Biomedical Sciences : Essential Laboratory Medicine
440
Biomedical Sciences Essential Laboratory Medicine Editors Ray K. Iles Suzanne M. Docherty
-
Upload
khangminh22 -
Category
Documents
-
view
0 -
download
0
Transcript of Biomedical Sciences : Essential Laboratory Medicine

RED BOX RULES ARE FOR PROOF STAGE ONLY. DELETE BEFORE FINAL PRINTING.
Biomedical SciencesEssential Laboratory Medicine
Editors Ray K. Iles Suzanne M. DochertyEditorsIles
Docherty
Biomedical Sciences
Biomedical Sciences
Essential Laboratory Medicine
EditorsRay K. Iles, Anglia Ruskin University, UK
Suzanne M. Docherty, Queen Elizabeth II Hospital, Welwyn Garden City, UK
By focusing on clinical relevance and including contributions from practising biomedical scientists, this textbook gives asense of what happens at the bench in the working clinical laboratory. It will therefore prove invaluable to all studentsof laboratory medicine and particularly those pursuing a dedicated career in this exciting and dynamic profession.
As the practice of clinical medicine and the diagnosis and management of human disease becomes more complex,there is an ever greater need for well-trained, highly skilled biomedical scientists: the professionals who perform thevital laboratory tests and investigations that underpin the diagnosis of disorders and the evaluation of theeffectiveness of treatment.
This textbook provides a clinically focused resource that students can use at all levels of their study and careerprogression in biomedical science. After an overview of the anatomy and physiology of major organ systems,individual chapters cover those aspects of science that are relevant to the clinical laboratory: pathophysiology; clinical cell biology and genetics; cellular pathology; clinical chemistry; medical microbiology; clinical immunology;haematology and transfusion science, and it concludes with a chapter on professional practice.
Cover design by Dan Jubb
Key Features:
A single volume resource written specifically for biomedical science students.
Clinically focused, covering the science that is relevant to the working laboratory.
Clearly written and well-presented with numerous illustrations in full colour throughout.


BiomedicalSciences


BiomedicalSciences
Essential Laboratory Medicine
Edited by
Ray K. IlesAnglia Ruskin University, UK
Suzanne M. DochertyQueen Elizabeth II Hospital, Welwyn Garden City, UK

This edition first published 2012 � 2012 by John Wiley & Sons, Ltd
Wiley-Blackwell is an imprint of John Wiley & Sons, formed by the merger of Wiley’s global Scientific, Technical
and Medical business with Blackwell Publishing.
Registered office: John Wiley & Sons, Ltd, The Atrium, Southern Gate, Chichester, West Sussex, PO19 8SQ, UK
Editorial offices: 9600 Garsington Road, Oxford, OX4 2DQ, UK
The Atrium, Southern Gate, Chichester, West Sussex, PO19 8SQ, UK
111 River Street, Hoboken, NJ 07030-5774, USA
For details of our global editorial offices, for customer services and for information about how to apply for permission to reuse
the copyright material in this book please see our website at www.wiley.com/wiley-blackwell.
The right of the author to be identified as the author of this work has been asserted in accordance with the UK Copyright,
Designs and Patents Act 1988.
All rights reserved. No part of this publication may be reproduced, stored in a retrieval system, or transmitted, in any form or
by any means, electronic, mechanical, photocopying, recording or otherwise, except as permitted by the UK Copyright, Designs
and Patents Act 1988, without the prior permission of the publisher.
Designations used by companies to distinguish their products are often claimed as trademarks. All brand names and product names
used in this book are trade names, service marks, trademarks or registered trademarks of their respective owners. The publisher
is not associated with any product or vendor mentioned in this book. This publication is designed to provide accurate and
authoritative information in regard to the subject matter covered. It is sold on the understanding that the publisher is not engaged
in rendering professional services. If professional advice or other expert assistance is required, the services of a competent professional
should be sought.
Library of Congress Cataloging-in-Publication Data
Biomedical sciences : essential laboratory medicine / Raymond Iles and Suzanne Docherty.
p. ; cm.
Includes bibliographical references and index.
ISBN 978-0-470-99775-8 (cloth) – ISBN 978-0-470-99774-1 (pbk.)
1. Diagnosis, Laboratory–Textbooks. 2. Medical laboratory technology–Textbooks. I. Iles, Raymond. II. Docherty, Suzanne.
[DNLM: 1. Pathology, Clinical–methods. 2. Laboratory Techniques and Procedures. QY 4]
RB37.B56 2011
616.07’5–dc23
2011019935
A catalogue record for this book is available from the British Library.
This book is published in the following electronic formats: ePDF 9781119950929; ePub 9781119962410; Mobi 9781119962427
Set in 10/12pt, Minion by Thomson Digital, Noida, India
First Impression 2012

The editors would like to dedicate this bookto the memory of Marion Docherty.


Contents
List of Contributors xi
Preface xiii
Chapter 1 Anatomy and physiology of major organ systems 1Ray K. Iles, Iona Collins and Suzanne M. Docherty
1.1 The skeletal system 1
1.2 The digestive system 6
1.3 The cardiovascular system 11
1.4 The urinary system 17
1.5 Respiratory system 21
1.6 The nervous system 23
1.7 The endocrine system 31
Bibliography 33
Chapter 2 Pathophysiology 35Suzanne M. Docherty
2.1 Pathophysiology: a definition 35
2.2 Introduction to epidemiology 35
2.3 Introduction to pharmacology 38
2.4 Gastroenterology 44
2.5 Liver, biliary tract and pancreatic disease 50
2.6 Rheumatology 56
2.7 Urinary tract disease 59
2.8 Cardiovascular disease 65
2.9 Respiratory disease 76
2.10 Endocrine disease 80
Bibliography 88
Chapter 3 Clinical cell biology and genetics 89Ray K. Iles and Stephen A. Butler
3.1 The cell 89
3.2 Genetics 103
3.3 Human genetic disorders 116
3.4 Important techniques in molecular cell biology 136
Bibliography 138
vii

Chapter 4 Cellular pathology 139Christopher M. Stonard and Jennifer H. Stonard
Part I: Principles of cellular pathology 139
4.1 Structure and function of normal cells, tissues and organs 139
4.2 Tissues and organs 140
4.3 Cellular responses to injury 141
4.4 Tissue responses to injury: acute inflammation 143
4.5 Tissue responses to injury: chronic inflammation 149
4.6 Healing and repair 151
4.7 Hyperplasia and hypertrophy 154
4.8 Atherosclerosis 155
4.9 Thrombosis and embolism 157
4.10 Ischaemia and infarction 159
4.11 Amyloid and amyloidosis 160
4.12 Infections of histological importance 162
4.13 Metaplasia, dysplasia and carcinoma in situ 165
4.14 Neoplasia 168
Part II: Clinical application and laboratory techniques 175
4.15 Sampling modalities 175
4.16 Fixation 178
4.17 Specimen dissection 180
4.18 Processing and embedding 182
4.19 Microtomy 184
4.20 Standard staining methods and procedures 186
4.21 Frozen section 190
4.22 Immunohistochemistry 191
4.23 Cytopathology 196
4.24 Electron microscopy 197
4.25 In situ hybridization 201
Bibliography 203
Chapter 5 Clinical chemistry 205Ray K. Iles and Stephen A. Butler
Introduction 205
Part I: Analytical methods 205
5.1 Sample collection 205
5.2 Analytical methods in clinical chemistry laboratories 210
5.3 Summary: common clinical tests for sample analytes 231
Part II: Clinical assessments 232
5.4 Urea and electrolytes (U and Es) 232
5.5 Metabolism and gastrointestinal markers 234
5.6 Renal function tests 236
viii Contents

5.7 Liver function tests 237
5.8 Heart disease and lipid disorder tests 238
5.9 Pancreatic function tests 240
5.10 Bone disease assessment 241
5.11 Endocrinological assessments 241
5.12 Pregnancy tests and pregnancy clinical chemistry 249
5.13 Therapeutic drug monitoring and toxicology 251
5.14 Clinical chemistry at the extremes of age 253
5.15 Cancer biomarkers 254
Bibliography 259
Chapter 6 Medical microbiology 261Sarah J. Furrows and Catherine S. Fontinelle
Introduction 261
6.1 Overview of microorganisms 261
6.2 Laboratory investigation of infection 265
6.3 Bacteria 277
6.4 Fungi 284
6.5 Parasitology --- protozoa and helminths 288
6.6 Viruses 290
6.7 Prions 297
6.8 Infections in the immunocompromised patient 298
6.9 Healthcare associated infections 299
6.10 Antimicrobial agents 302
6.11 Vaccines 307
6.12 Conclusion 309
Bibliography 309
Chapter 7 Clinical immunology 311Ray K. Iles and Ivan M. Roitt
Part I: The fundamentals of immunology 311
7.1 Overview of the immune system 311
7.2 Overview of the immune response 316
7.3 MHC genotyping, autoimmunity and susceptibility to disease 321
7.4 Physical age and immunocompetency 322
Part II: Laboratory investigations and immune assessments 323
7.5 Inflammation and chronic infection 323
7.6 Autoimmune diseases 324
7.7 Transplant rejection 325
7.8 Hypersensitivities 326
7.9 Immune deficiency 326
Bibliography 328
Contents ix

Chapter 8 Haematology and transfusion science 329Suzanne M. Docherty
8.1 Introduction and components of blood 329
8.2 Routine laboratory blood tests 332
8.3 Haemopoiesis 336
8.4 Red blood cell structure, disorders and metabolism 337
8.5 Haemoglobin 342
8.6 Anaemia 353
8.7 Benign white blood cell disorders 359
8.8 Haemostasis 361
8.9 Coagulation disorders 366
8.10 Myeloproliferative disorders 371
8.11 Haematological malignancies 373
8.12 Complement 378
8.13 Blood transfusion 380
8.14 Blood products 390
8.15 Haemopoetic stem cell transplantation 393
Bibliography 395
Chapter 9 Professional practice and biomedical science 397David Ricketts
9.1 What is a biomedical scientist? 397
9.2 The IBMS 397
9.3 Professional practice and the role of the HPC 398
9.4 Standards of proficiency --- biomedical scientists 399
9.5 Expectations of a health professional 400
9.6 Professional relationships 401
9.7 The skills required for the application of practice 401
9.8 Knowledge, understanding and skills 402
9.9 Standards of conduct, performance and ethics 403
9.10 CPD 403
9.11 Critical reflection 404
9.12 IBMS CPD scheme 404
9.13 The professional biomedical scientist as an agent for change in the wider
healthcare setting 405
Appendix 407
Index 413
x Contents

List of Contributors
Dr Stephen A. Butler, B.Sc., Ph.D.
Centre for Investigative and Diagnostic
Oncology
Middlesex University
The Burroughs
London, UK
Dr Iona Collins, MBBS, BMedSci (Hons.),
FRCS (Orth.)
Consultant in Spinal Surgery
Morriston Hospital
Swansea
Wales, UK
Dr Suzanne M. Docherty, MBBS,
BMedSci (Hons.), Ph.D.
Core Medical Trainee
Queen Elizabeth II Hospital
Welwyn Garden City
Hertfordshire, UK
Catherine S. Fontinelle, B.Sc. Hons., ARCS,
FIBMS, CSci
Senior Biomedical Scientist
Microbiology Department, St Helier Hospital
Carshalton,
Surrey, UK
Dr Sarah J Furrows, MBBS, M.Sc., MRCP,
FRCPath.
Consultant Microbiologist and Infection
Control Doctor
Kingston Hospital
Kingston-upon-Thames
Surrey, UK
Professor Ray K. Iles, B.Sc., M.Sc., Ph.D.,
CBiol, FSB, FRSC
Faculty of Health and Social Care
Anglia Ruskin University
Bishop Hall Lane
Chelmsford, UK
Dr David Ricketts, CSci, DBMS, FIBMS
Department of Clinical Biochemistry
North Middlesex University Hospital
London, UK
Professor Ivan M. Roitt, D.Sc., FRS, Hon. FRCP
Director, Centre for Investigative and Diagnostic
Oncology
School of Health and Social Science
Middlesex University
The Burroughs
London, UK
Dr Christopher M. Stonard, MA, MB, BChir,
FRCPath
Consultant Histopathologist
Department of Histopathology and Cytopathology
Chesterfield Royal Hospital NHS Foundation Trust
Calow
Chesterfield, UK
Jennifer H Stonard, B.Sc., LIBMS
Biomedical Scientist
Department of Histopathology and Cytopathology
Northern General Hospital
Sheffield Teaching Hospitals NHS Foundation Trust
Herries Road
Sheffield
South Yorkshire, UK
xi


Preface
The practice of clinical medicine and the diagnosis and
management of human disease becomes ever more
complex with each year that passes and our knowledge
of the molecular basis of pathology expands seemingly
exponentially. There is thus an ever greater need for
well-trained, highly skilled biomedical scientists --- the
professionals who perform the vital laboratory tests
and investigations that underpin the diagnosis of
disorders and the evaluation of the effectiveness
of treatment.
With this textbook on Biomedical Sciences, we set
out to create a comprehensive --- yet focused --- resource
that students can use at all levels of their study and
career progression in biomedical science. After an
overview of the anatomy and physiology of major
organ systems, individual chapters cover those aspects
of science that are relevant to the clinical laboratory:
pathophysiology; clinical cell biology and genetics;
cellular pathology; clinical chemistry; medical micro-
biology; clinical immunology; haematology and trans-
fusion science, and then concludes with a chapter on
professional practice. The book includes contributions
from a number of registered Biomedical Scientists
which greatly enhances its clinical relevance and interest
as well as giving a sense of what happens in the
real world, and at the bench in the working
clinical laboratory.
Wehope this textbook helps to take you successfully
into a fulfilling career in biomedical science or an allied
profession that you enjoy as much as the various
contributors have to date.
R.K.I and S.M.D
xiii

Chapter 1
Anatomy and physiologyof major organ systems
Professor Ray K. Iles, B.Sc., M.Sc., Ph.D., CBiol, FSB, FRSC,Dr Iona Collins, BMedSci, MBBS, FRCS and
Dr Suzanne M. Docherty, BmedSci, MBBS, Ph.D.
No area of medical science is truly self-contained; all
systems interact, so as we study our chosen speciality
we have to put this in a holistic context of human
biology. This is as true for the clinical laboratory
specialist as for any other medical professional. This
introductory chapter is not aimed to be a comprehen-
sive text on anatomy and physiology as there are
numerous extremely good volumes published on this
subject. However, the readermaywish to dip into these
explanatory notes as a refresher or source of direction
for further study. After all, students of clinical biomed-
ical science will find they have to read around our
specific substantive chapters on haematology, clinical
chemistry, microbiology and especially histopathology
if they do not have a grasp of anatomical systems.
1.1 The skeletal system
The obvious functions of the skeleton are to provide
support, leverage and movement and protection of
organs, for example the skull protects the brain, the rib
cage the lungs, heart, liver and kidneys, and the pelvis
the bladder. In addition, the skeletal system is a storage
site for calcium and phosphate minerals and lipids
(yellowmarrow) and critically a site for the production
of blood cells (red bone marrow).
The characteristics of bone are that they are very
lightweight yet very strong --- resistant to tensile and
compressive forces. Interestingly, healthiness (bone
density) depends on continuous stressing or loading
(i.e. activity). Bones are characterized by their shape
(Figure 1.1) into long bones, short bones, flat bones
and irregular bones.
1.1.1 The anatomical structureof a bone
Best exemplified by long bones, the bone itself is
subdivided by internal and external structures. The
bone is covered by a layer of cartilage called the
periosteum underneath which is a layer of dense
compacted calcified compact bone: however, beneath
this layer can either be a hollow chamber (medullary
Biomedical Sciences: Essential Laboratory Medicine, First Edition. Edited by Ray K. Iles and Suzanne M. Docherty.� 2012 John Wiley & Sons, Ltd. Published 2012 by John Wiley & Sons, Ltd.
1

cavity) filled with the specialist tissue of the bone
marrow or a spongy bone of small cavities. The
spongy bone is always found at the end structures of
articulating long bones and is a region of continued
bone turnover lying above a line of active bone cells
called the epiphyseal line. This spongy bone region is
called the epiphysis, whilst the bone marrow domi-
nant region between the two epiphyseal lines is
termed the diaphysis where highly active bone turn-
over (remodelling) does not continuously occur
(Figure 1.2).
Bone is derived from connective tissue and there are
two types of connective tissue in the skeletal system ---
calcified bone and cartilage. Cartilage tissue forms a
covering of articular surfaces, ligaments and tendons,
as well as sheaths around bone (periosteum).
Bone tissue is calcium phosphate (Ca3(PO4)) crys-
tals embedded in a collagenmatrix pepperedwith bone
cells. Thus bone is 60%minerals and collagen and 40%
water where the collagen enables bones to resist tensile
forces (i.e. are elastic) and minerals which enable
bones to resist compressive forces, but this does makes
them brittle.
Bone (osseous tissue) is, however, living tissue and
therefore has an abundant blood and nerve supply:
periosteal arteries supply theperiosteum(see Figure 1.3
(a)); nutrient arteries enter through nutrient foramen
supplies compact bone of the diaphysis and red mar-
row (see Figure 1.3(b)) and metaphyseal and epiphy-
seal arteries supply the red marrow and bone tissue of
epiphyses (see Figure 1.3(a)).
1.1.2 Spongy bone and compactbone
Bone tissue is of two types --- spongy and compact.
Spongy bone forms ‘struts’ and ‘braces’ with spaces
in between. Spaces contain bone marrow allowing
production and storage of blood cells (red marrow)
and the looser structure allows the bone to withstand
compressive forces. Compact bone makes up the
outer walls of bones, it appears smooth and homoge-
nous and always covers spongy bone. Denser and
stronger than spongy bone, compact bone gives
bones their rigidity. Spongy and compact bone are
biochemically similar, but are arranged differently.
In compact bone the structural unit is the osteon (see
Figure 1.4).
Figure 1.1 The human skeleton and the four bone categories which are shape descriptors. Essentials of Human Anatomy& Physiology, 9th Edition, Marieb, 2008 � Pearson Education Inc.
2 Biomedical sciences
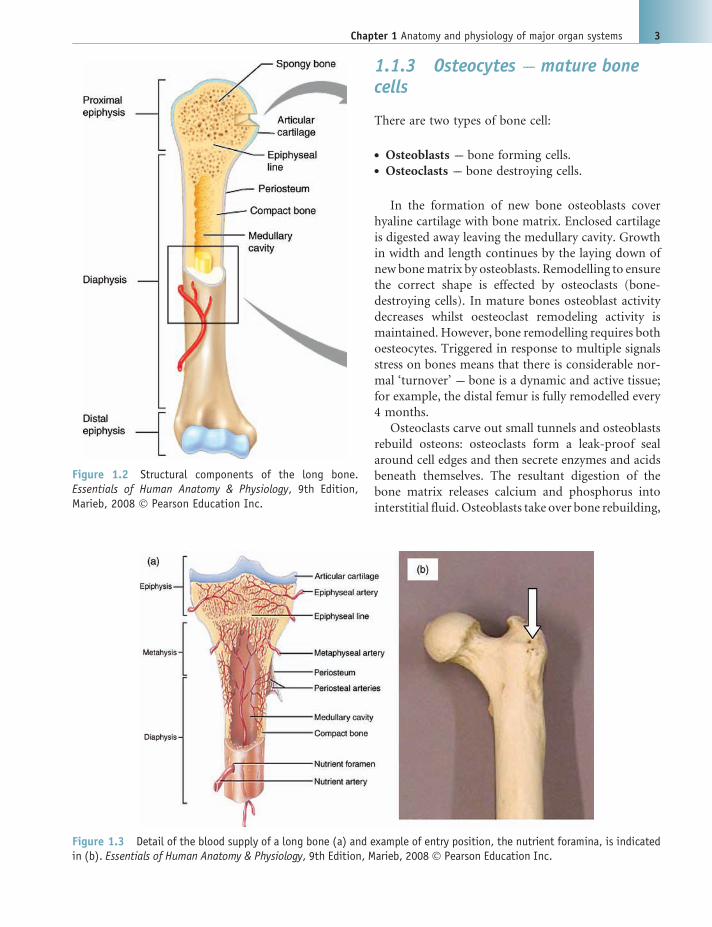
1.1.3 Osteocytes --- mature bonecells
There are two types of bone cell:
. Osteoblasts --- bone forming cells.
. Osteoclasts --- bone destroying cells.
In the formation of new bone osteoblasts cover
hyaline cartilage with bone matrix. Enclosed cartilage
is digested away leaving the medullary cavity. Growth
in width and length continues by the laying down of
new bonematrix by osteoblasts. Remodelling to ensure
the correct shape is effected by osteoclasts (bone-
destroying cells). In mature bones osteoblast activity
decreases whilst oesteoclast remodeling activity is
maintained. However, bone remodelling requires both
oesteocytes. Triggered in response to multiple signals
stress on bones means that there is considerable nor-
mal ‘turnover’ --- bone is a dynamic and active tissue;
for example, the distal femur is fully remodelled every
4 months.
Osteoclasts carve out small tunnels and osteoblasts
rebuild osteons: osteoclasts form a leak-proof seal
around cell edges and then secrete enzymes and acids
beneath themselves. The resultant digestion of the
bone matrix releases calcium and phosphorus into
interstitial fluid. Osteoblasts take over bone rebuilding,
Figure 1.2 Structural components of the long bone.Essentials of Human Anatomy & Physiology, 9th Edition,Marieb, 2008 � Pearson Education Inc.
Figure 1.3 Detail of the blood supply of a long bone (a) and example of entry position, the nutrient foramina, is indicatedin (b). Essentials of Human Anatomy & Physiology, 9th Edition, Marieb, 2008 � Pearson Education Inc.
Chapter 1 Anatomy and physiology of major organ systems 3

continually redistributing bone matrix along lines of
mechanical stress.
1.1.4 How bones grow
Bone growth only occurs in those young enough to still
have an active, unfused epiphyseal plate (roughly
< aged 16---19). The epiphyseal plates fuse earlier in
females than in males --- generally, females have stop-
ped growing by around the age of 16, while for males
this is around 18 to 19 (see Figure 1.5).
Cartilage cells are produced by mitosis on the
epiphyseal side of plates (ends of bones) --- this is
continuous with articular cartilage at the end of the
bone. Cartilage cells are destroyed and replaced by
bone on the diaphyseal side of plates (middle of long
bone)and a zone of resting cartilage anchors the
growth plate to the bone. The epiphyseal plate is at
the top of Figure 1.5, and this is where new cartilage
cells are being created by mitosis. As they are ‘pushed
away’ from the epiphyseal plate by new cartilage cells
being created ‘behind’ them, osteoblasts lay down a
calcium phosphate matrix in and around the cartilage
cells, ossifying the area. This gradually takes on the
structure of bone. The epiphyseal plate cartilage is
continuous with the articular cartilage at the end of
the bone, and new cartilage (and bone formation) is
occurring in both areas rather than strictly just at the
epiphyseal plate. Furthermore, the bone has to be
remodelled as it increases in length, or the whole bone
would be as wide as the epiphysis --- but what you
actually need is a narrower diaphysis (shaft) in the
middle of the bone. The thick articular cartilage, at
either end of the bone, is continuous with the thin (but
tough) periosteum around the outside of the rest of the
bone. Periosteum has a rich blood supply which is
important when you consider bones grow not only in
length but in width.
Periosteal cells (from membrane around the bone)
differentiate into osteoblasts and form bony ridges and
then a tunnel around a periosteal blood vessel. Con-
centric lamellae fill in the tunnel to form an osteon (see
Figure 1.6). Blood vessels around the outside wall of
the bone, on the periosteum, are ‘walled in’ as perios-
teal cells convert into osteoblasts and build new bone
around them. This is why cortical bone is composed
of osteons.
Figure 1.4 Microanatomy of the bone. Essentials of Human Anatomy & Physiology, 9th Edition, Marieb, 2008 � PearsonEducation Inc.
4 Biomedical sciences

1.1.5 Endocrine regulation andnutritional requirement ofbone growth
Several hormones are involved in endocrine control of
bone growth: growth hormone, thyroid hormone,
insulin and calcitonin. Before puberty growth hor-
mone is the most important hormone involved in
regulating bone growth. The metabolic hormones,
thyroid hormones and insulin are involved in modu-
lating the activity of growth hormone and ensuring
proper proportions in the skeleton. Together these
maintain the normal activity at the epiphyseal plate
until the time of puberty. At puberty the increase in sex
hormone production results in an acceleration of bone
growth. These hormones promote the differences in
the shape of the skeleton associated with males and
females such as density and shape such as a flatter and
wider pelvis in females. However, in both sexes the rate
of ossification starts to outpace the rate of cartilage
formation at the epiphyseal plates. Eventually the
plates ossify and bone growth stops when the individ-
ual reaches sexual and physical maturity.
For adequate bone growth good nutrition is also
required as are adequate levels of minerals and vita-
mins: calcium and phosphorus, vitamin D for bone
formation, vitamin C for collagen formation and
vitamins K and B12 for protein synthesis.
Figure 1.5 Histological appearance of epiphyseal plate. Essentials of Human Anatomy & Physiology, 9th Edition, Marieb,2008 � Pearson Education Inc.
Chapter 1 Anatomy and physiology of major organ systems 5

1.1.6 The role of bone asa mineral store
A critical mineral which bones are involved in regu-
lating is calcium as its ion concentrations in plasma
must be very carefully controlled. Calcium homeosta-
sis is affected by a negative feedback system involving
the action of two primary hormones; calcitonin, pro-
duced from parafollicular cells of the thyroid gland in
the neck and parathyroid hormone (PTH, also called
parathormone) produced by the parathyroid glands
(which lie on top of the thyroid gland). Responding to
a fall in plasma calcium ions, released PTH, among
other effects, induces the release of calcium by bone,
whilst a rise in plasma calcium results in calcitonin
which has the opposite effects, one of which is to
promote increased deposition of calcium in bone.
1.2 The digestive system
This section aims to give an overview of the anatomy of
the digestive system, identifying the major organs of
the alimentary canal and the accessory digestive or-
gans. In particular, the structure and function of the
following organs and accessory organs of the alimen-
tary canal are briefly described (see Figure 1.7):
. the oral cavity, pharynx and oesophagus;
. the stomach;
. the small intestine;
. the liver and gallbladder;
. the pancreas;
. the large intestine.
In so doing, it is possible to outline the major
processes occurring during digestive system activity
and give an overview of digestion and absorption.
1.2.1 Nutrition and absorption
The overall function of the digestive tract is to process
not only the macronutrients (carbohydrates, proteins
and fats) but also vitamins and minerals. Vitamins
are complex organic substances essential for health,
Figure 1.6 Appositional bone growth
6 Biomedical sciences

required in very small amounts (mg or mg per day) butmost cannot be made by the body. They function as
cofactors in enzyme activity, antioxidants to deal with
free radicals generated during metabolism, and even as
prohormone (i.e. vitamin D).
Minerals are inorganic compounds required by
the body, like vitamins, for a variety of functions but
often as cofactors or the reactive centres of function-
al proteins. Some minerals are needed in larger
amounts than others, for example calcium, phos-
phorus, magnesium, sodium, potassium and chlo-
ride. Others are required in smaller quantities and
are sometimes called trace minerals, for example
iron, zinc, iodine, fluoride, selenium and copper.
However, despite being required in smaller
amounts, trace minerals are no less important than
other minerals.
In order to extract macro- andmicronutrients from
food stuffs the digestive system must bring about
ingestion, digestion (mechanical and chemical), enable
movement through the digestive tract, facilitate ab-
sorption of nutrients and finally defaecation of the
nondigestible elements and some waste products.
1.2.2 Ingestion
The oral cavity is a far more complex mechanism than
just a set of teeth. You unconsciously analyse food
when youput it in yourmouth to check it isn’t too large
a chunk to sensibly chew, that it doesn’t contain very
hard bits, and that it isn’t in some way mouldy or
otherwise unpleasant. Only then do you start chewing
properly and contemplating swallowing it. Thus the
oral cavity analyses the food, mechanically processes
(chews to smaller pieces), lubricates (saliva) and starts
the process of chemical digestion via the enzymes
secreted as part of saliva (see Figure 1.8).
After chewing we swallow but there are two phases:
. buccal phase (voluntary);
. pharyngeal phase (involuntary).
1.2.2.1 Pharynx and oesophagus
During the pharyngeal phase, the airways have to be
shut off by the epiglottis to prevent food from going
Figure 1.7 Overall anatomy of the digestive system. Essentials of Human Anatomy & Physiology, 9th Edition, Marieb, 2008� Pearson Education Inc.
Chapter 1 Anatomy and physiology of major organ systems 7

down the air passages/windpipe (see Figure 1.9).
Babies don’t have quite the same set up, and this allows
them to breathe while drinking milk. Peristalsis carries
food in one direction only --- down, so you can eat and
drink standing on your head if you want to; animals
such as horses effectively do this by eating with their
heads lower than the level of their stomach.
1.2.3 The stomach
Lying in the upper part of the abdominal cavity, this sac
or balloon like stomach occupies a volume of 50mL
empty, but expands to 4 L when full. The different
orientations of muscle layers in the stomach allow it
to contract in different directions to maximize the
effectiveness of mechanically breaking down food. The
folds (rugae) increase the surface area for maximum
absorption (see Figure 1.10). It is also important to note
that there is a cardiac sphincter between the oesophagus
and stomach, and a pyloric sphincter between the
stomach and duodenum --- sometimes the pyloric
sphincter is malformed (this predominantly affects
baby boys) and will not open, which causes projectile
vomiting and failure to thrive until it is surgically
corrected. At the other end the stomach sits below
the diaphragm, but sometimes part of the stomach
is squeezed up through the diaphragm, resulting in
heartburn and reflux as acid enters the oesophagus.
1.2.3.1 Stomach mucosal lining
The gastric mucosa contain three predominant differen-
tiated cell types: parietal cells which secrete hydrochloric
acid and intrinsic factors facilitating the absorption
of vitamin B12; chief cells which secrete pepsinogen
(inactive form of pepsin) --- which is activated by HCl
and begins the digestion of protein; and mucous cells.
The stomach secretes a thick mucus to protect itself
from its own hydrochloric acid (see Figure 1.11).
1.2.3.2 The gastric digestive process
Swallowed food collects in theupper storage area. Starch
(complex carbohydrate) continues to be digested until
themasshasbeenmixedwithgastricjuice.Smallportions
ofmashed food are pushed into the digesting area of the
stomachwhere acid in gastric juice unwinds (denatures)
the proteins and the enzymepepsin breaks up the chains
Figure 1.8 Structures and exocrine glands of the oral cavity. From Tortora and Derrickson, Principles of Anatomy andPhysiology, Twelfth Edition, 2009, reproduced by permission of John Wiley & Sons Inc.
Figure 1.9 Position of the epiglottis in respect to closure ofthe trachea
8 Biomedical sciences

of amino acids. This all forms a thick liquid mass called
chymewhichmovesonandenters thesmall intestine.Fat
forms a separate layer on the top.
1.2.4 The small intestine
The small intestine consists of three distinct anatom-
ical regions: the duodenum, pyloric sphincter to
jejunum; jejunum, duodenum to ileum; and ileum,
jejunum to large intestine. The small intestine is
where most nutrients are absorbed, and it is all about
surface area maximization (see Figure 1.12).
The mucosal folds of the small intestine are covered
in villi (Figure 1.12(a) and (b)), and each villus in turn
is lined with columnar cells that have a brush border
(Figure 1.12(c)), all to give a large surface area for
absorption. Note too that each villus has a rich blood
supply to help with this too (see Figure 1.12(c)).
1.2.5 Liver and gall bladder
Positioned below the diaphragm and protected by the
lower half of the rib cage, the liver is divided into a right
and left lobe by the round ligament. The gall bladder
nestles into it from underneath and in real life this is a
dark green colour and really stands out. Among other
functions the liver produces bile. Bile contains bile
acids, which assist with the absorption of fats and fat-
soluble vitamins in the small intestine. Many waste
products, including bilirubin, are eliminated from the
body by secretion into bile and elimination in faeces.
Adult humans produce 400 to 800mL of bile per day.
Figure 1.10 (a) Anatomy and (b) cross-sectional appearance of the stomach. Essentials of Human Anatomy & Physiology,9th Edition, Marieb, 2008 � Pearson Education Inc.
Figure 1.11 Microanatomy of the stomach lining
Chapter 1 Anatomy and physiology of major organ systems 9
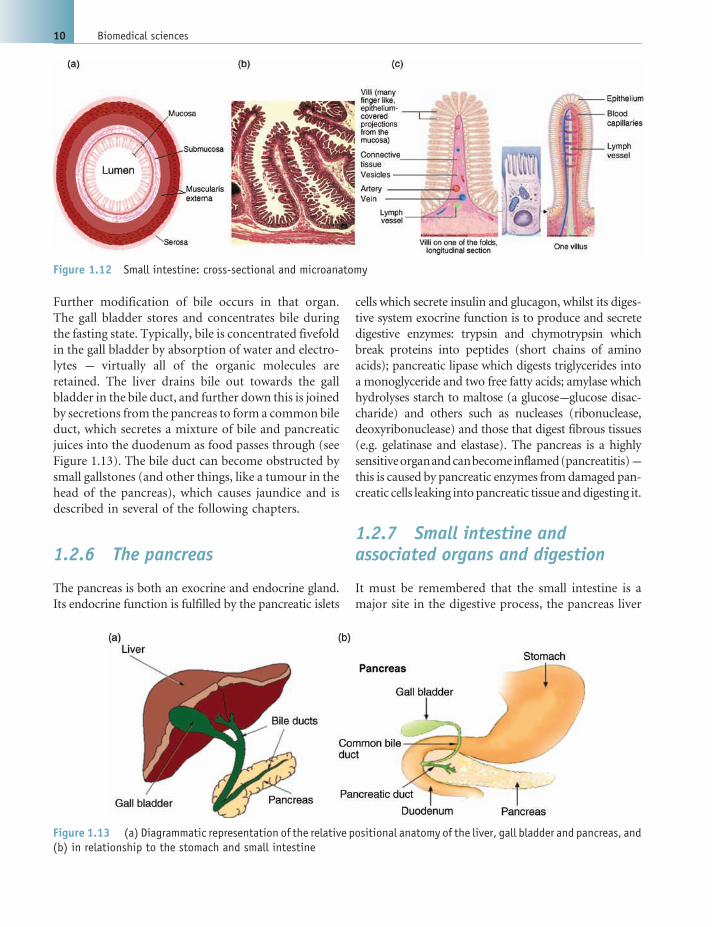
Further modification of bile occurs in that organ.
The gall bladder stores and concentrates bile during
the fasting state. Typically, bile is concentrated fivefold
in the gall bladder by absorption of water and electro-
lytes --- virtually all of the organic molecules are
retained. The liver drains bile out towards the gall
bladder in the bile duct, and further down this is joined
by secretions from the pancreas to form a common bile
duct, which secretes a mixture of bile and pancreatic
juices into the duodenum as food passes through (see
Figure 1.13). The bile duct can become obstructed by
small gallstones (and other things, like a tumour in the
head of the pancreas), which causes jaundice and is
described in several of the following chapters.
1.2.6 The pancreas
The pancreas is both an exocrine and endocrine gland.
Its endocrine function is fulfilled by the pancreatic islets
cells which secrete insulin and glucagon, whilst its diges-
tive system exocrine function is to produce and secrete
digestive enzymes: trypsin and chymotrypsin which
break proteins into peptides (short chains of amino
acids); pancreatic lipase which digests triglycerides into
a monoglyceride and two free fatty acids; amylase which
hydrolyses starch to maltose (a glucose---glucose disac-
charide) and others such as nucleases (ribonuclease,
deoxyribonuclease) and those that digest fibrous tissues
(e.g. gelatinase and elastase). The pancreas is a highly
sensitiveorganandcanbecomeinflamed(pancreatitis)---
this is caused by pancreatic enzymes fromdamaged pan-
creatic cells leaking intopancreatic tissue anddigesting it.
1.2.7 Small intestine andassociated organs and digestion
It must be remembered that the small intestine is a
major site in the digestive process, the pancreas liver
Figure 1.12 Small intestine: cross-sectional and microanatomy
Figure 1.13 (a) Diagrammatic representation of the relative positional anatomy of the liver, gall bladder and pancreas, and(b) in relationship to the stomach and small intestine
10 Biomedical sciences

and gall bladder all work in concert with the absorption
function of the mucosal folds and villi cells found here.
Thus, chyme squirts into the duodenum from the
stomach and peristaltic movement pushes the chyme
along andmixes with secretions for chemical digestion.
In particular pancreatic juice and bile help to digest
carbohydrate, lipids and proteins. All the while the
macro- and microanatomy of the small intestine opti-
mizes absorption and facilitates the transport of nu-
trient across the mucosal barrier and into the blood
stream. Most digested food is absorbed in the small
intestine so there is a rich and complex net of blood and
lymphatic channels around and leading to and from
the small intestine as it winds backwards and forwards.
1.2.8 The large intestine
The residual chyme moves from the small intestine via
the Illeocecal valve (which prevents the contraction
from these larger vessels forcing waste back into the
small intestine) into the first pouch or haustra of the
large intestine --- the caecum. Herbivores have a large
caecum and appendix that contain symbiotic bacteria
that synthesize the enzyme cellulase, allowing them to
digest plants cell walls, these pass through us as fibre.
The human appendix is roughly the size of the little
finger, but in some people it is relatively long and thin
(with a small diameter that is more likely to block,
possibly resulting in appendicitis).
The movement of this residual digestive chyme
through the large intestine is slow and rather laborious
in the mechanical mechanism that operates: pouches
(or haustra) fill to capacity, when stretched they con-
tract and force the contents into the next haustra (and
section of the colon). During this slow passage water is
absorbed or reabsorbed, and vitamins andminerals are
absorbed along with it. As water is absorbed the
residual chyme is dehydrated and compacted to form
faeces. Mass peristalsis forces the contents into the
rectum for the storage of faecal material prior to
defecation (see Figure 1.14).
The average passage time of undigested food resi-
dues through the human gut is about 50 h in men and
57 h in women, but ranges from well under 20 to over
100 h. It also changes from one day to the next.
However, about 80---90% of the entire transit time of
food in the body is spent in the colon, so it needs to be
large and have a good capacity. Thus, movement
through the digestive tract varies dramatically section
per section: Oesophageal peristalsis is fast with a transit
time of about 3 s; time in the stomach is about 1---3 h;
small intestine digestion and absorption is 2---6 h,
whilst 12---48 h is spent in the large intestine prior
to defecation.
1.3 The cardiovascularsystem
The function of the cardiovascular system is as a
transport system of the body carrying:
. respiratory gases;
. nutrients;
. hormones and other material to and from the
body tissues.
The fluid component of this system --- blood --- is a
complex of specialized cells and solution of salts (elec-
trolytes) and soluble proteins. At the centre of the
cardiovascular system is the heart to which structurally
distinct vessels --- arteries --- carry blood away, and
equally structurally distinct vessels --- veins --- carry
blood back to the heart.
However, the cardiovascular system has two divi-
sions: pulmonary and systemic (see Figure 1.15). In the
pulmonary division, blood flows from the right ven-
tricle of the heart to alveolar capillaries of the lungs and
back to the left atrium of the heart. In the systemic
division the left ventricle pumps blood to the rest of the
body and all other body capillaries, and the blood
returns to the heart’s right atrium. Hence there is an
asymmetry in muscle mass between the two ventricles.
In addition the two divisions have two different pro-
files with respect to the transport of respiratory gases;
pulmonary arteries are low inO2 high inCO2whilst the
arteries of the systemic division are high in O2 low in
CO2 (and the pulmonary---systemic veins vice versa).
Capillaries, minute blood vessels found throughout
tissues, connect the small arteries to the small veins.
Exchange of respiratory gases and nutrients with the
tissues occurs across the walls of the capillaries.
1.3.1 The heart
The heart is a complex structure of four chambers,
powerful muscles, specialized valves that contract and
Chapter 1 Anatomy and physiology of major organ systems 11

open/close in a coordinated manner, regulated by its
own specialist sensory and responsive neurological
system (see Figure 1.16). The entire organ is sur-
rounded by a protective barrier called the peri-
cardium. It is in fact a protective sac surrounding
the heart consisting of an outer tissue layer called the
parietal pericardium, a proteinacious (pericardial)
fluid and a heart wall contacting tissue, the visceral
pericardium also referred to as the epicardium.
The heart wall consists of two tissue layers the inner
endocardium which is contiguous with blood vessel
endothelium and the myocardium of specialist cardiac
muscle. The heart has two structural classes of cham-
bers: receiving chambers or atria (singular, atrium)
and pumping chambers or ventricles. The right
ventricle pumps for the pulmonary circulation, the
left ventricle pumps for the systemic circulation. The
‘GreatVessels’ of the heart are the aorta and pulmonary
trunk. Heart valves ensure the one-way flow of blood
through the heart and there are two types: semilunar
valves (pulmonary semilunar and aortic semilunar)
lead from the ventricles and prevent back flow from
pulmonary and systemic vasculature. The atrio-ven-
tricular (AV) valves are the tricuspid --- right atrium
into the right ventricle; and bicuspid (mitral) --- left
atrium to the left ventricle. If a section is cut through
the heart at the atrial ventricular boundary through the
four valves a structural skeleton of (four) fibrous rings
can be seen. These tough fibrous rings provide rigidity
to prevent the dilation of valves and provide a point of
Figure 1.14 Diagrammatic representation of the structure of the large intestine
12 Biomedical sciences

attachment for valves. This fibrous skeleton also elec-
trically isolates the atria from the ventricles. The AV
bundle (‘bundle of His’) is the only electrical connec-
tion between the atria and the ventricles (see
Figure 1.17).
The origin of heartbeat is located in a sinoatrial
(SA) node of the heart, where a group of specialized
cells continuously generates an electrical impulse. The
SA node generates such impulses about 100---120
times per min at rest. However, in a healthy individual
the resting heart rate (HR) would never be that high.
This is due to continuous control of the autonomic
nervous system (ANS) over the output of SA node
activity, which net regulatory effect gives real HR. In a
healthy subject at rest it is ranging between 50 and 70
beats per min.
The electrical impulse of the sino-atrial (SA),
stimulated by blood flow, first induces the muscle
tissue of the atrial chamber to contract. The electrical
impulse travels to the atrio-ventricular node and
synchronizes with this tissue’s inherent but weaker
electrical pulsivity. This combined and synchronized
electrical pulse travels down the conductive fibres
(bundle of His, bundle branches)of the noncontrac-
tive muscular cardiac septum (i.e. this tissue does
not contract in response to this electrical signal) to
the Purkinje fibres which originate at the base of the
ventricle muscle walls and travel up towards the
atrioventricular boundary. The result is that the signal
is delayed, atria muscles are relaxing, but the impulses
then induce waves of contraction of the ventricles
from the bottom up. This efficiently empties the heart
ventricles --- like squeezing a toothpaste tube from the
bottom and not the middle, whilst the atrium refill.
The order of impulse spreading all over the heart
muscle through specialized pathways creates synchro-
nized heart muscle contraction between both atriums
(first) and then the ventricles which contracts in a
wave starting from the bottom of the heart to the top
of the ventricles.
1.3.2 The vasculature
The blood vessels are the arteries, arterioles,
capillaries, venules and veins and all blood vessels
are lined with specialist cells of the endothelium (see
Figure 1.18). The arteries which carry blood away
from the heart are subject to the highest blood
pressure and located deep within tissues. Subject to
much lower pressures, veins return blood to
the heart.
1.3.2.1 Structure of arteries and arterioles
Arteries consist of three tissue layers: tunica interna,
tunica media and tunica externa. However, there
are two types of artery: elastic arteries, which con-
tain elastic fibres in the tunica media and interna,
which are the largest. Muscular arteries have little
elasticity and abundant smooth muscle in the
tunica media.
Arterioles are less than 1mm in diameter and
consist of endothelium and smooth muscle. It is the
ability of arteries to contract by virtue of the dense
smooth muscle layers that allows these vessels to
regulate blood pressure in a general and locality
specific manner. Indeed the metarterioles regulate
the flow of blood into capillaries (see Figure 1.19).
Capillaries are the sites of exchange, they are very
thin and permeable, allowing exchange between blood
and tissue cells in systemic capillaries and the exchange
between blood and air in pulmonary capillaries.
1.3.2.2 Structure of veins and venules
Veins are thinner than arteries, of a much larger
diameter and located both deep and superficially
Figure 1.15 The systemic and pulmonary systems
Chapter 1 Anatomy and physiology of major organ systems 13

within tissue. A key difference is that veins have
valves. Since the blood in veins is under much lower
pressure after a forward flow pressure beat from the
left ventricle, the blood could flow backwards again.
The valves prevent this backwards flow and veins
within muscles are squeezed by external contraction
of muscle tissue mass as a result of movement (and
general muscle tone) to help return blood.
Figure 1.16 The heart, position associated organs and major vessels
14 Biomedical sciences

1.3.3 Blood distribution
Blood does not spend its time equally between veins
and arteries. Indeed, as demonstrated in Table 1.1,
most of the time blood is in the systemic venous
system.
The reason is that exchange is not just one way ---
from the oxygen rich systemic arteries to tissues
but huge exchange occurs in the hepatic portal
system where food and metabolites are absorbed
(see Figure 1.20). Similarly, coming away from bone
(marrow) in the exiting veins are new blood cells.
1.3.3.1 The heart’s blood supply
The highly active muscle and neurological tissue of the
heart has its own surrounding network of capillaries
fed by the coronary circulation, some of the major
vessel of which are the right coronary artery, the left
coronary artery, the circumflex, the anterior interven-
tricular (also LAD) and the coronary sinus.
1.3.3.2 Blood flow
Defined as the volume of blood flowing through a
vessel, an organ, or the entire circulation in a given
period blood flow is measured in mL per minute.
Equivalent to cardiac output (CO), considering the
entire vascular system this is relatively constant
when at rest. However, it varies widely through
individual organs, according to immediate needs.
Figure 1.17 Neurological conduction system of the heart
Figure 1.18 Structural comparisons of arteries and veins. Human Physiology, 4th Edition, Fox, 1993 � William C. Brown
Chapter 1 Anatomy and physiology of major organ systems 15

Resistance --- opposition to flow --- is the measure of
the amount of friction blood encounters as it passes
through vessels. Resistance is more significant in the
systemic circulation and is referred to as peripheral
resistance (PR).
The three important sources of resistance are blood
viscosity --- thickness or ‘stickiness’ of the blood, total
blood vessel length --- the longer the vessel, the greater
the resistance encountered --- and blood vessel diame-
ter. Changes in vessel diameter are frequent and
significantly alter peripheral resistance. Resistance var-
ies inversely with the fourth power of vessel radius
Figure 1.19 Structural representations of arteriole capil-lary venule ‘mesh’
Table 1.1 Percentage distribution of blood in thecardio-vasculature
Systemic venous system 64%
Systemic arterial system 13%
Heart 7%
Systemic capillaries 7%
Pulmonary venous system 4%
Pulmonary arterial system 3%
Pulmonary capillaries 2%
Figure 1.20 (a) Diagrammatic anatomical and (b) functional representations of the hepatic portal circulations demon-strating the dominance of the venous vessels
16 Biomedical sciences

(one-half the diameter), for example, if the radius is
doubled, the resistance is 1/16 as much.
Blood flow (F) is directly proportional to the dif-
ference in blood pressure (DP) between two points in
the circulation. IfDP increases, blood flow speeds up; if
DP decreases, blood flow declines. Blood flow is in-
versely proportional to resistance (R), If resistance (R)
increases, blood flow decreases. Resistance is more
important than difference in blood pressure in influ-
encing local tissue blood pressure.
The pumping action of the heart generates blood
flow through the vessels along a pressure gradient ---
always moving from higher- to lower-pressure areas ---
andpressure resultswhen flow is opposedby resistance.
Blood pressure is defined as the force per unit area
exerted on the wall of a blood vessel by its contained
blood and is expressed in millimetres of mercury
(mmHg).
Thus, as the blood vessels get generally wider we
find that systemic blood pressure Is highest in the
aorta, declines throughout the length of the pathway
and is 0mmHg in the right atrium. The steepest
change in blood pressure occurs in the arterioles.
Thefact that there is reallynopressure leftby the time
the blood is returning to the heart means that the body
relies on the ‘sucking’ effect of the diaphragm lowering
tocause inhalation(i.e. creatingnegativepressure in the
thoracic cavity) within the thoracic cavity to help draw
venous blood back up towards the heart.
1.4 The urinary system
The urinary system comprises the kidneys, ureter(s),
bladder and urethra (Figure 1.21). The Functions of
the urinary system are:
. to excrete organic waste;
. to regulate blood volume;
. to regulate blood pressure;
. to regulate ion concentrations (sodium, potassium,
chloride, calcium, etc.);. to maintain blood pH at physiological range
(7.35---7.45).
The kidneys lie retroperitoneal (behind the perito-
neal cavity), so they are separated from the abdominal
organs that lie in front of them, in the peritoneal
cavity.Weighing approximately 150 g, the distinctively
shaped kidney (approximately 12 cm (long)� 6 cm
(wide)� 3 cm (thickness)) lies approximately at ver-
tebral level T12---L3 with the upper parts protected by
the 11th and 12th ribs. The organs themselves have
three layers of protective tissue: renal capsule, adipose
capsule and renal fascia. The capsule is a tough con-
nective tissue membrane around the kidney which is
quite hard to peel off it. The kidney is also covered in a
very thick layer of fat which gives it considerable
protection against trauma.
The female urethra is considerably shorter than the
male urethra (meaning that females suffer from far
more urinary tract infections than males --- bacteria
have only a short distance to travel to get into the
bladder in women, and the rectum is very close to the
urethra in females too). The right kidney is lower than
the left kidney, which means it gets more kidney
infections (a shorter urethra for bacteria to travel along
from the bladder) and suffers more from trauma, as it
has less protection from the ribcage (see Figure 1.22).
1.4.1 The kidneys
The kidney internal structure consists of a cortexwhich
produces urine and a series of collecting ducts that take
the urine from the kidney via a connective tube (ure-
ter) to the major reservoir for eventual excretion
(urination from the bladder). In its cross-sectional
anatomy the kidney has a ureteric interface cavernous
Figure 1.21 Gross anatomy of the urinary system
Chapter 1 Anatomy and physiology of major organ systems 17

region called the hilus (where kidney stones often
occur) to which a larger and larger urine draining
region (termed calyces) empties. Theminor calyces are
composed of aggregated collecting ducts --- these in
turn aggregate into major calyces, which finally be-
come the hilus and ureter. The renal artery supplies the
kidney --- the kidney is highly metabolically active and
needs a good supply of oxygen and glucose. Relative to
its small size, it actually uses about a quarter of the
arterial blood supply in the body. This also allows it to
be highly efficient in terms of filtration of large vo-
lumes of plasma and production of urine. The renal
vein drains deoxygenated, filtered blood from the
kidney (see Figure 1.23).
1.4.1.1 The nephron
The physiological unit of the kidney is the nephron
which anatomically straddles the renal cortex with a
descending loop into the renal medulla. The blood
vessels in the cortex of a kidney reduce from larger
vessels, to lots of small round ‘tufts’ of capillaries each
one of these is one glomerulus, the knot of capillaries
within a Bowman’s capsule (see Figure 1.24).
Blood vessels wrap around the whole nephron, and
after the efferent arteriole leaves the Bowman’s cap-
sule it continues and is wrapped around the proximal
convoluted tubule, loop of Henle, and distal convo-
luted tubule. This means that water, ions, amino
acids, drugs and so on can easily move between
the nephron and the bloodstream along the length
of the nephron.
Pressure within the glomerulus is kept very high by
the diameter of the outgoing arteriole being narrower
than the ingoing arteriole. In the Bowman’s capsule,
fluid is forced out of the glomerulus and into the
capsule from the bloodstream. Blood within the glo-
merulus is under very high pressure, and the capillar-
ies here are very leaky, so a lot of the fluid component
of blood is forced straight out into the capsule, and a
Figure 1.22 Comparative anatomy of the female and male urinary system
18 Biomedical sciences

large volume of fluid literally pours into the proximal
tubule. Proteins greater than 10 kD are generally too
large to be forced out of blood (urine should be
essentially protein-free in the healthy individual ---
that is at very very low levels compared to the blood),
and the cells of blood are obviously much too large to
get between the gaps in the capillaries too (urine
should not contain red or white blood cells in
the healthy).
1.4.1.2 Glomerular filtration rate (GFR)
This is the volume of blood filtered per unit time by all
glomeruli combined, approximately 125mL per min-
ute (or 7.5 L/h). However 7.5 L of filtrate per hour is
entering the nephrons of your kidneys, but how much
urine are you actually producing? It should be around
60mL/h, which tells you that over 99% of the water in
the filtrate alone is being reabsorbed. This is fortunate
as your bladder capacity is only about 500mL,
and you would otherwise need to empty it 15 times
per hour.
GFR varies directly with glomerular blood pressure
which, in turn, is determined by systemic blood pres-
sure. This can vary dramatically due the environment
or activity; however, renal autoregulation regulates the
diameter of incoming arterioles to keep blood flow
within normal limits and maintain GFR. If you lose a
lot of your blood volume, epinephrine/adrenalin is
produced by the sympathetic nervous system, and
causes blood pressure to rise (by increasing heart
rate and stroke volume as well as via arteriole constric-
tion). However, the kidneys are also partially masters
of their own incoming blood pressure via production
of renin, which increases blood pressure via the
renin---angiotensin system. The cells that produce
renins, the juxtaglomerular cells, are located between
the glomerulus and the distal convoluted tubule of
the same nephron.
1.4.1.3 Reabsorbtion
Nutrients (glucoseandaminoacids)whichpass intothe
filtrate at the glomerulus are normally all reabsorbed
Figure 1.23 Blood supply and metabolic active regions of the kidney. Human Physiology, 4th Edition, Fox, 1993� William C. Brown
Chapter 1 Anatomy and physiology of major organ systems 19

again. This reabsorption occurs selectively at specific
regions of the proximal and distal tubules and the
ascending and descending regions of the loop of
henle (see Figure 1.25) We generally need to expend
energy (i.e. use ATP) to reabsorb all of the small
molecules that left the bloodstream in the leaky
glomerulus and entered the nephron.
Sodium (Na) is actively reabsorbed due to the
action of aldosterone (produced by the adrenal gland)
by activating specific Na transporters in the cells of the
proximal tubules. This increased local blood level ofNa
causes osmotic uptake of water from the loop of henle.
ADH, antidiuretic hormone, is produced in the pitui-
tary gland in response to dehydration. It causes more
water to be reabsorbed from the nephron and put back
into the bloodstream, that is it makes it easier for
osmotic reabsorption.
1.4.1.4 Tubular secretion
Most of the processes of tubular secretion again
involve energy expenditure. These processes tend to
happen further down the nephron than tubular reab-
sorption, around the distal convoluted tubule area
(see Figure 1.25). It is a process in which substances
move into the distal and collecting tubules from
the blood:
. disposing of substances not already in the filtrate
(e.g., certain drugs such as penicillin);
Figure 1.24 The nephron and its microanatomy and histology
20 Biomedical sciences

. eliminating undesirable substances (e.g., waste pro-
ducts like urea);. ridding the body of excess potassium ions; and. controlling blood pH by Hþ secretion.
1.5 Respiratory system
Each lung is divided into lobes. The right lung, which
has three lobes, is slightly larger than the left, which has
two. The lungs are housed in the chest/thoracic cavity,
and covered by a protective membrane --- the pleura
(see Figure 1.26). The diaphragm, the primary muscle
involved in respiration, separates the lungs from the
abdominal cavity. Tobreathe in (inhale), the diaphragm
tightens and flattens and the rib cage rises increasing
the volumeof the thoracic cavity. This creates a decrease
in pressure, a partial vacuum, sucking the air into
your lungs. When the diaphragm relaxes to its original
shape and the ribs lower, the thoracic cavity volume
decreases again and forces out the inspired air.
There are two modes of breathing:
Quiet breathing is where inspiration is active: the
diaphragm, external intercostals muscles are in-
volved. However, expiration is passive, that is, no
muscles are involved and no energy is expended ---
elastic rebound of the rib cage and diaphragm
reduces the thoracic cavity volume expelling the air.
Figure 1.25 Reabsorption and secretion regions of the nephron’s post glomerulus draining tubules
Figure 1.26 Basic anatomy of the lungs. Essentials ofHuman Anatomy & Physiology, 9th Edition, Marieb, 2008� Pearson Education Inc.
Chapter 1 Anatomy and physiology of major organ systems 21

In forced breathing both inhalation and exhalation are
active processes: during inspiration the sternoclei-
domastoid, scalene and pectoralis minor muscles
contract whilst during exhalation the internal inter-
costals and abdominal muscles contract reducing
the thoracic cavity more than with elastic rebound.
1.5.1 Lung function measures
The two different breathing modes give different lung
function measures (see Figure 1.27):
. tidal volume (TV) --- air that moves into and out of
the lungs with each breath (approximately 500mL);. inspiratory reserve volume (IRV) --- air that can
be inspired forcibly beyond the tidal volume
(2100---3200mL);. expiratory reserve volume (ERV) --- air that can be
evacuated from the lungs after a tidal expiration
(1000---1200mL); and. residual volume (RV) --- air left in the lungs after
strenuous expiration (1200mL).
This leads to different measures of capacity:
. inspiratory capacity (IC) --- total amount of air that
can be inspired after a tidal expiration (IRVþTV);. functional residual capacity (FRC) --- amount of air
remaining in the lungs after a tidal expiration
(RVþ ERV);. vital capacity (VC) --- the total amount of exchange-
able air (TVþ IRVþ ERV); and. total lung capacity (TLC) --- sum of all lung volumes
(approximately 6000mL in males).
1.5.2 Respiration
In the exchange of gases --- alveoli to blood occurs at the
alveoli of the lungs --- gas is exchanged between the air
in the alveoli and the blood by the process of diffusion.
In this process surfactant covers the internal surface of
the alveoli air sac (see Figure 1.28). The surfactant is
important in decreasing surface tension, increasing
pulmonary compliance (reducing the effort needed to
expand the lungs) and reducing the tendency for
alveoli to collapse.
1.5.3 Oxygen and carbon dioxideexchange
Molecular oxygen is carried in the blood: some is
bound to haemoglobin (Hb) within red blood cells
and some is dissolved in blood plasma. Each Hb
molecule binds four oxygen molecules in a rapid and
reversible process. The haemoglobin---oxygen combi-
nation is called oxyhaemoglobin (HbO2) and haemo-
globin that has released oxygen is called reduced
haemoglobin (HHb).
Carbon dioxide is transported in the blood in three
forms: dissolved in plasma, about 7---10%; chemically
bound to haemoglobin, about 20% is carried in RBCs
as carbaminohaemoglobin; and as bicarbonate ions in
plasma, about 70% is transported as bicarbonate
(HCO3�).
Carbon dioxide must be released from the bicar-
bonate form before it can diffuse out of the blood into
the alveoli. Bicarbonate ions combine with hydrogen
ions to form carbonic acid and carbonic acid splits to
Figure 1.27 Respiratory volumes and capacities. Essentials of Human Anatomy & Physiology, 9th Edition, Marieb, 2008� Pearson Education Inc.
22 Biomedical sciences

form water and carbon dioxide. The carbonic acid-
---bicarbonate buffer system resists blood pH changes.
If hydrogen ion concentrations in blood begin to rise,
excess Hþ is removed by combining with HCO3� and
if hydrogen ion concentrations begin to drop, carbonic
acid dissociates, releasing Hþ ions.
1.6 The nervous system
The central nervous system (CNS) consists anatomi-
cally of the brain, where high reasoned thought pro-
cesses occur which influence autonomic nervous
responses (of the brain stem), and the spinal cord
which affects these neural control signals and the five
senses:
. sight;
. sound;
. smell;
. taste; and
. touch.
With such fundamentally important functions the
nervous system, at is most critical parts, is protected by
the skull and spinal cord (see Figure 1.29).
1.6.1 Central nervous system
The brain and spinal cord make up the central
nervous system (CNS). The brain is made of two
Figure 1.28 The alveoli and gaseous exchange
Figure 1.29 (a) Protection for the brain in the head/skull, and (b) and spinal cord by the various vertebrae. Essentials ofHuman Anatomy & Physiology, 9th Edition, Marieb, 2008 � Pearson Education Inc.
Chapter 1 Anatomy and physiology of major organ systems 23

hemispheres, connected by a bridging connection of
nerves called the corpus callosum. These cerebral
hemispheres are the newest addition to the human
brain in evolutionary terms, so it is called the neo-
cortex. The older part of the brain is the hindbrain.
The hindbrain, which is at the back of the brain,
includes the cerebellum, which controls balance and
the brainstem, which controls the most basic func-
tions of the body, including breathing, blood pres-
sure and heart rate.
Messages are sent from --- and received by --- the
brain by a direct continuation of the spinal cord. The
spinal cord has a two-tone colour scheme of grey and
white when viewed in cross section with the naked eye
(see Figure 1.30(a)). The grey matter looks like a
butterfly with outstretched wings, sitting in the middle
of the surrounding white matter. The grey matter has
nerves which act at a specific site of the body, for
example the grey matter at the level of the fourth
lumbar vertebra is involved with knee sensation and
function, whereas the grey matter at the level of the
10th thoracic vertebra is involved with sensation and
muscle control around the umbilicus.
Information is packaged in bundles, or tractswithin
the cord, so that damage to a specific part of the cord
creates a predictable functional deficit (Figure 1.30(b)
shows themain tracts in the spinal cord --- but there are
many more).
The corticospinal tracts are nerves which go from
the motor cortex of the brain to the muscles which
obey the brain and cause a movement. The spinotha-
lamic tracts convey information to the sensory cortex
that a specific part of the body has just experienced a
sharp pain, a change in temperature or a firm touch.
The posterior columns convey information to the
brain about where the body currently lies in space,
for example standing, raising one arm and so on.
This information helps to control balance. The pos-
terior columns also tell the brain if part of the body is
experiencing light touch.
The brain is also composed of different centres,
which perform specific roles. For example the pituitary
gland and hypothalamus are parts of the brain which
release hormones (Figure 1.30(c)).
1.6.2 Autonomic nervous system
What cannot be overlooked are the autonomic nervous
pathways which reside in the brain stem and control
breathing, heart rate, eye responses and even swallow-
ing (see Figure 1.31 and Table 1.2).
1.6.3 Peripheral nervous system
All nerves outside the brain and spinal cord constitute
the peripheral nervous system (PNS). The autonomic
nervous system is part of the peripheral nervous system
and this set of nerves helps to regulate blood pressure,
heart rate, crying and sexual function. The autonomic
system is subdivided into the sympathetic and para-
sympathetic nervous systems. In general, the sympa-
thetic systemmakes us feel excited, angry or frightened
--- it is part of the ‘fight or flight’ impulse. On the other
hand, the parasympathetic system calms us down,
lowering our blood pressure and slowing down our
heart rate.
Peripheral nerves/neurons all have a similar struc-
ture. They consist of an axon, with a cell body which
communicates with other neurons via lots of branches
termed dendrites.
Signals are transmitted by electrical and chemical
(neurotransmitter) means. The electrical signal is cre-
ated by sodium and potassium ions moving across a
membrane, called an action potential, which is able to
travel considerable distances without losing ampli-
tude, because the nerve cells are lagged with a fatty
substance called myelin which acts as an insulating
material. The myelin is made by Schwann cells. When
one nerve needs to communicate with another nerve,
they do so by their dendrites, which have tiny gaps
called synapses where the electrical impulse jumps
from one cell to the next. Nerve impulses only travel
in one direction along a nerve, from the cell body to the
terminal endings (Figure 1.32)
There are several different neurotransmitters, in-
cluding acetyl choline, noradenaline, adrenaline, do-
pamine, GABA, serotonin and substance P. Different
neurotransmitters tend to be found in special areas, for
example GABA is associated with brain signals, ACH
with muscle and dopamine with sexual function.
When amotor nerve stimulates a skeletal or cardiac
muscle to contract, themotor cortex of the brain relays
the signal along neurons in the corticospinal tract, exit
along the anterior horn and the action potential sti-
mulates the release of acetylcholine (ACh) at themotor
end plate. The ACh alters calcium channels in the
muscle fibres and this causes structural changes within
the muscle fibres. The cells in skeletal and cardiac
24 Biomedical sciences

Figure 1.30 Diagrammatic representations of anatomical regions of the brain and spinal cord
Chapter 1 Anatomy and physiology of major organ systems 25

muscle cells contain sarcomeres with protein filaments
called actin and myosin. When a muscle contracts, the
myosin proteins, which are found on the thick fila-
ments, ratchet along the thin filaments which contain
actin proteins, resulting in increased overlap of
the thick and thin filaments. This results in smaller
H zones and shorter sarcomeres, as demonstrated in
Figure 1.33.
When a muscle contracts it moves its attachments.
Themuscle is attached to bone at each end by tendons,
which are noncontractile. So, for example, the psoas
muscle is attached to bone at one end at the top of the
femur (specifically on the lesser trochanter) and on the
Figure 1.31 Location of autonomic nerve centre of the midbrain and brain stem
Table 1.2 Actions of the parasympathetic andsympathetic systems
Sympathetic(fight and flight)
Parasympathetic(rest and digest)
Pupils Constrict Dilate
Heart rate Increase Decrease
Blood supply
to stomach
Decrease Increase
Blood supply to brain Increase Decrease
Sexual function Erection Orgasm
Figure 1.32 Diagrammatic representation of a typical peripheral nerve structure
26 Biomedical sciences

other end to the lumbar spine (specifically, the trans-
verse processes of L1 to L5). The main joint between
the femur and the spine is the hip joint. As the psoas
muscle runs in front of the hip joint, the psoas muscle
flexes the hip joint. This results in either the femur
being flexed while the torso is still, the torso flexing
while the femur is still, or both the femur and torso
flexing together. In order to control which movement
results from psoas contraction, other muscles contract
either with or against the psoas. So, if you want to
perform a sit-up from a lying down position, you will
want your legs to remain on the floor, while you flex
your hips and raise your torso from the ground. Psoas
will contract to flex the hip joint, supported by iliacus
which runs next to it, the anterior abdominal wall will
contract (these muscles attach to the pelvis, so won’t
influence leg movement) and the hamstrings, which
run behind the hips joint, from the pelvis to the tibia
will contract to extend the hip joint --- thus keeping the
femurs frommoving. As you begin to appreciate here, a
seemingly simplemovement involves the coordination
of several different muscles working together and
against each other to achieve the desired effect --- the
muscles receive the messages by motor nerves which
travel along the front and sides of the spinal cord
(corticospinal tracts) from the motor cortex in the
brain (see Figure 1.34). Themovementwill result in the
back leaving the floor and this change in sensation, as
well as change of position in space is conveyed as nerve
impulses along sensory and proprioceptive fibres in the
posterior columns of the spinal cord to the sensory
cortex and other areas of the brain. The change in
position in space is supported by information gleaned
from the semicircular canals in the middle ear, because
the head position has also moved from a horizontal to
vertical position.
1.6.4 The five senses
1.6.4.1 Sight
The eye receives light waves and converts this infor-
mation into electricity by things called photoreceptors
cells. The electrical energy is transmitted to the visual
cortex in the brain by the optic nerve. Whereas they
eye works like a camera, capturing data as an inverted
image, the visual cortex interprets the electrical energy
into correctly-orientated images. The eye is globe-
shaped and divided into two compartments. The front
compartment is called the anterior chamber and
contains the lens with its attachments. The watery
fluid contained in the anterior chamber is called the
aqueous humour and the gelatinous fluid in the
posterior chamber is called the vitreous humour
(Figure 1.35).
The lens’ shape is maintained by muscles (ciliary
muscles) which make the lens thinner or thicker to
alter focus. The pupil size is controlled by the iris,
which is the structure giving us our eye colour (blue,
green or brown). Once the light has hit the retina at the
back of the eye, two specialized types of cells convert
the light energy to electrical energy. The rods are
colour-sensitive cells and contain photoreceptors. The
rods are found in the highest numbers at the fovea. This
is a single spot on the retina, which collects the most
Figure 1.33 (a) Diagrammatic representation of the physiological anatomy of muscle filaments and (b) the changes inpositioning upon contraction
Chapter 1 Anatomy and physiology of major organ systems 27

information. The cones are cells which differentiate
between light and dark and are the cells which give us
our night vision, where we see in black and white. The
optic nerve conveys the information received by the
retina onwards to the brain. The optic nerve attaches to
the retina by a disc of nerve endings called the optic
disc. There are no rods or cones on the optic disc so that
any light which lands on the optic disc is not recog-
nized; this is the blind spot.
To find our blind spot, fix your eyes on an object in
front of you. Take a small coloured object and move it
around your visual field. You will find that the object
vanishes at one consistent point with the right eye, and
a different point with the left eye. Our brains usually
Figure 1.34 The spinal nerves and vertebral exit positions. Essentials of Human Anatomy & Physiology, 9th Edition,Marieb, 2008 � Pearson Education Inc.
28 Biomedical sciences

ignore the blind spot. The next part of the pathway is
very interesting from a clinical viewpoint, as it is
sometimes possible to diagnose which part of the brain
is damaged when a person loses part of their vision (see
Figures 1.36 and 1.37).
The left visual cortex receives information from the
outer(lateral) half of the same-sided (¼ipsilateral) left
eye and the inner (medial) half of the opposite
(¼contralateral) right eye. The right visual cortex
receives information from the ipsilateral visual field’s
lateral half and the contralateral medial half’s visual
field. Tracts B and C cross, or decussate at the optic
chiasm, which is just above, or superior to, the pitui-
tary gland.
Figure 1.35 Diagrammatic representations of the function components of the eye
Figure 1.36 Shows how the information from each eye is divided into three tracts per eye, six in total; tracts A and B comefrom the left eye and tracts C and D come from the right eye
Chapter 1 Anatomy and physiology of major organ systems 29

1.6.4.2 Sound
Hearing and balance are closely associated, as both
rely on structures inside the inner ear. Sound is
received by the ear and processed via three compart-
ments into electrical signals, which are then relayed
to the brain. The ear is divided simply into the outer
ear, middle ear and inner ear (see Figure 1.38). The
outer ear is the part that we see, that is, the ear, or
pinna, itself. The hole in the ear is the external
auditory meatus (¼‘the hole outside that listens’,
Latin again) and sound waves are transmitted to the
ear drum, which is the beginning of the middle ear.
The ear drum is called the tympanic membrane. It is
called a drum, rather than a membrane, or wall, due
to its function. The tissue is stretched like the skin on
a drum and, as sound waves strike the drum, it
vibrates according to the frequency (pitch) and
amplitude (volume) of the sound waves received.
The three smallest bones in the body are attached in
series to the other side of the ear drum. These are
called the malleus (hammer), incus (anvil) and sta-
pes (stirrup). The malleus attaches to the ear drum
and the stapes attaches to the oval window, which is a
smaller version of the ear drum. The incus links the
two bones together. The oval window is the partition
between the middle ear and the inner ear. The
ossicles of the middle ear act as a dampening system
for sound waves which hit the ear drum. When the
sound wave amplitude is very large, the ear drum
vibration is large too. A negative feedback system
comes into play, whereby a muscle attached to the
malleus, called tensor tympani, stretches the tym-
panic membrane, thus reducing the size of the
vibrations’ amplitude. The second dampening sys-
tem occurs at the other end of the ossicle chain, by a
muscle attached to the stapes, called stapedius. The
vibrations from the stapedius are transmitted to the
cochlea via the oval window and transferred to
electrical energy, which is conveyed to the auditory
cortex in the brain via the auditory nerve. Next to the
cochlea lie the semicircular canals, which are orga-
nized in x,y,z planes to help maintain balance.
Figure 1.37 Illustration of visual perception as a result of damage to the optic nerve pathways: A¼ normal vision;B¼ suspiciously discrete lesion damaging exactly one half of tract B; C¼ same suspicion as for Mr B, with tract C; D¼ damagedleft optic nerve; E¼ left-sided brain damage beyond the optic chiasm --- termed homonymous hemianopia --- may have lostnormal vision as a result of a stroke, or a severe head injury; F¼ two identical discrete lesions at B and X, very unlikely; G¼ bi-temporal hemianopia, a visual defect which may come on slowly and gradually worsen, commonly a pituitary tumour, pressingupwards and against the optic chiasm; H¼ damage to both optic nerves, an enormous pituitary tumour compressing all optictracts, or massive posterior brain damage, affecting both visual cortices (cortical blindness)
Figure 1.38 Diagrammatic representation of the functionalcomponents of the ear
30 Biomedical sciences

1.6.4.3 Taste
This sense is mostly about taste buds on the tongue.
There are a few taste buds in the walls of themouth and
the upper oesophagus as well. Different parts of the
tongue are better at detecting different types of taste.
There are four main tastes (see Figure 1.39).
The chemicals which make up different tastes are
converted into electrical activity via the taste buds and
then transmitted to the brain via the vagus nerve (10th
cranial nerve) and the glossopharyngeal nerve (ninth
cranial nerve).
1.6.4.4 Smell
This is another sense that relies on chemical stimuli
which are converted to electrical energy. A small
surface area around the size of a postage stamp in
each nose is responsible for smell. The receptors are
called olfactory receptor cells and the olfactory nerves
travel up the nose to the cribiform plate at the front of
the brain. The olfactory nerves (first cranial nerve)
regenerate continually throughout life and for this
reason they are the focus of lots of research into nerve
regeneration following spinal cord injuries and degen-
erative nerve diseases.
1.6.4.5 Touch
The fifth sense is touch. Whereas the other special
senses have nerves which communicate directly with
the brain, via cranial nerves, touch --- or sensation ---
uses mainly nerves which transmit information to
the brain via the spinal cord. These nerves are called
spinal nerves and they belong to the peripheral
nervous system.
Touch can be classified into light touch, vibration,
pain and temperature perception. These different types
of touch aremanaged by different types of nerve, which
travel along different parts of the spinal cord to
the brain.
1.7 The endocrine system
It is appropriate that the endocrine system should be
considered in juxtaposition with the nervous systems
as there are many similarities and contrasts in their
functionality as control systems of the body: both act as
communication networks; both use chemical sub-
stances as mediators between cells and both cause
actions at a distance. In cellular origins they are closely
related and in the adrenal medulla and hypothalamus
specialized ‘neurons’ secrete ‘hormones’ into the
circulation. However, whilst neurological signal con-
trol is a fast response, short-lived and specific effect,
Figure 1.39 Diagrammatic representations of sensoryregions of the tongue
Figure 1.40 The anatomical positioning of the major en-docrine glands
Chapter 1 Anatomy and physiology of major organ systems 31

Figure 1.41 Classification of hormones by chemical structure type
Figure 1.42 (a) Positioning of the hypothalamus and pituitary in the brain and the neuroendocrine and pituitary peptidehormone systems ((b) and (c) respectively) controlled
32 Biomedical sciences

endocrine control is a slower response to stimuli but
responses last for longer and the responses are
more generalized.
The major endocrine glands are illustrated in
Figure 1.40 and the hormones produced by these
glands are chemical messengers carried in the blood-
stream to distant target cells where they cause specific
changes in function.
1.7.1 Main functions of hormones
The main function of the hormones is (Figure 1.41):
. to promote the development of physical, sexual
and mental characteristics (e.g. the sex steroid
hormones);. to promote the adjustments of important bodily
functions (e.g. thyroid hormone and adaptation to
cold);. to keep certain physiological parameters constant
(i.e. maintain homeostasis, e.g. insulin and blood
sugar).
The function of various endocrine organs systems is
described in Chapter 2 and others in Chapter 7;
however, the hypothalamus and pituitary are the mas-
ter controllers of the endocrine system.
1.7.2 The hypothalamus andpituitary glands
Positioned at the base of the brain (see Figure 1.42
(a)) the hypothalamus is a direct link between the
central nervous system and endocrine signalling.
Neuroendocrine cells directly secrete hormone
into the circulation in the anterior pituitary (see
Figure 1.42(b)) or induce specialist cells of the
posterior pituitary to produce more complex
peptide hormones. Nevertheless the effects and sys-
tem controlled by these hormones are broad and
widely spread throughout the body. The anterior
pituitary gland is often referred to as the ‘master’
endocrine organ, but it too has a ‘master’. The
hypothalamus through the secretion of releasing and
inhibiting hormones controls all the systemic hor-
mones released (see Figure 1.42(c)).The hypothala-
mus through sympathetic activation has a direct
neural control of the adrenal medulla (which pro-
duces adrenaline and nor adrenaline) by controlling
the release of adrenocorticotrophic hormone ---
ACTH --- by specialist corticotroph cells of the
anterior pituitary. The posterior pituitary is not
really an endocrine gland as it simply stores and
releases two hormones --- oxytocin and ADH --- but
these are actually made and secreted by the main
body of neuroendocrine cells found in the hypothal-
amus (see Figure 1.42(b)).
Bibliography
Marieb, E.N. (2008) Essentials of Human Anatomy and
Physiology, 9th edn, Pearson Education.
Pocock, G. and Richards, P. (2009) The Human Body: An
Introduction for the Biomedical and Health Sciences, 1st
edn, Oxford University Press.
Ross and Wilson (2010) Anatomy and Physiology in Health
and Illness, 10th edn (eds A. Waughand A. Grant)
Churchill Livingstone.
Chapter 1 Anatomy and physiology of major organ systems 33

Chapter 2
Pathophysiology
Dr Suzanne M. Docherty, BMedSci, MBBS, Ph.D.
2.1 Pathophysiology:a definition
Pathophysiology is the study of medicine which deals
with any disturbances of body function caused by
disease. This can result in alterations to the mechanics
and/or biochemistry of the tissue concerned, with an
enormous variety of consequences, but also of scope
for investigation. It is thus a very large field of study. In
considering the pathological conditions that can affect
the individual, students can also usefully consider how
these occur within the entire population, and how the
cause of outbreaks of certain conditions can be studied.
In this chapter we encompass an introduction to the
fascinating field of epidemiology, from its historical
roots and important work in working out the root
cause of important ailments affecting large numbers of
people, through tomodern epidemiology. We will also
include an overview of pharmacology to consider
how the common classes of drugs work in treating
human pathology.
2.2 Introduction toepidemiology
Epidemiology looks at the occurrence of diseases and
accidents in different groups of people, and attempts to
find out why disease has occurred. This is an integral
part of the work of Public Health organizations ---
discovering what is at the root of morbidity and
mortality, and putting strategies in place to address
the causes and thus improve the health of a population.
The population at risk of a particular problemor illness
--- the target population --- can sometimes comprise an
entire nation of people, but in most epidemiological
studies it will be a narrower section of society. From
the target population, subjects for study should be
identified; this may be according to where they live
(geographical), where they are a patient or in care
(special care), what job they do (occupational --- this
can include schoolchildren!), or a disease they have
(diagnostic). Subjects should be chosen at random
whenever feasible to prevent the introduction of bias
Biomedical Sciences: Essential Laboratory Medicine, First Edition. Edited by Ray K. Iles and Suzanne M. Docherty.� 2012 John Wiley & Sons, Ltd. Published 2012 by John Wiley & Sons, Ltd.
35
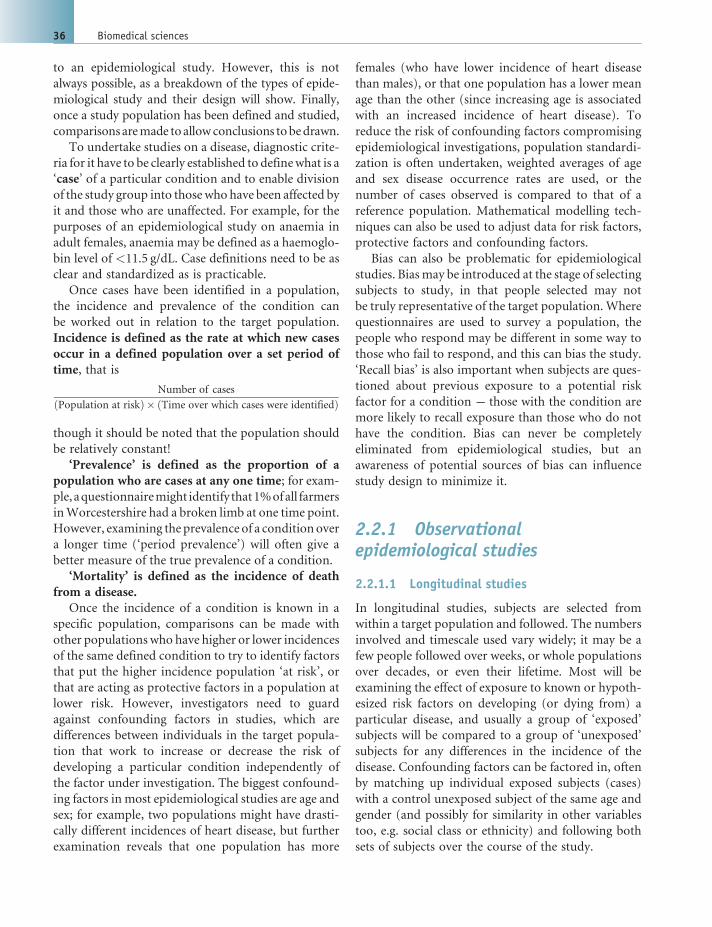
to an epidemiological study. However, this is not
always possible, as a breakdown of the types of epide-
miological study and their design will show. Finally,
once a study population has been defined and studied,
comparisons aremade toallowconclusions tobedrawn.
To undertake studies on a disease, diagnostic crite-
ria for it have to be clearly established to definewhat is a
‘case’ of a particular condition and to enable division
of the study group into those who have been affected by
it and those who are unaffected. For example, for the
purposes of an epidemiological study on anaemia in
adult females, anaemia may be defined as a haemoglo-
bin level of <11.5 g/dL. Case definitions need to be as
clear and standardized as is practicable.
Once cases have been identified in a population,
the incidence and prevalence of the condition can
be worked out in relation to the target population.
Incidence is defined as the rate at which new cases
occur in a defined population over a set period of
time, that is
Number of cases
ðPopulation at riskÞ � ðTime over which cases were identifiedÞ
though it should be noted that the population should
be relatively constant!
‘Prevalence’ is defined as the proportion of a
population who are cases at any one time; for exam-
ple,aquestionnairemight identify that1%ofall farmers
inWorcestershire had a broken limb at one time point.
However, examining the prevalence of a condition over
a longer time (‘period prevalence’) will often give a
better measure of the true prevalence of a condition.
‘Mortality’ is defined as the incidence of death
from a disease.
Once the incidence of a condition is known in a
specific population, comparisons can be made with
other populationswho have higher or lower incidences
of the same defined condition to try to identify factors
that put the higher incidence population ‘at risk’, or
that are acting as protective factors in a population at
lower risk. However, investigators need to guard
against confounding factors in studies, which are
differences between individuals in the target popula-
tion that work to increase or decrease the risk of
developing a particular condition independently of
the factor under investigation. The biggest confound-
ing factors in most epidemiological studies are age and
sex; for example, two populations might have drasti-
cally different incidences of heart disease, but further
examination reveals that one population has more
females (who have lower incidence of heart disease
than males), or that one population has a lower mean
age than the other (since increasing age is associated
with an increased incidence of heart disease). To
reduce the risk of confounding factors compromising
epidemiological investigations, population standardi-
zation is often undertaken, weighted averages of age
and sex disease occurrence rates are used, or the
number of cases observed is compared to that of a
reference population. Mathematical modelling tech-
niques can also be used to adjust data for risk factors,
protective factors and confounding factors.
Bias can also be problematic for epidemiological
studies. Biasmay be introduced at the stage of selecting
subjects to study, in that people selected may not
be truly representative of the target population. Where
questionnaires are used to survey a population, the
people who respond may be different in some way to
those who fail to respond, and this can bias the study.
‘Recall bias’ is also important when subjects are ques-
tioned about previous exposure to a potential risk
factor for a condition --- those with the condition are
more likely to recall exposure than those who do not
have the condition. Bias can never be completely
eliminated from epidemiological studies, but an
awareness of potential sources of bias can influence
study design to minimize it.
2.2.1 Observationalepidemiological studies
2.2.1.1 Longitudinal studies
In longitudinal studies, subjects are selected from
within a target population and followed. The numbers
involved and timescale used vary widely; it may be a
few people followed over weeks, or whole populations
over decades, or even their lifetime. Most will be
examining the effect of exposure to known or hypoth-
esized risk factors on developing (or dying from) a
particular disease, and usually a group of ‘exposed’
subjects will be compared to a group of ‘unexposed’
subjects for any differences in the incidence of the
disease. Confounding factors can be factored in, often
by matching up individual exposed subjects (cases)
with a control unexposed subject of the same age and
gender (and possibly for similarity in other variables
too, e.g. social class or ethnicity) and following both
sets of subjects over the course of the study.
36 Biomedical sciences

The disadvantages of longitudinal studies are
numerous. By studying subjects over long time peri-
ods, many will be lost to follow up (e.g. frommigrating
overseas), and studies can be very complex to admin-
ster as large numbers of subjects are involved. Exposure
to some hypothesized risk factors may be extremely
rare, and thus require large numbers of subjects to be
included to have sufficient numbers of exposed sub-
jects. There may also be a long time delay between
exposure and the manifestation of disease (e.g. it is
often several decades between exposure to asbestos and
the development of the lung tumour mesothelioma).
2.2.1.2 Case-control studies
A different approach to epidemiological studies that
may be preferable to the wide-ranging longitudinal
studies is the case-control study. In a case-control study,
people with a particular condition (cases) are identified,
and their exposure to one or more theoretical risk
factors is established retrospectively, for example by
questioning about areas lived in, diet, or industrial
exposure in different jobs. This is compared to the
exposure to the same risk factors in matched controls
who do not have the condition. Cases and controls can
be matched up according to exposure to potential
confounding factors, improving the validity of the
study, and the results statistically adjusted for con-
founding variables too. Once the exposure of both
cases and controls to a particular risk factor is known,
an odds ratio can be calculated for the likelihood of
developing that condition after exposure.
2.2.2 Experimental epidemiologicalstudies
Longitudinal and case-control studies are observation-
al; investigators study people as they are, and con-
founding factors can affect the results in ways that
investigators have little control over. Experimental
studies can be set up instead, in which investigators
control exposure to possible risk or protective factors
for a condition, and observe the outcome for experi-
mental subjects.
2.2.2.1 Randomized controlled trials
The ‘gold standard’ of epidemiological experimental
study is the randomized controlled trial. Subjects who
are representative of the target population and meet
predefined entry criteria are recruited, and their con-
sent for the experiment obtained. The number of sub-
jects required can be calculated in advance based on
what will give the study statistical ‘power’, that is, the
ability to show a real change. The subjects are divided
into twogroups; onewill receive aparticular treatment/
exposure to a possible risk factor (subjects), while the
other will not (controls). In an ideal situation a ran-
domized controlled trial will be ‘blinded’ so that sub-
jects are randomly assigned to one group or the other,
andwill not knowwhich group they are in --- this can be
achieved using computer-generated random numbers.
Controls can be given a ‘placebo’ treatment if appro-
priate, for example in a vaccine study case subjects will
receive the vaccine, while control subjects will receive a
placebo injection that has all other components of the
vaccine except the active compounds. Better still is the
‘double blind’ trial, in which the investigator is also
unaware ofwhich group subjects have been assigned to,
since this eliminates the potential for reporting bias of
the results by an investigator who is expecting a partic-
ular outcome. However, arrangements must exist for
rapidly ‘breaking the code’ if a problem arises. The trial
continues until a set end point, which may be weeks,
months or years later, and the outcomes from the case
and control subjects are compared and statistically
analysed to evaluate the intervention.
Some randomized controlled trials are designed to
be ‘crossover’ trials where feasible, such that the case
subjects and control subjects cross over in the middle
of the trial, with the cases then becoming controls, and
vice versa. This enables a treatment or exposure to be
evaluated in twice the number of people as a noncross-
over trial. However, the crossover trial is only suited to
interventions that have a short ‘half-life’, for example it
could not be used for a trial on a vaccine in which the
effects will last for years --- the cases could not go on to
act as controls if they have received the vaccine and still
have the relevant antibodies!
2.2.3 Epidemiology in outbreaksand epidemics
Outbreaks of disease are still of international impor-
tance, as recent global pandemics of SARS and Swine
Flu demonstrated. One of the first, and best known,
epidemiological studieswas thatundertakenoncholera
by the physician John Snow in London, in which he
Chapter 2 Pathophysiology 37

investigated the source of a cholera outbreak centred in
Soho in 1854. Snow’s work occurred in the days before
knowledge that disease could be transmitted bymicro-
organisms, when it was commonly believed that such
diseases were transmitted by breathing ‘foul air’. How-
ever, Snow worked out that the cholera outbreak
centred around one water pump in Broad Street by
studying the patterns of disease among the residents,
and enquiring about which pump had been used by
those infected with cholera. Snow later had the pump
handle removed from the pump,whichwas found to be
contaminated by a cesspit in close proximity. He also
performed a statistical analysis to link the number of
cases of cholera with the quality of the water supply.
Snow became known as the ‘father of epidemiology’.
Since Snow’s day, epidemiology has been used
to investigate the causes of numerous outbreaks of
illness, from the more mundane local clusters of food
poisoning to instances of serious illness caused by
environmental contamination (such as the aluminium
contamination of the drinking water supply at Camel-
ford in 1988), right up to the identification of the
cause of AIDS and its likely mode of transmission in
the early 1980s. However, defining what is a ‘case’ of
a particular condition remains important in the
epidemiological study of outbreaks of disease, as
‘pseudoepidemics’ are a possibility where a case defi-
nition is not well established. The population at risk
also needs to be identified before hypotheses about
the outbreak are developed, refined and tested. Once
the source of an outbreak is clear, control and preven-
tativemeasures can be put in place to halt the epidemic.
2.3 Introduction topharmacology
Pharmacology is the study of the science of drugs and
their affect on the human body. Drugs are not neces-
sarily simply those substances prescribed by a doctor,
or bought from the chemist --- a number of everyday
substances such as alcohol and tobacco are also drugs,
as are the herbal remedies that some people choose to
take. All of these substances contain active compounds
that can provoke a change in the body’s physiology via
a variety of mechanisms outlined in this section. (Note
that homeopathic ‘remedies’ fall outside of this defi-
nition, since they are composed of water that is so
diluted since initial exposure to an active compound
that is effectively only water once again, and numerous
studies suggest homeopathic remedies simply exert a
‘placebo’ effect.) Before considering the pathological
conditions that can arise in the human body and their
treatment, it is useful to have an understanding in how
pharmacological treatments actually achieve their ef-
fect, so that pathophysiology and treatment can both
be better understood.
2.3.1 Mechanisms of drug action
Drugs bring about changes in the body in one of five
general ways:
. action on receptors on cell membranes (including
membranes of organelles within the cell) --- this is the
most important conceptually in pharmacology;. blocking the action of specific enzymes, for example,
angiotensin converting enzyme inhibitors, used to
treat high blood pressure (see Section 2.8.9);. inhibiting cell transport mechanisms --- for example,
the drug probenecid inhibits transport of organic
anions in the renal tubule, and is often used along
with penicillin to prevent penicillin being rapidly
excreted by the kidneys;. action on invading organisms --- antibiotics are all
examples of this class of drug, as are antiviral,
antifungal and antihelminth drugs;. nonspecific interactions --- these are usually simple
chemical reactions, for example, using antacid drugs
(alkali compounds) to neutralize gastric acid.
2.3.2 Drugs and receptors
To bind to a receptor and produce an effect, a drug
needs to have a very specific structure. In general, drugs
need to have a very similar structure to the natural
compound (e.g. hormone) that usually binds to a
receptor, and drugs generally need a minimum
three-point attachment at a receptor to have an effect.
Drug binding to receptors can utilize any of the
chemical bonds the reader should already be familiar
with; hydrophobic interactions between nonpolar
groups on drug and receptor to minimize water con-
tact, ionic interactions between the charged groups on
drug molecules and receptor molecules, or occasion-
ally via covalent bonds. Since covalent bonds are
extremely strong and difficult to reverse, few drugs
38 Biomedical sciences

bind to receptors using themexcept in situationswhere
there is toxicity.
One of the most important concepts in considering
the action of drugs at receptors is that of the agonist
and antagonist. An agonist drug is a drug that causes a
stimulation-type response at a receptor; that is, it
mimics the effect of the natural molecule that binds
the receptor. A partial agonist does not fit the receptor
as well as the natural molecule that binds there, so it
causes a weaker response. An antagonist is a drug that
blocks or dampens the normal response at a receptor,
as it only partially fits the receptor, that is, it can block
it and prevent the natural molecule (e.g. neurotrans-
mitter) or an agonist drug binding there, but it cannot
activate the receptor.
Many antagonists work by competition with the
natural agonist, so the relative concentrations of the
agonist molecule and antagonist drug are important ---
at lowconcentrations of antagonist, little blockadeof the
receptor will be achieved, while at high concentrations
of antagonist compared tonatural agonist, good levelsof
blockade of the receptor will be achieved (Figure 2.1).
2.3.2.1 The adrenergic receptor --- the receptorof the sympathetic system
The sympathetic system (the body’s ‘fight or flight’
system, triggered in times of stress) uses receptors that
are activated by adrenalin, and these are known as
adrenergic receptors. The effects of adrenalin at these
receptors are to prepare the body to take rapid action in
a threatening situation, for example causing the heart
to pump faster, the bronchi to dilate to let maximal
oxygen reach the lungs, the arterioles to constrict and
increase blood pressure, to name the major effects (see
Chapter 1 to revise all the effects of activation of
the sympathetic system). There are different types of
adrenergic receptors found on different tissues of the
body; the heart has b1 adrenergic receptors, the
bronchioles of the lungs have b2 adrenergic receptors,and the blood vessels have mainly a adrenergic recep-
tors. Adrenalin acts on all types of adrenergic receptor,
but the subtle differences in these receptors allow drugs
to be made which will selectively act on one type of
adrenergic receptor. Salbutamol is a drug used to treat
asthma, a condition in which the bronchioles are
constricted and breathing becomes difficult. Salbuta-
mol is an agonist drug that acts at b2 receptors; it
activates them, causing dilation of the bronchioles.
However, it will also activate the similar b1 receptors
on the heart to a degree,meaning that a rapid heart rate
is a common side effect of salbutamol.
Beta blocker drugs have also been developed for
people with high blood pressure. These drugs are
antagonists for b receptors in the heart, blocking them
so that adrenalin is unable to bind to them, and thus
Figure 2.1 The actions of agonist and antagonist drugs at a receptor
Chapter 2 Pathophysiology 39

causing the heart to pump less hard, with subsequent
reduction of blood pressure. The first beta blocker
drug, propranolol, was not ‘selective’ and blocked both
b1 receptors in the heart and also b2 receptors in
bronchioles, which had the unfortunate side effect of
triggering asthma in individuals who were susceptible.
Later beta blockers such as atenolol were said to be
‘cardioselective’, meaning that they predominantly
blocked only b1 receptors and were less likely to triggerasthma; however, it remains good practice not to give
beta blocker drugs to patients with asthma.
2.3.2.2 The cholinergic receptor
The parasympathetic system (our normal day-to-day
operating system) uses acetylcholine as its neurotrans-
mitter, and thus its receptors are known as cholinergic
receptors. Binding of acetylcholine to cholinergic
receptors of the parasympathetic system causes
responses such as a lowering of heart rate, vasodilation,
bronchoconstriction, with increased gastric motility
and saliva production. Drugs which block cholinergic
receptors (i.e. are antagonists of cholinergic receptors)
are known as anticholinergic drugs, and can be used in
nausea and vomiting to decrease gastric motility. An
example is atropine, which is used to increase heart rate
by the blockade of cholinergic receptors. Common side
effects of anticholinergic drugs are a dry mouth, rapid
heart rate, blurred vision and urinary retention --- these
are largely predictable if you know the normal effects of
the parasympathetic system on the body!
2.3.3 Enzyme inhibition by drugs
Some drugs act by inhibiting the action of cellular
enzymes. Good examples include nonsteroidal anti-
inflammatory drugs (NSAIDs) such as aspirin and
ibuprofen, which inhibit the action of the enzyme
cyclo-oxygenase, and block the production of pros-
taglandins from arachidonic acid, thus decreasing
inflammation. However, prostaglandins also decrease
acid production and increase mucus production in
the stomach, so one side effect of NSAIDs in blocking
prostaglandin formation is to trigger gastritis in a
significant proportion of those who take NSAIDs for
any length of time.
Another example of enzyme inhibition by drugs is
angiotensin converting enzyme inhibitors (ACE inhi-
bitors) such as lisinopril, which inhibit the angiotensin
converting enzyme and ultimately prevent the forma-
tion of the potent vasoconstrictor angiotensin II, thus
keeping blood pressure down. The powerful antacid
drug omeprazole is also an enzyme inhibitor; it binds
to the proton pump enzyme in parietal cells in the
stomach to prevent the formation of Hþ ions, and thus
ultimately the formation of HCl for gastric acid
(Figure 2.2).
Figure 2.2 Enzyme inhibition pathways of (a) NSAIDs, (b) ACE inhibitors and (c) omeprazole
40 Biomedical sciences

2.3.4 Drugs that affect transportwithin a cell
Some drugs act by preventing the movement of ions
across cell membranes. A good example of this class of
drug is calcium channel blockers such as nifedipine;
these prevent the movement of calcium ions across the
cell membrane in the smooth muscle of blood vessels,
preventing contraction of blood vessels and thusmain-
tain vasodilation and lower blood pressure. They are
(b)
Renin�
Angiotensin
converting enzyme�
Angiotension
Angiotensinogen
Angiotensin l
Angiotensin lI
Vasoconstriction
Increased BP
Aldosterone
Na retentionWater retentionIncreased BP
�
converting enzyme� �
inhibitor (ACEI)�X
(c)
of (A),ACE (B)and
Parietal cell of
stomach
H+
K+
H+K+ - ATPase
GastrinHistamineAcetylcholine
X Omeprazole
Figure 2.2 (Continued )
Chapter 2 Pathophysiology 41
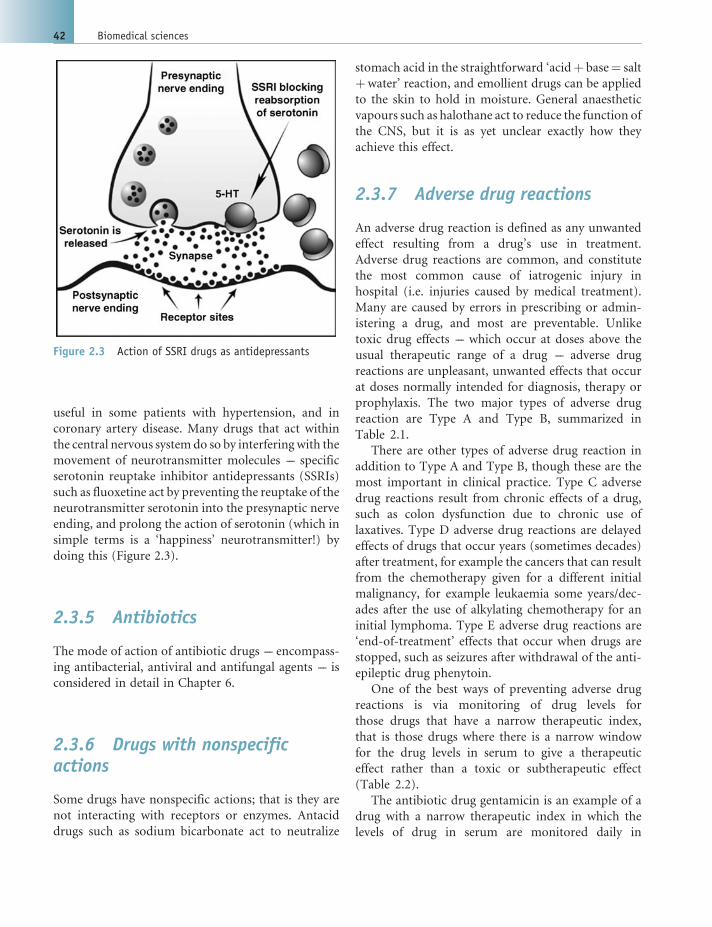
useful in some patients with hypertension, and in
coronary artery disease. Many drugs that act within
the central nervous systemdo so by interfering with the
movement of neurotransmitter molecules --- specific
serotonin reuptake inhibitor antidepressants (SSRIs)
such as fluoxetine act by preventing the reuptake of the
neurotransmitter serotonin into the presynaptic nerve
ending, and prolong the action of serotonin (which in
simple terms is a ‘happiness’ neurotransmitter!) by
doing this (Figure 2.3).
2.3.5 Antibiotics
The mode of action of antibiotic drugs --- encompass-
ing antibacterial, antiviral and antifungal agents --- is
considered in detail in Chapter 6.
2.3.6 Drugs with nonspecificactions
Some drugs have nonspecific actions; that is they are
not interacting with receptors or enzymes. Antacid
drugs such as sodium bicarbonate act to neutralize
stomach acid in the straightforward ‘acidþ base¼ salt
þwater’ reaction, and emollient drugs can be applied
to the skin to hold in moisture. General anaesthetic
vapours such as halothane act to reduce the function of
the CNS, but it is as yet unclear exactly how they
achieve this effect.
2.3.7 Adverse drug reactions
An adverse drug reaction is defined as any unwanted
effect resulting from a drug’s use in treatment.
Adverse drug reactions are common, and constitute
the most common cause of iatrogenic injury in
hospital (i.e. injuries caused by medical treatment).
Many are caused by errors in prescribing or admin-
istering a drug, and most are preventable. Unlike
toxic drug effects --- which occur at doses above the
usual therapeutic range of a drug --- adverse drug
reactions are unpleasant, unwanted effects that occur
at doses normally intended for diagnosis, therapy or
prophylaxis. The two major types of adverse drug
reaction are Type A and Type B, summarized in
Table 2.1.
There are other types of adverse drug reaction in
addition to Type A and Type B, though these are the
most important in clinical practice. Type C adverse
drug reactions result from chronic effects of a drug,
such as colon dysfunction due to chronic use of
laxatives. Type D adverse drug reactions are delayed
effects of drugs that occur years (sometimes decades)
after treatment, for example the cancers that can result
from the chemotherapy given for a different initial
malignancy, for example leukaemia some years/dec-
ades after the use of alkylating chemotherapy for an
initial lymphoma. Type E adverse drug reactions are
‘end-of-treatment’ effects that occur when drugs are
stopped, such as seizures after withdrawal of the anti-
epileptic drug phenytoin.
One of the best ways of preventing adverse drug
reactions is via monitoring of drug levels for
those drugs that have a narrow therapeutic index,
that is those drugs where there is a narrow window
for the drug levels in serum to give a therapeutic
effect rather than a toxic or subtherapeutic effect
(Table 2.2).
The antibiotic drug gentamicin is an example of a
drug with a narrow therapeutic index in which the
levels of drug in serum are monitored daily in
Figure 2.3 Action of SSRI drugs as antidepressants
42 Biomedical sciences

patients who are prescribed it. If levels of gentamicin
increase and climb above the therapeutic range,
damage to the nerves in the ear that control hearing
and balance can result, along with damage to the
kidneys. See also Section 2.3.7 for further details of
drug monitoring.
Having considered how the drugs used to treat
human disease attain their desired effects (and how
the safe use of drugs can best be achieved), we can now
move on to look at the diseases of major body systems;
understanding their diagnosis, investigation and
management.
Table 2.1 Type A and Type B adverse drug reactions
Type A Type B
Definition ‘Augmented’ adverse drug reaction: predictable,
common and dose-related
‘Bizarre’ adverse drug reaction: unpredictable, rare,
and not dose-related
Morbidity and mortality High morbidity, low mortality High mortality, low morbidity
Preventable? Most are avoidable Most are unavoidable
Examples Excessive pharmacological effect, e.g. respiratory
depression from morphine, heart block with
digoxin, gastric ulceration fromaspirin, lowblood
sugar with insulin
Allergic reactions, e.g. penicillin allergy
Rebound responses, e.g. rebound hypertension
after clonidine withdrawal
Genetically determined effects, e.g. autosomal
recessive trait for ‘slow acetylation’ of some drugs in
the liver means they are more slowly metabolized,
putting slow acetylators at risk of side effects. One
example is the drug-induced form of systemic lupus
erythematosus that occurs with the antihypertensive
drug hydralazine in slow acetylators.
Crossreaction with other receptors,
e.g. palpitations from salbutamol
Idiosyncratic effects of drugs, e.g. swelling around
the eyes from taking proton pump inhibitor drug
omeprazole, DVT after taking oral contraceptive pill
Table 2.2 Drug with a wide therapeutic index (left); drug with a narrow therapeutic index (right)
Drug with a wide therapeutic indexGenerally does not require monitoring of drugconcentration in plasma, e.g. penicillin, aspirin
Minimumeffectiveconcentration
Toxic level TOXICITY
Dose frequency
Dru
g co
ncen
trat
ion
Therapeuticrange
Drug with a narrow therapeutic indexRequires monitoring of drug concentration inplasma, e.g. gentamicin, phenytoin
Minimumeffectiveconcentration
Toxic level
Dose frequency
Dru
g co
ncen
trat
ion
Therapeuticrange
TOXICITY
Chapter 2 Pathophysiology 43

2.4 Gastroenterology
2.4.1 Symptoms of GI disease
The gastrointestinal (GI) tract is some 5m long in an
adult human, and symptoms of gastrointestinal disease
vary according to which part of the GI tract is affected.
Problems in themouth, throat andoesophagus can lead
to dysphagia, a difficulty in swallowing. Heartburn --- a
burning sensation felt behind the sternum --- may be
experienced where acid reflux from the stomach into
the oesophagus occurs. Vomiting may occur due to
stimulation of vomiting centres in the medulla of the
brain, or diarrhoea (passing increased volumes of loose
stool) may be experienced. Steatorrhoea is the passage
of pale bulky stools, and occurs where fat absorption is
impaired. Constipation usually means the infrequent
passage of hard stools ---oftenwith difficulty ---butmay
be interpreted differently by different people.
The gastrointestinal system comprises several com-
ponents; a bolus of food passes through themouth and
throat into the oesophagus, then the stomach, after
which components will travel on through the small
intestine and large intestine. Each of these aspects of
the gastrointestinal tract can give rise to their own
unique symptoms and presentations of disease --- these
are considered in turn below.
2.4.2 Oesophagus
The oesophagus conducts boluses of masticated
(chewed) food from the mouth into the stomach
through the oesophageal sphincter. Problems of the
oesophagus can lead to difficulty with swallowing ---
‘dysphagia’ --- or ‘heartburn’ (a burning sensation
experienced behind the sternum) from reflux of gastric
acid up into the oesophagus.
2.4.2.1 Acid reflux and Barrett’s oesophagus
A degree of reflux of gastric contents into the oesoph-
agus is normal, but repeated, lengthly episodes of
gastric acid in contact with the oesophageal mucosa
can cause the symptoms of heartburn. This is worsened
by bending down or lying flat, by alcohol and smoking,
but can be relieved by the action of simple antacids in
neutralizing gastric acid. H2 receptor antagonists such
as ranitidine can also be used to decrease the produc-
tion of gastric acid, or proton pump inhibitors such as
omeprazole to block the proton pump producing Hþ
ions in the stomach.
The normal squamous epithelium of the oesopha-
gus may undergo metaplasia to a columnar epithelium
following long-term exposure to gastric acid; this is
known as Barrett’s oesophagus, and may be identified
from biopsies taken from the oesophagus during en-
doscopy undertaken for investigation of longstanding
heartburn, or dysphagia (Figure 2.4).
Barrett’s oesophagusmay undergomalignant trans-
formation and give rise to adenocarcinoma of the
oesophagus in a proportion of patients with it, such
that surveillance for malignant change is often under-
taken once Barrett’s oesophagus is identified. Howev-
er, most tumours of the oesophagus are squamous cell
carcinomas that have arisen in the usual squamous
epithelium of the oesophagus. Oesophageal carcinoma
Figure 2.4 Normal squamous epithelium of the oesophagus (left); Barrett’s oesophagus (right)
44 Biomedical sciences

causes progressive dysphagia, starting with difficulty
in swallowing solids, then difficulty with swallowing
liquids too. A barium swallow X-ray is used to investi-
gate the oesophagus initially, in which barium (which
is opaque on X-ray films) is swallowed, and X-rays are
taken as it travels through the oesophagus. A narrow-
ing of the oesophagus is seen where there is a tumour
(Figure 2.5).
An endoscopy is performed to visualize any oeso-
phageal stricture, and biopsies taken to confirm the
diagnosis. CT and MRI scanning can also provide
useful information for staging a tumour. Treatment
is with surgery to remove a tumour if possible, but in
most patients will comprise symptomatic treatment to
relieve obstruction (e.g. insertion of a stent to keep the
oesophagus open).
2.4.3 The stomach
2.4.3.1 Gastritis
Gastritis is inflammation of the stomach lining, with an
inflammatory cell infiltrate seen in the gastric mucosa
microscopically. Breaks in the mucosa may be present
and these canbleed, sometimesextensively (Figure2.6).
Most gastritis is caused by chronic infection with
Helicobacter pylori, a Gram-negative, urease-produc-
ing bacterium that produces an acute gastritis that
rapidly becomes chronic. Use of nonsteroidal antiin-
flammatory drugs such as aspirin and ibuprofen,
which block prostaglandin production in the gastric
mucosa and remove the protective effect of these from
the action of gastric acid, is also a common cause.
However, alcohol, infections such as the herpes sim-
plex virus, stress and burns can all lead to gastritis. The
symptoms and signs of gastritis include heartburn,
vomiting and haemorrhage from the gastric mucosa,
and an endoscopy (with or without biopsies) may
be performed if symptoms merit it to establish a
diagnosis, along with specific testing for Helicobacter
Figure 2.5 Barium swallow film showing a stricture wherethere is an oesophageal tumour narrowing the lumen.Source: emedicine.medscape.com Figure 2.6 Gastritis as seen via an endoscope
Chapter 2 Pathophysiology 45

infection, such as antibody serology. Treatment of
gastritis involves removing identified causes, for exam-
ple stopping ibuprofen, or eradicating anyHelicobacter
infection with a multidrug regime comprising an anti-
biotic and a proton pump inhibitor drug. Proton pump
inhibitor drugs or H2 receptor antagonists are used in
most patients with gastritis to decrease gastric acid
production and thus damage to the inflamed mucosa.
2.4.3.2 Peptic ulcers
Peptic ulcers occur where the epithelium of an area of
mucosa is eroded; most occur in the stomach (gastric
ulcers) or duodenum (duodenal ulcers), and around
75% are associated with Helicobacter pylori infection.
Peptic ulcers cause pain in the upper abdomenwhich is
usually relievedbyantacids, sometimeswithnauseaand
heartburn. Occasionally, peptic ulcers can perforate
right through the wall of the stomach or duodenum,
or haemorrhage. A gastroscopy will allow visualization
of anulcer andbiopsyof areas of interest, and treatment
comprises eradicating anyHelicobacter pylori and sup-
pressing gastric acid, for example with a proton pump
inhibitor drug such as omeprazole (Figure 2.7).
2.4.3.3 Gastrointestinal bleeding
Bleeding into the gastrointestinal tract can be divided
into upper GI bleeding (originating in the oesophagus,
stomach or small intestine), and lower GI bleeding
(from the colon). Upper GI bleeding is usually due to
chronic peptic ulceration, but other common causes
are varicose veins in the oesophagus, tears from re-
peated vomiting (Mallory---Weiss tears), or from tu-
mours in any part of the upper GI tract. Upper GI
bleeding causes haematemesis --- or vomiting blood,
which looks dark due to the action of gastric acid --- and
melaena, the passing of dark, tarry stools as blood from
the upper GI tract is altered during its passage to the
rectum. The bleeding usually settles spontaneously,
but may require a blood transfusion and an urgent
endoscopy to establish the site of bleeding and enable
specific treatment of the underlying cause, for example
using protonpump inhibitor drugs for peptic ulcers, or
coagulation of actively bleeding ulcers by laser.
Bleeding from the lowerGI tract is common, and the
great majority of cases are due to haemorrhoids (also
known as piles) around the anus. Massive bleeding is
fortunatelyrare,andwhereitdoesoccurisusuallydueto
diverticular disease (see Section 2.4.5) or ischaemia of
thecolon,where itsbloodsupply isdisrupted.However,
tumours of the colon, inflammatory bowel disease,
polyps and congenital malformation of blood vessels
in the colon can all also cause lower GI bleeding. The
symptoms are passage of bright red blood from the
rectum, sometimes with abdominal pain depending on
the cause. Rectal examination and techniques such as a
colonoscopy can be used to determine the site of bleed-
ing, though angiography or the use of Technitium-
labelledredcellsmayberequired to lookformalformed,
bleeding blood vessels in the colon. Treatment is of
the underlying cause, for example surgical resection of
any tumour, with red cell transfusion as needed.
2.4.3.4 Gastric cancer
The incidence of gastric cancer is declining in the UK
relative to other cancers, and it is currently the eighth
most common cancer inmen.Most cases are related to
chronic infection with Helicobacter pylori, though
smoking, alcohol, a diet low in fruit and vegetables
and high in salt are also implicated. Most cases are
adenocarcinomas, and may be localized ulcerated tu-
mours (‘intestinal type’) or more extensive tumours
(‘diffuse type’). Gastric cancer causes very similar
Figure 2.7 Large duodenal (left) and gastric (right) ulcersseen on endoscopy; histology of a gastric ulcer showing theseagull-shapedHelicobacter organisms (arrows) on the surface
46 Biomedical sciences

symptoms to peptic ulceration, that is upper abdomi-
nal pain, along with weight loss, nausea and loss of
appetite. Metastatic spread occurs in advanced disease
to the liver and peritoneum, with symptoms of ascites
and an enlarged liver. A barium meal or gastroscopy
with biopsies are used to diagnose gastric cancer, with
CT scanning to stage the tumour (i.e. see if and how far
it has spread). Treatment is with surgical resection
where possible, though overall survival is poor.
2.4.4 Small intestine
The small intestine’s major function is nutrient ab-
sorption, and to optimize this function its surface area
is massively increased by villi and microvilli. Distur-
bance of small intestinal function causes diarrhoea,
abdominal pain, weight loss and steatorrhoea (pale
stools that contain fat), and specific deficiencies of
nutrients. The commonest causes of malabsorption
from the small intestine in the UK are coeliac disease
and Crohn’s disease.
2.4.4.1 Coeliac disease and malabsorption
Coeliac disease is an immunological condition in
which antibodies are formed against the gliadin com-
ponent of gluten, a protein found in wheat. Further
ingestion of gluten once this has occurred causes
chronic inflammation in the small intestine, with loss
of villi (villous atrophy), and thus a massively de-
creased absorptive capacity. It is known to run in
families, and is strongly associated with inheritance
of particular HLA genes: HLA-A1, -B8, -DR3, -DR7
and -DQW2. Coeliac disease diagnosis is often delayed
as symptoms are common, nonspecific ones such as
tiredness, diarrhoea, anaemia and abdominal pain; the
peak ages of incidence are in infancy, and age 30---40
years. The diagnosis is made by finding antigliadin and
antiendomysial antibodies in serum, followed by bi-
opsy of the jejunum via endoscopy and confirmation
of loss of villi on histology (Figure 2.8). Treatment of
coeliac disease is with a lifelong gluten-free diet. There
is an increased risk of intestinal lymphoma and small
intestinal cancer in coeliac disease.
2.4.4.2 Carcinoid tumours of the small intestine
Carcinoid tumours are rare tumours that produce
serotonin (also known as 5-hydroxytryptamine, or
5-HT), and are most usually found in the terminal
ileum, appendix or rectum. If they metastasize to the
liver, serotonin produced by the metastatic carcinoid
deposit is able to avoid metabolism and pass directly
into the hepatic vein and then into the systemic
circulation. This causes ‘carcinoid syndrome’ of flush-
ing, wheezing, diarrhoea, abdominal pain and fibrosis
of cardiac valves on the right side of the heart. It is
diagnosed by measuring levels above the normal range
of a metabolite of serotonin, 5-hydroxyindoleacetic
acid (5-HIAA) in a 24 h urine collection, and liver
ultrasound will reveal carcinoid metastases. Treatment
is via surgical resection of carcinoid tumour, and the
use of serotonin antagonist drugs such as octreotide to
improve symptoms (Figure 2.9).
Figure 2.8 Jejunal biopsy in coeliac disease showingvillous atrophy
Figure 2.9 A carcinoid tumour seen in islands in theappendix (tumour cells stained using antibodies againstchromogranin, a marker they express)
Chapter 2 Pathophysiology 47

2.4.5 The colon
2.4.5.1 Inflammatory bowel disease
Inflammatory bowel disease (IBD) is increasingly com-
mon in the Western world, with a peak incidence at
around 20---40 years. It is known to be associated with
the inheritance of HLA-B27, and men and women are
equally affected. The cause is currently unknown, but
there are various hypotheses around the role of infec-
tion with mycobacteria and viruses such as the measles
virus, and autoimmune processes. There are two main
forms of IBD: Crohn’s disease and ulcerative colitis,
and the features of both are compared in Table 2.3.
The symptoms of Crohn’s disease depend on which
part of the GI tract is involved, but commonly include
diarrhoea, weight loss and abdominal pain. Ulcerative
colitis is confined to the colon, and presents with
bloody diarrhoea --- in a severe attack there is also fever,
rapid heart rate, a raised ESR, anaemia and a low serum
albumin. Some patients develop ‘extraintestinal man-
ifestations’ such as arthritis of a single joint, specific skin
rashes (e.g. erythema nodosum and pyoderma gang-
renosum), liver cirrhosis or renal stones. X-rays with
barium contrast may be used to assist with the diagno-
sis, andwill often show ulceration and narrowing in the
affected segments. A colonoscopy is used to obtain
biopsies for histological diagnosis, which is useful to
distinguish between Crohn’s disease and ulcerative
colitis. Not every case can be given an exact type of IBD,
and such cases are designated ‘indeterminate colitis’.
The treatment of IBD uses preparatations of
5-acetylsalicylic acid such as mesalazine to induce
remission, often alongside corticosteroids (either may
be used orally, or via enemas/suppositories). Some
patients will require immunosuppressive treatment
with drugs such as azathioprine or cyclosporin in
addition, and others benefit from the use of an
‘elemental diet’ of liquid formulations of carbohy-
drates, fat and amino acids. Surgery may be required
to remove affected segments of the gut in patients in
whom drug therapy fails, or where there are compli-
cations such as abscess formation or perforation of
the inflamed gut.
2.4.5.2 Diverticular disease
Diverticular disease is common; around 50% of people
over age 50 are affected, and they are associated with a
low fibre diet. Diverticulae are outpouchings of mu-
cosa that push through the weak areas of the muscular
wall of the colon, forming pockets in which faecal
material can become trapped. This may result in
diverticulitis, or inflammation of diverticulae with
abdominal pain, nausea, fever, though most cases of
simple diverticulosis are asymptomatic (Figure 2.10).
Treatment of diverticulitis is with resting the bowel
(i.e. keeping a patient nil by mouth), and giving
intravenous fluids and antibiotics. Surgical interven-
tion is occasionally required in cases that do not settle.
Table 2.3 Comparison of the features of Crohn’s disease and ulcerative colitis
Crohn’s disease Ulcerative colitis
More common in smokers Less common in smokers
Incidence the same for men and women More common in women
Affects any part of the gastrointestinal tract Affects just the colon
‘Skip’ lesions seen: affected segments separated by normal tissue Lesions are continuous
Cobblestone appearance of mucosa, with fissures and deep ulcers Red, friable mucosa that bleeds easily
Inflammation extends throughout the entire wall Inflammation confined to the mucosa
Many granulomata seen No granulomata. Crypt abscesses seen and depletion of goblet cells
Figure 2.10 Diverticulae in the colon
48 Biomedical sciences

2.4.5.3 Polyps
Colon polyps are areas of colonic mucosa that are
raised above the mucosal surface. They are almost
always benign adenomas, and are usually entirely
asymptomatic and discovered incidentally (e.g. during
a colonoscopy) since they are found in around 10% of
the population. However, patients who inherit the
autosomal dominant gene for familial polyposis coli
will develop thousands of colonic polyps, with an
extremely high risk of malignant transformation due
to the sheer number of polyps present --- in such
patients resection of the colon should be performed
early to eliminate this risk (Figure 2.11).
2.4.5.4 Colorectal cancer
Colorectal cancer is one of the more common malig-
nancies; it is currently the third most frequent cancer
in the UK, and its incidence increases with increasing
age. It is associated with a low fibre, high fat diet, and
both ulcerative colitis and familial polyposis coli pre-
dispose to it. The most common genetic alterations in
sporadic bowel cancers are mutations that activate an
oncogene known as KRAS, along with the mutation or
loss of the tumour suppressor genes APC, SMAD4 and
TP53. Most tumours occur in the rectosigmoid area of
the colon and spread directly through the bowel wall,
and into the surrounding lymphatics, possibly metas-
tasizing to the liver. More than 90% are adenocarci-
nomas. Symptoms and signs of colorectal cancer
include changes in bowel habit, rectal bleeding and
abdominal pain, and investigation commonly uses
colonoscopy to visualize any masses, and acquire
biopsies. X-ray studies with barium contrast may also
be used. Treatment is via surgical resection of a tumour
where feasible, with rejoining of the two ends of the
bowel where possible (where this is not possible, the
proximal end of the colon will be brought out onto
the abdominal wall in a ‘colostomy’). Duke’s classifi-
cation is used to ‘stage’ colon cancer from histological
appearances and information from scans, as shown in
Table 2.4 (Figure 2.12 and Figure 2.13).
Following surgical resection of a malignant colo-
rectal tumour, further treatment with chemotherapy
or radiotherapy may also be advised, depending on the
stage of the tumour, and the patient’s age and general
health. Some patients may be suitable for therapy with
monoclonal antibodies (e.g. Cetuximab) against pro-
teins encoded by mutated oncogenes that give malig-
nant cells a survival advantage, and this improves
survival for those whose tumours express the relevant
antigen.
2.4.5.5 Appendicitis and peritonitis
Acute appendicitis is common, and is caused by
obstruction of the appendixwith a small impacted piece
of faecal material, triggering inflammation which can
lead on to gangrene and perforation of the appendix if
untreated. It can be seen in all age groups, and causes
acute abdominal pain that begins centrally and moves
to the right side, along with loss of appetite and fever.
Blood tests show a raised white cell count, and a scan
may show the inflamed appendix. Treatment is with
surgical removal of the appendix, often done via a
laparoscope (‘keyhole surgery’).However, the appendix
Figure 2.11 Colonic polyp as seen on colonoscopy (left); histology of a colonic adenoma (right)
Table 2.4 Staging of colorectal cancer
Dukes’ Stage Features
A Tumour confined to the bowel wall
B Tumour extending through the bowel wall
C Regional lymph nodes involved
D Distant metastases
Chapter 2 Pathophysiology 49

may perforate and cause a local abscess in the abdomen,
or generalized peritonitis.
Peritonitis is a seriouscondition that follows rupture
of an abdominal viscus (e.g. appendix, or perforated
gastric ulcer). It causes sudden abdominal pain with
shock, and an erect chest X-ray will show a line of air
under the diaphragm. Treatment is that of the underly-
ing condition, but peritonitis has a high mortality rate.
2.5 Liver, biliary tract andpancreatic disease
2.5.1 Symptoms and diagnosisof liver, biliary tract andpancreatic disease
The presentation of liver disease can vary according to
whether patients have acute or chronic liver disease.
Figure 2.12 Staging of colorectal cancer --- layers of the colon wall and the meaning of Dukes’ staging. From Abelhoff et al,Abelhoff’s Clinical Oncology, Fourth Edition, 2008� Elsevier
Figure 2.13 Colorectal cancer histology
50 Biomedical sciences

Acute liver disease typically gives rapid onset of symp-
toms such as nausea, tiredness and loss of appetite, with
jaundice developing later. Chronic liver disease often
has no symptoms, and patients often present at a late
stage of the disease with a variety of symptoms such as
confusion, drowsiness, collections of fluid in the ab-
dominal cavity (ascites), gastrointestinal bleeding, or
jaundice (with which many patients experience an
unbearable itching of the skin --- pruritis --- where bile
salts are deposited). Serum for liver function tests
(LFTs) is often sent to the clinical biochemistry labora-
tory to investigate potential liver disease, and serum
levels of bilirubin (total and conjugated), serum albu-
min, and liver enzymes alkaline phosphatase (ALP),
g-glutamyl transpeptidase (GGT), alanine transami-
nase (ALT), aspartate transaminase (AST) are mea-
sured (see Table 2.5 for the functions and diagnostic use
of these). Clotting tests --- specifically, measurement of
prothrombin time --- are also often useful to assess liver
function as clotting factors are made by the liver and
have a short half-life, and thus deranged blood clotting
can also be a useful indicator of liver disease.
Ultrasound examination of the liver following
confirmation of jaundice with LFTs will show a
dilated bile duct if there is obstruction to the biliary
tree, and serum viral markers for the hepatitis viruses
will be undertaken too in case they are the cause for
jaundice. In the presence of a dilated biliary tree, an
endoscopic examination called endoscopic retrograde
cholangio-pancreatography (ERCP) may be per-
formed in which an endoscope is passed through the
stomach and into the duodenum to the opening of
the common bile duct (CBD) to inject dye into the
biliary tree and visualize it on X-ray. Biopsies can be
taken of any obstructing masses to arrive at a diag-
nosis, gallstones can be removed if obstructing the
CBD, or a stent might be inserted into a narrowed bile
duct to hold it open.
Table 2.5 Liver enzymes and their significance
Liver function test component Significance
Bilirubin --- total Bilirubin is derived from breakdown of haem, which in turn comes from breakdown of aging
or defective red blood cells, and the liver process and excretes this. Bilirubin is taken up into
hepatocytes and conjugatedwith glucoronic acid tomake it water soluble, after which it can
be excreted in bile. Elevated levels of total bilirubin cause jaundice, with bilirubin deposited
in body tissues causing the characteristic yellowing of skin and mucous membranes.
Bilirubin --- conjugated Assessment of levels of conjugated bilirubin helps to narrow the possible causes of jaundice;
if conjugated bilirubin is elevated as well as total bilirubin, conjugation is proceeding
normally but the liver is unable to excrete bile effectively. If unconjugated bilirubin is
normal but total bilirubin is raised, this indicates a surplus of conjugated bilirubin and
indicates a problem in the bilirubin pathway before this point.
Serum albumin Alb Albumin is made in the liver and is the major protein found in serum. Levels are decreased in
chronic liver disease, some forms of renal disease where it is lost into urine, and in
malnutrition. Its half-life is relatively long (20 days), making it a less sensitive marker of
hepatic disease compared to clotting factor measurement.
Alkaline phosphatase ALP ALP is an enzyme present in the biliary ducts, and levels are increased in biliary duct
obstruction (e.g. by gallstones or pancreatic cancer) and by tumours present in the liver.
However, levels of ALP are also elevated in patients with Paget’s disease of bone, in
hyperthyroidism, and in growing children.
g-glutamyl transpeptidase GGT GGT is a more sensitive indicator of obstruction to the outflow of bile than ALP is and will
show small elevations even in mild, early liver disease, but is also elevated with chronic
alcohol abuse and when patients are on drugs that induce liver enzymes (e.g. the
anticonvulsant drug phenytoin).
Alanine transaminase ALT ALT is found within hepatocytes, and acute damage to hepatic cells causes it to leak into
serum causing dramatic rises (often measured in multiple of the upper limit of normal, or
ULN) e.g. in acute viral hepatitis infection.
Aspartate transaminase AST Like ALT, AST is found in hepatocytes and will similarly rise rapidly in acute liver injury.
However, it is also found in other cells of the body (e.g. red blood cells, the heart and skeletal
muscle); rises in AST are thus seen in myocardial infarction and damage to skeletal muscles.
Chapter 2 Pathophysiology 51

2.5.1.1 Jaundice
Jaundice refers to the yellow discolouration of skin and
eyes where serum bilirubin levels are greater than
approximately twice the upper limit of the normal
range (Figure 2.14).
Bilirubin is mostly formed from the breakdown of
red blood cells, and is carried in blood bound to
albumin to be conjugated to glucuronic acid in the
liver. Conjugated bilirubin is soluble and can be ex-
creted from the liver in bile, where it undergoes
conversion to urobilinogen in the terminal ileum of
the small intestine. Some urobilinogen is excreted in
faeces as stercobilinogen --- which give faeces their
characteristic brown colour --- and some is reabsorbed
and excreted by the kidneys (giving urine its charac-
teristic yellow colour). Causes of jaundice are divided
into prehepatic causes (i.e. haemolysis), hepatic causes
(e.g. liver disease) and posthepatic causes (obstruction
to the outflow of bile).
Prehepatic jaundice is caused by increased produc-
tion of bilirubin where excessive numbers of red blood
cells are being destroyed, for example in autoimmune
haemolytic anaemia, in red cellmembrane defects such
as hereditary spherocytosis, in malaria infection, thal-
assaemia and sickle cell anaemia, and in glucose-6-
phosphate dehydrogenase deficiency. Investigations
will show haemolytic anaemia along with an increase
in unconjugated bilirubin and normal liver enzymes.
Hepatic jaundice is caused by ineffective bilirubin
conjugation, for example in liver disease such as cir-
rhosis, viral or drug-induced hepatitis, liver tumours
(primary or secondary), and where the liver is imma-
ture in premature and newborn babies. Inherited
disorders of bilirubin metabolism can also cause
hepatic jaundice. The commonest example is Gilbert’s
syndrome, which affects around 5% of the UK popu-
lation and is usually asymptomatic, with a wide range
of defects possible in the bilirubin metabolism path-
way. It is characterized by an isolated increase in serum
bilirubin, with normal liver enzymes and no indication
of liver disease.
Posthepatic jaundice is due to obstruction of the
outflowof bile from the liver, where there are gallstones
in the common bile duct, inflammation along the bile
duct (cholangitis), or with compression of the com-
mon bile duct by tumours of the biliary tree or in the
head of pancreas.
2.5.2 Liver disease
2.5.2.1 Hepatitis
Hepatitis is acute (lasting less than 6 months) or
chronic (lasting more than 6 months) inflammation
of the liver,with thepresenceof inflammatory cells; that
is, neutrophils or lymphocytes in the tissues, and liver
cell necrosis. This causes a rise in AST levels in serum.
The liver is large and inflamed, andhepatitis sometimes
causes jaundice. It is most often caused by infection
with ahepatitis virus, though it canalsobecausedby the
Epstein---Barr virus, cytomegalovirus, autoimmune
disease, drugs (paracetamol overdose, or the anaesthet-
ic gas halothane), pregnancy and alcohol. Complete
recovery is usual. However, hepatitis can induce mas-
sive necrosis of hepatocytes and is occasionally fatal.
In hepatitis, a marked rise in serumAST is seen, and
an increased bilirubin where there is jaundice. Full
blood count will show an increase in white cells, and
serummarkers for the hepatitis viruses will be positive
where one is the causative agent, for example anti-
Hepatitis A Virus (anti-HAV) antibodies. Where au-
toimmune disease is the cause for hepatitis, circulating
autoantibodies will be present, for example antinuclear
and antismooth muscle antibodies), with an increased
bilirubin, AST and ALT.
Treatment of hepatitis is by treating the cause where
possible, immunosuppressant drug treatment for au-
toimmune disease, interferon-a for Hepatitis B and C,
stopping alcohol where this is the likely cause of hepa-
titis, or withdrawal of drugs known to cause hepatitis.
Immunization is available for Hepatitis A and
Hepatitis B and this should be given in at-risk groups.Figure 2.14 Jaundice in a newborn Caucasian baby suffer-ing from ABO incompatibility (see Chapter 8)
52 Biomedical sciences

2.5.2.2 Cirrhosis
Liver cirrhosis results where there has been necrosis of
liver cells, and this is replaced by scar tissue (fibrosis).
This causes deterioration of liver function and changes
in liver architecture (Figure 2.15).
Symptoms and signs likely to be found with cirrho-
sis include jaundice, an enlarged liver and spleen,
spider naevi (see Figure 2.16), ascites (free fluid in the
peritoneal cavity) and dilated veins over the abdomen.
In the final stages of liver cirrhosis patients become
confused and disorientated as toxins usually removed
by the liver build to such a level that they begin to cross
the blood---brain barrier.
The commonest cause of liver cirrhosis is alcohol
in the developed world, but worldwide the common-
est cause is Hepatitis B infection. Other causative
agents include Hepatitis C, cystic fibrosis, haemo-
chromatosis (a genetic condition in which excess iron
is absorbed in the gut and deposited in tissues,
including the liver), biliary cirrhosis, autoimmune
chronic active hepatitis, and a1-antitrypsin defici-
ency. The diagnosis may be suspected from elevations
of AST and ALT in liver function tests, and a low
serum albumin, with a prolonged prothrombin time
in clotting tests. Further testing for Hepatitis B and C
serology should be done, along with autoantibodies to
look for an autoimmune basis for the disease, serum
iron, ferritin and total iron binding capacity for
haemochromatosis, and serum a1-antitrypsin levels.
However, liver cirrhosis is a histological diagnosis and
can only be made from biopsy of the liver, with
demonstration of the altered architecture typical of
cirrhosis.
Cirrhosis is irreversible, though progression can be
halted by treating the cause if possible, for example
abstaining from alcohol. In end-stage liver cirrhosis,
liver transplantation is often advised, and referral to a
specialist centre made.
2.5.2.3 Liver tumours
Most liver tumours are metastatic from other areas of
the body rather than primary liver tumours. The most
common sites to metastasize to the liver are breast,
lung and gastrointestinal tract. Primary liver tumours
may be benign or malignant, and of malignant tu-
mours, hepatocellular carcinoma (HCC) is the com-
monest worldwide (though it is relatively rare in
developed countries).
Figure 2.15 Normal liver (left) stained with H&E; cirrhotic liver (right) stained with Masson’s trichrome, showing scar tissuereplacing normal liver tissue
Figure 2.16 Spider naevi on skin
Chapter 2 Pathophysiology 53

2.5.2.4 Hepatocellular carcinoma
Hepatitis B infection is the biggest single predisposing
factor to HCC, and liver cirrhosis from any cause also
increases the likelihood of HCC developing. Patients
with HCC experience loss of appetite, fevers, ascites,
weight loss and pain around the area of the liver. Serum
levels of a-fetoprotein (a normal antigen produced in
the fetus that is reexpressed by HCC cells) are raised,
andCT scan or ultrasound of the liver will show amass.
Liver biopsy and histology of the mass will confirm the
diagnosis. Surgical excision of the tumour may pro-
long survival, but in most cases HCC is fatal within
months (Figure 2.17).
2.5.3 Disorders of the biliary tractand pancreas
2.5.3.1 Gallstones
Around 20% of the UK population have gallstones.
They are more frequently found in women than men,
and the old adage was that they mostly occurred in
people who were, ‘fair, fat, female, fertile and 40’; risk
factors for developing gallstones do include obesity
and use of the contraceptive pill. Gallstones are either
composed of cholesterol (80% of gallstones are cho-
lesterol stones), or pigment stones composed of
bilirubin compounds that are found in people with
chronic haemolysis. Most people with gallstones will
have no symptoms, though a gallstone can become
trapped in the entrance to the gall bladder or in the bile
duct and cause severe pain, nausea and jaundice, with
fever --- this is acute cholecystitis. Ultrasound of the gall
bladder will show it to contain stones and be distended.
Removal of the gall bladder (cholecystectomy) should
be performed some days to months after cholecystitis
(Figure 2.18).
2.5.3.2 Pancreatitis
Pancreatitis is inflammation of the pancreas, and
causes severe abdominal pain thought to be due to
necrosis of pancreatic cells due to autodigestion from
release of proteolytic enzymes that should normally
be confined to lysosomes within pancreatic cells.
Common causes include gallstones, alcohol, hyperli-
pidaemia and steroid drugs. Pancreatitis may be acute
or chronic, and patients with pancreatitis experience
severe pain in the upper abdomen, with nausea and
vomiting. An elevated level of serum amylase --- a
digestive enzyme normally produced by the pancreas
Figure 2.17 Normal liver histology (left); hepatocellular carcinoma histology (right)
Figure 2.18 Gall bladder containing predominantly bile pigment gallstones (left); paler cholesterol gallstones (right)
54 Biomedical sciences

--- assists with the diagnosis, and CT or ultrasound
scans show an enlarged pancreas. Treatment uses
analgesia and resting the gut by keeping patients nil
by mouth, with a nasogastric tube to remove gastric
secretions. However, acute pancreatitis can be severe,
and may trigger multiorgan failure and even death in
up to 50% of the most serious cases. Patients who
recover may also go on to have further attacks of
pancreatitis, particularly where their causative factor
(e.g. alcohol) continues.
2.5.3.3 Pancreatic cancer
Pancreatic cancer is increasing in incidence in devel-
oping countries, and is now the 11th most common
cancer in the UK, but the fourth cause of cancer deaths.
It is more frequent in older people (two thirds of all
cases are diagnosed in people over the age of 70) and
occurs more often in men than in women. Risk factors
for developing pancreatic cancer include smoking,
alcohol, diabetes, pancreatitis, being overweight, and
a family history of pancreatic cancer. Most cases affect
the head of the pancreas, and cause a painless jaundice
as the tumour presses on the bile duct and obstructs it
(Figure 2.19).
Abdominal pain is common, and diabetes may
ensue as functional pancreatic tissue is lost to tumour.
The diagnosis is made with CT, ultrasound scanning,
and endoscopic retrograde cholangiopancreatography
(ERCP), in which an endoscope is passed through the
stomach and into the duodenum, and dye injected into
the bile duct, with biopsies taken of the mass if it is
accessible. Most cases are adenocarcinomas, andmany
express the tumour marker CA 19-9, which can be
monitored during treatment. In most cases, surgical
excision of pancreatic cancer is not possible, and
treatment with chemotherapy and radiotherapy is
recommended where patients are fit enough. A stent
is often placed in the compressed bile duct to hold it
open, and this relieves jaundice and associated symp-
toms (e.g. severe itching) for most patients. Pancreatic
cancer sadly has a very low 5 year survival rate; most
cases are diagnosed late as the early stages cause no
symptoms, and by this stage most cases are inoperable.
2.5.3.4 Endocrine tumours of the pancreas
Some tumours that arise in the pancreas are derived
from hormone-producing cells, and usually secrete
one hormone that gives rise to specific symptoms,
Figure 2.19 Cancer of the head of the pancreas, and its relationship to the bile duct
Chapter 2 Pathophysiology 55

and can be measured to assist with diagnosis. Gas-
trinomas occur in G cells of the pancreas and produce
large quantities of gastrin, causing development of
large gastric ulcers. Vipomas secrete vasoactive intes-
tinal peptide, which produces watery diarrhoea. Glu-
cagonomas produce glucagon, and are derived from
the a cells of the pancreas --- this produces diabetes
mellitus and a rash. Treatment of these endocrine
tumours is with surgical removal of the tumour
where possible, and treatment of the symptoms, for
example the proton pump inhibitor drug omeprazole
for gastrinomas.
2.6 Rheumatology
2.6.1 Symptoms of rheumatologicaldisease
Problems with the musculoskeletal system are ex-
tremely common in the general population, and ac-
count for a large proportion of consultations with
general practitioners. Patients with rheumatological
problems may experience pain in one or more joints
(arthralgia), which may arise from the joint itself, or
from tissues surrounding the joint (e.g. tendons, liga-
ments or the joint capsule). The term arthritis is used to
describe an abnormal joint: one which is swollen,
deformed and may contain extra fluid --- effusion ---
in the joint. However, it is important to realize that the
underlying defect in patients with rheumatological
disease is an autoimmune condition in which the
immune system is erroneously attacking different tis-
sues, and rheumatological conditions can thus mani-
fest themselves in any organ of the body. This is
outlined in the most common presentation patterns
for different rheumatological disease below.
2.6.2 Arthritis
Arthritis can be subdivided into osteoarthritis and
rheumatoid arthritis.
2.6.2.1 Osteoarthritis
People with osteoarthritis experience pain in joints
which is increased by movement, and relieved by
resting, often with increased stiffness in joints first
thing in the morning. It is caused by a gradual
destruction of the articular cartilage that normally
lines a joint surface (i.e. the cartilage would normally
prevent one bone from grinding along the surface
of another bone in a joint). The underlying bone is
exposed and becomes thickened, with cysts and
an increased proportion of blood vessels developing.
As new cartilage growth is attempted and calcifies,
small outgrowths of bone called ‘osteophytes’ appear
at the articular surface, causing further pain. The
distal interphalangeal joints --- the joints at the end
of fingers --- are most commonly affected. X-rays will
show a narrowed joint space and the presence of
osteophytes, with sclerosis (thickened bone) and cysts
in the bones. Blood tests are typically normal. Treat-
ment consists of advising overweight patients to lose
weight, and using nonsteroidal antiinflammatory
drugs (e.g. aspirin or ibuprofen) to control symp-
toms. Some patients will require surgery to replace
badly damaged joints.
Osteoarthritis is found more often in women than
men, and occurs more commonly with age: 50%
of those older than 60 have osteoarthritic changes on
X-ray, but not all of these will have symptoms. It may
be secondary to previous trauma to, or congenital
malformation of, a joint, but most cases are primary
osteoarthritis, and biochemical abnormalities in carti-
lage may underlie this.
2.6.2.2 Rheumatoid arthritis
Rheumatoid arthritis (RA) causes symmetrical pain,
swelling and stiffness, usually in the small joints of the
hands and feet first. As it progresses, it leads to joint
deformity and instability, and spreads to other joints of
the body. RA differs from osteoarthritis in the pattern
of joints involved, as shown in Figure 2.20, and in the
involvement of other parts of the body other than
joints in the illness.
RA tends to occur at a younger age than osteoar-
thritis (with a peak in the fourth decade of life), and
affects women three times more thanmen, in common
with other autoimmune conditions. It is a disorder of
the synovial membrane that lines a joint cavity, in
which an autoimmune process causes its infiltration by
macrophages, lymphocytes and plasma cells. The in-
flamed synovium grows over the articular cartilage
surface in a thick ‘pannus’, destroying the articular
cartilage and underlying bone. Apart from the joint
involvement in rheumatoid arthritis, subcutaneous
56 Biomedical sciences

nodules appear in the skin too --- these contain granu-
lomata, and are also found in the lungs and heart.
Muscle wasting may also be seen, along with fever,
fatigue, swollen lymph nodes, anaemia, pleural effu-
sions and pericarditis: RA is a multisystem disorder,
and the immune system can turn against several tissues
as part of the disease process. Blood tests will often
show a normocytic, normochromic anaemia (the
‘anaemia of chronic disease’), an ESR and CRP that
are raised in proportion to the disease activity, and
rheumatoid factor is positive in around 80% of pa-
tients. A newer test used inRA is anticitrullinated cyclic
peptide (antiCCP) antibody titre measurement --- a
high titre antiCCP is highly sensitive for RA, and
antiCCP antibodies can be found several years before
RA becomes clinically apparent. X-rays of affected
joints will show a narrowed joint space, bone erosion
and cysts in bones at the joint surface.
RA can be difficult to manage and requires the
input of several specialist medical teams. Nonsteroi-
dal antiinflammatory drugs are often used to manage
pain and swelling, but drugs to modify the disease
process (‘disease-modifying antirheumatic drugs’,
DMARDs, such as methotrexate or sulphasalazine)
should be started as soon as possible to prevent joint
erosion, deformity and loss of function ensuing as RA
progresses.These drugs can have serious side-effects
including bone marrow failure, and the use must be
monitored as appropriate for the drug, for example
with regular full blood counts for patients on metho-
trexate. Corticosteroids can also be used for RA flares,
either orally or injected into affected joints. The latest
treatments for RA for patients who have not been
successfully treated with at least two different
DMARDs use injections of antiTNF antibodies (e.g.
with adalimumab or etanercept), often with dramatic
improvement.
2.6.2.3 Infective arthritis
Fortunately, infections of joints are uncommon, but
when they do occur, joint destruction may ensue
within hours. Bacteria, viruses and fungi can all cause
infective arthritis. Septic arthritis is said to occur
when joints are infected with pus-producing organ-
isms, particularly with Staphylococcus aureus, which
reaches joints following local spread from infected
tissues, from trauma, or from spread via the blood-
stream from a distant site. Tuberculous arthritis may
occur in a small proportion of patients with TB, and
usually affects the spine; meningococcal arthritis can
occur in meningococcal septicaemia, or gonococcal
arthritis in patients with genital or oral infections with
gonorrhoea. Septic arthritis leads to a red, hot, swol-
len and painful joint with or without fever. Fluid is
aspirated from the joint to arrive at the diagnosis, and
in septic arthritis there is pus in the joint fluid
(>50 000� 106/L white blood cells). Gram staining
can be performed on the fluid to illustrate the pres-
ence of bacteria, and culture of the fluid will identify
the organism. Blood cultures may similarly identify
the infective organism. Immediate treatment with
Figure 2.20 Patterns of joint involvement in the hands in rheumatoid arthritis (left) and osteoarthritis (right)
Chapter 2 Pathophysiology 57

appropriate intravenous antibiotics should be started
to minimize joint destruction.
2.6.3 Systemic lupuserythematosus
Systemic lupus erythematosus (SLE) is the common-
est form of connective tissue disorders that cause
arthritis, along with immune complex deposition in
tissues, and vasculitis (inflammation of blood ves-
sels). It is a disorder of multiple body systems and
can present in different ways in different patients;
it mainly affects younger females, and is seen far
more frequently in people of Afro-Carribean descent.
It is believed to be largely genetically inherited, but
female hormones and some viral infections (particu-
larly with the Epstein---Barr virus) have also been
implicated. SLE is characterized by the development
of antinuclear antibodies, and may be associated
with a defect in apoptosis that causes intracellular
components to be presented to lymphocytes as if they
are foreign antigens, triggering the development of
antibodies against components of ‘self’ cells. The
presentation of SLE often involves an assymetrical
distribution of painful joints which changes to differ-
ent joints (‘migratory arthralgia’), sometimes with
fever, fatigue and depression. Some patients develop a
characteristic ‘butterfly’ facial rash. Pleurisy, renal
disease and involvement of the heart (with aortic
valve lesions, or inflammation of the pericardium
and/or endocardium) are also common in SLE, but
other body systems can also be involved. A full blood
count often shows a normochromic, normocytic
anaemia (commonly with decreased neutrophil and
platelet counts) with raised ESR, and the presence of
antinuclear antibodies is found. Futher antibodies
against intracellular materials such as double-strand-
ed DNA (dsDNA) and phospholipids may also be
identified in patients with SLE. Biopsies of affected
tissues will show vasculitis and the presence of
granulomata.
Treatment of SLE depends on its severity, and the
organs affected. Nonsteroidal antiinflammatory drugs
may be used for mild joint pain, but most patients will
require treatment with corticosteroids, and some with
disease-modifying or immunosuppressant drugs such
as hydroxychloroquine or azathioprine, often along-
side corticosteroids.
2.6.4 Crystal deposition diseases
2.6.4.1 Gout
Gout is the commonest crystal deposition disease, and
occurs when abnormal uric acid metabolism leads to
deposition of sodium urate crystals in joints, soft
tissues and the urinary tract. It is 10 times more
common in men than in women. The underlying
problem is hyperuricaemia, or increased levels of uric
acid, due to its overproduction, or decreased renal
excretion. The latter is more commonly responsible,
and may be seen in chronic renal disease, with high
blood pressure, with alcoholism or with the use of
thiazide diuretic drugs. Overproduction of uric acid
may occur as a result of increased purine production,
since urate is a product of purine metabolism; purines
are increased in myeloproliferative diseases such as
leukaemia or polycythaemia rubra vera, psoriasis or
carcinoma. Acute gout causes a sudden onset of severe
pain, redness and swelling in a joint, usually the joint
in the big toe. Itmay affectmultiple joints, and crystals
may also be deposited in cartilage, most notably
around the ear. Examination of aspirated synovial
fluid from infected joints shows the long, pointed
urate crystals, and treatment in the short term is with
nonsteroidal antiinflammatory drugs, injection of
corticosteroids into affected joints. In the longer term,
patients who are overweight should be advised to lose
weight, alcohol consumption should be decreased;
drugs to inhibit purine breakdown (e.g. allopurinol)
or drugs to promote the renal excretion of uric acid (e.
g. probenecid) can also be used.
2.6.4.2 Pseudogout --- pyrophosphatearthropathy
Calcium pyrophosphate crystals can also be deposited
in tissues, mainly in articular cartilage of the knee,
causing pseudogout. The cause is unknown, but it
tends to occur in older people with equal incidence
in men and women. It may follow primary hypopara-
thyroidism, gout, haemochromatosis or hypothyroid-
ism. In pseudogout, microscopy of aspirated synovial
fluid shows small, rectangular crystals of calcium
pyrophosphate (which show birefringence under
polarized light --- see Chapter 4). Treatment is with
joint aspiration, nonsteroidal antiinflammatory drugs
and corticosteroids.
58 Biomedical sciences

2.6.5 Bone disease
2.6.5.1 Osteomalacia
Osteomalacia occurs due to a lack of sufficient calcium
and phosphate mineralization of bone following clo-
sure of epiphyseal plates (where this occurs prior to
closure of epiphyseal plates, rickets --- bowing of the
bones of the lower leg --- is seen instead). It is often due
to vitamin D deficiency, from poor diet þ/� lack of
sun exposure. However, it may be due to renal disease
that results in poor production of active vitamin D
from its precursors, from malabsorption of vitamin D
from the diet (e.g. in coeliac disease) or from hepatic
failure. Osteomalacia leads to bone fractures and mus-
cle and bone pain. Low levels of calcium and phosphate
are seen in serum, along with an increased level of
alkaline phosphatase, and X-rays identify the poorly
mineralized bones. Bone biopsy and histology will give
a definitive diagnosis, and treatment is with oral vita-
min D supplementation.
2.6.5.2 Osteoporosis
Osteoporosis differs from osteomalacia as it is a defi-
ciency of all components of bone, that is both matrix
and minerals. It is more common in women (particu-
larly after the menopause, and with other causes of
oestrogen deficiency such as ovary removal), and as-
sociated with smoking, lack of exercise, people with a
low BMI, excess alcohol consumption, corticosteroid
use, rheumatoid arthritis, renal failure, andwhere there
is a family history of osteoporosis. It leads to an
increased risk of fractures, usually of the vertebrae,
wrist and neck of femur. Blood tests (including cal-
cium, phosphate and alkaline phosphatase levels) are
normal, but bone densitometry scanning will identify
‘thinned’ osteoporotic bones. Prevention is the ideal in
people at risk; oestrogen therapy will reduce bone loss
following the menopause, with attention to sufficient
calcium intake. Bisphosphonate drugs reduce bone loss
andmay be prescribed alongside calcium supplements.
2.6.5.3 Paget’s disease
Paget’s disease is characterized by overproduction of
weak, pathological new bone following overabundant
osteoclast and osteoblast activity. Viruses may play a
role in its causation, since viral inclusions can be seen
in the osteoclasts of Paget’s disease, and it is predomi-
nantly a disease of the elderly. Paget’s disease mainly
affects the pelvis, skull, tibia, spine and femur, leading
to bone pain and deformities (e.g. bowed legs, or
misshapen skull), sometimeswith fractures and, rarely,
bone tumours. A significantly raised alkaline phospha-
tase level may be found and X-rays of affected bones
show areas of bone lysis and thickening. Paget’s disease
is treated, once symptomatic, with bisphosphonate
drugs and calcitonin to decrease bone turnover.
2.7 Urinary tract disease
2.7.1 Symptoms and investigationof urinary tract disease
Disorders of the renal tract commonly cause problems
or changes to the pattern of urination (e.g. dysuria, or
painful urination, polyuria, frequent urination, noc-
turia, needing to urinate at night, anuria, passing no
urine, or haematuria, passing urine with blood in it).
Pain may be experienced from the kidney or bladder
regions, and renal disease may cause systemic symp-
toms and signs such as hypertension, fatigue, an
increased serum creatinine and urea, or protein in
urine (proteinuria).
Renal disease is most commonly investigated ini-
tially by simple dipstick testing of urine and compari-
son of the colour of each test strip with a chart. This
enables rapid assessment of the presence or absence of a
wide range of analytes in urine, such as blood, protein,
glucose, ketones, bilirubin and white blood cells, and
the estimation of the specific gravity of urine and its pH
(Figure 2.21).
The presence of glucose in urine may indicate
diabetes mellitus, while bilirubin signifies jaundice.
White cells imply a urinary tract infection, and urine
can be cultured to identify any organisms present.
Protein detected in urine (proteinuria) is sometimes
found in small amounts during episodes of fever and
after exercise, but significant proteinuria seen on re-
peated urine samples should be investigated further by
organizing a collection of all urine voided over 24 h for
measurement of the total amount of protein excreted
in one day. More than 2 g of protein in urine in 24 h
implies renal disease. Haematuria may bemacroscopic
(blood in urine is visible with the naked eye) or
microscopic (urine looks normal, but dipstick testing
reveals the presence of haemoglobin). If microscopic
Chapter 2 Pathophysiology 59

haematuria is detected, microscopy of urine should be
undertaken to look for red cells, and for red cell ‘casts’
(which indicates bleeding within the glomeruli of the
nephron). Further testing might include looking at the
cells present in urine --- urine cytology --- and radio-
graphic studies of the urinary tract. A cystoscopy could
also be performed, in which a flexible camera is in-
serted into the urethra to visualize the bladder, and
biopsies of any abnormal tissue identified can be taken.
2.7.2 Urinary tract infection
Urinary tract infection (UTI) is common in females,
who have a far shorter urethra than males, allowing
bacteria a quicker route into the bladder where they
canmultiply.Many bacteria that cause UTI are derived
from the bowel, and the proximity of the urethra and
anus in the female particularly predisposes them to
UTI. The commonest organism cultured is Escherichia
coli, but skin organisms such as Staphylococcus sapro-
phyticus and Staphylococcus epidermidis also account
for some 20% of UTIs in women. UTIs acquired in
hospital are often caused by Klebsiella aerogenes or
Enterococci species; catheterization of the bladder,
bladder stones and obstruction of the urinary tract all
make UTI more likely. Tuberculosis can occasionally
cause UTI, usually in immigrant populations.
Patients with a UTI experience urination that is
painful (dysuria) and frequent, and may have haema-
turia. Pain over the region of the bladder is usually
experienced, and patients may complain that their
urine smells offensive. If infection ascends from the
bladder up the ureter(s) to the kidney, pyelonephritis
results, and patients tend to become systemically
unwell with fever and loin pain in addition to symp-
toms of lower UTI. Patients with UTI should have
urine cultured, and finding >100 000 of one bacterial
species per ml of urine is diagnostic. Appropriate oral
antibiotics that are renally excreted to concentrate in
the bladder are prescribed, such as trimethoprim or
nitrofurantoin. In patients with pyelonephritis, intra-
venous antibiotics may be required.
2.7.3 Autoimmune diseaseand the kidney
2.7.3.1 Glomerulonephritis
Glomerulonephritis is a group of disorders in which
the immune system causes damage to the glomerulus
of the renal nephron. Circulating antigens (e.g. DNA in
systemic lupus erythematosus) become trapped in the
glomerulus and antibody---antigen complexes begin to
form, or antigen---antibody complexes present in the
circulation may be deposited in the glomerulus. In
many patients, the causative antigen is never discov-
ered, though some may be produced by drugs (e.g.
penicillamine), bacteria (e.g. Streptococcus viridans),
viruses (e.g. mumps) and fungi, as well as by innate
antigens. In other patients, glomerulonephritis is
caused by the presence of antiglomerular basement
membrane (antiGBM) antibodies that react against the
glomerular basement membrane to directly damage it.
Once immune complexes are present in the glomeru-
lus, they trigger inflammation and the appearances
seen under the light microscope after renal biopsy are
used to classify the resulting glomerulonephritis,
which may affect the entire kidney (‘diffuse’ glomeru-
lonephritis), be limited to part of the kidney (‘focal’
glomerulonephritis), or be seen to affect certain parts
or all of the glomeruli (‘segmental’ or ‘global’
glomerulonephritis).
Glomerulonephritis may present in different ways,
with asymptomatic proteinuria and haematuria right
up to renal failure. Some patients develop ‘acute
nephritic syndrome’ of oedema and hypertension
along with proteinuria and haematuria, or ‘nephrotic
syndrome’ in which there is heavy proteinuria, a fall in
Figure 2.21 Dipstick testing of urine
60 Biomedical sciences

plasma albumin and oedema. It is treated according
to the clinical picture; in some patients, a full
recovery is achieved with supportive measures and
careful assessment of fluid balance with daily weigh-
ing and measurement of fluid input and output.
Hypertension is treated with salt restriction, diuretics
and vasodilators, and in some patients, immunosup-
pressant drugs such as azathioprine or prednisolone
may be required. Renal failure is managed as detailed
in Section 2.7.7.
2.7.3.2 Tubulointerstitial nephritis
Tubulointerstitial nephritis is inflammation of the
supporting cells around the renal tubules, with tubular
damage, and is usually due to hypersensitivity to drugs
such as penicillin, ibuprofen, furosemide, phenytoin
and rifampicin. It causes acute renal failure along with
fever, a rash, an increase in eosinophils in the blood,
and joint pain, and renal biopsy will demonstrate
eosinophil infiltration amid the interstitial cells. Treat-
ment is by stopping the offending drug and managing
the renal failure (see Section 2.7.7), often alongside
corticosteroid drugs, and tubulointerstitial nephritis
will often resolve well.
2.7.4 Hypertension and the kidney
Kidney disease can cause dramatic hypertension, but
equally hypertension can trigger renal disease, and
distinguishing the correct order of events is not always
straightforward. Essential hypertension --- hyperten-
sion with no identifiable cause --- leads to thickening of
the walls of renal blood vessels and a shrinkage in
kidney size, often to the detriment of renal function.
Very sudden, severe hypertension can trigger necrosis
and fibrin deposition in the glomerular arterioles,
causing renal damage with subsequent worsening hy-
pertension and further renal damage.
Secondary hypertension is due to bilateral renal
disease in 80% of cases, and glomerulonephritis,
chronic pyelonephritis, polycystic kidney disease and
renal artery stenosis account for most of this. Hyper-
tension is triggered by activation of the renin---
angiotensin---aldosterone system and retention of salt
andwater in diseased kidneys. Some cases of secondary
hypertension may also occur due to unilateral kidney
disease in the case of renal artery stenosis, where a poor
blood supply from a constricted renal artery triggers an
increased renin release from that kidney, with a subse-
quent rise in angiotensin II, and thus blood pressure.
Renal artery stenosis can be demonstrated using arte-
riography of renal vessels with injected contrast, and is
usually treated using antihypertensive drugs (except
ACE inhibitors, which are unsafe in renal artery ste-
nosis). Some may be treated surgically by dilating the
narrowed renal artery.
2.7.5 Renal stones
Renal stones are relatively common in the UK popu-
lation, and affect males twice as often as females. Most
(80%) comprise calcium oxalate and calcium phos-
phate compounds in patients with unexplained high
levels of calcium secretion in urine (idiopathic
hypercalciuria), though some comprise magnesium
ammonium phosphate (often following urinary tract
infection with organisms that produce urease, such as
Proteus and Klebsiella species), and others are formed
from uric acid or cystine. Stones in the urinary tract
can cause no symptoms, but can cause excruciating
loin or bladder pain (depending on their location),
haematuria, and infections and obstruction of the
urinary tract. They are often visible on a plain X-ray
of the abdomen, and further blood tests can be
performed to pinpoint causative factors such as serum
calcium, uric acid and bicarbonate levels, with chem-
ical analysis of any stone that is passed. A 24 h urine
collection can be analysed for calcium, oxalate and
uric acid output. Treatment is with strong analgesia.
Stones of <5mm diameter will often pass spontane-
ously, while larger stones can be broken down with
shock waves (lithotripsy) or removed via cystoscopy
or open surgery. Any underlying conditions that
predispose to the development of renal stones should
be treated, and patients encouraged to drink enough
to stay well hydrated.
2.7.6 Cystic renal disease
The presence of one or more renal cysts is extremely
common in the general population, becoming more
so with increasing age in any one person, and is
usually of no significance. However, adult polycystic
disease (APCD) is an autosomal dominant genetic
condition in which both kidneys develop numerous
cysts that compress renal tissue and cause progressive
Chapter 2 Pathophysiology 61

loss of renal function in enlarging kidneys. This causes
loin pain, haematuria in some, and development of
hypertension and rising urea levels in serum. Some
also develop cysts in other organs, and Berry aneur-
ysms in the brain (see Section 2.8.10). Renal ultra-
sound confirms the diagnosis, and treatment is with
control of hypertension. Most patients with APCD
will eventually require dialysis or kidney transplanta-
tion, and other first-degree relatives should be
screened for the disease.
2.7.7 Renal failure
Renal failure is characterized by a fall in glomerular
filtration rate (GFR, see Chapter 7) and a failure to
maintain renal excretion of waste products. This is
seen alongside variable levels of failure of erythro-
poietin secretion, lack of vitamin D hydroxylation,
problems with acid---base balance, salt and water
balance, and blood pressure. Acute renal failure is a
rapid decline in renal function over days to weeks,
and is often reversible. It may be caused by ‘prerenal’
problems that lead to poor perfusion of the kidneys
with blood (e.g. haemorrhage, burns, diabetic ketoa-
cidosis, sepsis, myocardial infarction, renal artery
obstruction), renal problems (e.g. glomerulonephri-
tis, malignant hypertension, interstitial nephritis,
nephrotoxins such as the antibiotic gentamicin) or
‘postrenal’ problems (obstruction to urine flow any-
where along the pathway). Acute renal failure is often
asymptomatic at the outset, and then polyuria or
oliguria (large or small urine volumes produced,
respectively) is commonly seen, with weakness, nau-
sea, vomiting and confusion as urea levels rise in
serum. Symptoms of anaemia (pallor, fainting, short-
ness of breath) may be experienced if erythropoietin
excretion deteriorates.
Investigation of acute renal failure aims to give
an accurate assessment of renal function at that point
in time, and also to identify the underlying cause
quickly to attempt to reverse it. A full history and
examination is extremely important. A full blood
count, urine dipstick testing and urine microscopy
are performed, along with measurement of urinary
electrolytes, then imaging of the kidneys with ultra-
sound and/or CT scanning. Renal biopsy may be
undertaken if the cause is still unexplained and the
kidneys are of normal dimensions. Other investiga-
tions that may be done in some patients include
serum autoantibodies, serology for Hepatitis B and
C, and HIV, blood cultures and serum protein elec-
trophoresis (to exclude multiple myeloma --- see
Chapter 8). Acute renal failure should be treated
by reversing or removing identified problems, for
example restoring fluid volume after haemorrhage,
stopping nephrotoxic drugs, treating hypertension or
relieving obstructions to urine flow. Fluid balance
must be carefully monitored and urine volume,
serum urea and electrolytes measured, and the po-
tential need for dialysis considered. Patients with
severe hyperkalaemia --- a serum Kþ> 6.5mmol/L),
acidosis, rising urea levels or pulmonary oedema will
require dialysis. This can be haemodialysis, haemo-
filtration or via peritoneal dialysis. However, most
patients will not require dialysis and will recover from
acute renal failure in 2---3 weeks.
Chronic renal failure is mainly caused by glomeru-
lonephritis, chronic pyelonephritis and diabetes melli-
tus in Europe, but renal vascular disease, polycystic
kidneys, genetic disease, drugs, amyloidosis and sys-
temic lupus erythematosus may also be responsible.
The symptoms, signs and investigation are similar to
those for acute renal failure, though in chronic renal
failure there is polyuria and nocturia as the kidney
ceases being able to concentrate urine, and anaemia is
a particular feature. Impaired ability of the kidney to
produce the active form of vitamin D causes a variety
of bone diseases such as osteomalacia and osteopo-
rosis (see Section 2.6.5), and heart disease is common
due to hypertension, abnormal lipid metabolism and
vascular calcification in the presence of chronic renal
failure. As with acute renal failure, the underlying
cause should be addressed, and a low protein diet and
good blood pressure control instigated. Recombinant
human erythropoietin can be given for anaemia, and
oral sodium bicarbonate used to treat acidosis. How-
ever, most patients with chronic renal failure will
continue to lose renal function and ultimately will
require dialysis.
2.7.7.1 Dialysis and transplantationfor renal failure
The toxins normally excreted by a healthy kidney can
be removed from the blood by passing it along semi-
permeable membrane with dialysis fluid on the other
side of the membrane: the principles of osmosis cause
urea, creatinine and other waste products to move out
of the blood and into the dialysis fluid along the
62 Biomedical sciences

gradient from high to low concentration, thus remov-
ing them from blood. Dialysis can be achieved via the
process of haemodialysis, in which a patient’s blood is
extracted from an arm, and dialysis of the blood within
a haemodialysis machine, with the dialysed blood
returned to the patient’s body. This usually takes
4---5 h, three times a week for adult patients, and
requires the creation of an arteriovenous fistula
(a surgically created connection between an artery and
a vein) in the arm. However, chronic ambulatory
peritoneal dialysis has now been developed, in which
patients infuse dialysis fluid into their own peritoneal
cavity --- which has a rich, superficial vascular network
--- and toxins diffuse out of the bloodstream and into
the fluid, which is then drained away from the perito-
neal cavity. This can often be done overnight as the
patient sleeps, but requires the surgical insertion of a
permanent catheter into the peritoneal cavity
(Figure 2.22). Although peritoneal dialysis allows pa-
tients considerably more freedom, potentially fatal
infection of the peritoneal cavity is an ever-present
danger. Amyloidosis (see Chapter 4) is also a possible
complication of renal dialysis, as the amyloid protein is
not removed by dialysis membranes.
Renal transplantation offers the only hope of a cure
from complete renal failure and survival of a trans-
planted kidney can be as high as 80% at 10 years
posttransplant, though many patients will require
further renal transplantation once the initial trans-
planted kidney fails. Healthy kidneys from organ
donors --- living relatives in many cases, or organs
donated from the victims of serious accidents --- are
Figure 2.22 Haemodialysis (top) and peritoneal dialysis (bottom) for renal failure
Chapter 2 Pathophysiology 63

used; the donors must be ABO compatible and a good
HLA match with the recipient. Long-term treatment
with immunosuppressive drugs such as cyclosporin is
used to improve the survival of the transplanted organ,
and reduce the chances of rejection.
2.7.8 Tumours of kidneyand bladder
2.7.8.1 Renal cell carcinoma
The commonest tumour of the kidney in adults is renal
cell carcinoma, which arises from the epithelium of the
renal tubule (Figure 2.23). It occurs in males twice as
frequentlyas infemales.Mostpresent inpatients intheir
40s, with haematuria, pain in the loin area, sometimes a
palpable mass, and may cause weight loss, fever and
polycythaemia. Renal cell carcinomametastasizes early
to the lung, bone and liver. CT, MRI and ultrasound
scanning areuseful in confirming thediagnosis, and the
affected kidney is removed surgically (nephrectomy).
Prognosis is good if the tumour has not metastasized.
2.7.8.2 Urothelial tumours
Tumours can arise from the urothelium that lines any
part of the urinary tract, including the renal pelvis,
ureters, bladder and urethra, though the bladder is
most commonly affected. Most occur after the fourth
decade of life, and males are affected four times as
often as females. Industrial solvents, cigarette smok-
ing, chronic inflammation from infection and certain
drugs (e.g. phenacetin) are known to increase the risk
of urothelial tumours, which cause painless haema-
turia in most patients. Urine cytology is used to
demonstrate the presence of malignant cells, and
cystoscopy of the bladder will enable examination and
biopsy of suspicious lesions in the bladder. Urothelial
tumours should be surgically removed and chemo-
therapy and/or radiotherapy may be recommended
(Figure 2.24).
2.7.9 Diseases of the prostate gland
2.7.9.1 Benign prostatic hypertrophy
The prostate gland is found only in males, and benign
enlargement of the prostate due to hyperplasia is
extremely common in older men. This causes frequent
urination with dribbling following urination, and dif-
ficulty initiating the flow of urine, with nocturia in
many cases. A smooth, enlarged prostate gland can be
felt on rectal examination. Serum prostate specific
antigen (PSA) levels should be performed to rule out
prostate cancer, which has a very similar set of symp-
toms. Treatment with drugs can be tried initially:
a-reductase inhibitors prevent conversion of testoster-one to dihydrotestosterone and can decrease the size of
Figure 2.23 Renal cell carcinoma macroscopically (left)and histologically (right)
Figure 2.24 Urothelial bladder tumour histology
64 Biomedical sciences

the prostate gland, but many patients will require
surgical resection of the prostate gland.
2.7.9.2 Prostate cancer
The incidence of prostate cancer rises with increasing
age in men, and malignant changes are present in 80%
of males over 80; however, most of these foci of
prostate cancer will remain dormant. Presentation is
very similar to benign prostatic hypertrophy in terms
of difficulty and frequency of urination, but patients
with prostate cancer may present with metastases,
particularly to bone. A hard, irregular gland is felt on
rectal examination, and measurement of serum PSA
will reveal an increased level (and one that is rising, if
serial measurements are taken). Small tumours may be
managed with watching and waiting, while radical
removal of the prostate gland or radiotherapy may
be used in other patients. Metastases can be treated
with antiandrogen drugs (to remove the stimulus of
testosterone to the tumour) such as cypoterone ace-
tate, or synthetic luteinizing hormone analogues to
cause negative feedback to the pituitary gland along
this pathway.
2.8 Cardiovascular disease
2.8.1 Symptoms of cardiovasculardisease
Patients suffering from cardiovascular disease typical-
ly present with signs of the struggling system. Chest
pain may occur when the heart muscle, the myocar-
dium, is deprived of oxygen and nutrients due to
diseased coronary arteries in angina, myocardial in-
farction, or a lack of blood reaching the coronary
arteries in heart valve disease. In some cases chest pain
may be experienced due to inflammatory processes of
the pericardial membrane (e.g. following some viral
infections). Patients may experience palpitations
where there are abnormalities in the electrical con-
duction pathway of the heart or the heart’s rhythm,
which can in turn lead to fainting and periods of
unconsciousness. Some patients experience heart fail-
ure, where the heart can no longer fulfil the body’s
requirements for pumping blood; if the left side of the
heart is failing this causes a pooling of blood travelling
towards the left side of the heart, causing swelling
most noticeable in the ankles. If the right side of the
heart is failing, a backlog of blood in the lungs causes
pulmonary oedema there, with the excess fluid in the
lungs leading to shortness of breath and coughing.
Disorders of blood pressure, particularly hypertension
(high blood pressure), are common in the general
population but are often symptomless. In some cases
hypertension causes headaches, and later it may dam-
age other organs (e.g. the kidneys) and generate
symptoms subsequent to that.
2.8.2 Investigation ofcardiovascular disease
Taking a careful history from the patient with sus-
pected cardiovascular disease will often yield a good
idea of the diagnosis, as will a careful examination of
the cardiovascular system, including measurements of
pulse and blood pressure. A chest X-ray can give
important clues about the health of the cardiovascular
system, particularly in terms of the size of the heart and
in looking for signs of pulmonary oedema that might
indicate right-sided heart failure. Echocardiography
may be performed, where the heart is visualized in
motion using Doppler ultrasound --- this can be done
from the oesophagus (transoesophageal echocardiog-
raphy) to get close to the heart for the most detailed
information, and this is particularly useful when visu-
alizing heart valves and the septa between the chambers
of the heart (Figure 2.25).
Many patients will have an electrocardiogram
(known as the ECG in the UK, but EKG in several
other countries), which is a recording of the electrical
pathway of the heart made using leads across the front
of the chest, and from the upper and lower limbs
(Figure 2.26). These different electrical ‘perspectives’
on the heart allow the clinician to pinpoint which part
of the heart any such disorder is present in, and how
widespread it is.
Some patients will have ECG and blood pressure
recordingsmade while exercising to various degrees on
a treadmill (‘treadmill test’), particularly during the
investigation of angina, and following a myocardial
infarction. The heart may also be investigated by
visualizing the coronary arteries (Figure 2.27) using
a radio-opaque dye injected into the coronary arteries
via a catheter threaded through to the heart (usually
from a blood vessel in the groin).
Chapter 2 Pathophysiology 65

Blood tests in cardiovascular disease include full
blood count and urea and electrolytes as routine (these
may show risk factors for cardiac disease, such as
polycythaemia), serum cholesterol (since high choles-
terol levels are an independent risk factor for coronary
artery disease), and measurement of cardiac markers
such as troponin, creatine kinase and myoglobin
(see Section 2.8.7).
2.8.3 The cardiovascular systembefore and after birth
Before birth, the cardiovascular system is modified to
allow the uninflated lungs to be bypassed, and to enable
the acquisition of oxygen and nutrients from the
placenta, and the disposal of carbon dioxide and waste
products to the maternal circulation via the placenta.
The fetal circulation is illustrated in Figure 2.28.
Some blood in the fetal aorta travels into the iliac
arteries and then into the two umbilical arteries to the
placenta, where oxygen and nutrient supplies are
picked up. Blood then passes into the umbilical vein,
then into the ductus venosus or via the fetal liver to join
the inferior vena cava, and then travels to the right side
of the heart.
To enable bypass of the majority of the pulmonary
circulation to the uninflated lungs, there is an opening
between the right and left atria (the foramen ovale, or
‘oval hole’!) which allows the majority of blood enter-
ing the right atrium (which is oxygenated and rich in
nutrients during fetal life, having recently returned
from the placenta) to pass straight into the left atrium
and go via the left ventricle back off to the systemic
Figure 2.26 A normal 12-lead ECG recording
Figure 2.25 Echocardiography
66 Biomedical sciences

circulation. Blood that does pass into the right ventri-
cle and then the pulmonary artery can also be shunted
back into the systemic circulation through the ductus
arteriosis, which connects the pulmonary artery to
the aorta. In this way, most blood returning to the
right side of the heart is redirected into the left side
of the heart, or to the aorta, and is returned to the
systemic circulation without entering the pulmonary
circulation.
The fetal circulation normally undergoes conver-
sion to the postbirth circulatory system in theminutes,
hours and days after birth. Immediately after a baby is
born, the umbilical vessels are shut off as the umbilical
cord is clamped and cut, and as the baby takes its first
breath its lungs are inflated. Inflation of the lungs
causes a fall in resistance in the pulmonary circulation,
and blood flow into the pulmonary arteries is increased
by the ‘sucking effect’ within the chest from air being
drawn into the lungs, with more blood travelling
through this pathway to reach the left atrium from
the pulmonary veins. The increased pressure in the left
atrium and decreased pressure in the right atrium
causes the foramen ovale --- a structure rather like an
open door between the two atria --- to flap shut at this
point, separating the systemic and pulmonary circula-
tions. The ductus arteriosus between the pulmonary
artery and aorta also closes off within 1---2 days of birth
after the rise in pO2 at birth causes the muscle layer in
its wall to contract. The umbilical vessels are obviously
no longer functional once the umbilical cord is cut, and
these degenerate.
2.8.4 Common development defectsof CV system
Congenital heart disease is relatively common, with
around one in 200 babies born with some form of
developmental defect in their cardiovascular system.
Congenital heart disease is known to be commoner in
babies born to women with diabetes, in babies with
Down syndrome, where the pregnancy was affected by
rubella infection during early gestation, and with
maternal alcohol abuse during pregnancy.
2.8.4.1 Ventricular septal defect
The most common congenital defect is ventricular
septal defect (VSD) where the septum between the
left and right ventricles is not successfully formed
between the fourth and eighth weeks of gestation,
causing mixing of the pulmonary and systemic
circulations after birth (Figure 2.29). VSD may be
asymptomatic if the hole is small, but larger defects
put extra strain on the heart as it needs to pump
additional blood around the body to compensate
Figure 2.27 Coronary angiography --- the coronary arteriesare visualized on X-ray after injection of radio-opaque dye
Figure 2.28 The fetal circulation
Chapter 2 Pathophysiology 67

for the lowered oxygen levels in the mixed blood,
and an increased respiratory effort in oxygenating a
greater volume of blood. VSD may be one of the
features of other forms of congenital heart disease
such as the Tetralogy of Fallot.
A heart murmur will usually be heard with VSD,
and a chest X-ray will often show an enlarged heart,
while echocardiography will identify the VSD and
define its extent. If a VSD is small no treatment may
be required, but larger defects may require drugs to
lower blood volume and pressure, or surgical repair
for the largest defects. In some cases this can now be
done without open heart surgery using minimally
invasive techniques. Patients with VSD are at risk of
bacterial infection of the heart defect (subacute bac-
terial endocarditis --- see Section 2.8.8) and require
antibiotic cover for a range of medical procedures.
2.8.4.2 Atrial septal defect
Atrial septal defect (ASD) is also a common congenital
heart defect caused by failure of the closure of the
foramen ovale between the right and left atria of
the heart (Figure 2.30). Like VSD, this results in the
inefficient mixing of oxygenated and deoxygenated
blood from the pulmonary and systemic circulations,
with symptoms dependant on the size of the defect. It
can be undiagnosed throughout a person’s life if small
enough. Larger ASDs cause shortness of breath on
exertion, fatigue and recurrent respiratory infections,
and in later life may lead to arrhythmias and hyper-
tension in the pulmonary circulation.
Surgical closure of ASD is generally recommended
in patients with clinical symptoms and signs, and can
often be performed by minimally invasive techniques
in which a catheter is threaded through to the heart
from a large vein, and a patch that unfolds from the
catheter like an umbrella used to seal the ASD. Like
VSD, ASD is a risk factor for subacute bacterial endo-
carditis (see Section 2.8.8).
2.8.4.3 Patent ductus arteriosus
The ductus arteriosus is the normal fetal connection
between the pulmonary artery and the aorta, but when
it fails to close after birth it is known as a patent (open)
ductus arteriosus (PDA). After birth, the systemic
circulation is under higher pressure than the pulmo-
nary circulation, and blood will pass from the aorta
into the pulmonary artery along a PDA, causing the
hypertension in the pulmonary circulation (which is
only designed to withstand low pressure blood flow).
PDA is commoner in premature babies, and in babies
born at high altitudes. It may be symptomless, or cause
feeding problems, failure to thrive, and respiratory
distress, and even heart failure in some cases. A rapid
heart rate and respiratory rate will be seen on exami-
nation, and a flowmurmur heard when listening to the
heart. A chest X-ray may show enlarged pulmonary
arteries and heart, while echocardiography will con-
firm the diagnosis. Initial treatment is often to give
antiprostaglandin drugs such as indometacin, as it
known that the prostaglandin E2 keeps the ductus
Figure 2.29 Ventricular septal defect
Figure 2.30 Atrial septal defect
68 Biomedical sciences

arteriosus open during fetal life and this may close a
PDA. However, many cases will require surgical clo-
sure of the PDA, often by implanting a coil in the vessel
via a cardiac catheter. PDA, like ASD and VSD, is also a
risk factor for subacute bacterial endocarditis.
2.8.5 Arrhythmias
Any abnormality in the rhythm of the heart is known as
an arrhythmia. Arrhythmias can be simply divided into
bradycardia and tachycardia.
2.8.5.1 Bradycardia
Bradycardia, is an abnormality in which the heart rate
is slow: <60 beats/min. Sinus bradycardia occurs nor-
mally during sleep and in athletes, but can also be
caused by hypothyroidism, hypothermia, beta blocker
drugs and increased pressure inside the skull. Brady-
cardia may also be seen where the sinoatrial node
becomes fibrosed and cannot conduct electrical im-
pulses effectively, or where there is damage to the
atrioventricular pathway of electrical conductance
(usually caused by ischaemic heart disease). Bradycar-
dia may require a pacemaker to be installed in the
chest --- this is a small device, about the size of a pack of
cards, which has electrodes that will detect pauses in
electrical signals in the heart’s conductance pathway
and deliver their own jolt of electricity to stimulate the
ventricles to contract (Figure 2.31).
2.8.5.2 Tachycardia
Tachycardia, is an abnormality in which the heart rate
is fast:>100 beats/min. Tachycardia can be subdivided
into supraventricular tachycardia (arising in the atria,
or at the atrioventricular junction) and ventricular
tachycardia (arising within the ventricles). Tachycar-
dias are usually caused by the presence of damaged cells
in the atria and ventricles which trigger extra heart
beats, or by abnormal electrical pathways in the heart.
Atrial fibrillation is the most frequent form of supra-
ventricular tachycardia (Figure 2.32), occurring in
around 10% of people over the age of 65, and causes
chaotic, unsynchronized and ineffective atrial contrac-
tions (rather like a ‘bag of worms’!). This can cause
blood to pool in the atria and leads to a risk of a
thrombus --- a pathological clot --- forming, with
consequent risk of a section of this (an embolus)
breaking off and travelling to the brain to trigger a
stroke. People with known atrial fibrillation are thus
usually on the anticoagulant drug warfarin.
Arrhythmias may cause dizziness, the sensation of
palpitations in the chest, no symptoms at all, or rarely,
suddendeath.AnECGmay fail to show an intermittent
arrhythmia, and many patients will have a 24 h ambu-
latory ECG recording made (in which they spend a day
withECG leads attached, andwear amonitor in abag to
collect the data) and analysed to look for arrhythmias
over that period of time. Others may be issued with
event recorders, a portable devicewhich the patient can
activate when they feel an arrhythmia occurring.
2.8.6 Heart failure
Heart failure is said to occur when the heart can no
longer meet the body’s requirements for sufficient
cardiac output. It affects around one in 100 people
over the age of 65. Causes of heart failure may lie
within the heart itself (e.g. congenital malformations,Figure 2.31 A cardiac pacemaker as seen on a chest X-ray
Figure 2.32 The ECG in atrial fibrillation --- no clear P wavesare seen, just oscillations in the baseline of the trace
Chapter 2 Pathophysiology 69

ischaemic heart disease, heart valve disease, arrhyth-
mias) or may be due to conditions such as severe
anaemia or thyrotoxicosis. The failing heart will ini-
tially generate compensatory mechanisms: the sympa-
thetic nervous systemwill increase heart rate and blood
pressure, and the renin---angiotensin system will also
increase fluid retention. However, progression of heart
failure will eventually overwhelm these systems. Heart
failure is conventionally described as predominantly
‘right-sided’ or ‘left-sided’, but in practice it is uncom-
mon for just one side of the heart to fail. Heart failure
usually develops slowly, but in some cases can develop
suddenly over minutes or hours.
2.8.6.1 Right-sided heart failure
Right-sided heart failure usually follows on from left-
sided heart failure. The right side of the heart is unable
to pump blood effectively, and thus blood travelling to
the right side of the heart begins to pool in the
extremities (i.e. the ankles in people who are mobile,
or around the sacrum in the immobile), with an
enlarged liver in many.
2.8.6.2 Left-sided heart failure
Most left-sided heart disease is due to ischaemic heart
disease caused by atherosclerosis of the coronary ar-
teries. The left side of the heart is unable to push blood
through effectively, causing pulmonary congestion
with resultant fatigue, shortness of breath, and an
increased heart rate. A chest X-ray will show enlarge-
ment of the heart and signs of oedema in the lungs, and
an ECGmay show signs of ischaemia and arrhythmias.
An echocardiogram will enable assessment of how
effective ventricular function is, and show any pro-
blems with heart valves. A full blood count, urea and
electrolytes and thyroid function tests are usually done
and other tests such as coronary angiography or ra-
dionuclide scans of the ventricles may be used.
Heart failure is treated initially by using diuretic
drugs (e.g. furosemide) to lose some of the blood
volume and thus relieve pressure on the ventricles and
decrease pulmonary and systemic congestion. Vasodi-
lator drugs (e.g. ACE inhibitors such as enalopril) can
also reduce constriction of blood vessels and help
redistribute fluid. If patients have underlying pro-
blems, such as arrhythmias, these should also be
treated, for example using digoxin in atrial fibrillation,
or surgery on diseased heart valves.
2.8.7 Ischaemic heart disease
Ischaemic heart disease is the result of atherosclerosis
of the coronary arteries, which reduces the amount of
oxygen and nutrients reaching the highlymetabolically
active myocardial cells. It affects more males than
females, and may have a strong family history. Risk
factors include hyperlipidaemia, smoking, obesity,
hypertension and diabetes mellitus.
2.8.7.1 Angina
Angina is the term used for chest pain that is caused by
myocardial ischaemia --- the myocardial cells are still
alive and there is thus no infarction. It is described as a
‘crushing’ pain in the centre of the chest, made worse
by exercise and relieved by rest. It often radiates to the
left arm and the neck. An ECG usually shows depres-
sion of the ST segment, though it is normal in most
people inbetween episodes of angina. An exercise ECG
on a treadmill may be useful to confirm angina if the
diagnosis is in doubt, since symptoms are easily con-
fused with those of gastric problems such as dyspepsia
and reflux. Coronary angiography may also be useful.
Measurement of cardiac markers for MI should be
negative.
Angina is treated by treating underlying causes (e.g.
improving the management of diabetes, stopping
smoking, losing weight etc.) initially. Angina attacks
are treated using sprays or tablets of the powerful
vasodilator glyceryl trinitrate (GTN). In frequent at-
tacks, longer acting nitrate drugs such as isosorbide
mononitrate may be added, possibly with a beta-
blocker (e.g. atenolol) and a calcium channel antago-
nist such as nifedipine. Aspirin is usually given daily to
reduce the risk of myocardial infarction, with a statin
drug to lower blood cholesterol levels.
2.8.7.2 Myocardial infarction
Myocardial infarction (MI) --- or a heart attack - is the
commonest cause of death in the western world, and is
almost invariably due to a thrombus forming around a
burst atherosclerotic plaque in a coronary artery,
totally blocking the vessel and cutting off the supply
of oxygen and nutrients to the cardiac muscle that it
supplies. It results in severe crushing central chest pain
(often radiating to the left arm and neck, though in
women symptoms are often less ‘classical’ of a heart
attack) that lasts for hours, and the patient is often grey,
70 Biomedical sciences

sweating and nauseous with it. Some patients have no
pain (‘silent’MI). The diagnosis ismade on the basis of
the description of symptoms, and an ECG will show
elevation of the ST segment in the leads from the area of
the heart where infarction has occurred (Figure 2.33).
Various cardiac markers can be measured to show
the leakage of cellular contents from dying myocardial
cells, and these can help to distinguish between angina,
MI and noncardiac chest pain, particularly when mea-
sured serially over hours and days (Figure 2.34). Full
blood count, urea and electrolytes, serum cholesterol
and blood glucose are also measured to look for
reversible risk factors for myocardial infarction.
Cardiac markers for myocardial infarctionTroponin
The amino acid sequences of Troponin I and Troponin
T are unique in cardiacmuscle (TroponinC is identical
in cardiac and skeletal muscle), so these are assayed
when damage to the myocardium is suspected; the
death of myocardial cells will allow some of their
cellular contents to leak into serum, where they can
be measured. In the hours after myocardial infarction,
levels of troponin rise well about the 99th percentile
and peak around 2 days postinfarction before slowly
falling.
Creatine kinase
Creatine kinase (CK) consists of two subunits, M and
B, in various combinations in different tissues: CK---BB
is found in nonmuscle tissue, CK---MMpredominantly
in skeletal muscle, while CK---MB is specific to cardiac
muscle, so this may also be assayed where cardiac
damage is suspected. Levels of CK---MB begin to rise
3---6 h after myocardial infarction and peak around
12---24 h. Peak levels of CK---MB roughly correlate with
the size of the infarction; however, small infarcts can be
missed.
Myoglobin
Myoglobin levels rise rapidly after myocardial infarc-
tion, and are a sensitive indicator of MI. However,
myoglobin is found in many tissues of the body, so
measurement of myoglobin is a nonspecific indicator
of muscle damage --- there is no form unique to cardiac
muscle.
Treatment of myocardial infarctionPain relief should be given immediately (e.g. with the
opiate analgesic drug diamorphine, and an antiemetic
drug to treat nausea such as metaclopramide), along
with a GTN spray to dilate coronary blood vessels
Figure 2.33 ECG showing ST segment elevation (arrowed) in myocardial infarction
Figure 2.34 Comparison of troponin, creatinine kinase andmyoglobin levels following myocardial infarction
Chapter 2 Pathophysiology 71

and aspirin for its antiplatelet action. Within the hour
the patient should ideally undergo a reperfusion of
the blocked coronary artery (e.g. by using coronary
angiography to identify the blocked coronary artery,
then inserting a small balloon to push the vessel open,
or placing a ‘stent’ to hold it open), or be treated with
a thrombolytic drug such as streptokinase or recom-
binant tissue plasminogen activator (rTPA) to break
down the thrombus in the coronary vessel. The
patient should be treated on a coronary care unit
(CCU) and kept on a cardiac monitor for several
days --- 75% of deaths from myocardial infarction
occur within the first 24 hours. During rehabilitation
on the ward, the patient should be encouraged to
mobilize, and started on long-term aspirin (which
helps prevent the formation of thrombi), a beta
blocker, an ACE inhibitor and a statin drug to lower
serum cholesterol levels, as large clinical trials have
shown that these measures reduce the chances of
subsequent myocardial infarction. An exercise ECG
may be done before the patient goes home, or as part
of follow-up care following hospital discharge, as well
as a coronary angiography if not done as part of the
initial treatment.
2.8.8 Valvular heart disease
Heart valves can be ineffective, allowing blood to flow
backwards (‘regurgitant’), or narrowed and difficult to
open (‘stenosed’), and both will give a heart murmur
that can be heard through a stethoscope. Many people
have innocent heart murmurs, particularly the young,
and pregnant women. If a heart murmur is heard and a
pathological heart valve problem suspected, echocar-
diography of the heart will identify which valve is
affected, and how severely. Defective heart valves may
require repair or replacement if causing serious symp-
toms. Heart valves for replacement are other artificial
(prosthetic) mechanical valves, or obtained from the
hearts of pigs (Figure 2.35). Damaged heart valves and
mechanical heart valves are at risk of bacterial infec-
tion, and people with mechanical heart valves need to
be on anticoagulant drugs (e.g. warfarin) to prevent a
pathological thrombus forming around them.
The most clinically important forms of valvular
heart disease are stenosis and regurgitation affecting
the mitral and aortic valves, that is the valves on the
high-pressure left side of the heart.
Mitral regurgitation usually occurs in people who
have had rheumatic fever (a now rare inflammatory
disease following infection with Group A Streptococci
--- this triggers an autoimmune reaction in some in-
dividuals, which attacks the heart), and results in a
mitral valve that cannot keep blood in the left ventricle
for ejection via the aortaduring systole.Aproportionof
blood is pushed back into the left atrium via the
regurgitant mitral valve; causing increased pressure
back along the blood vessels towards the lung with
resultant pulmonary oedema, shortness of breath on
exertion and tiredness. A heart murmur is heard be-
tween the first and second heart sounds (i.e. you would
hear ‘lub-swoosh-dub’ rather than the usual ‘lub-dub’
heart sounds). A chest X-ray may show pulmonary
oedema and an enlarged left atrium, and echocardiog-
raphy will confirm the diagnosis. Mild cases may be
treated with diuretics or ACE inhibitors to reduce the
workload of the heart, but more serious cases will
require surgical repair or replacement of the valve.
Mitral stenosis also usually occurs after rheumatic
fever, but results in a valve that will not open properly
to allow blood into the left ventricle, with a reduced
cardiac output. The left atrium becomes very dilated
trying to push blood through the valve, and this can
cause atrial fibrillation (sometimes with a thrombus
forming in the atrium in addition, with the resultant
Figure 2.35 Mechanical heart valve (left); pig heart valve (right)
72 Biomedical sciences

risk of stroke from emboli breaking off it and travelling
to the brain). People with mitral stenosis can become
very short of breath on exertion, often with a cough
from the backlog of blood in the lungs, and a blue-
tinged colour (cyanosis) in the face. A heart murmur
can be heard. Heart failure may result in severe mitral
stenosis. A chest X-ray will show a large heart and signs
of pulmonary oedema, and an echocardiogram will
identify the stenosis of the valve. An ECG may show
atrial fibrillation. Treatment is initially with diuretics
for heart failure, and digoxin and an anticoagulant for
any atrial fibrillation. The valve may require surgical
repair or replacement.
2.8.8.1 Aortic regurgitation
Aortic regurgitation is also generally caused by rheu-
matic fever, or by infective endocarditis (see Section
2.8.8). It results in blood falling back into the left
ventricle from the aorta, with ventricular enlargement
and ultimately left-sided heart failure. Patients will
have shortness of breath on exertion and fatigue, and
a murmur can be heard early in diastole. A chest X-ray
will show a large heart, and echocardiography with
Doppler (which shows movement of blood) will show
the regurgitant aortic valve. Mild cases may be treated
with diuretic drugs, but inmost cases, surgical repair or
replacement of the valve will be required.
2.8.8.2 Aortic stenosis
Aortic stenosis can be due to rheumatic fever, but also
from calcification of the valve (which may be congeni-
tally abnormal). It causes obstruction to the left ven-
tricle emptying into the aorta, which causes some
ischaemia of the myocardium as the coronary arteries
come off the first part of the aorta to supply the heart
muscle. Angina, fainting on exertion and shortness of
breath on exertion result, and a ventricular arrhythmia
may develop and lead to sudden death. There is a
murmur heard in systole. Echocardiography should be
diagnostic. The treatment is with replacement of the
aortic valve.
2.8.8.3 Infective endocarditis
Infective endocarditis is an infection of the endocar-
dium (lining cell layer) of the heart, and is usually a
chronic process often also known as subacute bacte-
rial endocarditis (SBE). It can occur on normal
valves, but congenitally abnormal and prosthetic
valves have a greater chance of developing infective
endocarditis. Most cases are caused by infection with
Streptococcus viridans, though other bacteria and
fungi may be responsible. A vegetative mass of bac-
teria, platelets and fibrin forms along the edge of the
valve and destroy it, producing regurgitation and
heart failure. The patient with SBE will have a fever,
changing heart murmur and may have abscesses
elsewhere in the body where the vegetations embolize.
Immune complexes form and can cause joint pain
and inflammation of kidneys and blood vessels. A
raised ESR will be seen on blood tests. Multiple sets of
blood cultures must be taken (e.g. six sets over 24 h)
to identify the infecting organism, and echocardiog-
raphy will show the vegetation on a valve. Aggressive
treatment with intravenous antibiotics is given ini-
tially, with a long course of oral antibiotics thereafter.
If there is severe heart failure, the valve may need to
be replaced.
Patients with congenital valve disease and prosthet-
ic valves should always be given antibiotic prophylaxis
when undergoing a procedure that could introduce
bacteria into the bloodstream to protect them from
infective endocarditis.
2.8.9 Hypertension
Hypertension is the condition of having chronically
elevated blood pressure in the arteries of the systemic
circulation, though levels of acceptable blood pressure
do vary according to age, gender and ethnicity. Blood
pressure readings of >140mmHg systolic or >90
mmHg diastolic may conventionally be regarded as
hypertensive if present on repeated readings. Hyper-
tension is a risk factor for stroke, heart failure, myo-
cardial infarction, kidney failure and aneurysms of
arteries, and is thus highly undesirable to have and
requires intervention. Around 95% of cases of hyper-
tension are primary or essential hypertension in which
no underlying cause can be identified for the rise in
blood pressure, though an associationwith obesity and
a sedentary lifestyle is well established. Some 5% of
cases of hypertension are secondary to other condi-
tions, such as hyperthyroidism, Cushing’s syndrome,
kidney disease, pregnancy and tumours of the adrenal
glands.
Hypertension is usually symptomless, though very
rapid increases in blood pressure can trigger visual
Chapter 2 Pathophysiology 73

problems, vomiting, fits, headaches and even heart
failure. On examining most people with hypertension,
only increased blood pressure is evident, though some
may show changes in the retinal blood vessels on
visualizing the back of the eye. A chest X-ray may
show signs on heart failure, and measurement of urea
and electrolytes in blood may show signs of renal
impairment. An ECG may show signs of enlargement
of the left side of the heart as it copes with pumping
against high pressure. Urinalysis should also be per-
formed to look for signs of renal disease; that is,
proteinuria and haematuria. A range of investigations
should be performed to look for possible causes of
secondary hypertension (e.g. thyroid function tests),
though the great majority of cases will be primary
(essential) hypertension.
Hypertension is treated according to its severity.
Lifestylemeasures such asweight loss, reducing alcohol
consumption, increasing exercise and cuttingdown the
salt content of food can cure hypertension in some
patients, while others will require treatment with anti-
hypertensivedrugs.Themaingroupsusedareas follows
Diuretics Diuretic drugs increase the loss of water
and decrease its reabsorption in the renal tubules,
thus lowering blood volume and decreasing blood
pressure. A common side effect is hypokalaemia
(low Kþ levels). Examples include furosemide and
bendrofluazide.
Beta blockers This group of drugs blocks adrenergic
beta receptors of the sympathetic system in the
heart, causing the heart to slow and stop pumping
as hard. However, they will also block beta receptors
in the lungs to an extent, which can cause bronch-
oconstriction --- beta blockers must thus not be
used in patients with asthma. Common side effects
include fatigue, weakness and a slow heart rate.
Examples of beta blockers include propranolol,
atenolol and metaprolol.
Angiotensin converting enzyme (ACE) inhibitors
This group of drugs blocks the renin---angiotensin
pathway by preventing conversion of angiotensin I
into angiotensin II by inhibiting angiotensin con-
verting enzyme (ACE), thus preventing the forma-
tion of the powerful vasoconstrictor angiotensin II
and preventing a rise in blood pressure (see also
Section 2.3.3 for a revision of the renin---angiotensin
system and blood pressure). Common side effects of
ACE inhibitors are a dry cough, rashes and hypo-
tension after the first dose. Examples of ACE in-
hibitors include captopril, enalopril and lisinopril.
Calcium channel blockers This group of drugs acts by
blocking calcium channels in the muscular wall of
peripheral arterioles, leading to their dilatation and
thus lowering blood pressure. Common side effects
include headaches and a slow heart rate. Examples of
calciumchannelblockersareverapamilanddiltiazem.
2.8.10 Arterial and venous disease
2.8.10.1 Aneurysms
Aneurysms are abnormal dilatations of blood vessels, and
are often formed in the area of atherosclerotic plaques
where the vessel wall has been damaged. The aorta is the
commonest site of aneurysms, and these are most com-
monly seen in the abdominal aorta and the thoracic aorta
(Figure 2.36).
Aneurysms are usually asymptomatic unless they
rupture or ‘dissect’ (where a tear occurs in the inner
lining of the vessel, and blood tracks down the media
layer under high pressure to create a false lumen).
Dissection or rupture of an aortic aneurysm typically
results in severe chest or back pain, and a CT scan will
identify the aneurysm. Patients need to undergo emer-
gency surgery to place a graft into the ruptured vessel.
Berry aneurysmsBerry aneurysms are small congenital defects in vessels
of the brain, which can rupture and cause a stroke or
subarachnoid haemorrhage, with resulting severe
headache. A CT scan or angiography can be used to
diagnose this, and treatment involves clipping off the
vessel or occluding it with a small coil.
2.8.10.2 Deep vein thrombosis
The deep veins of the pelvis and leg are the most
common sites of thrombus (pathological clot) forma-
tion, though it can occur in any vein. Risk factors for
deep vein thrombosis (DVT) include immobility, sur-
gery, pregnancy, the oral contraceptive pill, obesity and
cancer. People with a DVT often have no symptoms,
but may notice a swollen calf with redness and warmth
--- measurements are taken around both calves with a
tape measure, and compared (Figure 2.37).
The diagnosis is made by scanning the veins of the
leg with a Doppler ultrasound scan, which looks for
movement of blood in the vessel. Patients with diag-
nosed or suspected DVT are started on anticoagulants
as there is a risk of pulmonary embolus (see below);
74 Biomedical sciences

heparin and warfarin are started together, and heparin
starts to work immediately while warfarin takes several
days to achieve its anticoagulation effect. Blood clot-
ting will be measured on a daily basis to tailor doses of
heparin and warfarin, and once warfarin has achieved
sufficient anticoagulation (i.e. INR in the range
2.0---3.0), heparin is stopped. In cases of massive DVT,
drugs to dissolve the thrombus may be required (e.g.
streptokinase).
2.8.10.3 Pulmonary embolism
Pulmonary embolism (PE) is usually seen following
the formation of a deep vein thrombosis where a part
breaks off and travels back to the heart and then onto
the lungs, though it can sometimes occur where a
thrombus has formed in the right atrium from atrial
fibrillation. The presence of an embolus in the lung
means that a section is being ventilated but not per-
fused with blood, which has an adverse effect on gas
exchange. A small PE causes shortness of breath, and
may also cause chest pain; a very large PE produces
severe chest pain, a rapid respiratory and heart rate and
shock. A chest X-ray is often normal, and an ECG
usually only shows a rapid heart rate. Arterial blood
gases may show lowered oxygen levels and CO2 levels,
Figure 2.36 Site of aortic aneurysms
Figure 2.37 The calf in deep vein thrombosis. Source:wikipedia.org/wiki/File:DVT2010.JPG� James Hellman, MD,2010
Chapter 2 Pathophysiology 75

or may be normal. Measurement of D-dimer levels
(which show the presence of fibrin, i.e. a thrombus) are
generally elevated. A specialized radionuclide scan
known as a ventilation-perfusion scan (V/Q scan) is
performed to diagnose PE: a radionuclide-labelled gas
is inhaled by the patient, and a gamma camera used to
produce an image of all the areas of the lung being
ventilated (‘V’ part of the scan). The patient is also
injected with an intravenous infusion of albumin
labelled with radioactive Technitium99 and the gamma
camera used to produce an image of all areas of the
lungs being perfused by blood (‘Q’ part of the scan).
The two images are then compared and an area of the
lung that is seen to be ventilated but not perfused gives
a high probability of PE (Figure 2.38). PE is treated
with anticoagulants in the samemanner as for DVT. In
cases of massive PE, drugs to break down the embolus
such as streptokinase may be used.
2.9 Respiratory disease
2.9.1 Symptoms and investigationof respiratory disease
Most patients with lung disease will present with some
combination of a cough, sputum production, wheez-
ing, shortness of breath (dyspnoea) or coughing up
blood (haemoptysis). Coughing is an extremely com-
mon symptom of respiratory tract infection, but also
occurs in a range of other conditions such as asthma ---
in which the cough is generally worse at night --- and in
chronic smokers, as well as in many people with lung
cancer. Dyspnoea is a sensation of shortness of breath,
which may be worse upon lying flat (orthopnoea).
Wheezing occurs when the flow of air into and out of
the trachea is constricted, and is typical of asthma and
some allergic reactions. Haemoptysis is a symptom to
be taken seriously and investigated thoroughly, since it
can signify serious pathology such as lung cancer,
tuberculosis and pulmonary infarction.
Investigation of respiratory symptoms, after a full
history has been taken from the patient and clinical
examination undertaken, often uses techniques such as
peak flowmeasurement and spirometry, as well as chest
X-ray. Peak flow meters record the maximum expira-
tory flow rate during a forced expiration in L/min,
which is compared to the expected range for the pa-
tient’s age, height and gender, and to an individual
patient’spreviousbest reading; it isparticularlyuseful in
assessing constriction of the airways in asthma (Fig-
ure 2.39). A spirometer can be used to measure total
lung capacity (TLC), respiratory volume (RV), forced
expiratory volume (FEV) and forced vital capacity
(FVC) --- the volume expired in the first second of FVC
measurement is known as FVC1, and the ratio of FEV:
FVC1 provides useful information indicating whether
patients have airflow limitation (FEV1:FVC< 75%) or
restrictive lung disease (FEV1:FVC> 75%).
2.9.2 Asthma
The number of people being diagnosed with asthma has
risen in recent years for reasons that are poorly under-
stood. It is a common disorder in many areas of the
world, and it is characterized by airway inflammation,
Figure 2.38 V/Q scan showing multiple mismatched areas in pulmonary embolism
76 Biomedical sciences

hyperresponsivity of the airways to a number of
stimuli, with reversible constriction of the airways.
Asthma is known to be related to the degree of ‘atopy’
of an individual, which is how readily people develop
IgE antibodies against common allergens in the envi-
ronment, such as the house dust mite and pollen.
People with asthma often have attacks triggered by
dust mites and pollen, but also by exercise, cold air,
respiratory tract infections, animal fur and drugs such
as b-block-ers or nonsteroidal antiinflammatory drugs.
Patients having an asthma attack experience wheezing,
cough-ing and shortness of breath, with reduced chest
expansion and audible expiratory wheeze, which are
thought to be caused by the release of inflammatory
mediators from T-cells, mast cells and lymphocytes
following antigen binding to IgE on the surface of mast
cells. Peak flow measurements will be reduced during
an asthma attack and a measurement of <50% of a
patient’s best peak flow measurement implies a serious
attack. Skin prick allergy testing can be used to identify
the allergens for a particular patient, which should
be avoided where possible, as should cigarette smoke
in all cases. Patients are issued with a peak flowmeter to
monitor their own condition, and managed in a step-
wise approach. Those with occasional symptoms can be
prescribed an inhaledb agonist drug such as salbutamol
to use as required to induce airway dilatation. For daily
symptoms, an inhaled corticosteroid such as flixotide
can be added to help prevent airway constriction, and
the dose of this can be increased as needed. If symptoms
are still not controlled, a long-acting b agonist drug
such as salmeterol may be used, with or without the
addition of oral steroids (Figure 2.40). In an acute
severe asthma attack, patients needing hospital admis-
sion will be treated with nebulized salbutamol given
along with high-dose O2 and hydrocortisone, and a
mast cell stabilizing drug such as ipratropium bromide
may be given in addition. Arterial blood gases will be
monitored and patients who are worsening despite all
measures may require admission to an intensive care
unit for ventilation.
2.9.3 Bronchitis and emphysema
Bronchitis is an inflammation of the airways that
causes coughing, retrosternal discomfort and some
wheezing. Acute bronchitis is short-lived and usually
Figure 2.39 Normal lung function values expected for men and women using a spirometer (left); a peak flow meter (right)
Chapter 2 Pathophysiology 77

due to a viral infection, while chronic bronchitis is a
cough productive of sputum onmost days over at least
threemonths of the year, formore than one year, and is
usually associated with cigarette smoking. Chronic
bronchitis is in some ways a distinct entity from
emphysema; emphysema causes dilatation and de-
struction of lung tissue in the alveoli leading to a loss
of surface area for effective gas exchange. In practice,
most patients with chronic bronchitis also have em-
physema and together the two conditions form the
spectrum of chronic obstructive pulmonary disease
(COPD). Cigarette smoking is the major cause, with
pollution playing a small role in somepatients. Patients
with COPD will have a chronic cough productive
of sputum, with wheezing and shortness of breath.
Frequent chest infections with organisms such as
Haemophilus influenzae and Streptococcus pneumoniae
regularly exacerbate their condition. Lung function
testing will show a reduced FEV1: FVC ratio, and a
chest X-ray may be normal or show hyperinflation. A
full blood countmay reveal a secondary polycythaemia
(increased haemoglobin level to compensate for hyp-
oxia) and an arterial blood gas measurement may be
normal, or reveal hypoxia and hypercapnia (a raised
pCO2).Management comprises advising the patient to
stop smoking, and uses similar drugs to asthma, that is
b agonist bronchodilators such as salbutamol, inhaled
or oral steroid drugs and continuous oxygen therapy
for the worst affected.
2.9.4 Cystic fibrosis
Cystic fibrosis (CF) is a genetic disorder inherited in an
autosomal recessive fashion, so sufferers need to
inherit two copies of the defective gene, usually from
two healthy carrier parents. The gene for CF codes for
the cystic fibrosis transmembrane conduction regula-
tor (CFTR) protein, leading to decreased excretion of
chloride into the lumen of the airways, along with
increased sodium and water reabsorption from the
airways; this leads to very thick secretions in the air-
ways, in turn causing dilatation of the bronchi and
impaired gas exchange. One in 16 people are carriers in
the Caucasian populations, and the high frequency of
CF carrier status is believed to be because carrier status
conferred a degree of protection against infection with
cholera. The gene for CF is very large and particularly
prone to new mutations.
CF causes recurrent chest infections, and is often
identified in infants with ‘failure to thrive’ who do not
gain weight and feed well, or in infants with small
intestinal obstruction due to the presence of very thick
meconium (‘meconium ileus’). The presence of thick
secretions also blocks ducts in the pancreas, and inad-
equate secretion of pancreatic digestive enzymes causes
malnutrition, and diabetes mellitus may result from
pancreatic damage. Males with CF are infertile as the
vas deferens fails to develop properly.
Treatment of CF is with daily, vigorous lung phys-
iotherapy to enable thickmucus to be expelled, inhaled
bronchodilator drugs and corticosteroids, dietary sup-
plementation of pancreatic enzymes and additional
nutrients, and with antibiotics for chest infections.
Some patients with CF receive heart and lung trans-
plants. Ultimately it is hoped that gene therapy for CF
will be possible, with the gene for the normal CFTR
protein delivered directly to the airways using a viral
vector, and initial research has shown some promise.
2.9.5 Pneumonia
Pneumonia is usually caused by bacterial infection
triggering an inflammatory process in the lung tissue;
Figure 2.40 A salmeterol inhaler, used for patients withasthma
78 Biomedical sciences

common organisms responsible for pneumonia ac-
quired in the community include Streptococcus
pneumoniae and Mycoplasma species. In people with
preexisting lung disease, Haemophilus influenzae is a
common cause of pneumonia and Chlamydia psittaci
can cause pneumonia in people who keep birds. Pneu-
monia contracted in hospital is often due to infection
with Klebsiella and Pseudomonas species. In immuno-
suppressed individuals (e.g. HIV positive patients),
infection with Pneumocystis carinii, Cytomegalovirus
and Aspergillus species can cause pneumonia.
Pneumonia usually causes a cough, fever and pleu-
ritic chest pain. A full blood count will often show a
raised white cell count, and sputum culture should be
performed to identify the infecting organism. A chest
X-ray will show consolidation, which is areas of a lung
that appear denser than normal (due to accumulation
of inflammatory exudates in pneumonia). Treatment
is with appropriate antibiotics for the specific patient-
depending on how sick they are and the setting in
which they acquired pneumonia. Most people with
pneumonia can be managed at home with oral anti-
biotics, but some will require hospital admission and
intravenous antibiotics.
2.9.6 Tuberculosis
Tuberculosis (TB) is caused by primary infection with
the bacteriumMycobacterium tuberculosis, which usu-
ally occurs in the lung following droplet transmission
from another actively infected patient. The lung
infection most often occurs in the mid and upper
zones of the lung, with an inflammatory exudates of
neutrophils appearing; the characteristic caseating
granulomas would be seen on histology of a lung
biopsy (see also Chapter 4), and in the regional lymph
nodes. However, most people recover completely,
with just calcified lymph nodes remaining to indicate
the TB infection, and this primary infection is often
symptomless. Reactivation of TB can occur after
several weeks, with symptoms of fatigue, weight loss,
fever and coughing. The cough may be productive of
sputum, which can be blood-stained; staining of the
sputum with the Ziehl---Neelsen stain will reveal
mycobacteria, but a bronchoscopy can be performed
to acquire washings of affected lobes for staining if no
sputum is otherwise available. A chest X-ray will often
show round shadows in the upper lobes of the lungs.
Sometimes it may be necessary to biopsy lung tissue
and/or lymph nodes to make a definitive diagnosis
of TB.
TB is treated with a regime of several antibiotics:
isoniazid and rifampicin for 6 months, with pyrizina-
mide and ethambutol too for the first 2 months of
treatment. All can cause a range of side effects, of which
hepatitis is common to rifampicin, isoniazid and pyr-
azinamide. Rifampicin is a liver enzyme inducer that
accelerates metabolism of several other drugs (includ-
ing warfarin and the oral contraceptive pill), and stains
tears and urine pink. Isoniazid can cause a polyneuro-
pathy and allergic reactions, while pyrazinamide can
trigger gout and arthralgia. Ethambutol can trigger
inflammation of the optic nerve and visual problems.
Patients who are found to have multidrugresistant
TB (which is occurring with increasing frequency
worldwide) will need specialist tailored regimes to
eradicate their TB infection and are cared for in a
negative-pressure room to minimize the potential for
infecting others with a more dangerous form of TB.
Close contacts of an individual found to be infected
with TB should be screened for infection too using the
Mantoux skin test, and treated if found to be infected.
A degree of protection from infection with TB is
provided by the Bacille Calmette-Gu�erin (BCG) vac-
cination, which is currently on offer to groups at risk of
TB infection in the UK.
2.9.7 Pneumoconiosis
Pneumoconiosis is a term given to lung disease caused
by the inhalation of fine inorganic dust particles that
trigger inflammation and fibrosis. Coal dust, asbestos,
silica and beryllium are the more common triggers of
pneumoconioses, andmost forms of this condition are
industrial diseases resulting from exposure to these
materials in the course of employment. Exposure to
coal dust can lead to coal workers’ pneumoconiosis,
which initially produces small nodules in the lungs
(simple pneumoconiosis). However, this can lead on
to progressivemassive fibrosis of the lungs with further
exposure to coal dust, causing large fibrotic masses
with shortness of breath, coughing and the potential
for complete respiratory failure for which there is
currently no treatment.
Asbestos exposure can cause pneumoconiosis
after a long latent period (often of several decades),
with a spectrum of disease from asymptomatic pleural
plaques through to lung cancers. Mesothelioma is the
Chapter 2 Pathophysiology 79

tumour which is characteristic of asbestos exposure,
but adenocarcinoma of the lung can also be seen
(Figure 2.41).
2.9.8 Lung cancer
Lung cancer is the commonest malignant tumour in
Europe, and a leading cause of death after heart disease
and pneumonia. It occurs more frequently in males,
but the incidence in females continues to rise, reflected
in the fact that smoking is themost important factor in
the aetiology of lung cancer, and the proportion of
female smokers is growing. Passive smoking is also
associated with lung cancer, as is asbestos exposure.
Most lung cancer is squamous cell carcinoma, arising
from the squamous epithelial cells lining the bronchi,
followed by small cell carcinoma (arising from endo-
crine cells in the lung), then large cell carcinoma,
adenocarcinoma and alveolar cell carcinoma.
Patients with lung cancer usually develop a cough,
chest pain and shortness of breath, and may cough up
blood. Local spread of the tumour to the pleura and
ribs can cause further pain and rib fractures, while
metastasis can produce bone pain from bony metasta-
ses, or seizures frombrainmetastases. A chest X-ray is a
useful initial investigation, usually showing a round
shadow with fluffy edges, and a CT scan may give
further definition and look for evidence of metastatic
tumours. A bronchoscopy can be used to obtain
biopsies of suspicious lesions, or sputum examined
cytologically to look for malignant cells. Liver function
testing can be used to indicate the presence of liver
metastases, with liver ultrasonography if indicated.
Isotope scans of bone may be used to look for evidence
of bony metastases. Treatment is with surgical resec-
tion of a tumour if possible, and high-dose radiother-
apy where this is not possible in most cases. Small cell
lung carcinoma can be treated with chemotherapy.
2.10 Endocrine disease
The endocrine system comprises a number of organs
which communicate mainly via hormones, chemical
messengers which generally act by binding to receptors
at a site distant from their origin and triggering specific
intracellular reactions. Some hormones act onmany ---
if not most --- tissues of the body (e.g. thyroid
hormones), while others only target one tissue
(e.g. thyroid-stimulating hormone acts only on the
thyroid gland).
Figure 2.41 Asbestos bodies seen on lung biopsy (left) and mesothelioma (right)
80 Biomedical sciences

2.10.1 Symptoms and investigationof endocrine disease
Given the complexity of the endocrine system, the
symptoms and investigation of endocrine disease will
be considered for the individual organs as we move
through this section for the sake of clarity.
2.10.1.1 The hypothalamus and pituitary disease--- tumours, hypopituitarism
The hypothalamus produces several ‘releasing factor’
hormones, which travel to the pituitary gland via the
portal circulation in the connection between the hypo-
thalamus and pituitary gland. The posterior pituitary
gland stores antidiuretic hormone (ADH) and oxyto-
cin, which aremade in the hypothalamus and passed to
the posterior pituitary via an axon in the pituitary stalk.
Asdiscussed inChapter7,mosthormones are regulated
by some form of feedback system, in which the final
hormone product of a pathway has a negative feedback
affect on further secretion of the releasing factors and
stimulating hormones. Patients who have hormone-
secreting tumourswill not show this negative feedback,
leading to a number of endocrinological diseases.
2.10.2 Pituitary tumours
Most pituitary tumours are benign, but cause symp-
toms resulting from excess production of a specific
pituitary hormone, underproduction of pituitary hor-
mones or from local pressure effects of the tumour.
The pituitary gland is situated in a small, saddle-shaped
compartment in the skull known as the sella turcica
(Latin for ‘Turkish saddle’!) in which it has little room
to expand. The chiasm of the optic nerve sits just about
the pituitary gland, and if it becomes enlarged by a
tumour, pressure on the optic nerve at this crossover
point produces a specific pattern of visual field loss
known as bitemporal hemianopia, inwhich the outside
half of each visual field is lost. Headaches may also
occur, or hydrocephalus from interruption of the flow
of cerebrospinal fluid.
2.10.3 Hypopituitarism
A lack of pituitary hormones is known as hypopituita-
rism, and may affect a single hormone secreted by the
pituitary, or can affect several hormones together. It
may be caused by primary tumours of the pituitary
gland or by secondary metastatic tumours from else-
where in the body, it may result from infection (men-
ingitis, encephalitis or syphilis), problems with blood
supply to the pituitary gland, antibodies against pitui-
tary tissues, head injuries or brain surgery, damage
from radiotherapy or chemotherapy, infiltration in
sarcoidosis, or due to the congenital disorder
Kallmann’s syndrome (which causes selective deficien-
cy of gonadotrophin hormones). Where several hor-
mones are affected, LH and FSH production is usually
decreased first, with TSH and ACTH last.
The symptomsand signs of hypopituitarismdepend
on which hormones’ secretions are affected. Growth
hormone deficiency can cause few symptoms in adults,
though in children a lack of adequate growth will
become apparent. TSH or ACTH deficiency will cause
hypothyroidism or adrenal failure, with subsequent
tiredness, hypotension and associated symptoms. Go-
nadotrophin deficiency --- lack of FSH and LH --- will
lead to impotence or amenorrhoea with loss of libido.
Investigations will need to target each of the pituitary
pathways, with measurement of basal hormone levels
and stimulatory tests of the pituitary gland (detailed
in later sections). Treatment of hypopituitarism is
with replacement of missing hormones as required
(either by replacing the pituitary hormones them-
selves, e.g. with FSH or LH analogues if fertility is
required, or replacement of their target organ hor-
mone, e.g. thyroxine is replaced rather than TSH for
hypothyroidism).
2.10.4 Male hypogonadism
Male hypogonadism refers to the syndrome resulting
from androgen deficiency, meaning a lack of testo-
sterone, which is normally produced in the testicles in
response to LH from the pituitary gland. The symp-
toms and signs depend on when this occurs: if prior
to puberty, it causes increased height and a lack of
secondary sexual characteristics, with small penis and
testicles and decreased muscle bulk. If it occurs after
puberty, it triggers decreased libido, impotence and a
lack of growth of facial and body hair, with a decrease
in the size of the prostate gland. It is most commonly
caused by the chromosomal disorder Klinefelter’s
Syndrome (XXY chromosomes are present rather than
the normal male XY), but may also be due to isolated
Chapter 2 Pathophysiology 81

GnRH deficiency in the hypothalamus, generalized
hypopituitarism (as detailed above in Section 2.10.3),
from testicular failure following trauma, torsion or
radio/chemotherapy to the testicles, from androgen
receptor deficiency, or in renal or hepatic failure.
Investigation of hypogonadism includes measure-
ment of testosterone, LH and FSH levels --- this enables
distinction between primary testicular failure (in
which LH and FSH will be high, but testosterone low)
and secondary pituitary disease (in which LH, FSH and
testosterone levels will all be low). Other investigations
such as CT scanning of the pituitary or chromosomal
analysis can be undertaken as required. Treatment is by
reversing the cause where possible and replacing tes-
tosterone, or using LH, FSH or pulses of GnRH
analogues if fertility is required and possible.
2.10.5 Gynaecomastia
Gynaecomastia is the development of breast tissue in
the male, and is caused by an increase in serum
oestrogen levels relative to those of testosterone. It is
very common in the neonatal period in baby boys and
during puberty, and usually requires no intervention
before it spontaneously resolves. However, in older
males it requires investigation as it may be a sign of
hypogonadism, oestrogen-producing tumours of testis
or adrenal gland, or hCG-producing tumours in the
lung. Some drugs may trigger gynaecomastia, notably
digoxin, cannabis, heroin, cimetidine or spironolac-
tone. It may also be seen in hyperthyroidism and
hepatic disease such as liver cirrhosis. However, in
many cases no underlying cause will be identified. If
possible, drugs that may be responsible should be
stopped, or any identified cause treated. Some males
with gynaecomastia will require cosmetic surgical ex-
cision of breast tissue.
2.10.6 Menopause
Females reach the natural menopause around the age
of 45---55, and at this age periods become irregular and
finally cease, following a gradual rise in FSH and LH
levels over several years. Oestrogen levels then begin to
fall, and the menstrual cycle is disturbed. A premature
menopause results if the ovaries are removed or dam-
aged (e.g by chemotherapy or ovarian disease) prior to
this. Menopause results in the characteristic ‘hot
flushes’, with breast atrophy and loss of bone density,
and some women experience weight gain, a loss of
libido, and possibly even depression. After the meno-
pause, the oestrogenic protection against ischaemic
heart disease is lost, and hormone replacement therapy
(HRT) is often given to postmenopausal women par-
tially to protect them from this and the loss of bone
density, as well as to relieve other symptoms. HRT
always comprises a combination of oestrogens and
progestogens, since oestrogens given alone cause an
increased risk of endometrial cancer.
2.10.7 Female hypogonadism andamenorrhoea
In females, hypogonadism almost always presents as
amenorrhoea (absence of periods), or oligomenor-
rhoea (abnormally long menstrual cycles). Amenor-
rhoea may be primary amenorrhoea where a woman
has never had periods, or secondary amenorrhoea, in
whichmenstrual cycles previously occurred. The com-
monest cause of amenorrhoea is weight loss causing
abnormal GnRH secretion from the hypothalamus,
though isolated GnRH deficiency may occur. Other
causes include generalized hypopituitarism, hyperpro-
lactinaemia, premature ovarian failure, defective ovar-
ian development, ovarian tumours, thyroid disease,
adrenal tumours and polycystic ovary syndrome
(PCOS). Patients with PCOS will have an irregular
menstrual cycle with acne, hirsuitism (increased hair,
e.g. on the face) and small cysts are seen on both ovaries
on ultrasound scan. PCOS is associated with decreased
oestrogen production and excess androgens, and is a
common cause of subfertility in females.
Investigation of amenorrhoea comprises a careful
history and examination, with measurement of basal
levels of FSH, LH, oestrogen, progesterone, testoster-
one and prolactin. Ultrasounds or CT scanning of the
ovaries and pituitary gland or ovarian biopsy are
performed if indicated. Treatment is of any underlying
cause (e.g. surgical excision of an adrenal or pituitary
tumour, weight gain, treating hypothyroidism), or
providing oestrogen replacement where this is not
possible, or FSH/LH for GnRH deficiency or hypopi-
tuitarism. Patients with PCOS are treatedwith the drug
clomifene, which stimulates ovarian function, and are
advised to lose weight where necessary. They may add-
itionally receive the hypoglycaemic drug metformin,
which is known to reduce testosterone production
82 Biomedical sciences

in the ovaries, and injected gonadotrophins if preg-
nancy is desired and ovulation is not occurring
with clomifene.
2.10.8 Hyperprolactinaemia
High prolactin levels are usually caused by a prolactin-
secreting pituitary adenoma (‘prolactinoma’), but can
also be seen in hypothyroidism, and due to drugs such
as oestrogens, cimetidine (an antacid drug) and me-
toclopramide (an antiemetic drug). High prolactin
levels cause subfertility with impotence in males (due
to negative feedback of prolactin onGnRHproduction
in the hypothalamus), with galactorrhoea (milk pro-
duction), amenorrhoea or oligomenorrhoea in fe-
males. Investigation is with measurement of serum
prolactin levels, CT or MRI scanning of the pituitary
gland and thyroid function tests. Treatment is by
stopping any drugs that might be the cause and using
the drug bromocriptine to shrink any prolactinoma.
Some prolactinomas will require surgical excision.
2.10.9 Parathyroid hormonedisorders
Parathyroid hormone (PTH) is involved in calcium
homeostasis and is produced by the parathyroid gland.
It causes increased serum calcium levels by increasing
calcium absorption from the intestine, increasing cal-
cium reabsorption in the renal tubules and increasing
calcium release from bones. Its counterpart in calcium
homeostasis is calcitonin, which is produced by the
parafollicular cells of the thyroid glands and has the
opposite effects to parathyroid hormone.
2.10.9.1 Hypoparathyroidism
A lack of PTH will cause hypocalcaemia, with symp-
toms of numbness around the mouth and in the
extremeties of the body, then cramps, twitching, con-
vulsions, and even death if untreated. Hypoparathy-
roidism may be due to the chromosomal disorder
DiGeorge syndrome, in which the parathyroid glands
are defective, or due to autoimmune destruction of
the parathyroid glands, following removal of the
thyroid glands or parathyroid glands, or even due to
a severe lack of magnesium, which inhibits the release
of parathyroid hormone. In some patients, PTH
levels are normal but the tissues are resistant to it
(‘pseudohypoparathyroidism’). Investigations will re-
veal a low serum calcium and low PTH levels (or
normal levels of PTH in pseudohypoparathyroidism).
Treatment is with calcium gluconate infusion initially
to correct serum calcium levels if there is severe
hypocalcaemia, and then treatment with vitamin D.
2.10.9.2 Hyperparathyroidism
Hypercalcaemia is most commonly caused by hyper-
parathyroidism, or elevated levels of PTH, though
some cases may be due to tumours that secrete a
peptide with PTH-like activity. Hypercalcaemia causes
a general feeling of being unwell, depression, bone pain
and constipation; renal stones may develop.
Hyperparathyroidism may be primary, secondary
or tertiary. Primary hyperparathyroidism is caused by
overproduction of PTH in the parathyroid glands,
often due to an adenoma or hyperplasia of the para-
thyroid glands (rarely, it is due to adenocarcinoma of
a parathyroid gland). Secondary hyperparathyroidism
is an elevated level of PTH occurring secondary to
hypocalcaemia (e.g. in renal disease), while tertiary
hyperparathyroidism occurs where there is hyper-
plasia of the parathyroid glands following chronic
secondary hyperparathyroidism. Investigations for
hyperparathyroidism show high serum PTH levels in
the presence of hypercalcaemia in primary hyperpara-
thyroidism, and treatment comprises lowering serum
calcium levels by rehydration with intravenous fluids
in the sick patient with bisphosphonate drugs to
increase calcium deposition into bones. Parathyroid
tumours should be excised and all four glands removed
in parathyroid hyperplasia.
2.10.10 Disorders of growthhormone
Growth hormone is produced by the anterior pitui-
tary gland, and interacts with insulin-like growth
factor (IGF-1) at the tissues to produces its effects.
Growth hormone deficiency is often asymptomatic
in adults, though a cause of short stature in children.
If growth hormone is overproduced in children it
can lead to gigantism and in adults it will give rise to
acromegaly.
Chapter 2 Pathophysiology 83

2.10.10.1 Acromegaly
Most cases of acromegaly are due to a benign pituitary
adenoma that produces excessive growth hormone
(GH), though occasionally an excess of GH releasing
hormone (GHRH) from the hypothalamus is respon-
sible. Excess growth hormone in adults who have fused
epiphyseal plates in long bones (and thus no potential
for further increase in height) causes excessive growth
of soft tissues, signified by a large tongue, separation of
teeth, increase in the size of the hands, feet and nose,
possibly with heart failure, hypertension and the symp-
toms of a pituitary tumour (headaches, visual field
defects). Investigation is with a glucose tolerance test:
usually, a glucose load will produce a fall in serumGH,
but this is absent in acromegaly. Serum GH levels are
usually increased, and a skull X-ray will show enlarge-
ment of the pituitary fossa in 90% of patients with
acromegaly --- MRI scanning will show the pituitary
adenoma well. Treatment is almost always with surgi-
cal removal of the pituitary tumour and followed up
with radiotherapy, though some patients may be trea-
ted with radiotherapy to the pituitary gland alone.
2.10.11 Thyroid disease
The hypothalamus produces thyrotropin-releasing
hormone (TRH), which triggers release of thyroid-
stimulating hormone (TSH) by the pituitary gland.
The thyroid gland responds to TSH by producing
mainly thyroxine (T4) and some tri-iodothyronine
(T3). T3 is the biologically active form, andmost serum
T3 is produced by conversion from T4. Serum T3 and
T4 feedback to the hypothalamus and pituitary gland to
decrease production of TRH and TSH in a classical
negative feedback loop. The vast majority of thyroid
hormones circulate bound to thyroxine-binding glob-
ulin (TBG).
2.10.11.1 Hypothyroidism
Underproduction of thyroid hormones is usually due
to problems with the thyroid gland itself, rather than
the hypothalamus or pituitary gland. The commonest
cause is autoimmune disease, in which antibodies are
produced against thyroid tissue, causing infiltration of
the thyroid gland with inflammatory cells, followed by
fibrosis and atrophy of the thyroid. As with all auto-
immune diseases, this occurs far more frequently in
females than males (six to one ratio). However, other
causes include iodine deficiency (particularly in
mountainous regions of the world) or following pre-
vious surgery or radiation treatment to the thyroid
gland, and rarely, due to the inheritance of genes for
defective thyroid hormone synthesis.
Hypothyroidism causes a slow heart rate, mental
slowness, dry thin hair, weight gain, and may lead to
pericardial effusion, oedema, deafness, anaemia and
loss of the outer part of the eyebrows. Some patients
have a marked goitre, or enlarged thyroid gland,
particularly where the cause of hypothyroidism is
iodine deficiency. Measurement of serum TSH will
show elevated levels, with low levels of T4, and thyroid
antibodies may be detected in autoimmune causes of
hypothyroidism. Treatment is by replacing thyroxine
for life, with the response to treatment assessed by
regular measurement of thyroid hormones and TSH,
particularly initially as it stabilizes.
2.10.11.2 Hyperthyroidism
Hyperthyroidism is a common problem in women in
the third and fourth decades of life, affecting an esti-
mated 5% of this group. The symptoms and signs
include weight loss, increased appetite, restlessness,
tremor, tachycardia (a rapid heart rate), bulging eyes
(exopthalmus),agoitreandhypertension(Figure2.42).
The commonest cause of hyperthyroidism is
Grave’s disease, in which IgG antibodies bind to TSH
receptors in the thyroid gland and stimulate thyroid
hormone production.However, a solitary toxic nodule
or a multinodular goitre may also be responsible, and
Figure 2.42 Large goitre in hyperthyroidism. Source: en.wikipedia.org/wiki/File:Struma_001.jpg
84 Biomedical sciences

in some cases hyperthyroidism occurs when acute
inflammation of the thyroid gland is seen following
a viral infection. Investigation of hyperthyroidism will
show a low TSH level (suppressed by high thyroid
hormone levels) and elevatedT3 andT4 levels in serum.
If Grave’s disease is the cause of hyperthyroidism,
serum microsomal and thyroglobulin antibodies will
be detected.
Treatment of hyperthyroidism is with antithyroid
drugs such as carbimazole, which inhibits the forma-
tion of thyroid hormones. A b-blocker drug may be
used in the first weeks after diagnosis to control
symptoms such as a rapid heart rate and increased
blood pressure. In some patients in whom drug treat-
ment is ineffective or unsuitable, radioactive iodine
(131I) is used; this accumulates in the thyroid gland and
destroys it via local irradiation. Alternatively, most of
the thyroid gland can be removed surgically, particu-
larly in patients with a large goitre. However, risks of
surgery include damage to a nerve that is involved in
speech, hypocalcaemia from damage to parathyroid
glands, and hypothyroidism.
2.10.12 Disorders of theglucocorticoid hormones
The adrenal cortex produces the steroid hormones
cortisol, aldosterone and androgens. Cortisol is pro-
duced pulses in response to adrenocorticotrophic hor-
mone (ACTH) from the pituitary gland, which is itself
released in response to corticotrophin releasing factor
(CRF) produced in pulses by the hypothalamus; corti-
sol feeds back on the hypothalamus and pituitary gland
to decrease further CRF and ACTH release. Cortisol
triggers increased fat and glycogen deposition and
sodium retention. Aldosterone secretion by the adre-
nal cortex is controlled by the renin---angiotensin
system (see Chapters 1 and 7 too).
2.10.12.1 Addison’s disease
Addison’s disease --- also known as primary hypoa-
drenalism --- is rare, and is a fall in cortisol and
aldosterone levels caused by destruction of the adrenal
cortex, usually by autoantibodies. However, it is also
seen in tuberculosis of the adrenal gland, infiltration by
malignant cells, and acute haemorrhage into the adre-
nal gland (often after meningococcal septicaemia). It
causes gradual weight loss, loss of appetite, depression
and tiredness, but can present acutely with vomiting,
shock and abdominal pain. Low blood pressure is an
important feature due to loss of sodium and water,
and there is hyperpigmentation since ACTH levels
are elevated, and ACTH stimulates melanocytes.
Measurement of urea and electrolytes will show a
decreased serum serum with increased serum potas-
sium, low serum glucose and raised urea. Full blood
count often shows an increased white cell count, and
adrenal autoantibodies can be detected in most cases.
The diagnosis can be confirmed with the Synacthen
test (also known as the ‘short tetracosactrin’ or
‘synthetic ACTH’ test), in which blood is taken for
measurement of serum cortisol levels, then a dose of
synthetic ACTH is given, with further serum cortisol
levels taken at 30 and 60min after the ACTH dose. In
adrenal failure, plasma cortisol levels are low, and fail
to rise in response to the ACTH dose. (Note that
serum ACTH levels cannot be used in diagnosis in
their own right as ACTH production is pulsatile and
highly variable.) Treatment of Addison’s disease is
with lifelong steroid replacement treatment, for
example with oral hydrocortisone, and the dose ad-
justed according to measurements of serum cortisol.
The dose may need to be increased when patients
are in inherently stressful situations, for example
infection, surgery or trauma.
2.10.12.2 Secondary hypoadrenalism
Secondary hypoadrenalismmay occur due to suppres-
sion of hypothalamic/pituitary CRF/ACTH produc-
tion by long-term steroid use, or from disorders of the
hypothalamus and pituitary gland. It causes the same
clinical problems as Addison’s disease except without
the skin pigmentation, since ACTH levels are low in
secondary hypoadrenalism. A longer version of the
Synacthen test is used to investigate and will show a
delayed but normal response to injected synthetic
ACTH.
2.10.12.3 Cushing’s syndrome
In Cushing’s syndrome, there is an excess of gluco-
corticoid levels, and most cases are caused by
patients taking steroids for chronic conditions such
as inflammatory bowel disease. Other causes include
excessive ACTH production by a pituitary adenoma
(this is specifically called Cushing’s disease), other
Chapter 2 Pathophysiology 85

ACTH-producing tumours such as small cell lung
tumours or carcinoid tumours, and from excessive
glucocorticoid production by adrenal tumours (adre-
nal carcinoma and adrenal adenomas). An excess of
glucocorticoids causes obesity centred around the
abdomen and trunk with a ‘moon face’, thin skin,
hypertension, stretchmarks, and pigmentation in cases
due to excess ACTH. Investigation is with a dexameth-
asone suppression test; dexamethasone is a synthetic
glucocorticoid, and in normal people its administra-
tion causes suppression of cortisol levels. In Cushing’s
syndrome, suppression of serum cortisol by dexameth-
asone is seen if the cause is ACTH production by the
pituitary gland, but none is seen if ACTH is being
produced by tumours elsewhere in the body as the
usual negative feedback loop will not work. Injected
CRF will show an exaggerated response in pituitary
causes of Cushing’s syndrome. In nonACTH depen-
dent causes of Cushing’s syndrome, very low levels of
plasma ACTHwill be recorded. A 24 h urine collection
will also show raised cortisol levels in urine.
Treatment of Cushing’s syndrome involves surgical
excision of pituitary or adrenal tumours (or tumours
elsewhere that are producing ACTH). Drugs to inhibit
cortisol synthesismay be useful if this is not possible (e.
g. metyrapone). If Cushing’s syndrome is due to
steroid treatment, a gradual reduction in steroid dose
should be instigated where possible.
2.10.13 Diabetes insipidus
Diabetes insipidus is a condition in which ADH secre-
tion by the pituitary gland is impaired (cranial diabetes
insipidus), or ADH secretion is normal but the kidneys
no longer respond to it by increasing resorption of
water in the tubules (nephrogenic diabetes insipidus).
Cranial diabetes insipidus may follow head injury or
brain surgery, or be caused by tumours in the hypo-
thalamus or pituitary, infections such as meningitis, or
vascular damage to the pituitary gland or hypothala-
mus, though some cases are idiopathic (no clear
cause). Nephrogenic diabetes insipidus can occur in
hypercalcaemia or hypokalaemia, or after treatment
with drugs such as lithium (a drug used for bipolar
disorder) or glibenclamide (a hypoglycaemic drug
used in Type II diabetes mellitus).
Diabetes insipidus leads to polyuria (large volumes
of urine are produced frequently) and thirst. Urine
volume is measured, and urea and electrolytes will
often show a high serum sodium level and osmolality
due to dehydration, while urine osmolality is low. A
water deprivation test with synthetic ADH adminis-
tration is used to confirm the diagnosis: water intake is
restricted for 8 hours and blood and urine osmolality
measured hourly. A continuing low urine osmolality is
seen in diabetes insipidus after water deprivation, and
following a dose of synthetic ADH, this normalizes in
cranial diabetes insipidus, but remains low in
nephrogenic diabetes insipidus. Treatment comprises
treating any underlying condition (e.g. excision of a
pituitary tumour) and giving a synthetic ADH (e.g.
desmopressin).
2.10.14 Diabetes mellitus
Insulin is a peptide hormone produced by the b cells ofthe islets of Langerhans in the pancreas in response to a
rise in plasma glucose levels. It allows glucose to be
taken up by cells, and glucose to be stored as glycogen
in the liver and muscles, and triglycerides to be stored
as fat. In diabetesmellitus, there is insulin deficiency or
a lack of tissue responsiveness to insulin (sometimes
both), with hyperglycaemia resulting. Diabetes is di-
vided into Type I diabetes mellitus, in which patients
are dependent on insulin injections, and Type II
diabetes mellitus, which can often be managed with
dietary changes or drugs alone. Type I diabetes occurs
when the islets of Langerhans are destroyed by an
autoimmune reaction, rendering the patient reliant
on injected insulin to survive thereafter. It is typically
diagnosed in young patients (with a peak incidence
around the age of 12) who are not overweight, and is
associated with HLA-DR3 or HLA-DR4 genes. In
contrast, Type II diabetes often affects patients older
than 40 years oldwho are usually overweight, and there
is no evidence of an autoimmune basis for Type II
diabetes. Most cases of Type II diabetes can be man-
aged with diet or oral medication, though some pa-
tients will require insulin.
In diabetes, patients develop chronic hyperglycae-
mia as a result of lack of insulin, or tissue resistance to
insulin --- glucose is effectively ‘locked out’ of cells. A
major symptom is polyuria as the renal threshold for
glucose reabsorption is exceeded with rising plasma
glucose levels; glucose in urine drags water with it by
osmotic diuresis, triggering frequent, high volume
urination, and accompanying dehydration and thirst.
Since glucose cannot be used by cells in the absence
86 Biomedical sciences

of glucose, fat and muscle are broken down as alterna-
tive fuel sources, with weight loss. In Type I diabetes,
ketoacidosis may result if the diagnosis is not
made early.
2.10.14.1 Ketoacidosis
Investigation of a patient for diabetes often begins with
urine dipstick testing for the presence of glucose in
urine, with a fingerprick ‘BM’ test for blood glucose
levels, or with a blood sample submitted for a random
blood glucose level. A fasting blood glucose sample
allowsmore accurate assessment, and is obtained in the
early morning after a patient has fasted overnight. A
random blood glucose�10mmol/L, or a fasting blood
glucose �6.7mmol/L, both allow a presumptive diag-
nosis of diabetes mellitus to be made. In borderline
cases, a glucose tolerance test can be undertaken, in
which a patient fasts overnight, a baseline blood glu-
cose sample is taken, and they are then given 75 g of
glucose in 300mL water. A further blood glucose
sample is taken at 2 h, and the results interpreted as
shown below in Table 2.6.
Treatment of diabetes aims to keep blood glucose
levels as normal as possible at all times, and thus
avoid the potential complications of diabetes melli-
tus, which include renal failure, macrovascular dis-
ease (strokes, heart disease and gangrene in feet),
microvascular disease (which can cause blindness
from retinal disease, renal failure when it affects the
renal glomerulus, and neuropathy) and infections. All
patients with diabetes should be advised on a healthy,
balanced diet to include complex carbohydrates rath-
er than simple sugars, enabling the avoidance of rapid
fluctuations of blood sugar levels. Type II diabetics
will sometimes also require oral hypoglycaemic drugs
such as glibenclamide (which increases insulin secre-
tion) or metformin (which reduces glucose absorp-
tion from the gut) if diet alone is failing to control
their blood glucose levels. Type I diabetics will re-
quire injected insulin --- usually recombinant human
insulin --- in a tailored regime of rapid-acting and
long-acting formulations, typically with two to four
injections of insulin each day and the dose adjusted
according to self-monitoring of blood glucose levels
using fingerprick testing and a blood glucose monitor
(Figure 2.43).
Since patients can continue to feel well in spite of
considerable degrees of hyperglycaemia, home moni-
toring of blood glucose levels to ensure good control is
extremely important. Patients should record their
home blood glucose measurements in a log, and take
this to hospital or GP surgery clinics for advice from a
diabetic specialist. In hospital, the control of blood
glucose levels can be assessed over the longer term
by measuring haemoglobin A1C levels --- HbA1C is
produced by glycosylation of HbA by glucose in
the bloodstream, and occurs in proportion to average
blood glucose levels over the lifespan of normal red
blood cells, that is 120 days. The normal range is
4---6.5% (i.e. 4---6.5% ofHb is HbA1C) in nondiabetics,
and for diabetic patients the target range is 6.5---7.5% ---
readings above this range indicate imperfect diabetic
control and a need to adjust control andmonitoring of
diabetes to avoid complications. In patients with ab-
normal forms of haemoglobin, or abnormal rates of
production of haemoglobin, such as sickle cell anaemia
or thalassaemia, other glycosylated plasma proteins
can be assessed instead.
Table 2.6 Interpreting the results of a glucose tolerancetest
Normal Diabetes Impairedglucosetolerance
Baseline blood
glucose
<6.7mmol/L �6.7mmol/L <6.7mmol/L
2 h blood
glucose
<6.7mmol/L �10mmol/L 6.7---10mmol/L
Figure 2.43 Home testing of blood glucose levels using ablood glucose monitor
Chapter 2 Pathophysiology 87

2.10.14.2 Diabetic ketoacidosis
If Type I diabetes is diagnosed late, or in known Type I
diabetics who are otherwise ill or have stopped taking
insulin, diabetic ketoacidosis can ensue. This occurs
where hyperglycaemia has led to osmotic diuresis and
dehydration, and lack of insulin has led to fat being
used as an alternative fuel source; with lipolysis under-
way, free fatty acids are released and their liver con-
version to acidic ketone bodies leads to a fall in blood
pH. The diagnosis is made in patients who have
hyperglycaemia (usually blood glucose >20mmol/L)
along with a lowered blood pH --- measured on an
arterial blood gas sample --- and the presence of ketones
in plasma. A full blood count may show an increased
white cell count when infection is also present, and
serumurea and electrolytes will show an increased urea
and creatinine (dehydration) with a raised serum
potassium, since potassium is also locked out of cells
in the absence of insulin.
Treatment of ketoacidosis comprises replacing lost
fluids and insulin intravenously, and also giving po-
tassium supplements as potassium will flood back into
cells once insulin is given (and rehydration is occur-
ring). Patients with diabetic ketoacidosis are often
extremely sick, and should be intensely monitored
with very frequent measurement of blood glucose
levels, serumurea and electrolytes, pH and bicarbonate
levels, and adjustment of fluids, potassium and insulin
accordingly; some will require admission to an inten-
sive care unit. Once the patient is well enough to eat
and drink, they are converted to subcutaneous insulin
injections.
2.10.14.3 Hyperosmotic hyperglycaemicnonketotic coma (HONK)
In Type II diabetics, severe hyperglycaemia can de-
velop without significant ketosis, and results in seri-
ous dehydration from osmotic diuresis and elevated
plasma osmolality, ultimately leading to a decreased
level of consciousness. It is often set off by intercur-
rent illness in a Type II diabetic patient. Management
is as for diabetic ketoacidosis, with rehydration and
insulin, but also with anticoagulation with heparin as
the risk of thrombosis is high in HONK. Once the
patient is well again, their usual diabetic regime can
begin again.
Bibliography
This chapter represents a ‘whistle-stop’ tour of a vast tract of
clinical medicine, epidemiology and pharmacology, and
students are advised to consult other textbooks for subjects
they wish to research in more depth. Some of the author’s
own favourites are as follows.
Bonita, R., Beaglehole, R. and Kjellstr€om, T. (2007) Basic
Epidemiology, 2nd edn, World Health Organization.
Kumar, P. and Clark, M. L. (eds) (2009) Clinical Medicine,
7th edn, Elsevier.
Longmore,M. et al. (eds) (2010)OxfordHandbook of Clinical
Medicine, 8th edn, Oxford University Press.
Neal, M.J. (2009)Medical Pharmacology at a Glance, 6th edn,
Wiley Blackwell.
Rang, H.P., Dale, M.M., Ritter, J.M. and Flower, R.J. (eds)
(2007) Rang and Dale’s Pharmacology, 6th edn, Churchill
Livingstone.
88 Biomedical sciences

Chapter 3
Clinical cell biology and genetics
Professor Ray K. Iles, B.Sc., M.Sc., Ph.D., CBiol, FSB, FRSCDr Stephen A. Butler, B.Sc., Ph.D.
At the most basic level, biomedical science is an
understanding of how cells work and genes are
expressed or silenced. At a clinical level this is perhaps
not nearly as important as recognizing a disease and
applying the correct treatment. Clinical biomedical
science attempts to bridge these two extremes. Thus,
an understanding of basic cell biology and genetics is
essential, but its relevance to human diseases and
laboratory medicine must not be lost. This chapter
aims to highlight and explain relevant aspects of
our growing understanding of basic genetics and cell
biology for the clinical biomedical scientist.
3.1 The cell
One of the fundamentals of biology is an understand-
ing of the structures and functions of the cell. In
biomedical science it is an appreciation that organelles
vary in prominence and indeed may be absent (e.g. no
nuclei in red cells and platelets) depending on the
function of the cell and tissue architecture in which
they are embedded. Cellular organizations are highly
regulated specific to the cell type and not a matter of
enzymes, proteins or structures floating freely in a
cytoplasmic soup (see Figure 3.1).
3.1.1 Cell structures, organellesand function
3.1.1.1 Cell membrane
The plasma or cell membrane is a bilayer consisting of
amphipathic phospholipids, that is consisting of a
polar hydrophilic head (phosphatidyl choline) and a
lipid hydrophobic tail (commonly two long chain
fatty acids). The phospholipids spontaneously form
bilayers that, as complete oval structures, form an
effective barrier which is impermeable to most
water soluble molecules. This barrier defines the inte-
rior environment of the cell and the exchanges across
the plasma membrane are regulated by various pro-
teins which are embedded in the lipid bilayer.
The lipids’ hydrophobic nature means that the
plasma membrane is held together by relatively
weak bonds. However, these collective interactions
strongly oppose transverse movement by hydrophilic
molecules whilst allowing considerable freedom for
lateral ‘fluid’ movement by the hydrophobic mole-
cules, such as membrane proteins, which are embed-
ded within the plasma membrane. This makes the
plasma membrane a very dynamic structure (also see
Chapter 4, Section 4.1.1).
Biomedical Sciences: Essential Laboratory Medicine, First Edition. Edited by Ray K. Iles and Suzanne M. Docherty.� 2012 John Wiley & Sons, Ltd. Published 2012 by John Wiley & Sons, Ltd.
89

3.1.1.2 Cytoplasm
This defines the interior of a cell membrane in which
the organelles are found; the cytoplasm. Although a
fluid compartment, the organelles are held within a
scaffolding or cytoskeleton.
3.1.1.3 Cytoskeleton
The cytoskeleton is in fact a complex network of
structural proteins, it regulates not only the shape of
the cell but its ability to traffic internal cell organelles
andmove in response to external stimuli. This network
even regulates the passage and direction in which the
interior solutes and storage granules flow. Although
the principal solute is water it contains amino acids,
sugars and whole protein complexes which traffic
between, and even within, the organelles. The major
components are microtubules, intermediate filaments
and microfilaments.
3.1.1.4 Nucleus
An organelle containing the human genome and
bound by two bilayer lipid membranes constitutes the
nucleus of a cell. Theouter of the two is continuouswith
the endoplasmic reticulum. Nuclear pores are present
in the membranes allowing the passage of nuleotides
and DNA interacting proteins in and mRNA out.
3.1.1.5 Nucleoli
Dense areas within the nucleus, rich in proteins and
RNA, are the nucleoli. These regions are chiefly con-
cerned with the synthesis of ribosomal RNA (rRNA)
and ribosomes.
3.1.1.6 Endoplasmic reticulum (ER)
Interconnecting tubules or flattened sacs (cisternae) of
lipid membrane bilayer which are continuous with the
nuclear double membrane constitute the endoplasmic
reticulum. Areas of the ER may contain ribosomes on
the surface (termed rough endoplasmic reticulum
(RER) when present, or smooth endoplasmic reticu-
lum (SER) when absent). The ribosomes translate
mRNA into a primary sequence of amino acids of a
protein peptide chain. This chain is synthesized into
the ER luminal or intermembrane where it is first
folded and modified into mature peptides. Often
tethered to the plasma membrane they are packed into
blunt ends of the ER folds that bud of from the ER
as vesicles. These transport vesicles often move to
the Golgi.
3.1.1.7 Golgi apparatus
A double membrane series of folded flattened cisternae
(like a stack of towels) they are similar to, but distinct
from, the ER. They are characterized as a stack of
cisternae from which many vesicles bud off from the
thickened ends. The primary processed peptides of the
ER are exported to the Golgi for maturation into
functional proteins (e.g. glycosylation of proteins
which are to be excreted occurs here) before packaging
into secretory granules and cellular vesicles which bud
off the end (see Figure 3.2).
Golgi apparatus
Endoplasmic reticulum
Nuclear pore
Cytoskeleton
Hetrochromatin
Ribosomes
Mitochondria
Euchromatin
Cell membrane
Nucleus
Vesicle
Figure 3.1 Diagrammatic representation of the cell illustrating the major organelles. From Kumar and Clark, ClinicalMedicine, 6ed 2005 � Elsevier
90 Biomedical sciences

3.1.1.8 Lysosomes
Dense cellular vesicles containing acidic digestive en-
zymes --- lysozymes --- fuse with phagocytotic vesicles
from the outer cell membrane, digesting the contents
into small biomolecules which can cross the lysosomal
lipid bilayer into the cell cytoplasm. Furthermore,
lysosomal enzymes can be released outside the cell by
fusion of the lysozyme with the plasma membrane.
Lysosomal action is crucial to the function of macro-
phages and polymorphs in killing and digesting infec-
tive agents, tissue remodelling during development
and osteoclast remodelling of bone. Not surprisingly
many metabolic disorders result from impaired lyso-
somal function.
3.1.1.9 Peroxisomes
Dense cellular vesicles --- so named because they con-
tain enzymes that catalyse the breakdown of hydogen
peroxide --- peroximes are involved in the metabolism
of bile and fatty acids; they are primarily concerned
with detoxification. For example D-amino acid oxi-
dase and H2O2 catalase are key enzymes in this regard.
The inability of the peroxisomes to function correctly
can lead to raremetabolic disorders such as Zellweger’s
syndrome and rhizomelic dwarfism.
3.1.1.10 Mitochondria
This organelle is the power house of the cell --- mito-
chondria contains two lipid bilayer membranes and a
central matrix. It also possesses several copies of its
own DNA in a circular genome reflecting their evolu-
tionary autonomous origins before symbiotic incor-
poration with our eukaryotic cell.
The outer mitochondrial membrane containsmany
gated receptors responsible for the import of raw
materials like pyruvate and ADP and the export of
products such as oxaloacetate (precursor of amino
acids and sugars) and ATP. An interesting caveat to
our symbiotic relationship is that proteins of the Bcl-2-
Bax family are incorporated in this outer membrane
and can release cytochromeCwhich triggers apoptosis.
The inner mitochondrial membrane is often highly
infolded to form cristae to increase its effective surface
area. It contains transmembrane, enzyme complexes
of the electron transport chain, which generate an
Figure 3.2 Intracellular transport. (a) Receptor-mediated pinocytosis. (b) Trafficking of vesicles containing synthesizedproteins to the cell surface (e.g. hormones). (c) Traffic between organelles is also mediated by v- and t-SNARE-containingorganelles. v-SNARE, vesicle-specific SNARE; t-SNARE, target-specific SNARE. From Kumar and Clark, Clinical Medicine,6ed 2005 � Elsevier
Chapter 3 Clinical cell biology and genetics 91

Hþ ion gradient. This gradient then drives the adjacent
transmembrane ATPase complex to form ATP from
ADP and Pi. The mitochondrial inner matrix contains
the enzymes of the Kreb cycle which generate the sub-
strates of both the electron transport chain (FADH2þ
and NADH) and central metabolism (e.g. succinyl
CoA, a-oxoglutarate, oxaloacetate, see Figure 3.3).
3.1.2 The dynamic cell
Like all systems, the component proteins and even
organelles of the cell are continually being formed and
degraded. Most of the degradation steps involve ATP
dependent multienzyme complexes. Old cellular pro-
teins are mopped up by a small cofactor molecule
called ‘ubiquitin’, which interacts with these worn
proteins via their exposed (hydrophobic) leusine re-
sidues (Figure 3.4). The ubiquitin acts as a signal
for destruction, and a complex containing more than
five ubiquitin molecules is rapidly degraded by a
large proteolytic multienzyme array termed ‘26S
proteasome’. The failure to remove worn protein can
result in the development of chronic debilitating dis-
orders. Alzheimer and Pick’s dementia are associated
with the accumulation of proteins (prion-like pro-
teins) which are resistant to ubiquitin-mediated
proteolysis. Similar proteolytic resistant ubiquinated
proteins give rise to inclusion bodies found inmyositis
and myopathies. This resistance can be due to point
mutation in the target protein itself (e.g. mutant p53 in
cancer) or as a result of an external factor altering the
conformation of the normal protein to create a pro-
teolytic resistant shape, as in new variant Creutz-
feldt---Jakob disease (CJD).
3.1.2.1 The cytoskeleton
The major components are microtubules, intermedi-
ate filaments and microfilaments (see Figure 3.5).
Microtubules. These are made up of two protein
subunits a and b tubulin (50 kDa) and are contin-
uously changing length. They form a ‘highway’
transporting organelles through the cystoplasm.
There are two motor microtubule-associated pro-
teins (MAP) --- dynein and kinesin --- allowing
antegrade and retrograde movement. Dynein is
also responsible for the beating of cilia. During
interphase the microtubules are rearranged by the
microtubule-organizing centre (MTOC), which
consists of centrosomes containing tubulin and
provides a structure on which the daughter chro-
mosomes can separate. Another protein involved in
the binding of organelles to microtubules is the
cytoplasmic linker protein (CLIP). Drugs that dis-
rupt the microtubule assembly (e.g. colchicine and
vinblastine) affect the positioning and morphology
Figure 3.3 Structure of themitochondria illustrating the doublemembrane and presence of its own circular chromosome forautologous synthesis of proteins within the organelle
92 Biomedical sciences

of the organelles. The anticancer drug paclitaxel
causes cell death by binding to microtubules and
stabilizing them so much that organelles cannot
move, and thus mitotic spindles cannot form.
Intermediate filaments. These form a network around
the nucleus and extend to the periphery of the cell.
They make cell-to-cell contacts with the adjacent
cells via desmosomes and basement matrix via
hemidesmosomes. Their function appears to be in
structural integrity, being prominent in cellular
tissues under stress. The term cytoskeleton was first
used to describe the crossingweb of these intermedi-
ate (thickness) filaments. The intermediate filament
fibre proteins are specific to the embryonic lineage
of the cell concerned, for example keratin are
intermediate fibres only found in epithelial cells
whilst vimentin is only found in mesothelial (fibro-
blastic) cells.
Microfilaments. Muscle cells contain a highly-ordered
structure of actin (a globular protein, 42---44 kDa)
and myosin filaments, which form the contractile
system. These filaments are also present throughout
the nonmuscle cells as truncated myosins (e.g.
myosin 1), in the cytosol (forming a contractile
actomyosin gel) and beneath the plasmamembrane.
Cell movement is mediated by the anchorage of
actin filaments to the plasmamembrane at adherent
junctions between cells. This allows a nonstressed
coordination of contraction between adjacent cells
of a tissue. Similarly vertical contraction of tissues is
anchored across the cell membrane to the basement
matrix at focal adhesion where actin fibres converge.
Actin-binding proteins (e.g. fimbria) modulate the
behaviourofmicrofilaments and their effects areoften
calcium-dependent. The actin associated proteins
can be tissue-type specific, for example actin binding
troponin is a complex of three subunits and two of
these have isomers which are only found in cardiac
muscle. Cardiac troponin I is released into the blood
circulation 6 h after the onset of a heart attack. This
marker has proved more clinically relevant than
creatinine kinase MB. Furthermore, since it is not
found in the blood of those with undamaged heart
tissue, elevated levels inpatientswith angina correlates
with the likelihood of a heart attack and months of
survival. Similarly cardiac troponin T has been shown
to identify patients suffering a myocardial infarct
and, again, the higher the serum levels the worse the
prognosis. More tissue specific actin associated pro-
teins are being identified and the number of serum
cardiac status markers is continually increasing.
Alterations in the cell’s actin architecture are also
controlled by the activation of small ras-like GTP-
binding proteins rho and rac. These are important
in rearrangement of the cell during division and
thus dysfunctions of these proteins are associated
with malignancy.
Figure 3.4 26S Proteosome --- the reprocessing complex of the cell to which worn proteins are reduced and recycled.Ubiquination of proteins by UBqE3 signals that the target protein is damaged and if it is polyUbiquinated it is transported tothe 26S proteosome complex for degradation. The ubiquitin protein is recovered and recycled to interact with other warn anddamaged proteins
Chapter 3 Clinical cell biology and genetics 93

3.1.3 Intercellular connections
The cytoskeleton and plasma membrane interconnect
and extracellular domains form junctions between
cells to form tissues. There are three types of junction
between cells: tight, adherent and gap junctions
(see Figure 3.6).
Tight junctions (zonula occludens) hold cells together.
They are at the ends ofmargins adjacent to epithelial
Figure 3.5 Illustration of the cytoskeletal proteins of a cell, contractile actin fibres (a), tram line microtubules (b) andconnection scaffolding of microfilaments (c)
94 Biomedical sciences

cells (e.g. intestinal and renal cells) and form a
barrier to the movement of ions and solutes across
the epithelium, although they can be variably ’leaky’
to certain solutes. The proteins responsible for the
intercellular tight junction closure are called clau-
dins. They show selective expression within tissue
and regulate which small ions may pass through the
gaps between cells. For example, the kidney displays
a differential expression of these claudin proteins.
Mutations of claudin-16 (which is only expressed in
the thick ascending limb of the loop of Henle where
magnesium is reabsorbed) is responsible for some
forms of Gitelman’s syndrome --- a rare inherited
hypomagnesaemia characterized bymassive urinary
magnesium loss, hypercalciuria and seizures at an
early age. Since magnesium reabsorbtion is para-
cellular, tight junctions, which contain claudin-16,
presumably prevent these divalent ions rapidly dif-
fusing back between the cells into renal tubules.
Adherent junctions (zonula adherens) are continuous
on the basal side of cells. These transmembrane
junctions contain cadherins and are the major site
of the attachment of intracellular microfilaments.
Intermediate filaments attach to desmosomes,
which are apposed areas of thickened membranes
of two adjacent cells. Hemidesmosomes attach cells
Figure 3.6 Cellular connection and cell adhesion molecules. (a) Five main groups of adhesion molecules. Selectins have aweak binding affinity for specific sugar molecules found on mucins. Mucins are long tandem-repeat peptides which protrudefrom the cell membrane and are covered in glycosylation moieties. (b) Adjacent cells form focal adhesion junctions.Desmosomes are where the membrane forms a proteinaceous plaque containing molecules like desmoglein, from whichcadherins protrude and bind cadherins of the adjacent cell. Intracellularly the plaque binds loops of cytoskeleton tointermediate filaments, e.g. keratin in epithelial cells and vimentin in fibroblasts. Tight junctions are mediated by integralmembrane proteins, claudins and diclaudins, which associate to form subunits bridging the intercellular gap. Gap junctionsconsist of connexin subunits that form a regulated hollow tube. Adherent junctions are similar to desmosomes in thatcell-to-cell adhesion is mediated by cadherins but the membrane proteinaceous plaque components are different and bindcontractile cytoskeletal fibres like actin at the terminus. (c) Basementmembrane adhesion. This is similar to desmosomes andadherent junctions in that membrane plaques link intercellular intermediate filaments (e.g. keratin or vimentin) inhemidesmosomes and contractile cytoskeleton actin in focal adherent junctions to the basement matrix. However,integrins replace cadherins as the surface adhesion molecules. From Kumar and Clark, Clinical Medicine, 6ed 2005� Elsevier
Chapter 3 Clinical cell biology and genetics 95

to the basal lamina and are also connected to inter-
mediate filaments. Transmembrane integrins link
the extracellular matrix to microfilaments at focal
areas where cells also attach to their basal laminae. In
blistering dermatological disorders autoantibodies
cause damage by attacking tight junction desmo-
somal proteins such as desmoglein 3 in pemphigus
vulgaris and desmoglein-1 in pemphigus foliaceus.
Gap junctions allow substances to pass directly between
cells without entering the extracellular fluids. Pro-
tein channels (connexons) are lined up between two
adjacent cells and allow the passage of solutes up to
molecular weight 1000 kDa (e.g. amino acids and
sugars), as well as ions, chemical messengers and
other factors. The diameter of these channels is
regulated by intracellular Ca2þ, pH and voltage.
Connexons aremade up of six subunits surrounding
a channel and their isoforms in tissues are encoded
by different genes. Mutant connexons can cause
disorders, such as the X-linked form of Charcot---
Marie---Tooth disease.
3.1.4 Cell adhesion molecules
Adhesion molecules and adhesion receptors are essen-
tial for tissue structural organization. Differential ex-
pressionof suchmolecules is implicit in theprocessesof
cell growth and differentiation, such as wound repair
andembryogenesis.Thereare fourmajor families of cell
adhesion molecules: cadherins, integrins, immuno-
globulin superfamily and the selectins (see Figure 3.6).
3.1.4.1 Cadherins
The cadherins establish molecular links between adja-
cent cells. They form zipper-like structures at ‘adherens
junctions’, areas of the plasma membrane where cells
make contact with other cells. Through these junc-
tions, bundles of actin filaments run from cell to cell.
Related molecules such as desmogleins form the main
constituents of desmosomes, the intercellular contacts
found abundantly between epithelial cells. Desmo-
somes serve as anchoring sites for intermediate fila-
ments of the cytoskeleton. When dissociated embry-
onic cells are grown in a dish, they tend to cluster
according to their tissue of origin. The homophilic
(like with like) interaction of cadherins is the basis of
this separation and has a key role in segregating
embryonic tissues. The expression of specific adhesion
molecules in the embryo is crucial for the migration of
cells and the differentiation of tissues. For example,
when neural crest cells stop producing N-CAM and
N-cadherin and start to display integrin receptors they
can separate and begin to migrate on the extracellular
matrix. Changes in cadherin expression are often
associated with tumour metastatic potential.
3.1.4.2 Integrins
Integrins are membrane glycoproteins consisting of
alpha and beta subunits and they exist in active
and inactive forms. The integrins principally bind to
extracellular matrix components such fibrinogen, elas-
tase and laminin. The amino acid sequence arginine---
glycine---aspartic acid (RGD) is a potent recognition
sequence for integrin binding and integrins replace
cadherins in the focal membrance anchorage of hemi-
desmosomes and focal adhesion junctions. An impor-
tant feature of integrins is that the active form can come
about as a result of a cytoplasmic signal that causes a
conformational change in the extracellular domain in-
creasing affinity for its ligand.This ‘insideout’ signalling
occurs when leucocytes are stimulated by bacterial pep-
tides, rapidly increasing leukocyte integrin affinity for
immunoglobulin superfamilies structures such as the Fc
portion of immunoglobulin. The ‘outside in’ signalling
follows the binding of the ligand to the integrin and
stimulates secondary signals resulting in diverse events
such as endocytosis, proliferation and apoptosis. Defec-
tive integrins are associated with many immunological
and clotting disorders such as Bernard---Soulier syn-
drome and Glanzmann’s thrombasthenia.
3.1.4.3 Immunoglobulin superfamily celladhesion molecules (iCAM’s)
These molecules contain domain sequences, which are
immunoglobulin-like structures. The neural-cell ad-
hesion molecule (N-CAM) is found predominantly in
the nervous system. Itmediates a homophilic (likewith
like) adhesion. When bound to an identical molecule
on another cell, N-CAM can also associate laterally
with a fibroblast growth factor receptor and stimulate
the tyrosine kinase activity of that receptor to induce the
growth of neurites. Thus adhesion molecules can trig-
ger cellular responses by indirect activation of other
types of receptors. The placenta and gastrointestinal
tract also express immunoglobulin superfamily mem-
bers, but their function is not completely understood.
96 Biomedical sciences

3.1.4.4 Selectins
Unlikemost adhesionmolecules ---which bind to other
proteins --- the selectins interact with carbohydrate-
ligands or mucin complexes on leucocytes and
endothelial cells (vascular and haematologic systems).
Selectins were named after the tissues in which they
were first identified. L-selectin is found on leucocytes
and mediates the homing of lymphocytes to lymph
nodes. E-selectin appears on endothelial cells after
they have been activated by inflammatory cytokines;
the small basal amount of E-selectin in many vascular
beds appears to be important for the migration
of leucocytes.
P-selectin is stored in the alpha granules of platelets
and theWeibel---Palade bodies of endothelial cells, but
it moves rapidly to the plasma membrane upon stim-
ulation of these cells. All three selectins play a part in
leucocyte rolling.
3.1.5 Receptors
There are many intracellular receptors that bind lipid
soluble ligands such as steroid hormones (e.g. proges-
terone, cortisol, T3 and T4). These cytoplasmic recep-
tors often change shape in response to binding their
ligands, form dimers, enter the nucleus and interact
directly with specific DNA sequences The nonlipid
soluble ligands such as growth hormone (GH), insulin,
insulin-like growth factor (IGF) and luteinizing
hormone (LH) have membrane surface receptors
which pass their extracellular signal across the plasma
membrane to cytoplasmic 2� signalling molecules.
These membrane bound receptors can be subclassified
according to the mechanism by which they activate
signalling molecules:
. ion channel linked;
. G-protein linked;
. enzyme linked.
Structurally these plasma membrane receptors can
be (see Figure 3.7):
. serpentine (seven transmembrane domains; e.g. the
LH receptor);. transmembrane with large extra- and intracellular
domains (e.g. the epidermal growth factor (EGF)
receptor);. transmembranewith large extracellular domain only;. entirely linked onto the outer membrane leaflet by a
lipid moiety known as a GPI (glycanphosphatidyli-
nositol) anchor (e.g. T-cell receptor).
The function of these membrane receptors is to
initiate a secondarymessagewhich ultimately results in
activation of a DNA binding protein. This translocates
to the nucleus and initiates transcription of a specific
set of genes.
3.1.5.1 Ion channel receptors
Commonly found, but not exclusive on the cell mem-
branes of neurological tissue where a sudden influx of
ions causes a depolorization wave or nerve impulse,
Figure 3.7 Diagrammatic representations of the plasmamembrane and integral protein receptors and secondary messengerproteins. From Kumar and Clark, Clinical Medicine, 6ed 2005 � Elsevier
Chapter 3 Clinical cell biology and genetics 97

ion channel receptors are found as abundant intracel-
lular components and will trigger a release of, for
example, Ca2þ ions from vesicles/organelles in which
they are stored as part of a secondary messaging
pathway.
3.1.5.2 G-Protein linked receptors
The G-protein linked receptor, once activated by a
ligand, binds a trimeric complex (a, b, g) which is
anchored to the inner surface of the plasma mem-
brane (see Figure 3.7). This complex is a GTP-
binding protein, or G-protein. The G-protein binds
GTP rather than GDP (see Figure 3.8), and then
interacts with enzyme complexes anchored into the
inner leaflet of the membrane. These complexes in
turn activate one or all three of the secondary
messengers:
. cyclic AMP (CAMP).
. Ca2þ ions.
. Inositol 1,4,5-triphosphate/diacylglycerol (IP3/DAG).
3.1.5.3 Enzyme-linked surface receptors
These receptors usually have a single transmembrane-
spanning region and a cytoplasmic domain that has
intrinsic enzyme activity, or will bind and activate
other membrane-bound or cytoplasmic enzyme com-
plexes. Four classes of enzymes have been designated as
follows.
Guanylyl cyclase-linked receptors, for example the atrial
natriuretic peptides, which produce cyclic GMP.
This in turn activates a cGMP-dependent kinase
(GPCRK), which binds to and phosphorylates serine
and threonine residues of specific secondary
messengers.
Tyrosine kinases receptors, for example the platelet
derived growth factor (PDGF) receptors, which
either specifically phosphorylate kinases on a small
set of intracellular signalling proteins, or associate
with proteins that have tyrosine kinase activity.
Tyrosine phosphatase receptors, for example CD45,
which remove phosphates from tyrosine residues
of specific intracellular signalling proteins.
Figure 3.8 Receptor and secondary messengers. (i) G-protein receptor binds ligand (e.g. hormone) and activates G-proteincomplex. The G-protein complex can activate three different secondary messengers: (a) cAMP generation; (b) inositol1,4,5-trisphosphate (IP3) and release of Ca2þ; (c) diacylglycerol (DAG) activation of C-kinase and subsequent proteinphosphorylation. (ii) Dimeric hormone binds receptor subunits bringing them into close association. Intracellular domainscross-phosphorylate and link to the phosphorylation cascades via molecules such as RAS. (iii) Lipid-soluble molecules, e.g.steroids, pass through the cell membrane and bind to cytoplasmic receptors, which enter the nucleus and bind directly toDNA. ER, endoplasmic reticulum; IkB, inhibitory factor kappa B; NFkB, nuclear factor kappa B. From Kumar and Clark, ClinicalMedicine, 6ed 2005 � Elsevier
98 Biomedical sciences

Serine/threonine kinase receptors, for example trans-
forming growth factor beta (TGFb) receptors, whichphosphorylate specific serine and threonine residues
of intracellular signalling proteins.
3.1.5.4 Cytoplasmic receptor
These are predominantly steroid binding proteins
which are free in the cell cytoplasm. On binding the
lipid soluble steroid molecule, which simply dis-
solves across the cell membrane (no need for a
membrane bound receptor), they undergo a con-
formational change, enter the nucleus and bind
directly with DNA initiating gene transcription or
silencing. Thus, there is no need for a secondary
messenger cascade for steroids but all other cell
signalling mediated via a cell membrane bound
receptor requires an intracellular secondary mes-
senger cascade (see Figure 3.8).
3.1.6 Secondary messengers
Secondary messengers are molecules which transduce
a signal from a. bound receptor to its site of action
(e.g. the nucleus). There are essentially four mechan-
isms by which secondary messengers act but
they crosstalk and are rarely activated independent of
each other (see Figure 3.8). These mechanisms are
cyclic AMP/cAMP, IP3/DAG, Ca2þ ions changes and
protein phosphorylation.
3.1.6.1 G-protein activation, inactivation
Guanine nucleotide binding proteins are a ubiqui-
tous cellular mechanism for coupling an extracellular
signal via a serpentine transmembrane receptor to a
second messenger such as cAMP. G-proteins have
three noncovalently associated subunits: a, b, g. Inthe inactive state GDP is bound to the a subunit of
the G-protein. When the receptor is activated by
ligand binding, the G-protein is activated by the
exchange of GDP for GTP. In this active state the
a subunit dissociates from the Ry subunit complex.
Either of these two complexes can then interact with
enzymes producing second messengers such as ade-
nyl cyclase forming cAMP. The a subunit is rapidly
inactivated by hydrolysis of GTP to GDP (this is an
intrinsic property of a subunit) and then reassociates
with the b and g subunits resetting the whole system
to the inactive state (see figure 3.9). The dissociation
of the complex away from the receptor on activation
allows multiple G-protein complexes to be activated
by a single receptor so amplifying the signal (see
Figure 3.8).
3.1.6.2 Cyclic AMP, IP3/DAG and CA2þ ions
The generation of cAMP by G-protein-linked recep-
tors results in an increase in cellular cAMP, which
binds and activates specific cAMP-binding proteins.
These dimerize and enter the cell nucleus to interact
with set DNA sequences (the cAMP response elements
or CREs found within the promoter region of genes).
In addition, cofactors in the cAMP-binding proteins
are coactivated and interact with the phosphorylation
pathway.
Other G-protein complexes activate inner mem-
brane-bound phospholipase complexes. These in turn
cleave membrane phospholipid --- polyphosphoinosi-
tide (PIP2) --- into two components. The first is
the water-soluble molecule inositoltriphosphate, IP3.
This floats off into the cytoplasm and interacts with
gated ion channels in the endoplasmic reticulum (or
sarcoplasmic reticulum in muscle cells), causing a
rapid release of Ca2þ. The lipid-soluble component
diacylglycerol (DAG) remains at the membrane, but
activates a serine/threonine kinase, protein kinase C
(see phosphorylation section below).
Although the cellular calbindin and ion pumps
rapidly remove Ca2þ from the cytoplasm back into a
storage compartments (such as the endoplasmic retic-
ulum), free Ca2þ interacts with target proteins in the
cytoplasm, inducing a phosphorylation/dephosphor-
ylation cascade, resulting in activated DNA binding
proteins entering the nucleus.
3.1.6.3 Protein phosphorylation
Although phosphorylation of the cytoplasmic sec-
ondary messengers is often a consequence of sec-
ondary activation of cAMP, Ca2þ and DAG, the
principal route for the protein phosphorylation
cascades is from the dimerization of surface protein
kinase receptors, which have bound their ligands.
The tyrosine kinase receptors phosphorylate each
other when ligand binding brings the intracellular
receptor components into close proximity. The
Chapter 3 Clinical cell biology and genetics 99

inner membrane and cytoplasmic targets of these
activated receptor complexes are Ras, protein ki-
nase C and ultimately the MAP (microtabule asso-
ciated protein) kinase, JAK---STAT pathways or
phosphorylation of I-KB causing it to release its
DNA-binding protein nuclear factor KB (NFKB).
These intracellular signalling proteins usually con-
tain conserved noncatalytic regions called SH2 and
SH3 (serc homology regions 2 and 3). The SH2
region binds to phosphorylated tyrosine. The SH3
domain has been implicated in the recruitment of
intermediates which activate Ras proteins. Like G-
proteins, Ras (and its homologous family members
Rho and Rac) switches between an inactive GDP-
binding state and an active GTP-binding state. This
starts a phosphorylation cascade of the MAP kinase,
JAK---STAT protein pathways, which ultimately
activate a DNA-binding protein. This undergoes
a conformational change, enters the nucleus and
initiates transcription of specific genes (see
Figure 3.8).
Lipid soluble ligands, for example steroids, do not
need secondary messengers and their cytoplasmic re-
ceptors, once activated, enter the nucleus as DNA
binding proteins and alter gene expression directly
(see Figure 3.8)
Figure 3.9 Cycle of G-protein activation and inactivation
100 Biomedical sciences

3.1.6.4 Receptors and disease
Receptors ---and indeed the secondary messenger sys-
tems they activate --- are often the target of a drug
therapy. However, illness --- be it a genetic malfunction
of a component or that an infectious agent targets a
receptor/secondary molecular protein --- is most often
the molecular basis of pathology. There is a vast array
of receptor and secondary messenger systems (see
Table 3.1) and G-protein deregulation has been
studied intensively as the molecular pathology
behind not only inborn errors but how/why certain
infections are so harmful: Albright’s hereditary
osteodystrophy or pseudohypoparathyroidism, is
where there is generalized resistance to a variety of
hormones and dysmorphic features. The molecular
cause has been found to be due to a 50% reduction
in the activity of the G-protein subunit which
activates adenylate cyclase in response to hormones
such as PTH, T3 and Gonadotrophins. At the genetic
level this has been found to be due to a germ line
mutation affecting the G-protein alpha subunit ---
Gsa. Similarly for pituitary adenoma, somatic muta-
tions activating the Gsa subunit of G-proteins occur in
about 40% of patients with acromegaly. This leads to
autonomous secretion of GH. In cholera infections it
was found that Vibrio cholerae secretes an exotoxin
which catalyses ADP-ribosylation of an arginine resi-
due on Gsa. This makes the subunit resistant to hydro-
lysis and the second messenger (in this case cAMP)
remains activated and this ultimately leads to the fluid
and electrolyte loss characteristic of the disease. In
Pertussis the bacterial toxin blocks G-protein function.
3.1.7 Cell cycle and apoptosis
Regulation of the cell cycle is complex. Cells in the
quiescent G0 phase (G, gap) of the cycle are stimulated
by the receptor-mediated actions of growth factors (e.g.
EGF, epithelial growth factor; PDGF, platelet-derived
growth factor; IGF, insulin-like growth factor) via intra-
cellular secondmessengers. Stimuli are transmitted to the
nucleus (see below) where they activate transcription
factors and lead to the initiation of DNA synthesis,
followed by mitosis and cell division. Cell cycling is
modified by the cyclin family of proteins that activate
or deactivate proteins involved in DNA replication by
phosphorylation (via kinases and phosphatase domains).
Thus fromG0 the cell moves on to G1 (gap 1) when
the chromosomes are prepared for replication. This is
followed by the synthetic (S) phase, when the 46
chromosomes are duplicated into chromatids, fol-
lowed by another gap phase (G2), which eventually
leads to mitosis (M) (see Figures 3.10 and 3.11).
3.1.8 Programmed cell death(see Figure 3.12)
Necrotic cell death is where some external factor (e.g.
hypoxia, chemical toxins) damages the cell’s physiol-
ogy and results in the disintegration of the cell. Charac-
teristically there is an influx of water and ions, after
Table 3.1 Examples of the variety of receptor/secondarymessenger systems and their classification
Receptor type Examples
Gated ionchannel
Acetyl choline receptor (Nicotinic). GABA and
glycine receptors
G-proteinreceptors
The Gonadotropins, ACTH, GHRH, TSH, a1adrenergic, histamine-1, vasopressin �1,
TRH, substance P, endothelins, IL-8,
Rhodopsin
Phosphorylation/kinase receptors
Insulin, Platelet Derived Growth Factor, IGF-
1, Macrophage-Colony Stimulating Factor,
Nerve Growth Factor, TNF, fas, IFNs, GH,
prolactin, IL2-7
Figure 3.10 Temporal relationship of cyclin (Cyc) andcyclin dependant kinase (Cdk) complex expression duringthe cell cycle. The thick read arrow represents a linearprogression through the cell cycle and the double-headedblack arrows represent the period at which a given Cyc/Cdkcomplex will be expressed. The CycB-Cdk1 complex is alsoknown as the mitosis-promoting factor (MPF). The repeated3D molecular model is of CycA/Cdk2
Chapter 3 Clinical cell biology and genetics 101

which cellular organelles swell and rupture. Cell lysis
induces acute inflammatory responses in vivo owing to
the release of lysosomal enzymes into the extracellular
environment. In apoptosis, physiological cell death
occurs through the deliberate activation of constituent
genes whose function is to cause their own demise.
Apoptotic cell death has characteristic morphological
features:
. chromatin aggregation, with nuclear and cyto-
plasmic condensation into distinct membrane-
bound vesicles which are termed apoptotic bodies. organelles remain intact;. cell ‘blebs’ (which are intact membrane vesicles);. there is no inflammatory response;. cellular ‘blebs’ and remains are phagocytosed by
adjacent cells and macrophages.
This process requires energy (ATP), and several
Ca2þ- and Mg2þ-dependent nuclease systems are
activated which specifically cleave nuclear DNA at
the interhistone residues. An endonuclease destroys
DNA following apoptosis. This involves the enzyme
CASPASE (cysteine-containing aspartase-specific pro-
tease) which activates the CAD (caspase-activated
DNase)/ICAD (inhibitor of CAD) system which can
destroy DNA. It is now recognized that regulated
apoptosis is essential for many life processes from
tissue structure formation in embryogenesis and
wound healing to normal metabolic processes such as
autodestruction of the thickened endometrium to
cause menstruation in a nonconception cycle. In on-
cology it has become clear that chemotherapy and
radiotherapy regimes only work if they can trigger the
Figure 3.11 Diagrammatic representationof the cell cycle.From Kumar and Clark, Clinical Medicine, 6ed 2005� Elsevier
Figure 3.12 Diagrammatic representation of the intrinsic and extrinsic apoptosis pathways and the links between them
102 Biomedical sciences

tumour cells’ own apoptotic pathways. Failure to do so
in resistant tumours can result in the accumulation of
further genetic damage to the surviving cells. Several
factors initiate apoptosis but in general there are two
signalling pathways: the extrinsic apoptotic pathway
triggered by death receptors on the cell surface and the
intrinsic pathway initiated at the mitochondrial level.
Death receptors are all members of the TNF receptor
superfamily and include CD95 (APO-1/Fas), TRAIL
(TNF-related apoptosis ligand)-R1, TRAIL-R2, TNF-
R1, DR3 and DR6.
The extrinsic pathway is important in processes
such as tissue remodelling and induction of immune
selftolerance. Activated receptors with internal death
domain complex multiple pro-caspase 8 molecules
whose autocatalytic activity results in released of the
initiator caspase 8. In turn caspase 8 cleaves pro-
caspases 3 and caspase 3, in combination with the
other effector caspases, activates DNA cleavage, cell
condensation and fragmentation. The intrinsic path-
way centres on the release of cytochrome C from the
mithochondria. Cellular stress, such as growth factor
withdrawal and p53 cell cycle arrest induces the ex-
pression of pro-apoptotic Bcl-2 family of proteins, Bax
and Bak. These form tetrameric complexes, which
imbed into the outer mitochondrial membrane form-
ing permissive pores. Cytochrome C, released from the
mitochondria, binds Apaf1, forms a complex known as
the apoptosome, which then activates an initiator
caspase, in this case, caspase 9. Caspase 9 then activates
the effector caspase, caspase 3. Other proteins released
from damaged mitochondria, Smac/DIABLO and
Omi/HtrA2, counteract the effect of IAPs (inhibitor
of apoptosis proteins), which normally bind and pre-
vent activation of procaspase 3. Antiapoptotic Bcl-2
protein, when incorporated as a member of the Bak/
Bax pore complex, renders the mitochondrial pore
nonpermissive to the release of cytochrome C and the
anti IAPs.
There is an amplification link between the extrinsic
and intrinsic apoptotic pathways in that caspase 8
cleaves a Bcl-2 family member, tBid, which then aids
formation of the Bcl-2/Bax/Bak pore complexes. If this
complex is predominately formed from proapoptotic
members of the Bcl-2 family of proteins then apopto-
some/caspase 9, along with mitochondrial anti-IAPs,
amplifies the apoptotic activation of effector caspases
3. Conversely, over expression of antiapoptotic Bcl-2
will not only inhibit intrinsic, but also dampen down
extrinsic apoptotic signalling.
Most cells rely on a constant supply of survival
signals without which they will undergo apoptosis.
Neighbouring cells and theextracellularmatrixprovide
these signals. Cancer, autoimmunity and some viral
illnesses are associated with the inhibition of apoptosis
and increased cell survival. Metastatic tumour cells
have circumvented the normal environmental cues for
survival and can survive in foreign environments.
3.2 Genetics
3.2.1 Human chromosomes
The nucleus of each diploid cell contains 6� 109 bp of
DNA in long molecules called chromosomes. Chro-
mosomes are massive structures containing one linear
molecule of DNA that is wound around histone pro-
teins into small units called nucleosomes, and these are
further wound to make up the structure of the chro-
mosome itself (see Figure 3.13). Diploid human cells
have 46 chromosomes, 23 inherited from each parent;
thus there are 23 ‘homologous’ pairs of chromosomes
(22 pairs of ‘autosomes’ and two ‘sex chromosomes’).
The sex chromosomes, called X and Y, are not homol-
ogous but are different in size and shape.Males have an
X and a Y chromosome; females have two X chromo-
somes (see Figure 3.14). (Primary male sexual char-
acteristics are determined by the SRY gene --- sex
determining region, Y chromosome.)
The chromosomes can be classified according to
their size and shape, the largest being chromosome 1.
The constriction in the chromosome is the centromere,
which can be in the middle of the chromosome (meta-
centric) or at one extreme end (acrocentric). The
centromere divides the chromosome into a short arm
and a long arm, which are referred to as the p arm and
the q arm respectively (see Figure 3.15). In addition,
chromosomes can be stained when they are in the
metaphase stage of the cell cycle and are very con-
densed. The stain gives a different pattern of light and
dark bands that is diagnostic for each chromosome.
Each band is given a number, and gene mapping
techniques allow genes to be positioned within a band
within an arm of a chromosome. For example, the
CFTR gene (in which a defect gives rise to cystic
fibrosis) maps to 7q21; that is, on chromosome 7 in
the long arm in band 21.
During cell division (mitosis), each chromosome
divides into two so that each daughter nucleus has the
Chapter 3 Clinical cell biology and genetics 103

same number of chromosomes as its parent cell.
During gametogenesis, however, the number of chro-
mosomes is halved bymeiosis, so that after conception
the number of chromosomes remains the same and is
not doubled. In the female, each ovum contains one or
other X chromosome but, in the male, the sperm bears
either an X or a Y chromosome.
Chromosomes can only be seen easily in actively
dividing cells. Typically, lymphocytes from the periph-
eral blood are stimulated to divide and are processed
to allow the chromosomes to be examined. Cells
from other tissues can also be used --- for example
fetal epithelia in amniotic fluid, placental cells from
chorionic villus sampling, bone marrow and skin.
3.2.1.1 The X chromosome and inactivation
Although female chromosomes are XX, females do not
have two doses of X-linked genes (compared with just
one dose for a male XY), because of the phenomenon
of X inactivation or Lyonization (after its discoverer,
Dr Mary Lyon). In this process, one of the two X
chromosomes in the cells of females becomes tran-
scriptionally inactive, so the cell has only one dose of
the X-linked genes. Inactivation is random and can
affect either X chromosome.
3.2.1.2 Telomeres and immortality
The ends of chromosomes, telomeres (see Figure 3.15),
do not contain genes but many repeats of a hexameric
sequence TTAGGG. Replication of linear chromo-
somes starts at coding sites (origins of replication)
within the main body of chromosomes and not at the
two extreme ends. The extreme ends are therefore
susceptible to single-stranded DNA degradation back
to double-stranded DNA. Thus cellular ageing can be
measured as a genetic consequence of multiple rounds
of replication with consequential telomere shortening.
This leads to chromosome instability and cell death.
Stem cells have longer telomeres than their termi-
nally differentiated daughters. However, germ cells
replicate without shortening of their telomeres. This
is because they express an enzyme called telomerase,
which protects against telomere shortening by acting as
a template primer at the extreme ends of the chromo-
somes.Most somatic cells (unlike germ and embryonic
cells) switch off the activity of telomerase after birth
and die as a result of apoptosis. Many cancer cells,
however, reactivate telomerase, contributing to their
Figure 3.13 G banded chromosome spread
Figure 3.14 46 chromosomes, 44 in 22 pairs (autosomes)and two sex chromosomes
104 Biomedical sciences
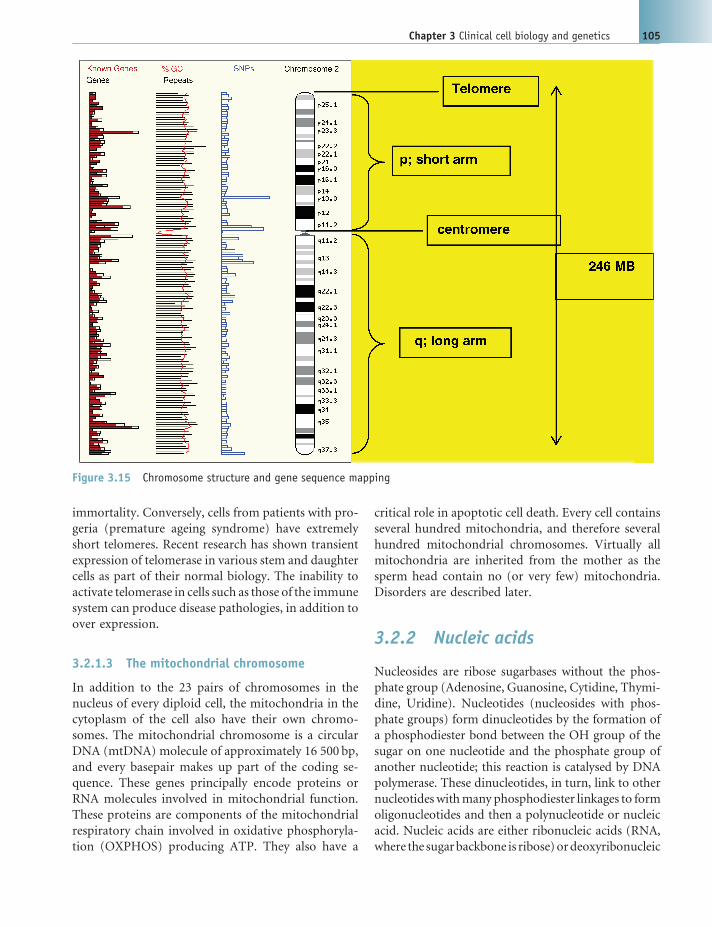
immortality. Conversely, cells from patients with pro-
geria (premature ageing syndrome) have extremely
short telomeres. Recent research has shown transient
expression of telomerase in various stem and daughter
cells as part of their normal biology. The inability to
activate telomerase in cells such as those of the immune
system can produce disease pathologies, in addition to
over expression.
3.2.1.3 The mitochondrial chromosome
In addition to the 23 pairs of chromosomes in the
nucleus of every diploid cell, the mitochondria in the
cytoplasm of the cell also have their own chromo-
somes. The mitochondrial chromosome is a circular
DNA (mtDNA) molecule of approximately 16 500 bp,
and every basepair makes up part of the coding se-
quence. These genes principally encode proteins or
RNA molecules involved in mitochondrial function.
These proteins are components of the mitochondrial
respiratory chain involved in oxidative phosphoryla-
tion (OXPHOS) producing ATP. They also have a
critical role in apoptotic cell death. Every cell contains
several hundred mitochondria, and therefore several
hundred mitochondrial chromosomes. Virtually all
mitochondria are inherited from the mother as the
sperm head contain no (or very few) mitochondria.
Disorders are described later.
3.2.2 Nucleic acids
Nucleosides are ribose sugarbases without the phos-
phate group (Adenosine, Guanosine, Cytidine, Thymi-
dine, Uridine). Nucleotides (nucleosides with phos-
phate groups) form dinucleotides by the formation of
a phosphodiester bond between the OH group of the
sugar on one nucleotide and the phosphate group of
another nucleotide; this reaction is catalysed by DNA
polymerase. These dinucleotides, in turn, link to other
nucleotideswithmany phosphodiester linkages to form
oligonucleotides and then a polynucleotide or nucleic
acid. Nucleic acids are either ribonucleic acids (RNA,
where the sugarbackbone is ribose)ordeoxyribonucleic
Figure 3.15 Chromosome structure and gene sequence mapping
Chapter 3 Clinical cell biology and genetics 105

acids (DNA, where the sugar backbone is deoxyribose).
RNA also differs from DNA in that Uracil replaces
Thymine and generally RNA is single-stranded where
DNA is double-stranded (see Figure 3.16(a)).
Watson and Crick first described the double-
stranded helix (Nature, 1953) based on their earlier
work, the work of Erwin Chargaff (complementary
base paring) and an X-ray diffraction image produced
by Maurice Wilkins and Rosalind Franklin. The DNA
model has antiparallel strands made of a sugar phos-
phate backbone with a nitrogenous base core of both
purines and pyrimidines --- which pair in a comple-
mentary fashion A with T, C with G, that is purines
always pair with pyrimidines. DNA has a uniform
diameter (20 A�) with a double right-handed twist
where each full twist is 34 A�comprising 10 base pairs
(3.4 A�between bases).
DNA is packaged and stored as chromatin in the
nucleus of eukaryotic cells. Chromosomes are only
visible during cell division when the chromatin con-
denses during metaphase. Chromatin is therefore very
tightly packaged DNA, coiled, wrapped and looped,
then coiled again into chromosomes (see Figure 3.16).
We therefore consider DNA packaging in three levels:
DNA sequence structure, nucleosome structure and
chromatin structure.
Each nucleosome is formed from a histone protein
octamerwrapped twice by a 140 bp section ofDNAand
Figure 3.16 DNA and its structural relationship to human chromosomes. (a) A polynucleotide strand with theposition of the nucleic bases indicated. Individual nucleotides form a polymer linked via the deoxyribose sugars. The 50
carbon of the heterocyclic sugar structure links to the 30 carbon of the next via a phosphate molecule forming the sugar---phosphate backbone of the nucleic acid. The 50---30 linkage gives an orientation to a sequence of DNA. (b) Double-strandedDNA. The two strands of DNA are held together by hydrogen bonds between the bases. As T always pairs with A, and G with C,there are only four possible pairs of nucleotides --- TA, AT, GC and CG. The orientation of the complementary single strands ofDNA (ssDNA) is always opposite; i.e. one will be 50---30 whilst the partner will be 30---50. CG base-pairs form three hydrogenbonds whilst the AT bonds form only two. Thus, CG bonds are stronger than AT bonds, which affects the biophysical nature ofdifferent sequences of DNA. In a random sequence of DNA with equal proportions of CG and AT base-pairs, complementarystrands form a helical 3D structure. This helix will have major and minor grooves and a complete turn of the helix will contain12 basepairs. These grooves are structurally important, as DNA-binding proteins predominantly interact with the majorgrooves. DNA sequences rich in repetitive CG basepairs distort the helical shape whereby the minor grooves become moreequal in size to the major grooves, giving a Z-like structure. These CG-rich regions are sites were DNA-binding proteins arelikely to bind. (c) Supercoiling of DNA. In humans, and other higher organisms, the large stretches of helical DNA are coiledto form nucleosomes and further condensed into the chromosomes that can be seen at metaphase. DNA is first packaged bywinding around nuclear proteins --- histones --- every 180 bp. This can then be coiled and supercoiled to compact nucleosomesand eventually visible chromosomes. (d) At the end of the metaphase DNA replication will result in a twin chromosomejoined at the centromere. This picture shows the chromosome, its relationship to supercoiling, and the positionsof structural regions: centromeres, telomeres and sites where the double chromosome can split. From Kumar and Clark,Clinical Medicine, 6ed 2005 � Elsevier
106 Biomedical sciences

‘locked’ in place by another histone protein H1. Each
nucleosome is connected to the next by a short section
of Linker DNA. Six nuclesomes spiral together to form
one cross section of the nucleosome solenoid, where
each set of six nucleosomes stack against the next in a
spiral. Approximately half the mass of nuclear chro-
matin is comprised of histones. These proteins are not
just structural but are also involved in transcription.
The histone octamer is comprised of two of each
histones H2A, H2B, H3 and H4.
Collectively chromatin is contained in the nucleus,
comprises DNA and proteins (histones and topoi-
somerases). The nucleosome solenoid loops back on
itself and is stabilized by the topoisomerases which also
play a role in DNA replication and transcription. This
whole structure then twists to form the spiral radial
loop model which again twists to form the ‘arm’ of the
chromosome (see Figure 3.16(c)).
3.2.2.1 The central dogma
Genetic information is passed only oneway fromDNA,
to RNA to protein, that is DNA is transcribed to RNA,
which in turn is translated to protein. The discovery of
retroviruses which made DNA from an RNA template
with reverse transcriptase challenged the first part of
this one way genetic dogma. The next challenge is to see
if protein (perhaps prions) challenges the final argu-
ment of this classic dogma.
3.2.3 DNA replication
When a cell undergoes cell division the cellular mate-
rial effectively divides in two, but the nuclear comple-
ment of the daughter cells remains diploid. In order to
achieve this the cell must generate an additional set of
chromosomes and effectively double its DNA. This
happens during the S phase of the cell cycle. The
human genome has over 3 000 000 000 000 basepairs
(bp) incorporating 20---25 000 genes, so DNA replica-
tion is a huge and sensitive task but it is essentially the
same in prokaryotes and eukaryotes.
One of the last lines in the famousWatson andCrick
paper hypothesized that the nature of the structure of
DNA, with its complementary basepairing and anti-
parallel strands, suggested a model for replication. The
DNA unwinds and the two strands separate, each
strand functioning as a template for the synthesis of
a complementary copy strand. What results, therefore,
are two daughter double-stranded DNA helices each
with one old strand and one new synthesized strand.
This model of DNA replication is therefore called
semiconservative (see Figure 3.17(a)).
3.2.3.1 DNA polymerases
The DNA replication process is catalysed by enzymes;
these are DNA polymerase I and DNA polymerase III.
As always the situation is much more complex and
other DNA polymerases exist and are associated with
DNA repair and other more specific functions.
DNA polymerases require magnesium ion cofac-
tors and dNTPs (the four deoxyribonucleotide
triphosphates --- dATP, dCTP, dGTP and dTTP) to
make the new strand. The polymerases also need a
template DNA strand to copy and a primer oligonu-
cleotide which binds DNA at the start of the replica-
tion site and provides polymerase with a recognizable
place to start adding new nucleotides.
DNA polymerase I and III both have a 50~30 poly-merase activity meaning they add new dNTPs one by
one onto a free 30 end starting with that of the primer.
Deoxyribonucleotides are added at several hundred
per second so at rates such as these mistakes can occur
(about 1 in 100 000 000 nucleotides added) and both
enzymes have the ability to ‘proof read’ what they have
done and go back to correct the mistake, this is called
30---50exonuclease activity. DNA polymerase I can also
do this in the 50---30 direction.
3.2.3.2 Enzymes of replication and thereplication fork
Other enzymes are also involved in the replication
process: DNA Polymerases -I, II, III, IV and V (they
essentially catalyse phosphodiester bond formation),
Helicase, Topoisomerase (I, II --- Girase), Primase,
Ligase and telomerase (see Figure 3.17(b)).
Polymerase I is slow DNA polymerase but can
remove nucleotides as well as synthesize (exonuclease
activity). It is not essential for DNA synthesis but
essential for faithful replication (involved more in
repair and bacteria deficient in Pol I are grossly mu-
tated). DNA polymerase II (along with IV and V) are
responsible for repair of DNA damage caused by
external influences. DNA polymerase III despite being
found last (in the original three enzymes discovered) is
the largest. It is a very complex holoenzyme which
catalyses DNA synthesis in a dimeric form.
Chapter 3 Clinical cell biology and genetics 107

There are over 20 helicase enzymes and DnaA,
DnaB and DnaC are essential. DnaB in association
with primase is particularly important for DNA
replication and is involved in helical unwinding of
double-stranded (ds)DNA into single-standed (ss)
DNA. Primases termed ssBPs stabilize the replication
bubble.
Topoisomerases are another complex group of en-
zymes which counteract the effect of unwinding DNA
which causes kinks; this is called supercoiling in circu-
lar DNA. Topoisomerase II (girase) breaks phospho-
diester bonds in either one or both strands of the helix
to relax the ‘tension’ and permit linear strands of DNA
to be exposed.
Primases insert the primer RIBOnucleotides
and are therefore essentially an RNA polymerase but
unlike DNA polymerase it does not require a 30 end to
start adding its nucleotides. It adds a short RNA
sequence (� 10NTPs) which is called a primer and is
inserted as DnaB (helicase) unwinds DNA at the
replication fork.
Telomerase work in the 30~50 and therefore can
build nucleotides into the exposed ends of replication,
for example at the ends of Eukaryotic chromosomes
Figure 3.17 DNA synthesis and the interplay of enzymes/protein necessary for replication DNAhas antiparalell strands eacharranged in an opposite direction (one 50-30 and the other strand 30---50). DNA polymerase III operates in a 50---30 directiononly and can therefore only continuously synthesize a new 30---50 strand, this is called the leading strand. A problem occurswhere the template runs 50---30 and DNA synthesis has to be discontinuous inserting short pieces of new DNA into what iscalled the lagging strand. These short strands of new DNA are called Okazaki fragments (b). This ‘Y’ shaped region betweenleading and lagging strands is called the replication fork
108 Biomedical sciences

which are linear and not circular packages of DNA as
seen in bacteria and viruses.
3.2.4 Transcription
Transcription produces an RNA copy of the template
DNA, this copy is said to be complementary. Tran-
scription occurs in three stages: initiation, elongation
and termination. The purpose of transcription is to
carry the coded message contained in the DNA to the
site of translation so that a protein can be synthesized.
In prokaryotes this process occurs in the cytoplasm but
in compartmentalized eukaryotes transcription occurs
in the nucleus and the transcribed RNA is transported
to the cytoplasm for translation. In eukaryotes the
process has much more complex regulation and con-
trol and there are three RNA polymerases, each one
responsible for transcribing different RNA molecules:
. RNA Polymerase I is found in the nucleoli, tran-
scribes rRNAs (ribosomal RNA) complex termed
18S, 5.8S and 28S (reflecting their respective molec-
ular masses).. RNA Polymerase II is found in the nucleoplasm,
transcribes hnRNAs (heterogeneous nuclear RNAs
--- mRNA precursors) and snRNAs (small nuclear
RNAs).. RNAPolymerase III is also found in the nucleoplasm
and transcribes 5S rRNA, tRNA (transfer RNA), viral
RNAs and possibly other small cellular RNAs.
In prokaryotes RNApolymerase is composed of five
subunits (four subunits in the core, plus s). However,
in eukaryotes the arrangement is much more complex
involving 12 subunits (in RNA Polymerase II) each
with specific functions, some of which are unique to
the specific polymerase and some which are common
to all three.
Where elongation and termination are essentially
similar between prokaryotes and eukaryotes, initiation
is much more complex in eukaryotes occurring
through interaction and binding of an entire RNA
polymerase holoenzyme complex with additional
bound transcription factors and is influenced by en-
hancers and/or silencers. The promoter sequences
are specific to each polymerase where: Class I promo-
ters are specific to RNA Polymerase I, Class II pro-
moters are specific to RNA Polymerase II, Class III
promoters are specific to RNA Polymerase III.
In the Class II Preinitiation complexes there are the
12 subunit RNA Polymerase II, 6 General Transcrip-
tion factors (TFIIA, TFIIB, TFIID, TFIIE, TFIIF,
TFIIH) where TFIID contains TATA box Binding
Protein (TBP) and is common to all classes and at
least eight TBP Associated Factors TAFIIs which are
specific to Class II preinitiation complexes.
Transcription can only occur when promoters are
bound by transcription factors and RNA polymerase
subunits. However, the rate of transcription can be
affected further by enhancers and silencers.
Enhancers are regions involved in stimulation of tran-
scription whereas silencers are regions involved in
reducing the rate of transcription. They are common
in Class II genes and are not strictly part of the
promoter. Enhancers and silencers are generally
tissue specific relying on tissue specific DNA binding
proteins and can significantly affect transcription.
In each case a further DNA binding protein (activator
protein) is required to recognize the enhancer/
silencer to elicit its effect on the RNA polymerase
transcription rate (see Figure 3.18).
3.2.4.1 Insulators
Aproblemof transcription is howdo you stop theRNA
polymerase running on through the chromosome
activating the promoter of some other gene in the
same region of the chromosome, or indeed DNA
binding proteins like enhancers turning on the pro-
moters of genes located thousands of basepairs away?
One answer is insulator DNA binding proteins/com-
plexes binding to insulator sequences spaced between
genes in the genome.
Insulator regions are located between the enhancer
(s) and promoter or silencer(s) and promoter of
adjacent genes or clusters of adjacent genes and com-
prise moderately long stretches of DNA (as few as 42
base pairs may do the trick).
Their function is to prevent a gene from being
influenced by the activation (or repression) of its
neighbours. For example, the enhancer for the pro-
moter of the gene for the delta chain of the gamma/
delta T-cell receptor for antigen (TCR) is located close
to the promoter for the alpha chain of the alpha/beta
TCR (on chromosome 14 in humans). A T-cell must
choose between one or the other (see Chapter 7,
Section 7.15). There is an insulator between the alpha
gene promoter and the delta gene promoter that en-
sures that activation of one does not spread over to the
Chapter 3 Clinical cell biology and genetics 109

other (see Figure 3.19). All insulators discovered so far
in vertebrates work only when bound by a protein
designated CTCF (‘CCCTC binding factor’, named for
a nucleotide sequence found in all the insulators
identified).
3.2.5 Posttranscriptionalmodifications
During transcription modifications are made almost
simultaneously to the mRNA and include: capping,
polyadenylation and splicing. These changes result in
mRNA and in most cases give rise to termination of
transcription and result in transportation of mRNA to
the cytoplasm for translation (see Figure 3.20).
Capping (or G capping) occurs at the 50 end of the
RNA and essentially involves the addition of a modi-
fiedGTP. RNA triphosphatase removes terminal phos-
phate and guanylyl transferase adds capping GMP
(from a dephosphorylated GTP molecule). Another
enzyme, methyl transferase, methylates the guanosine
base and also the base of the penultimate nucleotide in
the sequence. All of this occurs before the transcript is
30 bases long. Capping essentially has four functions:
. ensures proper splicing;
. facilitates transport;
Figure 3.18 Diagrammatic representation of the transcription of a gene sequence to mRNA initiated by a DNA bindingprotein facilitating the assembly of RNA Polymerase II complex at a close by TATA recognition sequence to which the RNApolymerase complex transcription factor TFIID binds
Figure 3.19 Diagrammatic representation of a DNA bind-ing protein recognition sequence for an insulator (marked inred), positioned between adjacent promoter regions for thetranscription of T-cell receptor subunit genes
110 Biomedical sciences

. protects from ribonuclease degradation;
. enhances translation through facilitation of ribo-
somal binding.
Polyadenylation (Poly A tail) is literally the
addition of a long chain of adenosine nucleotides at
the 30 end of the transcribedRNA. The polyadenylationsite is marked by a AAUAAA sequence in the
RNA transcript which is closely followed by subse-
quent GU then U rich regions. Cleavage factors and
Poly A polymerase are involved in the addition of
100---300 adenosine nucleotides and marks the end of
transcription. Polyadenylation essentially has four
functions:
. transcription termination;
. ensures proper splicing;
. provides RNA stability;
. involved in transport to cytoplasm.
Splicing-DNA includes coding (exons) and non-
coding regions (introns). Noncoding regions can be
repetitive nonsense regions between and within genes
as well as regions involved in transcription but not
required for translation. These introns are therefore
removed in the process of splicing. Small nuclear
ribonuclear proteins (snRNPs, or Snurps) bind con-
sensus sequences (specific sequences) in and around
the boundary between introns and exons and through
the formation of a splicosome ‘cuts’ out the intron and
rejoins the two exons together. The excised intron is
degraded and recycled and the snRNPs release and
return to splice another intron.
The 30 end of an mRNA defined by the sequence
AAUAAA acts as a cleavage signal for an endonuclease,
which cleaves the growing transcript about 20 bp
downstream from the signal. The 30 end is further
processed by a Poly A polymerase which adds about
250 adenosine residues to the 30 end, forming a Poly A
Figure 3.20 Transcription and translation (DNA to RNA to protein). RNA polymerase creates an RNA copy of the DNA genesequence. This primary transcript is processed: capping of the 50 free end of the mRNA precursor involves the addition of aninverted guanine residue to the 50 terminal which is subsequently methylated, forming a 7-methylguanosine residue. (Thecorresponding position on the gene is thus called the CAP site.)
Chapter 3 Clinical cell biology and genetics 111

tail (polyadenylation). Without these additions, the
mRNA sequence will be rapidly degraded 50---30 but theinverted cap nucleotide prevents nuclease attachment.
The activity of specific 50 mRNA nucleases to re-
move the cap is further regulated by the Poly A tail
which must first be removed by other degradation
enzymes. Splicing out of the introns then produces the
mature mRNA (prokaryote genes do not contain in-
trons). This then moves out of the nucleus via nuclear
pores and aligns on endoplasmic reticulum.
Ribosomal subunits assembleon themRNAmoving
along 50---30. With the transport of amino acids to their
active sitesby specific tRNAs, thecomplex translates the
code, producing the peptide sequence. Once formed,
the peptide is released into the cytoplasmic reticulum
for correct folding (fromChapter 3, Iles,R.K. inKumar
Clark Clinical medicine, 6th edn, Figure 3.9)
3.2.6 Translation
Translation is mRNA directed polypeptide (protein)
synthesis. Once complete, the transcribed mRNA exits
the nucleus through pores in the nuclear membrane
and is directed towards the site of translation, the
endoplasmic reticulum and recruits ribosomes.
Ribosomes are comprised of proteins and RNA
(ribosomal RNA, rRNA) arranged in two subunits
(large and small). In prokaryotes these are 50s and
30s ribosomal subunits (¼ 70s Ribosome) and in eu-
karyotes these are the 60s and 40s ribosomal subunits
(¼ 80s Ribosome).
The mRNA is bound between the large and small
subunit of the ribosome and translated by transfer
RNA (tRNA). Each ribosome has four binding sites
(in addition to the mRNA binding site) EPAT (or
TAPE in reverse): transfer site (T) (tRNA lands here),
amino site (A) (tRNA anticodon binds codon), poly-
peptide site (P) (amino acid tags onto peptide) and exit
site (E) (tRNA releases amino acid, exits and returns to
cytosol) (see Figure 3.21).
Each of the three letters in the mRNA sequence
is called a codon and is recognized and bound by
the anticodon on the anticodon loop of tRNA (see
Figure 3.21). Each tRNA is specific for each amino
acid, and through codon/anticodon recognition
brings the amino acids to the ER/ribosome complex
and presents them to the previous amino acid where
they form a peptide bond and the next unit in the
polypeptide chain. Thus, the polypeptide is a direct
‘translation’ of the sequence in the mRNA facilitated
by the unique properties of tRNA. This process can
be divided into three stages: initiation, elongation
and termination.
Initiation: Small ribosomal subunit binds an upstream
recognition sequence on the mRNA. A methionine
charged tRNA binds AUG start codon forming the
Figure 3.21 Ribosomal assembly and translation of mRNA
112 Biomedical sciences

initiation complex. The large subunit joins with the
first tRNA in the P site.
Elongation: Another tRNA binds the codon in the next
position situated in the A site of the ribosome. A
peptide bond forms between the original methio-
nine and the new amino acid as itmoves to the P site.
The free tRNA is released from the P site to the E site
as the ribosome moves along mRNA.
Termination: Release Factor (a complex mRNA bind-
ing protein) binds the stop codon and frees tRNA
from the P site to the E site. The release factor
therefore disconnects the peptide from the ribosome
and then itself dissociates from the mRNA.
Once the polypeptide is translated it can undergo
any one of a number of posttranslational modifica-
tions. It is not free circulating and translation is
accompanied by the passage of the new peptide
chain in to the luminal spaceof theER (see Figure 3.22).
In this preprotein stage the peptides often have signal
recognition particles (SRPs) associated with them that
act as escorts to direct the peptide to organelles for
further processing via organelle docking channels or
SNARES (signal and recognition elements).
3.2.6.1 Protein modifications
There aremany types of proteinmodification and after
folding into the correct shape posttranslational modi-
fication occurs first in the ER and then the Golgi. The
three most common are:
. Proteolysis or protein cleavage which forms individ-
ual smaller proteins or subunits of the same protein,
for example insulin.. Glycosylation or addition of sugar residues which
forms glycoproteins such as membrane receptors or
hormones, for example LH.. Phosphorylation or addition of phosphate groups by
the action of kinases. Amino acids that can be
phosphorylated include Serine, Threonine and
Tyrosine. Many enzymes and growth factors can
be activated in this way.
Other posttranslational modifications include:
Methylation, Sulphation, Prenylation, Acetylation and
vitamin dependent Hydroxylation/Carboxylation.
3.2.7 Chromatin and regulationof gene expression
Chromatin structure is known to have a major impact
on levels of transcription. In eukaryotes, DNA typically
exists as a repeating array of nucleosomes in which
146 bp of DNA are wound around a histone octamer.
Studies have demonstrated that nucleosomal DNA is
generally repressive to transcription in this way, nu-
cleosome structure and DNA-histone interactions
usually make the regulatory regions of genes unavail-
able for the binding of the transcriptional DNA bind-
ing proteins and other factors.
Figure 3.22 Diagrammatic representation of nascent peptide chain being synthesized into the lumen of the endoplasmicreticulum
Chapter 3 Clinical cell biology and genetics 113

Several enzymes and protein complexes are now
known to bring about changes in the chemical inter-
actions of chromatin, with resultant effects on gene
expression. One class of complexes alter the DNA
packaging (remodel chromatin) in an ATP-dependent
manner; these include the Swi---Snf complex. Another
class of chromatin-altering factors acts by covalently
modifying histone proteins. These modifications can
include phosphorylation, ubiquitination, ADP-ribo-
sylation and methylation, but the best-characterized
mechanism is acetylation, catalysed by histone acetyl-
transferase (HAT) enzymes.
HATs function enzymatically by transferring an
acetyl group from acetyl-coenzyme A (acetyl-CoA) to
the e-amino group of exposed lysine side chains within
a histone’s basic N-terminal tail region. Within a
histone octamer, these regions extend out from the
associated globular domains, and in the context of a
nucleosome, they are believed to bind the DNA
through charge interactions (positively charged his-
tone tails associated with negatively charged DNA) or
mediate interactions between nucleosomes (Fig-
ure 3.23). Lysine acetylation, which neutralizes part
of a tail region’s positive charge, is postulated to
weaken histone-DNA or nucleosome---nucleosome
interactions and/or signal a conformational change,
thereby destabilizing nucleosome structure or arrange-
ment and giving nuclear transcription factors access to
a genetic locus. Thus, acetylated chromatin has long
been associated with states of transcriptional activa-
tion. Interestingly, certain HATs have also been shown
to acetylate lysine residues specifically within tran-
scription-related proteins not just histones.
Histone acetylation is a reversible process, and
deacetylase tends to correlate with repression of gene
expression. Two opposing regulatory processes work
to bring about appropriate levels of transcription.
Indeed, some of the histone deacetylases (HDACs)
and the proteins with which they associate were
previously known as DNA-binding repressors or
corepressors.
HAT activities have been isolated and partially
characterized (see Table 3.2). Each of these enzymes
generally belongs to one of two categories: type A,
located in the nucleus, or type B, located in the cyto-
plasm. Recent studies indicate that someHATproteins
may function in multiple complexes or locations and
thus not precisely fit these historical classifications.
Nevertheless, B-type HATs are believed to have some-
what of a housekeeping role in the cell, acetylating
newly synthesized free histones in the cytoplasm for
transport into the nucleus, where they may be deace-
tylated and incorporated into chromatin. The A-type
HATs, on the other hand, acetylate nucleosomal
histones within nuclear chromatin.
3.2.7.1 Euchromatin versus heterochromatin
The density of the chromatin that makes up each
chromosome (i.e. how tightly it is packed) varies along
the length of the chromosome. Dense regions are called
heterochromatin, less dense regions are called euchro-
matin. Heterochromatin is found in parts of the chro-
mosome where there are few or no genes, such as
centromeres and telomeres. These areas are greatly
enriched with transposons and other ‘junk’ DNA
replicated late in the S phase of the cell cycle and have
reduced crossing over in meiosis.
Genes present in heterochromatin are generally
inactive; that is, not transcribed and show increased
methylation of the cytosines in CpG islands of the
DNA, decreased acetylation of histones and increased
methylation of lysine-9 in histone H3, which
now provides a binding site for heterochromatin pro-
tein 1 (HP1), which blocks access by transcription
factors.
Euchromatin is found in parts of the chromosome
that contain many genes and is loosely-packed
in loops of 30 nm fibres. These are separated from
adjacent heterochromatin by insulators. The loops
are often found near the nuclear pore complexes
Figure 3.23 Histone acetylation and deacetylation of thelysine residue. Acetylation of the lysine residues at the Nterminus of histone proteins removes positive charges,thereby reducing the affinity between histones and DNA
114 Biomedical sciences

Table3.2
Summaryofknownandputative
HATs.H
istones
thataretheprimaryinvitrosubstratesfora
given
HATarebold;otherhistones
listed
areacetylated
weakly
orin
asecondarymanner
HAT
Organ
ismsknown
tocontain
theHAT
Knowntran
scription-
relatedfunctions/effects
HATactivity
dem
onstrated
invitro
Histonespecificity
ofrecombinan
ten
zymein
vitro
KnownnativeHATcomplexesan
dnucleo
somal
histonespecificities
invitro
GNATsuperfam
ily
Hat1
Various(yeast
tohumans)
None(histonedeposition-related
B-typeHAT)
Yes
H4
YeastHAT-B,HAT-A3(nonucleosome
acetylation)
Gcn5
Various(yeast
tohumans)
Coactivator(adaptor)
Yes
H3/H
4YeastADA,SA
GA(H3/H
2B);human
GCN
5complex,
STAGA,TFTC
(H3)
PCA
FHumans,mice
Coactivator
Yes
H3/H
4Human
PCA
Fcomplex(H3/w
eakH4)
Elp3
Yeast
Transcriptelongation
Yes
ND*
Elongator,polymeraseII
holoenzyme
(H3/w
eakH4)
Hpa2
Yeast
Unknown
Yes
H3/H
4
MYSTfamily
Sas2
Yeast
Silencing
ND
Sas3
Yeast
Silencing
Yes
H3/H
4/H
2A
NuA3c
(H3)
Esa1
Yeast
Cellcycleprogression
Yes
H4/H
3/H
2A
NuA4(H
4/H
2A)
MOF
Drosophila
Dosagecompensation
Yes
H4/H
3/H
2A
MSL
complex(H
4)
Tip60
Humans
HIV
Tatinteraction
Yes
H4/H
3/H
2A
Tip60complex
MOZ
Humans
Leukemogenesis,uponchromosomal
translocation
ND
MORF
Humans
Unknown(stronghomologyto
MOZ)
Yes
H4/H
3/H
2A
HBO1
Humans
ORCinteraction
Yes*
ND*
HBO1complex
p300/CBP
Variousmulticellular
Global
coactivator
Yes
H2A/H
2B/H
3/H
4
Nuclearreceptor
coactivators
SRC-1
Humans,mice
Nuclearreceptorcoactivators
(transcriptionalrespon
seto
horm
one
sign
als)
Yes
H3/H
4
ACTR
Humans,mice
Yes
H3/H
4
TIF2
Humans,mice
ND
TAF II250
Various(yeast
tohumans)
TBP-associated
factor
Yes
H3/H
4TFIID
TFIIIC
RNApolymeraseIIItranscription
initiation
TFIIIC
(H2A/H
3/H
4)
TFIIIC220
Humans
Yes*
ND
TFIIIC110
Humans
Yes
ND
TFIIIC90
Humans
Yes
H3
Chapter 3 Clinical cell biology and genetics 115

(see Figure 3.24). This would seem to make sense
making it easier for the gene transcripts to get to the
cytosol, but there is evidence that as gene transcription
proceeds, the active DNA actually moves into the
interior of the nucleus. The genes in euchromatin are
active and thus show decreased methylation of the
cytosines in CpG islands of the DNA, increased acety-
lation of histones and decreased methylation of lysine-
9 in histone H3.
3.3 Human geneticdisorders
The spectrum of inherited or congenital genetic dis-
orders can be classified as the chromosomal disorders,
including mitochondrial chromosome disorders, the
Mendelian and sex-linked single-gene disorders, a
variety of nonMendelian disorders and the multifac-
torial and polygenic disorders (Table 3.3). All are a
Figure 3.24 Diagrammatic representation of the arrange-ment of euchromatin and heterochromatin may be organizedduring interphase in a vertebrate cell
Table 3.3 Although individual genetic diseases are rare regional variations are enormous --- the incidence of Downsyndrome varying from 1/1000 to 1/100 worldwide. Collectively they comprise over 15 500 recognized genetic disordersThe global prevalence of all single gene diseases at birth is approximately 10/1000
Genetic disease Congenital malformation
0.5% of all newborns have a chromosomal abnormality 3---5% of all births result in congenital malformations
7% of all stillborns have a chromosomal abnormality
20---30% of all infant deaths are due to genetic disorders 30---50% of postneonatal deaths are due to congenital
malformations
11% of paediatric hospital admissions are for children
with genetic disorders
18% of paediatric hospital admissions are for children with
congenital malformations
12% of adult hospital admissions are for genetic causes
15% of all cancers have an inherited susceptibility
10% of the adult population chronic diseases (heart,
diabetes, arthritis) have a significant genetic component
European incidences per 1000 births
Single gene disorders: 10 Congenital malformations: 31
Dominant 7.0 Genetically determined 0.6
Recessive 1.66 Multifactorial 30
X-linked 1.33 Nongenetic �0.4
Chromosomal disorders: 3.5
Autosomes 1.69
Sex chromosomes 1.80
ahttp://www.emro.who.int/publications/TechnicalPublications/Genetics/Part1-Ch1-Frequency.htm
116 Biomedical sciences

result of a mutation in the genetic code. This may be a
change of a single basepair of a gene, resulting in
functional change in the product protein (e.g. thalas-
saemia) or gross rearrangement of the gene within a
genome (e.g. chronic myeloid leukemia). These muta-
tions can be congenital (inherited at birth) or somatic
(arising during a person’s life). The latter are respon-
sible for the collective disease known as cancer, and the
principles underlying Mendelian inheritance act in a
similar manner to dominant and recessive traits. Both
gross chromosomal and point mutations occur in
somatic genetic disease.
3.3.1 Chromosomal disorders
Chromosomal abnormalities are muchmore common
than is generally appreciated. Over half of spontaneous
abortions have chromosomal abnormalities, com-
pared with only four to six abnormalities per 1000
live births. Specific chromosomal abnormalities can
lead to well-recognized and severe clinical syndromes,
although autosomal aneuploidy (a differing from the
normal diploid number) is usually more severe than
the sex-chromosome aneuploidies. Abnormalitiesmay
occur in either the number or the structure of the
chromosomes.
3.3.1.1 Abnormal chromosome numbers
If a chromosome or chromatids fail to separate
(‘nondisjunction’) either in meiosis or mitosis, one
daughter cell will receive two copies of that chromo-
some and one daughter cell will receive no copies of the
chromosome. If this nondisjunction occurs during
meiosis it can lead to an ovum or sperm having
eitheran extra chromosome, so resulting in a fetus that
is ‘trisomic’ and has three instead of two copies of
the chromosome; or no chromosome, so the fetus is
‘monosomic’ and has one instead of two copies of the
chromosome. Nondisjunction can occur with auto-
somes or sex chromosomes.However, only individuals
with trisomy 13, 18 and 21 survive to birth, and most
children with trisomy 13 and trisomy 18 die in early
childhood. Trisomy 21 (Down syndrome) is observed
with a frequency of 1 in 700 live births regardless of
geography or ethnic background. This should be re-
duced with widespread screening. Full autosomal
monosomies are extremely rare and very deleterious.
Sex-chromosome trisomies (e.g. Klinefelter’s syndrome,
XXY) are relatively common. The sex-chromosome
monosomy in which the individual has an X chro-
mosome only and no second X or Y chromosome is
known as Turner’s syndrome and is estimated to
occur in 1 in 2500 live-born girls (see Table 3.4).
Occasionally, nondisjunction can occur during
mitosis shortly after two gametes have fused. It will
then result in the formation of two cell lines, each
with a different chromosome complement. This
occurs more often with the sex chromosome, and
results in a ‘mosaic’ individual. Very rarely the entire
chromosome set will be present in more than two
copies, so the individual may be triploid rather
than diploid and have a chromosome number of 69.
Triploidy and tetraploidy (four sets) result in sponta-
neous abortion.
3.3.1.2 Abnormal chromosome structures
As well as abnormal numbers of chromosomes, chro-
mosomes can have abnormal structures and the dis-
ruption to the DNA and gene sequences may give rise
to a genetic disease.
. Deletions Deletions of a portion of a chromosome
may give rise to a disease syndrome if two copies of
the genes in the deleted region are necessary, and the
individual will not be normal with just the one copy
remaining on the nondeleted homologous chromo-
some. Many deletion syndromes have been well
described. For example, Prader---Willi syndrome is
the result of cytogenetic events resulting in deletion
of part of the long arm of chromosome 15, Wilms’
tumour is characterized by deletion of part of the
short arm of chromosome 11, andmicrodeletions in
the long arm of chromosome 22 give rise to the
DiGeorge syndrome.. Duplications Duplications occur when a portion of
the chromosome is present on the chromosome in
two copies, so the genes in that chromosome portion
are present in an extra dose. A form of the neuropa-
thy, Charcot---Marie---Tooth disease is due to a small
duplication of a region of chromosome 17.. Inversion Inversions involve an end-to-end rever-
sal of a segment within a chromosome, for example
abcdefgh becomes abcfedgh.. Translocations Translocations occur when two
chromosome regions join together, when theywould
Chapter 3 Clinical cell biology and genetics 117

not normally. Chromosome translocations in so-
matic cells may be associated with tumourigenesis.
Translocations can be very complex, involving
more than two chromosomes, but most are simple
and fall into one of two categories. Reciprocal
translocations occur when any two nonhomologous
chromosomes break simultaneously and rejoin,
swapping ends. In this case the cell still has 46 chromo-
somes but two of them are rearranged. Someone
with a balanced translocation is likely to be normal
(unless a translocation breakpoint interrupts a gene);
but at meiosis, when the chromosomes separate
into different daughter cells, the translocated chromo-
somes will enter the gametes and any resulting
fetus may inherit one abnormal chromosome and
have an unbalanced translocation, with physical
manifestations.
Table 3.4 Some of the syndromes resulting from chromosomal abnormalities
Syndrome Chromosomekaryotype
Incidence and risks Clinical features Mortality
Autosomal abnormalities
Trisomy 21 (Down
syndrome)
47, þ21 (95%)
Mosaicism
Translocation 5%
1:650 (risk with 20- to
29-year-old mother 1:1000;
>45-year-old mother 1:30)
Flat face, slanting eyes,
epicanthic folds, small ears,
simian crease, short stubby
fingers, hypotonia, variable
learning difficulties, congenital
heart disease (up to 50%)
High in first year, but
many now survive to
adulthood
Trisomy 13 (Patau
syndrome)
47, þ13 1:5000 Low-set ears, cleft lip and palate,
polydactyly, microophthalmia,
learning difficulties
Rarely survive for more
than a few weeks
Trisomy 18
(Edwards
syndrome)
47, þ18 1:3000 Low-set ears, micrognathia,
rocker-bottom feet, mental
retardation
Rarely survive for more
than a few weeks
Sex-chromosome abnormalities
Fragile X syndrome 46, XX, fra (X)
46, XY, fra (X)
1:2000 Most common inherited cause of
learning difficulties
predominantly in males
Macroorchidism
Female Turner’s
syndrome
45, XO 1:2500 Infantilism, primary
amenorrhoea, short stature,
webbed neck, cubitis valgus,
normal IQ
Triple X syndrome 47, XXX 1:1000 No distinctive somatic features,
learning difficulties
Others 48, XXXX 49,XXXXX Rare Amenorrhoea, infertility, learning
difficulties
Male Klinefelter’s
syndrome
47, XXY (or XXYY) 1:1000 (more in sons
of older mothers)
Decreased crown---pubis:
pubis---heel ratio, eunuchoid,
testicular atrophy, infertility,
gynaecomastia, learning
difficulties (20%; related to
number of X chromosomes)
Double Y syndrome 47, XYY 1:800 Tall, fertile, minor mental and
psychiatric illness, high incidence
in tall criminals
Others 48, XXXY 49, XXXXY Learning difficulties, testicular
atrophy
118 Biomedical sciences

Robertsonian translocations occur when two acro-
centric chromosomes join and the short arm is lost,
leaving only 45 chromosomes. This translocation is
balanced as no genetic material is lost and the individ-
ual is healthy. However, any offspring have a risk of
inheriting an unbalanced arrangement. This risk de-
pends on which acrocentric chromosome is involved.
Clinically important is the 14/21 Robertsonian trans-
location. A woman with this karyotype has a one in
eight risk of delivering a baby with Down syndrome
(amale carrier has a 1 in 50 risk). However, they have a
50% risk of producing a carrier like themselves, hence
the importance of genetic family studies. Relatives
should be alerted about the increased risk of Down
syndrome in their offspring, and should have their
chromosomes checked.
3.3.1.3 Mitochondrial chromosome disorders
The mitochondrial chromosome carries its genetic
information in a very compact form; for example
there are no introns in the genes. Therefore any
mutation has a high chance of having an effect. How-
ever, as every cell contains hundreds of mitochondria,
a single altered mitochondrial genome will not be
noticed. As mitochondria divide there is a statistical
likelihood that there will be more mutated mitochon-
dria, and at some point this will give rise to a mito-
chondrial disease.
Most mitochondrial diseases are myopathies and
neuropathies with a maternal pattern of inheritance.
Other abnormalities include retinal degeneration, di-
abetesmellitus and hearing loss.Many syndromes have
been described. Myopathies include chronic progres-
sive external ophthalmoplegia (CPEO); encephalo-
myopathies include myoclonic epilepsy with ragged
red fibres (MERRF) and mitochondrial encephalo-
myopathy, lactic acidosis and stroke-like episodes
(MELAS). Kearns---Sayre syndrome includes ophthal-
moplegia, heart block, cerebellar ataxia, deafness and
mental deficiency due to long deletions and rearrange-
ments. Leber’s hereditary optic neuropathy (LHON) is
the commonest cause of blindness in young men, with
bilateral loss of central vision and cardiac arrhythmias,
and is an example of amitochondrial disease caused by
a point mutation in one gene. Multisystem disorders
include Pearson’s syndrome (sideroblastic anaemia,
pancytopenia, exocrine pancreatic failure, subtotal
villous atrophy, diabetes mellitus and renal tubular
dysfunction). In some families, hearing loss is the only
symptom and one of the mitochondrial genes
implicated may predispose parents to aminoglyceride
ototoxicity (see Table 3.5).
3.3.1.4 Analysis of chromosome disorders
The analysis of gross chromosomal disorders has tra-
ditionally involved the culture of isolated cells in the
presence of toxins such as colchicine. These toxins
arrest the cell cycle at mitosis and, following staining,
the chromosomeswith their characteristic banding can
be seen. A highly trained cytogeneticist can then iden-
tify each chromosome pair and any abnormalities (see
Figure 3.12).
New molecular biology techniques have made
things simpler: yeast artificial chromosome (YAC)-
cloned probes are available and cover large genetic
regions of individual human chromosomes. These
probes can be labelled with fluorescently tagged nu-
cleotides and used in in situ hybridization of the
nucleus of isolated tissue from patients. These tagged
probes allow rapid and relatively unskilled identifica-
tion of metaphase chromosomes, and allow the
identification of chromosomes dispersed within
the nucleus. Furthermore, tagging two chromosome
regions with different fluorescent tags allows easy
identification of chromosomal translocations (see
Figure 3.25).
3.3.2 Gene defects
Mendelian and sex-linked single-gene disorders are the
result of mutations in coding sequences and their
control elements. These mutations can have various
effects on the expression of the gene, as explained
below, but all cause a dysfunction of the protein
product. Following translation of mRNA a peptide or
polypeptide is produced which then undergoes a series
of modifications as described earlier but at the same
time the protein is being folded and twisted into a
shape which is both stable and functional.
The primary structure of proteins is simply the
amino acid sequence translated from the mRNA se-
quence. Each amino acid in the sequence has a similar
basic structure but the functional group of each
amino acid unit confers charge and polarity and a
chain of amino acids is oriented according to the
constraints and interactions each amino acid side
chain has on its neighbour.
Chapter 3 Clinical cell biology and genetics 119

Table 3.5 Examples of mitochondrial genetic disorders
Mitochondrial DNA (mtDNA) deletional syndromes:
Kearns---Sayre syndrome (KSS) --- large deletion in mitochondrial DNA (1.3---10kB) from all tissue but particularly muscle
Pearson syndrome --- deletions in mitochondrial DNA found particularly in blood cells progressive external ophthalmoplegia
(PEO) --- deletions in mitochondrial DNA in skeletal muscle only
MELAS (Myopathy, Mitochondrial-Encephalopathy-Lactic Acidosis-Stroke)
Themost commonmutation in MELAS, present in over 80% of patients, is an A-to-G transition at nucleotide 3243 in themitochondrial
gene MTTL1 (Mitochondrial tRNA leucine 1)
MERRF (Myoclonic Epilepsy Associated with Ragged Red Fibres)
The most common mutation, present in over 80% of patients, is an A-to-G transition at nucleotide-8344 in the mitochondrial gene
MTTK (Mitochondrial tRNA lysine)
mtDNA-associated and NARP (Neurogenic muscle weakness, Ataxia, and Retinitis Pigmentosa),
Mutation in the mitochondrial gene MTATP6 (ATP synthase A chain) are associated with the neurodegenerative energy associated disease
NARP
mtDNA-associated Leigh syndrome
Mutations in the mitochondrial genes:
MTATP6 (ATP synthase A chain),
MTTL1 (Mitochondrial tRNA leucine 1),
MTTK (Mitochondrial tRNA lysine),
MTND1 (NADH-ubiquinone oxidoreductase chain 1),
MTND3(NADH-ubiquinone oxidoreductase chain 3),
MTND4 (NADH-ubiquinone oxidoreductase chain 4),
MTND5 (NADH-ubiquinone oxidoreductase chain 5),
MTND6 (NADH-ubiquinone oxidoreductase chain 6),
MTCO3(Cytochrome c oxidase polypeptide III),
MTTW (Mitochondrial tRNA tryptophan), and
MTTV (Mitochondrial tRNA valine) are all associated with neurodegenerative Leigh syndrome
Figure 3.25 24 colour FISH. Courtesy of Debbie Lillington CRUK Medical Oncology Barts
120 Biomedical sciences

A simple native protein’s shape is therefore affected
by the amino acids from which it is comprised but is
also affected by the environment in which it is formed.
The cytosol of the cell is aqueous and as a result a
native protein will generally fold with hydrophilic
amino acids oriented to external surface of the protein
and the hydrophobic amino acids will bury themselves
within the protein. The secondary structures, includ-
ing beta pleated sheets and alpha helices, are formed as
a result of these folds and weak interactions such as
hydrogen bonding. Some amino acids, namely cysteine
and proline have a more pronounced affect on the
structure forming disulphide bonds (a strong covalent
link) or L-shaped kinks in the polypeptide chain
respectively. The eventual three-dimensional shape is
critical to the function of themature protein and this is
dependent on the constituent amino acids. If any
amino acid is removed or changed the shape of the
protein is altered, if the shape is altered the function
may be compromised or the protein may have no
function at all. These changes come about by changes
to the gene sequences or DNA which ultimately codes
for proteins. Therefore a change in the DNA sequence
in the wrong place can prevent a protein from folding
and functioning correctly; if that protein is an enzyme,
hormone or receptor, for example, the consequences
can be far reaching. Changes to the DNA sequence of
an organism are called mutations.
AlthoughDNA replication is a very accurate process
with inbuilt repair mechanisms, occasionally mistakes
occur to produce changes or mutations in the se-
quence. These changes can also occur owing to other
factors such as radiation, ultraviolet light or chemicals.
Many different types of mutation can occur.
3.3.2.1 Point mutation
This is the simplest type of change and involves the
substitution of one nucleotide for another, so changing
the codon in a coding sequence. For example, the
triplet AAA, which codes for lysine, may be mutated
to AGA, which codes for arginine. Whether a substi-
tution produces a clinical disorder depends onwhether
it changes a critical part of the protein molecule
produced. Fortunately, many substitutions have no
effect on the function or stability of the proteins
produced as several codons code for the same amino
acid. However, some mutations may have a severe
effect; for example, in sickle cell disease a mutation
within the globin gene changes one codon from GAG
to GTG, so that instead of glutamic acid, valine
is incorporated into the polypeptide chain, which
radically alters its properties.
3.3.2.2 Insertion or deletion
Insertion or deletion of one or more bases is a more
serious change, as it results in the alteration of the rest
of the following sequence to give a frame-shift muta-
tion. For example, if the original code was:
TAA GGA GAG TTT
and an extra nucleotide (A) is inserted, the sequence
becomes:
TAA AGG AGA GTT T
Alternatively, if the third nucleotide (A) is deleted,
the sequence becomes:
TAG GAG AGT TT
In both cases, different amino acids are incorporat-
ed into the polypeptide chain. This type of change is
responsible for some forms of thalassaemia. Insertions
and deletions can involve many hundreds of basepairs
of DNA. For example, some large deletions in the
dystrophin gene remove coding sequences and this
results in Duchenne muscular dystrophy. Insertion/
deletion (ID) polymorphism in the angiotensin-con-
verting enzyme (ACE) gene has been shown to result in
the genotypes II, ID andDD. The deletion is of a 287 bp
repeat sequence and DD is associated with higher
concentrations of circulating ACE and possibly cardiac
disease.
3.3.2.3 Splicing mutations
If the DNA sequences which direct the splicing of
introns from mRNA are mutated, then abnormal
splicing may occur. In this case the processed mRNA
which is translated into protein by the ribosomes may
carry intron sequences, so altering which amino acids
are incorporated into the polypeptide chain.
3.3.2.4 Termination mutations
Normal polypeptide chain termination occurs when
the ribosomes processing the mRNA reach one of the
chain termination or ‘stop’ codons (see above). Muta-
tions involving these codons will result in either late or
premature termination. For example, Haemoglobin
Constant Spring is a haemoglobin variant where in-
stead of the ‘stop’ sequence a single base change allows
the insertion of an extra amino acid.
Chapter 3 Clinical cell biology and genetics 121

3.3.3 Single-gene disease
Monogenetic disorders involving single genes can be
inherited as dominant, recessive or sex-linked char-
acteristics. Although classically divided into autosomal
dominant, recessive or X-linked disorders, many syn-
dromes show multiple forms of inheritance pattern.
This is predominately because multiple defects can
occur within a given disease associated gene or in
separate genes which all contribute to a particular
molecular/cellular pathway and thus give rise to the
same phenotype. For example in Ehlers---Danlos syn-
drome we find autosomal dominant, recessive and
X-linked inheritance. In addition there is a spectrum
between autosomal recessive and autosomal domi-
nance in that having just one defective allele gives a
mild form of the disease whilst having both alleles with
the mutation results in more severe form of the syn-
drome. In some cases, such as factor V Leiden disorder,
the boundary between dominance and recessive forms
is very blurred. Tables 3.6 and 3.7 give examples of
autosomal dominant and recessive disorders.
Some diseases show a racial or geographical preva-
lence. Thalassaemia is seen mainly in Greeks, South-
east Asians and Italians, porphyria variegata occurs
more frequently in the South African white population
and Tay---Sachs disease particularly occurs in Ashke-
nazi Jews. The most common recessive disease in the
UK is cystic fibrosis. Thus the worldwide prevalence of
a diseasemay be low (as detailed in Tables 3.6---3.9) but
much higher in specific populations. Some disorders
are rare to the extent that the prevalence is counted in
the total number of cases ever reported. Molecular
biology has enabled the subclassification of some
syndromes according to which gene is giving rise to
the disease (e.g. Polycystic kidney disease) and the
proportion of cases arising from defects in that partic-
ular gene can be estimated from linkage analysis.
However, this may not be reflected in the detection
rate of a given clinical genetic test, since a single test
cannot detect all the possible mutations arising at a
particular locus.
3.3.3.1 Autosomal dominant disorders
Each diploid cell contains two copies of all the auto-
somes. An autosomal dominant disorder occurs when
one of the two copies has a mutation and the protein
produced by the normal form of the gene cannot
compensate. In this case a heterozygous individual
who has two different forms (or alleles) of the same
gene will manifest the disease. The offspring of hetero-
zygotes have a 50% chance of inheriting the chromo-
some carrying the disease allele, and therefore also of
having the disease. However, estimation of risk to
offspring for counselling families can be difficult be-
cause of three factors:
. These disorders have a great variability in their
manifestation. ‘Incomplete penetrance’ may occur
if patients have a dominant disorder but it does not
manifest itself clinically in them. This gives the
appearance of the gene having ‘skipped’ a
generation.. Dominant traits are extremely variable in severity
(variable expression) and a mildly affected parent
may have a severely affected child.. New cases in a previously unaffected family may be
the result of a new mutation. If it is a mutation, the
risk of a further affected child is negligible. Most
cases of achondroplasia are due to new mutations.
The overall incidence of autosomal dominant dis-
orders is seven per 1000 live births (see Table 3.6).
3.3.3.2 Autosomal recessive disorders
These disorders manifest themselves only when an
individual is homozygous for the disease allele, that
is both chromosomes carry the mutated gene. In this
case the parents are generally unaffected, healthy car-
riers (heterozygous for the disease allele). There is
usually no family history, although the defective gene
is passed from generation to generation. The offspring
of an affected person will be healthy heterozygotes
unless the other parent is also a carrier. If carriers
marry, the offspring have a one in four chance of being
homozygous and affected, a one in two chance of being
a carrier and a one in four chance of being genetically
normal. Consanguinity increases the risk. The clinical
features of autosomal recessive disorders are usually
severe; patients often present in the first few years of life
and have a high mortality. The overall incidence of
autosomal recessive disorders is about 2.5 per 1000 live
births (see Table 3.7).
3.3.3.3 Sex-linked disorders
Genes carried on the X chromosome are said to be
‘X-linked’, and can be dominant or recessive in the
122 Biomedical sciences

Table
3.6
Exam
plesofautosomal
dominantdisorderswithchromosomelocationandgenedefect
Syndrome
Disease
Prevalence
Gen
e-(Product)
Gen
eLo
cation
Gen
etic
test
detectionrate
Achon
droplasia
1/15,000---
1/40,000
FGFR3
(Fibroblastgrowth
factorreceptor-3)
4p16.3
99%
Alexander
disease
very
rare
GFAPP
(Glial
fibrillaryacidic
protein)
17q21
95%
Alagille
syndrome(AGS)
1/70,000
JAG1
(Jagged1protein)
20p12
77%
Alzheimersdisease
41/10,000at
risk
PSENI
(Presenilin
1)
14q24.3
30---70%
(early
onset)
PSENII
(Presenilin
2)
1q31-q42
<5%
APP
(Amyloid
betaA4protein)
21q21
10---15%
Aniridia
1-2/100,000
PAX6
(Pairedboxprotein
Pax-6)
11p13
90%
Breastcancer---Familialearly
onset
1/300-1/800
BRAC-1
(Breastcancertype
1susceptibilityprotein)
17q21
50---75%
BRAC-2
(Breastcancertype
2susceptibilityprotein)
13q12.3
15---30%
Charcot-Marie-Tooth
(30/100,000)
Disease
subtypes:
CMT1
15/100,000
PMP22
(Peripheral
myelinprotein
2)
17p11.2
�50%
MPZ(M
yelinP 0
Protein)
1q22
<20%
LITAF
(Lipopolysaccharide-inducedtumornecrosis
factor-alphafactor)
16p13.1-12.3
unknown
EGR2
(Early
growth
respon
seprotein
2)
10q21.1-q22
unknown
CMT2
6-12/100,000
KIF1B
(Kinesin-likeprotein
KIF1B)
1p36.2
unknown
RAB7
(Ras
like
protein
RAB-7)
3q21
unknown
GARS
(Glycyl-tRNAsynthetase)
7p15
unknown
NEFL
(NeurofilamenttripletLprotein)
8p21
unknown
Unknow
n12q23-24
unknown
Unknow
n7q11-21
unknown
CerebralCavernous
Malform
ation
Rare
(Fam
ilial)SubtypesCM
1(40%
ofcases)
CCM1
(Krit-1protein)
7q21-22
�70%
CM2
(20%
ofcases)
Unknow
n7p15-13
unknown
CM3
(40%
ofcases)
Unknow
n3q25.2-27
unknown
22q11.2
deletionSyndrome
(includes
DiGeorgesyndrome)
1/5,000
Multiple
known&
unknownsequen
ces
22q11.2
100%
Myotonic
Dystroph
y1/20,000
DMPK
(Myotonin
---protein
kinase)
19q13.2---13.3
100% (Continued)
Chapter 3 Clinical cell biology and genetics 123

Table
3.6
(Continued
)
Syndrome
Disease
Prevalence
Gen
e-(Product)
Gen
eLo
cation
Gen
etic
test
detectionrate
Ehlers
---DanalosSyndrome
Classictype
1/20,000
COL5A1
(Collagen
alpha1(V)chain)
9q34-34.3
50---75%
COL5A2
(collagen
alpha2(V)chain)
2q31
50---75%
Vasculartype
1/50,000
COL3A1
(TypeIIIcollagen
cahins)
2q31
98---99%
EpidermolysisBullosa
Simplex
1/50,000
KRT5
(Keratin
5)
12q13
50---70%
KRT14
(Keratin
14)
17q12-21
50---70%
Facioscapilohumeral
MuscularDystrophy
6/100,000
D4Z4
(repeatmotifdomain)
4q35
95%
FamilialAdenomatous
Polyposis
3/100,000
APC
(adenomatous
polyposiscoliprotein)
5q21-22
95%
FamilialH
ypercholestrolaem
ia1-2/500
(95---98%
ofcases)
LDLR
(lowdensity
lipoprotein
receptor)
19p13.2
unknown
(2---5%
ofcases)
APOB
(apolipoprotein
B100)
2p23-24
unknown
FamilialPeriodicFever/TRAPS
Rare
TNFRSF1A
(serum/soluble
TNFreceptor)
12p13
unkown
Hem
orrhagic
telangiectasia
1-4/50,000
ENG
(endoglin)
9q34.1
50---80%
(Hereditary)
ACVRL1
(Activin
-Serine/threonine-protein
kinase
receptorR3)
12q11-14
50---80%
Hirschsprung’sdisease
1/5000
Multiple
syndromes
andchromosomal
deletionsgive
rise
toHirshsprungdisease
(con
genital
intestinal
aganglionosis)
RET
(tyrosine-protein
kinasereceptor)
10q11.2
10---80%
GDNF
(Glial
cellline-derived
neutrotrophic
factor)
5p13.1-12
<1%
NRTN
(Neurturin)
19p13.3
<1%
EDNRB
(Endothelin
Breceptor)
13q22
3---5%
EDN3
(Endothelin-3)
20q13.2-13.3
5%
ECE1
(Endothelin-convertingenzyme)
1p36.1
<1%
LiFraumenisyndrome
Rare
TP53
(p53)
17p13.1
95%
CHEK2
(Serine/threonine-protein
kinaseChk2)
22q12.1
unknown
Malignanthyperthermia
1-5/50,000
RYR1
(Ryanodinereceptortype
1)
19q13.1
70%
CACNA1S
(Voltage-dependentL-typecalcium
channel
alpha-1S
subunit)
1q32
unknown
Unknow
n17q11.2-24
unknown
Unknow
n7q21-q22
unknown
124 Biomedical sciences

Unknow
n3q13.1
unknown
Unknow
n5p
unknown
Marfanssyndrome
1-2/10,000
FBN1
(Fibrillin
1)
15q21.1
70---90%
MEN
Type2
1/30,000
RET
(tyrosine-protein
kinasereceptor)
10q11.2
88---95%
(Multiple
endocrine
neoplasia)
Neurofibromatosis
Type11/3000
NF1
(Neurofibromin)
17q11.2
80---95%
Type2
1/40,000
NF2
(Merlin)
22q12.2
�65%
Peutz-Jegherssyndrome
1-10/250,000
STK11
(Serine/threonine-protein
kinase11)
19p13.3
65---75%
(AD)PolycysticKidney
disease
1-2/1000
(�85%
ofcases)
PKD1
(Polycystin)
16p13.3-13.12
50---75%
(�15%
ofcases)
PKD2
(Polycystin2)
4q21-23
75%
(AD)Retinitispigmantosa
4-7/100,000
(25---30%
ofcases)
RHO
(Rhodopsin)
3q22.1
unknown
(15---20%)
PRPF31
(Pre-m
RNAsplicingfactor31)
19q3.4
unknown
(5---10%)
RP1
(Oxygen-regulatedprotein
1)
8q12.1
unknown
(5---10%)
RDS
(Peripherin
2)
6p21.2
unknown
(3---5%)
IMPDH1
(Inosinemonophosphatedehydrogenase1)
7q14.3
unknown
(3%-Japan)
FSCN2
(Retinal
fascin
homolog2,actinbundling
protein)
17q25
unknown
(Rare)
CRX
(Cone-rodhomeoboxprotein)
19q13.3
unknown
(Rare)
PRPF8
(Pre-m
RNAsplicingfactorC8)
17p13.3
unknown
(Rare)
NRL
(Neuralretina-specific
leucinezipper)
14q11.2
unknown
(Rare)
ROM1
(Retinal
outersegmentmem
braneprotein1)
11q12.3
unknown
(Rare)
PIM
IK(Pim-1
kinase)
7p14.3
unknown
Retinoblastoma
�1/20,000
RB1
(Retinoblastoma-associated
protein)
13q14.1-14.2
�80%
Tuberoussclerosis(TS)
�1/6000
TSC1
(Ham
artinprotein)
9q34
10---30%
TSC2
(Tuberin)
16p13.3
50---70%
VonHippel-Lindau
syndrome
1/40,000
VHL
(vonHippel-Lindau
disease
tumour
suppressor)
3p26-25
�75%
VonWillebrand’sdisease
(Type1&2)
upto
3/100
vWF
(vonWillebrand’sfactor)
12p13.2
unknown
Wilm’sTumour
1/10,000
WT1
(Wilm’sTumourprotein)
11p13
unknown
Chapter 3 Clinical cell biology and genetics 125

Table
3.7
Exam
plesofautosomal
recessivedisorderswithchromosomelocationandgenedefects
Syndrome
Disease
Prevalence
Gen
e-(Product)
Gen
eLo
cation
Gen
etic
test
detectionrate
AlphaMannosidosis
0.5-2/1million
MAN2B1(Lysosomal
alpha-mannosidase)
19cen-q12
100%
Alstr€ om
syndrome
Rare
ALM
S1(ALM
S1protein)
2p13
unknown
Ataxia-Telangiectasia
1-3/100000
ATM
(Serine-protein
kinaseATM
)11q22.3
>95%
Alkaptonuria
1/500000
HGD(Hom
ogentisicacid
dioxygenase)
3q21-q23
90%
Charcot-Marie-Tooth
Disease
subtypeCM
T4<1/100
000
GDAP1(Ganglioside-induceddifferentiation-associated
protein-1)
8q13-12.1
unknown
MTM
R2(M
yotubularin-related
protein
2)
11q22
unknown
MTM
R13
(Myotubularin-related
protein
13)
11p15
unknown
KIAA1985(unknown)
5q32
unknown
NDRG1(NDRG1protein)
8q24.3
unknown
EGR2
(Early
growth
response
protein
2)
10q21.1-22
unknown
PRX(Periaxin)
19q13.1-13
unknown
Cokaynesyndrome
(<1/100000)
TypeA
25%
ofcases
CKN1(CockaynesyndromeWD-repeatprotein/EECC-6
associated
protein)
Ch5
unknown
TypeB
75%
ofcases
ERCC6(TranscriptioncoupledexcisionDNArepairprotein
ERCC-6)
10q11
unknown
Cystic
fibrosis
1-10/30000
CTFR
(Cysticfibrosistransm
embraneconductance
regulator)
7q31.2
50---95%
Cystinosis
1/20000
CTNS(Cystinosin)
17p13
40---65%
21-hydroxylase
deficiency
(21-OHD)
1:15,000
CYP21A2(CytochromeP450XXIB)
6p21.390---95%
-Congenital
adrenal
hyperplasia
Congenital
Icthyosis
1-2/200000
TGM1(Transglutaminase-K)
14q11.2
90%
FamilialMediterraneanfever
(FMF)
Rare
MEFV(Pyrin)
16p13.3
70---95%
Dysferlinopathy
Rare
DYSF(Dysferlin)
2p13.3-13.1
80%
Ehlers-Danalos-Kyphosoliotic
form
1/100000
PLOD(Procollagen-lysine,
2-oxogluterate
5-dioxgenase1)
1p36.3-36.2
20%
Fanconianaemia
1/100000
126 Biomedical sciences

(66%
ofcases)
FRANCA
(FanconiAnem
iaGroupAProtein)
16q24.3
unknown
(10%
ofcases)
FANCC
(FanconiAnem
iaGroupCProtein)
9q22.3
unknown
(10%
ofcases)
FANCE
(FanconiAnem
iaProtein
E)6p22-21
unknown
(10%
ofcases)
FANCG
(FanconiAnem
iaGroupGProtein)
9p13
unknown
(Rare)
FANCD2(FanconiAnem
iaGroupD2Protein)
3p25.3
unknown
(Rare)
FANCF
(FanconiAnem
iaComplementationGroupF)
11p15
unknown
Free
Sialic
AcidStorage
Disorders
Rare
SLC17A
5(Sialin)
6q14-q15
91%
Galactosaem
ia1/300000
GALT
(Galactose-phosphateuridyl
transferase)
9p13
95---100%
Gaucher’sdisease
1-2/100000
GBA(Glucocerebrosidase)
1q21
95---100%
GlycineEncephalopathy
1/50000
(80%
ofcases)
GLDC(Glycinedehydrogenase)
9p22
84%
(10---15%
ofcases)
AMT(Aminomethyl
transferase)
3p21.2-21.1
10---30%
GCSH(Glycinecleavage
system
Hprotein)
6q24
unknown
Hereditaryhaemochromatosis
1/3000
HFE
(Hereditaryhaemochromatosisprotein)
6p21.3
60---98%
HomocystinuriatypeI
1/200000
CBS(Cystathioninebsynthetase)
21q22.3
95%
MucopolysaccharidosisTypeI
(Hurler’ssyndrome)
1-5/500000
IDUA(a-L-iduronidase)
4p16.3
95%
Nieman-Pickdisease
1/150000
Type1
(90%
ofcases)
NPC1
(Nieman-PickC1
protein)
18q11-12
95%
Type2
(4%
ofcases)
NPC2
(Epididym
alsecretory
protein
E1)
14q24.3
100%
OculocutaneousAlbanism
Type1
1/40000
TYR(tyrosinase)
11q14-21
71%
Type2
1/40000
OCA2(P
protein)
15q11.2-12
80---90%
Phenylalaninehydroxylase
deficiency
(Phenylketonuria-
PKU)
1-55/150
000
PAH(Phenyalaninehydroxylase)
12q23.2
99%
Peroxisomebiogenesisdisorders
1/50000
(Zellweger’ssyndrome&Refsum’s
disease)
(65%
ofcases)
PEX1(Peroxisomebiogenesisfactor1)
7q21-22
80%
(11%
ofcases)
PEX6(Peroxisomeassembly
factor-2)
6p21.1
unknown
(7%
ofcases)
PEX26(PEX26protein)
22q11.2
unknown
(4%
ofcases)
PEX10(Peroxisomeassembly
protein
10)
Ch1
unknown
(Continued)
Chapter 3 Clinical cell biology and genetics 127

Table
3.7
(Continued
)
Syndrome
Disease
Prevalence
Gen
e-(Product)
Gen
eLo
cation
Gen
etic
test
detectionrate
(4%
ofcases)
PEX12(Peroxisomeassembly
protein
12)
17q21.1
unknown
(1---2%
ofcases)
PEX3(Peroxisomal
assembly
protein
PEX3)
6q23-24
unknown
(1---2%
ofcases)
PXR1(Peroxisomal
targetingsign
al1receptor)
12p13.3
unknown
(Rare)
PXM
P3(Peroxisomeassembly
factor-1)
8q21.1
unknown
(Rare)
PEX13(Peroxisomal
mem
braneprotein
PEX13)
2p15
unknown
(Rare)
PEX16(Peroxisomal
mem
braneprotein
PEX16)
11p12-11.2
unknown
(Rare)
PXF
(Peroxisomal
farnesylated
protein)
1q22
unknown
(AR)Retinitispigmantosa
4-5/100000
(10---20%
ofcases)
Unknow
n6q14-15
unknown
(4---5%
ofcases)
USH
2A(Usherin
protein)
1q41
unknown
(3---4%
ofcases)
PDE6B(RodcGMP-specific
30 ,5
0 cyclic
phosphodiesteraseb)
4p16.3
unknown
(3---4%
ofcases)
PDE6A(RodcGMP-specific
30 ,5
0 cyclic
phosphodiesterasea)
5q33.1
unknown
(2%
ofcases)
RPE65(Retinal
pigmentepithelium
61kDaprotein)
1p31.2
unknown
Atleast16other
geneandgeneloci
havebeenfoundassociated
withautosomal
recessive(AR)Retinitispigmantosa
Sickle
celldisease
Rare(1---2/10000in
Africa)
HBB(b-globin)
11p15.
100%
b-thalassaem
iaRare(1---2/100Cyprus)
HBB(b-globin)
11p15
99%
a-thalassaem
iaComplex
HBA1(haemoglobin,alpha1)
16p13.3
HBA2(haemoglobin,alpha2)
16p13.3
HexoamidaseAdeficiencies
(Tay---Sach’sdisease)
Rare
HEXA(Beta-hexosaminidasealphachain)
15q23-24
40---98%
Wilson’sdisease
1/30000
ATP7B(copper
transportingATPase2)
13q14.3-12
unknown
Xerodermapigmentosum
1-10/m
illion
(25%
ofcases)
XPA(DNA-repairprotein
complementingXP-A
cells)
9q22.3
unknown
(25%
ofcases)
XPC(DNA-repairprotein
complementingXP-C
cells)
3p25
unknown
(21%
ofcases)
POLH
(ErrorproneDNAphotoproductbypasspolymerase)
6p21.1-12
unknown
(15%
ofcases)
ERCC2(TFIIH
basaltranscriptionfactorcomplexhelicase
subun
it)
19q13.2-13
unknown
(6%
ofcases)
ERCC4(DNA-repairprotein
complementingXP-F
cells)
16p13.3-13.1
unknown
(6%
ofcases)
ERCC5(DNA-repairprotein
complementingXP-G
cells)
13q33
unknown
(Rare)
ERCC3(TFIIH
basaltranscriptionfactorcomplexhelicase
XPBsubun
it)
2q21
unknown
(Rare)
DDB2(DNAdam
agebindingprotein
2)
11p12-11
unknown
128 Biomedical sciences

Table 3.8 Examples of X-linked disorders with chromosome location and gene defects
Syndrome DiseasePrevalence
Gene- (Product) Gene Location Genetic testdetection rate
Recessive
Alport’s syndrome 1/50 000 COL4A5 (Collagen alpha 5(IV)
chain)
Xq22 60%
Adrenal hypoplasia congenital -X 1/13 000 NR0B1 (Orphan nuclear receptor
DAX-1)
Xp21.3-21.2 70---100%
Adrenoleukodystrophy- X linked 1-3/50 000 ABCD1 (Adrenoleukodystrophy
protein)
Xq28 98%
Agammaglobulinaemia- X linked 3-6/million BTK (Tyrosine-protein kinase BTK) Xq21.3-22 98---99%
Androgen insensitivity syndrome 2-5/100 000 AR (Androgen receptor) Xq11-q12 90%
Dystrophinopathies 1-4/20 000 (UK) DMD (Dystrophin) Xp21.2 65---85%
(Becker’s & Duchenne’s muscular
dystrophies)
Charcot-Marie-Tooth Disease
Subtype CMX 3-6/100 000 GJB1 (Gap junction beta-1
protein)
Xq13.1 90%
Fabry’s disease 1-2/100 000 GLA (a-galactosidase A) Xq22 100%
Haemophilia A 1/4000 F8 (Factor VIII) Xq28 98%
Haemophilia B 1/20 000 F9 (Factor IX) Xq27.1-27.2 99%
Myotubular Myopathy- X linked 1/50 000 MTM1 (Myotubularin) Xq28 80---85%
Nephrogenic diabetic insipidus Rare AVPR2 (Vasopressin V2 receptor) Xq28 97%
a-Thalassaemia, X-linked Rare ATRX (Transcriptional regulator
ATRX)
Xq13 90%
(mental retardation syndrome)
X-linked severe combined
immunodeficiency (X_SCID)
1-2/100 000 IL2RG (Cytokine receptor common
gamma chain)
Xq13.1 99%
Dominant
Coffin-Lowry syndrome 1/50 000 RPS6KA3 (Ribosomal protein S6
kinase alpha 3)
Xp22.2-22.1 35---40%
Incontinentia pigmenti Rare IKBKG (NF-kappaB essential
modulator)
Xq28 80%
Oral-facial-digital
syndrome type-1 1-5/250 000 OFD1(Oral-facial-digital syndrome
1 protein)
Xp22.3-p22.2 unknown
Periventricular heterotopia, X
linked
unknown FLNA (filamin 1) Xq28 83%
Retinitis Pigmentosa- X linked 1-4/100 000
(70% of cases) RPGR (Retinitis pigmentosa
GTPase regulator)
Xp21.1 unknown
(8% of cases) RP2 (XRP2 protein) Xp11.2 unknown
Rett Syndrome 1/10 000 MECP2 (Methyl-CpG-binding
protein 2)
Xq28 80%
Chapter 3 Clinical cell biology and genetics 129

same way as autosomal genes. As females have two X
chromosomes they will be unaffected carriers of
X-linked recessive diseases. However, since males have
just one X chromosome, any deleterious mutation in
an X-linked gene will manifest itself because no second
copy of the gene is present (see Table 3.8).
3.3.3.4 X-Linked Dominant Disorders
These are rare. Vitamin D-resistant rickets is the best-
known example. Females who are heterozygous for the
mutant gene and males who have one copy of the
mutant gene on their single X chromosome will mani-
fest the disease. Half the male or female offspring of an
affected mother and all the female offspring of an
affected man will have the disease. Affected males
tend to have the disease more severely than the
heterozygous female.
3.3.3.5 X-Linked Recessive Disorders
These disorders present in males and present only in
(usually rare) homozygous females. X-linked recessive
diseases are transmitted by healthy female carriers or
affectedmales if they survive to reproduce. An example
of an X-linked recessive disorder is haemophilia A,
which is caused by a mutation in the X-linked gene for
factor VIII. It has recently been shown that in 50% of
cases there is an intrachromosomal rearrangement
(inversion) of the tip of the long arm of the X chro-
mosome (one break point being within intron 22 of the
factor VIII gene).
Of the offspring from a carrier female and a
normal male:
. 50% of the girls will be carriers as they inherit a
mutant allele from theirmother and thenormal allele
from their father; the other 50% of the girls inherit
two normal alleles and are themselves normal.. 50%of the boys will have haemophilia as they inherit
the mutant allele from their mother (and the Y
chromosome from their father); the other 50% of
the boys will be normal as they inherit the normal
allele from their mother (and the Y chromosome
from their father).
The male offspring of a male with haemophilia and
a normal female will not have the disease as they do not
inherit his X chromosome. However, all the female
offspring will be carriers as they all inherit his X
chromosome.
3.3.3.6 Y-Linked Genes
Genes carried on the Y chromosome are said to be
Y-linked and only males can be affected. However,
there are no known examples of Y-linked single-gene
disorders which are transmitted.
Table 3.9 Examples of trinucleotide repeat genetic disorders
Syndrome ---inheritence
pattern
Disease
Prevalence
Gene, location and
gene-disorder
Genetic test detection rate
Friedreich’s ataxia ---AR 2-4/100 000 FRDA, (Frataxin) 9q13 96%
-GAA trinucleotide repeat expansion disorder
in inton 1 of FRDA
Fragile X syndrome- X-linked 16-25/100 000 FMR1 (Fragile X mental
retardation 1 protein) Xq27.3
99%
-CGG trinucletide repeat expansion and
methylation changes in the 50 untranslatedregion of FMR1 exon 1
Huntingdon’s disease-AD 3-15/100 000 HD (Huntingdon protein) 4p16.3 98%
-CAG trinucleotide repeat expansion within
the translated protein giving rise to long
tracts of repeat glutamine residues in HD.
Myotonic dystrophy- AD 1/20 000 DMPK (Myotonin-protein kinase)
19q13.2-13.3
100%
-CTG trinucleotide repeat expansion in the 30
untranslated region of the DMPK gene
130 Biomedical sciences

3.3.3.7 Sex-limited inheritance
Occasionally a gene can be carried on an autosome but
manifests itself only in one sex. For example, frontal
baldness is an autosomal dominant disorder in males
but behaves as a recessive disorder in females.
3.3.3.8 Other single-gene disorders
These are disorders which may be due to mutations in
single genes but which do not manifest as simple
monogenic disorders. They can arise from a variety
of mechanisms, including the following.
3.3.4 Triplet repeat mutations
In the gene responsible for myotonic dystrophy,
the mutated allele was found to have an expanded
30UTR region in which three nucleotides, GCT,
were repeated up to about 35 times. In families with
myotonic dystrophy, people with the late-onset
form of the disease had 20---40 copies of the repeat,
but their children and grandchildren who presented
with the disease from birth had vast increases in
the number of repeats, up to 2000 copies. It is thought
that some mechanism during meiosis causes this
‘triplet repeat expansion’ so that the offspring
inherit an increased number of triplets. The number
of triplets affects mRNA and protein function giving
rise to the phenomenon of ‘genetic anticipation’ (see
Table 3.9).
3.3.5 Mitochondrial disease
As discussed various mitochondrial gene mutations
can give rise to complex disease syndromes with
incomplete penetrance maternal inheritance.
3.3.6 Imprinting
It is known that normal humans need a diploid num-
ber of chromosomes, 46. However, the maternal and
paternal contributions are different and, in some way
which is not yet clear, the fetus can distinguish between
the chromosomes inherited from the mother and the
chromosomes inherited from the father, although
both give 23 chromosomes. In some way the chromo-
somes are ‘imprinted’ so that the maternal and pater-
nal contributions are different. Imprinting is relevant
to human genetic disease because different phenotypes
may result depending on whether the mutant
chromosome is maternally or paternally inherited.
A deletion of part of the long arm of chromosome
15 (15q11---q13) will give rise to the Prader---Willi
syndrome (PWS) if it is paternally inherited. A deletion
of a similar region of the chromosome gives rise
to Angelman’s syndrome (AS) if it is maternally
inherited. Recently the affected gene has been identi-
fied as ubiquitin (UBE3A). Significantly maternal
chromosome 15 UBE3A is expressed in the brain
and hypothalamus. Defective maternal ubiquitin in
Angelman’s syndrome is thus responsible for
accumulation of undegraded protein, and hence
neuronal damage.
3.3.7 Complex traits:multifactorial and polygenicinheritance
Characteristics resulting from a combination of genet-
ic and environmental factors are said to be multifac-
torial; those involvingmultiple genes can also be said to
be polygenic (see Table 3.10).
Measurements ofmost biological traits (e.g. height)
show a variation between individuals in a population
and a unimodal, symmetrical (Gaussian) frequency
distribution curve can be drawn. This variability is due
to variation in genetic factors and environmental
factors. Environmental factors may play a part in
determining some characteristics, such as weight,
whilst other characteristics such as height may be
largely genetically determined. This genetic compo-
nent is thought to be due to the additive effects of a
number of alleles at a number of loci, many of which
can be individually identified using molecular biologi-
cal techniques, for example studying identical twins in
different environments.
A common genetic variation in the 30untranslatedregion of the prothrombin gene is associated with
elevated prothrombin (up to fourfold), increased
risk of venous thrombosis and myocardial infarction.
Presumably the 30mutation induces overexpression of
the prothrombin gene by increasing mRNA stability.
In some pedigree studies those homozygous for
this mutation and heterozygous for factor V Leiden
Chapter 3 Clinical cell biology and genetics 131

mutation have an even greater risk of thrombotic
events. Conversely, downregulation of the a1-anti-trypsin gene (due to similar mutation in the 30 and50 untranslated regions) is associated with emphysema
and cirrhosis. There are sex differences. Congenital
pyloric stenosis is most common in boys, but if it
occurs in girls the latter have a larger number of
affected relatives. This difference suggests that a
larger number of the relevant genes are required
to produce the disease in girls than in boys. Most
of the important human diseases, such as heart
disease, diabetes and common mental disorders, are
multifactorial traits.
3.3.8 Cell cycle control oncogenesand tumour supressors
Regulation of the cell cycle is complex. Cells in the
quiescent G0 phase (G, gap) of the cycle are stimulated
by the receptor-mediated actions of growth factors
(e.g. EGF, epithelial growth factor; PDGF, platelet-
derived growth factor; IGF, insulin-like growth factor)
via intracellular second messengers. Stimuli are trans-
mitted to the nucleus where they activate transcription
factors and lead to the initiation of DNA synthesis,
followed by mitosis and cell division. Cell cycling is
modified by the cyclin family of proteins that activate
or deactivate proteins involved in DNA replication by
phosphorylation (via kinases and phosphatase do-
mains). Thus from G0 the cell moves on to G1 (gap1)
when the chromosomes are prepared for replication.
This is followed by the synthetic (S) phase, when
the 46 chromosomes are duplicated into chromatids,
followed by another gap phase (G2), which eventually
leads to mitosis (M).
As shown in Figure 3.26 mutations leading to de
regulation of expression or function of any protein in
the pathway from growth factor to target replication
gene expression can be an oncogene (see Table 3.11).
However, althoughmultiplemutationsmay arise to
give enhanced replication signalling, the cell cycle itself
is regulated by two gate keepers which would normally
halt the anerrant signal. Tumour suppressor gene
products are intimately involved in control of the cell
cycle (Table 3.12).
Progression through the cell cycle is controlled by
many molecular gateways, which are opened or
blocked by the cyclin group of proteins that are spe-
cifically expressed at various stages of the cycle. The RB
and p53 proteins control the cell cycle and interact
specifically within many cyclin proteins. The latter are
affected by INK 4A acting on p16 proteins. The general
principle is that being held at one of these gateways will
ultimately lead to programmed cell death. p53 is a
DNA-binding protein which induces the expression of
other genes and is a major player in the induction of
cell death. Its own expression is induced by broken
DNA. The induction of p53 gene transcription by
damage initially causes the expression of DNA repair
enzymes. If DNA repair is too slow or cannot be
affected, then other proteins that are induced by p53
will affect programmed cell death.
One gateway event that has been largely elucidated
is that between the G1 and the S phase of the cell cycle.
The transcription factor dimer complex E2F-DP1
causes progression from the G1 to the S phase. How-
ever, the RB protein binds to the E2F transcription
factor, preventing its induction of DNA synthesis.
Other, cyclin D-related molecules inactivate the RB
protein thus allowing DNA synthesis to proceed. This
period of rapid DNA synthesis is susceptible to muta-
tion events and will propagate a preexisting DNA
mistake. Damaged DNA-induced p53 expression rap-
idly results in the expression of a variety of closely
related (and possibly tissue-specific) proteins WAF-1/
p21, p16, p27. These inhibit the inactivation of RB by
cyclin D-related molecules. As a result RB, the normal
gate which stops the cell cycle, binds to the E2F-DP1
transcription factor complex, halting S phase DNA
synthesis. If the DNA damage is not repaired apoptosis
ensues (Figure 3.27).
Table 3.10 Examples of disorders that may have apolygenic inheritance
Disorder Frequency(%)
Heritability(%)a
Hypertension 5 62
Asthma 4 80
Schizophrenia 1 85
Congenital heart disease 0.5 35
Neural tube defects 0.5 60
Pyloric stenosis 0.3 75
Ankylosing spondylitis 0.2 70
Cleft palate 0.1 76
aPercentage of the total variation of a trait which can be attributed to genetic
factor
132 Biomedical sciences

3.3.8.1 Viral inactivation of tumour suppressors
The suppression of normal tumour suppressor gene
function can be achieved by disabling the normal
protein once it has been transcribed, rather than
by mutating the gene. Viruses have developed their
own genes which produce proteins to do precisely
this. The main targets of these proteins are RB and
p53 to which they bind and thus disable. The best
understood are the adenovirus E1A and human pap-
illomavirus (HPV) E7 gene products which bind RB,
whilst the adenovirus E1B and HPV E6 gene products
bind p53. The SV40 virus large T antigen binds both
RB and p53.
3.3.8.2 Epigenetics and cancer
The term ‘epigenetics’ was first coined to explain
changes in gene expression that do not involve
changes in the underlying DNA sequence. Despite not
altering the coding sequence, the effects of epigenetic
changes are stable over rounds of cell division and
sometimes between generations. There are two princi-
pal molecular epigenetic mechanisms implicated in
cancer:
. modifications to DNA’s surface structure but not to
its basepair sequence --- DNA methylation resulting
in nonrecognition of gene transcription DNA bind-
ing domains;. modification of chromatin proteins (in particular
histones) which will not only support DNA but bind
it so tight so as to regulate gene expression --- at the
extreme such binding can permanently prevent the
DNA sequences being exposed to, let alone acted on
by, gene transcription (DNA binding) proteins.
Figure 3.26 Diagrammatic illustrations of protooncogene positions within the growth factor receptor signal transductionpathway
Table 3.11 Examples of oncogenes
Gene Function of product
Sis PDGF growth factor
ErbB/Neu EGF receptor Truncated
Erb A Thyroid hormone cytoplasmic receptor
Ras G protein
Src Membrane/cytoskeleton- associated tyrosine Kinase
Fes Cytoplasmic tyrosine kinase
Raf Serine/threonine protein kinase
Myc Fos Jun Transcription factor nuclear proteins
Chapter 3 Clinical cell biology and genetics 133

Hypermethylation of gene regulatory regions (de-
noted by CpG islands) whereby cytosine is converted
to 5-methyl cytosine has been identified at a number of
gene loci and is associated with oncogenesis. TheHic-1
gene is noticeably silenced by hypermethylation in
numerous tumours. Interestingly the enzymes respon-
sible for methylation --- DNA methyltransferases
(DNMT1 etc) --- are attracted to replication foci and
preferentially modify hemimethylated DNA CpG re-
gions. The net result is not only ‘maintenance’ of the
methylated status in daughter strands but also its
expansion within the loci.
Table 3.12 Examples of tumour suppressor genes
Gene Function of product Hereditary tumours Sporadic tumours
RB1 Transcription factor Retinal and sarcoma SCLC, breast, prostate, bladder, retinal
and sarcoma
P53 Transcription factor Li-Fraumeni syndrome --- breast,
osteosarcoma, leukaemia, soft-tissue
sarcoma
50% of all cancers
WT1* Transcription factor Nephroblastoma Nephroblastoma
APC b-catenin function --- cell adhesion
role
Familial adenomatous polyposis ---
colorectal cancer
Colorectal cancer, rarely others.
NF1* GTPase activating protein Neuroblastoma, phaeochromocytoma Melanoma, neuroblastoma
NF2 Plasmamembrane link to cytoskeleton Bilateral vestibular schwannomas Schwannomas, meningiomas,
ependymomas, melanomas, breast Ca
BRCA1þ2 DNA repair 12% of all womenwith breast Ca under
40; ovarian
Ovarian � breast
MSH2, MLH1,
PMS1þ2
DNA mismatch repair Hereditary nonpolyposis coli -
colorectal, endometrial, gastric
Colorectal, endometrial, gastric
Figure 3.27 Diagrammatic illustration of the tumour suppressor RB protein ‘gate keeper’ role in preventing cell cycleprogression from G1---S phase until progressive phosphorylation by cyclin molecules renders RB unable to bind the cyclespecific E2F transcription factor
134 Biomedical sciences

Methylation is not limited to CpG rich regions of
DNA, the associated histones are also modified as
follows. Away from the main body of the histone
complex the lysine rich tail of histone protein 3
(H3) interacts with DNA by attracting and compen-
sating for the strong polar negative charge --- with like
negative charge --- repulsion of the phosphate back-
bone of DNA. Effectively it buffers this repulsion
allowing DNA to twist and coil tighter. Acetylation of
these H3 protein tail lysines removes their buffering
positive charge causing the DNA to spring away from
the Histone packaging. In this histone influence-free
form the DNA helix is able to assume conformational
shapes driven by its own internal bond length strains.
Thus, where the double helix is under stress from
distortion by CpG rich regions this springing away
from the nucleosomal histones allows the free assump-
tion of the open Z-form of DNA double helix and
hence access to DNA binding proteins that initiate
transcription.Deacetylation of theH3 tail lysines result
in DNA being pulled onto the histone body and
effectively burying the CpG rich transcription recog-
nition regions. However, methylation of the H3 tail
lysines results in even tighter coiling and like-with-like
attraction of similar modified histones of other nu-
cleosomes. The net result is the tight packing of large
regions of DNA in what is termed hetrochromation.
Thus DNA methylation can recruit DMNTs to meth-
ylate daughter strand loci during replication and their
associated histones to padlock a gene region effectively
shut. If the region includes tumour repressor gene loci
oncogenic progression can proceed without direct
mutation of the gene in question.
More epigenetic mechanisms are being discovered
that further help explain the phenomena of ‘book
marking’ which has been observed in several biological
species. The name refers to the observation that some
genes appear to remain active long after the initiating
signals for transcription have been removed --- much
like a book falling open at a much read page once
dropped. Recent studies have focused on small RNA
species that are the product (or spliced byproduct) of
transcriptional activated genes. These RNAs tend to
form double-stranded species that keep the gene loci
open for continued transcription. This is not an un-
usual phenomenon in that the protein product of genes
such as Hnf4 and MyoD are known to feedback and
maintain autotranscription. However, small RNA spe-
cies can freely diffuse through nuclear pores and into
other cells via gap junctions. This unhindered passage
makes such RNA species pervasive, up regulating and
locking the ‘on switch’ of oncogenic genes in trans-
formedandneighbouringcellswithoutDNAmutation.
In several species the so-called maternal effect pheno-
type is believed to be due to such small RNA species
being laid down in the oocyte by nurse cells and then
acting on genes of the resulting offspring as it develops.
3.3.8.3 Hereditary predisposition to cancer
Out of all cancers 1% have a clear hereditary nature
though a more subtle genetic predisposition, for ex-
ample in affecting relative gene product function, will
undoubtedly be present in amuch higher percentage of
patients. The majority are due to inheritance of tu-
mour-suppresser gene mutations. This is not surpris-
ing in view of the crucial role in development and
differentiation of protooncogenes. Inherited onco-
genes would be expected to be lethal though two are
recognized --- MEN2 and hereditary papillary renal
cancer. Only one hit is required to lose the function of
the tumour suppressor gene if there is already a
hereditary mutation on the other allele. Compared to
patients with sporadic tumours, those with inherited
predisposition to cancer tend to develop tumours at an
earlier age and more commonly bilaterally or multifo-
cal, and often with a more restricted tissue origin.
3.3.8.4 Microsatellite instability
Microsatellites are short (50---300 bp) sequences com-
posed of tandemly repeated segments of DNA two to
five nucleotides in length (dinucleotide/trinucleotide/
tetranucleotide repeats). Scattered throughout the ge-
nome in the noncoding regions between genes or
within genes (introns), many of these microsatellites
are highly polymorphic. Often used as markers for
linkage analysis because of high variability in repeat
number between individuals, these regions are inher-
ently unstable and susceptible to mutations. Somatic
microsatellite instability (MSI) has been detected in a
number of tumours. Detecting MSI involves compar-
ing the length of microsatellite alleles amplified from
tumour DNA with the corresponding allele in normal
tissue from the same individual. Recent studies indi-
cate that MSI can be detected in approximately 90% of
tumours from individuals with hereditary nonpolypo-
sis colorectal cancer (HNPCC). The presence of these
additional microsatellite alleles (repeated segments) in
tumour cells, results from the inherent susceptibility of
Chapter 3 Clinical cell biology and genetics 135
these areas to such alterations and from mutations in
the DNA mismatch repair mechanism that would
normally correct these errors.
3.3.8.5 Tumour angiogenesis
Once a nest of cancer cells reaches 1---2mm in diame-
ter, it must develop a blood supply in order to survive
and grow larger as diffusion is no longer adequate to
supply the cells with oxygen and nutrients. As with all
tissues solid tumour cancer cells secrete substances that
promote the formation of new blood vessels --- a
process called angiogenesis. Over a dozen substances
have been identified that promote angiogenesis. (e.g.
Angiopoietin-1, basic fibroblast growth factor [bFGF]
and vascular endothelial growth factor [VEGF]). This
has lead to the discovery of a number of inhibitors of
angiogenesis and some have already advanced to clini-
cal trials as part of a cancer treatment strategy.
Several therapeutic vaccine preparations are under
development to produce a range of host immune
(humoral, cellular) against proangiogenic factors and
their receptors in tumours. One approach has been
directed at cell adhesion molecules found in tumour
blood vessels. It turns out that the new blood vessels in
tumours express a vascular integrin — designated
alpha-v/beta-3 — that is not found on the old blood
vessels of normal tissues. Vitaxin, a monoclonal anti-
body directed against the alpha-v/beta-3 vascular in-
tegrin, shrinks tumours in mice without harming
them. In Phase II clinical trials in humans, Vitaxin
has shown some promise in shrinking solid tumours
without harmful side effects.
3.4 Important techniquesin molecular cell biology
Althoughroutine laboratorybiomedical techniques are
detailed in the following biomedical discipline specific
chapters, an awareness of the techniques peculiar to, or
developing in, biomedical research rather than labora-
tory medicine diagnostic laboratories is essential as
some are now entering the clinical laboratory.
3.4.1 Monoclonal antibodies
Myeloma is a malignantly transformed B-cell lineage
which secretes a specific antibody. This fact is used to
produce specific antibodies directed toward an antigen
ofchoice.Alaboratoryanimalis injectedwiththeantigen
of choice against which it mounts an immune response.
B-cells are then harvested from the spleen. The cells are
fused en masse to a specialized myeloma cell line which
no longerproduces itsownantibody.Theresulting fused
cells, or hybridomas, are immortal and produce anti-
bodies specified by the lymphocytes of the immunized
animal. These cells scan be screened to select for the
antibody of interest which can then be produced in
limitless amounts. Modification of the mouse antibody
is then required for the recognition of the Fc (effector)
region of the antibody to initiate human defence me-
chanisms and to avoid an immune response against the
antibody shortening its half-life.Attachmentofahuman
Fc fragment to the mouse Fab fragment to create a
chimaeric antibody is called humanization.
3.4.2 Southern hybridization
DNA, which has first been digested with restriction
endonucleases (e.g. Eco-R1), can be separated by virtue
of the differential mobility of fragments of varying size
in an electrical field. This is done in an agarose gel. The
gel is then placed on a nylon transfer membrane and
the DNA is absorbed onto it by capillary action: this is
the process of Southern blotting. (Northern andWest-
ern blotting refer to essentially the same process but
usingmRNAor protein respectively rather thanDNA.)
The nylon membrane can then be incubated with a
short strand of DNA (the probe) which has been
radiolabelled with 32p. If the DNA on the membrane
contains sequences homologous to the probe then
Watson---Crick basepairing will occur and the probe
will stick to the membrane. This can be visualized by
exposing the membrane to a standard radiographic
film. Thus a probe for a given region of the genome can
be used to investigate theDNAof patients to determine
the presence or absence of a given mutation if that
mutation creates or destroys a restriction enzyme
recognition site thereby altering the size of a band on
the exposed film.
3.4.3 The polymerase chainreaction
This has led to a revolution in molecular biology.
Two unique oligonucleotide sequences on either side
136 Biomedical sciences

of the target sequence, known as primers, are mixed
together with a DNA template, a thermostable DNA
polymerase (taq polymerase) and purine and pyrimi-
dine bases attached to sugars.
In the initial stage of the reaction the DNA template
is heated to 90 �C tomake it single-stranded (denature)
and then as the reaction cools the primerswill anneal to
the template if the appropriate, complementary, se-
quence is present. Then the reaction is heated to 72 �Cfor the DNA polymerase to synthesize new DNA
between the two primer sequences. This process is
then repeated on multiple occasions, up to about 30
or so cycles, amplifying the target sequence exponen-
tially. Each cycle takes only a few minutes. The crucial
feature of PCR is that to detect a given sequence of
DNA it only needs to be present in one copy (i.e. one
molecule of DNA); this makes it extremely powerful.
The sensitivity of the technique is dictated by the
amount of amplification and thus the number of cycles
performed. The specificity relies on the uniqueness of
the oligonucleotide sequence of the primers (if the
primers bind at multiple sites then multiple DNA
sequences will be amplified).
Refinements of PCR include:
. multiplex PCR where multiple pairs of primers are
used to amplify several target areas of DNA in
parallel;. nested PCR improves the specificity of the reaction
by including a second pair of primers just within the
target sequence defined by the first set of primers;. RtPCR uses reverse transcriptase to form cDNA
frommRNAwhich can then be used for the standard
PCR reaction;. real time RtPCR is a quantitative RtPCR where
relative levels of mRNA are determined by monitor-
ing the simultaneous amplification of cDNA of the
target gene against that of a housekeeping gene
mRNA.
3.4.4 Expression microarrays/gene chips
This is a methodology developed to examine the
relative abundance of mRNA for thousands of genes
present in cells/tissue of different types or conditions.
For example, it can be used to examine the changes in
gene expression from normal colonic tissue to that of
malignant colonic polyps. The basic technology is the
ability to immobilize a sequence of DNA complemen-
tary to specific genes or different regions of known
genes, onto a solid surface in precise microdot arrays.
Total mRNA is extracted from one tissue and labelled
with fluorescent tag Cy3-Green and the mRNA from
the second tissuewith fluorescent tag Cy5-red. The two
fluorescent-tagged total mRNA sample are mixed in a
1:1 ratio and washed over the DNA gene chips. The
mRNA for specific genes will bind to their comple-
mentarymicrodot and can be detected by laser induced
excitation of the fluorescent tag and the position and
light wavelength and intensity recorded by a scanning
confocalmicroscope. The relative intensity of Cy5-red:
Cy3-green is a reliable measure of the relative abun-
dance of specificmRNAs in each sample. Yellow results
from equal binding of both fluorescent-tagged
mRNAs. If no hybridization occurs on a dot then the
area is black. The power of the system is that many
thousands of genes can be screened for not only their
expression but relative expression in normal and dis-
eased tissue. A considerable amount of computing
power and analysis is required to interpret the thou-
sands of dots on a microarray chip.
3.4.5 Genomics
An international effort to sequence the entire human
genome, all 3� 109 bp on the 24 different chromo-
somes, was officially launched in 1986 and officially
completed on the 14th April, 1983. An initial aim was
to construct genetic and physical maps of the chromo-
somes: 40 three-generation families were studied for
microsatellite and restriction enzyme (RFLP) poly-
morphisms. These landmarks are the first step in
positional cloning of a disease gene and are used as
genetic markers if they cosegregate with the disease.
Now that the entire genome has been sequenced to an
accuracy of 99.99% finding genes that are colocated
with a genetic disease marker takes a matter of hours
instead of years and is in fact a database or adapted
‘in silico’ cloning exercise.
Only 2% of the genome codes for actual proteins ---
some 30 000 genes in the human genome of 300million
bases. However, many genetic disorders are the result of
deregulation of expression and it is the control elements
surrounding the coding that are deregulated. The com-
plete sequence also gives rise to an understanding of
how genes are packaged as euchromatin or heterochro-
matin and why it is organized in the way it is.
Chapter 3 Clinical cell biology and genetics 137

3.4.6 Proteomics
A more direct route to understanding genetic and
somatic disease is by studying the protein expression
characteristics of normal and diseased cells --- the
proteome. This relies on the separation of proteins
expressed by a given tissue bymolecular size and charge
on a simple two-dimensional display and is achieved by
using two-dimensional gel electrophoresis. Thepattern
of dots corresponds to the different proteins expressed.
With the improvement in technology the patterns are
reproducible and can be stored as electronic images.
Non-, over- andunderexpressionof a givenprotein can
be detected by a corresponding change on the prote-
ome two-dimensional electrophoresis. Furthermore,
posttranslational modifications of the protein show up
as a change in either size or charge on the proteome
picture. In order to identify the altered protein, and the
posttranslational modification it may contain, posi-
tively these protein spots are eluted and subjected to
modern mass spectrometry techniques such as Matrix
assisted laser desorption (MALDI) and Electrospray
ionization (ESI) time of flight (TOF), which not only
give you the precise mass of the protein, up to �500
000Da, but also can sequence its aminoacid, phos-
phorylation and glycosylation structure. This cannot
be detected by genome analysis. Looking for such
changes has already lead to the discoveryof newprotein
markers for the diagnosis of Creutzfeldt---Jakob dis-
ease, multiple sclerosis, schizophrenia, Parkinson’s
disease (spinal fluid protein) and Alzheimer’s disease
(blood and brain proteins). In 2000, the Swiss Institute
of Bioinformatics (SIB) and the European Bioinfor-
matics Institute (EBI) announced a major effort to
annotate and describe highly accurate information
concerning human protein sequences, effectively
launching the Human Proteomics Initiative (HPI),
3.4.7 Metabolomics
In the postgenomic era, computing power, statistical
software, separation science and modern mass
spectrometry has allowed the analysis of complex
mixtures as a complete entity and not merely the
fluctuation in concentration of one analyte within
it. Metabolomics is the study of the repertoire of
nonproteinaceous, endogenously-synthesized small
molecules present in an organism. Such small
molecules include well-known compounds like glu-
cose, cholesterol, ATP and lipid signalling molecules.
These molecules are the ultimate product of cellular
metabolism and the metabolome refers to the cata-
logue of those molecules in a specific organism, for
example the human metabolome. In terms of clinical
biochemistry, the analysis of the pattern of change of
such molecules in urine samples of individuals with
and without a particular disease and those treated with
specific drugs represents a change in the metabolome.
It is very likely that, in the future, medicine-regulating
authorities will require metabolomic studies on all
new drugs.
Bibliography
Alberts, B. et al. (2008)Molecular Biology of the Cell, 5th edn,
Garland Science.
Alberts, B., Bray, D., Hopkin, K. and Johnson, A. (2009)
Essential Cell Biology, 3rd edn, Garland Publishing.
Baum, H. (1995) The Biochemists’ Songbook, 2nd edn, CRC
Press.
Pritchard, D.J. and Korf, B.R. (2007) Medical Genetics at a
Glance, 2nd edn, Wiley---Blackwell.
Reed, R., Holmes, D., Weyers, J. and Jones, A. (2007)
Practical Skills in Biomolecular Sciences, 3rd edn, Benjamin
Cummings.
138 Biomedical sciences
Chapter 4
Cellular pathology
Dr Christopher M. Stonard, MA, MB, BChir, FRCPath andJennifer H. Stonard, B.Sc., MIBMS
Cellular pathology is the area of biomedical science
that combines the disciplines of histopathology and
cytopathology. It is an increasingly loose term that
refers to the science of the investigation of disease at a
cellular level.More specifically, histopathology looks at
disease processes at a cellular level in tissues (see below)
and its sister discipline of cytopathology looks at
individual cells. In the area of healthcare provision,
histopathology is chiefly concerned with the diagnosis
of disease by the examination of tissue and cytopa-
thology by the examination of a variety of body fluids
and aspirates.
In order to understand how the examination of
tissues, body fluids and aspirates can indicate diagnos-
tic information it is necessary to review the underlying
pathological processes. This is preceded by a brief
revision of the nature of cells, tissues and organs. A
review of the fundamental principles underlying dis-
ease processes forms the first part of this chapter. The
second part of the chapter is concernedwith laboratory
techniques in cellular pathology and how they can be
applied to investigating disease.
Part I: Principles of cellularpathology
4.1 Structure and functionof normal cells, tissues andorgans
Cells are the fundamental building blocks of all tissues.
They vary enormously in morphology and function
yet all share the same principal constituents (Figure 4.1).
These include:
1. The nucleus. This contains the DNA code for vir-
tually every protein found in the body. It precisely
regulates the expression of each protein and is
fundamental to the timing of cell division.
2. The mitochondria. These are the energy providers
of the cell that convert simple sugars to an energy
source that the cell can use at the level of individual
Biomedical Sciences: Essential Laboratory Medicine, First Edition. Edited by Ray K. Iles and Suzanne M. Docherty.� 2012 John Wiley & Sons, Ltd. Published 2012 by John Wiley & Sons, Ltd.
139

molecular interactions. They also contain a small
amount of DNA encoding the few proteins not
encoded by the DNA of the cell’s nucleus.
3. The endoplasmic reticulum. This is effectively the
production and assembly line of the cell. The DNA
code for cellular proteins is translated and the
corresponding proteins assembled here. A large
proportion of those proteins destined to become
enzymes carry out their actions within the endo-
plasmic reticulum.
4. The cytoskeleton. This is, as the name indicates, the
skeleton of the cell that maintains its structural
integrity. In mobile cells its ability to be rapidly
modified and reshaped gives the cell movement
relative to its environment.
5. Cell membranes. Cell membranes are composed of
a sandwich or bilayer of phospholipid molecules
(Figure 4.2) such that the water soluble (hydrophil-
ic) components of each molecule face the watery
environment around the membrane and the insol-
uble (hydrophobic) fatty acid components face
each other. The end result is a fragile but impervious
barrier to water and water soluble substances.
A continuous membrane surrounds every cell and
every discrete functional cellular constituent (or or-
ganelle). By inserting pores and transport proteins that
allow the passage of very specific substances across the
membranes under specific conditions the cell can have
a significantly different internal composition from its
environment. In addition it can contain an assortment
of intracellular compartments that are effectively
sealed off from the bulk of the cytoplasm.
4.2 Tissues and organs
Tissues are populations of cells of the same type that are
architecturally organised into a functional structure.
Thus aggregates of fibroblasts, with their secreted
extracellular proteins, form connective tissue and col-
lections of fatty acid-storing adipocytes compose fatty
tissue. When these tissues are organised together to
form a discrete structure with one or more defined
functions they are termed an organ. In this way an
organ such as the small bowel is composed of a variety
Polar head
Phosphate
Glycerol
FattyA
(a)
cid
FattyAcid
Hydrophiliccomponent
Hydrophobiccomponent
Transportprotein
(b)
Phospholipidmolecule
Figure 4.2 The structureof a typical lipidmolecule (a) andamembrane (b). The hydrophilic parts of the lipid moleculeface the environment and the cytoplasmwhile the hydropho-bic parts face each other tomake an impermeable central core
Figure 4.1 A schematic diagram of a cell showing repre-sentations of the main organelles including the nucleus,multiple mitochondria and the endoplasmic reticulum
140 Biomedical sciences

of tissue including an epithelial layer, connective tis-
sue, smooth muscle, neural tissue and vascular tissue.
4.3 Cellular responsesto injury
In this section we will address the nature of damaging
stimuli and the corresponding cellular responses.
4.3.1 Damaging stimuli
Given that human cells are protected from their im-
mediate environment only by permeable layers of lipid
and protein they are highly vulnerable. Fortunately the
body has a wide array of mechanisms for maintaining
homeostasis and physical barriers to keep cells in a
relatively constant local environment policed by the
immune system. A selection of the more commonly
encountered means by which injurious stimuli can
breach this protection are discussed below.
4.3.1.1 Hypoxia and ischaemia
Hypoxia refers to insufficient oxygen reaching a tissue
whereas ischaemia indicates insufficient blood supply.
The two usually go hand in hand, although there are
circumstances in which hypoxia is the result of inade-
quately oxygenated blood despite a good blood supply.
Cells vary in their response to hypoxia and ischaemia
depending on their metabolic demands (e.g. a high
demand for heart muscle cells but low for fibroblasts
within scar tissue). Themechanisms and consequences
of hypoxia and ischaemia are discussed later.
4.3.1.2 Environmental
Damaging environmental factors include an enormous
range of toxic chemicals fromnaturally occurring plant
toxins and venoms to common household chemicals
and cigarette smoke. Exposure to ionizing radiation is
an inevitable fact of life and takes the form of solar
ultraviolet light, diagnostic X-rays and unavoidable
radiation from the earth around us.
4.3.1.3 Physical
Damaging physical stimuli include heat and cold out-
side the functional temperature range of cells as well as
day-to-day traumatic injuries.
4.3.1.4 Infective and immunological
The body is under constant assault from a variety of
infective agents including viruses, bacteria, fungi and
parasites. In addition the immune system itself can
damage cells, either in the course of mounting an
attack against some infective organism or because of
some form of dysfunction that results in the body
targeting itself (an autoimmune reaction).
4.3.2 Varying vulnerability
The reaction of a cell to an injurious stimulus depends
not only on the type, degree and duration of the
stimulus but also on the cell type. For example, the
more metabolically active the cell the more prone to
damage that cell will be by factors that disrupt respira-
tion and blood supply. Thus the highly metabolically
active cells of the central nervous systemwill die within
minutes of disruption of their blood supply. Similarly
those cells that proliferate rapidly (such as the epithe-
lial cells that line the intestines) are highly susceptible
to stimuli that disrupt DNA.Hence they are vulnerable
to chemical substances that disrupt DNA replication
(such as certain chemotherapeutic agents) and ioniz-
ing radiation (which is one reason that diarrhoea is an
early sign of radiation sickness).
4.3.3 Reversible versus irreversibleinjury
If the injurious stimulus is removed the degree to
which the cell can recover differs widely between cell
types and the nature of the injury. All cells have an
essential need to maintain cytoskeletal and membrane
integrity, synthesise proteins, keep their own intracel-
lular proteolytic and free radical reactions in check and
undergo metabolic respiration in order to survive. If
the injurious stimulus allows these essential functions
to continue the cell is likely to survive. Disruption of
one ormore of these functionsmeans that the cell is no
longer viable and will die. The two principal methods
of cell death (apoptosis and necrosis) are discussed
below.
Reversible injury may result in complete resolution
of cell function. In cases in which the injurious stimu-
lus is recurrent or remains at a constant non-lethal level
the cell and the tissue in which it lies may need to
Chapter 4 Cellular pathology 141

undergo adaptive changes. Tissue adaptive changes are
dealt with elsewhere (see Sections 4.7 and 4.13). Such
changes include increased production of contractile
proteins in muscle undergoing sudden extremes of use
or increased production of smooth endoplasmic retic-
ulum in liver cells exposed to a new toxin that they are
required to break down.
4.3.4 Necrosis and apoptosis
Apoptosis and necrosis are the two principal mechan-
isms of cell death. They differ in that apoptosis is an
active process mediated by the sequential actions of a
set of chemical processes within the cell. Necrosis, on
the other hand, is a passive process over which the cell
has no control.
4.3.4.1 Necrosis
Necrosis is the manifestation of irreversible cell injury
that has progressed to show the effects of enzyme
degradation on the cellular constituents. The degrad-
ing enzymes may be derived from the cells themselves
(termed autolysis) or from acute inflammatory cells
recruited to the site of necrosis (termed heterolysis).
Necrosis is often subclassified according to its mac-
roscopic appearance into a variety of groups with
colourful descriptive names such as ‘caseous’ and
‘liquefactive’ (Figure 4.3). In practical terms by far the
most commonly encountered type of necrosis is coa-
gulative necrosis and this is the type typically seen in
acute infarction.
Coagulative necrosis manifests on haematoxylin
and eosin-stained sections as a gradual loss of nuclear
and organelle detail (as basophilia, or blue staining,
fades) and increased eosinophilia (or pink staining) of
the cytoplasm which subsequently demonstrates a
‘spider web’ or ‘motheaten’ pattern of vacuolation.
The loss of basophilia is due at least in part to the
nonspecific enzymatic degradation of nucleic acids,
particularly within the nucleus. The transition of cy-
toplasm through intense eosinophilia to loss of stain-
ing altogether with patchy apparent vacuolation is the
result of denaturing of cytoplasmic proteins followed
by their degradation into peptides. The terms
‘basophilia’ and ‘eosinophilia’ are discussed in more
detail in Section 4.20.
Of the other forms of necrosis, the one which tends
to imply a specific underlying cause is that of caseous
necrosis. Caseous (‘cheese-like’) necrosis has a firm
texture and cream/yellow colour. Histologically it is
surrounded by granulomatous inflammation (see Sec-
tion 4.5). It is classically caused by infection by Myco-
bacterium tuberculosis and, unless otherwise qualified,
its description normally implies tuberculosis.
4.3.4.2 Apoptosis
Unlike necrosis, apoptosis requires the cell to be an
active participant in its own destruction through a
coordinated process of upregulation of its own en-
zymes. As well as being a response to injury it is a
normal and continuously occurring process in the
body [1]. Commonly encountered examples include
the deletion of selfreactive T-cells during lymphocyte
maturation or the involution of breast tissue after
lactation has finished. There is even at least one cell
surface receptor (called Fas) that will trigger apoptosis
if activated [2]. This is activated for example by
T lymphocytes which have detected that the cell is
infected with a virus so that the cell can be killed
before it spreads its virus to other cells.
Apoptosis may be triggered by the same injurious
agents that cause necrosis. This may occur if the
amount of damage received by the cell is sufficient to
cause irreversible damage to the DNA but the meta-
bolic and synthetic ability of the cell is still sufficiently
preserved to undertake the energy-consuming process
Figure 4.3 An irregular area of necrosis. The cellular detailhas been lost and all that remains is an amorphous area ofeosinophilic material with some occasional nuclear frag-ments. A surrounding inflammatory reaction is present andin this case consists of granulomatous inflammation (seeSection 4.5). H&E photographed at �200
142 Biomedical sciences

of apoptosis. If a cell can undergo apoptosis rather than
necrosis then this avoids the risk of the leakage of
destructive free radicals and enzymes into the extra-
cellular space with consequent damage to surrounding
cells. In the case of irreversible cell injury, apoptosis is
therefore the lesser of two evils.
Histologically the first features of apoptosis are a
shrinking of the cell together with shrinking of the
nucleus and intense nuclear basophilia (Figure 4.4).
Eventually the nucleus fragments, followed by cyto-
plasmic fragmentation and uptake by neutrophils and
macrophages.
Two important proteins in the expanding list of
cellular constituents involved in apoptosis are Bcl2 [3]
and P53 [4]. Both appear to be targets for a variety of
mechanisms that detect cellular injury and, given
sufficient indication of cellular damage, act to initiate
a family of proteases called caspases that break down
the cell. As discussed in Section 4.14, P53 is heavily
involved in the detection of DNA damage and control
of cell division. Once the caspases are activated the
process of cellular destruction proceeds through a
sequence of caspase-mediated nuclear, cytoplasmic,
organelle and cytoskeletal degradation. The result is
that the cell ends up as a cluster of neatly packaged,
harmless degradation products that importantly do
not elicit a potentially damaging inflammatory reac-
tion and are ready to be removed, for example, by a
macrophage.
4.3.5 Summary
The individual cells of the body withstand a constant
barrage of damaging stimuli of varying degrees. The
individual cellular responses are determined by a wide
variety of factors including the type and degree of
insult, the metabolic activity of the cell and the line
of cellular differentiation. The behaviour of cells in the
context of injurious stimuli is linked in a complex
fashion to the nature of the tissues of which they are a
part. This is explored in the following section.
4.4 Tissue responses toinjury: acute inflammation
Acute inflammation marks the first response to any
damage to tissues. Although usually followed by a
chronic inflammatory response, the two processes
overlap and, despite its slightly misleading name, the
acute inflammatory process may persist for as long as
its chronic inflammatory counterpart (Box 4.1).
Acute inflammation represents a delicate balancing
act between the requirements of the immune response
to mount a swift and overwhelming attack on any
damaging agent (such as an infective organism) and
the need to limit the destructive power of the immune
system in order to prevent unnecessary damage to the
surrounding normal tissue. Each stage of the process
must therefore be kept in check by a system of counter-
measures and failure at any point can have serious
consequences.
The acute inflammatory response can be divided
broadly into vascular and cellular components.
4.4.1 Vascular components
The vascular changes in acute inflammation can be
viewed as effects on the localised blood flow within the
affected tissue and effects on the permeability of the
blood vessels within and adjacent to the affected tissue.
The balance between the fluid components of blood
and tissues is dependent on pressure and osmotic gra-
dients across the blood vessel wall and the permeability
of the vessel wall (Figure 4.5). The osmotic gradient is
largely contributed to by large proteinmolecules within
the blood that cannot, under normal circumstances,
diffuse freely across the blood vessel wall. The acute
Figure 4.4 A single squamous epithelial cell is undergoingapoptosis (centre). The apoptotic cell has brightly eosino-philic (red/pink) cytoplasm and a nucleus showing conden-sation and fragmentation. There is no inflammatory reaction.H&E photographed at �400
Chapter 4 Cellular pathology 143

inflammatory response results in dilatation of the arter-
ioles supplying blood to the affected area with a net
increase in intravascular blood pressure, thus shifting
the balance in favour of fluids exiting the vessels and
entering the tissues. In addition, the increased perme-
ability of the vessel walls results in the diffusion of some
of the blood protein components out into the tissues
with an osmotic equivalent amount of fluid. The net
result is an increase in blood flow to the affected tissue
together with a shift of fluid and certain proteins from
blood to tissue. This accounts for the immediate redness
(increased blood flow) and swelling (tissue fluid accu-
mulation) seen after an injury.
The blood remaining within the vessels has a lower
proportion of fluid and protein together with a higher
proportion of cells. It is therefore more viscous than
normal and will flow less freely. The stagnation of
blood flow subsequently assists the cellular compo-
nents of acute inflammation.
4.4.2 Cellular components
The cellular hallmark of the acute inflammatory re-
sponse is the neutrophil (Figure 4.6). The neutrophil
has amyriad of actions but its key feature is its ability to
engulf and destroy material identified as foreign or
unwanted. Its destructive capacity arises from its ability
to produce a variety of substances that can break down
membranes and constituent proteins. These include a
Box 4.1 Acute inflammation unregulated
The acute inflammatory response is very fre-
quently a cause of disease but this is usually a
manifestation of being the effector arm of
another system that is functioning incorrectly.
This is illustrated by dysfunction of the im-
mune system that results in inappropriate ac-
tivation of acute inflammation, for example in
chronic diseases such as rheumatoid arthritis
or, more dramatically, in the case of anaphy-
lactic shock.
Pure dysfunctions of the acute inflammatory
response do occur and often take the form of
subtle failures to regulate the degree of response
(complete failures to regulate inflammation not
being compatible with life).
One example of subtle dysregulation is that of
a1-antitrypsin deficiency. a1-antitrypsin is a
circulating plasma protein that inhibits the ac-
tion of neutrophil elastase, one of the
neutrophil’s hydrolytic enzymes involved in
acute inflammation. There are numerous alleles
for the gene encoding the protein but one in
particular (the Z allele) greatly reduces the
amount of functional enzyme inhibitor circu-
lating in the plasma. A person with two Z alleles
has only approximately 10---15% of the normal
level of circulating enzyme inhibitor.
Most a1-antitrypsin is produced by the liver.
Many with the ZZ genotype accumulate the
aberrant protein in the liver and this can lead to
the development of cirrhosis. A higher propor-
tion however develop emphysema (a disease
characterised by destruction of the walls of the
smallest airways and airspaces in the lungs that
results in enlarged air spaces with loss of func-
tional lung tissue). This is thought to be the
result of the gradual destruction of the elastin-
rich connective tissue of the lungs by inade-
quately opposed neutrophil elastin. The process
is accelerated by anything that precipitates in-
flammation within the lungs. Smoking in par-
ticular accelerates the develop of emphysema
and this may in part be the result of inactivation
of the small amount of remaining functional
a1-antitrypsin by chemicals within cigarette
smoke.
Osmotic gradients
Pressure gradient
Colloid osmotic gradient
Figure 4.5 An illustration of the various gradients com-peting to dictate the movement of fluid and ions across thevessel wall. Added to the effect of these gradients is theselective permeability of the vessel wall
144 Biomedical sciences

range of proteases, such as collagenase and elastase,
together with enzymes that can degrade certain plasma
proteins to produce more of the chemical mediators of
inflammation (see below). In addition the neutrophil
possesses enzymes for the rapid formationof a variety of
oxygen and chloride free radicals (the so-called oxida-
tive burst) which will react with and disrupt any large
molecules in the immediate vicinity.
Most of these destructive substances are stored in
precursor form within the neutrophil’s cytoplasm in
visible bodies called lysosome granules. Upon engulf-
ing some foreign material into a phagocytic vacuole
the lysosomal granules are activated and discharged
into the vacuole (Figure 4.7). As the destructive capa-
city of the lysosomal granule components is largely pH
dependent the neutrophil can control the activity of
these dangerous agents by regulating the acidity within
the vacuole.
In addition to destruction of substances within
phagocytic vacuoles the neutrophil’s proteases and
free radicals can be released into the extracellular space.
This may happen directly (through neutrophil death
and degeneration) or through attempts to engulf
material beyond the maximum capacity of the cell
(so-called ‘frustrated phagocytosis’).
The arrival of neutrophils at the site of an injury
marks the first characteristic histological feature of
acute inflammation. Neutrophils arrive via the circu-
lating blood and their influx peaks approximately 24 h
after injury. The arrival of a second population of
inflammatory cells (macrophages) over the ensuing
24---48 h heralds the commencement of the overlap
between acute and chronic inflammatory phases.
4.4.3 Underlying mechanismsof inflammation
Themechanisms that underlie the initiation and prop-
agation of the acute inflammatory response are enor-
mously complex and detailed discussion is beyond the
scope of this review. An examination of the underlying
concepts however illustrates not only the complexity
but also the intricate ways in which the acute inflam-
matory response is interlinked with such processes
as the clotting cascade, immunity, pain and even
behaviour.
Key to the mechanisms of the inflammatory process
is thegenerationofabroadrangeof chemicalmediators.
These mediators are chemical signals that diffuse away
from the immediate site of injury and act to enhance the
various components of the process. They can have
Figure 4.7 A neutrophil phagocytosing material identifiedas foreign. Destructive enzymes are released into the phago-cytic vacuole and the material is degraded
Figure 4.6 Neutrophils within a blood vessel in crosssection. Although neutrophils are classically represented ashaving a trilobed nucleus they rarely appear trilobed inhistological section. H&E photographed at �400
Chapter 4 Cellular pathology 145

effects locally (e.g. on the surrounding cells), over short
distances (e.g. to affect the behaviour of neighbouring
blood vessels), or even over long distances (e.g. to
upregulate the production of inflammatory cells or
proteins involved in the inflammatory process by the
bone marrow and the liver respectively).
The generation of mediators can arise in a variety of
contexts. A good starting point for the exploration of
the generation of mediators is to examine the response
to injury of a blood vessel wall.
4.4.3.1 The vessel wall and injury
As virtually all tissues in the body contain a complex
network of blood vessels an injurious stimulus is likely
to involve vessel wall damage. Blood vessels of all sizes
and functions have in common a complete and con-
tinuous internal lining of endothelial cells. Thus cells
and proteins circulating in the blood do not normally
come into contact with the connective tissues that
make up the surrounding layers of the vessel wall. If
an injurious stimulus however disrupts the integrity
of the vessel wall then damage to the endothelial
cells will result in exposure of the circulating blood
to underlying connective tissue components. These
connective tissue components are recognised by
blood constituents including Factor XII and circulat-
ing platelets.
The clotting cascadeFactor XII [5] is a protein synthesised by the liver. It
forms a normal circulating blood plasma protein but
upon exposure to collagen in connective tissues and
basement membranes it is activated to become a serine
protease enzyme. This enzyme then acts on a number
of circulating proteins to initiate the clotting cascade,
the kinin cascade and, indirectly, the complement
cascade (Figure 4.8). The end result is that a small
amount of activated factorXII results in a large amount
of such mediators as bradykinin (which is a local
vasodilator, increases local vascular permeability and
stimulates local nerve endings to cause pain) and
activated components of the complement cascade
termed C3a and C5a (which are vasodilators, increase
vessel permeability and attract neutrophils). Activa-
tion of factor XII also results in the generation of fibrin
that is the scaffolding for the formation of a blood clot
at the site of injury, thus reducing any bleeding that
might be occurring from the damaged vessel, stagnating
local blood flow and forming the structure on which
repair processes can act (see Section 4.6).
The activation of factor XII is termed the intrinsic
clotting pathway. The clotting cascade can also be
activated directly by Tissue Factor, a group of sub-
stances released by damaged endothelial cells. This
latter pathway is termed the extrinsic clotting pathway
(see Chapter 8).
PlateletsPlatelets are circulating membrane-bound bodies de-
rived from the cytoplasm of large cells within the bone
marrow termed megakaryocytes. They possess a cell
surface receptor termed GPIa which binds to collagen
in exposed vessel wall basement membrane [6]. This
stimulates exposure of a second platelet surface recep-
tor complex termedGPIIb/GPIIIa. This complex binds
to von Willbrand factor, a multimeric circulating
molecule that also binds to exposed basement mem-
branes as well as binding to GPIIb/GPIIIa on other
Classical pathway Alternative pathway
C3
C3a
C5
C5a
C3b
C5b
C5-9
C6C7
C9
C8
C3bBb3bC4b2a3b
C3bBbC4b2a
C1
C2C4
C3
C3bB
D
Figure 4.8 The complement cascade is an important initi-ator and effector of inflammation. Each stage tends torepresent an amplification of the inflammatory signal
146 Biomedical sciences

platelets (Figure 4.9). The binding of the GPIIb/GPIIIa
to von Willebrand factor activates the platelet to
produce a range of mediators via the precursor ara-
chidonic acid (see below). The net result is the pro-
duction of the mediator thromboxane A2 (which is a
vasoconstrictor, activates neighbouring platelets and
causes platelets to adhere to each other) and confor-
mational changes in the platelet membrane that pro-
mote the clotting cascade. Platelet adhesion and the
clotting cascade are interlinked such that the resulting
thrombus or blood clot is a complex structure com-
posed of constituents of both pathways.
4.4.3.2 Eicosanoids
Eicosanoids are the metabolites of arachidonic acid
which is itself ametabolite ofmembranephospholipids.
As we have seen in the example of platelet activation,
some of the initiators of the acute inflammatory re-
sponse act by stimulating membrane phospholipases
to produce arachidonic acid. The subsequent metabo-
lism of arachidonic acid is via two main pathways
to form two groups of inflammatory mediators, the
leukotrienes and the prostaglandins (Figure 4.10).
The leukotrienes collectively cause vasoconstric-
tion, attract inflammatory cells and increase the per-
meability of vessel walls. The group of prostaglandins
(which includes Thromboxane A2) have varied func-
tions depending on subtype. Some cause vasocons-
triction whereas others result in vasodilatation and
increased vascular permeability. In addition, some are
cofactors in stimulating local nerve endings to give the
sensation of pain. It is the ability of a nonsteroidal
anti-inflammatory drugs (such as Aspirin and Ibupro-
fen) to block the formation of prostaglandins that
results in their properties of reducing pain and
swelling.
4.4.4 Chemotaxis
Chemotaxis is the mechanism by which acute inflam-
matory cells migrate from the circulating blood to the
site of injury. We have already seen that an acute
Fibrinogen
GPIIb/IIIa
Platelet
GP1a
Endothelial cell
Collagen
Figure 4.9 The continuous endothelial lining of this blood vessel has exposed collagen. The adhesion of a platelet triggersactivation and the adhesion of other platelets via its activated surface receptor
Chapter 4 Cellular pathology 147

injurious stimulus results in the production of a range
of mediators that alter local blood flow, increase
vascular permeability and cause localised clotting. In
addition to these actions some of the mediators (e.g.
the leukotrienes and activated complement factors C3a
and C5a) diffuse away from the site of injury to act on
nearby intact vascular endothelium to promote the
migration of acute inflammatory cells from blood to
the site of damage [7]. Once out of the blood vessels the
inflammatory cells then follow the concentration gra-
dient of mediators to reach the site of injury.
The details of the process of migration from blood
to inflamed tissue are complex but the underlying
process is one of a sequential system of interaction
between endothelial and inflammatory cell surface
proteins. The histological manifestation is divided into
rolling, firm adhesion and transmigration phases
(Figures 4.11 and 4.12). The first phase comprises
activation of endothelial cells by local diffusion of
mediators from a nearby site of injury to produce a
set of adhesion molecules that loosely bind surface
adhesion molecules on the acute inflammatory cell.
This is assisted by sluggish blood flow in the vicinity
of inflammation as discussed above. The interaction of
adhesion molecules promotes sequential expression of
more firmly adhesive surface receptors which in turn
promotes conformational changes in both endothelial
and inflammatory cells that allow the inflammatory
cells to slip between endothelial cells and enter the
extracellular space. The acute inflammatory cells are
additionally stimulated to produce enzymes that can
modify the extracellular matrix and allow migration
around the tissues (Box 4.2).
Stimulated membrane phospholipases
Arachidonic acid
Cyclooxygenase5-Lipoxygenase
5-HPETE
Leukotriene A4 (LTA4)
LTC4 LTB4
LTD4
LTE4
Prostaglandin G2 (PGG2)
PGD2
PGE2
PGF2
Prostaglandin H2 (PGH2)
Prostacyclin (PGI2)
Thromboxane A2 (TXA2)
Figure 4.10 Arachidonic acid is derived from cell mem-brane lipids and forms the basis of a broad range of inflam-matory mediators
Figure 4.11 Neutrophils adhere to the wall of a blood vessel near the site of injury. They then follow a stepwise series ofreactions that result in firmer adhesion and then activation of mechanisms for crossing through the vessel wall
148 Biomedical sciences

4.4.5 Systemic effects
In addition to the examples above, the acute inflam-
matory response results in the secretion by partici-
pating cells of a variety of mediators that circulate in
the blood and have systemic effects. Chief amongst
these are interleukins 1 and 6 (IL-1 and IL-6) and
tumour necrosis factor a (TNFa). Each of these has a
range of functions including stimulation of the liver to
secrete certain proteins involved in the inflammatory
response, stimulation of the bone marrow to produce
more acute inflammatory cells and a rise in body
temperature. The rise in body temperature is pre-
sumed to be a useful property in that it may impair
temperature-sensitive enzymatic processes in certain
infective organisms and hence decrease their ability
to replicate.
4.4.6 Summary
The acute inflammatory response is initiated by an
injurious stimulus which triggers the release of a
variety of mediators into the surrounding tissue. These
act to alter local blood flow and vascular permeability
together with initiating local mechanisms of blood
clotting if required. In addition they trigger the me-
chanisms of attracting acute inflammatory cells (of
which the neutrophil is themost important) to exit the
circulating blood and attempt to destroy the damaging
stimulus and localised dead tissue.
In reality the acute inflammatory response is inter-
linked with chronic inflammation and the immune
response and does not occur in isolation. The funda-
mental principles however are a common theme in a
range of pathological processes and their understand-
ing underlies a great many of the diseases encountered
in clinical pathology.
4.5 Tissue responses toinjury: chronic inflammation
Chronic inflammation may follow acute inflamma-
tion, may run concurrently with the acute inflamma-
tory process or may occur without a preceding acute
inflammatory reaction. Like acute inflammation the
chronic inflammatory process is intimately linkedwith
immunity. In addition however chronic inflammation
Figure 4.12 Neutrophils in a vessel in cross section. Theseneutrophils are showing adhesion to the vessel wall and willsoon undergo migration into the surrounding tissue. H&Ephotographed at �400
Box 4.2 Platelets, pain and paralysis
The group of medications known as the non-
steroidal anti-inflammatory drugs (NSAIDs)
share a common action of inhibiting the cycloox-
ygenase enzymethatmetabolisesarachidonicacid
to a range of inflammatory mediators and cofac-
tors in signalling pain. They are therefore used for
their anti-inflammatory and analgesic properties.
Best known of this group of drugs is Aspirin,
which has the ability irreversibly to inactivate
platelet cyclooxygenase at low dose. Aspirin
therefore has a significant effect on reducing the
ability of platelets to aggregate.
Myocardial infarction and stroke are two of
the western world’s biggest killers. Most myo-
cardial infarcts and the majority of strokes are
due to the obstruction by thrombus of coronary
and cerebral arteries respectively. As thrombus
formation involves platelet aggregation, preven-
tion of platelet adhesion would be a logical
approach to the prevention of myocardial in-
farction and stroke. Aspirin has proved extraor-
dinarily successful in this role and remains a
first-line treatment in both the acute manage-
ment of myocardial infarction and in its long-
term prevention.More recently developed drugs
target the platelet membrane GPIIb/GPIIIa
complex in order to prevent platelet activation
at the initial receptor binding stage.
Chapter 4 Cellular pathology 149

demonstrates considerable overlap with the processes
of repair and healing.
Chronic inflammation following on from acute
inflammation shows a temporal overlap between the
dwindling acute process as it fulfils its role and the
emergence of the repair processes. When the acute and
chronic inflammatory processes run concurrently it is
usually because the stimulus that has caused the initial
injury has not fully resolved. Given that initiation and
coordination of healing and repair form a function of
chronic inflammation it is common in this situation to
see all three processes occurring simultaneously
(Figure 4.13).
If the neutrophil is the characteristic cell of acute
inflammation then the macrophage (Figure 4.14) is its
chronic inflammatory counterpart.
4.5.1 Macrophages
Bone marrow-derived monocytes circulate in the
blood. They are attracted to the site of an inflammatory
reaction and transformed to their active form by some
of the same mediators as in acute inflammation, toge-
ther with mediators released from active lymphocytes
(particularly interferon g derived fromT lymphocytes).
Once extravascular they are termedmacrophages or, in
histological texts, histiocytes.
Like the neutrophil they have the ability to phago-
cytose and degrade extracellular material determined
as foreign or unwanted using a similar array of pro-
teases and free radicals. Macrophages can also produce
eicosanoids (see acute inflammation) and secrete a
variety of mediators of crucial importance in the
orchestration of repair and healing (see Section 4.6).
Some of these healing/repair mediators, in particular
IL-1 and TNFa, have overlapping functions with acuteinflammation (see Section 4.4.5).
A further property of themacrophage is its ability to
undergo a functional and morphological change to
become an epithelioid macrophage (Figure 4.15). The
name is derived from the histological resemblance to
an intermediate squamous epithelial cell. An aggregate
of epithelioid macrophages is called a granuloma.
Classically granulomata form in response to a foreign
substance that is too large or too inert to degrade in the
usual manner of phagocytosis and release of lysosomal
enzymes and free radicals. Such foreign substances
might include exogenous material implanted during
injury, inert mineral dusts or suture material deliber-
ately implanted during surgery.
Granulomata can also form as a consequence of the
secretion of mediators by activated T lymphocytes (see
Section 7.1.2), largely in the context of certain infec-
tions, the classic example being tuberculosis. In addi-
tion granulomata may form for reasons that have not
yet been fully established and, by virtue of their space
occupying and local destructive effects, cause disease.
The best known example of this is the systemic disease
sarcoidosis, a disease characterised by the formation of
Figure 4.14 Amacrophage (centre) with adjacent lympho-cytes, red blood cells and poorly preserved cells of uncertainnature. Note the ‘foamy’ cytoplasm and impression of someintracytoplasmic vacuoles. Rapid giemsa photographed at�600
Figure 4.13 An ulcer (right) interrupts the normal conti-nuity of the epidermal surface (left) of this skin biopsy. Thebase of the ulcer is composed of acutely inflamed granulationtissue with underlying attempts at repair. H&E photographedat �40
150 Biomedical sciences

multiple non-caseating granulomata, particularly with-
in the lungs and lymph nodes. These may be asymp-
tomatic but may affect a broader range of organs and
may even be fatal.
The formation of a granuloma effectively encases
the provoking agent (whether it is a foreign body or the
tuberculous bacillus), thereby preventing it’s migra-
tion or, in the case of infection, spread of the infective
organism. In the case of tuberculosis the infective
bacterium may remain safely contained for years, or
perhaps even the rest of the patient’s life, despite the
bacterium remaining potentially infective. Tuberculo-
sis is further discussed in Section 4.11.2.
4.5.2 Summary
Chronic inflammation represents a process that fre-
quently overlaps acute inflammation together with
healing and repair. The macrophage is the principal
orchestrator and effector cell, showing a remarkable
degree of versatility of function from removing the
products of the destructive effects of acute inflamma-
tion to stimulating the migration of the cells that begin
the repair process.
4.6 Healing and repair
Healing and repair after an acute episode of tissue
damage typically follow on directly from the acute and
chronic inflammatory responses with a large degree of
overlap in mechanism and participating cell types.
Under normal circumstances the process proceeds
through the sequence of angiogenesis, fibroblast mi-
gration and proliferationwith synthesis of extracellular
matrix material and remodelling. This sequence is
discussed in more detail below.
4.6.1 Angiogenesis
Angiogenesis is the formation of new blood vessels.
It involves a coordinated sequence of events involv-
ing the sprouting of cords of endothelial cells from
an existing blood vessel, migration through the
extracellular space and formation of a central lu-
men. Like the acute and chronic inflammatory
processes, angiogenesis involves the actions of se-
creted mediators.
The signals to existing blood vessels to sprout, and
for endothelial cells to migrate, are transmitted via
mediators using their concentration gradient as a
stimulus for direction of migration. Several mediators
have been shown to be involved, the best characterised
of which comprise the vascular endothelial growth
factor family (VEGF).
Cells within and surrounding an area of acute tissue
damage have a poor blood supply because of local
blood vessel disruption. The resulting lack of oxygen
may promote these cells to produce a set of hypoxia
inducible factors (HIFs) [8]. These are transcription
Figure 4.15 The granuloma on the left shows central necrosis with surrounding epithelioid cells, some of which havemultiple nuclei. This is typical of tuberculosis. The diagram on the right is composed of epithelioid cells with no necrosis. Thisis typical of sarcoid. H&E photographed at �100
Chapter 4 Cellular pathology 151

factors that upregulate a variety of processes to miti-
gate against oxygen deprivation. One of these is the
production and secretion of VEGF (Box 4.3).
The result of angiogenesis in an area of acute tissue
damage is the formation of a network of rudimentary
capillary-sized blood vessels surrounded by the ongo-
ing acute and chronic inflammatory processes. This
network of blood vessels is termed granulation tissue
(Figure 4.16).
4.6.2 Fibroblasts and extracellularmatrix
Fibroblasts are cells that produce the essential struc-
tural materials that form the scaffolding of tissues, the
chief of which is the family of collagens. Collagens are
tough, largely inert polymers that add marked tensile
strength to tissues and are found throughout the body,
being most densely accumulated in fibrous capsules,
tendons, ligaments and in the skin.
In a site of acute tissue injury, fibroblasts migrate in
from surrounding tissue following a concentration
gradient of mediators. These include such mediators
as platelet derived growth factor (PDGF) and trans-
forming growth factor b (TGFb) [9]. These mediators
are secreted by, amongst other cells, macrophages
involved in the inflammatory process. The arriving
fibroblasts commence secreting extracellular matrix
material and the accumulating collagen adds physical
strength to the granulation tissue. The transition from
granulation tissue to more fibrous tissue marks the
beginning of scar formation.
4.6.3 Remodelling
In addition to synthesising extracellular matrix mate-
rials such as collagen, fibroblasts are capable of break-
ing thesematerials down using a set of enzymes termed
Box 4.3 Angiogenesis --- friend and foe
Angiogenesis is a vital part of embryonic devel-
opment and of healing. It is also one of the
primary factors in allowing tumours to grow
and cancer to kill.
A tumour is as dependent on having an
adequate blood supply as any other tissue in the
body. Unless a tumour can develop its own
blood supply its growth will become limited by
the maximum distance over which adequate
diffusion of oxygen and other essential cellular
requirements can take place to meet the needs of
the neoplastic cells. In reality a tumour without
its own supply will remain a few millimetres in
maximum dimension.
As a tumour cell’s demands begin to out-
strip the ability of the local blood vessels to
provide for their needs they will begin to
become functionally hypoxic. This will there-
fore initiate the same hypoxia inducible fac-
tors as in healing and repair. Thus a dedicated
vascular supply will develop that is composed
of normal, non-neoplastic vascular endothelial
cells. Indeed some tumours overexpress an-
giogenic factors as a result of the cluster of
genetic mutations that typically occur in that
particular tumour type.
The endothelial cells involved in this process
are performing their normal physiological func-
tion in response to mediators from an abnormal
source. By responding to correct what they
interpret as injury they promote tumour growth
with potentially disastrous consequences, that is
they are helpfully unhelpful. Blocking angiogen-
esis in this particular situation is an active focus
of research and cancer therapy development.
Figure 4.16 Granulation tissue composed of numerousthin-walled blood vessels interspersed with oedematousstroma, neutrophils and chronic inflammatory cells. H&Ephotographed at �100
152 Biomedical sciences

matrix metalloproteinases [10]. These enzymes are
also produced by other cells involved in the acute and
chronic inflammatory processes, most notably macro-
phages. As the granulation tissue is gradually replaced
by fibrous tissue the fibroblasts also break down and
reform the new extracellular matrix. This process
gradually shapes the fibrous tissue to match the tensile
requirements of the tissue and attempts to minimize
the amount of fibrous tissue present at the end of the
healing and repair process --- an important function as
fibrous scar tissue is of little use and may even impair
the tissue in performing its normal role.
4.6.4 Outcomeof healing and repair
The outcome of the healing process is dependent upon
a number of factors that influence the degree to which
the healing process can restore the tissue to its pre-
injury state.
Local factors that might impair the ability to heal
include sources of ongoing inflammation or injury
such as infection or the presence of foreignmaterial. In
addition, a massive area of injury or injury at a site of
constant tissue movement such as overlying a joint
may be extremely slow to heal.
Systemic factors that might impair healing include
general malnutrition or a more specific nutritional
deficiency such as vitamin C deficiency (vitamin C
being an important factor in the synthesis of colla-
gen [11]) or poor blood supply to the affected area
(Box 4.4).
Skin wounds provide an illustration of the impor-
tance of local factors on healing. A wound in which the
skin edges can be firmly apposed (for example with
sutures) and local infection can be prevented may heal
with a barely identifiable scar. This healing of a skin
wound with apposed edges is termed healing by pri-
mary intention. If the wound cannot be closed because
of mechanical factors, such as a central area of skin is
lost and the edges cannot physically meet, then the
central defect is filled by granulation tissue. This
gradually turns to scar tissue and the process is termed
healing by secondary intention. Although the scar
tissue may remodel and slowly draw the wound edges
closer together, the result is a large area of scar forma-
tion that takes a considerable time to gain tensile
strength and may disrupt function, for example if it
crosses a joint.
4.6.5 Summary
Healing and repair generally follow the sequence of
angiogenesis, fibroblast migration and proliferation
with synthesis of extracellular matrix material and
finally remodelling. Just as the neutrophil is the star
of acute inflammation and themacrophage the orches-
trator for chronic inflammation, the fibroblast is the
principal player in healing and repair. Furthermore,
just as mediators and concentration gradients are
central to the inflammatory processes, so they are to
healing and repair.
Box 4.4 Collagen and limes
Collagen is a fibrous protein which forms a chief
component of connective tissues. It has enor-
mous tensile strength and so is abundant in
tendons, ligaments, fibrous capsules and fascia.
Part of this tensile strength is derived from
extensive crosslinking between its individual
component polypeptide strands via proline and
lysine residues. Ascorbic acid (vitamin C) is an
essential cofactor in the formation of these
crosslinks.
The human body has no capacity for synthe-
sising ascorbic acid and so is entirely reliant on
dietary intake. Deficiency of ascorbic acid results
in failure to form and maintain good quality
connective tissue with the result that wounds fail
to heal properly, the teeth can become loose and
trivial damage to the mucous membranes can
result in chronic bleeding and infection. This
condition is called scurvy.
Ascorbic acid is fortunately abundant in a
wide variety of foods, most notably fresh fruit
and vegetables. It is however largely destroyed
by intensive cooking and can be degraded during
processes designed for long-term food preserva-
tion. Because of a reliance on preserved food and
a lack of fresh fruit or vegetables, scurvy was for
centuries a serious cause of disease and even
death on long sea voyages. By the time of the
Napoleonic wars however the Royal Navy had
begun to implement preventative measures such
as the consumption of vitamin C-rich citrus
fruits such as lemons and limes. This practice
is likely to underlie the slang term ‘limey’ for
British settlers in foreign countries.
Chapter 4 Cellular pathology 153

The outcome of healing and repair is highly depen-
dent on a variety of factors from the size and position of
the focus of destruction to the general levels of nutri-
tion. Under ideal circumstances the final outcomemay
be virtually undetectable.
4.7 Hyperplasia andhypertrophy
Hyperplasia refers to an increase in the number of cells
within a tissue secondary to an increased rate of cell
division. This will usually (but not always) result in an
increase in the size of the tissue. Hypertrophy refers to
an increase in the size of the tissue without an increase
in the number of component cells. This is due to an
increase in the size of the individual cells.
4.7.1 Hyperplasia
Hyperplasia is frequently a normal event within the
body. During pregnancy the smoothmuscle cells of the
uterus (the myometrium) undergo marked hyperpla-
sia under the hormonal influence of progesterone in
order to accommodate the increasing size of the de-
veloping fetus, placenta and amniotic fluid. Simulta-
neous hyperplasia also occurs in the ducts and lobules
of the breast in order to prepare for breast feeding.
Hyperplasia also frequently occurs in pathological
states. In the case of an acute injury with significant
tissue damage, for example, the local endothelial cells
undergo hyperplasia in order to form granulation
tissue.
On occasion however the hyperplasia may itself
be pathological. With increasing age, for example,
the glandular and stromal cells of the prostate
respond to androgens with nodular hyperplasia
(Figure 4.17). Unfortunately, owing to the shape
of the median lobe of the prostate the resulting
prostatic enlargement can act like a ball valve at the
base of the bladder leading to episodes of acute and
chronic urinary retention.
A further example is that of the hyperplastic endo-
metrium. Under normal premenopausal circum-
stances the endometrium demonstrates a burst of
proliferation after menstruation which ends at about
the point of ovulation. This proliferative phase is
stimulated by elevated oestrogen levels during the first
part of the menstrual cycle. During the second part of
the cycle oestrogen levels subside and progesterone
dominates. This change in hormone ratios halts endo-
metrial proliferation and causes endometrium to
switch to a secretory function. On occasion however
this switch fails to occur and the endometrium pro-
liferates continuously, that is it is hyperplastic. Hyper-
plastic endometrium is an indicator that there is a
significant hormonal abnormality. Although this is
usually the result of some sort of imbalance in the
complex interconnected pathways or hormonal con-
trol it does on rare occasions point to more severe
abnormalities such as oestrogen-secreting tumours.
Figure 4.17 Nodules of stromal (left) and glandular (right) hyperplasia in the prostate gland. H&E photographed at �40
154 Biomedical sciences

4.7.2 Hypertrophy
In tissues in which cellular maturation has resulted in
an inability to undergo further rounds of cell division a
possible response to functional demand is simply to
synthesise more functional components. The result is
an increase in the amount of cell cytoplasm with
subsequent cellular and hence tissue enlargement. As
in hyperplasia this can be a normal process or a
response to a pathological process which may itself
become intrinsically pathological.
Exercise increases the demands placed on skeletal
muscle cells (skeletal myofibres). Skeletal myofibres do
not, under normal physiological conditions, undergo
cell division once they have reached maturity. The
response to cellular metabolic stress and damage
caused by exercise is to produce more of the cellular
constituents involved in the contraction and respira-
tion processes. Thus the myofibres enlarge and the
muscles increase in size.
A similar process occurs in cardiacmyofibres placed
under increased demand. This can be the result of a
wide range of factors that cause an increase in the
amount of blood pumped by the heart, an increase in
pumping pressure or a decrease in the efficiency of the
heart as a pump. Such factors might include profound
anaemia, systemic hypertension or valvular disease
respectively. The heart myofibres produce more con-
tractile and respiratory elements in order to improve
contractility and the heart mass increases. The heart
relies on its own blood supply supplied by the coronary
arteries and so the greater the size and contractile
activity of the heart, the closer that coronary circula-
tion will get to its maximum capacity for supplying
blood to the heart muscle. Once this capacity is ex-
ceeded the heart muscle becomes starved of oxygen.
This results in a rapid deterioration in contractility
and, more dangerously, electrical instability that can
cause sudden loss of the normal rhythm and death.
4.7.3 Summary
Hyperplasia and hypertrophy represent growth re-
sponses in tissues. Whether this response is that of
hyperplasia or hypertrophy is dependent on the ability
of the cellular components of the tissue to proliferate.
Inmost cases this growth activity is a normal response
to a change in the body’s requirements of the tissue.
In some cases however this response is intrinsically
pathological and can therefore result in significant
disease.
4.8 Atherosclerosis
Atherosclerosis is the leading cause of death in Europe
andNorth America [12] as the underlying pathological
process in ischaemic heart disease, aortic aneurysm
and cerebrovascular disease. In its established form an
artery affected by atherosclerosis shows irregular thick-
ening of the intima with underlying plaques composed
of creamy material with patchy fibrosis and calcifica-
tion. In small affected arteries the lumen may be
narrowed by the presence of plaques almost to the
point of complete occlusion.
Atherosclerosis tends to affect the large elastic,
non-muscular arteries such as the aorta and common
iliac arteries, and the medium to larger calibre muscu-
lar arteries such as the carotids, the coronaries and
femorals.
4.8.1 Risk factors
A range of risk factors has been established [13], some
of which are unavoidable. These include:
. Gender. Men are more prone to developing athero-
sclerosis than women. The difference between men
and women for symptomatic atherosclerosis is most
marked for premenopausal women. After meno-
pause the difference gradually becomes insignificant.
Thedifferenceappears tobeat least inpart related toa
protective effect of oestrogen against atherosclerosis. Age. The degree of atherosclerosis varies widely
across the population at any given age. The overall
trend however is for an increase in amount and
degree with age. The earliest features of atheroscle-
rosis (fatty streaks)may become visible in childhood.
Symptomatic disease however is rare under the age
of 40.. Family history. A predisposition to atherosclerosis
appears to run in families. A small number of directly
hereditary conditions are strong risk factors for
atherosclerosis but in most cases the inherited pre-
disposition is weak and non-Mendelian. This im-
plies a polygenic pattern of inheritance with many
potential environmental and behavioural confound-
ing factors.
Chapter 4 Cellular pathology 155
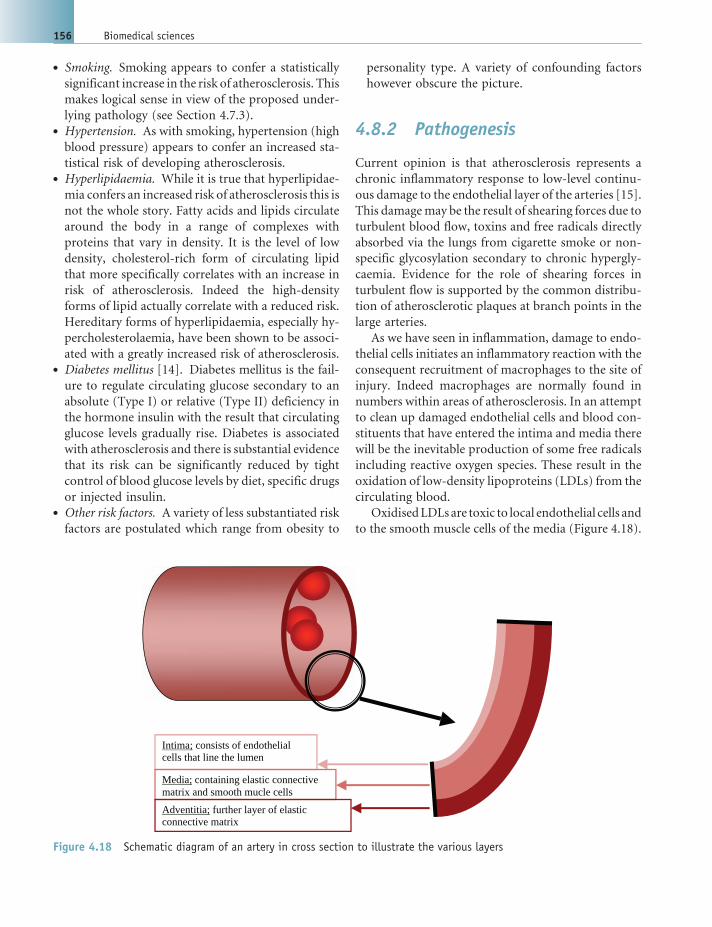
. Smoking. Smoking appears to confer a statistically
significant increase in the risk of atherosclerosis. This
makes logical sense in view of the proposed under-
lying pathology (see Section 4.7.3).. Hypertension. As with smoking, hypertension (high
blood pressure) appears to confer an increased sta-
tistical risk of developing atherosclerosis.. Hyperlipidaemia. While it is true that hyperlipidae-
mia confers an increased risk of atherosclerosis this is
not the whole story. Fatty acids and lipids circulate
around the body in a range of complexes with
proteins that vary in density. It is the level of low
density, cholesterol-rich form of circulating lipid
that more specifically correlates with an increase in
risk of atherosclerosis. Indeed the high-density
forms of lipid actually correlate with a reduced risk.
Hereditary forms of hyperlipidaemia, especially hy-
percholesterolaemia, have been shown to be associ-
ated with a greatly increased risk of atherosclerosis.. Diabetes mellitus [14]. Diabetes mellitus is the fail-
ure to regulate circulating glucose secondary to an
absolute (Type I) or relative (Type II) deficiency in
the hormone insulin with the result that circulating
glucose levels gradually rise. Diabetes is associated
with atherosclerosis and there is substantial evidence
that its risk can be significantly reduced by tight
control of blood glucose levels by diet, specific drugs
or injected insulin.. Other risk factors. A variety of less substantiated risk
factors are postulated which range from obesity to
personality type. A variety of confounding factors
however obscure the picture.
4.8.2 Pathogenesis
Current opinion is that atherosclerosis represents a
chronic inflammatory response to low-level continu-
ous damage to the endothelial layer of the arteries [15].
This damagemay be the result of shearing forces due to
turbulent blood flow, toxins and free radicals directly
absorbed via the lungs from cigarette smoke or non-
specific glycosylation secondary to chronic hypergly-
caemia. Evidence for the role of shearing forces in
turbulent flow is supported by the common distribu-
tion of atherosclerotic plaques at branch points in the
large arteries.
As we have seen in inflammation, damage to endo-
thelial cells initiates an inflammatory reaction with the
consequent recruitment of macrophages to the site of
injury. Indeed macrophages are normally found in
numbers within areas of atherosclerosis. In an attempt
to clean up damaged endothelial cells and blood con-
stituents that have entered the intima and media there
will be the inevitable production of some free radicals
including reactive oxygen species. These result in the
oxidation of low-density lipoproteins (LDLs) from the
circulating blood.
OxidisedLDLsare toxic to local endothelial cells and
to the smooth muscle cells of the media (Figure 4.18).
Intima; consists of endothelial cells that line the lumen
Media; containing elastic connective matrix and smooth mucle cells
Adventitia; further layer of elastic connective matrix
Figure 4.18 Schematic diagram of an artery in cross section to illustrate the various layers
156 Biomedical sciences

The local damage that they cause results in the re-
cruitment of more macrophages and so the cycle of
low-grade damage to the blood vessel wall continues.
Oxidised free fatty acids will also gradually complex
with circulating calcium.
As we have seen in healing and repair, macrophages
play a key role in orchestrating the repair process. They
can stimulate the proliferation of smooth muscle and
the recruitment of fibroblasts to produce collagen and
extracellular matrix. In this way the site of chronic
arterial intimal injury can evolve into a lesion that
consists of oxidised fatty material, macrophages and
disordered fibrous and muscular tissue with focal
calcification that is an atherosclerotic plaque.
4.8.3 Consequences ofatherosclerosis
The principal consequences include the following
. Thrombosis and embolism. The intimal surface of an
atherosclerotic plaque is uneven, has overlying pock-
ets of turbulent and stagnant blood, and bears
damaged endothelial cells. The surface is therefore
prone to platelet adhesion which, if unchecked, can
result in thrombus formation. The thrombus may
eventually block the artery entirely (e.g. the most
common cause of an acute myocardial infarct) or
may dislodge and block a small calibre artery down-
stream of the site of atherosclerosis (e.g. carotid
artery atherosclerosis can lead to strokes secondary
to thromboembolism because a large proportion of
the brain’s blood supply is derived from the carotid
arteries).. Plaque rupture. As plaques enlarge and expand into
the media of the artery the overlying layer of intima
becomes increasingly at risk of rupturing. The result
is a sudden in-rush of blood at pressure into the
plaque with rapid expansion which may cause the
plaque to occlude the artery. Post-mortem exami-
nation demonstrates that this is occasionally the
mechanism underlying a myocardial infarct.. Aneurysm formation. As plaques expand and en-
croach on themedia of the artery, the smoothmuscle
and its surrounding elastic and connective tissue
become more and more attenuated, weakening
the strength of the artery wall. Under the pressure
of the circulating blood the artery may gradually
dilate. This abnormally dilated segment of artery is
an aneurysm. The principal risk of aneurysm forma-
tion is that of rupture. Clearly, as atherosclerosis
tends to affect larger calibre arteries, and in particu-
lar the aorta, the consequences of aneurysm rupture
and haemorrhage are frequently fatal.
4.8.4 Summary
Atherosclerosis has a range of established risk factors
and a plausible potential mechanism for its develop-
ment. The proposed pathogenesis of a response to
chronic endothelial damage would appear to be a good
example of how the vital processes of acute inflamma-
tion, chronic inflammation, healing and repair can
occasionally be an inappropriate outcome and cause
significant disease. As the pathological mechanism
underlying the leading cause of death in the western
world and as a widespread cause of morbidity, athero-
sclerosis is of profound importance. Our understand-
ing of the underlying mechanisms is therefore crucial
in determining methods of treatment and prevention.
4.9 Thrombosis andembolism
In order to understand the pathological aspects of
thrombosis and embolism it is important to appreciate
the underlying principles of haemostasis.
4.9.1 Haemostasis
Any significant injury to a blood vessel will result in
localised bleeding which may have fatal consequences
if left unchecked. Haemostasis is the process by which
the body attempts to curb the bleeding. It has three
principal means of action:
. Local vascular effects. Damage to an arteriole or
small calibre artery results in an immediate constric-
tion of the smoothmuscle layer that forms themedia
(Figure 4.18). This has the obvious benefit of re-
stricting blood flow to the site of injury to reduce any
bleeding. The immediate response is due to a com-
bination of reflex nerve stimulation due to injury
Chapter 4 Cellular pathology 157

that signals to the artery to constrict via its own nerve
supply and by the action of localised preformed
mediators of inflammation.. The clotting cascade --- see Chapter 8.. Platelets --- see Section 4.4.
The end result of the action of haemostasis is
typically a blood clot composed of a meshwork of
fibrin and platelets which seals off the site of injury and
provides the scaffolding on which repair can take place
(see Section 4.6).
4.9.2 Thrombosis
A thrombus is a meshwork of fibrin and adherent
platelets. It is formed as a result of the actions of the
clotting cascade and platelet adhesion. In essence there-
fore a thrombus is essentially composed of the same
constituents as a blood clot. The principal difference
is that a thrombus is formed in moving blood whereas
a clot occurs in stagnant blood that has accumulated at
the site of a haemorrhage. The result is that thrombi
have an ordered structure resulting from successive
waves of fibrin deposition and platelet adhesion
arranged in an orientation that reflects the direction
of blood flow. The structure of a clot however is in
contrast apparently disorganised. The precipitants of
the formation of a thrombus were described by
Virchow [16] and, despite having been added to, still
bear his name. Although not strictly accurately named,
they are termed Virchow’s triad and consist of:
1. endothelial injury;
2. slow blood flow; and
3. hypercoagulability.
The presence of each of these three factors will
increase the likelihood of thrombus formation. The
role of endothelial injury in the activation of the
clotting cascade and platelet aggregation has been
discussed in Section 4.4. The role of hypercoagulability
is rather more complex. There are inherited deficien-
cies of some of the factors that inhibit inappropriate
clotting that can increase the risk of thrombus forma-
tion. There are in addition certain acquired conditions
(such as the conversely named lupus anticoagulant
syndrome) in which autoantibodies disrupt the clot-
ting cascade and increase the likelihood of inappropri-
ate clotting or thrombosis.
By way of illustration wewill examine two examples
of pathological thrombus formation as follows.
4.9.2.1 Atherosclerosis
As was discussed in Section 4.8, the intimal surface of
the atherosclerotic plaque is a frequent site for throm-
bus formation. The endothelium overlying the plaque
is prone to chronic damage, partially because of the
sheer stresses and turbulent flow that were presumed to
have initiated the formation of the plaque in the first
place and partially because of reactive oxygen species
and oxidised LDLs within the underlying plaque. Thus
one of Virchow’s triad is met and the likelihood of
thrombus formation increased.
In addition, the turbulent flow thought to have
initiated the plaque, combined with additional turbu-
lence caused by the presence of the plaque, creates
eddies and pockets of slow flow over the damaged
endothelial surface. Activated clotting factors in fast
flowing blood are washed away and immediately di-
luted but those in slow flowing blood have time to
propagate through the cascade. Thus slow blood flow
and localised increases in activated clotting factors
complete Virchow’s triad. It is therefore unsurprising
that atherosclerotic plaques are a common nidus for
thrombus formation.
4.9.2.2 Deep vein thrombosis
Blood pumped to the lower legs has a considerable
distance to travel in order to return to the heart and this
is frequently against gravity, even when lying down. In
order to assist venous return to the heart the major
veins of the lower legs pass through the calf and thigh
muscles and have valves to prevent backward flow.
Contraction of the calf and thighmuscles therefore acts
as a pumping mechanism, effectively functioning as a
second heart.
Prolonged immobility (e.g. due to having a leg
immobilised after a fracture) reduces the capacity of
the legmuscles to pump blood back to the heart. Blood
flow through the deep veins therefore slows right
down, thereby meeting one of Virchow’s triad. Unfor-
tunately the situation is often exacerbated by dehydra-
tion (perhaps secondary to blood loss at the time of the
injury that resulted in the leg fracture or at the time of
surgery to correct the fracture) and hypercoagulability
(secondary to amassive acute inflammatory reaction at
the site of fracture). Dehydration increases blood
158 Biomedical sciences

viscosity and therefore slows flow even further. Hyper-
coagulability increases the chances of inappropriate or
disproportionate activation of the clotting cascade.
Thus patients with lower limb fractures are at great
risk of developing deep venous thrombosis.
4.9.3 Consequences of thrombosis
These can be broadly divided into infarction, organi-
sation and thromboembolism.
4.9.3.1 Infarction
If a thrombus developing in an artery grows beyond a
critical size then the tissue supplied with blood by that
artery will receive an inadequate blood supply. The
consequences depend upon the oxygen demands of the
tissue and the anatomy of the local arteries. If the tissue
becomes necrotic as a result of vascular occlusion it has
undergone infarction (see Section 4.10).
4.9.3.2 Organization
With time endothelial cells, fibroblasts and smooth
muscle cells from the vessel wall migrate into the
thrombus and proliferate. Branching tracts of prolif-
erating endothelial cells may form an anastomosing
network of small blood vessels. Indeed vascular chan-
nels may completely traverse the length of the throm-
bus allowing blood to flow from one side to the other
(a process termed recanalisation). Eventually the
thrombus is replaced by largely fibrous tissue and
increasingly integrated into the wall of the vessel.
Organisation may be so successful that old thrombi
are only visualised as a smooth-contoured asymmet-
rical area of thickening in a vessel wall.
4.9.3.3 Thromboembolism
An embolus is material that has dislodged from its
site of origin and been carried to a new site via the
bloodstream. Although emboli may consist of bone
marrow or fat (e.g. after major trauma) or even air,
the most common type of embolus is a detached
thrombus.
Thrombi that form on atherosclerotic plaque may
dislodge, travel down the artery and occlude a smaller
branch with consequent infarction. Atherosclerosis of
the carotid artery is an occasional source of throm-
boemboli that lodge in the smaller arteries of the brain
and cause stroke.
All peripheral venous blood returns to the right side
of the heart and then passes through the pulmonary
circulation (the blood supply of the lungs). As the
pulmonary arteries transporting blood from the right
ventricle of the heart into the lungs branch into smaller
arteries they become the site of blockage of throm-
boemboli arising in the venous circulation. Unfortu-
nately the large calibre deep veins of the legs may
produce thromboemboli of considerable size, capable
of blocking the main artery to an entire lung, or even
the branch point of the pulmonary trunk immediately
after it leaves the heart. Pulmonary thromboembolism
is therefore a relatively common cause of death.
4.9.4 Summary
Haemostasis is a crucial set of processes that prevent
life-threatening haemorrhage from relatively minor
traumatic events. Just as in the case of inflammation
however there aremany occasions onwhich the normal
and vital process activated inappropriately can cause
disease and even death. In this way a system that has
evolved to prevent major haemorrhage can also result
in unwanted thrombus formation that can subsequent-
ly lead to thromboembolism. Consideration of
Virchow’s triad indicates that the circumstances in
which thrombus formation would be likely to occur
can frequently be predicted. This is of importance
because thrombosis of the deep veins of the legs, for
example, can lead to pulmonary thromboembolism
that is a very common cause of death in the western
world.
4.10 Ischaemia andinfarction
Ischaemia is inadequate blood supply to a tissue or
organ tomeet its metabolic needs. If ischaemia persists
long enough to cause necrosis in the affected tissue or
organ, that tissue or organ has undergone infarction.
Ischaemia may be transient and reversible but infarc-
tion means permanent damage.
There are essentially two different processes of
interruption to the blood supply that can result in
infarction as described below.
Chapter 4 Cellular pathology 159

4.10.1 Arterial occlusion
As discussed above, a thrombus or embolus may
occlude an artery. The consequences of occlusion are
then highly dependent upon themetabolic demands of
the tissue supplied by that artery and on the anatomy of
the local blood supply.
Tissues and organs vary in their requirements for
continuous blood supply. Fibrous connective tissue
has very low metabolic demands and so can tolerate a
poor blood supply indefinitely. Organs such as the
heart and brain however are massively demanding.
Interruption of blood supply will produce dysfunction
within seconds and infarction within a matter of
minutes. This is the reason that in the treatment of
acute myocardial infarction every second counts.
When an organ becomes acutely ischaemic the com-
ponent tissues tend to infarct in order of metabolic
demand. Thus in the intestine the highly metabolically
active mucosa infarcts long before the less demanding
smooth muscle and connective tissue.
Some organs possess an interconnecting arterial
supply from several arteries such that blocking one
artery simply means that blood has to take a more
circuitous route via alternative arterial pathways but
will still reach the tissue. In some organs however an
area of tissue is supplied by one artery only and if that
artery blocks then there is no alternative supply. Unless
the blockage is resolved promptly then infarction is
inevitable. This is unfortunately true to a great extent
in both the heart and brain.
4.10.2 Venous infarction
Venous infarction is much less common that arterial
infarction. If a vein is obstructed and no alternative
veins are available then blood has no way of leaving
the affected tissue. Blood will continue to enter the
tissue until the pressure in the small vessels of the
tissue equals that of the artery. Once this occurs no
more blood can flow into the tissue. The tissue will
therefore become ischaemic and eventually infarct.
Unlike in arterial infarction, the affected tissue is
engorged with blood but the pathology of the under-
lying necrosis is otherwise the same.
Venous infarction secondary to thrombosis is a rare
phenomenon (although can be seen with thrombus
formation primarily in the liver and venae cavae). This
is largelybecauseatherosclerosis very rarelyaffects veins
butalsobecause theanatomyof thevenoussystemtends
much more towards interconnection of vessels than
the arterial system. As veins tend to increase in calibre
along the direction of blood flow (clearly the opposite
of arteries), infarction secondary to embolism is
highly unlikely.
Themost common scenario for venous infarction is
that of torsion. Some organs or parts of an organ are
mobile within their body cavity and essentially only
anchored in place by their blood vessels and some
connective tissue. This is true for example of the
ovaries, the testes, the caecum and the sigmoid colon.
Under exceptional circumstances it is therefore possi-
ble for these organs to twist on their own vascular
pedicle. Thin-walled, low pressure veins are vulnerable
to compression by the twisting action but the thick-
walled muscular arteries at high pressure will continue
pumping blood into the twisted organ. A situationmay
then arise in which the subsequent vascular engorge-
ment swells the affected organ and makes it physically
less able to untwist. The result is therefore venous
infarction. This is not uncommon in ovaries affected
by the growth of an ovarian cyst.
4.10.3 Summary
Ischaemia is the result of insufficient blood supply to a
tissue or organ. If the tissue or organ undergoes
permanent damage as a result of ischaemia then it is
said to have infarcted. Two principal types of infarction
have been described, the more common being that of
arterial infarction secondary to arterial occlusion. The
vulnerability of tissue and organs to infarction is largely
dependent on both its metabolic requirements and the
anatomy of its arterial supply. Although venous infarc-
tion is less common than arterial, mobile organs can be
vulnerable to venous infarction under specific circum-
stances and result is morbidity or even mortality.
4.11 Amyloid andamyloidosis
Amyloid is a heterogeneous group of fibrillary pro-
teinaceous substances, all of which share the same
conformation on X-ray crystallography. They also
share the same histological appearance and a common
pattern of histochemical staining. Amyloidosis is the
160 Biomedical sciences

term for accumulation of amyloid within tissues.
Amyloidosis can be localised to the site at which the
component proteins are synthesised or can be systemic
(i.e. distributed throughout the body).
The three-dimensional structure of amyloid is that
of a so-called b-pleated sheet composed of arrays of
fibrils consisting of protein chains. The details of the
b-pleated sheet conformation are unimportant but the
crucial point is that although the component proteins
differ between different underlying causes of amyloid
formation, the overall structure is always the same.
Amyloid is characteristically extracellular and insolu-
ble with an eosinophilic staining pattern on standard
haematoxylin and eosin stained histological sections. It
is stained a deep red colour by the Congo Red staining
technique and subsequently demonstrates a yellow-
green dichroism under polarized light.
Although the fibrillary protein strands thatmake up
the b-pleated sheet are the main constituent of amy-
loid, a range of glycoproteins such as serum amyloid P
protein are also minor components.
4.11.1 Types of amyloid
Amyloid is generally classified according to the chemi-
cal nature of the fibrillary component proteins as
follows.
4.11.1.1 AL amyloid (antibody derived amyloid)
In the case of AL amyloid the component protein is
either part of or the complete immunoglobulin light
chain. In the vast majority of cases the patient will have
an elevated level of circulating monoclonal antibodies
or light chains indicative of some sort of underlying
B lymphocyte abnormality. In the majority of cases the
nature of the B cell abnormality is difficult to ascertain
but in a proportion the underlying B cell abnormality
will become apparent in the form of a B cell neoplasm
(see Section 4.14), the most significant of which is
multiple myeloma [17]. This is a malignant neoplasm
showing plasma cell differentiation that has a propen-
sity to spread widely through the bones.
4.11.1.2 AA amyloid (serum amyloid-associatedprotein)
Serum amyloid-associated protein (SAA) is a protein
synthesised by the liver that forms a normal constituent
of circulating serum proteins. Although normally as-
sociated with the transport of lipids the precise role of
SAA is still under debate. The production of certain
isoforms of SAA is increased in response to mediators
of acute inflammation. Thus amyloid derived from
SAA tends to be associated with inflammatory condi-
tions that include recurrent or prolonged episodes of
inflammation. These include rheumatoid arthritis,
osteomyelitis (bone infection) and idiopathic chronic
inflammatory bowel disease (Crohn’s disease and
ulcerative colitis).
4.11.1.3 b2-microglobulin amyloid
b2-microglobulin is a component of the MHC class I
molecule (see Chapter 7). Owing to its size and con-
formation it is not filtered out by conventional dialysis
machines and so accumulates in the blood in those on
long-term dialysis for chronic renal failure.
4.11.1.4 Localised endocrine amyloid
A variety of endocrine diseases can produce local
amyloid deposition. This is best exemplified by med-
ullary thyroid tumours in which themajor component
of the amyloid is calcitonin. Calcitonin is a hormone
produced by parafollicular cells of the thyroid glands
and is normally involved in regulating serum calcium
levels. Medullary thyroid tumours are composed of
neoplastic cells showing parafollicular cell differentia-
tion which therefore produce calcitonin inappropri-
ately and at high levels.
A myriad of other forms of amyloid are recognised
but are beyond the scope of this review.
4.11.2 Amyloidosis and disease
Amyloid is often an incidental finding on histological
examination of tissue sampled for an unrelated reason.
It may however be associated with degeneration of the
tissue inwhich it is found. The exactmechanism for this
is uncertain. Given that amyloid is frequently deposited
around blood vessels (Figure 4.19) this may be related
to localised ischaemia through disruption of transfer
across the vessel wall. The amyloid may damage tissue
simply because of its physical space-occupying pres-
ence. In addition it is possible that the amyloid itself is
inert and harmless but it is rather the effect of the
presence of high levels of the fibrillary proteins that is
Chapter 4 Cellular pathology 161

toxic (and the presence of amyloid is merely an indica-
tion that those precursors are present).
4.11.3 Summary
Amyloid is the term given to a diverse array of proteins
that share a common three-dimensional conforma-
tion, common staining properties on histological
examination and a capacity to cause disease. Identifi-
cation of the actual proteinaceous components often
indicates a significant underlying disease process (such
as the identification of amyloid composed of immu-
noglobulins and the presence of multiple myeloma).
The precise mechanism by which amyloid results in
disease still elicits a degree of debate.
4.12 Infections ofhistological importance
The laboratory investigation of infective disease is
predominantly the territory of the microbiology
laboratory. A number of infections however are com-
monly encountered in the routine workload of the
histopathology and cytopathology laboratory. Indeed
cervical cytology is almost entirely based around the
activity of a single type of viral infection (see Sec-
tion 4.12.1.1). For the purposes of this review we will
focus on a small number of the more commonly
encountered infective organisms in the UK.
4.12.1 Viruses
4.12.1.1 Human papilloma virus (HPV)
This extremely commonly encountered double-strand-
ed DNA virus is responsible for common warts and
verrucae. There is now overwhelming evidence that a
number of serotypes (in particular types 16 and 18) are
also involved in the causation of cervical carcinoma. Of
particular importance is the production by infected cells
of the virally encoded proteins called E6 and E7.
Amongst other actions these proteins inactivate p53 and
retinoblastoma (Rb) proteins produced by the host cell
(see Section 4.14) [18, 19]. The normal action of p53 and
Rb proteins is to block replication of the host cell,
especially in the context of DNA damage. Removal of
this barrier to replication may therefore result in unim-
peded proliferation of infected cells irrespective of DNA
damage with consequent increased risk of mutations
that contribute to the development of malignancy.
The UK cervical screening programme aims to
detect through exfoliative cytology the various degrees
of abnormality that arise in infected squamous epithe-
lial cells within the cervix so that treatment can be
initiated before invasive carcinoma develops (see Sec-
tion 4.13.2). These changes range from very low
risk cells showing features of HPV infection only
(Figure 4.20(a)) to grossly abnormal severely dyskar-
yotic cells (Figure 4.20(b)) at relatively high risk of
progressing to malignancy.
Although statistically themost important association,
cervical cancer is not the only malignant disease linked
with HPV. Anal cancer and penile cancer also demon-
strate strong associations with the virus and cutaneous
squamous cell carcinoma demonstrates a strong link in
the immunocompromised. There is also emerging evi-
dence of subtypes of oropharyngeal carcinoma with a
strong association with certain HPV serotypes.
4.12.2 Bacteria
4.12.2.1 Mycobacterium tuberculosis
Tuberculosis is the single most important bacterial
disease, with an estimated worldwide prevalence of
1.86 billion in 1997 [20] and worldwide mortality of
approximately 5000 people per day. Improvements
in sanitation and overcrowded housing and, more
recently, effective drug treatments meant that the
Figure 4.19 Amyloid in the wall of a blood vessel. Thisstains a deep red colour using Congo Red and demonstrates ayellow-green appearance when viewed under polarized light.Congo red photographed at �100
162 Biomedical sciences

twentieth century saw a great decline in tuberculosis in
the western world. The last 30 years however saw an
end to this decline and a re-emergence of tuberculosis,
largely as a result of the arrival of HIV.
Mycobacterium tuberculosis is an aerobic bacillus
with an ability to survive within macrophages where it
is largely safe from the immune system. Infection is
most commonly by inhalation into the lungs where the
initial inflammatory reaction occurs. M. tuberculosis
bacilli elicit a local acute inflammatory response and
are transported to regional lymphnodes at the hilumof
the infected lung within macrophages.
Eventually the immune system becomes activated
and in the immunocompetent a T cell-mediated re-
sponse kills macrophages infected with the bacilli and
assists uninfected macrophages in forming granulo-
mata and scar tissue to wall off infected foci within the
lungs and associated lymph nodes. Although infection
may be cleared at this point, some bacilli commonly
remain in the walled-off foci. Without oxygen from air
or blood these bacilli are unable to reproduce effec-
tively and so are kept in check by the immune system.
In the frail, debilitated or immunodeficient popu-
lation or in those infected with a particularly virulent
strain this T-cell mediated responsemay be inadequate
to prevent systemic infection. This may also occur in
those previously infected with tuberculosis who be-
come relatively immunodeficient, allowing old, dor-
mant bacilli to become active again. The result is
disseminated infection with multiple granulomata
throughout the body and widespread tissue destruc-
tion leading ultimately to death.
4.12.2.2 Helicobacter pylori
This gram-negative bacillus is a relatively common
incidental finding in gastric antral biopsies from the
asymptomatic patient. It demonstrates a strong asso-
ciation with chronic gastritis and with duodenal ulcer-
ation. In addition there is evidence for an aetiological
link with gastric adenocarcinoma [21] and extranodal
gastric B-cell lymphoma [22].
Helicobacter pylori possesses adhesins to bind to
gastric epithelial cells and secretes a urease enzyme
locally which produces ammonia and therefore pro-
tects the bacterium from gastric acids. The curvilinear
shape of the bacteriumwithin the surface mucus of the
gastric epitheliummakesHelicobacter pylori detectable
on histological examination of gastric biopsies (Fig-
ure 4.21). More frequently however Helicobacter colo-
nisation is detected on biopsy by simple chemical
testing for urease enzyme activity.
4.12.3 Fungi
4.12.3.1 Candida albicans
This common fungus frequently colonises the mouth
and skin without obviously causing disease. In the
otherwise healthy it may cause a range of relatively
minor diseases secondary to mucous membrane
Figure 4.20 (a) Two koilocytes. The characteristic peri-nuclear halo indicates HPV infection. Papanicolaou stainphotographed at�400 (b) A cluster of dyskaryotic cells (rightof centre). The cells are smaller than their neighbouringcounterparts but have larger, more irregular nuclei withcoarse chromatin. Papanicolaou stain photographed at �400
Chapter 4 Cellular pathology 163

infection, most commonly manifesting as oral or
vaginal white patches that can be removed to reveal
inflamed underlying squamous mucosa, better known
as ‘thrush’ (Figure 4.22). Candida albicans can also
cause an itchy rash inmoist skin folds and can result in
a chronic, hyperplastic inflammatory process in the
oral mucosa.
In the immunocompromised,Candida albicans can
cause a range of disease from oesophagitis to fatal
septicaemia. It may also infect any site in which a
foreign body can harbour growth such as intravenous
lines, catheters and prosthetic heart valves.
On histological and cytological preparations Can-
dida albicans can appear in yeast form, strings of yeast
forms arranged in long chains (pseudohyphae) and
true hyphae. Commonly a mixture of the different
forms occurs simultaneously.
4.12.4 Protozoa
4.12.4.1 Giardia lamblia
Giardia lamblia is a protozoan parasite that colonises
the proximal small bowel including duodenum [23]
The effects of infection range from asymptomatic
colonisation to severe malabsorption.
The parasite adheres to the intestinal epithelium in
its trophozoite form and can be seen in large numbers,
individual trophozoites demonstrating a characteristic
sickle shape on histological sections (Figure 4.23).
Occasional cyst forms develop and pass into the lumen
of the small intestine to be shed in the faeces. Outside
the gut the cyst form has a lifespan of approximately
2 weeks, during which time it may be ingested in
contaminated food or water to infect another small
intestine.
4.12.5 Helminths and other largerparasitic organisms
4.12.5.1 Hydatid disease
Hydatid disease is caused by ingestion of the eggs of
the dog tapeworm Echinococcus granulosus. This also
Figure 4.23 Giardia lamblia seen colonising the duodenumin this biopsy. The trophozoites have a crescent shape and areslightly detached from the epithelial surfaces in this image.H&E photographed at �400
Figure 4.21 Clusters of Helicobacter pylori within the mu-cus of a gastric crypt. Modified giemsa photographed at�600
Figure 4.22 The hyphae of Candida albicans appear asbranching lines on a cervical smear. Papanicolaou stainphotographed at �400
164 Biomedical sciences

affects sheep and so is more commonly seen in sheep
farming areas such as NorthWales and Cumbria in the
UK. The ingested eggs hatch in the duodenum and the
larvae invade through the intestinal wall to spread
widely through the body. The majority of larvae lodge
in the liver where those that survive the initial inflam-
matory response form surrounding cysts that can reach
enormous proportions. Occasionally these cysts are
biopsied (a risky procedure owing to the potential for
anaphylactic shock secondary to a reaction to the
leaked contents) because the cause of the cyst is
unknown. The cyst wall has a laminated appearance
and the refractile scolices are occasionally recognisable.
4.12.5.2 Other larger organisms
It is extremely unusual for larger parasitic organisms
to be identified in biopsies in the UK. The main
exception is that of the common pinworm Enterobius
vermicularis, which can occasionally be found in gas-
trointestinal surgical specimens including the appen-
dix (Figure 4.24). Other rare findings include the
scabies mite in diagnostic biopsies of chronic skin
rashes and more exotic organisms from foreign tra-
vellers. One example of the latter, now rarely found in
theUK, is that of the helminth Strongyloides, a parasitic
worm that is unusual in being able to reinfect its own
host repeatedly with the consequence that infection
can last decades andmay still be found in the dwindling
numbers of survivors of the SecondWorld War forced
labour camps in the jungles of south-east Asia.
4.12.6 Summary
Although primarily the territory of the microbiology
department, the identification of infective organisms
on cellular pathology preparations can be of diagnostic
assistance. Indeed the entire cervical cancer screening
programme currently revolves around spotting the
cytologic effects of Human Papilloma Virus infection
and its subsequent effects on the progression of neo-
plasia (see Section 4.14). Cellular pathological techni-
ques are normally far less robust than microbiological
techniques for identifying organisms but some infec-
tive organisms (such as Mycobacterium tuberculosis)
are difficult (and slow) to culture in a microbiology
laboratory and the clues that can be seen on histologi-
cal techniques allow for sufficient evidence to permit
treatment prior to a definitive microbiological result.
4.13 Metaplasia, dysplasiaand carcinoma in situ
4.13.1 Metaplasia
Metaplasia is the replacement of a mature tissue type
usually found at the particular site by another not
normally found at this position. The change in tissue
type is usually a response to a change in environmental
conditions such that the new tissue is better suited than
the old. In practice metaplasia is normally observed in
epithelial surfaces. The two most commonly encoun-
tered examples are present in the oesophagus and the
uterine cervix.
4.13.1.1 Oesophageal metaplasia
The oesophagus is normally lined by a layer of squa-
mous epithelium that is continuous with the squa-
mous epithelium of the pharynx and ends abruptly at
the gastro-oesophageal junction where it changes to
columnar epithelium. Squamous epithelium, best ex-
emplified in the skin, is well suited to chronic, low
grade mechanical trauma and assault by mixed bacte-
rial and fungal flora owing to its ability to shedmultiple
layers of anucleate surface cells without damage to the
underlying tissue. Thus the squamous epithelium of
the oesophagus can withstand the passage of irregular
fragments of food and exposure to the mixed flora of
themouth and sinonasal tract. The glandular surface of
Figure 4.24 Cross section through the body of Enterobiusvermicularis within the lumen of an appendix. This was anincidental findingwithin a right hemicolectomy specimen forcarcinoma. H&E photographed at �40
Chapter 4 Cellular pathology 165

the stomach however produces a mucus layer which
appears to protect the underlying tissue from acids and
digestive enzymes.
Chronic gastro-oesophageal reflux of acid, partially
digested food and digestive enzymes is relatively com-
mon, increases with age and is exacerbated by such risk
factors as obesity and hiatus hernia. With chronic
exposure of the oesophagus to stomach contents the
squamous epithelium is repeatedly eroded. Eventually
the squamous epithelium at the lower end of the
oesophagus can become partially or completely re-
placed by glandular epithelium resembling that lining
the stomach and occasionally including some epithe-
lium lining the intestine. This commonly observed
condition is termed columnar-lined oesophagus or
Barrett’s oesophagus (Figure 4.25).
4.13.1.2 Cervical metaplasia
At birth there is a clear histological distinction between
the surface of that part of the cervix lining the canal
between the vagina and endometrial cavity (the en-
docervix) and the part of the cervix projecting into the
vagina (the ectocervix) (Figure 4.26). The endocervix is
lined by mucin-secreting columnar epithelium which
is thrown into folds or crypts (usually erroneously
referred to as glands). This epithelium produces a
mucus plug that forms an effective barrier between
the endometrial cavity and the outside world.
The ectocervix is exposed to the varied flora of the
vagina and direct contact with the vaginal wall. It is
thus more suited to a squamous rather than glandular
epithelial layer. During growth and development
however the uterus changes conformation with the
result that some of the endocervix becomes everted
from the canal and effectively part of the ectocervix.
The glandular epithelial cell layer is gradually replaced
in part or entirely by squamous epithelium to match
the rest of the ectocervix. The underlying folds or
crypts however remain unchanged and are clues as to
the original position of the junction of the ecto- and
endocervix. This area of metaplasia is termed the
transformation zone. It is the area most prone to
undergoing human papilloma virus-associated dyspla-
sia (see Sections 4.12 and 4.13.2) and is therefore the
area sampled for cervical screening.
4.13.2 Dysplasia
Dysplasia means abnormal growth and as such is a
rather imprecise term that represents different things
in different contexts within the field of biomedical
science. To the cellular pathologist however it gener-
ally refers to an abnormal pattern of cellular and tissue
maturation that usually confers an increased risk of
malignancy and is the result of underlying genetic
damage.
Cells in tissues normally mature from the newly
divided state to the state recognised histologically as a
mature component of that tissue. This process relies on
a stepwise progression of the expression of various
cellular proteins as dictated by the cell’s genes. If the
dividing cell at the beginning of the process has, for
whatever reason, lost its ability to prevent genetic
mutations then it can be envisaged that the daughter
cells will eventually lose the ability to progress through
the maturation sequence in an orderly fashion because
some of the genes crucial to this process no longer
function normally. The cells will effectively become
‘stuck’ at various stages of immaturity. This process
can be illustrated in the uterine cervix, where the
process of identifying dysplasia has become the target
of a national screening programme.
As we have seen in Section 4.12, infection of squa-
mous cells of the cervix by certain serotypes of the
human Papilloma Virus (HPV) leads to the loss of
Figure 4.25 This biopsy was taken from the oesophagus.Instead of the normal squamous epithelium the biopsy islined by columnar epithelium. Most of this is of the typefound in the stomach adjacent to the gastro-oesophagealjunction. A few scattered cells are also visible that have pale-staining, slightly blue cytoplasm. These are goblet cells ofthe type seen in the intestine. H&E photographed at �100
166 Biomedical sciences

cellular checkpoints that stop the cell dividing if there is
genetic damage. If a cell therefore acquires a genetic
mutation it may well pass this mutation on to its
daughter cells before the mutation can be repaired.
With the accumulation of genetic abnormalities the
progression to cellular maturity becomes disrupted.
This becomes apparent histologically (Figure 4.27) in
the form of a failure of squamous cells to flatten and
their nuclei to shrink with distance from the basal cell
layer. The more genetic damage to the component
cells, the more likely the cells are to become stalled in a
morphologically immature state and the more abnor-
mal (or dysplastic) the growth pattern of the squamous
epithelium.
The significance of identifying dysplasia is its asso-
ciation with malignancy (see Section 4.14) and this is
both exemplified and utilised in the bowel cancer and
cervical screening programmes. It is well established
that those with invasive cancer are statistically more
likely to have concurrent nearby dysplasia on histo-
logical assessment than those without. We also know
that those with dysplasia identified are more likely to
go on to develop invasive cancer at some point
than those without. In addition the more atypical
the dysplastic changes, the higher the probability of
developing cancer and the shorter the time interval
between the identification of dysplasia and invasive
malignancy. Dysplasia would therefore appear to be a
risk factor for cancer and it is tempting to infer that
dysplasia leads to cancer. Support for this theory comes
from finding common patterns of genetic mutation in
dysplastic and malignant epithelium in the same pa-
tient compared with adjacent morphologically normal
epithelium. In reality however a large proportion of
identified dysplasia never becomes malignant and
some resolves entirely. This knowledge has been used
to determine screening age ranges and test intervals in
the cervical screening programme (Box 4.5).
4.13.2.1 Carcinoma in situ
A final comment should be made regarding the term
carcinoma in situ. This refers to the most severely
atypical and immature end of the spectrumof dysplasia
such that the normal architectural pattern of the
epithelial surface is lost entirely. Some classification
systems of dysplasia make a distinction between
severe dysplasia and carcinoma in situ as if they are
different entities. This would however appear to make
little biological sense. Indeed where carcinoma and
Birth Growth Maturation
Squamous epithelium
Endocervical epithelium
Metaplastic squamous epithelium (transformation zone)
Figure 4.26 As the uterus matures during childhood and adolescence part of the endocervical canal extends ontothe ectocervix. The glandular epithelium is gradually replaced by metaplastic squamous epithelium and forms thetransformation zone
Chapter 4 Cellular pathology 167

‘carcinoma in situ’ coexist, the true carcinoma often
appearsmuch less immature and disorganised than the
in situ component.
4.13.3 Summary
Metaplasia refers to the replacement of one normal
mature tissue type (usually epithelial) by another that
is, for a variety of reasons, more suitable to that
environment. This is frequently because the environ-
ment in which that tissue formed during embryogene-
sis has changed and twogoodexamples are given above.
Dysplasia however refers to disruption in the mat-
uration of a tissue type and, under the circumstances in
which it most frequently encountered in cellular pa-
thology, is the product of underlying genetic muta-
tions. Statistical and genetic analyses would suggest
that increasing degrees of dysplasia infer an increasing
risk of associated malignancy. Consideration of the
implications of dysplasia therefore leads into a review
of the pathological mechanisms underlying neoplasia.
4.14 Neoplasia
Neoplasia literally refers to new growth. In medical
terms however neoplasia is interpreted as new growth
that is inappropriate to its context. Unfortunately the
common usage of the term has resulted in its meaning
becoming synonymous with tumour formation or a
clonal proliferation of cells (where ‘clonal’ refers to all
of the cells in question carrying the same set of genetic
mutations, presumably derived from a common pre-
cursor, and is itself an inaccurate term as we shall see).
4.14.1 Benign versus malignant
Accepting the common use of the term in the context
of tumour formation, neoplastic lesions are classically
divided into benign and malignant categories. A third
category of ‘uncertain malignant potential’ is em-
ployed for extremely rare lesions with an unknown
natural history or formore common tumours in which
the clinical, radiological and histological features do
not give any clue as to how the tumour will behave. In
general terms a malignant neoplasm is synonymous
with cancer.
The distinction between benign and malignant in-
fers that one type of tumour will do no harm and the
other will kill. It is certainly true that malignant
tumourswill, if left untreated, go on to causemorbidity
and perhaps mortality, and that many benign tumours
are harmless. There are however numerous exceptions,
the most common cancer (basal cell carcinoma
Figure 4.27 Normal ectocervical squamous epithelium (left) shows a transition from polygonal cells with eosinophiliccytoplasm and oval nuclei at the base to flattened cells with clear cytoplasm and tiny, largely inconspicuous nuclei at thesurface. Mitotic activity is limited to the basal layer of cells. Dysplasia (right) of the cervical squamous epithelium shows thatthis orderly transition is partially lost and mitotic activity is no longer limited to the basal layer. Some of the more superficiallayers of cells include keratinocytes with hyperchromatic nuclei and a perinuclear zone of cytoplasmic pallor. It is easy toimagine that these would resemble the koilocytes discussed in Infections of Histopathological Importance. H&E photographedat �100
168 Biomedical sciences
of the skin) being a good example of a malignant
tumour that very rarely kills. In addition, certain
apparently benign tumours can be fatal. Benign
tumours within the brain may kill, simply because
they occupy space in a part of the body where there is
no room for expansion. The criteria for determining
that a tumour is malignant include metastasis and
invasion.
4.14.2 Metastasis
Metastasis is the spread of tumour from one site to
another with no physical continuity between the two.
The spread is presumed to be secondary to detachment
of tumour cells from the primary site and successful
implantation elsewhere, followed by the ability to
proliferate at the new site (Figure 4.28). Spread can
be via the circulating blood, via the lymphatics,
through the cerebrospinal fluid or across a serous body
cavity such as the peritoneal or pleural cavities. With
only a few exceptions the ability of a tumour to
metastasize defines it as malignant.
4.14.3 Invasion
The majority of tumours of clinical significance occur
in organs with an epithelial component. Such organs
usually have an ordered structure such that the epithe-
lial component is separated from the nonepithelial
component by a histologically identifiable boundary
such as a basementmembrane, amuscle layer or a layer
of myoepithelial cells. A tumour arising in the epithe-
lium remains classified as benign as long as the identi-
fiable boundary remains intact. If that barrier is seen to
be breached by the tumour, the tumour is classified as
invasive (Figure 4.29). Invasion, like metastasis, is a
defining feature of malignancy with only a few
exceptions.
Box 4.5 The UK cervical screening programme
The UK cervical screening programme offers
cervical smear tests to all women aged between
25 and 64 years. Screening tests are offered every
3 years between the ages of 25 and 49 and every
5 years thereafter.
The cervical smear test consists of examina-
tion of the surface epithelium of the cervical
transformation zone by means of exfoliative
cytology. Although two principal specimen
preparation methods are in common use, both
essentially consist of the use of a brush to obtain
the specimen and then liquid-based cytology to
prepare the slides for cytological examination
(see Section 4.15).
It is important to understand that although
cervical smears can be used to identify cervical
cancer this is not the primary purpose of the
screening programme. The purpose is to identify
the various stages of dysplasia in order to recog-
nise those women most at risk of developing
cancer so that treatment can be implemented
before cancer ever develops. In this way the
programme is estimated to prevent approxi-
mately 4500 deaths from cervical cancer per
year.1
As described in Section 4.13.2, the statistical
risk of the development of cervical cancer in-
creases with the degree of dysplasia (the equiva-
lent term being dyskaryosis in cytology) and
those with only mild degrees of abnormality are
statistically much more likely to revert to normal
than develop cancer. The prevalence of mild
abnormalities ismuch higher in younger women,
the vast majority of whom will not go on to
develop cancer if left untreated. Screening and
treating thesewomenwill therefore lead to a lot of
unnecessary procedures that are of no benefit to
the patient, costly to the NHS and not entirely
without risk of complication (although this is
extremely low). Furthermore, the rate of progres-
sion frommild to more severe abnormalities and
from severe to cancer is very variable with the
potential that cancer could develop between
smears if the interval is long enough. Against all
of these considerations is the cost of implement-
ing the programme to the NHS. The determina-
tion of the age at which to commence screening
and the interval between smears is therefore
complex and controversial with the inevitable
consequence that a small number of women will
still develop cancer despite complying with the
programme.
1NHS Cervical Cancer Screening Programme (2007) Cervical
Cancer: The Facts, Department of Health Publications
(London).
Chapter 4 Cellular pathology 169

For some epithelial and all non-epithelial tumours
the concept of invasion is more difficult to define
because there is no well-defined and histologically
identifiable barrier. Some epithelial tumours (such as
follicular tumours of the thyroid gland) develop their
own capsule of fibrous tissue. Invasion may then be
defined by a breach of the fibrous capsule to spread
into the surrounding tissue. Invasion may also be
defined by the spread into blood or lymphatic vessels
outside the bulk of the tumour. Capsular breach and
lymphovascular invasion are also defining features of
malignancy but, as is so often the case in histopathol-
ogy, there are exceptions to the rule.
4.14.4 Nomenclature in neoplasia
In general epithelial malignant tumours are termed
carcinomas and non-epithelial malignant tumours are
called sarcomas. Both benign and malignant tumours
are further subdivided into categories that are named
after the cell type they most resemble (Figure 4.30).
Thus a malignant tumour that most resembles squa-
mous epithelium is called a squamous cell carcinoma.
Similarly a malignant tumour that most resembles
fatty tissue (also known as lipoid or adipose tissue) is
called a liposarcoma.
An important point to make is that tumours are
named after the cell type that theymost resemble rather
than the tissue in which they arise. In most cases a
tumour will resemble the tissue in which it arises
but this is not always true. On occasion a malignant
tumour shows no obvious features to suggest what cell
type it is attempting to become and is therefore termed
undifferentiated or anaplastic (Figure 4.31).
If a tumour has been classified as malignant an
important role of the histopathology department is to
help clinicians provide an indicator as to the likely
behaviour of that tumour in order to determine what
possible treatments can be offered to the patient. The
range of possible treatments will, to a large degree, be
affected by the site of the tumour, but a number of
factors determined at least in part by the cellular
pathology laboratory are of great importance. These
include differentiation, grade and stage.
4.14.4.1 Differentiation
Determiningwhat cell type the tumourmost resembles
greatly affects treatment. This is based not only on the
histological appearance using conventional H&E
staining but also on the use of immunohistochemical
staining and several more rarely used ancillary tech-
niques such as electron microscopy and in situ hybrid-
isation (see Sections 4.24 and 4.25). A broad variety of
treatments are available for cancers including surgery,
radiotherapy and chemotherapy. For many tumour
Figure 4.28 Metastatic squamous cell carcinoma that ispartially replacing a lymph node. H&E photographed at �40
Figure 4.29 A small invasive squamous cell carcinoma inthe skin. The normal contour of the skin (seen at the left- andright-hand sides of the fields) with a clear demarcationbetween the squamous epithelium of the epidermis and theconnective tissue of the dermis is interrupted at the centre ofthe picture by carcinoma. Instead of a smooth junctionbetween dermis and epidermis, the dermis contains irregular,finger-like projections of squamous epithelium. This indi-cates that the basementmembrane of the epidermis has beenbreached and the lesion is invasive (i.e. malignant). H&Ephotographed at �40
170 Biomedical sciences

types surgery is the most effective treatment but for
some (including many tumours of lymphocytic differ-
entiation) surgery may be ineffective and a combina-
tion of radiotherapy and chemotherapy far more
appropriate. An increasing number of highly specific
treatment strategies are becoming available which are
so specific that they target not just a particular tumour
cell type but even a subgroupwithin that subtype. Thus
differentiation according to cell type is crucial.
4.14.4.2 Grade
Grading a tumour involves classifying the tumour
according to how closely it resembles the mature
non-neoplastic tissue type toward which it is differen-
tiating. In other words it is the degree to which the
tumour is differentiating. By way of example, a low
grade squamous cell carcinoma meets the criteria for
malignancy but otherwise closely resembles normal
squamous epithelium. In contrast, a high grade squa-
mous cell carcinoma may be barely recognisable as
squamous epithelium without a prolonged search for
histological evidence. The terms ‘well differentiated’
and ‘poorly differentiated’ are often used with inter-
changeable meaning as low grade and high grade
respectively.
Apportioning grade to a tumour is largely depen-
dent on the tumour type and there are unfortunately
numerous grading systems used in cellular pathology.
Some are semiquantitative (e.g. that used for breast
carcinoma in the UK Breast Screening Programme)
whereas others are entirely subjective. In broad terms
however the higher the grade (or poorer the differen-
tiation), the more aggressive a tumour is likely to be if
left untreated. Ironically it is the more aggressive
tumours that often respond most dramatically to
chemotherapy and radiotherapy.
4.14.4.3 Stage
Stage is a description of how extensive a tumour is,
grouped into categories according to tumour behav-
iour, response to treatment or both. The usual para-
meters considered in attributing stage include tumour
size, whether certain physical barriers within the body
have been breached and how extensive the metastases.
A tumour is usually staged according to the tissue or
organ in which it first arose, with every major organ
having its own staging system. A carcinoma in the
oesophagus will therefore be staged according to a
different system from one arising in the stomach, even
though the tumour type may be the same and the
organs lie next to each other.
Non-neoplastic counterpart Benign MalignantEpithelial
Squamous epithelium Squamous cell carcinomaGlandular epithelium Adenocarcinoma
Non-epithelialLymphoid tissue LymphomaAdipose tissue Lipoma LiposarcomaSmooth muscle Leiomyoma LeiomyosarcomaSkeletal muscle Rhabdomyoma RhabdomyosarcomaVascular endothelium Haemangioma AngiosarcomaCartilage Chondroma ChondrosarcomaBone Osteoma Osteosarcoma
Figure 4.30 Nomenclature in neoplasia
Figure 4.31 This tumour is composed of cells of all shapesand sizes, some of which have enormous and bizarrely shapednuclei. This tumour shows no morphological evidence ofdifferentiating toward any particular tissue type. The tumourwas eventually diagnosed as an embryonal sarcoma of theliver. H&E photographed at �400
Chapter 4 Cellular pathology 171

As in the case of grading there are many different
staging systems in current use. The International Un-
ion Against Cancer (UICC) attempted to produce a
universal group of site-specific staging systems for
carcinoma in order for clinicians all over the world
to be able to compare (amongst other things) prog-
nostic statistics and response to therapy. The system
for each site was classified according to the properties
of the tumour (T stage), the degree of spread to the
regional lymph nodes (N stage) and the presence and
extent of distant metastases (M stage). This so-called
TNM staging system has been widely adopted for
carcinomas and, even though other staging systems
are often used alongside, it is the one normally quoted
by clinicians in the UK when determining treatment
options (Box 4.6).
4.14.5 The cellular biologyof neoplasia
This is an enormous topic and is beyond the scope of
a short review. The broad principles however are fun-
damental to gaining an understanding of the causes,
investigations and treatments of cancer, and underpin
muchoftheactivityof thecellularpathology laboratory.
As neoplasia is essentially a genetic disease any review
needs to address some basic molecular cell biology.
4.14.5.1 The cell cycle (Figure 4.32)
The rate of turnover of cells varies widely between
tissue types. Some tissues, for example skeletal muscle
and neural tissue of the central nervous system, are
composed of cells that have apparently permanently
ceased cell division. Others, for example skin and the
epithelial lining of the gastrointestinal tract, contain
populations of cells that are continuously dividing.
Other tissues such as liver can undergo increased cell
division in response to injury but normally remain
relatively static.
Most cells in the body are in the G0 or mitotically
quiescent state. With appropriate external stimuli
some cells can be prompted to undergo division. The
process of division is represented by the cell cycle, the
significance of which is that once entered the cell is
committed to division. There are two important
checkpoints in the cycle at which division can be
halted. These lie immediately before the cell begins to
Box 4.6 The TNM staging system1
The TNM stage is composed of three core para-
meters. These describe the primary tumour (the
T stage), the presence or absence of regional
lymph node involvement (the N stage) and the
presence or absence of distant metastases (theM
stage). A variety of prefixes are often included to
indicate that the TNM stage has been applied
under specific conditions, for example a ‘y’
prefix indicates that the stage was defined after
chemotherapy or radiotherapy and a ‘p’ prefix
indicates that the stage was defined according to
the histopathological features.
An example of the TNM stage (as defined by
the histopathological features) is that commonly
applied to colorectal cancers:
T stage
pT0 no tumour identified
pT1 the tumour invades into the submucosa
pT2 the tumour invades into themuscularis
propria
pT3 the tumour breaches the muscularis
propria and invades into subserosa or
non-peritonealised pericolic or perirec-
tal tissues
pT4 the tumour directly invades other
organs and/or involves the visceral
peritoneum.
N stage
pN0 no regional lymph node involvement
pN1 one to three regional lymph nodes con-
tain metastases
pN2 more than three regional lymph nodes
contain metastases.
M stage
pM0 no distant metastasis
pM1 one or more distant metastases.
Thus a tumour invading beyond the muscu-
laris propria without involving other organs,
with two regional nodemetastases but no distant
metastases would be staged as pT3 pN1 pM0.
1Sobin, L. andWittekind,C. (2002)UICC TNMClassification
of Malignant Tumours, 6th edn, Wiley-Liss (New York).
172 Biomedical sciences

synthesise a duplicate set of chromosomes (G1
phase [24]) and immediately before the nucleus phys-
ically divides (immediately prior the M phase
diagrammatically) [25].
The first checkpoint is of importance in that it
allows the cycle to be interrupted if there is any damage
to the DNA. This allows the cell the opportunity to
repair the damage before the DNA is copied into the
new chromosomes. The second checkpoint allows the
cycle to be interrupted if there has been amajor error in
theDNAcopying process. In thisway it can be seen that
the cell has two importantmechanisms during division
for detecting damage to its genes in order to avoid
passing the damaged genes on to the daughter cells.
Both checkpoints involve the interaction of a set of
proteins called cyclins and their corresponding en-
zymes called cyclin-dependent kinases which trigger
the passage of the cell through the checkpoints. The
action of the cyclin-dependent kinase enzymes can be
blocked by a complicated cascade of proteins involved
in the detection of genetic damage. Of note is the
involvement of the multifunctional protein p53 [26]
which is closely involved in the blocking of the first
checkpoint and activation of DNA repair. Also of note
is the retinoblastoma protein [27] which is a protein
acted on by the active cyclin/cyclin-dependent kinase
complex at the first checkpoint with the effect of
triggering the transition into the S phase.
Cells with significant genetic damage should not be
able to complete the cell cycle and will be halted at one
of the two checkpoints. We have seen in Section 4.13.2
however that certain serotypes of HPV are able to
disrupt the actions of p53 and retinoblastoma protein
and therefore bypass the checkpoints. Similarly muta-
tions in the genes that encode the cyclins, cyclin-
dependent kinases, p53, retinoblastoma protein and
all of the proteins with which they interact may have
the same effect of bypassing the checkpoints. With the
checkpoints lost, the dividing cells are free to accumu-
late genetic mutations without restraint.
S
MG2
G1
Restriction point
G1 Gap one; preparation for DNA synthesis and contains an important checkpoint for damaged DNA, at this restriction point the DNA is either repaired or the cycle ceases.
S Synthesis of DNA; the DNA is uncoiled and two daughter chromatids are replicated.
G2 Gap two; the cytoplasm is prepared for mitosis.
M Mitosis; the nucleus followed by the cell as a whole is divided.
Figure 4.32 Schematic representation of the cell cycle: G1 Gap one, preparation for DNA; S Synthesis of DNA; G2 Gap two,the cytoplasm is prepared for mitosis; M Mitosis
Chapter 4 Cellular pathology 173

4.14.5.2 Stimuli to division
Cells receive a variety of signals from their environ-
ment that both promote and inhibit division. These
signals range from growth promoting or inhibiting
hormones to the membrane proteins that anchor the
cell to its neighbours and surrounding extracellular
matrix. The range of mechanisms is fairly broad but
most of these signalling pathways share the theme of
having some sort of extracellular receptor, a mecha-
nism of detecting that the receptor is activated, a
mechanism of relaying that message to the nucleus to
promote or inhibit entry into the cell cycle and a
variety of mechanisms for switching off the whole
process when the receptor becomes inactive again.
It is easy to appreciate that any errors in these
mechanisms of signalling growth promotion or inhi-
bition can result in uncontrolled or inappropriate
growth (i.e. neoplasia). A mutation in a gene encoding
a protein in a growth promoting pathway might, for
example, lead to spontaneous activation of the recep-
tor or failure to inactivate its signalling pathway after
normal activation. Numerous examples have been
identified (see Box 4.7) and their identification is
gradually assisting in unravelling the normal cellular
mechanisms of tissue growth.
4.14.5.3 Tumour growth
A group of cells that has acquired the necessary set of
mutations to proliferate without control and to bypass
restriction points that halt cell division when genetic
mutations arise is an unstable population. The inability
to correct mutations before cell division means that
when further spontaneous mutations arise then sub-
groups of cells with the new mutations will appear. If a
mutation happens to occur in a gene encoding a
protein directly involved in DNA repair then the cell
has no chance of repairing mutations and the process
of acquiring mutations accelerates.
As spontaneous gene mutations continue to occur,
subgroups of cells will arise with new mutations. If
these new mutations confer a growth advantage over
their neighbours then these cells will begin to dominate
the proliferating cell mass. Similarly mutations that
produce a subgroup with a growth disadvantage will
cause that group to dwindle. As cells within the pro-
liferatingmass are usually competing for blood supply,
the development of new cell subgroups with varying
growth advantages and disadvantages becomes a
process of natural selection. At any one time we can
see that the proliferating cell mass will be a composite
of numerous different subpopulations of cells with
some common mutations and some that differ
between subgroups.
Given the correct conditions, some cells within the
mass will develop a survival advantage by being able to
switch on genes that confer the ability to produce
enzymes that break down local cellular and extracellu-
lar boundaries, providing more physical space to the
neoplastic cells and access to new blood supplies. This
might also involve the ability to break down blood
vessel walls, to detach from the main tumour mass
within blood vessels or even to implant elsewhere and
develop new tumours. In such circumstances these
cells have crossed the boundary between benign and
malignant behaviour.
Box 4.7 Her2 and breast cancer
Her2 (human epidermal growth factor recep-
tor 2) is a member of a family of cell surface
receptor proteins that promote cell division.
Although no definite signalling hormone has
been identified that specifically activates Her2,
its close relative Her1 binds the epidermal
growth factor (EGF) hormones. Binding of EGF
to Her1 causes the receptor to dimerise and that
in turn activates a signalling pathway that pro-
motes entry of the cell into the cell cycle.
In a proportion of several cancers Her2 is
expressed at a much higher level than normal.
This overexpression greatly increases the prob-
ability of spontaneous dimerisation and promo-
tion of cell division.
The most studied cancer in which Her2 is
overexpressed is breast cancer and overexpres-
sion has been found to be linked to a marked
increase in the numbers of copies of the gene in
the malignant cells. Her2 overexpression was
found to indicate an aggressive form of the
cancer with a poor prognosis but a humanised
monoclonal antibody (called Trastuzumab) has
been developed that specifically blocks its action.
For this reason many larger cellular pathology
laboratories now routinely look for Her2 over-
expression on malignant breast biopsies to de-
termine whether Trastuzumab therapy should
be commenced.
174 Biomedical sciences

4.14.6 Genetic mutations andcarcinogens
Neoplasia would not occur without genetic mutations
and an account of neoplasia should include reference
to why they occur. Two principal causes include copy
errors and carcinogens.
4.14.6.1 Copy errors
Mitotic cell division requires a complete set of new
chromosomescopiedfromtheparentcell’sownset.The
copying process is extremely accurate considering the
amount of DNA material and the number of prolifer-
ating cells in the body. Inevitably however mistakes
ariseand,eventhoughsystemsto‘proofread’ thecopied
DNA are present and highly effective, some errors will
remain undetected. These errors can range from single
basepair copying errors to long segments of genes being
translocated from one chromosome to another.
4.14.6.2 Carcinogens
Weare constantly bombarded by a bewildering array of
radiation and chemical substances that can potentially
result inDNAdamage.Everytimewestepoutsideweare
exposed to DNA damaging ultraviolet radiation from
the sun. The earth around us contains traces of radio-
activity and even the airwebreathemay containminute
amounts of radioactive gases. An array of chemical
agents has been shown under laboratory conditions to
cause geneticmutations to a greater or lesser degree and
a cocktail of these is found in cigarette smoke. Some
albeit weak DNA damaging agents are even commonly
found constituents of our food and drink.
Considering the amount of exposure to carcinogens
we endure every day and the number of cell divisions
that are occurring at any one time it is astonishing that
genetic mutations of clinical significance are not more
common.
4.14.7 Summary
Neoplasia (according to the most commonly accepted
use of theword) is a genetic disease.We have a complex
array of cellular mechanisms for the detection and
correction of genetic abnormalities and considering
the scope for things to go wrong these mechanisms are
incredibly effective. When such mechanisms fail
however the results can range from a slowly growing
benign lump to a rapidly fatal metastatic cancer.
Part II: Clinical applicationand laboratory techniquesHaving reviewed some of themechanisms of diseasewe
can now discuss the important part that the cellular
pathology laboratory plays in diagnosis and treatment.
The clinician faced with a patient with a particular
disease will formulate a working list of potential diag-
noses (a differential diagnosis) and a plan of treatment.
In so doing the clinician may take a variety of samples
from the patient. The role of the cellular pathology
department is to prepare and analyse some those
samples to help the clinician narrow the range of
potential diagnoses, refine the treatment plan and
sometimes to monitor the effects of treatment.
Clinicians in direct contact with patients can choose
from a range of techniques or modalities for obtaining
samples of tissues or fluids.
4.15 Sampling modalities
A variety of diagnostic sampling modalities are avail-
able to the clinician, each of which has its advantages
and disadvantages. In general terms the best sampling
method is the one that provides themaximum amount
of diagnostic information for theminimum amount of
discomfort and risk to the patient. This will inevitably
vary with the degree of practical difficulty in obtaining
the sample (e.g. from a deep-seated organ in the
abdomen) and the amount of information needed in
order for the clinician to decide the optimum subse-
quent management of the lesion. The most common
sampling modalities are given below.
4.15.1 Analysis of externallysecreted bodily fluids
Any body fluid will inevitably contain some cells in
varying quantities. Saliva, sputum and semen are cell
rich whereas urine is normally relatively cell poor. Cell
rich samples can be spread directly onto a slide
and stained for visualization under the microscope
Chapter 4 Cellular pathology 175

(Figure 4.33). Cell poor specimens can be concentrated
by centrifugation or filtration to produce a higher yield
of cells.
Body fluids are easily sampled in an outpatient or
general practice setting with no obvious risk to the
patient. The amount of information that can be ob-
tainedmay be relatively limited because of degradation
of the cells of interest on their way out of the body. In
addition many of the lesions of interest that arise in
organ systems that produce externally secreted bodily
fluids are separated from the excretory tract by some
sort of physical barrier such as an epithelial layer. Thus
the cells of interest are only secreted if that barrier
becomes disrupted.
In the case of sputum the distance travelled from
lung to mouth is considerable, the cells of interest
become greatly diluted by cells derived from themouth
and upper gastrointestinal tract, and some of the lung
lesions of interest simply do not shed their cells into the
sputum until a late stage in their natural history.
Although sputum is easy to obtain it is therefore of
relatively limited diagnostic use.
4.15.2 Exfoliative cytology
This refers to obtaining cells from the surface of the
tissue under investigation by some form of scraping,
brushing or swabbing. The cells obtained can be spread
directly onto slides for viewing or concentrated by
centrifugation or filtration as above.
Themost familiar form of exfoliative cytology is the
cervical smear (Figure 4.34) whereby cells from the
cervix are collected on a brush in the general practice or
outpatient setting. These cells were formerly collected
on a spatula and then spread directly onto a slide but
this has now been superseded in the UK by a system of
collection on a brush, suspension in fluid and then a
combination of centrifugation and filtration. The end
result is a thin, concentrated layer of cells from the
cervix for analysis of the precursor stages of cervical
carcinoma.
Exfoliative cytology has the advantage over other
modalities in the ease of the procedure of obtaining the
sample and the minimal risk to the patient. In the
correct setting (such as the cervical screening pro-
gramme) the information provided can be extremely
useful. The modality does however require that the
lesion of interest is either at, or in continuity with,
an accessible epithelial surface. This is ideal for the
precursor stages of an epithelial surfacemalignancy but
of limited use for deeper lesions or for distinguishing
between an in situ and an invasive lesion.
Exfoliative cytology specimens can now be com-
bined with endoscopic procedures so that brush sam-
ples from bronchus, oesophagus and bile duct are now
used in routine diagnosis.
4.15.3 Serous cavity aspiration
Serous cavities are the internal cavities of the body,
including pleural, peritoneal and pericardial cavities.
In a range of disease processes these cavities, which
Figure 4.34 An example of exfoliative cytology --- this is acervical smear. Papanicolaou stain photographed at �400
Figure 4.33 The saliva of one of the authors showing thetypical content of mucous debris, a few bacterial clusters andnumerous superficial squamous epithelial cells. Rapid giemsaphotographed at �200
176 Biomedical sciences
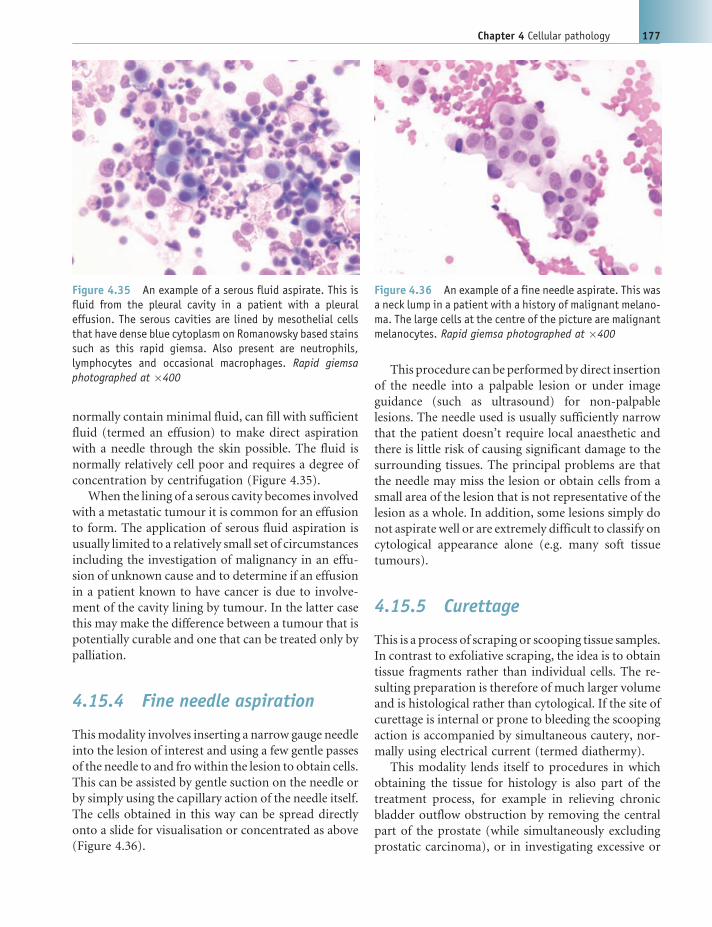
normally contain minimal fluid, can fill with sufficient
fluid (termed an effusion) to make direct aspiration
with a needle through the skin possible. The fluid is
normally relatively cell poor and requires a degree of
concentration by centrifugation (Figure 4.35).
When the lining of a serous cavity becomes involved
with a metastatic tumour it is common for an effusion
to form. The application of serous fluid aspiration is
usually limited to a relatively small set of circumstances
including the investigation of malignancy in an effu-
sion of unknown cause and to determine if an effusion
in a patient known to have cancer is due to involve-
ment of the cavity lining by tumour. In the latter case
this may make the difference between a tumour that is
potentially curable and one that can be treated only by
palliation.
4.15.4 Fine needle aspiration
Thismodality involves inserting a narrow gauge needle
into the lesion of interest and using a few gentle passes
of the needle to and fro within the lesion to obtain cells.
This can be assisted by gentle suction on the needle or
by simply using the capillary action of the needle itself.
The cells obtained in this way can be spread directly
onto a slide for visualisation or concentrated as above
(Figure 4.36).
This procedure can be performed by direct insertion
of the needle into a palpable lesion or under image
guidance (such as ultrasound) for non-palpable
lesions. The needle used is usually sufficiently narrow
that the patient doesn’t require local anaesthetic and
there is little risk of causing significant damage to the
surrounding tissues. The principal problems are that
the needle may miss the lesion or obtain cells from a
small area of the lesion that is not representative of the
lesion as a whole. In addition, some lesions simply do
not aspirate well or are extremely difficult to classify on
cytological appearance alone (e.g. many soft tissue
tumours).
4.15.5 Curettage
This is a process of scraping or scooping tissue samples.
In contrast to exfoliative scraping, the idea is to obtain
tissue fragments rather than individual cells. The re-
sulting preparation is therefore of much larger volume
and is histological rather than cytological. If the site of
curettage is internal or prone to bleeding the scooping
action is accompanied by simultaneous cautery, nor-
mally using electrical current (termed diathermy).
This modality lends itself to procedures in which
obtaining the tissue for histology is also part of the
treatment process, for example in relieving chronic
bladder outflow obstruction by removing the central
part of the prostate (while simultaneously excluding
prostatic carcinoma), or in investigating excessive or
Figure 4.36 An example of a fine needle aspirate. This wasa neck lump in a patient with a history of malignant melano-ma. The large cells at the centre of the picture are malignantmelanocytes. Rapid giemsa photographed at �400
Figure 4.35 An example of a serous fluid aspirate. This isfluid from the pleural cavity in a patient with a pleuraleffusion. The serous cavities are lined by mesothelial cellsthat have dense blue cytoplasm on Romanowsky based stainssuch as this rapid giemsa. Also present are neutrophils,lymphocytes and occasional macrophages. Rapid giemsaphotographed at �400
Chapter 4 Cellular pathology 177

prolonged menstrual bleeding by removing a propor-
tionof theendometrium(while simultaneously exclud-
ing endometrial polyps, hyperplasia or carcinoma).
4.15.6 Needle core and punchbiopsy
This refers to the sampling of a lesion using a wide bore
needle or hollow punch, the latter usually being re-
served for skin lesions. Deeper lesions can be sampled
using a spring-loaded needle that can be triggered to
biopsy once in the desired position. The biopsy posi-
tion can be guided by imaging techniques such as
ultrasound and computerised tomography.
The diagnostic uses of this technique overlap with
those of fine needle aspiration. Needle biopsy has the
advantage of demonstrating the tissue architecture in
addition to the cellular morphology. In addition it is a
more useful modality for investigating lesions that do
not readily aspirate. Its principal disadvantage is that
the calibre of the needle is significantly greater and so
requires local anaesthetic. In addition there is a greater
risk of causing damage to local structures such as large
calibre blood vessels and serous cavity walls (e.g.
penetrating the pleura during a deep breast or chest
wall biopsy). As in the case of fine needle aspiration
there is always a risk that the needle will miss the lesion
entirely or that the tissue obtained will not be repre-
sentative of the lesion as a whole.
4.15.7 Excision biopsy
This is the attempted surgical removal of the entire
lesion. It is the ultimate form of diagnostic biopsy in
that it combines removing the lesion for histological
analysis and an attempt at definitive treatment. The
entire lesion is available for histological examination,
thus avoiding the problem of sampling error. In addi-
tion there is usually sufficient lesional tissue for the
entire repertoire of histochemical staining, immuno-
histochemical staining and cytogenetics if required.
The obvious problem with excision biopsy is the
inevitable patient morbidity. This depends on the
amount of tissue removed and the site of surgery. A
small skin lesion from the back, for example, can be
removed in a general practice surgery whereas a lung
lesion may require major surgery with a high risk of
morbidity and potential mortality.
4.15.8 The role of the laboratory
As indicated above, tissue samples come in all shapes
and sizes. In the following sections we will discuss the
processes performed in histology (i.e. solid tissue
samples) and return to cytology later.
The diagnosis of disease in a tissue sample by a
histopathologist may include an important stage of
examining thewhole intact specimen (see Section 4.17)
but is chiefly concerned with the examination of
extremely thin slices (or sections) of the tissue under
the light microscope. The bulk of the work carried out
in a histopathology laboratory is therefore concerned
with the complex process of converting a piece of
human tissue to a series of thin slices on glass slides
for examination under the microscope. The stages of
this process include:
1. fixation;
2. specimen dissection (including special techniques
to assist dissection such as decalcification);
3. processing;
4. embedding;
5. microtomy;
6. staining and mounting.
In addition, the histopathology laboratory per-
forms a wide variety of ancillary techniques to assist
the histopathologist inmaking a diagnosis based on the
appearance of the tissue sections. The core stages of the
process will be discussed in turn along with the major
ancillary techniques.
4.16 Fixation
4.16.1 The purpose of fixation
Histology seeks to observe tissues in an as near to life-
like state as possible. The principal problem with the
examination of human tissue however is that of
degradation as a result of the cessation of blood and
oxygen supply, the release of destructive enzymes
within the tissue that are normally safely limited in
their actions and attack by enzymes produced by
colonising fungi, bacteria and larger organisms. It is
therefore necessary to preserve (or fix) the tissue. This
is performed using a range of different fixative agents
that act at amolecular level to alter the tissue’s chemical
178 Biomedical sciences

composition, for example by adding numerous cross-
linking bonds between long chain molecules. This has
the action of denaturing enzymes that might act to
break down the tissues, makes the tissues themselves
more resilient to enzymatic breakdown and prevents
the colonisation by bacteria and fungi that might
degrade the tissue. The earlier the tissue is treated with
a fixative agent, the closer it will remain to its original
in vivo state.
Given that fixation alters the chemical composition
of a tissue, we cannot be certain that the tissue viewed
after histological preparation is structurally anything
like fresh tissue. In other words one cannot be certain
how much of what one views under the microscope
reflects the appearance of the tissue in vivo and how
much is artefact introduced during fixation (and
other procedures in histological preparation). If we
compare several different methods of fixation
however those features that are observed on histo-
logical examination that are common to each method
are logically likely be genuine features of the tissue. In
this way we can work out which appearances are likely
to be normal for that tissue and which are products of
the fixative. We can then select the optimum fixative
for that tissue that introduces the fewest artefactual
changes (Box 4.8).
In addition to killing off any organisms that might
colonise and destroy the tissue, fixation also kills off
any organisms already present in the tissue that might
infect the laboratory scientist or pathologist. Such
infective organisms might include the human immu-
nodeficiency virus (HIV), hepatitis viruses andMycobac-
terium tuberculosis. All unfixed specimens are therefore
potential infection risks and all procedures in which
unfixed specimens are handled must be assessed and
reassessed regularly to protect staff. During review it
may be decided that there is an alternative, safer
method that could be employed or the task itself
could be deemed unnecessary.
4.16.2 Types of fixative
Precipitating fixatives such as acetone, ethanol and
methanol are fixatives that disrupt hydrophobic inter-
actions within the tertiary structure of proteins to
reduce their solubility. Cross-linking fixatives are ones
that form covalent chemical bonds across long chain
proteins, giving them added rigidity. The latter group
of fixatives tend to be grouped into the aldehydes (such
as formalin) and oxidizing agents such as osmium
tetroxide.
Factors which affect optimal fixation include:
1. pH. A fixative that is too acidic results in the
breakdown of red blood cells with a consequent
brown artefact. Fixatives are therefore usually buff-
ered to avoid variations in pH.
2. Tonicity. Fixatives must be osmotically similar to
the tissues to prevent swelling or shrinking of the
cells during fixation.
3. Thickness of specimen. Fixatives permeate the spec-
imen by diffusion. The larger the specimen themore
time it will take for the fixative to reach the centre of
the specimen and therefore themore time the tissue
will have at the centre to degrade prior to fixation.
Large specimensmay therefore be sliced or perfused
to allow even fixation.
4. Volume of fixative. Given that fixation is a chemical
reaction there must be sufficient fixative to com-
plete the process for the whole tissue before it
becomes depleted. In the case of the most com-
monly used (buffered formalin) estimates of an
Box 4.8 Fixation
Fixation is not a new technique that has arisen
from the science of histopathology. The preserv-
ing properties of such fixatives as acetic acid
(vinegar) and alcohol have been exploited since
ancient times and the process of ‘pickling’ food-
stuffs has changed little. The preservation of
animal tissue has been a reliable tool for nat-
uralists and collectors of animal specimens for
centuries.
The application of fixatives to the preserva-
tion of human tissue was well developed in
ancient China, including the use of mercuric
preserving (or embalming) fluids that could be
recognised as modern fixatives. The techniques
of perfusing the body after death with embalm-
ing fluids is still in common use, especially in
countries with warm climates or if bodies are to
be transported long distances. Famous examples
include the preservation of Horatio Nelson in a
barrel of brandy for his transfer from Gibraltar
to England and the embalming of Mao Zedong,
following which he was kept in a mausoleum in
Tiananmen Square, China.
Chapter 4 Cellular pathology 179

adequate volume would be at least 10 times that of
the specimen.
4.16.3 Drawbacks of fixation
As has been discussed, fixation may introduce artefact
into the morphology of the tissue viewed under the
microscope. In addition, as fixatives are selected for
their ability to react chemically with human tissue, they
are all potentially hazardous. Fixative solutions should
always be handled with care by trained personnel
wearing the appropriate personal protective equip-
ment (PPE). The potential dangers to staff from the
most common fixatives include carcinogenic effects,
irritant dermatitis and other toxic effects from inhala-
tion, ingestion, eye splash or skin penetration through
sharps injuries.
When disposing of fixatives local restrictions must
be adhered to and environmental issues such as the
effect on wildlife and water treatment facilities must be
considered. Some fixatives such as mercuric chloride
have added dangers of being corrosive and so famil-
iarity with standard operating procedures (SOPs) and
Control of Substances Hazardous to Health (COSHH)
guidelines produced by the UK Health and Safety
Executive [28] are vital.
Some specimens are required to be in their fresh (i.e.
unfixed) state upon arrival at the laboratory, normally
because fixation would have a negative impact on
specific investigations required of that specimen. Such
specific techniques might include enzyme studies
(such as testing for acetyl cholinesterase in suspected
Hirschsprung’s disease) in which fixation would de-
stroy the activity of the enzyme under investigation.
Other specimens commonly arriving in the laboratory
unfixed include those for direct immunofluorescence
(see Section 4.22.5) and those for urgent frozen section
examination (see Section 4.21). The majority of un-
fixed specimens will eventually be fixed and those that
are not will either be refrigerated or frozen in order to
slow down any degrading enzyme reactions.
Ideally a fixative would penetrate the tissue rapidly
and be of relatively low toxicity to staff. Above all else it
would cause no artefact in the final tissue histological
sections. Unfortunately no one single fixative meets
these criteria and a degree of compromise is required.
In practice, neutral buffered formalin is the most
readily accepted compromise and therefore the most
widely used fixative, with the additional benefit of
being relatively cheap. For this reason many of the
ancillary techniques used in histopathology begin
from the starting point of the tissue having been
formalin-fixed.
4.17 Specimen dissection
Tissue specimens range enormously in size and shape,
from a 1mmdiameter bronchial biopsy to 1mormore
of colon. The various stages of specimen handling in
the histology laboratory result in histological slices (or
sections) that are slightly less than one cell’s width in
thickness for examination under the microscope.
A typical section measures approximately 4 mm in
thickness and up to approximately 25 by 20mm in
length andwidth respectively. To examine even a 1mm
biopsy at 4 mm thickness in its entirety on histological
sections would take 250 sections. Examination of an
entire colon would require hundreds of thousands of
sections. It is therefore not realistic to section the entire
specimen and we must accept that examination must
be limited to a few sections that are interpreted as
representative of the tissue and the disease process as a
whole. For large specimens that include several differ-
ent types of tissue, some of which may be entirely
normal and some containing the disease process of
interest, careful selection of the areas of the specimen to
be sectioned is required (Figure 4.37).
The process of specimen dissection (commonly
called ‘cut up’) requires a certain amount of knowl-
edge of:
. what the disease process of interest should look like
in this particular specimen;. what parts of this type of specimen usually contain
disease if it is not visible to the naked eye;. in the context of a particular disease process in that
specimen (such as a cancer), what parts of the
specimen should be looked at to provide sufficient
information to give the clinicians an indication as to
treatment and prognosis.
This last point is of great importance in the context
of cancer surgery. Often the diagnosis of cancer is
already known and histological assessment is more
concerned with obtaining additional information such
as whether the tumour has been completely excised
and whether it has invaded into blood or lymphatic
vessels.
180 Biomedical sciences

Specimen dissection is normally performed on fixed
tissues. It can however be commenced on larger tissues
prior to fixation to allow the fixative to permeate the
whole tissue evenly.
It should be appreciated that good specimen dis-
section technique is crucial and that poor selection of
the relevant tissue for sectioning can render the rest of
the process relatively fruitless.
4.17.1 Decalcification
Calcium salts, predominantly in the form of various
calcium phosphates, are commonly found in tissues in
both normal and pathological states. They are one of
the main structural components of bones and teeth
and are also key constituents in stones that form in
various organs. Hard, insoluble calcium salts present a
significant problem for cutting thin sections and even
the hardest and sharpest of blades will struggle. The
purpose of decalcification is therefore to remove cal-
cium from tissues prior to processing in order to allow
sections to be cut. Calcification is usually recognised at
the time of specimen dissection, to which it can be a
significant barrier, and steps to permit dissection as
well as allow adequate sectioning are usually per-
formed at this stage.
There are two main types of decalcifying solutions
available. The purpose of both is essentially to convert
calcium ions from an insoluble to a soluble form so
that they are dissolved out of the tissue. The two types
are described below.
4.17.1.1 Chelating solutions
Chelating solutions act by a slow process of ion
exchange at a pH close enough to that of the
fixative such that additional chemical reactions
with the tissue are kept to a minimum. They can
therefore take a considerable amount of time to act
but avoid introducing significant amounts of artefact
that might alter morphology, staining pattern or have
a detrimental effect on immunohistochemical staining
properties. This is important for tissues such as bone
marrow in which cytomorphology and immunohis-
tochemical staining are paramount. It is also crucial in
cases in which fine disruptions in normal architecture
might have very significant consequences (e.g., the
examination of paediatric ribs in child abuse cases).
As chelating solutions draw out the calcium into
the solution itself, the solution must be changed
frequently to allow the continuation of the process
to completion.
4.17.1.2 Acid solutions
These dissolve the insoluble calcium salts rapidly
but result in additional chemical reactions that may
alter the staining pattern, introduce artefact and dis-
rupt the potential for ancillary techniques such as
Figure 4.37 A skin ellipse (left) excised from a patient with a suspicious patch of brown pigmentation measuringapproximately 5mm in diameter. Cutting the skin in the planes indicated produces complete transverse slices of theunderlying lesion (right). Sections cut from these slices will allow not only diagnosis but measurement of clinically usefulparameters such as the distances to the nearest deep and peripheral surgical resection margins (indicated). These parametersare useful for the clinician in determining whether the lesion can be regarded as completely excised
Chapter 4 Cellular pathology 181

immunohistochemistry. They are however useful if a
result is required quickly and fine detail is not essential
(e.g. to assess whether a tumour that has already been
diagnosed in a previous biopsy is involving bone).
Different strengths of acid solutions are available from
the more mild formic acid up to concentrated nitric
acid. In general terms, the stronger the acid, the more
rapid the decalcification but the greater the chance of
disrupting the soft tissue.
There is a range of solutions available for decalcification
and the appropriate one should be selected for each
particular tissue type and diagnostic situation. Ethylene-
diamine tetraacetic acid (EDTA) is a chelating solution
and is useful for bone marrow trephines and paediatric
ribs. Trichloroacetic acid (TCA) is an acid decalcification
solutionand isuseful for samples containingbone suchas
teeth, femoral heads and parts of mandibles.
In a small number of circumstances it is the calcifi-
cation itself that is of diagnostic significance. An
important aim of the breast screening programme is
to identify fine areas of calcification within the breast
that might signify an accompanying pathological pro-
cess such as early cancer. In this situation it is necessary
to retain the calciumwithin the tissue sections asmuch
as is technically possible so that its presence can be
detected by the pathologist and any associated pathol-
ogy identified. In such cases decalcification would
therefore be inappropriate.
There are several end point tests available that can
test for the amount of residual calcium within the
tissues either directly or indirectly. Direct testing in-
cludes the performance of X-ray, which is not disrup-
tive to the tissue but is expensive and time consuming.
Physical testing involves manipulation of the tissue to
test its flexibility and ability to be cut with a blade. This
is extremely quick and straightforward but can be
detrimental to the integrity of the specimen.
Indirectmethods are usually less accurate as they are
testing the decalcifying solution rather than the tissue
itself. An example of an indirect method is the ammo-
niumoxalate test inwhich ammoniumoxalate is added
to the decalcifying solution and will react with any
calcium present to form a cloudy precipitate of poorly
soluble calcium oxalate. If the decalcifying solution is
frequently changed then the amount of calcium in the
solution after it has been exposed to the tissue will
reflect the amount of calcium still left in the tissue.
Once calcium stops exiting the tissue into the solution
then the tissue has decalcified as much as it ever will.
A sample of the solution will therefore not form a
precipitate with ammonium oxalate.
In addition to soaking the specimen in a decalcify-
ing solution prior to processing, decalcification can be
performed on the cut surface of tissue blocks embed-
ded in wax at the time of sectioning. The same dec-
alcifying agents will suffice and the procedure is useful
either for problematic tissue that did not quite decal-
cify enough prior to processing or for tissues in which
small foci of calcification were not identified at the
time of tissue dissection and block selection.
4.17.2 Other obstacles tosectioning
In addition to insoluble calcium salts, other hard
substances can be present in tissues that prevent sec-
tioning. These are most commonly artificially im-
planted items such as sutures and surgical staples that
simply require the object to be picked out of the
specimen. The principal naturally occurring hindrance
to sectioning other than calcium salts is keratin, most
commonly in the form of skin horns and nails.
Keratins are structural proteins that form the main
constituents of hair and nails in humans aswell as claws
and feathers in other animals (Box 4.9). Fixation
further strengthens the structural properties of keratin
but several proprietary agents are available for soften-
ing the structural rigidity.
4.18 Processing andembedding
In order to cut very thin sections of tissue for exami-
nation under themicroscope the tissuemust somehow
be made sufficiently rigid to maintain structural integ-
rity whilst being sliced with a blade to less than the
thickness of one cell, usually of the order of 4 mm. The
tissue (which at this thickness is largely colourless
and transparent) must also however be made readily
available for the application of assorted stains and
other ancillary histological techniques. The best means
of performing this function is therefore to integrate the
tissue into some solid medium that can support the
tissue during the sectioning stage but can be removed
once the thin tissue section is safely attached to a glass
182 Biomedical sciences

slide so that the tissue is once more accessible for
staining.
A wide variety of waxes, resins and plastics can be
used for this purpose and each has its advantages and
disadvantages. Compromises must be made between
the ease of sectioning, rigidity of the medium and the
ability to remove the medium as required. In practice
the most commonly used medium is paraffin wax
which has the principal advantages of being cheap,
readily available and easily removed from the tissue
using the organic solvent xylene.
The use of paraffin wax presents the principal
obstacle of not being water soluble. As we have seen
above, fixatives have to be aqueous and be osmotically
similar to cells or would otherwise cause catastrophic
osmotic damage to fresh tissue that would make
histological interpretation impossible. Transferring
the tissue straight from its watery fixative into wax
however would result in complete failure of the wax
to bond to or penetrate the tissue and this in turn
would effectively negate the purpose of wax embed-
ding. The tissue, now fixed and therefore no longer so
osmotically sensitive, must therefore be converted
from being largely aqueous to being ready to bond to
paraffin wax. This sequence of events is called
processing.
4.18.1 Dehydrating and clearingagents
Routine processing is usually automated and uses
machines that are programmable to match the type
and size of tissue specimens. After penetration with
formalin the tissue must be gradually taken through a
series of increasing concentrations of alcohol to reduce
the water content. An increasing alcohol series is used
because, even in the fixed state, the sudden osmotic
changes produced by immersing straight into pure
alcohol may introduce artefact.
Absolute alcohol will notmix with paraffin wax and
so the tissue is treated with an organic solvent (most
commonly xylene, although other agents such as tolu-
ene are in commonuse) that will mixwith both alcohol
and wax. Xylene and other such organic solvents are
also known as clearing agents because they remove
lipids and therefore the adipose tissues become op-
tically translucent. The molten paraffin wax can then
be introduced to the tissues and will permeate through
the xylene. Once fully penetrated by paraffin wax, the
tissues can be embedded in a block of wax ready for
sectioning.
In the busy histopathology laboratory there is a
continuous risk of pieces of tissue from different speci-
mens becoming mixed. If the mixed pieces of tissue
happen to be of the same tissue type there is a very real
risk of misdiagnosis. For this reason all of the tissue
from each specimen is processed in plastic permeable
containers (called cassettes), each of which is labelled
with a unique number assigned to that particular
specimen (Figure 4.38). Thus at any point in the
process the tissue in a particular cassette can be
matched to the specimen from which it came.
4.18.2 Embedding
Embedding is the process of transferring tissues from
each cassette into a mould (Figure 4.39) and setting
Box 4.9 Keratin
Keratins are a family of structural proteins that
are present in a wide variety of cells but manifest
most obviously in forming one of the principal
components of skin, hair and nails (as well as
scales, claws and shells in other animals).
Occasional surgical specimens include a large
amount of tough keratin. Lesions may arise in
the vicinity of a nail (e.g. a variant of melanoma
has a propensity to arise in the nail bed) and
some dysplastic skin lesions result in the forma-
tion of a hard mass of overlying keratin. It is
therefore sometimes necessary to obtain sections
through a tough keratinous structure. This pre-
sents the obvious problems of the keratin being
difficult to cut and, because whatever tissue the
keratin is attached to will bemuch softer, tearing
of the section at the interface between hard and
soft. Fixation exacerbates the situation by hard-
ening the keratin and making it less susceptible
to softening in water.
A number of softening agents are commer-
cially available for softening formalin-fixed ker-
atin and these are of variable efficacy. A variety of
home-made softeners are also used with mixed
results. These include alkalinized washing-up
liquid and washing powder.
Chapter 4 Cellular pathology 183

them in position within the support medium with
which they were finally penetrated during processing.
This is then allowed to harden prior to cutting sections.
The most common technique in paraffin wax embed-
ding is to place the tissue into ametal mould, fill it with
molten wax and then allow it to cool and harden on ice
with the plastic cassette placed on top. In this way the
block of wax containing tissue remains attached to the
cassette in which it was processed so that it is still
identifiable by its specimen number label (Figure 4.40).
Where there aremultiple pieces of tissue, asmuch as
is practical, the pieces should all be flat, lying within the
same plane and with no overlapping or touching of the
separate pieces. This enables a clearer examination of
the full face of all the pieces within the same section.
The crucial element of embedding is that it allows an
opportunity to orientate the tissue before it is sec-
tioned. Histological sections of skin, for example,
normally require all layers of the skin to be apparent
for histopathological diagnosis. It is therefore impor-
tant at the embedding stage to ensure that the skin
sample is placed in the hardening wax at the correct
angle to produce a complete skin section. Skin samples
looking for alopecia may need one piece orientated for
the skin layers and another perpendicular to this to
observe sections through the hair follicles and this can
be positioned in agar by the pathologist prior to
processing or by the experienced biomedical scientist
at embedding. Tubular structures such as blood ves-
sels, appendix or alimentary tract will also require
orientation to allow an examination of the tissue layers
through to the lumen.
4.19 Microtomy
Microtomy is a technique whereby thin sections of
tissue are sliced from a large block of tissue with great
accuracy using a piece of equipment called a micro-
tome. The usual thickness cut is 4 mm which is frac-
tionally less than the diameter of a red blood cell. For
delicate structures such as glomeruli in which the fine
detail of basement membranes needs to be assessed,
thinner sections may be required. Similarly certain
investigations require thicker sections for optimal
staining.
Figure 4.40 Two pieces of tissue embedded in paraffin waxand attached to the original plastic cassette. The tissue isnow ready for sectioning on the microtome
Figure 4.38 Two pieces of tissue in a cassette that haveundergone processing. They are now ready for embedding
Figure 4.39 Two pieces of tissue embedded in paraffin waxwithin a steel mould
184 Biomedical sciences

All microtomes have the same basic components.
These consist of a chuck, in which the tissue block can
be held securely, a sharp blade and a mechanism for
advancing the tissue toward the blade at precise inter-
vals of distance. Although microtomes are always
becomingmore automated and user-friendly, a certain
level of skill andunderstanding is required to produce a
good quality section and to troubleshoot effectively.
When troubleshooting, most sectioning problems can
be resolved by ensuring the tissue block is cooled well
on ice (to keep the wax in a solid and rigid state), that
all the components of the microtome are securely
attached and that a clean, sharp blade is used.
There are generally two types of microtomes in
current use. These are the sledge and the rotary, both
of which share the same basic principles of action. The
sledge has the blademounted at the opposite end of the
device to the operator. The tissue blocks are presented
to the blade by sliding the chuck horizontally towards
it. The rotary has a wheel which, when turned, moves
the tissue block across the blade in a vertical fashion.
Both types of microtome can be used to produce good
quality sections, but the sledge microtome is gradually
being replaced by the rotary (Figure 4.41) as most
people find it easier with which to become familiar.
A complete section of the tissue block consists of an
approximately 4 mm thickness slice of tissue and sur-
rounding wax.Whenmultiple consecutive sections are
cut then each is usually loosely attached to the previous
at one end by wax to produce a ribbon of consecutive
sections. Once a ribbon of good quality sections has
been cut, they can be transferred onto a warm water
bath at around 45 �C, slightly below the melting point
of paraffin wax (Figure 4.42). This softens the wax,
stretches out any wrinkles within the sections and
allows the sections to be carefully manipulated with
forceps. The best sections (i.e. ones with no creases,
tears, scores, holes and of the correct thickness) are
separatedwith forceps and lifted onto glassmicroscope
slides ready to be stained (Figure 4.43).
Good quality sections are required to give the
pathologists the best possible picture of the tissue block
so they canmake an accurate diagnosis and so any vital
information is not obscured by artefacts in the section.
Figure 4.42 A ribbon of sections cut from the tissue blockphotographed earlier floating on a water bath
Figure 4.41 An example of the type of rotary microtomecommonly in use
Figure 4.43 The same tissue sections have now beenfloated onto a glass slide ready for staining
Chapter 4 Cellular pathology 185

4.20 Standard stainingmethods and procedures
4.20.1 Haematoxylin and eosin
The haematoxylin and eosin (H&E) stain is regarded
as the standard stain of clinical histopathology
(Figure 4.44). Virtually all solid tissues sent for
histological examination will first be stained using
H&E before deciding if any ancillary techniques are
required.
4.20.1.1 Haematoxylin
Haematin is derived from the Haematoxylin campe-
chianum tree. It is the oxidised form of the dye, either
oxidised naturally by ultraviolet light or chemically
with sodium iodate, that is used in the H&E stain. A
mordant such as aluminium potassium sulphate is
added that facilitates binding predominantly to nucleic
acids such as RNA in the cytoplasm and DNA in the
nucleus. The staining property of haematoxylin is
commonly described as basic owing to its property of
binding to acidic parts of the cell (and hence those
components are referred to as ‘basophilic’).
Haematoxylin is bright red in colour when mixed
with its mordant in a mildly acidic solution at the
commencement of the staining process. During stain-
ing however the procedure for precipitating the stain
onto the tissue in an insoluble form requires neutral-
ising the solution. This has the effect of making the
haematoxylin change to the characteristic blue/purple
colour that we see on histological sections.
4.20.1.2 Eosin
Eosin is a family of compounds chemically derived
from the fluorescent dye fluorescein. It stains a variety
of tissue components in varying shades of pink and
red. In direct contrast to haematoxylin, eosin has a
tendency to stain chemically basic cellular constituents
(constituents that are therefore termed ‘acidophilic’
because of their affinity for acidic stains). Given that
many proteins contain basic residues, eosin will stain
tissue components that are protein rich such as the
contractile elements of muscle and connective tissue
components such as collagen.
The quality of the haematoxylin can be checked by
ensuring that only the nuclei have stained and not the
background, the nuclei are blue and not too red, and
that the chromatin detail is visible. The eosin must
show the range of shades it can stain and overall not be
too light/dark. Overall, theremust be a good balance of
colour seen in the H&E. Most laboratories have an
automated staining machine for this stain because of
the number of slides to be stained and for the stain to be
standardised so every day a suitable control slide, such
as a section of colon, must be stained and checked to
ensure the slides for the day are stained accurately.
4.20.2 Major histochemical/tinctorial stains [29]
Only a few stains are listed here. Most standard histo-
chemistry texts give staining protocols and examples of
a wide range of techniques.
4.20.2.1 Periodic acid Schiff (PAS)
The periodic acid Schiff staining technique essentially
converts colourless Schiff’s reagent to a deep mag-
enta colour when in contact with a variety of carbohy-
drate compounds (Box 4.10). These include glycogen,
Figure 4.44 A section stainedwith haematoxylin and eosinshowing the contrast between the bright pink cytoplasm ofthe epithelial cells and the dark blue/purple nuclei of theadjacent lymphocytes. The lesion shown is a Warthin tumourof the salivary gland. This is characterised by strikinglyeosinophilic epithelial cells on a background of lymphoidtissue. H&E photographed at �100
186 Biomedical sciences

various mucopolysaccharides and a range of glycopro-
teins including the constituents of fungal cell walls. Its
multiple applications include the identification of gly-
cogen and fungi as well as the examination of basement
membranes (Figure 4.45) and neutral mucins.
4.20.2.2 Periodic acid Schiff with diastase (DPAS)
This variant of the PAS method involves pretreating
slides with the diastase enzyme before performing the
periodic acid Schiff stain. Glycogen is hydrolysed by
diastase and will not therefore produce the character-
istic magenta colour. A direct comparison between
sections of the same tissue stained with the PAS and
DPAS techniques can confirm or refute the presence of
glycogen (Figure 4.46).
4.20.2.3 Alcian blue PAS (ABPAS)
ABPAS allows the distinction between acid and neu-
tral mucins. Alcian blue will stain acid mucins blue, as
it is a basic dye with an affinity for anionic acid
mucins. Alcian blue will not however stain nuclei
because its molecular conformation results in steric
hindrance in staining nucleic acids. As discussed
above, the Schiff’s reagent will stain neutral mucins
magenta and diastase removes any glycogen. The
combination is useful in determining whether any
tissue mucin identified is acidic or neutral and the
relative cellular distributions of the two (Figure 4.47).
This has application, for example, in the examination
of biopsies from the antrum of the stomach in which
the normal gastric epithelium produces neutral mu-
cins. The presence of acid mucin-producing cells of
the type normally seen in the small and large intestines
(termed goblet cells) indicates a pathological process
called metaplasia (see Section 4.13) and is a good
indicator of colonisation by the disease-causing bac-
terium Helicobacter pylori.
4.20.2.4 Perls Prussian blue
In the Perls Prussian blue technique hydrochloric acid
and potassium ferrocyanide react with ferric ions in
the tissue to make the intensely blue pigment ferric
ferrocyanide (Prussian blue) (Figure 4.48). This is of
particular use in assessing tissues for excess iron
deposition as is seen in the disease haemochromatosis.
It is also of use in searching for asbestos fibres within
lung tissue as these fibres obtain a coating of iron-
containing haemosiderin and can be extremely hard
to identify on histological sections owing to their
relative scarcity.
Box 4.10 Diastase
Diastases are a group of enzymes that catalyse
the breakdown of complex carbohydrates into
simple sugars. In the histopathology laboratory
the primary application of commercially avail-
able diastase enzymes is the breakdown of gly-
cogen prior to the use of the periodic acid Schiff
(PAS) staining procedure. Glycogen is PAS-
positive (i.e. a bright magenta colour). Pretreat-
ment of the section with diastase will remove the
glycogen. A comparison between sections
stained with the PAS technique with and with-
out prior treatment with diastase allows the
identification of glycogen and distinction from
diastase resistant, PAS-positive carbohydrates
such as most neutral mucins.
Human saliva contains the enzymea-amylase
that is a type of diastase enzyme. Prior to the
ready commercial availability of diastase en-
zymes it was common practice for biomedical
scientists to spit on sections prior to using the
PAS technique. The lack of standardisation be-
tween biomedical scientist saliva (as well as a
variety of health and safety measures) means
that using commercially available diastases is
now the preferred option.
Figure 4.45 A section of skin including part of an eccrinesweat gland. PAS stains the basement membrane of the glandbright magenta. PAS photographed at �100
Chapter 4 Cellular pathology 187

4.20.2.5 Trichrome methods
Trichrome (literally three colour) staining methods
such as Martius scarlet blue (MSB) and Masson’s
trichrome are used for demonstrating a range of
connective tissue in one stain. Trichrome methods
work on the principle that different connective tissues
vary in their permeability to pigment molecules of
different sizes. The smaller molecular size dyes are
applied first and, where their molecular size allows,
they are replaced by a largermolecular size dyes that are
applied sequentially.
Martius scarlet blue (MSB)MSB is useful for demonstrating the relative age of the
blood clotting protein fibrin. The result of the action of
the clotting system together with the adhesion of blood
platelets in circulating blood is a solid mass of platelets
and fibrin called a thrombus. It is sometimes useful to
be able to establish the age of a thrombus. Even after
forming a thrombus the constituent fibrin undergoes
further chemical modification as the thrombus ma-
tures. MSB uses the differences in chemical composi-
tion between a newly formed thrombus and amaturing
Figure 4.46 Two sections of liver demonstrating cytoplasmic glycogen staining with PAS without (left) and with (right)pretreatment with diastase. PAS and DPAS photographed at �100
Figure 4.47 This oesophageal biopsy demonstratingBarrett’s oesophagus illustrates the PAS-positive neutralmucins in columnar cells resembling gastric epithelium andthe Alcian blue-positive acid mucins in columnar cells re-sembling those found throughout the intestines. ABPASphotographed at �100
Figure 4.48 This spleen contains an unusual amount ofhaemosiderin within its resident cells of the monocyte-macrophage lineage. Haemosiderin is a haemoglobin break-down product that is rich in iron and hence appears brightblue on staining using the Perls technique. Perls prussian bluephotographed at �100
188 Biomedical sciences

thrombus to produce different colours for new and old
fibrin. New fibrin stains as yellow strands, the inter-
mediate ages range from orange to red strands and the
oldest fibrin stains as blue strands. Collagen stains
green/blue, muscle/cytoplasm stains red and the nuclei
are dark blue.
4.20.2.6 Silver impregnation techniques
Silver techniques are very delicate and require an
experienced eye to determine sufficient impregnation
of the tissue and meticulously cleaned glassware as
even the smallest contaminant can produce poor re-
sults. All silver techniques involve the impregnation of
tissues with silver ions whichmust then be reduced to a
visible metallic silver form. The reduction is achieved
either through the addition of a reducer (an argyrophil
reaction) or through the combination of the tissue
components with the silver ions (an argentaffin reac-
tion) such as melanin in the Masson Fontana reaction.
Methenamine silver technique (Grocott’s stain)The methenamine silver technique (MST) can be used
to demonstrate the basement membranes within deli-
cate structures such as glomeruli with great effect and is
also used to demonstrate the cell walls of the majority
of fungi. It is a silver salt-based reaction in which the
silver is readily taken up by the basement membranes
and fungal cell walls and is directly reduced to precipi-
tate the silver into a visible metallic form in an analo-
gous process to black and white photography. In the
case of basement membrane staining the silver may be
toned using gold chloride, leaving the collagen golden
brown. A counterstain such as a light H&E provides
some background for orientation of the tissue
(Figure 4.49).
4.20.2.7 Congo red
This staining technique is used for the identification of
amyloid (see Section 4.11).
4.20.2.8 Ziehl Neelson
This technique is used for the identification of Myco-
bacteria, the group of bacteria responsible for
tuberculosis (the world’s single most deadly bacteri-
um) and a host of less common granulomatous dis-
eases. The technique essentially uses carbol fuchsin
(bright magenta) to stain the hydrophobic mycolic
acid constituent of the acid fastmycobacterial cell walls
(Figure 4.50). The technique has several variations
with more selective staining for various mycobacterial
species such asWade Fite which ismodified to stain the
acid---alcohol fast bacterium in leprosy.
Once slides have been stained they need to be covered
with a glass coverslip to prevent damage and the
drying out of the sections which affects its optical
properties. The coverslips are held in place by a
mounting medium that for the majority of slides
will be a resinous medium that is miscible with xylene
and has a similar refractive index to that of glass.
Figure 4.49 An example of MST showing a renal gomerulusand adjacent tubules. The basement membranes stain black.MST photographed at �200
Figure 4.50 Ziehl---Neelsen stain showing magenta curvi-linear rods in a case of Myocbacterium tuberculosis infection.Ziehl---Neelsen photographed at �600
Chapter 4 Cellular pathology 189

Some staining techniques such as Oil red O and
immunofluorescence can be removed or compro-
mised if alcohol or xylene is introduced after staining
and so these require an aqueous mounting medium.
4.20.2.9 Control tissues
In performing any histochemical stain in which the
presence or absence of a characteristic staining pattern
is diagnostic, it is always necessary to stain control
tissue under exactly the same conditions as the test
tissue. A control is a tissue inwhich the staining pattern
of the particular histochemical stain is already known.
A positive control is one in which the stain should be
positive if it has worked correctly. Similarly a negative
control should show no staining. The simultaneous
use of positive and negative controls ensures that the
staining pattern of the test slide can be interpreted with
a high degree of confidence that the technique has
worked correctly. Histopathology laboratories will
normally keep a collection of tissues with predictable
staining patterns to use as controls.
4.21 Frozen section
Cryotomy (frozen section) is, as the name suggests, the
cutting of sections of fresh tissue that has been frozen.
For conventional histological examination to be per-
formed the tissue must undergo the time-consuming
stages of fixation, processing and embedding. In com-
parison with these stages the steps of sectioning and
staining are relatively quick. Cryotomy bypasses the
slow stages by jumping straight from removal from the
patient to sectioning. This is extremely useful for swift
diagnosis but has the severe drawback that much of the
histological detail relied on for reliable diagnosis in
conventional histology is not available to the patholo-
gist on frozen section because of distortion during
freezing. This technique is therefore most useful when
only crude indicators are required rather than specific
diagnostic information. Such indications include con-
firming the nature of the particular tissue that has been
removed (useful in distinguishing between parathy-
roid glands and lymph nodes in the neck that can look
very similar to the operating surgeon) and assessing
whether a tumour that has already been diagnosed by
biopsy and conventional histology has been completely
removed at surgery. Frozen sections can be sufficiently
rapid to produce for the histological opinion to be
given to the operating surgeon within minutes and the
surgical procedure can be modified accordingly.
It is essential that tissues are rapidly frozen to reduce
the distortion caused by ice-crystal formation and
orientated correctly in the embedding medium to
ensure the best quality section can be achieved as
quickly as possible. Liquid nitrogen is commonly used
for rapid freezing but a variety of other options are
available including carbon dioxide and various low
boiling point organic solvents.
The mechanism of section cutting is similar to that
used when using the rotary microtome, but when the
sections are mounted onto the glass microscope slides
they are done so directly onto the glass without the aid
of a water bath. A special low temperature microtome
called a cryostat is dedicated to cutting frozen sections
(Figure 4.51). To achieve sections without creases, an
antiroll bar is used on the cryostat to stop the sections
from curling up.
In addition to its use in rapid histological assess-
ment, frozen sections have applications in certain other
ancillary techniques. Stains to assess the presence of fat
within tissue (such as Oil red O) are not possible on
conventional paraffin-embedded tissues because clear-
ing agents such as xylene inevitably dissolve out fatty
acids. No clearing agents are required for frozen sec-
tions and so fatty acids remain in the tissue and can be
stained.
Other ancillary techniques include enzyme histo-
chemistry. As fixation effectively denatures proteins,
enzymes are therefore also usually non-functional after
fixation and so enzyme histochemistry must be per-
formed on frozen sections. In enzyme histochemistry
Figure 4.51 A typical cryostat
190 Biomedical sciences

the enzymes present within a cell of interest are used to
effect a chemical reaction that results in the appearance
of a visible chromagen. Themost common application
is in the search for ganglion cells in the colon and
rectum for the purposes of assessing the evidence for
Hirschsprung’s disease. This is the failure of normal
innervation of a segment of the rectum of variable
length. The result is that the affected segment remains
severely narrowed and can result in constipation,
abdominal distension and even bowel obstruction.
Diagnosis is confirmed by a lack of normal ganglion
cells within the wall of the affected segment of bowel.
This search is greatly assisted by an enzyme histochem-
ical reaction that relies on the presence of the acetyl
cholinesterase enzyme in ganglion cells to cause a
visible chromagen to form. In the absence of ganglion
cells the reaction cannot happen and the diagnosis is
confirmed.
It is noteworthy that frozen tissue has not been
exposed to the fixing agents that normally eliminate
the presence of potentially infective pathogens.
Until the tissue is fixed there is therefore a risk of
infection to the biomedical scientist.
4.22 Immunohistochemistry
The technique of immunohistochemistry uses antibo-
dies to identify and bind to specific constituents within
a cell. The technique then activates a chemical reaction
at the site of binding which results in the production of
a visible chromagen.
Free antibodies are glycoproteins produced by plas-
ma cells during an immune reaction. The classical
example of antibody structure (as depicted by immu-
noglobulin G but the common theme of all antibody
types) approximates to a Y-shape with the principal
binding sites on the short arms [30] (Figure 4.52).
The areas of the antibody that form the binding site
are termed the hypervariable regions owing to the
enormous range in structure between antibodies
produced by different plasma cells. The remainder
of each antibody does not vary significantly between
plasma cells.
The structure of the binding site of the antibody is
such that it will bind highly specifically with only one
particular combination of molecular conformation
and component molecular groups, for example a
particular short sequence of amino acids with a par-
ticular three-dimensional structure. The point at
which the antibody binds is called the epitope and the
molecule that contains the epitope is called the antigen.
The binding is via a combination of electrostatic
interaction, van der Waals forces and hydrogen bond-
ing. It can be envisaged that the number of structurally
different molecules that happen to contain the same
epitope is likely to be small and in reality antibodies
will bind relatively specifically to just one type of
antigen or to a group of antigens that are chemically
and structurally closely related.
4.22.1 Clonality
Although individual plasma cells can produce a num-
ber of different types of antibody, each type has the
same hypervariable region in common. The structure
of the hypervariable binding site is encoded by a
segment of DNA that has undergone massive recom-
bination andmutation during development as an early
B-cell but is fixed in the mature plasma cell form. Thus
all of the antibodies produced by a single plasma cell
bind to just one specific epitope. These antibodies are
described as monoclonal.
In the course of an immune reaction to, for exam-
ple, an infecting bacterium, there may be a great many
different plasma cells producing antibodies to a par-
ticular bacterial component protein. These plasma
cells will all have different genetic sequences for their
hypervariable binding sites and will be producing
antibodies that bind to different epitopes, but if all of
these different epitopes happen to be on the same
bacterial protein then they are effectively all binding
to the same antigen. Antibodies that recognise differ-
ent epitopes but all bind to the same antigen are
described as polyclonal.
Light chain
Heavy chain
Fragment Antigenbinding (FAb)
FragmentCrystallisable(Fc)
Figure 4.52 The classical Y-shaped depiction of anantibody
Chapter 4 Cellular pathology 191

4.22.2 Antibodies inhistopathology
A wide range of antibodies are commercially available
that recognise a variety of cellular constituents. Both
polyclonal and monoclonal forms are available for
numerous different antigens but the higher specificity,
standardisation and consistent reproducibility of
staining results of monoclonal antibodies means that
the vast majority are monoclonal. Their production
involves fusion of reactive B lymphocytes exposed to
the antigen in question to a myeloma (a tumour of
plasma cells) cell line resulting in a hybrid tumour that
secretes a monoclonal antibody [31]. Although there
are various types of antibody with different functions
and conformations, it is the immunoglobulin G (IgG)
antibody isotype that is of use in histopathology be-
cause it is secreted as a soluble monomer.
The common uses in histopathology fall into two
main groups as follows.
1. Identification of a particular cell type. A common
problem in histopathology is that many different
cell types have a similar morphology. It can be very
difficult to distinguish between, for example, a
fibroblast and a smooth muscle cell, and even more
difficult to distinguish between different types of
mature lymphocyte. The problem becomes even
more difficult in the case of poorly differentiated
malignant tumours. Thus a poorly differentiated
carcinoma can look almost identical to a blastic
lymphoma but there may be a massive difference
between the two in terms of behaviour and treat-
ment.If such a diagnostic dilemma is encountered it
is extremely useful to have an antibody to an antigen
found in one possible cell type but not the other.
Cytokeratins, for example, are filament proteins
found almost ubiquitously in epithelial cells but
very rarely in significant amounts in lymphocytes.
Thus, in the example above of a poorly differenti-
ated tumour that could be a carcinoma or lympho-
ma based on appearance, an immunohistochemical
stain that recognises cytokeratins would stain a
carcinoma but not a lymphoma and therefore solve
the diagnostic problem.
2. Prognostication in a known tumour type. If the
tumour type is already know, either because it has
a characteristic morphology on histological exami-
nation or because we have already used immuno-
histochemical stains to determine the cell type, the
behaviour of some types or their response to treat-
ment can be predicted from the expression of
certain antigens. One such example is that of the
expression of Her2 in breast cancer (see Sec-
tion 4.14). This cell surface receptor is overex-
pressed in an aggressive subtype of breast cancer
and can be visualised on immunohistochemical
staining. In addition to indicating an aggressive
form of breast cancer with poor prognosis however
the overexpression of Her2 also means that the
tumour is likely to respond well to a highly specific
form of treatment.
4.22.3 Mechanisms ofimmunohistochemical staining
Having obtained an antibody to a specific antigen, a
mechanism must be found to be able to demonstrate
both that the antibody has bound to the histological
section and show exactly where the binding has taken
place. Several methods are employed including attach-
ing radioisotopes to the antibodies, attaching fluores-
cent molecules (see Section 4.22.5) or attaching
enzymes that can catalyse a colour-changing chemical
reaction. This last technique is immunohistochemistry
and is the technique most commonly encountered in
histopathology.
Antibody techniques can be direct or indirect as
follows.
1. Direct. In this case the system for identifying the
antibody is attached directly to the antibody mole-
cule. This means that each antibody molecule will
be attached to one fluorescent molecule or one
enzyme molecule. While this technique is quick
and gives a semiquantitative indication of the
amount of antigen present, a large amount of
antigen is required to produce a visible result. The
method therefore has relatively low sensitivity.
2. Indirect. (Figure 4.53). This makes use of the fact
that antibodies differ slightly between mammalian
species. It is therefore possible to make antibodies
within, for example, a rabbit that react to mouse
antibodies. If our antigen of interest has a specific
mouse monoclonal antibody bound to it (the pri-
mary antibody) then we can use an antimouse
IgG antibody conjugated to the colour-generating
192 Biomedical sciences

enzyme (the secondary antibody) to identify its
location. With several secondary antibody mole-
cules bound each primary antibody molecule we
have introduced an amplification step (and hence
enhanced sensitivity), with the added bonus that
only a limited range of conjugated antibodies is
required (a costly process) comparedwith the range
of unconjugated primary antibodies.
4.22.3.1 Further amplification steps
In reality the amount of antigen typically present in
histological sections is unlikely to be sufficient tomake
any antibody-conjugated enzyme-mediated colour
change reaction easily and reliably identifiable without
further amplification. The most commonly employed
method of amplification is the avidin-biotin complex
method (ABC method) [32].
The ABCmethod uses the tetrameric protein avidin
to bind to the amine biotin (vitamin H). Once bound,
the avidin-biotin complex is extremely stable and
resistant to separation. Given that avidin is a tetramer
and that eachmonomeric component can bind a biotin
molecule, each avidin molecule can theoretically bind
up to four biotin molecules.
The ABC method employs a specific primary anti-
body followed by a secondary antibody conjugated to
biotin. Addition of avidin and biotinylated colour-
producing enzyme in carefully chosen ratios results in
multiple avidin-biotin-enzyme complexes binding to
each secondary antibody (Figure 4.54).
The principal problemwith the ABCmethod is that
tissues such as liver and kidney contain significant
amounts of endogenous biotin and result in extensive
nonspecific background staining [33]. This effect can
be reduced through pretreatment methods involving
applying avidin followed by biotin and then washing
thoroughly but is difficult to eliminate (Box 4.11).
A number of variants on the ABCmethods are used
but are beyond the scope of this review. Similarly other
amplification systems using dextran polymers or even
nucleic acids are finding more common application in
histopathology but have not yet replaced variants of
the ABC technique in common practice.
4.22.3.2 Enzyme and chromagens
The enzymemost commonly used in histopathology is
horseradish peroxidase (HRP), a haem-containing en-
zyme derived from the root of the horseradish. This
catalyses the oxidation of the chromagen 3-
30diaminobenzidine (DAB) to form an insoluble dark
brownprecipitate that is resistant towashingwithwater
or alcohol. Thusmost immunohistochemically stained
slides appear brown at the sites of antigen (Figure 4.55).
In addition to the HRP---DAB system there are
several other enzyme-chromagen systems in use. The
most common of these after HRP---DAB is the calf
intestine alkaline phosphatase (AP) system that uses
the enzyme’s alkaline phosphatase activity on naphthol
phosphate esters to produce phenols that react with
diazonium salts to result in insoluble red azo dyes.
The HRP---DAB system is commercially widely
available and entirely satisfactory under most circum-
stances. If however the antigen in question happens to
occur in a cell that naturally produces brown pigment
(such as a melanocyte in the skin) then an alternative
chromagen technique such as the AP technique is
highly useful in reserve.
4.22.3.3 Antigen retrieval
As discussed above, the process of fixation includes the
formation of cross-linking bonds within and between
molecules within the tissue. Unfortunately these bonds
may prevent antibodies from accessing their corre-
sponding epitopes, even though the antigen may be
present in abundance. One possible solution is to
perform immunohistochemical staining on fresh fro-
zen tissue but this has numerous obvious limitations.
The answer is therefore to develop some form of
technique of limited effective reversal of the fixation
process so that the required epitopes are re-exposed
but the tissue does not begin to degenerate. This is
termed antigen retrieval.
Secondary antibody
Primary antibody
Figure 4.53 Primary and secondary antibodies
Chapter 4 Cellular pathology 193

The principal approaches to antigen retrieval are
enzyme digestion and heat:
1. Enzyme digestion is performed using enzymes
commonly found in the digestive tract. The most
frequently used are the proteolytic enzymes chy-
motrypsin and trypsin, normally produced by the
pancreas and secreted into the duodenum for the
digestion of proteins. These enzymes cleave some of
the long proteins and thus expose certain epitopes.
2. Various techniques using a combination of heat
and varying pH are employed to break down
Glass slide
Tissue section
Retrieved antigenic sites (epitopes)
Primary antibody
Secondary antibody
Biotin
Avidin
Avidin Biotin Complex
Horseradish peroxidase
3-3’ Diaminobenzidine (DAB)
Figure 4.54 A schematic diagram to illustrate the ABC method of antibody binding and enzyme-mediated chromagengeneration
194 Biomedical sciences

crosslinking bonds. These may be undertaken using
pressure cooking or, increasingly commonly,
microwaves [34].
The antigen retrieval technique used depends upon
the nature of the epitope and antibody in question. In
day-to-day practice therefore each of the antibodies
used in the laboratory will have its optimised antigen
retrieval procedure. It should be remembered how-
ever that some antigens do not require any retrieval
stage at all.
4.22.4 Control tissues
Just as with histochemical/tinctorial staining proce-
dures it is crucial that immunohistochemical staining
is always performed with positive control tissues (ide-
ally on the same slide for a more reliable test) and a
negative control tissues is also desirable where time,
space and cost allow (see above).
4.22.5 Immunofluorescence
The technique of immunofluorescence is in principle
similar to that of immunohistochemistry in that a
specific monoclonal or polyclonal antibody is used to
identify an antigen on a histological section. Instead of
an enzyme-mediated chemical reaction and colour
change however immunofluorescence uses a light-
emitting marker to indicate the position of the anti-
body. The most commonly used markers are deriva-
tives of fluoroscein such as fluoroscein isothyocyante
(FITC) that emit a yellow/green light when stimulated
with light at the ultraviolet end of the spectrum.
As in immunohistochemical staining the marker
may be attached to the primary antibody (direct
immunofluorescence) or to a secondary antibody (in-
direct immunofluorescence).
4.22.5.1 Advantages and disadvantages
The principal advantage of direct, and to an extent,
indirect immunofluorescence is that the degree of
staining is quantitative. This means that tissues can
be stained in which the antigen in question is normally
present but where an increase in antigen deposition in
a particular cellular or tissue location is being sought.
On conventional immunohistochemical staining, the
amplification processes would probably result in the
whole tissue section becoming various shades of brown
with little discernable difference in staining intensity in
the site of interest. Because eyes are extremely sensitive
to differences in intensity of light emission even the
most subtle of increased fluorescence in one part of the
cell may be visible.
Box 4.11 Avidin
Immunohistochemical staining involves the use
of relatively expensive reagents such as mono-
clonal antibodies. Commercially available puri-
fied avidin is surprisingly costly and, despite
being used in relatively small quantities per test,
the expense can mount up in a busy histopa-
thology department.
Egg white is relatively rich in avidin. It tran-
spires that there is sufficient avidin in egg white
to allow its use in immunohistochemical stain-
ing. Unfortunately the lack of standardisation in
egg white avidin concentration indicates that
commercial purified avidin is more likely to
produce the consistent and reproducible results
required in diagnostic immunohistochemistry.
Figure 4.55 An example of a section that has undergoneimmunohistochemical staining using the ABC method withDAB as a chromogen. This is a section of large intestinal wallstained for a range of cytokeratins (intermediate proteinfilaments that are abundant in epithelial cells). The brownstaining highlights the intestinal crypt epithelium. Immu-nohistochemical staining for cytokeratins AE1/AE3 photo-graphed at �100
Chapter 4 Cellular pathology 195

The application of this property of the immuno-
fluorescence technique is illustrated by its use in
searching for autoantibodies in various tissues, most
commonly the kidney. One particular disease of the
kidney, for example, is termed IgA nephropathy. In
this disease immunoglobulin A (IgA) binds to the
basement membrane of the glomerulus (the filtration
unit of the kidney) where its presence activates an
inflammatory reaction, for example via the comple-
ment cascade (see acute inflammation), and this in
turn damages the glomerulus. The form of the
glomerular damage is not specific to this disease and
so it is not possible to distinguish between IgA
nephropathy and other glomerular diseases on H&E
sections alone. The binding of IgA to the basement
membrane however is more specific to this disease
and so its presence is frequently diagnostic.
As IgA is always being produced in small amounts
somewhere in the body it is effectively a normal low
level circulating immunoglobulin and so its presence
in the blood at low levels is not abnormal. The
kidney is an extremely vascular organ and so some
IgA is present throughout the tissue. This means that
it is extremely difficult on immunohistochemical
staining to demonstrate IgA bound to the glomerular
basement membrane without the whole histological
section of kidney becoming a mess of brown staining.
The eye’s extremely sensitive ability to detect contrast
in light emission means however that it is often
possible to distinguish between a background low
level of light emission throughout the tissue and the
linear pattern of increased light emission along a
basement membrane.
The principal disadvantage of immunofluorescence
is that fluoroscein derivatives are relatively unstable
and so the immunofluorescent antibody-labelled slide
will degrade relatively rapidly after its preparation,
unlike the equivalent immunohistochemically stained
slide. In addition, viewing immunofluorescent slides is
inconvenient in that it requires a mercury lamp to
produce the correct wavelength, a microscope fitted
with filters to protect the eye from ultraviolet light and
a dark room for slide viewing. Furthermore most
commercially available antibodies are designed only
to work on fresh frozen tissue rather than formalin-
fixed, paraffin-embedded tissue. This is in part
because formalin has some intrinsic fluorescent prop-
erties and clearly introduces the problems of handling
of frozen tissue.
4.23 Cytopathology
As indicated earlier, cytopathology is the study of
disease by the examination of individual cells rather
than tissues. A variety of body fluids and aspirates can
be obtained by the clinician in the process of investi-
gating disease. Their subsequent treatment in the
cytology laboratory depends upon the nature of the
specimen, the site of origin and the disease under
investigation (Box 4.12).
Box 4.12 The ‘one-stop’ clinic
The investigation of the visible or palpable lump
frequently involves a three-step process. These
steps are:
1. clinical assessment;
2. radiological assessment; and
3. tissue sampling and histological/cytological
assessment.
Clinical assessment refers to obtaining infor-
mation from the patient about the nature of the
lump (e.g. how long it has been present, whether
it appeared rapidly andwhether it is painful) and
is commonly performed by a general practition-
er followed by a surgeon if required. Radiologi-
cal assessment refers to any modality of imaging
by a radiologist such as X-ray, ultrasound or
magnetic resonance imaging. A characteristic
clinical or radiological appearance may negate
the need for further investigation.
Some medical centres and hospitals have de-
veloped a service such that the surgeon, radiolo-
gist and pathologist all see the patient during the
same attendance. The use of fine needle aspira-
tion, preparation of direct smears of the sample
and rapid staining techniques (such as commer-
cially available modifications of the giemsa tech-
nique) mean that a cytologist can potentially
provide a cytological diagnosis within minutes.
Thus the patient can have his or her lump
assessed, diagnosed and a treatment plan agreed
within the same clinic appointment. The ‘one-
stop’ approach has commonly been applied to
the investigation of breast lumps and is increas-
ingly used in the context of head and neck lumps.
196 Biomedical sciences

4.23.1 Specimen preparation
4.23.1.1 Wet preparation
Certain diseases are characterised by the precipitation
of poorly soluble crystals. Themost frequently received
specimens that require the identification of crystals are
joint aspirates. The purpose of these specimens is
generally to distinguish between the metabolic disease
gout and its various mimics.
Gout is a disease of purine metabolism that is
characterised clinically by a destructive and extremely
painful arthritis that is often accompanied by the
formation of large nodules (called tophi) around the
joints and on extensor surfaces of the body. The
inflamed joints and tophi contain large quantities of
poorly soluble crystals of uric acid that have a charac-
teristic appearance under polarized light.
Wet preparations (as the name suggests) simply
involve placing a coverslip over an unstained drop of
the joint aspirate on a glass slide. The slide preparation
is examined immediately under polarized light and the
presence of crystals determined.
4.23.1.2 Direct smears
Specimens that consist of a tiny amount of material,
material that is for immediate examination or fluid
that is too viscous for realistic further preparation, can
be spread directly across a glass slide. A degree of skill is
required to ensure that the spread is as thin as possible
to avoid the problem of cellular overlap that might
obscure cellular detail on microscopic examination.
The direct smear is subsequently fixed, stained and
mounted for examination.
4.23.1.3 Cytospins (and variants)
Most cytology specimens have a relatively small cellu-
lar component compared to the amount of fluid.
Direct smears of such samples would produce a lot of
slides with sparse numbers of cells that would be
enormously time consuming to prepare and examine.
In order to increase the cellular component relative to
the overall volume these samples are first spun in a
centrifuge to separate the cellular component from the
fluid, or supernatant. Almost all of the supernatant is
discarded and 1mL of supernatant is retained that is
used to resuspend the cellular component. The resus-
pended cellular component is further concentrated
into spots on glass slides that can then be stained.
These are called cytospin preparations.
Modified centrifugation processes have been devel-
oped that form a cellular monolayer on a filter that is
lightly pressed against the slide. These techniques
(termed liquid-based cytology) have been automated
and rolled out across the UK for use in the cervical
screening programme.
4.23.2 Staining
The two most common staining techniques are
Papanicolaou’s stain (Pap) and various modifications
of the Romanowski technique (various type of giemsa)
(Figure 4.56).
These two staining techniques differ in that Pap
staining is performed on samples that have been fixed
when still wet and giemsa techniques are used on
samples that have been allowed to dry on the slide
prior to fixation. The former approach, in very general
terms, preserves excellent nuclear detail whereas the
latter allows the cytoplasm to spread out on the slide
and so demonstrates cytoplasmic featuresmore clearly.
The standard H&E technique is also frequently applied
to wet fixed specimens and allows a direct comparison
between cytological and histological appearance for
those pathologists more accustomed to interpreting
histology specimens.
4.23.3 Immunocytochemicalstaining
Most commercial immunohistochemical staining
techniques have been developed and marketed for use
on tissue sections. Many of these antibodies can
however be used to stain cytological preparation,
although a significant amount of experimentationmay
be required to produce satisfactory results.
The unpredictability of applying immunohisto-
chemical techniques to cytology specimens can be
reduced by solidifying part of the cytology specimen
(e.g. with agar) and then treating the solid specimen as
a tissue specimen.
4.24 Electron microscopy
Light microscopy will normally provide sufficient
morphologic detail of tissues and cells to diagnose the
Chapter 4 Cellular pathology 197

vast majority of pathological conditions if supplemen-
ted by histochemical, immunohistochemical and
immunofluorescence techniques. In terms of mor-
phology however light microscopy has the problem
of resolution as its main limitation.
Resolution is the minimum distance between two
points that still allows the two points to be recognised
as separate from each other when viewed down the
microscope. If the points are separate by less than this
distance then they will appear to be joined. The greater
the resolution power of a microscope, the smaller will
be the objects that can be viewed with clarity.
The resolution limit of a microscope depends upon
several factors including the quality of the lenses and
the set-up of the light source. Ultimately however the
very best quality light microscope’s resolution is lim-
ited by the nature of light itself or,more specifically, the
wavelength. The wavelength of light in the visible
spectrum is such that resolution much below 1mm is
not technically possible. This means that most cellular
organelles are not generally visible in isolation. Reso-
lution can be slightly improved by using a light source
at the higher frequency (shorter wavelength) end of the
spectrum but this then begins to introduce technical
complications to the staining techniques employed.
The practical manifestation of the resolution limit
of the light microscope is the maximummagnification
that can be obtained. The average histopathology
laboratory microscope will achieve magnifications of
approximately�400. This can be improved to approx-
imately�600 using high quality lenses and oil immer-
sion of both specimen and lens (which reduces light
diffraction). For higher magnifications we must find a
source of waves of much shorter wavelength.
A beam of electrons moving at speed through a
vacuum has a wavelength several orders of magnitude
shorter than visible light. The theoretical resolution of
anelectronbeam is therefore sufficiently small tobeable
toproducemagnificationsnotonlygreatenoughtoview
cell organelles but even to show the component mem-
branes. Examination of tissues at this magnification
would therefore add a new range of histological detail
for classifying and investigating pathological processes.
4.24.1 The mechanism of electronmicroscopy
The electron microscope essentially shares its central
design with a cathode ray oscilloscope or cathode ray
television (Figure 4.57).
A heated filament (e.g. tungsten wire, similar to a
light bulb filament and called the cathode) in a vacuum
can be made to emit a beam of electrons towards a
cylindrical tube (anode) kept at very high voltage to the
cathode. Those electrons passing straight through the
anode form a beamwhich can be deflected or attracted
by electrostatic charges andmagnetic fields. This beam
can be made to pass through a tissue section and the
slight deviations in the paths of the component elec-
trons caused by interaction with molecules in the
tissue used to form an image on a phosphorescent
screen (which produces visible light when struck by
electron beams) which can be recorded digitally or on
Figure 4.56 Examples of standard cytological stains. The giemsa technique (left) demonstrates cytoplasm and is illustratedby the pair of mesothelial cells to the left of centre showing well-defined blue cytoplasm but indistinct nuclear features. Thesheet of mesothelial cells stained with the Papanicolaou technique (right) demonstrated more nuclear detail but thecytoplasm is indistinct. Left: rapid giemsap Photographed at �600; right: Papanicolaou photographed at �400
198 Biomedical sciences

photographic film. The degree of beam deviation
caused by the tissue can be amplified in an analogous
fashion to magnification on a light microscope.
The above description is termed transmission elec-
tronmicroscopy. A variant is termed scanning electron
microscopy that effectively bounces an angled beam of
electrons off the surface of the specimen to form an
image. This is seldom used in histological practice.
4.24.1.1 Tissue preparation
It is important to remember that although electron
microscopy (EM) involves analogous stages to light
microscopy and produces a visible two-dimensional
image, the properties of light and an electron beam
inside a vacuum are different. The various stages of
tissue preparation are therefore different.
Tissue for EM is not generally fixed in formalin
because, although entirely adequate for light micros-
copy, formalin introduces artefacts that become
visible at the magnifications used in EM. The most
commonly used fixative is glutaraldehyde that intro-
duces fewer artefacts and reacts more quickly with
tissues than formalin but is more toxic and makes
antigen retrieval far more difficult for general use in
histopathology. To assist in rapid fixative penetration
and even fixation, tissue for EM is cut into specimens of
size of the order of up to about 1mm in maximum
dimension.
As preservation of the fatty acid content of light
microscopy specimens is generally unimportant it is of
minimal consequence that fat is little affected by fixa-
tion and therefore washed out of the specimen during
processing. The chief fatty acid component in the cell is
generally membranes and, as these cannot be seen on
light microscopy, it makes little difference to the
appearance of the tissue section if they are washed
out. The preservation of fatty acids in such structures
as membranes however is important in EM because
these structures can be visualised. A stage of fatty acid
stabilisation is therefore required and this is most
commonly undertaken using osmium tetroxide. The
Light microscope Electron microscope
Light source
Condenser
Tissue section on glass slide
Objective lens
Eye
Eye-piece lens
Focus
Tungsten filament(cathode)
Accelerator (anode)
Ultrathin tissue section on a copper mesh grid
Eye
Objective lens
Vacuum
Deflection plates
Phosphorescent screen
Figure 4.57 The essential components of the electron microscope. Many of the same components are seen in a cathode raytube television
Chapter 4 Cellular pathology 199

tissue is then dehydrated using an increasing series of
alcohol concentrations.
The tissue forEMrequireseventhinnersectionsthan
for lightmicroscopy.Thusthetissuerequiresanembed-
dingmediumthat is sufficiently strong tobe able to stay
relatively rigid insection.Variousacrylicorepoxyresins
are used and require the tissue to be treated with an
appropriate agent (such as propylene oxide) that may
dissolve resin in an analogous fashion to treating tissue
with xylene prior to embedding in wax.
4.24.1.2 Microtomy and imaging
Cutting sections requires an extremely sharp blade in
order to achieve the desired levels of thickness. A ‘semi-
thin’ section of approximately 0.6 mm in thickness is
cut first using a glass knife and stained with Toluidine
blue. This is examined under light microscopy for
orientation of the electron micrographs. The section
for examination is then cut at a thickness of the order of
0.08 mm using a glass or a diamond knife. These ‘ultra-
thin’ sections are placed on a copper grid and may be
further stained with heavy metal salts (such as uranyl
acetate and lead citrate) prior to being examined under
the electron microscope. Heavy metals (i.e. metals of
high atomic weight) block the path of electrons and so
act in a similar fashion to the light-absorbing pigments
in light microscopy tinctorial staining. Different cell
components will take up the metal salts in varying
concentrations and the greater the uptake the more
electrons will be absorbed/reflected while those areas
that are more lightly stained will allow more electrons
to pass through the tissue section (Figure 4.58).
In addition to providing tissue images at extremely
high resolution it is possible to perform some ancillary
investigations. Immunostaining is possible, for exam-
ple, by conjugating primary or secondary antibodies to
gold microspheres that can be visualised under the
electron microscope [35]. The use of antibodies con-
jugated to gold microspheres of different fixed sizes
means that several antibodies can be applied to the
same section and their relative staining distributions
determined by sphere size.
4.24.2 Applications of electronmicroscopy
Although electron microscopy has a potentially wide
range of applications within the histopathology labo-
ratory that merge into research use, we will consider
three of the principal diagnostic applications as
follows.
4.24.2.1 Glomerular disease
The glomeruli are essentially the filtration units of the
kidneys. They are subject to a number of diseases that
can manifest as disturbances of renal function and
blood pressure and itmay become necessary during the
process of investigation of renal disease to perform a
renal needle core biopsy. In most instances the con-
stellation of clinical features, light microscopic appear-
ance, histochemical/tinctorial staining pattern and
immunofluorescence pattern will provide sufficient
information to establish a diagnosis. There are occa-
sions however when the light microscopic changes are
non-existent, too subtle or the disease too early in its
course to allow diagnosis [36]. Fortunately the electron
microscopic appearance of the basementmembrane of
the glomerulus can often indicate the earliest patho-
logical changes and assist in diagnosis.
4.24.2.2 Diseases of skeletal muscle
Certain rare diseases of the skeletal muscles (called
myopathies) have characteristic electron microscopic
appearances that may not be identifiable on light
microscopy [37].
Figure 4.58 An electron micrograph showing the edge of askeletal muscle fibre. The exatracellular space is visualised atthe top of the picture with underlying cell membrane.Multiple mitochondria are seen beneath the membrane,beneath which are the striated contractrile fibres. photo-graphed at �4200
200 Biomedical sciences

4.24.2.3 The unknown tumour
Although the overwhelming majority of tumours can
be characterised using light microscopy with its vari-
ous ancillary techniques to a sufficient degree to allow
treatment, there are occasions on which there are no
clues as to what a tumour is differentiating towards.
Electron microscopic analysis of the tumour cells may
be helpful in that it may be possible to identify ultra-
structural clues or characteristic cytoplasmic struc-
tures to suggest a direction of differentiation.
It should be recognised that although the range of
potential uses of EM is wide, the proportion of cases
requiring EM in the general diagnostic histopathology
laboratory (themajority of which do not perform renal
or muscle analysis) is extremely small. The facilities for
EM are therefore generally only available in reference
laboratories and the larger tertiary referral centres.
4.25 In situ Hybridisation
In situ hybridisation (ISH) is a DNA (or RNA, but for
the purposes of this description we will limit the
discussion toDNA) identification technique that com-
bines three essential components:
1. identifying which of the cells in the tissue to which
the test is applied contain the particular DNA
sequence;
2. giving an indication of the number of copies of that
particular sequence there are in the DNA of the cell;
and
3. indicating whereabouts in the DNA of a particular
cell that sequence is located relative to another
marked DNA sequence.
Whereas the detection of specific DNA sequences
using older techniques had relied on destroying the
tissue to extract DNA and then perhaps chopping the
DNA into short segments, ISH actually labels the DNA
sequence in such a way that not only can one see which
cells within a particular tissue contain that DNA
sequence but one can gain an indication as to how
much of that sequence is found in theDNAof each cell.
4.25.1 Mechanism
We recall that DNA is composed of two strands con-
taining arrays of complementary nucleotide base pairs.
A highly specific way to identify a particular DNA
sequence is therefore to attach a distinctive label to a
single short strand of DNA with the complementary
base sequence to that in question (called a probe),
uncoil and separate the DNA being tested, and allow
the probe to bind (or hybridise) to the test DNA. If the
segment of DNA being sought is present in the test
DNA sample then the probewill bindwith high affinity
and specificity (Figure 4.59(a)).
Although the concept is relatively straightforward,
the reality is somewhat complex and problematic. The
design of the probe itself is the first major stumbling
block. The DNA sequence of interest is usually a
particular gene. The probe thus needs to be a comple-
mentary sequence to part of that gene. The shorter the
probe, the greater the risk that an identical or very
similar stretch of DNA will appear in other genes with
the result that the probe will bind to the wrong gene.
Having a very long probe reduces this risk but intro-
duces problems of expense and the technical difficul-
ties of poor tissue penetration. In practice probes are
commonly of the order of 40---50 basepairs in length
and aremost commonly constructed using RNA rather
than DNA.
Labelling the probe for subsequent illustration of
the position of its binding produces the same problems
and shares some of the same solutions as immunohis-
tochemistry (see Section 4.22). Radioactive isotopes
are commonly used in research applications whereas
an alternative technique of attaching a specific antigen
(commonly digoxigenin) allows the use of the same
process of immunohistochemical staining described
above. The technique most commonly encountered in
the diagnostic histopathology laboratory is to label
using a fluorescent marker. This technique is termed
fluorescent in situ hybridisation (FISH).
The use of ISH suffers some analogous problems to
that of immunohistochemistry in that the processes of
tissue formalin fixation and paraffin embedding intro-
duce technical drawbacks. The cross-linking of pro-
teins caused by fixation hinders probes in accessing
DNA with the result that a number of pretreatment
stages are required in an analogous fashion to antigen
retrieval.
4.25.2 Applications
Although there are many applications of FISH in the
laboratory, the most common applications in the
Chapter 4 Cellular pathology 201

diagnostic histopathology laboratory fall into two
main groups as follows.
1. Detection of increased gene copy numbers. Some
diseases are associated with an abnormally large
number of copies of a single gene within the
nucleus. In current diagnostic use the detection of
gene copy numbers is routinely applied to the
investigation of breast cancer [38]. An aggressive
variant of breast cancer overexpresses the protein
Her2/neu (also known as Erb-B2) and this over-
expression is most commonly associated with an
Fluorescentsignal
Denaturing anduncoiling of DNA
double helix
Denaturing and uncoiling of specific DNA probe labelled
with fluorescent signal
In-situ hybridisation offluorescently labelled DNA
probe to specific gene(a)
Figure 4.59 The mechanism of fluorescence in situ hybridization: (a) the probe binds with its complementary segment ofDNA; (b) the translocation between chromosomes 9 and 22 results in the Philadelphia chromosome. The use of red(chromosome 9) and green (chromosome 22) probes in the vicinity of the breakpoint demonstrates colour overlap (resultingin yellow fluorescence) in the Philadelphia chromosome
202 Biomedical sciences

increase in the number of copies of the correspond-
ing gene (see Box 4.7). These are sometimes present
in the form of small chromosome-like segments of
DNA termed double minutes. The detection of
increased fluorescence and an abnormal number
of sites of fluorescence using Her2 probes is a good
indicator of an aggressive variant of breast cancer
and a potentially good response to the highly spe-
cific drug Trastuzumab.
2. Detection of translocations. FISH has the advantage
that several different probes and colours of fluores-
cent marker can be used simultaneously. Some
diseases are associated with predictable chromo-
somal translocations, for example the overwhelming
majority of cases of chronicmyelogenous leukaemia
(CML) are associated with a translocation that
brings together the bcr gene on chromosome 22
and the abl gene on chromosome 9 to form a fusion
gene (and a characteristic new chimeric chromo-
some called the Philadelphia chromosome). If
probes are applied which label the vicinity of the
bcr gene one colour and the abl gene another then
normal cellswill contain distinctly separate coloured
dots within the nucleus and cells that have under-
gone the translocation will produce dots of different
colours adjacent to each other with some colour
overlap [39] (Figure 4.59(b) and (c)).
At present the relatively limited range of uses in
diagnostic histopathology and the expense of staffing
andmaintaining this specialised techniquemean that it
is currently centralised to a relatively small number of
reference laboratories. With an increasing caseload
requiring FISH (especially in the field of breast pathol-
ogy) and an increasing number of highly targeted drug
therapies there will inevitably be an expansion of the
applications of FISH in common diagnostic use.
Bibliography
1. Kerr, J.F., Wyllie, A.H. and Currie, A.R. (1972) Apopto-
sis: a basic biological phenomenon with wide-ranging
implications in tissue kinetics. Br. J Cancer, 26, 239---57.
2. King, L.B. andAshwell, J.D. (1993) Signaling for death of
lymphoid cells. Curr. Opin. Immunol., 5, 368---73.
Chromosome 9 Chromosome 22
Chromosome 9 Chromosome 22
(b)
Figure 4.59 (Continued)
Chapter 4 Cellular pathology 203

3. Vaux, D.L. (1993) Toward an understanding of the
molecular mechanisms of physiological cell death. Proc.
Natl Acad. Sci. USA, 90, 786---9.
4. Levine, A.J.,Momand, J. and Finlay, C.A. (1991) The p53
tumour suppressor gene. Nature, 351, 453---6.
5. Ratnoff, O.D. (1974) Some recent advances in the study
of hemostasis. Circ Res., 35, 1---14.
6. Nieuwenhuis, H.K., Akkerman, J.W., Houdijk,W.P. and
Sixma, J.J. (1985) Human blood platelets showing no
response to collagen fail to express surface glycoprotein
Ia. Nature, 318, 470---2.
7. Ryan, G.B. and Majno, G. (1977) Acute inflammation.
A review. Am. J. Pathol., 86, 183---276.
8. Maxwell, P.H. and Ratcliffe, P.J. (2002) Oxygen sensors
and angiogenesis. Semin. Cell Dev. Biol., 13, 29---37.
9. Raghow, R. (1991) Role of transforming growth factor-
beta in repair and fibrosis. Chest, 99, 61S---65S.
10. Woessner, J.F. Jr (1991) Matrix metalloproteinases and
their inhibitors in connective tissue remodeling. FASEB
J., 5, 2145---54.
11. Pinnell, S.R. (1985) Regulation of collagen biosynthesis
by ascorbic acid: a review. Yale J. Biol. Med., 58, 553---9.
12. Heron, M.P. et al. (2009) Deaths: Final data for 2006.
National vital statistics reports, Vol. 57,No. 14. National
Center for Health Statistics, Hyattsville, Maryland, USA.
13. Solberg, L.A. and Strong, J.P. (1983) Risk factors and
atherosclerotic lesions. A review of autopsy studies.
Arteriosclerosis, 3, 187---98.
14. Beckman, J.A., Creager, M.A. and Libby, P. (2002)
Diabetes and atherosclerosis: epidemiology, pathophys-
iology, and management. JAMA, 287, 2570---81.
15. Ross, R., Glomset, J. and Harker, L. (1977) Response
to injury and atherogenesis. Am. J. Pathol., 86,
675---84.
16. Virchow, R.L.K. (1856) Gesammelte Abhandlungen zur
Wissenschaftlichen Medicin. Meidinger Sohn & Co.,
Frankfurt, in Virchow, R.L.K. (1998) Thrombosis and
emboli (1846---1856) translated by Matzdorff, A.C. and
Bell, W.R. Canton, Science History Publications, 5---11,
110.
17. Pasqualetti, P. and Casale, R. (1997) Risk of malignant
transformation in patients with monoclonal gammo-
pathy of undetermined significance. Biomed. Pharmac-
other., 51, 74---8.
18. Scheffner, M. et al. (1990) The E6 oncoprotein encoded
by human papillomavirus types 16 and 18 promotes the
degradation of p53. Cell, 63, 1129---36.
19. Dyson, N., Howley, P.M., M€unger, K. and Harlow, E.
(1989) The human papilloma virus-16 E7 oncoprotein is
able to bind to the retinoblastoma gene product. Science,
243, 934---7.
20. Dye, C. et al. (1999) Global burden of tuberculosis.
Estimated incidence, prevalence, andmortality by coun-
try. JAMA, 282, 677---86.
21. Parsonnet, J. et al. (1991) Helicobacter pylori infection
and the risk of gastric carcinoma. N. Engl. J. Med., 325,
1127---31.
22. Wotherspoon, A.C., Ortiz-Hidalgo, C., Falzon,M.R. and
Isaacson, P.G. (1991) Helicobacter pylori-associated
gastritis and primary B-cell gastric lymphoma. Lancet,
338, 1175---6.
23. Mims, C. et al. (1993) Medical Microbiology, 1st edn,
pp. 17---18, Mosby, London.
24. Pardee, A.B. (1974) A restriction point for control of
normal animal cell proliferation. Proc. Natl Acad. Sci.
USA, 71, 1286---90.
25. Elledge, S.J. (1996) Cell cycle checkpoints: preventing an
identity crisis. Science, 274, 1664---72.
26. Levine, A.J. et al. (1994) The 1993 Walter Hubert Lec-
ture: the role of the p53 tumour-suppressor gene in
tumorigenesis. Br. J. Cancer, 69, 409---416.
27. Wiman, K.G. (1993) The retinoblastoma gene: role in
cell cycle control and cell differentiation. FASEB J., 7,
841---5.
28. UK Health and Safety Executive COSHH guidance is
available at http://www.coshh-essentials.org.uk/
29. Bancroft, D. and Gamble, M. (2007) Theory and practice
of histological techniques, 6th edn, Churchill Livingstone,
London.
30. Roitt, I., Brostoff, J. and Male, D. (1998) Immunology,
4th edn, Mosby, London.
31. K€ohler, G. and Milstein, C. (1975) Continuous cultures
of fused cells secreting antibody of predefined specificity.
Nature, 256, 495---7.
32. Dodson, A. (2002) Modern methods for diagnostic
immunocytochemistry. Curr. Diag. Path., 8, 113---22.
33. Mount, S.L. and Cooper, K. (2001) Beware of biotin: a
source of false-positive immunohistochemistry. Curr.
Diag. Path., 7, 161---7.
34. Jasani, B. and Rhodes, A. (2001) The role and mecha-
nism of high-temperature antigen retrieval in diagnostic
pathology. Curr. Diag. Path., 7, 153---60.
35. Wall, J., Langmore, J., Isaacson, M. and Crewe, A.V.
(1981) Colloidal gold: a cytochemical marker for light
and fluorescent microscopy and for transmission and
scanning electronmicroscopy. Scan. ElectronMicrosc., Pt
2: 9---31.
36. Shore, I. and Moss, J. (2002) Electronmicroscopy in
diagnostic renal pathology.Curr. Diag. Path., 8, 207---15.
37. Sewry, C. (2002) Electronmicroscopy of human skeletal
muscle: role in diagnosis. Curr. Diag. Path., 8, 225---31.
38. Mitchell, M.S. and Press, M.F. (1999) The role of
immunohistochemistry and fluorescence in situ hybrid-
ization forHER2/neu in assessing the prognosis of breast
cancer. Semin. Oncol., 26, 108---16.
39. Amiel, A. et al. (1993) Clinical detection of BCR-abl
fusion by in situ hybridization in chronic myelogenous
leukemia. Cancer Genet. Cytogenet., 65, 32---4.
204 Biomedical sciences

Chapter 5
Clinical chemistry
Professor Ray K. Iles, B.Sc., M.Sc., Ph.D., CBiol, FSB, FRSCand Dr Stephen A. Butler, B.Sc., Ph.D.
Introduction
In the broadest sense clinical chemistry is the area of
pathology that is concerned with analysis of bodily
fluids. Since boundaries are always blurred (and blood
is by definition a bodily fluid)many hospitals link their
clinical chemistry and haematology sections. However,
a more differential definition is that clinical chemistry
(or clinical biochemistry in some hospitals) is the
analysis of the soluble noncellular components of
bodily fluid. These components vary from small inor-
ganic compounds --- such as salts and ions --- to larger
organic compounds --- such as lipids and steroids and
even drugs --- to macromolecules such as albumin,
enzymes and protein hormones.
Part I: Analytical methodsThe biochemical tests used in a clinical chemistry
laboratory are designed to accurately quantify these
specific components. In order to reduce variation in
laboratory measurement to an absolute minimum,
standard operating procedures (SOPs) and rigid
quality control testing regimes are enforced in all
tests conducted.
5.1 Sample collection
The principal biological fluid examined in clinical
chemistry is blood serum as distinct from blood
plasma which still contains clotting factors including
fibrinogen.However, urine is also collected for analysis
and is usually a 24 h collection in a plastic container
supplied from clinical chemistry and containing an
antibacterial agent. Early morning urine (EMU) is
often collected as it is considered to be more concen-
trated whilst midstream urine (MSU) is often collected
for microbiological purposes.
5.1.1 Blood
In general blood, if not sampled bymedical staff on the
ward or the accident and emergency department, will
be sampled at a clinical/haematology blood clinic
collected by a qualified phlebotomist and many bio-
medical scientists are also phlebotomy trained.
Samples are collected in tubes appropriate to the test
required. For most analytes to be measured by immu-
noassay serum is the optimal fluid and the blood is
simply allowed to clot in a plain tube thereby allowing
the cellular components fibrinogen and clotting factors
Biomedical Sciences: Essential Laboratory Medicine, First Edition. Edited by Ray K. Iles and Suzanne M. Docherty.� 2012 John Wiley & Sons, Ltd. Published 2012 by John Wiley & Sons, Ltd.
205

to coagulate leaving the clotting factor-free yellow/
straw serum on top and a retracting clot of blood cells
on the bottom. Centrifugation simply helps maximize
the volume of serum harvested. However, vigorous
centrifugation is not recommended as this can lyse
some of the red cells releasing soluble haemoglobin
that will give a red contamination to the serum sample.
This can interfere with immunoassay results, as can not
allowing the clot to fully form (usually 1 h on the bench
at room temperature is sufficient). Harvested before a
clot has properly formed results in a serum that is
viscous due to fibrinogen partial polymerization and
a sample that can artificially precipitate antibodies or
labelled tracers in an immunoassay system.
However, plasma is needed when measuring the
levels of clotting factors in certain haematological
disorders such as haemophilia and von Leiden factor
8 deficiency (see Chapter 8, Section 8.8.5), or indeed if
the unclotted cellular components are to be analysed
by a Coulter or flowcytometer (see Chapter 8,
Section 8.2.1). In order to minimize the total amount
of blood collected from a patient the sample will be
collected in a tube containing an anticoagulant so that
the spin down cellular component can be analysed by
haematology and the plasma sent for simultaneous
analysing for common clinical chemistry analytes.
Clotting can be prevented by the presence of sodium
citrate, heparin or EDTA in the blood collecting tube.
However, the anticoagulant used will determine which
range of simultaneous test can be performed. Heparin
irreversibly blocks clotting in such samples and so is no
good if a clotting test is needed. EDTA chelates ions
and, although reversible by addition of excess magne-
siumand calcium,will compromise plasma analysis for
certain enzymes. Clotting can also effect the measure-
ment of blood glucose and adrenaline/catecholamine
so plasma is often collected instead of serum in
certain circumstances for specific soluble analytes (see
Table 5.1). In most hospitals blood collection is via
Vacutainer tubes and the leading manufacturer is
Becton Dickinson. The BD Vacutainer blood collec-
tion system is described as a closed evacuated system,
which consists of a double-ended needle with a safety
valve. Essentially, the BD Vacutainer holder is a plastic
sleeve into which a double-ended needle assembly
screws. Blood is collected by screwing the sleeve-cov-
ered end of the needle into the holder, then puncturing
the patients’ vein with the other end. After performing
venepuncture the tube is then pushed down into the
holder, and the premeasured vacuum of the tube
allows the required volume of blood to be drawn
(see Figure 5.1). The tubes are colour coded according
to the appropriate additive and international standards
(ISO 6710, also see Table 5.1).
5.1.2 Urine
After blood, urine is the second most commonly
analysed biological fluid (with CSF, saliva, ascites,
follicular fluid and inflammatory exudates muchmore
rarely sampled). The dynamics of this fluid are con-
siderably different from most blood analysis. In the
majority (60---80%) of blood-based tests the analytes
are expected to be maintained within a relatively
narrow concentration band in healthy individuals ---
to be kept in homeostasis --- but significantly altered by
disease processes. Urine, however, is an excretory
media in which the concentration of analytes within
any given sample varies dramatically depending on
water volume intake, food or drug consumption and
the rate of metabolism of molecules. All of these
confounding factors vary throughout the day and, in
the case of metabolism, can be up or down as regulated
Figure 5.1 Example of Vacutainer venepuncture and the various colour coded Vacutainer tubes with appropriate antic-oagulants added
206 Biomedical sciences

Table 5.1 Collection tube and associated anticoagulant (and colour) for clinical laboratory test.
Investigation Lithiumheparin(green)
EDTA(pink)
Fluorideoxalate(grey)
Sodiumcitrate(blue)
Clotted(red)
Full blood count �
U&Es �
Group and save/crossmatch �
Clotting �
Liver function tests �
Paediatric renal profile �
Bone profile �
Thyroid function tests �
Alkaline phosphatase �
Aldosterone �
17-alpha OHP �
3-Hydroxybutyrate �
Angiotensin converting enzyme �
ACTH �
Alpha fetoprotein �
Albumin �
Alcohol �
Alkaline phosphatase isoenzymes �
Ammonia �
Amylase �
Anti neutrophil cytoplasmic antibody �
Blood group antibody screen �
AST �
Antithrombin III �
Anti Xa assay �
APTT �
Autoantibody screen (ANA, liver AI screen) �
Autoantibody screen (adrenal, islet cell, salivary gland) �
Vitamin B12 �
Folate �
Bicarbonate �
Bilirubin (direct and conjugated) �
Biotinidase �
Blood film �
C3/C4 �
Caffeine �
Carbamazepine �
Calcium �
Chloride �
Cholesterol �
Cholesterol HDL �
(Continued )
Chapter 5 Clinical chemistry 207

Table 5.1 (Continued )
Investigation Lithiumheparin(green)
EDTA(pink)
Fluorideoxalate(grey)
Sodiumcitrate(blue)
Clotted(red)
Cholinesterase �
Creatinine kinase �
Coeliac screen (TTG) � �
Cold agglutinin screen �
Copper �
Complement �
Cortisol �
C-Peptide �
Creatinine �
CRP �
Cryoglobulins
Cyclosporin �
D-Dimer � �
DHEAS �
Digoxin �
Direct Coombs test (DCT) � �
DsDNA antibodies �
ESR �
Ferritin �
Fibrinogen �
Tacrolimus levels �
Free fatty acids �
Free T3 �
Free T4 �
FSH �
G6PD �
Gal-1-PUT �
Gamma GT �
Gastrin �
Glandular fever screen �
Glomerular basement membrane (GBM) antibody �
Glucose �
Haemoglobinopathy screen �
Haemoglobin S quantitation �
Haemolysin (ABO HDNB) Screen �
Factor v Leiden �
Haptoglobin �
HbA1C �
Human chorionic gonadotrophin (HCG) �
HLA antibody screen �
Homocysteine �
208 Biomedical sciences

Table 5.1 (Continued )
Investigation Lithiumheparin(green)
EDTA(pink)
Fluorideoxalate(grey)
Sodiumcitrate(blue)
Clotted(red)
Iron binding capacity �
IgA �
IGF-1 �
IgG �
IgM �
Immunoglobulins �
Insulin
Iron �
Lactate �
LDH �
LDH isoenzymes �
LH �
Lipoprotein electrophoresis �
Lithium �
Magnesium �
Malaria parasite screen �
Methotrexate �
Pregnancy test (blood) �
Oestradiol �
Osmolality �
Paracetamol �
Phenyalanine �
Phenytoin �
Phosphate �
Plasma amino acids �
Progesterone �
Prolactin �
Protein (total) �
Protein C level �
Protein S level �
Prothrombin time �
Parathyroid hormone (PTH) �
Renin �
Reticulocyte count �
Rheumatoid factor (RF) �
Salicylate �
Sex hormone binding globulin �
Sickle screen �
Suxamethonium sensitivity �
Testosterone �
Theophylline �
(Continued )
Chapter 5 Clinical chemistry 209
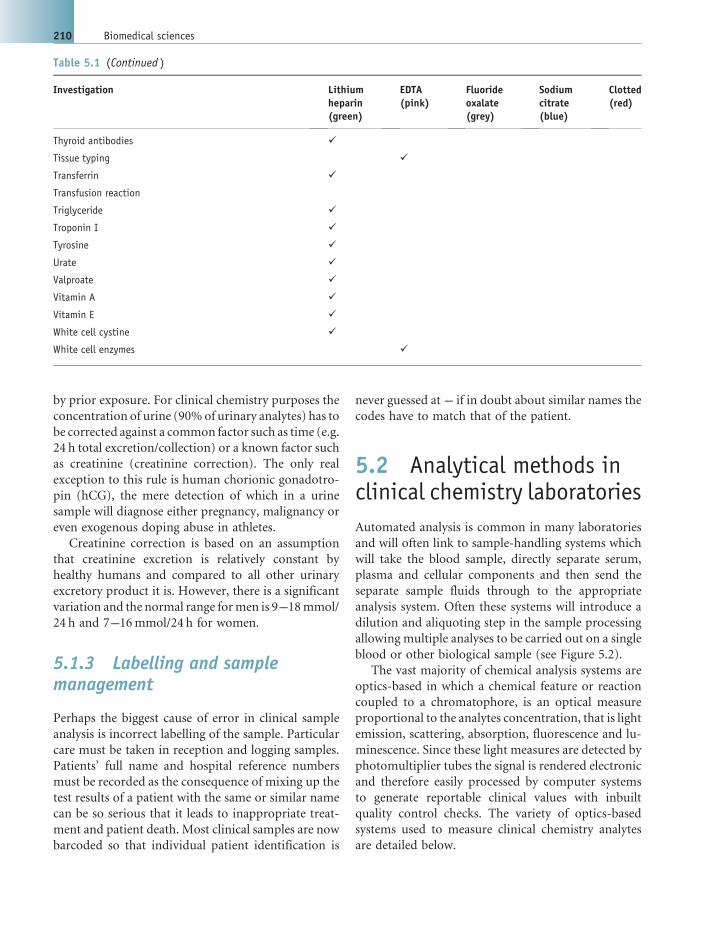
by prior exposure. For clinical chemistry purposes the
concentration of urine (90%of urinary analytes) has to
be corrected against a common factor such as time (e.g.
24 h total excretion/collection) or a known factor such
as creatinine (creatinine correction). The only real
exception to this rule is human chorionic gonadotro-
pin (hCG), the mere detection of which in a urine
sample will diagnose either pregnancy, malignancy or
even exogenous doping abuse in athletes.
Creatinine correction is based on an assumption
that creatinine excretion is relatively constant by
healthy humans and compared to all other urinary
excretory product it is. However, there is a significant
variation and the normal range formen is 9---18mmol/
24 h and 7---16mmol/24 h for women.
5.1.3 Labelling and samplemanagement
Perhaps the biggest cause of error in clinical sample
analysis is incorrect labelling of the sample. Particular
care must be taken in reception and logging samples.
Patients’ full name and hospital reference numbers
must be recorded as the consequence of mixing up the
test results of a patient with the same or similar name
can be so serious that it leads to inappropriate treat-
ment and patient death. Most clinical samples are now
barcoded so that individual patient identification is
never guessed at --- if in doubt about similar names the
codes have to match that of the patient.
5.2 Analytical methods inclinical chemistry laboratories
Automated analysis is common in many laboratories
and will often link to sample-handling systems which
will take the blood sample, directly separate serum,
plasma and cellular components and then send the
separate sample fluids through to the appropriate
analysis system. Often these systems will introduce a
dilution and aliquoting step in the sample processing
allowing multiple analyses to be carried out on a single
blood or other biological sample (see Figure 5.2).
The vast majority of chemical analysis systems are
optics-based in which a chemical feature or reaction
coupled to a chromatophore, is an optical measure
proportional to the analytes concentration, that is light
emission, scattering, absorption, fluorescence and lu-
minescence. Since these light measures are detected by
photomultiplier tubes the signal is rendered electronic
and therefore easily processed by computer systems
to generate reportable clinical values with inbuilt
quality control checks. The variety of optics-based
systems used to measure clinical chemistry analytes
are detailed below.
Table 5.1 (Continued )
Investigation Lithiumheparin(green)
EDTA(pink)
Fluorideoxalate(grey)
Sodiumcitrate(blue)
Clotted(red)
Thyroid antibodies �
Tissue typing �
Transferrin �
Transfusion reaction
Triglyceride �
Troponin I �
Tyrosine �
Urate �
Valproate �
Vitamin A �
Vitamin E �
White cell cystine �
White cell enzymes �
210 Biomedical sciences

5.2.1 Flame photometry
Flame photometry works on the principles of flame
atomic emission spectrometry. A spectral scan of the
visible portion of the electromagnetic spectrum
produced when metals are excited in a flame pro-
duces highly intense lines of emission at particular
wavelengths (see Figure 5.3). The intensity of emis-
sion at these characteristic wavelengths is propor-
tional to the amount of sample present in the fluid.
However, there is no need to produce a complex
spectral analysis as the combined spectral emission
will change the source flame a characteristic colour,
for example potassium --- violet (lilac); sodium ---
golden yellow; calcium --- brick red.
In its simplest form flame photometry is a quick,
economical and simple way of detecting and quantify-
ing traces ofmetal ions. Simply spray the fluid contain-
ing the metal through a flame and measure the light
intensity emitted through an appropriate colour filter
(see Figure 5.4). The instrument is calibrated by run-
ning standards of known concentration and construct-
ing a calibration curve from which the running of a
sample of unknown can be read against giving the value
of the analyte in the sample (see WHO standard
operating procedures flame photometric assay). In
clinical chemistry primarily sodium and potassium
are measured by flame photometry although lithium,
calcium and barium can also be measured in a biologi-
cal fluid by this method.
Figure 5.2 Example of an autoanlyser in a clinical chemistry laboratory and a bench top sample dilution and distributorsystem
Figure 5.3 Emission spectra of sodium (Na), potassium (K),magnesium (Mg) and calcium (Ca) Figure 5.4 Example of a simple flame photometer
Chapter 5 Clinical chemistry 211

WHO standard operation procedure for clinical flame photometric assay of Potassiumand Sodium
Reagents - All chemicals must be Analar grade.
Sodium chloride (NaCI) and potassium chloride (KCI) should be dried for 2---3 hours at about 100�C before
use. Before weighing, the chemicals must be allowed to cool to room temperature either in a desiccators or in a
container with a tight-fitting lid with a small air space.
. Stock Sodium 1000mmol/L --- Weigh out 29.25 g dried NaCl, dissolve in about 400ml of distilled water
taken in a 500ml volumetric flask and then make up to 500ml with distilled water. Store in a pyrex glass
bottle at 25---35�C. Stable for one year.. Stock Potassium 100mmol/L --- Weigh out 0.746 g dried KCI, dissolve in about 80ml of distilled water
taken in a 100ml volumetric flask and then make up to 100ml with distilled water. Store in a pyrex glass
bottle at 25---35�C. Stable for one year.
. Working Standards ---. Low standard for Sodium 100mmol/L: Dilute 10ml of stock sodium to 100ml with distilled water. Stable
for 6 months at 25---35�C.. Combined standard for sodium and potassium140Naþ/5Kþmmol/L: Dilute 14ml of stock sodium and
5ml of stock potassium together to 100ml with distilled water. Store in a pyrex bottle at 25---35�C.Stable for 6 months.
. Aspiration standard for sodium - 1.0mmol/L: Dilute 1.0ml of working standard to 100ml with
distilled water. Prepare fresh each time.. Combined aspiration standard for sodium 1.4mmol/L and potassium 0.05mmol/L. Dilute 1.0ml of
working standard (combined standard for Naþ/Kþ140/5mmol/L) to 100ml with distilled water.
Prepare fresh each time.
Equipment --- Two point calibrated clinical flame photometer with appropriate filter for potassium and
sodium colour emission.
Sample dilution
Dilute each serum sample 1:100 with distilled water by mixing 0.1ml sample with 9.9ml distilled water.
Procedure for simultaneous measurement of Na+ & K+ in the flame photometer (digital flame
photometer)
. Switch on the flame photometer. Digital display should turn on.
. Turn the set ‘(full scale) F.S. coarse and fine controls’ into maximum clockwise position.
. Select appropriate filter with the help of filter selector wheel (Naþ on the left side and Kþ on the right side).
. Switch on the compressor and check the air pressure. Adjust it to read between 0.4 and 0.6 kg/cm2.
. Open the gas cylinder, remove the trapper at the rear of the flame photometer and ignite the flame.
. Adjust the gas regulator to get amaximumheight non-luminous blue flamewith 10 distinct cones (5 on each
side of the burner head).. Feed distilled water to the atomizer and wait for at least 30 seconds.. Adjust the ‘Set Ref Coarse’ and Fine controls’ to zero digital readout for Kþ only.. Aspirate 1.0mmol/L Naþ solution. Wait at least 30 seconds and then adjust the Set Ref Coarse and Fine
controls’ to a digital read out of I 00 for Naþ only.. Aspirate the combined standard solution (1.4/0.05, Naþ/Kþ) and wait at least for 30 seconds. Adjust ‘F.
S control’ on Naþ side for readout 140 and that on Kþ side for a digital readout of 50.
212 Biomedical sciences

5.2.2 Colorimetric assay
The classic example of a simple colorimetric assay in
clinical chemistry is the measurement of urea in
which its reaction with specific compounds (chro-
mogens) yields a colour product. Often called BUN
this refers to assay of blood urea --- blood urea
nitrogen. Urea reacts directly with diacetyl mono-
xime under strong acidic conditions to give a yellow
condensation product. The reaction is intensified by
the presence of ferric ions and thiosemicarbazide.
The intense red colour formed is measured at
540 nm (yellow green) on a standard colorimeter
(see Figure 5.5 and WHO standard operating pro-
cedure for urea).
Glucose is also measured by colorimetric assays
but unlike urea the colour produced is not a result
of the direct interaction of the target analyte with
the chromogen. Indeed it is somewhat removed as
the colour reaction is a bystander effect of an
introduced chromatophore reacting via an enzyme
with a metabolic product of glucose being acted on
by a specific glucose degrading enzyme. Neverthe-
less, the intensity of colour or indeed fluorescence
generated is still directly proportional to the con-
centration of glucose present --- a coupled reaction
Urea +
Diacetyl Monoxime = Yellow
complex + Ferricions
Thiosemicarbazide = Intensered
complex
Figure 5.5 Illustration of the chemical colour changes of diacetyl monoxime with urea and ferric ions
. Repeat steps 9 and 10 once again. The flame photometer now stands calibrated.
. Now feed diluted test sample/QC to the atomizer for at least 30 seconds before recording the readings
for Naþ and Kþ.
Calculation
After aspirating the standard solution, the digital reading for Naþ is adjusted to 140 and that of Kþ to 50.
This is done in order to represent Naþ and Kþ values in undiluted serum. Since the test sample/QC is
diluted initially 1:100 and then aspirated, the initial standard values for Naþ & Kþ (1.4 & 0.05mmol/L)
must be multiplied by 100 to represent 140mmol/L Naþ and 5mmol/L Kþ. In the case of Kþ, in order to
improve the sensitivity of the assay the digital reading for the standard is further multiplied by 10 to show
a reading of 50.
Analytical reliabilities
Since Naþ, Kþ are very commonly analysed parameters in a laboratory, it is recommended that
internal QC (normal QC pool) be included with every batch of samples analysed in a day, irrespective
of the number of samples in a batch. Further, even when a single sample is analysed as an “emergency”
sample at any time of the day or night, it is essential to include an internal QC. From the QC results
obtained for the day, mean, standard deviation and % CV can be calculated to ensure that within-day
precision is well within the acceptable limit, i.e. 4%. The mean value of internal QC for the day can be
pooled with the preceding 10 or 20 mean values obtained in the previous days and between-day
precision can be calculated and expressed as % CV. Ensure that this is well within the acceptable limit,
i.e, 8%.
“Assayed” QC sera with stated values (ranges) are available from several commercial sources, viz.
Boehringer Mannheim, BioRad & Randox.
Chapter 5 Clinical chemistry 213

WHO standard operation procedure for Urea analysis by colorimetric assay
Diacetyl monoxime method
Principle of the method --- Urea reacts directly with diacetyl monoxime under strong acidic conditions to
give a yellow condensation product. The reaction is intensified by the presence of ferric ions and
thiosemicarbazide. The intense red colour formed is measured at 540 nm/yellow green filter.
Specimen types, collection and storage --- Serum is the specimen of choice. Store samples for no longer than
8 hours at room temperature (25---35 �C) and 7 days at 2---8 �C. For a longer duration, store in the freezer. If
the samples show evidence of bacterial contamination, do not use these for urea estimation. Plasma could also
be used for urea estimation.
Reagents --- All chemicals must be Analar grade.
. Stock acid reagent --- Dissolve 1.0 g of ferric chloride hexahydrate in 30ml of distilled water. Add 20ml
orthophosphoric acid andmix. Store in a brownbottle at room temperature (25---35 �C). Stable for 6months.. Mixed acid reagent --- Add slowly 100ml of Conc. H2S04 to 400ml distilled water taken in a 1-litre flat-
bottomconical flask kept in an icecoldwaterbath.Mixwell and add0.3ml of stock acid reagent.Mix and store
in a brown bottle at room temperature (25---35 �C). Stable for 6 months.. Stock colour reagent A --- Dissolve 2 g Diacetyl monoxime in distilled water and make the volume up to
100ml in a volumetric flask. Store in a brown bottle at room temperature (25---35 �C). Stable for 6 months.. Stock colour reagent B --- Dissolve 0.5 g thiosemicarbazide in distilled water and make up to 100ml in a
volumetric flask. Store in a brown bottle at room temperature (25---35 �C). Stable for 6 months.. Mixed colour reagent ---Mix 35ml of stock colour reagent Awith 35ml of stock colour reagent B andmake
upto500mlwithdistilledwater. Store inabrownbottleat roomtemperature (25---35 �C).Stable for6months.. Stock urea standard ---Weigh 1.0 g of analytical-grade urea and dissolve in 100ml of benzoic acid (1 g/dl).
Use a 100ml of volumetric flask for preparing this. Store at room temperature (25---35 �C). Stable for
6 months.. Working standard 50mg/dl --- Dilute 5.0ml of stock urea standard to 100ml with benzoic acid. Store at
room temperature (25---35 �C). Stable for 6 months.
Dilution of Standards (S1-S3), Test & QC
Pipette the following into appropriately labelled 13� 100mm tubes
S1 S2 S3 Test QC
Distilled Water (ml) 1.9 1.8 1.7 1.9 1.9
50mg/dl Urea (ml) 0.1 0.2 0.3 - -
Test sample/QC (ml) - - - 0.1 0.1
Mix Well
. Colour Development
The colour reagent is prepared fresh at the time of analysis by mixing distilled water, mixed acid reagent and
mixed colour reagent in the ratio 1:1:1.
Pipette the following into another set of appropriately labelled 18� 150mm tubes.
Blank S1 S2 S3 Test QC
Colour reagent (ml) 3.1 3.0 3.0 3.0 3.0 3.0
Respective diluted
standard (ml) - 0.1 0.1 0.1 - -
Diluted test/QC (ml) - - - - 0.1 0.1
214 Biomedical sciences

Mix all tubes well. Keep them in a boiling waterbath for 15minutes. Remove from waterbath and cool the
tubes for 5minutes. Set the spectrophometer/filter photometer to zero with blank at 540 nm/yellow green
filter and measure the absorbance of the other tubes.
Calculation and calibration graph
Concentration of standards:
S1 ¼ 50 mg=dl; S2 ¼ 100 mg=dl;
S3 ¼ 150 mg=dl
Plot the absorbance values of standards against their respective concentrations. The measurable range with
this graph is from 10 to 150mg/dl. A calibration graph should be constructed whenever a new set of reagents is
prepared. Plot absorbance values of test/QC on the calibration graph and read off the concentrations. Once
linearity is proved, it will be enough if S3 is set up every time that patients’ samples are analysed and the results
calculated using the formula:
Urea in test sample ¼ Absorbance of test
Absorbance of Standard� 150 mg=dl
Analytical reliabilities
Since urea is one of themost common analytesmeasured in a laboratory after glucose, it is recommended that
an internal QC (normal QC pool) be included with every batch of samples analysed in the day, irrespective of
the number of samples in a batch. Further, even when a single sample is analysed as an “emergency” sample at
any time of the day or night, it is essential to include an internal QC. From theQC results obtained for the day,
mean, standard deviation and %CV can be calculated to ensure that within-day precision is well within the
acceptable limit, i.e. 4%.
Themean value of internalQC for the day can be pooledwith the preceding 10 or 20mean values obtained in the
previous days and between---day precision can be calculated and expressed as % CV. Ensure that this is well within
the acceptable limit, i.e. 8%.
“Assayed” QC sera with stated values (ranges) are available from several commercial sources, viz.
Boehringer Mannheim, BioRad & Randox. If a laboratory uses QC sera from a commercial source, it is
important that the company certifies that their QCmaterials are traceable to international referencematerials.
Hazardous materials
Most of the chemicals used in thismethod are acids. Care should therefore be taken to avoidmouth pipetting
and contact with skin.
Chapter 5 Clinical chemistry 215

WHOstandard operation procedure for Glucose analysis by colorimetric assay (GlucoseOxidaseMethod)
Principle of themethod ---Glucose present in the plasma is oxidized by the enzyme glucose oxidase (GOD)
to gluconic acid resulting in the liberation of hydrogen peroxide, which is converted to water and oxygen by
the enzyme peroxidase (POD). 4 aminophenazone, an oxygen acceptor, takes up the oxygen and together with
phenol forms a pink coloured chromogen which is measured at 515 nm.
Specimen type, storage and collection --- Plasma is the specimen of choice for glucose estimation. Plasma
glucose levels have been found to be quite stable for 6 hours at room temperature (25---35 �C) in but it is
important that plasma should be separated from the cells soon after collection, preferably within 1 hour.
About 2ml of the patient’s blood should be collected by venipuncture into a anticoagulant tube containing a
mixture of potassium ethylene diaminetetraacetate (EDTA) sodium fluoride at a ratio 1:2 (W/W). The tube
should be gently but thoroughly shaken for complete mixing.
:: Reagents --- All chemicals must be Analar grade
. Phosphate Buffer: 100mmol/L. pH 7.0
To 800ml of distilled water add the following in the order:. Disodium hydrogen phosphate dihydrate [Na2HPO4 2H2O] 12.95 g. Anhydrous potassium dihydrogen phosphate [KH2PO4] 4.95 g. Sodium azide [NaN3] 0.5 g
Add one by one, dissolve and finally make up to 1 litre with distilled water. Stable for 3---4 months, at 2---8 �C.Check that the final pH is 7.0� 0.05 with a pH meter.. Colour Reagent
To 100ml of phosphate buffer add the following in the order and then mix to dissolve:. 4 amino phenazone 16mg. GOD [Sigma G 7016] 1800 units. POD [Sigma P 8250] 100 units. Phenol 105mg. Tween 20 [Sigma P 1359] 50ml
Reconstitute the purchased GOD& POD powder with phosphate buffer. Dispense separately into vials so thateach vial represents the requisite number of units. Store the vials frozen. Stable for 2weeks at 2---8 �C. Store in abrown bottle.. Benzoic acid 1 g/l. ---Dissolve 1.0 g of benzoic acid in water andmake up to 1 litre with water. This solution
is stable indefinitely at room temperature.. Stock glucose solution, 1 g/l. --- Before weighing, dry the glucose at 60---80 �C for 4 hours. Allow to cool in a
dessicator. Dissolve 1 g of glucose in benzoic acid solution and make up to 100ml in a volumetric flask.
Stable for six months at room temperature (25---35 �C). DO NOT FREEZE THE STANDARD. Working glucose standard 100mg/dl. ---Dilute 10ml of stock glucose (use either a volumetric pipette or a
burette) to 100ml with benzoic acid in a 100ml volumetric flask. Mix well. Stable for 6 months at room
temperature (25---35 �C).. Dilution of standards (S1---S5), Test & QC
Pipette the following into appropriately labelled 13� 100mm tubes
S1 S2 S3 S4 S5 Test QC
Distilled Water (ml) 1.9 1.8 1.7 1.6 1.5 1.9 1.9
100mg/dl glucose (ml) 0.1 0.2 0.3 0.4 0.5 - -
Test sample/QC (ml) - - - - - 0.1 0.1
Mix well
216 Biomedical sciences

. Colour development
Pipette the following into another set of appropriately labelled tubes.
Blank S1 S2 S3 S4 S5 Test QC
Colour reagent (ml) 1.2 1.2 1.2 1.2 1.2 1.2 1.2 1.2
Distilled water (ml) 0.1 - - - - - -
Diluted Standards
(ml) 0.1 0.1 0.1 0.1 0.1 - -
Diluted Test
Sample/QC (ml)
- - - - - - 0.1 0.1
Mix all tubes well. Incubate at 37 �C in a waterbath for 15minutes.
Remove from water bath and cool to room temperature. Set the spectrophotometer/filter photometer to
zero using blank at 510 nm/green filter and measure the absorbance of Standards, Test and QC.
This protocol is designed for spectrophotometers/filter photometer that require a minimum volume of
reaction mixture in the cuvette of 1ml or less. Economical use of reagents is possible with this protocol, thus
the cost per test can be kept to theminimum. However, if a laboratory employs a photometer requiring a large
volume of the reactionmixture formeasurement, viz. 5ml, it is advisable to increase the volume of all reagents
mentioned under Tabulation “(b) Colour development” proportionately.
Calculation and calibration graph
Since the protocol for standard tube S1 and test is identical, the standard S1 will represent a concentration of
100mg/dl. The glucose concentrations represented by other standard tubes are S2¼ 200; S3¼ 300; S4¼ 400&
S5¼ 500 (mg/dl).
Plot the absorbance values of standards against their respective concentrations. Themeasurable range with
this graph is from 10 to 500mg/dl.
Plot absorbance values of Test/QC on the calibration graph and read off the concentrations.
Once linearity is proved, it is not necessary to prepare the standard graph every time that patients’ samples
are analysed. It will be adequate if standard S2 is taken every time and patients’ results are calculated using the
formula:
Test absorbance
Standard absorbance� 200 mg=dl
Chapter 5 Clinical chemistry 217

(see Figure 5.6 and WHO standard operating pro-
cedure for glucose assay).
Enzymes have frequently, in the past, been mea-
sured by colorimetric assay in which the catalytic
activity of the enzyme itself is used as the definition
of quantification: an artificial chromogenic substrate
directly or indirectly acted on as a result of the target
enzyme is added in access and the amount/concentra-
tion of the product (a colour intensity) produced per
unit of time. Enzymes are therefore measured in
arbitrary ‘units’ which is the amount of enzyme re-
quired to convert a defined amount of substrate to
product (e.g. mmol) in a defined time period (i.e. per
minute) at a set temperature (i.e. 20 �C). This ap-
proach assumes that the enzyme is robust and catalyt-
ically stable. This is not always true and now enzymes
are being increasingly assayed by immunoassay where
the target is to measure the amount of protein that is
the enzyme and not its intrinsic enzymic activity.
5.2.2.1 Other blood analytes commonlymeasuredby colorimetric assay
CalciumSerum calcium is not usually measured by flame
photometry as it lacks sensitivity; however, direct
colorimetric assays are sufficiently sensitive. Calcium
forms a purple-coloured complex with ortho-
cresolphthalein complexone in an alkaline medium.
The inclusion of HCl helps to release calcium bound to
proteins and 8 hydroxy-quinoline eliminates the
interference by magnesium. 2-amino, 2-methyl, 1-
propanol (AMP) provides the proper alkaline medium
Analytical reliabilities
Since glucose is the most common analyte measured in a laboratory, it is advisable to include an internal
QC (normal QC pool) with every batch of samples analysed in the day, irrespective of the number of
samples in a batch. Further, even when a single sample is analysed as an “emergency” sample at any time of
the day or night, it is essential to include an internal QC. From the QC results obtained for the day, mean,
standard deviation and %CV can be calculated to ensure that within-day precision is well within the
acceptable limit, i.e, 5%.
Themean value of internal QC for the day can be pooled with the preceding 10 or 20mean values obtained
in the previous days, and between---day precision can be calculated and expressed as %CV. Ensure that this is
well within the acceptable limit, i.e, 8%.
At least once a day analyse another QC serum from either a low QC or high QC pool.
“Assayed” QC sera with stated values (ranges) are available from several commercial sources, viz.
Boehringer Mannheim, BioRad & Randox. If a laboratory uses QC sera from a commercial source, it is
important that the company certifies that their QC materials are traceable to international reference
materials.
:: Hazardousmaterials –This procedure uses sodium azide and phenol, which are poisonous and caustic.
Do not swallow, and avoid contact with skin and mucous membranes
Glucose present in the sample is oxidized by the enzyme glucose
oxidase (GOD) to gluconic acid resulting in the liberation of
hydrogen peroxide, which is converted to water and oxygen by a
peroxidize (POD) enzyme (here it is horse radish peroxidize-
HRP). The POD reaction can only occur if an acceptor substrate
is available. Many substrates have been developed that become
coloured or, as in this case, fluoresce.
Figure 5.6 Hydrogen peroxide generation enzyme coupled reaction for colorimetric assays
218 Biomedical sciences

for the colour reaction. The intensity of the colour is
measured at 540 nm.
Phosphates (Stannous Chloride reduction colorimetricassay method)Phosphorus in serum reacts with ammonium molyb-
date to form phosphomolybdate, which is then re-
duced by stannous chloride and hydrazine sulphate to
molybdenum blue. The intensity of the colour is
measured at 640 nm.
CreatinineOften assayed by the Jaffe method, creatinine present
in serum or plasma directly reacts with alkaline picrate
resulting in the formation of a red colour, the intensity
of which is measured at 505 nm/green filter. Protein
interference is eliminated using sodium lauryl sul-
phate. A second absorbance reading after acidifying
with 30% acetic acid corrects for nonspecific chromo-
gens in the samples.
BilirubinOften assayed by the Jendrassik and Grof method,
this is another direct chromogen reaction colori-
metric assay. Serum bilirubin is present in two forms
conjugated (liver processing of bilirubin results in
mono- and diglucuronide conjugation) and serum
protein bound. Conjugated bilirubin in serum can
directly reaction couple with diazotized sulphanilic
acid to form a red coloured compound. The cou-
pling reaction is rapid and is stopped with ascorbic
acid in order to prevent excessive reaction with
haemoglobin interfering with the assay. Protein
bound bilirubin is released by a caffeine benzoate
solution and can then reaction-couple with diazo-
tized sulphanilic acid. In both cases, after reactive
coupling with diazotized sulphanilic acid, tartrate
buffer alkation converts the red acid---bilirubin com-
plex to a green coloured compound which shows
peak absorbance at 607 nm. At this wavelength the
absorbance due to haemoglobin or carotene is min-
imal. Bilirubin measure is reported as conjugated
and total bilirubin as the distinction has clinical
relevance (see Section XX).
Total proteins (biuret direct colorimetric assays)Proteins form a purple coloured complex with cupric
ions in alkaline solution. The reaction takes its name
from the simple compound biuret which reacts in the
same way. The intensity of the purple colour is mea-
sured at 540 nm/yellow green filter and compared with
a standard serum of known protein concentration.
Albumin (BCG dye binding colorimetric method)Albumin binds quantitatively with bromocresol green
at pH 4.15 resulting in the formation of a green colour
which can be measured at 630 nm/red filter.
EnzymesExamples of colorimetric assay for serum enzymes:
. Alkaline Phosphatase (Total). Paranitrophenyl
phosphate, which is colourless, is hydrolysed by
alkaline phosphatase at pH 10.5 and 37 �C to form
free paranitrophenol, which is coloured yellow.
The addition of NaOH stops the enzyme activity
and the final colour showsmaximum absorbance at
410 nm.. Transaminases. Transamination is the process in
which an amino group is transferred from amino
acid to an a-keto acid. The enzymes responsible for
transamination are called transaminases. The sub-
strates in the reaction are a-ketoglutaric acid (a KG)
plus L-aspartate for AST, and aKGplus L-alanine for
ALT. The products formed by enzyme action are
glutamate and oxaloacetate for AST and glutamate
and pyruvate for ALT.Addition of 2,4, dinitrophenyl
hydrazine results in the formation of hydrazone
complex with the ketoacids. A red colour is pro-
duced on the addition of sodium hydroxide. The
intensity of colour is related to enzymic activity.
5.2.3 Immunoassay
Immunoassays are an immunological detection system
for quantifying specific analytes in all manner of
complex biological fluids. The principle of these assays
mimics the body’s immune system’s ability to recog-
nize foreign antigens when mounting an immune
response (see Chapter 7, Section 7.1.2). During an
immune response antibodies are recruited to
recognize, bind and remove potentially pathogenic
antigens --- or their source --- from the circulation. It
is this ability of antibodies to specifically target and
bind antigens which has been exploited in
immunoassays and lies at the root of the immunoassay
detection system.
Chapter 5 Clinical chemistry 219

5.2.3.1 Antibodies and antisera
Antibodies are complex proteins which come in a
number of subtypes (see Chapter 7, Section 7.1.4) the
immunoassay employs the ‘Y’ shaped IgG (immuno-
globulin G) type in either a polyclonal antiserum or a
monoclonal antibody solution.
Polyclonal antiserum, as the name suggests, is made
up of antibodies from ‘many clones’ and indicates that
the antibodies within the serum are not all necessarily
identical in their specificity. Polyclonal antibodies are
generated by a repeat immunization of a host animal
(rabbit, sheep or goat are common) which is then bled
and the serum separated. This antiserum will have a
potent ‘memory’ for one type of antigen and group of
epitopes but may also be nonspecific, that is the serum
will also include antibodies which recognize other
antigens and epitopes. However, repeat immunization
means that the amount, or titres, of antibodies specific
for the target antigen are boosted to exceed any other
by millions. Usually after such booster immunization
the polyclonal antibody response is dominated by one
or two highly responsive clones.
In contrast, monclonal antibodies are derived from
one B-Cell (essentially an immortalized B-cell clone)
and are therefore specific to a single antigen epitope.
Immunoassays can employ either polyclonal antisera
or monoclonal antibodies or a combination of both in
their design.
5.2.3.2 Enzyme immunoassays (EIA)
The majority of immunoassays used today are one
form of EIA, more commonly referred to as an
enzyme linked immunosorbant assay (ELISA); these
tests use the combined specificity of an antibody for
antigen with that of enzyme and substrate for detec-
tion. Essentially, when an antibody binds antigen the
‘linked’ enzyme produces a coloured product from a
proportional change in substrate, these substrates are
referred to as chromogenic because they undergo a
colour change.
The sandwich ELISA is by far themost common and
involves the use of two distinct antibodies which bind
the same antigen but at different epitopes, effectively
forming an antibody---antigen---antibody ‘sandwich’.
The first antibody is often referred to as the capture
antibody and is immobilized to a solid matrix such as
the bottom of a plastic 96 well plate; the plastic well is
then ‘blocked’ with a protein or detergent solution to
reduce nonspecific binding to the charged plastic
surface. Once this solution is removed the sample is
added and the immobilized antibody begins to bind
the antigen in the sample. The remaining sample is
washed away using amild detergent solution leaving an
antibody---antigen complex immobilized to a plastic
plate. A second antibody, the detection antibody, with
a conjugated enzyme is subsequently added to the
well and again any unbound or nonspecific
binding is washed away. At this stage there is an
invisible molecular sandwich of antibody--- antigen
---antibody---enzyme all immobilized to the bottom of
a plastic plate. The final step is the addition of a
chromogenic substrate which becomes coloured in an
intensity proportional to the quantity of enzyme pres-
ent; the colour change is quantified spectrophotomet-
rically. The quantity of enzyme present is proportional
to the quantity of antigen captured so by using a set of
standards of known concentration, unknown samples
can be compared and accurate estimations of antigen
concentration can be made.
Indirect ELISAs can also be employed to detect
antibody concentration --- antibodies are proteins and
can therefore be antigens too. An antibody which
detects and binds other antibodies is generally specific
to different species antibodies (antispecies antibodies
--- ASA) --- human antimouse antibodies (HAMA) are
an example of this. Indirect ELISAs employ a captured
antigen which is immobilized and an enzyme-linked
ASA to detect the captured antibody in an
antigen---antibody---antibody---enzyme sandwich. The
substrate reaction is the same as the sandwich ELISA
and the colour change is proportional to the captured
antibody concentration (see Figure 5.7).
ELISAs were developed from earlier radioimmu-
noassays (RIA) and immunoradiometric assays
(IRMA) which were developed in the 1970s (this
development resulted in the Nobel Prize forMedicine
and Physiology being awarded in 1977 to Roger
Guillemin, Andrew V. Schally and Rosalyn Yalow).
An IRMA is essentially an ELISA sandwich but rather
than using an enzyme-linked antibody to generate a
signal a radioactive signal was used and data generat-
ed in counts per minute (cpm). The RIA differs from
other detection systems in that the radioactive decay
signal --- cpm --- is indirectly proportional to the
concentration of antigen in a sample because it has
to compete with a defined amount of radioactive
antigen (tracer) in the test tube for a single antibody.
Defined amounts of radioactive tracer antigens,
220 Biomedical sciences

Figure 5.7 Direct (a) and indirect enzyme linked immunometric assay - ELISA (b) format with a typical standard curve (c)
Chapter 5 Clinical chemistry 221

antibody and sample are mixed together in a test tube
and the antigen---antibody complex that forms is
precipitated. Any unbound and therefore unprecipi-
tated, tracer is simply removed by aspirating (sucking
off) or decanting the supernatant. If there is no
antigen present in a sample then the tracer antigen
is bound by the antibody and found in the precipitate
--- giving a high radioactive count. However, if the
sample contains the target antigen it will compete and
effectively displace the radioactive tracer, for the
limited amount of antibody. The more antigen pres-
ent in a sample the more effectively the tracer is
competed for antibody binding and therefore dis-
placed from the antigen---antibody precipitate (i.e.
the lower the cpm the higher the antigen concentra-
tion, see Figure 5.8). As for all immunoassays a series
of known concentrations are tested in the system to
construct a standard. It is also possible to construct
competitive EIAs using the same RIA approach.
5.2.4 Electrophoresis
Most undergraduate experience of (gel) electrophore-
sis would suggest to them that ‘electrophoresis’
separates molecules (particularly DNA/RNA and
proteins) according to molecular size. This is a
misconception. The principal determinant of electro-
phoretic separation is charge and the response of the
151050 200.0
0.1
0.2
0.3
0.4
0.5
Concentration of standard antigen
OD
(c)
TYPICAL STANDARD CURVE OF AN ELISA – Both direct and indirect ELISAs produce standard curves in which the
optical density of a specific colour of the substrate reaction, plotted again ststandard concentrations of purified
antigen reacted in the assay system, are directly proportional.
Figure 5.7 (Continued)
Figure 5.8 Illustration of a typical calibration curve from acompetitive immunoassay (RIA or EIA) in which the signal isinversely proportional to the antigen concentration. Theantigen concentration range is large and plotted on alogarithmic x-axis. The signal can be expressed as simplycpm for RIA of colour intensity in EIA. However, it is bestexpressed as the percentage of signal found precipitated (B)in the standard/sample tube compared to when no antigen ispresent to compete with the capture antibody in the 0standard/control antigen tube --- B0. This allows for the decayin signal intensity of the tracer over time and produces moreconsistent curve plots
222 Biomedical sciences

charge on the given molecule (polarity --- positive or
negative and magnitude, 1þ, 2þ, etc.) to the applied
electrical field. The speed of mobility of a molecule in
an electrical field is determined by the mass to charge
ratio (m/z) (see Figure 5.9).
The secondary determinant of movement or sepa-
ration is frictional drag. For small moleculesmoving in
a fluid or even a gel this is negligible (and can be
virtually ignored), but as the molecule becomes larger
and the matrix/gel in which the molecule (i.e. protein
or nucleic acid polymer) is moving increases in solidi-
ty, frictional drag becomes a more important determi-
nant of separation (see Figure 5.10).
Various electrophoretic techniques have been de-
veloped which exploit these two forces (m/z and
frictional drag) and the peculiarities of the molecules
being separated with respect to environment buffer
altering the molecules’ charge properties.
5.2.4.1 Protein electrophoresis
In an electric field, a protein or other charged macro-
moleculewillmovewith a velocity that depends directly
on the charge on the macromolecule and inversely on
its size and shape. Gel electrophoresis is carried out in
some supporting media, usually polyacrylamide or
agarose, with pores big enough to allow the passage of
themacromolecule (see Figure 5.11). Being either acidic
or basic is dependent on the pH of the environment the
protein is in as this will be very significant in determin-
ing the net charge. This is a factor exploited in electro-
phoretic separation of haemoglobin (Hb) variants.
Amino acid substitutions give an overall charge change
in the Hb molecule and the magnitude of this charge
change can be amplified by altering the surrounding pH
of the electrophoresis buffer to effect clear resolution of
the various Hb variants.
There are four important variant forms of
electrophoresis:
. zonal electrophoresis;
. isoelectric focusing --- IEF;
. isotachophoresis; and
. sodium dodecyl sulphate polyacrylamide gel --- SDS
PAGE.
These in turn have been combined to give two
electrophoretic techniques commonly used in
proteomics:
. isotachophoresis combined with SDS-PAGE gives
rise to discontinuous SDS PAGE; and. combining SDS PAGE and IEF gives 2D
electrophoresis.
The term, electrophoresis, was coined in 1909, by Michaelis (Biochem. Z. 16, 1909, 81).
It is derived from the Greek elektron meaning amber (i.e. electricity) and phore meaning bearer.
‘A mainly analytical method in which separations are based on the differing mobilities (i.e. rate plus direction of movement ) of two or more charged analytes(ionic compounds) or particles held in a conducting medium under the influence of an applied d.c. electric field.’Most current methods are derived from the work of Tiselius in the 1930s (awardedNobel Prize in 1948).
Figure 5.9 Brief history and mathematical definitions of electrophoresis
Figure 5.10 The variable importance of frictional drag on electrophoretic mobility
Chapter 5 Clinical chemistry 223

5.2.4.2 Zonal electrophoresis
In this classic of the clinical chemistry laboratory,
proteins are allowed to move in or upon a support
medium (acetate sheet or gel) according to their charge
with very little consideration of frictional drag. This
can easily resolve and indeed defines classes of serum
protein (see Figure 5.12). It exploits the fact that an
amino acid substitution in a protein may not alter its
mass to any significant degree (unless analysed by a
mass spectrometer) but the effect on the overall charge
of the molecule is often considerable. This is most
clearly seen in the detection of haemaglobinopathies
(see Figure 5.13).
Figure 5.11 Basic organization of the functional components in an electrophoresis tank illustrating the simplicity ofconnecting electrical charge to the separation platform (gel) via conductive analyte/buffer which establishes the pHenvironment for the electrophoresis
Figure 5.12 Zonal electrophoretic separation of serumproteins migration is according to m/z, thus under theseprevailing conditions albumin is strongly negatively chargedand migrates to the positive electrode the fastest, gammaglobulins are net positively charged and migrate to thenegative electrode
Figure 5.13 Zonal electrophoretic separation of haemo-globin: Hb sickle variants (labelled C and S) migrate sepa-rately to both normal haemoglobin A and fetal haemoglobinF; the arrow shows the position line point of application.Patient sample 3 contains both normal haemoglobin A andhaemoglobin F and is hence heterozygote (a carrier) of icklecell disease
224 Biomedical sciences

5.2.4.3 Isoelectric focusing
The charge of a protein is dependent on its environ-
ment. For example a protein that is negatively charged
at neutral pH 7.4 can be changed to a positive charge
in low pH solution such as pH 4. This is because
environments in which there is abundant hydrogen
ion concentration carboxyl grouping ionization (neg-
ative charge) is suppressed. However, amide residues
readily ionize taking on the Hþ ions (giving a positive
charge). The opposite occurs in low hydrogen ion
concentration environments. At a specific pH the
suppression of amide and carboxyl groups within the
molecule balance and the molecule reaches its non-
charged state or isoelectric point (pI). It is possible to
create a gradient of pH due to a group of molecules
called ampholyltes.
In the original isoelectric focusing ‘electrophoretic’
systems a pH gradient was set up first using a pur-
chased mixture of ampholytes (different molecules
designed to have a range of pIs) which had to be
preelectrophorezed on the gel to form the pH gradient.
A mixture of molecules (proteins) was then applied,
the electric field turned on, and each protein moves to
the position (pH) at which its net charge is zero, that is
it is pI. In newer systems the ampholytes have nowbeen
immobilized on a solid support, such as a filter strip.
These can be placed in an individual sample tank or
coffin and the sample applied on to the strip and
electrophoresed immediately and easily removed for
analysis (see Figure 5.14).
5.2.4.4 Sodium dodecyl sulphatepolyacrylamide gel electrophoresis (SDS PAGE)
Polyacrylamide gels are tougher andmore resilient gels
than agarose. They also have the capacity to form a
large range of gel pore sizes through which large
molecules, such as proteins and DNA/RNA, can be
separated according to their molecular size. This is
simply achieved by varying the percentage of acrylam-
ide powder (�5---30%) in the polymerization mix.
Thus, in terms of electrophoretic separation the fric-
tional drag component is precisely controlled and
defined. However, charge is the dominant variable of
a protein determining migration velocity (force) and
direction of movement. SDS overcomes this and gives
all proteins the same net charge (negative) and mass/
charge ratio such that they all move in the same
direction (towards the cathode) with the same motive
force. Under these circumstances frictional drag is the
Figure 5.14 Illustration of the original tube IEF gels and the modern strip system of individual tanks nicknamed coffins
Chapter 5 Clinical chemistry 225

sole determinant of separation (see Figure 5.15).When
frictional drag is through a rigid inert polymer such as
acrylamide gels then drag is due to the ability of the
molecule to penetrate the pores; this is proportional to
the molecular size of the molecule. Since SDS has
refolded and wrapped proteins into dense spheroids,
molecular size closely approximates to molecular mass
(see Figure 5.16).
5.2.4.5 Capillary electrophoresis
Used inmany automated systems capillary electropho-
resis is a liquid-based electrophoresis method that
completes run times in a matter of seconds but to
achieve this applies very high voltages. Although you
can run classic electrophetic systems at very high
voltage to make the analytical run time faster, the heat
generated from the resistance will melt the gel or
electrophoresis paper and set the entire apparatus on
fire. The solution was to make small microcapillaries
which very effectively dissipate the heat generated from
the high voltages (see Figure 5.17).
A surprising finding was that the high voltage
induced electro-osmotic flow which was so significant
in microcapillaries it overcame the movement of mo-
lecules based on charge. Thus eventually all molecules
introduced would wash towards the cathode even if
negatively charged; thus negatively charged molecules
would be the lastmolecules eluting from the systembut
hence would still be resolved in the chromatographic
separation. Samples are loaded on the capillaries in
nano litre quantities but because of the physics of
electro-osmotic flow the molecules for analysis sepa-
rate and concentrate in tightly eluting plugs of intense
concentration (see Figure 5.18).
5.2.5 High performance liquidchromatography (HPLC)
HPLC is a chromatographic technique that can sepa-
rate a mixture of compounds very rapidly (in seconds
and minutes) and, for the analytical chemist, give not
only characteristic elution times aiding identification,
but chromatographic peak heights that are directly
proportion to the amount present --- aiding identifica-
tion and quantification. This is particularly useful for
chemists wishing to quantify small organic com-
pounds such as drugs in biological fluids or indeed
small organic biochemicals such as lipid-soluble vita-
mins, steroids and their various metabolic derivatives.
The heart of all HPLC systems are the columns
(see Figure 5.19) and they can be built to exploit
all the physical characteristics of a molecule: size,
charge, hydrophobicity and reactive group affinity.
Figure 5.15 Separation of proteins by SDS polyacrylamide gel electrophoresis
226 Biomedical sciences

Figure 5.16 Refolding of proteins/denaturation by sodium dodecyl sulphate (SDS)
Figure 5.17 Cross section and construction of electrophoretic capillary and the physics of electrosmotic flow
Chapter 5 Clinical chemistry 227

The advantage of HPLC is that separation is rapid
(minutes) using small sample sizes (ml) rather than
hours; for example a low pressure size exclusion col-
umn can take all day and require 1ml plus of sample. In
HPLC the sample to be analysed is introduced in a
small volume to the stream of mobile phase. The
analyte’s motion through the column is slowed by
specific chemical or physical interactions with the
stationary phase as it traverses the length of the col-
umn. How much the individual analyte molecule is
slowed depends on the nature of the molecule and on
the compositions of the stationary and mobile phases.
However, once a method has been established and
characterized the retention time is considered a rea-
sonably unique identifying characteristic of a given
molecule. The use of smaller particle size column
packing (which creates higher backpressure) increases
the linear velocity giving the components less time to
diffuse within the column, leading to improved reso-
lution in the resulting chromatogram. Common sol-
vents used include any miscible combination of water
or various organic liquids (the most common are
methanol and acetonitrile).Water may contain buffers
or salts to assist in the separation of the analyte
components, or compounds such as trifluoroacetic
acid which act as an ion-pairing agent.
In clinical chemistry the analytes we tend to mea-
sure by HPLC are generally drugs or metabolites as
other methods such as immunoassays are fast, inex-
pensive and easily performedmethodologies (a funda-
mental of clinical testing). HPLC does require both
time and a skilled operator if it is to be reliable. Thus for
Figure 5.18 Diagrammatic schematics of a capillary electrophoresis set up, the chemicophysics of electro-osmotic flowseparation chromatography and an example of the resulting chromatogram
Figure 5.19 Illustration of HPLC equipment and the core component --- the HPLC column
228 Biomedical sciences

detection and measurement of the more common
biochemical markers requested by the physicianHPLC
is not routinely employed even though it can be
adapted to measure most of the important common
clinical chemistry analytes.
The common columns used exploit small organic
molecules’ differences in charge (polarity) and hydro-
phobicity. The first methods developed for HPLCwere
normal phase or HILIC (hydrophilic interaction chro-
matography) where a solid phase was very polar (posi-
tive, negative or both) and a mobile phase was a water
soluble nonpolar solution (e.g. 1---100% methanol).
The highly polar molecules which paired with the
charge(s) on the solid phase were retarded to varying
degrees and neutral molecules rapidly passed through
the column eluting first at the detector.
Reverse phase worked on the bases of hydropho-
bicity of a molecule and a solid phase with nonpolar
hydrophobic chemical groupings like phenol chemi-
cally bonded to their surface. In very polar starting
buffers (i.e. high salt) the hydrophobic elements of any
given molecule induce it to associate with the hydro-
phobic groups coating the solid phase; but as the
polarity of the mobile phase decreases, such as lower
salt and increasing concentration of nonpolar solvents
like acetonitrile, the analyte molecules elute from the
column and are registered at the detector.
The detectors are often UV-visible spectrometers
that scan at a set or an array of wavelengths. However,
sensitivity is dependent on the light absorbing proper-
ties of the target analyte so electrochemical and fluo-
rescence detectors are also employed (see Figure 5.20).
5.2.6 Mass spectrometry
Mass spectrometers have developed so rapidly that
their application to routine clinical chemistry will be
dramatic in the next few years. The principal use has
been as the end detector of a HPLC --- not only will the
mass ion peak give detection and quantification of an
eluting fragment but the mass spectrum confirms the
analytes molecular Identity. In many cases stripped
down instruments are built with the sole aim to detect
the characteristic mass ion signature (could be as little
as a single parent ion peak) of certain drugs in a
complex mixture without the need of resolving the
component first by HPLC (see Figure 5.21 for the
detection of cocaine).
The science of mass chromatography has now
developed such that the process of ionization is no
longer destructive and that huge molecules such as
proteins of a million Daltons can be given a charge and
analysed by a mass analyser. These new instruments
give the precise molecular weights of proteins within
0.01% margin of error. Instead of ion bombardment
which fragments and therefore ionizes molecules,
matrix assisted laser desorption ionization (MALDI,
see Figure 5.22) and electrospray Ionization (EI, see
Figure 5.23) deposit charges on molecules without
destroying their structure.
To match this advance in ionization the old huge
sector instruments, which had a strong magnet dis-
torting the flight path of the ions generated, have been
replaced in all but the most specialist MS system.
Modern mass analysers are smaller and more versatile:
7-ßHT
Peak 1
Peak 2Peak 3
Adenosine
Peak 4
Peak 5
Peak 6
Adenine
Hypoxanthine
CreatinineUric acid
Peak 8
Peak 7
Figure 5.20 Illustration of small bioorganic molecules found in human follicular fluid resolved by RP-HPLC; only a few of thepeaks have been identified
Chapter 5 Clinical chemistry 229

Figure 5.21 Mass chromatograph of cocaine
Figure 5.22 Ionization of analytes by MALDI. The cocrystal of matrix and sample is targetted by a laser causing a desorptionprocess followed by desolvation and then introduction into the mass analyser. From Hoffbrand et al, PostgraduateHaematology, Sixth Edition 2010, reproduced by permission of John Wiley & Sons Ltd
Figure 5.23 Electrospray ionization (EI) process: a fine mist of charged analytes is formed from the sample stream asdroplets formed from the capillary needle eject into what is termed the Taylor cone; the charged droplets desolvate byCoulombic explosion and ions free from solvent can then enter the mass spectrometer via an intermediate vacuum region
230 Biomedical sciences

the quadrupole focuses ions of specific mass over
charge (m/z) on to a single target detector and sweeps
through a mass range from 0---2000 Daltons. Fed ions
from electrospray ionization the same molecule may
have 1 to 100 charges placed on it so the mass data
from the quadrupole is mathematically processed ---
deconvoluted --- to give a single mass peak (see
Figure 5.24).
Ion traps are similarly fed ions from electrospray
but collect all the ions generated in a ring magnet
containment chamber and then only eject those of set
m/z to the detector in a set analysis pattern. The data
still has to be deconvoluted but the system is much
more sensitive as it captures all ions and loses none
when detecting (see Figure 5.25).
The final mass analysis is time of flight (ToF) which
measures the nanoseconds an ion takes to travel from
source down a flight tube (usually 1m or more) to the
detector. The time it takes is proportional to the ions’
m/z but since ToFs are usually coupled to MALDI the
ions generated are mostly only singly or doubly
charged (see Figure 5.26). Thus the huge computa-
tional deconvolution of the data is not needed. This
means that extremely large molecules --- proteins of
1 million Daltons --- can be analysed.
5.3 Summary: commonclinical tests for sampleanalytes
Although electrophoresis, HPLC and mass spectrom-
etry are more and more used in clinical laboratories,
Figure 5.24 Schematic of a quadrupole mass analyser. Ions are fed in from the electrospray and the radiofrequency of thecharged rods varied or tuned to particular m/zs. Resonant ions will travel down through the poles towards the detector.Nonresonant ions will strike the poles and become neutralized. The quadrupole sweeps though the m/z resonance range inseconds scanning the sample
Figure 5.25 Schematic of an ion trap quadrupole showingan overview of MS-in time. Step 1: a trapping rf amplitude isapplied for 0---30ms during which ions are formed fromsample molecules and stored. Step 2: an rf amplitude isramped over the period 30---85ms during which mass-selective ion ejection and mass analysis occurs
Figure 5.26 The time of flight (ToF) mass analyser. Ionswill separate according to their velocity along the flighttube from the MALDI plate towards the detector, the largerthe molecule (strictly speaking the m/z) the longer theflight time
Chapter 5 Clinical chemistry 231

themost performedmethodologies are flame photom-
etry and colorimetric assays on autoanalysers. Indeed,
although immunoassays are the next highest used
methodology, they still represent only a small fraction
of the number of performances of a flame photometry
or colorimetric assay. This is because the most com-
mon requested tests (see Table 5.2) require quick,
robust and inexpensive methods for detection and
quantification to meet demands.
Part II: Clinical assessmentsThe molecular structural categorization of bodily
fluid components may influence the biochemical tests
used in their detection and quantification but clinical
chemistry is subdivided more along clinical/biological
functions relevant to the practice ofmedicine: urea and
electrolytes, gastro-intestinal markers, renal function
markers, bone assessment, heart disease and lipid
disorders, liver function markers, endocrine assess-
ment, reproductive endocrinology, therapeutic drug
monitoring and cancer biomarkers.
5.4 Urea and electrolytes(U and Es)
The so called U and Es involves the measurement of
urea, potassium, sodiumand the anion gap, carried out
routinely on serum or plasma samples. The test is
useful in numerous situations and utilized in some of
themost common interpretative diagnostic challenges.
Urea contributes most of the body’s nonprotein
nitrogen, accounting for about 45% of the total. It is
the major end-product of protein catabolism in hu-
mans. It is synthesized in the liver, released into blood
circulation and excreted by the kidneys. Measurement
of urea in blood is a useful indicator of renal and
hepatic integrity.
Electrolytes are minerals that are found in body
tissues and blood in the form of dissolved salts. As
electrically charged particles, electrolytes help move
nutrients into and wastes out of the body’s cells,
maintain a healthy water balance, and help stabilize
the body’s acid/base (pH) level. Electrolytes are usually
measured as part of a renal profile which measures the
main electrolytes in the body, sodium (Naþ), potassi-um (Kþ), together with creatinine and/or urea, and
may occasionally include chloride (Cl�) and/or bicar-bonate (HCO3
�) as well.Most of the body’s sodium is found in the extracel-
lular fluid (ECF), outside of the body’s cells, where it
helps to regulate the amount of water in your body.
Potassium is found mainly inside the body’s cells. A
small but vital amount of potassium is found in the
plasma, the liquid portion of the blood. Monitoring
potassium is important as small changes in the Kþ level
can affect the heart’s rhythm and ability to contract.
Chloride travels in and out of the cells to helpmaintain
electrical neutrality, and its level usuallymirrors that of
sodium. The main job of bicarbonate, which is excret-
ed and reabsorbed by the kidneys, is to help maintain a
stable pH level and, secondarily, to help maintain
electrical neutrality.
Your diet provides sodium, potassium and chlo-
ride; your kidneys excrete them. Your lungs provide
oxygen and regulate CO2. The balance of these che-
micals is an indication of the functional well-being of
several basic body functions, including those per-
formed by the kidneys and heart.
A related ‘test’ is the anion gap, which is actually a
calculated value. There is more than one formula: one
definition is sodium ion concentration minus the sum
of chloride plus bicarbonate ion concentration, and the
other is sodium plus potassium minus the sum of
chloride plus bicarbonate ion concentration. The oc-
currence of an abnormal anion gap is nonspecific but
can suggest certain kinds of metabolic abnormalities,
such as starvation or diabetes, or the presence of a toxic
substance, such as oxalate, glycolate or aspirin.
5.4.1 Hypo- and hypernatraemia,kalaemia and urea
Hyponatraemia (Na < 120mmol/L) may be due to
either loss of sodium or overload of water or a combi-
nation of both. The following list (Table 5.3) contains
the relatively common and important causes of hypo-
natraemia. For more complex cases, it is necessary to
have simultaneous samples of both blood and urine for
estimation of osmolality and electrolytes.
Increased serum potassium level is observed in an-
oxia, metabolic renal tubular acidosis, shock or circula-
tory failure. Low serum potassium values are observed
due to low intake of dietary potassium over a period of
time or increased loss through kidney, vomiting or
232 Biomedical sciences

Table
5.2
Commonclinical
testsforsample
analytes.
Analyte
Preferred
sample
Anticoagulent
Test
principle
Referen
cerange
Analytical
tips
Sodium
(Na)
Serum
(then
plasm
a)N/A
(Heparin)
Flam
ephotometry
130---145mmol/L
Donotrefrigerate(potassium
leaksfrom
red
cells)
separatewithin
3handdiscard
haemolysedserum
samples
Potassium
(K)
Serum
(then
plasm
a)N/A
(Heparin)
Flam
ephotometry
3.5---5.0mmol/L
Urea
Serum
orplasm
aAny
Colorimetricassay
15---40mg/dL
Calcium
Serum
EDTA,oxalate
orcitrate
must
notbeusedas
these
preservatives
cause
removalofcalcium
by
chelation
Colorimetricassay
8.5---10.4mg/dL
Haemolysedandheparinized
samplesare
unsuitable
Creatinine
Serum
orplasm
aAny
Colorimetricassay
Male0.7---1.4mg/dL
Avoid
usinghaemolysedorlipaemic
samples
Female0.4---1.2mg/dL
Glucose
Plasm
aED
TA---
Nafluoride
Colorimetricassay
Fasting:70---110mg/dL
Rem
ove
from
cellularfractionwithin
1has
glucose
uptake
bybloodcellsreduceslevels
Postprandial:80---140mg/dL
Random:60---140mg/dL
Bilirubin
Serum
N/A
Colorimetricassay
Serumconjugated
Bilirubin
---
upto
0.5mg/dL
Bilirubin
isunstableandlightsensitive
assay
should
becarriedoutwithin
2hofcollection
orrefrigerated
Serum
totalBilirubin
---
0.2---1.0mg/dL
Phosphates
Serum
N/A
Colorimetricassay
3.5---5.0mg/dL
Nonhaemolysedserum
separated
from
erythrocyte
assoonas
possible
Totalprotein
Serum
(then
plasm
a)N/A
Colorimetricassay
6.5---8.5g/dL
Haemolysedandlipaemic
sera
interfere
strongly
withthemeasurement
Albumin
Serum
(then
plasm
a)N/A
Colorimetricassay
3.5---5.0
g/dL
Haemolysedandlipaemic
sera
interfere
strongly
withthemeasurement
Tranam
inases
GGT
Plasm
aHeparin
Colorimetric(enzyme)
assay
AST
5---40U/L
Haemolysedandlipaemic
sera
interfere
strongly
withthemeasurement
ALT
7---56U/L
GGT0---51U/L
Chapter 5 Clinical chemistry 233

diarrhoea. Increased secretion of adrenal steroids or
some diuretics may also promote the loss of potassium.
Elevated serum urea levels may be due to prerenal,
renal or postrenal disease processes. Prerenal causes
could be cardiac related or due to increased protein
catabolism, and dehydration. Renal causes include
glomerulonephritis, chronic nephritis, nephrotic syn-
drome and other kidney disease. Postrenal causes
include obstruction of the urinary tract. Decreased
serum urea levels could be due to pregnancy, intrave-
nous infusion, low antidiuretic hormone (ADH)
secretion, low protein intake, severe liver diseases,
inborn errors of urea cycle and SIADH (syndrome of
inappropriate ADH secretion).
The cause of elevated or lowered potassium (hypo-
and hyperkalaemia) and urea are summarized in
Table 5.4.
5.4.2 Hypo- and hypercalcaemia
Approximately 99% of total body calcium is deposited
in the skeleton. A higher proportion of nonskeletal
calcium is present within cells than in extracellular
fluids, and most of this intracellular calcium is bound
to proteins in the cell membrane. Intracellular ionized
calcium is physiologically active and functions as an
intracellular messenger by binding to --- or being
released from --- specific intracellular proteins, a pro-
cess that changes protein conformations and hence its
activity or function. Release of calcium into the blood
circulation is controlled by parathyroid hormone
(PTH) and its fetal analogue PTH-like hormone.
Increased serum calcium levels are associated with
primary hyperparathyroidism, multiple myeloma,
metastatic bone lesions and hypervitaminosis D.
Hypocalcaemia is associated with hypoparathyroid-
ism, nephrotic syndrome, rickets and renal failure.
5.5 Metabolism andgastrointestinal markers
There is considerable overlap in the functional
association of abnormal analyte-marker levels with
particular body systems; but certain common clinical
chemistry are more associated with gastrointestinal
and metabolism disorders than others and are
detailed below.
Table 5.3 Common causes of hyponatraemia.
Hyponatraemia and oedema CCF
Liver failure
Nephrotic syndrome
Hyponatraemia and
dehydration
Diarrhoea
Addison’s disease
Renal salt wasting
Hyponatraemia and
normal volume
Diarrhoea and vomiting followed by
drinking excess water
Diuretic therapy may occur within
1/2 weeks of initiation of therapy
but may develop after many years of
therapy
ACE inhibitors (see Chapter 2,
Section 2.7.9)
Inappropriate ADH
(Section 1.7.2) secretion
Drug therapy
Chest disease
CNS disease
Table 5.4 Common causes of hypo- and hyperkalaemiaand altered urea levels.
Hypokalaemia
(K < 3.5mmol/L)
Diuretics
Diarrhoea and vomiting
Ileostomy
Chronic purgative abuse
Excessive liquorice
Elderly patients with poor nutrition (catabolic
state)
Hyperkalaemia
(K > 5.5mmol/L)
Haemolysis and delayed separation overnight
storage in a fridge
Renal failure
Potassium retaining diuretics
ACE inhibitors
Low urea Pregnancy
Starvation
Chronic liver disease
High urea Renal failure
Dehydration
Transiently after eating high-protein meal
Following a significant gastrointestinal bleed
234 Biomedical sciences

5.5.1 Creatinine
Creatinine is a waste product formed in muscle from a
high-energy storage compound, creatine phosphate.
Creatine phosphate can be stored in muscle at approx-
imately four times the concentration of adenosine
triphosphate. In muscles it spontaneously undergoes
degradation to form a cyclic anhyride-creatinine. The
blood concentration of creatinine and its excretion in
urine are remarkably constant in healthy individuals.
Therefore serum creatinine level is used as an indicator
for assessing kidney function.
Serum creatinine concentration is related to mus-
cle mass and the values are lower in children.
Increased serum creatinine is associatedwith decrease
in glomerular filtration rate (GFR), whether the cause
is prerenal, renal or postrenal. Prerenal factors in-
clude conditions such as congestive heart failure,
shock, diarrhoea, uncontrolled diabetes mellitus, use
of diuretics and so on. Renal factors involve mainly
damage to the glomeruli. Postrenal factors may be
prostatic hypertrophy, calculi blocking the ureters or
neoplasms compressing the ureters. The serum
creatinine concentration is monitored closely after
a renal transplantation because a rising concentra-
tion, even though small, may be an indication of graft
rejection.
5.5.2 Glucose
Glucose is a reducing monosaccharide that serves as
the principal fuel of all the tissues. It enters the cell
through the influence of insulin and undergoes a series
of chemical reactions to produce energy.
Lack of insulin or resistance to its action at the
cellular level causes diabetes. Therefore, in diabetes
mellitus the blood glucose levels are very high. Some
patients with very high blood glucose levels may
develop metabolic acidosis and ketosis caused by the
increased fat metabolism, the alternate source for
energy. Hyperglycaemia is also noted in gestational
diabetes of pregnancy and may be found in pancreatic
disease, pituitary and adrenal disorders. A decreased
level of blood glucose, hypoglycaemia is often associ-
ated with starvation, hyperinsulinaemia and in those
who are taking high insulin dose for therapy and
hypoadrenalism.
Thus elevated plasma glucose levels are expected in
a variety of clinical conditions, especially diabetes
mellitus, Cushing’s syndrome and hyperadrenalism.
Decreased plasma glucose levels are observed in hy-
perinsulinism, antidiabetic treatment and anorexia.
5.5.3 Bilirubin
Bilirubin is formed from the haem fragment of hae-
moglobin released by aged or damaged red blood cells.
Liver, spleen and bonemarrow are the sites of bilirubin
production. Bilirubin formed in spleen and bone
marrow is transported to the liver. In the liver it is
converted into bilirubin conjugates --- bilirubin mono
and diglucuronides. Any liver disease affects the above
systems, and hence bilirubin accumulates in serum
leading to jaundice.
Hyperbilirubinaemia is characteristic of jaundice.
An increase in unconjugated bilirubin is observed in
haemolytic and neonatal jaundice. In viral and toxic
hepatitis there is impaired hepatocellular conjugation
and excretion of bilirubin with a major rise in conju-
gated and a lesser rise in unconjugated bilirubin in
serum. In cirrhosis there is overall damage to liver cells
and hence the ability of the liver to form conjugated
bilirubin, resulting in an increase in unconjugated
bilirubin in serum. In obstructive jaundice there is
an increase in predominantly conjugated bilirubin
in serum.
5.5.4 Phosphates
Eighty per cent of body phosphorus is laid down in
bone matrix as insoluble salts. The organic phosphate
esters are primarily confined within cells, associated
with nucleoproteins, hexoses and purines. Phosphate
forms high-energy bonds in ATP, GTP and creatine
phosphate. Inorganic phosphate ions are mostly con-
fined to the extracellular fluid where they are part of
buffer systems. The plasma phosphate concentration is
regulated by parathyroid hormone (PTH) and vitamin
D3. PTH stimulates the kidney to excrete phosphate
while conserving calcium. In chronic renal disease,
phosphate retention occurs because of impaired glo-
merular filtration.
An increase in serum phosphorous is found in
chronic nephritis progressing with increased renal
failure. A moderate increase is observed in hypopara-
thyroidism and vitamin D excess. A decrease in serum
phosphorous is observed in rickets or osteomalacia
Chapter 5 Clinical chemistry 235

and also in hyperparathyroidism. Hypophosphatemia
may result due to disorders of renal tubular
reabsorption.
5.5.5 Total protein
Serum total protein represents the sum total of nu-
merous different proteins, many of which vary inde-
pendently of each other. Proteins are present in all
body fluids but the protein concentration is normally
high (>3 g/dL) only in plasma, lymphatic fluids and
some exudates. Protein concentration in the cerebro-
spinal fluid of normal subjects is <45mg/dL, whereas
the urine contains only trace amounts. Measurement
of serum-total protein is useful in conditions relating
to changes in plasma or fluid volumes, such as shock
and dehydration. In these conditions concentration of
serum-total protein is elevated indicating haemocon-
centration. Haemodilution is reflected as relative hy-
poproteinemia, which occurs with water intoxication
or salt retention syndrome, during massive intrave-
nous infusions.
In addition to dehydration and diarrhoea, increased
serum-total protein levels are observed in multiple
myeloma. Hypoproteinemia is generally seen in con-
ditions associated with hypoalbuminemia.
5.5.6 Albumin
Serum albumin represents approximately 60% of
the total protein found in serum. It is synthesized
exclusively in the liver and functions as a regulator
of blood oncotic pressure, as a carrier for many
cations and water insoluble substances, and as a pool
of amino acids for caloric or synthetic purposes.
Serum levels of albumin are used to assess nutri-
tional status and have important influences on the
metabolism of endogenous substances such as cal-
cium, bilirubin, fatty acids and hormones and on the
metabolism of drugs. Hyperalbuminemia has little
diagnostic significance except in dehydration. Hy-
poalbuminemia is very common in many illnesses
which impair its liver synthesis (also liver disease),
increased catabolism, reduced amino acid absorp-
tion, protein loss in urine, malnutrition, protein
losing enteropathy and in hospital patients with
acute illness.
5.5.7 Alkaline phosphatase (total)
Phosphatases are enzymes which catalyse the splitting
of a phosphate from monophosphoric esters. Alkaline
phosphatase (ALP), a mixture of isoenzymes from
liver, bone, intestine and placenta, has maximum
enzyme activity at about pH 10.5. Serum ALP mea-
surements are of particular interest in the investigation
of hepatobillary and bone diseases. Serum alkaline
phosphatase (adults) --- 40---125U/L (levels up to three
times this may be normal in children). Liver, bone and
placenta contain very high concentrations of ALP.
Increases in total ALP activity are usually related to
hepatobiliary and bone disorders. Increased ALP levels
are observed in liver diseases, osteomalacia, rickets and
bone disorders. Moderate elevations are sometimes
noted in congestive heart failure, intestinal disease and
intra-abdominal bacterial infections.
5.5.8 Transaminases
The two transaminases of diagnostic importance are
serum glutamic oxaloacetate transaminase (SGO) also
called aspartate amino transferase or AST, and serum
glutamic pyruvate transaminase (SGPT) also called
alanine amino transferase or ALT. While AST is found
in every tissue of the body, including red blood cells,
and is particularly high in the cardiac muscle, ALT is
present atmoderately high concentration in liver but is
low in cardiac, skeletal muscle and other tissues. Both
AST andALTmeasurements are useful in the diagnosis
andmonitoring of patients with hepatocellular disease.
5.6 Renal function tests
Renal function is usually explored by measuring blood
urea nitrogen (BUN), serum creatinine and urinary
creatinine. From the creatinine values the glomerular
filtration rate (GFR) can be calculated. The creatinine
clearance test compares the level of creatinine in urine
with the creatinine level in the blood. It should be
noted that the creatinine clearance test is actually an
estimate of the true GFR as a small amount of creati-
nine is released by the filtering tubes as a result of their
ownmetabolic activity so it is not all a filtered material
from blood. Thus creatinine clearance usually over-
estimates the GFR; this is particularly true in patients
with advanced kidney failure.
236 Biomedical sciences

Although a single blood sample is taken, total 24 h
urine has to be collected since the volume as well as
collective creatinine concentration is required. The
total amount of creatinine in the 24 h sample will be
calculated and, given the determined blood concen-
tration of creatinine for the patient, the total amount of
blood needed to be filtered by the kidney to give that
amount of creatinine in the urine is calculated. Thus,
creatinine clearance GFR (Cr-GFR) is reported as
millilitres/minute (mL/min). Normal values are:
. Male: 97 to 137mL/min.
. Female: 88 to 128ml/min.
Normal value ranges may vary slightly among dif-
ferent laboratories. Also there is a cheat in that not
always 24 h collection is taken, the urine excreted in 4 h
might be taken and extrapolated to 24 h. Furthermore,
multiple correctioncharts allow for age and formulas to
adjust ‘normal’ for body surface areahavebeendevised.
5.6.1 Implications of abnormalresults
Abnormal results (lower-than-normal creatinine
clearance) may indicate:
. acute tubular necrosis;
. bladder outlet obstruction;
. congestive heart failure;
. dehydration;
. glomerulonephritis;
. renal ischemia (blood deficiency);
. renal outflow obstruction (usually must affect both
kidneys to reduce the creatinine clearance);. shock;. acute renal failure;. chronic renal failure;. end-stage renal disease.
There are other methods for calculating GFR based
on serum and urinary molecules such as sodium and
including proteins such as b2 microglobulin.
5.7 Liver function tests
Many of the biochemicals and enzymes routinely
assayed are markers of liver disease, alanine amino-
transferase (ALT) --- a marker of hepatitis; aspartate
aminotransferase (AST) --- amarker of liver damage, as
is albumin. Similarly direct bilirubin and total biliru-
bin are markers for infant jaundice, whilst alkaline
phosphatase (ALP) is often elevated when the bile duct
is blocked. Another very important enzyme is gamma-
glutamyltransferase (GGT). Isolated elevation of GGT
level may be induced by alcohol and aromatic medica-
tions, usually with no actual liver disease.
In determining the pathology of liver disorders the
pattern of change in the various biomarkers indicates
the nature of disease.
5.7.1 Hepatocyte necrosis
In acute hepatitis, toxic injury or ischemic injury
results in the leakage of enzymes into the circulation.
However, in chronic liver diseases such as hepatitis C
and cirrhosis, the serum ALT level correlates only
moderately well with liver inflammation. In hepatitis
C, liver cell death occurs by apoptosis as well as by
necrosis. Hepatocytes dying by apoptosis presumably
synthesize less AST andALT and this probably explains
why at least one third of patients infected with hepatitis
C virus have persistently normal serum ALT levels
despite the presence of inflammation on liver biopsy.
Patients with cirrhosis often have normal or only
slightly elevated serum AST and ALT levels. Thus, AST
andALT lack some sensitivity in detecting chronic liver
injury. Of course, AST andALT levels tend to be higher
in cirrhotic patients with continuing inflammation or
necrosis than in those without continuing liver injury.
As markers of hepatocellular injury, AST and ALT
also lack some specificity because they are found in
skeletal muscle. Levels of these aminotransferases can
rise to several times normal after severe muscular
exertion or other muscle injury. In fact, AST and
ALT were once used in the diagnosis of myocardial
infarction.
5.7.2 Cholestasis (lack of bile flow)
Reduction in the outflow of bile often results from the
blockage of bile ducts but also from a disease that
impairs bile formation in the liver itself. AP and
gamma-glutamyltransferase (GGT) levels typically rise
to several times the normal level after several days of
bile duct obstruction or intrahepatic cholestasis. The
Chapter 5 Clinical chemistry 237

highest liver AP elevations, often greater than 1000U/
L, are found in diffuse infiltrative diseases of the liver
such as infiltrating tumours and fungal infections.
Both AP and GGT levels are elevated in about 90%
of patients with cholestasis. The elevation of GGT
alone, with no other liver function test (LFT) abnor-
malities, often results from enzyme induction by
alcohol or aromatic medications in the absence of liver
disease. The GGT level is often elevated in persons who
take three or more alcoholic drinks (45 g of ethanol/
three units or more) per day.
5.7.3 General markers of liverhealth
Since the secretion of conjugated bilirubin into bile is
very rapid in comparison with the conjugation step,
healthy individuals have almost no detectable conju-
gated bilirubin in their blood. Liver disease mainly
impairs the secretion of conjugated bilirubin into bile.
As a result, conjugated bilirubin is rapidly filtered into
the urine, where it can be detected by a dipstick test.
The finding of bilirubin in urine is a particularly
sensitive indicator of the presence of an increased
serum conjugated bilirubin level. Unconjugated bili-
rubin rises rapidly with haemolytic disease such as in
new born due to rhesus incompatibility of mother
with fetal/infant blood group. Mild hemolysis, such as
that caused by hereditary spherocytosis and other
disorders, can also result in elevated unconjugated
bilirubin values.
Although the serum albumin level can serve as an
index of liver synthetic capacity, several factors make
albumin concentrations difficult to interpret. The liver
can synthesize albumin at twice the healthy basal rate
and thus partially compensate for decreased synthetic
capacity or increased albumin losses. Albumin has a
plasma half-life of 3 weeks; therefore, serum albumin
concentrations change slowly in response to alterations
in synthesis. Furthermore, because two thirds of the
amount of body albumin is located in the extravascu-
lar, extracellular space, changes in distribution can
alter the serum concentration.
5.7.3.1 Gilbert syndrome
A major confounding factor in interpreting mildly
elevated serum unconjugated bilirubin is Gilbert
syndrome. In many healthy people unconjugated
bilirubin can be mildly elevated to a concentration
of 34---51 mmol/L, especially after a 24 h fast. If this
is the only LFT abnormality and the conjugated
bilirubin level and complete blood count are nor-
mal, the diagnosis is usually assumed to be Gilbert
syndrome, and no further evaluation is required.
Gilbert syndrome was recently shown to be related
to a variety of partial defects in uridine diphosphate-
glucuronosyl transferase, the enzyme that conju-
gates bilirubin.
5.7.3.2 Prothrombin time
The liver synthesizes blood clotting factors II, V,VII, IX
and X. The prothrombin time (PT) does not become
abnormal until more than 80% of liver synthetic
capacity is lost. This makes PT a relatively insensitive
marker of liver dysfunction. However, abnormal
PT prolongation may be a sign of serious liver dys-
function. Since factor VII has a short half-life --- about
6 h --- it is sensitive to rapid changes in liver synthetic
function. Thus, PT is very useful for following liver
function in patientswith acute liver failure. An elevated
PT can result from a vitamin K deficiency. This defi-
ciency usually occurs in patients with chronic chole-
stasis or fatmalabsorption fromdisease of the pancreas
or small bowel.
5.8 Heart disease and lipiddisorder tests
Lipid disorders, high blood cholesterol and triglycer-
ides, increase the risk for atherosclerosis, and thus for
heart disease, stroke and hypertension. There are
three main serum forms of cholesterol which are
measured:
. total cholesterol;
. high-density lipoprotein (HDL) cholesterol; and
. low-density lipoprotein (LDL) cholesterol.
Along with triglycerides and Apolipoproteins
(Apo A-1, etc.), cholesterols are usually measured as
a panel of tests.
The laboratory test for HDL or LDL measures
how much cholesterol is present in high-density or
low-density lipoprotein fractions, not the actual
238 Biomedical sciences

amount of HDL or LDL in the blood. Thus, density
centrifugation or zonal electrophoresis would sepa-
rate high- and low-density lipoprotein fractions in a
blood sample and cholesterol would be determined.
Lipoprotein levels themselves can also be measured by
specific immunoassay.
Cholesterol can be measured by linked colori-
metric enzymatic reactions. For example cholesterol
esters are hydrolysed by cholesterol esterase, to
produce cholesterol which is then oxidized by cho-
lesterol oxidase producing hydrogen peroxide
(H2O2). H2O2 is quantified by the Trinder reaction
where 4-aminoantipyrine, 4-chlorophenol produces
a coloured product catalysed by hydrogen peroxi-
dase (POD) monitored at 546 nm (see colorimetric
assays, Section 5.1.2).
Triglycerides are similarly measured by linked
colorimetric enzymatic methods based on the hy-
drolysis of triglyceride by lipase to glycerol and free
fatty acids. Glycerol, in a reaction catalysed by
glycerol kinase, is converted to glycerol-3-phos-
phate. In a third reaction, glycerol-3-phosphate is
oxidized by glycerol phosphate oxidase to dihydrox-
ylacetone phosphate and hydrogen peroxide. H2O2
is then quantified by the Trinder reaction.
Several genetic disorders lead to abnormal levels of
cholesterol and triglycerides:
. familial combined hyperlipidemia;
. familial dysbetalipoproteinemia;
. familial hypercholesterolemia; and
. familial hypertriglyceridemia.
However, abnormal cholesterol and triglyceride
levels are more often caused by:
. being overweight or obese (metabolic syndrome);
. medications, including birth control pills, oestrogen,
corticosteroids, diuretics, beta blockers, and
antidepressants;. pre -existing diseases, for example diabetes, hypo-
thyroidism, Cushing’s syndrome, polycystic ovary
syndrome and kidney disease;. excessive alcohol consumption;. diets that are high in saturated fats (red meat, egg
yolks and high-fat dairy products) and transfatty
acids (found in commercial processed foods);. lack of exercise and sedentary lifestyle;. smoking (depresses HDL levels).
5.8.1 HDL and LDL
The main function of HDL is to transport choles-
terol from the walls of blood vessels to the liver,
where it is broken down and removed in the bile. In
general, the risk for heart disease, including a
heart attack, increases if HDL cholesterol levels are
<40mg/dL. An HDL >60mg/dL is associated with
reduced risk of heart disease. Women tend to
have higher HDL cholesterol than men and a low
HDL level may indicate increased risk for athero-
sclerotic heart disease. A low HDL level may also be
associated with familial combined hyperlipidemia;
noninsulin-dependent diabetes (NIDD) and
certain drugs.
High levels of LDL may be associated with an
increased risk of atherosclerotic heart disease and
familial hyperlipoproteinemia. However, very low le-
vels of LDL may be caused by malabsorption (inade-
quate absorption of nutrients from the intestinal tract)
or malnutrition. A healthy LDL level is one that falls in
the optimal or near-optimal range:
. optimal: less than 100mg/dL (less than 70mg/dL for
persons with a history of heart disease);. near optimal: 100---129mg/dL;. borderline high: 130---159mg/dL;. high: 160---189mg/dL;. very high: 190mg/dL and higher.
5.8.2 Triglycerides
Generally we try to keep fats to a minimum but these
obviously fluctuate after a meal so like the lipoproteins
fasted triglycerides are measured as a true indicator of
underlying health and condition. High triglyceride
levels may be due to:
. cirrhosis;
. diet low in protein and high in carbohydrates;
. familial hyperlipoproteinemia (rare);
. hypothyroidism;
. nephrotic syndrome;
. pancreatitis; or
. poorly controlled diabetes.
Low triglyceride levels may be due to a low-fat diet,
hyperthyroidism, malabsorption syndrome and
Chapter 5 Clinical chemistry 239

malnutrition. A healthy triglyceride level is one that
falls in the optimal or near-optimal range:
. normal: less than 150mg/dL;
. borderline high: 150---199mg/dL;
. high: 200---499mg/dL; or
. very high: 500mg/dL or above.
5.8.3 Apolipoproteins
Specific to lipid metabolism apolipoproteins are
found in the HDL and LDL complexes. Apolipopro-
tein A-I is the major protein component of HDL in
plasma. The protein promotes cholesterol efflux
from tissues to the liver for excretion. It is a cofactor
for lecithin cholesterolacyltransferase (LCAT) which
is responsible for the formation of most plasma
cholesterol esters. ApoA-I was also isolated as a
prostacyclin (PGI2) stabilizing factor, and thus may
have an anticlotting effect. Defects in the gene
encoding are associated with HDL deficiencies,
including Tangier disease, and with systemic non-
neuropathic amyloidosis. Apolipoprotein B (ApoB)
is associated predominately with LDL and therefore
high levels are associated with heart disease. It is
reported that brain apolipoprotein E (ApoE) levels
influence amyloid-b (Ab) deposition and thus the
increased risk for Alzheimer’s disease.
5.8.4 Markers of myocardialinfarction
For many years the determination of serum crea-
tine kinase (CK) activity was the mainstay of
biochemical tests for acute myocardial infarction.
Isoelectrophoresis demonstrated that the increase
was due to a specific isoform MB --- MBCK. With
antibody technology specific immunoassays for the
MB and even a myocardial MBCK were developed.
However, biomarker research eclipsed the decades
of evaluation of CK with the discovery that a
protein specifically associated with the microfila-
ment and cytoskeleton of myocytes was released
into serum as a result of injury to the heart
muscle, that is as a result of ischemia. Termed
Troponins, immunoassays specific to these cyto-
skeleton associated proteins --- Troponin I and
Troponin T --- developed, Troponin T being spe-
cific to the cytoskeletal filaments found in heart
muscle cells. Troponin I and T are now the main
stay markers of myocardial infarction:
. blood creatine kinase (CK or CPK) levels: male,
38---174 units/L; female, 96---140 units/L;. MBCK level: normally less than 5% of total CK;. Troponin I and Troponin T: normally undetectable
very high in MI, but slight to moderate elevation
during any damage episode to heart tissue such as
inflammation --- myocarditis.
5.9 Pancreatic functiontests
The mainstay clinical chemistry tests for assessing the
endocrine and exocrine function of the pancreas are
amylase c-peptide and insulin assay.
5.9.1 Amylase
In acute pancreatitis, amylase in the blood increases
often to four to six times higher than the highest
reference value (upper limit of normal). The increase
occurs within 12 h of injury to the pancreas and
generally remains elevated until the cause is success-
fully treated. Then the amylase values will return to
normal in a few days. In chronic pancreatitis, amylase
levels initially will be moderately elevated but often
decrease over time with progressive pancreatic
damage. A urine amylase test may also be ordered.
Typically, its level will mirror blood amylase concen-
trations, but both the rise and fall occur later. Amylase
levels may also be significantly increased in patients
with pancreatic duct obstruction, cancer of the
pancreas, and gallbladder obstruction or infection.
Measured by colorimetric assay the normal range is
23---85U/L.
5.9.2 Insulin and c-peptide
Both Insulin and c-peptide are measured by immuno-
assay. Insulin determination is used to diagnose in-
sulinoma (a tumour of the islets of Langerhans) and to
240 Biomedical sciences

evaluate patients with fasting hypoglycaemia. It is often
combinedwith a fasting plasma glucose test to increase
its diagnostic value with respect to diabetes.
Proinsulin, is transported to the Golgi appara-
tus where it is packed into secretory granules.
Maturation of the secretory granules is associated
with enzymatic cleavage of proinsulin to insulin
and C-peptide. Secretion of insulin into the blood-
stream is accompanied by the release of small
amounts of proinsulin. Although the absence of
insulin/proinsulin is diagnostic of insulin depen-
dent diabetes, the fact that many insulin assays use
antibodies that cross react significantly with pro-
insulin is not always helpful. In pathological con-
ditions elevated apparent ‘immunoreactive’ Insulin
may be nonfunctional because what is released is
proinsulin which has not been cleaved to active
insulin (and c-peptide). However, c-peptide im-
munoassays are specific for the free c-peptide
cleavage fragment which is also released. Thus, an
elevated plasma glucose level in the presence of
apparently high-insulin levels may be due to in-
correct processing and release of proinsulin (some
insulinomas). This can be diagnosed by the ab-
sence of c-peptide. If both are elevated this may
indicate insulin resistance --- noninsulin dependent
diabetes (see Figure 5.27).
A significant use of c-peptide assay is in forensics:
self abuse with injected insulin or indeed injected
insulin induced coma death can be determined by the
absence of c-peptide in the serum.
5.10 Bone diseaseassessment
Classically clinical chemistry assessment of bone dis-
ease has been by measuring calcium, phosphate and
alkaline phosphatase activity as discussed above. More
recently newer markers of bone metabolism have been
discovered and are moving from research to routine
clinical assessment, primarily in the assessment of
primary bone cancers (Ewings sarcoma and oesteo-
sarcoma) and bone metastasis (from primarily breast
and prostate cancers).
These new markers are cleavage fragments from
the synthesis (oesteoblast activity) or destruction
(oesteoclast activity) of collagen complexes that
forms the base matrix to which calcium is deposited
to form calcified bone. As matrix collagen is synthe-
sized by oesteoclasts it has a preprocessing
N-terminal and C-terminal propeptide regions
(PINP and P1CP, see Figure 5.28(a)) which are cleaved
as the collagen a chains are linked into twisted fibrils
and finally together by cross-linking telopeptides which
link the N-terminal and C-terminal regions of the fibril
a chains complex into large collagen fibres in the
extracellular matrix (see Figure 5.28(b)). Cleavage of
the C-terminal peptide --- PICP --- is an early event in
collagen synthesis but cleavage and release into circula-
tion of the N-terminal peptide --- PINP --- appears to be
a late process in the formation of new bone. During
bone destruction C-Telopeptides (CTX) and N-
Telopeptides (NTX) are released into circulation and
further metabolized to pyridinoline excreted in the
urine (see Figure 5.28(c)).
Immunoassays to CTP, PINP, PICP and NTX are
being evaluated as new markers of bone disease.
5.11 Endocrinologicalassessments
Endocrinological assessments cover a very broad
group of medical disciplines and disorders, from
neuroendocrinology to reproduction in which mar-
kers of the hypothalamic-pituitary adrenal axis, the
pituitary thyroid axis and the pituitary gonadol axis
are equally important. The endocrine functioning of
the other endocrine glands such as the parathyroids are
also important to specialists in metabolic disorders.Figure 5.27 Diagrammatic representations of proinsulinand its processing to active insulin and c-peptide
Chapter 5 Clinical chemistry 241

Figure 5.28 Demonstrating the structure of procollagen positions of N-terminal (PINP) and C-terminal (PICP) propedtides(a), their cleavage when laid down as large complex fibril units of extracellular collagen fibres (b) and the structure andposition of C and N terminal telopeptides which join the collagen fibres together, but are released during bone metabolism(60% as free telopeptides) and further degraded (40%) to pyridinoline and deoxy- (c) pyridinoline
242 Biomedical sciences

5.11.1 Thyroid function tests
The hypothalamus senses low circulating levels of
thyroid hormones --- Triiodothyronine (T3) and
Thyroxine (T4) and responds by releasing thyrotropin
releasing hormone (TRH). This stimulates the pitui-
tary to produce thyroid stimulating hormone (TSH).
The TSH, in turn, stimulates the thyroid gland to
produce thyroid hormones T3 and T4 until levels in
the blood return to normal. Thyroid hormone exerts
negative feedback control over the hypothalamus as
well as the anterior pituitary thus controlling the
release of both TRH from the hypothalamus and TSH
from the anterior pituitary gland (Figure 5.29).
The thyroid hormones T3 and T4 affect cells’
metabolism by increasing metabolic rates. In clinical
chemistry usually only TSH andT4 levels aremeasured
by specific immunoassay to assess thyroid pathology.
However, T3 has to be measured to confirm T3 toxi-
cosis; given the nonpeptide biochemical nature of T3
and T4, HPLC and HPLC-MSmethods are sometimes
used to measure these molecules:
. TSH normal range: 0.3---3.5mLU/L;
. free T4 normal range: 10---25 pmol/L;
. free T3 normal range: 3.5---7.5 pmol/L.
5.11.1.1 Disease associated with disturbance ofthe pituitary thyroid axis
In thyrotoxicosis TSH levels are suppressed (<0.05
mLU/L), T4 and T3 levels are increased, whilst in
primary hypothyroidism TSH levels are increased,
T4 levels decrease and T3 levels are either normal or
low. In T3 toxicosis TSH levels are suppressed but T4
levels are normal and T3 levels are significantly
Increased. In patients with TSH deficiency disorders
TSH levels are significantly decreased, T4 levels are also
decreased and T3 levels are normal or low.
5.11.2 The hypothalamic---pituitary---adrenal (HPA) axis
The hypothalamus contains neuroendocrine neurons
that synthesize and secrete vasopressin/ADH and cor-
ticotropin-releasing hormone (CRH). These two pep-
tides regulate the function of proopiomelanocortin
(POMC) endocrine secretory cells of the anterior
lobe of the pituitary gland. In particular, CRH and
vasopressin stimulate the secretion of adrenocortico-
tropic hormone (ACTH). ACTH in turn acts on the
adrenal cortices, which produce glucocorticoid hor-
mones --- mainly cortisol. The glucocorticoids in turn
act back on the hypothalamus and pituitary to suppress
CRH and ACTH production in a negative feedback
cycle (see Figure 5.30).
Vasopressin is also a powerful antidiuretic hor-
mone and hence is also called ADH. It is released
when the body is dehydrated and has potent water-
conserving effects on the kidney. It is also a potent
vasoconstrictor. Interestingly ACTH is derived
from the cleavage of a much larger peptide
Figure 5.29 The hypothalamic pituitary thyroid axis Figure 5.30 The hypothalamic---pituitary---adrenal axis
Chapter 5 Clinical chemistry 243

proopiomelanocortin (POMC) of which the other
major products are b-endorphins.Cortisol has widespread effects on cell metabolism,
fatigue and moods; levels dramatically increase after
waking slowly decreasing thereafter and is further
increased during periods of physical stress. It also
dampens down immune reactions.
All hormones of the HPA axis can be measured by
specific immunoassay but given the nonpeptide bio-
chemical nature of the glucocorticoids HPLC and
HPLC---MS methods are sometimes used to measure
these molecules. However, levels fluctuate markedly
during the day and between individuals. Thus many
of the assessments are measuring the dynamics of
the changes in levels after stimulation or specific
suppression.
5.11.2.1 Diseases associated with disturbanceof the HPA axis
Addison’s disease --- ACTH stimulation test --- in
normal individuals 30---60min after being injected
with an ACTH anolog drug plasma cortisol should
nearly double from 300---600 nmol/L to 500---
1200 nmols/L but in Addison’s disease cortisol levels
will essentially remain unchanged.
Cushing’s syndrome --- dexamethasone suppression
test --- in normal individuals after administration of
dexamethasone plasma cortisol will rapidly drop
from 300---600 nmols/L to a reference range in the
order of undetectable to �75 nmols/L.
Adrenal insufficiency --- ACTH stimulation test --- a
response intermediate between normal and full-
blown Addison’s disease.
Diabetes insipidus --- major cause is deficiency in
vasopressin or target tissue insensitivity to vasopres-
sin; often diagnosis is excessive urination and mon-
itoring a high plasma osmolarity and low urinary
osmolarity.
Stress --- elevated basal cortisol.
5.11.3 The growth hormone --- IGFanabolic endocrine cascade and axis
Also referred to as the somatotrophin---somatomedin
system, growth hormone-releasing hormone (GHRH,
also known as GRF --- growth hormone releasing
factor ---or sommatocorinin) is a 44 aminoacidpeptide
hormone produced by neuroendocrine hypothalamic
cells. GHRH, is secreted in bursts, particularly during
sleep, andplays a key role in regulating thebody’smajor
anabolic endocrine pathway. GHRH secreted from the
hypothalamus is carried to the anterior pituitary gland
where it stimulates the production and release of
growth hormone/somatotrophin (GH). There are a
number of growth hormone isoforms, all of which are
secreted in response to GHRH (prolactin is a structural
anolog of GH but is not controlled by GHRH).
The actions of GHRH are opposed by ‘growth-
hormone-inhibiting hormone’, more commonly
termed somatostatin. Somatostatin is released from
neurosecretory somatostatin neurons, and is carried to
the anterior pituitary where it inhibits GH secretion.
Somatostatin and GHRH are secreted in alternation,
giving rise to the markedly pulsatile secretion of
GH (see Figure 5.31).
Pulses of GH released from the pituitary have
numerous growth-enhancing and metabolic effects
and also stimulate the secretion of insulin-like growth
factor-1/somatomedin (IGF-1) from the liver. IGF-1
has major direct anabolic effects on a range of tissues
and also causes the release of numerous other growth
factors. IGF-1 and other growth factors exert negative
feedback effects which control and limit secretion of
GH and GHRH. This mechanism is important in
preventing excessive production and release of GH.
Growth hormones and the IGFs are usually mea-
sured by immunoassay. Normal ranges: GH - fasting
0---5mg/L but arginine stimulated it will be greater than
7 mg/L; IGF-1 ranges from 570 to 800 mg/L.
5.11.3.1 Diseases commonly associated withdisturbance of the GH---IGF axis
Overproduction of growth hormone causes excessive
growth. Inchildren, theconditioniscalledgigantism. In
adults, it is called acromegaly. Acromegaly is manifest
by growth of soft tissue but in childhood the epiphyseal
(growth)plates are still activeand thusexcessive skeletal
growth alsooccurs.However, itmost commonly affects
middle-aged adults and can result in serious illness and
prematuredeath.Once recognized, acromegaly is treat-
able in most patients, but because of its slow and often
insidious onset, it frequently is not diagnosed correctly.
There are multiple types of growth retardation and
dwarfism --- some simply due to a lack of GH others are
due to a deficiency in the IGF-1 response to GH which
are now termed severe primary IGF deficiencies.
244 Biomedical sciences

Patients with severe primary IGFD typically present
with normal to high GH levels, height below -3 stan-
dard deviations (SD), and IGF-1 levels below �3SD.
Severe primary IGFD includes patients withmutations
in the GH receptor, postreceptor mutations or IGF
mutations. In Laron dwarfism there are no GH recep-
tors. As a result, IGFD patients cannot be expected to
respond to GH treatment.
5.11.4 Prolactin
Hypothalamic neuronal dopamine release stimulates
anterior pituitary prolactin secreting cells to release
prolactin. Prolactin stimulates differentiated breast
ductal epithelia into lactation (milk production). It
also hasmany other functions, including essential roles
in the maintenance of the immune system and dis-
rupting the menstrual cycle. Measured by immunoas-
say prolactin normal ranges in females are up to
20 mg/L and in males are up to 15 mg/L.
5.11.4.1 Diseases commonly associated withdisturbance of prolactin secretion
Hyperprolactinemia, abnormally high prolactin, can
delay puberty, in women interfere with ovulation,
decrease libido in men and decrease fertility. Elevated
prolactin may be due to a benign tumour in the
pituitary gland --- a prolactinoma.
Hypoprolactinemia, abnormally low prolactin (or
prolactin deficiency), can cause menstrual disorders
and lead to inadequate lactation. Low prolactin is due
to impaired production by prolactin secreting cells of
the anterior pituitary gland.
5.11.5 Parathyroid hormoneand calcitonin
Parathyroid hormone (PTH), is secreted by the para-
thyroid glands as a mature polypeptide of 84 amino
acids. It acts to increase the concentration of calcium
(Ca2þ) in the blood, whereas calcitonin --- a hormone
produced by the parafollicular cells (C cells) of the
thyroid gland --- acts to decrease serum calcium con-
centration. PTH targets parathyroid hormone recep-
tors in three parts of the body:
. bone --- release of calcium;
. kidney --- increased reabsorption of calcium; and
. intestine --- increased absorption of calcium.
This latter action is indirect and via another
metabolic pathway of the kidneys. Vitamin D
activation occurs in the kidney. PTH upregulates
25-hydroxyvitamin D3 1-alpha-hydroxylase, the
enzyme responsible for 1-alpha hydroxylation of
25-hydroxy vitamin D, converting vitamin D to its
Figure 5.31 The growth hormone --- insulin-like growth factor/somatotrophin-somatomedin system
Chapter 5 Clinical chemistry 245

active form (1,25-dihydroxy vitaminD). This activated
form of vitamin D increases the absorption of calcium
(as Ca2þ ions) by the intestine via calbindin.
A fetal variant (PTH-like hormone) is larger and
consists of a propeptide of 139 aminoacids (but splice
variants also give propeptides of 173 and 141 amino
acids). This is in turn subject to proteolytic processing
to give three PTH related peptides (PTHrp) a 1-36
amino acid N terminal and PTH-like fragment,
a nuclear localization midregion fragment
(AAs 38---94) and a C - terminal oesteostatin peptide
(AAs 107---139).
Measured by immunoassay PTH levels are normally
1.1---7.5 pmol/L. Vitamin D is measured by HPLC and
HPLC MS and the normal range is 30.0---74.0 mg/L.
5.11.5.1 Diseases commonly associated withdisturbance of parathyroid hormone secretion
Hypoparathyroidism, low PTH levels, may be caused by
inadvertent removal of parathyroids during routine
thyroid surgery, autoimmune disorders and inborn
errors of metabolism.
Hyperparathyroidism, high PTH levels can be
caused by parathyroid adenoma, parathyroid hypepla-
sia and parathyroid cancer all termed primary hyper-
parathyroidism. Chronic renal failure --- secondary
hyperparathyroidism --- is where serum calcium levels
are decreased because of failed kidney reabsorption
and vitamin D activation, which causes the hyperse-
cretion of PTH from the parathyroid glands.
Apparent primary hyperparathyroidism can occur
due to ectopic expression of PTH-like hormone by
common cancers and the action of the PTHrps giving
rise to parathyroid hormone related peptide is humor-
al hypercalcemia of malignancy (HHM) by nonpar-
athyroid tumours.
5.11.6 Pituitary gonadol axisand reproductive endocrinology
Hypothalamic pulsitile release of gonadotrophin re-
leasing hormone (GnRH) results in stimulation of
anterior pituitary gonadotrophic cells to produce and
release luteinizing hormone (LH) and follicle stimu-
lating hormone (FSH). The classical roles of LH and
FSH are the control of folliculogenesis and ovulation
as well as the regulation of the spermatogensis (see
Figure 5.32 and Table 5.5).
Frommenarche to menopause, the menstrual cycle
produces a mature oocyte once a month. Primary
oocytes arrest during the first meiotic prophase and
are held within immature follicles. The human
menstrual cycle takes 28---30 days and only a few
follicles grow every cycle during the following three
phases:
. a follicular phase, consisting of preantral and antral
stages first 10---12 days;. an ovulatory(/preovulatory) stage, next 1---2 days;
and. a luteal phase of 12---15 days.
The initial stages of preantral development occur
independently of any extraovarian controls but it is
generally believed that cytokines induce graffian follicle
development. During the antral stage GnRH produc-
tion by the hypothalamus results in LH and FSH
production by the pituitary. LH induces the synthesis
of androgens from the follicular theca interna (an inner
glandular, highly vascular layer surrounding the pre-
antral follicle) and FSH stimulates aromatization of
androgens to oestrogens by the follicular granulosa
Table 5.5 Normal ranges of reproductive hormones.
Hormone Normal range
Testosterone Men younger than 50 10---45 nmol/L
Men older than 50 6.2---26 nmol/L
Females 0.5---2 nmol/L
Dihydrotestosterone Adult men 8---35 nmol/L
Estradiol Follicular phase 400---1500 pmol/L
Luteal phase 70---600 pmol/L
Postmenopause <130 pmol/L
Progesterone Follicular phase 2.2---9 nmol/L
Luteal phase 17---92 nmol/L
FSH Adult men 1---8 IU/L
Female follicular phase 5---8 IU/L
Luteal phase 1.5---5 IU/L
Ovulatory peak 5.5---15 IU/L
Postmenopause >35 IU/L
LH Adult men 2---14 IU/L
Female follicular phase 3---7 IU/L
Luteal phase <1---6 IU/L
Ovulatory peak 20---75 IU/L
Postmenopause >20 IU/L
246 Biomedical sciences

cells (the cellular population outside the oocyte con-
tacting cells of the zona pellucida). A number of
cytokines also function at that point: activin suppresses
androgen output and increases the aromatization ca-
pabilities of the granulosa cells, while inhibin has the
opposite effects of stimulating androgen output and
suppressing aromatizing activity. Endometrial changes
that eventually lead to endometrialmaturationoccur as
soon as oestrogens are produced and the endometrium
prepares for the implantation of any fertilized oocyte.
Figure 5.32 Summary of the menstrual cycle indicating: (a) the hypothalamo-pituitary-ovarian interactions, (b) serum LHand FSH levels, (c) the morphology of follicular development, (d) serum oestrogen and progesterone levels, and (e) thesequence of endometrial changes
Chapter 5 Clinical chemistry 247

Midway through a cycle and after the LH
surge preovulatory growth commences of a primed
immature graffian follicle, as part of the next men-
strual cycle. During this stage, the secondary oocyte is
formed following the reinitiation of meiosis. During
the second half of meiosis, the oocyte is arrested, again
at the metaphase point, and this is the maturation
state of the oocyte at day 14 ovulation. During
preovulatory growth the granulosa cells stop synthe-
sizing oestrogen from androgen and start synthesizing
progesterone; LH, therefore, stimulates granulosa cell
differentiation and ovulation simultaneously. Posto-
vulation the remaining tissue of the ruptured follicle
becomes the corpus luteum; granulosa cells undergo
hypertrophy to form large lutein cells. The cells of
the theca also form lutein cells, although they are
smaller in size. Lutein cells secrete progesterone
and oestrogens.
5.11.6.1 Spermatogenesis
Testicular functions in the male are governed by
neuroendocrine mechanisms similar to those that
regulate ovarian activities. GnRH production by the
hypothalamus in males causes the secretion of the
gonadotrophins LH and FSH which in turn regulate
the endocrine and spermatogenic activities of
the testis.
LH stimulation of the testicular Leydig cells
initiates the production of testosterone, the key
androgen in spermatogenesis, which feeds back
down regulating GnRH and LH production by the
pituitary. The absence of testosterone leads to hy-
pogonadotropism. FSH acts on specific receptors on
the Sertoli cells, leading to Inhibin-B production,
which selectively negatively regulates FSH secretion
(see Figure 5.33).
Gonadotrophs
Anterior pituitary
GnRH
FSH LH
Leydig cells
Sertoli cell
Cell products
Androgen-binding protein
To tissues for secondary effects
Androgen-binding protein +
testosterone
Spermatocytes
-ve
feed
back
to F
SH
-ve feedback to LH
, FSH
, GnR
H
Seminiferous tubule
Hypothalamus
Portal vessels Systemic circulation
Inhibin B
Testosterone
Figure 5.33 In the control of spermatogenesis, GnRH is the key neuropeptide acting on gonadotrophs of the anteriorpituitary, which in turn produce LH and FSH. The testicular gonadol steroid testosterone and protein hormone inhibin Bproducts, feed back to negatively downregulate Hypothalamic GnRH and pituitary FSH secretion
248 Biomedical sciences

Most reproductive hormones are measured by im-
munoassay although HPLC mass spectrometry is used
to measure steroid levels in criminal and athletic
doping as the positive identification and quantitative
accuracy of this method is deemed more evidential
than immunoassays.
5.11.6.2 Diseases commonly associated withdisturbance of the pituitary---gonadol axis
Given the nature of the pituitary---gonadol axis any
reproductive conditions will alter gonadol/sex steroid
levels be it testosterone, progesterone, estradiol and
dihydrotestosterone. Often it is more informative to
combine steroid measurement with that of gonado-
tropin levels; for example poor ovarian reserve --- also
known as premature ovarian aging --- is characterized
by high FSH levels but not LH high levels. In
polycystic ovarian disease LH levels are elevated
but FSH levels are lowered. Other conditions associ-
ated with altered gonadotropin levels are listed
in Table 5.6.
5.12 Pregnancy tests andpregnancy clinical chemistry
Pregnancy tests are based on immunoassay technology
(Section ) and therefore rely on antibody specificity for
test specificity. The antibodies used in pregnancy tests
are raised against the hormone human chorionic
gonadotrophin (hCG) and can be poly- or mono-
clonal. hCG is a unique hormone which is produced
in only a very few clinical situations namely pregnancy
and some cancers. For this reason a qualitative test is
often sufficient to determine pregnancy.
hCG is a heterodimeric glycoprotein hormone
comprised of an alpha and beta subunit. The alpha
subunit is shared with the other three members of the
glycoprotein hormones: luteinizing hormone (LH),
follicle stimulating hormone (FSH) and thyroid stim-
ulating hormone (TSH). The beta subunits are, how-
ever, distinct but display considerable homology in
their amino acid sequences and three-dimensional
structures. hCG is produced by the trophoblast cells
of the early blastocyst and after implantation hCG
circulates within the maternal blood to exert its endo-
crine function on the ovary. hCG binds the LH recep-
tor, which again reflects the homology between the two
closely related molecules, and stimulates the expres-
sion of 20a-hydroxylase side chain cleavage enzymes
and 3b-hydroxsteroid dehydrogenase/isomerase to
convert cholesterol to pregnenolone and pregnenolone
to progesterone respectively. This increase in the pro-
duction of progesterone results in themaintenance of a
thickened and receptive endometrium and prevents
menstruation. In essence hCG (produced by the pla-
centa) takes over from LH in the stimulation of
progesterone to allow pregnancy to continue. In the
absence of hCG menstrual cycling would continue.
hCG is therefore critical to the initiation of pregnancy
in humans and, as such, it is logical to use hCG as a
single test diagnostic marker for pregnancy.
5.12.1 Pregnancy physiology
hCG rises throughout the first weeks of pregnancy
doubling every 2 days until around week 10 where it
declines and stabilizes at a much lower concentration
until term. Other hormones, progesterone, hPL
and estrogens also rise through pregnancy. These
significant changes in the endocrinology bring
Table 5.6 Diseases associated with high and low LH andFSH levels.
Altered gonadotropin levels Conditions/pathological cause
Consistently high
LH and FSH
. Premature menopause
. Gonadal dysgenesis, Turner
syndrome
. Castration
. Swyer syndrome
. Polycystic ovary syndrome
. Certain forms of congenital
adrenal hyperplasia
. Testicular failure
Low LH and FSH . Kallmann syndrome
. Hypothalamic suppression
. Hypopituitarism
. Eating disorder
. Female athlete triad
. Hyperprolactinemia
. Gonadotropin deficiency
. Gonadal suppression therapy
(GnRH antagonist/agonist)
Chapter 5 Clinical chemistry 249
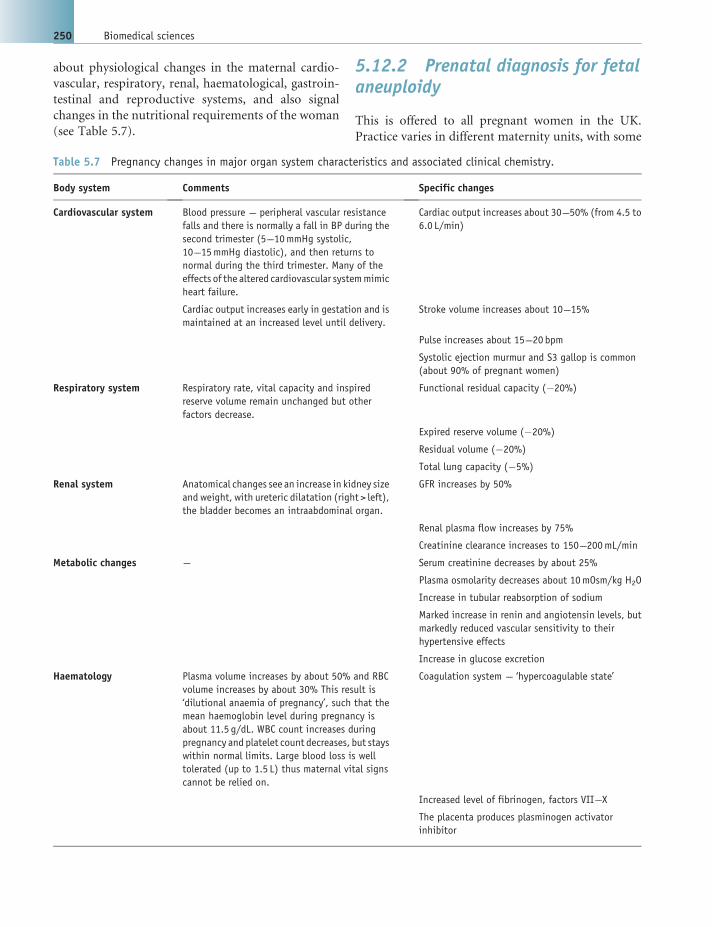
about physiological changes in the maternal cardio-
vascular, respiratory, renal, haematological, gastroin-
testinal and reproductive systems, and also signal
changes in the nutritional requirements of the woman
(see Table 5.7).
5.12.2 Prenatal diagnosis for fetalaneuploidy
This is offered to all pregnant women in the UK.
Practice varies in different maternity units, with some
Table 5.7 Pregnancy changes in major organ system characteristics and associated clinical chemistry.
Body system Comments Specific changes
Cardiovascular system Blood pressure --- peripheral vascular resistance
falls and there is normally a fall in BP during the
second trimester (5---10mmHg systolic,
10---15mmHg diastolic), and then returns to
normal during the third trimester. Many of the
effects of the altered cardiovascular systemmimic
heart failure.
Cardiac output increases about 30---50% (from 4.5 to
6.0 L/min)
Cardiac output increases early in gestation and is
maintained at an increased level until delivery.
Stroke volume increases about 10---15%
Pulse increases about 15---20 bpm
Systolic ejection murmur and S3 gallop is common
(about 90% of pregnant women)
Respiratory system Respiratory rate, vital capacity and inspired
reserve volume remain unchanged but other
factors decrease.
Functional residual capacity (�20%)
Expired reserve volume (�20%)
Residual volume (�20%)
Total lung capacity (�5%)
Renal system Anatomical changes see an increase in kidney size
and weight, with ureteric dilatation (right > left),
the bladder becomes an intraabdominal organ.
GFR increases by 50%
Renal plasma flow increases by 75%
Creatinine clearance increases to 150---200mL/min
Metabolic changes --- Serum creatinine decreases by about 25%
Plasma osmolarity decreases about 10mOsm/kg H2O
Increase in tubular reabsorption of sodium
Marked increase in renin and angiotensin levels, but
markedly reduced vascular sensitivity to their
hypertensive effects
Increase in glucose excretion
Haematology Plasma volume increases by about 50% and RBC
volume increases by about 30% This result is
‘dilutional anaemia of pregnancy’, such that the
mean haemoglobin level during pregnancy is
about 11.5 g/dL. WBC count increases during
pregnancy and platelet count decreases, but stays
within normal limits. Large blood loss is well
tolerated (up to 1.5 L) thus maternal vital signs
cannot be relied on.
Coagulation system --- ‘hypercoagulable state’
Increased level of fibrinogen, factors VII---X
The placenta produces plasminogen activator
inhibitor
250 Biomedical sciences

only offering screening to high-risk mothers. Predic-
tion factors for high-risk include womenwho are older
than 35 years and those with a history or family history
of chromosomal abnormalities.
First trimester:. ultrasound (high-resolution) for nuchal translucen-
cy to exclude major chromosomal abnormalities
(e.g. trisomies and Turner syndrome);. maternal serum for pregnancy-associated plasma
protein-A (PAPP-A from the syncytial trophoblast)
for trisomy 21 ---This ismore accurate than the triple
test at 16 weeks.
Second trimester. ultrasound for structural abnormalities (e.g. neural
tube defects, congenital heart defects) --- serum
screening has been superseded by high-resolution
ultrasound (above) in specialist centres;. triple test for chromosomal abnormalities: this
consists of a serum a-fetoprotein (low), unconju-
gated oestradiol (low) and human chorionic gonad-
otrophin (high);. a-fetoprotein (high for neural tube defects).
All markers are corrected for gestational ages a
multiple of the mean (MOM) value for the appropriate
week of gestation. If abnormalities are detected, it is
necessary to continue investigations with chorionic
villus sampling (CVS) at 11---13 weeks, or amniocente-
sis at 15 weeks, under ultrasound control to sample
amniotic fluid and fetal cells necessary for cytogenetic
testing. These testsmaywell be superseded by salvage of
fetal cells from the maternal blood sample at 12 weeks.
5.13 Therapeutic drugmonitoring and toxicology
Many medications are used without monitoring of
blood levels, as their dosage can generally be varied
according to the clinical response. In a small group of
drugs, this is difficult, as insufficient levels will lead to
under treatment or resistance, and excessive levels can
lead to toxicity and tissue damage. Therapeutic drug
measurement of medication levels in blood is essential
under these circumstances. Thus, the main focus of
therapeutic drugmonitoring is on drugs with a narrow
therapeutic range.
5.13.1 Prescribed drugs
Gentamicin is a vestibulotoxin, and can cause perma-
nent loss of the sense of balance, caused by damage to
the vestibular apparatus of the inner ear, usually if
taken at high doses or for prolonged periods of time.
Some individuals have a normally harmless mutation
in their mitochondrial RNA that allows the gentami-
cin to affect their cells. The cells of the ear are
particularly sensitive to this, sometimes causing com-
plete hearing loss and in some cases gentamicin
completely destroy the vestibular apparatus after
3---5 days of high exposure. Ideally levels are kept at
less than 1mg/L of blood.
Other commonly monitored therapeutic drugs:
. antiepileptic, for example carbamazepine, phenytoin
and valproic acid;. mood stabilizers, for example lithium citrate;. antipsychotics, for example pimozide and clozapine.
Given the small organic nature of most drugs
HPLC---mass spectrometry (quadrupole) is often used
as the detection and quantification methodology. Al-
though other colorometric and immunoassay based
systems are used depending on the nature of the drug.
Drugs with narrow therapeutic range can often be
accidental toxins if taken by children or even deliber-
ately administered in homicides (see Table 5.8).
Aside from drugs that have a very narrow thera-
peutic range which can easily be exceeded into their
toxicity range, other common, over the counter, drugs
can be taken at deliberate vast excess and in to the
toxic range:
. salicylate --- asprin overdoses from 150---300mg/kg;
mild-to-moderate toxicity serum levels being
between 300---500mg/L;. iron --- particularly children taking their mother’s
iron tablets; children can show signs of toxicity with
ingestions of 10---20mg/kg of elemental iron.
5.13.2 Over the counterdrugs---paracetamol poisoning
Paracetamol poisoning is a common toxicological test
in clinical laboratories. First used in the late nineteenth
century, in the 1960s the first reported liver failure in
Chapter 5 Clinical chemistry 251

humans was attributed to paracetamol poisoning.
There had been studies on rats and cats but little was
known about the side effects but as use of the drug
increased, so too did the numbers of overdoses. In 1973
scientists first established the biochemical basis of
paracetamol toxicity which led to the development of
an antidote: N-acetylcysteine.
The toxicity of a paracetamol overdose is as a
result of one of the pathways by which the liver
metabolizes this drug (Figure 5.34). In normal doses,
paracetamol is conjugated by glutathione to glucu-
ronide or sulphate in the liver. A small amount is
also converted to N-acetyl-para-benzoquinoneimine
(NABQI) --- an alkylating agent that reacts with
glutathione This gives an intermediate that is metab-
olized to nontoxic cysteine and mercapturic acid
conjugates. When there is an overdose of paraceta-
mol (>10 g) normal levels of glutathione are depleted
and the toxic intermediates metabolite --- NABQI
binds to important liver cell constituents and inhibits
Table 5.8 Prescribed drugs --- therapeutic drug monitored.
Therapeutic drug Medical condition Therapeutic level
Digoxin Atrial fibrillation Plasma concentration 1.0---2.6 nmol/L
Lithium Antipsychotic Plasma concentrations 0.6---1.2mmol/L
Theophylline Mast cell inhibitor used to treat asthma Serum concentration 10---20mg/L
Carbamazepine Antiepileptic is also used as a treatment for
patients with manic-depressive illness
Plasma concentration is 4---12mg/L
Methotrexate Chemotherapy but used to downregulate immune
reaction in arthritis
Therapeutic range 0.01mmol---10 mmol over 24 h
Phenobarbital Barbiturate abuse Toxicity is seen at plasma levels >40mg/L
Phenytoin Anticonvulsant Therapeutic plasma concentration <80mmol/L
Thyroxine Treats hypothyroidism Lowest recorded toxic dose to a child has been
14---20 mg/kg
Figure 5.34 Liver metabolism of paracetamol indicating the toxic intermediate metabolite N-acetyl p-benzoquinoneimine(NABQI) and the glutathione dependent final metabolism of NABQI for safe excretion
252 Biomedical sciences

the activity of enzymes. NABQI is also nephrotoxic
and will cause renal failure. There is greater toxicity
when overdoses are taken by people on low-protein
diets or those who consume alcohol regularly ---
both these states deplete glutathione levels further.
N-acetylcysteine and oral methionine promotes
glutathione synthesis.
5.13.3 Environmental toxins
Toxicology monitoring is not only medicines but
environmental chemicals that poison the body. The
common environmental toxins are listed in Table 5.9.
5.14 Clinical chemistry atthe extremes of age
Clinical chemistry results differ from those of adults in
the newborn, infant and child and for quite different
reasons in the elderly. Themost obvious differences are
endocrinological, largely in the reproductive hor-
mones, being low before puberty and high afterwards
but declining with age or changing dramatically as in
the menopause.
However, there are three other very notable sets
of common clinical chemistry markers that change
with age: acid---base balance of electrolytes associated
with oxygen tension, renal function and metabolism
markers.
5.14.1 Blood gases and electrolytes
The trauma of labour and birth results in a significant
degree of asphyxia in the infant. Acidosis (blood pH
and bicarbonate levels) should return to normal within
1 h. However, premature infants with respiratory dis-
tress syndrome usually become acidotic monitored by
the increased level of PaCO2.
5.14.1.1 Normal newborn arterial blood gassaturation
. PaC02 (mmHg) 27---40;
. PaO2 (mmHg) 65---80.
Sodium and potassium may be slightly elevated in
the newborn and infant and chloride can be 1 or
2mmols more markedly elevated compared to adults.
However, the major differences are in bicarbonate
levels which are much lower:
. infant serum bicarbonate 19---24 mmol/L;
. child serum bicarbonate 21---27 mmol/L;
. adult serum bicarbonate 23---32 mmol/L.
5.14.1.2 Old age blood gases and electrolytes
As an adult our arterial blood gases should be 95---99%
but as we progress into old age arterial blood PaO2
decreases 5% every 15 years and PaCO2 increases 2%
every 10 years. Sodium and chloride levels remain
relatively constant but potassium levels also increase
with age.
Table 5.9 Common environmental toxins.
Environmental poison Comments
Carbon monoxide Poisoning --- carboxyhaemoglobin --- CO has a greater affinity for haemoglobin than O2. Up to 2% COHb can
be found in the blood of city dwellers, and up to 10% in smokers
Ethanol Blood alcohol levels important to determine driving ban
Ethylene glycol (antifreeze) Neuro and metabolic toxin lowest recorded oral lethal dose is 786mg/kg
Lead Common accumulative neurotoxin --- nonoccupationally exposed blood levels 1.2mmol/L; occupationallyexposed 2.9mmol/L
Mercury Accumulative neurotoxin --- normal mercury levels are considered to be <10mg/L in blood and <20mg/L in24 h urine
Methanol Neuro and metabolic alcohol toxin --- binds to cells and has to be displaced by ethanol as this is less toxic
Arsenic Accumulative metabolic toxin --- the reported lethal dose of arsenic ranges from 120 to 200mg in adults and
is 2mg/kg in children
Paraquat Weed killer but also a human toxin if a dose of 35mg/kg is taken
Chapter 5 Clinical chemistry 253
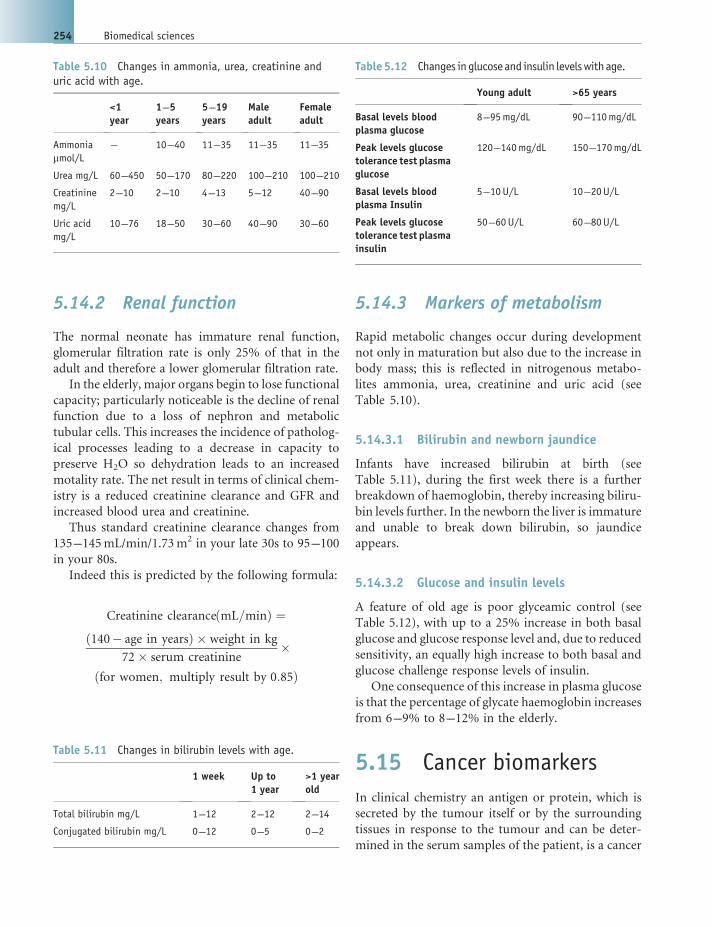
5.14.2 Renal function
The normal neonate has immature renal function,
glomerular filtration rate is only 25% of that in the
adult and therefore a lower glomerular filtration rate.
In the elderly, major organs begin to lose functional
capacity; particularly noticeable is the decline of renal
function due to a loss of nephron and metabolic
tubular cells. This increases the incidence of patholog-
ical processes leading to a decrease in capacity to
preserve H2O so dehydration leads to an increased
motality rate. The net result in terms of clinical chem-
istry is a reduced creatinine clearance and GFR and
increased blood urea and creatinine.
Thus standard creatinine clearance changes from
135---145mL/min/1.73m2 in your late 30s to 95---100
in your 80s.
Indeed this is predicted by the following formula:
Creatinine clearanceðmL=minÞ ¼ð140� age in yearsÞ � weight in kg
72� serum creatinine�
ðfor women; multiply result by 0:85Þ
5.14.3 Markers of metabolism
Rapid metabolic changes occur during development
not only in maturation but also due to the increase in
body mass; this is reflected in nitrogenous metabo-
lites ammonia, urea, creatinine and uric acid (see
Table 5.10).
5.14.3.1 Bilirubin and newborn jaundice
Infants have increased bilirubin at birth (see
Table 5.11), during the first week there is a further
breakdown of haemoglobin, thereby increasing biliru-
bin levels further. In the newborn the liver is immature
and unable to break down bilirubin, so jaundice
appears.
5.14.3.2 Glucose and insulin levels
A feature of old age is poor glyceamic control (see
Table 5.12), with up to a 25% increase in both basal
glucose and glucose response level and, due to reduced
sensitivity, an equally high increase to both basal and
glucose challenge response levels of insulin.
One consequence of this increase in plasma glucose
is that the percentage of glycate haemoglobin increases
from 6---9% to 8---12% in the elderly.
5.15 Cancer biomarkers
In clinical chemistry an antigen or protein, which is
secreted by the tumour itself or by the surrounding
tissues in response to the tumour and can be deter-
mined in the serum samples of the patient, is a cancer
Table 5.10 Changes in ammonia, urea, creatinine anduric acid with age.
<1year
1---5years
5---19years
Maleadult
Femaleadult
Ammonia
mmol/L--- 10---40 11---35 11---35 11---35
Urea mg/L 60---450 50---170 80---220 100---210 100---210
Creatinine
mg/L
2---10 2---10 4---13 5---12 40---90
Uric acid
mg/L
10---76 18---50 30---60 40---90 30---60
Table 5.11 Changes in bilirubin levels with age.
1 week Up to1 year
>1 yearold
Total bilirubin mg/L 1---12 2---12 2---14
Conjugated bilirubin mg/L 0---12 0---5 0---2
Table 5.12 Changes inglucose and insulin levelswithage.
Young adult >65 years
Basal levels bloodplasma glucose
8---95mg/dL 90---110mg/dL
Peak levels glucosetolerance test plasmaglucose
120---140mg/dL 150---170mg/dL
Basal levels bloodplasma Insulin
5---10 U/L 10---20U/L
Peak levels glucosetolerance test plasmainsulin
50---60 U/L 60---80U/L
254 Biomedical sciences

biomarker (formerly called tumour marker). They are
used in screening programs and clinical practice to:
. confirm diagnosis of malignancy;
. indicate severity and hence prognosis;
. provide posttreatment information to monitor
therapy.
Several decades ago the criteria of an ‘Ideal Tumour
Marker’ was established. They should be:
. tumour specific and common to tumour type;
. absent from healthy individuals or benign disease;
. easily detected at the early stage of tumour
development;. directly proportional to tumour mass;. levels parallel response to therapy.
However, in practice tumour markers never ful-
filled these criteria (and hence the name was changed
to cancer biomarker) and such markers are:
. Rarely tumour or type specific, even rarer is 100%
expression.. Most cancer associated proteins and molecules are
expressed regardless of tumour status. A low level is
often found in benign conditions which will be
intermediate between that found in healthy controls
and that of those with early --- late stage malignant
disease.. Most cancers only produce high levels of any given
tumour marker in advanced stage and there is
considerable variation between patients.. Although tumour marker levels will parallel
response to therapy this is an individual patient
issue and there is often a lag response that may be
preceded by ‘tumour marker flare’ whereby large
amounts of the marker are released due to cancer
cell death.
No tumour/cancer biomarker matches all these
criteria but the nearest is hCG when used as a marker
of gestational trophoblastic disease.
5.15.1 Classification of cancerbiomarkers
Clinical chemistry cancer markers can be defined
by their biochemical nature: organic and inorganic
compounds and metabolites, peptide hormones,
monoclonal defined cancer antigens and oncofetal
antigens. There is a tendency for the ectopic expression
of proteins to be associated with highly malignant
tumours (see Figure 5.35).
Figure 5.35 Overview of biochemical cancer marker types and the nature of the tumours with which they are associated
Chapter 5 Clinical chemistry 255

5.15.1.1 Organic and inorganic compounds andmetabolites
These markers are highly specific, often urinary and
define well-differentiated slow growing tumours.
In the main they aid diagnosis following clinical
observations.
A good example is Phaeochromocytoma, an adrenal
gland tumour one in 10 of which are cancerous. Given
the nature of the tissue, adenal medullary cells, a
clinical consequence of the expanded cell population
is elevated production of adrenal hormones (adrena-
line/epinephrine). If the tumour arose in the adrenal
cortex rather than the medulla then it would be
increased cortisol.
Although the adrenalins have potent vasodilatory
and ‘flight or fight’ effects, biochemically they are
rapidly degraded. Thus, to detect such increased se-
cretion we measure urinary Catecholamines (break-
down products of the adrenalins) the normal ranges of
which are:
. Normetadrenalin --- up to 2.8mmol/24 h;
. Metadrenaline --- up to 2.2mmol/24 h;
. (5HAA) 5-hydroxyindole-3-acetic acid ---
8---50mmol/24 h;. HMMA (4 Hydroxy, 3 Methoxy Mandelic Acid);. VMA (Vanilylmandelic acid) --- 8---35mmol/24 h;. HVA(HomoVanillic Acid) --- up to 40mmol/24 h.
It should be noted that the relationship to elevated
metabolites and steroids are not always direct. For
example Carcinoid tumours (neuroendocrine tumours
found in the small intestine or the appendix --- often
benign) release ACTH which induces adrenal corticol
cells to produce and elevate serum cortisol levels.
5.15.1.2 Peptide hormones
These markers when elevated are usually specific,
serum or urine-based measurement and usually
define well-differentiated slow growing tumours.
Again primary diagnosis is largely from clinical
features. However, nonbioactive forms and frag-
ments of the peptide hormone tend to define ag-
gressive poorly differentiated tumours. For example
elevated PTH, PTH-RP, LH, GH and ACTH are
diagnostic of parathyroid and pituitary tumours.
Hypothalamic tumours require additional clinical
investigation, but post chemotherapy or surgery,
monitoring of levels is indicative of response to the
therapy.
5.15.1.3 Monoclonal defined cancer antigens
They are the result of raising antibodies (monoclonal
and polyclonal) against human tumour cells and ex-
tracts thereof, immunized in mice, sheep, rabbits, and
so on. As such the molecules are defined by the
antibody that detects them, for example CEA (Carci-
noembryonic Antigen), CA125 (Cancer Antigen 125),
CA15.3 (Cancer Antigen 15), PSA (Prostate Specific
Antigen), and so on. Characterization has revealed all
to be normal proteins inappropriately expressed as a
result of oncogenesis. These do tend to be interesting
functional molecules almost exclusively large molecu-
lar weight glycoproteins (see Table 5.13).
Thus the reality of this category of tumourmarkers
is that:
. None are tumour specific but more commonly
associated with a particular cancer.. Low levels are found in normal individuals, higher
during pregnancy and occasionally during menses.
Often expressed by more than one cancer.. Found in serum, urine or tissue.. Can be detected at all stages of tumour development
but usually correlate with advancing disease stage.. They are generally not particularly diagnostic of very
early stage disease.. They are prognostic and used for monitoring
disease.
5.15.1.4 Oncofetal antigens
These are peptide hormones and proteins specifically
expressed by the placental---fetal unit, for example
PLAP (Placental Alkaline Phosphatase), AFP (Alpha-
fetoprotein), hCG (human Chorionic Gonadotropin).
They can be measured in serum or urine and when
ectopically expressed by cancers tend to define poorly
differentiated fast growing/malignant tumours and
diagnosis is more reliant on the levels of these markers.
Indeed, hCG is diagnostic of gestational trophoblastic
disease (GTD), particular forms of testicular germ cell
tumours and some nontrophoblastic tumours (see
Table 5.14). Additional clinical investigation is re-
quired, but monitoring of levels postchemotherapy or
surgery is extremely useful in detecting response and
256 Biomedical sciences

Table 5.13 Examples of major monoclonal antibody defined cancer antigens in clinical use.
Antibody definedCa marker
Clinical significance/characteristics
CEA . Define colorectal cancers
--- but also breast, lung, GI tract and liver
. Normal levels <5mg/L
. Elevated in pregnancy, smokers, respiratory disorders
. Not reliable for diagnosis but some prognostic value in colon cancers and in monitoring posttreatment levels fall
T1/2 of 2---3 days
CA125 . Ovarian cancer 85---90%
--- but also adenocarcinomas of breast, lung and GI tract
. Also elevated in other gynaecological conditions
. Large screening study completed --- not proven effective policy for asymptomatic screening
. Not reliable for diagnosis but some prognostic value in ovarian cancers and in monitoring
--- postsurgical levels fall T1/2 of 5 days
CA15.3 . Breast cancer --- up to 35% of early disease
--- also in lung, GI tract, reproductive system cancers
. >25 kU/L indicates disease but not really diagnostic
. Not really prognostic
--- levels often indicate mass rather than malignancy
. 5 � cut off indicates metastatic disease
. Drop in levels posttreatment indicate good response and elevations over 25% indicate recurrent disease
PSA . Prostate cancer (prostatic carcinoma)
--- also BPH (benign prostatic hypertrophy) and prostatitis
. Normal <50 years 2.5mg/L > 50 < 70 years 4mg/L
. No use in screening or diagnosis alone
. Some use in prognosis
. Good in monitoring
--- T1/2 of 2.2 days to undetectable levels after radical prostatectomy
Table 5.14 Oncofetal antigens in clinical use.
Oncofetal antigen Clinical significance/characteristics
PLAP Elevated in trophoblastic and nontrophoblastic dedifferentiated tumours. Particularly associated with
seminomatous germ cell tumours of the testis and the female ovarian equivalent --- dysgerminomas
. seminomas 90% PLAP positive
. dysgerminomas 75% PLAP positive
AFP Elevated in trophoblastic, germ cell and nontrophoblastic dedifferentiated tumours:
Nontrophoblastic/germ tumours
--- Hepatocellular carcinoma
--- Yolk sac tumours
. Diagnostic
. Prognostic
(Continued )
Chapter 5 Clinical chemistry 257

Table 5.14 (Continued )
Oncofetal antigen Clinical significance/characteristics
---High levels the more extensive the tumour burden
. Monitor
--- Levels correspond to therapy
--- Persistent or resurgent levels¼ resistance/recurrence
Testicular germ cell tumours
. Diagnostic of nonseminomatous type that contain yolk sac elements
. Prognostic
--- In combination with hCG
. Monitor
--- Levels correspond with therapy
--- Persistent levels¼ resistance/recurrence
hCG Elevated in trophoblastic, germ cell and nontrophoblastic dedifferentiated tumours.
Testicular germ cell tumours
. Diagnostic
--- Seminoma (a radiosensitive tumour) --- hCG positive 8% (AFP 0%)
--- Nonseminoma (a radioresistant tumour) --- hCG positive 50% (AFP 66%)
. Prognostic
--- Nonseminoma
. hCG > 10 000mLU/mL¼ 53% 3 year survival
. hCG <1 000mLU/mL¼ 85% 3 year survival
--- Seminoma
. 80---97% overall survival
. Monitor
--- Levels correspond to therapy
--- Persistent or resurgent levels¼ resistance/recurrence
Gestational trophoblastic disease (GTD)
--- Including hydatidiform mole
--- Partial molar pregnancy
--- Placental site tumour
--- Choriocarcinoma
hCG for this disease is virtually an ideal tumour marker:
.Diagnostic --- In youngwomen it is generally diagnostic of GTD if not fromanyother source (e.g. pregnancy) and
all GTD will produce hCG
A CSF: serum ratio of greater than 1: 60 is indicative of brain metastasis
. Prognostic --- the higher the levels the higher the tumour burden
High pretreatment levels¼ poor prognosis
. Monitor
--- Levels correspond to therapy
--- Persistent or resurgent levels¼ resistance/recurrence
258 Biomedical sciences

recurrent disease prior to other clinical symptoms or
imaging measures.
In monitoring GTD response to chemotherapy
hCG has proven invaluable, as all GTDs express hCG
and at high levels patients are monitored for response
to therapy almost daily until in remission defined
as hCG not detected for three consecutive weeks.
They are then monitored by hCG serum assay every
2 weeks for 6 months then monthly for 5 years. Levels
of hCG determine when and how chemotherapy is
administered and in the absence of clinically apparent
disease, persistently elevated serum hCG reflects the
existence of microtumours that if untreated will
progress clinically.
Bibliography
Marshall, W.J. and Bangert, S.K. (2008) Clinical Chemistry,
6th edn, Mosby.
Gaw,A. et al. (2008)Clinical Biochemistry, 4th edn, Churchill
Livingstone.
Hughes, J. and Jefferson, J.A. (2008)Clinical ChemistryMade
Easy, 1st edn, Churchill Livingstone.
Chapter 5 Clinical chemistry 259


Chapter 6
Medical microbiology
Dr Sarah J. Furrows, MBBS, M.Sc., MRCP, FRC Pathand Catherine S. Fontinelle, B.Sc. Hons., ARCS, FIBMS, CSci
Introduction
Microbiology, the study of microorganisms, is both a
clinical speciality and a study of natural history. Mi-
croorganisms existed long before human beings and
are an integral part of our everyday existence. If an alien
were to land on Earth and study us, it is doubtful
whether he would even recognize our bodies as human
--- our bodies contain 100 000 000 000 000 microbial
cells, which is approximately 100 times more than the
number of human cells in our bodies. These normal
flora, often described as ‘friendly bacteria’, are wide-
spread in our mouth, intestines and skin and act, as
part of the skin, as a barrier to infection,
Microorganisms may be beneficial in other ways.
They are essential in industry for fermentation pro-
cesses used to make alcohol, cheese, yoghurt and
vinegar, and are used routinely in food waste and
sewage treatment.
Medical microbiology is a rapidly developing field,
which incorporates the study of microorganisms
along with their impact on the human body and the
range of treatments available. In the 300 years since
bacteria were first identified under a microscope,
hundreds of bacteria of medical importance have
been described. In addition there are viruses, fungi,
protozoa, parasites and prions, all of which may
cause disease.
Formerly a backroom or ‘Cinderella’ speciality,
microbiology has been thrust into the limelight in
recent years, largely due to a resurgence of public
interest in ‘superbugs’ such as meticillin-resistant
Staphylococcus aureus (MRSA) and Clostridium difficile
(Box 6.1). Add to this the emergence of pathogens from
animal reservoirs such as swine influenza and SARS
(severe acute respiratory syndrome), travel-associated
infections, and the continuing threat from old enemies
such as tuberculosis, and it is clear that microbiology
will remain a busy speciality for the foreseeable future.
6.1 Overview ofmicroorganisms
Cells can be divided into two kinds: prokaryotic (where
the DNA is free within the cell) and eukaryotic (where
the DNA is kept within a nucleus). Bacteria are pro-
karyotes. Eukaryotic pathogens include protozoa,
yeasts andmulticellular organisms such as tapeworms.
Viruses do not have cells but instead enter the cell of the
host organism. Table 6.1 gives an overview of com-
monly encountered cellularmicroorganisms, classified
Biomedical Sciences: Essential Laboratory Medicine, First Edition. Edited by Ray K. Iles and Suzanne M. Docherty.� 2012 John Wiley & Sons, Ltd. Published 2012 by John Wiley & Sons, Ltd.
261
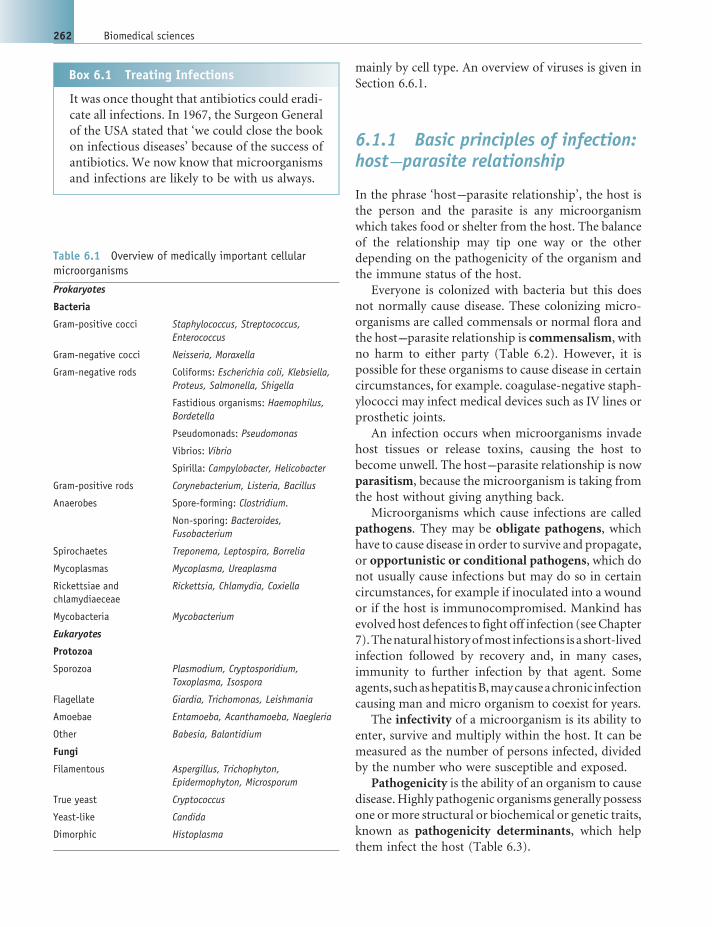
mainly by cell type. An overview of viruses is given in
Section 6.6.1.
6.1.1 Basic principles of infection:host---parasite relationship
In the phrase ‘host---parasite relationship’, the host is
the person and the parasite is any microorganism
which takes food or shelter from the host. The balance
of the relationship may tip one way or the other
depending on the pathogenicity of the organism and
the immune status of the host.
Everyone is colonized with bacteria but this does
not normally cause disease. These colonizing micro-
organisms are called commensals or normal flora and
the host---parasite relationship is commensalism, with
no harm to either party (Table 6.2). However, it is
possible for these organisms to cause disease in certain
circumstances, for example. coagulase-negative staph-
ylococci may infect medical devices such as IV lines or
prosthetic joints.
An infection occurs when microorganisms invade
host tissues or release toxins, causing the host to
become unwell. The host---parasite relationship is now
parasitism, because the microorganism is taking from
the host without giving anything back.
Microorganisms which cause infections are called
pathogens. They may be obligate pathogens, which
have to cause disease in order to survive and propagate,
or opportunistic or conditional pathogens, which do
not usually cause infections but may do so in certain
circumstances, for example if inoculated into a wound
or if the host is immunocompromised. Mankind has
evolved host defences to fight off infection (seeChapter
7).Thenaturalhistoryofmost infections is a short-lived
infection followed by recovery and, in many cases,
immunity to further infection by that agent. Some
agents, suchashepatitisB,maycauseachronic infection
causing man and micro organism to coexist for years.
The infectivity of a microorganism is its ability to
enter, survive and multiply within the host. It can be
measured as the number of persons infected, divided
by the number who were susceptible and exposed.
Pathogenicity is the ability of an organism to cause
disease.Highly pathogenic organisms generally possess
one ormore structural or biochemical or genetic traits,
known as pathogenicity determinants, which help
them infect the host (Table 6.3).
Box 6.1 Treating Infections
It was once thought that antibiotics could eradi-
cate all infections. In 1967, the Surgeon General
of the USA stated that ‘we could close the book
on infectious diseases’ because of the success of
antibiotics. We now know that microorganisms
and infections are likely to be with us always.
Table 6.1 Overview of medically important cellularmicroorganisms
Prokaryotes
Bacteria
Gram-positive cocci Staphylococcus, Streptococcus,
Enterococcus
Gram-negative cocci Neisseria, Moraxella
Gram-negative rods Coliforms: Escherichia coli, Klebsiella,
Proteus, Salmonella, Shigella
Fastidious organisms: Haemophilus,
Bordetella
Pseudomonads: Pseudomonas
Vibrios: Vibrio
Spirilla: Campylobacter, Helicobacter
Gram-positive rods Corynebacterium, Listeria, Bacillus
Anaerobes Spore-forming: Clostridium.
Non-sporing: Bacteroides,
Fusobacterium
Spirochaetes Treponema, Leptospira, Borrelia
Mycoplasmas Mycoplasma, Ureaplasma
Rickettsiae and
chlamydiaeceae
Rickettsia, Chlamydia, Coxiella
Mycobacteria Mycobacterium
Eukaryotes
Protozoa
Sporozoa Plasmodium, Cryptosporidium,
Toxoplasma, Isospora
Flagellate Giardia, Trichomonas, Leishmania
Amoebae Entamoeba, Acanthamoeba, Naegleria
Other Babesia, Balantidium
Fungi
Filamentous Aspergillus, Trichophyton,
Epidermophyton, Microsporum
True yeast Cryptococcus
Yeast-like Candida
Dimorphic Histoplasma
262 Biomedical sciences
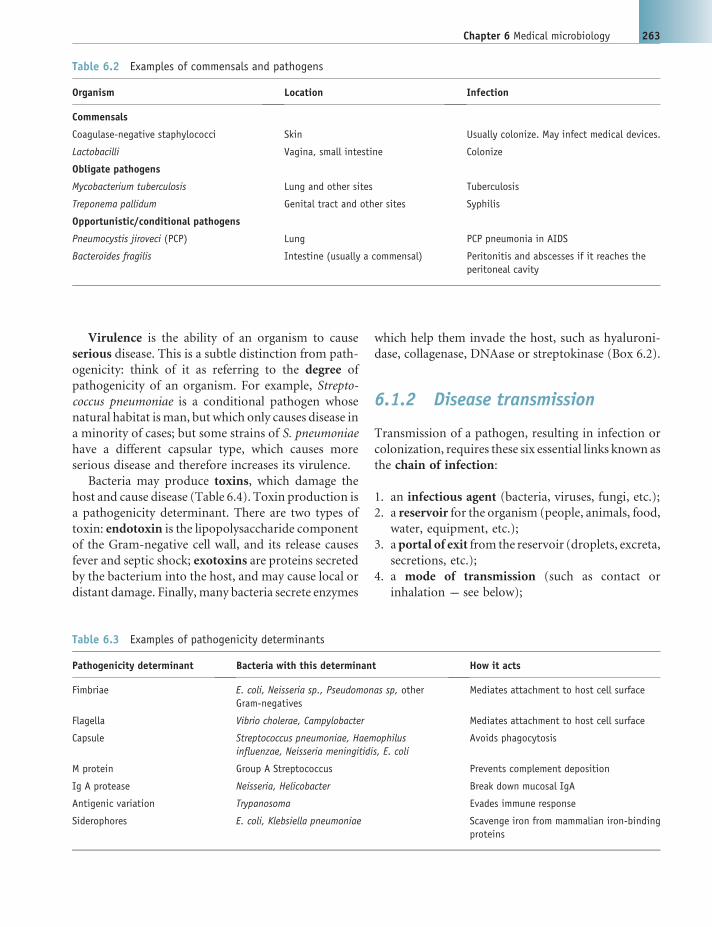
Virulence is the ability of an organism to cause
serious disease. This is a subtle distinction from path-
ogenicity: think of it as referring to the degree of
pathogenicity of an organism. For example, Strepto-
coccus pneumoniae is a conditional pathogen whose
natural habitat isman, but which only causes disease in
a minority of cases; but some strains of S. pneumoniae
have a different capsular type, which causes more
serious disease and therefore increases its virulence.
Bacteria may produce toxins, which damage the
host and cause disease (Table 6.4). Toxin production is
a pathogenicity determinant. There are two types of
toxin: endotoxin is the lipopolysaccharide component
of the Gram-negative cell wall, and its release causes
fever and septic shock; exotoxins are proteins secreted
by the bacterium into the host, and may cause local or
distant damage. Finally, many bacteria secrete enzymes
which help them invade the host, such as hyaluroni-
dase, collagenase, DNAase or streptokinase (Box 6.2).
6.1.2 Disease transmission
Transmission of a pathogen, resulting in infection or
colonization, requires these six essential links known as
the chain of infection:
1. an infectious agent (bacteria, viruses, fungi, etc.);
2. a reservoir for the organism (people, animals, food,
water, equipment, etc.);
3. aportal of exit from the reservoir (droplets, excreta,
secretions, etc.);
4. a mode of transmission (such as contact or
inhalation --- see below);
Table 6.2 Examples of commensals and pathogens
Organism Location Infection
Commensals
Coagulase-negative staphylococci Skin Usually colonize. May infect medical devices.
Lactobacilli Vagina, small intestine Colonize
Obligate pathogens
Mycobacterium tuberculosis Lung and other sites Tuberculosis
Treponema pallidum Genital tract and other sites Syphilis
Opportunistic/conditional pathogens
Pneumocystis jiroveci (PCP) Lung PCP pneumonia in AIDS
Bacteroides fragilis Intestine (usually a commensal) Peritonitis and abscesses if it reaches the
peritoneal cavity
Table 6.3 Examples of pathogenicity determinants
Pathogenicity determinant Bacteria with this determinant How it acts
Fimbriae E. coli, Neisseria sp., Pseudomonas sp, other
Gram-negatives
Mediates attachment to host cell surface
Flagella Vibrio cholerae, Campylobacter Mediates attachment to host cell surface
Capsule Streptococcus pneumoniae, Haemophilus
influenzae, Neisseria meningitidis, E. coli
Avoids phagocytosis
M protein Group A Streptococcus Prevents complement deposition
Ig A protease Neisseria, Helicobacter Break down mucosal IgA
Antigenic variation Trypanosoma Evades immune response
Siderophores E. coli, Klebsiella pneumoniae Scavenge iron from mammalian iron-binding
proteins
Chapter 6 Medical microbiology 263

5. a portal of entry into the body (respiratory tract,
broken skin, etc.);
6. a susceptible host (infections are more likely in the
immunosuppressed, very young or very elderly).
Each link must be present for infection or coloni-
zation to proceed. Breaking any of these links can
prevent the infection. The easiest link to break is the
mode of transmission, and infection control measures
such as isolation and hand hygiene are aimed at
breaking this link. Modes of transmission include
the following.
Contact transmission: the commonest mode in
healthcare settings. Contact transmission may be
subdivided into:
Direct contact: direct person-to-person spread of
microorganisms through physical contact. Exam-
ples --- transfer during a dressing change or inser-
tion of invasive device, if the healthcare worker
had not cleaned their hands; or skin-to-skin
contact can spread scabies or herpes simplex.
Hand hygiene can prevent transmission by direct
contact.
Indirect contact: occurs when a susceptible person
comes in contact with a contaminated object
(fomite). This may be equipment such as endo-
scopes,orawardarea contaminatedwithMRSAor
Clostridium difficile. All healthcare settings should
ensure correct cleaning of their environment
and equipment, and disinfection or sterilization
of equipment where appropriate, to prevent
transmission by this route.
Droplet transmission: results from contact with con-
taminated respiratory secretions. Respiratory dro-
plets are generated by coughing, sneezing, talking,
suctioning and bronchoscopy. Droplets can travel
up to 1m and will then settle on surfaces, where the
organisms may survive for some time. Examples of
diseases spread by droplets include influenza and
whooping cough.
Airborne transmission: occurs when small particles
containing pathogens are expelled (usually from the
respiratory tract), suspended in the air for a pro-
longed period, then spread widely by air currents
Table 6.4 Some important toxins
Organism Toxin Effect of toxin
Staphylococcus aureus Toxic shock syndrome toxin Toxic shock syndrome
Epidermolytic toxin Scalded-skin syndrome
Enterotoxins Food poisoning
Leucocidin Lyses blood cells
Group A streptococcus Streptolysins O and S Lyses blood cells
Erythrogenic toxins Fever and rash
Clostridium difficile C. difficile toxins Aþ B Diarrhoea and colitis
Clostridium botulinum C. botulinum toxin A Prevents release of acetylcholine at neuromuscular
junction, causing flaccid paralysis
Clostridium tetani Tetanus toxin Inhibits neurotransmitter release, causingmuscle spasms
Corynebacterium diphtheriae Diphtheria toxin Mucosal necrosis, airway obstruction and systemic
toxicity
E. coli 0157 Vero toxins VT1 and VT2 Diarrhoea, haemolytic uraemic syndrome
Shigella Shiga toxin Dysentery
Box 6.2 Streptokinase
Streptokinase is produced by Group A strepto-
coccus. It activates host plasminogen to plasmin,
which stops fibrin barriers building up and helps
the infection to spread. This is why Group A
streptococcal soft tissue infections spread so
rapidly. On the plus side, streptokinase was used
for many years as thrombolytic therapy for
patients with myocardial infarction, because of
its ability to dissolve blood clots.
264 Biomedical sciences

and inhaled. Examples of diseases spread by the
airborne route include pulmonary tuberculosis,
varicella and measles.
6.2 Laboratoryinvestigation of infection
Practical microbiology is all about the investigation of
infection, and the classification and naming of micro-
organisms are largely based around their reactions in
common tests. For this reason, laboratory investiga-
tions are described at the beginning of this chapter. It is
not necessary to read this whole section at once: parts
of it may make more sense if you dip in and out, and
crossrefer to the section on specific organisms.
Almost any tissue or body fluid may be investigated
in the laboratory. Most investigations rely on micros-
copy with or without stains, culture, colonial mor-
phology on agar and biochemical tests. Organisms that
are difficult to grow may be detected by nucleic acid
amplification tests (NAATs), or the immune response
to infection may be detected by serological methods.
6.2.1 Specimen collection
Samples must always be clearly labelled with at least
two patient identifiers (such as name, date of birth,
hospital or NHS number) and should also have:
. name of ward or GP practice;
. date and time of collection;
. contact details for requesting doctor;
. description of sample (culture site);
. relevant clinical details;
. antibiotic therapy details.
It is essential that the correct sample is sent for a test,
otherwise the quality of the results will be affected. For
example, a sputum sample is not worth investigating if
it is clearly salivary, as it cannot have originated from
the lungs and therefore any culture results would be
uninterpretable. Another notorious example is the ‘pus
swab’ --- if there is an abscess, it is better to send a
sample of pus in a sterile container rather than a swab
of the pus. If in doubt, the clinician should check with
the laboratory before sending a sample.
“If identification is an issue
Forget the swab and send some tissue.”
6.2.2 Types of sample
Swab samples are taken from a range of body sites
including eyes, ears, throat, skin and the vagina. Bac-
terial swabs come with the transport medium inside
the accompanying tube to allow the bacteria present in
the sample to survive, in the same numbers, long
enough to reach the laboratory. Viral swabs come with
a sponge-like section that contains a variety of anti-
biotics that prevent bacterial overgrowth and preserve
the virus on the swab.
Sample pots are available in a variety of sizes, most
commonly 30mL, 60ml and 250ml. The small 30mL
pots are used for urine, semen, catheter tips and faeces
collection, and occasionally for nail clippings; howev-
er, specialist dark-coloured paper envelopes are avail-
able for this sample type. The 60mL pots are most
commonly used for sputum samples, although urine is
often sent in these containers as the opening is wider
and more convenient for the patient. Unfortunately
the urine processing racks are designed for the smaller
pot and 60mL pots can seriously unbalance a tray! The
larger 250ml containers are most commonly used for
early morning urine samples (EMU), where the entire
EMU is collected to investigate for TB but these con-
tainers are also used for tissue and graft samples
(Figure 6.1).
Blood cultures are one of the more important
samples received by the laboratory. These are used
to detect the presence of microorganisms in the blood
(bacteraemia or fungaemia) and are usually only taken
from unwell, febrile patients. Blood culture bottles
contain liquid media with suitable nutritional and
environmental conditions to allow bacteria to grow,
together with an indicator system to show when the
bottle is positive. There are many different types of
blood culture system on the market, from bottles
containing liquid and solid media, which allows the
user to subculture the bottle just by tilting it, to bottles
loaded onto large machines (Figure 6.2). The latter
bottles are continuously monitored so that when a
positive is detected, by a change in the colorimetric
sensor on the bottom of the bottle due to the produc-
tion of CO2 by microbial growth, the machine can
alert laboratory staff to the new positive and allow it to
be dealt with promptly and efficiently. The liquid in
the blood culture bottles contains: complex media
including amino acids, protein and growth factors;
CO2 under vacuum, to allow the correct amount of
blood (usually 8---10ml) to be drawn into the bottle
Chapter 6 Medical microbiology 265

when attached to blood collection systems; and occa-
sionally beads or charcoal to counteract the effect of
any antibiotics already in the patients’ blood. Differ-
ent bottle types are available. Most commonly, one
aerobic and one anaerobic bottle are used (Box 6.3).
Paediatric bottles are designed to deal with small
volumes of sample and are usually sent singly. Myco-
bacterial and fungal blood culture bottles are also
available.
6.2.3 Basic handling principles
It is important when processing a sample that nothing
contaminates it whilst it is being handled in the
laboratory. This is called aseptic technique.
There are several common methods of reducing
bacterial contamination.
1. Use of correctly flamed wire loops for inoculating
and spreading agar plates, or plastic disposable
loops. When decontaminating a wire loop, hold it
above the Bunsen at a downwards angle of approx-
imately 30� so that the wire is red hot all the way upto the join with the handle (Figure 6.3).
2. Sterile plastic pipettes often come in packets of 10,
but rarely in singles. A new packet should be opened
when dealingwith a sterile fluid, such as a CSF, as an
Figure 6.1 (a) A selection of sample containers and (b)blood culture bottles belonging to two different automatedsystems
Figure 6.2 (a) Blood culture system and (b) system show-ing bottles inside
Box 6.3 Blood culture pitfalls
Beware the blood culture set arriving in the
laboratory with plastic covers over the septa ---
these are uninoculated!
266 Biomedical sciences

opened packet may have become contaminated
with bacteria.
3. The neck of a glass bottle should be flamed before
transferring any liquid into or out of it.
4. Never return any unused sample to its original
container. If it is to be kept, it must be put into a
fresh container so as not to contaminate the
remainder.
5. When subculturing a fluid never dip the loop more
than 1 cm into the sample. This avoids crossconta-
mination due to poor flaming.
6.2.4 Sample processing
Once all the basic checks have taken place (name,
hospital number, date of birth) the samples are labelled
and are ready for processing. This takes place in
three stages.
1. Visual inspection of the sample for any clues to
diagnosis. Examples include the presence of tape-
worm segments in a faecal sample, or sulphur gran-
ules on an IUCD indicating a potential actinomyces
infection. Visual inspection also gives an indication
of the quality of sample that has been received. For
example, a salivary specimenof sputum, if processed
at all, should have its description noted so that the
results may be considered accordingly. Comments
are recorded of any visual clues found.
2. Microscopy --- there are three commonly used
microscopic techniques in routine laboratories:. light microscopy to look at direct preparations or
stained slides;. phase contrast microscopy using a special con-
denser and objective, to look at direct prepara-
tions for organisms with flagella;. fluorescencemicroscopy using ultraviolet light to
look at fluorescent stains, for example, for acid
fast bacilli.
Other microscopic techniques include polar-
izing microscopy, darkground microscopy and
electron microscopy.
The most common stain used in micro-
biology is the Gram stain. This divides bacteria
into two groups, Gram-positive or Gram-
negative, and is a fundamental part of bacterial
identification.3. Culture --- media used to isolate bacteria may
contain water, electrolytes, protein, vitamins, blood
and agar.
Liquid culturemedia are used to enrich low bacteria
numbers in some samples. It is of additional benefit in
that any inhibitors present in the sample, such as
antibiotics, are diluted and have less effect on bacterial
growth. As liquid media often needs to be subcultured
it does cause a delay in the isolation and identification
of some bacteria (Table 6.5).
Solid media contains agar as a gelling agent, which
does not set until it reaches 40 �C. This feature allowstemperature sensitive factors, such as antibiotics, to be
added as the molten agar cools (Table 6.6). Solid agar
can be enriched to enhance the growth of nutritionally
demanding bacteria, or it can be selective so that only
certain groups of bacteria grow (Figure 6.4).
The choice of agar used varies with the different
samples processed in the laboratory. This is because
each site on the surface of the human body has its own
mix of normal flora. The function of themedia selected
is to enable the biomedical scientist to find the patho-
genic bacteria that may be present.
In some samples, such as CSF and joint fluids,
there should be no bacteria present and any bacteria
isolated will be considered significant. In contrast,
Put the loop into thehottest part of the flame.Make sure the length ofthe wire has become ‘red’ hot.
Figure 6.3 Decontaminating a wire loop
Chapter 6 Medical microbiology 267

with faeces samples the laboratory is very specific
about the bacteria being investigated and will often
only be looking for salmonellae, shigellae, E. coli 0157
and Campylobacter, so the chosen media reflect this
need.
Once the plates are inoculated, they are streaked out
using wire or plastic loops and incubated. Some plates
may have additional diagnostic discs added to them
before incubation, such as metronidazole, used to
detect anaerobes, and optochin to identify S. pneumo-
niae in a sample of sputum.
MRSA selective agar uses the phosphatase enzyme
activity of the organism, together with specific antibi-
otic agar components, enabling the organism to
be identified as blue colonies (Figure 6.5). Other
Table 6.5 Common liquid media and their uses
Common liquid media Use
Selenite F Enriches the growth of nonlactose fermenting coliforms by suppressing the growth of other coliforms
Brain heart infusion (BHI) Enriches the growth of bacteria in fluids that should be sterile
Robinson’s cooked meat (RCM) As BHI and also enhances the growth of anaerobic bacteria
MRSA selective broth Colour change to yellow indicates a potential positive that requires follow-up. No colour change
indicates a negative screen and can be reported
Table 6.6 Common solid media and their uses
Common solid media Use
Blood agar Grows most bacteria
Fastidious anaerobe agar (FAA) Enhances growth of anaerobic bacteria
Chocolate agar (Box 6.4) Grows bacteria such as Haemophilus spp. and Neisseria gonorrhoeae that require
extra nutrients present inside the red blood cell
MacConkey Contains lactose and phenol red. Grows coliforms, staphylococci and some
streptococci
Xylose lysine desoxycholate (XLD) Selective media for salmonellae and shigellae
Desoxycholate citrate agar Selective media for salmonellae and shigellae
Cystine-lactose electrolyte deficient medium (CLED) Contains lactose and bromothymol blue. Grows coliforms, staphylococci and
some streptococci
Box 6.4 Chocolate agar
Unfortunately, chocolate agar plates are not
made from chocolate. Instead the agar is
‘chocolatized’ by heating at a higher temperature
than usual. This lyses (bursts) the red blood cells
present and releases extra nutrients --- maybe it
should be called gravy agar instead!
Figure 6.4 Selection of culture plates used on the faecesbench
Box 6.5 Chromogenic agar
Chromogenic agar is a commercially available
agar that produces specific colour changes to
help the user identify bacteria grown on these
plates.
268 Biomedical sciences

chromagar can differentiate between common coli-
forms isolated from urine, or species of yeasts with
Candida albicans growing as purple colonies (Box 6.5).
6.2.5 Enumeration techniques
A link has been established between the number of
organisms and the number of white blood cells (or,
indeed, red blood cells) in a sample as an indicator of
disease.
6.2.5.1 Enumeration of cultures
The most common sample tested for bacterial num-
bers is urine. Urine samples are often contaminated by
flora from the external genitalia as patients are rarely
advised of the correct method of specimen collection.
A level of ‘significant bacteruria’ of > 105 organisms/
ml was established by Kass to determine the number
of bacteria required to be present to indicate an
infection.
There are three common methods used in the
routine laboratory to enumerate bacteria in urine.
1. A 1mL loop of urine spread onto solid agar (CLED,
MacConkey or chromogenic agar); 10 colonies of
growth will correspond to 10� 1000 mL¼ 104 orgs/
mL, therefore 100 colonies corresponds to
100� 1000 mL, or 105 orgs/mL (Figure 6.6).
2. Sterile filter paper strips are dipped into the urine,
allowed to soak in, and pressed onto solid agar (as
above). The surface area is of a standard size and
therefore the number of organisms per mL can
be calculated.
3. Semiautomated machines, such as the iQ200 Auto-
mated Urine Microscopy Analyzer (from Iris
Diagnostics) and the Sysmex UF Series Analyzers
(developed by Biomerieux and Sysmex Corp) allow
large numbers of urines to be screened. These use
digital image recognition and fluorescence and
forward scatter of light to detect the number of
bacteria present.
6.2.5.2 Enumeration during microscopy
A significant level of white blood cells (WBC) has been
established in samples of cerebrospinal fluid (CSF),
ascitic fluid (ASF), peritoneal dialysis fluid (PDF) and
urine (National Standard Methods, Health Protection
Agency; see Table 6.7). It should be noted that immu-
nocompromised patients may not produce WBC in
these ranges.
There are three commonmethods of counting cells.
1. White blood cell counts in nonrepeatable samples,
that is CSF, ASF and PDF, are determined using
counting chambers of known surface area, such as
Neubauer and Fuchs---Rosenthal. These aremade of
glass and are reusable. A small amount of the fluid is
loaded into the chamber. Under the microscope a
grid of known area can be seen and the number of
WBC inside the grid can be converted into the
Figure 6.5 MRSA growing on a chromogenic agar plate Figure 6.6 CLED plates on the urine bench
Table 6.7 Positive cell counts
Sample CSF ASF PDF Urine
WBC/mL 5* 250 100 100
*The normal ranges of WBC in CSF vary with the patients’ age.
Chapter 6 Medical microbiology 269

number of WBC/mL (Figure 6.7). Plastic disposablecounting chambers are available to usewith samples
from patients with CJD.
2. The most common method of enumerating cells is
using an inverted microscope and flat bottomed
wells to calculate the cells present in urine samples.
A known volume (60mL) of urine is added and
allowed to settle. As the surface area of the well is
known, it is possible to calculate thenumberofWBC
and RBC/microlitre. This technique allows the op-
erator to read 96 samples in one sitting. At least
200---300 samples of urine will be scrutinized in
an average microbiology department every day
(Figure 6.8).
3. Semiautomated machines, such as the iQ200 and
the Sysmex UF Series, count cells using digital
image processing and fluorescent and forward scat-
ter of light.
6.2.6 Bacterial sensitivity testing
Once a bacterium has been identified as a pathogen it is
necessary to ascertain the correct antibiotic treatment
required to effect a cure. There are many methods of
decidingwhether a bacterium is sensitive or resistant to
an antibiotic, but currently there are four common
methods in use: Stokes’ controlled sensitivity testing,
BSAC (British Society for Antimicrobial Chemothera-
py) sensitivity testing, MIC (minimum inhibitory
concentration) testing and automated sensitivity
testing.
In Stokes’ controlled sensitivity testing a suspen-
sion of the test bacteria is spread onto the inner part of
an agar plate (usually isosensitest or direct sensitivity
test agar) and a control organism is spread around the
outside edge (Figure 6.9). Filter paper discs impreg-
nated with antibiotics are placed where the two organ-
isms almost meet. After overnight incubation, the
zone sizes are compared. If the zone size of the test
organism is larger than the control organism, the
antibiotic is considered sensitive. If it is more than
3mm smaller than the control zone, then it is con-
sidered resistant. Stokes’ method is no longer widely
used --- the main drawback was that the organism used
for comparison was often not the same genus as the
test organism.
More recently laboratories have adopted the BSAC
method of sensitivity testing (Figure 6.10). A standard-
ized inoculum is prepared using a densitometer. The
suspension is spread over an entire agar plate, each
organism having a recommended sensitivity agar to be
used, temperature and atmosphere to be incubated in.
Filter paper discs impregnated with antibiotics are
Figure 6.7 (a) Fuchs---Rosenthal counting chamber and (b)inverted microscope for urine microscopy
Figure 6.8 Pipette with tips and microtitre tray
270 Biomedical sciences

added and the zone sizes measured after overnight
incubation. Each genus of bacteria (and sometimes
species) has its own zone sizes allocated to it. If the zone
is smaller then the antibiotic is considered resistant.
TheMIC is the lowest concentration of an antibiotic
required to inhibit growth of an organism. Knowledge
of the MIC allows the clinician to determine the
quantity of an antibiotic required to treat an infection,
as well as choose one that the pathogen will be suscep-
tible to: the infection should respond to treatment
provided that levels of antibiotic in blood are equal
to or higher than the MIC. MIC testing is performed
for organisms causing endocarditis or other difficult-
to-treat infections. Themost commonmethod ofMIC
determination is by use of E-test strips (Box 6.6 and
Figure 6.11). These E-tests are small strips of ‘paper’
impregnated with different concentrations of antibi-
otic along its length. Growth appears, after overnight
incubation, as an ellipse. The point at which the growth
touches the strip is (usually) considered to be theMIC.
This does vary in interpretation with yeasts, when
double zones appear.
Automated systems are available in two main
types --- SIR systems (sensitive, intermediate, resistant)
andExpert systemswhich useMIC ranges to determine
results. The British Society for Antimicrobial Chemo-
therapy (BSAC) and the Clinical and Laboratory Stan-
dards Institute (CLSI) each publish MIC ranges for
different organisms. These are different from each
other and the rule base used by each laboratory can
be fed into the automated system to produce results
that follow local guidelines.
Identification of an organism takes between 5 and
18 h. A suspension of the organism is added to a test
card,with the card type chosenbased on theGram stain
result or on the organism type, such as yeasts or anae-
robes. The wells in the card contain different concen-
trations of antibiotics or identification tests (Figure
6.12). These systems also include tests to determine
specific resistancemechanisms, such as extended spec-
trum beta-lactamase production (ESBL).
6.2.7 Biochemical tests
Bacteria can be identified by the various sugar and
other biochemical reactions that they perform and
these reactions have been commercially produced for
various bacterial groups, for example, staphylococci.
Control organism
Test organism
Antibiotic paper discs
Sensitiveto this
antibiotic
Resistantto this
antibiotic
Figure 6.9 Stokes sensitivity testing
Figure 6.10 BSAC sensitivity testing
Chapter 6 Medical microbiology 271

A suspension of the test organism is added to a series of
small chambers, containing dehydrated substrates for
several reactions, in a strip form. The reactions are
converted into a numerical profile. The profile can be
compared to a database to establish identity of the
organism. This is more convenient than performing
each test individually, and is cheaper than automated
identification systems.
Auramine stain --- flood a fixed smearwith auramine
solution for 10min, rinse with water then decolourize
with 1% acid---alcohol for 5min. Rinse with water then
counterstain with potassium permanganate for 1min.
Wipe dry the back of the slide and air dry in a rack.
Never blot an auramine stain as fibres transferred from
the filter paper may give false positive results. Myco-
bacteria and cryptosporidium are auramine positive.
Beta-lactamase is an enzyme that can split beta-
lactam rings. Nitrocefin discs are moistened and the
test organism rubbed onto it. A red colouration in-
dicates a positive result. N.B. Some coliforms only
produce beta-lactamase in the presence of other anti-
biotics, such as cefoxitin and imipenem. This is known
as an inducible class 1 beta-lactamase and requires disc
testing to detect its presence. A seeded agar plate has
cefoxitin and cefotaxime discs added. A reduced zone
between the discs, characterized by a flattened edge,
indicates this resistance mechanism.
Bile-aesculin is hydrolysed by enterococci and Lis-
teria, producing black colouration in the media.
Bile-solubility is a method of identifying Streptococ-
cus pneumoniae. A drop of 10% sodium deoxycholate
solution is added to a suspicious colony and allowed to
dry. The colony will dissolve if it is S. pneumoniae.
Catalase is an enzyme which splits hydrogen per-
oxide into water and oxygen. To perform a catalase
test, the bacteria are brought into contact with hydro-
gen peroxide, and will produce oxygen bubbles if
positive. The test is always performed in a capillary
tube or under a cover slip, which traps oxygen bubbles
Whole plate seeded withtest organism
E-test stripAntibiotic concentration
at its largest
MIC ismeasured at
the point the ellipsetouches the strip
Antibioticconcentration
at its wemost dilute
Figure 6.11 E-test
Box 6.6 E is for.....
E-test stands for Epsilometer test and refers to
the elliptical shape of the zone around the test
strip.
Figure 6.12 Vitek system for bacterial identification andsensitivity
272 Biomedical sciences

and minimizes aerosol formation. Care must be taken
not to pick up any agar as it may crossreact. Catalase
positive --- staphylococci, catalase negative ---
streptococci.
Coagulase is an enzyme which causes plasma to
coagulate. Coagulase testing can be performed by latex
agglutination on a card, or by mixing the bacteria with
plasma in a tube, where a visible clot is formed.
Coagulase positive --- Staphylococcus aureus, coagulase
negative --- coagulase negative staphylococci (some-
times inaccurately called Staphylococcus epidermidis).
DNAase is also present in S. aureus and is often used
as a confirmatory test. The test organism is inoculated
onto media containing nucleic acids, and a zone of
clearing indicates a positive result.
Gram stain --- Flood a fixed smear with crystal violet
for 1min, rinse with tap water, then flood with Lugol’s
iodine for one minute. Add acetone for 2---3 s, then
quickly rinse and add the counterstain, usually dilute
carbol fuchsin, for 1min, then rinse with tap water.
Wipe the back of the slide, and dry the front by pressing
firmly into filter paper. Allow to air dry. It is thought
that Gram-positive bacteria retain the crystal violet
stain because of the large amount of peptidoglycan and
teichoic acid in the cell wall. The iodine step is used to
fix the crystal violet stain into place.
Indole --- The hydrolysis of tryptophan by trypto-
phanase produces indole. A solution of p-dimethyl
aminocinnamaldehyde (DMACA) and hydrochloric
acid is placed onto filter paper and a colony rubbed
onto it. A positive result is indicated by a blue/green
colour being formed. Indole positive organisms in-
clude E. coli and Providentia, indole negative organ-
isms include Serratia and Salmonella.
Lecithinase activity is demonstrated by inoculating
media containing egg yolk, such as a Nagler plate, and
incubating overnight. A zone of opacity is formed
around lecithinase producing colonies. A positive
reaction is seen with Clostridium perfringens and
Bacillus anthracis.
Oxidase --- A swab or piece of filter paper soaked in
oxidase reagent (p-aminodimethylaminoxalate) is ap-
plied to a colony. A positive result is a change from
clear to purple. This is due to the production of
iodophenol. Oxidase positive organisms include Pseu-
domonas, Moraxella, Neisseria and Haemophilus. Oxi-
dase negative organisms include Salmonella, Shigella
and Proteus.
Streptococcal grouping uses enzyme extraction, or
acid extraction, to differentiate between the different
groups of beta-haemolytic streptococci. Group D
streptococci have protein on the cell wall, the other
groups have either polysaccharide or teichoic acid. The
sixmost common groups are screened for ---A, B, C, D,
F and G. Six drops of enzyme are mixed with a few
colonies of the organism and incubated for 10min at
37 �C. The solution is then mixed with latex relating to
each of the groups as a slide agglutination test. All six
latexes must be tested as some streptococci will react
with more than one of the latexes.
Tributyrin testing is used to confirm the identifica-
tion of Moraxella catarrhalis. It is a test looking for
butyrate esterase activity. A tributyrin disc is added to a
suspension of the organism in saline. Positives turn the
solution yellow after 2---4 h at 37 �C.Urease splits urea to produce ammonia. Bacteria are
inoculated on to media containing urea and a pH
indicator such as phenol red. Ammonia production
by urease positive organisms turns the medium alka-
line. Urease positive organisms include Proteus, Heli-
cobacter pylori and Cryptococcus neoformans.
6.2.8 Molecular methods
The most commonly used molecular method is poly-
merase chain reaction (PCR). The RNA or DNA
genome of the pathogen is amplified using primers
and polymerase (Figure 6.13). This technique is very
useful for the detection of organisms which are diffi-
cult, slow or dangerous to grow. PCR can also be used
to detect antibiotic resistance genes or to quantify viral
load. Methods such as PCR, which amplify nucleic
acids prior to detection, are called nucleic acid ampli-
fication methods (NAATs). Examples of NAATs in
Figure 6.13 ProbeTec system for NAAT
Chapter 6 Medical microbiology 273

common use include Chlamydia trachomatis, TB and
herpesvirus PCRs. Other molecular methods include
Southern blot, Western blot and 16S sequencing.
16S RNA is part of the small ribosomal subunit and
is highly conserved between species. It can be amplified
by reverse transcriptase PCR (RT-PCR) and then
sequenced to identify the bacterium. This is a useful
technique for bacteria that cannot be grown in culture.
For example, a patient with empyema (chest infection
with a collection of infected fluid around the lung) will
often receive antibiotics before the fluid is drained. The
bacteria in the pleural fluid sample are antibiotic-
damaged and may not grow by conventional culture
methods, but can be identified by 16S.
6.2.9 Serological tests
Serological testing detects the immune response to a
pathogen. Most commonly we look for IgM, IgG or
both. Serology is used to detect many viral infections
and also for other difficult-to-grow organisms such as
Toxoplasma, Chlamydia, Mycoplasma, Coxiella, Heli-
cobacter and Borrelia. Methods include latex aggluti-
nation, enzyme immunoassay, complement fixation
and single radial haemolysis. Most laboratories are
moving away from traditional labour-intensive assays
towards automated systems.
6.2.10 Antibiotic assays
Antibiotic assays involve taking a sample of blood (or
rarely other body fluids) and measuring the concen-
tration of antibiotic in it. Most antibiotics are well
tolerated by patients and do not require monitoring. A
few antibiotics, in which therapeutic levels are close to
the toxic range at which side effects occur, have a
higher risk of toxicity. The best-known examples are
aminoglycoside antibiotics, such as gentamicin, and
vancomycin. Possible side effects of these drugs include
renal failure and deafness. Patients who are on these
drugs for more than a day should have their levels
monitored. If the levels are outside the desired range,
the size of dose or frequency of dosingmay be changed.
Traditionally, peak levels (taken 1 h after a dose)
and trough levels (taken just before the next dose) were
taken. Peak levels are now rarely requested unless there
are concerns about underdosing and treatment failure.
Trough levels give a better indication whether the
patient is likely to have problems with toxicity. For
once-daily gentamicin dosing, levels are taken any-
where from 6---20 h postdose and interpreted with the
aid of a graph called a nomogram.
There are two commonmethods of antibiotic assay.
The Abbott TDX system uses fluorescence polarization
immunoassay (FPIA) and can be used to measure
gentamicin, amikacin and vancomycin levels (Figure
6.14). Abbott also manufacture the Axsym and the
Architect i2000SR, which are immunoassay systems.
Requests for antibiotic assay should always include
information about all antibiotics that the patient is on,
the size and frequency of dose, and the date and time of
the last dose. Without this information it is impossible
to interpret and advise on the results (Box 6.7).
6.2.11 Safe working practice in themicrobiology laboratory
All laboratories have working hazards to deal with.
Every chemical has its own Control of Substances
Figure 6.14 Antibiotic assays being performed on a TDXanalyser
274 Biomedical sciences

Hazardous to Health (COSHH) certificate. COSHH
covers chemicals, products containing chemicals,
fumes, dusts, vapours, mists and gases, and biological
agents. If the packaging of a product has any hazard
symbols then it is classed as a hazardous substance.
Every procedure has its own risk assessment, as your
employer has a legal responsibility to reduce risk to
staff and the public. More details about COSHH and
risk assessment can be found on the Health and Safety
Executive website (www.hse.gov.uk).
Understanding safe working practices is part of
becoming qualified as a biomedical scientist. The IBMS
Certificate of Competence contains several sections on
the understanding of safe working.
Every staff member, and visitor, will have safety
instruction on entry to the department, with funda-
mental instructions on what to do if alarm bells should
sound, including evacuation routes and the assembly
area for the department. Every staff member will be
provided with training on how to respond in the event
of a fire. Every staff member, and visitor, working in
the laboratory will have personal protective equipment
made available to them. This includes a white coat, or
protective disposable coat, disposable gloves, eye pro-
tection and the use of a Class I Safety Cabinet for
handling high risk samples and organisms.
The Class I Safety Cabinet is a negative pressure,
ventilated cabinet with an open front and a minimum
face velocity of 75 linear feet per minute. All of the air
drawn into the cabinet is filtered through an HEPA
filter before being exhausted to the environment.
There is a meter on the front of the cabinet showing
the current air speed. The cabinet is only safe to use
when this meter reading is in the safe zone
(Figure 6.15).
There are set procedures for dealing with spillages,
near misses and accidents. All staff should be aware of
health and safety legislation and incident reporting
procedures. There will be standard operating proce-
dures (SOPs), online or provided in folders, to explain
how an incident or accident must be handled.
All staff will be able to work in a safe environment,
understand good laboratory practice, thus minimizing
the risk to others through the understanding of any
hazards present in the workplace. These hazards may
include the infection risk of microorganisms, which
are grouped into four categories of risk (hazard groups
1, 2, 3 and 4, Table 6.8).
Organisms in hazard groups 2---4 are considered to
be pathogens. Hazard group 1 organisms would not
usually cause disease, although might cause opportu-
nistic infections under certain circumstances (see Sec-
tion 6.18 on opportunistic infections).
6.2.12 Notifiable diseases
Some infections are legally notifiable to the Health
Protection Agency under the Health Protection (No-
tification) Regulations 2010 [1]. Clinicians have a duty
to notify illnesses that they suspect on clinical grounds,
while the laboratory has to notify certain pathogens
that it has detected. These are organisms which have
implications for public health, such as food poisoning
bacteria or invasive Group A streptococcal infections.
Laboratory notification is usually done via an electronic
link called CoSurv.
Box 6.7 Antibiotic assay pitfalls.
Common causes of ridiculously high or low
levels include:
The blood sample was taken out of the same IV
line used to give the antibiotic.
The blood sample was taken at the wrong time.
The dose was not given.
The dose was given at the wrong time.
The wrong drug was given.
The wrong patient was bled.
The request form asked for the wrong assay
(e.g. patient is on gentamicin but the ward
staff requested vancomycin assay).
Figure 6.15 Class I safety cabinet
Chapter 6 Medical microbiology 275

6.2.13 Waste: reduce, reuse, recycle
Waste produced by the laboratory or hospital can
present a risk to staff, the community and the envi-
ronment. It is necessary to treat this waste before
disposal. This does not always require sterility, the
complete removal of all organisms, but may require
disinfection, the removal of significant organisms to
the extent that the item ceases to be a potential source
of infection (Table 6.9).
Methods of waste disposal are determined by the
nature of the waste [2]. There is an increasing
Table 6.8 Hazard groups for micro-organisms
Hazardgroup
Pathogenicity to humans Example Hazard toworkforce
Hazard tocommunity
Treatment orprophylaxis
1 Unlikely to cause human disease — No No Not usually
required
2 Can cause human disease Staphylococcus aureus, E. coli Possible Unlikely Available
3 Can cause severe human disease Mycobacterium tuberculosis,
Salmonella typhi
May be
serious
May spread Usually available
4 Causes severe human disease Lassa fever virus, Ebola virus Serious Likely None
Table 6.9 Treatment of waste
Sterilization methods Example Use
Dry heat Bunsen burner Sterilize laboratory equipment, e.g. wire loops, forceps, and
scissors
Hot air oven Glassware, powders
Moist heat Autoclave Sterilize laboratory equipment that can be reused, sterilize
bacterial cultures for safe disposal, sterilization of operating
theatre equipment, plastic tubing for media preparation
Using steam under pressure
Toxic Gas Ethylene oxide Sterilize laboratory equipment such as specialist instruments for
re-use
Radiation Cobalt-60 source in special facilities Sterilize mass-produced disposable plastics, e.g. pipettes
Filtration Hepa filters Decontaminate air leaving safety cabinets
Cellulose acetate membrane filters Filter sterilize drugs for injection
Disinfection Examples of use
Cleaning Hand washing to prevent transmission of infection between patients
Pasteurization --- item
held at high temperature
for set time period
Expressed milk from neonatal unit
Boiling May be used for ‘medium risk’ metal instruments, but rare as small autoclaves are commonly
used.
Low temperature steam Can be used with formalin to disinfect equipment
Chemical Endoscope decontamination. Chemicals work well on clean objects, but not objects
contaminated with bodily fluids.
276 Biomedical sciences

awareness in the hospital environment of the cost of
waste disposal and the staff are encouraged
to dispose of waste correctly and economically.
Sharp laboratory waste will be put into rigid
plastic containers before being further processed
for discard (Figure 6.17). Other bench-produced
waste will be put into bags to be autoclaved before
disposal (Figure 6.16). Some waste, such as bacterial
cultures and patient samples, are autoclaved before
disposal. This often occurs on-site but can be
transported off-site in rigid plastic containers to
be autoclaved and incinerated elsewhere.
Secure shredding facilities are available for confi-
dential waste, which often involves the collection of
confidential waste by contractors, who then shred on-
site using portable equipment. Domestic waste, such as
flowers, food waste and so on, is disposed of into black
plastic bags. Clinical or potentially infectious waste
is discarded into orange or yellow bags, which are
sealed with bag ties, to determine their processing
requirements (Figure 6.18).
6.3 Bacteria
6.3.1 Nutritional growthrequirements
Bacteria chemically comprise of protein, polysaccha-
ride, lipid, nucleic acid and peptidoglycan. This means
that bacteria require hydrogen, oxygen, carbon and
nitrogen in order to grow. Some bacteria can make
what they need from very basic elements, others re-
quire ready-made compounds that can be broken
down and used to manufacture structural compo-
nents. Bacterial growth also requires an energy source,
which can be as simple as sunlight, or more compli-
cated, such as the breakdown of sugars.
Growth factors are required in very small amounts
and are found in body fluids and tissues. These factors
include purines and pyrimidines (to build DNA),
vitamins and amino acids.
6.3.2 Environmental growthrequirements
6.3.2.1 Carbon
Bacteria can be divided into two groups depending on
their carbon requirement. Auxotrophs get all their
carbon requirement from the CO2 in the air and use
sunlight for energy. They are free living bacteria and
Figure 6.16 Autoclave
Figure 6.17 Sharps bin
Figure 6.18 Yellow waste bag for clinical waste
Chapter 6 Medical microbiology 277

nonparasitic. Heterotrophs require an organic form of
carbon that can act both as a carbon source and an
energy source. This group of bacteria includes human
pathogenic bacteria.
6.3.2.2 Oxygen
The oxygen requirement of a bacterium allows them to
be divided into five groups: obligate anaerobes, aero-
tolerant anaerobes, facultative anaerobes, obligate
aerobes and microaerophilic organisms (Table 6.10).
6.3.2.3 Temperature
There are three groups used to describe the temperature
at which bacteria grow: psychrophiles (< 20 �C), me-
sophiles (25 --- 40 �C) and thermophiles (55 --- 80 �C).Most human pathogens are mesophiles.
6.3.3 Bacterial growth
Bacterial growth and division occurs by binary fission
when the bacterium reaches a critical mass. The rate of
growth occurs in four phases
1. The lag phase occurs when the bacteria adjust to
prepare for cell division.
2. The logarithmic (or exponential) phase is when cell
growth and division is at the maximum rate allow-
able based on the nutrients available. A bacterium
can divide every 30min during log phase.
3. The stationary phase is a levelling out period that
occurs when one of the nutrients is depleted.
4. The death phase (decline) occurs when the bacteria
lyse and die (Figure 6.19).
6.3.4 Bacterial metabolism
Many of the tests used to identify bacteria require them
tometabolize various different compounds. Themeth-
od in which they do that is another way of grouping
bacteria through the different enzymes that they
possess.
6.3.4.1 Fermentation
Fermentation is the release of energy anaerobically
from carbohydrates. It occurs mainly via glycolysis,
which leads to the production of pyruvic acid or
pyruvate.
Table 6.10 Oxygen requirement
Group Requirement
Obligate anaerobes Require very low oxygen
concentration gas mix and a catalyst
to reduce any remaining oxygen to
water
Aerotolerant anaerobes Anaerobic bacteria that are not killed
by oxygen
Facultative anaerobes Can grow both aerobically and
anaerobically
Obligate aerobes Require oxygen to grow
Microaerophilic organisms Grow best in low oxygen tension
STATIONARY PHASE
DEATHPHASE
LOG PHASE
Log numberof bacteria
LAG PHASE
Time in hours
Figure 6.19 Bacterial growth curves
278 Biomedical sciences

6.3.4.2 Oxidation
Oxidation is the release of energy in the presence of
oxygen.
6.3.5 Bacterial cell structure
A typical bacterial cell is illustrated in Figure 6.20.
Important cell structures include the following.
Cytoplasmic membrane: a phospholipid bilayer.
Cell wall: a rigid structure whose function is to sup-
port the cytoplasmic membrane and maintain the
shape of the bacterium.Damage to the cell wall often
results in lysis. The main component of the cell wall
is a polymer called peptidoglycan (Figure 6.21). The
staining technique known as a Gram stain will
distinguish bacteria with a thick peptidoglycan layer
(Gram-positive) from a thin layer (Gram-negative).
Gram-positive cell walls have a simple, strong struc-
ture. Gram-negative cell walls are thinner but have a
second, outer membrane which contains lipopoly-
saccharide (LPS), as well as many associated pro-
teins. LPS, also known as endotoxin, may cause
septic shock if it gets into the bloodstream. The
Gram-negative outer membrane confers advantages
such as protecting the cell from the effects of lyso-
zyme (a host defence substance) and impeding the
entry of antibiotics to the cell.
Nuclear material: the bacterial chromosome is a long
molecule of double-stranded DNA which is coiled
and supercoiled by the DNA gyrase enzyme system
Fimbriae
CytoplasmicmembraneCytoplasm
containing ribosomes
Cell wall
CapsuleFlagellum
Bacterialchromosome
Plasmids
Figure 6.20 Bacterial cell structure
Gram-positive cell wall
Capsule
Peptidoglycan
Cytoplasmic membrane(phospholipid bilayer
with membrane proteins)
(a)
Membrane proteins
Gram-negative cell wall
Capsule
Membrane proteinsPorin
Lipopolysaccharide is theouter membrane.Only foundin Gram-negative bacteria.
Cytoplasmic membrane
Peptidoglycan
Membrane proteins
(b)
Figure 6.21 Cell wall structure
Chapter 6 Medical microbiology 279

(another suitable target for antibacterial therapy).
There is no nuclear membrane and no nucleus. The
area where the chromosome is situated is called the
nucleoid.
Many bacteria have additional DNA in structures
called plasmids, which are small circular DNA
elements found in bacterial cytoplasm. They repli-
cate independently of the main bacterial chromo-
some and can be passed between bacteria by a
process known as conjugation. They often encode
genetic information for useful traits such as antibi-
otic resistance or toxin production.Ribosomes: a bacterial cell contains thousands of ribo-
somes, whose function is protein synthesis. Bacterial
ribosomes are smaller than eukaryotic ribosomes,
with a sedimentation coefficient of 70S (composed
of 30S and 50S subunits). This difference makes
them a useful target for antibacterial therapy.
Genetic study of ribosomal RNA by 16S amplifica-
tion can be used to identify bacteria that cannot be
grown in culture.
Fimbriae or pili: filamentous projections arising from
the cell wall which mediate adhesion between the
bacterium and the host cell. Sex pili are longer and
initiate conjugation (transfer of DNA) between
bacterial cells.
Flagella: long, thin filaments arising from the cyto-
plasm, used for locomotion. Flagella may be single
ormultiple (up to 20 per cell) andmay be situated at
one end of the cell (polar) or along the sides
(peritrichous).
Spores: formed only by some bacterial species, nota-
bly Bacillus and Clostridium, as a response to
adverse environmental conditions. The spore is a
dormant form which can survive for long periods
and will germinate when conditions become
favourable for growth. Each cell produces only one
spore, sometimes in a distinctive position within
the cell which can aid us in identification of the
bacteria (Figure 6.22).
Capsule or slime: many bacteria have a further poly-
saccharide layer external to the cell wall. This layer is
often well defined and is visible on light microscopy
as a halo around the bacterium, in which case it is
called a capsule. If the layer is amorphous and comes
away from the bacterium it is called slime; in vitro it
causes the bacterial colonies to appear mucoid. The
presence of a capsule or slime is protective against
phagocytosis and complement, and reduces antibi-
otic penetration into the bacterial cell.
6.3.6 Common bacteria
The primarymethod of differentiation between groups
of bacteria is through the Gram stain result. Below are
some of the more common bacteria and methods of
identification.
6.3.6.1 Staphylococci
Staphylococci areGram-positive cocci growing inpairs
and tetrads, resembling a bunch of grapes. They are
catalase positive, which differentiates them from strep-
tococci. Staphylococci are divided into two groups
using the coagulase test. Staphylococcus aureus is coag-
ulase positive, other staphylococci are not. A positive
coagulase combined with a positive DNAase test con-
firms the identificationofaStaphylococcusaureuswhich
will always be followed up. Staphylococcus aureus is a
common cause of infection of the skin and soft tissues,
and can also cause deep seated infections at other sites
such as endocarditis and osteomyelitis. Some S. aureus
produce toxins which are involved in food poisoning,
toxic shock syndrome and skin exfoliation. Some
strains produce a toxin called Panton---Valentine leu-
cocidin (PVL) and cause severe skin infections and
necrotising pneumonia. Meticillin resistant Staphylo-
coccus aureus (MRSA) causes the same infections as
meticillin sensitive S. aureus, but is more difficult to
treat and is a greater infection control problem.
The other staphylococci are usually grouped to-
gether as coagulase-negative staphylococci (CNS) and
reported as such. They are usually skin flora of no real
significance, but may be significant if isolated repeat-
edly from a sterile site.
Clostridium tetani
Clostridium difficile
Subterminal spore
Terminal spore
Figure 6.22 Clostridium difficile with subterminal sporesand Clostridium tetani with terminal spores
280 Biomedical sciences

6.3.6.2 Streptococci
Streptococci are Gram-positive cocci growing in pairs
and chains. They are catalase negative. Streptococci are
classified based on their ability to haemolyse blood to
various degrees. Beta-haemolytic streptococci haemo-
lyse blood completely, leaving a clear zone around
colonies on a blood agar plate. Alpha-haemolytic
streptococci partially haemolyse blood, producing a
greenish zone around colonies on blood agar. Non-
haemolytic streptococci will not haemolyse blood and
have no zone around them (Figure 6.23).
Beta-haemolytic streptococci can be divided using
the Lancefield grouping system into groups A, B, C, D,
F and G. Group A streptococci (GAS) cause throat
infections, ear infections, and skin and soft tissue
infections which can progress to necrotizing fasciitis.
The immunological reaction to GAS may cause rheu-
matic fever or poststreptococcal glomerulonephritis.
Group C and G streptococci cause most of the same
diseases as GAS but in a milder form. Group B strep-
tococci are carried vaginally and are linked with in-
fections of the newborn.
Alpha-haemolytic streptococci are often nonpatho-
gens but one species, Streptococcus pneumoniae, can
cause serious infections such as pneumonia as well as
ear and eye infections. It is differentiated from the
others by looking for a zone of inhibition around an
optochin disc (ethyl hydrocuprein hydrochloride).
6.3.6.3 Anaerobes
Anaerobes come in all shapes and sizes, the most
common including Clostridium sp., Bacteroides sp. and
anaerobic cocci. They are identified by adding a met-
ronidazole disc to all anaerobic culture plates. A zone
indicates the presence of an anaerobe. Anaerobes are
often isolated as a mixed culture and not identified
individually; however, the presence of a spreading
colony sensitive to metronidazole may indicate Clos-
tridium sp. andwould necessitate a full identification to
rule out tetanus or Clostridium perfringens. Some
Clostridium species are a cause of food poisoning,
others can cause gangrenous infection. Mixed cultures
of anaerobic bacteria are often a cause of infection in
deep tissue sites.
Clostridium difficile is a Gram-positive anaerobic
rod, which is part of the normal gut flora in children
aged less than 2 years but is not normal in adults.
Adults may be exposed to C. difficile spores in the
healthcare environment. Antibiotic treatment dis-
turbs the normal bowel flora and can lead to the
overgrowth of this bacterium. In these conditions it
can cause antibiotic-associated diarrhoea (AAD) or
pseudomembranous colitis (PMC) symptoms rang-
ing from mild diarrhoea to life-threatening illness.
The severity of the disease is related to toxin produc-
tion by the bacterium. It produces two toxins: toxin A
is an enterotoxin and toxin B is a cytotoxin. Diagnosis
of C. difficile infection is based on detection of the
toxins in samples of faeces. This can be performed by
serological methods, such as EIA, or by cell line
looking for cytopathic effect --- the latter only dem-
onstrating toxin B. Screening for this bacterium
occurs daily in most hospitals, and results are avail-
able on the same day. It can be cultured in the
laboratory, but is rarely requested as it takes much
longer to get a result.
Figure 6.23 (a) Beta-haemolytic streptococci on a bloodagar plate and (b) Streptococcus pneumoniae demonstratingalpha haemolysis on blood agar
Chapter 6 Medical microbiology 281

6.3.6.4 Coliforms
Coliforms are Gram-negative rods and encompass a
wide variety of bacteria including the enterobacteria-
ceae. Coliforms are found in faeces but can contami-
nate other sites, as transient flora or as pathogens. They
are the most common cause of urinary tract infections
where, as treatment does not require full identification
of the bacteria, the focus is on antibiotic sensitivity
testing after preliminary identification.
The primary method of differentiating coliforms is
to establish whether or not they can ferment lactose.
Lactose-fermenting coliforms only cause disease if they
are found in sterile areas. Common lactose-fermenting
coliforms include Escherichia coli and Klebsiella spp.
Many strains of E. coli have powerful toxins that cause
diarrhoea and other symptoms. For example, E. coli
O157 causes bloody diarrhoea and haemolytic
uraemic syndome.
Non-lactose fermenting coliforms include diar-
rhoea-causing organisms, such as the salmonellae and
shigellae. Salmonellae and shigellae are common causes
of food poisoning. Tests to identify these pathogens
initially involve oxidase to exclude pseudomonads and
biochemical tests to identify which carbohydrates can
be utilized by the organism. The cell wall of salmonellae
contains specific lipopolysaccharides called ‘O’ antigens
and ‘H’ antigens made out of flagella protein. Shigellae
also possess ‘O’ antigens. These bacteria are identified
by serological testing: a suspension of the organism is
made in saline, mixed with specific antisera and rocked
gently whilst looking for agglutination. Antisera are
available as a mixture of antigenic types, for example
polyvalent ‘O’ antigen, as well as singly, and so can be
used for screening suspicious colonies. The results of
the Salmonella ‘serology’ can be compared to a refer-
ence listing of all the antigenic types in order to identify
the species; this is available in the Kauffman---White
classification scheme. A copy of this can be found in
everymicrobiology laboratory. Identification to species
level is followed by phage typing by a reference labora-
tory (Table 6.11). It is crucial to determine identifica-
tion to this level as it establishes whether or not a group
of infections is due to a food poisoning outbreak from a
particular event or establishment (Figure 6.24).
When performing agglutinations with antisera it is
important to take great care as the risk of infection to
the BMS is increased. A loop of antiserum is mixed
with a saline suspension of the organism. When
making the suspension and adding and mixing the
antiserum, it is important to turn the wire or plastic
loop onto its side before lifting it from the mixture.
This reduces the likelihood of aerosols being produced.
Another common nonlactose fermenter found in fae-
ces is Proteus spp., a common cause of UTI, which is
characterized by its ability to swarm on blood agar and
is urease positive.
6.3.6.5 Pseudomonads and acinetobacter
Pseudomonads are Gram-negative rod-shaped bacte-
ria that are strict aerobes. They cause infections in
burns and UTI, and are very commonly found. They
are nonlactose fermenters and oxidase positive. Com-
monly pseudomonads are further differentiated to
identify Pseudomonas aeruginosa by a variety of test
including growth at 42 �C (Ps. aeruginosa will grow at
this temperature), and sensitivity to identification
Table 6.11 Common salmonellae
Common salmonellae Antigenic structure
Salmonella enteritidis ‘O’ 1,9,12 ‘H’ g
Salmonella typhi ‘O’ 9,12 ‘H’ d Vi*
Salmonella typhimurium ‘O’ 1,4,5,12 ‘H’ i
Salmonella paratyphi A ‘O’ 1,2,12 ‘H’ a
*The capsule produced by some salmonellae is the ‘Vi’ antigen. When this is
present, the organism will often not agglutinate with any ‘O’ antisera as the
capsule gets in the way.
Figure 6.24 Probable Salmonella species growing as blackcolonies on XLD plate; lactose fermenting coliforms grow asyellow colonies on XLD
282 Biomedical sciences

discs (e.g. C390). They are resistant to a large number
of antibiotics.
Acinetobacters are short Gram-negative rod-
shaped bacteria that are strict aerobes, and oxidase
negative. Multiresistant strains can cause problems in
hospitals with colonization and infection of patients.
6.3.6.6 Campylobacter, vibrio and helicobacter
This group are all Gram-negative curved rods. They are
all oxidase positive. Campylobacter grows in micro-
aerophilic conditions and causes bloody diarrhoea.
There are many strains, but those pathogenic to hu-
mans are the only ones that can grow at 42 �C. Identi-fication is done by colonial morphology on selective
agar, Gram stain and oxidase.
Vibrios are found in water. Vibrio cholerae causes
cholera. It is an aerobe and oxidase positive on nonse-
lective agar. Thiosulphate citrate bile salt sucrose agar
(TCBS) is the selective agar used for isolation of Vibrio
spp. Antiserum is available for identification.
Helicobacter pylori is a curved Gram-negative rod,
catalase positive, oxidase positive and urease positive.
It is associated with chronic gastritis, peptic ulcers and
gastric carcinoma. H. pylori strains grow in a micro-
aerophilic atmosphere, at 37 �C and prefer a high
humidity. It takes 3 to 5 days to grow but is notoriously
difficult to isolate. For this reason, detection of
H. pylori is done serologically. Faeces samples are tested
using an EIA method, looking for bacterial antigen. A
positive result indicates a current infection. Histori-
cally, antibody screening was performed, but this was
less useful because antibodies remained positive after
treatment and so could not be used to assess response
to treatment or to detect reinfection.
6.3.6.7 Corynebacteria
Corynebacteria are Gram-positive rods, often dem-
onstrating a pattern similar to Chinese lettering. The
majority of corynebacteria are part of the normal skin
flora, but Corynebacterium diphtheriae can cause
diphtheria. This species is differentiated from other
corynebacteria by isolation on selective media such as
Tinsdale or Hoyle’s, and being urease negative. Fur-
ther biochemical testing will establish the species
group from this point. There are three main biotypes
of C. diphtheriae: gravis, intermedius and mitis
(Box 6.8). Isolates are sent to the reference laboratory
for toxigenicity testing, which takes 24---48 h. Mitis
strains are less likely to be toxigenic.
6.3.6.8 Haemophilus
Small Gram-negative rods, haemophili are associated
with the respiratory tract and are commonly found as a
cause of eye and ear infections as well as chest infec-
tions. They require an enriched media to grow as the
organism has a requirement for haemin (X-factor)
and/or di- or tri-phosphopyridine (V-factor) which
are present in lysed blood. Themost significant isolate,
Haemophilus influenzae, is both X and V dependent
(Table 6.12). The growth of Haemophilus species is
enhanced by an atmosphere rich in carbon dioxide
(Figure 6.25).
6.3.6.9 Gram-negative cocci
Many Gram-negative cocci, such as Neisseria gonor-
rhoeae and N. meningitidis, are nutritionally demand-
ing bacteria. They require a lysed blood agar (such as
chocolate agar) to grow. Moraxella catarrhalis grows
on blood agar. They are all oxidase positive but can be
differentiated by tributyrin test (Moraxella gives a
positive reaction) and sugar fermentation tests.
Neisseria gonorrhoeae is a pathogen found in the
human genital tract, N. meningitidis can cause menin-
gitis and is found in the upper respiratory tract, andM.
catarrhalis can cause upper respiratory infections. All
have been found as causes of eye infections.
Box 6.8 Diphtheria toxin
Diphtheria toxin production is not an intrinsic
feature of C. diphtheriae, but is encoded on the
tox gene carried, and inserted into the bacterial
chromosome, by a bacteriophage. Only strains
which contain the bacteriophage are toxigenic.
Table 6.12 Haemophilus growth factors
Organism Requirement
Haemophilus influenzae X and V
Haemophilus parainfluenzae V
Haemophilus ducreyi X
Chapter 6 Medical microbiology 283

6.3.6.10 Spirochaetes
Spirochaetes are helical organisms with a similar cell
wall structure to Gram-negative organisms. Spiro-
chaetes are too slender to see on a Gram’s stain so
dark ground microscopy or modified staining meth-
ods, such as silver stains, are used to see themunder the
microscope. This group includes Treponema, Borrelia
and Leptospira. As these organisms are very difficult to
grow, their presence is detected through serological
blood testing.
Treponema pallidum causes syphilis and is detected
by a range of serological tests, including TPPA (Trep-
onema pallidum particle agglutination), RPR (rapid
plasma reagin), EIA (enzyme immunoassay) and FTA
(fluorescent treponemal antibody absorption test).
Borrelia burgdorferi is the cause of Lyme disease, a
tick-borne disease that causes skin lesions, encephalitis
and arthritis symptoms. The ticks are carried by deer,
so this disease is found in people who have been in
woodland areas. Antibodies are detected by enzyme
immunoassay.
Leptospira spp. are the cause of leptospirosis or
Weil’s disease. It is carried in many animal hosts, most
commonly the rat, and transmitted in urine. It causes
fever, headache and muscle pain and can lead to
jaundice and renal failure. Diagnosis is usually con-
firmed by serology, though it may be grown from
blood cultures within the first 5 days of the illness.
6.3.7 A guide to what is normal ---and what is not!
Each region of the body has its own population of
bacteria that call it home (Table 6.13). This varies due
to the nature of that body part but leads to a sometimes
confusing mixture of bacteria and the need to decide
which are in the right place, and which are unwelcome
--- the potential pathogens. Tomake thismystery a little
clearer we have provided a list, region by region, of
normal bacteria and common pathogens.
6.4 Fungi
Fungi are opportunistic organisms. They can cause
either superficial or deep infections (mycoses).
6.4.1 Fungal cell structure
Fungi are eukaryotes and all possessmembrane-bound
organelles, cell membrane and cell wall composed of
polysaccharides (glucan, mannan) and chitin. For
practical purposes they can be divided into three main
groups. Moulds or filamentous fungi are composed of
branching filaments (hyphae) which intertwine to
form a mass called the mycelium. They reproduce by
spore production. True yeasts and yeast-like fungi are
Figure 6.25 (a) CO2 incubator with gas cyclinder and (b)and (c) incubator with plates stacked inside
284 Biomedical sciences

predominantly unicellular and oval or round in shape.
They may produce chains of elongated cells called
pseudohyphae. Reproduction is by budding. Dimor-
phic fungi grow as yeasts at 37 �C (on agar and in the
body) and as filamentous fungi at 28 �C. They are oftenCategory 3 organisms, which require extra precautions
during laboratory work.
6.4.2 Common fungi and laboratoryidentification
Direct microscopy of the sample may include potassi-
um hydroxide to digest keratinous samples, and
lactophenol cotton blue to stain the fungal elements.
All fungi stain Gram-positive. Samples are cultured
onto Sabouraud’s agar and incubated at 28 �C (and
37 �C). Commercial identification kits, which rely on
Table 6.13 Normal bacterial flora and bacterial pathogens
Normal flora Potential pathogens
Mouth Alpha haemolytic streptococci Candida
Neisseria spp. Vincent’s fusiform bacillus
Anaerobes
Nose and sputum
Alpha haemolytic streptococci Strep. pneumoniae
Neisseria spp. Haemophilus influenzae
Diphtheroids (Corynebacteria) Staph. aureus
Enterobacteriaceae
Throat Alpha haemolytic streptococci Beta-haemolytic streptococci (Group A)
Neisseria spp. Arcanobacterium haemolyticum
Diphtheroids (Corynebacteria)
Skin
Staphylococcus epidermidis Staph. aureus
Nonhaemolytic streptococci Beta-haemolytic streptococci (Group A and G)
Enterococci Pseudomonas (in burns)
Diphtheroids (Corynebacteria)
Propionibacteria
Bowel (and faeces)
Enterobacteriacae Salmonella
Enterococci Shigella
Anaerobes Campylobacter
Candida E. coli 0157
Vagina
Lactobacilli Candida
Alpha haemolytic streptococci Neisseria gonorrhoeae
Diphtheroids (Corynebacteria) Beta-haemolytic streptococci (Group B) (Box 6.9)
Beta-haemolytic streptococci (Group B) (Box 6.9) Actinomyces
Box 6.9 Group B streptococcus
Confusingly, Group B streptococcus appears in
both columns. It is carried in the vagina of up to
40% of healthy women, and is usually regarded
as a commensal organism.However, it can cause
serious maternal and neonatal infections at, or
soon after, birth.
Chapter 6 Medical microbiology 285

biochemical tests, are available for yeasts. Indicator
media such as ChromAgar, which changes colour
according to the species grown, may also be used for
provisional identification.
Candida albicans is a yeast that causes opportunistic
infections. It is commonly isolated from the genital
tract as it lives on human skin andmucousmembranes.
It can cause superficial disease such as thrush, or can
cause systemic disease (invasive candidiasis) in the
immunocompromised patient. C. albicans can be dis-
tinguished from other Candida species by the germ
tube test (Box 6.10). This is important because
C. albicans is usually sensitive to fluconazole, whereas
other species of Candida are often resistant, so the
germ tube test guides the initial choice of therapy
(Figure 6.26).
Non-albicans species of Candida include C. para-
psilosis, C. tropicalis, C. krusei and C. dubliensis. These
are less common thanC. albicans and are generally seen
in patients who are immunocompromised, have med-
ical devices such as IV lines, or who have previously
been treated with flucononazole. Many non-albicans
species are fluconazole resistant.
Cryptococcus neoformans is a capsulate yeast. It is
found in the environment, mainly in bird droppings,
but may be inhaled and act as an opportunistic patho-
gen. It is a cause of meningitis, particularly in immu-
nocompromised patients. It grows as a creamy colony,
is urea positive and is ‘india ink’ positive in vivo
(Box 6.11 and Figure 6.27). Its presence can be detected
by cryptococcal antigen testing of blood or CSF.
Malassezia furfur is a yeast that causes a superficial
skin infection called pityriasis versicolor. It is lipophil-
ic, and has been known to cause IV line sepsis in
neonates receiving parenteral lipid therapy. Its lipid
requirement makes it very difficult to grow in the
laboratory, so diagnosis is based on its characteristic
appearance on direct microscopy, known as ‘spaghetti
and meatballs’ due to the short nonbranching hyphae
and spores seen mixed together.
Aspergillus species are found in the environment;
airborne spores may be inhaled to cause disease.
Aspergillus fumigatus is the most common species
found in humans. It is distinguished fromother species
by microscopy and colonial appearance. Other species
which may cause human infection are A. niger, A.
terreus and A. flavus.
The spectrum of disease caused by Aspergillus
includes:
Allergic aspergillosis --- type I or III hypersensitivity
reaction causes fever, breathlessness and progressive
lung fibrosis,
Aspergilloma --- preexisting lung cavities become co-
lonised to form a fungal ball whichmay erode blood
vessels to cause haemorrhage, and
Invasive aspergillosis --- in immunocompromised pa-
tients, an initial pulmonary infection spreads by the
haematogenous route to other organs. This is a
serious complication with high mortality.
Chronic otitis media or sinus infection may be
caused by Aspergillus species, particularly A. niger.
Dermatophytes are filamentous fungi that infect the
stratum corneum of skin, hair or nails to cause ring-
worm (tinea). There are three species:
Trichophyton spp. includes a range of dermatophytes
that cause infections of skin, nail and hair. The
species are differentiated by their colonial and mi-
croscopic appearance, although urea testing has
some benefit.
Box 6.10 Germ tube
Germ tube test: the fungus is incubated in serum
for 2 h, then viewed down a light microscope. If
it has formed protrusions known as ‘germ
tubes’, it is almost certainly C. Albicans.
Germ tube
Yeast cell
Figure 6.26 Diagram of yeast cell with germ tube
Box 6.11 India ink
India ink testing: india ink is added to CSF. This
gives a dark background. The capsule around the
cryptococcal cells stops it from taking up the
stain, so the cells have a clear halo around them.
This halo distinguishes them from other cells
such as host lymphocytes.
286 Biomedical sciences

Microsporum canis is a dermatophyte transmitted by
animals. It causes skin infections.
Epidermophyton spp
Dermatophyte infection causes scaly red lesions on
the skin (ringworm), hair loss and scarring on the
scalp, or thickening and discolouration of the nails
(Figure 6.28). The clinical diagnosis is given a Latin
name based on the site of infection:
Tinea capitis --- head and scalp.
Tinea barbae --- beard area.
Tinea corporis --- body.
Tinea cruris --- groin.
Tinea manuum --- hand.
Tinea pedis --- feet (athlete’s foot).
Onychomycosis --- nail infection.
Other filamentous fungi such as Mucor, Rhizopus
and Absidia are opportunistic pathogens that are usu-
ally harmless but may cause infections in severely
immunocompromised patients, the elderly, diabetics
or alcoholics. They may infect sites such as the eye,
sinuses, lung or brain. These infections are extremely
difficult to treat and have a high mortality.
Penicillium marneffei is a dimorphic fungus that
causes systemic infections in AIDS patients who have
visited south east Asia. It grows as a green colonywith a
red reverse, and is a Category 3 pathogen. Suspicious
colonies should only be investigated in a safety cabinet.
Histoplasma capsulatum is a dimorphic fungus. It is
found in hot climates, particularly South and Central
Cryptococcalcell
India ink preparation of CSF
Figure 6.27 India ink test
Figure 6.28 Trichophyton interdigitale (dermatophyte) ona Sabouraud plate
Chapter 6 Medical microbiology 287

America and is rarely seen in the UK. It occasionally
causes pneumonia or disseminated disease, particular-
ly in the immunocompromised. At 28 �C it grows as a
filamentous fungus with brown colonies, and is gen-
erally isolated from respiratory samples. Any brown
colonies isolated from these sample types should be
investigated in a safety cabinet.
6.5 Parasitology --- protozoaand helminths
The study of protozoa and helminths is known as
parasitology. Parasitic infections may be acquired in
the UK but are often acquired during foreign travel,
and are also relatively common in immunocompro-
mised patients.
6.5.1 Parasite investigations
The most common method for the detection of para-
sites is through the investigation of faeces samples.
Stains can be used to detect some parasites: the aur-
amine stain is used to screen for Cryptosporidium
parvum (and can also be used to detect Isospora belli)
and the rapid Field’s stain is good at detecting the
trophozoite form of many protozoa. The biomedical
scientists’ treat is the discovery of a whole worm in a
sample, but this is fairly unusual.
Much of parasite investigation comes from (literal-
ly) sifting through the faeces sample. The faeces is
prepared for parasite examination by suspending a
pea-sized amount in saline containing formalin, in
order to kill off the bacteria present. This sample is
vortexed to make a soup-like suspension and then
filtered to remove larger debris. The remainder is
mixed with 2mL of either ethyl acetate or ether and
vortexed again. This step allows the fat in the sample to
be extracted. The mixture is placed in a centrifuge and
spun for 2min at 2000 rpm. The fatty plug is loosed
and the entire supernatant is carefully discarded. (Due
to the nature of the chemicals that have been added,
this supernatant is not poured down the sink, but
disposed of by collection in larger glass containers and
sent for correct chemical disposal.) The remaining
pellet is resuspended in one or two drops of saline
and inspected under the microscope. Two drops are
inspected, one in saline, another mixed with iodine to
assist with the identification of cysts. The knack of
telling broccoli from parasite comes only with practice.
Strange as it may seem, there are some truly beautiful
structures to be found in faeces (Box 6.12)!
6.5.2 Protozoal cell structure
Protozoa are eukaryotic unicellular organisms.
They are relatively large, with diameters ranging from
2 --- 100 mm. Their surface membrane may be thin and
flexible, as in amoebae, or relatively stiff to maintain
their shape, as in ciliated protozoa. Protozoa are con-
sidered to be a low form of animal life because they do
not photosynthesize: most protozoa capture and ingest
food particles.
6.5.3 Common protozoa
Plasmodium species cause malaria. There are four
species which infect humans: P. falciparum, P. vivax,
P. ovale and P. malariae. P. falciparum causes the most
severe disease. Malaria is transmitted by the bite of the
female Anopheles mosquito. The parasites multiply
within liver cells and red blood cells to cause a multi-
system disease.
There are millions of cases of malaria worldwide
each year, and approximately 1600 cases/year in the
UK. Malaria in the UK is a travel-associated disease,
usually seen in people who travelled to malaria-en-
demic areaswithout taking prophylaxis. The common-
est scenario is an immigrant returning home who does
not realize they need prophylaxis; sometimes this is
referred to as VFR (visiting friends and relatives).
The diagnosis of malaria should be considered in
any patient who presents with fever within a year of
travel to an endemic area. Diagnosis is by thick and
thin blood films (at least three films taken at different
times) and by antigen detection dipsticks. NAATs are
sometimes useful.
Box 6.12 Tapeworm motility
Occasionally faecal samples arrive in the labora-
tory containing tapeworm segments. Each seg-
ment can move on its own and they are fasci-
nating to watch. They are very infectious, so they
must be carefully treated, but if more than one is
present it may be possible to race them up the
side of the container!
288 Biomedical sciences

Malaria treatment is a specialist subject. Usually a
combination of two drugs is given. Quinine plus a
second agent is the treatment of choice for falciparum
malaria, unless the patient has come from a region
where quinine resistance is common.
Giardia lamblia is an intestinal protozoon, found
worldwide, which is transmitted by contaminated
water and food or by person-to-person spread (fae-
cal---oral route). It is often seen in travel-associated
diarrhoea or in household or nursery outbreaks. Clin-
ical features include abdominal pain, diarrhoea and
flatus. It has two stages: the cyst is the infective stage
and survives well in the environment. The host ingests
the cysts, which reach the duodenum and small intes-
tine and then develop into trophozoites. Trophozoites
are motile and flagellated, and attach themselves to the
intestinal wall by a sucking disc. Eventually more cysts
are excreted to complete the life cycle. Diagnosis is by
concentration andmicroscopy of stool for cysts. Three
stools should be examined. Trophozoites may be seen
in duodenal aspirate or string test, but this test is rarely
done (Figure 6.29).
Trichomonas is a flagellated protozoonwhich causes
genital infection, usually sexually transmitted. It may
be asymptomatic or cause vaginal discharge and itch
(Figure 6.30). Diagnosis is by microscopy of wet
preparation of vaginal discharge, or culture in liquid
medium. Treatment is metronidazole. It is common
knowledge in microbiology departments that, if you
manage to find a Trichomonas spp. in a clinical sample
on a Friday afternoon, you are guaranteed to have a
good weekend!
Cryptosporidium parvum is an intestinal protozoon
which is transmitted via contaminated water or per-
son-to-person, or by direct contact with farm animals.
It is highly resistant to disinfectants and may survive
water purification. Infection ismost commonly seen in
children and in HIV-positive people. It usually causes
watery diarrhoea, which is usually self-limiting but
may be more severe and prolonged in the immuno-
compromised. Diagnosis is by stool microscopy with
modified acid-fast or immunofluorescent staining,
antigen detection or NAAT. Treatment is not usually
required.
Toxoplasma gondii is an intracellular parasite of
macrophages. Its definitive host is the cat, but other
animals and humans can become infected if they ingest
cysts. It causes an acute mononucleosis-like illness. It
may later reactivate during immunodeficiency, partic-
ularly AIDS, most commonly as cerebral infection. It
also causes congenital infection, if acquired during
pregnancy, and chorioretinitis.
Trophozoite
Nucleus
Nucleus
FlagellumFlagellum
FlagellumFlagellum
7 × 14 µmCyst
8 × 11 µm
Figure 6.29 Giardia lamblia
Chapter 6 Medical microbiology 289

Entamoeba histolytica is an intestinal protozoon
which is found worldwide but is more common in
developing countries (Box 6.13). It is not often seen in
the UK. It is transmitted by contaminated food and
water or by the faecal---oral route. The cyst is the
infective stage. The host ingests the cysts, which pass
to the colon and develop into trophozoites. The tro-
phozoites adhere to colonic epithelium and damage it
with protease and cytotoxin production. Clinically this
produces amoebic dysentery, with bloody diarrhoea
and abdominal tenderness. Complications include
amoebic liver abscess and cutaneous amoebiasis.
Treatment is metronidazole plus a second agent to
eradicate cysts.
Diagnosis is by stool microscopy for cysts (which
may be seen in fresh stools) or trophozoites. Antigen
detection and NAATs are also available. Serology is
useful for liver abscesses but not for intestinal disease.
Microsporidia are a group of intracellular spore-
forming protozoa, which may infect the intestine or
other organs. They are best known for causing infec-
tion in patients with advanced HIV. Diagnosis is by
stool microscopy using modified trichrome stain
or NAAT.
Isosporabelli is foundworldwide,most commonly in
the tropics and subtropics, and causes diarrhoea with
abdominal cramps.The illness is self-limiting inhealthy
people but may be severe and prolonged in the immu-
nodeficient, particularly AIDS patients. Diagnosis is by
stool microscopy with modified acid-fast stain.
6.5.4 Helminths
Helminths are multicellular parasitic worms. Strictly
speaking they are too large to be classed as true
microorganisms, but they are included here because
their detection falls within the remit of the microbiol-
ogy laboratory. They are a common cause of infection
worldwide. Most cases in the UK are imported from
abroad, with the exception of Enterobius vermicularis
which is common in the UK. There are three major
groups of helminths: nematodes (roundworms), tre-
matodes (flukes) and cestodes (tapeworms). They can
be broadly classified as intestinal or tissue parasites.
6.5.4.1 Intestinal helminths (Table 6.14)
6.5.4.2 Tissue helminths (Table 6.15)
6.6 Viruses
6.6.1 Overview of some medicallyimportant viruses (Table 6.16)
6.6.2 Virus structure
Viruses are small organisms (less than 200 nm in diam-
eter)which consist of: nucleic acid,whichmaybe either
RNAorDNA; a protein coat called a capsid,madeupof
subunits called capsomeres; and an optional outer
Nucleus
Flagellum
Figure 6.30 Trichomonas
Box 6.13 Entamoeba cysts
E. histolytica cysts are morphologically identical
to cysts of E. dispar, which does not cause
disease. If E. histolytica cysts are seen, they
should be reported as being ‘E. histolytica or E.
dispar’, and referred for antigen detection or
NAAT to identify the species.
290 Biomedical sciences

Table 6.15 Tissue helminths
Name Commonname
Type ofhelminth
Approx sizeof adult worm
Disease Labinvestigation
Brugia malayi --- Nematode 4---10mm Filariasis, tropical
pulmonary eosinophilia
Midnight blood
microscopy
Echinococcus
granulosus
Dog tapeworm Cestode * Hydatid disease Serology
Onchocerca volvulus --- Nematode 4 cm male, 50 cm
female
River blindness Microscopy of skin
snips for microfilariae
Schistosoma spp. Bilharzia Trematode 1---2 cm Schistosomiasis Microscopy of terminal
midday urine or stool
for eggs, or serology
3 months after
exposure.
Trichinella spiralis --- Nematode 1---3mm Trichinosis (larvaemigrate
and encyst in skeletal
muscle)
Serology or
microscopy of muscle
biopsy
Wuchereria bancrofti --- Nematode 4---10mm Filariasis, tropical
pulmonary eosinophilia
Midnight blood
microscopy
*Echinococcus is a parasite of dogs and cannot complete its life cycle in man. It forms cysts in the liver, lungs and other organs, causing hydatid disease.
Table 6.14 Intestinal helminths
Name Common name Type ofhelminth
Approx size ofadult worm
Disease Lab investigation
Ancylostoma duodenale Hookworm Nematode 1 cm Intestinal infection,
iron deficiency anaemia
Stool microscopy for eggs
Ascaris lumbricoides Common
roundworm
Nematode 15---30 cm Intestinal infection,
chest symptoms during
larval migration
Stool microscopy for eggs
Enterobius vermicularis Threadworm Nematode 2---10mm Pruritis ani Microscopy of perianal
sellotape slide
Necator americanus Hookworm Nematode 1 cm Intestinal infection, iron
deficiency anaemia
Stool microscopy for eggs
Strongyloides stercoralis --- Nematode 2mm Intestinal infection, rarely
hyperinfection
Stool microscopy or culture for
larvae, serology
Taenia solium Pork tapeworm Cestode 3---5m Intestinal infection,
cysticercosis
Stool microscopy for eggs and
proglottids. Serology (IFAT)
for cysticercosis.
Taenia saginata Beef tapeworm Cestode 5---10m Intestinal infection Stool microscopy for eggs and
proglottids
Toxocara canis Dog roundworm Nematode * Visceral larva migrans Serology
Trichuris trichiura Whipworm Nematode 2---5 cm Intestinal infection Stool microscopy for eggs
*Toxocara is a parasite of dogs and cannot complete its life cycle in humans to become an adult worm. Instead, larvae migrate around the body (visceral larva
migrans) and may cause retinal damage.
Chapter 6 Medical microbiology 291

Table 6.16 Some medically important viruses
Group Most important members Disease caused Genome type Morphology Envelope
Adenoviridae Adenoviruses Respiratory tract infection,
conjunctivitis
dsDNA Icosahedral No
Herpesviridae Herpes simplex 1 and 2 Cold sores, genital herpes,
encephalitis
dsDNA Icosahedral Yes
Cytomegalovirus Glandular fever-like illness.
Congenital CMV. Severe
infection in
immunocompromised
Varicella zoster Chicken pox, shingles
Epstein---Barr virus Glandular fever. Tumours (see
Table 6.17)
HHV-6 and 7 Exanthem subitum (childhood
illness)
HHV-8 Kaposi’s sarcoma
Poxviridae Molluscum contagiosum Molluscum contagiosum skin
infection
dsDNA Brick-shaped Yes
Orf Orf (zoonotic skin infection)
Parvoviridae Parvovirus B19 Erythema infectiosum,
arthralgia, aplastic crises,
fetal anaemia, hydrops fetalis.
ssDNA Icosahedral No
Papovaviridae Human papillomaviruses Warts, genital warts, cervical
cancer
dsDNA Icosahedral No
Polyomaviruses (JC, BK) JCV --- progressive multifocal
leucencephalopathy in AIDS.
BK --- cystitis and nephritis in
immunosuppressed
Hepadnaviridae Hepatitis B virus Hepatitis, cirrhosis,
hepatocellular carcinoma
Partial ds DNA Spherical Yes
Orthomyxoviridae Influenza A,B, C Influenza ss(�) RNA Spherical Yes
Paramyxoviridae Parainfluenza Respiratory tract infection
including bronchiolitis
ss(�) RNA Spherical Yes
Mumps Mumps
Measles Measles
Respiratory syncytial virus Respiratory tract infection
including bronchiolitis
Coronaviridae Coronavirus Common cold ss(þ) RNA Spherical Yes
SARS
Picornaviridae Poliovirus Polio ss(þ) RNA Icosahedral No
Enteroviruses Meningitis, encephalitis,
pharyngitis, hand foot and
mouth disease, myocarditis,
pericarditis, conjunctivitis
Hepatitis A Hepatitis
Rhinoviruses Common cold
Reoviridae Rotavirus Gastroenteritis dsRNA Icosahedral No
Reoviruses Tick fever
Retroviridae HIV 1 and 2 HIV and AIDS Diploid ss(þ) RNA Spherical Yes
292 Biomedical sciences

membrane called the envelope, which is derived from
host cell membranes but may be customized by the
addition of viral-encoded proteins (Figure 6.31).
Although viruses contain genetic material, they are
unable to replicate by themselves --- instead they have
to ‘hijack’ a host cell and use its cellular machinery.
The type of nucleic acid in viruses varies enormous-
ly: it may be DNA or RNA, single or double stranded,
Table 6.16 (Continued )
Group Most important members Disease caused Genome type Morphology Envelope
HTLV-1 and 2 Leukaemia, lymphoma,
tropical spastic paraparesis
Togaviridae Rubella Rubella, congenital rubella ss(þ) RNA Spherical Yes
Arboviruses Encephalitis
Flaviviridae Yellow fever Yellow fever ss(þ) RNA Spherical Yes
Dengue Dengue
Hepatitis C Hepatitis
Arboviruses Encephalitis
Bunyaviridae Arboviruses including hantavirus Fever, encephalitis, renal
failure
ss ambisense RNA Spherical Yes
Arenaviridae Lassa Viral haemorrhagic fever ss ambisense RNA Spherical Yes
Filoviridae Marburg, Ebola Viral haemorrhagic fever ss(�) RNA Filamentous Yes
Rhabdoviridae Rabies Rabies ss(�) RNA Bullet-shaped Yes
Astroviridae Astrovirus Gastroenteritis ss(þ) RNA Spherical No
Caliciviridae Caliciviruses including norovirus Gastroenteritis ss(þ) RNA Spherical No
Hepevirus Hepatitis E Hepatitis ss(þ) RNA Icosahedral No
Key: AIDS --- acquired immune deficiency syndrome; Arbovirus¼ arthropod-borne virus (numerous types exist); HHV¼ human herpesvirus; HIV¼ human
immunodeficiency virus; HTLV¼ human T-cell lymphotropic virus.
Viral structure (Schematic)
Viral protein
Envelope
Capsid Nucleic acid
Figure 6.31 Viral structure
Chapter 6 Medical microbiology 293

circular or linear, in one piece or segmented. Single-
stranded nucleic acid may be described as positive
sense or negative sense (Box 6.14). Viruses are classi-
fied according to their type of nucleic acid, capsid
morphology, mode of replication and presence or
absence of an envelope (Box 6.15).
6.6.3 Virus replication
Viruses can only replicate within living cells. They
interactwithhostcells inavarietyofways,withdifferent
replication cycles and outcomes.Most viruses of medi-
cal importance undergo a cytolytic cycle, whereby the
virus particle attaches to the cell, enters into it, is
uncoated to reveal the viral genome, and uses the viral
genome and host cell machinery to produce enzymes,
viral nucleic acid and structural proteins. New virus
particles are assembled and released, either through cell
lysis (used by nonenveloped viruses) or through bud-
ding (used by enveloped viruses, which use the host cell
membrane tomake theirownenvelope).Completionof
the cycle usually causes host cell death.
Other significant outcomes include:
Persistent infection: The virus replicates within the cell
as per the cytolytic cycle but does not kill the host
cell. The host cell coexists with the virus, and con-
tinues to produce some viral particles.
Latency: the viral genome persists within the host cell,
but with little or no transcription of viral genes. One
example is herpes simplex virus, which can remain
latent within neuronal cells for many years after an
initial infection. The virus may reactivate after a
period of time, particularly if host defences wane.
Transformation: the viral genome persists within the
host cell, with expression of selected viral proteins
which change the properties of the cell. Typically,
the host cell loses contact inhibition of growth and
can grow and divide indefinitely, making it behave
like a tumour cell. Although transformation is a
relatively uncommon event, approximately 18% of
all new cancer cases are linked with viral infection.
6.6.3.1 Associations of viruses withcancer (Table 6.17)
6.6.4 Laboratory investigationof viral infection
Most microbiology laboratories will perform some
routine virological investigations on site. Very few
laboratories, with the exception of the largest virology
centres, can offer the whole repertoire of viral inves-
tigations, so some specialized and nonroutine tests
may be sent away to a reference laboratory. It is
generally not financially economic to perform such
tests in-house, either because the equipment required
is too expensive or because the test is requested infre-
quently and is therefore uneconomic to provide on a
day-to-day basis. Examples include nucleic acid am-
plification tests (NAATs) and electron microscopy.
Many viral investigations are performed in order to
establish the cause of a patient’s symptoms. Once
diagnosis has been made, antiviral treatment may be
offered to the patient if appropriate (Section 6.10.4).
Contacts of the patient who are considered at risk of
infection may sometimes be offered antiviral prophy-
laxis, for example with influenza, or immediate vacci-
nation, for example in cases of hepatitis B (Section 6.4).
6.6.4.1 Serology
Most tests are performed on clotted blood samples,
which are spun to separate the serum from the red
blood cells. Methods include latex agglutination, en-
zyme immunoassay, complement fixation tests and
single radial haemolysis. Themost widely usedmethod
is enzyme immunoassay.Most laboratories aremoving
Box 6.14 Single-stranded nucleic acid
Positive (þ) sense nucleic acid has the same
polarity or sense as mRNA, so that proteins can
be translated directly from it. Negative (�) sense
nucleic acid has to be copied into the opposite
(positive) sense before translation can start.
Box 6.15 RNA viruses
RNA viruses are prone to transcription errors
and therefore to frequent mutations. This is
usually seen as a weakness, but their frequent
changes make it difficult for us to produce
effective vaccines or to sustain immunity after
an infection. Examples of mutation-prone
RNA-containing viruses are influenza and HIV.
294 Biomedical sciences

away from performing these manually in 96-well
plates, and towards automated systems such as the
AxSym, Architect (Figure 6.32) or VIDAS.
Most virology departments will test for Hepatitis A,
B and C, HIV, varicella zoster virus (VZV) and rubella.
Other serology tests performed on-site may include
cytomegalovirus, Epstein---Barr virus, measles and
mumps.
It is fundamentally important that the requesting
clinician understands that an antigen is part of the
organism, and that an antibody is produced by the
body. Antigen tests look for infection, IgG antibody
tests look for immunity through vaccination or previ-
ous disease and IgM antibody tests look for a current
infection.
6.6.4.2 Nucleic acid amplification tests (NAATs)
These may be used to detect virus in blood or other
body fluids. Most viral PCR work is performed from a
sample of blood in an EDTA tube, though a few PCRs
give better results with serum than EDTA. For exam-
ple, hepatitis C PCR on blood will distinguish patients
with active infection, who have positive PCR, from
those with past infection, who are PCR negative.
Serology would have been positive in both scenarios.
Quantitative PCR may also be done, to assess how
much virus is in the bloodstream, and this result can be
used to guide treatment. Another example is herpesvi-
rus PCR, carried out by reference laboratories as a
multiplex PCR which tests for herpes simplex virus
(HSV) 1 and 2, CMV, VZV and EBV. This is a useful
test for CSF in suspected viral meningitis or
encephalitis.
6.6.4.3 Nasopharygeal aspirates
These are regularly sent to the virology laboratory in
order to screen children for respiratory viruses. All
laboratories screen for respiratory syncytial virus
Table 6.17 Associations of viruses with cancer
Virus Cancer % virus-positive No. of casesworldwide/year
Human papilloma viruses (HPV) Cervical cancer 100% 490 000
Hepatitis B virus Liver cancer 50% 340 000
Hepatitis C virus Liver cancer 25% 195 000
Epstein Barr virus (EBV) Nasopharyngeal cancer;
Burkitt’s lymphoma;
post-transplant lymphoma;
Hodgkin’s lymphoma
100%; >
90%; >
80%; ➢
50%
113 000
Human herpesvirus 8 Kaposi’s sarcoma 100% 66 000
Human T-cell lymphotropic virus
(HTLV-1)
Adult T-cell leukaemia/lymphoma 100% 3000
Figure 6.32 (a) and (b) Architect 200SR analyser
Chapter 6 Medical microbiology 295

(RSV), and larger laboratories may also screen for
influenza A and B, parainfluenzae 1, 2 and 3 and
adenovirus. The results of these tests are used to reduce
crossinfection within hospitals by cohorting (separat-
ing infectious children from noninfectious ones).
RSV is one of the most common childhood respi-
ratory viruses, and can be detected using membrane
bound immunoassay. These tests come in card or stick
form and resemble pregnancy testing kits. Direct
immunofluorescence can be used to look at a panel
of different viruses at the same time, using fluorescent-
ly tagged monoclonal antibodies. It requires greater
staff skill, more expensive equipment (including a UV
microscope) and takes much longer to perform.
6.6.4.4 Viral swabs
These (together with urine and faeces samples) are
investigated using tissue culture techniques. Swabs are
generally used to diagnose herpes simplex virus (HSV)
and varicella zoster virus (VZV). The virus grows in
human embryonic lung cells. After 5---10 days a char-
acteristic cytopathic effect can be seen. Further sero-
typing of positive tissue culture samples then takes
place, using immunofluorescence with type-specific
monoclonal antibodies.
6.6.4.5 Faeces samples
These are most often used to investigate rotavirus,
using immunoassay methods. This is a common cause
of gastroenteritis in children. Faeces can also be
screened for enteroviruses by tissue culture and elec-
tron microscopy; this is usually done for suspected
enteroviral meningitis (surprisingly, enteroviruses
hardly ever cause gastrointestinal symptoms). Urine
samples are used to screen for cytomegalovirus
(CMV).
6.6.4.6 Electron microscopy
This allows visualization of a virus from clinical sam-
ples. Its great advantage is that it can be used to
investigate samples even when you are not sure which
virus you are looking for. For example, it was used to
detect the previously unknown pathogen SARS coro-
navirus during the worldwide SARS (severe acute
respiratory syndrome) outbreak in 2003. It is la-
bour-intensive and requires expensive specialist equip-
ment, so is no longer widely used.
6.6.5 Common requests in thevirology laboratory
6.6.5.1 Norovirus screen
Norovirus is an important cause of diarrhoea in children
and in adults. It causes anunpleasant gastroenteritiswith
abdominal cramps, vomiting and diarrhoea, sometimes
known as “winter vomiting disease”. Outbreaks can
occur in hospital wards (and are also common in care
homes and on cruise ships!). Investigation of a sus-
pected norovirus outbreak will require testing of
stools from several affected patients, usually coordi-
nated by the Infection Prevention and Control Team.
Norovirus PCR is available at larger virology labora-
tories and at reference laboratories.
6.6.5.2 Influenza testing
Influenza is usually a clinical diagnosis made in the
community. Investigation may be required if there is
doubt about the diagnosis or if the patient is admitted
to hospital. A viral swab of the nose and throat, or a
nasopharyngeal aspirate, can be sent to the reference
laboratory for influenza PCR. The PCR can distinguish
between different types of influenza such as influenza
A, influenza B and swine flu H1N1. Influenza serology
is available but does not give timely results.
6.6.5.3 The antenatal screen
All pregnant women are tested for hepatitis B, rubella
and HIV, as well as syphilis, unless they opt out. This is
known as the “booking bloods” and is done at their
antenatal booking visit at 12---14 weeks gestation, to
allow time for counselling and interventions if any of
the tests are positive.
6.6.5.4 The hepatitis B screen
There are numerous different tests for hepatitis B due
to the complex structure of the virus. Clinicians often
find it challenging to select the correct test for hepatitis
B. However, if the correct clinical details are available
then the laboratory can ensure that the appropriate test
is performed.
Hepatitis B surface antigen --- is positive if the patient
is a carrier or has had a very recent infection. This is
the first line test to do ‘to check a patient’s hepatitis
B status’.
296 Biomedical sciences

Hepatitis B surface antibody --- is positive at high titre
if the patient has been successfully vaccinated. This is
the test to do ‘to check response to vaccine’. Anti-
Hepatitis B surface antibody can also be positive at
low level following an infection with hepatitis B,
when the immune system is beginning to clear the
Hepatitis B virus.
Hepatitis B core antibody --- will be positive if a pati-
ent has ever had hepatitis B. This is the test to do ‘to
check if the patient has ever had hepatitis B’.
Hepatitis B ‘e’ antigen and ‘e’ antibody are tests per-
formed on known carriers to assess their degree of
infectivity (high infectivity carriers are ‘e’ antigen
positive, low infectivity carriers are ‘e’ antibody
positive). This test will eventually be superceded by
quantitative PCR.
6.6.5.5 The renal screen
A laboratory covering a renal unit will receive numer-
ous requests for hepatitis B and C screens because
dialysis patients must be tested before being put on the
dialysis machine to prevent cross-infection. Renal
patients are retested at regular intervals, and are also
screened before and after going on holiday overseas,
firstly to show their current status, and secondly to
check they have not become infected with anything
whilst being dialysed onmachinery in another country.
6.6.5.6 Checking response to vaccination
Certain occupations such as healthcare work require
staff members to be vaccinated against infections such
as hepatitis B, rubella, measles and mumps (Section
6.11.4). Holiday makers are advised to have pretravel
vaccinations depending on the area of the world that
they are travelling to. It is the job of the virology
department to check that vaccine recipients have de-
veloped sufficient protective antibody levels.
6.7 Prions
Prions are proteinaceous infective agents (Box 6.16).
They are composed entirely of protein, with no genetic
material at all, and it is debatable whether they are
actually living organisms. Prion proteins have the same
amino acid sequence as a cellular protein in the host
nervous system, but have a different three-dimensional
conformation. Typically, the host protein is rich in
alpha helices while the prion protein is rich in beta-
pleated sheets. When ingested, prions accumulate first
in the peripheral lymphoid system and then reach the
central nervous system, where they replicate by stimu-
lating the host protein to adopt the abnormal confor-
mation of the prion protein. Accumulation of these
abnormal proteins leads to loss of function and spongi-
form degeneration of the brain.
Transmissible spongiform encephalopathies are
prion diseases which cause neurological degeneration
and eventually death. TSEs are seen in animals as well
as humans, as shown by the epidemic of BSE in the UK
in the 1980s (Box 6.17). Human TSEs are thankfully
uncommon. The most important human TSE is
Creutzfeld---Jakob disease (CJD), which has a variety
of causes shown below (Table 6.18).
Iatrogenic CJD is very rare. There is a theoretical
possibility of transmission via surgery, particularly
neurosurgery, eye surgery or procedures involving
lymphoid tissue. Prions are resistant to most decon-
taminationmethods including boiling, irradiation and
most disinfectants. So autoclaving cannot be relied on
to remove prion proteins from surgical instruments
after use on a patient with CJD. As a precaution to
Box 6.16 Prions
Prions are the only known infectious agents
which are able to replicate but which do not
contain nucleic acid.
Box 6.17 Mad cow disease: an epidemic thatshould never have happened
Bovine spongiform encephalopathy (BSE), also
known asmad cow disease, was first identified in
1985 in the UK and spread rapidly through the
cattle population. At its peak the epidemic ne-
cessitated the slaughter of 200 000 diseased cattle
and 4.5 million asymptomatic, but possibly
exposed, cattle. It appears that the epidemic
resulted from contaminated cattle feed contain-
ing sheep tissue and the sheep TSE agent scrapie.
The epidemic was further fuelled by recycling
contaminated cattle carcasses into cattle feed.
These unsavoury practices have since been
banned.
Chapter 6 Medical microbiology 297

reduce risk, standards of decontamination for surgical
instruments have been improved, with the options of
quarantining or destroying instruments used on high-
risk patients, or selective use of disposable instruments.
There have also been cases in the UK of vCJD trans-
mission via blood transfusion. This risk has now been
minimized by: removing white cells from all blood
used for transfusions (leucodepletion), sourcing plas-
ma products from overseas, and banning high risk
people from donating blood.
6.7.1 Practical precautions inthe laboratory
If CJD is suspected, patient samples must be processed
in the Class 1 safety cabinet with extra precautions that
may include: lining the working area with an imper-
meable layer such as BenchKote, using disposable
loops, counting chambers and forceps. At the end of
working, all instruments are wrapped in the Bench-
Kote and bagged for disposal.
6.8 Infections in theimmunocompromised patient
6.8.1 Common causes of severeimmunodeficiency
The immunocompromised patient is, by definition, a
person whose host defences are impaired (Box 6.18).
Thismay be due to a variety of reasons such as prematu-
rity, cytotoxic chemotherapy, immunosuppressive drug
therapy, transplantation or untreated HIV infection.
There are in addition a number of inherited diseases
such as chronic granulomatous disorder (CGD) which
affect the response to infection. The most deeply im-
munosuppressed patients are those who are about to
have, or have just had, a bone marrow transplant.
Immunosuppressedpeople areprone to infectionby
exogenous or endogenous flora (see Box 6.19). Often
theseorganismsareopportunisticpathogens,whichare
not usually very pathogenic but will cause an infection
when host defences are impaired. An example is coagu-
lase-negative staphylococci, which are normal flora on
the skin but may cause line-associated infections. Re-
member,whenreadingcultureson immunosuppressed
patients, that commensal organismsmay cause clinical
infections and may require further investigation.
6.8.2 Commonly encounteredproblems
6.8.2.1 Neutropenia
Neutropenia, or low neutrophil count, is most com-
monly seen after chemotherapy but also occurs in
patients with haematological malignancy, HIV
infection or bone marrow infiltration by malignant
disease. Risk of infection is inversely related to the
neutrophil count: there is some increased risk with a
Table 6.18 Types and causes of CJD
Type of CJD Cause
New variant (vCJD) Infection by consuming bovine prions (BSE)
Iatrogenic (iCJD) Infection by tissue from another infected
person for example human growth hormone,
dura mater graft, corneal transplant
Familial (fCJD) Inherited mutation in prion protein gene
Sporadic (sCJD)
(85% of cases)
Cause unknown
Box 6.18 Common causes of severeimmunodeficiency
Neutropenia post chemotherapy.
Post solid organ transplant.
Post bone marrow transplant.
HIV infection.
Box 6.19 Sources of infection
Endogenous infections arise from the body’s
own commensal organisms, which can prolifer-
ate to cause infection once the host is
immunosuppressed.
Exogenous infections arise from an external
source,suchasmicroorganismstransferredviathe
hands of healthcare workers, or Aspergillus from
the air (a fungus found widely in air, which can
cause chest infections in the immunosuppressed).
298 Biomedical sciences

count of 1.0� 109 cells/L and infections become very
common with a count of 0.1� 109/L or lower. Neu-
tropenic patients who develop a fever must have
cultures taken from all available sites (blood via pe-
ripheral vein and central line, urine and any other likely
focus) and are immediately started on broad spectrum
antibiotics.
6.8.2.2 Splenectomy
This may be performed for trauma or haematological
disease, or the spleen may infarct due to sickle-cell
disease. Either way, the lack of a spleen leaves patients
at risk of overwhelming sepsis due to capsulated
bacteria such as Streptococcus pneumoniae, Haemophi-
lus influenzae and Neisseria meningitidis, and also at
increased risk of severe malaria. Patients are warned
that they are at increased risk of infection, particularly
in the first 2 years after splenectomy, and to seek
medical advice promptly if they become unwell. Other
precautions include wearing a medical alert bracelet,
lifelong antibiotic prophylaxis with penicillin V and
immunization against influenza, Streptococcus pneu-
moniae, Haemophilus influenzae type b and Neisseria
meningitidis group C.
6.8.2.3 Minimizing infections
Infections in the immunosuppressed cannot be wholly
avoided but can beminimized by the following actions:
. minimize underlying problem, for example treat
HIV with antiviral drugs;. protective isolation in a side room while in hospital;. prophylactic antibiotics are sometimes indicated, for
example cotrimoxazole to prevent Pneumocystis
(PCP) pneumonia in advanced HIV, penicillin V
postsplenectomy;. vaccination is sometimes useful, for example sple-
nectomy patients.
6.9 Healthcare associatedinfections
Healthcare associated infections (HCAI) are infec-
tions acquired as a consequence of a person’s treatment
by a healthcare provider, or by a healthcare worker
in the course of their duties. It replaces the older
term hospital acquired infection (HAI) because in-
fections may be acquired in the hospital or in the
community.
HCAI is an enormous problem in modern health-
care (Box 6.20). An estimated 9% of patients develop
HCAI during a hospital stay. This is obviously bad for
the patient, causing anxiety, illness or even death.
Furthermore, HCAIs are expensive. Recent Depart-
ment of Health figures show that HCAI costs the NHS
£1 billion per year [3]. This money goes towards
increased length of hospital stay, extra treatment, and
the cost of dealing with complaints and legal action.
Many HCAIs are avoidable, as we will see below, and
HCAI reduction has become a top priority for health-
care providers.
HCAIs may be usefully subdivided into:
1. community acquired infections --- the infection
presents in the community or within 48 h of ad-
mission to hospital (implying that it was already
developing prior to admission);
2. infections contracted and developing within
hospital;
3. infection contracted in hospital but not becoming
clinically apparent until after discharge (e.g. post-
operative wound infection).
6.9.1 Risk factors for infection
Age --- elderly or very young/premature babies are
most at risk. The ageing population means that
there are many very elderly patients in hospital.
Surgery --- wounds are prone to infection, as are
prostheses such as replacement hips. Risk factors
for surgical site infection include duration of sur-
gery, surgical technique and length of stay.
Underlying illness --- particularly immunosuppres-
sion, but also immobility or ischaemia.
Antibiotic use --- this reduces commensal organisms,
leaving a niche for resistant bacteria to fill.
Medical devices --- such as intravenous cannulae, uri-
nary catheters, endotracheal tubes for ventilation,
Box 6.20 Facts about HCAI in the UK
There are over 300 000 HCAI in hospitals each
year.
The cost to the NHS is at least £1 billion each year.
MRSA bacteraemia and C. difficile account for
about 15% of HCAI.
Chapter 6 Medical microbiology 299

and prosthetic devices such as artificial joints or
heart valves are widely used and readily become
colonized or infected (Figure 6.33).
6.9.2 Commonly occurringhealthcare-associated infections,and the microorganisms that causethem (Table 6.19)
6.9.3 Antibiotic-resistant bacteria
HCAIs are often caused by multiresistant bacteria
(Section 6.10.3). This is particularly likely in specialist
units with heavy antibiotic use, such as intensive care
or burns units, because the overuse of antibiotics
selects for a population of resistant organisms.
This means that broader spectrum antibiotics will be
required for treatment, that a strict antibiotic policy
must be implemented to reduce overprescribing, and
that infection control procedures must be put in place
to prevent transmission to other patients.
Examples of multiresistant bacteria implicated in
HCAI include:
MRSA --- commonly found on general medical and
elderly carewards, andwidespread innursing homes.
VRE (vancomycin resistant enterococci) --- found in
intensive care units, particularly if glycopeptide anti-
biotics such as vancomycin are frequently prescribed.
Multiresistant coliforms (Enterobacteriaceae) --- in-
cluding ESBL and AmpC producers (Section 6.10.3).
Clostridium difficile
Multiresistant Acinetobacter (MRAB) --- outbreaks are
seen in ITUs with heavy antibiotic use.Acinetobacter
persists for a long time in the environment and so
can be difficult to eradicate from a ward.
Surgical wound
Centralintravenous
line
Endotrachealtube for
ventilation
Urinary catheter
Peripheralintravenous
line
Figure 6.33 Patient with medical devices
300 Biomedical sciences

Pseudomonas survives well in moist environments
(including inside bottles of aqueous antiseptic!) and
can become multiply resistant.
Stenotrophomonas is notorious for being intrinsically
resistant to carbapenems, and is found on ITUs with
heavy carbapenem usage.
6.9.4 The Infection Prevention andControl Team (IPCT)
The Infection Prevention and Control Team (IPCT) is
a valuable resource. Every hospital and most Primary
Care Organizations will have an IPCT. The typical
structure within a hospital is:
Director of Infection Prevention and Control (DIPC)
--- often the medical or nursing director, sometimes
a consultant microbiologist;
Infection Control Doctor --- a consultant microbiolo-
gist; and
InfectionControl Nurse(s) ---usually the only full-time
team member.
The IPCT write the Infection Control Policy for the
hospital, provide training for staff, and advise on day-
to-day matters. They oversee HCAI surveillance and
reporting, audit hand hygiene and infection control
procedures, and are involved in planning hospital-
wide issues such as influenza pandemic preparedness.
The Infection Control Doctor or Nurse may liaise
closely with the laboratory, particularly if there is an
outbreak within the hospital. The DIPC leads the team
and reports to the Trust Board. Management of out-
breaks within the hospital is the responsibility of the
IPCT. They will assess the situation, isolate patients as
required and advise on appropriate samples to be sent
(Box 6.21).
HCAI surveillance is a complex and difficult area.
The main system within the NHS is compulsory
reporting of MRSA and MSSA bacteremias and of
C. difficile cases in the over-2s. Cases are reported by
the hospital chief executive to the regional NHS au-
thority. The figures are collated and released publicly
by the Health Protection Agency every month [4]. The
IPCT may carry out surveillance of other infections as
part of a national scheme called Saving Lives.
Prevention of HCAI requires involvement of all
staff from ‘board to ward’, that is. from the chief
executive down to the ward and domestic staff. Basics
such as thorough, regular cleaning must be put in
place. Hand hygiene must be a priority for clinical
staff and should be audited regularly (Figure 6.34).
Table 6.19 Common causes of healthcare associated infections
Urinary tract infection E.coli, Proteus, Klebsiella, Serratia, Enterococcus, Pseudomonas aeruginosa, Candida
Pneumonia Staphylococcus aureus (includingMRSA), Enterobacteriaceae, Candida, Aspergillus, respiratory viruses (RSV,
influenza, parainfluenza)
IV line infection S. aureus (including MRSA), Group A streptococcus, Enterococcus, coagulase-negative staphylococci
Wound infection S. aureus (including MRSA), Group A streptococcus, Enterococcus, anaerobes
Gastrointestinal infection Clostridium difficile, norovirus
Figure 6.34 Handgel pump dispenser
Chapter 6 Medical microbiology 301

Antibiotic overuse breeds resistance, so antibiotic
stewardship by the microbiologist should restrict their
use. Foreign bodies such as IV lines and catheters are a
potential focus of infection, somedical devicesmust be
inserted and looked after correctly, and should only be
used if essential. Where resistant organisms are found,
infection control procedures (such as single room
isolation) must be followed on the advice of the IPCT.
Good infection control practices can make a no-
ticeable difference to infection rates. The number of
death certificates in England and Wales mentioning
MRSA decreased from 1230 in 2008 to 781 in 2009, a
drop of 37%. MRSA was recorded as the underlying
cause of death in 19% of those 781 cases. Deaths
involving C. difficile infection fell by 34% from 5931
in 2008 to 3933 in 2009 [5].
6.9.5 MRSA screening
The NHS in England requires universal MRSA screen-
ing for hospital patients. All patients admitted to
hospital will be swabbed according to local policy from
one or more of the following sites: nose, throat, axilla,
groin, any wounds, catheter urine. MRSA positive
patients are offered decolonization with topical
antibacterial washes and nasal antibiotic ointment for
5---7 days, and should ideally be isolated from other
patients.
6.10 Antimicrobial agents
An antimicrobial agent is any substance which in-
hibits the growth of microorganisms. An antibiotic is
more specifically defined as a substance produced by
microorganisms which is antagonistic to the life or
growth of other microorganisms (Box 6.22). This
definition gives away the origin of antibiotics: namely,
that they occur naturally, produced by one microor-
ganism as a weapon against others.
In the late 1930s, a team of scientists at Oxford
University, led by Howard Florey and Ernst Chain,
were seeking to develop antimicrobial drugs. They
picked up on Alexander Fleming’s observation and
developed methods of growing mould and extracting
penicillin on a larger scale. At this point, they were
growing mould in hospital bedpans and cantaloupe
melons! By 1943, penicillinwent intomass production.
It transformedmedical practice and has savedmillions
of lives.
Many more antibiotics have been developed since
that time. Some are derived from the original penicil-
lin, some from other naturally occurring compounds,
and some are completely synthetic. The need for new
antibiotics was driven partly by the desire for better
pharmacokinetic properties (such as oral bioavailabil-
ity and less frequent dosing) and also by the emergence
of antibiotic resistance. In everyday practice, antimi-
crobials which act against bacteria are referred to as
antibiotics. Antiviral and antifungal agents also exist
and will be covered in Sections 6.10.4 and 6.10.5.
Box 6.21 Example of outbreak managementon the ward
The elderly care ward reports that three patients
have new onset diarrhoea. The infection control
nurse visits the ward and notes that all patients
have loose, offensive stools. All have recently had
antibiotics. This is most probably Clostridium
difficile diarrhoea triggered by antibiotic use.
Actions: the patients are cohorted together in a
bay, which is closed to new admissions, to
prevent onward transmission. The bay is cleaned
twice daily with chlorine-disinfectant mix to
reduce the amount of clostridial spores in the
environment. Staff wear aprons and gloves. The
patients’ antibiotics are stopped and they are
commenced on oral metronidazole. Stool sam-
ples test positive for C. difficile toxin. The pa-
tients remain in isolation until they have been
diarrhoea-free for at least 48 h. The ward doctors
are reminded not to overprescribe antibiotics.
Box 6.22 Alexander Fleming
Alexander Fleming discovered antibiotics in
1929, while working at St Mary’s Hospital in
London. He found fungus growing on an old
Petri dish and noted that bacterial growth
around the fungus was inhibited. He concluded
that the mould was producing an antimicrobial
substance, which he named penicillin after the
Penicilliummould which produced it. However,
he did not extract the active ingredient or devel-
op it into a usable form.
302 Biomedical sciences

6.10.1 Antibiotic classification
There are several different classes of antibiotics, allo-
cated according to their chemical structure and mode
of action. Numerous classes exist but the most com-
monly encountered are as follows.
Penicillins: derived from the original penicillin antibi-
otic. They all contain a beta-lactam ring in their
structure (Figure 6.35). Penicillin binding proteins
link the side chains in peptidoglycan, which is an
integral part of the bacterial cell wall, especially in
Gram-positive bacteria. Penicillins bind to these
proteins, interfering with cell wall synthesis. Some
penicillins have been modified to make them more
stable or to give them a broader spectrum. Exam-
ples: benzyl penicillin, flucloxacillin, amoxicillin.
Cephalosporins: like penicillins, these contain a beta-
lactam ring and inhibit cell wall synthesis. Some
cephalosporins have a longer half-life meaning that
they can be given just once a day. Examples: cefur-
oxime, ceftriaxone.
Carbapenems: these also contain a beta-lactam ring
and inhibit cell wall synthesis. These are powerful,
broad spectrum, intravenous antibiotics which are
used mainly in intensive care units. Examples:
meropenem, imipenem, ertapenem.
Glycopeptides: these large molecules also inhibit cell
wall synthesis, but by a different mechanism: they
block addition of new ‘building blocks’ to the pep-
tidoglycan molecule. Examples: vancomycin or tei-
coplanin (Box 6.23).
Macrolides: these antibiotics inhibit bacterial protein
synthesis. They stop bacteria from growing and
reproducing but they do not kill them --- hence they
are bacteriostatic. This makes them unsuitable for
use in life-threatening infections. They are used
mainly to treat respiratory tract, gastrointestinal
and genitourinary infections. Examples: erythro-
mycin, clarithromycin.
Tetracyclines: bacteriostatic agents which inhibit pro-
tein synthesis. Not used in children under 12 years of
age, or pregnant or breast-feeding women, due to
adverse effects on developing tooth enamel. Used for
respiratory, skin, soft tissue and genitourinary in-
fections, and sometimes used as malaria prophylax-
is. Examples: tetracycline, doxycycline.
Anti-folate antibiotics: these inhibit the synthesis of
tetrahydrofolate, which in turn affects production of
pyrimidines and purines needed for DNA synthesis.
Examples: trimethoprim, sulphonamides.
Aminoglycosides: inhibit protein synthesis. Potent,
broad spectrum agents which are given IV or IM
because their oral absorption is so poor. They are
active against most staphylococci and Gram-nega-
tive bacilli, but not very active against streptococci
and anaerobes. They are potentially toxic to the ear
and kidney, and levels should be monitored if
treatment is for 48 h or more. Examples: gentami-
cin, amikacin, streptomycin.
Quinolones: these inhibit bacterial DNA gyrase and
therefore kill bacterial cells by blocking DNA super-
coiling. Used mainly to treat genitourinary infec-
tions, and sometimes infections at other sites caused
by Pseudomonas.
Lipopeptides: Daptomycin is the only licensed mem-
ber of this class. It has a similar spectrum of activity
to vancomycin. It is used for complicated skin and
soft tissue infections or endocarditis caused by
resistant Gram-positive bacteria.
Oxazolidinones: Linezolid is the only licensedmember
of this class, used to treat pneumonia or skin/soft
tissue infections caused by resistant Gram-positive
bacteria.
Streptogramins: a combination of two streptogramins,
quinupristin and dalfopristin, is licensed to treat
serious Gram-positive infections such as pneumo-
nia, skin and soft tissue infections which have failed
to respond to other antibacterials.
Either bacteriostatic or bactericidal agents may be used
(Box 6.24). In most circumstances, either type of agent
is sufficient. A bactericidal agent is needed
if the patient’s host defences are suppressed --- a
common reason for this is neutropenia after cytotoxic
ON
S
Figure 6.35 Beta lactam ring
Box 6.23 Vancomycin
Vancomycin used to be extracted from soil,
because it was naturally made there by soil-
dwelling microorganisms. It was known as ‘the
brown powder’ because it looked dirty!
Chapter 6 Medical microbiology 303

chemotherapy. Another example where bactericidal
drugs are required is infective endocarditis. Bacteria
infect the inner lining of the heart (endocardium) and
reside within clumps of platelets and fibrin known as
vegetations, where they are protected from phagocytic
activity. It is essential to select a bactericidal drug, or
combination of drugs, that can penetrate the vegeta-
tion and kill the bacteria.
6.10.2 Principles of antibiotic use
Antibiotics are given to treat infections. It sounds as
simple as that. However, there are numerous factors
influencing the decisions of whether to treat and, if so,
which antibiotic to choose, at what dose, and for how
long (Box 6.25).
1. Clinical factors. The clinical presentation is the
most important factor in decision making. A good
history and examination should provide a provi-
sional diagnosis. From this, we can tell the likely site
of infection and the likely organisms responsible.
Specimens for culture must be taken at this stage,
before starting antibiotics. Remember that antibio-
tics alone are not always the answer --- adjuvant
therapy may be needed, for example an abscess will
not respond to antibiotic treatment unless it is also
surgically drained.
2. Are antibiotics necessary? Many minor illnesses are
selflimiting.
3. Spectrumof activity --- choose an antibiotic that will
be active against the likely pathogens. Bear in mind
whether the patient has had antibiotics recently
(which may have induced resistance) and any
knowledge of local resistance patterns. Remember
that it is a good principle to choose the narrowest
spectrum option --- it reduces the risk of side effects
such as Clostridium difficile diarrhoea.
4. Pharmacokinetics --- the antibiotic must achieve
adequate tissue levels at the affected site. Think
about how it will be given --- is it absorbed orally?
If not, will it be given intravenously, intramuscu-
larly, rectally, topically? Consider also its meta-
bolism, tissue penetration and excretion. For
example, an antibiotic used to treat meningitis
must be able to cross the blood---brain barrier and
pass into CSF.
5. The need to be right. Put simply, can you afford
for your initial choice to be wrong? If the illness is
immediately life-threatening, choose a very broad
spectrum antibiotic. You can swop to a narrow
spectrum choice later, when the culture results
are available. However, for a mild illness such as
an uncomplicated UTI, it is better practice to
choose a narrow spectrum option such as tri-
methoprim. There will be no serious harm done if
your initial choice was ineffective and needs
modifying.
6. Side effects. All antibiotics have possible side effects
such as allergic reactions, adverse drug reactions
and interactions. Glycopeptides and aminoglyco-
sides are potentially nephrotoxic and require drug
level monitoring. Antibiotics affect the normal
flora, allowing superinfection, for example by
Candida (thrush) or Clostridium difficile.
7. Cost --- the cost of antibiotics varies widely. Newer
antibiotics are generally more expensive. There is
also the cost of administration (think of the nursing
time involved in giving an intravenous drug several
times daily) and of monitoring levels.
8. Duration of treatment. In general, short courses of
treatment are preferable because they are less likely
to cause side effects. For example, pneumonia is
now treated for only 5 days and uncomplicated UTI
in women for only 3 days. If in doubt of when to
stop, be guided by ‘measures of response’ such as
temperature, heart rate, respiratory rate, white
blood cell count, C-reactive protein and culture
results. There are a few conditions requiring longer
antibiotic courses: these are usually deep seated
infections such as endocarditis.
Box 6.24 Bactericidal versus bacteristatic
Bactericidal drugs kill bacteria. Examples are
the beta-lactam agents (penicillins, cephalos-
porins, carbapenems) and quinolones.
Bacteriostatic drugs inhibit bacterial growth,
butdonotkillbacteria.Theyrelyonhostdefences,
especially phagocytic cells, to eliminate the infec-
tion. Examples are tetracyclines and macrolides.
Box 6.25 Important factors influencingantibiotic choice
Clinical diagnosis.
Spectrum of activity.
Pharmacokinetics.
The need to be right.
Side effects.
Cost.
304 Biomedical sciences

6.10.3 Antibiotic resistance
Resistance to antibiotics is a natural evolutionary
response of bacteria to antibiotic exposure. So the
introduction of antibiotics was soon followed by the
advent of antibiotic resistance. Drug companies devel-
op new classes of antibiotics to combat this, but
invariably bacteria develop resistance sooner or later.
Until recently, man kept ahead. From 1945 until the
late 1980s, new antibiotics were producedmore quick-
ly than bacteria could develop resistance. Now, how-
ever, progress is slowing. New classes of antibiotics
are hardly ever found --- not many new antibiotics are
being introduced, and those that do come along are
often improvements within classes, with no novel
mechanism of action. There is a real worry that some
infections are becoming untreatable with currently
available antibiotics. Also development of new anti-
biotics is not a priority for drug companies, as they are
less lucrative than other drugs, such as statins to reduce
cholesterol levels, which people take lifelong.
Intrinsic resistance occurs when the microbe does
not possess a target for the drug’s action or when it is
impermeable to the drug. For example, the lipopoly-
saccharide outer envelope of Gram-negative bacteria
blocks entry of many antibiotics.
Acquired resistance occurs when bacteria previ-
ously sensitive to an antibiotic become resistant to it.
For example, Staphylococcus aureus was almost always
sensitive to penicillin until the 1940s, when penicillin
became widely used. It soon developed resistance by
producing a beta-lactamase enzyme which breaks
down the beta-lactam ring in penicillin. Now, about
90% of S. aureus isolates in clinical practice are resis-
tant to penicillin.
Acquired resistance occurs because a bacterial cell
mutates, or it acquires a resistance gene from another
bacterium. Bacteria can divide every 20---30 min, so a
single resistant cell can produce a billion cells overnight
and become the predominant strain. Then resistant
strains can spread between patients in hospital and in
the community. This is more likely to happen if
antibiotic overuse exerts selection pressure.
Mechanisms of acquired antibiotic resistance:
. inactivation of the antibiotic, for example. beta-
lactamase production;. alteration or protection of the target site within the
bacterial cell, for example methylation of the 23S
ribosomal RNA subunit in staphylococci confers
resistance to macrolides;
. prevention of antibiotic entry into the cell, for
example Pseudomonas species can lose porins
(water-filled pores in the cell membrane) so that
beta-lactam antibiotics cannot enter;. removal of antibiotic from the cell, for example
tetracycline resistance arises when bacterial cells
synthesize a membrane protein which acts as a rapid
efflux pump;. metabolic bypass, for example trimethoprim resis-
tance. Trimethoprim acts by inhibiting the dihy-
drofolate reductase enzyme in bacteria. Resistant
bacteria synthesize a trimethoprim-insensitive vari-
ant of the dihydrofolate reductase enzyme, thus
bypassing the antibiotic’s mechanism of action.
Antibiotic overuse is undoubtedly a major cause of
acquired antibiotic resistance. Large amounts of anti-
biotics are used in hospitals, particularly in intensive
care areas (Section 6.9.3). General practitioners vary
greatly in their prescribing habits, and 80% of anti-
biotics used in the UK are prescribed by GPs. Another
less obvious culprit is the farming industry (see
Box 6.26). A restrictive antibiotic policy can be applied
in hospitals and in the community to limit antibiotic
use. Such policies are drawn up bymicrobiologists and
pharmacists, in consultation with other clinicians, and
may ban use of certain antibiotics whose use is linked
to problems with antibiotic resistance.
Extended spectrum beta lactamase(ESBL) simply
means a beta-lactamase enzyme (one which breaks
down the beta lactam ring of an antibiotic) which is
very broad spectrum and can inactivate many different
beta-lactam antibiotics, including extended spectrum
cephalosporins such as cefotaxime. There are several
Box 6.26 Antibiotic use in animals
More than half of all antibiotics produced
worldwide are used in animals, either to treat
infection or as growth promoters (to increase
weight gain). These antibiotic-exposed animals
may become colonised with resistant bacteria
and will eventually enter the food chain. Use of
the glycopeptide antibiotic avoparcin as a
growth promoter in Denmark led to 80% of
Danish broiler chickens becoming colonized
with the superbug VRE (vancomycin-resistant
enterococci). The European Union subsequent-
ly banned the use of antibiotics as animal growth
promoters, though they are still used elsewhere.
Chapter 6 Medical microbiology 305

different types of ESBL, with names such as TEM and
SHV which describe the gene which produces the
enzyme. These genes are frequently carried on plas-
mids. ESBL producers are typically multiresistant En-
terobacteriaceae. They can cause hospital outbreaks
but are increasingly common in the community, often
causing UTIs in the elderly [6]. Treatment options
include carbapenems for severe infections, or nitro-
furantoin or mecillinam for UTIs. Co-amoxiclav is
sometimes active against ESBLs.
AmpC is another type of beta lactamase commonly
found in multiresistant Enterobacteriaceae. It is unaf-
fected by beta-lactamase inhibitors such as clavulanic
acid, so AmpC positive bacteria are resistant to useful
antibiotics such as co-amoxiclav and piperacillin-ta-
zobactam. Treatment is usually with a carbapenem.
Carbapenem resistance is an increasing problem in
Enterobacteriaceae. Carbapenem antibiotics are usu-
ally considered as a last line of defence, active even
against ESBL and Amp C producers, so the emergence
of carbapenemases is perceived as a real threat.
Resistance may occur as a combination of ESBL or
AmpC together with porin loss, or through acquisition
of carbapenemase. Acquired carbapenemases are a
more serious risk. The types of carbapenemase that
have been seen in the UK to date are IMP, VIM and
New Delhi metallo beta lactamase NDM (all of these
are metallo enzymes, with zinc at the active site), and
KPC and OXA-48 (non-metallo enzymes). Most car-
bapenemase-producing bacteria have been imported
to the UK from other countries where antibiotic
overuse has led to widespread resistance [7].
Laboratory identification of carbapenemases can be
difficult as carbapenem susceptibility may be only
slightly reduced in vitro. Isolates with borderline or
low carbapenem sensitivity should be forwarded to the
reference laboratory for confirmation [8].
6.10.4 Antiviral drugs
Antiviral drugs were developed relatively recently. The
intracellular location of viruses and their use of host
cell machinery makes it difficult to develop a drug that
can reach the virus and destroy it without damaging
the host cell.
6.10.4.1 Nucleoside analogues
Aciclovir is active against herpes simplex and varicella
zoster viruses. It can be taken orally and crosses the
blood---brain barrier. It only becomes active in virally
infected cells. Ganciclovir is active against cytomega-
lovirus. Lamivudine is active against hepatitis B virus
and HIV. Ribavirin is a guanosine analogue which is
active against respiratory syncytial virus and hepatitis
C, andwhich has also been used to treat Lassa fever and
hantavirus infections.
An example is the treatment of viral meningitis and
encephalitis. Most cases of viral meningitis are caused
by enteroviruses, which cause a selflimiting illness and
do not usually require antiviral treatment. Herpes
simplex meningitis or encephalitis cause a more seri-
ous illness with significant neurological symptoms,
which may be provisionally diagnosed on clinical
grounds and then should be confirmed by herpes PCR
of CSF. This should be treated immediately with
intravenous aciclovir.
6.10.4.2 Antiretroviral compounds
HIV infection is treated with a combination of anti-
virals known as highly active anti-retroviral therapy
(HAART). Using a combination reduces the risk of
resistance occurring. The exact combination can vary
but is usually two nucleoside reverse transcriptase
inhibitors plus either a nonnucleoside reverse tran-
scriptase inhibitor or a boosted protease inhibitor (see
below). HAART causes a rise in CD4 count and a fall in
viral load, which reduces incidence of opportunistic
infections and improves survival. HIV treatment is a
highly complicated subject and is always overseen by
a specialist.
Nucleoside reverse transcriptase inhibitors (NRTIs)
are nucleoside analogues which inhibit the action of
reverse transcriptase (the enzymes which converts viral
RNA into a DNA copy). Example: zidovudine (AZT).
Nonnucleoside reverse transcriptase inhibitors
(NNRTIs) inhibit reverse transcriptase by a different
mechanisms. Examples: nevirapine, efavirenz. Prote-
ase inhibitors are highly effective at reducing viral load
but are prone to side effects and drug interactions.
Examples: nelfinavir, lopinavir.
6.10.4.3 Neuraminidase inhibitors
Oseltamivir and zanamivir reduce replication of influ-
enza A and B viruses by inhibiting viral neuraminidase.
They can be used to treat influenza, when they reduce
the duration of symptoms by 1---1.5 days, or to prevent
it (postexposure prophylaxis). Oseltamivir was widely
306 Biomedical sciences

used to treat and to prevent swine influenza in the 2009
influenza pandemic.
6.10.4.4 Interferons
Interferons are immunomodulatory compounds rath-
er than antiviral drugs, but they are used in combina-
tion with antivirals to treat chronic hepatitis. Such
treatment must only be commenced by a specialist.
Chronic hepatitis B is treated with peginterferon alfa-
2a with lamivudine, for up to 48 weeks. Chronic
hepatitis C is treated with peginterferon alfa and
ribavirin, for 24---48 weeks. The success of hepatitis
treatment can be assessed by quantitative PCR, to
demonstrate a reduction in viral load, at the end of
the course of treatment.
6.10.4.5 Immunoglobulins
Immunoglobulins may be given as postexposure pro-
phylaxis to prevent or attenuate a viral infection in a
susceptible person. This is known as passive immuni-
zation (Section 6.11.1).
6.10.5 Antifungal drugs
Fungi are eukaryotic organisms and antibacterial
agents are not effective against them. Antifungal agents
have been developed but are often quite toxic because
of the greater similarity between fungal and human
cells. Superficial infections such as dermatophytosis
(infection of the skin, nail or hair) or infection of
mucous membranes (thrush) are often treated with
topical applications in order tominimise toxicity; deep
infections require systemic treatment.
The main groups of antifungal agents are:
Azoles such as fluconazole. These interfere with the
demethylation of lanosterol during the synthesis of
ergosterol, which is the main sterol in the fungal cell
membrane. These are the most widely used antifun-
gal agents.
Polyenes such as amphotericin B and nystatin. These
bind to sterols in the fungal cellmembrane and cause
damage to it.
Echinocandins such as caspofungin. These are semi-
synthetic lipopeptides that interfere with the forma-
tion of glucans in the fungal cell wall. Used only for
severe systemic infections.
Pyrimidine analogues such as flucytosine, which is
converted intracellularly into 5-fluorouracil, which
is then incorporated into fungal RNA. Used only for
severe yeast infections.
Allylamines such as terbinafine. These interfere with
ergosterol synthesis. It accumulates in keratin and is
used to treat dermatophyte infections.
6.11 Vaccines
Immunization is used to induce immunity and control
the spread of infectious diseases. It may be active or
passive.
6.11.1 Passive immunization
Passive immunization is achieved by administration
of immunoglobulin (Box 6.27). This is a short-term
measure which takes effect within days but wanes
within weeks. It is used to protect people with immune
disorders or for postexposure management. Human
normal immunoglobulin (HNIG) is derived from the
pooled plasma of donors and contains antibodies to
infectious agents that are prevalent in the general
population. Specific immunoglobulins prepared from
Box 6.27 Example of passive immunizationfor postexposure prophylaxis
A 12-week pregnant woman spends the after-
noon with her friend’s child. Later that day the
child develops a rash typical of chickenpox. The
woman cannot recall whether she has ever had
chickenpox herself. Chickenpox in pregnancy
can cause congenital problems. The GP takes a
blood sample for urgent varicella antibody test-
ing. A positive result would indicate immunity.
A negative result means that she is susceptible to
chickenpox. She has had a significant exposure
to chickenpox, so if she is susceptible shemust be
given IM varicella zoster immunoglobulin
(VZIG) as soon as possible, provided by the
local microbiology department and given by the
GP or practice nurse. This will reduce the risk of
her developing chickenpox.
Chapter 6 Medical microbiology 307

hyperimmune donors are available for passive immu-
nization against hepatitis B, varicella zoster, tetanus
and rabies. Transfer of antibodies across the placenta
frommother to child also produces a passive immunity
which lasts only for weeks or months.
6.11.2 Active immunization
Active immunization or vaccination presents a mi-
croorganism, or antigens fromamicroorganism, to the
host in order to stimulate the host’s immune response.
The idea is to produce immunity without inducing the
disease or its complications. Such immunity is usually
long-lasting. Vaccines may be:
. Live attenuated --- contain whole, live micro-
organisms whose pathogenicity has been reduced
(attenuated). To be avoided in pregnancy or immu-
nocompromised patients. Examples: measles,
mumps, rubella (MMR), BCG (an attenuated strain
of M. bovis used to immunise against TB).. Inactivated --- contain inactivated or killed whole
organisms. Example: hepatitis A, inactivated polio-
myelitis vaccine (IPV).. Antigenic components --- contain the antigens
from the microorganism which are required to
stimulate the immune response. Examples: pneu-
mococcal vaccine contains polysaccharide from the
capsule, influenza vaccine contains a surface protein
called haemagglutinin.. Toxoid --- contain toxins which have been in-
activated so that they do not cause symptoms.
Examples: tetanus and diphtheria vaccines.
6.11.3 UK vaccination programme
Universal vaccine coverage in the UK currently in-
cludes those listed in Table 6.20.
Other vaccines may be required for particular risk
groups, for example over-65s are offered an annual
influenza vaccination and healthcare workers are of-
fered hepatitis B vaccination. The vaccination pro-
gramme is regularly updated. The best source of
information is ‘The Greenbook’ [9].
High levels of vaccine coverage will reduce the levels
of disease in the population. This means that even
unvaccinated individuals will be at less risk of catching
the disease --- a concept known as herd immunity. A
successful vaccination programmemay even be able to
eradicate a disease completely, as happenedwith small-
pox in 1980. The World Health Organization aims to
eradicate poliomyelitis next.
6.11.4 Vaccination of laboratorystaff
The best protection against catching an infection at
work is through adherence to good laboratory practice.
Vaccination is never a substitute for safe working
practices. All laboratory staff should be up to date
with their routine immunisations. In addition, BCG
and hepatitis B vaccinations are usually recommended.
This can vary from laboratory to laboratory depending
on what types of samples are processed.
6.11.5 Vaccine failure
Vaccine failure can occur and may be primary (when
an individual fails to respond to the vaccine) or
secondary (when an individual responds initially but
protection wanes over time). One common example is
failure to respond to hepatitis B vaccine, as demon-
strated by failure to generate an hepatitis B surface
antibody response. When this happens, it is worth
repeating the course of vaccination. If the patient still
Table 6.20 Vaccine coverage currently in the UK
Age Vaccine
Two months old Diphtheria, tetanus, pertussis,
polio, Hib, pneumococcus
Three months old Diphtheria, tetanus, pertussis,
polio, Hib, MenC
Four months old Diphtheria, tetanus, pertussis,
polio, Hib, MenC, pneumococcus
Twelve to thirteen months
old
Hib, MenC, measles, mumps,
rubella, pneumococcal
Three to five years old Diphtheria, tetanus, pertussis,
polio, measles, mumps, rubella
Twelve to thirteen years
old (girls only)
Human papilloma virus
Thirteen to eighteen years
old
Tetanus, diphtheria, polio
Hib¼Haemophilus influenzae b
MenC¼Meningococcus C
308 Biomedical sciences

fails to respond, check their hepatitis B core antibodies
--- sometimes the failure is because they have already
been infected with hepatitis B.
6.11.6 Vaccine safety
Vaccine safety is a contentious topic. All vaccines are
extensively tested before a license for use is granted.
Most vaccines have occasional mild side effects but it is
recognized that more serious reactions can rarely
occur. A scheme for reporting adverse reactions exists.
Most vaccine safety scares, such as the discredited
‘autism link to MMR’, are never proven, but have
serious consequences such as reduced vaccine uptake
leading to outbreaks of disease.
6.12 Conclusion
This chapter is just a taster for the speciality of micro-
biology. You can take away from this an overview of
common pathogens and an insight into the workings of
the microbiology laboratory. Microbiology is a truly
fascinating field, constantly changing as new pathogens
evolve and new techniques are introduced. It is also the
speciality where you least want to take your work home
with you! A career inmicrobiologymay be busy butwill
always provide interest and variety. Thanks to: Girish
Patel, John Clark, Jon Hutchinson, Clare Elwell, Cilla
Hashmi, Reena Devlia, Amin Bilal, Jill Leach, Lauren
Marlow, Sneha Patel, Helmut Schuster and all the staff
at Kingston and St Helier Hospital Microbiology De-
partments, and of course our families for their support.
Bibliography
1. Health Protection (Notification) Regulations 2010.
Available on the HPA website www.hpa.org.uk
2. Health Technical Memorandum 07-01: Safe manage-
ment of healthcare waste., Department of Health 2006.
Available at www.dh.gov.uk
3. House of Commons Public Accounts Committee
“Reducing Healthcare Associated Infection in Hospitals
in England” 2009 report. Available online at http://www.
publications.parliament.uk
4. Healthcare-Associated Infections and Antimicrobial
Resistance:, 2009/10, Health Protection Agency, report,
Published online September 2010, available as free
download from www.hpa.org.uk
5. Office for National, Statistics. MRSA and Clostridium
difficile mortality rates updated annually at http://www.
statistics.gov.uk. 2009datawas releasedon24August 2010.
6. Livermore DM, Canton R, Gniadkowski M et al. CTX-
M: changing the face of ESBLs in Europe. J Antimicrob
Chemother 2006; 59(2): 165---74.
7. Kumarasamy KK, TolemanMA,Walsh T.R. et al. Emer-
gence of a new antibiotic resistance mechanism in India,
Pakistan and the UK: a molecular, biological and epide-
miological study. Lancet Infect Dis 2010; 10: 597---602.
8. Advice on Carbapenemase Producers: Recognition, in-
fection control and, treatment. Department of Health
Advisory Committee on Antimicrobial Resistance and
Healthcare Associated Infection/Health Protection
Agency. January 2011. Available as free download at
www.hpa.org.uk
9. Immunisation against Infectious Disease (“The Green,
Book”). www.dh.gov.uk/en/Publichealth/Healthprotec-
tion/Immunisation/Greenbook
10. National Health Service/Health Protection Agency/Na-
tional Public Health service for Wales. National Stan-
dard Method BSOP 29 “Investigation of cerebrospinal
fluid”. Issued by Standards Unit, Evaluations and Stan-
dards Laboratory, Centre for Infections. Available on
Health Protection Agency website www.hpa.org.uk or at
www.evaluations-standards.org.uk.
Further Reading
Stokes, E.J., Ridgway, G.L. and M.W.D. Wren, M.W.D.
(1993) Clinical Microbiology, 7th edn, Edward Arnold.
Grayson, M.L. et al. (2010) Kucers’ The Use of Antibiotics,
6th edn, Hodder Arnold.
Hawkey, P. and Lewis, D. (eds) (2004)Medical Bacteriology:
A Practical Approach, 2nd edn, Oxford University Press.
Koneman, E.W. et al. (1997) Color Atlas and Textbook of
Diagnostic Microbiology, 5th edn, Lippincroft, Williams
and Wilkins.
Medical, Microbiology. Edited by David Greenwood,
Richard Slack, John Peutherer, Mike Barer. Elsevier. 17th
edition 2007.
Notes on Medical, Microbiology. Katherine N. Ward, A.
Christine McCartney, Bishan Thakker. Churchill Living-
stone, 2nd edition 2009.
Oxford Handbook of Infectious Diseases and, Microbiolo-
gy. Estee Torok, Ed Moran and Fiona Cooke. Oxford
University Press 2009.
Problem-orientated Clinical Microbiology and, Infection.
Hilary Humphreys, William Irving and C A Hart. Oxford
Medical Publications 2004.
Principles and Practice of Infectious, Diseases. Edited by
Gerald L. Mandell, John E. Bennett and Raphael Dolin.
Churchill Livingstone, 7th edition 2009.
Chapter 6 Medical microbiology 309


Chapter 7
Clinical immunology
Professor Ray K. Iles, B.Sc., M.Sc., Ph.D., CBiol, FSB, FRSC andProfessor Ivan M. Roitt, D.Sc., FRS, Hon. FRCP
There are huge overlaps in clinical chemistry, haema-
tology and histology with the discipline of clinical
immunology but this subarea of biomedical science
covers malfunctions of the immune system in autoim-
mune diseases, hypersensitivities, immune deficiency
and transplant rejection. Various laboratory investiga-
tions are conducted to diagnose and stage the extent of
these pathological conditions using histology, clinical
chemistry and haematological measurements. Howev-
er, the basis of clinical Immunology is an understand-
ing of the organs, cellular differentiation, genetics,
specific proteins and biological properties of the
immune system. Thus a basic understanding of the
fundamentals of Immunology is essential.
Part I: The fundamentalsof immunology
7.1 Overview of the immunesystem
The key primary lymphoid organs of the immune
system are thymus and bone marrow, and secondary
lymphatic tissues including both the encapsulated
organs, spleen, tonsils, lymph vessels, lymph nodes,
adenoids, and the unencapsulated mucosal tissue
(MALT) residing in the lung, the lamina propria of
the gut, genitourinary tract, salivary, lacrimal glands
and lactating mammary tissue (see Figure 7.1). When
health conditions warrant, immune system organs
including the thymus, spleen, portions of bone mar-
row, lymph nodes and secondary lymphatic tissues can
be surgically excised for examination while patients are
still alive. The primary lymphoid organs are where cells
of the immune system originate and develop into
immature forms. Cells destined to be lymphocytes or
myeloid cells all derive from a common progenitor
‘pluripotent’ stem cell population residing in the bone
marrow. The secondary lymphoid tissues are where
these immature forms encounter infectious challenges
react and differentiate as necessary as part of the
immune response. If one secondary structural tissue
of critical importance to the immune system was to be
singled out it would be the lymphatic system.
7.1.1 Lymphatic system
The lymphatic system is a network of very small blunt
ended vessels that drains interstitial fluid which has
Biomedical Sciences: Essential Laboratory Medicine, First Edition. Edited by Ray K. Iles and Suzanne M. Docherty.� 2012 John Wiley & Sons, Ltd. Published 2012 by John Wiley & Sons, Ltd.
311

been extruded from the blood capillaries (which are
under pressure) as part of their nourishment of tissues
or produced by the tissues themselves. Called lymph
the fluid is clear straw-coloured and contains protein
molecules, salts, glucose, urea and other potent bio-
chemical substances. This drainage network is essential
to keep the bodily fluid level in balance. However, it is
not a completely acellular fluid as immune system
white cells constantly migrate from the blood system
through tissue into the lymphatic drainage, hence the
term lymphocytes.
Although the lymph fluid is returned to the blood
system via openings in major vessels such as the left
subclavian vein (drained frommost of the lower body)
and right lymphatic duct (draining the right neck,
chest and arms) to the right subclavian vein; it is
constantly filtered by lymph nodes and other immu-
nological tissue including the spleen (see Figure 7.2). It
should be noted that the blood is also filtered by the
spleen. Since foreign and invading organisms and
substances will enter tissue, this drainage network is
the primary site inwhich to first detect and then defend
the body against infections that are or will happen.
Blockage of a lymph channel or draining lymph
gland (e.g. due to infection) will lead to swelling due to
the build up of localized lymph fluid in the interstitial
tissue spaces. However, this swelling (interstitial tissue
buildup of lymph fluids) is also a feature of immobility
as the fluid in lymph vessels can only flow due to
muscle contraction and movement. For example feet
and legs swell when sitting too long on trains and
planes because the lymph fluid is not being made to
flow by muscle contractions as a result of walking.
Lymph nodes (see Figure 7.3) are bean-shaped
and covered with a thick fibrous capsule subdivided
into compartments by trabeculae consisting of func-
tional cortex and medullary cells. The cortex is
populated mainly with lymphocytes and germinal
centres, the primary resting place for B Cells which
Figure 7.1 Diagrammatic representations of the primaryand secondary immune tissues
Figure 7.2 Diagrammatic representation of the parallelrelationship of the lymphatic system to the pressurized bloodsystem, illustrating how leaked blood plasma is collected andreturned as lymph
Figure 7.3 Typical lymph node
312 Biomedical sciences

will divide in response to antigen stimulation and
produce specific antibodies. The paracortex contains
T- cells that have circulated through the lymph
nodes, blood stream and lymphatic ducts monitor-
ing the tissues for infection. The medulla of the
lymph nodes is primarily made up of macrophages
attached to reticular fibres. Subcapsular macro-
phages process afferent lymphatic material and pres-
ent antigens to B cells in the cortex.
7.1.2 T-Cells
Immature cells destined to become T-lymphocytes
migrate from the bone marrow and enter the thymus
as thymocytes. These cells express the T-cell receptor.
Akin to the antigen binding domain of antibodies the
T-cell receptors, specifically complement the antigenic
shape they recognize and are the product of random
T-cell receptor domain gene rearrangement. In this
nursery the T-cell receptor of an individual thymocyte
will be tested for reaction against selfantigens and
the thymocytes with autoreactive T-cell receptors
ruthlessly deleted from the population. The next mat-
uration step is the designation of the response pathway
which activation of the T-cell receptor will elicit. Those
which differentiate to express a CD4 antigen (cluster
differentiation antigen 4) will be hardwired to be
T-helper cells and express cytokines; or CD8 (cluster
differentiation antigen 8) cells which once activated
will kill any cell which their T-receptor binds to.
These antigen naive T-cells migrate from the thy-
mus and populate the secondary lymphatic tissue
awaiting encounter with foreign antigens. On binding
a foreign antigen the primary function of the T-cell
receptor is to drive this antigen naive first generation
effector T---cell into a replication frenzy generating
thousands of clones which will be execution CD4þor CD8þ cells respectively either expressing cytokines
to aid the immune response or kill the antigen expres-
sing cells. A few of the daughter cells will not be
execution T-cells and will migrate into the spleen and
lymph nodes as CD4 and CD8 memory cells for the
antigen.
7.1.3 B-Cells
The progenitor B lymphocytes undergo maturation
and differentiation within the bone marrow. Genetic
rearranging occurs within the component domains
that make up an antibody, both antigen binding Fab
portions and the structural Fc domains that determine
whether the immunoglobulin is as an IgM, IgA, IgG,
IgE or IgD subtype, produced by this gene rearrange-
ment. Like T-cells those first generation B-cells expres-
sing an antibody (usually surface expressed in these
immature B-cells) reacting against selfantigens are
deleted by apoptoticmechanisms. The antigen-specific
naive B-cells migrate from the bone marrow and
populate the follicular centres of lymph nodes and
other lymphoid tissues waiting to react to passing
antigens which bind to their surface membrane bound
antibody. As with naive T-cells, the reaction of naive
B-cells to the antibody binding of its specific target
antigen is to drive the primary B-cell into frenzied
replication of genetic clones most of which will be
antibody factories called plasma cells churning out
billions of copies of the antibody - monoclonal anti-
bodies. A few of the daughter cells will not be plasma
cells and will migrate to the spleen and lymph nodes as
memory B-cells.
The memory T- and B-cells form the basis of
immunity and why vaccination is so successful: a large
population of memory cells means that a very rapid
and overwhelming immune response can be mounted
if a subsequent challenge with even the tiniest contact
with the foreign antigen/organism occurs. Clinical
illness resulting from the foreign organism is therefore
much less serious and often not noticed as the immune
response is so efficient at eliminating the foreign
organism.
7.1.4 Immunoglobulins
The product of specific plasma cell clones of activated
naive B-cells, there are five main classes of immuno-
globulin IgM, IgG, IgE, IgA and IgD (see Figure 7.4 and
Table 7.1).
The basic structure of the immunoglobulins is
illustrated in Figure 7.4(a). Although different im-
munoglobulins can differ structurally, they all are
built from the same four chain structure as their
basic unit. They are composed of two identical light
chains (23 kD) and two identical heavy chains
(50---70 kD). The heavy and light chains and the two
heavy chains are held together by interchain disul-
phide bonds and by noncovalent interactions. The
number of interchain disulphide bonds varies among
Chapter 7 Clinical immunology 313

different immunoglobulin molecules. Within each of
the polypeptide chains there are also intrachain
disulphide bonds.
When the amino acid sequences of many different
heavy chains and light chains were compared, it
became clear that both the heavy and light chain could
be divided into two regions based on variability in the
amino acid sequences. These are the light chain --- VL
(110 amino acids) and CL (110 amino acids) --- and the
heavy chain ---VH (110 amino acids) andCH (330---440
amino acids) --- domains. The regionwhere the arms of
the antibody molecule form a Y is called the hinge
region because there is some flexibility in the molecule
at this point. Carbohydrates are attached to the CH2
domain in most immunoglobulins. However, in some
cases carbohydrates may also be attached at other
locations.
Immunoglobulin fragments produced by proteo-
lytic digestion have proven very useful in elucidating
structure/function relationships in immunoglobulins.
Digestion with papain breaks the immunoglobulin
molecule in the hinge region on the N-terminal side
Figure 7.4 Generalized structure of immunoglobulins demonstrating sites of glycosylation disulphide bonds, hinge regionand the variable and constant domains (labelled C and V respectively) is illustrated in (a). The functional regions of the Agbinding site, Fc complement and placental transfer receptors are indicated in (b). The IgM pentameric structure is shown as isthe position of an addition Fc domain --- Cm4 --- and the J chain in (c). The dimeric structure of IgAwith its J Chain and secretorysignalling protein is indicated in (d). The generalized structure of IgE with its additional Cc4 Fc domain is shown in (e), whilstIgD’s structure with its additional membrane insertion tail piece to the Fc is indicated in (f)
314 Biomedical sciences

of the H-H interchain disulphide bond. This results in
the formation of two identical fragments that contain
the light chain and the VH and CH1 domains of the
heavy chain. These fragments were called the Fab
fragments because they contained the antigen binding
sites of the antibody. Each Fab fragment is monovalent
whereas the original molecule was divalent. The com-
bining site of the antibody is created by both VH and
VL. An antibody is able to bind a particular antigenic
determinant because it has a particular combination of
VH and VL. Different combinations of a VH and VL
result in antibodies that can bind different antigenic
determinants.
Digestion with papain also produces a fragment
that contains the remainder of the two heavy chains
each containing a CH2 and CH3 domain. This fragment
was called Fc because it was easily crystallized. The
effector functions of immunoglobulins are mediated
by this part of the molecule. Different functions are
mediated by the different domains in this fragment.
Normally the ability of an antibody to carry out an
effector function requires the prior binding of an
antigen;
The clinical essential about immunoglobulin pro-
duction is that IgM is the first type to be produced in a
primary immune response and measurement of an
IgM specific isotype is usually diagnostic of a primary
infection. Higher affinity IgG dominates at second
exposure to antigen is diagnostic of an established
immune response to the infection. Both IgM and IgG
are efficient activator of complement when bound to
an antigen in an immune complex. IgG is the only
maternal antibody that can cross the placenta and
therefore can transfer immunity (and sometimes a
foreign antigen/pathogen) to the fetus. IgA are specific
to secretion and are carried across mucosal cells to give
protection within the mucosae. The IgE class is
designed to activate mast cells and IgD is essentially
the only class found in lymphocyte membranes
(as receptors).
As B-cells mature they undergo instruction from
T-cells to switch the class of their heavy chain (i.e. m to
g,a or e) but never the specificity for the target antigen.
7.1.5 T-cell receptors
The T-cell receptor exists as a transmembrane hetero-
dimer with peptide domain similar to the Fab frag-
ment of the immunoglobulin (see Figure 7.5) with
variable and constant domains. There are two types of
T-cell receptor (TCR) and ab chain TCR found on all
CD4 T cells and the majority of CD8 T-cells and a glchain TCR found on 20% CD8 T-cells. The TCR
works in conjunction with the CD3 receptor found on
all T-cells. Another crucial ligand on CD4 T cells is
CD154; this is a surface ligand for the CD40 receptor
found on antigen presenting cells. The cell-to-cell
interaction via antigen presenting cells CD40 receptor
with CD154L on CD4 T helper cells ‘licences’ the
antigen presenting cell to activate other CD8 cytotoxic
T- and B-cells.
Table 7.1 Characteristics of the main immunoglobulin isotypes
IgG Ig M IgA IgE IgD
Clinical feature Dominant class
of antibody
Produced first
to response to
a new immune
antigen
Crosses into
mucous membrane
secretions
Allergy
specific Ig,
but designed
to work in defence
of nematode
infections
Found
predominately
on lymphocyte
membranes
Mean serum level (adults) 8---16 g/L 0.5---2 g/L 1.4---4 g/L 17---450mg/L 0---0.4 g/L
Half-life (days) 21 10 6 2 3
Complement fixation:
classic/alternative pathways
YES þþ YES þþþ YES þ NO NO
Classic Classic Alternative NA NA
Mast cell binding No No No YES þþþ No
Traverses placenta Yes þþþ No No No No
Chapter 7 Clinical immunology 315

7.2 Overview of the immuneresponse
The immune response is a complex interplay of innate
immunity, driven by cells which recognize set patterns
of molecules found on invading organisms, and adap-
tive immunity driven by cells that can mount a more
precise response to a specific immune challenge.
7.2.1 Orchestration of the immuneresponse by CD4 T-cell subsets
Although delineation of function is primarily deter-
mined by expression of CD4 helper or CD8 cytotoxic
markers, various subsets of these T-cells exist; there are
at least three classes of CD4 Pro-inflammatory
T-helper cells; the so-called Th1, Th2 and Th17 re-
sponse regulators. There is a further class of CD4
antiinflammatory T-cells or regulatory T-cells (Tregs)
of which three subsets are clinically identified. Various
cytokines can polarize the immune response based of
the CD4 T-cell subset they promote. These subsets are
described in Table 7.2.
7.2.2 Components of the innateimmune system
So far we have described the underlying cellular nature
of the adaptive immune systemwhich has been divided
into humoral B-cell and cellular T-cell components;
however, a more primitive innate immune system,
Figure 7.5 Diagrammatic representation of the ab chain T-cell receptor (TCR) illustrating its transmembrane domainand immunoglobulin (Ig) like Ag binding and constantdomains
Table 7.2 Functionality of CD4 T-cell subsets
T-cell subset Function Action Main polarizingcytokine
Main cytokinesproduced
Th1 Proinflammatory Orchestrate killing of bacteria, fungi
and viruses by activating
macrophages and cytotoxic T-cells
IL-12 IFNg, IL-2, TNFa
Th2 Proinflammatory Orchestrate killing of parasites by
recruiting Eosinophils promote
antibody response specifically
switching to IgE
IL-4 IL-4, IL-5, IL-13
Th17 Proinflammatory Recruiting cells to immune response
more resistant to Treg cell dampening
of responses
IL-6, IL-23 IL-17
Antigen induced Treg ---
Tr1 CD25þve Foxp3þve
Antiinflammatory Suppression of immune responses by
IL-10
IL-10 IL-10
Antigen-induced Treg
(Th3) CD25 ---ve, Foxp3-ve
Antiinflammatory Down regulates proinflammatory
responses
TGFb TGFb
Naturally occurring Treg
CD25þve Foxp3 -ve
Antiinflammatory Cell-to-cell down regulation of
immune response
IL-2, TGFb TGFb
316 Biomedical sciences

which does not improve with repeated exposure to
antigen, preexists. Many components of this immune
system are also cellular in nature, not associated with
any specific organ but are embedded in or circulating
through, various body tissues.
The first line of defence to infection is provided
by an array of cells which engulf or otherwise
destroy foreign organisms (see Table 7.3). Many of
the white blood cells are part of this innate immune
system:
Neutrophils (alternative name polymorphs due to
their distinctive multilobed nucleus) contain neu-
tral staining granules.More often found in the blood
and lymphatics than tissue, except in acute inflam-
matory responses, they phagocytose bacteria either
triggered by recognizing key antigens of the foreign
organism or because they have been coated by
immune reactive molecules such as antibodies
(opsonization).
Eosinophils are much more prevalent in tissue than
neutrophils and less prevalent in blood. They have
dense eosin-staining granules packed with cationic
proteins enzymes and toxins. Their main function is
to target large muticellular parasites such as hel-
minths (worms) causing destruction of the organ-
ism and recruiting other immune cells to clean up
the debris in a localized inflammatory response.
Unfortunately they can become sensitized to gener-
ally innocuous substances and play a major causa-
tive role in allergies like asthma. Indeed, in addition
to toxic substances eosinophils release leukotrienes
and platelet derived activating factor (PAF) which
have an effect on smoothmuscles and vasculature ---
in the case of asthma constriction of the air passages.
Eosinophils are activated by a variety of set chemi-
cals such as complement factors, chemokines
(eotaxin---1 and eotaxin---2) and cytokines such as
IL-3 and IL-5.
Mast cells and basophils are almost exclusively found
in skin and mucosal tissue and are characterized
by the expression of high affinity IgE receptors
which trigger degranulations (an antibody subtype
therefore associated with allergies) and a high
content of histamine-containing granules. Hista-
mine is a simple 111 Dalton amine which is
rapidly metabolized (blood half-life 5min) but is
the major product of mast cells. Its localized
biological action, constituting the acute inflam-
matory reaction is threefold:
1. erythema (reddening) of the skin due to arteriole
dilation and venule contraction;
2. wheal, swelling due to increased vascular perme-
ability leaking blood plasma into the tissue; and
3. flare, direct action on local nerve axons causing
widespread and distant vascular changes.
Table 7.3 Cells on the innate immune respons
Class of cell Subtype Function Primary target
Granulocyte Neutrophils Phagocytose and kill bacteria, release
antibacterial molecules
Bacteria, fungi
Eosinophils Release cellular toxins and proinflammatory
factors
Multicellular parasites
Basophils Release proinflammatory factors including
histamine
Mast cells Release soluble proinflammatory histamine
within tissues
Parasites
Mononuclear Monocytes (blood)
Macrophages (tissue)
Ingest and kill bacteria present processed
antigens to T-cells release proinflammatory
molecules IL-1 -, TNF-a, IFN-g, etc.
Intracellular pathogens recruit
adaptive immune response
Dendritic Myeloid dentricytes Ingest pathogen igrate to lymph nodes and
present antigens to T-cells
Recruit adaptive immune response
Plasmactoid dentrictic Migrate to inflammation sites and reactive
lymph nodes, release IFN’s and present
antigens to T-cells
Recruit adaptive immune response to
viral infections
Lymphoid Natural killer cells Lyse viral infected cells Viruses
Chapter 7 Clinical immunology 317

In addition to these cellular elements of the innate
immune response, a variety of soluble factors contrib-
ute to innate antimicrobial defences of the body (see
Table 7.4).
The innate cellular response is more limited and
preprogrammed in its repertoire than the adaptive
immune system. However, it can not only kill infec-
tious organisms and infected cells in its own right, but
is also crucial in controlling the adaptive immune
response of antibodies and T-cell mediated cell killing.
Immunology itself rests on an understanding of the
properties of these twobiological entities and howboth
systems are highly interdependent. This is no better
Table 7.4 Circulating and humeral innate immune response molecules
Class of molecule Example Primary target Source Function
Complement (40 plus circulating
proteins)
Bacteria, viruses Blood and lymph Lyse bacteria, opsonize, recruit
and activate immune cells and
promote inflammation
Collectins Mannose binding
protein
Bacteria Blood and lymph Binds bacteria and activates
complement
Pentraxins C-reactive protein Bacteria Blood and lymph Opsonize bacteria
Enzymes Secretary lysozyme Bacteria Secretions and
neutrophil released
Cleave bacterial cell wall
Defensins Bacteria and Fungi Neutrophil released Antibacterial and antifungal
polypeptides
Cathepsins Bacteria Neutrophil released Cellular digestion of phagocytized
pathogen
Elastase Bacteria Neutrophil released Intracellular digestion of
phagocytised pathogen, but also
breakdown of extracellular matrix
to aid migration
Collagenase Migration Neutrophil released Breakdown of extracellular matrix
to aid migration
Myeloperoxidase and
cytochrome B558
Toxic damage to
pathogens
Neutrophil released Halide and respiratory burst --- free
radical damage
Eosinophil peroxidase Toxic damage to
pathogens
Eosinophils released Reactive oxygen free radical
damage
Proteins Bacterial permeability
increase protein
Bacteria Neutrophil released Cellular digestion of phagocytized
pathogen
Major basic protein Helminths Eosinophils released Toxic damage to helminths
Eosinophil cationic
protein
Helminths Eosinophils released Toxic damage to helminths
Reactive amines Histamine Pathogens and
allergens
Basophils/mast cell
release
Vasodilatation, increased
permeability smooth muscle
contraction.
Leukotrienes C4 and D4 Pathogens and
allergens
Eosinophils released Alter smooth muscle and vascular
responses.
Prostaglandins PGD2 Pathogens and
allergens
Basophils/mast cell
release
Vasodilatation, increased
permeability,
bronchoconstriction
Proteoglycan Heparin Pathogens and
allergens
Basophils/mast cell
release
Anticoagulation
318 Biomedical sciences

illustrated than by the functioning of antigen presen-
tation functions of the monocyte/macrophage den-
dritic cell system.
7.2.3 Antigen presenting cells
Monocytes and macrophages derive from a sophisti-
cated lineage of mononuclear phagocytic cells. Mono-
cytes are blood circulating cells that subsequently
migrate to tissues as macrophages and some forms of
dendritic cell, particularly in response to an inflam-
matory event. Monocytes are divided in to two sub-
types: one positive for CD14 which is a receptor for
bacterial lipopolysaccharide, and the other CD14/
CD16 positive monocytes, CD16 being a receptor for
IgG antibodies.
In response to proinflammatory stimuli these cells
are activated and engulf bacteria, fungi and tissue
debris at the site of inflammation. Monocytes dif-
ferentiate into dendritic cells and macrophages in
response to the cytokine IL-4 and GM-CSF. At all
stages of differentiation they produce proinflamma-
tory cytokine in particular TNF-a, IL-1 and IFNgas part of the mechanism of presenting processed
fragments --- antigenic portions --- of the pathogen to
T-cells.
Dendritic cells have a distinctive morphology of
projecting tentacles (dendrites) from their ovoid cell
shape and very large distorted, but not lobular, nuclei.
They have the receptors to sense pathogens (TLR -
Toll-like receptors see Table 7.5) to sense pathogens,
phagocytose, process and present antigens to CD4 and
CD8 T-cells and are unique in their ability to activate
naive T-cells. What is more they determine the future
differentiation and function of the T-cells they recruit.
Activated dendritic cells secrete enormous quantities
of IFNa and migrate from tissues to local lymph
nodes to achieve T-cell activation while the direction
of T-cell functional differentiation they orchestrate
is tailored to the antigenic determinants of the
pathogen.
There are various subtypes of dendritic cells, such as
myeloid, plasmacytoid and Langerhans cells of skin, as
well as immature and mature counterparts.
7.2.4 Histocompatibility andregulation of antigen presentation
A feature of all cells is that they will express antigens
which are specific to an individual and identify cells of
one person as being different from that of another.
These are termed histocompatability antigens and are
coded on chromosome 6 as part of a major histocom-
patability complex (MHC) of genes (see Figure 7.6).
This MHC gene cluster codes for three classes of
protein: two are concerned with how foreign antigens
are presented to T- and B-cells to elicit an adaptive
immune response --- MHC class I and class II --- and a
third cluster of genes codes for complement genes, heat
shock proteins (HSPs) and the cytokine TNF a and
TNF b. MHC class I are still referred to as HLA genes,
reflecting their historical discovery as antigens present
on leucocytes (human leucocyte antigens) which
determined whether transplant organs are matched or
induced transplantation rejection. There are three
major types termed HLA-A, HLA-B and HLA-C and
along with the class II MHC are highly polymorphic.
Equally expressed by both maternal and paternal de-
rived copies of chromosomes 6 all our nucleated cells
will express two variants of HLA-A, HLA-B, and so on
(except when the antigen in both parents is identical).
The reason they induced such a potent adaptive im-
mune response is because they are in fact functional
Table 7.5 Toll receptor and their target pathogen associated molecular pattern (PAMP) molecules
Pathogenic organism PAMP Toll receptor Antigen presenting cell type
Gram-positive bacteria Peptidoglycan TLR2 Myeloid dendritic cells
Viruses Double-stranded RNA TLR3 Myeloid dendritic cells
Gram-negative bacteria TLR4 Myeloid dendritic cells
Viruses Single-stranded RNA TLR7 Plasmacytoid dendritic cells
Viruses Double-stranded DNA TLR9 Plasmacytoid dendritic cells
Chapter 7 Clinical immunology 319

receptor molecules which present small antigenic frag-
ments of digested proteins to immune T-cells, to
induce a specific adaptive response. Thus, in addition
to the polymorphic differences which make them
appear ‘foreign’ to the immune system, the grafted
MHC molecules will differ from autologous MHC in
the structures of their receptor grooves which
will accommodate a different extensive set of antigen
fragments, even those derived from ‘self ’ proteins to
which the recipient’s T-cells are not tolerant. Thus
the graft induces a highly potent immunological rejec-
tion mechanism, just as though it were an invading
pathogen.
7.2.5 Antigen presentation
HLA class I molecules have the role of presenting short
8---10 amino acids antigenic peptides to the T-cell
receptor of those T-cells also expressing the CD8
receptor. The HLA molecule consists of a transmem-
brane protein in which the large extra cellular domain
Figure 7.6 Human HLA complex. From Male et al, Immunology, Seventh Edition, 2006� Elsevier
Figure 7.7 (a) Schematic representation of dentritic cell (DC)---T-cell interaction. This interaction, is mediated mostly bythe class IImajor histocompatibility complex presentationmolecule presenting a foreign pathogens antigenicmolecule to theT-cell receptor (TCR) and CD 4 molecule on the DC and T-cell surface, respectively, leading to T-cell activation andproliferation. In so-called ‘cross-priming’ the processed antigen associates with MHC class I and interacts with CD8 cytotoxicT-cell precursors. Costimulatory molecules B7 on the DC and CD28 on the T-cell are obligatory for successful activation.(b) Foreign antigenic peptides processed by an infected cell are presented on the cells as a complexwith class I/HLAmoleculeswhich presents and interacts with the TCR on activated cytotoxic immune cells like CD8 T-cell, stimulating the immune cell tokill and recruit disposal of the infected cell
320 Biomedical sciences

noncovalently binds a common serum protein b2Microglobulin. HLA-A, HLA-B and HLA-C are con-
stituently expressed by all nucleated cells; however,
HLA --- E, F and G are only expressed by specialized
cells or in special circumstance, such as by fetal tissue
in utero, and can alter --- even downregulate --- the
immune response. A subgroup of MHC class I related
(MICA) antigens is expressed by stressed/virally in-
fected epithelial cells and is targeted by natural killer
cells of the innate immune system as the recognition
receptor for cell---cell killing (Figure 7.7).
MHC class II genes have three major subgroups
termed DP, DQ and DR of which each contain an A
and B gene. ThematureMHC class II antigen is a hetro
dimeric ab surface protein complex. These molecules
present slightly longer 12---15 amino acid antigenic
fragments of processed pathogens to T-cells that are
also expressing the CD4 receptor. MHC class II anti-
gens are not constituently expressed by all nucleated
cells and were originally thought restricted to cells of
the immune systems. However, cytokines --- and in
particular IFN-g --- can induce MHC class II antigen
expression by all cell types.
There are three major routes to antigen processing
and presentation:
Endogenous route A property of all nucleated cells
whereby peptides processed as part of intracellular
turnover of peptides are incorporated and displayed
by HLA class I antigen complexes. Self proteins are
ignored, but if virally infected fragments of the viral
protein made by the cell are presented they are
recognized as foreign. The HLA-class I viral peptide
complex is surveyed by T-cells bearing CD8 and
induce a cytotoxic response.
Exogenous route A differentiated function of antigen
presenting cells (APC) whereby phagocytized
pathogens and other antigenic complexes are bro-
ken down and the resultant peptides complexed and
presented byMHC class II antigens. ThisMHC class
II---pathogen peptide complex interacts with CD4
T-cells. These in turn can facilitate and enhance B-
cell response (antibody production) as well as T-cell
responses.
Cross presentation Dendritic cells in particular are
able to process foreign antigens so that both HLA
class I activation of CD8 T-cells (endogenous route
short 8---10 amino acid fragments) andMHC class II
activation of CD4T-C cells (exogenous route 12---15
amino acid fragments) occurs simultaneously.
7.3 MHC genotyping,autoimmunity andsusceptibility to disease
Although it is necessary to match HLA and MHC
antigens for donor recipient compatibility in trans-
plantation (except corneal grafts as this tissue is not
surveyed by T-cells due to the lack of a blood supply to
the eye’s surface) particular MHC genotypes are asso-
ciated with susceptibility to various diseases.
Genetic polymorphism and the fact that both pa-
ternal and maternal HLA/MHC complex genes are
expressed equally, results in huge phenotypic variation
in the antigen presenting HLA/MHC complex mole-
cules in a population. The structural molecular vari-
ability is predominantly in the peptide binding groove,
the region that recognizes the foreign antigen. Thus the
ability to hold on to --- and therefore present --- any
given pathogenic antigen to induce a specific adaptive
immune response can be dependent on the binding
ability and repertoire of HLA/MHCgenes one inherits.
This variability is a good thing in gross population
terms as it ensures that at least some of the population
will be immune and be able to mount an effective
adaptive immune response to an epidemic/pandemic
infectious agent. However, on an individual basis this
may mean that a certain foreign antigens are never
effectively presented or indeed that one presents
degraded selfantigens, which may closely resemble a
pathogen’s antigen and induce autoimmunity.
7.3.1 Conditions associated withparticular genotypes
Genotyping has involved identifying the specific var-
iants of the HLA and MHC class II genes. Labelling is
denoted first by the gene locus from which they origi-
nate, that is HLA-A, HLA-B, HLA-C, DP, DR, DQ (see
Figure 7.4). For the class I genes this is followed by an
asterisk and a two---four digit number that defines the
variant (e.g. HLA-B*02). The same system applies for
MHC class II molecules but both the A and B genes are
both listed variants, with the exception of the DR locus
where all of our A genes are identical and only the B
gene variable. A lower case ‘w’ after the gene locus
refers to a classification whereby the international
Chapter 7 Clinical immunology 321

tissue typing association are agreeing the unique ge-
notype and have assigned a preliminary ‘workshop’
numeric designation. A person’s HLA---MHC geneo-
type may look like:
HLA---A*02/A*24, HLA---B*18/B*35, HLA---C0001/
Cw*0602,
DPA1*0111/DPB1*0112 DQA1*0102/DQB1*0602,
DRA/DRB1*0402.
Certain alleles are associated with disease process
and are illustrated in Table 7.6.
7.4 Physical age andimmunocompetency
The body’s ability to react to antigen varies according to
the age of the person, antigen type,maternal factors and
the area where the antigen is presented. Neonatal fetus
is considered to be in a state of physiological immuno-
deficiency, because both the innate and adaptive im-
munological responses are greatly suppressed. Once
born, a child’s immune system responds favourably to
protein antigens while not as well to glycoproteins and
polysaccharides. Consequently many of the infections
acquired by neonates are caused by low virulence
organisms like Staphylococcus and Pseudomonas. In
neonates, opsonic activity and the ability to activate the
complement cascade is very limited; the mean level of
C3 in a newborn is approximately 65% of that found in
the adult. Phagocytic activity is also greatly impaired in
newborns. By 6---9months after birth, a child’s immune
system begins to respond more strongly to glycopro-
teins. Not until 12---24 months of age is there a marked
improvement in the body’s response to polysacchar-
ides. This can be the reason for the specific time frames
found in vaccination schedules.
Maternal factors also play a role in the body’s
immune response. At birth most of the immunoglob-
ulin present is maternal IgG. Since IgM, IgD, IgE and
IgA do not cross the placenta, they are almost unde-
tectable at birth; although some IgA is provided in
breast milk. These passively acquired antibodies can
protect the newborn for up to 18 months. However,
these antibodies can also produce a negative response:
if a child is exposed to the antibody for a particular
antigen before being exposed to the antigen itself then
the child will produce a dampened response. Similarly
Table 7.6 HLA and MHC class II genotypes associated with disease phenotypes
HLA Class I or MHC ClassII genotype
Condition Disease classification
HLA---A*02, HLA---A*24,
HLA---B*18, HLA---B*35
Susceptibility to type 1 diabetes Autoimmunity
HLA---B*27 Susceptibility to ankylosing spondylitis Inflammation
HLA---B*27, HLA-B*51,
HLA---B*57
Human immunodeficiency virus infection --- associatedwith slow progressive
disease
Infection
HLA-B*35 Human immunodeficiency virus infection --- associated with rapid
progressive disease
Infection
HLA---Cw*0602 Susceptibility to psoriasis Inflammation
DQA1*0102/DQB1*0602 Protection from type 1 diabetes Autoimmunity
DQA1*0301/DQB1*0302 Susceptibility to type 1 diabetes Autoimmunity
DQA1*0501/DQB1*0201 Susceptibility to type 1 diabetes Autoimmunity
DQA1*0501/DQB1*0201 Susceptibility to coeliac disease Autoimmunity
DQB1*0201 & DRB1*0402 Susceptibility to pemphigus vulgaris Autoimmunity
DRB1*03 & DRB*04 Susceptibility to autoimmune- hepatitis Autoimmunity
DRB1*0404 Susceptibility to rheumatoid arthritis Autoimmunity
DRB1*1501 Susceptibility to multiple sclerosis Autoimmunity
DRB1*1501 Susceptibility to antiglomerular basement membrane disease Autoimmunity
322 Biomedical sciences

the response of T-cells to vaccination differs in children
compared with adults, and vaccines that induce Th1
responses in adults do not readily elicit these same
responses in neonates.
During adolescence the human body undergoes
several physical, physiological and immunological
changes. These changes are started and mediated by
different hormones. Depending on the sex, at 12 and
10 years either testosterone or 17-b-oestradiol, startacting. However, these steroids act not only on the
primary and secondary sexual characteristics, but also
have an effect on the development and regulation of
the immune system: the female sex hormone 17-
b-oestradiol has been shown to regulate the level of
immunological response. Similarly, some androgens,
like testosterone, seem to suppress the stress response
to infection, but other androgens like DHEA have the
opposite effect. There is an increased risk in developing
autoimmunity for pubescent and postpubescent fe-
males and males. It has been suggested that cell surface
receptors on B-cells and macrophages may respond to
various reproductive peptide hormones. In addition to
hormonal changes physical changes such as the invo-
lution of the Thymus during puberty also affect the
immunological response.
Part II: Laboratoryinvestigations and immuneassessments (Table 7.7)
7.5 Inflammation andchronic infection
Acute inflammation sees activation of the innate
immune system: direct activation of complement,
mast cell degranulation, swelling, changes in blood
flow, pain and redness. As a result of cytokine release
such as IL-1, IL-6, TNF-a, and so on, fever often
results as these reach the hypothalamus. C-reactive
protein is also produced by the liver due to increas-
ing circulatory levels, particularly of IL-6. Neutro-
phils and granulocytes migrate to the site(s) of
infection due to changes in adhesion molecule
expression by local blood vessel endothelial cells and
interstitial spaces may fill with pus --- a mixture of
pathogen and cellular debris and abundant granu-
locytes. This will be walled in by fibrin and reactive
Table 7.7 Common clinical laboratory tests evaluating the immune system
Parameter Interpretation Diagnostic method
C-reactive protein Raised levels indicative of infection or inflammation Immunoassay
Complement C3 and C4 Low levels indicate consumption in immune complex disease Immunoassay
Immunoglobulins Low levels indicate antibody deficiency, usually due to
underlying disease or immunodeficiency Elevated levels,
particularly IgM, indicate acute infection
Colorimetric protein and
specific immunoassay
IgE Raised levels in autoimmunity, can pinpoint allergen specific IgE
responses
Immunoassays
Neutrophil respiratory
burst
Absent in immune deficiency chronic granulomatous disease Functional assay
T-cell proliferation Low in primary T-cell immunodeficiencies Functional assay
Neutrophils High levels in bacterial infections low in secondary
immunodeficiency
Haematological cell count
Eosinophils High levels in parasite infections or allergic reactions Haematological cell count
CD4 T cells Low levels in HIV infections Haematological cell count
Rheumatoid factor and
antiCCP autoantibodies
Rheumatoid arthritis Immunoassay
Double-stranded DNA
antibodies
Systemic lupus erythematosus (SLE) Immunoassay
Acetylcholine receptor
antibodies
Myasthaemia gravis Immunoassay
Chapter 7 Clinical immunology 323

fibroblasts forming a containment sphere. Lymphat-
ic traffic of the foreign antigens, either free or carried
by antigen presenting cells to the lymph nodes, may
also induce localized inflammation --- red tracks in
the tissue --- lymphangitis. This triggers the adaptive
immune response activating T- and B-cells and the
first response is to produce IgM antibodies within
7---14 days postinfection which will change to high
affinity IgG antibodies and IgA antibodies if it is a
mucosal tissue response. Scavenging macrophages
help resolution of the infection.
Chronic infection is where the immune response is
not as dramatic nor are infections resolved so quickly.
Immune responsesmay be triggered --- or only partially
triggered --- as the infectious agent is mostly hidden
intracellularly such as latent hepatitis B and C and
mycobacteria. Even environmental toxins such as
asbsestos and silicon are partially hidden but slowly
leach giving a burst of immune response. Intermittent
exposure as in hay fever and even autoimmune stimuli
catches the immune system in an insidious trap of not
properly clearing the supposed infection and the tissue
damage caused by chronic repeated activation of
lymphoid and mononuclear cells.
Chronic inflammation can lead to permanent
organ and vascular damage and the rapid recall
inflammatory response, evident within 24---48 h post-
exposure is both a feature and test for chronic infec-
tion/inflammatory conditions --- the so-called type IV
hypersensitivity tests of contact dermatitis and the
Mantoux test for tuberculosis immunity. The immu-
nological event is the presences of proinflammatory
antigen presenting cells --- particularly macrophages,
B- and T-cells. Indeed these cells can be present in
such organization that it resembles the germinal
centres of lymph nodes misplaced in other tissue such
as joints in rheumatoid arthritis. Both Th1 and Th2
responses are seen but are often polarized such as Th1
response in cases of chronic mycobacterium and viral
infections but Th2 responses in cases of chronic
allergic reactions.
7.6 Autoimmune diseases
Autoimmune disease is estimated to affect 5% of the
population at some stage of their life. This is a
situation in which the immune system responds to
specific self molecules as if they were foreign particles.
Given the vast array of possible antibodies and T-cell
receptors it is highly likely that some will be generated
that are autoreactive. Indeed a degree of autoreactivity
exists as the T-cell receptor is designed to react with
the selfHLA and MHC class II molecules but recog-
nize the tiny fragment held within the binding groove
is foreign.
In order to prevent autoimmune responses result-
ing from the inevitable generation of novel naive
autoreactive T- and B-cells three major (and other
minor) checkpoints are in place:
. First, during the early stages of development in the
thymus, T-cell clones with strong affinity antiself
T-cell receptors are deleted.. Secondly in any immune reaction naturally arising
T regulatory cells (Tregs) are generated to damp
down or even stop a reaction particularly if it is
to --- or crossreacts significantly with --- abundant
selfantigens.. Thirdly, dendritic cells have to overcome selfaware-
ness blockage before they can activate CD4 T-cells.
Autoimmunity therefore can occur in cases of
failures in either complete Thymic development or
the inability of the given selfantigen to be expressed/
presented within the thymus. Similarly genetic defects
can and do effect Treg cells and subtle failure of Tregs
has been implicated in diseases such as type 1 diabetes.
Linked to this is failure of antigen presenting cells to
distinguish activation of an autoreactive T-cell. Den-
dritic cells being particularly important in recruiting
the entire gambit of immune responses are therefore
key in escalating autoreactivity to a clinically florid
autoimmune disease. This is proposed to occur in two
major ways:
. Tissue damage --- the release of hidden selfantigens,
which were never presented by the thymus and are
now actively presented by dendritic cells, particularly
in circumstance of an infection as a reactive adjuvant
allows activation of autoreactive CD4 T-cells
along with the pathogen specific ones --- bystander
activation.. Pathogen mimics of selfantigens --- an entirely ap-
propriate immune response to a pathogen results in
T- and B-cells that react with similar (not necessarily
identical) selfantigens --- molecular mimicry.
We know more of the molecular mechanism
of tissue damage due to stimulation of autoimmune
324 Biomedical sciences

responses: direct CD8 T cell cytotoxity, cytokine
damage such as IL1 and TNF; complement fixation
as a result of autoantibodies binding to target tissue;
autoantibodies binding soluble selfantigens and pre-
cipitating as complexes in tissue (and the kidneys’
nephrons) then recruiting complements to produce a
damaging chronic inflammatory response which
nonspecifically kills all adjacent cells in the proximity;
autoantibodies binding a surface receptor activating
or blocking it to cause pathology (see Table 7.8).
7.7 Transplant rejection
Immunological rejection is the inevitable consequence
of a graft of tissue between genetically nonidentical
Table 7.8 Examples of common autoimmune disease
Disease Target antigen Pathology
Addison’s disease Adrenal cortical cells, 21a-hydroxylase Adrenal failure as cortical cells are destroyed,
antibodies target corticosteroid synthesis enzyme
Goodpasture syndrome Glomerular basement membrane (GBM)Type IV
collagen fragment
Antibody reaction to Goodpasture antigens on the
basement membrane of the glomerulus of the kidneys
and the pulmonary alveolus
Graves’ thyroiditis Thyroid stimulating hormone receptor (TSHr) Autoantibodies bind TSHr continually stimulating
production of thyroid hormones --- hyperthroidism
Hashimoto’s thyroiditis Thyroid peroxidize, thyroglobulin Antibodies cause gradual destruction of follicles in
the thyroid gland leading to hypothroidism
Vitiligo Pigment cell antigen Cellular destruction mediated rather than antibody
direct killing of pigment cells
Systemic lupus
erythematosus (SLE)
? Antinuclear antigens nRNP A and nRNP C
including, in particular, DNA plus a variety of
other antigens
Widespread symptoms of immunological destruction
of tissues and deposition of antinuclear protein
complexes thought to be triggered by failure to clear
apoptotic cells by scavenger macrophages
Multiple sclerosis (MS) Myelin basic protein, myelin oligodendritic
glycoproteins
Immune cell mediated progressive demyelination of
nerves leading to muscle fatigue and nervous system
collapse
Type I diabetes ? Antiproinsulin and antiglutamic acid
decarboxylase.
Autoimmune cell mediated destruction of insulin-
producing beta cells of the pancreas
Primary biliary cirrhosis ? anti mitochondrial pyruvate dehydrogenase and
anti nuclear antigen
Cell mediated slow progressive destruction of the
small bile ducts (bile canaliculi) within the liver
Rheumatoid arthritis Citrullinated protein/peptide, rheumatoid factor
(antibody to the Fc portion of IgG !)
Inflammatory response of the synovium (synovitis)
secondary to hyperplasia of synovial cells, excess
synovial fluid and the development of pannus in the
synovium
Scleroderma ? Anti-topoisomerase, anti-centromere anti-U3
and anti-RNA polymerase antibodies
Chronic CD4 T cell mediated autoimmune disease
characterized by fibrosis (or hardening) of tissue,
vascular alterations and autoantibodies
Sj€ogren’s syndrome Alpha-fodrin Immune cells attack and destroy the exocrine glands
that produce tears and saliva
Myasthenia gravis Acetylcholine receptors Antibodies block the muscle cells from receiving
neurotransmitters --- voluntary muscle weakness
Pernicious anaemia Gastric parietal cells and intrinsic factor Destruction of cells responsible for absorption of B12
or antibody blockade of the B12 carrier protein ---
intrinsic factor
Pemphigus vulgaris Desmoglein Antibodies attack desmosmal proteins of the skin
causing blistering
Chapter 7 Clinical immunology 325

individuals in the absence of adequate immune sup-
pression. Rejection occurs in waves, the first is hyper-
acute which is a response that is seen within minutes
and hours when preformed antibodies predominantly
antiblood group (or HLA if this foreign tissue type has
been encountered before) affix to the grafted tissues.
An acute response occurs 7---14 days later when T-cells
join the attack (this can be accelerated acute if the tissue
type has prior sensitized the recipient) and if this is
controlled by steroid and immune suppressive drugs
like ciclosporin A, a chronic phase ensues. Months
to years later reactive B-cells are producing new tissue-
specific antibodies that affix complement bringing
destruction of the graft. The T-cell response is against
the whole foreign HLA/MHC molecule --- direct allor-
ecognition ---whilst the chronic response is a processed
one against small peptides of the foreign HLA/MHC
antigens --- indirect allorecognition.
Aside from matching a suitable blood group, some
HLA and MHC antigens are more important
than others and so partial matching in addition to
appropriate immunosuppressive therapy is common.
HLA-A, HLA- B and DR genotypes are regarded as the
most important to match.
7.8 Hypersensitivities
Under some circumstances a harmless molecule can
initiate an immune response that can lead to critical
tissue damage and death. In type 1 (immediate)
hypersensitivity the binding of an antigen to specific
IgE bound by IgE receptors on mast cells results in
immediate and massive degranulation; the conse-
quential inflammatory response is ferocious
and very damaging. Yet the antigens (allergens)
involved are typically inert molecules present in the
environment.
The immediate effects of the allergen are often
very florid (early response) and are seen within a few
hours. Of even greater concern are the late phase
responses which are mediated by Th2 cells recogniz-
ing peptide epitopes of the allergen. They recruit
eosinophils and the late phase response is chronic
inflammation which is much more difficult to con-
trol. In asthma the late phase response gives rise to
wheezing due to the eosinophil leukotryene release
causing constrictions of airways. The immediate
hypersensitivity is normally responsive to antihista-
mines but late-phase responses will not be and
require much more potent, but slower acting, corti-
costeroids to control the immune cells.
The tendency to develop allergic responses (atopy)
display strong inheritance tendencies and 20---30% of
the UK population are atopic. Two thirds of atopic
individuals, who have been characterized due to
circulating levels of specific antiallergen IgE, have
clinical allergic disease. This ranges from hay fever
(allergic rhinitis), allergic eczema, uritcara, angioede-
ma, to asthma, food, bee and wasp venom allergies.
Diagnosis is usually made from clinical history and
skin prick testing --- introducing a tiny amount of the
allergen under the skin and measuring the size of the
weal --- or measurement of the levels of allergen
specific IgE.
The term anaphylaxis describes an allergic reac-
tion that is so rapid on onset and serious that it may
cause death. Due to an acute generalized (not local
site) IgE mediated immune reaction of mast cells and
basophils it is characterized by an allergen priming
followed by reexposure. The allergen has to be
systematically absorbed either by ingestion or par-
enteral injection in order to provoke this whole body
response. Of the foods that often do this nuts (pea-
nut, Brazil, cashew), shellfish (shrimp, lobster), dairy
products and eggs are the most noted. The less
common food anaphylactic agents are citrus fruits,
mango, strawberries and tomatoes. Of the directly
injected known anaphylactic agents venoms (bees,
wasps, etc.) are the best recognized, whilst of the
medications antisera and antibiotics are the most
recognized. However, dextrans and latex (from sur-
gical gloves and condoms) can induce anaphylaxis
and are absorbed into the systemic circulation
through the skin.
7.9 Immune deficiency
Infections associated with immunodeficiency have
several typical clinical features:
. The causative infecting organism is often unusual
being either atypical or opportunistic.. The infection is often chronic, severe or recurrent.. Following antibiotic treatment they return quickly
and may only ever partially resolve during therapy.
Most forms of clinical immunodeficiency are sec-
ondary and result from infection (e.g. HIV) or therapy
326 Biomedical sciences

(e.g. cytotoxic drugs, corticosteroids, antiTNFa anti-
body therapy, radiation damage or indeed bone
marrow ablation prior to stem cell transplantation).
Disease or drug induced myelosuppression, increased
hypersplenic destruction and autoimmune reactivity
to neutrophils makes acquired neutopenias very
common and as blood neutrophil counts drop below
5� 108/L infection rapidly overwhelms innate
immunity.
Hypogammaglobulinaemias are seen in patients
with myeloma and chronic lymphocytic leukaemia
and lymphoma. Spleenectomy, although not fatal will
lead to an inability to mount an effective immune
response against pneumococcal, meningococcal and
other capsulated bacteria.
Primary immunodeficiency is rare and is the result
of either a congenital developmental defect of immune
cells or inherited genetic defects (invariably autosomal
or X-linked recessive). They manifest after birth any-
where from infancy to adulthood depending on expo-
sure to different pathogens. Examples of primary
immunodeficiency are given in Table 7.9.
Table 7.9 Examples of primary immunodeficiency
Disease Phenotypic defect in the immune system
Chronic granulomatous disease (GCD) --- failure in generating antibacterial
respiratory burst metabolites
Neutrophil functional deficiency
Leucocyte adhesion deficiency (LAD) --- failure of components of cell adhesion
responsible for leucocyte rolling and passage from blood stream at sites of
infection
Neutrophil and other leucocyte deficiency in tissue
penetration
Hyper Ig E syndrome --- failure in STAT3 secondary messenger signalling, high
serum IgE, cysts, dermatitis as neutrophils fail to respond to IgE binding to
pathogens
Neutrophil functional deficiency
Mutation in compliment proteins --- depending on the protein the alternative,
classic or indeed both pathways may not function impairing innate or adaptive
immune responses
Complement deficiency
DiGeorge Syndrome --- The thymus (and parathyroids and aortic arch) fails to
develop. Affected children have reduced/absent T-cells and immune
proliferation responses
T-cell deficiency
CD3 and IL-2 gene mutations --- Deficiencies in CD3 receptor and IL-2 mean that
the necessary growth/proliferation signal to activated T-cells is absent
T-cell deficiency
X-linked agammaglobinopathy (XLA) --- IgG levels are low usually less than 2 g/L,
B-cell development is arrested at the preB-cell stage and B-cells are absent from
the blood. (After maternal IgG levels fall newborns succumb to recurrent
infection)
B-cell deficiency
Selective IgA deficiency --- Most common immunodeficiency (�1/600 North
Europeans); normal IgG and IgM but very low IgA --- recurrent mucosal tissue
infections
B-cell deficiency
Severe combined immunodeficiencies (SCID) --- This is a collection of diseases
with various molecular causes (including adenosine deaminase deficiency)
whereby T-cell, NK-cell and B-cell development is impaired. The most common is
an X-linked defect of the IL-2 receptor g chain but as this is a shared componentof IL-4, IL-7, IL-9 and IL-15 receptors its affects are widespread
T- and B-cell deficiency
Hyper IgM syndrome (HIGM) --- Only effectively produce an IgM response, an X-
linked defect on the CD40 ligand: signalling between CD40L on T-cells with CD40
on B-cells is necessary to effect class switch from low-affinity IgM to high-
affinity immunoglobulin G, A, etc.
T- and B-cell deficiency
Wiskott---Aldrich syndrome --- An X-linked defect associated with eczema and
thrombocytopenia an unexplained fall in immunoglobulin levels which is cell
mediated and considered autoimmune
T- and B-cell deficiency
Chapter 7 Clinical immunology 327

Bibliography
Delves, P.J., Martin, S.J., Burton, D.R. and Roitt, I.M. (2011)
Roitt’s Essential Immunology, Wiley-Blackwell.
Hall, A. and Yates, C. (2010) Immunology: Fundamentals of
Biomedical Science, Oxford University Press.
Male, D., Brostoff, J., Roth, D. and Roitt, I. (2006) Immu-
nology, Mosby.
Sompayrac, L. (2008)How the Immune SystemWorks, Wiley-
Blackwell.
328 Biomedical sciences

Chapter 8
Haematology and transfusionscience
Dr Suzanne M. Docherty, BMedSci, MBBS, Ph.D.
8.1 Introduction andcomponents of blood
Haematology is the study of blood. Blood is a connec-
tive tissue comprising cells (red blood cells and white
blood cells, plus cellular fragments; platelets) sus-
pended in a straw-coloured fluid, plasma, to circulate
through the arteries, capillaries and veins of the body.
The average adult has around 5 L of blood. Haematol-
ogy also considers the disorders of blood that can arise,
while transfusion science focuses on the different
products that are made from donated blood, and how
these are best used for different patients with different
markers on their own red blood cells, and in a variety of
haematological disorders.
8.1.1 Red blood cells
Red blood cells --- or erythrocytes --- are the most
numerous cells found in blood, and have a lifespan
of around 120 days. There are some 5million red blood
cells/mL of blood, giving an overall average red blood
cell count of around 5� 1012/L in adults. Red blood
cells are a biconcave disc shape (i.e. they look like a flat
disc that someone has squeezed between finger and
thumb in themiddle!) and about 7mmindiameter. The
structure of the red blood cell makes it uniquely flexi-
ble; red blood cells need to be able to squeeze through
capillaries that are only 3 mm in diameter, despite their
7mm size, for which they obviously need to be able to
bend considerably to fit. The flattened disc shape also
gives the red blood cell a large surface area/volume
ratio, which is ideal for efficient gas exchange. The
structure of the red blood cell is shown in Figure 8.1.
8.1.2 White blood cells
The normal range for white blood cells (also known as
leucocytes) is around 4.0---11.0� 109/L in humans.
There are five types of white blood cells, given in
descending order of frequency in blood: neutrophils,
lymphocytes, monocytes, eosinophils and basophils
(many people use the mnemonic ‘Never Let Monkeys
Eat Bananas’ to remember this order!). The character-
istics of each are described below.
Biomedical Sciences: Essential Laboratory Medicine, First Edition. Edited by Ray K. Iles and Suzanne M. Docherty.� 2012 John Wiley & Sons, Ltd. Published 2012 by John Wiley & Sons, Ltd.
329

8.1.2.1 Neutrophils
Neutrophils are the most abundant of the white blood
cells; the normal range in blood is 1.5---7.5� 109/L
(Figure 8.2). Neutrophils are 9---15mm in diameter, and
contain numerous small granules and a nucleus with a
variable number of segments (usually 2---5 segments).
They are a pale pink/purple in a Romanowsky stain. The
function of neutrophils is chemotaxis into areas of
inflammation, then phagocytosis, and the killing of
phagocytozed bacteria. The majority of neutrophils in
blood are circulating in plasma, but a minority form a
marginated eutrophils pool, attached to the endothelium
of small blood vessels. Neutrophils have a half-life in
blood of around 7h.
8.1.2.2 Lymphocytes
The normal range for lymphocytes in blood is 1.2---3.5�109/L, making them the second most frequent white
blood cells in plasma (Figure 8.3). Lymphocytes are
7---16mm in diameter, with a large round nucleus that
has large chromatin clumps and almost fills the cell.
They have a few fine granules in their small rim of
cytoplasm, and appear pale blue in Romanowsky
stains. B-cells comprise 10---30% of lymphocytes, T-
cells form 65---80% of lymphocytes, while 2---10% are
nonB-, nonT- (null) cells. Lymphocytes are involved in
specific immune responses; the production of antibo-
dies by B-lymphocytes, and cell-mediated immunity by
T-lymphocytes. They have a half-life of around 70 h,
though some B-lymphocytes are immortal.
8.1.2.3 Monocytes
The normal range for monocytes in blood is 0.2---0.8�109/L (Figure 8.4). Monocytes are 15---30 mm in diam-
eter, with a moderately low nucleus/cytoplasmic ratio.
The nucleus is of variable shape, but often C- or U-
shaped, with some lacy chromatin.With a Romanows-
ky stain, monocytes have a variable number of fine
Figure 8.1 The red blood cell
Figure 8.2 A neutrophil --- note the segmented nucleus andfine granules
Figure 8.3 A lymphocyte --- note the large nucleus/cytoplasm ratio
330 Biomedical sciences

purplish granules amid a pale blue cytoplasm, in which
vacuoles are often visible. Around half of all monocytes
are found in the spleen, while the rest typically circulate
in the bloodstream for 1---3 days before migrating into
tissues and differentiating into larger tissue macro-
phages. Monocytes and macrophages are phagocytes
capable of killing some microorganisms.
8.1.2.4 Eosinophils
Thenormal range for eosinophils inblood is 0.02� 0.6�109/L (Figure 8.5). Eosinophils are 12---17mm in diame-
ter, with a low nucleus/cytoplasm ratio. The nucleus
usually has two segments and eosinophils contain nu-
merous large, round reddish granules (since they readily
take up eosin in the Romanowsky stain), giving them a
distinctiveappearance.Theyhaveahalf-lifeofaround6h
in blood. Eosinophils’ granules contain histamine, per-
oxidase, ribonuclease, deoxyribonuclease, lipase and
plasminogen among other substances, and the function
of eosinophils in defence against parasite, viruses and
mediation of allergy often results in release of the toxic
contents of their granules (degranulation).
8.1.2.5 Basophils
The normal range for basophils in blood is 0.01� 0.15�109/L (Figure 8.6). Basophils are 10---14 mm in diam-
eter, with a low nucleus/cytoplasm ratio. The nucleus
usually has two segments, often seen with overlying
granules, and a basophil’s several granules stain pur-
plish-black on a Romanowsky stain. The granules
contain histamine, proteolytic enzymes, cytokines
and heparin. Basophils mediate immediate-type
hypersensitivity with histamine release, andmodulate
inflammatory responses using substances like heparin
to increase blood flow to tissues.
8.1.3 Platelets
Althoughplatelets appear tobe tiny, simple fragments of
a larger cell (the megakaryocyte), their complex com-
posite structure underlines their important function
Figure 8.4 A monocyte
Figure 8.5 An eosinophil --- note the multiple red granules,and nucleus with multiple segments
Figure 8.6 A basophil --- note the dark granules obscuringthe nucleus
Chapter 8 Haematology and transfusion science 331

in haemostasis. As shown in Figure 8.7, they contain
mitochondria, a glycogen store and different types of
granules, the contents of which can be released using an
intricate tubular network within the platelet.
8.1.4 Plasma
Plasma is a pale yellow, clear fluid in which the cellular
components of blood are suspended, and it comprises
around 55% of blood volume (Box 8.1). Around 90%
of plasma is water, and dissolved in this are numerous
proteins (including clotting factors and fibrinogen),
glucose, hormones, ions and carbon dioxide
(Figure 8.8).
8.2 Routine laboratoryblood tests
8.2.1 Full blood count
The full blood count or FBC (known as the ‘complete
blood count’, CBC, in the USA) is the most frequently
requested haematological investigation on patients
(Box 8.2). Blood is collected into tubes that contain a
compound that will prevent clotting (e.g. potassium
citrate), and in the laboratory, samples are drawn into
an automated analyser which dilutes and then runs a
set volume of the blood through an electrical current
to enable all of the cells in the blood to be counted
as they pass through the current and individually
Figure 8.7 Blood film with platelets arrowed (left). Structure of a platelet
Box 8.1 Serum v. plasma
‘Serum’ is not an interchangeable word for
‘plasma’. Serum does not contain clotting fac-
tors and fibrinogen, and is thus found in blood
that has been allowed to clot. Plasma is prepared
from blood with an added anticoagulant to
prevent clotting.
Figure 8.8 Centrifuged blood sample showing plasma andcellular components of blood; a thin ‘buffy coat’ layer (plate-lets and white blood cells) sits between the red cells andplasma
332 Biomedical sciences

interrupt it. The red blood cells are then burst with a
lytic solution, and white blood cells and platelets are
counted again using the same method (platelets are
easily distinguished from white blood cells using this
method as they interfere less with the electrical cur-
rent by virtue of being so much smaller than white
cells). The white blood cell counts and platelet counts
obtained are subtracted from the initial total cell
count to enable the red blood cell count to be calcu-
lated (Figure 8.9). The different types of white blood
cells are estimated by running the dilute sample
through a very narrow capillary tube one by one, and
a laser beam directed onto each cell gives a character-
istic pattern of reflection, scattering or transmission
according towhich type of white blood cell it is. In this
way, white cell populations are estimated.
8.2.1.1 Indicesmeasured in a full blood count andnormal ranges
Haemoglobin level
Haemoglobin level is the quantity of haemoglobin
in a given volume of blood, and is given in g/dL
(dL¼ one tenth of a litre, i.e. 100ml) or g/L.
Normal ranges for haemoglobin
Adult males: 13.5---17.5 g/dL (135---175 g/L).
Adult females: 11.5---16 g/dL (115---160 g/L).
Red blood cell count(RBC).
Red blood cell count (RBC) is simply the number of
red blood cells in 1 L of blood, as counted by automat-
ed analysers.
RBC normal ranges
Adult males: 4.5---6.0� 1012/L.
Adult females: 3.9---5.0� 1012/L.
8.2.2 Red blood cell distributionwidth (RDW)
Red blood cell distribution width (RDW) is a mea-
surement of how widely red blood cells vary in volume
in one blood sample. In normal circumstances, red
blood cells vary little around their normal volume, but
in some forms of anaemia, they can vary widely in
volume and shape --- this is known as anisocytosis.
RDW is calculated in automated analysers by dividing
the standard deviation of the mean red blood cell
Box 8.2 Gender differences
Note that males and females differ in terms of
their red blood cell count, and the haemoglobin
concentration packed into each red blood cell.
After puberty, males have higher red cell counts
(which in turn gives them a higher haematocrit
than females) and haemoglobin concentrations.
This is mainly due to the anabolic hormone
testosterone, of which males have considerably
higher levels after puberty.
Figure 8.9 An example of a normal full blood count produced by an automated analyser
Chapter 8 Haematology and transfusion science 333

volume, by the mean cell volume (MCV: see Section
8.2.5). The RDW normal range is 11---42%.
8.2.3 Reticulocytes
The reticulocyte count is a measurement of the pro-
portion of red cells that are immature reticulocytes,
and gives an insight into bone marrow activity. It is
expressed as a percentage of the total number of red
cells. Reticulocytes are slightly larger than mature red
blood cells and still contain some ribosomal RNA (see
Figure 8.10). After bleeding or haemolysis, the reticu-
locyte count will be increased; if the reticulocyte count
is low despite anaemia, it may be due to bone marrow
failure, or a lack of iron, B12 or folate for red blood cell
formation. The reticulocyte normal range is < 2%.
8.2.4 Haematocrit
The term ‘haematocrit’ refers to the total volume of
blood that is comprised of cells. It is also known as the
packed cell volume (PCV); in practice, the vast major-
ity of cells in blood are red blood cells, so haematocrit is
considered equivalent to the total red blood cell vol-
ume. Haematocrit is expressed either as a percentage
(e.g.HCT 38% --- thismeans that cells comprise 38%of
blood volume), or in L/L (e.g.HCT0.38 L/L --- so 0.38 L
out of 1 L of blood is the cellular component). It can be
measured by centrifuging heparinized blood in micro-
capillary tubes and simply measuring the cellular and
serumcomponents in a specialized haematocrit reader,
but it ismore usually calculated in automated analysers
in haematology laboratories by multiplying red cell
volume by red cell count (this latter method has the
added advantage of being slightly more accurate than
directly measuring PCV, as PCVwill also include some
serum between cells, while calculation of haematocrit
excludes this). The normal ranges (NB: normal ranges
vary from lab to lab, and those given here are average
values) are:
adult males: 43---49%
adult females: 37---43%.
8.2.5 Mean cell volume (MCV)
Mean cell volume (MCV) is the average volume of a
single red blood cell. It is an extremely useful index
in patients with anaemia, as different causes of
anaemia are associated with small, normal-sized or
large red blood cells. MCV is measured in femtolitres
(abbreviated as fL, femto is 10�15), and can be
calculated by dividing the haematocrit by the red
blood cell count; that is, the total volume of red
blood cells divided by the number present will give
the volume of one red blood cell.The normal range
for MCV is 80---96 fL.
8.2.6 Mean corpuscularhaemoglobin (MCH)
Mean corpuscular haemoglobin (MCH) is a calculated
value for the amount of haemoglobin in each red blood
cell, and is measured in pg (picograms, where pico is
10�12). It is calculated by dividing the haematocrit by
the red blood cell count. The normal range for MCH is
27---32 pg.
8.2.7 Mean corpuscularhaemoglobin concentration (MCHC)
Mean corpuscular haemoglobin concentration
(MCHC) is the amount of haemoglobin in a given
volume of packed cells and as such is measured in
g/dL. It is calculated by dividing the haemoglobin
level by the haematocrit. The normal range for MCHC
is 32---36 g/dL.
Figure 8.10 Reticulocytes (arrowed) in a blood film. Source:www.hematologyatlas.com
334 Biomedical sciences
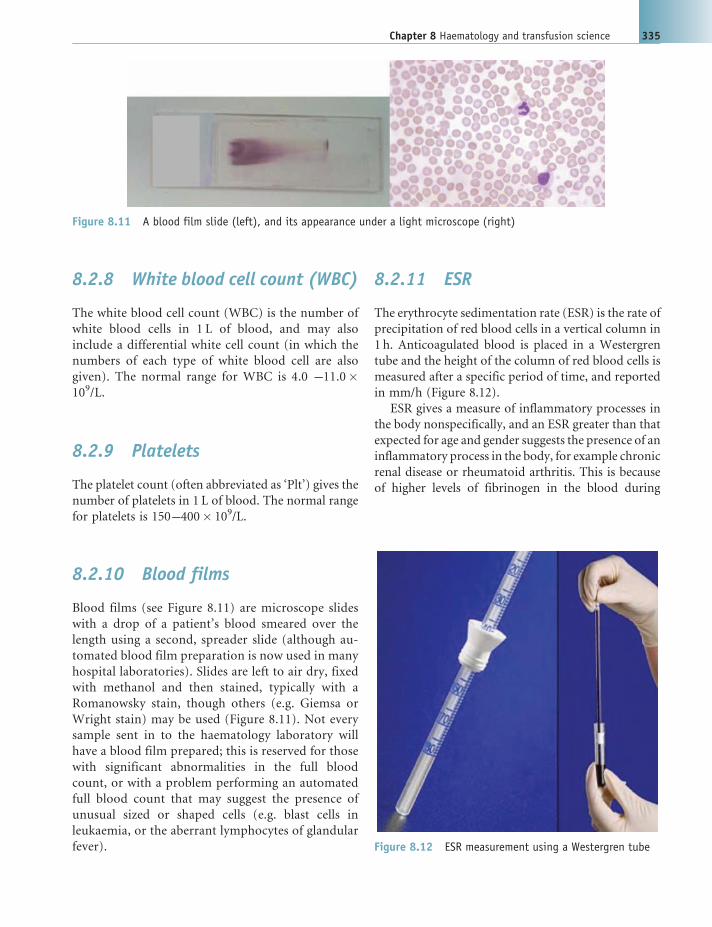
8.2.8 White blood cell count (WBC)
The white blood cell count (WBC) is the number of
white blood cells in 1 L of blood, and may also
include a differential white cell count (in which the
numbers of each type of white blood cell are also
given). The normal range for WBC is 4.0 ---11.0�109/L.
8.2.9 Platelets
The platelet count (often abbreviated as ‘Plt’) gives the
number of platelets in 1 L of blood. The normal range
for platelets is 150---400� 109/L.
8.2.10 Blood films
Blood films (see Figure 8.11) are microscope slides
with a drop of a patient’s blood smeared over the
length using a second, spreader slide (although au-
tomated blood film preparation is now used in many
hospital laboratories). Slides are left to air dry, fixed
with methanol and then stained, typically with a
Romanowsky stain, though others (e.g. Giemsa or
Wright stain) may be used (Figure 8.11). Not every
sample sent in to the haematology laboratory will
have a blood film prepared; this is reserved for those
with significant abnormalities in the full blood
count, or with a problem performing an automated
full blood count that may suggest the presence of
unusual sized or shaped cells (e.g. blast cells in
leukaemia, or the aberrant lymphocytes of glandular
fever).
8.2.11 ESR
The erythrocyte sedimentation rate (ESR) is the rate of
precipitation of red blood cells in a vertical column in
1 h. Anticoagulated blood is placed in a Westergren
tube and the height of the column of red blood cells is
measured after a specific period of time, and reported
in mm/h (Figure 8.12).
ESR gives a measure of inflammatory processes in
the body nonspecifically, and an ESR greater than that
expected for age and gender suggests the presence of an
inflammatory process in the body, for example chronic
renal disease or rheumatoid arthritis. This is because
of higher levels of fibrinogen in the blood during
Figure 8.11 A blood film slide (left), and its appearance under a light microscope (right)
Figure 8.12 ESR measurement using a Westergren tube
Chapter 8 Haematology and transfusion science 335

inflammatory diseases, which causes red cells to stick
together in stacks (‘rouleaux’), which pile up faster and
create an elevated ESR. However, ESR increases with
age, is higher in females than in males, and is depen-
dent on Hb concentration (it is increased in anaemia,
and low where Hb is high). The normal ESR is calcu-
lated as follows:
</¼ (age in years/2) for male adults.
</¼ ((age in years þ10)/2) for female adults.
8.2.12 Plasma viscosity
Some laboratories report plasma viscosity instead of
ESR, which is similarly dependent on the concentra-
tion of large molecules --- such as fibrinogen and
immunoglobulins --- in blood. The advantages of using
plasma viscosity instead of ESR are that the normal
range is independent of Hb level, it is the same inmales
and females, and only slightly higher in older adults.
Plasma viscosity results can also be produced rapidly,
in around 15min.
8.2.13 Bone marrow biopsy
Samples of a patient’s bone marrow may be required
to assist in the diagnosis of some haematological
conditions, and are usually acquired from the pos-
terior iliac crest of the pelvis using either trephine
biopsy, or bone marrow aspiration (occasionally,
both are needed). For a bone marrow aspirate, a
special aspirate needle is inserted through the skin
over the pelvis under local anaesthetic and then
twisted through the bone into the marrow cavity.
A syringe is attached, and a sample of liquid bone
marrow aspirated into it. For a trephine biopsy, a
larger needle with a hollow cavity is inserted into the
pelvic bone and a solid core of bone marrow ob-
tained. For both forms of bone marrow sampling, a
film of the bone marrow is made to be examined
under the microscope, and the cells obtained may
also be analysed using techniques such as flow cyto-
metry to look at surface markers on the stem cells, or
fluorescent in situ hybridization to analyse chromo-
somes (Figure 8.13).
8.3 Haemopoiesis
The bone marrow is one of the most fertile tissues of
the body and is responsible for the production of
more than 1013 new blood cells each day --- an
incredible feat. Haemopoiesis is the term for the
production of new blood cells. The first primitive
blood cells are detectable from around the fourth
week of gestation, where they are produced in the
fetal yolk sac and migrate to the liver and spleen.
The latter are the major sites of haemopoiesis until the
third trimester of gestation, when the bone marrow
becomes the main source of blood cells. Throughout
postnatal life, the bone marrow is the only normal site
of haemopoiesis and almost all bones of the body
contain red marrow, producing blood cells, at birth.
However, by adulthood, most of these red marrow
cavities have been replaced by yellow marrow (com-
posed predominantly of fat), and only the long bones
and some of the cavities within the axial skeleton still
contain red marrow for haemopoiesis. The liver and
spleen may still be pressed into service as sites
of extramedullary haemopoiesis if disease processes
demand more haemopoiesis than the red marrow can
produce, but this is always abnormal.
Figure 8.13 Normal bone marrow aspirate film (left) and trephine biopsy film (right)
336 Biomedical sciences

Every type of blood cell is ultimately derived from
pluripotent stem cells of the redmarrow. Such cells are
capable of both self and renewal and also of dividing
along different lineage pathways to give rise to a range
of possible cells. The two major pathways that plurip-
otent stem cells of bone marrow divide along initially
are into either lymphoid stem cells (from which lym-
phocytes are produced), or myeloid stem cells (from
which all other types of blood cell derive). The possible
pathways of haemopoiesis, alongwith themain growth
factors involved in the control of each arm, are shown
here in Figure 8.14.
The differentiation of the pluripotent haemopoietic
stem cell into different blood cells is controlled by a
wide range of growth factors, which act on receptors
expressed by blood cells at their various stages of
development as illustrated in Figure 8.14. Some of
these growth factors have been developed into clinical
treatments; erythropoietin (EPO) is normally pro-
duced by the kidney and causes increased production
of erythrocytes, and this can be given to patients who
are anaemic due to renal disease, with a consequent
lack of EPO. Granulocyte colony stimulating factor
(G-CSF) can be used in patients who have received
chemotherapy to improve their full blood count.
8.4 Red blood cell structure,disorders and metabolism
8.4.1 The red blood cell membrane
The plasma membrane of the red blood cell com-
prises the lipid bilayer with associated membrane
proteins found on all cells of the body, but it has a
Figure 8.14 Normal haemopoiesis and associated growth factors. Source: http://en.wikipedia.org/wiki/File:Hematopoietic_growth_factors.png
Chapter 8 Haematology and transfusion science 337

number of special features necessary to fulfil its
multiple functions and retain its inherit strength
and flexibility while travelling the equivalent of
hundreds of miles around the circulation in its life-
span. In addition to the lipid bilayer, the red cell
membrane also has a glycocalyx on its external
surface; this is rich in carbohydrates. The lipid
bilayer contains a large number of associated mem-
brane proteins and within the red cell is an extensive
cytoskeleton linked to these --- it is these membrane
proteins and their connection to the cytoskeleton
within the red cell that enables the red cell to
combine flexibility with robustness. Integral proteins
that provide the links across the entire plasma mem-
brane and cytoskeleton are known as vertical con-
nections, while the proteins of the cytoskeleton
present just on the internal face of the plasma
membrane are called horizontal connections
(Figure 8.15).
8.4.2 The glycocalyx
Manyof the proteins found in the plasmamembrane of
the red blood cell are profoundly glycosylated; that is,
they have a network of polysaccharide carbohydrate
groups associated with them along the external face of
the plasma membrane. This glycocalyx has numerous
functions on the red cell, including assisting with cell
adhesion, immune system recognition and carbohy-
drate antigens that are important in human blood
grouping.
8.4.3 Major membrane proteins
More than 50 proteins have been described in the red
cell membrane in various quantities. Some are rare,
while others have several hundred thousand copies per
red cell. Around half carry blood group antigens, while
others act as ion channels, transport proteins or cell
adhesion molecules. The most important structurally
are the glycophorins, spectrin, ankyrin, Band 3, pro-
teins 4.1 and 4.2.
8.4.3.1 Glycophorins
The glycophorins are heavily glycosylated, major
integral proteins that cross the entire red cell plasma
membrane. Glycophorin A is part of the MN blood
grouping system, glycophorin B bears the Ss blood
group proteins and glycophorin C carries antigens of
the Gerbich blood groups.
Figure 8.15 The structure of the red cell membrane, showing important membrane proteins and their links to thecytoskeleton. From Hoffbrand et al, Postgraduate Haematology, Sixth Edition 2010, reproduced by permission of John Wiley& Sons Ltd
338 Biomedical sciences

8.4.3.2 Spectrin, ankyrin, Band 3 and proteins 4.1and 4.2
The a and b subunits of the spectrin form a hetero-
dimeric molecule. Ankyrin is a large molecule that
attaches spectrin to Band 3, a major integral protein
that spans the red cell membrane, along with protein
4.2. Together, these molecules --- spectrin, Band 3,
protein 4.2 and ankyrin --- form a network to maintain
red cell conformation and flexibility.
8.4.4 Hereditary disorders of thered cell membrane
The shape of the red blood cell is intimately depen-
dent on the presence of membrane proteins, and
mutations in the genes that encode these proteins
can adversely affect red cell conformation, resulting in
characteristic clinical syndromes. The most impor-
tant of these are hereditary spherocytosis, hereditary
elliptocytosis, hereditary pyropoikilocytosis and he-
reditary stomatocytosis.
8.4.4.1 Hereditary spherocytosis
Hereditary spherocytosis is an inherited form of hae-
molytic anaemia in which affected red blood cells take
on a characteristic small, spherical shape --- spherocytes
--- rather than the usual biconcave disc shape. It is
relatively common in Caucasians (with an incidence of
1 in� 2000 inNorthern Europe), and usually inherited
in an autosomal dominant pattern. It is usually caused
by the inheritance of a defective gene for ankyrin, but
can also be due to defects in spectrin, Band 3 or protein
4.2, any ofwhich can lead to cytoskeletal dysfunction in
the red cell due to the adverse effects on vertical
connections. The presence of small spherocytes in the
circulation triggers their haemolysis, with resultant
mild anaemia and jaundice, and a small degree of
splenomegaly. Full blood count shows mild anaemia
and the blood film will show the presence of spher-
ocytes (Figure 8.16).
The red cells in hereditary spherocytosis are more
rigid than normal red cells and tend to prove relatively
resistant to haemolysis if incubated with 0.5% NaCl
(the osmotic fragility test). The clinical course of
hereditary spherocytosis is variable in different indi-
viduals, even within the same family. Most will expe-
rience a mild anaemia but occasionally there is severe
anaemia in some individuals, who may be treated with
removal of the spleen (splenectomy --- this works as
removing the spleen removes a substantial source of
premature red cell removal from the circulation).
Aplastic crises (bonemarrow failure, usually transient)
can develop after certain infections such as with Par-
vovirus 19, requiring transfusion and support. Gall-
stones are a common complication, as in other forms
of haemolytic anaemia. Folic acid supplements are
usually recommended to allow for increased require-
ments due to the shortened lifespan and rapid turnover
of red cells.
8.4.4.2 Hereditary elliptocytosis and hereditarypyropoikilocytosis
Inherited mutations of the a or b spectrin genes causesa dysfunction in the horizontal connections along the
red cell membrane and gives rise to a spectrum of red
cell morphological disorders. These range from the
mild common hereditary elliptocytosis (HE) to the
more distorted red cell forms seen in hereditary pyr-
opoikilocytosis (HPP).Most forms ofHE are inherited
in an autosomal dominant fashion, while HPP is of
autosomal recessive inheritance. HE and HPP are
relatively common in malarial regions of the world,
due to the relative resistance to malaria conferred by
these conditions. Both tend to cause haemolytic anae-
mia, though HEmay be clinically silent in the majority
of cases. The blood film appearances vary according to
the mutation inherited and typical appearances of HE
andHPP are given in Figure 8.17. InHE elliptocytes are
Figure 8.16 Blood film in hereditary spherocytosis, withspherocytes arrowed. From Hoffbrand et al, PostgraduateHaematology, Sixth Edition 2010, reproduced by permissionof John Wiley & Sons Ltd
Chapter 8 Haematology and transfusion science 339

seen, while in HPP, cells are highly variable in size
(anisocytosis) and shape (poikilocytosis).
The clinical picture in HE varies from silent carriers
who are asymptomatic through to mildly shortened
red cell life span, and to full blownhaemolytic anaemia.
No treatment is usually necessary for HE. However, in
HPP there ismoderate to severe haemolytic anaemia in
most cases, and folic acid supplements are usually used,
with splenectomy where there is severe anaemia.
8.4.4.3 Hereditary stomatocytosis
Stomatocytes are unusual looking red blood cells,
named after the slit that appears to look like a mouth
(‘stoma’) that is seen on the red cells in blood films in
this condition. This disorder is inherited in an autoso-
mal dominant fashion and is caused by a leak of Naþ
and Kþ ions from the red cell membrane. Most in-
dividuals who inherit this disorder have a moderate
haemolytic anaemia associated with macrocytosis
(large red cells) and there will be an increased serum
Kþ level caused by the leaks from red blood cells. The
blood film generally shows the presence of stomato-
cytes, as shown in Figure 8.18. Most cases of hereditary
stomatocytosis require no treatment, but in some
cases, splenectomy may be recommended.
8.4.5 Red cell metabolism
In order to maintain its shape and perform gas ex-
change effectively using its full complement of haemo-
globin molecules, the red blood cell needs a source of
energy, and also reducing power to reduce methaemo-
globin (see Section8.5.5)back intodeoxyhaemoglobin.
Since it has no nucleus or mitochondria, the red cell is
not capable of protein synthesis or oxidative phos-
phorylation. It thus relies on anaerobic glycolysis, the
hexose monophosphate shunt (also known as the pen-
tose phosphate pathway) and the glutathione cycle for
generating ATP and providing reducing power. How-
ever, as noprotein synthesis is possible in the red cell, no
enzymes can be replaced in these metabolic pathways
during its lifespan --- enzyme activity thus declines over
the red cell’s life, contributing to its ageing.
8.4.5.1 Glycolysis in the red blood cell: theEmbden---Meyerhof pathway
During glycolysis, glucose molecules in the red cell are
converted into pyruvate molecules, with two ATP
molecules generated for each molecule of glucose
Figure 8.17 Blood film appearances of mild common HE (left) and HPP (right). From Hoffbrand et al, PostgraduateHaematology, Sixth Edition 2010, reproduced by permission of John Wiley & Sons Ltd
Figure 8.18 Peripheral blood film in hereditary stomato-cytosis. From Hoffbrand et al, Postgraduate Haematology,Sixth Edition 2010, reproduced by permission of JohnWiley &Sons Ltd
340 Biomedical sciences

metabolized (Figure 8.19). This pathway also serves the
dual purpose of providing the reduction reaction to
convert methaemoglobin back into deoxyhaemoglo-
bin by using NADH that is produced from NADþ
during glycolysis.
A sidebranch off glycolysis is the Rapoport---Lueber-
ing shunt,which generates 2,3-diphosphoglycerate (2,3-
DPG). 2,3-DPG is essential to decrease the affinity ofHb
for oxygen, which makes Hb give up oxygen to tissues
more readily when 2,3-DPG levels are high (as occurs in
red cells during hypoxia or anaemia, making this an
important survival mechanism, see also Section 8.5.3).
The glycolytic pathway utilizes enzymes at each
stage and mutations in many of these have been
described which result in haemolytic anaemia due to
failure to generate sufficient ATP (Figure 8.20). The
commonest by far is pyruvate kinase deficiency.
Pyruvate kinase deficiencyPyruvate kinase (PK) catalyses the conversion of py-
ruvate into phosphoenolpyruvate, one of the last stages
of the glycolytic pathway and the step that produces
phosphorylation of ADP to ATP. PK deficiency is the
most frequent enzyme defect in the glycolytic pathway,
and is inherited as an autosomal recessive disorder.
However, over 100 different mutations of the PK gene
have been described, leading to huge variability in the
clinical effects of inheriting two defective alleles. PK
deficiency may give rise to a spectrum of disease,
from very mild, symptomless haemolytic anaemia
through to severe anaemia and jaundice. Gallstones
due to the haemolysis are common in PK deficiency
and spleen enlargement may occur. A full blood
count shows a normocytic anaemia and reticulocy-
tosis, and enzyme assay of red cell pyruvate kinase
activity will show a decrease in the maximal activa-
tion of PK from that of normal controls. Treatment
consists of removal of the spleen for severe haemo-
lytic anaemia.
8.4.5.2 The pentose phosphate pathway
The pentose phosphate pathway in the red blood cell
gives it reducing power via the production of NADPH
from NADPþ. The first step of this pathway converts
glucose-6-phosphate (G6P) into 6-phosphogluconate
(6-PG), which is catalysed by the enzyme glucose-6-
phosphate dehydrogenase (G6PD). G6P is also a sub-
strate in the glycolytic pathway, and the final products
of the pentose phosphate pathway reenter the glyco-
lytic pathway --- there is overlap between the two
pathways, and the proportions of glucose metabolized
Figure 8.19 An overview of glycolysis, the pentose phosphate pathway and the glutathione cycle in the red cell. FromHoffbrand et al, Postgraduate Haematology, Sixth Edition 2010, reproduced by permission of John Wiley & Sons Ltd
Chapter 8 Haematology and transfusion science 341

via each pathway vary according to the cell’s need for
reducing power.
Different steps of the pentose phosphate pathway can
be affected by inherited and acquired disorders, but the
most important haematological disorder arising from it
is glucose-6-phosphate dehydrogenase deficiency.
Glucose-(6)-phosphate dehydrogenase deficiency(G6PDD)G6PDD is the commonest inherited enzyme defect in
the world and some 130 variants of the gene have
been described. The gene for the red cell isoenzyme
of G6P is found on the X chromosome, and thus
G6PDD is inherited as an X-linked disorder (how-
ever, the other cells of the body will have normal
G6PD enzyme). Since the mutated genes for G6PD
are common in certain regions of the world, female
homozygotes for G6PDD are not uncommon, and
female heterozygotes may experience symptoms of
G6PDD where X-chromosome inactivation has ran-
domly inactivated relatively more X chromosomes
with the normal gene.
In individuals with G6PDD, haemolysis is increased
by exposure to oxidative stress, which can be caused by
ingestion of oxidative foods or drugs. Haemolytic
anaemia can be precipitated by exposure to broad
beans (‘favism’, as broad beans are known as fava
beans in some regions of the world) which can produce
free oxygen radicals. Antimalarial drugs can also pro-
duce a dose-related haemolysis. Neonatal jaundice can
also be seen with G6PD.
Investigations in G6PDD show variable levels of
anaemia in the full blood count. If G6PDD is sus-
pected, screening tests can be used to distinguish
between deficient and nondeficient individuals, for
example using a rapid fluorescent spot test which looks
for the generation of fluorescent NADPH from
NADPþ by G6PD --- a deficiency of G6PD is indicated
by a lack of fluorescence, though this may not detect
heterozygous females. A quantitative assay can then be
performed to measure G6PD activity.
Management of G6PDD depends upon the severity
of the condition in an individual, though all should be
advisedtoavoidoxidizingagents.Someepisodesofsevere
haemolysis may require blood transfusion for support,
and removal of the spleenmay be advised for some cases.
8.5 Haemoglobin
Haemoglobin (abbreviated as ‘Hb’) is the major pro-
tein foundwithin red blood cells, and is responsible for
Glucose
NADPH
NADH
Glutathione cycle
PentosephosphatePathway
Antioxidant
GSH
Pyruvate/lactate
Reducing power
Glycolysis
ATP
2,3-DPG
MetHbreduction
Hb – O2 affinity
Rapoport – Luebering shunt
Metabolic energy
Figure 8.20 Glycolytic pathway showing enzymes. From Hoffbrand et al, Postgraduate Haematology, Sixth Edition 2010,reproduced by permission of John Wiley & Sons Ltd
342 Biomedical sciences

carrying oxygen from the lungs to tissues of the body
(and to an extent, returning carbon dioxide from
tissues to the lungs).Haemoglobin is a 68kD tetrameric
molecule, meaning that it consists of four globin
subunits. Each globin subunit in a haemoglobin mol-
ecule contains a haem group, which has a porphyrin
ring with a ferrous atom that is capable of reversibly
binding one oxygen molecule.
The majority of haemoglobin in the normal adult is
HbA, comprising two a subunits and two b subunits.
The globin structure of HbA (and of a haem group) is
shown in Figure 8.21.
About 1.5---3% of adult haemoglobin is HbA2,
which comprises two a globin chains and two d (delta)globin chains. The major haemoglobin expressed by
the term baby is HbF, the structure of which contains
two a globins and two g (gamma) globins. Normal
adults express <2% HbF.
8.5.1 Haemoglobin synthesis
Haemoglobin synthesis occurs largely within the
mitochondria of the ‘newborn’ red blood cell. The
enzyme erythropoietin stimulates conversion of gly-
cine and succinyl CoA into d-aminolaevulinic acid
(ALA) in the rate-limiting step of the reaction. This
uses the enzyme ALA synthetase, along with vitamin
B6 acting as a cofactor; completed haem molecules
inhibit this initial stage of haemoglobin synthesis
in classical negative feedback. Two molecules of
d-ALA then form porphobilinogen, which go on to
form protoporphrin via uroporphyrinogen and
coproporphyrinogen.
Iron atoms are imported into the cell, bound to
transferrin receptors on the cell surface. Iron combines
with protoporphyrin to form haem, which is incorpo-
rated into globin chains. These combine to form
haemoglobin. The entire scheme is illustrated in
Figure 8.22.
8.5.2 Function of haemoglobin
The function of haemoglobin is to bind oxygen readily
--- and reversibly --- in the capillaries of the lungs
(forming oxyhaemoglobin) and carry it to the tissues,
where Hb needs to give up oxygen. Some oxygen is also
carried in solution in plasma, but themajority is bound
to Hb. The percentage of Hb that is saturated with
oxygen at any one time depends on the partial pressure
of oxygen in the surrounding environment. Haemo-
globin arriving in the capillaries of the lungs encoun-
ters an environment of high partial pressure of oxygen
and picks up oxygen molecules readily. However, in
the tissues, oxyhaemoglobin encounters an environ-
ment of low partial pressure of oxygen and gives up its
oxygen to diffuse into those tissues. Since each Hb
molecule is a tetramer with four haem groups, each
molecule of Hb can carry four oxygen molecules.
Binding of the first molecule of oxygen to an Hb
molecule is the most difficult as the Hb molecule
undergoes a shape change to accommodate the first
oxygen molecule; binding of the second and third
molecules of oxygen is then easier, but binding of the
final, fourth oxygen molecule is harder again due to
‘steric hindrance’; that is, the first three oxygen mo-
lecules get in the way! The relationship between the
Figure 8.21 Structure of the haemoglobin A molecule (left) and a haem group (right)
Chapter 8 Haematology and transfusion science 343

partial pressure of oxygen in an environment and the
saturation of haemoglobin that results can be plotted,
and the oxygen---haemoglobin dissociation curve that
results has a sigmoidal shape due to the relative diffi-
culty of binding the first and fourth oxygen molecules
to haemoglobin, as compared to the ease of binding the
second and third. This is shown in Figure 8.23.
A number of factors can decrease the affinity of
haemoglobin for oxygen. In the tissues, high levels of
CO2 and the presence of Hþ ions produce this effect,
causing Hb to give up oxygen readily there (this is
known as the ‘Bohr effect’), and this shifts the oxy-
gen---haemoglobin dissociation curve to the right. The
presence of high levels of 2,3-DPG in the red blood cell
(see Section 8.4.5.) also decreases the affinity of hae-
moglobin for oxygen, as does hyperthermia. However,
fetal haemoglobin, HbF, has a higher affinity for oxy-
gen than HbA; this enables the fetal circulation to
attain higher levels of O2 from the maternal circula-
tion, and causes the oxygen---haemoglobin curve in the
fetus to shift to the left.
Carbon monoxide (CO) has a much higher af-
finity for haemoglobin than oxygen does and CO
binds irreversibly to haemoglobin --- once this oc-
curs with high enough levels of CO there is a lack of
spaces on haemoglobin molecules to bind oxygen
molecules and CO poisoning results, often with fatal
consequences.
8.5.3 Carbon dioxide transportin blood
Carbon dioxide is transported from the tissues to the
lungs for excretion by exhalation. It is carried in blood
in three ways:
1. About 5% of CO2 is transported dissolved in plasma
2. 10% ofCO2 is carried reversibly bound to the amino
groups of haemoglobin (as carbaminohaemoglo-
bin) and to the amino groups of plasma proteins
3. The majority of carbon dioxide is transported
inside red blood cells as bicarbonate ions (HCO3�),
formed by the reversible reaction of CO2 with water
inside the red blood cell. This reaction is catalysed
by the enzyme carbonic anhydrase, and is shown
here in Figure 8.24.
This reaction does also occur to an extent in
plasma, but is very slow due to the lack of carbonic
Figure 8.22 Haemoglobin synthesis
344 Biomedical sciences

anhydrase there. The HCO3� ions that are produced
within the red cell diffuse out of it, and Cl� ions
diffuse in to balance the charges; this is known as the
chloride shift.
Once blood reaches the lungs --- an environment of
low partial pressure of CO2 --- the reverse reaction
occurs, again catalysed by carbonic anhydrase, and
CO2 is reformedwithin the red blood cell. This diffuses
out of the red cells, into the plasma and then out of the
alveolar capillaries and into the alveoli of the lung for
exhalation. This process is illustrated in Figure 8.25.
8.5.4 Globin genes
The production of the globin chains found in haemo-
globin is from genes at two loci. Two genes for aglobins are found on each copy of chromosome 16
(giving a total of four a globin genes), along with the z(zeta) globin gene that is only expressed in early
Figure 8.23 The oxygen---haemoglobin dissociation curve: note the sigmoidal shape, due to the relative difficulty ofbinding the first and fourth oxygen molecules to haemoglobin
CO2
H2CO3
HCO3- H+
Hb
HCO3-carried in solution in plasma
H2O
CO2 produced in tissues diffuses intoplasma, then into red blood cells
Redbloodcell
Hb bindsH+
and CO2
Figure 8.24 Carriage of CO2 in the blood as bicarbonateions --- reaction in tissue capillaries
HCO3- in plasma diffuses back
into red cell
H+
CO2
H2O
H2CO3-
HCO3-
CO2 diffuses back into plasma,then into lung alveoli
HbRedbloodcell
Hb releasesH+ and CO2
Figure 8.25 Excretion of carbon dioxide --- reaction inalveolar capillaries
Chapter 8 Haematology and transfusion science 345

embryonic life. On chromosome 11, genes coding for
the production e (epsilon), g, d and b globins are
present in a gene cluster. The gene loci for globins and
the haemoglobins they produce at different life stages
are shown in Figure 8.26.
The first globins produced in embryonic life are Hb
Gower 1 (z2e2), Hb Gower 2 (a2e2) and Hb Portland
(z2g2), though these are rapidly superceded by HbF
(Box 8.3). HbF (a2g2) comprises 80% of the haemo-
globin of a human baby at term; the switchover toHbA
occurs after birth, when b globin chain synthesis
increases rapidly due to mechanisms as yet unknown.
By the age of 6 months, there is little HbF remaining.
Expression of the d globin chain commences just
before birth and �2% of total haemoglobin is HbA2
(a2d2).
8.5.5 Haemoglobinopathies
Haemoglobin disorders may be related to:
. abnormal globin chain structure;
. reduced or absent production of globin; or
. a combination of abnormal globin chain structure
and reduced production.
Beta globin gene cluster on Chromosome 11
5’ 3’
Alpha globin gene cluster on Chromosome 16
5’ 3’3’ Zeta 2 Zeta 1 Alpha 2 Alpha 1
Epsilon Gamma G Gamma A Delta Beta
Hb F Hb A2 Hb A
Figure 8.26 Gene loci for globins and haemoglobins produced at different stages of life
346 Biomedical sciences

8.5.5.1 Abnormal globin chain structure
Haemoglobin S (HbS) is the best-known and com-
monest example of a structurally abnormal haemo-
globin molecule. It is caused by a mutation of the bglobin gene in which a substituted base results in the
insertion of a valine residue at the sixth position in
the b globin chain, where a glutamic acid would
normally be present. This results in an abnormal
haemoglobin molecule, HbS, which polymerizes at
low oxygen tension, resulting in a rigid, sickle-
shaped erythrocyte with membrane damage from
the sharp crystals of polymerized HbS, giving it a
shortened lifespan.
The gene for HbS is inherited in an autosomal
recessive pattern; in the patient who is homozygous
for the HbS gene this gives rise to sickle cell anaemia
(SCA, in which the phenotype is HbSS). Those in-
dividualswho inherit a single copy of the defective gene
are said to have sickle cell trait (HbAS). It is of note
that, as the defect affects the b globin chain which is
present in HbA, sickle cell anaemia does not become
apparent before the age of around 6 months, as HbF
(a2g2) is the prevalent Hb before this age. The gene for
HbS is widespread in tropical and subtropical regions
of the world, since individuals who are carriers had a
good degree of protection against malaria infection,
and is most often found in individuals of Black African
or BlackCaribbean descent. However, individuals with
ancestry in the Middle East, Asia and the Mediterra-
nean may also be affected.
8.5.5.2 Clinical features of sickle cell anaemia
Individuals with SCA typically suffer repeated epi-
sodes of vaso-occlusive crisis, where large propor-
tions of erythrocytes sickle and occlude small blood
vessels, giving rise to the clinical picture of pain in the
hands and feet, and in bones. Fever usually occurs
with severe pain, and occlusion of small vessels in the
spleen gives painful splenomegaly (an enlarged
spleen). After repeated episodes, normal spleen is
replaced by nonfunctional scar tissue (fibrosis). Mas-
sive pooling of cells in the spleen can be fatal, as can
bone marrow aplasia, which may be seen following
infection in individuals with SCA (usually with par-
vovirus B19).
8.5.5.3 Laboratory diagnosis of sickle cellanaemia
The only single test that can diagnose a haemoglobin
variant with certainty is DNA analysis but a combi-
nation of laboratory tests can diagnose the most
common Hb variants with confidence. In practice,
a combination of full blood count and film, with a
solubility test to determine the presence or absence of
a sickling molecule, is used alongside high perfor-
mance liquid chromatography (HPLC) and/or hae-
moglobin electrophoresis. If doubt still exists as to the
identity of a variant haemoglobin, DNA analysis to
look at a precise globin gene mutation can then be
performed.
8.5.5.4 Full blood count and blood film
Hb levels are typically 6---8 g/dL in individuals with
SCA, and reticulocyte count is high (�15%). The
blood film will show sickle cells, as in Figure 8.27.
Box 8.3 Haemoglobin nomenclature
HbGower (1 and 2) were named byHuehns and
colleagues in 1961 after Gower Street, where
University College Hospital in London is situat-
ed, and where the Hb Gower variants were first
described. Hb Portland was named after its
discovery at the University of Oregon in
Portland, USA.
Figure 8.27 Blood film in sickle cell anaemia. FromHoffbrand et al, Postgraduate Haematology, Sixth Edition2010, reproduced by permission of John Wiley & Sons Ltd
Chapter 8 Haematology and transfusion science 347

8.5.5.5 The sickle solubility test
In the hospital setting, patients admitted in emergen-
cy circumstances may need urgent surgery under
anaesthesia and the most important piece of infor-
mation the clinician needs about a potential haemo-
globinopathy is whether it will cause a patient’s blood
to sickle at low oxygen partial pressure (a situation
which may occur transiently in a patient under gen-
eral anaesthesia). Nonsickling variants of haemoglo-
bin are of less interest in the emergency situation and
a sickle solubility test can be performed in minutes if
required. The sickle solubility test utilizes the relative
insolubility of HbS compared to HbA in a concen-
trated phosphate buffer solution, and the addition of
red cells to such a solution produces a cloudy (turbid)
appearance if HbS is present, while HbA gives a clear
solution (Figure 8.28). The test should be read by
holding the tube against a background of white card
with black lines.
The sickle solubility test cannot distinguish between
individuals with SCA and those with sickle cell trait ---
both will produce a positive sickle solubility test result
--- but allows a rapid assessment of whether or not a
patient has a sickling Hb variant (Box 8.4).
8.5.5.6 HPLC of Haemoglobins
Automated separation and detection of different
haemoglobins using high performance liquid chro-
matography (HPLC) is becoming increasingly pop-
ular in diagnostic laboratories. The principles of
HPLC are explained in more detail in Chapter 5,
but in essence, HPLC of haemoglobin is separation
on the basis of charge difference (as haemoglobin
variants with amino acid substitutions often have a
net charge difference from HbA) using ion-exchange
column matrices. Very little sample is required and
resolution takes just a few minutes. Identification of
Hb variants is dependent on the time it takes for
them to elute from the column, which in turn
depends on how strongly they interact with the
charged column matrix (Figure 8.29).
8.5.5.7 Hb electrophoresis
Electrophoresis of haemoglobins, like HPLC, is also
based on the charge of variant haemoglobin molecules
(see Chapter 5 for further details of electrophoresis).
Most laboratories use a gel matrix, as these are easier to
handle, and stain to see where the haemoglobin mo-
lecules have migrated to. Acid or alkali conditions are
employed to maximize the difference in charge of
variant haemoglobins due to amino acid substitutions;
extremes of pH are needed to enhance separation of
subtle charge differences in the variant haemoglobin
molecules (Figure 8.30).
8.5.5.8 DNA analysis of globin genes
In some situations the usual combination of tests for a
haemoglobinopathy may fail to identify the haemo-
globin form present; in such situations analysis of the
DNA sequence of globin genes may be required. A
mutation may be found in any of the major globin
genes (a, b, g and d), giving rise to variants of the
relevant globin chain, and the production of abnormal
forms ofHbA,HbF orHbA2. This enables the sequence
determined to be compared with a world database of
Box 8.4 Nomenclature of new Hb variants
Variant haemoglobins are traditionally named
after the region in which they were discovered,
giving rise to some unusual names: Hb Deer
Lodge, Hb Watford, Hb Rio Grande, Hb Rocky
Mountain and Hb City of Hope to name just
a few!
Figure 8.28 Sickle solubility test result --- positive result((b) and (c)) and negative result (a). Lines are not visiblethrough the turbid samples positive for a sickling Hb
348 Biomedical sciences

known variant globin genes and gives a definitive
diagnosis. However, new globin gene mutations are
constantly being published and a novel gene may be
identified.
8.5.5.9 Treatment of sickle cell anaemia
As the clinical picture of sickle cell anaemia is highly
variable, the treatment is tailored to the individual’s
pattern of illness. Some people with SCA will suffer
frequent painful crises, with hospital admission for
pain control and hydration. They may require regular
blood transfusions to maintain an acceptable Hb level
and along with regular blood transfusions goes the
requirement for near daily iron chelation therapy with
desferrioxamine to remove the excess iron from fre-
quent transfusion that might otherwise accumulate in
tissues and cause harm. Some will require splenectomy
(removal of the spleen) to lessen the likelihood of
frequent haemolytic episodes. Still others will lead a
relatively normal life, with few --- if any --- crisis
episodes.
Figure 8.29 HPLC traces from HbA, HbS and HbAS (continued on the next page)
Chapter 8 Haematology and transfusion science 349

8.5.5.10 Other structural haemoglobin variants
More than 1000 haemoglobin variants have been
described at the time of writing. Many are clinically
insignificant in that they have no effect on the
haemoglobin molecule’s function and are ‘silent’
variants which are incidentally discovered, perhaps
when a patient is screened for haemoglobinopathies
preoperatively or during antenatal care. HbC is
much like HbS in terms of the population it is found
in, its inheritance and effect on the Hb molecule, and
is produced when a lysine residue is substituted for a
glutamic acid residue in the b globin chain (rather
than valine in HbS). The coinheritance of HbC along
with HbS (HbSC disease) gives rise to a clinical
picture much like that of SCA, albeit a somewhat
milder version in many individuals. HbE is a further
variant of Hb that is common in Asia, and caused by
a mutation in the b globin gene that causes lysine to
be substituted for a glutamic acid residue in the bglobin chain. HbE trait (HbAE) is generally asymp-
tomatic, while HbE disease (HbEE) usually gives rise
to a mild haemolytic anaemia, but the combination
of an HbE gene with a b0 thalassaemia gene can
produce very severe anaemia with serious morbidity
and mortality. Hb Lepore is caused by a fusion of the
d and b globin genes, giving rise to an Hb molecule
with normal a globin chains coupled to d-b fusion
chains. Hb Lepore trait is asymptomatic and Hb
Lepore homozygotes are fortunately rare, but the
combination of an Hb Lepore gene with a b thalas-
saemia gene gives rise to anaemia of variable severity
where few/no normal b globin chains can be
produced.
Figure 8.29 Continued
Figure 8.30 Haemoglobin electrophoresis --- standards inlane A, HbSS in lanes B and C, HbSC in lane D and HbAS inlane E. From Hoffbrand et al, Postgraduate Haematology, SixthEdition 2010, reproduced by permission of John Wiley &Sons Ltd
350 Biomedical sciences

8.5.5.11 Methaemoglobins
Methaemoglobin is haemoglobin in which the normal
ferrous (Fe2þ) ion of the haem group is oxidized to the
ferric form (Fe3þ) and rendered unable to bind oxygen.Normal individuals should have <1% of all haemo-
globin in themethaemoglobin form, as the NADH and
NADPHmethaemoglobin reductase pathways are pro-
tective against oxidation of Fe2þ. However, larger
proportions of methaemoglobin are seen in congenital
and acquired methaemoglobinaemia.
Congenital methaemoglobinaemia may be due to
a hereditary defect in the protective enzyme pathway,
an autosomal recessive condition in which two de-
fective copies of the gene for the enzyme diaphorase I
(NADH methaemoglobin reductase) are inherited,
compromising the major protective system against
oxidation of the ferrous atoms in haemoglobin.
It may also be seen when a variant haemoglobin
molecule is inherited in which an amino acid sub-
stitution on either the a or b globin chain alters the
haem---globin bond in a way that makes the molecule
more stable in the oxidized form. Several variants of
such ‘haemoglobin M’ molecules have been de-
scribed, including Haemoglobin M Saskatoon and
Haemoglobin M Hyde Park, and most are inherited
in an autosomal dominant pattern.
Methaemoglobinaemia is, however, more com-
monly acquired by exposure to oxidizing agents in
drugs, which can swamp the protective enzyme sys-
tems and cause an acute rise inmethaemoglobin levels.
Drugs that can trigger this include antibiotics (e.g.
dapsone, trimethoprim), local anaesthetics, metaclo-
pramide and nitrate drugs. Infants under 6 months of
age aremore prone to acquiredmethaemoglobinaemia
asHbF ismore readily oxidized thanHbA, and levels of
the protective NADH reductase are lower in the early
months of life.
Affected individuals have methaemoglobin levels
>1% and are usually asymptomatic until levels are
above 10---20%. Above such levels, symptoms of hyp-
oxia (low oxygen levels) are seen, that is shortness of
breath, cyanosis (blue-tinged skin), dizziness and poor
exercise tolerance (Box 8.5). Once methaemoglobin
levels reach >50%, arrhthymias, unconsciousness and
ultimately coma and death may ensue.
Diagnosis of methaemoglobinaemia is usually
based on cooximetry, a form of spectrophotometry
which can identify the different signature wavelengths
of light absorption by normal oxyhaemoglobin, deox-
yhaemoglobin, carboxyhaemoglobin and methaemo-
globin. The variant haemoglobin M molecules can
often be identified using haemoglobin electrophoresis,
but DNA sequencing of the globin chain genes may be
necessary to identify them. Enzyme assays will allow
diagnosis of methaemoglobinaemia due to defects in
the protective pathway enzymes. Methaemoglobinae-
mia is treated with supplementary oxygen and by
administering methylene blue, which accepts electrons
from NADPH methaemoglobin reductase and in-
creases its activity.
8.5.5.12 Unstable haemoglobins
More than 140 variants of haemoglobin have now been
reported inwhich amutation in a globin gene produces
a haemoglobinmolecule that is relatively insoluble and
comes out of solution readily, with Heinz bodies
(clusters of denatured Hb) seen in the red cells. Inher-
itance is usually autosomal dominant and haemolytic
anaemia or altered affinity for oxygen results in some
(but not all) cases. Hb K€oln is the commonest unstable
haemoglobin encountered and often arises as a new
mutation in a family with no history of the disorder.
8.5.5.13 Reduced or absent productionof haemoglobin: the thalassaemias
In contrast to the structural haemoglobin variants,
where an abnormal globin molecule is generally pro-
duced at a normal rate, the thalassaemias are caused by
a decreased or absent production of a normal globin
molecule. This is usually due to gene deletion, or
mutations to the gene or its regulatory elements that
caused reduced production of a globin. The thalassae-
mias are classified according to the affected globin --- athalassaemia or b thalassaemia --- and also according to
Box 8.5 The blue men of Lurgan
The ‘Blue Men of Lurgan’ were described in
the County Armagh town of Lurgan, Northern
Ireland, by local General Practitioner Dr James
Deeny in 1942, who diagnosed ‘familial idio-
pathic methaemoglobinaemia’, and made the
discovery that the reducing agent ascorbic acid
(vitamin C) was an effective treatment for
methaemoglobinaemia.
Chapter 8 Haematology and transfusion science 351

clinical picture. Patients may thus have thalassaemia
minor, major or intermedia.
Alpha thalassaemiaAlpha thalassaemia is due to a reduced or absent
production of a globin molecules. Since there are four
a globin genes, it is possible to have one, two, three or
four a globin genes deleted ormutated, as illustrated in
Figure 8.31.
Defect of one a globin gene; deletion or mutation of
one of the four a globin genes is clinically silent, with
no apparent effect on full blood count, or blood film. It
is usually only discovered when a family is screened for
alpha thalassaemia after the diagnosis of amore serious
form of the condition in other family members.
Defects of two a globin genes --- a thalassaemia trait:
deletion ormutation of two a globin genes gives rise toalpha thalassaemia trait. Alpha thalassaemia trait can
be inherited in one of two ways: patients may have two
missing genes on one allele of chromosome 16, or one
missing gene from each copy of chromosome 16. These
patterns are found in different ethnic groups; people of
Southeast Asian originwitha thalassaemia trait tend to
have the homozygous (‘cis’) pattern of gene deletions,
while people of Black ethnic origin with a thalassaemia
trait tend to inherit the heterozygous (‘trans’) pattern
of gene deletion. This pattern of gene inheritance has
very important implications for the children of parents
with a thalassaemia trait. The combination of a ‘cis’
chromosome 16with twomissinga globin genes with asecond chromosome 16 with one deleted gene will
give rise to the severe haemoglobin H disease, while
the combination of two ‘cis’ chromosomes 16 would
give rise to the fatal condition Bart’s Hydrops fetalis,
where an infant has no functional a globin genes and
thus no functional Hb molecules. This is not possible
in populations where a thalassaemia trait is caused by
the ‘trans’ pattern of gene deletion across both copies of
chromosome 16. This is illustrated in Figure 8.32.
Haemoglobin H diseaseIn this variant of alpha thalassaemia, individuals in-
herit three defective a globin genes; two gene deletions
are seen on one allele of chromosome 16 and one gene
5’
5’
3’
3’
Normal: 4 copies of alpha globin gene present
5’
5’
3’
3’
Silent carrier: 3 copies of alpha globin gene present, one deleted
5’
5’
3’
3’
Alpha thalassaemia trait (‘cis’/homozygous
pattern): 2 copies of alpha globin gene deleted from one chromosome
5’
5’
3’
3’
Alpha thalassaemia trait (‘trans’/heterozygous pattern): 2 copies of alpha globin gene deleted, one from each chromosome
5’
5’
3’
3’
Haemoglobin H disease: 3 copies of alpha globin gene deleted
5’
5’
3’
3’
Barts Hydrops Fetalis : All 4 copies of alpha globin gene deleted
Figure 8.31 Possible gene deletions in alpha thalassaemia. From Hoffbrand et al, Postgraduate Haematology, Sixth Edition2010, reproduced by permission of John Wiley & Sons Ltd
352 Biomedical sciences

deletion on the second allele, as illustrated in
Figure 8.33.
Individuals with haemoglobin H disease are affect-
ed by a chronic haemolytic anaemia, though the degree
of anaemia is variable. They may be transfusion-de-
pendent and will require iron chelation therapy to
counteract the effects of iron loading from multiple
transfusions if so. Infections may trigger bouts of
increased haemolysis. The lack of a globin causes a
gross imbalance between a and b globin such that
tetramers of b globins form into b4 ‘haemoglobin H’
molecules; this comprises�20% of total Hb in people
with haemoglobinHdisease. Theb4HbHmolecule has
very high affinity for oxygen and is unaffected by the
Bohr effect such that it does not relinquish O2 to the
tissues; this causes a worse 02 carrying capacity than
would be expected from overall Hb levels. It is an
unstable molecule which precipitates within erythro-
cytes, giving rise to the appearance of Heinz bodies in a
blood film (as shown in Figure 8.33).
Barts Hydrops fetalisBarts Hydrops fetalis (named after the London teach-
ing hospital, St Bartholomew’s, where the associated
haemoglobin was first described) is the variant of athalassaemia with all four genes deleted --- individuals
with this condition inherit two copies of chromosome
16 with the ‘cis’ double gene deletion, meaning that
they have no functional a globin genes. Haemoglobin
Barts, comprising four g globin chains, g4, is expressedin the fetus, a molecule which has such high O2 affinity
that it does not relinquish it to tissues and is thus
effectively nonfunctional. This condition is incompat-
ible with life and infants with it are grossly oedematous
and are either stillborn or will die shortly after birth.
8.5.5.14 Combinations of haemoglobinopathies
Contrary to what might instinctively be expected,
inheriting combinations of haemoglobinopathies of-
ten gives rise to an improved clinical picture! Coin-
heritance of genes for a and b thalassaemia, for exam-
ple, can bring the production of the a and b globin
chains back into balance with less serious clinical effect
than would be expected from either alone.
8.6 Anaemia
Anaemia is defined as a haemoglobin level below the
normal range for age and gender. It is not a condition
in its own right, but rather is a symptom of another
problem, and haematological indices can give impor-
tant clues as to the underlying cause. Apparent anae-
mia can also be seen due to changes in plasma volume
--- an increase in plasma volume will result in greater
dilution ofHb, as occurs during pregnancy. Anaemia is
classified according to mean cell volume (MCV) and
divided into microcytic anaemia (small cells --- low
MCV), normocytic anaemia (cells of normal size, with
a normal MCV) andmacrocytic anaemia (large cells ---
highMCV). Patientswith anaemiamaybe asymptomatic,
Mother – Alpha trait (heterozygous)
Father – Alpha trait (heterozygous)
100% offspring – Alpha trait (heterozygous)
Mother – Alpha trait (heterozygous)
Father – Alpha trait (homozygous)
50% offspring –silent carriers alpha thalassaemia
50% offspring – Haemoglobin H disease
Figure 8.32 Alpha thalassaemia trait inheritance patterns. From Hoffbrand et al, Postgraduate Haematology, Sixth Edition2010, reproduced by permission of John Wiley & Sons Ltd
Chapter 8 Haematology and transfusion science 353

particularly where the fall in Hb has been gradual. In
patients with symptoms of anaemia, tiredness, faint-
ness and shortness of breath are common, while some
may additionally experience angina and palpitations
(the latter particularly in the elderly). They will often
look pale, with a rapid heart rate and sometimes with
signs of heart failure too.
Investigations for suspected anaemia include a full
blood count to assess Hb levels alongside red cell
count, white cell count, platelet count and reticulocyte
count. A blood film to look at red cell shape should
usually be performed too. Some patients will need a
bone marrow biopsy to supplement findings from the
FBC and blood film; this reveals details of how cellular
the marrow is, whether erythroblasts are normoblastic
(normal-sized blasts) or megaloblastic (large blasts).
Further investigations should be based on findings in
the FBC and blood film --- for example, iron store
assessment where iron deficiency anaemia is a possible
diagnosis (Table 8.1).
8.6.1 Microcytic anaemia
Iron deficiency is the commonest cause of microcytic
anaemia, though thalassaemia (see Section 8.5.5), side-
roblastic anaemia and the anaemia of chronic disease
are also relatively common possible causes.
8.6.1.1 Iron
Humans have a number of mechanisms to absorb
iron and regulate this, but no physiological mecha-
nism to excrete iron from the body. Most iron in the
Figure 8.33 Haemoglobin H disease genes and blood film showing Heinz bodies
354 Biomedical sciences

body is found in haemoglobin (�3 g), while the rest
is found in macrophages of the reticuloendothelial
system, skeletal muscle and hepatocytes (�1 g),
mostly in the storage form of iron, ferritin, a soluble
complex of iron and protein, and haemosiderin, an
insoluble iron---protein complex found particularly
in macrophages.
The average diet contains around 20mg of iron
per day but under normal circumstances only around
10% of this is absorbed. Each day, around 1mg of iron
is lost in urine, faeces and sweat, though in menstru-
ating women, the average daily loss of iron is around
1.7mg, though it can be considerably higher. Haem
iron --- the iron found in red meat --- is the best
absorbed form of iron, but most dietary iron is in the
nonhaem form found in vegetables and grains. Ferrous
iron (Fe2þ) is also better absorbed than ferric iron
(Fe3þ) and gastric acid helps to keep iron in the ferrousformat. Iron absorption from food can be increased up
to around 20---30% in iron deficiency, and by the
action of erythropoietin (e.g. at high altitudes, or after
bleeding or haemolysis), but decreased where there is
iron overload. Nonhaem iron is absorbed in the small
intestine after gastric acid in the stomach --- and the
enzyme ferriductase in the duodenum --- have reduced
iron from the ferric to the ferrous form. Haem iron can
be absorbed by intestinal haem transporters; some
passes intact into the bloodstream. Iron absorption is
regulated by the cells of duodenal villi, which absorb
iron in proportion to recent dietary iron intake, to
body iron stores and according to bone marrow
erythropoiesis via different pathways. Iron that has
been absorbed by duodenal epithelial cells may be
stored as ferritin (and later shed with the cell into the
gut at the end of its lifespan, thus regulating iron
balance), or passed across the cell into the plasma via
the iron transporter protein ferroportin. The activity of
ferroportin can be reduced by hepcidin, a peptide
made in the liver that binds ferroportin and triggers
its destruction, thus preventing the movement of iron
into the plasma and its loss when the duodenal epithe-
lial cells are shed.
Once in plasma, iron is transported bound to
transferrin. Each transferrin molecule binds two iron
atoms and at the bone marrow this binds to receptors
on reticulocytes and erythroblasts to deliver iron to
them. Normal serum iron range is 13---32 mmol/L.
8.6.1.2 Defective iron absorption --- hereditaryhaemochromatosis
Hereditary haemochromatosis is an inherited disorder
of iron absorption that results in excessive iron depo-
sition in various tissues of the body. It is inherited as an
autosomal recessive disorder, and the gene is common
in Caucasian populations where around one in 10
people are carriers. The mechanism for excessive iron
absorption in the intestine is unclear, but may result
from absence of hepcidin --- or defective forms ---
resulting in a lack of regulation of dietary iron absorp-
tion. Iron levels exceed the plasma carriage capacity of
transferrin and free iron is taken up by most tissues,
including the liver, pancreas, heart and skin. The iron
causes fibrosis (the production of scar tissue), with
ensuing liver cirrhosis. People with hereditary haemo-
chromatosis develop bronzed skin, diabetes, heart
arrhythmias and an enlarged liver, typically around
the age of 45. Some may develop hepatocellular carci-
noma after liver cirrhosis. Investigations show elevated
serum iron and ferritin and genetic testing is per-
formed to test for the gene for hereditary haemochro-
matosis. Treatment is with venesection --- 500mL of
blood is taken up to twice a week initially, then three or
four times per year until serum ferritin is within the
normal range. Chelation therapy with the iron-binding
desferrioxamine may be used in some patients who
Table 8.1 Common causes of microcytic, normocyticand macrocytic anaemia
MCV Causes
Microcytic anaemia < 80 fL Iron deficiency
Thalassaemia
Sideroblastic anaemia
Chronic disease
Normocytic anaemia Normal Acute haemorrhage
Haemolytic anaemia
Chronic disease
Bone marrow infiltration
Renal failure
Macrocytic anaemia > 96 fL Vitamin B12/folate
deficiency (megaloblasts
in marrow)
Alcoholism
Drugs e.g. methotrexate,
trimethoprim
Liver disease
Hypothyroidism
Chapter 8 Haematology and transfusion science 355

cannot tolerate venesection.Desferrioxaminebinds free
iron in plasma, thus enhancing its excretion in urine.
8.6.1.3 Iron deficiency
Iron deficiency is very common worldwide and is
caused by a lack of sufficient iron for haemoglobin
synthesis. Normal haemoglobin levels are maintained
initially while the body’s iron stores are depleted; once
this occurs Hb levels begin to fall. Iron deficiency can
result from inadequate iron in the diet, increased iron
demands (e.g. during pregnancy), decreased iron ab-
sorption (e.g. coeliac disease) or blood loss, and the
latter is the most common cause of iron deficiency.
Menstruating women are particularly prone to iron
deficiency but blood loss can also be from the gastro-
intestinal tract (e.g. where there are gastric or duodenal
ulcers present, or bleeding tumours in any part of the
gastrointestinal tract, or fromhookworm infestation in
developing countries).
Once haemoglobin levels begin to fall after iron
stores have been depleted, iron deficiency anaemia is
said to be present. Patients with this condition may
experience the classical symptoms of anaemia ---
fatigue, shortness of breath and palpitations on
exertion --- as well as the effects of tissue iron
deficiency such as brittle nails and hair and altered
shape of nails. A full blood count will show a lowered
Hb with microcytic, hypochromic red cells of varied
sizes (anisocytosis) and shapes (poikilocytosis, see
Figure 8.34). Serum iron levels and serum ferritin
will be low, with increased iron-binding capacity (i.e.
transferrin levels).
The treatment of iron deficiency anaemia relies on
identifying the underlying cause and treating that (e.g.
treating heavy periods, gastric ulcers or gastrointestinal
tumours), and give oral iron supplementation with a
preparation such as ferrous sulphate.
8.6.2 Normocytic anaemia
Acute haemorrhage, chronic haemolysis, chronic dis-
ease (such as rheumatoid arthritis, cancer or renal
failure) and bone marrow infiltration can all cause a
normocytic anaemia, in which there is a decreased
haemoglobin level with a normal MCV. Treatment of
the cause where possible will treat the anaemia, and
treatment with erythropoietin where the cause cannot
be treated may also be suggested.
8.6.3 Haemolytic anaemia
The normal lifespan of the red cell is around 4 months
(approximately 120 days). In haemolytic anaemia, red
cells are destroyed at an unusually high rate by macro-
phages of the spleen, bone marrow and liver, and
survival times for red cells fall. Red cell production
will increase to compensate and some circumstances
this may suffice to prevent anaemia developing. How-
ever, once red cell survival is down to around 15 days
the bonemarrow will no longer be able to compensate,
and anaemia will ensue.
Investigations in haemolytic anaemia will show a
decrease in Hb level, with increase in reticulocytes and
a raised serum bilirubin level (indicating breakdown of
red cells is occurring), along with an increase in urobi-
linogen andurinaryhaemosiderin.Ablood filmwill give
furthercluesas tothe likelycause:abnormal redcellsmay
beseeninsicklecelldiseaseorthalassamia(Section8.5.5),
Heinzbodies in redcell enzymedefects (Section8.4.5)or
spherocytes in autoimmune haemolytic disease,malaria
or hereditary spherocytosis (Section 8.4.4).
8.6.3.1 Acquired causes of haemolytic anaemia
The cause of destruction of red cells can be divided into
immune destruction, nonimmune destruction and
other causes.
1. Immune destruction of red cells may be due to the
presence of autoantibodies, alloantibodies (antibo-
dies from another individual), or drug-induced
antibodies in the circulation. The presence of
Figure 8.34 Peripheral blood film in irondeficiencyanaemia.From Hoffbrand et al, Postgraduate Haematology, Sixth Edition2010, reproduced by permission of John Wiley & Sons Ltd
356 Biomedical sciences

antibodies coating red cells gives a positive direct
antiglobulin (Coombs) test (see Section 8.13.6).
The antibodies that cause this autoimmune hae-
molytic anaemia (AIHA) can be classified into
‘warm’ and ‘cold’ antibodies based on whether they
attach best to red cells at 37�C (warm) or <37�C(cold). In warm AIHA, the antibodies are usually
IgG, whilst cold AIHA is usually caused by IgM.
The presence of autoantibodies in AIHA which
attach to the red cells triggers the complement
cascade and then intravascular haemolysis ensues.
Some IgG antibodies do not activate complement,
and these are removed in the spleen via extravas-
cular haemolysis.‘Warm’ autoimmune haemolytic
anaemia occurs most frequently in middle-aged
females, usually as an episode of anaemia with
jaundice thatmay remit and relapse. Investigations
reveal haemolytic anaemia, spherocytosis and a
positive direct antiglobulin test with autoantibo-
dies against red cells present. Around a third of
cases have no identifiable underlying cause, whilst
others are associated with rheumatoid arthritis,
drugs or cancer of the lymphoid system. Treat-
ment with steroids or other immunosuppressive
drugs is used, possibly with blood transfusion for
severe anaemia.
‘Cold’ autoimmune haemolytic anaemia may be
seen after infections such as cytomegalovirus or the
Epstein---Barr virus, or in the elderly. Investigations
show red cell agglutination at room temperature or
cooler, as well as a positive direct antiglobulin test
and the presence of monoclonal antibodies against
the Ii blood group system. Patients should avoid
exposure to the cold and blood transfusion may be
required for severe anaemia.
Alloimmune haemolytic anaemia is seen where
antibodies from one individual react against red cell
antigens on another individual, for example in
haemolytic transfusion reactions or haemolytic dis-
ease of the newborn (see Section 8.13.5).
2. Nonimmune destruction of red cells may be due to
red cell membrane defects (e.g. hereditary spher-
ocytosis), mechanical red cell destruction (e.g. due
to a prosthetic heart valve) or due to chronic
disease, such as liver or kidney disease.
3. Other causes for acquired haemolytic anaemia in-
cludemalaria, extensive burns, drugs and chemicals
that can induce oxidative haemolysis (e.g. dapsone
and certain weedkillers) and toxins such as arsenic
and hypersplenism.
8.6.4 Macrocytic anaemia
Macrocytic anaemia, in which the MCV is >96 fL, can
be subcategorized according to the appearance of bone
marrow into megaloblastic and nonmegaloblastic
macrocytic anaemia. Megaloblastic anaemia is defined
by the presence in bone marrow of large erythroblasts
with immature nuclei (megaloblasts). The most im-
portant causes of megaloblastic macrocytic anaemia
are vitamin B12 deficiency and folate deficiency. Non-
megaloblastic macrocytic anaemia, where normal
erythroblasts are seen in bone marrow, is seen in
normal pregnancy, but also in alcoholism, liver disease,
hypothyroidism, aplastic anaemia and following treat-
ment with chemotherapy drugs.
8.6.5 Megaloblastic macrocyticanaemia
8.6.5.1 Vitamin B12 and haemoglobin
Humans are dependent on animal sources for vitamin
B12, which is found in eggs, milk, meat and fish (and
not in vegetables). The average diet contains 5---30 mgper day of vitamin B12, and around 2mg is absorbed.Body stores --- found mainly in the liver --- of around
3mg of vitamin B12 will last for approximately 2 years
if absorption failure occurs, after which deficiency will
develop.
The B12 molecule is a cobalamin, consisting of
planar (flat) group made up of four pyrrole rings with
a central cobalt atom bound to them, and a ribonucle-
otide set at 90� to this (Figure 8.35).
Vitamin B12 is necessary for the metabolism of
almost every cell in the body. It is required for the
successfulmethylation of homocysteine to convert it to
methionine during DNA synthesis, and as a coenzyme
for conversion ofmethylmalonyl CoA to succinyl CoA,
a keymolecule of the citric acid cycle. After ingestion in
food, the action of gastric enzymes releases it from
proteins and it is bound to an ‘R’ binder protein.
Pancreatic enzymes later separate the two and at this
point B12 is bound to intrinsic factor in the small
intestine. Intrinsic factor is a glycoprotein excreted by
parietal cells of the stomach and binds B12 to carry it to
receptors on the mucosa in the ileum --- B12 is trans-
ported into ileal cells while intrinsic factor stays be-
hind. B12 is then taken to the bone marrow via the
bloodstream on the transport protein transcobalamin
Chapter 8 Haematology and transfusion science 357

II (TCII), thoughmost B12 is bound to transcobalamin
I, of which the function is unknown.
8.6.5.2 Vitamin B12 deficiency
Deficiency of vitamin B12 is most commonly due to
pernicious anaemia (see Section 8.6.5), butmay also be
seen where dietary intake is poor (e.g. in vegans), with
congenital deficiency of transcobalamin II or intrinsic
factor, following removal of the stomach (gastrecto-
my) or small intestine and due to infection with fish
tapeworm.
8.6.5.3 Pernicious anaemia
Pernicious anaemia is an autoimmune condition in
which the gastric parietal cells are destroyed, leading to
a loss of intrinsic factor and consequent vitamin B12
malabsorption. It is relatively common in the elderly,
particularly in females, people of blood group A and
thosewith fair hair and pale eye colour.More than 90%
will have antibodies against parietal cells in serum and
50% will have antibodies against intrinsic factor. The
onset of pernicious anaemia is gradual, with progres-
sive symptoms of anaemia and often a mild jaundice
due to breakdown of Hb. Neurological problems
also occur with B12 deficiency, causing parasthesia
(tingling) in fingers and toes, weakness and loss of
vibration and spatial sense, which can develop into
paraplegia, dementia and psychiatric problems.
A full blood count will show a decreased Hb with a
raised MCV --- red cells are large (megaloblastic) and
hypersegmented neutrophils are seen on a blood film.
Serum bilirubin is often raised, and serum B12 levels
are well below the normal range (below 160 ng/L).
The treatment of pernicious anaemia is usually with
regular intramuscular injections of vitamin B12 (as
hydroxycobalamin) over the rest of the patient’s life,
though oral B12 is now being used since 2%of the dose
is absorbed by diffusion into the blood without intrin-
sic factor.
8.6.5.4 Folate
Folate (folic acid) is present in green vegetables and in
offal (liver and kidney). The average diet contains
around 400 mg of folate per day, though cooking
markedly reduces the amount present.
The folate molecule comprises a pteridine nucleus,
p-aminobenzoic acid and glutamic acid. Folate is
inactive until it is reduced in the body to dihydrofolic
acid and then to tetrahydrofolate (THF) (Figure 8.36).
These two latter forms are coenzymes used in amino
acid metabolism and in the synthesis of purines and
pyrimidines for DNA and RNA synthesis.
8.6.5.5 Folate deficiency
The body’s folate stores are relatively low (�10mg)
and folate deficiency can develop after about 4 months
of a folic acid deficient diet; this may be more rapid
when folate utilization by the body is high. The major
cause of folate deficiency is nutritional due to poor
intake and absorption (e.g. in starvation, following
gastrectomy, coeliac disease, alcoholism), though anti-
folate drugs such as phenytoin, trimethoprim ormeth-
otrexate may also be a cause. Increased utilization of
Me
Me
N
N
O
OHO
CH2HO
P
H
N
O O
O
Me
Co 2 +
N
Me
Me
Me
CH2
CH2
Me CH2
Me
Me
Me
CH2CH2N
O
CH2 C NH2
CH2 C NH2
C NH2
O
MeH2N C CH2 CH2
O
H2N CH2
O
O
O
C
−N
N N
O
Figure 8.35 Structure of vitamin B12
Figure 8.36 Structure of the folic acid molecule
358 Biomedical sciences
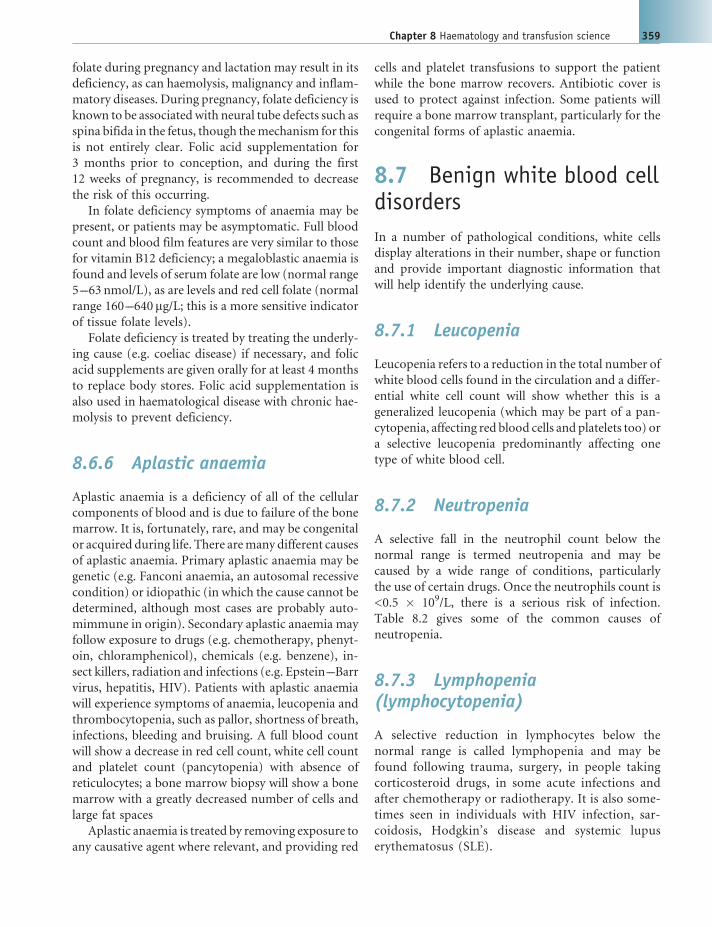
folate during pregnancy and lactation may result in its
deficiency, as can haemolysis, malignancy and inflam-
matory diseases. During pregnancy, folate deficiency is
known to be associated with neural tube defects such as
spina bifida in the fetus, though themechanism for this
is not entirely clear. Folic acid supplementation for
3 months prior to conception, and during the first
12 weeks of pregnancy, is recommended to decrease
the risk of this occurring.
In folate deficiency symptoms of anaemia may be
present, or patients may be asymptomatic. Full blood
count and blood film features are very similar to those
for vitamin B12 deficiency; a megaloblastic anaemia is
found and levels of serum folate are low (normal range
5---63 nmol/L), as are levels and red cell folate (normal
range 160---640 mg/L; this is a more sensitive indicator
of tissue folate levels).
Folate deficiency is treated by treating the underly-
ing cause (e.g. coeliac disease) if necessary, and folic
acid supplements are given orally for at least 4 months
to replace body stores. Folic acid supplementation is
also used in haematological disease with chronic hae-
molysis to prevent deficiency.
8.6.6 Aplastic anaemia
Aplastic anaemia is a deficiency of all of the cellular
components of blood and is due to failure of the bone
marrow. It is, fortunately, rare, and may be congenital
or acquired during life. There aremany different causes
of aplastic anaemia. Primary aplastic anaemia may be
genetic (e.g. Fanconi anaemia, an autosomal recessive
condition) or idiopathic (in which the cause cannot be
determined, although most cases are probably auto-
mimmune in origin). Secondary aplastic anaemia may
follow exposure to drugs (e.g. chemotherapy, phenyt-
oin, chloramphenicol), chemicals (e.g. benzene), in-
sect killers, radiation and infections (e.g. Epstein---Barr
virus, hepatitis, HIV). Patients with aplastic anaemia
will experience symptoms of anaemia, leucopenia and
thrombocytopenia, such as pallor, shortness of breath,
infections, bleeding and bruising. A full blood count
will show a decrease in red cell count, white cell count
and platelet count (pancytopenia) with absence of
reticulocytes; a bone marrow biopsy will show a bone
marrow with a greatly decreased number of cells and
large fat spaces
Aplastic anaemia is treated by removing exposure to
any causative agent where relevant, and providing red
cells and platelet transfusions to support the patient
while the bone marrow recovers. Antibiotic cover is
used to protect against infection. Some patients will
require a bone marrow transplant, particularly for the
congenital forms of aplastic anaemia.
8.7 Benign white blood celldisorders
In a number of pathological conditions, white cells
display alterations in their number, shape or function
and provide important diagnostic information that
will help identify the underlying cause.
8.7.1 Leucopenia
Leucopenia refers to a reduction in the total number of
white blood cells found in the circulation and a differ-
ential white cell count will show whether this is a
generalized leucopenia (which may be part of a pan-
cytopenia, affecting red blood cells and platelets too) or
a selective leucopenia predominantly affecting one
type of white blood cell.
8.7.2 Neutropenia
A selective fall in the neutrophil count below the
normal range is termed neutropenia and may be
caused by a wide range of conditions, particularly
the use of certain drugs. Once the neutrophils count is
<0.5 � 109/L, there is a serious risk of infection.
Table 8.2 gives some of the common causes of
neutropenia.
8.7.3 Lymphopenia(lymphocytopenia)
A selective reduction in lymphocytes below the
normal range is called lymphopenia and may be
found following trauma, surgery, in people taking
corticosteroid drugs, in some acute infections and
after chemotherapy or radiotherapy. It is also some-
times seen in individuals with HIV infection, sar-
coidosis, Hodgkin’s disease and systemic lupus
erythematosus (SLE).
Chapter 8 Haematology and transfusion science 359

8.7.4 Leucocytosis
Leucocytosis is an increase in the absolute white cell
count. A differential white cell count will reveal which
type of white cell predominates.
8.7.5 Neutrophilia
A selective increase in the neutrophils count above the
normal range is called neutrophilia, and this is the
commonest abnormality of white cell count (Fig-
ure 8.37). The most important cause of neutrophilia
is bacterial infection and neutrophils may show addi-
tional features on a blood film such as toxic granulation
(abnormal, coarsereddishgranules)andthepresenceof
D€ohle bodies (small, pale blue peripheral cytoplasmic
inclusions). These features indicate accelerated neutro-
phils production in the bone marrow. Some of the
causes of neutrophilia are given in Table 8.3.
8.7.6 Eosinophilia
An increase in eosinophil count above the normal
range is called eosinophilia, and is usually due to allergy
in developed countries from conditions such as
asthma, hay fever and drug sensitivity (Box 8.6 and
Figure 8.38). It is sometimes found in people with
eczema, psoriasis and with malignancies such as lym-
phoma and metastatic carcinoma. However, in other
regions of the world eosinophilia is most often due to
parasitic infections such as hookworm, filariasis, hy-
datid cysts and strongyloidiasis.
Table 8.2 Common causes of neutropenia
Physiological Neutrophil counts lower in Black populations
Infections Overwhelming bacterial infection
Some viral, fungal and protozoal infections
Drugs Antibiotics: chloramphenicol, cotrimoxazole
Antiinflammatories: indomethacin,
phenylbutazone
Some anticonvulsant drugs, oral hypoglycaemic
drugs, antithyroid drugs, antimalarial drugs,
antihistamines, antidepressants
Immune Autoimmune neutropenia, systemic lupus
erythematosus (SLE)
Other causes Familial benign chronic neutropenia,
hypothyroidism, hypopituitarism
Figure 8.37 Peripheral blood film showing neutrophilia
Table 8.3 Some causes of neutrophilia
Physiological Neonates, pregnancy, lactation, exercise
Infections Acute infections with pyogenic bacteria
Inflammation Burns, surgery, myocardial infarction,
rheumatoid arthritis
Metabolic Diabetic ketoacidosis, gout, thyrotoxicosis
Drugs Adrenalin (epinephrine), steroids
Nonhaematological
malignancies
Lymphoma, malignant melanoma,
carcinoma
Myeloproliferative
disorders
Myelofibrosis, polycythaemia, leukaemia
Other causes Electric shock, convulsions, following
removal of the spleen
Box 8.6 Spanish Toxic Oil Syndrome
In 1981, some 20 000 people in Spain became
acutely unwell with intense muscle pain and
investigations revealed that they had a marked
eosinophilia too. This was eventually discovered
to be due to ingestion of a toxic oil that had been
fraudulently marketed as olive oil; it contained
fatty acid esters of 3-(N-phenylamino)-1,2-pro-
panediol (PAP). Some 300 people died and
many have since developed chronic tissue and
neurological disorders.
360 Biomedical sciences

8.7.7 Lymphocytosis
An increase in lymphocyte count above the normal
range for one’s age is called lymphocytosis; however, a
relative lymphocytosis is normal in young children
below the age of 2, hence the need to correct for age.
Lymphocytosis is most often due to viral infection, for
example in glandular fever, hepatitis, cytomegalovirus,
rubella or pertussis, and may also be seen in thyrotoxi-
cosis and some connective tissue diseases. However, it
may also be seen in chronic lymphocytic leukaemia.
8.7.8 Infectious mononucleosis(glandular fever)
Infectious mononucleosis (commonly known as
‘mono’ in the USA, and as ‘glandular fever’ in the
UK) is an infection of the nasopharyngeal epithelial
cells and B-lymphocytes with the Epstein---Barr virus
(EBV). Most people infected have a mild illness, with
sore throat, tiredness, headaches and fever, and swollen
lymph nodes (lymphadenopathy) in the neck. Around
half also experience swelling of the spleen and a very
small proportion may have splenic rupture, thrombo-
cytopenia, haemolytic anaemia, aplastic anaemia or
liver failure. A full blood count will show an increase in
the absolute lymphocyte count and a blood film shows
the appearance of lymphocytes with abnormal mor-
phology (‘atypical mononuclear cells’) --- they are
large, with abundant basophilic cytoplasm and an
indented nucleus with prominent nucleoli and fine
chromatin patterns (Figure 8.39). The abnormal
lymphocytes typically show scalloping of their plasma
membranes at the point of contact with other blood
cells on the film, and appear to be almost wrapped
around them. These atypical cells are T-lymphocytes
which are reacting against infected B-lymphocytes;
the latter appear morphologically normal on a blood
film. The diagnosis of mononucleosis can bemade by
detection of the characteristic heterophilic antibo-
dies present in serum from 2---3 weeks after the onset
of illness to around 3months later --- these antibodies
crossreact against the red cells of different species
and will agglutinate them (‘monospot’ test). IgM
antibodies (indicating recent/current infection)
and IgG antibodies (indicating infection in the
past) against EBV can also be used in the diagnosis
if necessary.
8.7.9 Monocytosis
An increase inmonocyte count above the normal range
is monocytosis; it may be caused by a range of bacterial
or viral infections, including glandular fever, tubercu-
losis, brucellosis, subacute bacterial endocarditis,
syphilis andmalaria. It can also be seen in autoimmune
conditions such as rheumatoid arthritis, ulcerative
colitis and systemic lupus erythematosus, as well as
in malignancies such as Hodgkin’s disease and some
forms of leukaemia.
8.8 Haemostasis
Blood faces an interesting dilemma in survival terms.
To function as a transport medium for oxygen,
Figure 8.38 Peripheral blood film showing eosinophilia.Source: http://en.wikipedia.org/wiki/File:Eosinophils_in_peripheral_blood.jpg�Ed Uthman, MD, Houston, Texas, USA
Figure 8.39 Atypical mononuclear cells on the peripheralblood film from a patient with infectious mononucleosis.Source: www.hematologyatlas.com
Chapter 8 Haematology and transfusion science 361

nutrients and carbon dioxide, blood needs to be a
fluid that can be pumped readily around the vascular
network. However, this also means that large quan-
tities of blood could be readily lost from broken
blood vessels if blood remained a fluid in that
circumstance. Happily we have evolved haemostasis
--- the ability of blood to clot in the event of injury.
Blood is usually in a state of equilibrium such that it
is neither forming pathological clots (thrombi)
within blood vessels nor haemorrhaging abnormally
from damaged blood vessels. Several factors contrib-
ute to this haemostatic homeostatis. Blood vessels
themselves are involved, as are platelets and the
clotting factors and inhibitors of the clotting cas-
cade, all of which are detailed here (Box 8.7).
8.8.1 Blood vessels andhaemostasis
While capillaries are simple structures comprising a
single layer of endothelium, veins and arteries are more
complex affairs with three layers. The outer layer, the
tunica adventitia, is a tough connective tissue ‘coat’. The
middle layer, the tunicamedia, has different amounts of
muscle and elastin in arteries --- relativelymore elastin in
elastic arteries and more muscle in muscular arteries,
though this layer is thin in veins. The inner layer of veins
and arteries is the tunica intima, and this layer com-
prises a single layer of endothelial cells which are critical
to successful haemostasis. Endothelial cells contain
Weibel-Palade bodies, which produce the glycoprotein
von Willebrand factor (vWF). vWF functions as a
binding protein; it acts as a bridging protein for platelet
adhesion when blood vessels are damaged. vWF is also
produced by megakaryocytes, and can thus be found in
platelets too (Figure 8.40). It can also be found in
solution in plasma, where it binds clotting factor VIII
and increases its half-life five times.
8.8.2 The role of platelets inhaemostasis
Platelets need to be activated before they can aggregate
into a blood clot, and activation requires platelets
Box 8.7 Rudolph Virchow
Virchow’s triad- The nineteenth century Ger-
man pathologist Rudolph Virchow made a
number of important discoveries in his lifetime
and several clinical signs now bear his name (e.g.
Virchow’s law, Virchow’s node). He discerned
that changes in a blood vessel, changes in blood
flow and changes in the content of blood could
all cause thrombosis, or the formation of abnor-
mal clots within blood vessels --- this is known as
Virchow’s triad.
Figure 8.40 Von Willebrand factor and platelet adhesion
362 Biomedical sciences

coming into contact with one of a range of surfaces.
The most obvious one is a damaged blood vessel;
platelets immediately adhere to, and are activated by,
contact with the tissues beneath vascular endothelial
cells, and they have specific receptors on their plasma
membrane for vWF to enable this adhesion. Other
substances are also capable of activating platelets, such
as ADP and bacterial endotoxins. Once platelets have
adhered, they undergo a shape change from their small,
discoid form to become a highly irregular shape with
multiple projections from the plasma membrane. This
makes the platelet extremely ‘sticky’, rather like the
barbed fruit burrs from the goosegrass weed, which are
almost impossible to comb out of a pet’s fur (see
Figure 8.41)!
As the external shape of the platelet changes upon
activation, so its internal structure is altered to enable
the platelet’s granules to fuse with its inner network of
tubules, allowing the contents of the granules to be
released along the tubule tunnels to the surface of the
platelet. The released contents of the granules cause the
adherence of further platelets, which are themselves
activated and degranulate, recruiting more and more
platelets to the damaged area.
8.8.3 The clotting cascade
The ultimate goal of the clotting cascade is to convert
soluble fibrinogen in plasma into insoluble fibrin, a
mesh-like structure that converts relatively weak
platelet aggregates into a strong, stable clot. To
achieve this, a cascade of enzyme reactions takes
place. Although the clotting cascade has been tradi-
tionally delineated into ‘extrinsic’ and ‘intrinsic’
branches, this is not the case in reality (though it
remains a useful concept when interpreting the results
of some clotting tests). The cascade is one unified
pathway, and proceeds as follows.
The cascade starts with the exposure of tissue
factor (TF) when tissue damage occurs. TF immedi-
ately binds to factor VII in plasma and the clotting
cascade is initiated. The TF---factor VII complex turns
inactive factor X into active factor Xa (‘a’ denotes the
active form of clotting factors). Once factor Xa is
produced, inhibition of further conversion of factor X
to Xa is achieved by tissue factor pathway inhibitor
(TFPI), and further Xa must be generated via factors
IX and VIII (see Figure 8.42). Factor Xa converts
prothrombin into thrombin, and thrombin serves
the purposes of activating factors IX, VIII and XI
(producing further Xa --- again, refer to Figure 8.42),
and factor V, which hugely amplifies the conversion
of prothrombin to thrombin. Finally, thrombin also
triggers polymerization of fibrinogen monomers into
the net-like molecule fibrin, all whilst enhancing its
own production via activating clotting factors.
Thrombin requires Ca2þ ions to achieve this, and
also activates factor XIII to assist with the fibrin/
fibrinogen conversion.
von Willebrand factor also plays an important role
in the clotting cascade, in that it associates with factor
Figure 8.41 Inactivated platelets on left; activated platelets on right (left). Litvinov et al in The Journal of BiologicalChemistry Vol 278 2003� The American Society for Biochemistry and Molecular Biology. Goosegrass fruit (right). Goosegrassfruit photograph�www.english-country-garden.com
Chapter 8 Haematology and transfusion science 363

VIII in plasma, forming VIII:C, and protects it from
being broken down in plasma.
8.8.4 Control of the clottingcascade
Haemostasis must be held in check in the normal
person --- it would plainly be disastrous if blood clotted
too readily in the absence of tissue damage. Antic-
oagulants are present to keep the clotting cascade from
activating inappropriately, or extending too widely
once the cascade is initiated.
8.8.4.1 Protein C and protein S
Protein C is activated by thrombin, and activated
protein C inactivates factors V and VIII to reduce
further production of thrombin. Protein S acts as a
cofactor for protein C; for reasons that are as yet
Figure 8.42 The clotting cascade
364 Biomedical sciences
unclear, the majority of protein S is bound in the
circulation (by C4b), but it is the free, unbound
fraction of protein S in plasma that is active.
8.8.4.2 Antithrombin
Antithrombin achieves its anticoagulant activity by
binding a range of activated clotting factors (factors
Xa, IXa, XIa, XIIa, VIIa and thrombin) and in so doing
‘hides’ their active site, preventing their participation
in the cascade with their substrates. Antithrombin is a
serpin (serine protease inhibitor) molecule and its
inactivation of its target clotting factors is greatly
increased by heparin.
8.8.4.3 Fibrinolysis
After the clotting cascade has been triggered and
resulted in the formation of fibrin and a stable clot,
fibrinolysis will be initiated by the presence of fibrin.
This process aims to restore blood flow in the damaged
vessel. The enzyme plasmin is fundamental to breaking
down fibrin; it is produced from inactive plasminogen
by the action of tissue plasminogen activator (tPA),
which is derived from endothelial cells, and fibrin itself
has binding sites for plasminogen activators. Plasmin
degrades both fibrin and fibrinogen into fibrin degra-
dation products (FDPs), fragments known as X, Y, D
and E. D-dimer levels can bemeasured to establish that
the clotting cascade has been initiated in patients who
may have a thrombus, for example in suspected deep
venous thrombosis or pulmonary embolus.
8.8.5 Laboratory clotting tests
There is an enormous range of specialized tests that can
be undertaken to investigate disorders of blood coag-
ulation, including assays of the various clotting factors.
Here, the commonest laboratory coagulation tests are
considered.
8.8.5.1 Activated partial thromboplastin time(aPTT)
In the aPTT assay, a patient’s plasma is combined with
a platelet membrane substitute, calcium (which re-
verses the effect of the anticoagulant in the tube the
blood is collected into) and an activator such as silica,
after which the time taken to form a clot is measured in
seconds. This test assesses the intrinsic and common
branches of the clotting cascade pathways. Aprolonged
aPTT ismost often caused by deficiency of factors VIII,
IX, XI or XII, by treatment with the anticoagulant
heparin, or by the presence of inhibitors to clotting
factors. If aPTT is prolonged, the test is repeated with a
50:50 mixture of the patient’s plasma and plasma that
is known to be normal; if the problem is corrected, it is
likely that the patient has a clotting factor deficiency
and clotting factor assays can be undertaken. If it does
not correct, the presence of an inhibitor to clotting
is likely.
The normal range will be produced by the labora-
tory for each batch of reagents used in the test; it can
thus vary between laboratories, as well as at different
times in the same laboratory. A typical normal range
for aPTT is 25---39 s.
8.8.5.2 Prothrombin time (PT)
The prothrombin time measures the extrinsic branch
of the clotting cascade, looking at the activity of factors
I, II, VII and X. Calcium is added to a patient’s plasma
at 37 �C to reverse the effects of the citrate anticoagu-
lant in the tube the blood was collected in; then tissue
factor (factor III) is added and the time taken to form a
clot is measured. A typical reference range for PT is
11---16 s but again this is dependent on the laboratory
and the reagents used.
A prolonged PT is most commonly caused by a
deficiency of vitamin K (which is essential to produce
factors II, VII, IX and X), by treatment with the
anticoagulant warfarin, by liver failure (as the liver
synthesizes clotting factors) and by deficiencies of
factors V or X.
8.8.5.3 The international normalized ratio (INR)
The INR compares the patient’s PT time to a stan-
dardized normal PT time for a particular batch of
tissue factor and produces a ratio according to this
formula:
INR ¼ PTpatient
PTnormal
:
The normal INR for a healthy person is 0.9---1.3; an
increase in the INR indicates that a patient has a
prolonged PT and can be caused by all the causes of
a prolonged PT. In patients treated with the anticoag-
ulant warfarin, the INR is measured on a regular basis
Chapter 8 Haematology and transfusion science 365

and the dose of warfarin adjusted as necessary to
achieve the target INR. A target INR of 2.0---3.0 is
often used for patients taking warfarin after a deep vein
thrombosis, while a higher target INR (e.g. 3.0---4.0)
may be required in patients with artificial heart valves.
8.9 Coagulation disorders
8.9.1 Vascular disorders
Structural blood vessel disorders can cause easy bruis-
ing in people with normal platelet counts, and coagu-
lation and bleeding test results. Connective tissue
disorders such as Ehlers---Danlos syndrome (in which
abnormal collagen is found in blood vessel walls) can
cause this, as can the autosomal dominantly inherited
Hereditary Haemorrhagic Telangiectasia, with dilated
capillaries present in different areas of the body. Easy
bruising can also be seen in people taking steroids,
in the elderly, and due to certain infections.
Henoch---Sch€onlein purpura may be seen following
chest infections in children and is due to the formation
of IgA complexes triggering vasculitis (inflammation of
blood vessels), with subsequent bleeding (Figure 8.43).
8.9.2 Platelet disorders
The normal range for platelets is 150---400� 109/L, and
abnormal bleeding may occur in individuals with a
lowered platelet count (thrombocytopenia), or who
have a normal platelet count but functionally abnor-
mal platelets.
8.9.2.1 Thrombocytopenia
A low platelet count can be caused by destruction of
platelets in the circulation, by reduced production of
platelets in bonemarrow or because an enlarged spleen
is sequestering platelets. Some instances of reduced
platelet count may be caused by the dilutional effect of
a massive transfusion of red blood cells. Bone marrow
biopsy is a key tool in identifying the cause of throm-
bocytopenia as it will show the level of megakaryocytes
present in bone marrow, as well as their morphology.
The risk of bleeding in thrombocytopenia is directly
proportional to platelet count: a platelet count
<50� 109/L carries a risk of haemorrhage after trauma
and will be closely monitored with repeated full blood
counts but at <20� 109/L, the risk of spontaneous
bleeding and even bleeding into the brain is real and
such patients will often require platelet transfusion.
8.9.2.2 Reduced platelet production in the bonemarrow
There are numerous causes of decreased megakaryo-
cyte production in the bonemarrow leading to throm-
bocytopenia, including bonemarrow failure, leukaemia,
myelodysplasia, aplastic anaemia, some rare in-
herited syndromes (e.g. inherited amegakaryocytic
Figure 8.43 Telangiectasia (left) and Henoch---Sch€onlein purpura (right)
366 Biomedical sciences

thrombocytopenia), numerous drugs (including anti-
biotics, proton pump inhibitors and chemotherapy
drugs) and systemic bacterial and viral infections (e.
g. HIV). Bone marrow biopsy will show decreased
numbers of megakaryocytes, and may show morpho-
logical abnormality. Treatment is that of the underlying
cause or stopping any drugs where this may be a factor.
8.9.2.3 Excessive destruction of platelets in theperipheral circulation
Platelet destruction in the peripheral circulation is
mainly mediated by immune mechanisms, of which
the most clinically important is the autoimmune con-
dition immune thrombocytopenia purpura. Other
causes of excessive destruction are disseminated intra-
vascular coagulation, systemic lupus erythematosus
and thrombotic thrombocytopenia purpura (TTP).
Drugs may also lead to immune-mediated platelet
destruction. Heparin-induced thrombocytopenia (HIT)
is one example where antibodies are produced against
heparin-platelet factor 4 complexes in a small propor-
tion of patients receiving heparin for anticoagulation,
and alongside thrombocytopenia, HIT paradoxically
predisposes to severe thrombosis, as the antibody trig-
gers platelet aggregation.
8.9.2.4 Immune thrombocytopenia purpura (ITP)
Immune thrombocytopenia purpura (ITP) occurs
where macrophages remove antibody-coated platelets
from the peripheral circulation, causing a fall in plate-
let count and leading to bruising, nose bleeds and
petechiae (pin-prick sized bruises on the skin). It may
appear rapidly in younger children, but usually has a
more insidious onset in adults who develop ITP.
Platelet autoantibodies will be found in �70% of
people with ITP and in adults women are most often
affected. Full blood count shows an isolated thrombo-
cytopenia and bone marrow biopsy will show normal
or increased levels of megakaryocytes. Most people
with ITP require no treatment, as it is usually a mild,
selflimiting condition. High dose oral steroids may be
used in both adults and children where necessary, and
immunoglobulin can be given intravenously in adults
where a rapid rise in platelets is needed (e.g. prior to
surgery). Removal of the spleen may be required in
some adults and this has high success rates in improv-
ing platelet count; however, a few go on to require
additional immunosuppressive drugs. Platelet transfu-
sions are generally reserved for urgent clinical situa-
tions only in ITP, and are not part of routine manage-
ment --- it is usually pointless to transfuse platelets in
ITP as transfused platelets will also be rapidly
destroyed!
8.9.2.5 Thrombotic thrombocytopeniapurpura (TTP)
Thrombotic thrombocytopenia purpura (TTP) is
uncommon; it occurs where endothelial damage trig-
gers widespread platelet aggregation and extensive
microscopic thrombosis throughout the body, with
ultimate platelet consumption and severe thrombo-
cytopenia. Red blood cells that are forced through
the tiny thromboses are damaged too, with haemo-
lytic anaemia ensuing, and numerous schistocytes
(damaged, fragmented red cells) seen in the circula-
tion. This all causes widespread bruising, fever, neu-
rological problems such as headache, hallucinations
and often with renal failure too. Primary TTP is
caused by autoantibodies inhibiting an enzyme called
ADAMTS13, which is normally responsible for cleav-
ing the vWF molecules --- the presence of large vWF
molecules (ultra large vWF multimers) is known to
trigger platelet aggregation and vWF is a presence in
both platelets and endothelium for this purpose.
Secondary TTP may occur due to the presence of
tumours, in pregnancy, with some infections and
certain drugs, but the mechanism of action is not yet
well understood for secondary TTP.
Treatment of TTP relies on plasmapheresis, which is
removing the patient’s own plasma --- and thus their
autoantibodies - from one vein, and exchanging it for
donated plasma containing a fresh source of uninhib-
ited ADAMTS13 via another vein.
8.9.2.6 Splenic sequestration of platelets
Splenomegaly is associated with a range of haemato-
logical conditions and the presence of an enlarged
spleen can lead to sequestration of platelets there,
causing a decreased platelet count in the peripheral
circulation.
8.9.3 Platelet function disorders
People may inherit or acquire dysfunctional platelets.
This will usually result in bruising and haemorrhage in
Chapter 8 Haematology and transfusion science 367

the presence of a normal (or high) platelet count, with
a prolonged bleeding time due to those platelets being
functionally abnormal. Inherited platelet dysfunction
disorders encompass a range of anomalies, including a
lack of dense bodies within platelets (storage pool
deficiency), a lack of the binding site for vWF on
platelets (Bernard---Soulier syndrome), or a defective
fibrinogen binding site (Glanzmann’s thrombasthe-
nia). Acquired platelet dysfunction may occur in a
setting of renal and liver disease, myeloproliferative
disorders or simply via the action of NSAIDs which act
as platelet inhibitors.
8.9.4 Thrombocytosis
A platelet count above the normal range --- a count
greater than 400� 109/L --- is thrombocytosis; it is said
to be an ‘acute phase reaction’, meaning something
that is a physiological response to disease. It can be seen
in the setting of iron deficiency, cancer, myeleoproli-
ferative disease and inflammatory disease. It is also
found after splenectomy since the site of themajority of
platelet elimination has been removed. The underlying
cause of thrombocytosis should be treated where pos-
sible, but low dose aspirin may be given to alleviate
some of the risk of thrombosis in the presence of a
chronically elevated platelet count.
8.9.5 Inherited disorders of bloodclotting
8.9.5.1 Haemophilia A
Haemophilia A is a haemorrhagic tendency caused
by insufficient production of factor VIII. It is an X-
linked condition, and thus almost all sufferers are
male. It is possible to be a female with haemophilia,
but this requires inheritance of two defective genes
on both X chromosomes, one from a father with
haemophilia and the other from a carrier mother; as
such this is far rarer in females than males, who only
need to inherit one defective factor VIII gene from a
carrier mother. The incidence is about one in 5000 of
the male UK population and new mutations of the
factor VIII gene that produce sporadic cases of
haemophilia are relatively common, since it is a very
large gene, which is thus statistically more prone to
mutation.
Haemophilia A varies in severity in different in-
dividuals and to a large extent this is due to the levels of
factor VIII they produce. Severe haemophilia is expe-
rienced by haemophilia sufferers with factor VIII levels
of <1 IU/dL (normal range 50---150 IU/dL), with spon-
taneous bleeding, particularly into joints, occurring
regularly from infancy if untreated. Moderate haemo-
philia is experienced if factor VIII levels are 1---5 IU/dL,
with rare spontaneous haemorrhage, and most bleed-
ing occurring where injury has preceded it. Mild
haemophilia is defined by factor VIII levels >5 IU/dL,
and diagnosis is often made late in this group of
individuals. Haemorrhage usually only occurs after
surgery or significant injury.
Laboratory testing in haemophiliaClotting tests on individuals with haemophilia will
show a normal bleeding time and prothrombin time
(PT), but a prolonged activated partial thromboplastin
time (APTT). Levels of factor VIII:C will be low.
Management of haemophiliaRecombinant preparations of factor VIII can be in-
fused intravenously to treat haemophilia A, either at
the time of haemorrhage, for planned surgery or
prophylactically in people with severe haemophilia to
prevent recurrent joint bleeds (haemarthroses) and the
risk of ensuing deformity and disability from these
(Box 8.8). Since the half-life of factor VIII is only 12 h,
infusions are given twice daily where there is bleeding
Box 8.8 The legacy of plasma-derived factoruse in haemophilia
In most developed countries, recombinant
factor VIII and IX is now produced in the
laboratory for use in people with haemophilia.
However, until relatively recently, these factors
were manufactured from pooled plasma from
blood donors, and this camewith the risk of viral
transmission in the era prior to exclusion of
high-risk blood donors and screening for virus-
es. InfectionwithHIV,Hepatitis B andHepatitis
C was sadly not uncommon among people with
haemophilia who received plasma-derived fac-
tor, and lawsuits continue in this area. The risk of
vCJD from blood products remains, and plasma
products in the UK are currently obtained from
countries with a low incidence of BSE.
368 Biomedical sciences

or planned surgery, and three times a week in young
people with severe haemophilia who are receiving it
prophylactically (usually from around the age of 2 into
early adulthood). However, a significant proportion of
people with haemophilia will develop antibodies
against factor VIII and such individuals may require
alternative therapy with recombinant factor VIIa
(which effectively bypasses factor IX and VIII activity
in the clotting cascade --- see Figure 8.42).
Vasopressin (often given as a nasal spray) may also
be useful in people with mild haemophilia, in whom it
is capable of producing a rise in factor VIII levels that
may suffice to treat minor haemorrhage.
Female carriers of haemophiliaFemale carriers of haemophilia A may have reduced
levels of factor VIII, but this is highly variable between
individual females due to the random nature of
lyonization (in which one X chromosome is inacti-
vated in each cell). DNA studies to look for factor VIII
gene mutations are often required to confidently
identify female carriers where a family history is
present and antenatal testing for haemophiliac status
of any male fetuses may be offered if a pregnancy
ensues. Obstetricians should be aware of a woman’s
haemophilia carrier status since the delivery of a male
baby with potential haemophilia should be as atrau-
matic as possible --- babies with haemophilia have a
higher risk of cerebral haemorrhage at the time of
delivery.
8.9.5.2 Haemophilia B
Haemophilia B is often known as Christmas disease
after the first patient identified with it, Stephen Christ-
mas, in 1952, and it is due to factor IX deficiency. It is
also X-linked, but far less common than haemophilia
A, with an incidence of one in about 30 000males in the
UK population. This is probably because the gene for
factor IX is smaller than that for factor VIII and thus
less prone to mutation.
Haemophilia B is managed in a similar manner to
haemophilia A, using recombinant factor IX.However,
vasopressin will not increase levels of factor IX.
8.9.5.3 Von Willebrand disease
Von Willebrand disease (vWD) is the most common
bleeding disorder, thought to be present in around 1%
of the population although only symptomatic in a
small proportion of these. It is usually caused by a
qualitative or quantitative lack of vWF, that is vWF
may be present at very low levels in vWD, or present at
normal levels but as an abnormal molecule which does
not function well (Box 8.9). The congenital forms of
vWD may be inherited in autosomal dominant or
recessive forms. Some cases of vWD are acquired, and
due to the production of autoantibodies against a
normal vWF molecule.
vWD is diagnosed in the laboratory by measuring
the amount present in plasma and also how well it is
functioning using a glycoprotein binding assay. Factor
VIII levels can also be measured; these can be low in
vWF deficiency, as vWF binds factor VIII in plasma
and increases its half-life.
vWD is generally mild enough to need no treat-
ment, though additional factor VIII may be given at
times of increased bleeding (e.g. for elective surgery)
for people badly affected. For milder cases, vaso-
pressin nasal spray can be used as it increases the
release of vWF from the Weibel---Palade bodies in
endothelial cells.
8.9.6 Acquired clotting disorders
8.9.6.1 Disseminated intravascular coagulation(DIC)
Disseminated intravascular coagulation (DIC) occurs
where there is universal triggering of the clotting
cascade throughout the body, with generalized plate-
let aggregation, ultimately with consumption of all
clotting factors and platelets. This in turn causes
widespread fibrinolysis and then inhibition of further
fibrin formation, so the clinical picture that was
initially one of thrombosis may become one of pro-
found haemorrhage. DIC is seen in some people after
large burns, in the presence of eclampsia, septicaemia
and falciparum malaria, and with malignant disease.
In serious cases, PT and APTT are prolonged, with
Box 8.9 vWF and blood group
Interestingly, levels of vWF have been found to
be related to ABO blood group. Group O in-
dividuals have the least vWF, while group AB
individuals have the highest levels. This is related
to the frequency of symptomatic vWD, which is
commonest in people who are blood group O.
Chapter 8 Haematology and transfusion science 369

depletion of fibrinogen levels and severe thrombocy-
topenia. Treatment is of the underlying condition and
this will often suffice for mild DIC. In worse cases of
DIC, replacing platelets and clotting factors and
maintaining blood volume, is the treatment of choice.
8.9.6.2 Liver disease
Clotting factors are made in the liver, and liver disease
will often result in deranged coagulation tests as a
consequence. Platelet dysfunction and defective fibrin-
ogen may also be sequelae to liver disease for some
individuals.
8.9.6.3 Vitamin K deficiency
Without vitamin K, factors II, VII, IX and X (and
proteins C and S) are unable to bind Ca2þ ions,
rendering them inactive and giving a prolonged PT
and APTT. This can cause bruising, haemorrhage and
haematuria (blood in urine). Vitamin K deficiency can
be seen in newborn babies, who are routinely pre-
scribed vitamin K shortly after birth, and also in people
who malabsorb vitamin K or are severely malnour-
ished. Warfarin is a vitamin K antagonist, which is the
basis of its anticoagulant activity.
Treatment of vitamin K deficiency is to treat the
cause and replace vitamin K if necessary.
8.9.6.4 Thrombotic disorders
ThrombosisA thrombus is defined as an abnormal clot formed
within an intact blood vessel in a living person and it
can be caused by any of the three components of
Virchow’s triad: changes in the blood vessel, changes
in blood flow and changes in the constituents of blood.
Deep vein thrombosis (DVT) is themost common type
of thrombus and forms in the deep veins of the calf. The
danger of having a thrombus is the possibility of a
section of it breaking off (an embolus) and travelling to
another site in the body, where it may block other
blood vessels. Venous thrombi usually occur in normal
blood vessels, but in areas of stasis of blood, or where
alteration to components of blood make thrombus
formation more likely.
Thrombi may occur in the arteries, usually in the
presence of preexisting atherosclerosis of the vessel.
The rough plaque of atheroma and associated endo-
thelial damage creates a sitewhere platelets aggregate; if
clotting is triggered an arterial thrombus may result.
This is commonly seen in the coronary arteries during
myocardial infarction (MI) or within the ventricles of
the heart.
Risk factors for thrombosis include increasing age,
obesity, long-haul travel, pregnancy, recent surgery,
the oral contraceptive pill, cancer, hormone replace-
ment therapy, varicose veins, sickle cell anaemia and
the thrombophilias.
ThrombophiliasThe tendency to form thrombi is known as thrombo-
philia, and this may be inherited or acquired. This may
be the cause of recurrent deep vein thrombosis and of
recurrent miscarriages. One inherited cause that has
been discovered in recent years is factor V Leiden, a
variant form of clotting factor V that is not easily
cleaved by protein C, making it far more likely to
proceed in the clotting cascade and cause the forma-
tion of a thrombus. It is found in around 30% of
patients with deep vein thrombosis. The risk of throm-
bosis from factor V Leiden is compounded by the
addition of other risk factors given above, particularly
the oral contraceptive pill.
Other less common forms of thrombophilia include
antithrombin deficiency (which may be inherited, or
acquired after trauma or major surgery), an inherited
variant of prothrombin giving rise to elevated levels of
it, deficiencies of Protein S andProtein C, and antipho-
spholipid antibody (see Section 8.8.4).
Investigation of thrombosis and thrombophiliaIn the laboratory setting, a platelet count should be
performed as part of FBC, along with a fibrinogen
level and coagulation screen. If a thrombophilia is
suspected after recurrent instances of thrombosis (or
miscarriage), assays can be performed for the specific
causes, for example levels of protein C and protein S.
Treatment of thrombosisArterial thrombosis treatment is tailored to the precise
clinical situation. It may include the use of thrombo-
lytic (‘clot busting’) drugs to break down a thrombus.
Streptokinase or recombinant tissue plasminogen ac-
tivator (rTPA) are thrombolytic drugs: both promote
the formation of plasmin, and thus the degradation of
fibrin and breakdown of a thrombus. Antiplatelet
drugs such as aspirin or clopidogrel may be given to
help prevent platelet activation at the site of atheroma
370 Biomedical sciences

in patients known to be at risk. The treatment of
arterial thrombosis must, however, include manage-
ment of risk factors for atheroma, such as improving
diabetic control or losing weight as needed to attain a
healthy BMI.
Venous thromboembolism is usually managed
with anticoagulants such as heparin and warfarin.
Heparin is given either as an intravenous infusion or
via subcutaneous injection and it binds antithrombin
to have an immediate anticoagulant effect. Direct
thrombin inhibitors such as hirudin may be preferred
in some patients (e.g. those suffering from heparin-
induced thrombocytopenia). Many patients will be
started on the oral anticoagulant warfarin at the same
time as commencing treatment with heparin; warfarin
takes several days to establish its antivitamin K activity
and diminish levels of factors II, VII, IX and X, but
once it is working well, heparin can be discontinued.
The efficacy of warfarin in an individual patient is
established by measuring the international normal-
ized ratio (INR), where the patient’s PT is compared
to a normal control, and expressing the results as a
ratio --- an INR of 2.5 is the usual target in most
patients, but this will be higher (3.5) for patients who
have had recurrent thromboembolism while on
warfarin.
Subcutaneous heparin injections can also be used
for prophylaxis (prevention) of thrombosis in high-
risk patients, for example patients in hospital around
the time of surgery. They are usually used along with
thromboembolic disease (TED) compression stock-
ings, worn on the legs to prevent stasis of blood in the
deep veins there. Up to 10% of all hospital deaths may
be due to pulmonary embolism, so this is a large-scale
problem.
8.10 Myeloproliferativedisorders
Myeloproliferative disorders are characterized by clon-
al proliferations of specific cell lines in the bone
marrow; polycythaemia, thrombocythaemia and my-
elofibrosis are considered here, while chronic myeloid
leukaemia (CML) is described in Section 8.11.1.3.
8.10.1 Polycythaemia
Polycythaemia comprises an increase in Hb, haema-
tocrit and red cell count. It may be a primary disorder
(where the changes in full blood count are due to clonal
stem cell expansion) or where red cell count is raised,
or apparently raised, secondary to other conditions
(e.g. dehydration, cardiac or lung disease, or travelling
to high altitude).
8.10.1.1 Primary polycythaemia
Primary polycythaemia (also known as polycythaemia
vera (PV) or polycythaemia rubra vera) is due to a
clonal expansion of a pluripotent stem cell leading to
an increase in the lineages that give rise to erythroid,
megakaryocyte and myeloid cells. More than 90% are
now known to be due to mutations in the Janus Kinase
2 gene (JAK2), which codes for a cytoplasmic tyrosine
kinase. The effect of this clonal expansion is to cause an
increase in Hb levels (>18.5 g/dL in males; >16.5 g/dL
in females) and bone marrow biopsy in such patients
will show hypercellularity with characteristic increase
in the cell lines detailed above (Figure 8.44). Serum
Figure 8.44 Bonemarrow film in polycythaemia vera showingmarked hypercellularity (left) Pardanani et al in Leukemia, 21,2007 � Nature Publishing Group, a division of Macmillan Publishers Limited; normal bone marrow for comparison (right)
Chapter 8 Haematology and transfusion science 371

erythropoietin levels will be low or normal. Patients
with PV are usually over 60 years old and experience a
gradual onset of vague symptoms such as dizziness,
tiredness and visual problems. They may also have
hypertension, angina and gout and often look
very pink!
Treatment of PV tries to bring the haematocrit
below 45% and venesection is the mainstay in most
patients, with �500mL blood removed each week in
most patients. Intermittent chemotherapy with hy-
droxyurea may also be used to control platelet counts,
with low dose aspirin if blood clotting episodes
are experienced. PV will develop into myelofibrosis
in �30% of cases, and into acute leukaemia in �5%.
8.10.1.2 Secondary polycythaemia
Secondary polycythaemia is, like PV, an increase inHb,
haematocrit and red cell count, but is not due to stem
cell mutation. It may be relative, where plasma volume
is reduced relative to the cellular component of blood,
due to dehydration or burns. Secondary polycythae-
mia may also be seen due to an increase in erythropoi-
etin, due to high altitude, cardiovascular disease, lung
disease, the inheritance of Hb variants with high O2
affinity, or tumours that produce erythropoietin (such
as renal cell carcinoma, hepatocellular carcinoma).
Investigations will show a normal or raised erythro-
poietin level and treatment is to tackle the cause.
8.10.2 Myelofibrosis
Myelofibrosis (sometimes known as myelosclerosis) is
due to clonal expansion of a myeloid stem cell lineage
in the bone marrow, with additional fibrosis of the
marrow due to the production of fibroblast-stimulat-
ing factors by abnormal megakaryocytes. A quarter of
all cases arise following polycythaemia vera. Patients
with myelofibrosis typically have a gradual onset of
tiredness and weakness and will have marked spleno-
megaly --- the spleen may undergo infarction, causing
abdominal pain. Patients with myelofibrosis may also
experience bruising and bleeding due to abnormal
platelets. Investigations show an increase in platelet
and white blood cell counts with anaemia, and bone
marrow trephine biopsy shows increased fibrosis of the
bone marrow (bone marrow aspiration is usually
unsuccessful --- the so-called ‘dry tap’ --- due to the
amount of fibrous tissue in the marrow making it
difficult to aspirate cells). Myelofibrosis can be hard
to distinguish from CML, but the Philadelphia chro-
mosome (see Section 8.11.1) is absent inmyelofibrosis.
Treatment of myelofibrosis is difficult; drugs can be
used to suppress bone marrow activity (e.g. busulfan),
and blood transfusion and folic acid to support the
patient. Radiotherapy/chemotherapy may be em-
ployed to reduce the size of the spleen, though sple-
nectomy (removal of the spleen) may ultimately be
required. The prognosis of myelofibrosis is poor in
most cases, with median survival of 3 years (20% will
transform into acute leukaemia). Bone marrow trans-
plantation can be curative if available for a fit enough
patient.
8.10.3 Myelodysplasia
Myelodysplasia is a group of conditions that cause
gradual bonemarrow failure and is typically seen in the
elderly. It is caused by stem cell disorders in the
myeloid lineages. Patients with myelodysplasia devel-
op a gradual pancytopenia; low Hb, red cell, white cell
and platelet count are seen, singly or in various com-
binations, but alongside increased bone marrow cel-
lularity. Myelodysplasia is classified according to the
percentage of blast cells seen in peripheral blood and
bone marrow; the prognosis worsens with increasing
numbers of blasts seen in the bone marrow, and
patients with >5% blasts are treated with chemothera-
py if fit enough to tolerate it. Bone marrow transplan-
tation may be curative if a match is available, in
patients who are less than 50 years old.
8.10.4 Thrombocythaemia
Thrombocythaemia (also known as essential throm-
bocythaemia (ET)) is related to PV, and another
disorder caused by clonal stem cell expansion in the
bone marrow, but patients with ET have normal
Hb and WBC counts, and increased platelet count to
>600� 109/L, often into the low thousands. Patients
with ET will usually experience a thrombosis (þ/�embolism), but somemay have bleeding problems due
to abnormal platelet function. Many are diagnosed
during routine tests for other reasons. Diagnosis can
prove difficult as there is no single diagnostic test for
ET, and patientsmay need to be observed over a period
of time, with regular FBC, before a firm diagnosis is
372 Biomedical sciences

established. Treatment aims to bring the platelet count
below 400 � 109/L, and uses hydroxyurea, busulphan
ora-interferon to achieve this. ET can progress into PV
or even acute leukaemia, but many cases follow an
indolent course for decades.
8.11 Haematologicalmalignancies
Malignant disorders of blood are relatively uncommon
and all are potentially life-threatening. The cause is
unknown in most cases, but exposure to radiation,
previous chemotherapy and certain viruses have all
been found to increase the risk of haematological
malignancy.
8.11.1 Leukaemia
Leukaemia is uncommon, with an incidence of one in
10 000 per year across all age groups. The subclassifi-
cation of all types of leukaemia is becoming increas-
ingly complex, but leukaemias can be divided into
acute and chronic types based on what the natural
history would be if untreated. They may be further
divided according to whether the affected cell type is of
lymphoid or myeloid origin. Thus the acute leukae-
mias are subdivided into acute lymphoblastic leukae-
mia (ALL) and acute myeloid leukaemia (AML), while
the chronic leukaemias are divided into chronic lym-
phocytic leukaemia (CLL) and chronic myeloid leu-
kaemia (CML).
8.11.1.1 Diagnosis of leukaemia
Patients with leukaemia will classically present with
symptoms of anaemia (pallor, breathlessness), leuco-
penia (infections), thrombocytopenia (bruising) and
general symptoms such as weight loss, and bone pain
from marrow infiltration by malignant cells. A full
blood count will show a low Hb, low platelets and
usually high WBC count (though paradoxically, this
can sometimes be low). A blood film will show the
presence of immature white blood cells (blasts) and a
bone marrow biopsy will show increased cellularity; a
lumbar puncture may also be performed to assess for
the presence of blasts in the central nervous system.
The precise subtype of a leukaemia depends upon the
appearance of the cells on a blood film, with an
assessment of enzymes in the cytosol of the blasts,
establishing which cell surface markers are present on
the blasts with monoclonal antibodies (e.g. using flow
cytometry) and testing for chromosomal rearrange-
ments (by cytogenetic analysis, fluorescent in situ
hybridization (FISH) or PCR for specific fusion genes).
Most cases of leukaemia have an acquired cytogenetic
abnormality, of which the most well known is the
Philadelphia chromosome, which is present in 97%
of cases of CML.
8.11.1.2 Acute leukaemias
Acute lymphoblastic leukaemia (ALL) is the common-
est malignancy in childhood, while AML is found
mainly in older adults (the median age at presentation
is 65). It can be variously subclassified according to the
French---American---British (FAB) scheme, or more
recently according to theWorld Health Organization’s
(WHO) scheme. A simplified version of the WHO’s
classification is given in Table 8.4.
The diagnosis of the specific subtype of acute leu-
kaemia is arrived at with a combination of blood film
and bone marrow aspirate appearances, as well as
confirmation of blast lineage using cytogenetic analy-
sis, immunophenotyping and molecular genetics (see
Figures 8.45 and 8.46). Most patients with ALL will
have the common ALL antigen, CD10, on their blasts,
Table 8.4 WHO classification of acute leukaemia
AML with genetic
abnormalities (the
best prognosis
category of AML)
AML with translocations between
chromosomes 8 and 21
AML with translocations between
chromosomes 15 and 17
AML with inversions in chromosome 16
AML with abnormalities in 11q23
AML with multilineage
dysplasia
AML following myelodysplasia or
myeloproliferative disease
AML andMDS, therapy-
related
AML in patients who have had prior
chemotherapy or radiotherapy
AML not otherwise
categorized
Other categories of AML
ALL Precursor B-cell acute lymphoblastic
leukaemia
Precursor T-cell acute lymphoblastic
leukaemia
Burkitt cell leukaemia
Biphenotypic acute leukaemia
Chapter 8 Haematology and transfusion science 373

often with CD19, while immature myeloid cells of
AML express CD33 or CD19.
Acute leukaemia would always prove fatal without
treatment, and the different subtypes have different
prognoses --- the age and health of the patient otherwise
are also factors to take into account when deciding on a
treatment regime.ChildhoodALL isusually curable, for
example, while some types of AML are usually incur-
able. Treatment will involve supportive therapy with
transfusions of red cells and platelets, antibiotic pro-
phylaxis to counter the high risk of infection and
antibiotics to treat active infections; then different
regimes of chemotherapy may be used to try to induce
complete remission (i.e. the return of normal blood and
bone marrow). This is tailored to the patient, their
precise leukaemia subtype and their other risk factors,
and should be carried out in isolation facilities in
hospital to reduce the risk of infection. Risk factors
include increasing age, high initial white cell counts at
the time of diagnosis, the presence of certain cytogenet-
ic abnormalities and the presence of minimal residual
disease (MRD: low levels of persistent leukaemic cells in
apparently normal bone marrow during remission,
detected using flow cytometry with monoclonal anti-
bodies, or PCR for chromosome/gene rearrangements).
If remission is successfully achieved, consolidation
therapy will follow to reduce the risk of a recurrence
of the leukaemia --- this may entail an early bone
marrow transplant, or further cycles of chemotherapy.
8.11.1.3 Chronic leukaemia
Chronic lymphocytic leukaemia (CLL) is the com-
monest form of leukaemia and is usually seen in older
adults (median age at presentation is 66). Some 95%
are of B-cell origin. Chronicmyeloid leukaemia (CML)
also occurs almost entirely in adults, but with a
youngermedial age at presentation of around 50.Most
Figure 8.45 Blood film appearance in ALL (left) and AML (right). From Hoffbrand et al, Postgraduate Haematology, SixthEdition 2010, reproduced by permission of John Wiley & Sons Ltd
Figure 8.46 Flow cytometry immunophenotyping of leukaemia (from Hoffbrand et al, Postgraduate Haematology, SixthEdition 2010, reproduced by permission of John Wiley & Sons Ltd) and fluorescent in situ hybridization (FISH) of fusion geneproducts in chromosomal rearrangement in leukaemia
374 Biomedical sciences

patients who present with chronic leukaemia have no
symptoms, and the condition is found incidentally
during a full blood count for other reasons.
Chronic myeloid leukaemiaMany patients with CML will be asymptomatic but
somemay have symptoms of anaemia, a swollen spleen,
weight loss, bruising or fevers. Diagnosis of chronic
leukaemia includes a full blood count, which typically
shows a normocytic anaemia, a raised WBC count and
variable platelet numbers. A blood film will show
myeloid precursors (with some blasts) and a neutro-
philia, while a bonemarrow aspirate will have increased
cellularity with myeloid precursor cells (Figure 8.47).
Cytogenetic analysis will show the presence of a
Philadelphia (Ph) chromosome in 97% of cases of
CML. This is a reciprocal translocation of part of the
long arms (q) of chromosome 22 to chromosome 9.
This translocation results in part of an oncogene,
c-ABL, on chromosome 9, becoming fused with a
‘breakpoint cluster region’ (BCR) from chromosome
22, creating a novel hybrid gene, BCR-ABL. This new
gene is transcribed into a fusion protein that has
tyrosine kinase activity resulting in altered growth and
apoptosis (see Figure 8.48)
Treatment of CML thus uses tyrosine kinase inhi-
bition to block the activity of the BCR-ABL fusion
protein with imatinib, and this will produce remission
in 95%of patients. However, this response is often only
temporary, and chemotherapy is then used as for acute
leukaemia to produce further remission. Stem cell
transplantation is offered to thosewho do not continue
to respond well to imatinib, and are otherwise well
enough. Cure is achieved in around 70% of patients
with CML.
Chronic lymphocytic leukaemiaCLL patients are usually asymptomatic at diagnosis,
though some will present with symptoms of bone
marrow failure (anaemia, infections, bruising), or
from abdominal discomfort due to a swollen spleen.
Full blood count shows a normal or low Hb, a raised
WBC count (with lymphocytosis) and usually normal
platelets. A blood film will typically show small
Figure 8.47 Blood film in CML. From Hoffbrand et al,Postgraduate Haematology, Sixth Edition 2010, reproducedby permission of John Wiley & Sons Ltd
Figure 8.48 The Philadelphia chromosome and formation of the BCR-ABL hybrid gene in CML
Chapter 8 Haematology and transfusion science 375

lymphocytes and ‘smudge cells’ where the fragile ma-
lignant lymphocytes are fragmented during the spread-
ing of the film of blood (Figure 8.49).
Treatment options are variable in CLL and 30% of
all patients will not require treatment. A further pro-
portion will only be treated when progression of their
condition occurs: treatment with chemotherapy and
antibody therapy may be undertaken. Supportive
treatment --- red cell transfusions, platelet transfusions
and antibiotics --- should also be used as necessary. The
benefits of stem cell transplantation (particularly in
younger patients) in CLL are still being studied.
Hairy cell leukaemiaHairy cell leukaemia (HCL) is a rare form of chronic
leukaemia found predominately in males in the sixth
decade of life. It is due to a clonal proliferation of
abnormal B cells which have cytoplasmic projections
that look hair-like! Patients with HCL usually present
with anaemia, weight loss and fever, andmost will have a
swollen spleen. The FBC will show anaemia, low platelet
count and low neutrophil and monocyte counts; im-
munophenotyping will show a range of cellular markers
including CD19, CD20 and CD103 (Figure 8.50).
HCL is treated with chemotherapy and this is
generally very successful with one cycle of chemother-
apy producing remission in 90%.
8.11.2 Lymphoma
The lymphomas are a further type of haematological
malignancy that arise due to an abnormal proliferation
of lymphoid tissue. Lymphoma is commoner than
leukaemia and its incidence is increasing. The lym-
phomas usually start as enlarged lymph nodes (lymph-
adenopathy) at single or multiple sites in the body and
the prognosis is related to howmany sites are involved,
where in the body they are, and what subtype of
lymphoma this represents. Lymphomas are initially
divided into two major groups; Hodgkin lymphoma
and non-Hodgkin lymphoma.
8.11.2.1 Hodgkin’s lymphoma (HL)
The great majority of cases of HL occur in adults, with
a peak in diagnoses in the third decade of life, and
the UK incidence is around three per 100 000. The
Epstein---Barr virus (EBV) is implicated in the aetiol-
ogy of HL; EBV has been found in tissue from HL
patients suggesting it plays a role in the development
of the condition. Patients with HL typically present
with enlarged, rubbery lymph nodes, usually in the
neck. They may have a swollen spleen and liver, and
some will have symptoms of systemic illness such as
fever, night sweats and weight loss (‘B symptoms’ in
HL, as these affect the classification and prognosis of
HL). Diagnosis is made on biopsy of an enlarged
lymph node, in which the characteristic malignant
Reed---Sternberg cell is seen --- these cells have two
nuclei and are said to have an ‘owl’s eye’ appearance.
They are derived from B cells and usually express
CD30 and CD15 markers (Figure 8.51).
A full blood count in a patient with HL may be
normal or showanormocytic anaemia, andESR is usual-
ly raised. CT scans, a chest X-ray and a positron emission
tomography (PET) scan will look for the involvement
of other lymph node groups in the body.
Figure 8.49 Blood film in CLL showing characteristicsmear cell . From Hoffbrand et al, Postgraduate Haematology,Sixth Edition 2010, reproduced by permission of JohnWiley &Sons Ltd
Figure 8.50 Hairy cells seen on blood film in HCL. FromHoffbrand et al, Postgraduate Haematology, Sixth Edition2010, reproduced by permission of John Wiley & Sons Ltd
376 Biomedical sciences

Treatment for HL usually aims for a cure, and is
tailored according to how far advanced the disease is
and whether ‘B’ symptoms are present. It generally
employs one ormore cycles of chemotherapy, followed
by radiotherapy of involved lymphoid tissue, to induce
remission. This is successful for about 75% of HL
patients and further remissions may be achieved after
recurrences with more chemotherapy.
8.11.2.2 Non-hodgkin lymphoma (NHL)
The incidence of NHL is around 15 per 100 000 per
year and, like HL, this has been increasing in recent
years. In terms of aetiology, the EBV is also implicated
in NHL, particularly in Burkitt lymphoma (which
occurs mainly in Africa). HIV infection confers
an increased risk of NHL, as does immunosuppression
(e.g. after organ transplantation) and the human T-cell
lymphotropic virus (foundmainly in Japan) is a major
risk factor. Patients with NHL usually present with
painless enlargement of superficial lymph nodes and
often with systemic symptoms (weight loss, fevers and
sweating), or sometimes from the appearance of NHL
in other tissues such as the skin, lung, brain or gastro-
intestinal tract. Full blood count usually shows a
normocytic anaemia, raised WBC count, and low
platelet count --- some will have renal impairment with
increased urea levels and bone marrow biopsy will
show infiltration of themarrow withmalignant cells in
a proportion of patients. Lymph node biopsy with
immunophenotyping and cytogenetic analysis will
allow the subtype of NHL to be diagnosed. All NHL
cells express CD20, while the subtypes vary, and chro-
mosomal translocations are frequent in NHL.
There are some 23 types of NHL according to the
WHO classification (as shown here in Table 8.5) and
the treatment and prognosis for NHL depends on the
accurate classification of each case using biopsy appear-
ances, immunophenotyping and cytogenetic analysis.
The treatment of NHL depends on the disease
subtype, and the age and condition of the patient. The
antiCD20 antibody rituximab may be used alongside
chemotherapy (‘chemoimmunotherapy’), or either
Figure 8.51 Reed---Sternberg cells seen in a lymph nodebiopsy in Hodgkin lymphoma. From Hoffbrand et al, Post-graduate Haematology, Sixth Edition 2010, reproduced bypermission of John Wiley & Sons Ltd
Table 8.5 Modified WHO classification of lymphoidneoplasms
B-cell lymphomas
Precursor B-cell
lymphoma
Precursor B lymphoblastic leukaemia/
lymphoma
Mature B-cell
lymphoma
Chronic lymphocytic leukaemia/lymphoma
Lymphoplasmacytic lymphoma
Splenic marginal zone lymphoma
Extranodal marginal zone B-cell lymphoma of
mucosa-
associated lymphoid tissue
Nodal marginal zone B-cell lymphoma
Follicular lymphoma
Mantle cell lymphoma
Diffuse large B-cell lymphoma
Burkitt lymphoma
T-cell lymphomas
Precursor T-cell
lymphoma
Precursor T-cell lymphoblastic leukaemia/
lymphoma
Blastic natural killer lymphoma
Mature T-cell/
natural killer cell
lymphoma
Adult T-cell leukaemia/lymphoma
Extranodal natural killer cell/T-cell
lymphoma
Enteropathy-type T-cell lymphoma
Hepatosplenic T cell lymphoma
Subcutaneous panniculitis-like T-cell
lymphoma
Mycosis fungoides
S�ezary syndrome
Primary cutaneous anaplastic large cell
lymphoma
Peripheral T-cell lymphoma
Angioimmunoblastic T-cell lymphoma
Anaplastic large cell lymphoma
Chapter 8 Haematology and transfusion science 377

alone, with supportive measures such as red cell and
platelet transfusions, erythropoietin to increase red cell
count and antibiotics as needed. For some cases of
NHL, supportive treatment may be used in the first
instance and plasmapheresis in some patients where a
B-cell lymphoma is producing large quantities of
immunoglobulin molecules.
8.11.3 Myeloma
Myeloma is a rare haematological malignancy and it is
a malignant proliferation of plasma cells which pro-
duces monoclonal paraproteins, usually IgG or IgA. It
is usually seen in the elderly, with amedial presentation
age of 60. It is slightly commoner in males and the
incidence is four per 100 000. Amajor characteristic of
myeloma is bone destruction, which is due to increased
osteoclastic (bone breakdown) activity, as myeloma
cells produce interleukin-6 (IL-6) and other factors to
increase osteoclast numbers and activity. The huge
number of paraproteins also results in deposition of
light chains of antibodies in the renal tubules, with
renal impairment resulting. The presentation of pa-
tients with myeloma is thus often due to bone pain
fromdestruction of bones (with hypercalcaemia symp-
toms due to the release of calcium from bone), symp-
toms of renal failure and symptoms of bone marrow
infiltration (anaemia, infection, sometimes bleeding).
A full blood count may be normal, or show decreased
Hb, WBC count and platelets. ESR is high and a blood
film may show rouleaux formation --- stacked red
blood cells --- due to the sticky paraprotein molecules
sticking red cells together. Urea and creatinine levels
may be raised due to renal impairment, possibly with
raised serum calcium too. Bone marrow aspirate will
show infiltration with plasma cells and X-rays will
show characteristic areas of bone breakdown (see
Figure 8.52). Serum protein electrophoresis and im-
munofixation will show a monoclonal band.
Treatment of myeloma involves supportive mea-
sures such as red cell transfusion and erythropoietin for
anaemia, antibiotics for infections, bisphosphonate
drugs to reduce osteoclast activity and pinning areas
of thin bone before a fracture occurs. Myeloma is
currently incurable and specific treatment regimes de-
pendon the age andhealth of thepatient; combinations
of cytotoxic drugs with steroids and thalidomide deri-
vatives, or using thalidomide derivatives alone, can
improve survival. In younger patients, autologous stem
cell transplantsmayalsohelpprolong life.Thepotential
benefit of allogeneic stem cell transplant is still unclear.
8.12 Complement
Complement is not one entity, but a group of around
25 different proteins found in plasma that
‘complement’ antibody activity. They are made in the
liver, but can also be produced by macrophages,
monocytes and some epithelial cells. Complement
proteins are generally in an inactive precursor form
in plasma, but once activated they interact in cascades
that ultimately stimulate lysis of antibody-coated red
blood cells (e.g. in haemolytic syndromes, or trans-
fusion reactions), to help attract phagocytes into
inflamed regions and stimulate phagocytosis, and to
clear immune complexes. The two major pathways
through which this can happen are the classical path-
Figure 8.52 Bone marrow biopsy showing abnormal plasma cells (left); skull X-ray showing ‘pepper pot skull’ appearance inmyeloma, caused by bone breakdown. From Hoffbrand et al, Postgraduate Haematology, Sixth Edition 2010, reproduced bypermission of John Wiley & Sons Ltd
378 Biomedical sciences

way and the alternative pathway, and both result in
lysis of a target cell and the induction of opsonization,
inflammation and phagocytosis.
8.12.1 The classical complementpathway
This pathway is triggered by IgG or IgM antibodies
binding antigen, for example in a transfusion reaction
with antibody binding a red cell antigen (Figure 8.53).
It relies on there being a large enough number of these
happening in close proximity to each other, which
results in two Fc regions of the antibodies being able
to bind to one molecule of C1q. Since IgM is a
complex of five antibodies this is more effective than
IgG at triggering the classical pathway. Once the large
C1q molecule has bound two Fc regions on Ig, it
undergoes a conformational change that activates two
C1r serine proteasemolecules and these in turn cleave
another serine protease, C1s. Activated C1s cleaves C4
into two molecules, C4a and C4b, and C4b binds
briefly to the membrane of red blood cells via a
hydrophobic binding site. C1s also cleaves C2 into
C2a and C2b, and C2a binds to C4b (a process
requiringMg2þ ions) on the red blood cell membrane
Figure 8.53 The classical complement pathway, with link to the alternative pathway shown. From Hoffbrand et al,Postgraduate Haematology, Sixth Edition 2010, reproduced by permission of John Wiley & Sons Ltd
Chapter 8 Haematology and transfusion science 379

to form the novel enzyme C4b2a. This new molecule
splits C3 into C3a and C3b, and the larger C3b
molecule can also bind to the red cell membrane or
to C4b2a. If it binds to the latter, it produces the
complex C4b2a3bwhich cleaves C5 into C5a andC5b.
C5b can also bind to the red cell membrane and C5b
molecules then undergo the addition of C6, C7 and
C8 molecules to their structure, resulting in a very
large molecule known as the membrane attack com-
plex (MAC). The MAC is built up into a cylindrical
structure at the surface of the target cell (a red blood
cell here) and creates a pore at the surface of the red
cell. These pores enable the movement of ions and
small molecules between the red cell and its external
environment resulting in the loss of the usual con-
centration gradients and ultimate equilibration. The
red cell starts to swell as water moves in to dilute the
large molecules that are unable to leave the red blood
cell and ultimately it will burst (haemolysis).
The number of components of the complement
pathway that canbind red cells once antibodyhas bound
them means that there is considerable amplification of
the original number ofmolecules bound to the cell after
the antibody binding occurred and, moreover, it is
much easier to test for the presence of complement
than antibodies on the surface of red blood cells as there
is so much more complement present.
Apart from lysis, the complement pathways also
stimulate opsonization, phagocytosis and inflammation.
C3a andC5a are chemotacticmolecules for neutrophils,
drawing them into areas of complement activation.
Phagocytic cells (e.g. macrophages, neutrophils) have
receptors for C3b and will bind cells coated with C3b ---
this binding triggers very efficient phagocytosis of the
C3b-coated cell, for example the phagocytosis of of C3b-
coated red cells by phagocytes in the spleen. C3b can also
bind immune complexes, stimulating their phagocyto-
sis. C3a, C4a and C5a can trigger degranulation of mast
cells, with resultant histamine-induced vasodilation and
plasma arriving in the area of complement activation;
this results in more complement and immunoglobulin
in the region too. Complement can also enhance platelet
aggregation in blood clotting and the breakdown of
fibrin in the fibrinolytic system.
8.12.2 The alternative complementpathway
The alternative complement pathway is misnamed, as
it is simply a loop off the classical pathway in which
C3b production enhances further cleavage of C3 into
more C3a and C3b (Box 8.10 and Figure 8.54). It is not
dependent on the presence of antibody for activation
but may be initiated by natural breakdown of C3 in
plasma into C3a and C3b. Factor B (found in plasma)
binds C3b to form C3bB. In the presence of factor D,
this complex will be cleaved into Ba andBb, and Bbwill
bind the C3bBmolecule to form C3bBb. This complex
catalyses the cleavage of C3 into C3a and C3b, and the
cycle continues. Ultimately, all C3 would be exhausted
if this continued unchecked, but it is kept under
control by the instability of the C3bBb complex (which
rapidly breaks down once formed) and by the conver-
sion of C3b into an inactive form (C3bi) by the action
of factors H and I in plasma.
8.12.3 Complement disorders
Absence or subobtimal function of most types of
complement have been described in humans, and may
be inherited. Deficiency of C1, C2 and C4 are associ-
ated with systemic lupus erythematosus (SLE), while
deficiencies of C3, factor H and factor I are associated
with an increased risk of bacterial infection.
8.13 Blood transfusion
Human blood groups are determined by the antigens
present on the surface of an individual’s red blood cells.
Although some 30 blood grouping systems are recog-
nized, it is the ABO and Rhesus systems which are of
greatest clinical importance (Box 8.11).
Box 8.10 Paroxysmal nocturnalhaemoglobinuria
This results from an acquired deficiency of the
enzyme that allows linkage of factors that protect
red blood cells from complement to the red
blood cell membrane, for example decay-accel-
erating factor (DAF), which decreases formation
of C3 convertase. A lack of these proteins causes
complement-mediated red cell haemolysis and
the appearance of dark urine (due to haemoglo-
bin) predominantly at night.
380 Biomedical sciences

8.13.1 The ABO system
The great importance of the ABO blood grouping
system in blood transfusion arises from the fact that
humans develop natural antibodies against the ABO
antigens early in life, before ever apparently being
exposed to other ABO antigens --- a phenomenon
sometimes called Landsteiner’s Law. (Contrast this to
other types of antibodies in humans, which we acquire
during life after exposure to infection or foreign anti-
gens.) These naturally occurring anti-A and anti-B
antibodies can produce severe haemolytic reactions to
transfusions of incompatible red blood cells --- such
reactions can be severe enough to prove fatal. ABO
antibodies start to appear at around 18 months of age
and it is thought that this is due to exposure to similar
carbohydrates in food after weaning of infants.
An individual’s ABO blood group is determined
by codominant genes A, B and O, which encode the
expression of specific carbohydrate antigens on the
surface of the red blood cell. The A gene codes for
expression of the A antigen and the B gene for the B
antigen but the O gene codes for the H substance,
which is not generally antigenic. These three mole-
cules are nonetheless very similar: the H substance is
the ‘basic building block’, while the A and B anti-
gens comprise additional N-acetylgalactosamine and
D-galactose respectively, added onto the end of the
H substance structure by specific enzymes. These
antigens are illustrated in Figure 8.55.
The antigens, antibodies and possible genotypes for
each ABO blood group are shown in Table 8.6.
There are subtypes of A and B antigen within the
ABO system; most individuals who are blood group
A have A1 antigens and express large numbers of
these. A3, A4 (sometimes designated AX), AY and
Aend antigens can also be found in the population,
and are associated with less antigen presence on the
red cell surface than for the A1 antigen. The B antigen
similarly has other forms that are more poorly ex-
pressed, including B3, Bw, Bx and Bm. These antigen
variations are unimportant in terms of transfusion
medicine.
The ABO system antigens are also expressed in body
fluids in the 80% of the population who have the
Figure 8.54 Focus on the alternative complement pathway
Box 8.11 Landsteiner and blood groupdiscovery
Karl Landsteiner was a scientist in Vienna and in
1900 he took red cells suspensions and serum
from six men in his laboratory (including him-
self); by mixing them in different combinations
and noting the agglutination patterns, he first
described the A, B and O blood groups --- sheer
luck awarded him two men of each group,
against all the odds in a random selection of six
men! Landsteiner was awarded the Nobel Prize
for Medicine in 1930.
Chapter 8 Haematology and transfusion science 381

‘secretor’ gene --- they can be found in saliva, for
example, or in gastric juices.
8.13.2 The hh blood group
A very rare blood group known as the hh or Bombay
blood group is found in around 0.0004% of the world
population, though more frequently in the Mumbai
(formerly Bombay) region of India. Individuals with
this blood group inherit two copies of a recessive h gene
which results in no expression of the H antigen and
thus no expression of any ABO antigens, regardless of
which ABO blood group genes they have inherited.
Their serum will contain anti-A and anti-B, but also
anti-H, and their blood will appear to be Group O in
regular ABO typing. The hh blood type is written asOh.
Such individuals can only receive blood from the same
hh/Bombay blood, though their blood can safely be
transfused into individuals of all ABO groups. Since hh
blood is rare, an anticipated need for transfusion ---
perhaps at the time of surgery --- will often entail
banking their own blood prior to the event, but blood
of hh group is often unavailable in emergency
situations.
8.13.3 The Rhesus system
Individuals may be either Rhesus positive or Rhesus
negative and this is determined by whether or not they
express the Rhesus D antigen on the surface of ery-
throcytes --- people who possess at least one D antigen
are said to be Rhesus positive (Box 8.12). The Rhesus
(Rh) system comprises some 45 different antigens but
C and c, E and e, and D and absence of D (denoted d)
are the most important clinically. Of these, the D
antigen (or its absence) is the most critical to establish,
as RhD negative individuals have a high incidence of
generating anti-RhD antibodies if exposed to RhD
positive blood. Rh antigens are strongly expressed in
the fetus too, which has important implications during
pregnancy (see Section 8.13.5).
The Rh antigens are large transmembrane polypep-
tide, with six loops of the polypeptide exposed on the
external surface of the red cell where the Rh antigens
are expressed (Figure 8.56). The polypeptides are
combined with an Rh glycoprotein into tetrameric
Figure 8.55 The antigens of the ABO system
Table 8.6 The ABO system antigens, antibodies and genotypes, and frequency of each ABO group in the UK population*
Antigens on redblood cell surface
Antibodies in plasm Genotype Frequency in UKpopulation 2009
Group A A Anti-B AA or AO 42%
Group B B Anti-A BB or BO 10%
Group AB AþB None AB 4%
Group O None Anti-Aþ Anti-B OO 44%
*Note that an individual can only possess antibodies against antigens they do not themselves possess (e.g. Group A individuals only have anti-B antibodies) and
the H antigen found in Group O individuals is not generally antigenic (so Group O individuals are considered to have no antigens, and there is no ‘anti-O’ antibody).
It is also of interest to note that individuals who are heterozygous for Group A or Group B genes (genotypes AO or BO) will have half as many A or B antigens as
homozygotes (AA or BB).
382 Biomedical sciences

structures to form a Rhesus core complex; some in-
dividuals inherit a defective gene for this essential
glycoprotein and are said to have a Rhnull phenotype
with no Rh genes expressed. The function of the Rh
complex is unknown, but its structure strongly sug-
gests it is an ion channel.
8.13.3.1 Inheritance of rhesus genes
Combinations of genes that can be inherited in the Rh
system are complex and a lot of investigation went
into elucidating this following the discovery of Rh
antigens. Fisher and Race coined a model in which
there are three pairs of closely-linked alleles (D/d, C/c
and E/e), allowing for eight different possible com-
binations of Rh genes on one chromosome and
resulting in seven common combinations of Rh genes
overall in the population. These are given below in
Tables 8.7 and 8.8.
Fisher’s model is now known not to be entirely
correct, but nonetheless it works well in clinical prac-
tice and continues to be used. In 1986, Tippet proposed
that the Rh system is actually based on two closely
linked gene loci on chromosome 1, with one ten
exon gene for the RHD gene, and another separate ten
exon gene forRHCcEewhich encodes the alleles (C or c
and E or e) that an individual expresses; this is now
known to be the correct model for inheritance of Rh
genes. Interestingly, the RHD gene is thought to have
arisen from duplication of the RHCcEe gene during
evolution. Rh negative individuals lack a functioning
RHD gene (Box 8.13).
Some Rh positive individuals may express fewer of
their D antigens than normal for unknown reasons, a
Box 8.12 Discovery of Rhesus factor
The Rhesus system was also discovered by Karl
Landsteiner, along with Alexander Wiener, in
1940. It is named after the Macaque rhesus
monkeys, whose red cells were injected into
rabbits and gave rise to the production of an
‘antiRhesus’ antibody that reacted against 85%
of the red cells of blood donors in New York.
They named the antigen that caused this reac-
tion the, ‘Rhesus factor’, and blood that reacted
to the antibody was said to be ‘Rhesus positive’.
Figure 8.56 The structure of the Rhesus antigen
Table 8.7 Fisher’s model of Rhesus gene combinationson one chromosome
Haplotype Symbol Rh status
DCe R1 Rh positive
DcE R2 Rh positive
Dce R0 Rh positive
DCE RZ Rh positive
dCE r1 Rh negative
dcE rn Rh negative
dce r Rh negative
dCE ry Rh negative
Chapter 8 Haematology and transfusion science 383

condition designated DU --- this may make their blood
harder to correctly group (historically, suchdonorswere
sometimes mistakenly grouped as Rh negative), but
bloodfromthesedonorswouldstimulatetheproduction
of anti-D if transfused into an Rh negative recipient.
8.13.3.2 Transfusion and Rhesus groups
At its simplest, RhD positive patients should have RhD
positive blood (it is safe for RhDpositive individuals to
have RhD negative blood but, since this is in short
supply, it is generally reserved for RhD negative pa-
tients). RhDnegative patients should usually haveRhD
negative blood to prevent the formation of the highly
potent anti-D antibody. However, at times blood may
need to be provided that is also matched to a patient’s
Ce/Ee alleles, since patients who have previously been
pregnant, or transfused with blood matched solely
to their RhD status, may have formed anti-C, anti-c,
anti-E, or anti-e antibodies. For example, recipients
with the genotype DCe/dce (R1r) often develop anti-E
antibodies if transfused with blood that is RhE positive
and future blood will need to be provided that is RhE
negative.
8.13.4 Laboratory blood grouping
In the modern laboratory, blood grouping is mostly
done using automated systems which use monoclonal
antibodies against the ABOandRh antigens to arrive at
a full blood group, and an antibody screen will be
performed to look for preformed antibodies that will
affect the choice of units of blood for transfusion (or
may cause a problem for the fetus during pregnancy).
These automated systems commonly use microcol-
umns of gel with antibodies or plasma lying on top of a
gel column. A solution of a patient’s is added to an
antibody (anti-A, anti-B or anti-D) and their serum is
added to known Group A and Group B cells as a cross-
check. The mixtures are allowed time for any aggluti-
nation to occur, then the tubes are centrifuged. Where
there is no agglutination (e.g. a combination of Group
B cells with anti-A antibody will not cause agglutina-
tion), red cells will fall through the gel and appear at the
bottom of the column to give a negative result for that
column. Where there is agglutination (e.g. Group B
cells with anti-B antibody), the agglutinated cells will
remain on the top of the gel column as the clusters of
cells are too large to pass through the pores of the
column, giving a positive result for that column. The
results can be read automatically if they are clear. This
is illustrated in Figure 8.57.
8.13.5 Other important humanblood grouping systems
There are more than 600 different antigens identified
on the surface of human red blood cells and, following
transfusion or pregnancy, antibodies may be produced
against awide variety of red cell epitopes. TheABO and
Rhesus blood group systems are the most important
clinically’ but several other major systems must also be
considered.
Blood group antigens may be divided into carbo-
hydrate and protein structures. Protein antigens are
determined by the inheritance of genes for different
Table 8.8 Fisher’s model of Rh genotypes given in orderof approximate frequency
Geno-type
Fishershorthand
Frequency Rh status
DCe/dce R1r 34% Rh positive
DCe/DCe R1R1 17% Rh positive
dce/dce rr 15% Rh negative
DCe/DcE R1R2 14% Rh positive
DcE/dce R2r 11% Rh positive
Dce/dce R0r 2% Rh positive
DcE/DcE R2R2 2% Rh positive
DCe/Dce R1R0 2% Rh positive
Other combinations Uncommon (< 1%)
Box 8.13 Rhesus factor advantage
Around 15% of the European population is Rh
negative, implying that the r allele must have
conferred a survival advantage at one time,
particularly since Rh negativity was associated
with poorer pregnancy outcomes. The Rh com-
plex is thought to be an ion channel or pump and
some studies have suggested that carriers of the r
allele (i.e. Rh positive heterozygotes) have a
degree of protection against toxoplasma
infection.
384 Biomedical sciences

membrane protein molecules on red cells. They are
may be further divided into:
1. membrane channels, for example Rhesus, Kidd;
2. structural proteins, for example MNS;
3. membrane-bound enzymes, for example Kell;
4. cell adhesion molecules, for example Lutheran;
5. chemokine receptors, for example Duffy;
6. complement regulatory proteins, for example
Knops.
The carbohydrate antigens are the product of ge-
netically inherited glycosyl transferase enzymes that
attach specific carbohydratemolecules to the surface of
red blood cells. The ABO antigens are an example of
carbohydrate red cell antigens and the ABO blood
group is determined by which carbohydrates are pres-
ent, according to which genes for the glycosyl trans-
ferase enzymes have been inherited.
The naming of the blood group systems historically
lacked standardization and in 1980 the International
Society of Blood Transfusion (ISBT)’s Working Party
on Red Cell Surface Antigens gave each known red cell
antigen a unique six digit number. In this system, the
first three digits represent the blood group system and
the second three represent the antigen.
8.13.5.1 Protein antigens
Kell systemThe Kell system is represented by the symbol KEL;
ISBT number is 006. Some 24 Kell antigens are
associated with the highly polymorphic Kell system
and they are epitopes on the Kell protein which is a
transmembrane endopeptidase molecule. After the
ABO and Rh systems, the Kell system is the most
likely to cause transfusion problems following trans-
fusion or pregnancy and is thus of considerable
clinical importance. Six major alleles of the Kell
system are most clinically important: these are the
K (Kell) antigen, k (also known as Cellano), Kpa
(Penney), Kpb (Rautenberg), Jsa (Sutter) and Jsb
(Matthews). Antibodies may be produced against any
of these Kell antigens following transfusion or preg-
nancy, and transfusion reactions or haemolytic dis-
ease of the newborn may result.
TheKell protein is present on the red cellmembrane
bound to another protein, Kx, via a disulphide bond;
absence of the Kx protein thus greatly diminishes
expression of the Kell protein, though absence of the
Kell protein (due to homozygosity for the rare K0
genes) has no effect on Kx expression. Individuals who
are homozygous for K0 and express no kell proteinmay
produce an antiKell antibody (called anti-KU) if ex-
posed to Kell antigens.
MNSs systemThe MNSs system is represented by the symbol MNSs;
ISBT number is 002. Some 45 antigens of the MNS
system have now been identified, of which the major
ones are M, N, S and s. The antigens of this system are
glycophorins A and B, structural components which
span the red cell membrane and render it hydrophilic;
theM andN genes are expressed on glycophorin A and
the S and s genes on glycophorin B. The genes are found
in codominant pairs at two closely-linked loci, with the
major combinations for MN in the population being
MþN�, Mþnþ, M�Nþ and, rarely, M�N�. (note
that since glycophorin A (MN) acts as a receptor for the
malarial parasite Plasmodium falciparum, red cells that
lack glycophorin A [M�N�] have resistance to this
strain of malaria.) Common population combinations
for Ss are Sþs�, Sþsþ, S�sþ and, very rarely, S�s�.
Antibodies against M, N, S or s may be acquired by
individuals without the relevant antigens, and can
cause both haemolytic transfusion reactions and hae-
molytic disease of the newborn.
Duffy systemThe Duffy system is represented by the symbol FY;
ISBT number is 008. The Duffy protein is a nonspecific
chemokine receptor that is found on the surface of the
Figure 8.57 Use of microcolumn technology for bloodgrouping
Chapter 8 Haematology and transfusion science 385

red blood cell andwas discovered after an antibody was
found in a haemophiliac patient who had received
multiple transfusions. The two major alleles of the FY
system are Fya and Fyb, with four common phenotypes
of the Duffy system described: Fy(aþb�), Fy(aþbþ),
Fy(a�bþ) and Fy(a�b�). This last phenotype, Fy
(a�b�) (the ‘minus minus’ phenotype) is almost
unknown in Caucasians but is common in Black
populations of African descent, and reflects the Duffy
antigen’s role as the site of attachment of the malarial
parasites, Plasmodium vivax and Plasmodium knowlesi.
Individuals who have the Fy(a�b�) genotype are thus
at a survival advantage in malarial regions, hence the
frequency of this genotype in Africa.
Anti-Fya and anti-Fyb antibodies may be acquired
following transfusion or pregnancy, and can cause
transfusion reactions and haemolytic disease of the
newborn. However, the Duffy antigen is only moder-
ately immunogenic.
Kidd systemThe Kidd system is represented by the symbol JK; ISBT
number is 009. TheKidd (Jk) antigen is foundon aurea
transport protein on the red cell membrane and the
two major allelic forms are Jka and Jkb, which are
codominant; thus the major phenotypes found in the
population are Jk(aþb�), Jk (aþbþ), Jk(a�b�) and
Jk(a�bþ). Rarely, individuals may be homozygous for
the Jk null gene and express no Jk antigen. Antibodies
against Jka and Jkb may be acquired following
exposure during pregnancy or via transfusion --- for
example, a Jk(aþb�) individual may form anti-Jkb
antibodies. However, anti-Jk antibodies tend to be
unstable and levels often decline rapidly. They can
cause mild haemolytic disease of the newborn or
haemolytic transfusion reactions.
Lutheran systemThe Lutheran system is represented by the symbol LU;
ISBT number is 005. Lutheran antigens are expressed
on glycoproteins on the red blood cell membrane that
function as cell adhesion molecules and the major
antigens are Lua and Lub, coded for by codominant
alleles. The major phenotypes in the population are Lu
(aþb�), Lu(aþbþ) and Lu(a�bþ), though rarely
some individuals inherit a null Lu phenotype, Lu
(a�b�). Antibodies against Lua and Lub may be
acquired after pregnancy or transfusion; they are gen-
erally weak and may cause mild haemolytic disease of
the newborn but they are an uncommon cause of
transfusion reactions.
8.13.5.2 Carbohydrate antigens
Lewis systemThe Lewis system is represented by the symbol LE;
ISBT number is 007. The major antigens of the Lewis
system are Lea and Leb although Lewis antigens are
not strictly red cell antigens. They are actually se-
creted by exocrine epithelial tissue in the body and
then reversibly adsorbed onto the surface of red cells
from plasma. The Lea antigen is encoded by the
presence of at least one Le gene and this antigen
interacts with the ABO secretor gene (see Sec-
tion 8.13.1) where this is present. This results in the
conversion of Lea into Leb and gives Le(bþ) red cells,
the most common phenotype (interestingly, Leb acts
as a receptor for Helicobacter pylori infection, which
causes gastritis). If no secretor gene is present, only
Lea remains in plasma with just Le(aþ) positive red
cells. Individuals in a population can thus have the
phenotypes Le(aþb�) and Le(a�bþ) but not Le
(aþbþ). Individuals who lack an Le gene (i.e. who
are homozygous for lele) will not express any Le
antigens on their red cells and have the phenotype
Le(a�b�).
Antibodies against Lea and Leb may be found
naturally in people without the relevant antigen;
however, they do not cause haemolytic disease of the
newborn although anti-Lea can cause some haemo-
lytic transfusion reactions. Lewis antigens may be lost
from stored red cells so it is always advisable to use the
freshest possible samples for Lewis grouping of red
cells.
P systemThe P system is represented by the symbol P1; ISBT
number is 003. The major antigens of the P system are
P1, P and Pk, although only P1 is considered a true
antigen. Individuals may express just P, P1 and P, P1and Pk, just Pk or, rarely, no P antigens at all.
Naturally-occurring antibodies may be found in se-
rum against antigens an individual does not possess
and these may be anti-P1, anti-P or anti-PP1Pk in
those rare individuals who express no P antigens.
These antibodies may cause haemolytic transfusion
reactions but typically do not cause haemolytic dis-
ease of the newborn.
386 Biomedical sciences

Haemolytic disease of the newborn (HDNB)Haemolytic disease of the newborn (HDNB) is
caused by the presence of IgG antibodies in the
mother that can cross the placenta and coat the red
cells of the fetus to bring about their destruction. The
most clinically important form of HDNB is Rhesus
incompatibility. Many babies were stillborn several
decades ago, and in 1939 Levine and Stetson pub-
lished the first paper, ‘An unusual case of intra-
group agglutination’, in which they first described
Rhesus haemolytic disease of the newborn. Since
approximately 15% of pregnant mothers are Rhesus
negative --- while 85% of their male partners will be
Rhesus positive --- most of these women’s pregnan-
cies will be with Rhesus positive fetuses; before
effective prophylaxis was available, one in 200
mothers developed anti-D antibodies following ex-
posure to their baby’s Rhesus positive red cells
during the pregnancy, or around the time of the
birth (fetal-maternal haemorrhage, or FMH). Once
anti-D was made by the mother in response to
exposure to the baby’s RhD antigens, an increasing
proportion of the babies of Rhesus negative mothers
were stillborn with each subsequent pregnancy. The
principles of Rh sensitization during pregnancy are
shown in Figure 8.58.
Once anti-red cell antigen IgG has crossed the
placenta and coated fetal red cells, thesewill agglutinate
and be removed by macrophages in the circulation or
spleen, causing a rise in fetal bilirubin levels. This is not
usually a problem in itself before birth, as the placenta
passes excess bilirubin to the maternal circulation,
where it is safely processed by the maternal liver.
However, after birth bilirubin levels can rise sufficient-
ly high to cause early onset jaundice (jaundice within
the first 24 h or so of birth is always pathological). Very
high levels of bilirubin are toxic to the central nervous
system and can cross the blood---brain barrier once at
sufficient concentration, so treatment should be insti-
gated to protect the newborn baby from brain damage
due to bilirubin (kernicterus). Using ultraviolet light to
break down bilirubin in the skin may be sufficient (see
Figure 8.59), but for higher bilirubin concentrations,
an exchange transfusion may be necessary. In an
exchange transfusion, the two veins in the umbilical
cord are used to remove the baby’s blood and replace it
with blood that is compatible with the maternal anti-
bodies in the baby’s circulation --- so, for example, a
RhD positive baby whose red cells were being de-
stroyed by anti-D would have that RhD positive blood
drawn off and receive a transfusion of RhD negative
blood to protect him/her until maternal antibodies are
broken down.
If there are high levels of a potent IgG during the
pregnancy, ultimately the fetus will become severely
anaemic, pale and swollen, and will often die in the
uterus or soon after birth. This condition is known as
hydrops fetalis, and the commonest cause of this
condition is the highly potent anti-D. Rhesus haemo-
lytic disease of the newborn has thankfully been very
Figure 8.58 Rhesus sensitization of RhD negative mother during pregnancy
Chapter 8 Haematology and transfusion science 387

rare since the advent of prophylactic treatment for
RhD negative pregnant women.
8.13.6 Laboratory detection ofmaternal antibodies
During pregnancy, all women are tested for ABO and
RhDblood group and screened at several points during
the pregnancy for the presence and amount (titre) of
any antibodies against red cell antigens that could cross
the placenta, using an indirect antiglobulin test (IAT ---
also known as an indirect Coombs’ test). The fetus is
assumed to be at risk from high titre red cell antibodies
and the fetus’s condition can be assessed using ultra-
sound scans, amniocentesis (with measurement of
bilirubin in the amniotic fluid), or using fetal blood
sampling via the umbilicus in the process of cordo-
centesis to assess fetal haemoglobin and bilirubin
levels. Early in gestation the baby’s blood group can
be confirmed by obtaining fetal cells with chorionic
villus biopsy (which removes early placental tissues
and is possible from 8 weeks of gestation). Exchange
transfusion is also possible while the fetus is still in the
uterus using the umbilical veins and the blood is
crossmatched with maternal serum in this situation
to check its compatibility with maternal antibodies.
A direct antiglobulin test (DAT --- also known as a
direct Coombs’ test) can be performed on fetal blood
to confirm that fetal cells are coated in antibody.
8.13.6.1 Indirect antiglobulin test (IAT)/indirectCoombs test
The indirect antiglobulin test (IAT) looks for the
presence of anti-red cell antibodies in serum (Fig-
ure 8.60). In the IAT, a panel of washed red cells
containing a variety of common red cell antigens is
incubated with maternal serum in separate tubes. If the
maternal serum contains antibodies against any red
cell antigen, the maternal antibodies will bind to the
Figure 8.59 A baby undergoing ultraviolet light treatmentfor moderately severe haemolytic disease of the newborn(this baby was suffering from ABO incompatibility at birth ---the mother is blood group O and her anti-A antibodies causedhaemolysis of her newborn son’s Group A cells)
Figure 8.60 Indirect antiglobulin test
388 Biomedical sciences

relevant red cell antigen in that tube. The red cells are
then washed with saline and incubated with antihuman
globulin (also known as Coombs’ reagent). If any red
cells are coated with maternal antibodies, they will be
agglutinated by the antihuman globulin, and this will
be apparent.
8.13.6.2 Direct antiglobulin test (DAT)/directCoombs test
The direct antiglobulin test (DAT) looks for the pres-
ence of antibody on red cells (Figure 8.61). In the DAT,
the patient’s red cells are washed with saline and then
incubated with antihuman globulin (Coombs re-
agent). If anti-red cell antibodies are present on the
surface of the red cells, they will be visibly agglutinated
by the antihuman globulin.
8.13.6.3 Prevention of HDNB in RhD negativepregnant women
Early researchers working on Rhesus HDNB noticed
that RhD negative women were less likely to be sensi-
tized to the D antigen during pregnancies with RhD
positive babies if mother and baby were ABO incom-
patible. They realized that this effect was likely to be
because preformed ABO antibodies were destroying
incompatible fetal red cells as soon as they got into the
maternal circulation and before RhD sensitization
could occur. In 1960, Finn suggested that RhDnegative
women could receive injected anti-D to destroy RhD
positive fetal cells in the maternal circulation before
they could trigger RhD sensitization in the mother
(with subsequent seriously problematic production of
her own anti-D). Clinical trials were set up in several
countries in the 1960s, which showed the success of
giving exogenous anti-D to RhD negative women
immediately after the birth of an RhD positive baby
in preventing RhD sensitization; in 1968, anti-D was
licensed for use.
The use of anti-D was recently extended so that
pregnant women also receive two injections of anti-D
during pregnancy (at 28 and 34 weeks of gestation) as
well as immediately after the birth, and this further
prevents the small number of RhD sensitisation events
due to feto-maternal haemorrhage during pregnancy.
A dose of 500IU of anti-D is used during pregnancy,
and following delivery, and this is sufficient to clear
less than 4mL of RhD positive fetal blood in the
maternal circulation. However, sometimes larger
FMH can occur at the time of delivery, and for this
reason, quantification of FMH is performed after
delivery in RhD negative women whose baby is RhD
positive so that they can be given further anti-D if
necessary.
8.13.6.4 Assessment of feto-maternalhaemorrhage
Immediately after birth, blood samples are taken from
the babies of RhD negative women to have the baby’s
blood group ascertained as well as from the mother to
Figure 8.61 Direct antiglobulin test
Chapter 8 Haematology and transfusion science 389

quantify the volume of fetal blood that is present in the
maternal circulation. If the baby is also found to be
RhD negative after birth, then no further action is
necessary. However, if the baby is RhD positive (as the
majority will be), the blood sample from the mother is
tested to see how many fetal cells are present in a given
volume of maternal blood. This is done using the
Kleihauer test, in which a blood film is made from
the maternal blood sample following delivery and
treated with haemotoxylin and hydrochloric acid be-
fore counterstaining with eosin (Figure 8.62). Adult
red cells contain predominantly HbA, which is re-
moved by acid such thatmaternal cells appear as ‘ghost
cells’. Fetal cells contain predominantly HbF, which is
resistant to acid --- thus the different populations of red
cells frommother and baby can easily be distinguished.
The ratio of fetal/maternal cells is counted under a
microscope and thus the extent of FMH can be calcu-
lated. Large FMH will require a further dose of anti-D.
8.13.6.5 Other causes of HDNB
Anti-D is themost clinically important cause ofHDNB
since it has the most potential to cause serious mor-
bidity and mortality in the fetus, but the commonest
cause of HDNB is actually ABO incompatibility. A
large number of pregnancies will be ABO incompatible
but this is not usually a problem as ABO antigens are
not strongly expressed by the fetus in most pregnan-
cies. However, in some pregnancies the mother may
produce high titre anti-A or anti-B IgG in response to
antigens on the fetus’s red cells and in this situation
they will cross the placenta and a degree of haemolysis
of the fetal red cells is seen. This is not usually serious
enough to cause harm to the fetus, though a mild
degree of early onset jaundice may be experienced after
the birth. ABO incompatibility rarely requires
treatment.
Other IgG antibodies can also cause HDNB,
including anti-K, anti-C, anti-c, anti-E, anti-e and
anti-Fya. Of these, anti-K and anti-c are the most
likely to cause clinical problems but these are rare;
interestingly, anti-K antibodies cause suppression of
red cell haemopoiesis rather than haemolysis of fetal
red cells.
8.14 Blood products
In the UK, the NHS Blood Service collects blood in
units of around 470mL from volunteer donors at
donation sessions. Whole blood is collected from
donors into sterile blood bags containing an anticoag-
ulant. It is tested forABOandRhesus blood groups and
for the presence of transmissible infections before
being processed into blood components and blood
products --- note that whole blood is rarely transfused
back into patients.
8.14.1 Red cell concentrates
Red cell concentrates are manufactured from units of
donated blood by extraction of leucocytes (‘leucocyte
depletion’) and plasma and replacement of the latter
with 100mL of an additive solution. They may be
further washed in saline for patients who have previ-
ously suffered anaphylactic reactions from transfusion.
Red cell packs last for 5 weeks and are stored at 4 �Cuntil required. Red cells are used for patients with low
Hb who require blood transfusion and typically they
are infused with sufficient units to bring Hb to 10 g/dL
--- the rule of thumb commonly used is that one unit of
red cells equates to anHb rise of 1 g/dL, so that a patient
with an Hb level of 7 g/dL would typically receive three
units of red cells where clinically necessary. Note that a
low Hb is not an automatic reason for transfusion. In
an otherwise well patient who is not at risk of bleeding
for any reason, iron supplementation and FBC moni-
toring will often suffice.
8.14.2 Platelet concentrates
Cell separation on whole blood allows separate prepa-
ration of packs of concentrated platelets, which last
Figure 8.62 Kleihauer test to quantify the volume of FMH
390 Biomedical sciences

around 5 days. They need to be stored at 22 �C and
constantly agitated to prevent platelet aggregation.
Platelet concentrates are used for patients with throm-
bocytopenia and bone marrow failure.
8.14.3 Fresh frozen plasma
Around 200mL of plasma is removed from a unit of
whole blood in creating red cell concentrates and this
plasma is frozen down (‘fresh frozen plasma’, or FFP)
to be used in patients with acquired clotting factor
deficiencies since it contains all clotting factors.
8.14.4 Cryoprecipitate
Cryoprecipitate comprises the �20mL supernatant
produced from allowing frozen FFP to thaw to 4 �C.It contains fibrinogen along with von Willebrand
factor (vWF) and factor VIII:C and is thus particularly
useful in conditions where fibrinogen is depleted, such
as disseminated intravascular coagulation (DIC).
8.14.5 Immunoglobulins
Normal immunoglobulin is a preparation made from
human plasma and encompasses a range of Ig, which
is useful in patients with hypogammaglobulinaemias.
Single immunoglobulin preparations are made from
the plasma of blood donors who have high titre
antibodies against specific antigens, for example an-
ti-Hepatitis B Ig, anti-D.
8.14.6 Clotting factors
Patients with haemophilia generally lack factor VIII or
factor IX and recombinant concentrates of these fac-
tors are now available to treat haemophilia. In areas
where these are unavailable, concentrates may be
manufactured from pooled plasma of blood donors.
8.14.7 Albumin
Two different human albumin solutions are available,
at either 4.5% or 20% albumin concentration. They are
indicated in some patients with hypoalbuminaemia
and in plasma exchange procedures.
8.14.8 Autologous bloodtransfusion
In some situations, a patient’s blood may be collected
and reinfused into them at the time of surgery. This
may be done as a predeposit of blood before planned
surgery, such that that a patient donates a few units of
blood at weekly intervals prior to their surgery and
then receives it back. Patientsmay also have one or two
units of blood removed just prior to surgery (effectively
diluting the blood that remains in their circulation so
that less red cells are lost during surgery: this is
preoperative haemodilution) and receive it back dur-
ing or after their surgery to replace lost blood. Cell
salvage is also increasingly being used to collect blood
lost during planned surgery for retransfusion into the
patient, though not all operations are suited to this
(e.g. bowel surgery releases bacteria that make cell
salvage from the site unsafe).
8.14.9 Adverse reactions to bloodtransfusion
Most reactions to blood products are minor and easily
managed. However, in some rare situations, serious,
life-threatening reactions to transfusion of blood com-
ponents can develop. Any new symptoms that appear
while a patient is being transfused must be taken
seriously as they may be the first warnings of a serious
reaction. Symptoms of a reaction include fever, rash,
high or low blood pressure developing, shortness of
breath, chest or abdominal pain, nausea and generally
feeling unwell. Transfusion reactions may be divided
into:
. febrile nonhaemolytic transfusion reactions;
. acute haemolytic transfusion reactions;
. reaction to infusion of a bacterially contaminated
unit;. transfusion associated circulatory overload (TACO);. transfusion related acute lung injury (TRALI);. severe allergic reaction;. anaphylaxis.
Chapter 8 Haematology and transfusion science 391

Where symptoms develop that may suggest an
adverse reaction to a transfusion, the transfusion
should be stopped immediately and the patient’s basic
observations done (i.e. pulse, blood pressure, temper-
ature, respiratory rate and O2 saturation). The details
of the unit of blood should again be checked against
the patient’s details on their wristband to check that
the right unit is being given to the right patient. If the
patient is otherwise well and a rise in temperature of
<1.5 �C has occurred in isolation, paracetamol can be
administered and the transfusion continued at a slower
rate --- this usually means a febrile nonhaemolytic
transfusion reaction. If an urticarial rash is present an
antihistamine may be administered and the transfu-
sion continued at a slower rate, as this would indicate a
mild allergic reaction. However, more serious reac-
tions may be due to ABO incompatibility of the unit,
bacterial infection of the unit, fluid overload, transfu-
sion-related acute lung injury or serious allergic reac-
tions, and these require more specialized medical
management to reverse associated symptoms. The
transfusion must be stopped immediately in these
situations and the unit returned to the transfusion
laboratory for tests on the component of blood.
8.14.10 Safety of blood products
Ensuring the safety of blood products begins with
donor selection and, in the UK, the National Health
Service Blood and Transplant (NHSBT) service has
stringent guidelines for who is eligible to donate
blood. A donor health check survey is taken by each
donor every time they donate blood. Some guidelines
within this (e.g. minimum age and weight, and mini-
mum time between donations of 16 weeks) aim to
keep the donor safe and ensure they do not come to
harm through donating blood, but others (e.g. ineli-
gibility to donate after recent travel to certain regions
of the world, for 6 months after ear-piercing or
tattoos, for 12 months after having hepatitis or jaun-
dice, or where any member of their family has had
Creutzfeld---Jacob disease) aim to ensure that infec-
tions are not present in any units of blood collected.
The donor is also asked to give an initial drop of blood
which is dropped into standardized concentrations of
copper sulphate solution to check their haemoglobin
level is above the minimum acceptable limit for their
gender (currently 13.5 g/dL for males and 12.5 g/dL
for females). Donated units of blood undergo rigor-
ous testing for a range of blood-borne infections,
including HIV, Hepatitis B and C and syphilis. Some
units may be screened for cytomegalovirus too, as
CMV-negative units are required for transfusion in
immunosuppressed patients.
8.14.11 Ensuring the right patientreceives the right blood product
In the UK, patients receiving blood products in the
hospital setting is a common aspect of patient care, but
the pathway for providing the correct product for the
correct patient is complex and has occasionally led to
fatal errors where a patient has been given the wrong
blood product --- ABO incompatible red cell transfu-
sions are one example. Several steps are involved in the
pathway of ensuring the correct blood product reaches
a patient: a sample for blood grouping and cross-
matching must be correctly labelled with full details
of the patient and with barcoding of the sample at the
laboratory to track the specimen through the lab.
Blood grouping and crossmatching is performed in
the laboratory that has appropriate quality assurance
and quality control in place. Once blood is cross-
matched and one or more units for the patient is
issued to a blood fridge, the correct units must be
collected for the patient it has been ordered for and
then units must be crosschecked against the patient’s
identification details (usually a hospital wristband,
ideally with verbal checking with the patient of their
identity too) before they can be administered to the
patient. Any of these stages can be error-prone and a lot
of effort has gone into ensuring that procedures are
streamlined and clear protocols are followed to keep
the patient safe. The use of barcoding of specimens in
the laboratory, with automated blood grouping and
electronic crossmatching in well-defined situations,
has seen the laboratory error rate in transfusion ad-
verse events fall to very low levels. Most errors now
relate to mislabelling of the original blood sample for
grouping and crossmatching, and to the wrong unit
being given to a patient on the ward.
The UKwas the first country in the world to set up a
professionally led ‘haemovigilance’ scheme, Serious
Hazards of Transfusion (SHOT), in which anon-
ymized data on serious adverse events and reactions
to blood transfusion is collected via the Serious Ad-
verse Blood Reactions and Events (SABRE) reporting
392 Biomedical sciences

website and analysed. SHOT produces an annual
report and recommendations which are circulated to
all relevant bodies (including blood and transplanta-
tion services, Departments of Health and all reporting
hospitals in the UK). Analysis of where adverse events
occur in the transfusion pathway has led to several
recommendations of change, including trials of elec-
tronic patient identification at the bedside to match
unit to patient (e.g. using barcodes on patient wrist-
bands and using patient identification cards for pa-
tients having regular transfusions in the outpatient
setting).
8.15 Haemopoetic stemcell transplantation
The first successful human tissue transplant occurred
in 1954 when a kidney transplant was carried out by
Joseph Murray. Since that time, successful transplants
of other tissues as various as heart, lung, liver, cornea,
pancreas and bone have been achieved and here we will
consider transplantation of bone marrow, peripheral
blood stem cells and umbilical stem cells in patients
with serious haematological and immunological
disorders.
With most types of transplantation, the danger
arises from recognition by the recipient’s immune
system that a foreign tissue has been implanted, with
ensuing rejection. In the case of allogeneic bone mar-
row and blood stem cell transplantation into a delib-
erately immunosuppressed recipient, this danger is
turned on its head; healthy white blood cells in the
donated tissue can recognize the recipient’s tissues as
foreign, resulting in ‘graft versus host disease’ (GvHD).
This can prove serious or even fatal for the recipient
and its prevention relies on a close match of HLA
markers between donor and recipient.
8.15.1 Matching donor andrecipient for bone marrow and bloodstem cell transplants
In the ideal blood stem cell transplant scenario, donor
and recipient would be genetically identical to
completely eliminate the risk of GvHD. This is the
case where a prospective recipient has a healthy iden-
tical twin or, in the case of autologous transplants, in
which diseased marrow is collected from a patient and
treated (e.g. with chemotherapy to attempt to eradicate
tumour cells) before infusion back into the patient.
However, autologous transplantation often has a high
disease recurrence rate and most people who require a
transplant will not have an identical twin to donate.
Most transplants of bone marrow and blood stem cells
are thus allogeneic transplants, where the donor is
matched as closely as possible with the recipient for
their major histocompatibility (MHC) molecules. In
most cases, a sibling has the greatest chance of a good
MHC match with the patient.
The MHC molecules are cell surface markers that
present foreign antigens to T lymphocytes. They are
divided into Class I and Class II MHC; Class I MHC
molecules are present on all nucleated cells and
present antigens to cytotoxic T-cells, while Class II
MHCmolecules are only found on antigen-presenting
cells of the immune system, and present antigen to
helper T-cells. The genes that encode the MHC mo-
lecules are often called human leucocyte antigen
(HLA) genes, and there are billions of different pos-
sible combinations of MHC that can be inherited. The
success of a bone marrow or blood stem cell trans-
plant depends on a good match of MHC between
donor and recipient. The enormous variability of
MHC makes this difficult when attempting to match
unrelated donors with recipients in need of a trans-
plant where matched siblings are unavailable. Large
international registers have been created detailing the
MHC molecules of healthy people who are willing to
volunteer to donate bone marrow or peripheral blood
stem cells (in the UK, the Anthony Nolan Bone
Marrow Register is one example). Some differences
in MHC --- particularly in Class I MHC --- can be
tolerated and immunosuppressive drugs are given
following transplantation to enhance this tolerance.
However, the degree of GvHD experienced following
transplantion is known to be directly related to the
extent of MHC mismatch between donor and
recipient.
8.15.2 Performing a bone marrowor stem cell transplant
If a patient is in need of bone marrow or stem cells
(e.g. a young adult with acute leukaemia), a search for
Chapter 8 Haematology and transfusion science 393

a donor with a good MHC match to the patient is
undertaken. The patient’s MHC molecules are iden-
tified using monoclonal antibodies, analysis of restric-
tion fragment length polymorphisms (RFLPs) or
DNA gene sequence identification with DNA probes,
after which an initial assessment of the patient’s
family will be undertaken to identify any likely donors
among siblings (and possibly parents, if no siblings
are available --- however, each parent is likely to be no
better than a 50% MHC match unless parents are
related). If this is unsuccessful, the medical team will
turn to the international bone marrow registers to
identify a possible MHC-matched donor. For many
patients in need of a transplant no donors who are a
suitable MHC match will be found, sadly, and in this
situation an autologous transplant may be considered.
However, for patients where a possible MHC-
matched donor is identified, further testing will be
conducted on the possible donor and recipient to
establish full MHC profiles and ultimately cross-
matching between recipient serum and peripheral
blood lymphocytes from the potential donor to look
for recipient antibodies against donor cells. Note that
the ABO and Rh blood group of donor and recipient
are unimportant in matching them for this type of
transplant.
Once a suitable donor has been identified and has
consented to donate bone marrow or blood stem cells,
the recipient must be ‘conditioned’ before the trans-
plant can take place to destroy their own bonemarrow.
This is usually achieved using high doses of chemo-
therapy, possibly with radiotherapy too. Following
this, the recipient will be completely immunosup-
pressed and is kept in a special isolation unit to
minimize the risk of infection. Bone marrow or stem
cells may be collected from the donor using either
marrow harvesting under general anaesthetic (in
which marrow is extracted from multiple sites on the
pelvic bone --- a minimum of around 3 � 108 marrow
cells per kg of recipient body weight is required), or
using peripheral blood stem cell (PBSC) collection. For
PBSC, the donor is given injections of granulocyte
colony-stimulating factor (G-CSF) over several days
prior to their collection to stimulate increased produc-
tion and mobilization of the CD34-bearing haemo-
poietic stem cells, from marrow into the peripheral
circulation. After around 5 days of these injections,
PBSCs are collected from the donor using apheresis.
Blood from the donor is removed from a vein in one
arm and PBSC are removed from it using centrifuga-
tion, with the rest of the blood returned to the donor
into a vein in their other arm. This involves minimal
discomfort for the donor and no general anaesthesia;
however, it does not always result in the collection of
sufficient stem cells for larger recipients and the older
bonemarrow harvest techniquemay still sometimes be
preferred (Figure 8.63).
Other sources of stem cells have been identified in
recent years, with the umbilical cord of newborn
infants identified in recent years as a rich source of
haemopoietic stem cells. Cord blood banks are now
being established in several countries and research is
still underway in this area.
Following bone marrow harvesting or apheresis,
stem cells are concentrated and can then be infused
into the conditioned recipient. The recipient is kept in
Figure 8.63 Stem cell harvesting using marrow harvesting (left) and peripheral blood stem cell collection (right)
394 Biomedical sciences

isolation until blood tests show that the new stem cells
have engrafted, with a sufficiently high white cell count
to offer sufficient protection against infection. Engraft-
ment usually takes around 15---30 days. Before this
occurs, other blood components such as red cells and
platelets may be needed to support the recipient,
and these should be cytomegalovirus (CMV) negative
and irradiated before being given to the immunosup-
pressed recipient. Antibiotics may also be given to
decrease the risk of infection.
8.15.3 Complications of bonemarrow and PBSC transplantation
Bone marrow and PBSC transplants carry a consider-
able mortality risk which varies according to the
disease process being treated and the MHC match
achieved between donor and recipient, and it is not
undertaken lightly.
Infection is a common and sometimes fatal com-
plication of bone marrow and PBSC transplantation
and occurs due to the immunosuppression of the
recipient around the time of transplantation, both
from chemotherapy þ/� radiotherapy before the
transplant, and from immunosuppressive drugs given
following it.
Graft versus host disease (GvHD)may occur. This is
seenwhere immunocompetent cells are infused into an
immunosuppressed recipient and can occur following
allogeneic transplantation of bone marrow or stem
cells. T lymphocytes in the donated bone marrow
recognize the recipient’s MHC as foreign and launch
an immunological attack. Acute GvHD occurs within
the first 30 days, and is characterized by a skin rash,
which rapidly becomes extensive and often blistered.
Epithelial cells of the skin and gastrointestinal tract
may become necrotic and slough off; the patient
typically experiences severe diarrhoea, sometimes with
jaundice and splenomegaly as the liver and spleen are
affected. Chronic GvHDmay evolve from acute GvHD
beyond the first 3 months after transplant, with a dry
rash, dry skin and eyes and hair loss. GvHD is treated
with immunosuppressive drugs and steroids but may
be fatal if serious enough.
Bibliography
Green, A. (2010) Postgraduate Haematology (eds A.V.
Hoffbrand, D. Catovsky and E.G.D Tuttenham), Wiley-
Blackwell.
Hoffbrand, V. and Moss, P. (2011) Essential Haematology,
Wiley-Blackwell.
Lewis, S.M., Bain, B.J. and Bates, I. (2006) Dacie and Lewis
Practical Haematology, Churchill Livingstone.
Overfield, J., Dawson, M.M. and Hamer, D. (2007) Transfu-
sion Science, Scion Publishing.
Pallister, C.J. and Watson, M.S. (2010) Haematology, Scion
Publishing.
Chapter 8 Haematology and transfusion science 395


Chapter 9
Professional practiceand biomedical science
Dr David Ricketts CSci, DBMS, FIBMS
9.1 What is a biomedicalscientist?
The term biomedical scientist is a protected title in law
(Health Professions Council 2003). Thismeans that if a
person has a test performed by a biomedical scientist
they can be assured that the person is registered with
theHealth Professions Council (HPC) as competent to
perform that analysis. In order to be registered with the
HPC, students need to have been deemed competent to
practice by their peers and met the HPC Standards of
proficiency for Biomedical Scientists.
Professionalism is not just being paid to do a job,
but to perform duties while adhering to a set of values,
conforming to a code of conduct and being trusted by
those who you are providing a service for. Results
provided by biomedical scientists are trusted as they
are provided as part of a professional service to other
healthcare practitioners. Quality is a given by the users
of the service and the results and advice given impact
directly on the patient pathway. The HPC provides the
peer assessed framework against which biomedical
scientists can be judged.
The term biomedical scientist was confirmed as the
legally protected titlewhen theHPCreplaced theCouncil
for Professions Supplementary to Medicine (CPSM).
Under theCPSMthe termMedicalLaboratoryScientific
Officers (MLSO) was used to describe the profession,
althoughministers used the termbiomedical scientist in
2000. MLSOs were not graduate entry and developed
through a junior A, junior B grade before registering
with the CPSM on completion of a Higher National
Diploma and an oral examination. To qualify as a
biomedical scientist aBachelorofScience(B.Sc.) (Hons.)
degree is required and a certificate of competence
awarded by the Institute of Biomedical Science (IBMS).
9.2 The IBMS
The IBMS is the professional body for practitioners of
biomedical science. It was formed in 1912 as the
Pathological and Bacteriological Laboratory Assistants
Association (PBLAA) and then it became the Institute
of Medical Laboratory Technology (IMLT) in 1942
changing its name with the role of its members to the
Institute of Medical Laboratory Science (IMLS) in
1975. Unusually for a professional body, membership
is not compulsory for biomedical scientists.
The IBMS provides education and support for bio-
medical scientists including assessing the competence
Biomedical Sciences: Essential Laboratory Medicine, First Edition. Edited by Ray K. Iles and Suzanne M. Docherty.� 2012 John Wiley & Sons, Ltd. Published 2012 by John Wiley & Sons, Ltd.
397

of a prospective registrant onto the HPC register. The
IBMS’s primary role is to develop biomedical scientists
within healthcare and support their role in providing
patient care.
The IBMS provides an education stream along
with a professional support network for all levels of
education from student to senior professional quali-
fications at career stage 9 of the healthcare science
career pathway. This career escalator was published by
the Department of Health in 2005. The IBMS qualifi-
cation structure (Table 9.1) commences with an ac-
credited biomedical science degree. The combination
of the degree and a period of training in an Institute
approved laboratory, during which a Registration
Portfolio is completed, leads to the issue of a certificate
of competence. This award is dependent upon external
verification of the training process --- as evidenced by
the portfolio and a guided laboratory tour conducted
by the trainee in the presence of the external verifier.
Together with the academic degree, this demonstrates
the learning outcomes needed to register as a biomed-
ical scientist have been met. As well as being able to
apply for registration with the HPC, the student also
becomes eligible to apply for Corporate Membership
of the Institute as a Licentiate. To become a Member
(the next class of Institute membership) the Licentiate
is required to pass the specialist diploma in the subject
area of their specialty. This is a portfolio-based pro-
fessional qualification and is assessed through a pre-
sentation and an accompanied tour of the laboratory,
where their expert knowledge is tested by the external
examiner.
The higher specialist diploma (HSD)was developed
to fill the void left by the special and fellowship
examinations. These examinations were used to award
the Fellow membership class of the IBMS. With the
advent of Masters Degrees in biomedical science, they
became less popular and were no longer offered. The
Masters program offers an excellent academic qualifi-
cation but a vocational qualification was lacking for
experienced practitioners to demonstrate their level of
practice. The HSD is designed to test the application of
a practitioner’s knowledge at a high level of practice. A
portfolio of evidence is submitted and, if it is of a
sufficiently high quality, is followed by a written ex-
amination. Success in this examination leads to eligi-
bility to apply for Fellowship of the Institute. There are
now Advanced Specialist Diplomas in discrete areas of
high level practice developed with the Royal College of
Pathologists to provide an academic and clinical
framework to support advanced clinical roles in bio-
medical science.
Supporting this spine of qualifications are the di-
plomas and certificate of expert practice. These qua-
lifications are used to support the education and
development of members in specialist areas such as
diabetes, histological dissection, quality management
and point of care in the community.
The IBMS also supports a mature continual profes-
sional development (CPD) programme to support
lifelong learning in the profession and evidence the
requirements of both theHPC and the Science Council
for continued learning. The IBMS is an awarding body
for Chartered Science status. This is a nationally rec-
ognized mark of excellence that is now available to
scientists and requires the applicant to have a Masters
level qualification and CPD.
9.3 Professional practiceand the role of the HPC
Codes of practice are in place to ensure patient safety,
which is the primary role of the regulator. Registrants
falling short of these standards can be referred to the
Table 9.1 IBMS qualifications taken from the IBMSwebsite at www.ibms.org
Careerframeworkstage
Membershipclass
Additionaloptionalqualifications
9 Professional
Doctorate
8 AdvancedSpecialistDiploma
"
Fellow
7 HigherSpecialistDiploma*
"MSc
Member Diploma of
Expert Practice
and Certificate
of Expert Practice
6 SpecialistDiploma*
"
Licentiate
5 Certificate ofCompetence
"B.Sc. (Hons.)
Biomedical
Science
Source: The Institute of Biomedical Sciences, UK www.ibms.org
398 Biomedical sciences

HPC for investigation and be liable to action --- the
ultimate sanction including being struck off from the
register. The HPC provides advice for practitioners
and aspiring practitioners in the form of brochures
outlining what is expected from them as they develop
in their career as a biomedical scientist.
The HPC produces a document entitled Guidance
on conduct and ethics for students (HPC, December
2009) aimed at students, practitioners in training and
those who are delivering the training for a career in a
profession regulated by theHPC, including biomedical
science. The brochure covers information on the pur-
pose of the HPC as a regulator and an overview of what
you can expect as a registered healthcare practitioner.
Importantly it highlights that conduct leading up to
registration can impact the ability of the potential
candidate to be accepted onto the register. Guidance
on conduct and ethics is covered with statements
provided on the expectation of the practitioner
(Table 9.2). What the document does not provide are
examples of good and bad practice.
The information given on acting in the patient’s
best interest is fairly straight forward to understand,
but does raise a dilemma that professionals often
have to face in its last bullet point. Even at the begin-
ning of your career as a healthcare professional
you need to be able to exhibit a mindset that looks
for risks to the patient and have the courage to raise
them with either your placement team or education
provider. This is an ongoing theme for biomedical
scientistswhoneed to develop critical reflective skills to
enable them to grow and develop as a healthcare
provider. Not all guidance is as straight forward as the
example given (Table 9.3).
Bullet points two to four are fairly self explanatory
but the first point is one that is important to all
registrants. Your conduct is important in work as well
as away from the workplace. It is possible to be referred
to theHPC for conduct unfitting for a professional due
to issues arising fromnonwork-related situations. This
does not mean that you will be struck off for these
situations, but the HPC will investigate and agencies
such as the police force will refer any criminal activity
to the HPC for investigation.
The student guidance covers key areas that a
biomedical scientist will need throughout their career
such as competence, health, operatingwithin the limits
of knowledge, development, consent and communica-
tion. All of these will be covered later in this chapter.
The HPC covers a diverse spectrum of healthcare
professions from biomedical scientists to arts thera-
pists. They all need to meet the same standards
of proficiency, known as generic standards. There
are profession-specific standards to underpin these,
which can be found in the Standards of Proficiency ---
Biomedical Scientists, produced by the HPC in 2003
and updated in November 2007.
9.4 Standards ofproficiency --- biomedicalscientists
These Standards --- coupled with the Standards of
Conduct, Performance and Ethics --- are the backbone
of a biomedical scientist’s duties. As stated they pro-
vide the framework against which a biomedical scien-
tist’s professionalism is judged and therefore they
Table 9.2 Guidance on conduct and ethics taken fromthe HPC pamphlet for best interest
1 You should always act in the best interests of yourservice users:
. You should respect a person’s right to have their interventions
carried out by a professional not a student
. You should not exploit or abuse your relationships with
service users
. You should treat everyone equally
. You should not do anything that you think will put someone in
danger
. If you are worried about a situation which might put someone at
risk, you should speak to a member of the placement team or your
education provider
Source: The Health Professions Council, UK www.hpc-uk.org
Table 9.3 Guidance on conduct and ethics taken fromthe HPC pamphlet for personal conduct
3 You should keep high standards of personal conduct:
. You should be aware that conduct outside your programme may
affect whether or not you are allowed to complete your
programme or register with us
. You should be polite with service users, your colleagues and the
programme team
. You should make sure that your personal appearance is
appropriate for your placement environment
. You should follow your education provider’s or placement
provider’s policy on attendance
Source: The Health Professions Council, UK www.hpc-uk.org
Chapter 9 Professional practice and biomedical science 399

require some scrutiny to help define how they can be
used to improve practice.
The HPC states in its literature that:
‘Your scope of practice is the area or areas of your
profession in which you have the knowledge, skills and
experience to practice lawfully, safely and effectively, in
a way that meets our standards and does not pose any
danger to the public or yourself.’
The HPC’s primary concern is that of safety to the
public, which is why a practitioner who is struck off
from the register cannot lawfully practice biomedical
science. The register is open to the public so they can
check if the people they entrust their samples to are fit
to practice. This is not the case in voluntary registers
where a practitioner may be able to practice in another
part of the country and not declare previous short
comings in his or her performance.
9.5 Expectations of a healthprofessional
The expectations for a biomedical scientist’s scope of
practice are clearly laid out by the HPC. The first
guidance provided is in the area of professional
autonomy and accountability. Under the old CPSM
standards, biomedical scientists could not offer advice
--- this rule seems to be upheld in someworkplaces even
though the HPC view differs. The HPC standards ask
practitioners to perform their duties within the legal
and ethical boundaries of there profession. There is a
need to look after the best interests of those who you
offer the service to as well as a need to understand
current standards and legislation. Confidentiality and
seeking appropriate consent are key areas of responsi-
bility, as are the ability to exercise a duty of care. One of
the most important areas this standard of proficiency
covers is in understanding the limits of practice and
when to seek advice. A biomedical scientist is permit-
ted to practice as an autonomous practitioner using
professional judgment. It is essential that a biomedical
scientist understands any advice they provide can have
an impact on the patient care pathway, especially as
pathology training in junior doctors is not as extensive
as that which was previously delivered.
The issue of consent is particularly important due to
the Human Tissue Act (2004) (HTA) clarifying the
issue and setting it in a legal framework following some
high-profile cases with human organs. Biomedical
scientists are increasingly asked for expert opinion on
consent regarding thisAct; therefore it is important that
the knowledge of the latest advice is up to date. This Act
is covered in the expectation of the HPC that practi-
tioners should be aware of standards, be they British or
more global, that impact on the pathology laboratory.
Self management of workload and the effective use
of resources are expected of a biomedical scientist. This
can be a challenging standard to meet when resources
are tight due to global financial issues. It is the duty of a
professional to make full use of resources available
and also to highlight to senior management if the lack
of resources could have a detrimental impact on
patient care.
Personal conduct has been mentioned in the
student booklet and is as important when registered
as a professional. The HPC has a public record of
any disciplinary hearings on its website. Reviewing
these hearings shows that often offences outside of
the workplace are brought to their attention. It is also
the duty of a registered professional to report poor
conduct in others if it can impact patient care.
This can be an issue as there are local policies and
procedures in place to deal with conduct. The golden
rule is: if in doubt, discuss this locally and obtain advice
from the HPC. An employer would not like to know
there is an issue from the HPC if it had not first
been raised locally. It is also important that a patient
safety issue concerning a registrant is not kept from the
HPC. Failure of a registered practitioner to notify the
HPC of a fellow registrant acting in such a way as to
contravene HPC standards may place their own regis-
tration at jeopardy.
The issue of personal health is important to the
HPC. Registrants are required to alert the HPC if their
health can jeopardise the service they offer. This covers
all forms of health issues including mental health and
potential substance dependency --- if in doubt check
with the HPC. It is important that if there is a short-
term issue that may impact judgment, such as a heavy
cold, care must be taken as to whether it is safe to be on
duty or not.
The need for life-long learning is ingrained in the
Standard. No one would wish to have their results
provided by someone who does not have access to
the skills and training of an up-to-date healthcare
professional. Medicine continually evolves and those
providing diagnostics need to be in a position to
respond. As a result, the HPC randomly samples a
400 Biomedical sciences

number of registrants to check their CPD records to
ensure they are keeping their skills current. CPDwill be
discussed later in this chapter, but it is an essential part
of a professional’s career.
9.6 Professionalrelationships
There have always been some tensions between various
groups delivering healthcare and science in healthcare.
Some of these tensions are due to historical issues,
whilst others are due to service development and the
roles of healthcare professions changing. Point of Care
Testing (POCT) can be performed by numerous staff
of different grades and abilities. This tests the skills of a
biomedical scientist to be able to help support and
develop these services. The training and support will
need to be provided to a range of healthcare profes-
sionals meaning that the information given needs to be
set at an appropriate level and that the biomedical
scientist can ensure the testing is performed safely.
Increasingly, the laboratory is viewed as a key part of
the patient pathway. This requires biomedical scien-
tists to link with clinical teams and provide expert
input. Traditionally, most biomedical scientists have
the view that their role is laboratory based. The advent
of advanced roles, such as in cytology and the involve-
ment of biomedical scientists in histological dissection
means that biomedical scientists now input into the
multidisciplinary team (MDT) meetings to review
cancer cases. This role is recognised as key by the HPC
who make it one of their Standards of professional
relationships --- Standard 1b.2.
Standard 1b.3 relates to the appropriate communi-
cation of advice, instruction and professional opinion
to colleagues, service users, their relatives and carers.
As previously stated in the chapter, this is a culture
change for some in pathology and there remains
some confusion as to when and where this is appro-
priate. The skill and knowledge of the individual
should be the deciding factor in this issue. This of
course should be underpinned by supporting evidence
from academic and vocational training and CPD.
The last area covered in this section is about effec-
tive communication throughout the care of the service
users. Biomedical scientists usually do not treat pa-
tients directly as part of their normally duties, although
they can do as part of clinics, such as warfarin dosing.
However it is important that the reports they produce
are clearly understood by those using the service. This
links to the need to communicate at the level of the
recipient of information’s understanding.
9.7 The skills requiredfor the application of practice
The HPC has included many profession-specific stan-
dards in this section. The section concentrates on
assessment of need, delivery of service, reviewof service
and audit as its key themes. It encourages biomedical
scientists to move from the delivery of a routine
service to be part of the team planning future services.
The ability of the biomedical scientist to knowwhich is
the most appropriate specimen and procedure for
analysis forms the first standard; it is a key skill for
a professional to have, as often this is the sort of basic
advice needed by other healthcare professionals.
There is a detailed list in the Standards, where the
registrantmust be able to perform anddemonstrate key
laboratory functions, such as to ‘be able to validate
scientific and technical data andobservations according
to predetermined quality standards’. These are impor-
tant skills for the biomedical scientist and require
evidence to support that these have been met. The
Clinical Pathology Accreditation Scheme (CPA), which
is aligned to the International Standard ISO 15189 for
medical laboratories, sets a standard that requires evi-
dence of competencies for staff performing laboratory
investigations. Signing a StandardOperatingProcedure
(SOP) to indicate it has been read is now insufficient as
evidence. It is important that the personundergoing the
testing has not only read the SOP but understands what
they are doing and can demonstrate this competence to
their peers. There aremany ways of doing this, a simple
one being including a series of questions as part of
the SOP that require being answered and assessed
before the task is performed for the first time. This
assessment must be recorded as evidence.
The HPC also uses this section of the Standards to
alert the biomedical scientist to the importance of
using their knowledge to identify risk and try to
remove opportunity for error from their systems. Data
quality and data retention are important issues as the
rules on personal information change with the ad-
vances in information technology. These advances
prove an ongoing challenge due to the regulations,
Chapter 9 Professional practice and biomedical science 401

such as those of retention of blood transfusion records
requiring increasingly long periods of storage.
The move from paper-based, to tape, to floppy disk,
toCD, toDVD, tomemory stick has happened over the
last 15 years. The challenge is not in the keeping of
records, but keeping them in a format that will be
future-proof in terms of access as different technolo-
gies become obsolete: even the ink used in modern
printers fades over time.
The HPC requires professionals to be able evaluate
their own impact on the users of the service and the
actions as a result of their decisions. Critical reflection
is an import tool, one traditionally associated with
nurses. Reflection is now a recognised activity for
CPD and forms an important part of a registrant’s
practice. The use of qualitative as well as quantitative
data is important to registrants, especially as scientists
are more often used to dealing with numerical
data. Understanding feedback from users and staff
is becoming increasingly more important in the
management of resources and being able to respond
to the changes in healthcare delivery.
The use of auditing is an important tool to help
identify areas for service improvement and to provide a
rich source of data for research and development.
Auditing is a skill that is required by both the HPC and
CPA. The HPC includes the audit of internal quality
systems such as quality control and external quality
assessment. The use of audit and review as part of a
quality management system, and the application of the
findings to the servicedelivery, are expectedqualitiesof a
biomedical scientist. This is one of the areas the bio-
medical scientist can offer an important skill set to help
other healthcare professionals. All doctors are expected
to perform a clinical audit; many of these audits require
data from the laboratory and therefore it is an ideal
opportunity to become involved in the clinical interface
with colleagues from other departments. The training
that biomedical scientists have in quality control and
quality assurance is transferable to those performing
analysis near the patient, and is required to ensure good
governance and safe outcomes for patients.
9.8 Knowledge,understanding and skills
The final set of Standards for biomedical scientists
examines the knowledge that a practitioner must have.
The understanding of the anatomy and function of the
human body are the basic building blocks of this
knowledge. What is ‘normal’ and how to identify
disease and disorder is expected for a biomedical
scientist. There must be an awareness of current
research and scientific enquiry to help influence
appropriate investigation of the diagnostic questions
posed by requesting clinicians.
Biomedical scientists must understand the limita-
tions of the molecules being examined and convey
important scientific information to users. The move
towards greater patient choice, where a test may be
carried out in different laboratories or non-laboratory
environments, can lead to confusion and error due to a
lack of standardisation in methodologies and terms,
which is being address by the professional bodies in the
Harmony Project (2010). Similar tests are described by
different names, some profiles are called the same but
have different analytes prescribed to them and even the
same test can have a different result depending on how
the reaction is performed or the epitope being mea-
sured. This level of detail is not understood by the
patient or the requesting clinician who would, rightly,
expect the test to be the same no matter where and
when ordered.
Pathology laboratories have many sub-specialties,
the most common being clinical biochemistry,
haematology, microbiology, histopathology, cytology
and blood transfusion. In some centres these
may even be combined into larger multi-disciplinary
departments such as blood sciences. Biomedical
scientists should be aware of the function of all of
these and be able to direct service users to the most
appropriate area to answer the clinical question
needed. There are more specialised areas of pathology
such as virology, immunology and departments offer-
ing esoteric testing which may offer a changing menu
and more complex testing, so keeping up-to-date
requires good communication and documentation
between departments. The advent of molecular tech-
niques into routine diagnostics offers a challenge as the
same technology can cross traditional diagnostic
departmental boundaries and there is a new challenge
for learning as the data produced requires advanced
bioinformatics skills.
The adaptation of the testing and information
for specific clinical and cultural challenges is part of
the knowledge and understanding expected from a
biomedical scientist. An example of this is biomedical
scientists who help with advice to set up and provide
402 Biomedical sciences

a cell salvage service for those who will not allow blood
transfusion due to religious belief.
There are many aspects of health and safety that a
biomedical scientist has to be aware of and implement.
The medical laboratory contains many hazards gov-
erned by diverse legislation such as Control of Sub-
stances Hazardous to Health (COSHH) which was
revised in 2009, ISO 15190 (2003) and the Health and
Safety Law. There is a need to understand the biologi-
cal, chemical and physical aspects of working in
pathology; the risks to staff and visitors as well as the
need to ensure proper precautions are taken to ensure
the same vigor is used when placing equipment in a
POCT setting.
9.9 Standards of conduct,performance and ethics
The HPC provides this document for all registrants as
an overarching guide to inform the public and the
professionals onwhat to expect andwhat is expected of
them. Most of the Standards have been covered earlier
in the chapter so only a brief summary of this docu-
ment will be given.
There are 14 Standards covered which are set out as
one list (Table 9.4). These Standards all start with the
descriptor of ‘You must. . . ’, leaving no room for
ambiguity as to the need for compliance. The Stan-
dards listed are taken from the HPC website and are
free to download.
Often the statements contain phrases that are an
expectation, such as keeping a high standard of per-
sonal conduct. It does not define what a high standard
is, but it is up to the registrant to prove that if referred
they meet this expectation. A high standard may be
hard to define, but a low standard is easily spotted by
your peers.
The emphasis is on communication between the
registrant and theHPC, and between the registrant and
the service users. If you train someone to do a task, you
must ensure that adequate support is there should
there be an issue; this is particularly relevant as diag-
nostics are being moved away from the traditional
laboratory setting and closer to the patient.
Operating within the scope of knowledge and skills
is important. The HPC guides the registrant to refer
issues to another practitioner for a second opinion if
unsure on how to proceed. It also clearly states that
registrants are responsible for ensuring that they are
able to identify when they need to moderate or stop
practice if unwell, a point alluded to earlier in this
chapter.
The HPC relies on the professional biomedical
scientist to make judgment calls and to back these up
with evidence. As a professional you are expected to
identify practice in yourselves and your colleagues that
may impact on the patient, and improve on it --- or
refer it --- if patient safety is put at risk. Keeping up-
to-date and aware of service change is incumbent on
all biomedical scientists, coming in daily and just
doing a job is no longer sufficient for a professional
practitioner. The appropriate use of CPD is an essential
tool in maintaining registration.
9.10 CPD
In 2006 the HPC produced another helpful brochure
entitled Your guide to our standards for continuing
Table 9.4 Duties of a registrant
Duties as a registrant
1. You must act in the best interest of service users
2. You must respect the confidentiality of service users
3. You must keep high standards of personal conduct
4. You must provide (to us and any relevant regulators) any
important information about your conduct and competence
5. You must keep your professional knowledge and skills up-to-date
6. You must act within the limits of your knowledge, skills and
experience and, if necessary, refer the matter to another
practitioner
7. Youmust communicate properly and effectively with service users
and other practitioners
8. You must effectively supervise tasks that you have asked other
people to carry out
9. You must get informed consent to give treatment (except in an
emergency)
10. You must keep accurate records
11. You must deal fairly and safely with the risks of infection
12. Youmust limit your work or stop practicing if your performance or
judgment is affected by your health
13. You must behave with honesty and integrity and make sure that
your behaviour does not damage the public’s confidence in you or
your profession
14. You must make sure that any advertising you do is accurate
Chapter 9 Professional practice and biomedical science 403

professional development. CPD is defined in this
document as:
a range of learning activities through which
health professionals maintain and develop throughout
their
career to ensure that they retain their capacity to
practise safely,
effectively and legally within their evolving scope of
practice.
(This definition is taken from the Allied Health Pro-
fessions project, Demonstrating competence through
CPD, 2002.)
Until 2005 CPD was an optional exercise using
voluntary schemes such as the one offered by the IBMS.
It is now a requirement of registration and a detailed
record needs to be kept of CPD activities. These
activities need to be relevant to current practice and
focus on service delivery offered now and in the future.
The HPC allows practitioners to define their own
learning but provides a list of suggested activities to
help. These can be done as part of a group, such as
journal clubs, or as individual focused learning such as
critical reflection on one’s own performance.
9.11 Critical reflection
Critical reflection has been used by nurses to improve
their practice for a number of years (Rolfe et al., 2001)
and was incorporated into the IBMS CPD scheme in
2003. Critical reflection looks at learning from an
experience and disseminating and changing practice
as a result. This technique is suited to the HPC CPD
evidence and uses the Gibbs model of reflection as
describe in Rolfe’s book.
The Gibbs model requires that you describe what
happened and then you describe your feelings about
this. The next stage is to evaluate what was good and
bad about this and to analyse this data, tomake sense of
it. In this case the data is thoughts and feelings which is
something of an unfamiliar approach to learning for
scientists. Using this data you elucidate what else could
be done and then finally come upwith an action plan as
to what to do in the future to prevent this from
happening again. This model can be taken further and
used positively to change the culture of the laboratory.
With agreement of all staff, thoughts on the input of
colleagues and management can be added and kept
private at the time of the incident or process being
reflected upon. After a while these thoughts can be
revisited and reviewed to see if, when emotions are no
longer running high, the feelings as to how the inter-
action went can be revisited and then reviewed in a
constructive way to see if a service or professional
relationship improvement can result.
Good practice as a result of reflection should be
shared with colleagues and should be encouraged to
input into the Knowledge and Skills Framework (KSF).
This can then lead to improved training needs identi-
fied as part of the appraisal process.
Reflective learning logs should be performed as a
result of attending training courses and seminars so the
information gained from them can be used to improve
the service and to inform your colleagues. These should
be documents that all can see rather than an intimated
reflection of one’s self which are more the result of
reflection after an incident or issue. The information
should convey which areas are: suitable for immediate
implementation, require more research, a detailed
business plan or what is there for general interest and
information.
9.12 IBMS CPD scheme
This scheme complements the requirements needed
for the HPC evidence but is not sufficient to provide
this as the only evidence for theHPC.The scheme came
about due to the vision of one of the Institute’s past
Presidents, the late Russ Allison, and was launched in
1992. This scheme is free to members of the IBMS and
consists of the accreditation of events. Accumulation
of credits leads to the award of a CPD certificate.
Online journal-based learning, structured essays and
credits awarded to meetings and seminars all go to-
wards the credit total. Credits are awarded for work-
based journal clubs, for professional activity and for
attending events such as the IBMS congress, held every
2 years. With the advent of reflective learning as part of
the role of a biomedical scientist, CPD credits can now
be given for this, although no formal assessment is
made of CPD learning sheets.
The IBMS CPD scheme is designed to reward
activity that encourages biomedical scientist to share
their professional knowledge. Credits are awarded
for educational activity such as teaching on the
degree programs, running workshops and acting as
404 Biomedical sciences

an external examiner for the degree courses. Publishing
books and chapters of books attracts CPD credits as
does reviewing articles and books. Lecturing to share
knowledge is encouraged and is also recognised by the
scheme; this can be as a presenter of research at an
international or national meeting or as a speaker on
science or management.
Getting involved in the professions as an elected
member of Council or inputting scientifically or aca-
demically in one of the specialist advisory bodies
attracts credits. At a local level this may mean organis-
ing local meetings through the region or branch net-
work of the IBMS or even at laboratory level running
discussion groups. Case presentations to fellow bio-
medical scientists or other healthcare professionals are
also a good way of gaining credits and establishing
professional recognition.
One of the criticisms of the IBMS scheme is that
credits are awarded for attending activities in nondis-
cipline-related subject areas, a biochemist gaining
CPD points for attending a haematology seminar,
for example. This has, in hindsight, proved to be a
strength of the scheme as technology is increasingly
blurring the boundaries of traditional pathology sub-
ject areas. As well as a drive from technology to
combine disciplines, workforce reconfiguration due
to budgetary restraints is also causing departments
such as clinical biochemistry and haematology to
combine as a blood science department. The HPC
also requires a broad knowledge of other disciplines’
functions as part of the evidence they wish to see from
their registrants.
9.13 The professionalbiomedical scientistas an agent for changein thewider healthcare setting
The knowledge and skills of biomedical scientists can
offer a huge amount of value to the wider healthcare
community should they look beyond the doors of
the laboratory. Biomedical scientists, through their
accreditation scheme --- CPA, have developed internal
systemswhich others in the healthcare professional can
learn from.
The delivery of training for biomedical scientists is a
mature structured scheme, supported by education
tools from the IBMS. Each laboratory that is approved
for training by the IBMS has a person responsible
for delivering and coordinating training. Training is
agreed in a structuredway to benefit the individual and
the service. These systems can be used to help structure
wider delivery of education and often biomedical
scientists can be found at the heart of Trust training.
CPA has also brought structure to the quality
management systems used in pathology. These systems
have allowed the development of competency based
SOPs and good document control systems to be put in
place. It is possible to link the KSF dimension to the
SOPs, making the appraisal target setting and evidence
gathering easier. These systems seem second nature to
many in pathology and can greatly benefit other areas
by sharing the learning and developing similar systems
across the health system. Quality management systems
are not just about complying with paperwork,
but using the system to look for opportunities for
improvement rather than being reactive to problems
when the system fails. The three strands of a good
quality management system are: quality control, qual-
ity assurance and quality improvement. These skills are
well developed in to biomedical scientists. Controlling
quality is about systems being in place rather than just
running a known sample through an analyser and
getting a result. It looks for systems to be in place to
look for consistent quality as well as focusing on the
quality of the service and/or product.
Recently process management tools such as LEAN
and Six Sigma have become very popular with Health
Service Managers in both primary and secondary care.
Schemes such as the productive ward and looking to
bring LEAN into nursing have been set up to reduce
error and to improve the experience of patients by
making the ward more efficient and safer. These tech-
niques have been used in pathology since 2003 and
there is a considerable body of knowledge that can be
used to help shape these projects. The danger is that
these resources will be kept in pathology due to the fear
of losing staff without backfill and the pathology
service suffering as a result. The true cost will be the
host organisation not realising the benefit biomedical
scientists can offer in terms of quality and innovation.
If this is not realised then there is a risk that the
pathology department will be seen as an overhead
only, which can be disposed of or downgraded to help
meet short-term financial expediency.
Biomedical scientists have been in existence,
under various titles, for almost 100 years. They have
Chapter 9 Professional practice and biomedical science 405

developed as an essential part of the healthcare team
through good training and adaptation of new ideas and
systems. The HPC regulates their conduct to ensure
they operate at the highest level of professionalism
needed to fulfill their role in delivery of service. This is
supported by a professional body that provides a
structure to training, education and CPD. One of the
big challenges facing biomedical scientists is the low
profile they seem to have with the public and their
peers. This challenge can only be met by leaving the
confines of the laboratory and getting into the wider
healthcare environment offering their unique skills to
help develop systems throughout the wider service.
The NHS has devised a scheme known as Modern-
ising Scientific Careers (MSC). This looks to replace
the established B.Sc. (Hons.) degree with a practitioner
training programme and a voluntary register. The
impact of this is unclear and comes at a time when
pathology is under pressure to save 20% of its budget.
Whatever the outcome of these challenges, there has
never been such a time when the biomedical scientists’
skills have been needed as much as now.
406 Biomedical sciences

Appendix
Index of diseases,disorders and syndromes
Achondroplasia 122, 123
Acidosis 62, 232, 235, 253
Acromegaly 84, 244
Addison’s disease 85, 244
Adenocarcinoma 257
Adenoma 49
Adrenal hypoplasia congenital-X 129
Adrenal insufficiency 244
Adrenal tumour 246
Adrenoleukodystrophy - X linked 129
Adult polycystic disease (APCD) 61---2
Adult T-cell leukaemia/lymphoma 295
Agammaglobulinaemia - X linked 129
AIDs 263, 288---293, 298---9, 306
Alagille syndrome (AGS) 123
Albrights hereditary osteodystrophy 101
Alexander disease 123
Alkaptonuria 126
Allergic aspergillosis 286
Alpha Mannosidosis 126
Alport’s syndrome 129
Alstrom syndrome 126
Alzheimer dementia 92, 123
Amegakaryocytic thrombocytopenia 366
Amenorrhoea 82---3
Amyloidosis 160---2
Anaemia 353---9
Anal cancer 162
Anaphylaxis 326---7, 392
Aneurysm 74, 157
Angelman’s syndrome 131
Angina 70
Aniridia 123
Ankylosing spondylitis 132
Anorexia 235
Antiglomerular basement membrane
disease 196
Aortic aneurysm 75, 155, 157
Aortic regurgitation 73
Aortic stenosis 73, 155
Aplastic anaemia 357, 359, 361, 366
Aplastic crisis 292
Appendicitis 49---50
Arrhythmia 69
Arterial occlusion 160
Arthralgia 56, 292
Arthritis 56---8
Aspergilloma 286
Asphyxia 253
Asthma 76---7
Ataxia-Telangietctasia 126
Atherosclerosis 155---9
Atopy 77, 326
Atrial septal defect (ASD) 68
Autoimmune disease 60---1, 321---2, 324---5
Bacterial endocarditis 68
Barrett’s oesophagus 44---5, 166
Bart’s Hydrops fetalis 352
Becker’s muscular dystrophy 129
Benign prostatic hypertrophy 64---5
Bernard---Soulier syndrome 96
Berry aneurysm 74
Bilary cirrhosis 238
Bilateral vestibular schwannomas 134
Bitemporal hemianopia 30, 81
BK - cystitis and nephritis in
immunosuppresssed 292
Bladder tumour 134
Bradycardia 69
Biomedical Sciences: Essential Laboratory Medicine, First Edition. Edited by Ray K. Iles and Suzanne M. Docherty.� 2012 John Wiley & Sons, Ltd. Published 2012 by John Wiley & Sons, Ltd.
407

Breast cancer 123, 134, 174, 257
Breast osteosarcoma 134, 241
Bronchiolitis 292
Bronchitis 77---8
Burkitt lymphoma 295, 373, 377
Campylobacter 262---3, 269, 283, 285
Candida albicans 163---4, 269, 286
Carcinoid tumours/syndrome 47, 256
Cardiovascular disease 65---76
Castration 249
Cerebellar ataxia 119
Cerebral Cavernous Malformation 123
Cervical cancer 167---9, 293
Charcot---Marie---Tooth disease 123,
126, 129
Chicken pox 292
Cholangitis 52
Cholecystitis 54
Cholera 283
Cholestasis 237---8
Chorioretinitis 289
Christmas disease 369
Chronic granulomatous disease (GCD) 298
Chronic myeloid leukaemia 371, 373---5
Chronic otitis media 286
Chronic progressive external ophthalmoplegia
(CPEO) 119
Cleft palate 132
Clostridium difficile 264, 280---1, 300
Coeliac disease 47
Coffin---Lowry syndrome 129
Cokayne syndrome 126
Cold sores 292
Colitis 48
Colorectal cancer 49---50
Columnar-lined oesophagus 166
Common cold 292
Congenital adrenal hyperplasia 126, 249
Congenital heart disease 67, 132
Congenital Icthyosis 126
Congenital pyloric stenosis 132
Congenital rubella 293
Congential CMV 292
Conjunctivitis 292
Creutzfeldt---Jakob disease (CJD)
297---8, 368
Crohn’s disease 48, 161
Cushing’s syndrome 85---6, 244
Cyanosis 73, 351
Cystic fibrosis (CF) 78
Cystic renal disease 61---2
Cystinosis 21-hydroxylase deficiency 126
Deep vein thrombosis (DVT) 74---5, 158---9, 370
Dengue 293
Diabetes insipidus 86, 244
Diabetes mellitus 86---8, 156
Diabetic ketoacidosis 87---8
Diarrhoea 264, 281, 291
DiGeorge syndrome 123
Diptheria 283
Dissemintated intravascular coagulation (DIC)
369---70, 391
Diverticular disease/diverticulosis/
diverticulitis 48
Double Y syndrome 118
Down Syndrome 118
Duchenne’s muscular dystrophy 121, 129
Dwarfism 245
Dysentry 264
Dysferlinopathy 126
Dysgerminoma 257
Dysphagia 44---5
Dyspnoea 76
Edward’s syndrome 118
Ehler---Danlos syndrome 124, 126
Embolism 157---9
Emphysema 77---8
Encephalitis 292---3
Endometrial cancer 134
Enterobius vermicularis 165
Eosinophilia 291, 360---1
Ependymomas 134
Epidermolysis Bullosa Simplex 124
Epstein---Barr virus (EBV) 376
Erythema infectiosum 292
Escherichia coli 264, 282
Exanthem subitum 292
Extranodal gastric B-cell lymphoma 163
Fabry’s disease 129
Facioscapilohumeral muscular dystrophy 124
Familal polyposis coli 49
Familial adenomatous polyposis 124, 134
Familial combined hyperlipidemia 239
Familial dysbetalipoproteinemia 239
Familial hypercholestrolaemia 124, 239
Familial hypertriglyceridemia 239
408 Appendix

Familial Mediterranean fever (FMF) 126
Familial periodic fever/TRAPS 124
Fanconi anaemia 126
Fetal anaemia 292
Filariasis 291
Folate deficiency 303, 355, 357---9
Food poisoning 280
Fragile X syndrome 118---130
Free sialic acid storage disorders 127
Friedreich’s ataxia 130
Galactorrhoea 83
Galactosaemia 126
Gallstones 54
Gastric adenocarcinoma 46
Gastrinoma 56
Gastritis 45
Gastroenteritis 292---3
Gaucher’s disease 127
Genital herpes 292
Genital warts 292
Gestational trophoblastic disease (GTD)
256, 285
Giardia lamblia 164, 289
Gilbert’s syndrome 238
Gitelman’s syndrome 95
Glandular fever 292, 361
Glanzmann’s thrombasthenia 96
Glomerular disease 60, 200
Glomerulonephritis 60, 237
Glucagonoma 56
Glucose-6-phosphate dehydrogenase deficiency
(G6PDD) 342
Glycine encephalopathy 126
Gonadal dysgenesis 249
Gonococcal arthritis 57
Goodpasture syndrome 325
Gout 58, 197
Graft versus host disease (GvHD) 393---5
Graves’ disease 84---5
Graves’ thyroiditis 325
Gynaecomastia 82
Haematuria 59---60
Haemochromatosis 187, 355---6
Haemoglobinopathies 346, 350, 353
Haemolytic anaemia 238
Haemolytic uraemic syndrome 238
Haemophilia A 129
Haemophilia B 129
Haemoptysis 76
Haemorrhage 45---6, 62, 74, 85, 157---9, 286,
355---6, 366, 369, 387
Haemorrhoids/piles 46
Hand foot and mouth disease 292
Hashimoto’s thyroiditis 385
Healthcare associated infections
(HCAI) 299---302
Heart block 43, 119
Heart failure 70
Heart murmur 68, 72---3
Heartburn 44
Helicobater pylori 45---6, 163, 283
Hemorrhagic telangiectasia 124
Henoch---Sch€onlein purpura 366
Hepatitis A 52, 237, 296---7, 308---9
Hepatitis B 52, 237, 296---7, 308---9
Hepatitis C 52, 237, 296---7, 308---9
Hepatocellular carcinoma (HCC) 53---4,
257, 292
Hereditary elliptocytosis 339---40
Hereditary haemorrhagic telangiectasia 127
Hereditary heamochromatosis 127, 355
Hereditary nonpolyposis colorectal
cancer 134---5
Hereditary papillary renal cancer 135
Hereditary pyropoikilocytosis 339---40
Hereditary spherocytosis 339
Hereditary stomatocytosis 340
Herpes simplex 295---6
Hirchsprung’s disease 124
HIV 292, 298---9, 306
Hodgkin lymphoma (HL) 376---7
Homocystinuria Type 1 127
Human Papilloma Virus (HPV) 133, 162
Huntingdon’s disease - AD 130
Hydatid disease 291, 160, 164---5
Hydrocephalus 81
Hydrops fatalis 292, 353
Hyper Ig E syndrome 327
Hyper IgM syndrome (HIGM) 327
Hyperadrenalism 235
Hyperbilirubinaemia 235
Hypercalcaemia 234
Hyperglycaemia 235
Hyperkalaemia 232---4
Hyperlipidaemia 156
Hypernatraemia 232---4
Hyperosmotic hyperglyceamic nonketotic
coma (HONK) 88
Hyperparathyroidism 83, 235, 239, 246
Appendix 409

Hyperplastic endometrium 154
Hyperprolactineamia 83, 245, 249
Hypertension 61, 73---4, 156
Hyperthyroidism 84
Hyperuricaemia 58
Hyper-vitaminosis D 245---6
Hypoalbuminemia 236
Hypocalcaemia 234
Hypogonadism 81---3
Hypokalaemia 232---4
Hyponatraemia 232---4
Hypoparathyroidism 83, 243
Hypophosphatemia 235
Hypopituitarism 81, 249
Hypoprolactinemia 245
Hypothyroidism 84---5, 235, 283, 292
Hypoxia 141, 151---2
Immune thrombocytopenia purpura (ITP) 367
Incontinentia pigmenti 129
Infarction 159---60
Infectious mononucleosis 361
Infective arthritis 57---8
Infective endocarditis 73
Inflammatory bowel disease (IBD) 48
Influenza 283, 292
Intersitial nephritis 61
Invasive aspergillosis 286
Ischaemia 70---2, 141, 159---60
Ischaemic heart disease 69, 70, 82, 155
Jaundice 52, 254
JCV - progressive multifocal
leucencephalopathy 292
Kallman’s syndrome 81, 249
Kaposi’s sarcoma 292, 295
Kearns---Sayre syndrome 119
Ketoacidosis 87---8
Klinefelter’s syndrome 117---18
Lactic adidosis 119, 120
Laron dwarfism 245
Leber’s hereditary optic neuropathy
(LHON) 119
Leigh syndrome 120
Leprosy 189
Leptospirosis/Weil’s disease 284
Leucocyte adhesion deficiency (LAD) 327
Leucocytosis 360
Leucopenia 359
Leukaemia 134, 373---6
Li Fraumeni syndrome 124, 134
Liver cirrhosis 53, 132, 238
Lung cancer 80, 293
Lyme’s disease 284
Lymphangitis 324
Lymphocytosis 361, 375
Lymphoma 376---8
Lymphopenia/Lymphocytopenia 359
Malaria 288---9
Malignant hyperthermia 124
Mallory---Weiss tears 46
Marfans syndrome 125
Measles 292
Melaena 4
Melanoma 134
MELAS (myopathy, mitochondrial-
encerphalopathy-lactic-acidosis-stroke) 119
Menigococcal arthritis 57
Meningiomas 134
Meningitis 283, 292
Menopause 82
Metastatic bone lesions 181---2, 241
Methaemoglobinaemia 351
Mitochondrial encephalomyopathy 119
Mitral regurgitation 72---3
Mitral stenosis 72---3
Molluscum contagiosum skin infection 292
Monocytosis 361
MRSA 261, 264, 268---9, 280, 300---2
Mucopolysaccharidosis Type 1 (Hurler’s
syndrome) 127
Multiple Endocrine neoplasia 125, 135
Multiple myeloma 62, 161---2, 234, 236
Multiple sclerosis 138, 322, 325
Mumps 292
Myasthaemia gravis 323
Mycobacterium tuberculosis 57, 79, 151,
162---3, 189---90
Myelodysplasia 372
Myelofibrosis 372
Myeloproliferative disorders 371---3
Myocardial infarction (MI) 70---1, 131, 149, 240
Myocarditis 292
Myoclonic epilepsy 119
Myopathies 200
Myotonic dystrophy 123, 130
Myotubular myopathy - X linked 129
NARP (neurogenic muscle weakness, ataxia
and retinitis pigmentosa) 120
410 Appendix

Nasopharyngeal cancer 293
Nephritic syndrome 60---1
Nephroblastoma 134
Nephrogenic diabetic insipidus 129
Nephrotic syndrome 60, 239
Neural tube defects 132
Neuroblastoma 134
Neurofibromatosis 125
Neutropenia 298---9, 304, 359---60
Neutrophilia 360, 375
Nieman---Pick disease 127
Oculocutaneous Albanism 127
Oedema 144
Oligomenorrhoea 82---3
Oliguria 62
Onychomycosis 287
Ophthalmoplegia 119---120
Oral facial digital syndrome type 1 129
Orf 292
Orthopnoea 120
Osteoarthritis 56---7
Osteomalacia 59, 235
Osteomyelitis 280
Osteoporosis 59
Ovarian cyst 160
Ovarian tumour 82, 134, 257
Paget’s disease 59
Pancreatic cancer 54---5, 240---1
Pancreatitis 54---5, 239---241
Parkinson’s disease 138
Patau syndrome 118
Patent ductus arteriosus (PDA) 68---9
Pearson’s syndrome 119
Pemphigus Vulgaris 96, 322
Penile cancer 162
Pericarditis 292, 325
Peritonitis 49---50
Periventricular heterotopia - X linked 129
Pernicious anaemia 325, 358
Peroxisome biogenesis disorders 127
Pertussis 308
Peutz-Jeghers syndrome 125
Phaeochromocytoma 134, 256
Pharyngitis 292
Phenylalanine hydroxylase deficiency
(Phenylketonuria-PKU) 127
Pick’s dementia 92
Pituitary adenoma 243---6
Pituitary tumours 243---6
Pleurisy 58
Pneumoconiosis 79---80
Pneumonia 78---9
Polio 292
Poliomyelitis 292
Polycystic kidney disease 61, 125
Polycystic ovary syndrome (PCOS) 82, 249
Polycythaemia 371---2
Polyps 49
Polyuria 59
Porphyria variegata 122
Prader---Willi syndrome (PWS) 131
Premature menopause 249
Premature ovarian aging 249
Primary biliary cirrhosis 325
Primary hypoadrenalism 85
Primary hypothyroidism 243
Progeria 105
Progressive external ophthalmoplegia
(PEO) 119---120
Prostate cancer 65
Proteinuria 59---60
Pseudogout - pyrophosphate arthropathy 58
Pseudohypoparathyroidism 83, 101
Psoriasis 58, 322, 360
Pulmonary embolism (PE) 75---6
Pulmonary oedema 72
Pyelonephritis 61
Pyloric stenosis 132
Pyruvate kinase deficiency (PK) 341
Rabies 293
Renal artery stenosis 237
Renal cell carcinoma 64
Renal disease 237
Renal stones 48, 61, 83
Respiratory tract infection 292
Retinal tumour 134
Retinitis pigementosa 125, 127, 129
Retinoblastoma 125
Rett Syndrome 129
Rhematoid arthritis (RA) 56---7
Rheumatic fever 72---3, 281
Rickets 130
Ringworm 286---7
River blindness 291
Robertsonian translocation 119
Rubella 293
Rubra vera 58, 371
Appendix 411

Salmonellae 276, 282
Sarcoidosis 150
Sarcoma 124
SARS 292, 296
Scalded skin syndrome 264
Schistosomiasis 291
Schizophrenia 132
Scleroderma 325
Secondary hypoadrenalism 85
Seminomatous germ cell tumour 257---8
Sepsis 62, 286, 299
Septic arthritis 57
Severe combined immunodeficiencies
(SCID) 327
Shigellae 264, 282
Shingles 292
SIADH (syndrome of inappropriate ADH
secretion) 234
Sickle cell anaemia 128
Soft tissue sarcoma 134
Spanish toxic oil syndrome 360
Spherocytosis 339
Staphylococcus aureus (MRSA) 261, 264,
268---9, 280, 300---2
Steatorrhoea 44, 47
Storage pool deficiency 368
Streptococci 281
Stress 244
Strongyloides 165
Swine flu 296
Swyer syndrome 249
Syphilis 263, 284
Systemic lupus erythematosus (SLE) 58
T3 Toxicosis 243
Tachycardia 69
Tay---Sachs disease 128
Testicular failure 249
Testicular germ cell tumour 258
Tetanus 308
Thalassaemia 351---3
Thrombocythaemia 372---3
Thrombocytopenia 366---7
Thromboembolism 159, 371
Thrombophilias 370
Thrombosis 157---9, 370---1
Thrombotic thrombocytopenia purpura
(TTP) 367
Thrush 164
Thyroid disease 243
Thyrotoxicosis 243
Tick fever 292
Tinea 286---7
Toxic shock syndrome 264, 280
Trichinosis 291
Triple X syndrome 118
Trophoblastic tumour 257---8
Tropical pulmonary esoinophilia 291
Tropical spastic paraparesis 292
TSH deficiency 243
Tuberculosis (TB) 57, 79, 151, 162---3, 189---90
Tuberculous arthritis 57
Tuberous sclerosis 125
Tubulointersitial nephritis 61
Turner’s syndrome 117---18, 249
Urinaty tract infection (UTI) 60
Urothelial tumour 64
Valvular heart disease 72---3
van Leiden disease 131
Vasculitis 58, 366
Venous infarction 160
Vernticular septal defect (VSD) 67
Vibrio cholerae 263
Vipoma 56
Viral haemorrhagic fever 293
Viral hepatitis 29
Vitamin K deficiency 238
Vitiligo 325
Von Hippel-Lindau syndrome 125
Von Willebrand’s disease 125, 146
Warts 162
Whooping cough 265
Wilms tumour 125
Wilson’s disease 128
Wiskott---Aldrich syndrome 327
Xeroderma pigmentosum 128
X-linked agammaglobinopathy (XLA) 129
X-linked severe combined immunodeficiency 129
Yellow fever 293
Yolk sac tumour 257---8
Zellweger’s syndrome and Refsum’s disease 91,
127
a1-antitrypsin deficiency 53, 132, 144
a-thalassaemia 128---9, 352---3
b-thalassaemia 128, 352---3
412 Appendix

Index
a1-antitrypsin 144
absorption processes 6---7, 19---20, 47
acid decalcification 181---2
acid reflux 44---5
acinetobacters 282---3
actin 26, 93---4
activated partial thromboplastin time (aPTT) 365
Addison’s disease 85, 244
adherent junctions 95---6
adrenal glands 243---4
adrenalins 39, 256
adrenocorticotrophic hormone (ACTH) 33, 85---6, 243---4
adult polycystic disease (APCD) 61---2
adverse drug reactions (ADR) 42---3, 393
age factors 155, 253---4, 299, 322---3
alanine transaminase (ALT) 51---3, 237
albumin 51, 219, 236, 238, 391
Alcian blue PAS (ABPAS) 187---8
alkaline phosphatases (ALP) 51, 219, 236, 237, 256---9
alpha thalassaemia 352---3
alphafetoprotein (AFP) 256---9
alternative complement pathway 380---81
alveoli 22---3
amenorrhoea 82---3
amplification techniques 193
amyloid/amyloidosis 160---2
anabolic endocrine cascade/axis 244---5
anaemia 353---9
analgesia 72, 149
anatomy and physiology
cardiovascular system 11---17
digestive system 6---11
endocrine system 31---3
nervous system 23---31
respiratory system 21---3
skeletal system 1---6
urinary system 17---21
aneurysms 74, 157
angina 70
angiogenesis 136, 151---2
angiotensin converting enzyme (ACE) inhibitors 40---1, 74
ankyrin 339
antacids 40---1
antenatal screens 296
antibiotics
classification 303---4
medical microbiology 262, 274, 299---301, 302---6
pharmacology 38, 42---3
principles of use 304
resistance mechanisms 305---6
antibodies
clinical chemistry 219---23, 256---8
clonality 191
haematology 356---7, 385---90
histopathology 192
immunohistochemistry 191---6
virology 296---7
anticoagulants 206---9
antifungal drugs 306
antigens
clinical chemistry 220---1, 256---8
clinical immunology 319---21, 324---5
haematology 382---3, 385---8
retrieval 193---5
antiglobulin tests 388---9
antimicrobial agents 302---7
antiretroviral compounds 306
antisera 220
antithrombin 365
antiviral drugs 306---7
aorta 12, 17, 73
apolipoproteins 238---40
apoptosis 101---3, 142---3
appendicitis 49---50
arachidonic acid 147---8
arrhythmias 69
arteries 13, 15, 74---6, 160, 253---4, 370---1
arterioles 13, 16---17, 18
arthritis 56---8
asbestos exposure 79---80
aspartate transaminase (AST) 51---3, 237
aspirin 72, 149
Biomedical Sciences: Essential Laboratory Medicine, First Edition. Edited by Ray K. Iles and Suzanne M. Docherty.� 2012 John Wiley & Sons, Ltd. Published 2012 by John Wiley & Sons, Ltd.
413

asthma 76---7
atherosclerosis 155---9
atria 12---13, 17, 68
autoanalysers 210---11
autoclaves 276---7
autoimmune diseases 60---1, 321---22, 324---5
autonomic nervous system (ANS) 13, 24, 26
autosomal disorders 118, 122---5, 126---8
avidin-biotin complex (ABC) method 193---5
azoles 307
B-cells 313, 377
bacteria
cell structure, growth and division 277---80
cellular pathology 162---3
differentiation and identification 280---4
environmental growth requirements 277---8
medical microbiology 261---3, 270---3, 277---84, 303---6
sensitivity testing 270---3
barium swallows 45
Barrett’s oesophagus 44---5
Barts Hydrops fetalis 353
basophils 317, 331
BCG dye binding method 219
benign prostatic hypertrophy 64---5
beta blockers 39---40, 74
beta lactamase 272, 306
beta lactams 303
bile 9---10, 11, 54, 237---8, 272
biliary tract 51---2, 54---6
bilirubin 9, 51---2, 54, 219, 235, 254
biochemical tests 271---3
biomarkers 254---8
biopsies 44---5, 47, 166, 178, 336, 377---8
bladder 17, 19, 64
blind spots 28---9
blood 13, 15---17
cellular pathology 143---4, 155, 159---60
film 335, 347---8, 356, 374, 376
gases 253---4
groups 369, 380---8, 390
pressure 17, 19, 65, 250
products 390---3
samples 205---9, 265---6, 269---70
tests 332---6, 365---6
transfusions 380---90, 391---2
blood urea nitrogen (BUN) 236---7
bone 1---2, 4---6, 59, 241---2
bone marrow 57, 336, 366---7, 371, 378, 393---5
bovine spongiform encephalopathy (BSE) 297---8
Bowman’s capsule 18---20
bradycardia 69
brain 23---5
bronchitis 77---8
c-peptide 235, 240---1
cadherins 96
calcitonin 5, 245---6
calcium 98, 99, 218---19, 234
calcium channel blockers 74
cancer biomarkers 254---8
Candida spp. 163---4, 286
capillaries 18
capillary electrophoresis 226---9
capping 110---11
carbapenems 303, 306
carbohydrate antigens 385, 386---8
carbon dioxide transport 344---5
carbon requirements 277---8
carcinogens 175
carcinoid tumours 47
carcinoma in situ 167---8
cardiovascular system 11---17
arrhythmias 69
arterial and venous disease 74---6
heart 11---15, 69---72
hypertension 73---4
ischaemia 70---2, 141, 159---60
pathophysiology 65---76
pregnancy 250
symptoms and investigation 65---6
valvular heart disease 72---3
cartilage 2, 4
catalases 272---3
CD4 cells 313, 315---16
cell adhesion molecules 95, 96---7
cell cycle 101---3, 132---6, 172---3
cell division 174
cell membranes 89---90, 97, 140, 337---40
cell structure 89---92
bacteria 279---80
fungi 284---5
haematology 337---8
protozoa 288
viruses 290, 293---4
cellular pathology 139---204
amyloid and amyloidosis 160---2
apoptosis and necrosis 142---3
atherosclerosis 155---9
clinical application and laboratory techniques 175---203
cytopathology 196---7
electron microscopy 197---201
fixation 178---80, 201
frozen section 190---1
healing and repair 151---4
hyperplasia and hypertrophy 154---5
immunohistochemistry 191---6
in situ hybridization 201---3
infections 141, 162---5, 179
414 Index

inflammation 143---51, 156---7
ischaemia and infarction 159---60
malignancies 152, 165---75
microtomy 184---5, 200
normal structure and function 139---41
processing and embedding 182---4
responses to injury 141---51
sampling modalities 175---8
specimen dissection 180---2
staining methods and procedures 186---90, 192---5
thrombosis and embolism 157---9
tissues and organs 140---1, 143---51
central nervous system (CNS) 23---4
centrifugation 197, 206
cephalosporins 303
cervical metaplasia 166
cervical screening 167, 169, 176
chelating solutions 181
chemotaxis 147---9
chemotherapy 42, 55---6, 298, 304
cholestasis 237---8
cholesterol 54, 238---9
chromagens 193
chromatin 106---7, 113---16, 133
chromosomes
cellular pathology 202---3
disorders 117---19
human 103---6
mitochondrial 105, 131---2
Philadelphia chromosome 202---3, 375
sex chromosomes 104, 117---18, 122, 129---31
chronic granulomatous disorder (CGD) 298
classical complement pathway 379---80
clearing agents 183
clinical cell biology 89---103
cell adhesion molecules 95, 96---7
cell cycle and apoptosis 101---3, 172---3
cell structures, organelles and function 89---92
dynamic nature of cells 92---4
intercellular connections 94---6
neoplasia 172---4
receptors 97---9
secondary messenger proteins 97---8, 99---101
clinical chemistry 205---58
age factors 253---4
analytical methods 205---33
bone disease assessments 241---2
cancer biomarkers 254---8
clinical assessments 232---58
colorimetric assays 213---19, 233
electrophoresis 222---9
endocrinological assessments 241---8
flame photometry 211---13, 233
heart disease and lipid disorder tests 238---40
high performance liquid chromatography 226---9, 229
immunoassays 219---22
laboratory techniques and equipment 210---31
liver function tests 237---8
mass spectrometry 229---31
metabolism and gastrointestinal markers 219, 234---6,
254
pancreatic function tests 240---1
pregnancy 249---51
renal function tests 236---7
sample collection 205---10
therapeutic drug monitoring and toxicology 251---3
urea and electrolytes 232---4
clinical immunology 311---28
age and immunocompetency 322---3
autoimmunity 321---2, 324---5
cellular pathology 141
hypersensitivities 326
immune response 316---21
immune system 311---16
immunodeficiency 326---7
inflammation and chronic infection 323---5
laboratory investigations and assessments 323---7
MHC genotyping, autoimmunity and
susceptibility 321---2
transplant rejection 325---6
clinical wastes 277
clonality 191
Clostridium spp. 261, 264, 280---1, 301---302, 304
clotting cascade/factors 146, 206---9, 332, 363---71, 391
coagulases 273
cocaine 229, 230
coeliac disease 47
coliforms 282
collagens 152---3
colon pathophysiology 48---50
colorectal cancer 49---50
colorimetric assays 213---19, 233
commensals 262---3
complement 146, 378---81
computed tomography (CT) 45, 55
confounding factors 36
Congo red 189
continual professional development (CPD) 398, 401---406
Control of Substances Hazardous to Health
(COSHH) 274---5, 403
control tissues 190, 195
Coombs tests 388---9
copy errors 175
copy number 201---3
coronary angiography 66---7
corpus callosum 24
corticospinal tracts 24---5
cortisol 244
Index 415

creatine kinase (CK) 71, 240
creatinine 219, 235, 236---7, 254
Creutzfeld---Jakob disease (CJD) 297---8
Crohn’s disease 48
cryoprecipitate 391
cryotomy 190---1
culture media 267---9
curettage 177---8
Cushing’s syndrome 85---6, 244
cyclic AMP (cAMP) 98, 99
cyclin/cyclin dependent kinase (Cyc/Cdk) 101, 173
cystic fibrosis (CF) 78
cystic renal disease 61---2
cytomegalovirus (CMV) 296, 395
cytopathology 196---7
cytoplasm 90, 99, 279
cytoskeleton 90, 92---4, 140
cytospins 197
decalcification 181---2
deep vein thrombosis (DVT) 74---5, 158---9, 370
dehydrating agents 183
deletions 117, 120---1, 352
dendritic cells 319---20
developmental disease 66---9
diabetes insipidus 86, 244
diabetes mellitus 86---8, 156
diacetyl monoxime method 213---15
dialysis 62---4
3-30diaminobenzidine (DAB) 193
diaphragm 17, 21
diastases 187
dietary factors 153, 232
differentiation 170---1
digestive system 6---11
dipstick testing 59---60
direct antiglobulin test (DAT) 388---9
direct smears 197
disease susceptibility 321---2
disease transmission 263---5
dissection of specimens 180---2
disseminated intravascular coagulation (DIC) 369---70,
391
diuretics 74
diverticular disease 48
DNA analysis 348---9
DNA structure/replication 105---9
DNAase 273
double blind trials 37
double Y syndrome 118
drug monitoring 251---3
Duffy system 386
duodenum 9
duplications 117
dysphagia 44---5
dysplasia 166---8
ears 30
echinocandins 307
echocardiography (ECG) 65---6, 69---71
eicosanoids 147---8
electrolytes 232---4, 253---4
electron microscopy (EM) 197---201, 296
electrophoresis 222---9, 348, 350
electrospray Ionization (EI) 229, 230---1
elliptocytosis 339---40
embden---meyerhof pathway 340---1
embedding tissue samples 183---4, 201
embolism 157---9
emphysema 77---8
endocrine system 31---3
bone growth 5---6
clinical chemistry 241---8
pathophysiology 56, 80---8
symptoms and investigation of disease 81
endoplasmic reticulum (ER) 90, 140
endoscopy 45---6, 51, 55---6
endotoxins 263---4
enzyme immunoassays (EIA/ELISA) 220---2
enzyme-linked receptors 98---9
enzymes
clinical chemistry 213, 216---18, 219
medical microbiology 272---3
pharmacology 38, 40---1
of replication 107---9
eosinophils 317, 331, 360---1
epidemiology 35---8
epigenetics 133---5
epiphyseal plates 4---5
Epsilometer tests (E-tests) 272
Epstein---Barr virus (EBV) 376
erythrocyte sedimentation rate (ESR) 335---6
ethics 399, 403
ethylene diaminetetraacetic acid (EDTA) 206---9, 216
euchromatin 114---16
eukaryotic cells 261---2
exfoliative cytology 176
exocrine glands 7---8
exotoxins 263---4
expiratory reserve volume (ERV) 22
extended spectrum beta lactamase (ESBL) 305---6
externally secreted bodily fluids 175---6
extracellular matrix (ECM) 152
extrinsic signalling 102---3
eyes 27---30
faeces samples 296
fermentation 272
416 Index

fetal circulation 66---7
feto-maternal haemorrhage (FMH) 390
fibrinogen 363, 391
fibrinolysis 365
fibroblasts 152---3
fine needle aspiration 177
Fisher’s model 383---4
fixation 178---80, 201
flame photometry 211---13, 233
flow cytometry 374
fluorescence techniques 201---2, 267, 274, 373---4
fluoride oxalate 206---9
folic acid/folate 303, 358---9
fragile X syndrome 118, 130
fresh frozen plasma (FFP) 391
frozen section 190---1
full blood count (FBC) 332---3, 347---8, 354
functional residual capacity (FRC) 22
fungi
cell structure 284---5
cellular pathology 163---4
differentiation and identification 285---8
medical microbiology 262, 284---8, 307
G-protein linked receptors 98
gamma-glutamyl transpeptidase (GGT) 51, 237---8
gall bladder 9---10
gallstones 54
gap junctions 95---6
gastroenterology 8, 44---50
gastrointestinal (GI) tract 44, 46, 219, 234---6
gel electrophoresis 222---6
gender factors 155
gene chips 137
gene sequence mapping 104---5
genetics 103---38
cell cycle control oncogenes and tumour
suppressors 132---6
chromatin and regulation of gene expression 113---16
chromosomal disorders 117---19
DNA replication 107---9
gene defects 119---21
haematology 345---53, 382---4
human chromosomes 103---6
human genetic disorders 116---36
imprinting 131
in situ hybridization 201---3
mitochondrial disease 131
molecular cell biology 136---8
multifactorial and polygenic inheritance 131---2
neoplasia 174---5
nucleic acids 105---7
posttranscriptional modifications 110---12
single-gene disease 122---31
techniques 136---8
transcription 109---10
translation 111, 112---13
triple repeat mutations 131
genomics 137
genotyping 321---2
gentamicin 42---3, 251
geriatrics 253---4
germ tube tests 286
gestational trophoblastic disease (GTD) 258
Giardia spp. 164, 289
giesma technique 197---8
Gilbert syndrome 238
glandular fever 361
globin genes 345---6, 348---9
glomerular filtration rate (GFR) 19, 62, 236---7
glomerulus 18---20, 60---1, 200
glucose 86---8, 213---14, 216---18, 235, 254
glucose oxidase (GOD) method 213---14,
216---18
glucose-(6)-phosphate dehydrogenase deficiency
(G6PDD) 342
glyceryl trinitrate (GTN) 70---2
glycocalyx 338
glycolysis 340---2
glycopeptides 303
glycophorins 338
Golgi apparatus 90---1
gonorrhoea 57
gout 58, 197
grading of tumours 171
graft versus host disease (GvHD) 393---5
gram-negative cocci 283
granulomata/granulation tissue 150---2
growth factors 136, 151---2, 174, 337
gynaecomastia 82
haematocrit 334
haematology 329---95
anaemia 353---9
benign white blood cell disorders 359---61
blood components 329---32
blood products 390---3
blood transfusions 380---90, 391---2
clinical chemistry 206
coagulation disorders 366---71
complement 378---80
haemoglobin 342---53
haemopoiesis 336---7, 393---5
haemostasis 157---8, 159, 361---5
malignancies 373---8
myeloproliferative disorders 371---3
pregnancy 250
RBC structure, disorders and metabolism 337---42
Index 417
haematology (Continued )
routine laboratory blood tests 332---6, 365---6
stem cell transplantation 393---5
haematuria 59---60
haemochromatosis 355---6
haemodialysis 62---4
haemoglobin (Hb) 22---3, 333---5, 342---53
anaemia 353---9
clinical chemistry 223---4
disorders 346---53
function 343---4
globin genes 345---6, 348---9
oxygen/ carbon dioxide exchange 22---3, 344---5
synthesis 343---4
haemolytic disease of the newborn (HDNB) 387---90
haemophilia 368---9
Haemophilus influenzae 283, 299
haemopoiesis 336---7, 393---5
haemorrhoids 46
haemostasis 157---8, 159, 361---6
hairy cell leukaemia (HCL) 376
Health Professions Council (HPC) 397, 398---406
healthcare associated infections (HCAI) 299---302,
308
hearing 30
heart 11---15, 69---70, 238---40
heart valves 72
Helicobacter pylori 45---6, 163, 283
helminths 164---5, 261---2, 290---1
Henoch---Sch€onlein purpura 366
heparin 206---9, 367
hepatitis 52, 237, 296---7, 308---9
hepatocellular carcinoma (HCC) 53---4
hepatocyte necrosis 237
hereditary disorders 135, 155, 339---40, 355, 368---9
herpes simplex virus (HSV) 295---6
heterochromatin 114---16
high-density lipoprotein (HDL) 238---9
high performance liquid chromatography (HPLC) 226---9,
231, 348---50
histocompatibility 319---22, 325---6, 393---4
histone acetyltransferase (HAT) 114---15
histone protein 3 (H3) 135
histopathology 192
HIV/AIDS 298---9, 306
Hodgkin’s lymphoma (HL) 376---7
hormones 5---6
cellular pathology 154
clinical chemistry 234, 243---9, 256
pathophysiology 81---6
production and functions 31---3
horseradish peroxidase (HRP) 193
host---parasite relationship 262---3, 284---5
human chorionic gonadotrophin (hCG) 249, 256---9
human epidermal growth factor receptor 2 (Her2) 174,
192, 202---3
human leucocyte antigens (HLA) 319---22, 325---6, 393---4
human papillomavirus (HPV) 133, 162
hydatid disease 164---5
hyper/hypoparathyroidism 83
hyper/hypothyroidism 84---5
hyperlipidaemia 156
hypermethylation 134
hyperosmotic hyperglycaemic nonketotic coma
(HONK) 88
hyperplasia 154
hyperprolactinaemia 83
hypersensitivities 326
hypertension 61, 73---4, 156
hypertrophy 155
hypogonadism 81---3
hypopituitarism 81
hypothalamic---pituitary---adrenal (HPA) axis 243---4
hypothalamus 32---3, 81, 243---4
hypoxia 141, 151---2
immortality 104---5
immune thrombocytopenia purpura (ITP) 367
immunization see vaccines
immunocompetency 322---3
immunodeficiency 298---9, 326---7
immunofluorescence 195---6
immunoglobulins 96, 196, 307---8, 313---14, 387---8, 391
immunohistochemistry 191---6
imprinting 131
in situ hybridization (ISH) 201---3
india ink testing 286---7
indirect antiglobulin test (IAT) 388---9
infarction 159---60
Infection Prevention and Control Team (IPCT) 301---2
infections
cellular pathology 141, 162---5, 179
clinical immunology 323---4
disease transmission 263---5
haematology 392
healthcare associated 299---302
host---parasite relationship 262---3
immunodeficiency 298---9
laboratory investigations 265---77, 294---7
pathophysiology 60, 78---9
virology 294---7
see also individual pathogen type; medical microbiology
infectious mononucleosis 361
infective arthritis 57---8
infective endocarditis 73
inflammation
acute 143---9
cellular responses 144---5
418 Index

chemotaxis 147---9
chronic 149---51, 156---7
clinical immunology 323---5
macrophages 150---1, 156---7
mechanisms 145---7
systemic effects 149
vascular responses 143---4, 146---8
inflammatory bowel disease (IBD) 48
influenza testing 296
ingestion 7---8
inhalers 77---8
innate immune system 316---19
inositol 1,4,5-triphosphate/diacylglycerol (IP3/DAG) 98,
99
insertions 121
inspiratory capacity (IC) 22
Institute of Biomedical Science (IBMS) 397---8, 404---5
insulator sequences 109---10
insulin 5, 86---8, 235, 240---1, 254
insulin-like growth factor-1 (IGF-1) 244---5
integrins 96
intercellular connections 94---6
interferons 307
intermediate filaments 93
international normalized ratio (INR) 365---6, 371
intracellular transport 90---1
intrinsic signalling 102---3
invasion 169---70
inversions 117
ion traps 231
iron deficiency 354---6
irreversible cellular damage 141---2
ischaemia 70---2, 141, 159---60
isoelectric focusing 223, 225
jaundice 52, 254
jejunum 9, 47
Kell system 385
keratins 182---3, 192
ketoacidosis 87---8
Kidd system 386
kidney stones 18, 61
kidneys 17---21
function tests/screens 236---7, 254, 397
pathophysiology 60---4
pregnancy 250
Kleihauer test 390
Klinefelter’s syndrome 117---18
koilocytes 163
labelling regimes 210
large intestine 11---12
latency 294
leucocytosis 360
leucopenia 359
leukaemias 373---6
Lewis system 386
light microscopy 197---8, 267, 269---70, 335
lipid disorder tests 238---40
lipopeptides 303
liver 9---10
function tests 51, 237---8
haematology 370
pathophysiology 50---4
low-density lipoproteins (LDL) 156---7, 238---9
lungs 21---2, 80
Lutheran system 386
lymph nodes 312---13
lymphatic system 311---13
lymphocytes 142, 150, 330, 361
lymphomas 376---8
lymphopenia 359
lysosomes 91
macrolides 303
macrophages 150---1, 156---7
magnetic resonance imaging (MRI) 45
major histocompatibility complex (MHC) 319---22,
325---6, 393---4
malabsorption 47
malaria 288---9
malignancies
cellular pathology 152, 165---75, 192, 201
clinical chemistry 254---8
endocrine system 81
gastroenterology 44---5, 46---7, 49
genetics 132---6
haematology 373---8
immunohistochemistry 192
liver, biliary tract and pancreatic disease 53---4, 55---6
respiratory system 80
urinary tract 64---5
virology 295
mass spectrometry (MS) 229---33
mast cells 317
matrix assisted laser desorption ionization (MALDI) 229,
230---1
mean cell volume (MCV) 334, 353---4, 356---7
mean corpuscular haemoglobin (MCH/MCHC) 334
medical devices 299---300
Medical Laboratory Scientific Officers (MLSO) 397
medical microbiology 261---309
antimicrobial agents 302---7
antiobiotic assays 274
bacteria 261---63, 270---3, 277---84
biochemical tests 271---3
enumeration techniques 269---70
Index 419

medical microbiology (Continued )
fungi 262, 284---8
healthcare associated infections 299---302, 308
immunodeficiency 298---9
laboratory investigations 265---77
microorganisms 261---65
molecular methods 273---4
notifiable diseases 275---6
parasitology 261---3, 288---90
prions 297---8
processing techniques 267---9
safe working practice 274---5, 298, 299---302
sample collection and handling 265---9
serological tests 274, 294---5
viruses 261---2, 290---7
waste treatment 276---7
membrane attack complex (MAC) 380
meningococcal septicaemia 57
menopause 82
menstrual cycle 246---9
messenger RNA (mRNA) 110---13
metabolism 219, 234---6, 250, 254, 278---9, 340---2
metabolomics 138
metaphase chromosomes 106
metaplasia 165---6, 168
metastasis 169
methaemoglobins 351
methenamine silver technique (MST) 189
methylation of DNA 133---5
meticillin-resistant Staphylococcus aureus (MRSA) 261,
264, 268---9, 280, 300---2
microarrays 137
microfilaments 93---4
microorganisms 261---5
microsatellite instability 135---6
microtomy 184---5, 200
microtubules 92---4
minerals 6---7
minimum inhibitory concentration (MIC) 270---1
mitochondria 91---2, 131, 139---40
mitochondrial chromosome 105, 119---20, 131---2
mitral regurgitation/stenosis 72---3
MNSs system 385---6
molecular cell biology 136---8
monoclonal antibodies 136, 191, 220, 257---60
monocytes 330---1, 361
mucosal linings 8, 11
multifactorial inheritance 131---2
multiresistant Acinetobacter (MRAB) 300, 306
muscular action 26---7, 155
myelin 24
myelodysplasia 372
myelofibrosis 372
myeloma 378
myeloproliferative disorders 371---3
myocardial infarction (MI) 70---1, 149, 240
myoglobulin 71
myopathies 200
myosin 26, 93
nasopharyngeal aspirates 295---6
necrosis 142
Neisseria spp. 283, 299
neonates 253---4, 322, 387---9
neoplasia 168---75
benign and malignant forms 168---9
cellular biology 172---4
genetics 174---5
invasion 169---70
metastasis 169
nomenclature 170---2
nephron 18---21
nervous system 23---31, 39---40
autonomic nervous system 13, 24, 26
central nervous system 23---4
peripheral nervous system 24---7
senses 27---31
neuraminidase inhibitors 306---7
neuroendocrine system 32---3
neurotransmitters 24---5
neutropenia 298---9, 304, 359---60
neutrophils 144---5, 148---50, 317, 330, 360, 380
nondisjunction 117
nonHodgkin lymphoma (NHL) 377---8
nonspecific drug actions 38, 42
nonsteroidal anti-inflammatory drugs (NSAID) 40---1,
45, 149
norovirus screens 296
nose 31
notifiable diseases 275---6
nucleic acids 105---7, 273---4, 294---5
nucleoside analogues 306
nucleus 90, 139, 279---80
nutrients/nutrition 5---7, 19---20
obligate pathogens 263, 278
oesophageal metaplasia 165---6
oesophagus 7---8, 11, 44---5
oestrogens 154, 246---8
oncofetal antigens 256---9
oncogenes 132---6
opportunist pathogens 263
optic nerves 27---30
oral cavity 7---8
organelles 89---92, 140
organization 159
osteoarthritis 56---7
osteoblasts/osteoclasts 3---6, 241
420 Index

osteogenic zone 5
osteomalacia 59
osteons 4, 6
osteoporosis 59
oxazolidinones 303
oxidases 273
oxidation processes 279
oxygen requirements 278
oxygen---carbon dioxide exchange 22---3, 343---5
oxytocin 32---3, 81
P system 387
p53 132---3, 173
pacemakers 69
paediatrics 253---4, 322---3
Paget’s disease 59
pain 149
pancreas 10, 51---2, 54---6, 240---1
paracetamol 251---3
paralysis 149
parasitology 164---5, 261---3, 288---90
parasympathetic nervous system 26, 40
paroxysmal nocturnal haemoglobinuria 380
patent ductus arteriosus (PDA) 68---9
pathogen associated molecular pattern (PAMP) 319
pathogenicity 262---3, 275---6
pathophysiology 35---88
cardiovascular disease 65---76
endocrine disease 80---8
epidemiology 35---8
gastroenterology 44---50
liver, biliary tract and pancreatic disease 50---6
pharmacology 38---43
receptors 101
respiratory disease 76---80
rheumatology 56---9
urinary tract disease 59---65
peak flow measurements 76---7
penicillins 303
Penicillium spp. 287, 302
pentose phosphate pathway 341---2
periosteum 4, 6
peripheral blood stem cell (PBSC) 394---5
peripheral nervous system (PNS) 24---7
peripheral resistance (PR) 16---17
peristalsis 11
peritoneal dialysis 62---4
peritonitis 49---50
peroxidases 216---18, 239
peroxisomes 91
personal protective equipment (PPE) 180
pharmacology 38---43
adverse drug reactions 42---3
antibiotics 38, 42---3
enzyme inhibition 38, 40---1
mechanisms of drug action 38---42
nonspecific drug actions 38, 42
receptors 38---40
transport within cells 38, 41---2
pharynx 7---8
phase contrast microscopy 267
Philadelphia chromosome 202---3, 375
phosphate analysis 219, 235---6
pituitary glands 32, 81, 243---4, 246---9
pituitary---gonadol axis 246---9
placental alkaline phosphatase (PLAP) 256---10
plaque rupture 157
plasma 332, 336, 391
platelets
cellular pathology 146---7, 149, 158
concentrates 391
disorders/function disorders 367---8
haemotology 331---2, 335, 362---3, 366---8
pneumoconiosis 79---80
pneumonia 78---9
Point of Care Testing (POCT) 401
point mutations 121
polyadenylation 111---12
polyclonal antisera 220
polycythaemia 371---2
polyenes 307
polygenic inheritance 131---2
polymerase chain reaction (PCR) 136---7, 273---4
polymerases 107---9
polynucleotide chains 106
polyps 49
posttranscriptional modifications 110---12
potassium analysis 232---4
Prader---Willi syndrome (PWS) 131
pregnancy 249---53, 322---3, 387---9
prevalence 36
prions 297---8
processing tissue samples 182---3
professional practice 397---406
change in wider healthcare setting 405---6
conduct, performance and ethics 399, 403
continual professional development 398, 401---6
critical reflection 404
expectations of health professionals 400---1
Health Professions Council 397, 398---405
Institute of Biomedical Science 397---8, 404---6
professional relationships 401
skills, knowledge and understanding 401---3, 404---5
standards of proficiency 399---400
proinsulin 241
prokaryotic cells 261---2
prolactin 245
proopiomelanocortin (POMC) 243---4
Index 421

propeptides 241---2
prostate gland 64---5
protein antigens 385---6
protein electrophoresis 223---4
proteins
clinical cell biology 99---100
clinical chemistry 219, 223---4, 227, 236
genetics 113
haematology 338---9, 364---5
urinary system 19
proteinuria 59---60
proteomics 138
proteosomes 92---3
prothrombin 131---2
prothrombin time (PT) 238, 365
protozoa 164, 261---2, 288---9
pseudogout 58
Pseudomonas spp. 282---3, 301
pulmonary embolisms (PE) 75---6
pulmonary system 11---13
pyloric sphincter 8, 9
pyrimidine analogues 307
pyrophosphate arthropathy 58
pyropoikilocytosis 339---40
pyruvate kinase (PK) 341
quadrupole mass analyzers 231
quality control (QC) testing 213, 215, 217---18
quinolines 303
radiotherapy 55---6
randomized controlled trials (RCT) 37
recall bias 36
receptors 38---40, 97---101
rectum 11---12
red blood cells (RBC) 329---30, 333---5, 337---42
red cell concentrates 390
registrants 403
regulation of gene expression 113---16
remodelling 152---3
renin-angiotensin system 19
replication fork 107---9
reproductive endocrinology 246---9
residual volume (RV) 22
resistance mechanisms 305---6
respiratory syncytial virus (RSV) 295---6
respiratory system 21---3
lung function measures 22
oxygen---carbon dioxide exchange 22---3
pathophysiology 76---80
pregnancy 250
respiration 22
symptoms and investigation of disease 76
reticulocytes 334
reverse phase HPLC 229
reversible cellular damage 141---2
Rhesus system 382---4, 387---8
rheumatoid arthritis (RA) 56---7
rheumatology 56---9
RNA polymerases 109---10
RNA structure 105---7
Robertsonian translocations 119
Romanowski technique 197---8
safe working practice 274---5, 298, 299---302
salbutamol 39
saliva 175---6
salmeterol 77---8
sampling modalities 175---8, 205---10, 265---6
scurvy 153
secondary hypoadrenalism 85
secondary messenger proteins 97---8, 99---101
selectins 97
senses 27---31
Serious Adverse Blood Reactions and Events (SABRE) 393
Serious Hazards of Transfusion (SHOT) 393
serological tests 274, 294---5
serous cavity aspiration 176---7
serum 51, 161, 332
sex chromosomes 104, 117---18, 122, 129---31
sex-limited inheritance 131
sharps bins 277
single-gene disease 122---31
sinoatrial (SA) nodes 13
skeletal system 1---6
bone structure and growth 1---2, 4---6
cellular pathology 200
endocrine regulation and nutritional requirements 5---6
mineral storage 6
osteocytes 3---6
pathophysiology 56---9
small intestine 9---11, 47
smoking 156
sodium analysis 232---4
sodium citrate 206---9
sodium dodecyl sulphate polyacrylamide gel electrophoresis
(SDS PAGE) 225---6, 227
somatotrophin---somatomedin system 244---5
Southern hybridization/blotting 136
specimen collection 265
specimen dissection 180---2
spectrin 339
spermatogenesis 248---9
spherocytosis 339
spider naevi 53
spinal cord/nerves 23---5, 27---8
spirochaetes 284
spirometry 76---7
422 Index

splenectomies 299
splenomegaly 367
splicing 111---12, 121
sputum 176
squamous cell carcinoma 169---70
staging of tumours 171---2
staining methods and procedures 186---90, 192---5,
197---8, 272---3
standard operating procedures (SOP)
colorimetric assays 214---18
flame photometry 212---13
medical microbiology 275
professional practice 401
stannous chloride reduction method 219
Staphylococcus spp. 57---8, 273, 280
stem cell transplantation 393---5
Stokes’ controlled sensitivity testing 270
stomach 8---9, 45---7
stomatocytosis 340
Streptococcus spp. 263---4, 268, 272---3, 275, 281, 285, 299
streptogramins 303
streptokinase 264
stress 244
stroke 149, 159
subacute bacterial endocarditis (SBE) 73
supercoiling of DNA 106
surgical wounds 299
sympathetic nervous system 26, 39---40
systemic cardiovascular system 11, 13, 17
systemic lupus erythematosus (SLE) 58
T-cells 313, 315---16, 324, 377
tachycardia 69
telangiectasia 366
telomeres 104---5
telopeptides 241---2
temperature requirements 278
termination mutations 121
tetracyclines 303
thalassaemias 351---53
therapeutic indexes 42---3
thrombocythaemia 372---3
thrombocytopenia 366---7
thrombocytosis 368
thromboembolisms 159, 371
thrombophilias 370
thrombosis 157---9, 370---1
thrombotic thrombocytopenia purpura (TTP) 367
tidal volume (TV) 22
tight junctions 94---5
time of flight (ToF) mass analyzers 231
TNM staging 172
tongue 31
total lung capacity (TLC) 22
total proteins 219, 236
toxicity indexes 42---3
toxicology 251---3
transaminases 219, 236
transcription 109---10, 294
transformation 5, 294
translation 111, 112---13
translocations 117---20, 203
transmissible spongiform encephalopathies (TSE) 297---8
transplantation 62---4, 325---6, 393---5
transport within cells 38, 41---2
tributyrin testing 273
triglycerides 238---40
triple X syndrome 118
trisomy disorders 117---18, 130---1
troponin 71
tuberculosis (TB) 57, 79, 151, 162---3,
189---90
tubular secretion 20---1
tubulointerstitial nephritis 61
tumour suppressors 132---6
Turner’s syndrome 117---18
ulcerative colitis 48
ulcers 46, 150, 163
ultrasound 51, 55, 251
unstable haemoglobins 351
urea 213---15, 232---4
urease testing 273
ureters/urethra 17---18
uric acid 58
urinary system 17---21
glomerular filtration rate 19
kidneys 17---21
nephron 18---21
pathophysiology 59---65
reabsorption of nutrients 19---20
symptoms and investigation of disease 59---60
tubular secretion 20---1
urinary tract infections (UTI) 60
urine samples 205, 206, 210, 265, 269
urothelial tumours 64
vaccines 297, 307---9
valvular heart disease 72---3
vancomycin resistant enterococci (VRE) 300, 305
vanomycin 303
varicella zoster virus (VZV) 295---6, 307
vasculature 13---15
cellular pathology 143---4, 146---8, 159---60
haematology 366
pathophysiology 74---6
vasopressin 243---4
veins 13---15, 74---6, 160
Index 423

ventilation-perfusion (V/Q) scans 76
ventricles 12---13, 67---8
venules 13---14, 16
villi cells 11
virulence 263
viruses
activation of tumour suppressors 133
cell structure 290, 293---4
cellular pathology 162
laboratory investigations 294---7
medical microbiology 261---2, 290---7, 306---7
medically important 292---3
replication 294
visual inspections 267
vital capacity (VC) 22
vitamins 6---7, 153, 357---8, 370
von Willebrand factor (vWF) 362---4, 369, 391
vulnerability to cellular damage 141
waste treatment 276---7
wet preparation 197
white blood cells (WBC) 329---31, 335, 359
X-radiography 65, 67---9
yeasts 261---2, 286
zonal electrophoresis 224---5, 239
424 Index