Microscopic theory of thermodynamic properties of finite nuclei
12
arXiv:1008.2486v1 [cond-mat.str-el] 15 Aug 2010 Microscopic Theory of the Thermodynamic Properties of Sr 3 Ru 2 O 7 Wei-Cheng Lee 1, ∗ and Congjun Wu 1, † 1 Department of Physics, University of California, San Diego, California, 92093, USA (Dated: August 17, 2010) The thermodynamic properties of the bilayer Sr3Ru2O7 at very low temperatures are investigated by a realistic tight-binding model with the on-site interactions treated at the mean-field level. Due to the strong spin-orbit coupling, the band structure undergoes a significant change in Fermi surface topology as the external magnetic field is applied, invalidating the rigid band picture in which the Zeeman energy only causes chemical potential shifts. In addition, since Sr3Ru2O7 is a t2g active system with unquenched orbital moments, the orbital Zeeman energy is not negligible and plays an important role in the phase diagram on the magnetic field orientation. We find that both the total density of states at the Fermi energy and the entropy exhibit a sudden increase near the critical magnetic field for the nematic phase, echoing the experimental findings. Our results suggest that extra cares are necessary to isolate the contributions due to the quantum criticality from the band structure singularity in this particular material. The effects of quantum critical fluctuations are briefly discussed. PACS numbers: 72.80.Ga,73.20.-r,71.10.Fd I. INTRODUCTION Recently, a great deal of attention has been paid to the bilayer ruthenate compound Sr 3 Ru 2 O 7 with various interesting physical properties. It was first considered as a field-tuned quantum critical state having metamag- netic transitions around 8 Tesla 1–3 . Later, in the ultra- pure single crystal it has been found that the meta- magnetic quantum critical point is intervened by the emergence of an unconventional anisotropic (nematic) electronic state 4,5 , stimulating considerable theoretical efforts 6–18 . Sr 3 Ru 2 O 7 is a metallic itinerant system with the active t 2g -orbitals of the Ru sites in the bilayer RuO 2 (ab) planes. At very low temperatures (∼ 1K), it starts as a paramagnet at small magnetic fields. Further increas- ing field strength leads to two consecutive metamagnetic transitions at 7.8 and 8.1 Tesla if the field is perpen- dicular to the ab-plane. The nematic phase is observed between these two transitions, identified by the observa- tion of anisotropic resistivity without noticeable lattice distortions. This nematic phase in Sr 3 Ru 2 O 7 can be understood as the particle-hole channel Fermi surface instability of the Pomeranchuk-type 3 . It is a mixture of the d-wave Pomer- anchuk instabilities in both density and spin channels 19 , though the microscopic origin of these instabilities re- main controversial. Different microscopic theories have been proposed based on the quasi-1D bands of d xz and d yz 14,15,18 , and based on the 2d-band of d xy 8,9,16,17 . In our 14,18 and Raghu et. al.’s 15 theories, the unconven- tional (nematic) magnetic ordering was interpreted as or- bital ordering among the d xz and d yz -orbitals. In partic- ular, in Ref. [18] a realistic tight-binding model with the important features including the t 2g -orbitals, the bilayer splitting, spin-orbit coupling, and the staggered rotations of RuO octahedra, has been derived and shown to repro- duce accurately the results of the angle-resolved photon emission spectroscopy (ARPES) 20 and the quasiparticle interference in the spectroscopic imaging scanning tun- neling microscopy (STM) 21 . On the other hand, orbital physics is an important sub- ject in transition metal oxides with active d-orbitals 22,23 . Recently the research of orbital physics has been fur- ther stimulated due to the observations of anisotropic properties in iron-pnictides 24,25 which are consistent with orbital ordering 26–28 . Generally speaking, a transition metal oxide with active t 2g -orbitals could exhibit or- bital ordering in the quasi-1D bands under certain con- ditions. In the particular case of Sr 3 Ru 2 O 7 , it has been argued 14,15 that at zero magnetic field, although the sys- tem does not show any order, it is near the instabilities of ferromagnetic and orbital (nematic) orderings. Ap- plying the magnetic field pushes the system closer to the van Hove singularities which largely raises up the density of states at the Fermi energy D(ǫ F ) and results in both the metamagnetic and nematic transitions. It should be noted that the Fermi liquid states always dominate the low temperature physics of this system because the re- sistivity was found to follow T 2 law in both isotropic and nematic phases. This suggests that quantum criti- cality is not expected to play much role in both isotropic and nematic phases at low temperatures. Nevertheless, quantum critical behavior appears at finite temperatures above the nematic phase, which exhibits non-Fermi liquid properties. The study of quantum critical states has attracted intensive research activities over past few decades 29,30 . Materials possessing quantum critical points are usually triggered by tunable parameters, for example, external pressure and magnetic field. When approaching quan- tum critical points, not only the zero temperature elec- tronic ground state but also the low-temperature proper- ties are modified radically. Pioneering theoretical works done by Hertz 31 and extended by Millis 32 have addressed the physics near the ferromagnetic and antiferromagnetic quantum critical points, showing that the critical fluc-
-
Upload
independent -
Category
Documents
-
view
0 -
download
0
Transcript of Microscopic theory of thermodynamic properties of finite nuclei

arX
iv:1
008.
2486
v1 [
cond
-mat
.str
-el]
15
Aug
201
0
Microscopic Theory of the Thermodynamic Properties of Sr3Ru2O7
Wei-Cheng Lee1, ∗ and Congjun Wu1, †
1Department of Physics, University of California, San Diego, California, 92093, USA
(Dated: August 17, 2010)
The thermodynamic properties of the bilayer Sr3Ru2O7 at very low temperatures are investigatedby a realistic tight-binding model with the on-site interactions treated at the mean-field level. Dueto the strong spin-orbit coupling, the band structure undergoes a significant change in Fermi surfacetopology as the external magnetic field is applied, invalidating the rigid band picture in which theZeeman energy only causes chemical potential shifts. In addition, since Sr3Ru2O7 is a t2g activesystem with unquenched orbital moments, the orbital Zeeman energy is not negligible and plays animportant role in the phase diagram on the magnetic field orientation. We find that both the totaldensity of states at the Fermi energy and the entropy exhibit a sudden increase near the criticalmagnetic field for the nematic phase, echoing the experimental findings. Our results suggest thatextra cares are necessary to isolate the contributions due to the quantum criticality from the bandstructure singularity in this particular material. The effects of quantum critical fluctuations arebriefly discussed.
PACS numbers: 72.80.Ga,73.20.-r,71.10.Fd
I. INTRODUCTION
Recently, a great deal of attention has been paid tothe bilayer ruthenate compound Sr3Ru2O7 with variousinteresting physical properties. It was first consideredas a field-tuned quantum critical state having metamag-netic transitions around 8 Tesla1–3. Later, in the ultra-pure single crystal it has been found that the meta-magnetic quantum critical point is intervened by theemergence of an unconventional anisotropic (nematic)electronic state4,5, stimulating considerable theoreticalefforts6–18. Sr3Ru2O7 is a metallic itinerant system withthe active t2g-orbitals of the Ru sites in the bilayer RuO2
(ab) planes. At very low temperatures (∼ 1K), it starts asa paramagnet at small magnetic fields. Further increas-ing field strength leads to two consecutive metamagnetictransitions at 7.8 and 8.1 Tesla if the field is perpen-dicular to the ab-plane. The nematic phase is observedbetween these two transitions, identified by the observa-tion of anisotropic resistivity without noticeable latticedistortions.
This nematic phase in Sr3Ru2O7 can be understood asthe particle-hole channel Fermi surface instability of thePomeranchuk-type3. It is a mixture of the d-wave Pomer-anchuk instabilities in both density and spin channels19,though the microscopic origin of these instabilities re-main controversial. Different microscopic theories havebeen proposed based on the quasi-1D bands of dxz anddyz
14,15,18, and based on the 2d-band of dxy8,9,16,17. In
our14,18 and Raghu et. al.’s15 theories, the unconven-tional (nematic) magnetic ordering was interpreted as or-bital ordering among the dxz and dyz-orbitals. In partic-ular, in Ref. [18] a realistic tight-binding model with theimportant features including the t2g-orbitals, the bilayersplitting, spin-orbit coupling, and the staggered rotationsof RuO octahedra, has been derived and shown to repro-duce accurately the results of the angle-resolved photonemission spectroscopy (ARPES)20 and the quasiparticle
interference in the spectroscopic imaging scanning tun-neling microscopy (STM)21.
On the other hand, orbital physics is an important sub-ject in transition metal oxides with active d-orbitals22,23.Recently the research of orbital physics has been fur-ther stimulated due to the observations of anisotropicproperties in iron-pnictides24,25 which are consistent withorbital ordering26–28. Generally speaking, a transitionmetal oxide with active t2g-orbitals could exhibit or-bital ordering in the quasi-1D bands under certain con-ditions. In the particular case of Sr3Ru2O7, it has beenargued14,15 that at zero magnetic field, although the sys-tem does not show any order, it is near the instabilitiesof ferromagnetic and orbital (nematic) orderings. Ap-plying the magnetic field pushes the system closer to thevan Hove singularities which largely raises up the densityof states at the Fermi energy D(ǫF ) and results in boththe metamagnetic and nematic transitions. It should benoted that the Fermi liquid states always dominate thelow temperature physics of this system because the re-sistivity was found to follow T 2 law in both isotropicand nematic phases. This suggests that quantum criti-cality is not expected to play much role in both isotropicand nematic phases at low temperatures. Nevertheless,quantum critical behavior appears at finite temperaturesabove the nematic phase, which exhibits non-Fermi liquidproperties.
The study of quantum critical states has attractedintensive research activities over past few decades29,30.Materials possessing quantum critical points are usuallytriggered by tunable parameters, for example, externalpressure and magnetic field. When approaching quan-tum critical points, not only the zero temperature elec-tronic ground state but also the low-temperature proper-ties are modified radically. Pioneering theoretical worksdone by Hertz31 and extended by Millis32 have addressedthe physics near the ferromagnetic and antiferromagneticquantum critical points, showing that the critical fluc-
2
tuations are scale invariant in the vicinity of quantumcritical points due to the divergence of the correlationlength right at these points. This aspect enables the es-tablishment of universal classes based on the scaling the-ory. Experimentally, quantum critical states usually ex-hibit divergences in thermodynamic properties like spe-cific heat, entropy, etc. The critical exponents associatedwith these divergences are believed to be universal val-ues in the same universal class regardless the microscopicdetails.
The influence of quantum critical fluctuations inSr3Ru2O7 seems to be novel as well. Rost et. al.33,34
measured the entropy and specific heat in ultra-pure sam-ples and found divergences near the metamagnetic transi-tions in both quantities. Although it is a common featurein a quantum critical state that the specific heat C di-verges as C/T = A[(H−Hc)/Hc]
−α+B due to quantumfluctuations, the exponent of α is fitted to be 1 insteadof 1/3 as predicted by the Hertz-Millis theory31,32. Thetotal density of states (DOS) measured by Iwaya et al.35
using the STM showed that the DOS at the Fermi en-ergy (D(ǫF )) increases significantly under the applicationof the magnetic field, but the DOS at higher and lowerenergy does not change accordingly. This indicates thatthe Zeeman energy in this case does not simply causea chemical potential shift so that the conventional rigidband picture can not explain this result. These findingshave posted a challenge to understand the critical behav-ior in this material.
In this article, we show that the tight-binding modelderived by Arovas and two of us18 together with the on-site interactions treated simply at the mean-field levelalready gives rise to divergences in these properties with-out involving quantum fluctuations. Realistic featureslike multi-orbital bands, the bilayer splitting, the rota-tions of RuO octahedra, and spin-orbit coupling makethis material very sensitive to small energy scales. Be-cause parts of the Fermi surface are close to the van Hovesingularities, Fermi surface reconstructions in the exter-nal magnetic fields lead to a singular behavior in D(ǫF ).This results in the divergences observed in the exper-iments mentioned above. Because of the strong spin-orbit coupling and the unquenched orbital moments, theZeeman energy tends to reconstruct the Fermi surfacesrather than just provides a chemical potential shift. Ourresults suggest that the influence of quantum critical fluc-tuations will be masked if D(ǫF ) of the system exhibitsa non-monotonic behavior with the tuning parameters,implying that a more careful analysis is required in orderto distinguish the role of the quantum criticality in thebilayer Sr3Ru2O7.
This paper is organized as follows. We will summarizethe tight-binding model derived in Ref. [18] in Sect. II.The formalism of the mean-field theory will be presentedin Sect. III. The results for the cases of the magneticfields parallel to and tilted away from the c-axis will bediscussed in Sect. IV and V, respectively. Conclusionswill be given in Sect. VI.
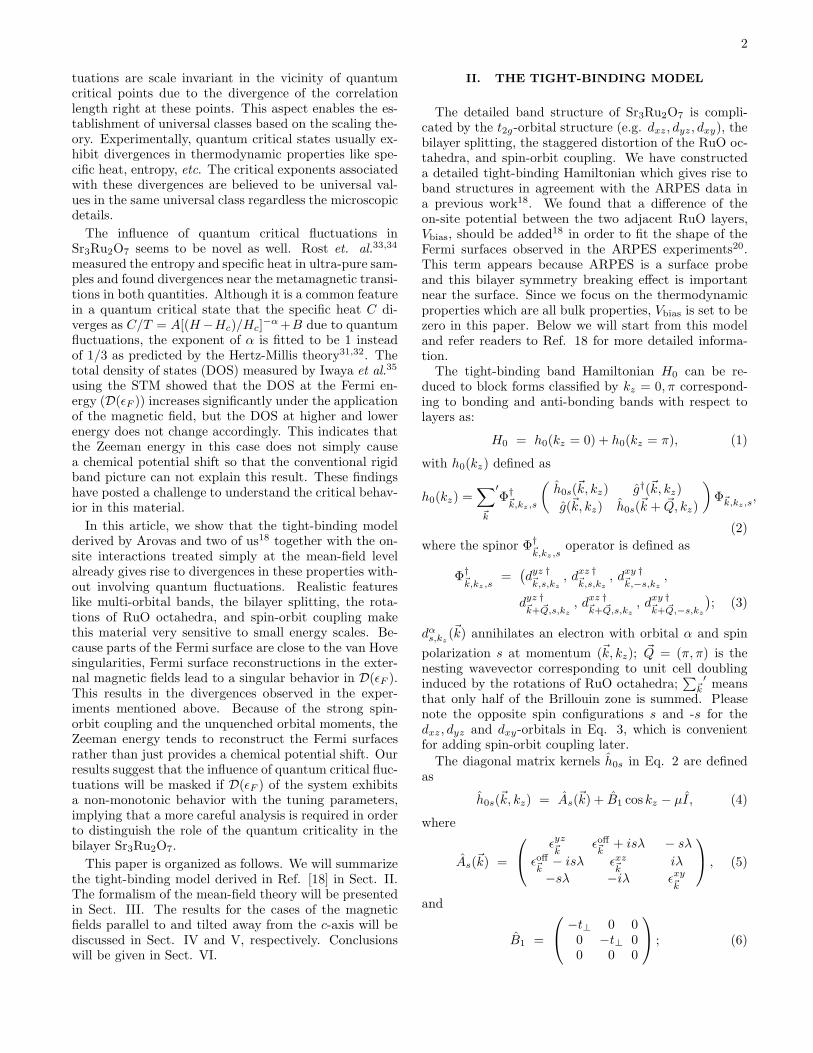
II. THE TIGHT-BINDING MODEL
The detailed band structure of Sr3Ru2O7 is compli-cated by the t2g-orbital structure (e.g. dxz, dyz, dxy), thebilayer splitting, the staggered distortion of the RuO oc-tahedra, and spin-orbit coupling. We have constructeda detailed tight-binding Hamiltonian which gives rise toband structures in agreement with the ARPES data ina previous work18. We found that a difference of theon-site potential between the two adjacent RuO layers,Vbias, should be added18 in order to fit the shape of theFermi surfaces observed in the ARPES experiments20.This term appears because ARPES is a surface probeand this bilayer symmetry breaking effect is importantnear the surface. Since we focus on the thermodynamicproperties which are all bulk properties, Vbias is set to bezero in this paper. Below we will start from this modeland refer readers to Ref. 18 for more detailed informa-tion.The tight-binding band Hamiltonian H0 can be re-
duced to block forms classified by kz = 0, π correspond-ing to bonding and anti-bonding bands with respect tolayers as:
H0 = h0(kz = 0) + h0(kz = π), (1)
with h0(kz) defined as
h0(kz) =∑
~k
′Φ†~k,kz ,s
(
h0s(~k, kz) g†(~k, kz)
g(~k, kz) h0s(~k + ~Q, kz)
)
Φ~k,kz,s,
(2)
where the spinor Φ†~k,kz ,s
operator is defined as
Φ†~k,kz ,s
=(
dyz †~k,s,kz
, dxz †~k,s,kz
, dxy †~k,−s,kz
,
dyz †~k+~Q,s,kz
, dxz †~k+~Q,s,kz
, dxy †~k+~Q,−s,kz
)
; (3)
dαs,kz(~k) annihilates an electron with orbital α and spin
polarization s at momentum (~k, kz); ~Q = (π, π) is thenesting wavevector corresponding to unit cell doublinginduced by the rotations of RuO octahedra;
∑
~k
′means
that only half of the Brillouin zone is summed. Pleasenote the opposite spin configurations s and -s for thedxz, dyz and dxy-orbitals in Eq. 3, which is convenientfor adding spin-orbit coupling later.
The diagonal matrix kernels h0s in Eq. 2 are definedas
h0s(~k, kz) = As(~k) + B1 cos kz − µI, (4)
where
As(~k) =
ǫyz~k
ǫoff~k + isλ − sλ
ǫoff~k − isλ ǫxz~k iλ
−sλ −iλ ǫxy~k
, (5)
and
B1 =
−t⊥ 0 00 −t⊥ 00 0 0
; (6)

3
where t⊥ is the longitudinal inter-layer hopping for thedxz and dyz orbitals. λ is the spin-orbit coupling strengthwhich comes from the on-site spin-orbit coupling term
as Hso = λ∑
i~Li · ~Si; µ is the chemical potential; the
dispersions for the dyz, dxz, and dxy bands in Eq. 5 aredefined as
ǫyz~k
= −2t2 cos kx − 2t1 cos ky,
ǫxz~k = −2t1 cos kx − 2t2 cos ky,
ǫxy~k
= −2t3(
cos kx + cos ky)
− 4t4 cos kx cos ky
−2t5(
cos 2kx + cos 2ky)
− Vxy
ǫoff~k = −4t6 sin kx sin ky, (7)
which includes longitudinal (t1) and transverse (t2) hop-ping for the the dxz and dyz orbitals, respectively, aswell as are nearest neighbor (t3), next-nearest neighbor(t4), and next-next-nearest neighbor (t5) hopping for thedxy orbital. Following the previous LDA calculations36,Vxy is introduced to account for the splitting of the dyzand dxz states relative to the dxy states. While symme-try forbids nearest-neighbor hopping between differentt2g orbitals in a perfect square lattice without the rota-tion of Ru octahedra, a term describing hopping betweendxz and dyz orbitals on next-nearest neighbor sites (t6)is allowed and put into the tight-binding model.
The off-diagonal matrix kernel g(~k, kz) in Eq. 2 reads
g(~k, kz) = G(~k)− 2B2 cos kz, (8)
where
B2 =
0 t⊥INT
0−t⊥
INT0 0
0 0 0
, (9)
and
G(~k) =
0 −2tINT γ(~k) 0
2tINT γ(~k) 0 00 0 0
, (10)
with γ(~k) = cos kx + cos ky. tINT and t⊥INT
describe theintra- and inter-layer hopping between dxz and dyz in-duced by the rotations of RuO octahedra, providing the
coupling between ~k and ~k + ~Q.When describing the Zeeman energy, we can choose
the magnetic field ~B to lie on the xz plane and define
θ as the angle between ~B and the c-axis of the samplewithout loss of the generality. Consequently, the Zeemanterm becomes:
HZeeman = HorbitalZeeman +Hspin
Zeeman,
HorbitalZeeman = −µB B
∑
i,a
(
Lz,ia cos θ + Lx,ia sin θ)
,
HspinZeeman = −2µB B
∑
i,a,α
(
Sαz ia cos θ + Sα
x ia sin θ)
,
(11)
where a is the layer index, B = | ~B|, and the matricesLx,z can be found in Ref. [18].For θ 6= 0, the extra Zeeman terms from x-component
of ~L and ~S couple Φ†~k,kz ,↑
and Φ†~k,kz ,↓
. Defining φ†~k,kz
≡(
Φ†~k,kz ,↑
,Φ†~k,kz ,↓
)
, the Zeeman term can be written in the
matrix form as:
HZeeman = µBB∑
~k
′ ∑
kz
φ†~k,kz
HZ(θ)φ~k,kz
,
(12)
where
HZ(θ) =
HDZ (θ,+) 0 HO †
Z (θ) 0
0 HDZ (θ,+) 0 HO †
Z (θ)
HOZ (θ) 0 HD
Z (θ,−) 0
0 HOZ (θ) 0 HD
Z (θ,−)
,
(13)
HDZ (θ, s) = cos θ ×
−s −i 0i −s 00 0 s
, (14)
with s = ±1 and
HOZ (θ) = sin θ ×
−1 0 00 −1 −i0 i −1
, (15)
III. THE MEAN-FIELD THEORY
In Sect. II, we have introduced the rather complicatedband structure of Sr3Ru2O7. In this section, we intro-duce the minimal multi-orbital band Hubbard model forthe nematic ordering and outline the mean-field proce-dure.In realistic band structures measured by ARPES20,
there exists an additional δ-band arising from the dx2−y2-orbital which is not covered by the current model. Theparticle filling in the t2g-orbitals is not fixed. For theconvenience of calculation, we fix the chemical potentialµ = 0.94t1 instead of fixing particle filling in the t2g-orbitals while changing magnetic fields and orientationsin Sect. IV and Sect. V. The corresponding fillings in-side the t2g-orbitals per Ru atom varies within the rangebetween 4.05 and 4.06 in Figs. 2, 6, 7. This treatmentdoes not change any essential qualitative physics.The Hubbard model contains the on-site intra and in-
ter orbital interactions as
Hint = U∑
i,a,α
nαia↑n
αia↓ +
V2
∑
i,a,α6=β
nαia n
βia, (16)
where the Greek index α refers to the orbitals xz, yz andxy; the Latin index a refers to the upper and lower layers.Throughout this paper, the parameter values are takenas U/t1 = V/t1 = 3.6. The other two possible terms

4
FIG. 1: (Color online) The Fermi surfaces using the bilayertight-binding model Eq. 2 with the parameters in unit of t1 as:t2 = 0.1t1, t3 = t1, t4 = 0.2t1, t5 = −0.06t1, t6 = 0.1t1, t⊥ =0.6t1, tINT = t⊥INT = 0.1t1, λ = 0.2t1, Vxy = 0.3t1, and µ =0.94t1. The thick dashed lines mark the boundary of halfBrillouin zone due to the unit cell doubling induced by therotation of RuO octahedra. The Fermi surfaces of the bonding(kz = 0, black solid lines) and the anti-bonding bands (kz =π, red dashed lines) could cross since kz is a good quantumnumber.
in the multi-band Hubbard interaction are the Hund’srule coupling and pairing hopping terms, which do notchange the qualitative physics and are neglected. Weassume the external B-field lying in the xz-plane withan angle θ tilted from the z-axis. The occupation andspin in each orbital and layer are defined as follows:
nαa ≡
∑
s
〈dα †s,a(i)d
αs,a(i)〉,
Sαz a ≡ 1
2
∑
s
s 〈dα †s,a(i)d
αs,a(i)〉,
Sαxa ≡ 1
2
∑
s
〈dα †s,a(i)d
αs,a(i)〉. (17)
No any other inter-layer interaction is considered and thenon-interacting Hamiltonian has symmetric layers, thusthe order parameters are the same for both layers, whichhave been numerically confirmed. From now on it will beassumed:
nαa = nα, Sα
x,z a = Sαx,z. (18)
With this property, kz remains a good quantum numberin the resulting mean-field Hamiltonian.The standard mean-field decomposition of Hint leads
to
HMFint =
∑
i,a,α
∑
s
Wαs dα †
s,a(i)dαs,a(i)− USα
x dα †s,a(i)d
αs,a(i) ,
(19)
where
Wαs = U
(
12nα − s Sα
z
)
+ V∑
β 6=α
nβ . (20)
The interaction parameters (U, V ) are chosen such thatno spontaneous magnetization occurs in the absence ofthe external magnetic field. Moreover, since the order pa-rameters {nα
a} are non-zero even without magnetic field,we require that the renormalized Fermi surface at zerofield to be the one given in Fig. 1. As a result, in addi-tion to the optimized parameters obtained in our previ-ous work18, we need to subtract the following term fromEq. 19:
Hshift =∑
i,a,α
∑
s
Wαs (0)d
α †s,a(i)d
αs,a(i), (21)
where
Wαs (0) = 1
2Unα(0) + V
∑
β 6=α
nβ(0), (22)
and nα(0) is the occupation number in orbital α corre-sponding to the Fermi surfaces shown in Fig. 1. This isan effect of the renormalization of the chemical potentialµ and Vxy due to interactions. After putting all the piecestogether, we finally arrive at the mean-field Hamiltonianas:
HMF = H0 +HMFint −Hshift +HZeeman
≡∑
~k
′ ∑
kz
φ†~k,kz
HMF (~k)φ~k,kz
. (23)
The order parameters are computed self-consistently.It has been pointed out14,15 that the nematic phase canbe identified as the orbital ordering between the dxz anddyz-orbitals, thus the nematic order parameter N is de-fined as
N = 2(nyz − nxz). (24)
The magnetization order parameter is defined as:
~M ≡ 2∑
α
~Sα. (25)
The factor of 2 in Eq. 25 and 24 accounts for the doublelayers.
IV. THE CASE OF THE PERPENDICULARMAGNETIC FIELD (θ = 0)
In this section the thermodynamic properties at lowtemperatures are calculated within the mean-field the-
ory for the case of ~B ‖ c, i.e., θ = 0. Most importantfeatures of these properties, including the evolution ofthe nematic ordering, the tunneling DOS, entropy land-scapes, and the finite temperature phase diagram underthe application of the magnetic field B, can be reasonablyreproduced and understood by the singular behavior ofD(ǫF ) under the magnetic field.

5
FIG. 2: (Color online) The order parameters as a functionof µBB for θ = 0. The nematic phase (in the green area) isbounded by two magnetization jumps which corresponds tometamagnetic transitions.
A. Nematic ordering and metamagnetic transitions
The order parameters | ~M| and N as functions of µBBfor this case are shown in Fig. 2. There are three rapidincreases in the magnetization, consistent with the ex-periment measurements of the real part of the very lowfrequency AC magnetic susceptibility at 7.5T, 7.8T and8.1T, respectively4. Experimentally, only the last two ex-hibit dissipative peaks in the imaginary part of the ACsusceptibility, which characterize the first order meta-magnetic transitions. The first jump measured in theexperiment is considered as a crossover.
The nematic ordering develops in the area bounded bythe last two magnetization jumps, reproducing the well-known phase diagram of the Sr3Ru2O7
4. In particular,if we adopt the results from LDA calculations37,38 thatt1 ≈ 300 meV, we find that three jumps in the magne-tization appear at B ≈ 0.0032t1/µB, 0.0053t1/µB, and0.0059t1/µB ∼ 15.7 T, 26 T, and 29 T, which is withinthe same order to the experimental values of 7.5T, 7.8T,and 8.1T. This is an improvement compared to the resultsin previous theory calculations8–11,15,16. in which the ne-matic ordering develops at much higher field strengthµBB/t1 ≈ 0.02
The sensitivity to the small energy scale like the Zee-man energy is because a part of the Fermi surfaces,mostly composed of quasi-1D bands as shown in theyellow areas in Fig. 3 (b), is getting close to the vanHove singularities at (π, 0) and (0, π). The evolutionof the Fermi surface structures as increasing the B-fieldacross the nematic phase boundaries is presented in Fig.3 a (before), b (inside), and c (after) at µBB/t1 =0.0048, 0.00544, 0.006, respectively. Before and after thenematic phases, the Fermi surfaces have the 4-fold ro-tational symmetry as exhibited in Fig. 3 (a) and (c).When the system is in the nematic phase, the Fermisurfaces only have 2-fold symmetry as expected. Par-ticularly, the nematic distortion is most prominent near(±π, 0) and (0,±π) whose Fermi surfaces are dominatedby the quasi-1D bands as shown in Fig. 3(b), support-ing the mechanism of orbital ordering in quasi-1D bands
driven by the van Hove singularities.It is worthy of mentioning that the onsite spin-orbit
coupling Hso = λ∑
i~Li · ~Si has important effects on
the Fermi surface evolutions. Hso hybridizes the oppo-site spins between quasi-1D bands dyz,xz and the 2-Dband dxy. As the spin Zeeman energy is present, thespin majority (minority) bands of dyz,xz couples to thespin minority (majority) band of dxy. Moreover, theorbital Zeeman energy provides more hybridizations be-tween quasi-1D dxz,yz bands. Combined with the abovetwo effects, the addition of the spin and orbit Zeeman en-ergies causes reconstruction of the Fermi surfaces ratherthan just chemical potential shifts.These results show that the complexity and the sensi-
tivity of the Sr3Ru2O7 band structure can be capturedvery well by our tight-binding model with a reasonablequantitative accuracy. In the following, the same modelwill be used to further investigate some novel physicalproperties observed in experiments.
B. Entropy landscape under the magnetic field
One of the intriguing puzzles observed in Sr3Ru2O7 isthe critical exponent of the divergence in entropy (as wellas specific heat) when approaching the nematic region, orthe quantum critical point. Although it is expected thatspecific heat C diverges as C/T = A[(H −Hc)/Hc]
−α +B near the quantum critical point, the exponent α hasbeen found to be 133,34 instead of 1/3 as predicted by theHertz-Millis theory. However, it is noticed that D(ǫF ) istaken to be a constant in the Hertz-Millis theory whilethis material has a complicated Fermi surface evolutionsunder the magnetic field. Moreover, as mentioned in theintroduction, the system is always in the Fermi liquidstates at low temperatures inferred from the temperaturedependences of the resistivity. Motivated by these twofacts, it is then worthy of studying first the contributionfrom the band structure to the entropy before consideringthe quantum fluctuations.The entropy per Ru atom at the mean-field level can
be evaluated by:
S(B) = − kB
N
∑
~k
′ ∑
j
[
f(Ej(~k)) ln f(Ej(~k))
+(1− f(Ej(~k)) ln(1− f(Ej(~k)))]
, (26)
where β = 1/kBT , f(Ej(~k)) the Fermi-Dirac distribu-
tion function, and Ej(~k) is the jth eigenvalue of HMF (~k)given in Eq. 23. Because only the change of the entropyas a function of magnetic field near the nematic regionis experimentally relevant, we plot in Fig. 4 the quan-tity: S(B)/T in unit of k2B/t1 at a low temperature of1/(βt1) = 0.002 within the range of 0.0045 ≤ µBB/t1 ≤0.007. Near the nematic region, S(B)/T increases first,being cut off inside the nematic region, and then de-creases after, which is consistent with the experiment33.Since these results are obtained at the mean-field level,

6
FIG. 3: Fermi surface evolution for the case of magnetic field parallel to c axis (a) before (µBB = 0.0048t1) (b) inside(µBB = 0.00544t1), and (c)after (µBB = 0.006t1) the nematic phase. Significant changes in the Fermi surface topology underthe magnetic field can be seen (see Fig. 1 for the Fermi surfaces at zero field). The nematic distortion is most obvious in theFermi surfaces near (±π, 0) and (0,±π) as indicated by the yellow areas in (b). These parts of Fermi surfaces are composedmostly of quasi-1D bands, supporting the intimacy of nematic phase to the orbital ordering.
this diverging behavior near the nematic region of theentropy landscape results from the singularity of D(ǫF ).As apparent in Eq. 26, at very low temperature only thestates near the Fermi surfaces give a sizable contributionto the entropy. Since the nematic region is driven bythe sudden increase of D(ǫF ), the entropy should also beenhanced near the nematic region. While it is generallyexpected that the quantum fluctuations near the criticalpoint could contribute more entropies, our results demon-strate that entropy contributed from the mean-field levelalready gives diverging behavior due to the singularity ofD(ǫF ) under the evolution of the magnetic field.To summarize, it is found that the singular behavior
of D(ǫF ) already produces diverging behavior in both en-tropy and specific heat under magnetic field at constanttemperature, although the critical exponent α can not beextracted from the current theory. Similar argument hasbeen proposed in previous study34, in which the effect ofa rigid band shift away from van Hove singularities in aperfect 1-d band is discussed. The quantum fluctuationsseem to play a minor role in this case but become im-portant in the vicinity of the quantum critical point andat higher temperature. It is noted that the rigid bandpicture does not work neither when the system is dopedby the substitution of La3+ into the Sr2+ site, which hasbeen argued to result from the strong correlation effect39.We will leave these discussions in the conclusion section.
C. Total density of states
Iwaya et al. has measured the STM tunneling differen-tial conductance dI
dVin the B-field for Sr3Ru2O7, which
corresponds to measurement of the DOS. It has been ob-served that while DOS at higher and lower energy doesnot change, the DOS at the Fermi energy (D(ǫF )) in-
FIG. 4: (Color online) (a) The entropy landscape represetnedby the quantity S(B)/T in unit of k2
B/t1 within the rangeof 0.0045 ≤ µBB/t1 ≤ 0.007. A sudden increase near thenematic region (green area) is clearly seen.
crease significantly under the application of the magneticfield, demonstrating the violation of the rigid band pic-ture.In our model the total DOS can be evaluated using:
ρtot(ω) = 1πN
∑
~k
′TrIm
[
GMF (~k, ω)]
GMF (~k, ω) ≡(
ω + iη −HMF (~k))−1
(27)
where HMF (~k) is given in Eq. 23 with the self-consistentorder parameters and N is the total number of sites inthe bilayer square lattices.The profiles of the total DOS at several different mag-
netic field strength are plotted in Fig. 5(a), and clearly arigid band picture does not apply here. D(ǫF ) (ρtot(ω =0) in the plot) increases significantly as the nematic phaseis approached. This feature can also be directly un-derstood by the picture of Fermi surface reconstruction,

7
FIG. 5: (Color online) (a) The total DOS ρtot(ω) as a functionof µBB. The broadening factor η is set to be η = 0.002t1.ρtot(ω) does not follow the rigid band picture and ρtot(ω = 0)has a sudden increase near the nematic region. Inset: the totalDOS at zero field for a wider range of |ω|/t1 ≤ 0.4. The peakscorresponding to van Hove singularities are near ω/t1 ≈ −0.2and ω/t1 ≈ 0.35. (b) The DOS of the quasi-1D bands. Inset:the DOS of quasi-1D bands at zero field for a wider rangeof |ω|/t1 ≤ 0.4. Only the peak around ω/t1 ≈ 0.35 remains,meaning that this peak is due to the van Hove singularitiesin quasi-1D bands.
since the changes in the Fermi surface topology inevitablylead to the non-monotonic behavior in ρtot(ω = 0). Inparticular, comparing Figs. 1 and 3, it is straightfor-ward to see that more Fermi surfaces appear near the(±π, 0) and (0,±π) as the magnetic field increases. Since
there are van Hove singularities near these four ~k points,ρtot(ω = 0) is expected to increase. As the magnetic fieldis increased further so that the van Hove singularities areall covered below the Fermi surfaces, ρtot(ω = 0) startsto drop (not shown here).
At the first glance, the entropy measurement and ourresults of the total DOS seem to contradict with the STMmeasurement. While both the entropy measurement andour results develop a maximum around the nematic re-gion in D(ǫF ), the STM measurement showed insteadthat D(ǫF ) keeps increasing even after the nematic re-
gion is passed. To resolve this discrepancy, several realis-tic features need to be considered before comparing ourcalculations with the STM results. Since the STM is asurface probe and the surface of the material is usuallycleaved to have the oxygen atoms in the outermost layer,there is an oxygen atom lying above each uppermost Ruatom. Consequently, the tunneling matrix element willbe mostly determined by the wavefunction overlaps be-tween the p-orbitals of the oxygen atom and the d-orbitalsof the Ru atom, resulting in a much smaller matrix ele-ment for dxy orbital compared to dxz,yz orbitals18. Theminimal model to take this effect into account is to ex-tract the DOS only from the quasi-1D orbitals, which isplotted in Fig. 5(b). Although the overall profile in Fig.5(b) is not exactly the same as that in Ref. 35, which isattributed to more complicated momentum dependenceof tunneling matrix elements26,40,41 not considered here,it captures the increasing DOS with the magnetic fieldwhich is more consistent with Ref. 35.The insets in Fig. 5 plot the total and quasi-1D band
DOSs at zero field within a wider range of |ω|/t1 ≤ 0.4.The peaks corresponding to the van Hove singularitiesreside at ω/t1 ≈ −0.2 and ω/t1 ≈ 0.35, far away from theFermi energy. The reason why the small energy scale likeZeeman energy (∼ 0.003t1) can push the system to getcloser to the van Hove singularities at energies far awayfrom the Fermi energy is the help of the metamagnetism.In the mean-field theory, the magnetization produces aneffective chemical potential shift as sUSα
z for electrons atorbital α and spin s. As a result, under the magnetic fieldthe jump in the magnetization gives Sα
z ∼ 0.05 withinthe range of experimental interests. This leads to theeffective chemical potential shift about ±0.18t1 for U =3.6t1, which is large enough to push the system closer tothe van Hove singularities. This renormalization of thechemical potential by the interaction is also part of thecause for the violation of the rigid band picture.
D. Finite Temperature Phase Diagram
Another intriguing observation by Rost et. al.33 is thephase boundary of the nematic phase at the finite tem-perature. Since the nematic phase is bounded by the twofirst-order metamagnetic transition, the phase boundarycan be determined by the magnetic Clausius-Clapeyronrelation:
µ0dHc
dTc
= − ∆S∆M
, (28)
where µ0 is the permeability constant, Hc and Tc the crit-
ical field and temperature, S the entropy, and M = | ~M|the magnetization. Experimentally it was found that theentropy is always higher inside the nematic phase thanthe adjacent normal phases but the magnetization in-creases monotonically with the magnetic field. From Eq.28, this implies a ’muffin’-shaped phase boundary, i.e.,at field strengths slightly below 7.8T and above 8.1T thenematic phase appears at finite temperature but vanishes

8
FIG. 6: (Color online) (a) Phase diagram for higher tem-peratures. Magnitudes of N are represented by the colorscales. The areas with light colors have large N , defin-ing the region for the nematic order. The re-entry of thenematic order at higher temperature is seen at fields be-tween 0.0058 < µBB/t1 < 0.0063. (b) The DOSs of theall bands (solid line) and quasi-1D bands (dashed line) atµBB/t1 = 0.006. The yellow areas refers to the energy win-dow bounded by ±kBT/t1 with temperature kBT/t1 = 0.003.It can be seen that this thermal energy window covers a re-gion in which the DOS increases abruptly, driving the nematicphase at finite temperature.
at zero temperature, to which we term as ’re-entry’ be-havior throughout this paper.By inspecting Fig. 4 closer, it can be seen that the en-
tropy drops as entering the nematic phase from the lower-field boundary but raises as entering from the upper-fieldboundary. In other words, the present theory has the’re-entry’ behavior of the nematic order at the upper-field boundary but not at the lower-field boundary. Thisaspect is further confirmed by the temperature depen-dence of the nematic order parameter N as a function ofmagnetic field shown in Fig. 6(a).The re-entry behavior can be understood as follow-
ing. Because the nematic phase transition is first-order,roughly speaking one requires UeffD(ǫF ), where Ueff isthe effective interaction for nematicity, to exceed a crit-ical value for the nematic ordering to occur. The mech-anism for nematic ordering in Sr3Ru2O7 based on vanHove singularities is all about increasing D(ǫF ) abruptlyby driving the system closer to the van Hove singu-larities with the magnetic field. At the field strengthslightly above the upper critical field, D(ǫF ) is large butstill not enough for the occurrence of the nematic or-dering. Therefore, if the thermal energy is large enoughto cover enough DOS within the thermal energy win-dow ǫF − kBT < ǫF < ǫF + kBT but still low enoughso that the thermal fluctuations are small, the re-entryof the nematic phase at higher temperature can be pos-sible. As a illustration, Fig. 6(b) plots the DOS forµBB/t1 = 0.006 at which the nematic ordering first oc-curs at kBT/t1 = 0.003 in our calculation. It can beseen that the thermal energy window for kBT/t1 = 0.003(yellow areas) covers a region in which the DOS increasesabruptly, consistent with the mechanism for the re-entrybehavior discussed above.
V. THE CASE OF THE TILTED MAGNETICFIELDS (θ 6= 0)
A. θ dependence of the nematic ordering
Experimentally, it has been concluded from the mag-netic susceptibility and resistivity measurements3,5,15
that the resistive anisotropy disappears very quickly asthe magnetic field is tilted away from the c-axis, suggest-ing that the nematic ordering vanishes with the increaseof the field angle θ. Fig. 7 presents the nematic order pa-rameter N as functions of µBB and θ. It should be notedthat since the in-plane component of the orbital Zeemanenergy explicitly break the C4 symmetry down to the C2
symmetry, N is non-zero as long as θ 6= 0. Nevertheless,the experimentally observable nematic phase can still beidentified by the jumps in N . Our results showed thatthe nematicity is strongly enhanced with the increase ofθ, which does not agree with the experiments.The large enhancement of the nematic phase for θ 6= 0
in our calculation is due to the orbital Zeeman energy.The anisotropic in-plane component of the orbital Zee-man energy term −µBB
∑
i,a Lx,ia sin θ is clearly propor-
tional to B and largest at θ = 90◦ (i.e. B ‖ x). Toillustrate this point, we plot the Fermi surfaces without
any interaction for ~B ‖ x with strength µB| ~B| = 0.1t1in Fig. 8, and an anisotropy can be seen. Althoughsuch anisotropy in the band structure is not importantat low field, it can be amplified by the effect of the in-teractions, driving the system more susceptible to thenematic phase as the critical points is approached. Asa result, the portion of the nematic phase in the phasediagram is enlarged as θ increases from 0◦ to 90◦ as seenin our calculations. The disagreement between our the-

9
FIG. 7: (Color online) The nematic order parameter N asfunctions of µBB and θ. The magnitudes of N are repre-sented by the color scales. For θ 6= 0, the nematic orderparameter is in general non-zero, but there is an area (withlight colors) in which the nematic order parameter is sharplyenhanced, defining the region of the nematic phase observedin experiments.
FIG. 8: (Color online) The non-interacting Fermi surfaces for~B ‖ x and µBB = 0.1t1. The anisotropy in Fermi surfacesis already visible, especially for the areas near (±π, 0) and(0,±π).
ory and the experimentally-determined phase diagram asa function of θ could result from the strong correlationeffect, which is beyond the scope of the mean-field theory.
B. Anisotropy of the resistivity measurements
While it requires more experimental efforts to confirmthe cause of disagreement, Raghu et. al. have arguedthat the resistivity measurement might not be a good
FIG. 9: (Color online) Illustration of the energetically-favoreddomain structures as the in-plane magnetic field is along xaxis. When the in-plane magnetic field is weak, orbital or-dered phase with N > 0 are dominant (shaded areas) andhigh-energy domains with N ≤ 0 (green ovals) could exist.(b) The domain walls extend longer in y direction becauseit costs less energies if less y- than x- bonds are broken ina N > 0 background. The white oval represents the wavefunction of dyz orbital on each site. The current flows muchmore easily along y-axis than x-axis since the electrons sufferless domain scatterings hopping along this direction. As thein-plane magnetic field is strong, these high-energy domainsvanish, thus there is no longer an easy axis for the currentflow.
indicator for the nematic phase in this material15. Thepoint is that the nematic phase is mostly associated withthe states near the van Hove singularity whose Fermi ve-locities are too small to have sizable contribution to thetransport properties. Therefore the observed anisotropicresistivity is mostly likely due to the scatterings betweennematic domains, and the tilt of the magnetic field helpslie up the domains. However, if the domains are fully liedup, the resistivity measurement becomes insensitive tothe nematic phase due to the diminishing scatterings be-tween nematic domains, despite the nematic order couldbe stronger.One remaining puzzle of this domain scattering argu-
ment is why the easy axis for the current flow is per-pendicular to the in-plane component of the B-field5.We provide a natural argument based on the anisotropicspatial extension of the domain walls as explained be-low. Assuming the B-field lying in the xz-plane, thein-plane (xy) orbital Zeeman energy reads Hin−plane =−µBB sin θ
∑
i,a Lx,ia, which couples the dxy and dxz-orbitals and breaks the degeneracy between the dxz anddyz-orbitals. Since the dxy-orbital has lower on-site en-ergy due to the crystal field splitting than that of dxz, thedxz-orbital bands are pushed to higher energy than dyz-orbital bands by this extra coupling. As a result, the ne-matic state with preferred dyz-orbitals (i.e., N > 0) haslower energy in the homogeneous system. At small anglesof θ, domains with preferred dxz-orbitals (i.e. N ≤ 0)could form as depicted in Fig. 9 (a) as meta-stablestates, which occupy less volume than the majority do-main of N > 0. Let us consider the shape of the domainwalls. Because of the quasi-1D features of the dxz and

10
dyz-orbitals, the horizontal (vertical) domain wall breaksthe bonds of the dyz(dxz)-orbital as depicted in Fig. 9(b), respectively. Since the dyz-orbital is preferred byHin−plane, the horizontal domain wall costs more energy.Consequently, the domain structure illustrated in Fig. 9(a) with longer vertical walls than the horizontal walls isenergetically favored.Since the electrons suffer less domain scatterings hop-
ping along the y-axis in this domain structure, it becomesthe easy axis for the current flow. At large values ofθ, higher energy domains are suppressed and eventuallyvanish, and thus the resistivity measurement becomes in-sensitive to the nematic phase because of vanishing of thedomain scatterings.
C. Measurements proposed for the nematicity
Our results have posted a possibility that the nematicorder could occur in a larger range of the magnetic field
for ~B ‖ x than for ~B ‖ z. Detection methods otherthan resistivity would be desirable. One feasible way isto measure the quasiparticle interference (QPI) in thespectroscopic imaging STM which has been examined indetail in our previous work18. It has been predicted by usthat if there is a nematic order, QPI spectra will manifestpatterns breaking rotational symmetry.Another possible experiment is the nuclear quadruple
resonance (NQR) measurement, which has been widelyused to reveal ordered states in high-Tc cuprates
42–44 andrecently the iron-pnictides45. This technique utilizes thefeature that a nucleus with a nuclear spin I ≥ 1 has anon-zero electric quadruple moment. Because the elec-tric quadruple moment creates energy splittings in thenuclear states as a electric field gradient is present, aphase transition could be inferred if substantial changesin the resonance peak are observed in the NQR measure-ment. Besides, since this is a local probe at the atomiclevel, it is highly sensitive to the local electronic change.Given that Ru atom has a nuclear spin of I = 5/246 andthe orbital ordering in the quasi-1D bands significantlychanges the charge distribution around the nuclei, a sys-tematic NQR measurement as functions of magnetic fieldand field angle will reveal more conclusive informationabout nematicity.
VI. CONCLUSIONS
In this paper we have shown that a number of impor-tant properties observed in the bilayer Sr3Ru2O7 couldbe qualitatively consistent with a realistic tight-bindingmodel together with on-site interactions treated at mean-field level. The band structure of this material is compli-cated by multibands, bilayer splitting, rotations of RuOoctahedra, and the spin-orbit coupling, collectively lead-ing to the high sensitivity to the small energy scales. This
is the main cause of the singular behavior in the evolu-tion of the Fermi surfaces under magnetic field. Usingour tight-binding model and the standard mean-field ap-proaches on the intra- and inter- orbital Hubbard inter-actions, we find that for the case of magnetic field paral-lel to the c-axis, the nematic order, which is interpretedas the orbital ordering in quais-1d dyz and dxz bands,appears at the magnetic field at the same order of theexperimental values ∼ 8T. Moreover, we find that thetotal density of states at the Fermi energy D(ǫF ) underthe magnetic field does not follow a rigid band picture,in agreements with the results of STM measurement35.
The failure of following a rigid band picture is essen-tially a consequence of the interplay between spin-orbitcoupling and the Zeeman energy, despite the strong cor-relation effect could also result in the violation of therigid band shift upon doping39. Because the spin-orbitcoupling hybridizes the quasi-1D bands and 2-D bandswith opposite spins, the Zeeman energy naturally inducesthe reconstruction of the Fermi surfaces instead of justrigid chemical potential shifts. This singular behavior inD(ǫF ) also results in the divergences in the entropy andspecific heat landscapes, since at very low temperatureboth quantities are approximately proportional to D(ǫF ).Because the divergence observed by Rost el. al.33 startapproximately at 6-7 Tesla which is not very close to thequantum critical point residing about 8 Tesla, a directapplication of the quantum critical scaling seems to beinappropriate. The explanation of the critical exponentassociated with this divergence could not be completewithout taking the band structure singularity into ac-count in this particular material21.
As the magnetic field is tilted away from the c axis(θ 6= 0), we find that nematic region expands instead ofshrinking as the resistivity measurement has indicated.From the theoretical viewpoints, the tilt of the magneticfield induces an extra in-plane component of the orbitalZeeman energy which explicitly breaks the C4 symmetrydown to the C2 symmetry. As argued above that thissystem is very sensitive to small energy scale, the effectof this extra Zeeman energy is not important at low fieldbut could amplify the effect of interaction to drive thesystem toward nematicity as the quantum critical pointis approached. As a result, the nematic phase is more fa-vored and stable in the presence of the in-plane magneticfield and it requires another Fermi surface reconstruc-tion at even higher magnetic field in order to weaken thenematic phase by reduced D(ǫF ).
To explain this discrepancy between our theory and theresistivity measurement, we adopt the domain scatteringargument proposed by Raghu et. al.15. Furthermore,we have given an explanation for another experimentalpuzzle that the easy axis for the current flow is alwaysperpendicular to the in-plane magnetic field. Measure-ments like quasiparticle interference in the spectroscopicimaging STM and NQR which could detect the orbitalordering directly have been proposed to be more reliableprobes for the nematicity in this material than the resis-

11
tivity measurement.Finally we would like to comment on limitation of the
present theory. Although we have found the ’re-entry’ be-havior of the nematic phase, i.e., the appearance of thenematic phase only at the finite temperature but not atthe zero temperature, near the upper-field boundary, theexperiments showed this behavior near both upper- andlower- field boundary. In our calculations, the re-entrybehavior is due to the increase of the density of stateswithin the narrow energy window around the Fermi en-ergy opened by thermal energy, but we do not reject otherschemes for the re-entry behavior. One possible schemeis an analogue of ferromagnetism without exchange split-ting proposed by Hirsch47. He showed that the nearestneighbor interactions could result in a spin-dependentrenormalization on the bandwidth (equivalently, the ef-fective mass). As a result, the filling for different spinbands can be different because of the unequal effectivemasses, leading to the ferromagnetism even without theexchange splitting as in the Stoner model.In Hirsch’s original paper, the re-entry of the ferromag-
netism at higher temperature was found. Since we onlyconsidered the on-site interactions in our model, suchan effect is beyond the scope of the current theory. Itis possible that after including the nearest neighbor in-teraction, the renormalizations of the bandwidths have
novel temperature-dependences, leading to a phase dia-gram better consistent with the experiments. If this isthe correct scheme, the re-entry of the nematic statesshould be accompanied by a change in the kinetic energydue to the effective mass renormalization, which could beexamined by the sum rules for the optical properties47–51.
Another possible scheme for the re-entry behavior isthe quantum critical fluctuations. It is well-known thatthe influences of the critical fluctuations extend from thequantum critical point to finite temperature in a V -shaperegion in the phase diagram. Moreover, the critical fluc-tuations in this material contain not only the ferromag-netic but also the nematic ones. As a result, it is notsurprising that the competition between these two typesof critical fluctuations leads to a intriguing phase dia-gram at the finite temperature, and the study towardthis direction is currently in progress.
VII. ACKNOWLEDGMENT
We thank J. E. Hirsch and A. Mackenzie for valuablediscussions. C. W. and W. C. L. are supported by ARO-W911NF0810291 and Sloan Research Foundation.
∗ Electronic address: [email protected]† Electronic address: [email protected] S. A. Grigera, R. S. Perry, A. J. Schofield, M. Chiao, S. R.Julian, G. G. Lonzarich, S. I. Ikeda, Y. Maeno, A. J. Millis,and A. P. Mackenzie, Science 294, 329 (2001).
2 R. S. Perry, L. M. Galvin, S. A. Grigera, L. Capogna,A. J. Schofield, A. P. Mackenzie, M. Chiao, S. R. Julian,S. I. Ikeda, S. Nakatsuji, et al., Phys. Rev. Lett. 86, 2661(2001).
3 S. A. Grigera, R. A. Borzi, A. P. Mackenzie, S. R. Ju-lian, R. S. Perry, and Y. Maeno, Phys. Rev. B 67, 214427(2003).
4 S. A. Grigera, P. Gegenwart, R. A. Borzi, F. Weickert,A. J. Schofield, R. S. Perry, T. Tayama, T. Sakakibara,Y. Maeno, A. G. Green, et al., Science 306, 1154 (2004).
5 R. A. Borzi, S. A. Grigera, J. Farrell, R. S. Perry, S. J. S.Lister, S. L. Lee, D. A. Tennant, Y. Maeno, and A. P.Mackenzie, Science 315, 214 (2007).
6 A. J. Millis, A. J. Schofield, G. G. Lonzarich, and S. A.Grigera, Phys. Rev. Lett. 88, 217204 (2002).
7 A. G. Green, S. A. Grigera, R. A. Borzi, A. P. Mackenzie,R. S. Perry, and B. D. Simons, Phys. Rev. Lett. 95, 086402(2005).
8 H.-Y. Kee and Y. B. Kim, Phys. Rev. B 71, 184402 (2005).9 H. Yamase and A. Katanin, J. Phys. Soc. Japan 76, 073706(2007).
10 H. Yamase, Phys. Rev. B 76, 155117 (2007).11 C. Puetter, H. Doh, and H.-Y. Kee, Phys. Rev. B 76,
235112 (2007).12 A. M. Berridge, A. G. Green, S. A. Grigera, and B. D.
Simons, Phys. Rev. Lett. 102, 136404 (2009).
13 A. M. Berridge, S. A. Grigera, B. D. Simons, and A. G.Green, Phys. Rev. B 81, 054429 (2010).
14 W.-C. Lee and C. Wu, Phys. Rev. B 80, 104438 (2009).15 S. Raghu, A. Paramekanti, E. A. Kim, R. A. Borzi, S. A.
Grigera, A. P. Mackenzie, and S. A. Kivelson, Phys. Rev.B 79, 214402 (2009).
16 C. M. Puetter, J. G. Rau, and H.-Y. Kee, Phys. Rev. B81, 081105 (2010).
17 M. H. Fischer and M. Sigrist, Phys. Rev. B 81, 064435(2010).
18 W.-C. Lee, D. P. Arovas, and C. Wu, Phys. Rev. B 81,184403 (2010).
19 C. Wu, D. Bergman, L. Balents, and S. D. Sarma, Phys.Rev. Lett. 99, 70401 (2007).
20 A. Tamai, M. P. Allan, J. F. Mercure, W. Meevasana,R. Dunkel, D. H. Lu, R. S. Perry, A. P. Mackenzie, D. J.Singh, Z.-X. Shen, et al., Phys. Rev. Lett. 101, 026407(2008).
21 J. Lee, M. P. Allan, M. A. Wang, J. Farrell, S. A. Grigera,F. Baumberger, J. C. Davis, and A. P. Mackenzie, Nat.Phys. 5, 800 (2009).
22 M. B. Salamon and M. Jaime, Rev. Mod. Phys. 73, 583(2001).
23 G. Khaliullin, Prog. Theor. Phys. Suppl. 160, 155 (2005).24 J. Zhao, D. T. Adroja, D.-X. Yao, R. Bewley, S. Li, X. F.
Wang, G. Wu, X. H. Chen, J. Hu, , et al., Nat. Phys. 5,555 (2009).
25 T.-M. Chuang, M. P. Allan, J. Lee, Y. Xie, N. Ni, S. L.Bud’ko, G. S. Boebinger, P. C. Canfield, and J. C. Davis,Science 327, 181 (2010).
26 W.-C. Lee and C. Wu, Phys. Rev. Lett. 103, 176101
12
(2009).27 W. Lv, F. Kruger, and P. Phillips, Phys. Rev. B 82, 045125
(2010).28 C. Chen, J. Maciejko, A. P. Sorini, B. Moritz, R. R. P.
Singh, and T. P. Devereaux, arXiv.org:1004.4611 (2010).29 P. Coleman and A. J. Schofield, Nature 433, 226 (2005).30 H. v. Lohneysen, A. Rosch, M. Vojta, and P. Wolfle, Rev.
Mod. Phys. 79, 1015 (2007).31 J. A. Hertz, Phys. Rev. B 14, 1165 (1976).32 A. J. Millis, Phys. Rev. B 48, 7183 (1993).33 A. W. Rost, R. S. Perry, J.-F. Mercure, A. P. Mackenzie,
and S. A. Grigera, Science 325, 1360 (2009).34 A. W. Rost, A. M. Berridge, R. S. Perry, J.-F. Mercure,
S. A. Grigera, and A. P. Mackenzie, Phys. Status Solidi B247, 513 (2010).
35 K. Iwaya, S. Satow, T. Hanaguri, N. Shannon, Y. Yoshida,S. I. Ikeda, J. P. He, Y. Kaneko, Y. Tokura, T. Yamada,et al., Phys. Rev. Lett. 99, 057208 (2007).
36 D. Singh and I. Mazin, Phys. Rev. B 63, 165101 (2001).37 A. Liebsch and A. Lichtenstein, Phys. Rev. Lett. 84, 1591
(2000).38 I. Eremin, D. Manske, and K. Bennemann, Phys. Rev. B
65, 220502 (2002).39 J. Farrell, R. S. Perry, A. Rost, J. F. Mercure, N. Kiku-
gawa, S. A. Grigera, and A. P. Mackenzie, Phys. Rev. B78, 180409 (2008).
40 J. Tersoff and D. Hamann, Phys. Rev. Lett. 50, 1998(1983).
41 Y. Zhang, V. W. Brar, F. Wang, C. Girit, Y. Yayon,M. Panlasigui, A. Zettl, and M. F. Crommie, Nat. Phys.4, 627 (2008).
42 P. C. Hammel, B. W. Statt, R. L. Martin, F. C. Chou,D. C. Johnston, and S.-W. Cheong, Phys. Rev. B 57, R712(1998).
43 G. B. Teitel’baum, B. Buchner, and H. de Gronckel, Phys.Rev. Lett. 84, 2949 (2000).
44 P. M. Singer, A. W. Hunt, and T. Imai, Phys. Rev. Lett.88, 047602 (2002).
45 G. Lang, H.-J. Grafe, D. Paar, F. Hammerath, K. Man-they, G. Behr, J. Werner, and B. Buchner, Phys. Rev. Lett.104, 097001 (2010).
46 K. Ishida, Y. Kitaoka, K. Asayama, S. Ikeda, S. Nishizaki,Y. Maeno, K. Yoshida, and T. Fujita, Phys. Rev. B 56,R505 (1997).
47 J. E. Hirsch, Phys. Rev. B 59, 6256 (1999).48 Y. Okimoto, T. Katsufuji, T. Ishikawa, A. Urushibara,
T. Arima, and Y. Tokura, Phys. Rev. Lett. 75, 109 (1995).49 Y. Okimoto, T. Katsufuji, T. Ishikawa, T. Arima, and
Y. Tokura, Phys. Rev. B 55, 4206 (1997).50 D. N. Basov and T. Timusk, Rev. Mod. Phys. 77, 721
(2005).51 A. D. LaForge, W. J. Padilla, K. S. Burch, Z. Q. Li, A. A.
Schafgans, K. Segawa, Y. Ando, and D. N. Basov, Phys.Rev. Lett. 101, 097008 (2008).