Microsatellite markers of water buffalo, Bubalus bubalis - development, characterisation and linkage...
7
BioMed Central Open Access Page 1 of 7 (page number not for citation purposes) BMC Genetics Research article Microsatellite markers of water buffalo, Bubalus bubalis - development, characterisation and linkage disequilibrium studies Muniyandi Nagarajan, Niraj Kumar, Gopala Nishanth, Ramachandran Haribaskar, Karthikeyani Paranthaman, Jalaj Gupta, Manish Mishra, R Vaidhegi, Shantanu Kumar, Amresh K Ranjan and Satish Kumar* Address: Centre for Cellular and Molecular Biology, Uppal Road, Hyderabad-500007, India Email: Muniyandi Nagarajan - [email protected]; Niraj Kumar - [email protected]; Gopala Nishanth - [email protected]; Ramachandran Haribaskar - [email protected]; Karthikeyani Paranthaman - [email protected]; Jalaj Gupta - [email protected]; Manish Mishra - [email protected]; R Vaidhegi - [email protected]; Shantanu Kumar - [email protected]; Amresh K Ranjan - [email protected]; Satish Kumar* - [email protected] * Corresponding author Abstract Background: Microsatellite markers are highly polymorphic and widely used in genome mapping and population genetic studies in livestock species. River buffalo, Bubalus bubalis is an economically important livestock species, though only a limited number of microsatellite markers have been reported thus far in this species. Results: In the present study, using two different approaches 571 microsatellite markers have been characterized for water buffalo. Of the 571 microsatellite markers, 498 were polymorphic with average heterozygosity of 0.51 on a panel of 24 unrelated buffalo. Fisher exact test was used to detect LD between the marker pairs. Among the 137550 pairs of marker combination, 14.58% pairs showed significant LD (P < 0.05). Further to check the suitability of these microsatellite markers to map these on a radiation hybrid map of buffalo genome, the markers were tested on Chinese hamster genomic DNA for amplification. Only seven of these markers showed amplification in Chinese hamster, and thus 564, of these can be added to the radiation hybrid map of this species. Conclusion: The high conservation of cattle microsatellite loci in water buffalo promises the usefulness of the cattle microsatellites markers on buffalo. The polymorphic markers characterised in this study will contribute to genetic linkage and radiation hybrid mapping of water buffalo and population genetic studies. Background Genetic maps provide new insights into genome structure and chromosomal architecture of the genome, and also serve as framework for identification and location of genes linked with economically important traits. Except for water buffalo, the genetic maps have been reported for Published: 21 October 2009 BMC Genetics 2009, 10:68 doi:10.1186/1471-2156-10-68 Received: 5 May 2009 Accepted: 21 October 2009 This article is available from: http://www.biomedcentral.com/1471-2156/10/68 © 2009 Nagarajan et al; licensee BioMed Central Ltd. This is an Open Access article distributed under the terms of the Creative Commons Attribution License (http://creativecommons.org/licenses/by/2.0 ), which permits unrestricted use, distribution, and reproduction in any medium, provided the original work is properly cited.
-
Upload
independent -
Category
Documents
-
view
3 -
download
0
Transcript of Microsatellite markers of water buffalo, Bubalus bubalis - development, characterisation and linkage...
BioMed Central
ss
BMC Genetics
Open AcceResearch articleMicrosatellite markers of water buffalo, Bubalus bubalis - development, characterisation and linkage disequilibrium studiesMuniyandi Nagarajan, Niraj Kumar, Gopala Nishanth, Ramachandran Haribaskar, Karthikeyani Paranthaman, Jalaj Gupta, Manish Mishra, R Vaidhegi, Shantanu Kumar, Amresh K Ranjan and Satish Kumar*
Address: Centre for Cellular and Molecular Biology, Uppal Road, Hyderabad-500007, India
Email: Muniyandi Nagarajan - [email protected]; Niraj Kumar - [email protected]; Gopala Nishanth - [email protected]; Ramachandran Haribaskar - [email protected]; Karthikeyani Paranthaman - [email protected]; Jalaj Gupta - [email protected]; Manish Mishra - [email protected]; R Vaidhegi - [email protected]; Shantanu Kumar - [email protected]; Amresh K Ranjan - [email protected]; Satish Kumar* - [email protected]
* Corresponding author
AbstractBackground: Microsatellite markers are highly polymorphic and widely used in genome mappingand population genetic studies in livestock species. River buffalo, Bubalus bubalis is an economicallyimportant livestock species, though only a limited number of microsatellite markers have beenreported thus far in this species.
Results: In the present study, using two different approaches 571 microsatellite markers havebeen characterized for water buffalo. Of the 571 microsatellite markers, 498 were polymorphicwith average heterozygosity of 0.51 on a panel of 24 unrelated buffalo. Fisher exact test was usedto detect LD between the marker pairs. Among the 137550 pairs of marker combination, 14.58%pairs showed significant LD (P < 0.05). Further to check the suitability of these microsatellitemarkers to map these on a radiation hybrid map of buffalo genome, the markers were tested onChinese hamster genomic DNA for amplification. Only seven of these markers showedamplification in Chinese hamster, and thus 564, of these can be added to the radiation hybrid mapof this species.
Conclusion: The high conservation of cattle microsatellite loci in water buffalo promises theusefulness of the cattle microsatellites markers on buffalo. The polymorphic markers characterisedin this study will contribute to genetic linkage and radiation hybrid mapping of water buffalo andpopulation genetic studies.
BackgroundGenetic maps provide new insights into genome structureand chromosomal architecture of the genome, and also
serve as framework for identification and location ofgenes linked with economically important traits. Exceptfor water buffalo, the genetic maps have been reported for
Published: 21 October 2009
BMC Genetics 2009, 10:68 doi:10.1186/1471-2156-10-68
Received: 5 May 2009Accepted: 21 October 2009
This article is available from: http://www.biomedcentral.com/1471-2156/10/68
© 2009 Nagarajan et al; licensee BioMed Central Ltd. This is an Open Access article distributed under the terms of the Creative Commons Attribution License (http://creativecommons.org/licenses/by/2.0), which permits unrestricted use, distribution, and reproduction in any medium, provided the original work is properly cited.
Page 1 of 7(page number not for citation purposes)
BMC Genetics 2009, 10:68 http://www.biomedcentral.com/1471-2156/10/68
most of the important livestock species. Water buffalo(Bubalus bubalis) is one among the important livestockspecies and has a wide geographical distribution in theIndian sub-continent, Middle East, Eastern Europe andseveral other Asian countries. To develop genetic maps ofwater buffalo, identification and characterisation of poly-morphic microsatellite markers is a prerequisite.
Microsatellite markers are tandemly repeated short DNAsequences, often highly polymorphic. These have proveduseful in marker assisted selection of desirable traits towhich they are linked; hence are the markers of choice forgenome mapping studies [1]. The repeat-flankingsequences of microsatellite loci are often conservedbetween closely related species [2,3], thus allowing crossspecies amplification on related species for which micros-atellite markers have not been developed. Such anapproach has been proved effective by several previousstudies including by us [4]. A large number of microsatel-lite loci have been characterized for domesticated cattle[5-7], although in the recent past a very few studies haveused cattle microsatellite markers to amplify on water buf-falo genome [2,4]. The number of microsatellite markersdeveloped for buffalo has been very small. In our earlierstudy, we have used 108 cattle markers to amplify buffalomicrosatellite loci, of the 108 markers 81 were amplifiedand 61 were polymorphic in buffalo genome. Mostimportantly, no de-novo microsatellite markers have beenreported for this species. In the present study, we havecharacterised 571 microsatellite markers for water buffalousing two different approaches and tested their suitabilityin construction of genome map for water buffalo.
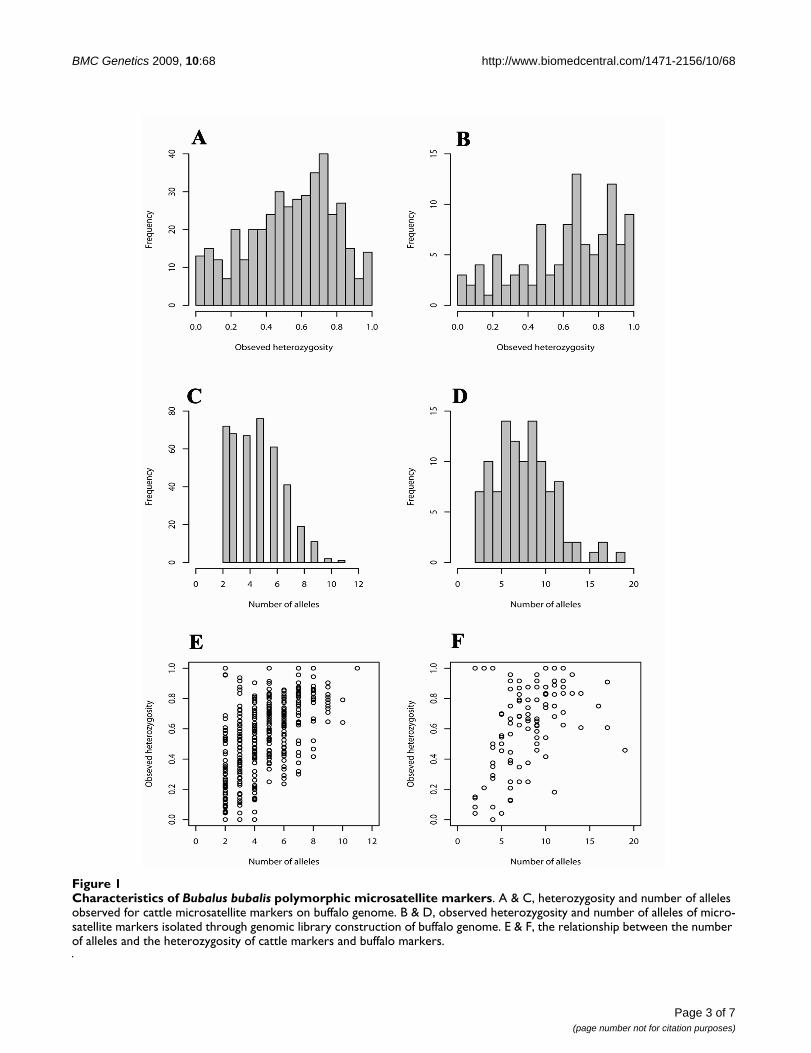
ResultsA total of five hundred and ninety four cattle microsatel-lite primer pairs were tested for amplification on waterbuffalo genomic DNA. Of the 594 primer pairs tested, 457(76.9%) gave discrete amplification products. Of theseamplified products, 391 (85.5%) were polymorphic [seeAdditional file 1] and the remaining 66 (14.5%) weremonomorphic [see Additional file 2] on a panel of 24unrelated Murrah buffaloes. The average number of alle-les per polymorphic locus was 4.64, ranging from 2 to11(Figure 1C & Additional file 1). The values of observedheterozygosity ranged from 0 to 1 (52.08%) against theexpected heterozygosity values from 0.04 to 0.88 (Figure1A & Additional file 1). Of the 391 polymorphic loci, 24loci showed significant departure from Hardy-Weinbergequilibrium after applying bonferroni correction.
To further generate new microsatellite markers for buffalogenome, we constructed a small insert library. Four hun-dred sixty clones hybridizing to CA/GA repeats werepicked up and the plasmid DNA was isolated and insertswere sequenced from both directions. Out of these, 303
sequences contained microsatellite repeat motif, fromwhich 177 sequences were selected to design primersbased on the GC content and length of the flankingregion. Of which, 114 primer pairs amplified discreteproducts [see Additional file 3 &4] and 107 of the corre-sponding loci revealed extensive polymorphism. Thenumber of alleles per locus ranged from 2 to 19 with anaverage of 8.04 (Figure 1D & Additional file 3). Theobserved heterozygosity of the polymorphic markersranged from 0 to 1 (62.29%) against the expected hetero-zygosity values from 0.05 to 0.93 (Figure 1B & Additionalfile 3). Of the 107 polymorphic loci, 32 loci significantly(P < 0.05) deviated from the Hardy-Weinberg equilibriumafter the bonferroni correction [see Additional file 3].
Thus, we have characterised 498 polymorphic microsatel-lite markers in this study for an economically importantlivestock species, Bubalus bubalis. The average number ofalleles observed was 5.37 for all the 498 markers, whereasthe average heterozygosity was 0.51. The markers with ahigh number of alleles tended to be more heterozygouswhereas the markers with a small number of alleles exhib-ited diverse level of heterozygosity (Figure 1E &1F).
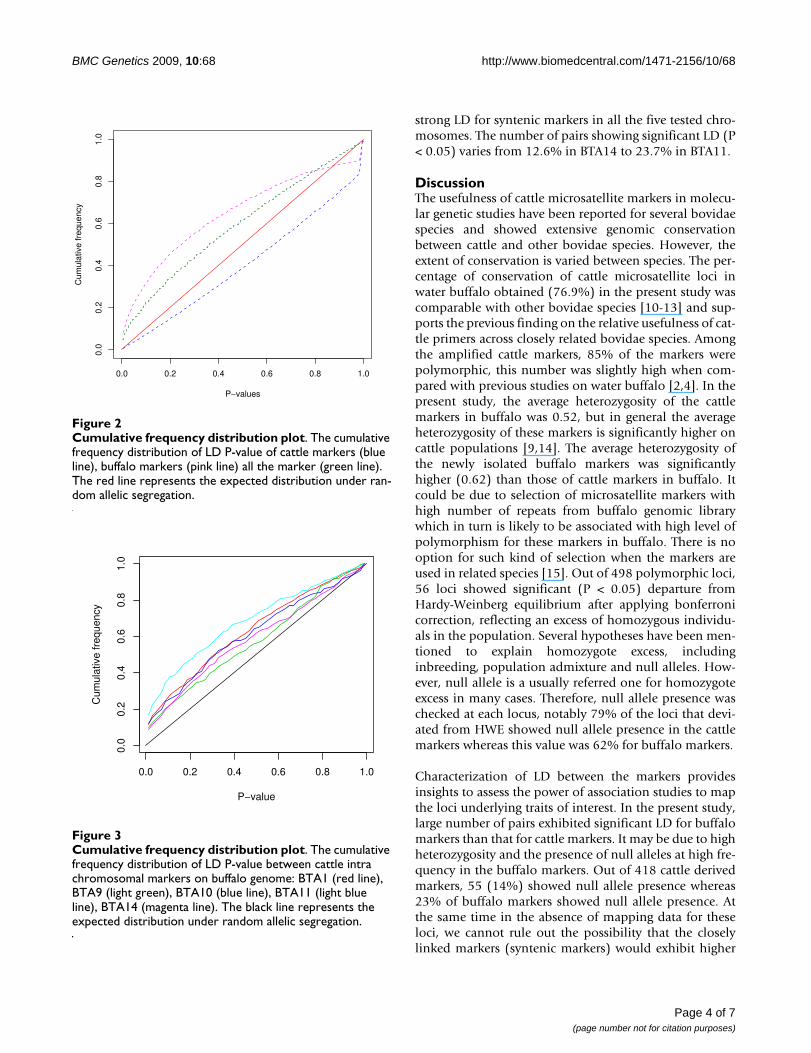
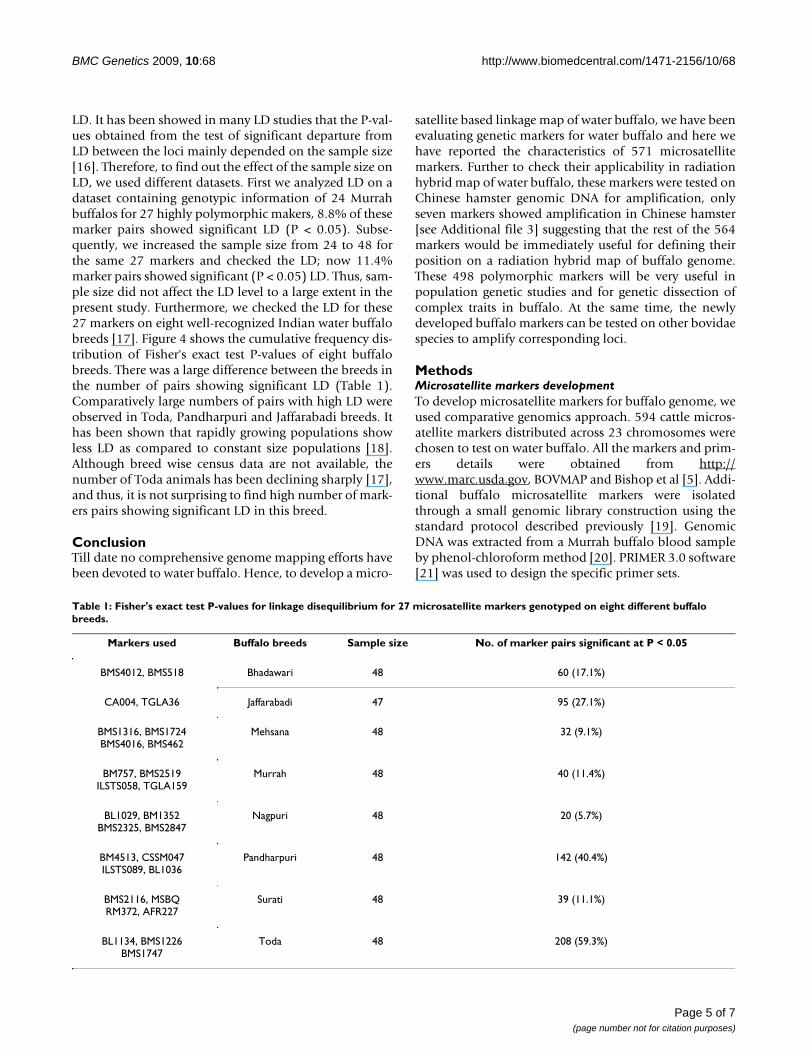
Linkage disequilibriumThe statistical significance of the linkage disequilibriumamong 525 microsatellite loci, including 27 markers char-acterised by us earlier [4], was tested by Fisher's exact test.LD P-values were obtained for 137550 pairs of markerscombinations. Out of these, 20064 (14.58%) pairsshowed significant LD at P < 0.05 and 10380 (7.5%) pairsat P < 0.01. Since large number of tests were performed forseveral markers combinations it was expected that somepairs of markers would show significant LD. Thus, a Bon-ferroni correction for multiple testing would result in lossof power to detect LD [8,9]. Instead, we made a plot forthe cumulative frequency distribution of P-values. Underthe null hypothesis of random allelic association, theexpected cumulative frequency distribution of P-values ison the diagonal of the graph in Figure 2. The cumulativefrequency of P values significantly departed from the dis-tribution expected under the random allelic association(Figure 2) suggesting substantial level of LD between themarkers used in this study. We also checked the LD signif-icance for cattle and buffalo markers independently. Outof 87153 pairs of cattle markers, 12.9% showed signifi-cant LD (P < 0.05) whereas 47.2% pairs of buffalo mark-ers (out of 5671 pairs) showed significant LD (P < 0.05).Further, we wanted to know how the LD behaved betweenintra chromosomal markers. Thus we sorted out the cattlemarkers, based on the cattle map and we chose five chro-mosomes (BTA1, BTA9, BTA10, BTA11 & BTA14) withreasonable number of markers (24 to 35). As expected thedistribution of the P values between syntenic markerslargely departed from the diagonal (Figure 3), indicating
Page 2 of 7(page number not for citation purposes)
BMC Genetics 2009, 10:68 http://www.biomedcentral.com/1471-2156/10/68
Page 3 of 7(page number not for citation purposes)
Characteristics of Bubalus bubalis polymorphic microsatellite markersFigure 1Characteristics of Bubalus bubalis polymorphic microsatellite markers. A & C, heterozygosity and number of alleles observed for cattle microsatellite markers on buffalo genome. B & D, observed heterozygosity and number of alleles of micro-satellite markers isolated through genomic library construction of buffalo genome. E & F, the relationship between the number of alleles and the heterozygosity of cattle markers and buffalo markers.
BMC Genetics 2009, 10:68 http://www.biomedcentral.com/1471-2156/10/68
strong LD for syntenic markers in all the five tested chro-mosomes. The number of pairs showing significant LD (P< 0.05) varies from 12.6% in BTA14 to 23.7% in BTA11.
DiscussionThe usefulness of cattle microsatellite markers in molecu-lar genetic studies have been reported for several bovidaespecies and showed extensive genomic conservationbetween cattle and other bovidae species. However, theextent of conservation is varied between species. The per-centage of conservation of cattle microsatellite loci inwater buffalo obtained (76.9%) in the present study wascomparable with other bovidae species [10-13] and sup-ports the previous finding on the relative usefulness of cat-tle primers across closely related bovidae species. Amongthe amplified cattle markers, 85% of the markers werepolymorphic, this number was slightly high when com-pared with previous studies on water buffalo [2,4]. In thepresent study, the average heterozygosity of the cattlemarkers in buffalo was 0.52, but in general the averageheterozygosity of these markers is significantly higher oncattle populations [9,14]. The average heterozygosity ofthe newly isolated buffalo markers was significantlyhigher (0.62) than those of cattle markers in buffalo. Itcould be due to selection of microsatellite markers withhigh number of repeats from buffalo genomic librarywhich in turn is likely to be associated with high level ofpolymorphism for these markers in buffalo. There is nooption for such kind of selection when the markers areused in related species [15]. Out of 498 polymorphic loci,56 loci showed significant (P < 0.05) departure fromHardy-Weinberg equilibrium after applying bonferronicorrection, reflecting an excess of homozygous individu-als in the population. Several hypotheses have been men-tioned to explain homozygote excess, includinginbreeding, population admixture and null alleles. How-ever, null allele is a usually referred one for homozygoteexcess in many cases. Therefore, null allele presence waschecked at each locus, notably 79% of the loci that devi-ated from HWE showed null allele presence in the cattlemarkers whereas this value was 62% for buffalo markers.
Characterization of LD between the markers providesinsights to assess the power of association studies to mapthe loci underlying traits of interest. In the present study,large number of pairs exhibited significant LD for buffalomarkers than that for cattle markers. It may be due to highheterozygosity and the presence of null alleles at high fre-quency in the buffalo markers. Out of 418 cattle derivedmarkers, 55 (14%) showed null allele presence whereas23% of buffalo markers showed null allele presence. Atthe same time in the absence of mapping data for theseloci, we cannot rule out the possibility that the closelylinked markers (syntenic markers) would exhibit higher
Cumulative frequency distribution plotFigure 3Cumulative frequency distribution plot. The cumulative frequency distribution of LD P-value between cattle intra chromosomal markers on buffalo genome: BTA1 (red line), BTA9 (light green), BTA10 (blue line), BTA11 (light blue line), BTA14 (magenta line). The black line represents the expected distribution under random allelic segregation.
0.0 0.2 0.4 0.6 0.8 1.0
0.0
0.2
0.4
0.6
0.8
1.0
P−value
Cum
ulat
ive
freq
uenc
y
Cumulative frequency distribution plotFigure 2Cumulative frequency distribution plot. The cumulative frequency distribution of LD P-value of cattle markers (blue line), buffalo markers (pink line) all the marker (green line). The red line represents the expected distribution under ran-dom allelic segregation.
0.0 0.2 0.4 0.6 0.8 1.0
0.0
0.2
0.4
0.6
0.8
1.0
P−values
Cum
ulat
ive
freq
uenc
y
Page 4 of 7(page number not for citation purposes)
BMC Genetics 2009, 10:68 http://www.biomedcentral.com/1471-2156/10/68
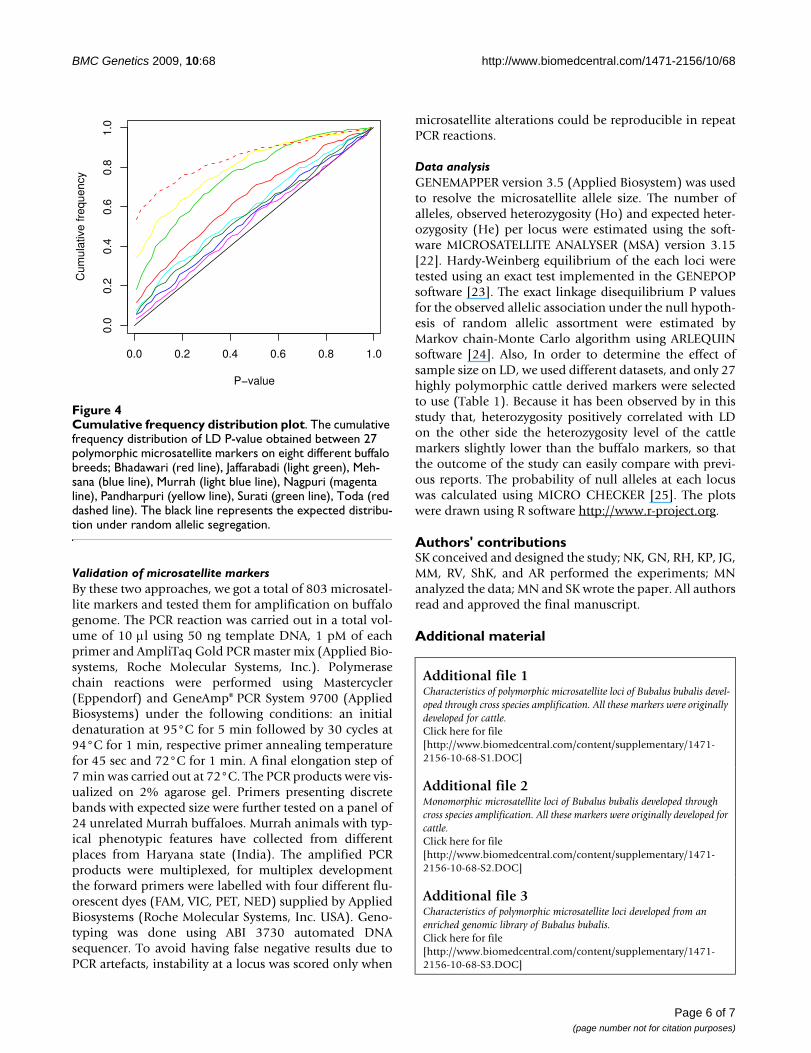
LD. It has been showed in many LD studies that the P-val-ues obtained from the test of significant departure fromLD between the loci mainly depended on the sample size[16]. Therefore, to find out the effect of the sample size onLD, we used different datasets. First we analyzed LD on adataset containing genotypic information of 24 Murrahbuffalos for 27 highly polymorphic makers, 8.8% of thesemarker pairs showed significant LD (P < 0.05). Subse-quently, we increased the sample size from 24 to 48 forthe same 27 markers and checked the LD; now 11.4%marker pairs showed significant (P < 0.05) LD. Thus, sam-ple size did not affect the LD level to a large extent in thepresent study. Furthermore, we checked the LD for these27 markers on eight well-recognized Indian water buffalobreeds [17]. Figure 4 shows the cumulative frequency dis-tribution of Fisher's exact test P-values of eight buffalobreeds. There was a large difference between the breeds inthe number of pairs showing significant LD (Table 1).Comparatively large numbers of pairs with high LD wereobserved in Toda, Pandharpuri and Jaffarabadi breeds. Ithas been shown that rapidly growing populations showless LD as compared to constant size populations [18].Although breed wise census data are not available, thenumber of Toda animals has been declining sharply [17],and thus, it is not surprising to find high number of mark-ers pairs showing significant LD in this breed.
ConclusionTill date no comprehensive genome mapping efforts havebeen devoted to water buffalo. Hence, to develop a micro-
satellite based linkage map of water buffalo, we have beenevaluating genetic markers for water buffalo and here wehave reported the characteristics of 571 microsatellitemarkers. Further to check their applicability in radiationhybrid map of water buffalo, these markers were tested onChinese hamster genomic DNA for amplification, onlyseven markers showed amplification in Chinese hamster[see Additional file 3] suggesting that the rest of the 564markers would be immediately useful for defining theirposition on a radiation hybrid map of buffalo genome.These 498 polymorphic markers will be very useful inpopulation genetic studies and for genetic dissection ofcomplex traits in buffalo. At the same time, the newlydeveloped buffalo markers can be tested on other bovidaespecies to amplify corresponding loci.
MethodsMicrosatellite markers developmentTo develop microsatellite markers for buffalo genome, weused comparative genomics approach. 594 cattle micros-atellite markers distributed across 23 chromosomes werechosen to test on water buffalo. All the markers and prim-ers details were obtained from http://www.marc.usda.gov, BOVMAP and Bishop et al [5]. Addi-tional buffalo microsatellite markers were isolatedthrough a small genomic library construction using thestandard protocol described previously [19]. GenomicDNA was extracted from a Murrah buffalo blood sampleby phenol-chloroform method [20]. PRIMER 3.0 software[21] was used to design the specific primer sets.
Table 1: Fisher's exact test P-values for linkage disequilibrium for 27 microsatellite markers genotyped on eight different buffalo breeds.
Markers used Buffalo breeds Sample size No. of marker pairs significant at P < 0.05
BMS4012, BMS518 Bhadawari 48 60 (17.1%)
CA004, TGLA36 Jaffarabadi 47 95 (27.1%)
BMS1316, BMS1724BMS4016, BMS462
Mehsana 48 32 (9.1%)
BM757, BMS2519ILSTS058, TGLA159
Murrah 48 40 (11.4%)
BL1029, BM1352BMS2325, BMS2847
Nagpuri 48 20 (5.7%)
BM4513, CSSM047ILSTS089, BL1036
Pandharpuri 48 142 (40.4%)
BMS2116, MSBQRM372, AFR227
Surati 48 39 (11.1%)
BL1134, BMS1226BMS1747
Toda 48 208 (59.3%)
Page 5 of 7(page number not for citation purposes)
BMC Genetics 2009, 10:68 http://www.biomedcentral.com/1471-2156/10/68
Validation of microsatellite markersBy these two approaches, we got a total of 803 microsatel-lite markers and tested them for amplification on buffalogenome. The PCR reaction was carried out in a total vol-ume of 10 μl using 50 ng template DNA, 1 pM of eachprimer and AmpliTaq Gold PCR master mix (Applied Bio-systems, Roche Molecular Systems, Inc.). Polymerasechain reactions were performed using Mastercycler(Eppendorf) and GeneAmp® PCR System 9700 (AppliedBiosystems) under the following conditions: an initialdenaturation at 95°C for 5 min followed by 30 cycles at94°C for 1 min, respective primer annealing temperaturefor 45 sec and 72°C for 1 min. A final elongation step of7 min was carried out at 72°C. The PCR products were vis-ualized on 2% agarose gel. Primers presenting discretebands with expected size were further tested on a panel of24 unrelated Murrah buffaloes. Murrah animals with typ-ical phenotypic features have collected from differentplaces from Haryana state (India). The amplified PCRproducts were multiplexed, for multiplex developmentthe forward primers were labelled with four different flu-orescent dyes (FAM, VIC, PET, NED) supplied by AppliedBiosystems (Roche Molecular Systems, Inc. USA). Geno-typing was done using ABI 3730 automated DNAsequencer. To avoid having false negative results due toPCR artefacts, instability at a locus was scored only when
microsatellite alterations could be reproducible in repeatPCR reactions.
Data analysisGENEMAPPER version 3.5 (Applied Biosystem) was usedto resolve the microsatellite allele size. The number ofalleles, observed heterozygosity (Ho) and expected heter-ozygosity (He) per locus were estimated using the soft-ware MICROSATELLITE ANALYSER (MSA) version 3.15[22]. Hardy-Weinberg equilibrium of the each loci weretested using an exact test implemented in the GENEPOPsoftware [23]. The exact linkage disequilibrium P valuesfor the observed allelic association under the null hypoth-esis of random allelic assortment were estimated byMarkov chain-Monte Carlo algorithm using ARLEQUINsoftware [24]. Also, In order to determine the effect ofsample size on LD, we used different datasets, and only 27highly polymorphic cattle derived markers were selectedto use (Table 1). Because it has been observed by in thisstudy that, heterozygosity positively correlated with LDon the other side the heterozygosity level of the cattlemarkers slightly lower than the buffalo markers, so thatthe outcome of the study can easily compare with previ-ous reports. The probability of null alleles at each locuswas calculated using MICRO CHECKER [25]. The plotswere drawn using R software http://www.r-project.org.
Authors' contributionsSK conceived and designed the study; NK, GN, RH, KP, JG,MM, RV, ShK, and AR performed the experiments; MNanalyzed the data; MN and SK wrote the paper. All authorsread and approved the final manuscript.
Additional material
Additional file 1Characteristics of polymorphic microsatellite loci of Bubalus bubalis devel-oped through cross species amplification. All these markers were originally developed for cattle.Click here for file[http://www.biomedcentral.com/content/supplementary/1471-2156-10-68-S1.DOC]
Additional file 2Monomorphic microsatellite loci of Bubalus bubalis developed through cross species amplification. All these markers were originally developed for cattle.Click here for file[http://www.biomedcentral.com/content/supplementary/1471-2156-10-68-S2.DOC]
Additional file 3Characteristics of polymorphic microsatellite loci developed from an enriched genomic library of Bubalus bubalis.Click here for file[http://www.biomedcentral.com/content/supplementary/1471-2156-10-68-S3.DOC]
Cumulative frequency distribution plotFigure 4Cumulative frequency distribution plot. The cumulative frequency distribution of LD P-value obtained between 27 polymorphic microsatellite markers on eight different buffalo breeds; Bhadawari (red line), Jaffarabadi (light green), Meh-sana (blue line), Murrah (light blue line), Nagpuri (magenta line), Pandharpuri (yellow line), Surati (green line), Toda (red dashed line). The black line represents the expected distribu-tion under random allelic segregation.
0.0 0.2 0.4 0.6 0.8 1.0
0.0
0.2
0.4
0.6
0.8
1.0
P−value
Cum
ulat
ive
freq
uenc
y
Page 6 of 7(page number not for citation purposes)
BMC Genetics 2009, 10:68 http://www.biomedcentral.com/1471-2156/10/68
Publish with BioMed Central and every scientist can read your work free of charge
"BioMed Central will be the most significant development for disseminating the results of biomedical research in our lifetime."
Sir Paul Nurse, Cancer Research UK
Your research papers will be:
available free of charge to the entire biomedical community
peer reviewed and published immediately upon acceptance
cited in PubMed and archived on PubMed Central
yours — you keep the copyright
Submit your manuscript here:http://www.biomedcentral.com/info/publishing_adv.asp
BioMedcentral
AcknowledgementsWe thank Mr. Ashok Sugandhi, AI Dairy Farm, Hyderabad for permitting us to use their animals and the National Dairy Development Board, Anand, Gujarat, and the Department of Biotechnology, Government of India, New Delhi for the financial assistance.
References1. Kappes SM, Keele JW, Stone RT, McGraw RA, Sonstegard TS, Smith
TP, Lopez-Corrales NL, Beattie CW: A second-generation link-age map of the bovine genome. Genome Res 1997, 7:235-249.
2. Moore SS, Evans D, Byrne K, Barker JS, Tan SG, Vankan D, Hetzel DJ:A set of polymorphic DNA microsatellites useful in swampand river buffalo (Bubalus bubalis). Anim Genet 1995, 26:355-359.
3. Pépin L, Amigues Y, Lépingle A, Berthier JL, Bensaid A, Vaiman D:Sequence conservation of microsatellites between Bos taurus(cattle), Capra hircus (goat) and related species. Examples ofuse in parentage testing and phylogeny analysis. Heredity 1995,74:53-61.
4. Navani N, Jain PK, Gupta S, Sisodia BS, Kumar S: A set of cattlemicrosatellite DNA markers for genome analysis of riverinebuffalo (Bubalus bubalis). Anim Genet 2002, 33:149-154.
5. Bishop MD, Kappes SM, Keele JW, Stone RT, Sunden SL, HawkinsGA, Toldo SS, Fries R, Grosz MD, Yoo J, et al.: A genetic linkagemap for cattle. Genetics 1994, 136:619-639.
6. Barendse W, Armitage SM, Kossarek LM, Shalom A, Kirkpatrick BW,Ryan AM, Clayton D, Li L, Neibergs HL, Zhang N, et al.: A geneticlinkage map of the bovine genome. Nat Genet 1994, 6:227-235.
7. Ihara N, Takasuga A, Mizoshita K, Takeda H, Sugimoto M, MizoguchiY, Hirano T, Itoh T, Watanabe T, Reed KM, Snelling WM, Kappes SM,Beattie CW, Bennett GL, Sugimoto Y: A comprehensive geneticmap of the cattle genome based on 3802 microsatellites.Genome Res 2004, 14:1987-1998.
8. McRae AF, McEwan JC, Dodds KG, Wilson T, Crawford AM, Slate J:Linkage disequilibrium in domestic sheep. Genetics 2002,160:1113-1122.
9. Farnir F, Coppieters W, Arranz JJ, Berzi P, Cambisano N, Grisart B,Karim L, Marcq F, Moreau L, Mni M, Nezer C, Simon P, Vanman-shoven P, Wagenaar D, Georges M: Extensive genome-wide link-age disequilibrium in cattle. Genome Res 2000, 10:220-227.
10. Kim K, Min M, An J, Lee H: Cross-species amplification of Bovi-dae microsatellites and low diversity of the endangeredKorean goral. J Hered 2004, 95:521-525.
11. van Hooft WF, Hanotte O, Wenink PW, Groen AF, Sugimoto Y, PrinsHH, Teale A: Applicability of bovine microsatellite markersfor population genetic studies on African buffalo (Synceruscaffer). Anim Genet 1999, 30:214-220.
12. de Gortari MJ, Freking BA, Kappes SM, Leymaster KA, Crawford AM,Stone RT, Beattie CW: Extensive genomic conservation of cat-tle microsatellite heterozygosity in sheep. Anim Genet 1997,28:274-290.
13. Mommens G, Van Zeveren A, Peelman LJ: Effectiveness of bovinemicrosatellites in resolving paternity cases in Americanbison, Bison bison L. Anim Genet 1998, 29:12-18.
14. Vallejo RL, Li YL, Rogers GW, Ashwell MS: Genetic diversity andbackground linkage disequilibrium in the North AmericanHolstein cattle population. J Dairy Sci 2003, 86:4137-4147.
15. Ellegren H, Primmer CR, Sheldon BC: Microsatellite 'evolution':directionality or bias? Nat Genet 1995, 11:360-362.
16. Ardlie KG, Kruglyak L, Seielstad M: Patterns of linkage disequilib-rium in the human genome. Nat Rev Genet 2002, 3:299-309.
17. Kumar S, Gupta J, Kumar N, Dikshit K, Navani N, Jain P, Nagarajan M:Genetic variation and relationships among eight Indian riv-erine buffalo breeds. Mol Ecol 2006, 15:593-600.
18. Slatkin M: Linkage disequilibrium in growing and stable popu-lations. Genetics 1994, 137:331-336.
19. Edwards KJ, Barker JH, Daly A, Jones C, Karp A: Microsatellitelibraries enriched for several microsatellite sequences inplants. Biotechniques 1996, 20:758-760.
20. Sambrook J, Russell DW: Molecular Cloning: A LaboratoryManual. Cold Spring Harbor Laboratory Press, Cold Spring Harbor,NY; 2001.
21. Rozen S, Skaletsky HJ: Primer3 on the WWW for general usersand for biologist programmers. In Bioinformatics Methods and Pro-tocols: Methods in Molecular Biology Edited by: Krawetz S, Misener S.Humana Press, Totowa, NJ; 2003:365-386.
22. Dieringer D, Schlötterer C: Microsatellite analyzer (MSA): aplatform independent analysis tool for large microsatellitedata sets. Mol Ecol Notes 2003, 3:167-169.
23. Raymond M, Rousset F: GENEPOP (VERSION-1.2) - Popula-tion-genetics software for exact tests and ecumenicism. JHered 1995, 86:248-249.
24. Excoffier L, Laval LG, Schneider S: Arlequin ver. 3.0: An inte-grated software package for population genetics data analy-sis. Evolutionary Bioinformatics Online 2005, 1:47-50.
25. van Oosterhout C, Hutchinson WF, Wills DPM, Shipley P: Micro-checker: software for identifying and correcting genotypingerrors in microsatellite data. Molecular Ecology Notes 2004,4:535-538.
Additional file 4Monomorphic microsatellite loci derived from an enriched genomic library of Bubalus bubalis.Click here for file[http://www.biomedcentral.com/content/supplementary/1471-2156-10-68-S4.DOC]
Page 7 of 7(page number not for citation purposes)
http://www.ncbi.nlm.nih.gov/entrez/query.fcgi?cmd=Retrieve&db=PubMed&dopt=Abstract&list_uids=9074927
http://www.ncbi.nlm.nih.gov/entrez/query.fcgi?cmd=Retrieve&db=PubMed&dopt=Abstract&list_uids=9074927
http://www.ncbi.nlm.nih.gov/entrez/query.fcgi?cmd=Retrieve&db=PubMed&dopt=Abstract&list_uids=7486257
http://www.ncbi.nlm.nih.gov/entrez/query.fcgi?cmd=Retrieve&db=PubMed&dopt=Abstract&list_uids=7852099
http://www.ncbi.nlm.nih.gov/entrez/query.fcgi?cmd=Retrieve&db=PubMed&dopt=Abstract&list_uids=7852099
http://www.ncbi.nlm.nih.gov/entrez/query.fcgi?cmd=Retrieve&db=PubMed&dopt=Abstract&list_uids=7908653
http://www.ncbi.nlm.nih.gov/entrez/query.fcgi?cmd=Retrieve&db=PubMed&dopt=Abstract&list_uids=7908653
http://www.ncbi.nlm.nih.gov/entrez/query.fcgi?cmd=Retrieve&db=PubMed&dopt=Abstract&list_uids=8012383
http://www.ncbi.nlm.nih.gov/entrez/query.fcgi?cmd=Retrieve&db=PubMed&dopt=Abstract&list_uids=8012383
http://www.ncbi.nlm.nih.gov/entrez/query.fcgi?cmd=Retrieve&db=PubMed&dopt=Abstract&list_uids=9345724
http://www.ncbi.nlm.nih.gov/entrez/query.fcgi?cmd=Retrieve&db=PubMed&dopt=Abstract&list_uids=9345724
http://www.ncbi.nlm.nih.gov/entrez/query.fcgi?cmd=Retrieve&db=PubMed&dopt=Abstract&list_uids=9682442
http://www.ncbi.nlm.nih.gov/entrez/query.fcgi?cmd=Retrieve&db=PubMed&dopt=Abstract&list_uids=7493011
http://www.ncbi.nlm.nih.gov/entrez/query.fcgi?cmd=Retrieve&db=PubMed&dopt=Abstract&list_uids=7493011
http://www.ncbi.nlm.nih.gov/entrez/query.fcgi?cmd=Retrieve&db=PubMed&dopt=Abstract&list_uids=8056320
http://www.ncbi.nlm.nih.gov/entrez/query.fcgi?cmd=Retrieve&db=PubMed&dopt=Abstract&list_uids=8056320
http://www.ncbi.nlm.nih.gov/entrez/query.fcgi?cmd=Retrieve&db=PubMed&dopt=Abstract&list_uids=8723911
http://www.ncbi.nlm.nih.gov/entrez/query.fcgi?cmd=Retrieve&db=PubMed&dopt=Abstract&list_uids=8723911