Metabolic control analysis indicates a change of strategy in the treatment of cancer

Similarity in recombination rate and linkage disequilibriumat CYP2C and CYP2D cytochrome P450 gene regions amongEuropeans indicates signs of selection and no advantageof using tagSNPs in population isolatesVille N. Pimenoffa,b, Guillaume Lavalc,e, David Comasd, Jukka U. Paloa, Ivo Gutg,Howard Cannf, Laurent Excoffierc and Antti Sajantilaa
Objective Linkage disequilibrium (LD) and recombination
rate variations are known to vary considerably between
human genome regions and populations mostly because
of the combined effects of mutation, recombination, and
demographic history. Thus, the pattern of LD is a key issue
to disentangle variants associated with complex traits. Here,
we aim to describe the haplotype structure and LD variation
at the pharmacogenetically relevant cytochrome P450 CYP2C
and CYP2D gene regions among European populations.
Methods To assess the haplotype structure, LD pattern,
and recombination rate variations in the clinically
significant CYP2C and CYP2D regions, we genotyped 143
single-nucleotide polymorphisms (SNPs) across these two
genome regions in a diverse set of 11 European population
samples and one sub-Saharan African sample.
Results Our results showed extended patterns of LD and
in general a low rate of recombination at these loci, and a
low degree of allele differentiation for the two cytochrome
P450 regions among Europeans, with the exception of the
Sami and the Finns as European outliers. The Sami sample
showed reduced haplotype diversity and higher LD for the
two cytochrome P450 regions than the other Europeans,
a feature that is proposed to enhance the LD mapping of
underlying common complex traits. However,
recombination hotspots and LD blocks at these two regions
showed highly consistent structures across Europeans
including Finns and Sami. Moreover, we showed that the
CEPH sample has significantly higher tag transferability
among Europeans and a more efficient tagging of both the
rare CYP2C9 and the common CYP2C19 functional variants
than the Sami. Our data set included CYP2C9*3
(rs1057910) and CYP2C19*2 (rs4244285) enzyme activity-
altering variants associated in a recent genome-wide study
with acenocoumarol-induced and warfarin-induced
anticoagulation or to the antiplatelet effect of clopidogrel,
respectively. Including these known activity-altering
variants, we showed the haplotype variation and high
derived allele frequencies of novel recently identified
acenocoumarol genome-wide associated SNPs at CYP2C9
(rs4086116) and CYP2C18 (rs12772169, rs1998591,
rs2104543, rs1042194) loci in a comprehensive set of 11
European populations. Furthermore, a significant frequency
difference of a CYP2C19*2 gene mutation causing variable
drug reactions was observed among Europeans.
Conclusion The CEPH sample representing the general
European population as such in the HapMap project seems
to be the optimal population sample for the LD mapping of
common complex traits among Europeans. Nevertheless, it
is still argued that the unique pattern of LD in the Sami may
offer an advantage for further association mapping,
especially if multiple rare variants play a role in disease
etiology. However, besides the activity-altering CYP2C9*3
(rs1057910) and CYP2C19*2 (rs4244285) variants, the
high derived allele frequencies of novel recently identified
acenocoumarol genome-wide associated SNPs at CYP2C9
(rs4086116) and CYP2C18 (rs12772169, rs1998591,
rs2104543, rs1042194) loci variants indicated that the
CYP2C region may have been influenced by selection. Thus,
this fine-scale haplotype map of the CYP2C and CYP2D
regions may help to choose markers for further association
mapping of complex pharmacogenetic traits at these
loci. Pharmacogenetics and Genomics 22:846–857 �c 2012
Wolters Kluwer Health | Lippincott Williams & Wilkins.
Pharmacogenetics and Genomics 2012, 22:846–857
Keywords: CYP2C, CYP2D, European population, haplotype,linkage disequilibrium, recombination
aLaboratory of Forensic Biology, Department of Forensic Medicine, Hjelt-Institute,University of Helsinki, Helsinki, Finland, bInstitute of Legal Medicine and ForensicSciences, CHARITE – Universitatsmedizin Berlin, Berlin, Germany, cComputationaland Molecular Population Genetics, Zoological Institute, University of Bern, Bern,Switzerland, dInstitute of Evolutionary Biology, Barcelona, Spain, eHuman Evolu-tionary Genetics, Centre National de la Recherche Scientifique, (CNRS-URA3012),Institut Pasteur, fFoundation Jean Dausset-Centre d’Etude du PolymorphismeHumain (CEPH) and gCentre National de Genotypage, Paris, France
Correspondence to Ville N. Pimenoff, PhD, Unit of Infections and Cancer (UNIC),Cancer Epidemiology Research Programme, Institut Catala d’ Oncologia,Bellvitge Biomedical Research Institute (IDIBELL), Catalan Institute of Oncology(ICO), Gran Via 199-203, 08907 L’ Hospitalet de Llobregat, Barcelona, SpainTel: + 34 932 607 812; fax: + 34 932 607 787; e-mail: [email protected]
Received 15 November 2011 Accepted 9 September 2012
IntroductionRecent pharmacogenetic studies have focused on the
genetic variation involved in variable drug reactions and
Supplemental digital content is available for this article. Direct URL citationsappear in the printed text and are provided in the HTML and PDF versions of thisarticle on the journal’s Website (www.pharmacogeneticsandgenomics.com).
846 Original article
1744-6872 �c 2012 Wolters Kluwer Health | Lippincott Williams & Wilkins DOI: 10.1097/FPC.0b013e32835a3a6d
Copyright © Lippincott Williams & Wilkins. Unauthorized reproduction of this article is prohibited.

particularly on characterizing the underlying haplotype
structures of clinically significant cytochrome P450 (CYP)
genes [1–6]. To date, most of the human CYP variants
described are variations associated with monogenically
determined drug reactions (e.g. CYP2C9 and warfarin;
CYP2C19 and clopidogrel; CYP2D6 and tamoxifen) [5].
However, most pharmacogenetic traits are complex, with
several genes and variants affecting drug metabolism and
response [7]. Association mapping [i.e. linkage disequili-
brium (LD) mapping] has been proposed to be a feasible
tool for finding genetic factors involved in common
complex traits by assuming that the disease-causing
variant is linked for a certain amount of time with markers
in its physical vicinity and that the disease etiology is
influenced to a nontrivial degree by a single common
variant in a given gene region [8,9]. However, finding an
association between a phenotype and a marker depends
largely on the distribution of LD in the populations
studied, and LD is known to vary considerably between
genome regions and populations. Therefore, a solid under-
standing of the haplotype structure and LD distribution
at drug-metabolizing enzyme loci in several human
populations is important for association studies of
variation in drug effects determined by the interaction
of multiple genes [7–9].
Two CYP2 gene subfamily regions, CYP2C [10] at 10q24
and CYP2D [11] at 22q13.1, contribute considerably toward
clinically important drug responses [5]. The CYP2C region
contains genes that encode CYP2C8, CYP2C9, CYP2C18,
and CYP2C19 enzymes. The CYP2D region contains the
gene encoding the CYP2D6 enzyme as well as the
CYP2D7 and CYP2D8 pseudogenes. At least three of
these drug-metabolizing enzymes (CYP2C9, CYP2C19,
and CYP2D6) play a crucial role in the metabolic path-
ways of endogenous and exogenous natural substrates
[12]. Furthermore, clinically important drugs such as
antidepressors, neuroleptics, b-blockers, antiarrhythmics,
vitamin K antagonistic anticoagulants, antidiabetic drugs,
proton pump inhibitors, and anti-inflammatory agents are
almost exclusively metabolized by these enzymes [5,12].
To assess the haplotype structure, LD pattern, and
recombination rate variation in clinically significant
cytochrome P450 CYP2C and CYP2D regions, we geno-
typed altogether 143 single-nucleotide polymorphisms
(SNPs) across these two genome regions in a diverse set
of 11 European population samples and one African sample.
These data allowed us to disentangle the complex
European haplotype structures at the CYP2C and CYP2Dsubfamily regions. Our study found extended patterns of
LD and in general a low rate of recombination at these
loci. We also observed a highly consistent recombination
hotspot and LD block structure among Europeans.
Moreover, we found a significant frequency difference
among Europeans in a protein activity-altering mutation
of CYP2C19*2 relevant in drug metabolism and response.
These results may not only be clinically significant but
also valuable for further attempts at mapping complex
pharmacogenetic traits.
Materials and methodsParticipants
We assayed a total of 811 DNAs from unrelated and
ethnically self-identified individuals who provided in-
formed consent and not selected for disease, recruited
from 11 European-populations and one sub-Saharan African
Mandenka (man, n = 56) group. Population samples
recruited from Europe included British (bri, n = 77),
Orcadians (orc, n = 88), Catalans (cat, n = 66), Italians
from Bergamo (ber, n = 82 men), from Piedmont (pie,
n = 59), and from Sicily (sic, n = 59), French Basques
(bas, n = 76), Finns (fin, n = 71), Roma from Spain (rom,
n = 62), Sami from the Kola peninsula (saa, n = 49), and
individuals from the CEPH northern and western
European reference families (cep, n = 66).
Genotypes
A total of 55 common SNPs in the CYP2C region and 97
SNPs in the CYP2D region were genotyped at the Centre
National de Genotypage, Evry, France, using the Illumina-
Beadarray Platform (Illumina, San Diego, California,
USA) [13]. All the SNPs were chosen with a minor allele
frequency (MAF) of at least 0.05 in dbSNP and a mean
spacing of 7.8 and 7.6 kb for the CYP2C (B400 kb) and
CYP2D (B702 kb) regions, respectively. Genotype data
were loaded into a database within the SNPator web
server (http://bioinformatica.cegen.upf.es) [14], and further
quality control tests were carried out. Fifty SNPs in the
CYP2C and 93 at the CYP2D regions showed at least a
98.5% genotyping call rate for all populations and MAF of
at least 0.05 in at least nine of the 11 European pop-
ulations and were retained for further analysis (Supple-
mentary Table 1, http://links.lww.com/FPC/A516 and Table 2,
http://links.lww.com/FPC/A517). Ancestral alleles for the
SNPs were determined from the snp126orthoPanTro2R-
heMac2 table (http://www.genome.ucsc.edu) by assigning the
chimpanzee orthologous allele as ancestral in humans. In
case of no mammalian ortholog between humans and
chimpanzees, the ancestry was not defined (12 SNPs)
(Supplementary Table 1, http://links.lww.com/FPC/A516 and
Table 2, http://links.lww.com/FPC/A517). Moreover, a wider
set of 623 SNPs spaced across the CYP2C (1 Mb) and 864
SNPs spaced across the CYP2D (1.5 Mb) regions and
genotyped in 90 individuals of European–CEPH origin
were downloaded from the HapMap project database
(released 26 March 2007; http://www.hapmap.org) to com-
pute reference recombination rates for both regions.
Genetic diversity analyses
Locus-specific allele frequencies, Hardy–Weinberg equi-
librium for all populations, and population pairwise FST
values were estimated using Arlequin software v3.0 [15].
Pairwise FST values were visualized by a Neighbor-Joining
tree, constructed using MEGA 4.0 [16]. For each
CYP2C and CYP2D haplotype diversity Pimenoff et al. 847
Copyright © Lippincott Williams & Wilkins. Unauthorized reproduction of this article is prohibited.

population, haplotypes and recombination rates were
inferred separately for the CYP2C (B400 kb) and CYP2D(702 kb) regions genotype using Phase v.2.1 with 1000
iterations [17]. A local recombination hotspot was called
if its recombination rate showed a 10-fold increase over
the median recombination rate [±95% confidence inter-
vals (CIs)] for each region for most European popula-
tions [17,18]. Moreover, the median rate of recombination
for 1 and 1.5 Mb regions was estimated from HapMap
CEU SNP genotype data (MAFZ 0.05) across the CYP2Cand the CYP2D regions, respectively. The correlation
between population recombination rates was assessed
with the Spearman Rank correlation test using SPSS 17.0
(IBM, Somers, New York, USA). In addition, the sig-
nificance of the correlation between population FST
distances and population recombination rate correlations
was assessed using the Mantel test [15] with 10 000
permutations, where the Spearman correlation values
were converted into dissimilarity values by subtracting
them from 1. Independent from haplotype phase estima-
tions, extended haplotype homozygosity for chromosomes
carrying the functional CYP2C19 G/A(derived) variant
(rs4244285 at position 19154) was determined manually
using a method described by Tishkoff et al. [19].
Analysis of extended linkage disequilibrium regions
Metric LD maps [20] expressed in linkage disequilibrium
units (LDUs) were constructed for both genome regions
using diplotype and haplotype data from all 12 popula-
tions. LD blocks were identified by combining adjacent
intervals with widths less than 0.3 LDUs and a recombi-
nation hotspot was called with widths more than 1.0
LDU [21]. The Haploview program v.4.0 was also used to
identify LD blocks within both regions [22]. In this case,
the block definition by Gabriel et al. [23] was used as a
standard estimate, and four gamete [24] and solid
spine [22] estimates of LD blocks were also carried out.
In a more detailed analysis of LD, all pairwise SNP
combinations were tested in each population by estimat-
ing |D0| and r2 from phased genotypes using Arlequin
v3.0 [15]. The significance of pairwise LD determina-
tions was tested using w2 with a Bonferroni correction for
multiple testing [25]. To represent the differential decay
of LD within the extended LD regions, we plotted the r2
values against the intermarker distances (NCBI Build
36.3) and computed the logarithmic best-fit curves for
each population sample. To assess the significant
difference in the r2 pattern for adjacent SNPs within
the extended LD regions among the populations, a
Wilcoxon’s test was applied using SPSS 17.0 (IBM). The
network of inferred common haplotypes (MAFZ 0.05)
within the CYP2C extended LD region was constructed
using program Network v.4.500 (Fluxus Technology Ltd,
Suffolk, UK) and the median-joining algorithm with
weight 1 assumed in all loci, except the eight high-
frequency derived allele loci (Supplementary Table 1,
http://links.lww.com/FPC/A516) and rs1998591 with weight
25 [26]. A correspondence analysis for shared common
haplotypes between populations was carried out using
Statistica (StatSoft, Tulsa, Oklahoma, USA).
TagSNP analysis
To verify the transferability of tags across populations, we
selected tagSNPs within CEPH and Sami populations
(considered as a general European model-population and
isolate-population, respectively) and measured their per-
formance in all other population samples. The pairwise
algorithm of the Tagger program (http://www.broad.mit.edu/mpg/haploview) [22] was used to select the tagSNPs and
an r2 of 0.8 was selected as a threshold for all analyses.
Performance was defined as the number of SNPs in the
evaluated population that had an r2 of more than 0.8 with the
tagSNPs over the total number of SNPs available. Thus, we
also tested the efficiency of the selected tagSNPs to capture
the observed common and rare CYP2C19*2 and CYP2C9*3functional P450 variants observed in this study, respectively.
Results
Allele frequency differences
Derived allele frequencies of 50 and 93 SNPs covering
the CYP2C and CYP2D subfamily regions are shown in
Supplementary Table 1, http://links.lww.com/FPC/A516 and
Table 2, http://links.lww.com/FPC/A517, respectively. None
of the informative SNP loci deviated significantly from
Hardy–Weinberg equilibrium in any of the populations.
The average FST value across both regions together for all
12 populations was 0.036 (95% CI 0.025–0.047), whereas
the corresponding value only among the Europeans was
0.018 (95% CI 0.014–0.022).
Pairwise FST values showed that the sub-Saharan Mandenka
population was clearly an outlier compared with all the
European populations (Fig. 1). The Sami (FST = 0.030–0.053;
P < 0.001) and the Finns (FST = 0.021–0.037; P < 0.001)
were also significantly different from all other European and
from each other (Fig. 1). Moreover, the Basque, the Roma,
and the Orcadian showed genetic differentiation from
general Europeans by being significantly different from
nine out of 10 European populations in this study (Fig. 1).
In contrast, using only the CYP2C region data, the Sami
(FST = 0.037–0.095; P < 0.01) and to some extent the
Basque, the Roma, and the Orcadian were significantly
different from other Europeans (Supplementary Fig. 1A,
http://links.lww.com/FPC/A515), whereas within the CYP2Dregion, only the Sami (0.015–0.039; P < 0.05) and the
Finns (FST = 0.029–0.047; P < 0.01) were significantly
different from other Europeans (Supplementary Fig. 1B,
http://links.lww.com/FPC/A515).
Recombination hotspots and linkage disequilibrium
Using estimates of recombination rates, we identified
three recombination hotspots shared by most of the
848 Pharmacogenetics and Genomics 2012, Vol 22 No 12
Copyright © Lippincott Williams & Wilkins. Unauthorized reproduction of this article is prohibited.

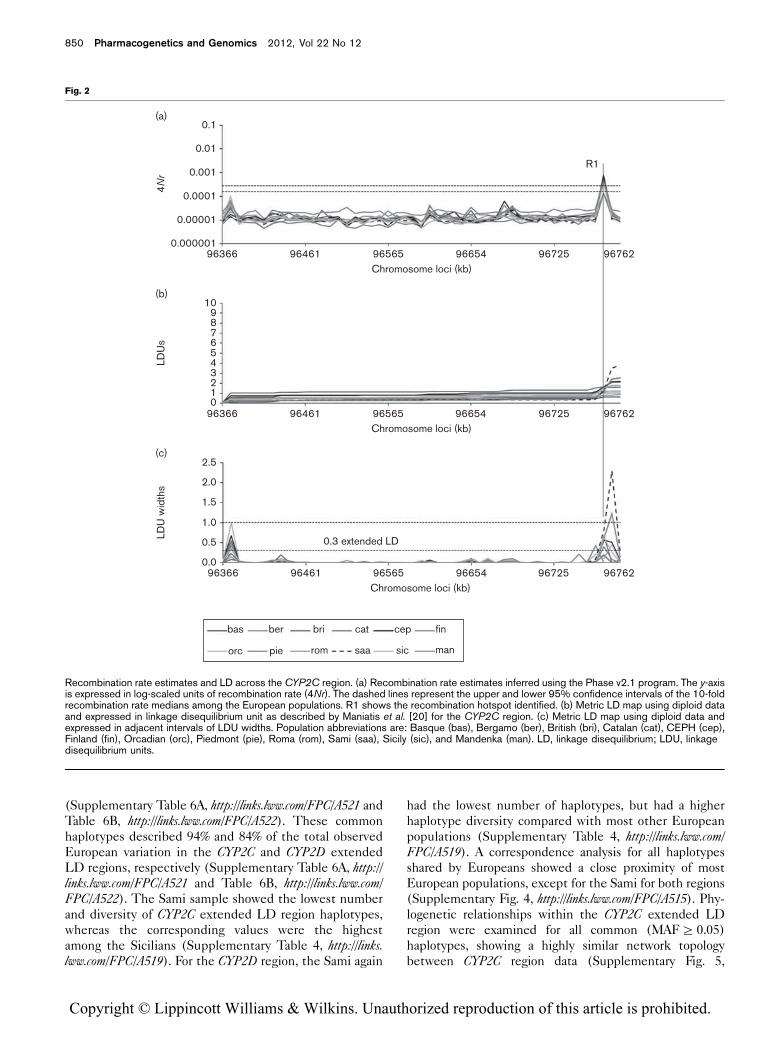
European populations: R1 in the CYP2C region (Fig. 2a),
and R2 and R3 in the CYP2D region (Fig. 3a). Moreover,
differing fluctuations in recombination rate medians among
the populations were observed in both regions. However,
only the R1–R3 positions were proposed as recombination
hotspots as only at these sites the population-specific
recombination rate estimates showed significantly more
than a 10-fold increase compared with the recombination
rate mean of all European populations across each region.
The Spearman rank correlation for the similarity between
recombination rate estimates for Europeans was B20%
higher for the CYP2D region, but mostly significant for
both regions (Supplementary Table 3, http://links.lww.com/FPC/A518). The correlation between population FST
distances and recombination rate correlations for both
regions together was positive and significant for all 12
populations (r = 0.57; P < 0.01) and also without the sub-
Saharan Mandenka population (r = 0.65; P < 0.001). How-
ever, when the two regions were analyzed separately, only
the CYP2D region FST and recombination rate correlation
was positive and significant (r = 0.4; P < 0.02), whereas for
the CYP2C region, the correlation was negative and non-
significant among Europeans (r = – 0.12; P = 0.72).
Metric LD maps either from diploid (Figs 2b and c and
3b and c) or from haploid (Supplementary Fig. 2A and B,
http://links.lww.com/FPC/A515) data show consistent LDU
patterns of steps and plateaus within both regions.
Recombination hotspots defined as an adjacent interval
of LDU widths more than 1.0 show identical locations,
with hotspots R1–R3 identified using recombination rate
estimates (Figs 2a and c and 3a and c). Moreover, extended
high LD regions were observed and only defined by one
block (i.e. adjacent interval of LDU widths <0.3) in the
CYP2C (379.3 kb, defined by 46 SNPs from rs11638 to
rs2185570) and in the CYP2D (303.7 kb, defined by 46
SNPs from rs5751194 to rs134901) regions among all
populations (Figs 2c and 3c, respectively; see also the
corresponding Table 1). A more stringent criterion for LD
blocks (i.e. adjacent intervals with LDU widths equal to
zero) showed that the longest single LD block (362.5 kb)
within the CYP2C region was for Sami and Italians from
Sicily, whereas most other populations had a recombina-
tion step between CYP2C19 and CYP2C9 genes (Figs 2c
and 4a, Table 1, see Supplementary Table 1, http://links.lww.com/FPC/A516 for gene locations). Within the
CYP2D region, all the populations had a recombination
step either at the 30 end of the CYP2D6 gene or within an
intronic region of the TCF20 gene (Table 1; see
Supplementary Table 2, http://links.lww.com/FPC/A517 for
gene locations). The LD blocks, on the basis of the
definition by Gabriel et al. [23] for each European
population, are plotted in Fig. 4a and b. As for the metric
LD maps, most of the CYP2C region was covered by
Haploview LD blocks with a consistent size and loca-
tion across populations, whereas the CYP2D region
showed less LD and more heterogeneity of the existing
blocks among the populations. However, clear extended
LD regions were observed and defined by 1–3 blocks in
the CYP2C (246 kb) and 2–4 blocks in the CYP2D(323 kb) regions for each population (slashed bars,
Fig. 4a and b).
Pairwise LD measures estimated for each European
population within the extended LD CYP2C (379.3 kb, be-
tween rs11638 and rs2185570) and CYP2D region (303.7 kb,
between rs5751194 and rs134901) showed a similar pattern
of the lower proportion of significantly high LD (r2 > 0.8;
P < 0.05) in the CEPH sample and the highest in the
Sami (Supplementary Table 4, http://links.lww.com/FPC/A519).
Clearly, the lowest level of LD was observed in the sub-
Saharan African Mandenka population for both regions
(Supplementary Table 4, http://links.lww.com/FPC/A519).
The decay of r2 with physical distance between all SNP
pairs of extended LD showed the highest level and the
slowest decay of LD in Sami for both the CYP2C region
and within the first 100 kb interval for the CYP2D region
(Supplementary Fig. 3, http://links.lww.com/FPC/A515).
Thus, the only European population with a significantly
different pattern of adjacent marker r2 with respect to all
the others in both regions was the Sami (Supplementary
Table 5, http://links.lww.com/FPC/A515). However, for both
regions, there were considerable heterogeneities in
adjacent marker r2 patterns among the Europeans.
Haplotypes within the extended linkage
disequilibrium region
In total, 63 and 133 haplotypes were estimated for the
CYP2C (B379.3 kb) and CYP2D (B303.7 kb) extended
LD regions, respectively. However, only eight and 10
extended LD region common haplotypes were present at a
frequency of at least 5% in at least one European
population for the CYP2C and CYP2D regions, respectively
Fig. 1
Roma
0.01
PiedmontFinns
Sami
Mandenka
Basque
CEPHSicily
Orcadian
British
BergamoCatalan
Neighbor-Joining tree of population pairwise FST distances between 12studied populations using all 143 SNPs across the CYP2C and theCYP2D regions. SNPs, single-nucleotide polymorphisms.
CYP2C and CYP2D haplotype diversity Pimenoff et al. 849
Copyright © Lippincott Williams & Wilkins. Unauthorized reproduction of this article is prohibited.
(Supplementary Table 6A, http://links.lww.com/FPC/A521 and
Table 6B, http://links.lww.com/FPC/A522). These common
haplotypes described 94% and 84% of the total observed
European variation in the CYP2C and CYP2D extended
LD regions, respectively (Supplementary Table 6A, http://links.lww.com/FPC/A521 and Table 6B, http://links.lww.com/FPC/A522). The Sami sample showed the lowest number
and diversity of CYP2C extended LD region haplotypes,
whereas the corresponding values were the highest
among the Sicilians (Supplementary Table 4, http://links.lww.com/FPC/A519). For the CYP2D region, the Sami again
had the lowest number of haplotypes, but had a higher
haplotype diversity compared with most other European
populations (Supplementary Table 4, http://links.lww.com/FPC/A519). A correspondence analysis for all haplotypes
shared by Europeans showed a close proximity of most
European populations, except for the Sami for both regions
(Supplementary Fig. 4, http://links.lww.com/FPC/A515). Phy-
logenetic relationships within the CYP2C extended LD
region were examined for all common (MAFZ 0.05)
haplotypes, showing a highly similar network topology
between CYP2C region data (Supplementary Fig. 5,
Fig. 2
0.1
0.01
0.001
0.0001
4Nr
LDU
sLD
U w
idth
s
0.00001
0.000001
10(b)
(a)
(c)
9
76543
096461 96654 96725 967629656596366
96461 96654 96725 9676296565
0.3 extended LD
96366
bas ber bri cep
orc saa mansicrompie
fincat
0.0
0.5
1.0
2.0
2.5
1.5
12
8
96366 96461 96565Chromosome loci (kb)
Chromosome loci (kb)
Chromosome loci (kb)
96654 96725 96762
R1
Recombination rate estimates and LD across the CYP2C region. (a) Recombination rate estimates inferred using the Phase v2.1 program. The y-axisis expressed in log-scaled units of recombination rate (4Nr). The dashed lines represent the upper and lower 95% confidence intervals of the 10-foldrecombination rate medians among the European populations. R1 shows the recombination hotspot identified. (b) Metric LD map using diploid dataand expressed in linkage disequilibrium unit as described by Maniatis et al. [20] for the CYP2C region. (c) Metric LD map using diploid data andexpressed in adjacent intervals of LDU widths. Population abbreviations are: Basque (bas), Bergamo (ber), British (bri), Catalan (cat), CEPH (cep),Finland (fin), Orcadian (orc), Piedmont (pie), Roma (rom), Sami (saa), Sicily (sic), and Mandenka (man). LD, linkage disequilibrium; LDU, linkagedisequilibrium units.
850 Pharmacogenetics and Genomics 2012, Vol 22 No 12
Copyright © Lippincott Williams & Wilkins. Unauthorized reproduction of this article is prohibited.

http://links.lww.com/FPC/A515) and the CYP2C9 gene varia-
tion reported by Veenstra et al. [3].
CYP2C locus-altered activity and genome-wide
associated variants
Considering CYP2C9 and CYP2C19 enzymes, individuals
can be classified as extensive, intermediate, and poor
metabolizers (PM). Extensive metabolizers are homo-
zygous for the wild-type allele (i.e. CYP2C9*1 or
CYP2C19*1), intermediate metabolizers have one wild-
type and one altered activity allele (e.g. CYP2C9*3 or
CYP2C19*2), and PM carry two copies of the altered
activity variants. The CYP2C9*2,*3 and CYP2C19*2 variants
are considered to determine the principal altered functional
Fig. 3
0.1(a)
0.01
0.001
0.0001
4Nr
LDU
sLD
U w
idth
s
0.00001
0.00000140569 40651 40721 40778
Chromosome loci (kb)
R2 R3
Chromosome loci (kb)
Chromosome loci (kb)
40954 41009 41083 411894091140513
98
65432
040513
2.5(c)
1.5
1.0
0.5
0.040513
bas ber bri cat cep fin
orc pie rom sic mansaa
40569 40651 40721
0.3 extended LD
40778 40954 41009 41083 4118940911
2.0
40569 40651 40911 411894108341009409544077840721
1
7
10(b)
Recombination rate estimates and LD across the CYP2D region. (a) Recombination rate estimates inferred using the Phase v2.1 program. The y-axisis expressed in log-scaled units of recombination rate (4Nr). The dashed lines represent the upper and lower 95% confidence intervals of the10-fold recombination rate medians among the European populations. R2–3 show the recombination hotspots identified. (b) Metric LD map usingdiploid data and expressed in linkage disequilibrium unit as described by Maniatis et al. [20] for the CYP2D region. (c) Metric LD map usingdiploid data and expressed in adjacent intervals of LDU widths. Population abbreviations are: Basque (bas), Bergamo (ber), British (bri),Catalan (cat), CEPH (cep), Finland (fin), Orcadian (orc), Piedmont (pie), Roma (rom), Sami (saa), Sicily (sic), and Mandenka (man). LD, linkagedisequilibrium; LDU, linkage disequilibrium units.
CYP2C and CYP2D haplotype diversity Pimenoff et al. 851
Copyright © Lippincott Williams & Wilkins. Unauthorized reproduction of this article is prohibited.
substitutions with clinical significance prevalent among
Europeans (see also http://www.imm.ki.se/CYPalleles) [27–29].
Our data set included functional SNPs rs1057910 and
rs4244285 for CYP2C9*3 C– 42614 and CYP2C19*2 A– 19154
variant alleles, respectively (Table 2, see further Supple-
mentary Table 1, http://links.lww.com/FPC/A516). In addition,
to search for evidence of a selective sweep involving
chromosomes with the CYP2C19*2 A– 19154 allele, we
constructed a plot of extended haplotype homozygosity for
ancestral (G) and derived (A) alleles among the European
populations using unphased genotypes (Supplementary
Fig. 6, http://links.lww.com/FPC/A515). In our data, the average
homozygous tract length in A/A-19154 homozygotes (n = 29)
was 385.8 kb compared with 136.8 kb in G/G-19154 homo-
zygotes (n = 523). In addition, our data set included variants
associated in a recent genome-wide study to acenocoumarol
dosage variation [30]: one for CYP2C9 (rs4086116) and four
for the CYP2C18 gene region (rs1998591, rs2104543,
rs12772169, rs1042194). All of these genome-wide associa-
tion (GWA) variants (except rs2104543) showed high
derived allele frequencies (Z0.8) in most of our population
samples.
TagSNP analysis
The numbers of tagSNPs estimated for each population
to capture the underlying haplotype structure for both
regions are shown in Table 3. The Sami sample showed
the lowest of only 12 tagSNPs for the CYP2C region,
whereas the CEPH sample required 20 tags for full
haplotype coverage (Table 3). Similarly, the Sami and the
Finns showed the lowest number of tagSNPs required for
the CYP2D region, whereas the other European popula-
tions required more than 40 tagSNPs to capture the
underlying genetic diversity (Table 3). A more detailed
measure of the CEPH and Sami tagSNP performance
across other European populations for both regions is also
shown in Table 3. The 20 CYP2C region tagSNPs
estimated for the CEPH sample showed a success rate
of at least 0.9 in all other populations, whereas the 12
Sami tagSNPs captured the haplotype structure in other
populations with a significantly lower rate between 0.52
and 0.74 (Table 3). A similar trend was observed in the
CYP2D region: the 41 CEPH tagSNPs showed a success
rate of at least 0.9 in all other European populations,
whereas the 38 Sami tagSNPs showed a significantly
lower success rate in most other Europeans (Table 3).
Furthermore, the 20 CEPH tagSNPs captured both the
rare CYP2C9*3 and the common CYP2C19*2 functional
P450 variant allele (rs1057910 and rs4244285, respec-
tively) in all European populations, but the 12 Sami
tagSNPs captured only the common functional variant in
eight other European populations.
Discussion
Allele frequency differences
The genetic landscape in Europe has been characterized
by relatively short genetic distances between popula-
tions [31]. Similarly, several pharmacogenetically relevant
genes including CYP2C9, CYP2C19, and CYP2D6 and
their functional variants have shown little variation among
Europeans [27,32,33]. Our combined CYP2C and CYP2Ddata of Europeans and the Mandenka population from
Africa showed a similar average range of genetic distance
(B0.04) as observed by Heath et al. [34] in a large whole-
genome SNP study of European, African, and Asian
HapMap populations. Using only the European popula-
tions, our data showed, however, a 10-fold higher average
FST value compared with that obtained by Heath et al. [34].
However, when our outlier populations (i.e. the Sami, the
Finns, the Basque, the Roma, and the Orcadian) were
excluded from the analysis, we observed a similar average
FST value of 0.0031 (95% CI 0.0016–0.0045) as obtained by
Heath et al. [34] among Europeans.
Moreover, our data indicated that the genetic distance
between the Sami or the Finns and any other European
population is on average 10-fold larger than in general
between European populations [34]. For Europeans
including the CEPH sample representing the general
European population as such in the HapMap project, the
locus-specific and population pairwise FST values ob-
served indicated a low degree of allele frequency
differentiation (FST range of 0.0016–0.0045) for the two
cytochrome P450 regions. These results were in agreement
with previous analyses of European populations, including
the Sami and the Finns [31,34,35]. Interestingly, how-
ever, eight and 12 derived allele SNPs with high
frequencies (> 0.8) in at least two populations were
observed for the CYP2C and CYP2D regions, respectively
(Supplementary Table 1, http://links.lww.com/FPC/A516 and
Table 2, http://links.lww.com/FPC/A517). This may indicate
discrepancies in the human chimpanzee ancestral allele
assignments or evolutionary selection pressures that have
increased particular SNP frequencies.
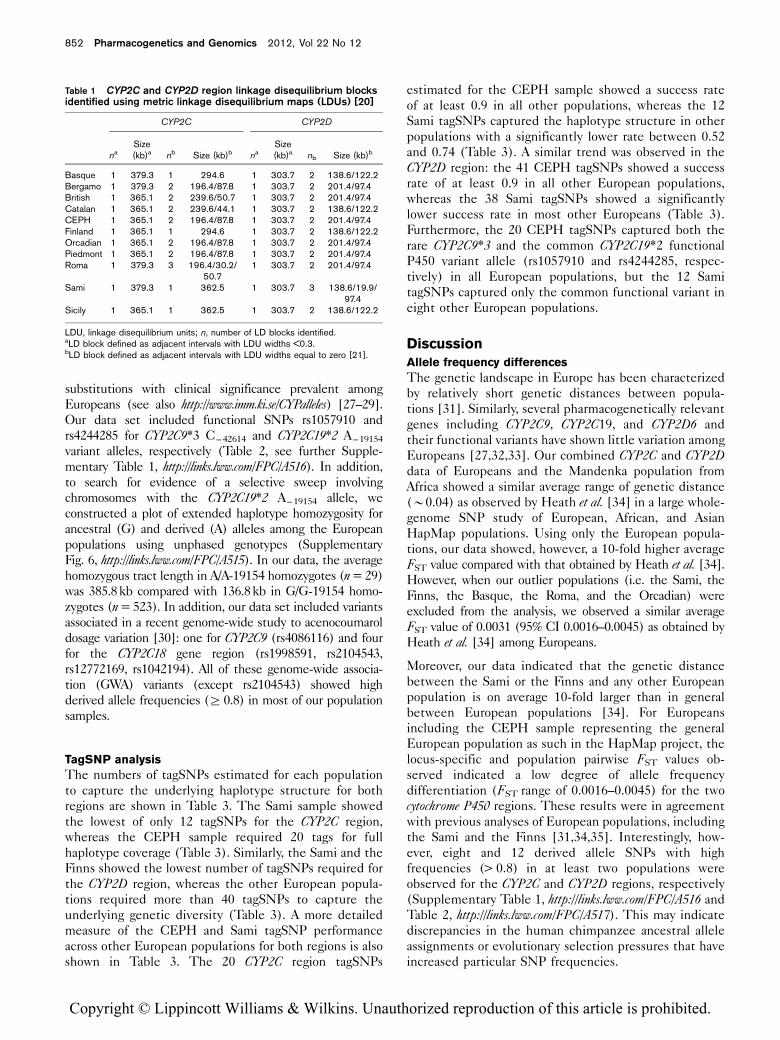
Table 1 CYP2C and CYP2D region linkage disequilibrium blocksidentified using metric linkage disequilibrium maps (LDUs) [20]
CYP2C CYP2D
naSize(kb)a nb Size (kb)b na
Size(kb)a nb Size (kb)b
Basque 1 379.3 1 294.6 1 303.7 2 138.6/122.2Bergamo 1 379.3 2 196.4/87.8 1 303.7 2 201.4/97.4British 1 365.1 2 239.6/50.7 1 303.7 2 201.4/97.4Catalan 1 365.1 2 239.6/44.1 1 303.7 2 138.6/122.2CEPH 1 365.1 2 196.4/87.8 1 303.7 2 201.4/97.4Finland 1 365.1 1 294.6 1 303.7 2 138.6/122.2Orcadian 1 365.1 2 196.4/87.8 1 303.7 2 201.4/97.4Piedmont 1 365.1 2 196.4/87.8 1 303.7 2 201.4/97.4Roma 1 379.3 3 196.4/30.2/
50.71 303.7 2 201.4/97.4
Sami 1 379.3 1 362.5 1 303.7 3 138.6/19.9/97.4
Sicily 1 365.1 1 362.5 1 303.7 2 138.6/122.2
LDU, linkage disequilibrium units; n, number of LD blocks identified.aLD block defined as adjacent intervals with LDU widths <0.3.bLD block defined as adjacent intervals with LDU widths equal to zero [21].
852 Pharmacogenetics and Genomics 2012, Vol 22 No 12
Copyright © Lippincott Williams & Wilkins. Unauthorized reproduction of this article is prohibited.
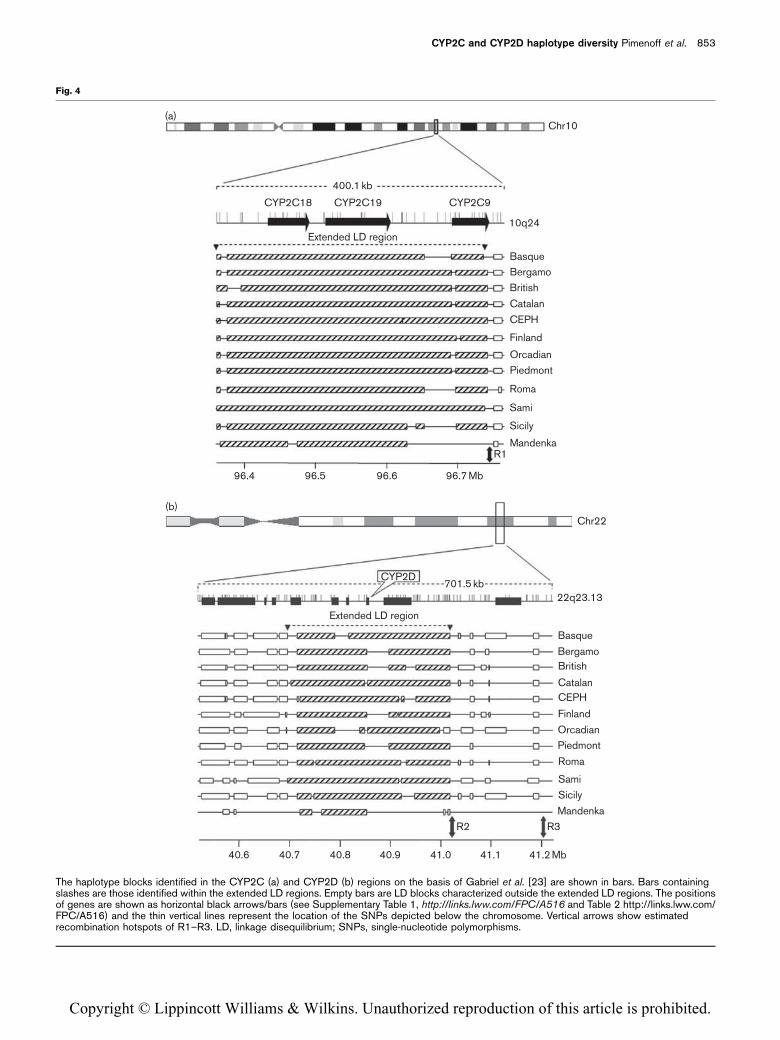
Fig. 4
400.1 kb
CYP2C18
(a)
(b)
CYP2C19
Extended LD region
Extended LD region
701.5 kbCYP2D
CYP2C9
10q24
BasqueBergamoBritish
CEPH
Finland
Roma
Sami
Sicily
Mandenka
96.7 Mb96.696.596.4
R1
PiedmontOrcadian
Catalan
22q23.13
Basque
BergamoBritish
CEPH
Finland
Roma
SamiSicily
Mandenka
41.2 Mb41.040.940.840.740.6 41.1
R3R2
PiedmontOrcadian
Catalan
Chr10
Chr22
The haplotype blocks identified in the CYP2C (a) and CYP2D (b) regions on the basis of Gabriel et al. [23] are shown in bars. Bars containingslashes are those identified within the extended LD regions. Empty bars are LD blocks characterized outside the extended LD regions. The positionsof genes are shown as horizontal black arrows/bars (see Supplementary Table 1, http://links.lww.com/FPC/A516 and Table 2 http://links.lww.com/FPC/A516) and the thin vertical lines represent the location of the SNPs depicted below the chromosome. Vertical arrows show estimatedrecombination hotspots of R1–R3. LD, linkage disequilibrium; SNPs, single-nucleotide polymorphisms.
CYP2C and CYP2D haplotype diversity Pimenoff et al. 853
Copyright © Lippincott Williams & Wilkins. Unauthorized reproduction of this article is prohibited.

Recombination hotspots and linkage disequilibrium
The estimated patterns of recombination rate variation
for the CYP2C and CYP2D regions showed significant but
lower correlation (rs < 0.75; Supplementary Table 3, http://links.lww.com/FPC/A518) within Europe compared with
correlations between continental groups observed by
Evans and Cardon [36] using data from chromosome 20
(rs > 0.8). It is noteworthy that despite the allele
frequency differences between the Sami or the Finns
and any other European population and lower level
recombination rate correlations among Europeans, the
location and magnitude of detected hotspots were
conserved in all Europeans including the Sami and Finns
and also in the sub-Saharan Mandenka population
(Figs 2–4). The CEPH European reference sample had
both a very similar recombination and LDU profile to
other European populations (Figs 2 and 3 and Supple-
mentary Table 3, http://links.lww.com/FPC/A518). Hence, a
fine-scale recombination map inferred from the CEPH
data might be applicable for other European populations
as well. The SNPs with lower recombination rates
showed more variation in the rates between populations,
however, indicating among-population differences either
in recombination histories or in past demography.
The haplotype structure at the CYP2C region has been
shown to be conserved across populations in our data
(Fig. 2, Supplementary Fig. 4A http://links.lww.com/FPC/A515, Supplementary Table 6A http://links.lww.com/FPC/A521) and in previous studies [2,4,6]. Indeed, the pattern
of recombination rate variation and adjacent marker r2
values in the CYP2C region in the CEPH sample were
highly similar to those of the other Europeans (Fig. 2,
Supplementary Table 5, http://links.lww.com/FPC/A520).
Moreover, the size and distribution of LD blocks at
CYP2C were highly consistent among all Europeans
(Table 1, Figs 2 and 4a). Congruent results were obtained
with all block criteria and with MAFs greater than 0.05
and 0.1 (Supplementary Fig. 7A, http://links.lww.com/FPC/A515), despite the fact that the LD block structure at
CYP2C region has remained under debate [2,4]. However,
the low proportion of high LD for the CEPH in contrast
to the high proportion of high LD for Sami and the
significantly different pattern of adjacent marker r2
values indicated differences for the population-specific
haplotypes spanning the CYP2C region.
Within the CYP2D extended LD region, most of the
European populations showed significantly different
patterns of adjacent marker r2 values and still showed a
highly congruent LD block and recombination hotspot
structure across Europeans (Table 1, Figs 3 and 4b and
Supplementary Fig. 7B, http://links.lww.com/FPC/A515).
Analogous to the CYP2C region, the Sami showed the
largest proportion of high LD and a significantly different
pattern of adjacent marker r2 values in CYP2D among
Europeans. However, using the more stringent LD block
criteria (Table 1, see also Fig. 3), the Sami were the only
population to show both CYP2D extended LD block
region recombination steps common among Europeans
(data not shown). The decay of LD was rather similar
between the populations for the two regions showing the
slowest decay for the Sami and more similar rates among
the other Europeans (Supplementary Fig. 3, http://links.lww.com/FPC/A515). However, some heterogeneity in
the adjacent marker r2 values at CYP2D region was
observed across populations (Supplementary Table 5,
Table 2 Genotype frequencies of the CYP2C9*3 A/C – 42614 and CYP2C19*2 G/A – 19154 single-nucleotide polymorphisms
Genotype A/C – 42614
CYP2C9*3Genotype G/A – 19154
CYP2C19*2n AA AC CC C – 42614 (95% CI) n GG GA AA A – 19154 (95% CI)
Basque 76 0.842 0.145 0.013 0.086 (0.041–0.13) 75 0.547 0.4 0.053 0.253 (0.184–0.323)Bergamo 81 0.926 0.074 0 0.037 (0.008–0.066) 82 0.732 0.22 0.049 0.159 (0.102–0.215)British 76 0.908 0.066 0.026 0.059 (0.022–0.097) 77 0.792 0.169 0.039 0.123 (0.071–0.175)Catalan 63 0.873 0.127 0 0.063 (0.021–0.106) 66 0.758 0.212 0.03 0.136 (0.078–0.195)CEPH 66 0.879 0.121 0 0.061 (0.02–0.101) 66 0.818 0.167 0.015 0.098 (0.048–0.149)Finland 71 0.859 0.127 0.014 0.077 (0.033–0.122) 71 0.718 0.225 0.056 0.169 (0.107–0.231)Orcadian 88 0.875 0.125 0 0.063 (0.027–0.098) 88 0.796 0.193 0.011 0.108 (0.062–0.154)Piedmont 58 0.879 0.103 0.017 0.069 (0.023–0.115) 59 0.627 0.356 0.017 0.195 (0.123–0.267)Roma 62 0.871 0.129 0 0.065 (0.021–0.108) 62 0.565 0.403 0.032 0.234 (0.159–0.309)Sami 49 0.837 0.163 0 0.082 (0.027–0.136) 49 0.388 0.469 0.143 0.378 (0.281–0.474)Sicily 59 0.864 0.136 0 0.068 (0.022–0.113) 59 0.78 0.203 0.017 0.119 (0.06–0.177)Mandenka 55 1 0 0 0 56 0.607 0.357 0.036 0.214 (0.138–0.291)
CI, confidence interval; n, number of individuals analyzed.
Table 3 TagSNPs
CYP2C CYP2D
2C 2D tSNPa tSNPb tSNPa tSNPb
Basque 18 42 0.72 0.96 0.86 0.94Bergamo 19 45 0.7 0.96 0.77 0.89British 16 42 0.69 1 0.78 0.9Catalan 16 41 0.72 1 0.76 0.95CEPH 20 41 0.52 1 0.79 1Finland 16 37 0.74 1 0.91 0.92Orcadian 15 42 0.73 1 0.81 0.89Piedmont 19 45 0.7 0.96 0.77 0.88Roma 18 42 0.73 0.98 0.77 0.95Sami 12 38 1 1 1 0.93Sicily 18 45 0.66 0.98 0.75 0.92
2C and 2D, estimated tagSNPs for each population across the CYP2C andCYP2D region, respectively; efficiency of the aSami and bCEPH identifiedtagSNPs (tSNP) in other populations.SNP, single nucleotide polymorphism.
854 Pharmacogenetics and Genomics 2012, Vol 22 No 12
Copyright © Lippincott Williams & Wilkins. Unauthorized reproduction of this article is prohibited.
http://links.lww.com/FPC/A520, see also Fig. 3 and Supple-
mentary Fig. 7B, http://links.lww.com/FPC/A515).
The lowest estimated number of CYP2C and CYP2Dhaplotypes was observed for the Sami (Supplementary
Table 4, http://links.lww.com/FPC/A519), but with high and
low haplotype diversity, respectively, compared with most
other Europeans. This fluctuation is not surprising as
the unique genetic diversity and LD pattern among Sami
can be attributed to past demographic and evolutionary
factors. First, genetic drift is shown to generate enhanced
but random LD patterns [37,38]. Second, the high but
fluctuating LD for Sami could be linked to the small
effective population size with a constant size and sub-
sequent long-term drift increasing the LD in Sami com-
pared with other European populations [35,39–40]. In
addition, the positive and significant correlation between
recombination profiles and FST values for CYP2D region
or both regions combined was expected as differences in
the recombination rates between populations often
increase with their genetic distance [41]. However, the
CYP2C region showed a negative and nonsignificant cor-
relation, which might also indicate that genetic selection
has acted on the region. The above-described features
such as reduced haplotype diversity and high extended LD
among the Sami, and also observed by Terwilliger et al. [37]
and Kaessman et al. [39], strongly indicated that not the
CEPH sample but the Sami could be the optimal population
for the LD-based drift mapping of complex pharmacogenetic
traits across the CYP2C and CYP2D regions.
Haplotype diversity and CYP2C region-altered activity
variants
The CYP2C9*3 allele had a frequency of less than 10% and
C – 42614 homozygotic individuals were almost absent in
European samples (Table 2). Similar values have been
reported in other studies within Europe [29,42]. Most of
the CYP2C19 PM genotypes (> 95%) [25,26] in the
context of Europe are inferred using the CYP2C19*2A – 19154 variant (Table 2). Our data showed 10–20%
A – 19154 allele frequencies across most of the European
populations, which is congruent with the earlier observed
13.4–16.0% (95% CI, N = 3990) allele frequency distribu-
tion within Europe [27]. The Sami showed the highest
observed A – 19154 allele frequency (37.8%) and CYP2C19*2A – 19154 homozygosity of 0.143 (95% CI 0.073–0.212), with
a significant difference (P < 0.05) from most European
samples (Table 2; see also Xie et al. [27]). In fact, the Sami
showed the highest CYP2C19*2 A – 19154 allele frequency
in Europe reported so far [27]. Similar high CYP2C19*2A – 19154 frequencies (Z 0.30) have been observed in Asian
populations [28,43–47], and thus, the Asian origin for the
high CYP2C19*2A – 19154 allele frequency among Sami
could be argued, but a more likely explanation is simply
long-term drift.
Interestingly, the rare CYP2C9*3 and common CYP2C19*2altered activity haplotypes showed less derived alleles
(four to eight sites) across the CYP2C extended LD
region than that observed in other common haplotypes
(10–15 sites) (Supplementary Table 6A, http://links.lww.com/FPC/A521). The genotype data for the CYP2C region
also showed a consistently longer average homozygous
tract length for the activity-altering CYP2C19*2 (A)
homozygotes compared with the wild-type CYP2C19*1(G) homozygotes. The specific distribution and diversity
of the CYP2C19 activity-altering allele may thus indicate
that the CYP2C region has been influenced by selection.
However, a more detailed analysis with full-sequence
CYP2C region data is required to confirm the role of
selection.
To test the superior feasibility of the reduced haplotype
diversity and high extended LD of the Sami sample
among Europeans to capture the underlying functional
CYP2C variants, we estimated the tagSNPs for each
population. As expected, the Sami required less tagSNPs
than most other European samples such as the CEPH for
full haplotype coverage for both regions (Table 3). How-
ever, tagSNPs of the CEPH sample showed a significantly
higher success rate for tag transferability than the Sami
tagSNPs. Moreover, the CEPH tagSNPs captured both
the rare CYP2C9 and the common CYP2C19 functional
variants in all European populations, whereas the Sami
tagSNPs captured only the more common CYP2C19 variant
in eight other populations. These results indicated clearly
that the CEPH [48] sample-based tagSNPs could be after
all the optimal markers for the LD mapping of complex
traits among Europeans across the studied cytochrome P450regions and further across other genomic regions as
proposed by Montpetit et al. [48] and Huyghe et al. [35].
However, the reduced haplotype diversity and high LD of
the Sami could still facilitate a gene association, although
with lower tagSNP resolution, especially if multiple rare
variants play a role in disease etiology [35].
Since the establishment of pharmacogenomics, there has
been an intense theoretical debate over the superiority of
either the candidate gene or the GWA approach in the
analyses on drug response [49]. Today, however, several
GWA studies on drug response have shown their value
with significant associations to variants within the
CYP2C9 [30] and CYP2C19 [30,50], although so far not
within the CYP2D6 gene [49]. However, these GWA
studies have merely provided confirmation of earlier
candidate gene results rather than novel new data. In this
context, our study disentangled the novel distribution of
CYP2C9*3 (rs1057910) and CYP2C19*2 (rs4244285)
variants previously GWA associated with acenocoumarol-
induced and warfarin-induced anticoagulation [30,51–52]
or associated with the antiplatelet effect of clopidogrel,
respectively (Supplementary Table 6A, http://links.lww.com/FPC/A521) [50]. Moreover, we showed the haplotype
variation and LD pattern of novel recently identified
acenocoumarol GWA-associated SNPs [30] located at
CYP2C9 (rs4086116) and CYP2C18 (rs12772169,
CYP2C and CYP2D haplotype diversity Pimenoff et al. 855
Copyright © Lippincott Williams & Wilkins. Unauthorized reproduction of this article is prohibited.

rs1998591, rs2104543, rs1042194) loci in a comprehensive
set of 11 European populations and one African population
(Supplementary Table 6A, http://links.lww.com/FPC/A521).
AcknowledgementsThe authors thank all the donors for providing the blood
samples. They also thank the Centre National de
Genotypage (CNG), Evry, France for the genotyping; C.
Morcillo-Suarez and O. Fernando for guidance in SNPator
and Perl programming, respectively. This work was carried
out within the European Commission LD-EUROPE project
(FP5). The authors acknowledge W. Bodmer, S. Tonks, I.
Evseeva, A. Piazza, F. Crobu, S. Santachiara-Benerecetti, O.
Semino, J. Bertranpetit, A. Gonzalez-Neira, and C. de Toma
for the collaboration and contribution of DNA sources. They
also thank J. Terwilliger and two anonymous referees for
helpful comments and discussion of the manuscript.
This research project was financially supported by The
European Commission (QLG2-CT-2001000916), The
Finnish Cultural Foundation, the Federation of European
Biochemical Societies, and Aaltonen Foundation to (V.N.P.),
Direccio General de Recerca, Generalitat de Catalunya
[2009SGR1101] to (D.C.), and the Academy of Finland
(1109265,1111713) to (J.U.P.) and (80578) to (A.S.).
Conflicts of interest
There are no conflicts of interest.
References1 Wilson JF, Weale ME, Smith AC, Gratrix F, Fletcher B, Thomas MG, et al.
Population genetic structure of variable drug response. Nat Genet 2001;3:265–269.
2 Ahmadi KR, Weale ME, Xue ZY, Soranzo N, Yarnall DP, Briley JD, et al.A single-nucleotide polymorphism tagging set for human drug metabolismand transport. Nat Genet 2005; 1:84–89.
3 Veenstra DL, Blough DK, Higashi MK, Farin FM, Srinouanprachan S,Rieder MJ, et al. CYP2C9 haplotype structure in European Americanwarfarin patients and association with clinical outcomes. Clin PharmacolTher 2005; 5:353–364.
4 Walton R, Kimber M, Rockett K, Trafford C, Kwiatkowski D, Sirugo G.Haplotype block structure of the cytochrome P450 CYP2C gene cluster onchromosome 10. Nat Genet 2005; 9:915–916, author reply 916.
5 Wilkinson GR. Drug metabolism and variability among patients in drugresponse. N Engl J Med 2005; 21:2211–2221.
6 Vormfelde SV, Schirmer M, Toliat MR, Meineke I, Kirchheiner J, Nurnberg P,et al. Genetic variation at the CYP2C locus and its association withtorsemide biotransformation. Pharmacogenomics J 2007; 3:200–211.
7 Evans WE, Relling MV. Moving towards individualized medicine withpharmacogenomics. Nature 2004; 6990:464–468.
8 Pritchard JK, Cox NJ. The allelic architecture of human disease genes:common disease-common variantyor not? Hum Mol Genet 2002;20:2417–2423.
9 Palmer LJ, Cardon LR. Shaking the tree: mapping complex disease geneswith linkage disequilibrium. Lancet 2005; 9492:1223–1234.
10 Nebert DW, Nelson DR, Adesnik M, Coon MJ, Estabrook RW, Gonzalez FJ,et al. The P450 superfamily: updated listing of all genes and recommendednomenclature for the chromosomal loci. DNA 1989; 1:1–13.
11 Kimura S, Umeno M, Skoda RC, Meyer UA, Gonzalez FJ. The humandebrisoquine 4-hydroxylase (CYP2D) locus: sequence and identification ofthe polymorphic CYP2D6 gene, a related gene, and a pseudogene. Am JHum Genet 1989; 6:889–904.
12 Lewis DF. 57 varieties: the human cytochromes P450. Pharmacogenomics2004; 3:305–318.
13 Shen R, Fan JB, Campbell D, Chang W, Chen J, Doucet D, et al.High-throughput SNP genotyping on universal bead arrays. Mutat Res2005; 1-2:70–82.
14 Morcillo-Suarez C, Alegre J, Sangros R, Gazave E, de Cid R, Milne R, et al.SNP analysis to results (SNPator): a web-based environment oriented tostatistical genomics analyses upon SNP data. Bioinformatics 2008;24:1643–1644.
15 Excoffier L, Laval G, Schneider S. Arlequin ver. 3.0: an integrated softwarepackage for population genetics data analysis. Evol Bioinform Online 2005;1:47–50.
16 Tamura K, Dudley J, Nei M, Kumar S. MEGA4: Molecular EvolutionaryGenetics Analysis (MEGA) software version 4.0. Mol Biol Evol 2007;24:1596–1599.
17 Stephens M, Smith NJ, Donnelly P. A new statistical method for haplotypereconstruction from population data. Am J Hum Genet 2001; 4:978–989.
18 Li N, Stephens M. Modeling linkage disequilibrium and identifyingrecombination hotspots using single-nucleotide polymorphism data.Genetics 2003; 4:2213–2233.
19 Tishkoff SA, Reed FA, Ranciaro A, Voight BF, Babbitt CC, Silverman JS,et al. Convergent adaptation of human lactase persistence in Africa andEurope. Nat Genet 2007; 39:31–40.
20 Maniatis N, Collins A, Xu CF, McCarthy LC, Hewett DR, Tapper W, et al.The first linkage disequilibrium (LD) maps: delineation of hot and coldblocks by diplotype analysis. Proc Natl Acad Sci USA 2002; 99:5217–5221.
21 Tapper WJ, Maniatis N, Morton NE, Collins A. A metric linkage disequilibriummap of a human chromosome. Ann Hum Genet 2003; 67:487–494.
22 Barrett JC, Fry B, Maller J, Daly MJ. Haploview: analysis and visualizationof LD and haplotype maps. Bioinformatics 2005; 2:263–265.
23 Gabriel SB, Schaffner SF, Nguyen H, Moore JM, Roy J, Blumenstiel B, et al.The structure of haplotype blocks in the human genome. Science 2002;5576:2225–2229.
24 Wang N, Akey JM, Zhang K, Chakraborty R, Jin L. Distribution ofrecombination crossovers and the origin of haplotype blocks: the interplay ofpopulation history, recombination, and mutation. Am J Hum Genet 2002;5:1227–1234.
25 Rice WR. Analyzing tables of statistical tests. Evolution 1989; 1:223–225.26 Bandelt HJ, Forster P, Rohl A. Median-joining networks for inferring
intraspecific phylogenies. Mol Biol Evol 1999; 1:37–48.27 Xie HG, Stein CM, Kim RB, Wilkinson GR, Flockhart DA, Wood AJ. Allelic,
genotypic and phenotypic distributions of S-mephenytoin 40-hydroxylase(CYP2C19) in healthy Caucasian populations of European descentthroughout the world. Pharmacogenetics 1999; 5:539–549.
28 Wedlund PJ. The CYP2C19 enzyme polymorphism. Pharmacology 2000;3:174–183.
29 Lee CR, Goldstein JA, Pieper JA. Cytochrome P450 2C9 polymorphisms:a comprehensive review of the in-vitro and human data. Pharmacogenetics2002; 3:251–263.
30 Teichert M, Eijgelsheim M, Rivadeneira F, Uitterlinden AG, van Schaik RH,Hofman A, et al. A genome-wide association study of acenocoumarolmaintenance dosage. Hum Mol Genet 2009; 18:3758–3768.
31 Lao O, Lu TT, Nothnagel M, Junge O, Freitag-Wolf S, Caliebe A, et al.Correlation between genetic and geographic structure in Europe. Curr Biol2008; 18:1241–1248.
32 Garte S, Gaspari L, Alexandrie AK, Ambrosone C, Autrup H, Autrup JL, et al.Metabolic gene polymorphism frequencies in control populations. CancerEpidemiol Biomarkers Prev 2001; 12:1239–1248.
33 Sistonen J, Sajantila A, Lao O, Corander J, Barbujani G, Fuselli S. CYP2D6worldwide genetic variation shows high frequency of altered activity variantsand no continental structure. Pharmacogenet Genomics 2007; 2:93–101.
34 Heath SC, Gut IG, Brennan P, McKay JD, Bencko V, Fabianova E, et al.Investigation of the fine structure of European populations with applicationsto disease association studies. Eur J Hum Genet 2008; 16:1413–1429.
35 Huyghe JR, Fransen E, Hannula S, Laer LVL, Eyken EV, Maki-Torkko E, et al.Genome-wide SNP analysis reveals no gain in power for associationstudies of common variants in the Finnish Saami. Eur J Hum Genet 2010;18:569–574.
36 Evans DM, Cardon LR. A comparison of linkage disequilibrium patternsand estimated population recombination rates across multiple populations.Am J Hum Genet 2005; 4:681–687.
37 Terwilliger JD, Zollner S, Laan M, Paabo S. Mapping genes through theuse of linkage disequilibrium generated by genetic drift: ‘drift mapping’ insmall populations with no demographic expansion. Hum Hered 1998;3:138–154.
38 Slatkin M. Linkage disequilibrium–understanding the evolutionary past andmapping the medical future. Nat Rev Genet 2008; 6:477–485.
856 Pharmacogenetics and Genomics 2012, Vol 22 No 12
Copyright © Lippincott Williams & Wilkins. Unauthorized reproduction of this article is prohibited.
39 Kaessmann H, Zollner S, Gustafsson AC, Wiebe V, Laan M, Lundeberg J,et al. Extensive linkage disequilibrium in small human populations in Eurasia.Am J Hum Genet 2002; 3:673–685.
40 Kauppi L, Sajantila A, Jeffreys AJ. Recombination hotspots rather thanpopulation history dominate linkage disequilibrium in the MHC class IIregion. Hum Mol Genet 2003; 1:33–40.
41 Laayouni H, Montanucci L, Sikora M, Mele M, Dall’Olio GM, Lorente-GaldosB, et al. Similarity in recombination rate estimates highly correlates withgenetic differentiation in humans. PLoS One 2011; 6:1–8.
42 Oliveira E, Marsh S, van Booven DJ, Amorim A, Prata MJ, McLeod HL.Pharmacogenetically relevant polymorphisms in Portugal.Pharmacogenomics 2007; 7:703–712.
43 Niu CY, Luo JY, Hao ZM. Genetic polymorphism analysis of cytochromeP4502C19 in Chinese Uigur and Han populations. Chin J Dig Dis 2004;2:76–80.
44 Adithan C, Gerard N, Vasu S, Rosemary J, Shashindran CH, KrishnamoorthyR. Allele and genotype frequency of CYP2C19 in a Tamilian population.Br J Clin Pharmacol 2003; 3:331–333.
45 Jose R, Chandrasekaran A, Sam SS, Gerard N, Chanolean S, Abraham BK,et al. CYP2C9 and CYP2C19 genetic polymorphisms: frequencies in thesouth Indian population. Fundam Clin Pharmacol 2005; 1:101–105.
46 Xiao ZS, Goldstein JA, Xie HG, Blaisdell J, Wang W, Jiang CH, et al.Differences in the incidence of the CYP2C19 polymorphism affecting the
S-mephenytoin phenotype in Chinese Han and Bai populations andidentification of a new rare CYP2C19 mutant allele. J Pharmacol Exp Ther1997; 1:604–609.
47 Kimura M, Ieiri I, Mamiya K, Urae A, Higuchi S. Genetic polymorphism ofcytochrome P450s, CYP2C19, and CYP2C9 in a Japanese population.Ther Drug Monit 1998; 3:243–247.
48 Montpetit A, Nelis M, Laflamme P, Reedik M, Xiayi K, Maido R, et al.An evaluation of the performance of tag SNPs derived from Hapmap ina Caucasian population. PLoS Genet 2006; 2:282–290.
49 Daly AK. Genome-wide association studies in pharmacogenomics. Nat RevGenet 2010; 11:241–246.
50 Shuldiner AR, O’Connell JR, Bliden KP, Gandhi A, Ryan K, Horenstein RB,et al. Association of cytochrome P450 2C19 genotype with theantiplatelet effect and clinical efficacy of clopidogrel therapy. JAMA 2009;302:849–857.
51 Cooper GM, Johnson JA, Langaee TY, Feng H, Stanaway IB,Schwarz UI, et al. A genome-wide scan for common genetic variantswith a large influence on warfarin maintenance dose. Blood 2008;112:1022–1027.
52 Takeuchi F, McGinnis R, Bourgeois S, Barnes C, Eriksson N, Soranzo N,et al. A genome-wide association study confirms VKORC1, CYP2C9, andCYP4F2 as principal genetic determinants of warfarin dose. PLoS Genet2009; 5:1–9.
CYP2C and CYP2D haplotype diversity Pimenoff et al. 857
Copyright © Lippincott Williams & Wilkins. Unauthorized reproduction of this article is prohibited.
Copyright © 2022 FDOKUMEN