
Microeconometric Analyses on Determinants of ... - ifo Institut
279
83 2019 Microeconometric Analyses on Determinants of Individual Labour Market Outcomes Lisa K. Simon
-
Upload
khangminh22 -
Category
Documents
-
view
0 -
download
0
Transcript of Microeconometric Analyses on Determinants of ... - ifo Institut

832019
Microeconometric Analyses on Determinants of Individual Labour Market OutcomesLisa K. Simon

Herausgeber der Reihe: Clemens FuestSchriftleitung: Chang Woon Nam
Microeconometric Analyses on Determinants of Individual Labour Market Outcomes Lisa K. Simon
832019

Bibliografische Information der Deutschen Nationalbibliothek
Die Deutsche Nationalbibliothek verzeichnet diese Publikationin der Deutschen Nationalbibliografie; detaillierte bibliografischeDaten sind im Internet überhttp://dnb.d-nb.deabrufbar.
ISBN: 978-3-95942-058-7
Alle Rechte, insbesondere das der Übersetzung in fremde Sprachen, vorbehalten.Ohne ausdrückliche Genehmigung des Verlags ist es auch nicht gestattet, diesesBuch oder Teile daraus auf photomechanischem Wege (Photokopie, Mikrokopie)oder auf andere Art zu vervielfältigen.c© ifo Institut, München 2019
Druck: ifo Institut, München
ifo Institut im Internet:http://www.cesifo-group.de

I dedicate this thesisto Uwe, Babcia i Dziadek, und Elke.
I know you were there.


Acknowledgements
First and foremost, I would like to thank my advisor Ludger Woessmann: for hiringme and believing in me, for his continuous advice and support, for his remarkableexpertise, his incredible network and his outstanding skills to tell a story. It has beena pleasure and an honour to learn from you.
I would also like to thank my second advisor Davide Cantoni, for great advice, help andencouragement. Thanks to Guido Schwerdt for joining my committee and for being amuch valued co-author. I am deeply indebted to Marc Piopiunik, for being my mentorfrom my first day at the ifo Institute, as well as a reliable and esteemed co-author. Ialso thank Philipp Lergetporer for great co-authorship. I’ve cherished our countlessmeetings and collaborations, your expertise, and your e�ort to speak High German tome. I am grateful to Jens Ruhose, an invaluable co-author, for his impressive knowl-edge and reliability, and for never sparring with great guidance and advice.
I thank my colleagues at the ifo Institute for wonderful company, countless lunchesand laughs, many productive talks and moral support. In particular, I thank Ben-jamin Arold, Franziska Hampf, Natalie Obergruber, Larissa Zierow, Sven Resnjanskij,Francesco Cinnirella, Katharina Werner, Annika Bergbauer, Elisabeth Grewening, RuthSchüler, Sarah Kersten and Franziska Kugler. Much thanks to Ulrike Baldi-Cohrs andFranziska Binder for their continuous administrative as well as general life support.Thanks to my fellow PhD students, Marie Lechler, Henrike Steimer, Zhaoxin Pu, MiriamBreckner, Cathrin Mohr, Daniel Wissmann and Markus Nagler for being good friendsand companions.
I had the fantastic opportunity to spend the academic year of 2016/2017 at UC Berke-ley. I owe much gratitude to Jesse Rothstein, for inviting me there and the Institute forResearch on Labor and Employment for hosting me and providing me with an o�ice.Thanks to my o�ice mates and colleagues there, for making this a memorable andproductive year: Megan Collins, Hannah Liepmann, Lydia Assouad, Jonas Cederlöf,Yukiko Asai, Daphné and Claire Montialoux. I thank the German Academic ExchangeService for funding me during that year. I also received generous support from theBernt Rohrer Foundation during my last PhD year, for which I am grateful.
I am indebted to many people, who over the course of the years, have contributed tovarious papers by providing valuable comments, advice, information, or data. I want
III

Acknowledgements
to particularly thank Joachim Winter, David Card, Rajashri Chakrabarti, RaymundoVazquez, Wolfgang Dauth, Heiko Bergman, Ralf-Olaf Granath, Oliver Steinkamp andthe sta� at the Research Data Centre of (IAB).
I thank my amazing friends, for their patience and support. You may be far away andscattered throughout the globe, but I know I could always count on you to cheer meon and keep me to high standards. You know who you are.
I owe everything that I am to my family, and for this I thank them so very much. I thankmy mother, who is an insatiable source of inspiration every day, with her work ethic,energy, resourcefulness and fearlessness. You taught me by living example, how to bean independent and strong woman, who can have it all. I thank my father, who is themost loving and supportive dad a daughter could ask for. You may have installed meon my path as an economist by taking me to your economics lectures when I was onlya few months old, but in particular you taught me what is truly important in life andnot to take myself too seriously. I am thankful to my big brother Maciej, for protecting,supporting and teaching me, and for always having my back. I also thank my grandmaMargret, for her care and support throughout my whole life. Hopefully I won’t be ded-icating any books to you anytime soon.
Last but certainly not least, I thank my fiancé Maxime, for being my amazing partnerin everything I do. I am grateful for your love, support, trust, humour, smartness andpatience, your incredible work ethic that inspires me daily, for listening to my dismalmicroeconometric identification problems and helping me find ideas, solutions, for-mulations or coding errors, for proofreading, for letting me be me and for above ev-erything else, believing in me, being my #1 fan, and letting me know, that I could doit. Here is to finally being in the same place, always.
IV

Preface
Lisa K. Simon prepared this study while she was working at the ifo Center for the Eco-nomics of Education. The study was completed in September 2018 and accepted asdoctoral thesis by the Department of Economics at the University of Munich. It con-sists of four distinct empirical analyses: Chapters 2 and 3 deal with the impact of someindividual characteristics on labour market outcomes, while Chapters 4 and 5 dealwith the impact of some external factors. Chapters 2 and 3 employ experimental meth-ods, while Chapters 4 and 5 use observational data, especially administrative socialsecurity data.
Keywords: Education, Labour Market Outcomes, Human Capital, CognitiveSkills, Refugees, Education Level, Labour Market Deregulation, Re-form Evaluation, Survey Experiment, Social Security Data, Occupa-tion Choice, Vocational Occupation, Trade Shocks
JEL-No: I20, I26, J15, J24, J31, J44, O33
V


Microeconometric Analyses onDeterminants of Individual Labour
Market OutcomesInaugural-Dissertation
Zur Erlangung des GradesDoctor oeconomiae publicae (Dr. oec. publ.)
eingereicht an derLudwig-Maximilians-Universität München
2018
vorgelegt von
Lisa K. Simon
Referent: Prof. Ludger WoessmannKorreferent: Prof. Davide CantoniPromotionsabschlussberatung: 30.01.2019


Contents
Acknowledgements III
Preface V
List of Tables XIII
List of Figures XVII
1 Introduction 11.1 Selected Individual Characteristics and
Labour Market Outcomes . . . . . . . . . . . . . . . . . . . . . . . . . . . 21.1.1 Education as a Signal . . . . . . . . . . . . . . . . . . . . . . . . . 21.1.2 Migration and Education . . . . . . . . . . . . . . . . . . . . . . . 4
1.2 Selected External Factors and Labour MarketOutcomes . . . . . . . . . . . . . . . . . . . . . . . . . . . . . . . . . . . . 51.2.1 Occupational Licensing as Entry Barrier . . . . . . . . . . . . . . 51.2.2 Education as Insurance Against Change . . . . . . . . . . . . . . 6
1.3 Empirical Methods for Causal Inference . . . . . . . . . . . . . . . . . . . 91.4 Chapter Overview . . . . . . . . . . . . . . . . . . . . . . . . . . . . . . . 121.5 Policy Implications . . . . . . . . . . . . . . . . . . . . . . . . . . . . . . . 16
2 Skills, Signals, and Employability 192.1 Introduction . . . . . . . . . . . . . . . . . . . . . . . . . . . . . . . . . . 192.2 Conceptual Framework on Skills, Signals, and Labour Markets, with
Relation to the Literature . . . . . . . . . . . . . . . . . . . . . . . . . . . 232.2.1 Skills, Signals, and Labour-Market Outcomes . . . . . . . . . . . 242.2.2 CV Studies: Innate Characteristics vs. Acquired Signals . . . . . 262.2.3 Main Research Question and Contextual Heterogeneity: Rele-
vance, Expectedness, and Credibility of Skill Signals . . . . . . 272.3 Experimental Design . . . . . . . . . . . . . . . . . . . . . . . . . . . . . . 28
2.3.1 Choice Experiments in an HR Manager Survey . . . . . . . . . . 282.3.2 The Resumes . . . . . . . . . . . . . . . . . . . . . . . . . . . . . 302.3.3 Descriptive Statistics . . . . . . . . . . . . . . . . . . . . . . . . . 332.3.4 Empirical Model . . . . . . . . . . . . . . . . . . . . . . . . . . . . 34
IX

Contents
2.4 The Impact of Skill Signals on Job-Interview Invitations . . . . . . . . . 352.4.1 Baseline Results for Secondary-School Graduates . . . . . . . . 352.4.2 Baseline Results for College Graduates . . . . . . . . . . . . . . 37
2.5 Heterogeneous E�ects for Di�erent HR Managers . . . . . . . . . . . . . 402.5.1 Heterogeneity by HR Manager Characteristics . . . . . . . . . . 402.5.2 Consistency with Stated Priorities in Survey Questions . . . . . 42
2.6 Conclusion . . . . . . . . . . . . . . . . . . . . . . . . . . . . . . . . . . . 43Figures and Tables . . . . . . . . . . . . . . . . . . . . . . . . . . . . . . . . . . 45Appendix . . . . . . . . . . . . . . . . . . . . . . . . . . . . . . . . . . . . . . . . 57
3 Does the Education Level of Refugees A�ect Natives’ Attitudes? 653.1 Introduction . . . . . . . . . . . . . . . . . . . . . . . . . . . . . . . . . . 653.2 Theoretical Framework and Evidence on Refugees’ Education Level . . 703.3 Survey Design, Information Treatment, and Empirical Model . . . . . . 733.4 Results . . . . . . . . . . . . . . . . . . . . . . . . . . . . . . . . . . . . . . 803.5 Discussion and Conclusion . . . . . . . . . . . . . . . . . . . . . . . . . . 89Figures and Tables . . . . . . . . . . . . . . . . . . . . . . . . . . . . . . . . . . 92Appendix . . . . . . . . . . . . . . . . . . . . . . . . . . . . . . . . . . . . . . . . 100
4 Entry Barriers and the Labour Market Outcomes of Incumbent Workers 1234.1 Introduction . . . . . . . . . . . . . . . . . . . . . . . . . . . . . . . . . . 1234.2 Reform of the German Trade and Cra�s Code 2004 . . . . . . . . . . . . 1264.3 Labour Market E�ects of Entry Barriers: Related Literature and Some
Theory . . . . . . . . . . . . . . . . . . . . . . . . . . . . . . . . . . . . . . 1284.4 Data . . . . . . . . . . . . . . . . . . . . . . . . . . . . . . . . . . . . . . . 1334.5 Reform E�ects on Incumbent Workers . . . . . . . . . . . . . . . . . . . 1354.6 Reform E�ects on Overall Employment and Earnings . . . . . . . . . . . 1454.7 Discussion . . . . . . . . . . . . . . . . . . . . . . . . . . . . . . . . . . . . 1474.8 Conclusion . . . . . . . . . . . . . . . . . . . . . . . . . . . . . . . . . . . 149Figures and Tables . . . . . . . . . . . . . . . . . . . . . . . . . . . . . . . . . . 151Appendix . . . . . . . . . . . . . . . . . . . . . . . . . . . . . . . . . . . . . . . . 164
5 Trade Shocks and Vocational Occupation Choices 1895.1 Introduction . . . . . . . . . . . . . . . . . . . . . . . . . . . . . . . . . . 1895.2 Conceptual Framework on Trade Shocks and Vocational Occupation
Choices with Relation to the Literature . . . . . . . . . . . . . . . . . . . 1945.3 Empirical Set-Up . . . . . . . . . . . . . . . . . . . . . . . . . . . . . . . . 2005.4 Impacts of Import Exposure on Vocational Occupation Choice and
Labour Market Outcomes . . . . . . . . . . . . . . . . . . . . . . . . . . . 209
X

Contents
5.5 Concluding Remarks . . . . . . . . . . . . . . . . . . . . . . . . . . . . . . 218Figures and Tables . . . . . . . . . . . . . . . . . . . . . . . . . . . . . . . . . . 220Appendix . . . . . . . . . . . . . . . . . . . . . . . . . . . . . . . . . . . . . . . . 234
Bibliography 239
XI


List of Tables
Table 2.1: Summary Statistics: Secondary-School Graduate CVs . . . . . . 47Table 2.2: Summary Statistics: College Graduate CVs . . . . . . . . . . . . 48Table 2.3: Skill Signals and Job-Interview Invitation: Baseline Results for
Secondary-School Graduates . . . . . . . . . . . . . . . . . . . 49Table 2.4: Skill Signals and Job-Interview Invitation: Baseline Results for
College Graduates . . . . . . . . . . . . . . . . . . . . . . . . . 50Table 2.5: Summary Statistics: HR Manager and Firm Characteristics . . . 51Table 2.6: Interactions of Skill Signals with HR Manager and Firm Charac-
teristics: Secondary-School Graduates . . . . . . . . . . . . . . 52Table 2.7: Interactions of Skill Signals with HR Manager and Firm Charac-
teristics: College Graduates . . . . . . . . . . . . . . . . . . . . 53Table 2.8: HR Managers’ Stated Priorities: Survey Results . . . . . . . . . . 54Table 2.9: Interactions of Skill Signals with HR Manager Priorities:
Secondary-School Graduates . . . . . . . . . . . . . . . . . . . 55Table 2.10: Interactions of Skill Signals with HR Manager Priorities: College
Graduates . . . . . . . . . . . . . . . . . . . . . . . . . . . . . . 56Table A2.1: Values of All CV Elements of Secondary-School Graduates . . . . 60Table A2.2: Values of All CV Elements of College Graduates . . . . . . . . . . 61Table A2.3: Sample Representativeness: Comparing Respondents and Non-
Respondents from the ifo Personnel Manager Survey Database . 62Table A2.4: Invitation Rate by First and Last Names . . . . . . . . . . . . . . 63
Table 3.1: Comparison of socio-demographic characteristics across controland treatment groups . . . . . . . . . . . . . . . . . . . . . . . 93
Table 3.2: E�ect of information treatment on beliefs about refugees’ edu-cation level . . . . . . . . . . . . . . . . . . . . . . . . . . . . . 94
Table 3.3: E�ect of information treatment on beliefs about refugees’ edu-cation level (follow-up survey) . . . . . . . . . . . . . . . . . . . 95
Table 3.4: E�ect of beliefs about refugees’ education level on labour marketand fiscal burden concerns . . . . . . . . . . . . . . . . . . . . . 96
Table 3.5: E�ect of beliefs about refugees’ education level on general atti-tudes . . . . . . . . . . . . . . . . . . . . . . . . . . . . . . . . 97
Table 3.6: E�ect of beliefs about refugees’ education level on opinion for-mation aspects . . . . . . . . . . . . . . . . . . . . . . . . . . . 98
XIII

List of Tables
Table 3.7: E�ect of veiled response treatment (follow-up survey) . . . . . . 99Table A3.1: Comparison of sample characteristics to university student pop-
ulations . . . . . . . . . . . . . . . . . . . . . . . . . . . . . . . 102Table A3.2: Comparison of socio-demographic characteristics across control
and treatment group (follow-up survey) . . . . . . . . . . . . . . 103Table A3.3: Correlations between beliefs about refugees’ education level
and general attitudes . . . . . . . . . . . . . . . . . . . . . . . . 104Table A3.4: Relationship between general attitudes toward refugees and
socio-demographic characteristics . . . . . . . . . . . . . . . . 105Table A3.5: Relationship between beliefs about refugees’ education level
and respondents’ socio-demographic characteristics . . . . . . 106Table A3.6: Characterizing compliers with the treatments on beliefs about
refugees’ education level . . . . . . . . . . . . . . . . . . . . . . 107Table A3.7: Persistence of information treatment e�ects on beliefs about
refugees’ education level (follow-up survey) . . . . . . . . . . . 108Table A3.8: Persistence of information treatment e�ects on beliefs (follow-
up survey) . . . . . . . . . . . . . . . . . . . . . . . . . . . . . . 109Table A3.9: E�ect of information treatment on participation in re-survey . . 110Table A3.10: E�ect of information treatment on beliefs about refugees’ edu-
cation level by baseline beliefs . . . . . . . . . . . . . . . . . . . 111Table A3.11: E�ect of beliefs about refugees’ education level on other refugee-
related statements . . . . . . . . . . . . . . . . . . . . . . . . . 112Table A3.12: Correlations between opinion aspects . . . . . . . . . . . . . . 113Table A3.13: Relationship between opinion formation aspects and general at-
titudes toward refugees . . . . . . . . . . . . . . . . . . . . . . 114Table A3.14: Information treatment e�ects on labour market and fiscal bur-
den concerns . . . . . . . . . . . . . . . . . . . . . . . . . . . . 115Table A3.15: Information treatment e�ects on general attitudes . . . . . . . . 116Table A3.16: Information treatment e�ects on other refugee-related statements117Table A3.17: Information treatment e�ects on opinion formation aspects . . 118Table A3.18: Wording of survey questions (main survey) . . . . . . . . . . . . 119
Table 4.1: Covariate Balancing Before Matching, 2003 . . . . . . . . . . . . 156Table 4.2: Reform E�ects on Incumbent Workers . . . . . . . . . . . . . . . 157Table 4.3: Reform E�ect Heterogeneity by Regional Characteristics . . . . . 158Table 4.4: Reform E�ect Heterogeneity by Firm Size . . . . . . . . . . . . . 159Table 4.5: Attrition from Sample . . . . . . . . . . . . . . . . . . . . . . . 160Table 4.6: Reform E�ects: Accounting for Attrition . . . . . . . . . . . . . . 161Table 4.7: Economy-wide Reform E�ects on Occupational Level . . . . . . 162
XIV

List of Tables
Table 4.8: Reform E�ects on Monthly Income and Self-Employment . . . . 163Table A4.1: List of Regulated and Deregulated Cra� Occupations . . . . . . . 170Table A4.2: Mapping of Occupations from Cra�s and Trade Code to Classifi-
cation of Occupations 1988: Deregulated Occupations . . . . . . 171Table A4.3: Mapping of Occupations from Cra�s and Trade Code to Classifi-
cation of Occupations 1988: Regulated Occupations . . . . . . . 173Table A4.4: Mapping of Occupations from Cra�s and Trade Code to Classifi-
cation of Occupations 1992 in the Microcensus . . . . . . . . . . 174Table A4.5: Yearly Treatment E�ects . . . . . . . . . . . . . . . . . . . . . . 176Table A4.6: Other Labor Market Adjustment Mechanisms . . . . . . . . . . . 177Table A4.7: Average Earnings Growth A�er Matching . . . . . . . . . . . . . 178Table A4.8: Checking Common Trends in Pretreatment Periods . . . . . . . 179Table A4.9: Labor Market E�ects for Incumbent Workers: Dropping Sample
Restrictions . . . . . . . . . . . . . . . . . . . . . . . . . . . . . 180Table A4.10: E�ect Heterogeneity by Industry Group . . . . . . . . . . . . . . 181Table A4.11: Reform E�ects by Occupational and Firm Switches . . . . . . . . 182Table A4.12: Excluding Occupations with Similar Tasks . . . . . . . . . . . . . 183Table A4.13: Attrition from Sample: Yearly Treatment Results . . . . . . . . . 184Table A4.14: Earnings of Workers Dropping Out of the Sample . . . . . . . . . 185Table A4.15: Earnings of Workers Dropping Out of the Sample: Controlling for
Individual Characteristics . . . . . . . . . . . . . . . . . . . . . 186Table A4.16: Treatment E�ects with Matching on Cra� Groups . . . . . . . . . 187
Table 5.1: Summary Statistics . . . . . . . . . . . . . . . . . . . . . . . . . 224Table 5.2: E�ects of Import Exposure on Vocational Education Occupation
Types . . . . . . . . . . . . . . . . . . . . . . . . . . . . . . . . 225Table 5.3: E�ects of Import Exposure on Occupation Task Characteristics . 226Table 5.4: E�ects of Import Exposure on Earnings and Other Labour Market
Outcomes . . . . . . . . . . . . . . . . . . . . . . . . . . . . . . 227Table 5.5: 10-Year Earnings Growth by Vocational Occupation Choice . . . 228Table 5.6: Non-Endogenous Subsample: Selection into School Tracks . . . 229Table 5.7: Supply-Demand Relations for Apprenticeship Positions for All
Occupations . . . . . . . . . . . . . . . . . . . . . . . . . . . . . 230Table 5.8: Unsuccessful Apprenticeship Candidates by Occupation Category 231Table 5.9: Robustness Check: Using Di�erent Import Exposure Definitions . 232Table 5.10: Hetereogeneity Analysis by Gender . . . . . . . . . . . . . . . . 233Table A5.1: List of Tasks and Skills from BIBB Survey used for Skill Specificity
Measure . . . . . . . . . . . . . . . . . . . . . . . . . . . . . . . 234Table A5.2: Change in Import Exposure Per Worker by Quantiles and Years . 235
XV

List of Tables
Table A5.3: Results for Occupation Categories for Eastern Europe and China,IV and OLS . . . . . . . . . . . . . . . . . . . . . . . . . . . . . . 236
Table A5.4: Evidence on Youths Aspirations and E�ects of Parental Occupations237
XVI

List of Figures
Figure 2.1: Example CV of a Secondary-School Graduate . . . . . . . . . . . 45Figure 2.2: Example CV of a College Graduate . . . . . . . . . . . . . . . . . 46
Figure 3.1: E�ect of information treatment on beliefs about refugees’ edu-cation level . . . . . . . . . . . . . . . . . . . . . . . . . . . . . 92
Figure A3.1: Graphical depiction used in information treatment in follow-upsurvey . . . . . . . . . . . . . . . . . . . . . . . . . . . . . . . . 100
Figure A3.2: General attitudes toward refugees . . . . . . . . . . . . . . . . . 101
Figure 4.1: Changes in Number of Businesses (relative to 2003) . . . . . . . 151Figure 4.2: Self-Employment and Master Cra� Examinations (relative to 2003) 152Figure 4.3: Log Earnings Before and A�er the Reform . . . . . . . . . . . . . 153Figure 4.4: E�ect on Log Earnings and Unemployment for Incumbent Work-
ers over Time . . . . . . . . . . . . . . . . . . . . . . . . . . . . 154Figure 4.5: Overall Employment and Earnings (relative to 2003) . . . . . . . 155Figure A4.1: Log Earnings Before and A�er the Reform Relative to 2003 . . . . 164Figure A4.2: E�ect Heterogeneity by Firm Size: Log Daily Earnings . . . . . . 165Figure A4.3: E�ect Heterogeneity by Firm Size: Unemployment . . . . . . . . 166Figure A4.4: Apprenticeships and Apprenticeship Examinations . . . . . . . . 167Figure A4.5: E�ects on Net Monthly Income of Self-Employed and Employees 168Figure A4.6: Net Monthly Income of Self-Employed and Employees . . . . . . 169
Figure 5.1: Apprentice Shares by Quantiles of Import Exposure in 2000 . . . 220Figure 5.2: Total Trade Volumes in Billions of 2010 Euros . . . . . . . . . . . 221Figure 5.3: 10-year Changes in Import Exposure Per Worker . . . . . . . . . 222Figure 5.4: Occupational specificity by Occupation Group . . . . . . . . . . 223
XVII


1 Introduction
This thesis is about how individuals fare on the labour market and the di�erent deter-minants a�ecting this. The determinants investigated here range from signals of skillsand migration, to the regulatory framework and changing industry structures. Thecommon denominator is education and how it helps to navigate the labour marketand the challenges it poses. In the most immediate way of course, there is a well-established relationship between education and labour market outcomes, such aspositive returns to years of schooling (e.g., Card, 1999). The channels which drive thisrelationship, have been subject to much interest in the literature on education andlabour economics.
One way in which education helps to navigate the labour market is by acting as a sig-nal, meaning a transfer of information on productivity, adaptability, skilfulness or re-liability. An individual’s high school degree signals to potential employers, not onlythat the individual fulfilled the formal requirements needed to finish high school, butalso that this person carries important personal characteristics such as reliability andpersistence, which allowed him or her to graduate from high school. In his seminalpaper, Spence (1973) derives a model in which education is used as a signal of pro-ductivity on the job market, where signalling costs and ability are inversely related.This explains why individuals obtain varying signals of education, e.g., why some ob-tain a high school degree and others a PhD. In contrast to the theory of screening (Ar-row, 1973), this thesis makes the assumption that education actually transmits hu-man capital and increases productivity, and is not only a mere signal of other relatedadeptness. Either way, signals of education and skills play a paramount role in inform-ing the labour market and future employers, about the individual’s suitability for acertain job. Chapter 2 of this thesis investigates in depth, which skill signals matter ingetting a job. Chapter 3 looks at the importance of education for refugees and natives’attitudes towards refugees.
Another way in which education helps to navigate the labour market, is by acting asan insurance against changing conditions, because it provides the ability to adapt tonew situations and to learn new skills (e.g., Nelson and Phelps, 1966; Welch, 1970;Schultz, 1975; Heckman, 2000). Having skills which allow to adapt to new challenges,is paramount in an ever faster-evolving economy. Globalisation (e.g., Autor, Dorn andHanson, 2013) and technological progress (e.g., Levy and Murnane, 1992) are twoimportant drivers of change. Globalisation, with international trade, free mobility
Microeconometric Analyses on Determinants of Individual Labour Market Outcomes 1

1 Introduction
of labour and ever cheaper transport and communication, puts increasing compet-itive pressure on the domestic production of goods and services. This requires do-mestic industries to remain competitive, through higher productivity, better quality,better service or other ways of di�erentiation. Technological progress with automa-tion increases productivity of many processes, but also requires higher-skilled labourto complement the increasingly automated production processes. A well-educatedlabour force equipped with adaptable skills is therefore necessary to navigate thesechallenges. Chapter 5 focusses on educational choices of young individuals that arefaced with changing industry structures in their surroundings. Chapter 4 on the otherhand, looks at the labour market e�ects of a change in competition dynamics througha li� in regulation.
Globally, the first two chapters of this thesis deal with the e�ects of certain individ-ual characteristics on labour market outcomes, while the last two chapters focus oncertain external factors. In the remainder of this introduction, Sections 1.1 and 1.2introduce the respective key concepts and literatures in turn. Section 1.3 discussessome of the empirical challenges when one is interested in causal inference on thesetopics and introduces the empirical strategies used in this thesis. Section 1.4 providesan overview of the four chapters, and Section 1.5 summarises the main insights andthe policy implications one can draw from them.
1.1 Selected Individual Characteristics andLabour Market Outcomes
This section discusses selected individual-level determinants of labour market out-comes, in particular the role of educational attainment – a personal characteristic inwhich individuals invest in. First, education and skills as signals of productivity onthe labour market are discussed, and then the role of education for immigrants andrefugees is introduced.
1.1.1 Education as a Signal
Education, in the sense of educational degrees (e.g., high school diploma, bachelorsdegree), can be used as a signal, for example about one’s ability and productivity topotential future employers (Spence, 1973; Arrow, 1973; Stiglitz, 1975). It acts as an in-formation transfer or message about a trait that is not directly observable. Becausefuture employers cannot directly observe skills and productivity of candidates they
2 Microeconometric Analyses on Determinants of Individual Labour Market Outcomes

1 Introduction
want to hire for a job opening, they have to make a decision based on partial informa-tion available to them, which is based on the signals the candidates transmit.
Chapter 2 looks at the relationship between education signals and labour market out-comes in more depth, namely at the importance of skill signals in the hiring process oflabour market entrants. Which skills denoted on a CV matter in particular to employ-ers? In the literature, various categories of skills have been found to matter, usuallydistinguishing between cognitive and non-cognitive skills.1
Cognitive skills, defined as the ability of an individual to perform mental activitiesassociated with learning and problem solving, are o�en measured as achievementon standardized tests.2 For the economy as a whole, e.g., Hanushek and Woessmann(2008) show the importance of cognitive skills for economic growth and development.In terms of individuals, Chetty et al. (2011) and Hanushek et al. (2015) document thatcognitive skills are positively related to employment and earnings. Non-cognitiveskills are not as precisely defined nor understood, but are receiving growing atten-tion in the literature, in particular as better defined subcategories. Social skills havebeen recognised as particularly important, due to the growing importance of teamproduction and interpersonal interactions on the labour market. As far as signallingsocial skills goes, Baert and Vujić (2018) and Heinz and Schumacher (2017) find thatsocial volunteering may be used to credibly signal the willingness to cooperate, but itmay also be correlated with other skills valued by employers. In Chapter 2, we arguethat social volunteering is particularly related to personality traits that include matu-rity, conscientiousness, perseverance, and curiosity, which is another highly relevantsubgroup of non-cognitive skills to employers. How important these traits are to em-ployers is also shown in Heckman, Humphries and Mader (2011), who find that evenconditional on cognitive skills, high school graduates outperform GED3 recipients interms of labour-market outcomes and show that this di�erence is driven by personal-ity traits of reliability and perseverance.
Education has further been shown to not only a�ect cognitive ability, but also to havean impact on crime, health, fertility or political participation (Hanushek and Woess-
1 Recent literature does recognise that the strict dichotomy between cognitive and non-cognitive skills doesnot necessarily hold, as skills from both categories also have elements of the respective other to varying degrees.For example, a good high school GPA contains both classic cognitive elements as doing well on tests, but alsothe ability to interact with teachers and peers and the discipline to study or do homework, which are morenon-cognitive skills (e.g., Balart, Oosterveen and Webbink, 2018).2 Earlier literature measures cognitive skills in terms of years of schooling, but it has been duly argued thatschool quality varies too much and that actual skills are a much better predictor of abilities (see e.g., Hanusheket al., 2015).3 The GED is a test that is usually used by high school drop-outs to earn their high school equivalence credential.
Microeconometric Analyses on Determinants of Individual Labour Market Outcomes 3

1 Introduction
mann, 2008), and can therefore act as a signal of these traits. In Chapter 3, educationacts as a signal of the potential and willingness to integrate in the labour market forrefugees, and in Chapter 4, it acts as a signal of quality to consumers.
1.1.2 Migration and Education
Migration can change a country’s labour market skill composition, when immigrantshave di�erent levels of skills than the native population on average, or when particu-larly high or low education natives leave the country to emigrate (e.g., Dustmann andGlitz, 2011). This can have varying impacts on the labour market; for example, Otta-viano and Peri (2012) find that comparative skill advantages of migrants and nativeslead to occupational specialisation and therefore increased productivity.
In 2014 and 2015, Europe experienced an unprecedented influx of refugees. In 2015alone, more than 1.5 million individuals applied for asylum in Europe, with Germanyregistering the highest number of some 440,000 applications (Eurostat, 2016). Therewas much uncertainty surrounding the true education level of the incoming refugeesdue to poor documentation and lacking data. To implement feasible refugee and inte-gration policies, it is important that these are supported by domestic voters in orderto successfully implement these policies and to preserve solidarity with refugees. Thefact that public support for anti-immigration parties increased markedly in several Eu-ropean countries during the refugee crisis, suggests that voters’ scepticism towardsrefugees and national asylum policies have not been fully appreciated by policy mak-ers.
Chapter 3 tests how beliefs about the education level of refugees impact natives’ atti-tudes towards refugees. Economic models on attitudes towards immigration empha-size the importance of the education level of migrants, and natives’ beliefs about it.Hainmueller and Hiscox (2010) discuss two competing theories on how the skill levelof immigrants a�ects natives’ attitudes towardss them. According to the labour mar-ket competition model, natives are most opposed to immigrants with a skill level sim-ilar to their own because they expect these immigrants to compete for the same typesof jobs (e.g., Mayda, 2006; Scheve and Slaughter, 2001). The fiscal burden model, onthe other hand, predicts that natives in general are more opposed to low-skilled im-migrants because they impose larger fiscal burdens on the public than high-skilledimmigrants.
The education level of refugees acts as a signal of the ability to integrate, participateand compete on the labour market, as well as of future potential earnings and tax con-tributions. Of course, beliefs about refugees’ education may a�ect general attitudes
4 Microeconometric Analyses on Determinants of Individual Labour Market Outcomes

1 Introduction
through other channels than labour market competition concerns and fiscal concerns(e.g., Bauer, Lofstrom and Zimmermann, 2000; Dustmann and Preston, 2007). There-fore, Chapter 3 also assesses the relevance of alternative concerns such as increasingcrime levels as potential channels.
1.2 Selected External Factors and Labour MarketOutcomes
This section introduces some external and exogenous factors that determine labourmarket outcomes, i.e. aspects that individuals cannot alter. It becomes quickly evi-dent that education is important to protect individuals from unexpected changes thatare outside their control.
1.2.1 Occupational Licensing as Entry Barrier
Entry barriers are costs that new entrants have to pay to become active in a given prod-uct market such as standardization of products, minimum capital requirements, andtime-consuming registration procedures to licenses that are required to run a busi-ness (Djankov, 2009; Kleiner, 2000). Occupational licences are one particular form ofentry barriers and are usually an educational requirement that individuals have toposses in order to practice an occupation. Doctors or lawyers are two obvious exam-ples of professions, which require occupational licences. Advocates for entry barriersargue that they can secure and improve the quality of the products and services pro-vided (Arruñada, 2007). For example, Anderson et al. (2016) find that occupational li-censing in medical professions can be highly beneficial by showing that the licensingof midwives in the early 20th century in the United States led to reductions in infantand mother mortality. Opponents argue that entry barriers lead to ine�icient alloca-tions of resources because they restrict competition and create rents for incumbentfirms (Peltzman, 1976; Posner, 1975; Stigler, 1971).
Chapter 4 analyses the e�ects of a reform that removed an occupational requirementin the cra�s sector that was previously necessary to own a business in the respectivecra� occupation. The Master Cra�s Certificate, a costly (both in terms of money andtime) advanced professional degree, acted as a substantial entry barrier for cra�smento become self-employed, and was removed for roughly half of all cra� occupations in2003. Standard economic theory predicts that reducing entry barriers for firms leadsto increasing entrepreneurial activity through increasing the number of active firms(e.g., Bertrand and Kramarz, 2002; Mullainathan and Schnabl, 2010). This is exactly
Microeconometric Analyses on Determinants of Individual Labour Market Outcomes 5

1 Introduction
what happened in the case of this reform: the number of firms in deregulated occupa-tions increased by up to 300 percent.
The predictions on how wages and employment evolve following an increase in com-petition are less clear cut. If incumbent firms and new entrants are e�ective competi-tors, meaning that they engage in similar markets and compete for similar resources(Chen, 1996), then incumbent firms may react by increasing investments (Alesinaet al., 2005) and innovative activity (Aghion et al., 2004; Gri�ith, Harrison and Simp-son, 2010) to keep their long-run competitive advantage. However, new firm entrycan also be detrimental to innovation and growth by diminishing rents and therebydecreasing incentives to innovate and invest (Aghion et al., 2005).
It is important to understand the potential earnings and employment outcomes ofworkers who work in a firm that is a�ected by a deregulation. In many cases, the mainbeneficiaries of entry regulations are incumbent firms, which are protected from com-petition by entry barriers and can therefore raise economic rents through chargingmarkups on prices.4 There is strong evidence that firms share their economic rentswith their employees, causing higher wages in many regulated markets and indus-tries.5 To protect their product market position, firms may try to save costs follow-ing a deregulation reform by revising wages of their workers downwards. However, toretain their competitive advantage, firms may also choose to invest in the human cap-ital of their workforce because firms with more skilled labour work more e�iciently.Evidence on this channel comes from Fernandes, Ferreira and Winters (2014) andGuadalupe (2007) who show that returns to skills increase a�er a deregulation andfrom Bassanini and Duval (2006) who show that firms invest more in training their em-ployees. Whether deregulation increases or decreases wages of incumbent workersis therefore an empirical question that Chapter 4 seeks to answer.
1.2.2 Education as Insurance Against Change
Education teaches adaptability and acts as an insurance against changing conditions(e.g., Nelson and Phelps, 1966). Since skill begets skill (Heckman, 2000), possessing asolid basis of education enables individuals to acquire new skills in the future, whennew technologies, occupations or industries require them. Much attention in the liter-ature has been paid to general versus skill-specific education, focussing on universityversus vocational education, arguing that the former is preferable because it teachesmore general and therefore transferable skills. Krueger and Kumar (2004) show that
4 See, e.g., Djankov (2009); Gittleman, Klee and Kleiner (2018); Kleiner and Krueger (2013); Weeden (2002).5 See, for example, Arai and Heyman (2009); Card, Devicienti and Maida (2014); Christofides and Oswald (1992);Blanchflower, Oswald and Sanfey (1996); Guertzgen (2009); Hildreth and Oswald (1997); Rusinek and Rycx (2013).
6 Microeconometric Analyses on Determinants of Individual Labour Market Outcomes

1 Introduction
on a country level, economies that favour vocational education grow slower thancountries that focus on general education, due to slower adaptations of new tech-nologies, in particular when the pace of technological advancement increases. Theauthors o�er this as potential explanation for di�erential growth rates between theUS (more general education) and European countries (more vocational focus), espe-cially since the rate of technological advancement picked up in the 1980s. At theindividual level, Hanushek et al. (2017a) and Hampf and Woessmann (2017) showthat vocational education eases entry into the labour market for young individualsbut increases the risk of unemployment in later life and also reduces lifetime income.The reason is that while vocational education provides a more seamless transitionfrom the apprenticeship into regular employment, it does not impart enough adap-tive skills in case of unemployment later in life. With general education and transfer-able skills, the risk of unemployment is reduced because individuals are better ableto adapt to new occupations and new tasks. With technological advancement thatfavours skilled labour (Acemoglu and Autor, 2011; Autor, Levy and Murnane, 2003),and increased occupational complexity (Spitz-Oener, 2006), this trade-o� becomesparticularly relevant.
One can go further in the distinction between general and specific skills, namely atthe level of occupations. Lazear (2009) provides a useful framework for occupationalspecificity, called skill-weights approach, which assumes that occupations use di�er-ent skills with di�erent respective weights, so-called skill bundles. Skill bundles ofoccupations have di�erent distances to the skill bundle of the labour market on av-erage. The further away a skill bundle is from the average of the labour market, themore specific that occupation is and the more costly it is for a person with such skillsto change occupations. Conversely, skill bundles that are similar to the labour marketon average, enable individuals to switch occupations at lower costs. Geel, Mure andBackes-Gellner (2011) operationalise the skill-weights approach for German occupa-tions using skills from a German employment survey and find that the more specifican occupation, the higher apprentice training costs for the firm and the lower occupa-tional mobility. Eggenberger, Rinawi and Backes-Gellner (2018) find a clear trade-o�between higher wages in more specific occupations but lower occupational mobilityand therefore higher risk of unemployment.
Chapter 5 focusses on an important German education institution, namely the voca-tional education training (VET) system, sometimes called the dual system. It is dual inthat there is cooperation between companies and publicly funded vocational schools.Individuals in VET spend part of their time working as an apprentice at a company andthe other part at a vocational school. The system plays a large role in post-secondary
Microeconometric Analyses on Determinants of Individual Labour Market Outcomes 7

1 Introduction
education in Germany; these days about 40 percent of a cohort enter vocational ed-ucation (Statistisches Bundesamt, 2018b). The system is o�en praised as the reasonfor low youth unemployment in Germany, because it eases the transition from edu-cation into the labour market.6 There are over 320 di�erent occupations which re-quire vocational education, which range from manual and technical to service, mer-chants or public service related occupations. The analysis in Chapter 5 looks at theskill-specificity of the occupations that individuals choose upon entering vocationaleducation training. In particular, the focus is on vocational occupation choices of in-dividuals who grew up in regions that are exposed to structural change.
Structural change is the slow transition of a labour force from one sector to another,such as the slow change from a predominantly manufacturing to service-based econ-omy, which started in Germany like in most Western countries in the 1970s. It can besaid to be driven by both automation (e.g., Levy and Murnane, 1992) and trade (e.g.,Dauth and Suedekum, 2016), in that routine tasks become automated and goods getproduced where it is cheapest to do so. The analysis in Chapter 5 deals with the partof structural change, which is induced by trade, in particular import competition. Thecentral idea is that trade with China following its accession to the WTO and EasternEurope a�er the fall of the iron curtain, was an exogenous shock in manufacturingimports, which a�ects di�erent regions in Germany di�erentially, due to varying in-dustry structures. Studies looking at the impact of this trade exposure for Germanyactually find, that Germany has profited due to increased export opportunities thatretained employment in manufacturing. Nevertheless, certain regions also lost largeshares of manufacturing employment because of their specialisation in industries inwhich China amd Eastern Europe happened to become more competitive than Ger-many (Dauth, Findeisen and Suedekum, 2014).
The question is whether individuals who grew up in regions with trade-induced struc-tural change, shelter themselves in terms of the vocational occupations they enter.General skills act as an insurance to individuals for at least three reasons. First, occu-pations which impart general skills tend to be in more modern and service-orientedoccupations and therefore not so much subject to these transitory forces. Secondly,these occupations are less likely to be replaced by trade and automation because theyrequire human interaction or case-specific actions. Lastly, if points one and two donot hold, general skills enable the individual to adapt and apply the skills in a newoccupation.
6 68 percent of apprentices were o�ered a full employment contract at their training firm upon completion ofVET in 2016 (BIBB, 2016).
8 Microeconometric Analyses on Determinants of Individual Labour Market Outcomes

1 Introduction
1.3 Empirical Methods for Causal Inference
Economists are interested in making causal claims to the relationships we uncover inorder to make policy recommendations. The gold standard of causal inference is torun an experiment, in which the experimental subjects are randomly assigned to treat-ment and control groups. Random assignment ensures that on average, individualsin both groups are the same in terms of observable as well as unobservable character-istics, and that therefore any di�erence in outcome must stem causally from assign-ment to the treatment (e.g., Angrist and Pischke, 2009; Schlotter, Schwerdt and Woess-mann, 2011). In absence of such experimental designs with random assignment, asimple regression of an outcome on a treatment will likely introduce a bias and there-fore not give the causal e�ect of the treatment. Take for example earnings as outcomeand a university degree as treatment. If we were to regress earnings on whether anindividual holds a university degree, we would overestimate the causal e�ect of theuniversity degree for a couple of reasons. First, selection into tertiary education is notrandom and the individual who enters it may have done similarly well on the labourmarket in absence of a university degree. The problem here is due to omitted variablesthat we cannot observe and which make an individual both choose tertiary educationand do well on the labour market, such as factors of ability, perseverance, and motiva-tion. The second source of bias is reversed causality: the individual who went to uni-versity may have gone because of his or her high (family) earnings, not the other wayaround. In the case where a randomized experiment is not possible, the researchermust rely on “an identification strategy”, which is the manner in which observationaldata is used to approximate a real experiment (Angrist and Pischke, 2009).
Chapters 2 and 3 and Chapters 4 and 5 can be separated along another dimension thanthat of individual versus external determinants of labour market outcomes, namelybeing experimental versus observational studies.7 In Chapters 2 and 3, the empiricalanalyses are based on experiments which use surveys as a basis for the experimentaldesign. In Chapter 2, an online experiment is administered among a representativesample of human resource managers. The participants are asked to imagine therewere a vacancy in their firm and to consider the two CVs of fictitious candidates thatappear side-by-side. They have to choose one of these two CVs, to “invite them to aninterview at their firm” (hypothetically speaking). On the CVs, we independently ran-domize skill signals, such as grade-point-averages, language skills or social volunteer-ing. This allows to obtain the causal e�ect of skill signals on the probability of being
7 However, the two dimensions are certainly related. One can credibly “manipulate” individual characteristicsin an experiment, in particular when another person is supposed to believe or judge them. On the other handone may need a natural experiment for exogenous shi�s in external factors.
Microeconometric Analyses on Determinants of Individual Labour Market Outcomes 9

1 Introduction
invited for an interview. It would be very di�icult to obtain such causal e�ects froman observational study, because di�erent skills are usually highly correlated with eachother. Arguably, many types of skill investments do not only increase one particulartype of skill, but a�ect the development of several dimensions of skills. In addition,the acquisition of actual skills and skill signals may depend on other determinants ofemployability such as innate characteristics.8
In Chapter 3, we design a survey experiment in which we ask a large sample of uni-versity students about their attitudes towards refugees. The challenge here is that weneed random exogenous variation in our participants’ beliefs about how educatedrefugees are. The exogenous variation in beliefs stem from random provision of infor-mation, which shi� individuals’ beliefs, a so-called information treatment9. Our par-ticipants are randomly assigned into one of three groups. The control group does notreceive any information on the education level of refugees. Respondents in the HighSkilled treatment are informed about a study that finds that refugees are rather well-educated. In the Low Skilled treatment, we induce the opposite beliefs by informingparticipants about a di�erent study that finds that refugees are rather low-educated.This survey design was feasible because of the existing uncertainty and contradictorymedia coverage on the level of education of the incoming refugees between 2014 and2016. The information treatments shi� our participants’ beliefs about the educationlevel of refugees in the expected directions. We exploit this shi� in beliefs to analyseits causal e�ect on attitudes towards refugees.
Chapters 4 and 5 use observational data and identification strategies to mimic therandom assignment of an experiment. Chapter 4 exploits a policy change as a natu-ral experiment and uses a di�erence-in-di�erence estimator. There are two groups ofcra� occupations in that chapter, one of which gets deregulated (i.e. “treated” group)and the other remains as it was (i.e. “comparison” group). Because these two groupsare not assigned to treatment and comparison randomly, we cannot simply take theirdi�erence in outcomes a�er the reform, because they may have been di�erent evenin the absence of the reform. The crux is to observe the two groups both before anda�er the reform. By taking a double-di�erence, i.e., the di�erence in average outcomein the treatment group before and a�er treatment minus the di�erence in average out-come in the comparison group before and a�er treatment, we obtain the causal e�ectof the reform which is rid of both the di�erence between the two groups, as well asany di�erence which occurred to both groups over time. For this estimate to produce
8 See Rich (2014), Neumark (2016), and Bertrand and Duflo (2016) for overviews of CV studies.9 See Cruces, Perez-Truglia and Tetaz (2013); Elias, Lacetera and Macis (2015); Kuziemko et al. (2015); Wiswalland Zafar (2015); Lergetporer et al. (2016); Bursztyn (2016) and ? for further examples and overviews of surveyexperiments using information treatments.
10 Microeconometric Analyses on Determinants of Individual Labour Market Outcomes

1 Introduction
the true e�ect, it must hold that the two groups would have developed similarly, i.e.,on “parallel trends” in the absence of the reform (Angrist and Pischke, 2009). Luckilyin Chapter 4, we have high-quality social security data as well as microcensus data,which allows to observe workers in many years both before and a�er the reform, inorder to ensure that the parallel trends assumption holds. We even take a further stepto ensure comparability of our treatment and comparison groups and use entropy bal-ancing, a non-parametric matching procedure which allows us to reweight observa-tions such that their pre-reform characteristics are identical on average and in theirvariances (Hainmueller, 2012).
In Chapter 5 finally, I use a combination of di�erent strategies to obtain an exogenoussource of regional structural change. To construct the extent of local import exposureper worker, a so-called shi�-share measure is constructed (Bartik, 1991). In a firststep, I look at yearly industry imports from China and Eastern Europe in every man-ufacturing industry. This then gets apportioned to the region proportionally to initialemployment in the industry and region, and then summed over all industries. Themeasure therefore gives predicted potential local import exposure per worker, givennational import volumes (see also e.g., Dauth, Findeisen and Suedekum, 2014). Thisis useful (i) because I do not observe the actual local per worker import exposure and(ii) using national industry imports and apportioning it to initial industry structuresgets rid of region-specific adjustments which are endogenous to the trade shock. Ina second step, I instrument imports to Germany with imports to other high-incomecountries. “Instrumental variables” are used when an explanatory variable is endoge-nous, i.e. is correlated with the error term. The main idea is to find another variablewhich is highly correlated with the endogenous regressor, but is unrelated with theoutcome and the error term, meaning that the only way in which it a�ects the out-come is through the channel of the endogenous regressor (Wooldridge, 2008; Angristand Pischke, 2009). One then uses the instrument to predict the endogenous vari-able and uses the predicted values instead of the endogenous variable, in a so-calledtwo-stage least squares instrumental variable regression. In the context of Chapter 5,this means that trade in other high-income countries with China and Eastern Europeis highly correlated with Germany’s trade with China and Eastern Europe and can beused to predict it. However, imports from China and Eastern Europe to other highincome countries (such as New Zealand for example), are entirely unrelated to occu-pational choices and labour market outcomes of adolescents in German local labourmarkets. This allows to uncover the causal e�ect of import exposure on vocationaloccupation choices.
Microeconometric Analyses on Determinants of Individual Labour Market Outcomes 11

1 Introduction
1.4 Chapter Overview
While previous sections introduced selected aspects of the four chapters containingmy research, this section provides concise but comprehensive summaries of the fourchapters.
Chapter 2 provides evidence on the importance of skill signals in the job applicationprocess of labour market entrants. The chapter is joint work with Marc Piopiunik,Guido Schwerdt and Ludger Woessmann. As skills of labour market entrants are usu-ally not directly observed by employers, individuals acquire skill signals which theysend out to potential future employers, most commonly on their CV. To study whichsignals are valued by employers, we administer an experiment among a large repre-sentative sample of German human-resource (HR) managers. The HR managers areasked to choose between two fictitious CVs, which appear on their computer screensside-by-side, and decide which candidate they would rather invite to an interview,if their firm had an opening. To obtain causal e�ects of di�erent skill signals, we si-multaneously and independently randomize a broad range of skill signals on the CVpairs. Because the skill signals that are e�ectively relevant might di�er substantiallybetween secondary-school and college graduates due to di�ering relevance, expect-edness, and credibility of various skill signals, part of the HR managers receive applica-tions from secondary-school graduates for an apprentice position and the other partreceive applications from college graduates in business administration for a businesstrainee position.
We find that signals in all three studied domains – cognitive skills, social skills, andmaturity – have a significant e�ect on being invited for a job interview. Consistent withthe relevance, expectedness, and credibility of di�erent signals, the specific signalthat is e�ective in each domain di�ers between apprenticeship applicants and collegegraduates. GPAs prove important for both genders, with a stronger e�ect for collegegraduates than for secondary-school graduates. IT and language skills are particularlyrelevant for females. Social skills are highly relevant for both genders and particularlyimportant for secondary-school graduates entering the labour market at a young age.Maturity is particularly relevant for males, especially for secondary-school graduates.Moreover, we test heterogeneities by HR manager characteristics. Notably, older HRmanagers value school grades less and other signals more, whereas HR managers inlarger firms value college grades more. To validate our experimental set-up, we findthat HR managers’ choices in the experiment are consistent with self-reported hiringpriorities.
12 Microeconometric Analyses on Determinants of Individual Labour Market Outcomes

1 Introduction
Chapter 3 analyses the impact of refugees’ education level on natives acceptance ofrefugees. The chapter is joint work with Philipp Lergetporer and Marc Piopiunik. Inrecent years, Europe has experienced an unprecedented influx of refugees. While na-tives’ attitudes towards refugees are decisive for the political feasibility of asylum poli-cies, little is known about how these attitudes are shaped by refugees’ characteristics.We study whether attitudes towards refugees are a�ected by beliefs about the educa-tion level of refugees. To do so, we implement online survey experiments with morethan 5,000 students at universities in Germany. To estimate causal e�ects of beliefsabout education on attitudes, we exogenously shi� respondents’ beliefs by randomlyproviding information on the education level of refugees. The uncertainty regardingrefugees’ education level at the time, allows us to provide opposing information onthe education level of refugees in Germany to our three experimental groups. Thecontrol group does not receive any information on the education level of refugees.Respondents in the High Skilled treatment are informed about a study that finds thatrefugees are rather well-educated (UNHCR, 2015). In the Low Skilled treatment, we in-duce the opposite beliefs by informing participants about a di�erent study that findsthat refugees are rather low-educated (Woessmann, 2016).
We test two economic theories which make opposing predictions about how the ed-ucation level of refugees should a�ect natives’ attitudes towards them. The labourmarket competition model predicts that natives will be most opposed to immigrantswhose skills are similar to their own since these immigrants might be competitors onthe labour market. This model therefore predicts that university students, the par-ticipants in our surveys, are more opposed to refugees if they believe refugees to bewell-educated. The fiscal burden model, on the other hand, predicts that natives ingeneral are more opposed to low-skilled immigrants because they impose larger fiscalburdens on the public budget than high-skilled immigrants. In contrast to the labourmarket competition model, the fiscal burden model predicts that university studentsare more opposed to refugees if they believe refugees to be low-educated (see Hain-mueller and Hiscox, 2010).
We find that our information treatments strongly shi� respondents’ beliefs about theeducation level of refugees in the expected directions. Using the exogenous shi� inrespondents’ beliefs about refugees’ education as the first stage in an instrumental-variable approach, we find that beliefs about refugees’ education level a�ect natives’concerns about labour market competition. This finding is in line with the predictionsof the labour market competition model. In contrast, we find no e�ects on fiscal bur-den concerns or other concerns such as increasing crime levels. We also do not findthat education beliefs a�ect general attitudes towards refugees, because economic
Microeconometric Analyses on Determinants of Individual Labour Market Outcomes 13

1 Introduction
aspects are rather unimportant for forming general attitudes towards refugees. Ina follow-up survey, we test that our information treatment e�ects are not driven byexperimenter demand e�ects nor priming e�ects, and show that they are persistentacross time, and are not subject to social desirability bias.
Chapter 4 looks at the e�ects of a labour market reform in the cra�s sector. The chap-ter is joint work with Jens Ruhose and Philipp Lergetporer. We analyse the impactof a deregulation reform in the German cra�s sector on labour market outcomes ofincumbent workers. The reform abolished the requirement to hold a costly occupa-tional license to open a new business in some cra� occupation but not in others. Thisled to large increases in entrepreneurial activity, namely it tripled the number of busi-nesses in the deregulated occupations within ten years. Using longitudinal social se-curity data, we implement a matched di�erence-in-di�erences design with entropybalancing to account for observable characteristics and unobserved individual het-erogeneity.
We find that the deregulation reform had negative e�ects on earnings of incumbentworkers and that firms also adjust to competitive pressure via the employment mar-gin. We find that the daily gross earnings of incumbent workers in deregulated occu-pations grew significantly less than those of workers in regulated occupations a�erthe reform. Over the period from 2004 to 2014, workers in deregulated occupationsexperienced a negative average e�ect on their earnings of about 2.3 percent relativeto workers in regulated occupations. Year-specific estimates show that the treatmente�ect becomes gradually larger over time to -4.3 percent in 2014. We also find that un-employment among incumbent workers increased by 0.7 percentage points more inthe deregulated occupations than in the regulated occupations. Using cross-sectionalcensus data allows us to provide evidence on the income e�ects of self-employed,showing no e�ects on the income position of self-employed individuals in deregu-lated compared to regulated occupations. Further analysis suggests that the reformhad negative e�ects on overall employment and average wages of all employees inderegulated occupations. We conclude that while the reform created slight compet-itive pressure on incumbent firms resulting in erosion of some monopoly mark-upsand therefore decreasing earnings and employment of incumbent workers, the newlycreated firms were too small and insubstantial to spark positive e�ects on total em-ployment, investments or innovative activity.
Chapter 5 investigates the impact of growing up in a region with structural change onindividual vocational occupation choices. Structural change describes the transitionof the workforce from manufacturing to service-based occupations. Local labour mar-ket exposure to import competition has been shown to speed up this process. This
14 Microeconometric Analyses on Determinants of Individual Labour Market Outcomes

1 Introduction
chapter looks at the impact of growing up in a region exposed to import competi-tion on young individual’ choice of occupation in vocational education training andwhether the occupation teaches them specific or general skills. General skills protectfrom future unemployment because they are adaptable and transferable. I construct ameasure of occupational skill-specificity to show that manufacturing and cra�s occu-pations are skill-specific and have skill bundles further away from the average labourmarket, while service and merchant occupations are more general with skill-weightscloser to the average of the labour market.
I exploit the exogenous rise in trade volumes with both China following its accessionto the WTO and Eastern Europe a�er the fall of the iron curtain as an exogenous sup-ply shock of manufacturing good imports to Germany. Exogenous regional variationin import exposure stems from varying initial local industry structures with respect toemployment shares in the di�erent manufacturing industries. National industry tradevolumes are apportioned to the local labour markets by the initial local industry em-ployment structure in the sense of a shi�-share analysis. To isolate the supply-drivencomponent of imports from China and Eastern Europe and to shut down pull or pushfactors stemming from labour demand, I instrument imports (and exports) from Chinaand Eastern Europe to Germany with imports (and exports) from China and EasternEurope to other high-income countries.
Using longitudinal individual-level administrative social security data, the resultsshow that individuals growing up in regions with higher import exposure surpris-ingly choose more skill-specific occupation groups in manufacturing and cra�s, moreimport-intensive manufacturing industries in particular, and less general occupationsin services and commerce (as merchants). Secondly, I find that increased import expo-sure makes adolescents less likely to enter occupations with high computer use, andmore likely to enter manual occupations. Lastly, I find that individuals exposed to im-port competition in their adolescence who enter vocational education, are adverselya�ected on the labour market in terms of earnings in later life.
While the negative labour market outcomes cannot be directly causally linked to thevocational occupation choices due to issues of biased self-selection, suggestive evi-dence shows that general skill occupation groups in service and as merchants, shelterindividuals from the adverse e�ects of import competition, while the negative e�ectseems entirely driven by entering manufacturing occupations. I show that the e�ectsare not biased by endogenous sub-sample sorting in the sense of di�erential sortinginto di�erent educational tracks and are not purely labour demand driven. Women,as opposed to men, are more likely to enter service and merchant occupations when
Microeconometric Analyses on Determinants of Individual Labour Market Outcomes 15

1 Introduction
exposed to local import competition, but are nevertheless adversely a�ected by im-port competition in terms of later labour market outcomes.
1.5 Policy Implications
While the four chapters all deal with di�erent aspects and determinants of labour mar-ket outcomes, the importance of education is the core message that unites them.
Chapter 2 provides useful insights not only to policy makers but also to young labourmarket entrants, teachers, parents and employers alike, on which skill signals are im-portant to human resource managers in Germany. The findings show that cognitiveskills, social skills and maturity are important and that the particularly relevant skillin these domains are di�erent for apprenticeship applicants and college graduates.The policy implication to be drawn from this chapter is that various skills pay o� inthe labour market, and that while formal education is still most important, schoolsand parents alike should encourage young individuals to invest in skills also outsideschool, such as IT skills or social volunteering and seek prior labour market experiencein the form of internships.
Chapter 3 first demonstrates that humanitarian aspects are very important for shap-ing natives’ attitudes towards refugees, which stipulates that the decision of grantingpersecuted asylum seekers temporary refugee status is independent of their charac-teristics and economic considerations. Secondly, the chapter contributes to under-standing the underlying determinants that drive public attitudes, which may stronglya�ect the political feasibility of asylum policy. While the e�ects of the large refugeeinflow on the labour market and on the government budget remain to be seen, ourfindings suggest that developments in these areas will only have limited impact onpublic attitudes, at least among high-skilled natives.
Chapter 4 shows the e�ect of a reform that removed an educational requirement to en-ter self-employment in the German cra�s-sector, thereby li�ing a substantial barrierto entry. We find that the reform led to decreased earnings and increased unemploy-ment for incumbent workers. This implies that the increased competitive pressuredid reduce some mark-ups and monopoly rent sharing. However, the reform also didnot trigger employment and earnings growth for other workers in the a�ected occupa-tions, as theory on competition would predict. The most likely reason for this findingis that the newly established firms remained one-man businesses with low ability tocompete against incumbent firms that also did not produce new employment. Thismay be due to the fact that holding a Master Cra�s Certificate still acts as a consider-
16 Microeconometric Analyses on Determinants of Individual Labour Market Outcomes

1 Introduction
able signal of quality to consumers, and that business owners without them simplydo not compete on the same market.
While decreasing entry barriers should generally foster competition, entrepreneurialactivity, innovation, and employment growth, policy makers should be aware thatthere may be unintended consequences when the newly created businesses do notcompete with incumbent firms. If this is the case, it is likely that there are further(more important) barriers in place that hold back new firms from becoming stablecompetitors. Thus, each deregulation reform should collect and carefully evaluatepossible industrial and occupational entry barriers before the reform is implemented.While it is di�icult to identify all relevant entry barriers ex ante, the success of eachreform has to be constantly monitored and evaluated. The results also point to theimportance of investigating not only short-term but also long-term e�ects of policies,as the reduction and redistribution of rents through deregulation may induce adjust-ments over longer periods.
My findings in Chapter 5 finally show that individuals tend not to choose occupationsthat shelter them from forces of globalisation and trade. Individuals exposed to im-port competition choose more skill-specific occupations than elsewhere and also en-ter more import impacted industries. This implies that they will likely be exposed tofurther import competition in the future, and any immediate e�ect of trade shocks onearnings may be underestimated. The results suggest that these occupational choiceslead to adverse outcomes on the labour market in particular in terms of later earnings.In terms of policy implications, these findings clearly point to the importance of pro-viding better information to young individuals choosing their vocational occupations.The results also imply that individuals predominantly enter apprenticeships in occu-pations which are strongly present in their local labour market. While this is partlydriven by labour demand, there is clearly a place for campaigns informing adolescentson di�erent occupations and their advantages, in particular with regards to the gen-eral and transferable skills they teach. Moreover, the paper points to the importanceof regional redistribution, as regions go through di�erent stages of development andmay be adversely a�ected by factors outside their immediate control. Once prosper-ous regions may turn to losers of globalisation, and once struggling regions may riseas stars (Dauth and Suedekum, 2016), which is why all regions have an interest in par-ticipating in redistribution policies.
To conclude this introduction, the policy implication from this thesis as a whole, isthat policy makers cannot stress the importance of education and skills enough, be-cause it is what equips the labour force to navigate the labour market and its constant
Microeconometric Analyses on Determinants of Individual Labour Market Outcomes 17

1 Introduction
changes and challenges. The thesis demonstrates that this is true for new labour mar-ket entrants, refugees and professionals alike.
18 Microeconometric Analyses on Determinants of Individual Labour Market Outcomes

2 Skills, Signals, and Employability: An ExperimentalInvestigation∗
2.1 Introduction
Cognitive and non-cognitive skills predict individuals’ labour-market performance(e.g., Heckman, Stixrud and Urzua, 2006). But employers cannot directly observe theskills of job applicants. Therefore, individuals make costly investments to signal theirskills to potential employers. So far, however, it is not well understood to what extentspecific skill signals – characteristics in which workers have invested – a�ect hiringdecisions. When making hiring decisions, employers simultaneously consider manydi�erent and potentially highly correlated signals, and not all of these signals are typ-ically observed by researchers. As a consequence, a more nuanced empirical investi-gation of the relative importance of di�erent skill signals for employability is challeng-ing.
In this chapter, we investigate how several skill signals a�ect labour-market entry inan experimental setting. We conduct a randomized survey experiment among 579human-resource (HR) managers, exploiting our access to the ifo Personnel ManagerSurvey, a regular survey of HR managers representative of German firms. The experi-mental design gives us full control over the information set available to firms. We si-multaneously randomize several skill signals contained in applicants’ CVs. This set-upallows us to base our identification strategy on independent and exogenous variationin di�erent signals within three broad skill domains: cognitive skills, social skills, andmaturity – a trait potentially of particular relevance at labour-market entry. Due todi�ering relevance, expectedness, and credibility of various skill signals, the specificsignals that are e�ectively relevant might di�er with the educational degree of appli-cants. Therefore, about half of the HR managers receive applications from secondary-
∗ This chapter was coauthored by Marc Piopiunik, University of Munich and ifo Institute, Guido Schwerdt,University of Konstanz and Ludger Wößmann, University of Munich and ifo Institute. Financial support by theGerman Federal Ministry of Education and Research for the project “Exit exams as a governance instrument inthe school system: The importance of school-leaving grades for the hiring decisions of firms” within the BMBFresearch priority “Educational Governance” (SteBis) is gratefully acknowledged.
Microeconometric Analyses on Determinants of Individual Labour Market Outcomes 19

2 Skills, Signals, and Employability
school graduates for an apprentice position. The other half receive applications fromcollege graduates in business administration for a business trainee position.1
The choice experiments confront HR managers with resumes of two fictitious job ap-plicants, asking them to indicate the applicant whom they would rather invite for a jobinterview in their firm. The only information on the applicants available to HR man-agers are the elements of the resumes. Specifically, cognitive skills are signalled bygrade-point averages (GPAs) in school for secondary-school graduates and in collegefor college graduates, as well as by IT skills, fluency in English, and a second foreignlanguage. Social skills are signalled by social volunteering and team sports (as op-posed to single sports). Maturity is signalled by being older within the same schoolcohort and length of internship.2 We carefully selected these CV elements in a pre-study, conducting qualitative interviews with HR managers to identify the pieces ofinformation that are typically included in resumes of real applicants in Germany. Inour survey, we complement the choice experiments with a questionnaire of the HRmanagers.
We find that signals in all three domains –cognitive skills, social skills, and maturity–significantly a�ect the probability of being invited for a job interview. GPAs prove im-portant for both genders, with a stronger e�ect on the probability of being invited fora job interview for college graduates than for secondary-school graduates. IT and lan-guage skills are particularly relevant for females. Social skills are highly relevant forboth genders and particularly important for secondary-school graduates entering thelabour market at a young age. Maturity is particularly relevant for males, especially forsecondary-school graduates.
These heterogeneities by labour-market entry age and gender are consistent withvarying relevance, expectedness, and credibility of the di�erent skill signals in di�er-ent contexts. Gender di�erences in the e�ects of IT skills, language skills, and maturityare generally in line with gender stereotyping. Social skills are most e�ectively sig-nalled by social volunteering among secondary-school graduates but by engaging inteam sports among college graduates, possibly reflecting limited credibility of volun-
1 To avoid unrealistic situations, the resumes are adjusted to the firm of the HR manager. Most importantly,using information on the educational composition of the firms’ workforce that we elicited in a pre-survey,secondary-school graduates applying for an apprentice position are presented only to HR managers in firmsthat currently o�er apprenticeship positions. Similarly, applications of college graduates are only shown to HRmanagers whose firms employ college graduates.2 The categorization of specific skill signals into three broad skill domains is meant as a structuring device ratherthan a conceptually sharp distinction. Presumably, signals that are included in real-world CVs – which are thesubject of this chapter – always reflect components of di�erent domains but tend to be perceived as having afocus in one of the domains (see Section 2.2.3 for details)
20 Microeconometric Analyses on Determinants of Individual Labour Market Outcomes

2 Skills, Signals, and Employability
teering activities of older individuals who may behave strategically. In addition, skillsignals that are easily verifiable in real hiring situations such as age, internships, andGPAs (available on transcripts usually included in German applications) tend to havehigher returns than skills that are costlier to verify, such as language skills and socialvolunteering.
Exploiting our HR manager questionnaire, we also find heterogeneities with respectto HR managers’ personal characteristics. Most importantly, managing directors andolder HR managers put less weight on the school GPAs of apprenticeship applicants,but instead put more weight on IT skills, social volunteering, and experience throughinternships. HR managers in large firms value the college GPAs of college graduatesmore, possibly due to a more standardized procedure of applicant selection.
Our questionnaire also asks HR managers to indicate the importance they attach tovarious resume attributes of actual job applicants in their firm. Corroborating our ex-perimental set-up, we find that HR managers’ self-reported hiring priorities tend to bein line with their decisions between the fictitious candidates’ resumes in the choice ex-periments.
Overall, our results indicate that a broad range of skill signals indeed causally a�ectemployment chances at labour-market entry. Employers value skill signals in sev-eral di�erent domains. While situated in a specifically designed experimental setting,the results add an important dimension to our understanding of how labour marketsprocess and use information on skills. When observational data indicate that signalssuch as high-school grades are associated with labour-market outcomes, it remainsunclear whether employers really value grades or whether the association capturesother productivity aspects that happen to be correlated with grades, whereas gradesare potentially never conscientiously observed by employers. Even in the setting ofa convincing natural experiment, it is hard to imagine a research design that can sep-arately identify independent exogenous variation in di�erent skill dimensions suchas GPAs and social engagement. Exploiting randomized controlled variation in sev-eral skill signals, our experimental results indicate that employers do indeed careabout signals such as high-school GPAs, social volunteering, and internships, addingto the existing knowledge on the importance of skills and signals for labour-marketoutcomes. The results also inform about which signals may be particularly relevantfor whom. The observed e�ect heterogeneities by high-school vs. college background,gender of applicants, and traits of HR decision-makers suggest that di�erent signalsare regarded as relevant, expected, and credible in di�erent situations.
Microeconometric Analyses on Determinants of Individual Labour Market Outcomes 21

2 Skills, Signals, and Employability
Our results contribute to the large literature that has established that labour-marketoutcomes are associated with di�erent types of skills. Skills may be reflected througheducational degrees (e.g., Heckman, Stixrud and Urzua, 2006) or more directly ob-served in terms of cognitive skills (e.g., Hanushek and Woessmann, 2008). Social skillsseem to have become increasingly important on modern labour markets that valueteam production (Deming, 2017). Likewise, signals of maturity, including personal-ity traits such as conscientiousness, commitment, and perseverance, are strongly re-lated to labour-market outcomes (Almlund et al., 2011). Despite the wide evidencethat these di�erent types of skills are associated with labour-market success, it is un-clear whether signals of these skills that can be observed at the application stage havea causal impact on the employability at career start.
Our research design also adds to the literature on CV studies. This literature almostexclusively focuses on discrimination in the labour market, investigating e�ects of in-nate characteristics such as gender and race (e.g., Neumark, 2016, see Section 2.2.2for greater detail). By contrast, we are interested in the returns to skill investmentsthat are used as signals of productivity on resumes, thus focusing on the e�ects ofintentionally acquired characteristics.3 As a recent exception, Deming et al. (2016) in-vestigate the employability impact of for-profit online college degrees. Our study, inturn, investigates the employability impact of a broad range of acquired signals in dif-ferent skill domains.4 A related important di�erence between the existing CV studyliterature and our study is that statistical discrimination based on innate characteris-tics is typically considered unfair in the sense that it is based on circumstances thatare beyond a person’s control Roemer (1998).5 By contrast, di�erential treatment ofjob applicants is generally considered fair to the extent that it is based on di�erencesin signals that reflect di�erences in ability or e�ort. According to theories of job mar-ket signalling and screening (e.g., Riley, 2001), these skill signals have to be acquiredby individuals since actual skills are not directly observed by employers at the appli-cation stage.6
In contrast to most existing CV studies, HR managers in our study are fully aware thatthey are dealing with fictitious job applicants. A primary motivation for not being
3 To abstract from the aspects studied in the discrimination literature, we keep gender fixed within CV pairs anduse only standard German names.4 A general limitation of CV studies that our study has in common with this literature is that only the first stageof the application process – the interview invitation – is observed, but not actual job o�ers or wages.5 According to the non-discrimination principle, individuals who compete for positions in society should bejudged only on attributes that are relevant to the performance of the duties of the respective position. Therefore,attributes such as gender or race should not be considered.6 Throughout the chapter, we refer to signalling simply as the revelation of otherwise unobserved information,without any claim about whether the signalling process is productive or unproductive from a welfare perspective.
22 Microeconometric Analyses on Determinants of Individual Labour Market Outcomes

2 Skills, Signals, and Employability
transparent about the true nature of applications in conventional CV studies is con-cern about social desirability bias in HR managers’ behaviour. We are less concernedabout social desirability bias in our setting because we do not study discriminationagainst certain groups of applicants such as women, blacks, or foreigners. Apart fromnot deceiving participants, the transparency of our research design has several advan-tages. First, existing discrimination studies put substantial costs on the hiring systemsof firms. Second, the flooding of online portals with fictitious CVs might lead to artifi-cial results because initial hiring decisions are increasingly computerized, whereas fi-nal job o�ers are made by HR managers. Instead, we make use of evaluations by thoseHR managers who actually make the hiring decisions in their firms. Third, in contrastto studies that contact job portals, our survey-based approach enables us to collectinformation on decision-makers’ characteristics and hiring preferences.7 This allowsboth investigating e�ect heterogeneity by HR manager characteristics and assessingwhether self-reported hiring priorities are consistent with decisions in the experimen-tal set-up. Fourth, in our setting we have complete information on all applicants thatan HR manager faces. In contrast, researchers sending fictitious resumes to real jobopenings do not have information on the characteristics of the real job applicants forthe same position. The distribution of relevant resume characteristics of the other jobapplicants, however, likely a�ects job interview decisions.8
In what follows, Section 2.2 provides background on the role of skills and their signalson labour markets and discusses related literature. Section 2.3 describes the experi-mental design of our CV study. Section 2.4 reports the baseline results of the choice ex-periments. Section 2.5 investigates heterogeneous e�ects for di�erent HR managers.Section 2.6 concludes.
2.2 Conceptual Framework on Skills, Signals, and LabourMarkets, with Relation to the Literature
Based on the existing literature, we first discuss how di�erent skills may a�ect labour-market outcomes. We examine how these e�ects depend on the extent to which skillsare observed by employers and how the importance of skill signals may vary with the
7 We also have access to rich information on the firms, including their workforce’s educational composition.8 For example, assuming that employers value maths skills, the estimated returns to maths skills will be lowerif most real applicants possess high maths skills (since this lowers the probability that a fictitious applicantwith high maths skills gets invited to a job interview), compared to a situation where hardly any real applicantpossesses high maths skills. Since we have complete information on the distribution of characteristics of allapplicants, the magnitudes of the estimated skill signals are directly comparable with each other and notinfluenced by resume characteristics of unknown job applicants.
Microeconometric Analyses on Determinants of Individual Labour Market Outcomes 23

2 Skills, Signals, and Employability
quality of the signal and the context. We then discuss how a randomized CV study canbe used to elicit exogenous variation in di�erent skill signals and how the questionof costly skill signals di�ers from most of the existing CV study literature. Finally, wespecify our main research question and several hypotheses on e�ect heterogeneities.
2.2.1 Skills, Signals, and Labour-Market Outcomes
The employability of individuals depends on their marketable skills in which theymake a variety of investments. Formal education is one of these investments. Nu-merous studies show that more schooling and higher educational degrees lead tomore success on the labour market (e.g., Card, 1999; Heckman, Lochner and Todd,2006). However, while the reduced-form e�ects of educational investments on labour-market success are well documented, it is less well understood how these e�ects arise.Several aspects complicate a more nuanced investigation of the underlying mecha-nisms.Marketable skills are not unidimensional. The labour-market impacts of di�er-ent domains of skills are the subject of a growing literature. Several studies inves-tigate the importance of cognitive skills such as achievement on standardized testson labour-market outcomes (e.g., Osborne, Gintis and Bowles, 2001; Hanushek andWoessmann, 2008). Early studies9 as well as more recent investigations (Chetty et al.,2011; Hanushek et al., 2015, 2017a) document that cognitive skills are positively re-lated to employment and earnings.
There is also abundant evidence highlighting the importance of non-cognitive skills(e.g., Heckman, Stixrud and Urzua, 2006; Borghans et al., 2008; Almlund et al., 2011).While non-cognitive skills are o�en used as a vague term for a residual set of skills(many of which in fact contain a strong cognitive component), an increasing literatureinvestigates di�erent skills in the non-cognitive domain that are empirically clearlyspecified. One important dimension of non-cognitive skills is social skills. Deming(2017) argues that the importance of social skills on the labour market is growing,with the fastest-growing occupations requiring a substantial amount of interpersonalinteractions. His results support a model of team production where workers tradetasks to exploit their comparative advantage. In this setting, social skills reduce co-ordination costs, allowing workers to specialize and trade more e�iciently. Thus, so-cial skills such as the willingness to cooperate make workers more productive in teamproduction.10 This may be particularly important in occupations with a high comple-mentarity between cognitive and social skills (Weinberger, 2014). Recent evidence
9 E.g., Bishop (1989); Murnane, Willett and Levy (1995); Neal and Johnson (1996) and Mulligan (1999).10 In the context of a lab experiment, Englmaier and Gebhardt (2016) find direct evidence of a link betweenproductivity and cooperative behaviour measured by contributions in a public goods game.
24 Microeconometric Analyses on Determinants of Individual Labour Market Outcomes

2 Skills, Signals, and Employability
suggests that social volunteering may be used to credibly signal willingness to coop-erate (Heinz and Schumacher, 2017; Baert and Vujić, 2018), but social volunteeringmay also be correlated with other skills valued by employers.
Another dimension of non-cognitive skills that may be particularly relevant at thelabour-market entrance stage are personality traits that include maturity, conscien-tiousness, perseverance, and curiosity (e.g., Almlund et al., 2011). For example, Heck-man, Humphries and Mader (2011) find that even conditional on cognitive skills, high-school graduates outperform GED recipients in terms of labour-market outcomes andshow that this di�erence is driven by personality. This is in line with other findings ona positive link between personality traits and labour-market outcomes.11
However, any observational study on the labour-market impact of skills faces the chal-lenge that researchers do not know whether skills are actually observed by employers.In contrast to innate characteristics such as gender and race, cognitive skills, socialskills, and maturity are typically not directly observable. Thus, employability mightbe primarily a function of signals of these skills rather than the skills themselves. Ed-ucational credentials, grades, and extracurricular activities are just a few prominentexamples of such skill signals.
A large literature explores the role of costly skill signals in determining labour-marketoutcomes.12 Several studies investigate the signalling value of educational creden-tials (e.g., Tyler, Murnane and Willett, 2000; Clark and Martorell, 2014). The impor-tance of skill signals may, however, crucially depend on other factors. For example,skill signals may be more important for labour-market entrants than for workers withsubstantial experience. Such a pattern would be consistent with the evidence on em-ployer learning about the true skills of workers over time (Altonji and Pierret, 2001).Relatedly, ability appears to be observed well for college graduates, whereas it is re-vealed to the labour market more gradually for high-school graduates (Arcidiacono,Bayer and Hizmo, 2010).
More generally, the importance of a specific skill signal may depend on the perceivedquality of the signal. For example, in Colombia college reputation is correlated withgraduates’ earnings, but the return to reputation is reduced if a college exit exam isavailable as an additional skill signal (Macleod et al., 2017). In Germany, the informa-
11 E.g., Heckman, Stixrud and Urzua (2006); Mueller and Plug (2006); Heineck and Anger (2010); Lindqvist andVestman (2011).12 See Spence (1973), Arrow (1973), and Stiglitz (1975) for seminal contributions and Weiss (1995) and Riley(2001) for surveys.
Microeconometric Analyses on Determinants of Individual Labour Market Outcomes 25

2 Skills, Signals, and Employability
tion value of high-school grades depends on whether these grades were obtained inlocal or centralized exams (Schwerdt and Woessmann, 2017).
In addition, the value of a skill signal may also depend on stereotypes. If membersof a specific group are perceived as having certain skills while non-members are not,signals for the same skills may matter more for non-members. As a consequence, ed-ucation is generally a more valuable signal of productivity for blacks than for whites(Lang and Manove, 2011). Similarly, gender stereotypes during the hiring processhave been frequently documented in the sociological literature (e.g., Gorman, 2005).These stereotypes can arise unconsciously, as decision-makers may be influenced bygender-specific attitudes or beliefs they are not even aware of. One well-documentedexample of such an implicit gender stereotype is that males are considered as havinghigher math skills than females Lummis and Stevenson (1990).
2.2.2 CV Studies: Innate Characteristics vs. Acquired Signals
A key conceptual problem is that skills, as well as signals thereof, are typically highlycorrelated across domains. Arguably, many types of educational investments do notonly increase one particular type of skill, but a�ect the development of several di-mensions of skills. In addition, the acquisition of actual skills and skill signals maydepend on other determinants of employability such as innate characteristics. As aconsequence, it is empirically challenging to identify the isolated e�ect of an increasein one particular skill signal based on observational data. The key problem is thatother determinants of employability are likely not observed by the econometrician,but may be observed by the employer. To credibly estimate the relative importanceof di�erent skill signals on employability, it is therefore crucial to obtain independentexogenous variation in the di�erent skill domains.
Randomized CV studies o�er a methodological solution to this identification problem.In these studies, fictitious applications with fictitious resumes are sent to numerousemployers currently o�ering jobs. The resumes are designed to carefully match onall individual characteristics that matter for employability. The fictitious applicantsare thus identical except for the characteristic whose impact the researcher is inves-tigating. This research design has two key advantages. First, the experimentally gen-erated variation in resume characteristics solves the identification problem. Second,the econometrician knows exactly all the signals that the employer observes for thefictitious applicants. A common drawback of this research design, however, is thatonly the first stage of the application process – i.e., the invitation for a job interview –is observed, but not actual job o�ers and wages.
26 Microeconometric Analyses on Determinants of Individual Labour Market Outcomes

2 Skills, Signals, and Employability
Most studies using randomized resumes are motivated by research questions address-ing di�erent types of discrimination in the labour market (see Rich (2014), Bertrandand Duflo (2016) and Neumark (2018) for recent overviews). As a consequence, nearlyall existing CV studies focus on the impact of innate characteristics such as race (e.g.Bertrand and Mullainathan, 2004), gender (e.g. Booth and Leigh, 2010), age (e.g. Laheyand Oxley, 2016), immigrant status (e.g. Oreopoulos, 2011)13, phenotype (e.g. Arceo-Gomez and Campos-Vazquez, 2014), or beauty (e.g. Ru�le and Shtudiner, 2015).14
A di�erential treatment of job applicants by firms based on these innate characteris-tics will generally be viewed as unfair – e.g., according to Roemer’s 1998 concept ofequality of opportunity. In contrast, our focus is on characteristics in which individu-als can invest.
2.2.3 Main Research Question and Contextual Heterogeneity: Relevance,Expectedness, and Credibility of Skill Signals
The previous discussion implies some important open research questions that we ad-dress in this chapter. Our main question of interest is whether and which acquiredsignals of skills in di�erent domains have a causal e�ect on employability. To addressthis question, we simultaneously and independently randomize several skill signalsin the framework of a CV study, covering three skill domains: cognitive skills, socialskills, and maturity.
To obtain a more nuanced view of how skill signals function in the labour market, wealso aim to investigate how the e�ectiveness of di�erent types of skill signals variesin di�erent settings. As indicated, di�erent skills may be viewed as relevant and ex-pected in di�erent contexts, and di�erent signals may be viewed as credible. We thusset out to test how the relevance, expectedness, and credibility of di�erent skill sig-nals a�ect their e�ectiveness in di�erent contexts. First, given the di�erential observ-ability of skills for graduates from high school and college, we study the relevanceof di�erent skill domains for graduates of lower-secondary school who apply for anapprenticeship position as opposed to college graduates. Further aspects of skill rele-
13 While migration status is not innate, individuals cannot simply invest in this characteristic as in cognitive andnon-cognitive skills.14 Notable exceptions of randomized CV studies that investigate the e�ects of including information on a particu-lar cognitive or non-cognitive skill on the resume include Koedel and Tyhurst (2012) for maths skills, Protschand Solga (2015) for school grades and teacher evaluations, Humburg and van der Velden (2015) for occupation-specific field of study and professional experience, Kübler and Schmid (2015) for age and additional training,andHeinz and Schumacher (2017) andBaert and Vujić (2018) for social volunteering. In a non-randomized pre-post set-up of a CV study, Falk, Lalive and Zweimüller (2005) study the e�ect on job interview invitations of atraining course meant to raise basic computer skills.
Microeconometric Analyses on Determinants of Individual Labour Market Outcomes 27

2 Skills, Signals, and Employability
vance may give rise to heterogeneity by gender (if employers have stereotypes abouthow di�erent genders will be employed in the workplace), firms (e.g., relevance ofdi�erent skills in di�erent sectors), and types of HR managers (e.g., more or less ex-perienced managers). The investigation of whether the importance of skill signals de-pends on the characteristics of HR managers is typically not feasible when sendingfictitious applications to real job openings.15
Second, certain groups of applicants may be generally expected to be equipped withcertain skills, reducing the pay-o� to respective signals. For example, employers mayexpect college graduates, but not secondary-school graduates, to be equipped withbasic foreign language and IT skills anyway. A further example of expectedness is an-other form of gender stereotyping: if HR managers, for example, expect boys to bea�ine to computers in general, signalling good IT skills may have a higher value forgirls than for boys.
Third, the value of a signal may depend on its credibility. One central aspect of credi-bility is the extent to which a signal can be verified, which may be easier for GPAs thanfor social skills. Another aspect of credibility refers to the possibility of strategic be-haviour of job applicants. For example, even rather unsociable people may chooseto signal social volunteering if they expect such signals to be rewarded in the labourmarket. In such a setting, social volunteering may lose credibility as a signal of socialskills and may be replaced by other signals that are less subject to strategic behaviour.
2.3 Experimental Design
To investigate the importance of skill signals for employability, we conduct an onlinesurvey experiment with randomized CVs among German HR managers.
2.3.1 Choice Experiments in an HRManager Survey
We conduct our online survey experiment among HR managers who participate inthe ifo Personnel Manager Survey.16 The ifo Institute is an independent economic re-search institute that regularly administers business surveys including Germany’s mainbusiness climate index. The quarterly survey of personnel managers is generally usedto construct an index of the usage of di�erent personnel management instruments
15 In an alternative attempt to learn about heterogeneity across screeners of resumes, Lahey and Oxley (2016)use eye-tracking technology, albeit on a sample of students in the lab rather than actual HR managers.16 For more information on the ifo Personnel Manager Survey, see https://www.cesifo-group.de/ifoHome/facts/Survey-Results/Personalleiterbefragung.html.
28 Microeconometric Analyses on Determinants of Individual Labour Market Outcomes

2 Skills, Signals, and Employability
and to investigate current topics of personnel policy. We conducted our survey as aspecial additional survey in August 2016.17 The firms covered by the database are arepresentative sample of firms in Germany.
In our survey, we confront each HR manager with two choice experiments. In eachchoice experiment, we ask HR managers to compare resumes of two fictitious appli-cants (either two secondary-school graduates or two college graduates) which are pre-sented side by side on the same screen.18 The HR managers are asked to choose thecandidate they would rather invite for an interview in their firm.19 We force HR man-agers to select exactly one of the two candidates to mimic the fact that HR managersultimately have to make choices and to increase statistical power in the empirical anal-ysis. HR managers complete the two choice experiments sequentially and are not ableto revise their decisions.
To present realistic candidates to HR managers, we elicited information on the edu-cational structure of the firms’ workforce in a pre-survey, conducted in the context ofa regular ifo Personnel Manager Survey prior to our main survey. Based on the shareof employees with college degrees and the presence of apprentices in the firm, wesplit firms in our database into two groups. HR managers in firms with a high share ofcollege-educated employees were shown resumes of fictitious college graduates ap-plying for a fictitious graduate trainee position.20 The second group of HR managers,who had apprentices in their firm at the time of our survey, were shown resumes of fic-titious secondary-school graduates with an intermediate school degree applying fora fictitious apprentice position.
17 HR managers of firms in the ifo database were first contacted by mail with the request to participate in aspecial additional survey. The letter informed the HR managers that the ifo Institute was to carry out a scientificstudy that was financed by the Germany Ministry of Education and Research. They were told that they wouldreceive an email a few days later that included a link to the online survey and that completing the survey wouldtake about three minutes. Additionally, the letter stated that the goal of the survey was to study hiring decisionsin Germany and that all answers would be kept strictly confidential.18 In the instructions of the choice experiment, HR managers were asked to imagine that their firm had a vacancy– either an apprenticeship position or a traineeship position for a business university graduate – and to considerthe two shown fictitious applicants for that position.19 Additional analyses (not shown) reveal that the resume shown on the le�-hand side is chosen with the sameprobability as the resume shown on the right-hand side. Including an indicator for the side on which a CV isshown does not a�ect our estimates.20 HR managers are assigned to this group if their establishment either (i) does not o�er apprentice positions,(ii) has a share of at least 25 percent of college-educated employees, or (iii) has a share of at least 5 percentcollege-educated employees and the majority of apprentices have completed the most academic high-schooltrack (Abitur).
Microeconometric Analyses on Determinants of Individual Labour Market Outcomes 29

2 Skills, Signals, and Employability
To create realistic resumes, we used real resumes to set up our fictitious resumes.21
Prior to our main survey experiment, we conducted field interviews with HR managersresponsible for selecting candidates in six firms located in Munich (also drawn fromthe ifo Personnel Manager Survey database) to assess whether our fictitious resumeswere realistic. Importantly, all interviewed HR managers stated that our skill signalsincluded in the fictitious resumes are relevant criteria at the first stage of the hiringprocess. We also discussed the values that these signals typically take on in practice,e.g., the common range of values of school grades and college grades. The expert inter-views helped to set up realistic resumes that are appropriate to answer our researchquestions and also provided feedback on the questionnaire (see Section 2.5).
2.3.2 The Resumes
Secondary-School Graduates
The resumes shown to the HR managers are one-page CVs that contain standard in-formation that would generally be included in job applications in Germany.22 Ap-pendix A2.1 describes all elements of the resumes of secondary-school graduates indetail. Figure 2.1 shows an example of a resume of a secondary-school graduate andTable A2.1 lists all possible values of all CV elements.
All fictitious secondary-school graduates obtained an intermediate school degree(Mittlere Reife) a�er 10 years of schooling.23 Because mobility is typically low amongindividuals with vocational education in Germany, all secondary-school graduateswere born and attended school in the state of the HR manager’s firm.24 Furthermore,at the beginning of the online survey, HR managers are asked whether their firm o�erspredominantly technical or commercial apprenticeships. Depending on the answer to
21 We did not include a cover letter or a photograph on the resume, which is standard in German applications,since HR managers in our study were fully aware that they face fictitious candidates.22 Firms typically receive many applications for apprenticeship positions. Therefore, in the first stage, HRmanagers pre-select appropriate candidates based on written applications, which include a cover letter, theresume, and various documents. Subsequently, large firms may conduct written tests and ask applicants to dosome trial work, followed by job interviews. About 30 to 40 percent of applicants pass the first stage and only 10to 15 percent are eventually invited to job interviews (Protsch and Solga, 2015).23 The German school system tracks students (in almost all states) a�er four years in primary school into threesecondary-school tracks that di�er in academic orientation: basic school (Hauptschule), intermediate school(Realschule), and high school (Gymnasium). Basic school is the least academic track and lasts until grade 9 or 10.It is typically followed by an apprenticeship in a firm that includes part-time attendance in a vocational school.Intermediate school usually lasts until grade 10 and is traditionally also followed by such an apprenticeship.High school is the most academic track and lasts until grade 12 or 13. It is meant to prepare students for college,with the high-school leaving certificate (Abitur) being a precondition for attending college.24 Fictitious candidates are born in the capital of the respective state (there are 16 states in Germany), wherethey have also attended an (existing) intermediate school and completed their internship.
30 Microeconometric Analyses on Determinants of Individual Labour Market Outcomes

2 Skills, Signals, and Employability
this question, the resumes include candidates who have completed an internship inthe respective field (technical or commercial). To further increase realism, we ensurethat HR managers receive female applicants only if the share of female employees intheir industry is at least 20 percent.25
The resumes include the following specific signals of the three broad domains of skillsthat we focus on in this study.26 Cognitive skills of secondary-school graduates aresignalled by their final GPA in school, extended IT skills, English proficiency, and pro-ficiency in French or Spanish as a second language.27 Social skills are signalled bysocial volunteering (neighbourhood help such as youth work, elderly group, and of-fering German language courses)28 and by reporting team sports (as opposed to sin-gle sports). Maturity is signalled by an age di�erence of at most four months, with theolder candidate being born in the calendar year before the younger candidate (but,given the year of school graduation, from the same regular school birth cohort), andby having conducted a long internship (four weeks as opposed to two weeks).29
As HR managers have to select exactly one of the two candidates, we design resumessuch that one resume does not dominate the other resume within a CV pair to avoidobvious choices. To this end, we introduce a negative correlation between the school
25 The share of female employees per industry is computed using the statistics of the German Statistical O�icefrom 2015. We distinguish between 62 industries based on the two-digit German Classification of EconomicActivity, Version 2003.26 The assignment of the specific signals to one of the three skill domains serves to consolidate the presentation.We do not argue that each skill signal can be exclusively mapped to one domain. Instead, we categorize eachskill signal according to the skill domain it most likely reflects, given all other signals. For example, GPAs likelyreflect both cognitive components such as ability and non-cognitive components such as perseverance, butarguably most people would consider GPAs primarily as signals of cognitive skills. An alternative would havebeen to include information that more clearly reflects only one skill domain, such as Raven scores as reflectingonly cognitive skills – but this information would never be reported on a CV. Similarly, engaging in volunteeractivities or in team rather than single sports may reflect traits beyond sociability such as initiative or specificaspects of fitness. Facing these trade-o�s between conceptual sharpness and creating a realistic choice problemamong actually used signals, we opt for the latter and only include important CV elements that are typicallyincluded in real applications in Germany, as elicited in our pre-study. While this comes at the cost of havingto use a slightly ad-hoc categorization of skill domains, we believe that the proposed categorization is overallvery reasonable. At the minimum, it allows for a more structured presentation of the results for the specific skillsignals on a typical CV that should be of interest per se.27 Grades in Germany range from 1 (very good) to 6 (failed). For the empirical analysis, we recode all grades(GPAs) such that higher values mean better grades.28 These social volunteering activities meet the definition of social engagement used in Heinz and Schumacher(2017). They have been shown to be related to the actual willingness of individuals to cooperate as well as to HRmanagers’ beliefs about the willingness of workers to cooperate.29 While these are short periods, it is uncommon for a 16- or 17-year-old secondary-school graduate to havemore labour-market experience. Importantly, a two-week internship may signal a compulsory internship duringthe school year, whereas a four-week internship tends to signal a voluntary labour-market experience obtainedduring vacations.
Microeconometric Analyses on Determinants of Individual Labour Market Outcomes 31

2 Skills, Signals, and Employability
GPA (likely an important skill signal) and the other skill signals in the CV. This meansthat the CV with the better GPA gets worse other skill signals, such as lower languageand IT skills (see Appendix A2.1).
Finally, as the e�ects of innate characteristics have already been studied extensively inthe literature, we intentionally keep these characteristics fixed within the choice setsin our experimental design. That is, we keep gender fixed within CV pairs and use onlyfictitious candidates with German nationality and standard German-sounding names(see Appendix A2.1.
College Graduates
The set-up of resumes of college graduates is similar to those of secondary-schoolgraduates, with only few obvious di�erences. Appendix A2.2 describes the elementsof the resumes of college graduates in detail. Table A2.2 lists all values of all CV ele-ments and Figure 2.2 presents a sample resume for college graduates.
All fictitious college graduates completed upper-track high school (Gymnasium) a�er12 years of schooling and obtained a four-year Bachelor’s degree in business admin-istration at a public German university. We chose business administration since thisis by far the most common college major in Germany, with 15 percent of universitystudents being enrolled in business administration during the academic year 2015/16(Statistisches Bundesamt, 2016). Because business administration is so pervasive,most firms likely hire college graduates with this major. This choice seems particu-larly appropriate for our context as we do not send applications to actual job adver-tisements. Instead, we ask HR managers to choose the better applicant for a hypothet-ical universal trainee position in their firm with a college graduate who has a businessadministration degree. We use five top-ranked universities and five lower-ranked uni-versities to investigate whether the impact of college GPA varies with college quality(the category, e.g., top-ranked university, is held constant within a CV pair; see Ap-pendix A2.2).
For college graduates, cognitive skills are signalled by their college GPA, the most re-cent productivity signal obtained just before entering the labour market. Further sig-nals of cognitive skills again include extended IT skills, English proficiency (measuredas 0 = basic, 1 = very good, and 2 = fluent), and proficiency in French or Spanish as a sec-ond language. Social skills are signalled by volunteering activities that involve inten-sive interactions with other people (neighbourhood help or mobile care services) asopposed to volunteering activities that involve only limited social interactions (preser-vation of monuments or online IT work and translations for the United Nations). Again,
32 Microeconometric Analyses on Determinants of Individual Labour Market Outcomes

2 Skills, Signals, and Employability
social skills are also signalled by engaging in team sports as opposed to single sports.As for secondary-school graduates, maturity is signalled by an age di�erence of atmost four months within a school cohort, with the older candidate being born in thecalendar year before the younger candidate (but, given the year of high-school grad-uation, from the same regular school birth cohort). Maturity is additionally signalledby having completed a long internship (three or five months as opposed to only onemonth). In the context of college graduates, we interpret high-school GPA as anothersignal of maturity as, conditional on college GPA, it is more likely to be perceived as asignal of e�ort during adolescence rather than a signal for cognitive skills.
In contrast to secondary-school graduates who apply for an apprenticeship positionin their region, college graduates are geographically more mobile. While the fictitiouscollege graduates attended a high school in their city of birth (using schools that ac-tually exist), they are completely mobile with respect to both the college location andthe location of the HR manager’s firm.
Each element on the resume is randomized independently of all other CV elements,except for one restriction on GPAs: while the first three GPAs within a CV pair (thereare two high-school GPAs and two college GPAs) are randomized independently ofeach other, the fourth GPA, randomized last, is restricted such that no resume containsboth a better high-school GPA and a better college GPA. We impose this restrictionsince HR managers may select the resume that dominates the other resume with twobetter GPAs. Finally, as for the resumes of the secondary-school graduates, we keepgender constant within CV pairs and use only candidates with German nationality andGerman-sounding names.
2.3.3 Descriptive Statistics
We sent the online survey to HR managers in 1,496 firms (one HR manager per firm), ofwhom 579 HR managers participated. 307 respondents participated in the secondary-school graduate sample and 272 in the college-graduate sample. Given that each HRmanager was exposed to two pairs of resumes, we have a total of 1,158 decisions and2,316 resumes. Table 2.1 provides summary statistics of the resume characteristics forthe secondary- school-graduate sample and Table 2.2 for the college-graduate sam-ple. By construction, the mean of our outcome variable – the job interview invitation– is 0.5. The average school GPA (GPAs are recoded as “4 minus actual grade” suchthat higher values mean better grades) is 1.46 for secondary-school graduates and1.67 for college graduates; average college GPA is 1.67. There are slightly more maleapplicants in the secondary-school graduate sample (56.8 percent), which is due to
Microeconometric Analyses on Determinants of Individual Labour Market Outcomes 33

2 Skills, Signals, and Employability
the fact that female applicants are only presented to HR managers in industries withmore than 20 percent of female employees.30
The distribution of firms in the ifo Personnel Manager Survey is representative forfirms in Germany. As shown in Table A2.3 in the appendix, HR managers (and theirfirms) who participate in our study do not di�er significantly from non-respondentsof the ifo Personnel Manager Survey database in terms of location, industry, numberof employees, and share of females in the industry.
2.3.4 Empirical Model
The randomization of the di�erent skill signals provides us with identification of theircausal e�ects on being invited for a job interview. We estimate the e�ects in a first-di�erenced model, treating a resume pair as the unit of observation. Accordingly,the dependent variable equals 1 if the resume on the le�-hand side was selected andequals -1 if the resume on the right-hand side was selected. Similarly, all explanatoryvariables are constructed as first di�erences, i.e., the characteristic of the le�-handside resume minus the characteristic of the right-hand side resume. We hence esti-mate the following OLS specification:
∆yij = β0 + β′1∆Sij + εij, (2.1)
where ∆yij is the outcome for CV pair i (i = 1,2) of HR manager j. ∆Sij is a vector of CV-pair-specific di�erences in skill signals, and εij is an error term. In some specifications,we additionally include industry fixed e�ects and even HR manager fixed e�ects, thusexploiting only variation in the choices within HR managers across the two CV pairs.Our parameters of interest that capture the impact of the skill signals are given by thevector β1. Throughout, we cluster standard errors at the level of the HR manager.
Note that the magnitudes of the estimated e�ects of the skill signals do not havea straightforward interpretation in our setting because HR managers are forced tochoose exactly one of the two applicants in each CV pair. This likely overemphasisesthe importance of the skill signals since HR managers might choose both applicantsor none when facing real applications, at least in the first stage of the application pro-cess. Therefore, we prefer to interpret relative e�ect sizes, comparing the importanceof two di�erent skill signals.
30 In contrast, the lower share of male applicants in the college-graduate sample arises due to chance in therandomization procedure.
34 Microeconometric Analyses on Determinants of Individual Labour Market Outcomes

2 Skills, Signals, and Employability
To investigate heterogeneities in the e�ects of skill signals by HR managers’ character-istics, we estimate models with interaction terms between the two:
∆yij = β0 + β′1∆Sij + β′2Cj∆Sij + εij, (2.2)
whereCj is a characteristic of HR manager j. In particular, we explore two dimensionsof potential heterogeneity in the valuation of skill signals by HR managers. First, westudy whether skill signal e�ects vary with HR managers’ characteristics such as theirage, gender, position and responsibility in the firm, and the size of their firm. Second,we test the consistency between HR managers’ observed choices and the preferencesthat they express for a particular skill signal in the subsequent questionnaire.
2.4 The Impact of Skill Signals on Job-Interview Invitations
We start by presenting the baseline results of the impact of signals of cognitive skills,social skills, and maturity on job-interview invitations for secondary-school graduatesand college graduates. In the next section, we turn to e�ect heterogeneities for di�er-ent HR managers.
2.4.1 Baseline Results for Secondary-School Graduates
Table 2.3 reports the baseline results of the choice experiment in the secondary-school graduate sample. The baseline specification indicates significant e�ects ofskill signals in each of the three domains – cognitive skills, social skills, and matu-rity (column 1). Results hardly change when industry fixed e�ects are added to thefirst-di�erenced model (column 2). Signals of cognitive skills strongly a�ect the invi-tation decision. In the given setting, an improvement in school GPA by one grade levelincreases the probability of being invited for a job interview, ceteris paribus, by 22 per-centage points. The point estimates do not di�er significantly between female andmale applicants (columns 3 and 4), although the coe�icient is slightly smaller and lessprecisely estimated in the female sample. We tested for non-linearity in the e�ects ofschool GPA by adding two interaction terms: school GPA interacted with an indicatorfor whether both school GPAs in the CV pair are equal to or better than 2.3 (a goodGPA) and school GPA interacted with an indicator for whether both school GPAs in theCV pair are equal to or worse than 2.7 (a mediocre GPA). The coe�icients on both inter-
Microeconometric Analyses on Determinants of Individual Labour Market Outcomes 35

2 Skills, Signals, and Employability
action terms are insignificant (not shown), indicating that the impact of school GPA israther linear.31
Extended IT skills also improve the odds of being invited to a job interview. This e�ectis more pronounced for female applicants, which might reflect implicit gender stereo-types among HR managers that males in general have reasonable IT skills (similar tomaths skills, e.g. Lummis and Stevenson (1990)), so that returns to these skills arehigher for females. Thus, HR managers may subconsciously not place a high value onIT skills signalled by males, but may reward female applicants with this signal becauseit is less expected among this group.
Foreign language skills, another dimension of cognitive skills, seem to be less impor-tant in case of apprenticeship applications. The e�ect of being fluent (as opposed tobasic) in English is marginally significant, whereas having a second foreign language(either French or Spanish) does not have a significant e�ect.
Signalling social skills by social volunteering has a considerable impact in the hir-ing process. Specifically, applicants who report doing neighbourhood help such asyouth work, elderly group, and o�ering German language courses have a 37 percent-age points higher probability of being invited for a job interview than identical appli-cants who have not volunteered in our setting. The e�ect size is almost equivalentto improving school GPA by two grade levels and it is similar for females and males.This indicates strong importance of signalling social skills and commitment for youngapplicants who enter the labour market directly out of school.
A potential second signal of social skills is whether an applicant participates in teamsports such as football (soccer) and basketball as opposed to single sports such asswimming and cycling. This signal, however, does not a�ect interview invitationsamong applicants for apprenticeship positions. This may reflect that the social skillcomponent here is dominated by social volunteering and that 17-year-olds commonlyplay team sports, which may not make it a very good predictor for actual social skillsat this age.
Concerning maturity, HR managers significantly prefer older applicants for appren-ticeship positions. While all fictitious applicants are 17 years old and born within thesame regular birth cohort (given the school graduation year), applicants born in theearlier calendar year are more likely to get chosen. This e�ect is entirely driven bymale applicants, the only significant gender di�erence in the skill-signal e�ects for
31 Similarly, we do not find evidence of non-linearity in the form of an additional e�ect of having a grade thatstarts with 1 (indicating top grades in Germany) when added to the linear grade e�ect (not shown).
36 Microeconometric Analyses on Determinants of Individual Labour Market Outcomes

2 Skills, Signals, and Employability
apprenticeship positions. Boys may generally be perceived as more immature thangirls during adolescence (another form of gender stereotype), so that being slightlyolder is a relevant signal of maturity for boys. By contrast, we do not find a significante�ect of having completed a longer internship – four weeks rather than two weeks –in the secondary-school graduate sample.
As each HR manager receives two pairs of resumes and thus makes two choices, wecan additionally restrict the analysis to exploit only variation in decisions within HRmanagers. With HR manager fixed e�ects taking out most of the variation, estimatesbecome considerably more imprecise (with standard errors tending to double) andonly the e�ect of social volunteering retains statistical significance at conventional lev-els (column 5). However, point estimates remain very similar to the baseline model.
2.4.2 Baseline Results for College Graduates
Table 2.4 presents baseline results of the choice experiment in the college graduatesample. Again, we find significant e�ects of skill signals in each of the three skill do-mains. However, the specific signals that a�ect job-interview invitations for collegegraduates partly di�er from the specific signals relevant for secondary-school gradu-ates.32
Results show that college grades, one signal of cognitive skills, are an important de-terminant in the first stage of the hiring decision of HR managers. A better collegeGPA significantly increases the probability of being invited to a job interview for bothfemales and males. In the given setting, a better college GPA by one grade level in-creases the likelihood of a job-interview invitation by 38 percentage points. Again, wedo not find evidence of non-linearity in the GPA e�ects among college graduates (notshown).
Results for other cognitive-skill signals are mixed. Extended IT skills and English pro-ficiency do not a�ect the interview decision in the college graduate sample. One pos-sible explanation is that firms expect that German college graduates have reasonablydecent IT skills and English proficiency anyway By contrast, high proficiency in a sec-ond foreign language (French or Spanish), which is less common, does improve theprobability of an interview invitation. This e�ect is entirely driven by female collegegraduates, whereas no such e�ect is observed for males, possibly reflecting the types
32 We replicated all results from Tables 2.3 and 2.4 by weighting HR managers with the (log) firm size to accountfor the relative over-representation of small firms in the German economy. These results are very similar to theunweighted results (not shown).
Microeconometric Analyses on Determinants of Individual Labour Market Outcomes 37

2 Skills, Signals, and Employability
of occupations or tasks that HR managers expect females to perform. The e�ect is verysimilar for whether the second foreign language is French or Spanish (not shown).
Signals of social skills also matter for the employability of college graduates, althoughto a substantially lesser extent than the signals of cognitive skills. Among females, vol-unteering work that is characterized by intensive social interactions (such as neigh-bourhood help or mobile care services) is an advantage over volunteering work thatinvolves less social interactions (such as monument preservation or online o�ice workfor the UN). No such e�ect is found for males. Note that the treatment here is di�er-ent from the secondary-school graduate sample, where applicants do or do not reportvolunteering work; by contrast, all college graduates report some sort of volunteering,only that its intensity of social interactions di�ers.
Interestingly, participation in team sports such as football and basketball, as opposedto single sports such as swimming and cycling, increases the probability of a job inter-view in the college graduate sample. This contrasts with the lack of an e�ect in thesecondary-school sample. Potentially, at the age of 17, the type of sport that an ap-plicant does may be conceived as being primarily determined by family and friendsrather than being a personal choice, so that it is a poor signal of applicants’ socialskills. By contrast, at the age of 24 in the college graduate sample, the type of sportsthat a person decides to (continue to) participate in may be more likely perceived asa personal choice and thus a better signal of social skills. In addition, HR managersmay be wary of strategic behaviour among applicants who have reached the stage offinishing college. This could account for the fact that reporting social volunteeringwork has a much smaller e�ect in the college sample than in the secondary-schoolsample (besides reflecting a somewhat weaker variation in the signal), whereas it isthe other way around for team sports. Knowing that firms value social volunteeringBaert and Vujić (2018), even persons with limited social skills may do some voluntarysocial work only to have the signal. With limited credibility of volunteering as a signalof actual social skills, HR managers may revert to the type of sports as an alternativesignal that is less obvious and may thus be less subject to strategic manipulation.
Signals of maturity also seem to play some role in the hiring of college graduates,but again to a lesser extent than cognitive skills. In particular, a longer internship –three or five months as opposed to one month – increases the probability of beinginvited to a job interview.33 In contrast to secondary-school graduates, we do notfind an advantage for applicants who are older within their school cohort, presum-ably because small age di�erences are less relevant for applicants aged 24 than for33 There are two separate treatments, either three months of internship or five months of internship. We do notfind a significant di�erence between the two treatment e�ects, so we combine them into one indicator.
38 Microeconometric Analyses on Determinants of Individual Labour Market Outcomes

2 Skills, Signals, and Employability
applicants during their adolescence (aged 17 in the secondary-school graduate sam-ple). For male college graduate applicants, we find a significant e�ect of a better high-school GPA. Holding constant college GPA, we interpret this as a signal that the appli-cant focused on school work already during adolescence.34 No such e�ect is found forfemale college graduate applicants. This may reflect the same gender stereotype asin the secondary-school graduate sample: boys are perceived as more immature thangirls during adolescence, and therefore have higher returns to signals of maturity.
While less precisely estimated, the order of magnitude of the point estimates and thepattern of results are again confirmed in the specification with HR manager fixed ef-fects (column 5). In the college-graduate sample, the e�ects of college GPA, teamsports, and internship duration retain statistical significance at conventional levelseven though standard errors with HR manager fixed e�ects roughly double.
Although the set-up of our experiment was not designed for deeper investigation ofthe importance of complementarities among di�erent skills or di�erent packages ofskills, we also experimented with adding interaction terms between di�erent skill sig-nals to our baseline model (not shown). There are virtually no significant interactione�ects among the di�erent randomized skill signals, possibly due to limited statisti-cal power in these models. In particular, we do not find significant interactions be-tween GPAs and social skills. Similarly, there is no consistent pattern of e�ect hetero-geneities by the four high-school types used on the college graduate resumes or bywhether the college is top-ranked or not.
In sum, signals in all three domains – cognitive skills, social skills, and maturity –have a causal impact on the decisions of HR managers whom to invite for a job in-terview among both secondary-school and college graduates. In general, cognitiveskills as signalled by school GPA for secondary-school graduates and college GPA forcollege graduates play a consistently important role. Among college graduates, cog-nitive skills tend to be relatively more relevant than social skills, whereas social skillsseem to be more relevant for young school graduates applying for an apprenticeship.Signals of maturity also tend to be more important for young job applicants in theiradolescence, with e�ects being restricted to boys. In contrast, IT skills tend to be moreimportant for female secondary-school graduates, possibly because of common gen-der stereotypes that boys have an a�inity to computers. Overall, the observed e�ectheterogeneities across entry ages and genders appear consistent with di�erences inthe relevance, expectedness, and credibility of specific signals in di�erent settings.
34 Additionally controlling for whether the GPA has improved from school to college does not change the coe�i-cient on high-school GPA and slightly increases the coe�icient on college GPA (not shown).
Microeconometric Analyses on Determinants of Individual Labour Market Outcomes 39

2 Skills, Signals, and Employability
2.5 Heterogeneous E�ects for Di�erent HRManagers
In this section, we turn to e�ect heterogeneities with respect to HR manager charac-teristics. Furthermore, we investigate whether decisions in the choice experiment areconsistent with HR managers’ answers to survey questions regarding the importanceof various skill signals of applicants in their firm.
2.5.1 Heterogeneity by HR Manager Characteristics
In contrast to most existing CV studies, we have information about the characteristicsof the HR managers who make the decisions in our setting. A�er the choice experi-ments, we provided the HR managers with a short survey questionnaire that includedquestions on their personal characteristics and on the importance they assign to dif-ferent skill signals in actual applications to their firm (see Appendix A2.3). The infor-mation on HR managers’ personal characteristics includes age, gender, educationalattainment, whether they are responsible for hiring decisions in their firm, whetherthey are the managing director of the firm (more likely in smaller firms), and how manyjob interviews they have conducted during the past 12 months. This information al-lows us to investigate whether the e�ects of the di�erent skill signals di�er acrossdi�erent types of HR managers.
Table 2.5 provides summary statistics of the characteristics of HR managers and firms,separately for the secondary-school graduate and college graduate samples. In bothsamples, HR managers are on average 50 years old, and about two thirds are male.HR managers in the secondary-school graduate sample are more likely to be manag-ing directors of their firms, presumably because apprenticeship-o�ering firms tend tobe smaller than those in the college sample. Most HR managers (87-88 percent) areresponsible for the actual final hiring decisions in their firm. HR managers are rathersimilarly divided between the three types of professional degrees – vocational educa-tion, university of applied sciences, and university – in the two samples. Firms in thesecondary-school graduate sample, all of which employ apprentices, are more likelyto be in the manufacturing sector, whereas firms in the college graduate sample aremore likely to be in the real estate sector. Furthermore, firms in the secondary-schoolgraduate sample are more likely to be in industries where the share of women is be-low 20 percent. This is likely due to the fact that many apprenticeship positions aretechnical jobs.
Tables 2.6 and 2.7 report estimated coe�icients on interaction terms between the var-ious skill signals (indicated in the first column) and selected characteristics of the HRmanagers and firms (indicated in the column headers) for the secondary-school grad-
40 Microeconometric Analyses on Determinants of Individual Labour Market Outcomes

2 Skills, Signals, and Employability
uate and the college graduate sample, respectively. Each cell stems from a separateregression.
For apprenticeship positions, we find substantial e�ect heterogeneity with respect toHR manager characteristics (Table 2.6). Older HR managers (split at median age 51)put less weight on school grades and more weight on IT skills. Older managers alsoappreciate social volunteering more, but consider team sports to be less important forthe decision whom to invite for a job interview. These di�erences between young andold HR managers might indicate that older HR managers have gained the experiencethat school grades predict the workplace performance of apprentices less well thansignals of specific abilities such as IT skills. Similarly, experienced HR managers mighthave experienced that social volunteering is indeed a good signal for social skills thatare important on the labour market. Interestingly, the focus of HR managers who arealso the managing directors of their firm goes in the same direction as that of olderHR managers, partly reflecting that the majority of managing directors (59.5 percent)are also in the subgroup of older HR managers. Furthermore, managing directors, aswell as HR managers who are responsible for hiring decisions in their firm, place moreweight on work experience through long internships.
We also find substantial and intuitive di�erences between apprenticeship positionsin the technical sector and in the commercial area. Concerning signals of cognitiveskills, the priorities of HR managers in the technical sector are more strongly focusedon school GPA and less on specific skills in IT and second foreign languages, whichmight be particularly relevant for apprenticeship positions in the commercial area.Similarly, social volunteering is more important in the commercial area, likely reflect-ing higher relevance of social skills in commercial jobs than in technical jobs. Longerinternship duration is also more important for HR managers in the commercial areathan in the technical sector. By contrast, e�ects of the di�erent skill signals in thesecondary-school graduate sample hardly di�er between female and male HR man-ager, and they do not vary significantly with firm size.
Overall, there is less e�ect heterogeneity with respect to HR manager characteristicsin the college graduate sample (Table 2.7). Interestingly, HR managers in larger firmsplace more weight on college GPA, possibly reflecting a more standardized and au-tomated screening process in larger firms with a particular focus on formal signalsor with applicants having to pass a specific GPA threshold. Easy verifiability of sig-nals may thus be particularly important for large firms in the first hiring stage. OlderHR managers, males, and those with hiring responsibility place more weight on pro-ficiency in a second foreign language. Internship duration seems less important formanaging directors and HR managers with hiring responsibility. HR managers who ob-
Microeconometric Analyses on Determinants of Individual Labour Market Outcomes 41

2 Skills, Signals, and Employability
tained an apprenticeship degree care less about high-school GPA than HR managerswith a college degree; HR managers with a technical college degree put less weight oncollege GPA and more weight on social skills.
2.5.2 Consistency with Stated Priorities in Survey Questions
At the end of the questionnaire, HR managers also indicate their priorities for vari-ous skill signals of actual applicants applying for jobs in their firm. Table 2.8 showsthat 67 percent of HR managers in the secondary-school graduate sample report thatschool GPAs are either “rather important” or “very important” (as opposed to “ratherunimportant” or “very unimportant”). An even larger share of HR managers statesthat school grades in specific main subjects are important: 89 percent in maths and81 percent in German. IT skills are considered important by 86 percent of HR man-agers, language skills by 66 percent, and professional experience through internshipsby 74 percent. In the college graduate sample, 47 percent of HR managers view high-school GPA as important and 81 percent college GPA, the more recently acquired skillsignal. The shares of HR managers who view IT skills (96 percent), language skills (83percent), and professional experience through internships (94 percent) as importantare all higher in the college graduate sample than in the secondary-school graduatesample. The only dimension without a significant di�erence between the two sam-ples is hobbies (47 to 48 percent).
The priorities reported by HR managers in the questionnaire allow us to investigatewhether answers to survey questions are consistent with choices between the ficti-tious applicants in the choice experiment. This yields insights into whether HR man-agers’ answers in survey questionnaires are in line with their decisions when compar-ing entire resumes of applicants. To investigate this question, we add to our base-line model an interaction term between a skill signal in our fictitious resumes and thedegree of importance that the HR manager assigns to that specific skill signal in thequestionnaire (using the original four-point scale). We estimate models with interac-tion terms separately for each skill signal that is included both in the questionnaireand in the fictitious resumes.
For HR managers in the secondary-school graduate sample, all interaction terms arepositive and statistically significant (Table 2.9). This implies that HR managers whoreport in the questionnaire that a certain skill signal is important do indeed put moreweight on that signal when choosing between resumes. This is the case for school GPA,IT skills, language proficiency (English and second foreign language), and internshipduration.
42 Microeconometric Analyses on Determinants of Individual Labour Market Outcomes

2 Skills, Signals, and Employability
Similar positive interactions are found for HR managers in the college graduate sam-ple, with the interactions with college GPA, IT skills, and English language proficiencyreaching statistical significance at conventional levels (Table 2.10). The results againindicate that choices are consistent with self-reported priorities in the questionnaire.Interestingly, statistical significance is reached for the three signals of cognitive skills,which is the most important domain of signals among college graduates, whereas thesignals of maturity (high-school GPA and internship duration), which are in generalless important for decisions among college graduates, do not capture statistical sig-nificance.
2.6 Conclusion
We conduct a randomized CV study among HR managers to investigate how acquiredsignals of a broad range of cognitive skills, social skills, and maturity are valued byemployers. We find evidence that signals in each of the three domains increase theprobability of being invited for a job interview. Given our experimental design, theseare separate and independent e�ects of signals in the di�erent skill domains, with lit-tle evidence of strong complementarities between the domains. The results indicateat least three conclusions on how labour markets function. First, skills in all three do-mains matter on the labour market. Second, applicants can e�ectively signal theseskills to employers before career start with information contained on their CVs. Third,associations of labour-market outcomes with skill indicators such as school or col-lege grades in observational data do in fact have a causal interpretation in the sensethat employers observe and react to them during the application stage. Furthermore,the importance of the specific signals di�ers depending on the respective relevance,stereotypical expectedness, and credibility of the signal in di�erent contexts. Impor-tant e�ect heterogeneities exist between secondary-school graduates applying for anapprentice position and college graduates. While signals of cognitive skills (particu-larly college GPA) seem to be more important than signals of social skills and maturityamong college graduates, this is not true for secondary-school graduates. School GPAof secondary-school graduates and college GPA of college graduates – signals of cogni-tive skills – are important for both genders, but other signals matter more for one gen-der than the other: IT and second language skills – and, to a lesser extent, social skills– are particularly relevant for females, whereas signals of maturity are particularlyrelevant for males. These di�erences might reflect gender stereotypes in relevance(with stronger e�ects for the gender which is expected to perform the respective tasks)and in expectedness (with stronger e�ects for the gender for which the skill is less ex-pected). Social volunteering is a strong signal of social skills among secondary-school
Microeconometric Analyses on Determinants of Individual Labour Market Outcomes 43

2 Skills, Signals, and Employability
graduates. Among college graduates, however, social skills are more e�ectively sig-nalled by engaging in team sports, consistent with reduced credibility of social volun-teering as a signal of actual social skills due to potential strategic behaviour at olderages.
We also find di�erences in the impact of skill signals across di�erent groups of HRmanagers. For secondary-school graduates, older HR managers and managing direc-tors put less weight on school GPA and more weight on IT skills, social volunteering,and internship duration. Among college graduates, HR managers in larger firms placemore weight on college GPA than those in smaller firms, which might reflect morestandardized procedures of hiring applicants in larger firms that attach more impor-tance to easily verifiable skill signals. Using a questionnaire that asks HR managersto indicate their priorities of skill signals of actual applicants applying for jobs in theirfirm, we find that the decisions in the choice experiments are consistent with HR man-agers’ self-reported hiring priorities. Together, the e�ect heterogeneities by entry age,gender, and HR managers reveal important aspects about how signals of skills are pro-cessed and utilized in the labour market.
44 Microeconometric Analyses on Determinants of Individual Labour Market Outcomes

2 Skills, Signals, and Employability
Figures and Tables
Figure 2.1 : Example CV of a Secondary-School Graduate
Lebenslauf
Name: Daniel Fischer
Nationalität: Deutsch
Geburtsdatum: 15.11.1998
Geburtsort: Dresden
Schulische Ausbildung
2008 - 2015 32. Oberschule "Sieben Schwaben", Dresden
2015 Realschulabschluss
Durchschnitt: 3,3
Berufliche Erfahrung
Juli 2014 Praktikum bei Sparkasse in Dresden
4 Wochen
Sprachen
Englisch (fließend)
Spanisch (Grundkenntnisse)
EDV Kenntnisse
Microsoft Office
HTML + Dreamweaver
Interessen und soziales Engagement
Schwimmen
Radfahren
Nachbarschaftshilfe: Jugendarbeit, Seniorengruppe, Durchführung von
Deutschkursen
Microeconometric Analyses on Determinants of Individual Labour Market Outcomes 45

2 Skills, Signals, and Employability
Figure 2.2 : Example CV of a College Graduate
Lebenslauf
Name: Sarah Becker
Nationalität: Deutsch
Geburtsdatum: 15.11.1991
Geburtsort: Mainz
Schulische Ausbildung
2003 - 2011 Integrierte Gesamtschule Mainz-Bretzenheim
2011 Abitur, Durchschnitt: 3,3
Studium
2011 - 2015 Betriebswirtschaftslehre
Universität Siegen
2015 Abschluss: Bachelor of Science in Betriebswirtschaftslehre
Gesamtnote: 3,0
Berufliche Erfahrung
2014 Praktikum im Bereich Sales
MVI Proplant, Wolfsburg
3 Monate
Sprachen
Englisch (fließend)
Französisch (gute Kenntnisse)
EDV Kenntnisse
Microsoft Office (fortgeschritten)
HTML und Adobe Dreamweaver
Interessen und soziales Engagement
Handball
Volleyball
Nachbarschaftshilfe: Jugendarbeit, Seniorengruppe, Durchführung von
Deutschkursen
46 Microeconometric Analyses on Determinants of Individual Labour Market Outcomes

2 Skills, Signals, and Employability
Table 2.1 : Summary Statistics: Secondary-School Graduate CVs
Mean Std. Dev.Job interview invitation 0.500Cognitive Skills
School GPA 1.460 0.628Extended IT skills 0.491Fluent English 0.516French as 2nd language 0.237Spanish as 2nd language 0.265
Social SkillsSocial volunteering 0.458Team sports 0.500
MaturityAge within school cohort 0.416Long internship 0.514
Non-varying CharacteristicsMale 0.568Technical internship 0.477
StateBaden-Wuerttemberg 0.160Bavaria 0.254Berlin 0.003Brandenburg 0.023Bremen 0.007Hamburg 0.020Hesse 0.072Lower Saxony 0.088Mecklenburg-Vorpommern 0.013North Rhine-Westphalia 0.178Rhineland-Palatinate 0.024Saarland 0.007Saxony 0.088Saxony-Anhalt 0.010Schleswig-Holstein 0.020Thuringia 0.036
N (CVs) 1228Note: Means of CV elements of secondary-school graduates. All variablesexcept school GPA are binary.
Microeconometric Analyses on Determinants of Individual Labour Market Outcomes 47

2 Skills, Signals, and Employability
Table 2.2 : Summary Statistics: College Graduate CVs
Mean Std. Dev.Job interview invitation 0.500Cognitive Skills
College GPA 1.665 0.683Extended IT skills 0.500Very good English 0.367Fluent English 0.318French as 2nd language 0.267Spanish as 2nd language 0.245
Social SkillsSocial volunteering 0.500Team sports 0.500
MaturityHigh-school GPA 1.677 0.674Age within school cohort 0.3803-months internship 0.2755-months internship 0.330
Non-varying CharacteristicsMale 0.441Catholic school 0.360Comprehensive secondary 0.353Top-ranked university 0.553Internship in sales 0.232Internship in controlling 0.395
CollegeUniversity of Munich 0.106RWTH Aachen 0.092University of Frankfurt 0.110University of Cologne 0.132University Leuphana Lueneburg 0.084University of Mannheim 0.113University of Siegen 0.098University of Trier 0.107University of Bremen 0.084
High-school StateBaden-Wuerttemberg 0.066Bavaria 0.202Hesse 0.132Lower Saxony 0.153North Rhine-Westphalia 0.172Rhineland-Palatinate 0.128Thuringia 0.147
N (CVs) 1088Note: Means of CV elements of college graduates. All variables except GPAsare binary.
48 Microeconometric Analyses on Determinants of Individual Labour Market Outcomes

2 Skills, Signals, and Employability
Table 2.3 : Skill Signals and Job-Interview Invitation: Baseline Results for Secondary-School Graduates
(1) (2) (3) (4) (5)All All Female Male All
Cognitive SkillsSchool GPA .22*** .21*** .18 0.24** 0.22
(0.08) (0.08) (0.14) (0.10) (0.16)Extended IT skills 0.17*** 0.16*** 0.22** 0.14 0.20
(0.06) (0.06) (0.09) (0.09) (0.13)Fluent English 0.12* 0.12* 0.14 0.09 0.01
(0.06) (0.07) (0.10) (0.09) (0.13)2nd foreign language 0.04 0.05 –0.05 0.10 –0.02
(0.06) (0.06) (0.10) (0.08) (0.14)Social Skills
Social volunteering 0.37*** 0.36*** 0.38*** 0.36*** 0.50***(0.07) (0.07) (0.10) (0.08) (0.14)
Team sports 0.01 0.02 0.03 –0.01 0.09(0.04) (0.04) (0.06) (0.05) (0.08)
MaturityAge within school cohort 0.13*** 0.14*** –0.00 0.24*** 0.16
(0.05) (0.05) (0.08) (0.07) (0.10)Long internship 0.04 0.04 0.03 0.05 0.09
(0.06) (0.06) (0.09) (0.09) (0.13)Industry FE No Yes Yes YesHR manager FE No No No No YesR2 0.119 0.125 0.175 0.130 0.493N (CV pairs) 614 614 264 350 614Note: First-di�erenced model with CV pair as unit of observation. Dependent variable:invitation for job interview. Standard errors clustered at HR-manager level in parentheses.Significance level: * p<0.10, ** p<0.05, *** p<0.01.
Microeconometric Analyses on Determinants of Individual Labour Market Outcomes 49

2 Skills, Signals, and Employability
Table 2.4 : Skill Signals and Job-Interview Invitation: Baseline Results for College Graduates
(1) (2) (3) (4) (5)All All Female Male All
Cognitive SkillsCollege GPA 0.38*** 0.39*** 0.33*** 0.44*** 0.28**
(0.07) (0.07) (0.11) (0.09) (0.14)Extended IT skills –0.03 –0.02 0.02 –0.00 –0.02
(0.06) (0.06) (0.08) (0.09) (0.13)English level –0.03 –0.03 –0.07 –0.01 –0.05
(0.04) (0.04) (0.05) (0.06) (0.07)2nd foreign language 0.11* 0.12** 0.25*** –0.04 0.05
(0.06) (0.06) (0.08) (0.08) (0.12)Social Skills
Social volunteering 0.07 0.06 0.10* –0.00 –0.00(0.05) (0.05) (0.06) (0.07) (0.10)
Team sports 0.10** 0.10** 0.11* 0.06 0.16*(0.04) (0.04) (0.06) (0.07) (0.09)
MaturityHigh-school GPA 0.05 0.06 –0.02 0.14* –0.03
(0.05) (0.05) (0.07) (0.08) (0.11)Age within school cohort 0.00 0.01 0.12 –0.08 0.03
(0.06) (0.06) (0.08) (0.08) (0.13)Long internship 0.12*** 0.13*** 0.13*** 0.17*** 0.15**
(0.03) (0.03) (0.05) (0.05) (0.06)Industry FE No Yes Yes YesHR manager FE No No No No YesR2 0.139 0.150 0.188 0.182 0.564N (CV pairs) 544 544 304 240 544Note: First-di�erenced model with CV pair as unit of observation. Dependent variable:invitation for job interview. Long internship refers to internship of three or five months(instead of only one month). Standard errors clustered at HR-manager level in parentheses.Significance level: * p<0.10, ** p<0.05, *** p<0.01.
50 Microeconometric Analyses on Determinants of Individual Labour Market Outcomes

2 Skills, Signals, and Employability
Table 2.5 : Summary Statistics: HR Manager and Firm Characteristics
Secondary-schoolgraduates
College graduates
Mean Std. Dev. Mean Std. Dev.HR Manager CharacteristicsAge 49.944 10.0 49.664 9.8Male 0.658 0.651Managing director 0.437 0.288Hiring responsibility 0.875 0.871Professional education level
Vocational education degree 0.309 0.217University of applied sciences degree 0.250 0.258University degree 0.411 0.472None/Other 0.026 0.051
Firm CharacteristicsNumber of employees 331 1286.7 442 1817.9Industry share female employees ≤ 20% 0.239 0.118Industry
Manufacturing 0.534 0.360Trade, maintenance and reparations 0.182 0.136Hospitality 0.032 0.025Transport and communication 0.072 0.074Real estate 0.162 0.341Other public services 0.016 0.062
N (HR managers) 307 272Note: Means (and standard deviations for continuous variables) reported. HR manager characteristicscome from the survey questionnaire and firm characteristics come from the ifo Personnel Manager SurveyDatabase. “Industry share female employees ≤ 20%” refers to the share of firms in industries with lessthan 20 % female employment. Indicated industries refer to the 1-digit German Classification of EconomicActivity, Version 2003.
Microeconometric Analyses on Determinants of Individual Labour Market Outcomes 51

2 Skills, Signals, and Employability
Tabl
e2.
6:I
nter
actio
nsof
Skill
Sign
alsw
ithH
RM
anag
eran
dFi
rmCh
arac
teris
tics:
Seco
ndar
y-Sc
hool
Grad
uate
s
(1)
(2)
(3)
(4)
(5)
(6)
HR
age
abov
em
edia
nM
ale
Man
agin
gdi
rect
orH
iring
resp
onsi
bilit
yTe
chni
cal
sect
or
Firm
size
≥25
0em
ploy
ees
Cogn
itive
Skill
sSc
hool
GPA
-0.2
2**
0.04
-0.3
3***
-0.2
40.
16*
0.03
(0.1
0)(0
.11)
(0.0
9)(0
.16)
(0.1
0)(0
.12)
Exte
nded
ITsk
ills
0.19
*0.
160.
26**
*0.
21-0
.21*
*-0
.01
(0.1
0)(0
.10)
(0.1
0)(0
.15)
(0.1
0)(0
.12)
Flue
ntEn
glis
h0.
09-0
.08
0.10
0.12
-0.1
20.
11(0
.10)
(0.1
0)(0
.10)
(0.1
5)(0
.10)
(0.1
3)2nd
fore
ign
lang
uage
0.10
0.19
*0.
24**
0.21
-0.2
2**
-0.0
2(0
.10)
(0.1
1)(0
.10)
(0.1
4)(0
.10)
(0.1
2)So
cial
Skill
sSo
cial
volu
ntee
ring
0.22
**0.
060.
24**
0.20
-0.1
9*-0
.10
(0.1
1)(0
.12)
(0.1
1)(0
.18)
(0.1
1)(0
.13)
Team
spor
ts-0
.16*
*0.
08-0
.05
0.12
0.02
0.14
(0.0
8)(0
.08)
(0.0
8)(0
.12)
(0.0
8)(0
.09)
Mat
urity
Age
with
insc
hool
coho
rt-0
.01
0.03
-0.0
20.
07-0
.14
0.03
(0.1
0)(0
.11)
(0.1
0)(0
.16)
(0.1
0)(0
.12)
Long
inte
rnsh
ip0.
110.
030.
21**
0.27
*-0
.23*
*0.
12(0
.10)
(0.1
1)(0
.10)
(0.1
6)(0
.10)
(0.1
3)N
ote:
Each
cell
stem
sfr
oma
sepa
rate
regr
essi
on.T
here
port
edco
e�ic
ient
sar
eth
ein
tera
ctio
nte
rms
betw
een
the
two
elem
ents
indi
cate
din
the
head
eran
dfir
stco
lum
n.Fi
rst-d
i�er
ence
dm
odel
with
CVpa
iras
unit
ofob
serv
atio
n.De
pend
entv
aria
ble:
invi
tatio
nfo
rjob
inte
rvie
w.C
ontr
olsf
orot
herC
Vel
emen
tsas
inTa
ble
2.3
incl
uded
thro
ugho
ut.A
llre
gres
sion
sinc
lude
indu
stry
fixed
e�ec
ts.
Stan
dard
erro
rscl
uste
red
atH
R-m
anag
erle
veli
npa
rent
hese
s.Si
gnifi
canc
ele
vel:
*p<
0.10
,**p
<0.
05,*
**p<
0.01
.
52 Microeconometric Analyses on Determinants of Individual Labour Market Outcomes

2 Skills, Signals, and EmployabilityTa
ble
2.7
:Int
erac
tions
ofSk
illSi
gnal
swith
HR
Man
ager
and
Firm
Char
acte
ristic
s:Co
llege
Grad
uate
s
(1)
(2)
(3)
(4)
(5)
(6)
(7)
HR
age
abov
em
edia
nM
ale
Man
agin
gdi
rect
orH
iring
resp
onsi
bilit
yVo
catio
nal
degr
eeTe
chni
cal
colle
gede
gree
Firm
size
≥25
0em
ploy
ees
Cogn
itive
Skill
sCo
llege
GPA
-0.0
6-0
.13
-0.1
7-0
.05
0.18
-0.3
1***
0.23
**(0
.11)
(0.1
0)(0
.13)
(0.1
2)(0
.11)
(0.1
1)(0
.10)
Exte
nded
ITsk
ills
0.16
0.08
-0.0
30.
180.
150.
010.
19(0
.12)
(0.1
3)(0
.13)
(0.1
8)(0
.15)
(0.1
4)(0
.14)
Engl
ish
leve
l-0
.03
-0.0
7-0
.14*
0.04
0.02
0.06
0.08
(0.0
7)(0
.07)
(0.0
8)(0
.10)
(0.0
8)(0
.08)
(0.0
8)2nd
fore
ign
lang
uage
0.25
**0.
26**
0.20
0.29
**-0
.20
-0.1
6-0
.31*
*(0
.12)
(0.1
2)(0
.13)
(0.1
4)(0
.14)
(0.1
4)(0
.13)
Soci
alSk
ills
Soci
alvo
lunt
eerin
g-0
.05
0.04
-0.1
30.
16-0
.11
0.23
**-0
.11
(0.0
9)(0
.09)
(0.1
0)(0
.11)
(0.1
0)(0
.10)
(0.1
0)Te
amsp
orts
0.10
0.00
-0.0
2-0
.07
0.00
0.27
***
0.06
(0.0
8)(0
.09)
(0.0
9)(0
.12)
(0.1
0)(0
.09)
(0.1
0)M
atur
ityH
igh-
scho
olGP
A0.
050.
11-0
.06
-0.1
1-0
.21*
*0.
1400
.00
(0.0
8)(0
.08)
(0.1
)(0
.1)
(0.0
9)(0
.10)
(0.1
1)Ag
ew
ithin
scho
olco
hort
0.01
0.00
0.01
0.03
-0.1
00.
040.
02(0
.11)
(0.1
1)(0
.14)
(0.1
4)(0
.12)
(0.1
3)(0
.13)
Long
inte
rnsh
ip-0
.06
-0.0
7-0
.16*
*-0
.14*
0.08
-0.0
50.
01(0
.06)
(0.0
7)(0
.07)
(0.0
7)(0
.07)
(0.0
7)(.0
7)No
te:E
ach
cell
stem
sfro
ma
sepa
rate
regr
essi
on.T
here
port
edco
e�ic
ient
sare
the
inte
ract
ion
term
sbet
wee
nth
etw
oel
emen
tsin
dica
ted
inth
ehe
ader
and
first
colu
mn.
Firs
t-di
�ere
nced
mod
elw
ithCV
pair
asun
itof
obse
rvat
ion.
Depe
nden
tvar
iabl
e:in
vita
tion
forj
obin
terv
iew
.Lon
gin
tern
ship
refe
rsto
inte
rnsh
ipof
thre
eor
five
mon
ths(
inst
ead
ofon
lyon
em
onth
).Co
ntro
lsfo
roth
erCV
elem
ents
asin
Tabl
e2.
4in
clud
edth
roug
hout
.All
regr
essi
onsi
nclu
dein
dust
ryfix
ede�
ects
.Col
umns
5an
d6
refe
rto
the
high
este
duca
tion
leve
loft
heH
Rm
anag
er.S
tand
ard
erro
rscl
uste
red
atH
R-m
anag
erle
veli
npa
rent
hese
s.Si
gnifi
canc
ele
vel:
*p<
0.10
,**p
<0.
05,*
**p<
0.01
.
Microeconometric Analyses on Determinants of Individual Labour Market Outcomes 53

2 Skills, Signals, and Employability
Table 2.8 : HR Managers’ Stated Priorities: Survey Results
HR manager sampleSecondary-school
graduatesCollege
graduatesDi�erence
(1)-(2)p-value
(1) (2) (3) (4)School GPA 0.668 0.469 0.199 0.000College GPA n/a 0.808 n/a n/aGerman grade 0.806 n/a n/a n/aMath grade 0.885 n/a n/a n/aIT skills 0.858 0.956 -0.098 0.000Language skills 0.657 0.828 -0.172 0.000Professional experiencethrough internships
.736 .941 -.205 .000
Hobbies .483 .472 .011 .593N (HR managers) 307 272Note: Shares of HR managers stating to find the indicated characteristic “very important” or “ratherimportant”. p-values in column (4) stem from a two-sided t-test.
54 Microeconometric Analyses on Determinants of Individual Labour Market Outcomes

2 Skills, Signals, and Employability
Table 2.9 : Interactions of Skill Signals with HR Manager Priorities: Secondary-School Graduates
(1) (2) (3) (4) (5)
School GPAExtended
IT skillsFluentEnglish
2nd foreignlanguage
Longinternship
CV element 0.21*** 0.16** 0.13** 0.06 0.04(0.07) (0.06) (0.07) (0.06) (0.06)
Interactionwith HR priority
0.36*** 0.27*** 0.32*** 0.27*** 0.18**
(0.07) (0.08) (0.06) (0.06) (0.08)Controls forother CV elements
Yes Yes Yes Yes Yes
Industry FE Yes Yes Yes Yes YesR2 0.171 0.152 0.175 0.163 0.143N (CV pairs) 601 605 605 605 605Note: First-di�erenced model with CV pair as unit of observation. Dependent variable: invitationfor job interview. Controls for other CV elements as in Table 2.3 included throughout. HR priorityrefers to importance given to the respective CV element (on a 4-point scale) by the HR manager in thequestionnaire (1=very unimportant, 2=rather unimportant, 3=rather important, 4=very important). Incolumns 3 and 4, this importance refers to “language skills”, in column 5 to “professional experiencethrough internships”. Standard errors clustered at HR-manager level in parentheses. Significancelevel: * p<0.10, ** p<0.05, *** p<0.01.
Microeconometric Analyses on Determinants of Individual Labour Market Outcomes 55

2 Skills, Signals, and Employability
Table 2.10 : Interactions of Skill Signals with HR Manager Priorities: College Graduates
(1) (2) (3) (4) (5) (6)College
GPAExtended
IT skillsEnglish
level2nd foreignlanguage
High-schoolGPA
Longinternship
CV element 0.43*** 0.02 0.05 0.12** 0.08 0.26***(0.07) (0.06) (0.07) (0.06) (0.05) (0.06)
Interaction withHR priority
0.27*** 0.23** 0.18** 0.12 0.08 0.02
(0.08) (0.12) (0.09) (0.08) (0.07) (0.10)Controls forother CV elements
Yes Yes Yes Yes Yes Yes
Industry FE Yes Yes Yes Yes Yes YesR2 0.168 0.163 0.171 0.168 0.156 0.154N (CV pairs) 542 542 536 536 542 542Note: First-di�erenced model with CV pair as unit of observation. Dependent variable: invitation for jobinterview. Long internship refers to internship of three or five months (instead of only one month). Controlsfor other CV elements as in Table 2.10 included throughout. HR priority refers to importance given to therespective CV element (on a 4-point scale) by the HR manager in the questionnaire (1=very unimportant,2=rather unimportant, 3=rather important, 4=very important). In columns 3 and 4, this importance refers to“language skills”, in column 6 to “professional experience through internships”. Standard errors clustered atHR-manager level in parentheses. Significance level: * p<0.10, ** p<0.05, *** p<0.01.
56 Microeconometric Analyses on Determinants of Individual Labour Market Outcomes

2 Skills, Signals, and Employability
Appendix
Appendix A2.1 Resumes of Secondary-School Graduates
Each secondary-school graduate applying for an apprenticeship position is repre-sented by a one-page CV. Figure 2.1 shows an example CV of a secondary-school gradu-ate. Table A2.1 lists all possible values of all CV elements that are randomly attributedto the secondary-school-graduate resumes. Elements marked with a star – genderand apprenticeship area (commercial or technical) – do not vary within a CV pairshown to an HR manager. The other elements – name, date of birth, school GPA, in-ternship duration, English proficiency, 2nd foreign language, IT skills, voluntary work,and sports – vary randomly within CV pairs. We use five di�erent first names for eachgender and five di�erent last names. The last names are the most common familynames in Germany, while the first names are among the ten most common names ofboys and girls of the birth cohort of the fictitious candidates (1998/1999). Table A2.4indicates that HR managers do not strongly prefer specific first names or specific fam-ily names. Invitation rates for the job interview di�er statistically significantly from0.5 (at the 5 percent level) in only two of 30 cases. Candidates are born within a four-month period between 15 November 1998 and 10 March 1999 in the capital of therespective state in which the firm is located. Grades in Germany, both in school andin college, range from 1 (very good) to 6 (failed). A grade of 4 (adequate) is typicallythe passing grade and GPAs typically involve decimal places. The school GPAs in ourresumes range from 1.3 to 3.3, that is, between very good and satisfactory. Each re-sume includes two sports disciplines, either two team sports or two single sports. Thesecondary-school graduates do their internships either in a “technical” or “commer-cial” job at a local cra� or retail company. Technical internships di�er across genderand involve, e.g., carpenter for males and hairdresser for females. Commercial intern-ships are the same for both gender and include, e.g., positions in banks or supermar-kets. To obtain a negative correlation between the school GPA and the other skill sig-nals on the resume, we construct a point index for the other skill signals, with eachskill signal receiving 1 point if the signal is positive (and 0 otherwise). In particular, thefollowing signals receive 1 point: fluent English proficiency (vs. basic), basic Frenchor Spanish proficiency (vs. no second foreign language), extended IT skills (Microso�O�ice plus HTML plus Dreamweaver vs. only Microso� O�ice), social volunteering (vs.no volunteering), and four weeks of internship (vs. two weeks). Within each CV pair,the resume with the worse school GPA includes other skill signals with an index thatis 2, 3, or 4 points higher.
Microeconometric Analyses on Determinants of Individual Labour Market Outcomes 57

2 Skills, Signals, and Employability
Appendix A2.2 Resumes of College Graduates
Each college graduate applying for a business trainee position is represented by a one-page CV. Figure 2.2 shows an example CV of a college graduate. Table A2.2 lists all pos-sible values of all CV elements that are randomly attributed to the college graduateresumes. Elements marked with a star – gender, type of secondary school, collegetype, and business area of the internship – do not vary within a CV pair shown to anHR manager. The other elements – name, date of birth, place of birth, high school GPA,college GPA, internship firm and duration, English proficiency, 2nd foreign language,IT skills, volunteering, and sports – vary randomly within CV pairs. College graduateresumes have the same five first names and five last names as the secondary-schoolgraduates. The first names are again among the ten most common names in the yearthe candidates were born. Candidates are born within a four-month period between15 November 1991 and 10 March 1992 in the capital in one of six states. The applicantswent to one of three high school types, which are held constant within CV pairs: a reg-ular high school (Gymnasium), a private catholic school, or a comprehensive school.All schools in the fictitious resumes actually exist in the respective city of birth. Allcandidates obtained their high school leaving certificate (Abitur) in 2011. Resumes in-clude the high school GPA (Abiturnote). All applicants have obtained a four-year Bach-elor’s degree in business administration at a public German university. The degreesare from universities ranked either in the top five or bottom five in the category under-graduate business degree of the CHE University Ranking 2015. Note that there are notuition fees and typically no entrance exams for public colleges in Germany. Resumesinclude the college GPA. High school GPA and college GPA range from 1.3 to 3.3, that is,between very good and satisfactory. We do not use the best and worst possible gradesto avoid very large (and quite uncommon) performance changes from high school tocollege. To avoid that one CV in a pair dominates on both GPAs, we randomize threeof the four GPAs in each CV pair independently, but restrict the fourth GPA in a waythat ensures that no CV contains better GPAs at both levels. The area of the intern-ship (sales, accounting, or controlling) is held constant within CV pairs in order notto give one candidate a particular advantage in case that the HR manager’s firm hap-pens to specialize in that area. Fictitious candidates have completed their internshipat one of four existing mid-size firms that o�er student internships on an online jobportal. All candidates have English language skills, but the level of proficiency variesbetween basic, very good, and fluent. Candidates may or may not have a second for-eign language, either French or Spanish (basic level). All candidates are proficient inMicroso� O�ice, whereas some candidates have additional IT skills in both HTML andDreamweaver.
58 Microeconometric Analyses on Determinants of Individual Labour Market Outcomes

2 Skills, Signals, and Employability
Appendix A2.3 Questionnaire
HR managers are given the following questionnaire (translated from the original Ger-man version) a�er they have selected their preferred fictitious applicants.
1. How old are you? (drop down menu, 18-100 years)
2. You are: (male, female)
3. Which professional qualification do you have? (vocational degree, university ofapplied sciences degree, university degree, no professional degree, other de-gree)
4. Are you responsible for hiring decisions in your establishment? (yes, no)
5. Are you the managing director of the firm? (yes, no)
6. How many job interviews have you approximately conducted during the previ-ous 12 months? (0, 1-9, 10-50, more than 50)
7. How important are for you the following characteristics of applicants in yourfirm? (very important, rather important, rather unimportant, very unimportant)
All HR managers
– IT skills– Language skills– Professional experience through internships– Hobbies
Only HR managers in secondary-school-graduate sample
– GPA of school-leaving degree– German grade– Math grade
Only HR managers in college-graduate sample
– High-school GPA (Abiturnote)– College GPA
Microeconometric Analyses on Determinants of Individual Labour Market Outcomes 59

2 Skills, Signals, and Employability
Appendix A2.4 Appendix Tables
Table A2.1 : Values of All CV Elements of Secondary-School Graduates
Gender* Female MaleMale first name Alexander Christian Patrick Daniel TobiasFemale first name Sarah Laura Anna Katharina JuliaLast name Becker Fischer Mayer Schneider WeberDate of birth 15-Nov-98 2-Dec-98 22-Jan-99 12-Feb-99 10-Mar-99School GPA 1.3; 1.7; 2.0; 2.3; 2.7; 3.0;3.3Apprentice area* commercial technicalCommercial internship at Sparkasse at carhouse in bookstore in hotel in supermar-
ketTechnical internship f at hairdresser
salonat cosmeticstudio
at bakery at jeweller at photo-graphic shop
Technical internship m with floortilercra�sman
at bakery at locksmith with carpenter at painter
Internship length 4 weeks 2 weeksEnglish fluent basic2nd foreign language French SpanishIT skills Microso�
O�iceMicroso� O�ice, HTML and Dreamweaver
Sports single teamSingle sports swimming cycling runningTeam sports handball volleyball basketball football
Social volunteering Neighbourhood help: youth and senior group, German languageclasses (social)
Note: This table shows all values of all CV elements that were randomized. ∗ denotes elements that arefixed within CV pairs. School GPAs range from 1.3 (very good) to 3.3 (satisfactory); for the analysis gradesare converted to points (4-grade). Technical internships vary for male and female candidates to ensurecredibility. Each resume contains either two single sports or two team sports. In half of the resumes, thereis no social volunteering.
60 Microeconometric Analyses on Determinants of Individual Labour Market Outcomes

2 Skills, Signals, and Employability
Table A2.2 : Values of All CV Elements of College Graduates
Gender* Female MaleMale first name Alexander Christian Patrick Daniel TobiasFemale first name Sarah Laura Anna Katharina JuliaLast name Becker Fischer Mayer Schneider WeberDate of birth 15-Nov-91 2-Dec-91 22-Jan-92 12-Feb-92 10-Mar-92Place of birth Wiesbaden Erfurt Mainz Hannover Düsseldorf München StuttgartType of secondary school* catholic integrated
comprehen-sive
neutral
Catholic Bishop-Naumann-SchoolKönigstein
Edith-Stein-SchoolErfurt
Theresianum,Mainz
GymnasiumSt.-Ursula-SchoolHannover
Suitbertus-Gymnasium,Düsseldorf
Maria-Ward-GymnasiumMünchen
Sankt-Meinrad-Gymnasium
Integrated Comp. HeleneLange Comp.secondaryWiesbaden
Comp. sec-ondaryErfurt
Comp. sec-ondaryMainz-Bretzenheim
Comp. sec-ondaryLinden,Hannover
Heinrich-Heine Comp.secondary,Düsseldorf
Willy-BrandtComp. sec-ondaryMünchen
Elise vonKönigSchool
Neutral GymnasiumLeibnizSchoolWiesbaden
Albert-SchweizerGymnasiumErfurt
GymnasiumMainz-Oberstadt
GymmasiumSchillerSchoolHannover
Max-PlanckGymnasiumDüsseldorf
Oskar-von-MillerGymnasiumMünchen
Karl-GymnasiumStuttgart
High-school GPA 1.3 1.7 2.0 2.3 2.7 3.0 3.3College type* Top-ranked Non top-
rankedTop-ranked universities University of
MannheimRWTHAachen
University ofMunich
University ofCologne
University ofFrankfurt
Non top-ranked universities University ofTrier
University ofGreifswald
University ofSiegen
UniversityLeuphanaLüneburg
University ofBremen
College GPA 1.3 1.7 2.0 2.3 2.7 3.0 3.3Internship firm Windmöller
& Hölscher,Lengerich
AmannGroup,Bönnigheim
FACT, Mün-ster
MVI Pro-plant,Wolfsburg
AstaroGmbH &Co. KG,Karlsruhe
Internship business area* Accounting Controlling SalesInternship length 1 month 3 months 5 monthsEnglish fluent very good basic2nd foreign language Spanish (ba-
sic)French(basic)
IT skills Microso� Of-fice
Microso� O�ice, HTML and Dreamweaver
Sports single teamSingle sports swimming cycling runningTeam sports handball volleyall basketball football
Volunteering: “social”neighbourhood help: youth andsenior group, German languageclasses
mobile care services: senior and do-mestic care
Volunteering: “non-social” volunteering preservation of mon-uments work
online volunteering at UN: IT workand translations
Note: This table shows all values of all CV elements that were randomized. ∗ denotes elements that are fixed within CV pairs. Schooland college GPAs range from 1.3 (very good) to 3.3 (satisfactory); for the analysis grades are converted to points (4-grade). Top-rankeduniversities according to the “2015 CHE Hochschulranking” in Undergraduate Business Administration. Each resume contains eithertwo single sports or two team sports. In half of the resumes, there is socially-interactive volunteering, in the other half, there isnon-socially-interactive volunteering.
Microeconometric Analyses on Determinants of Individual Labour Market Outcomes 61

2 Skills, Signals, and Employability
Table A2.3 : Sample Representativeness: Comparing Respondents and Non-Respondents from the ifo PersonnelManager Survey Database
Respondents Non-respondents p-valueAssigned sample (secondaryschool=1 / college=2)
1.472 1.469 0.932
Share female ≤ 20 0.185 0.187 0.930Industry 0.680Employees 383.02 424.22 0.725State 0.578Baden-Württemberg 0.145 0.150Bavaria 0.242 0.195Berlin 0.009 0.023Brandenburg 0.019 0.023Bremen 0.007 0.011Hamburg 0.021 0.024Hesse 0.073 0.079Mecklenburg-West Pomerania 0.019 0.013Lower Saxony 0.083 0.095North Rhine-Westphalia 0.181 0.178Rhineland-Palatinate 0.043 0.040Saarland 0.012 0.009Saxony 0.074 0.066Saxony Anhalt 0.021 0.028Schleswig-Holstein 0.026 0.032Thuringia 0.026 0.036N (HR managers) 579 927 Total: 1506Note: Means and p-values from two-sided t-tests comparing respondents and non-respondents from the ifoPersonnel Manager Survey Database. For “industry” and “state” distributions, both groups are comparedusing a two-sample Kolmogorov-Smirnov test (means are not reported for these categorical variables).Means for the German states represent the shares of firms from the respective state.
62 Microeconometric Analyses on Determinants of Individual Labour Market Outcomes

2 Skills, Signals, and Employability
Table A2.4 : Invitation Rate by First and Last Names
Secondary-schoolgraduate sample
College-graduatesample
Male first names mean p-value N (CVs) mean p-value N (CVs)Alexander 0.408 0.039 125 0.558 0.241 104Christian 0.487 0.750 156 0.439 0.272 82Daniel 0.561 0.227 98 0.582 0.106 98Patrick 0.496 0.931 133 0.461 0.431 102Tobias 0.522 0.559 186 0.447 0.305 94Female first namesAnna 0.455 0.397 88 0.531 0.454 143Julia 0.554 0.239 121 0.463 0.419 123Katharina 0.480 0.657 125 0.510 0.844 102Laura 0.495 0.918 93 0.547 0.272 139Sarah 0.495 0.922 103 0.426 0.136 101Last namesBecker 0.480 0.525 246 0.463 0.275 214Fischer 0.482 0.554 284 0.559 0.091 202Mayer 0.538 0.217 262 0.589 0.005 241Schneider 0.474 0.428 228 0.403 0.003 226Weber 0.505 0.890 208 0.483 0.626 205Note: Mean represents the mean of the outcome of being selected for an interview. P-values stem fromtwo-sided tests whether the mean of the outcome equals 0.5.
Microeconometric Analyses on Determinants of Individual Labour Market Outcomes 63


3 Does the Education Level of Refugees A�ect Natives’Attitudes?∗
3.1 Introduction
In 2014 and 2015, Europe experienced an unprecedented influx of refugees.1 In 2015alone, more than 1.5 million individuals applied for asylum in Europe, with Germanyregistering the highest number of some 440,000 applications (Eurostat, 2016).2 Theserefugee movements were exceptional not only in terms of magnitude, but also interms of refugees’ origin countries: As Syria, Afghanistan, and Iraq constitute the mainsource countries, these refugees are perceived as culturally more distinct than thoseseeking asylum during previous refugee waves, such as refugees from the Balkancountries in the 1990s (see Dustmann et al., 2017). Against this background, Europeanpoliticians face a challenge when implementing and enforcing asylum policies. On theone hand, these policies have to comply with international commitments, such as the1951 Geneva Convention for Refugees or the Dublin Convention.3 On the other hand,it is crucial that refugee policies are supported by domestic voters in order to success-fully implement these policies and to preserve solidarity with refugees. The fact thatpublic support for anti-immigration parties increased markedly in several Europeancountries during the refugee crisis suggests that voters’ scepticism towards refugeesand national asylum policies have not been fully appreciated by policy makers.4 De-∗ This chapter was coauthored by Philipp Lergetporer, University of Munich and ifo Institute and Marc Piopiunik,University of Munich and ifo Institute.1 Throughout the chapter, we use the term “refugee” as a collective term for all persons who seek refuge inanother country, independent of their legal status. We thereby follow the public discourse in Germany, in whichthe migration inflow from 2014 onward has generally been referred to as “Flüchtlingskrise” (refugee crisis) bypoliticians, the media, and the general public.2 The Federal Ministry of Internal A�airs registered a total of more than 1.1 million refugees entering Germanyin 2015 (Bundesministerium des Inneren, 2016).3 The Geneva Convention broadly defines the rights of refugees and the obligations of hosting countries. TheDublin Convention, which came into force in 1997/98, established the principle that the EU member state throughwhich an asylum seeker first enters the EU is responsible for processing the asylum claim (see Dustmann et al.,2017).4 Electoral outcomes that have largely been attributed to voters’ rising anti-immigration sentiments includethe “Brexit” referendum in the United Kingdom (Bansak, Hainmueller and Hangartner, 2016) and the successof the right-wing populist party “Alternative für Deutschland” (AfD) in Germany. The AfD won significant voteshares in several state elections, including the 2016 state election in Mecklenburg-West Pomerania in which itoutperformed Chancellor Merkel’s “Christlich Demokratische Union” (CDU) in Merkel’s home state (21 percentversus 19 percent). In the German federal election in September 2017, the AfD received 13 percent of the votes,which made it the third-largest party in the German Bundestag.
Microeconometric Analyses on Determinants of Individual Labour Market Outcomes 65

3 Does the Education Level of Refugees A�ect Natives’ Attitudes?
spite the importance of public attitudes towards refugees, little is known about thedeterminants of these attitudes and whether they depend on the characteristics ofrefugees.
In this chapter, we study whether attitudes towards refugees are a�ected by beliefsabout refugees’ education level. To do so, we implemented online survey experimentswith more than 5,000 students at universities in Germany. To estimate a causal e�ectof education beliefs on attitudes, we exogenously shi�ed respondents’ beliefs by ran-domly providing information on refugees’ education level.
The focus on refugees’ education level, one specific characteristic of refugees, allowsus to test two economic theories on how immigrants’ skill level shapes natives’ atti-tudes towards them (see Hainmueller and Hiscox, 2010) in the context of the Europeanrefugee crisis: The labour market competition model predicts that natives will be mostopposed to immigrants whose skills are similar to their own since these immigrantsmight be competitors on the labour market (see also Haaland and Roth, 2017). Thismodel therefore predicts that university students, the participants in our surveys, aremore opposed to refugees if they believe refugees to be well-educated. The fiscal bur-den model, on the other hand, predicts that natives in general are more opposed tolow-skilled immigrants because they impose larger fiscal burdens on the public thanhigh-skilled immigrants. In contrast to the labour market competition model, the fis-cal burden model thus predicts that university students are more opposed to refugeesif they believe refugees to be low-educated.5 Besides testing these two economic the-ories, our focus on refugees’ education level (instead of other refugee characteristics)has also been shaped by the political debates at the time we conducted our survey,which was a�er the large refugee influx from 2015 slacked o�. At that time, the publicdebate had started to focus on how to integrate the large number of refugees; obvi-ously, the education level of refugees was central in this debate.
In the context of this study, university students are an interesting and highly relevantfocus group for at least two reasons. First, in contrast to low-skilled natives, the twoeconomic theories make opposing predictions for the e�ect of education beliefs onthe attitudes of university students, which allows us to test the relevance of these twomodels. Second, university students constitute an important part of the electorate be-
5 While refugees typically do not migrate for economic reasons, they o�en stay in the host countries for longerperiods, making labour market integration an important challenge. Since labour market integration is consideredan important step for the general integration into the host country, refugees in Germany are entitled to work oncetheir asylum has been granted. Since many individuals applied for asylum in Germany, this implies a considerablenumber of refugees entering the labour market. In June 2017, for example, 10 percent of all unemployed personsseeking work in Germany were refugees (Degler, Liebig and Senner, 2017).
66 Microeconometric Analyses on Determinants of Individual Labour Market Outcomes

3 Does the Education Level of Refugees A�ect Natives’ Attitudes?
cause their voter turnout is traditionally higher than that of other voter groups (e.g.,Schäfer, Vehrkamp and Gagné, 2013). To put our findings into perspective, we providecomplementary evidence from the ifo Education Survey 2016, an opinion survey rep-resentative of the German adult population, on di�erences in beliefs about refugees’education level between university students and other groups of the population (seeSection 3.5).
For implementing the information treatment, we exploit the fact that, at the time ofour survey, the information on refugees’ education level6 discussed in German me-dia seemed to contradict itself. Due to the uncertainty regarding refugees’ educationlevel, we were able to provide opposing, equally credible, information on the edu-cation level of refugees in Germany. In particular, in our main survey, we randomlyassigned survey participants to one of three experimental groups: The control groupdid not receive any information on the education level of refugees. Respondents inthe High Skilled treatment were informed about a study that finds that refugees arerather well-educated (see UNHCR, 2015).7 In the Low Skilled treatment, we inducedthe opposite beliefs by informing participants about a di�erent study that finds thatrefugees are rather low-educated (see Woessmann, 2016). To assess the robustnessand replicability of our main results, we conducted a follow-up survey experiment in2017, using a new sample of more than 500 university students and a di�erent infor-mation treatment, which relied on newly available evidence on the education level ofrefugees.
We find that the information treatments strongly shi� respondents’ beliefs aboutrefugees’ education level in the expected directions. In the follow-up survey, using analternative information treatment, we replicate these e�ects and show that the shi� inbeliefs persists until one week later. Using the exogenous shi� in respondents’ beliefsabout refugees’ education as the first stage in an instrumental-variable approach, wefind that beliefs about refugees’ education level a�ect natives’ concerns about labourmarket competition. This finding is in line with the predictions of the labour market
6 We use the singular form education level to imply the average education level of refugees in Germany. Ofcourse, the education level may vary considerably across individuals.7 During 2015, information that refugees are rather well-educated was widespread in German me-dia. For example, newspaper articles discussed the contended high level of education of refugees:https://www.stern.de/politik/deutschland/so-alt-und-gebildet-sind-asylbewerber-in-deutschland-6473632.htmlb [accessed December 1, 2017]; https://www.welt.de/politik/ausland/article149755032/Syrische-Fluechtlinge-ueberdurchschnittlich-gebildet.html [accessed December 1, 2017]. Relatedly,media reports suggested that many refugees were academics, such as doctors or engineers (e.g.,https://www.taz.de/!5021964/ [accessed December 1, 2017]). See Section 3.2 for a detailed discussionon refugees’ education level and media reports thereof.
Microeconometric Analyses on Determinants of Individual Labour Market Outcomes 67

3 Does the Education Level of Refugees A�ect Natives’ Attitudes?
competition model. In contrast, we find no e�ects on fiscal burden concerns or otherconcerns such as increasing crime levels.8
Despite a strong correlation between beliefs about refugees’ education level and at-titudes, we do not find any evidence that education beliefs a�ect attitudes towardrefugees in a causal way. These precisely estimated zero e�ects suggest that eco-nomic aspects, such as labour market competition concerns, are rather unimpor-tant for shaping attitudes toward refugees in our sample. To empirically explore the(missing) link between labour market competition concerns and attitudes, we investi-gate the importance respondents attribute to various aspects when forming their atti-tudes toward refugees. Two clear patterns emerge: First, providing information aboutrefugees’ education level only increases the importance of economic aspects, but notthe importance of other aspects, such as humanitarian aspects. Second, when respon-dents form their attitudes toward refugees, economic aspects are relatively unimpor-tant. This result is consistent with the existing literature on attitude formation towardimmigrants, which suggests that non-economic aspects are more important than eco-nomic aspects (e.g., Card, Dustmann and Preston, 2012; Dustmann et al., 2017; Hain-mueller and Hiscox, 2010).
Several robustness checks indicate that our results are not driven by di�erent types ofbiases in respondents’ answering behaviour. In particular, in the follow-up survey, weused the item count technique (ICT) to assess whether survey answers are biased byrespondents’ desire to provide socially desirable answers (see e.g., Co�man, Co�manand Ericson, 2017). We find little evidence of social desirability bias. Furthermore, thepersistence of treatment e�ects on beliefs about refugees’ education level, as well asthe pattern of heterogeneous treatment e�ects by respondents’ baseline beliefs, sug-gest that our information treatment e�ects are not driven by experimenter demande�ects or priming e�ects.
This chapter contributes to several strands of economic research. It is related to theliterature on attitudes toward immigration (e.g., Card, Dustmann and Preston, 2012;Dustmann and Preston, 2007; Facchini and Mayda, 2008; O’Rourke and Sinnott, 2006),in particular to those studies that use survey experiments. For example, Grigorie�,Roth and Ubfal (2016) show that randomly provided information about immigration,such as the share of immigrants in the population and immigrants’ unemployment orincarceration rates, yields more favourable attitudes toward immigrants, but does nota�ect policy preferences. Similarly, Alesina, Stantcheva and Teso (2018) study how in-formation about the true share, the origin, and the work ethic of immigrants a�ects
8 We also present reduced-form estimates, which corroborate our instrumental-variable results.
68 Microeconometric Analyses on Determinants of Individual Labour Market Outcomes

3 Does the Education Level of Refugees A�ect Natives’ Attitudes?
natives’ preferences for redistribution. They find a negative e�ect of priming peopleto think about immigrants on demand for redistribution, which dominates the e�ectsof their information treatments. Hainmueller and Hiscox (2010) study experimentallyhow concerns about labour market competition and about the fiscal burden on pub-lic services shape attitudes toward high- and low-skilled migration. They find no sup-port for the labour market competition model or the fiscal burden model in their data.Haaland and Roth (2017) investigate whether beliefs about labour market impacts ofimmigration a�ect the support for immigration. They find that respondents reportmore support for immigration when being provided (research-based) evidence thatimmigration has no adverse e�ects on natives’ wages. To our knowledge, ours is thefirst study that studies the relevance of the labour market competition model and thefiscal burden model in the context of the European refugee crisis.
While the literature on natives’ attitudes towards immigration is well developed, ev-idence on what determines attitudes towards refugees is scarce.9 The study mostclosely related to ours is the survey experiment by Bansak, Hainmueller and Hangart-ner (2016). The authors asked 18,000 eligible voters in 15 European countries to eval-uate di�erent profiles of refugees that varied experimentally across nine broad do-mains. They find that refugees are more likely to be accepted if they worked in higher-skilled occupations in their home country, have more consistent asylum testimoniesand higher vulnerability, and are Christians (rather than Muslims). In a related surveyexperiment, Bansak, Hainmueller and Hangartner (2017) show that European citizenssupport a proportional allocation of asylum seekers across countries.10 To our knowl-edge, we are the first to provide an in-depth analysis of the causal e�ect of refugees’education level on natives’ attitudes. More generally, this chapter contributes to thegrowing literature that studies the causal e�ects of information provision on surveyrespondents’ attitudes and preferences in various domains.11
The rest of the chapter is structured as follows. In Section 3.2, we describe the labourmarket competition model and the fiscal burden model. We discuss the challenges ofmeasuring refugees’ education level and present the studies that we used for our in-formation treatments. In Section 3.3, we describe our opinion surveys and the experi-mental design. In Section 3.4, we present the results, including evidence that respon-
9 Also note that most surveys cited above were conducted before the massive refugee influx in 2014/2015.10 Further recent studies on natives’ attitudes in the context of the European refugee crisis include Steinmayr(2016), who investigates how the exposure to refugees a�ects voting behaviour in Austria, and Jeworrek, Leisenand Mertins (2017), who study whether telling survey respondents about the possibility that refugees supportthe local population with volunteering activities a�ects natives’ support for integrating refugees.11 See, for instance, Cruces, Perez-Truglia and Tetaz (2013); Elias, Lacetera and Macis (2015); Kuziemko et al.(2015); Wiswall and Zafar (2015); Lergetporer et al. (2016); Bursztyn (2016) and ?.
Microeconometric Analyses on Determinants of Individual Labour Market Outcomes 69

3 Does the Education Level of Refugees A�ect Natives’ Attitudes?
dents’ answers are not driven by di�erent types of biases such as social desirabilitybias. Section 3.5 discusses our findings and concludes.
3.2 Theoretical Framework and Evidence on Refugees’Education Level
While refugees typically do not intend to stay permanently, their integration in thehost country is nevertheless an important issue since many refugees have only fewprospects of returning to their country in the near future (Woessmann, 2016). Thesuccess of refugees’ integration critically depends on their successful integration intothe labour market (Degler, Liebig and Senner, 2017), which is also economically de-sirable since working refugees typically do not depend on government aid. For thesereasons, refugees in Germany are allowed to work once asylum has been granted.12
In general, policy makers may be more likely to implement successful integration poli-cies when they possess accurate information on the skill level of refugees and whennatives have positive attitudes towards refugees.
Economic theories on natives’ attitudes towards immigrants
The increasing success of anti-immigration parties in Europe, including the AfD in Ger-many, during recent years suggests widespread hostile attitudes towards immigrationand/or refugees. Thus, natives’ attitudes towards immigration might be a key obstacleto the implementation of integration policies as well as for accepting new immigrantsand refugees. Economic models on attitudes towards immigration emphasize the im-portance of migrants’ education level and natives’ beliefs thereof.
Hainmueller and Hiscox (2010) discuss two competing theories on how the skill levelof immigrants a�ects natives’ attitudes toward them. According to the labour marketcompetition model, natives are most opposed to immigrants with a skill level similarto their own because they expect these immigrants to compete for the same typesof jobs (e.g., Mayda, 2006; Scheve and Slaughter, 2001). Since our sample of univer-sity students will fall in the upper tail of the skill distribution of workers,13 the labour
12 Furthermore, it has been argued that refugees would alleviate the shortage of skilled workers.For example, in September 2015, Dieter Zetsche (Chairman of Daimler), comparing refugees toguest workers who came to Germany in the 1950s and 1960s, claimed that refugees could help tocreate a new “German economic miracle” (Die Zeit, August 18, 2016, http://www.zeit.de/2016/35/fluechtling-arbeitsmarkt-buerokratie-unternehmen-versprechen [accessed December 1, 2017]).13 Only 21 percent of the German population holds a university degree (Brücker, Rother and Schupp, 2016). Notethat the share of university-educated adults is lower in Germany compared to other OECD countries because ofthe extensive dual vocational education system in Germany.
70 Microeconometric Analyses on Determinants of Individual Labour Market Outcomes

3 Does the Education Level of Refugees A�ect Natives’ Attitudes?
market competition model predicts that our survey participants have more negativeattitudes toward refugees when they believe that refugees are highly educated (andthus potential competitors on the labour market). In contrast, the fiscal burden modelpredicts that respondents are more opposed to low-skilled immigration because low-skilled immigrants (by assumption) impose net burdens on public finance whereashigh-skilled immigrants are net contributors.14
This study tests these two competing theories in the context of the European refugeecrisis. In particular, we test whether shi�ing respondents’ beliefs about refugees’ edu-cation level upward (i.e., toward a higher education level) (i) increases concerns aboutcompetition on the labour market (hypothesis 1); (ii) decreases concerns that refugeesimpose fiscal burdens on public services (hypothesis 2); and (iii) a�ects general atti-tudes toward refugees (hypothesis 3). Of course, beliefs about refugees’ educationmay a�ect general attitudes not only because of labour market competition concernsand fiscal concerns (e.g., Bauer, Lofstrom and Zimmermann, 2000; Dustmann and Pre-ston, 2007). Therefore, we also assess the relevance of alternative concerns such asincreasing crime levels.
The education level of refugees in Germany
The successful integration of refugees into the labour market of the host country maysubstantially depend on their skills.15 A major challenge in this context is the largedegree of uncertainty regarding refugees’ formal education, which provides informa-tion on their professional skills. The large inflow of refugees during the years 2014and 2015 posed an enormous administrative challenge to register arriving refugeesand an even larger challenge to document their educational degrees. Particular prob-lems arise due to missing verifiable credentials, such as graduation certificates, andbecause educational degrees from the refugees’ home countries are o�en hardly com-parable with German educational degrees (see Brücker, Rother and Schupp, 2016;Woessmann, 2016).
14 In particular, the model predicts that richer (poorer) natives are more opposed to low-skilled immigrationif the government balances its budget by changing tax rates (by changing per capita transfers) in response toincreased spending on immigrants. Therefore, we measured respondents’ concerns about (i) the need for taxincreases and about (ii) lower levels of government benefits because of government spending on refugees (seeSection 3.3.1). While we refrain from making assumptions about how the German government might financespending increases on refugees, note that university graduates in Germany will on average have relatively highfuture earnings (OECD, 2016). This implies that they should be more concerned about tax increases than aboutcuts in government transfers if they believe that refugees’ education level is low.15 Note that, from a legal perspective, granting prosecuted individuals temporary refugee status is a humanitarianact that is independent of economic considerations and independent of the asylum seeker’s education level(Dustmann et al., 2017).
Microeconometric Analyses on Determinants of Individual Labour Market Outcomes 71

3 Does the Education Level of Refugees A�ect Natives’ Attitudes?
As a consequence of these di�iculties, studies that aim at quantifying the educationor skill level of refugees have produced seemingly contradictory findings. One of thefirst assessments of refugees’ education level is the UNHCR study on Syrian refugees(UNHCR, 2015). The study draws a positive picture of refugees’ education level sinceit finds that 43 percent of adult Syrian refugees report to have some university edu-cation and an additional 43 percent report to have completed secondary education(UNHCR, 2015).16 These data were collected by UNHCR border protection teams whoconducted interviews among a non-random sample of Syrian asylum seekers in var-ious locations in Greece.17 Since the majority of interviewees (50 percent) intendedto request asylum in Germany, the findings of this study have been interpreted as aproxy for the education level of asylum seekers in Germany (von Redetzky and Stoewe,2016).18
In contrast to the UNHCR study, Woessmann (2016) draws a negative picture ofrefugees’ education level. Comparing multiple data sources (e.g., the German Micro-census and the IAB-SOEP Migration Sample), the author finds that only about 10 per-cent of asylum seekers in Germany have a university degree and two-thirds do nothave any type of professional qualification. Moreover, using data from the Trends inInternational Mathematics and Science Study (TIMSS) in 2011 (before the Syrian civilwar started), Woessmann (2016) finds that 65 percent of Syrian 8th-grade students failto achieve the most basic proficiency level in mathematics and in science. Comparedto German 8th-grade students, the achievement gap amounts to 4-5 years of school-ing.19
We used these two studies for the two information treatments in our main survey toexogenously shi� respondents’ beliefs about refugees’ education level. The fact thatthe two studies reach contradicting conclusions allows us to implement symmetric in-formation treatments: One treatment tends to shi� beliefs about refugees’ educationlevel upward, whereas the other treatment tends to shi� beliefs downward. Thesetwo studies, UNHCR (2015) and Woessmann (2016), received considerable media at-
16 The UNHCR interprets its findings on the education level of Syrian refugees as follows: “Overall, the profileis of a highly-skilled population on the move.” (UNHCR, 8 December 2015, http://www.unhcr.org/news/latest/2015/12/5666ddda6/unhcr-says-syrians-arriving-greece-students.html [accessed 1 December, 2017]).17 These Syrian asylum seekers arrived in Greece between April and September 2015. The authors of the studynote that the interviews were voluntary and interviewees were not required to verify their statements withcredentials.18 See Buber-Ennser et al. (2016) for a similar interview study with asylum seekers in Austria.19 The TIMSS results should be viewed as an approximation of the skill level of refugees in Germany. First, whileSyria is the most relevant source country of refugees in Germany, refugees also come from other countries.Second, regarding the skill level, it is unclear to what extent Syrian refugees in Germany are a selected group ofSyrians.
72 Microeconometric Analyses on Determinants of Individual Labour Market Outcomes

3 Does the Education Level of Refugees A�ect Natives’ Attitudes?
tention and were, to our knowledge, the most convincing academic assessments ofrefugees’ education level at the time of our main survey. More recent evidence onrefugees’ education level from the IAB-BAMF-SOEP Survey of Refugees in Germanywas released only in late 2016, a�er our main survey had been conducted. This studyfinds that 32 percent of asylum seekers in Germany aged 18 years and older have ahigh school degree and 13 percent hold a university degree (see Brücker, Rother andSchupp, 2016). We used this alternative, and more recent, information on refugees’education level in the follow-up survey (conducted in June/July 2017) to assess therobustness and replicability of our main findings.
3.3 Survey Design, Information Treatment, and Empirical Model
3.3.1 Main Survey Experiment
General framework
To implement the main survey experiment, we ran an online survey with 4,901 stu-dents from four large German universities (Technical University of Dresden, Univer-sity of Munich, University of Konstanz, and Technical University of Chemnitz). Weobtained access to the universities’ mailing lists and invited students to participatein a “short opinion survey on refugees” via email. The email informed students thatthe survey would take about 5 minutes, participants would have the chance to winAmazon gi� vouchers a�er survey completion, and that the survey would be anony-mous.20 The survey was conducted using the so�ware Qualtrics (Qualtrics, Provo, UT),and the field time was from June to August 2016.
As is typical for experiments in economics, our study relies on a self-selected sam-ple of university students. Appendix Table A3.1 compares basic characteristics of stu-dents in our sample (share of females, share of non-Germans, and faculty) with o�i-cial administrative student statistics from the two larger universities. While we do notclaim to have a sample that is representative of students in Germany, Appendix TableA3.1 shows that our sample closely resembles the student populations at the respec-tive university in terms of gender and faculty composition. Non-German students areunder-represented in our sample because the survey was conducted in German.
20 We were able to guarantee anonymity and simultaneously o�er the chance to win Amazon gi� vouchers(which were delivered via email) because survey answers were saved in a di�erent file than email addresses.This was known to all respondents before the start of the survey. Furthermore, the survey so�ware preventedrespondents from participating in the survey with the same computer more than once.
Microeconometric Analyses on Determinants of Individual Labour Market Outcomes 73

3 Does the Education Level of Refugees A�ect Natives’ Attitudes?
Survey Questions
We designed the survey questions to measure respondents’ (i) beliefs about refugees’education level, (ii) labour market competition concerns, (iii) fiscal burden concerns,(iv) other concerns related to refugees (such as increasing crime), (v) general attitudestowards refugees, and (vi) aspects that shape respondents’ attitude towards refugees,such as economic consideration . Appendix Table A3.18 contains the wording and theanswer categories of all questions in the main survey (translated into English).21
Beliefs about refugees’ education level. To assess whether the information treatments(described below) indeed shi� beliefs about refugees’ education level in the intendeddirections, we asked respondents to indicate their belief about refugees’ educationlevel a�er randomly providing the information on refugees’ education level. The ef-fects of the information treatments on the education beliefs constitute the first stageof our instrumental-variables (IV) estimation strategy (see Section 3.3.3).
Labour market competition, fiscal burden, and other concerns. To assess the relevanceof the labour market competition model, we elicited concerns that refugees increaselabour market competition for both the respondent personally and in general. To as-sess the relevance of the fiscal burden model, we measured concerns about (i) fis-cal revenues and costs, (ii) lower levels of government benefits due to spending onrefugees, and (iii) the need for tax increases. To capture other potential channelsthrough which natives’ beliefs about refugees’ education level might a�ect attitudes,we elicited additional economic and non-economic concerns (e.g., increased crime)and statements about refugees.
General attitudes towards refugees. Ultimately, we are interested in how natives’ be-liefs about the education level of refugees translate into general attitudes towardsthem. To measure general attitudes, we asked respondents whether (i) Germanyshould admit more or less refugees in the future; whether (ii) the number of refugeesthat Germany admitted last year was too high or too low; and whether (iii) refugeesshould be allowed to stay in Germany permanently.
Aspects shaping respondents’ attitudes. Finally, we asked respondents about the im-portance of six di�erent aspects for forming their attitudes towards refugees: human-
21 Like many other recent economics papers using survey experiments, our outcomes of interest are self-reportedattitudes and policy preferences (e.g. Alesina, Stantcheva and Teso, 2018; Karadja, Mollerstrom and Seim, 2017;Kuziemko et al., 2015). Importantly, recent survey experiments corroborate the relevance of self-reportedattitudes toward migration by showing that they correspond closely to actual political behaviour, such as theprobability of signing an online petition or donating to charity (e.g. Grigorie�, Roth and Ubfal, 2016; Haaland andRoth, 2017; Alesina, Miano and Stantcheva, 2018).
74 Microeconometric Analyses on Determinants of Individual Labour Market Outcomes

3 Does the Education Level of Refugees A�ect Natives’ Attitudes?
itarian aspects, economic aspects, refugees’ willingness to integrate, religion/cultureof refugees, refugees’ criminal behaviour, and personal experience with refugees. Weincluded this question for two purposes: First, it allows us to investigate which as-pects of attitude formation become more, or less, important when respondents’ be-liefs about refugees’ education level are changed. Second, comparing the relative im-portance of the various aspects helps understanding the channels through which edu-cation beliefs a�ect general attitudes. At the end of the survey, we elicited a set of de-mographic characteristics, including respondents’ migration and family background,as well as refugee-related information, such as personal experience with refugees,and labour-market-related information, such as expected future earnings.
To avoid the risk that general attitudes towards refugees are contaminated by prim-ing respondents beforehand with refugee-related statements, we first elicited respon-dents’ general attitudes, then their beliefs about refugees’ education level, followedby specific concerns (labour market competition, fiscal burden, and others) and as-pects shaping respondents’ attitudes. Note that respondents were not able to returnto earlier questions to revise earlier answers. On each screen, except for the final ques-tions on demographic characteristics, we randomized the order of questions to avoidquestion order e�ects.
Summary indices. We combine answers to individual questions to create four sum-mary indices: a summary index for general attitudes, for labour market competition,for fiscal-burden, and for other concerns/statements, respectively. Each of these fourindices is created in three steps: First, we demean the outcomes of all individual ques-tions (concerns are coded from 1=“completely disagree” to 5=“completely agree”;general attitudes are coded from 1=very negative attitude to 5=very positive attitude).Second, we standardize the demeaned outcomes of all individual questions by divid-ing by its standard deviation. Third, we compute the mean across the standardizeditems that enter a specific summary index. The advantage of using summary indices istheir robustness to over-testing because only few indices are used. Another advantageis that measurement error is reduced if measurement error is not perfectly correlatedacross individual items (see also Anderson, 2008).
Information treatments
To identify a causal e�ect of beliefs about refugees’ education level on attitudes to-wards them, we randomly assigned respondents to one of three groups (control group,treatment High Skilled, and treatment Low Skilled) that di�ered by the type of informa-tion on refugees’ education level they were provided at the beginning of the survey.
Microeconometric Analyses on Determinants of Individual Labour Market Outcomes 75

3 Does the Education Level of Refugees A�ect Natives’ Attitudes?
Control group. Participants in the control group were shown the following text: “Withthis survey, we would like to learn about your opinion on refugees. Please think of thecurrent refugee situation in Germany when answering the survey.” Note that this textdoes not contain any information about refugees’ education level.
Treatment High Skilled. Participants in this group were given the following informa-tion:“With this survey, we would like to learn about your opinion on refugees. Pleasethink of the current refugee situation in Germany when answering the survey. In thiscontext, a study has found that the education level of refugees is rather high since 43percent of the refugees from Syria have attended a university.” The information onrefugees’ education level in this treatment is based on the UNHCR (2015) study (seeSection 3.2).
Treatment Low Skilled. Participants in this group were given the following information:“With this survey, we would like to learn about your opinion on refugees. Please thinkof the current refugee situation in Germany when answering the survey. In this con-text, a study has found that the education level of refugees is rather low because 65percent of the school students in Syria do not reach the basic level of academic com-petencies.” The information on refugees’ education level in this treatment is based onthe Woessmann (2016) study (see Section 3.2).
Note that we did not deceive our participants since the information provided reflectsthe interpretation of the authors of the two studies (and is not our interpretation oftheir results).22
3.3.2 Follow-up Survey Experiment
The information on refugees’ education level provided in the main survey has two po-tential drawbacks: First, due to the lack of available data for other source countries,the provided information only refers to refugees from Syria, the major source countryof refugees in Germany. Second, the information provided not only includes the studyresults (i.e., 43 percent university attendance rate versus 65 percent of 8th-grade stu-dents lacking basic academic competencies), but also reflects the interpretations ofthe respective authors (i.e., refugees are rather highly educated versus low-educated).While the interpretations of authors are typically provided when study results are dis-seminated by the media, explicitly incorporating authors’ interpretations in our infor-
22 Note that providing information on results from specific academic studies is not unusual for informationexperiments. See, for instance, Haaland and Roth (2017), who inform their survey respondents about Card’s(1999) results on the Mariel Boatli�, explicitly choosing a study with a non-negative finding on the impact ofimmigration on natives.
76 Microeconometric Analyses on Determinants of Individual Labour Market Outcomes

3 Does the Education Level of Refugees A�ect Natives’ Attitudes?
mation treatments may trigger experimenter demand e�ects. To address this issueand to assess the robustness of the findings from the main survey experiment, weconducted a follow-up experiment on a new sample of university students one yeara�er the main survey.
The follow-up survey experiment, conducted in June and July 2017, had a similar gen-eral set-up as the main survey experiment. The 582 respondents23 were randomizedinto two experimental groups (control group and treatment Information). The follow-up survey, which repeated a subset of six questions from the main survey,24 was de-signed to address three issues:
First, it investigates the robustness of our main findings to using an alternative infor-mation treatment. The information on refugees’ education level was based on a re-cently published study, the IAB-BAMF-SOEP Survey of Refugees in Germany (see Sec-tion 3.2 for details). The text in the information treatment reads as follows: “With thissurvey, we would like to learn about your opinion on refugees. Please think of the currentrefugee situation in Germany when answering the survey. In this context, a study hasfound that 32 percent of adult refugees have a high school degree; the respective shareamong the German population is 29 percent. 13 percent of refugees hold a universitydegree; the respective share among the German population is 21 percent” (see Brücker,Rother and Schupp, 2016).25 We supplemented this text information with a graphicaldepiction (see Appendix Figure A3.1). Note that the direction in which this informa-tion treatment shi�s respondents’ beliefs about refugees’ education level (if any) isunclear a priori, since it depends on respondents’ initial beliefs about the statisticsprovided (i.e., high school and university completion rates of refugees versus thoseof Germans). In Section 3.4.2, we show that this information treatment shi�ed beliefsabout refugees’ education level upward.
Second, the follow-up survey investigates the persistence of the shi� in respondents’beliefs about refugees’ education level that is triggered by the information treatment.To this end, we invited all respondents of the follow-up survey to participate in a re-
23 The follow-up survey was conducted with students from the University of Munich, the University of Konstanz,the Technical University of Chemnitz, and the Catholic University of Eichstätt-Ingolstadt. To identify respondentswho had already participated in the main survey one year earlier, we included a screening question. We excluded12 respondents who reported having already participated in our main survey. Including them in the sample doesnot change the results.24 The following questions were asked again: beliefs about refugees’ education level; labour market competitionconcerns (both questions: “for me personally” and “in general”); concern about fiscal revenues and costs; andtwo aspects governing opinion formation process (humanitarian aspects and economic aspects).25 As with the information provided in the main survey experiment, we remain agnostic about the accuracy ofthese study results and merely use them as an alternative information treatment.
Microeconometric Analyses on Determinants of Individual Labour Market Outcomes 77

3 Does the Education Level of Refugees A�ect Natives’ Attitudes?
survey about one week later, which again elicited respondents’ beliefs about refugees’education level. We also asked respondents to estimate the share of refugees with ahigh school degree and university degree, respectively, i.e., the information providedin the Information treatment one week before. Out of the 582 respondents to the firstsurvey, 292 (50 percent) participated in the re-survey.26
Third, since some questions on attitudes toward refugees might be sensitive ques-tions, we used the item count technique (ICT) to assess the extent of social desirabil-ity bias in the questions on labour market competition and fiscal burden concerns aswell as aspects of attitude formation (see also Co�man, Co�man and Ericson, 2017).The ICT provides a “veil” of anonymity for sensitive questions that reduces the risk ofbiases through socially desirable answers. Appendix A3.2 provides a detailed descrip-tion of the item count technique.
3.3.3 Empirical Model
To estimate the impact of respondents’ beliefs about refugees’ education level ontheir attitudes towards refugees, we use an instrumental-variables (IV) strategy. In thefirst stage, we instrument the belief of respondent i about refugees’ education levelwith the randomly assigned information treatment indicators:
BeliefEducationLeveli = α0 + α1HighSkilledi + α2LowSkilledi + δ′Xi + µi + εi.
(3.1)
whereHighSkilledi andLowSkilledi are binary treatment indicators.27 Xi is a vectorof control variables, including the respondents’ demographic characteristics. Impor-tantly, we include fixed e�ects for university*faculty combinations (µi) such that wee�ectively compare only students in the same faculty in the same university.28 εi isthe idiosyncratic error term. Since treatment High Skilled tends to shi� respondents’beliefs about refugees’ education level upward, while treatment Low Skilled tends toshi� them downward„ including both instruments should yield a strong first stage. Inthe analysis of the follow-up survey, we instrument respondents’ education beliefs
26 This rate is comparable to other recent studies: For instance, take-up in the follow-up surveys was 14 percentin Alesina, Stantcheva and Teso (2018) and Kuziemko et al. (2015), and 66 percent in Haaland and Roth (2017).27 Results are very similar when we instead use two binary treatment indicators for treatment Low Skilled andfor treatment High Skilled.28 Across the four universities, there are 11 di�erent faculties in total. Given that not all faculties are representedin each university (or in our sample), our sample contains 24 faculty*university cells.
78 Microeconometric Analyses on Determinants of Individual Labour Market Outcomes

3 Does the Education Level of Refugees A�ect Natives’ Attitudes?
with a binary indicator for whether respondents have been assigned to the informa-tion treatment.
In the second stage, we regress the respective outcome of interest (yi) on the predictededucation beliefs of the first stage:
yi = β0 + β1̂BeliefEducationLeveli + δ′Xi + µi + εi, (3.2)
Our coe�icient of interest is β1, which gives us the local average treatment e�ect(LATE). Identification of β1 relies on the untestable assumption that the informationtreatments a�ect our outcomes of interest only through their e�ects on respondents’beliefs about refugees’ education level. In Section 3.4.6, we provide evidence thatsuggests the validity of this exclusion restriction and show that our results hold whenestimating reduced-form e�ects instead.
3.3.4 Balancing Test
To test whether the randomization balanced the socio-demographic characteristicsof respondents across experimental groups in the main survey, we compare the char-acteristics of respondents in the control group with respondents in the two treatmentgroups (Table 3.1). We find statistically significant (at the 5 percent level), but small,di�erences (at the 5 percent level) in only six out of 90 pairwise comparisons; (seecolumns 2 to 4); six additional coe�icients are very small and only marginally signif-icant at the 10 percent level. Interestingly, note that some of the statistically signif-icant di�erences go in the same direction for the High Skilled and Low Skilled treat-ment. For example, the share of parents without college degree is slightly lower inboth information treatment groups compared to the control group. This implies thatonly few characteristics di�er statistically significantly between treatment High Skilledand treatment Low Skilled. Overall, while some di�erences exist between the controlgroup and treatment groups, they seem to emerge for random, and not systematic,reasons. In line with this interpretation, the information treatment has – as expected– opposite e�ects on respondents’ education beliefs in the High Skilled treatment andLow Skilled treatment (see Section 3.4.2). In our regression analyses, we control forall characteristics reported in Table 3.1.
Since the High Skilled and Low Skilled samples are slightly smaller than the controlgroup sample (by 4 and 2 percent, respectively), selection into survey participationmight be a threat to internal validity. If the information treatments decreased respon-dents’ likelihood to finish the survey, then di�erences in answers across experimen-
Microeconometric Analyses on Determinants of Individual Labour Market Outcomes 79

3 Does the Education Level of Refugees A�ect Natives’ Attitudes?
tal groups might be driven by attrition rather than by the information provided. Totest for non-random attrition, we compare the shares of participants who have beenassigned to a treatment group and subsequently completed the survey (see secondlast row of Table 3.1). Reassuringly, survey completion rates do not di�er across treat-ment groups, indicating that the lower numbers of observations in the informationtreatments are due to pure chance and that our estimates are internally valid.29 Ap-pendix Table A3.2 shows that characteristics are also well balanced between controland treatment groups in the follow-up survey (only one out of 30 di�erences is statis-tically significant at the 5 percent level) conventional levels.
3.4 Results
3.4.1 Correlation Between Attitudes, Beliefs About Refugees’ Education, andRespondents’ Socio-Demographic Characteristics
Using the control group, Appendix Table A3.3 presents bivariate correlations betweenbeliefs about refugees’ education level and general attitudes towards them.30 Re-spondents with more positive beliefs about refugees’ education level also have morepositive attitudes towards refugees. This is true for the summary index of generalattitudes as well as for the three individual items it comprises. In Section 3.4.4, weanalyse whether these correlations represent a causal e�ect of education beliefs onattitudes. In Appendix Tables A3.4 and A3.5, we investigate how respondents’ socio-demographic characteristics are related to attitudes towards refugees and to beliefsabout refugees’ education level, respectively.31 Overall, males are more sceptical to-wards refugees, whereas students who spoke to refugees and students who receive
29 Note that Table 3.1 compares respondents who are included in our analysis sample. Several participants hadto be excluded for the analysis: First, we excluded all individuals (482 persons) who clicked on the survey link,but terminated the survey before having been assigned to an information treatment. Second, we excluded 524participants who answered only the four general attitude questions on the first screen, but nothing else. Third,we excluded 414 participants aged 40 years and older since it is unlikely that these persons are regular students.Fourth, and similarly, we excluded 47 participants who reported that they were not studying (e.g., guest auditors).Finally, we excluded one participant whose comments at the end of the survey suggested that he or she did notanswer the survey truthfully. In the full sample (i.e., before applying these sample restrictions), 2,015 participants(34.2 percent) were randomly assigned to the control group, 1,925 participants (32.7 percent) to treatment HighSkilled, and 1,947 participants (33.1 percent) to treatment Low Skilled. All remaining participants completedthe survey and are included in the analysis. The completion rates reported at the bottom of Table 3.1 refer tothe full sample before applying the sample restrictions (except the first restriction since individuals had notbeen assigned to a treatment yet). The numbers of observations in our regression analyses are slightly smallerbecause we excluded respondents with missing covariates from the analyses.30 See Appendix Figure A3.2 for histograms of answers to the general attitude questions.31 Note reported numbers of observations in our regressions is a bit lower than the numbers reported in the bal-ancing tables because of item non-response. Importantly, treatments status is unrelated to item non-response.
80 Microeconometric Analyses on Determinants of Individual Labour Market Outcomes

3 Does the Education Level of Refugees A�ect Natives’ Attitudes?
need-based student aid (an indicator for low family income) have more positive atti-tudes (column 1 of Table A3.4). Consistent with the strong correlations reported in Ap-pendix Table A3.3, respondents’ socio-demographic characteristics also predict theirbeliefs about refugees’ education level (see Appendix Table A3.5): Males, older respon-dents, and students born abroad are less likely to believe that refugees’ educationlevel is high. In contrast, students who spoke to refugees and recipients of need-basedstudent aid are more optimistic. Interestingly, additional heterogeneity analyses (notshown) reveal that the information treatment e�ect on education beliefs is very simi-lar across socio-demographic groups.
3.4.2 Impact of Information Treatment on Beliefs About Refugees’ Education Level
Figure 3.1 shows that the two opposing information treatments shi� the beliefs aboutrefugees’ education level in opposing directions. The information provided in the LowSkilled treatment shi�s education beliefs downward (le� panel); in contrast, the infor-mation in the High Skilled treatment shi�s education beliefs upward (right panel). Ta-ble 3.2 presents the results in regression form. The dependent variable in columns 1and 2 equals 1 if the respondent agrees completely or somewhat that refugees are welleducated, and equals 0 otherwise; in columns 3 and 4, the dependent variable equals1 if the respondent disagrees completely or somewhat (0 otherwise). In columns 5 and6, we use the original, five-point scale, outcome, with higher values indicating moreagreement with the statement that refugees are well educated on average. The HighSkilled treatment increases the share of respondents who agree with the statementby 14 percentage points. Since the respective share is only 18 percent in the controlgroup, this is a very strong e�ect. In contrast, the Low Skilled treatment strongly de-creases the share of respondents with positive views on refugees’ education level by5 percentage points (or 28 percent).3233
Table 3.3 reports the information treatment e�ect in the follow-up survey. The infor-mation provided in this survey (32 percent of adult refugees have a high school degreeand 13 percent a university degree; respective shares among the German population
32 Since we elicited beliefs about refugees’ education level on a five-point-scale, we can also investigate how theinformation treatments a�ect each answer category. It turns out that the information treatments did not onlya�ect those who “somewhat agree” or “somewhat disagree” with the statement, but also changed the shares ofrespondents who articulated strong agreement and strong disagreement, respectively (results available uponrequest).33 In Appendix Table A3.6, we regress respondents’ education beliefs on the treatment indicator, respondents’characteristics, and interactions between treatment indicator and characteristics, separately for treatmentHighSkilled (columns 1 to 3) and Low Skilled (columns 4 to 6). The coe�icients on the interaction terms allow us tocharacterize the compliers in both treatments: Respondents in the diploma-track (male and older respondents)are significantly less likely to react to treatment High Skilled (Low Skilled) than their counterparts.
Microeconometric Analyses on Determinants of Individual Labour Market Outcomes 81

3 Does the Education Level of Refugees A�ect Natives’ Attitudes?
are 29 percent and 21 percent) strongly increases the share of respondents who agreethat refugees are well-educated by 29 percentage points. This finding has two impor-tant implications: First, the information treatment e�ect in the follow-up survey isvery similar to the strong positive e�ect of the High Skilled treatment in the main sur-vey. Second, and more importantly, the strong information treatment e�ects in themain survey are not due to the way the information was presented, in particular, thesee�ects are not driven by the included interpretation of the numbers (e.g., “...a studyhas found that the education level of refugees is rather high since...”).
Persistence of information treatment e�ect and e�ect heterogeneities by initial beliefs
One potential issue with information experiments is that the information providedmight trigger experimenter demand e�ects or priming e�ects instead of genuine be-lief updating.34 We provide two pieces of evidence that suggest that the strong ef-fects of the information treatments on beliefs about refugees’ education level are notdriven by experimenter demand e�ects or by priming e�ects.
First, the e�ects of the information treatment persist for one week. Combining datafrom the follow-up survey and the re-survey one week later, we regress respondents’beliefs about refugees’ education level on an information treatment dummy, a re-survey dummy, and an interaction term of these two indicators (Appendix Table A3.7).The information treatment not only increases the share of respondents who agreethat refugees are well-educated at the moment the information is provided, but sub-stantially increases this share still one week later when the information is not provided(again). As expected, the immediate treatment e�ect is stronger than the longer-runimpact, which is likely due to imperfect recall.
Appendix Table A3.8, using alternative outcomes, again shows that the informationtreatment has longer-run impacts on respondents’ beliefs about refugees’ educationlevel: While respondents in the control group underestimate the share of refugeeswho hold a high school degree by almost 12 percentage points (the control mean incolumn 1 is 21 percent, the true value is 32 percent), the treatment group holds sig-nificantly more accurate beliefs (columns 2 and 3). Interestingly, the treatment doesnot improve estimates of refugees’ university graduation rate (columns 5 and 6). Thus,the positive treatment e�ect on education beliefs in Table 3.3 stems from correctingrespondents’ initial beliefs about refugees’ high school graduation rate upward. Re-
34 Experimenter demand e�ects occur if the information provided contains indications about the experimenter’sintentions and respondents answer accordingly to please the experimenter (Zizzo, 2010; de Quidt, Haushoferand Roth, 2018). Similarly, specific words in the information might activate certain concepts in respondents’memory that influence their answering behaviour unconsciously (priming e�ects).
82 Microeconometric Analyses on Determinants of Individual Labour Market Outcomes

3 Does the Education Level of Refugees A�ect Natives’ Attitudes?
spondents who were provided the information on these education shares one weekearlier are also more confident about their estimates (column 7).35 Similar to previ-ous studies (Grigorie�, Roth and Ubfal, 2016; Haaland and Roth, 2017; Cavallo, Crucesand Perez-Truglia, 2017), we argue that it is very unlikely that experimenter demande�ects or priming e�ects persist until one week later in the re-survey. This interpreta-tion is consistent with recent evidence by Mummolo and Peterson (2018) who showthat survey experiments are robust to experimenter demand e�ects.
Second, the large sample in the main survey allows estimating heterogeneous treat-ment e�ects by respondents’ baseline beliefs about refugees’ education level. For thisanalysis, we first have to predict the baseline beliefs of respondents in the two infor-mation treatments.36 Column 1 of Appendix Table A3.10 shows that while treatmentHigh Skilled increases beliefs about refugees’ education level (measured on the origi-nal five-point scale) among respondents with high and low baseline beliefs, treatmentLow Skilled only decreases beliefs about refugees’ education level among respon-dents with high baseline beliefs, but not among those with low baseline beliefs. Usingdichotomized measures of education beliefs as outcome variables (see columns 2 and3), the pattern is identical for treatment Low Skilled, which only decreases (increases)the probability that respondents agree (disagree) with the statement that refugeesare well educated among those with high baseline beliefs. Similarly, treatment HighSkilled increases (decreases) the probability to agree (disagree) with the statement ifbaseline beliefs are low. Interestingly, this treatment particularly increases the prob-
35 In Appendix Table A3.9, we regress an indicator for participation in the re-survey on the treatment indicator andcovariates. While a few covariates are significantly related to re-survey participation, they are jointly insignificant(p=0.89, joint F-test performed on regression of column 2). Most importantly, the insignificant coe�icients on thetreatment indicator show that attrition does not di�er across treatment arms. Thus, providing information torespondents does not a�ect their probability of participating in the re-survey one week later.36 To verify that the information provision indeed a�ects beliefs about refugees’ education level, it was necessaryto elicit the education beliefs a�er providing the information to respondents in the two treatment groups.We abstained from belief elicitation before providing the information to avoid behavioural anomalies such asbackfire e�ects where individuals respond defiantly to belief corrections by reinforcing their initial beliefs (Nyhanand Reifler, 2010). Instead, we imputed the baseline beliefs of respondents in the two treatment groups. Todo so, we regressed the education beliefs (using the original five-point scale) of the respondents in the controlgroup on all socio-demographic background characteristics, university, faculty, and opinion formation aspects(except economic aspects since they were a�ected by the information provision; see Section 3.4.5). We thenused the estimated coe�icients from the control group and imputed the baseline beliefs of respondents inthe two treatment groups, using their background characteristics and opinion aspects. Finally, we split theimputed baseline belief at the median to define high and low baseline beliefs. This imputation procedure seemsto work well: First, among respondents in the control group, the reported beliefs and the imputed beliefs aresubstantially correlated (r=0.58). Second, again using only the control group, the standard deviation of theimputed beliefs is rather large (57 percent) relative to the standard deviation of the reported beliefs.
Microeconometric Analyses on Determinants of Individual Labour Market Outcomes 83

3 Does the Education Level of Refugees A�ect Natives’ Attitudes?
ability to agree among those with relatively high baseline beliefs.37 Since almost allpatterns in the table indicate belief updating, we consider it highly unlikely that ourinformation treatment e�ects are driven by experimenter demand e�ects or priminge�ects.38
3.4.3 Impact of Beliefs About Refugees’ Education Level on Labour MarketCompetition and Fiscal Burden Concerns
We now assess the relevance of the two competing theories, the labour market com-petition model and the fiscal burden model, in the context of the European refugeecrisis. Table 3.4 presents results from IV estimates of the e�ects of beliefs aboutrefugees’ education level (instrumented with the two information treatment indica-tors) on labour market competition and fiscal burden concerns.39 The dependent vari-ables in columns 1 and 4 are the summary indices of labour market competition andfiscal burden concerns, respectively (see Section 3.3.1). The outcomes in the remain-ing columns are binary indicators of agreement with the individual statements thatmake up the two summary indices.
Consistent with the labour market competition model, respondents are more con-cerned about competition from refugees on the labour market if they believe thatrefugees are well-educated, rather than low-educated (column 1). This applies to con-cerns about increased competition for the respondent personally, but particularlyto concerns about increased competition on the labour market in general (controlmean: 26 percent; see column 3). A post-estimation test reveals that the treatment ef-fect in column 3 is marginally significantly larger than the e�ect in column 2 (p=0.11).This moderate e�ect, together with the low level of baseline concerns that refugeesincrease labour market competition for the respondent personally (control mean isonly 4 percent, see column 2), suggests that, while a relevant share of students is con-
37 One possible explanation for the positive e�ect of treatment High Skilled on the probability to agree to thestatement of persons with high baseline beliefs is that the specific information provided (i.e., 43 percent ofrefugees have attended a university) constitutes a positive shock to their beliefs about the share of refugees whohave attended a university (which we did not measure). This finding is also consistent with the notion that theserespondents hold motivated beliefs, which they update selectively (e.g. Bénabou and Tirole, 2016).38 This approach to distinguishing information e�ects from other unintended e�ects was developed by Lenz(2009) and has been applied to various survey experiments, e.g., Cruces, Perez-Truglia and Tetaz (2013), Schuelerand West (2016), and Lergetporer et al. (2016).39 All results are robust to including survey date fixed e�ects, indicating that results do not depend on the daywhen respondents answered the survey.
84 Microeconometric Analyses on Determinants of Individual Labour Market Outcomes

3 Does the Education Level of Refugees A�ect Natives’ Attitudes?
cerned about increased general labour market competition, most respondents do notperceive refugees as their direct competitors on the labour market.40
In contrast, we do not find any evidence for the fiscal burden model. Treatment e�ectson both the summary index (column 4) and on its components (columns 5 to 7) are pre-cisely estimated zeros. While 30 percent of respondents think that refugees will bringmore revenues than costs for the government, this share is una�ected by shi�s in re-spondents’ education beliefs (column 5). Similarly, the treatment does not a�ect re-spondents’ concerns that they will have to pay more taxes (control mean: 24 percent,see column 6) or that they will have to forgo future government benefits because ofthe refugees (control mean: 11 percent, see column 7). Beliefs about refugees’ edu-cation level also do not a�ect agreement to other refugee-related statements, for in-stance, that refugees are a cultural enrichment, or concerns that they increase crimelevels (see Appendix Table A3.11).
To account for the fact that we estimate e�ects of education beliefs on multiple out-comes, we also conduct a multiple hypotheses correction using the procedure of Ro-mano and Wolf (2005). Reassuringly, when accounting for the multiple hypothesestests performed on the four summary indices in Tables 3.4,3.5,A3.11, the coe�icienton the labour-market-concerns index remains highly statistically significant (p < 0.01).
3.4.4 Impact of Beliefs About Refugees’ Education Level on General Attitudestowards Refugees
Next, we investigate whether the increased labour market competition concernstranslate into a change in general attitudes towards refugees. Again using the IV modelin equations (1) and (2), we find no e�ect of beliefs about refugees’ education level ongeneral attitudes towards refugees (Table 3.5). This is true for the summary index ofgeneral attitudes (column 1) as well as for the individual items that make up the sum-mary index (columns 2 to 4). While attitudes towards refugees are strongly correlatedwith beliefs about their education level (see Appendix Table A3.3), Table 3.5 impliesthat these correlations are not driven by an impact of education beliefs on attitudes.
40 Interestingly, the e�ect of education beliefs on concerns that refugees increase labour market competition forthe respondent personally is basically zero in the follow-up survey experiment, which provides a di�erent type ofinformation. This result is consistent with Appendix Table A3.8, which shows that the information treatment onlyshi�s beliefs about the share of refugees with a high school degree, but not beliefs about university graduationrates. Since our sample of university students is unlikely to consider refugees with a high school degree ascompetitors on the labour market, it is not surprising that this information treatment does not a�ect concernsabout increased personal labour market competition.
Microeconometric Analyses on Determinants of Individual Labour Market Outcomes 85

3 Does the Education Level of Refugees A�ect Natives’ Attitudes?
The finding that increased labour market competition concerns do not translate intomore negative general attitudes may be surprising at first sight, given that potentiallabour market impacts of the large refugee inflow in Germany play a prominent role inthe public debate. However, our finding is consistent with existing studies on attitudestowards immigration, which find that economic considerations play only a minor rolein the attitude formation process (see Dustmann and Preston, 2007; Hainmueller andHiscox, 2010). In the next section, we provide direct empirical evidence that this inter-pretation also applies to our study.
3.4.5 Aspects Shaping Attitudes Towards Refugees
To investigate the connection between respondents’ beliefs about refugees’ educa-tion level and general attitudes more closely, we elicited the importance that respon-dents attribute to various aspects when forming their attitude towards refugees. Ta-ble 3.6 presents results of IV regressions in which all outcomes are binary and equal 1if the respondent considers the given aspect as important, respectively unimportant,for her attitude formation process (and 0 otherwise).41
Table 3.6 contains two interesting findings: First, beliefs about refugees’ educationlevel do not a�ect the importance of any aspect of opinion formation except for eco-nomic aspects, which become more important (i.e., less unimportant) with higher ed-ucation beliefs.42 This suggests that providing information about refugees’ educationlevel only triggers respondents’ economic considerations. This result is related to anopen question in the literature on attitudes towards immigration as to what extentrespondents associate the education level of refugees, or immigrants more generally,with economic aspects rather than with social or cultural aspects (Hainmueller andHiscox, 2010).
The second key finding of Table 3.6 concerns the relative importance of economicaspects versus other aspects when individuals form their attitude towards refugees.Using only respondents from the control group (who have not been a�ected by anyinformation treatment), we find that refugees’ willingness to integrate and humanitar-ian aspects are important for most respondents (88 percent and 86 percent, respec-tively). These aspects are followed by personal experience with refugees (70 percent),refugees’ criminal behaviour (54 percent), and religion/culture of refugees (45 percent).Intriguingly, economic aspects are the least important aspect: Only 39 percent of re-spondents consider them important when forming their attitudes towards refugees.
41 Appendix Table A3.12 reports bivariate correlation coe�icients between all opinion formation aspects.42 This treatment e�ect remains significant (p=0.03) a�er correcting for the multiple hypotheses tested in Table 3.6using the step-down procedure described in Romano and Wolf (2005).
86 Microeconometric Analyses on Determinants of Individual Labour Market Outcomes

3 Does the Education Level of Refugees A�ect Natives’ Attitudes?
This pattern also holds when regressing general attitudes on all opinion aspects simul-taneously (Appendix Table A3.13): Compared to all other opinion aspects, the relation-ship between economic aspects and general attitudes is much weaker. The great im-portance attributed to humanitarian aspects in our sample is similar to Bansak, Hain-mueller and Hangartner (2016), who find that humanitarian aspects play a major rolein whether natives are willing to accept refugees. However, while these authors alsoidentify employability and religion as being important for shaping natives’ attitudestowards refugees, religious and economic aspects are relatively unimportant in ourcontext.
In sum, our results show that shi�ing beliefs about refugees’ education level upward(i.e., refugees are more likely to be considered highly educated) increases labour mar-ket competition concerns. However, these economic concerns do not translate intomore negative attitudes towards refugees because economic aspects are rather unim-portant when individuals form their attitudes towards refugees.
3.4.6 Validity of the Exclusion Restriction
The validity of our IV estimates hinges on the assumption that the only channelthrough which the information treatments impact the outcome variables of interestis through shi�ing respondents’ beliefs about the education level of refugees. Oneimportant potential concern may be that the treatments in our main survey experi-ment did not only inform respondents about refugees’ education level, but also men-tioned their country of origin (Syria). Any direct e�ect (i.e., not operating througheducation beliefs) of this information on respondents’ concerns or attitudes towardrefugees would invalidate our IV approach. For several reasons, we consider such di-rect e�ects unlikely. First, the fact that most refugees in Germany come from Syria hasalready been well known within the German public.43 Therefore, this part of the treat-ment hardly constituted new information for our survey respondents. Second, thefact that both information treatments mentioned Syrians, but had opposing e�ectson respondents’ labour market concerns (treatment High Skilled increased those con-cerns, treatment Low Skilled reduced them; see below) is hard to reconcile with thenotion that information about refugees’ origin is important. Third, our findings thatthe treatments do not a�ect any other statements/concerns about refugees, such asconcerns about increased crime levels (see Appendix Table A3.11), speaks against the
43 This notion is corroborated by the fact that in 2015, Google documented on average 18 searchrequests each day in Germany for the German equivalent of “refugees Syria”, whereas therewere only two requests (one request) for “refugees Afghanistan” (“refugees Iraq”) (Google Trends,https://trends.google.de/trends/explore?date=2015-01-01%202015-12-31&geo=DE&q=Fl%C3%BCchtlinge%20Syrien,Fl%C3%BCchtlinge%20Afghanistan,Fl%C3%BCchtlinge%20Irak; [accessed 7 August 2018]).
Microeconometric Analyses on Determinants of Individual Labour Market Outcomes 87

3 Does the Education Level of Refugees A�ect Natives’ Attitudes?
presumption that the treatment operates through other channels than education be-liefs.
Finally, our reduced-form results are in line with our findings from our IV estimates: InAppendix Table A3.14, we regress respondents’ labour market competition and fiscalburden concerns on the two information treatment indicators. Consistent with theIV results in Table 4, the treatment High Skilled (Low Skilled) significantly increases(decreases) the summary index for respondents’ labour market concerns (column 1),but does not a�ect fiscal burden concerns. In line with the IV results in Table 3.5 andAppendix Table A3.11, the reduced-form results in Appendix Tables A3.15 and A3.16reveal precisely estimated null e�ects on respondents’ general attitudes and otherrefugee-related statements, respectively. Similarly, Appendix Table A3.17 yields sig-nificant and positive treatment e�ects of treatment High Skilled on the importance ofeconomic aspects for shaping respondents’ attitudes toward refugees, which corrob-orates our IV findings in Table 3.6. In sum, the fact that these intention-to-treat e�ectsare in line with our findings in Sections 3.4.3 to 3.4.5 is reassuring since their causalinterpretation does not depend on the validity of the exclusion restriction.
3.4.7 Social Desirability Bias
Respondents might perceive some questions on their attitudes towards refugees assensitive. One prominent concern with sensitive survey questions is that respondentsmight give socially desirable answers instead of answering honestly. A widely usedtechnique to reduce, or even avoid, social desirability bias is the so-called item counttechnique (ICT). The ICT is designed to foster truthful reporting by providing respon-dents a “veil” that prevents researchers from inferring an individual’s answer to aspecific sensitive item. Researchers, however, are still able to draw probabilistic in-ferences for groups of respondents (See Co�man, Co�man and Ericson (2017) for adetailed description and validation of the ICT). The ICT randomly assigns survey re-spondents to a direct response group whose members are directly asked whether theyagree with a sensitive item. Respondents in the veiled response group, in contrast, re-port on how many of N+1 items (which include the sensitive item and N other items)they agree with. In our case N=4 since we use four additional, non-sensitive items toveil answers to the sensitive item. See Appendix A3.2 for a detailed description of howthe ICT works.
In the follow-up survey, we used this technique to assess the social desirability biasfor five potentially sensitive items: labour market competition concerns (both for therespondent personally and in general); concerns about fiscal revenues and costs; and
88 Microeconometric Analyses on Determinants of Individual Labour Market Outcomes

3 Does the Education Level of Refugees A�ect Natives’ Attitudes?
aspects shaping the attitude towards refugees (humanitarian aspects and economicaspects). In Table 3.7, we regress the number of items (out of five items) that respon-dents agree with on a binary indicator for respondents in the veiled response group.The small and statistically insignificant coe�icients on the veiled indicator in the firstthree columns indicate that reported labour market competition and fiscal burdenconcerns are not a�ected by social desirability bias. On the other hand, the negative,and statistically significant, coe�icient for humanitarian aspects suggests that socialdesirability bias leads to some over-reporting of the importance of humanitarian as-pects when respondents are asked directly (i.e., when no veil is provided). Less intu-itively, we also find a negative coe�icient on veiled answers for economic aspects, sug-gesting that respondents more o�en report economic aspects to be important whenasked directly. Using a non-sensitive placebo item (“I used a laptop computer for com-pleting this survey”) shows that the significant coe�icients in columns 4 and 5 do notarise mechanically from the ICT. Adding up the mean answers in the direct responsegroup (see “Mean (direct response)” in Table 3.7) and the respective regression coef-ficient yields social-desirability-bias-adjusted average responses (See Co�man, Co�-man and Ericson (2017) for details). Results show that the adjusted share of respon-dents – in this sample – who consider humanitarian aspects and economic aspectsimportant for their attitude formation process towards refugees is 68 percent (i.e., 95percent minus 27 percent) and 49 percent (i.e., 69 percent minus 20 percent), respec-tively. This finding underscores the conclusion of the main survey that economic as-pects are much less important than humanitarian aspects. In sum, the evidence fromTable 3.7 makes us confident that the direct questions in the main survey experimentgenerally provide accurate information, especially concerning labour market compe-tition and fiscal burden concerns.
3.5 Discussion and Conclusion
We conducted randomized online survey experiments with more than 5,000 univer-sity students in Germany to investigate how beliefs about refugees’ education levela�ect attitudes towards them. We randomly provided information from existing stud-ies on refugees’ education level that strongly shi�ed respondents’ education beliefsin the expected direction. Consistent with the labour market competition model, wefind that beliefs about refugees’ education a�ect labour market competition concerns.In contrast, we find no e�ects on fiscal burden concerns or other specific concernssuch as increasing crime levels. The labour market competition concerns, however,do not translate into general attitudes towards refugees because economic aspectsare rather unimportant for shaping respondents’ attitudes.
Microeconometric Analyses on Determinants of Individual Labour Market Outcomes 89

3 Does the Education Level of Refugees A�ect Natives’ Attitudes?
Our findings have important policy implications. First, the fact that humanitarian as-pects are very important for shaping respondents’ attitudes towards refugees showsthat public opinion is in line with the legal requirements of the Geneva Convention,which stipulates that the decision of granting prosecuted asylum seekers temporaryrefugee status is independent of their characteristics. This result is similar to that ofBansak, Hainmueller and Hangartner (2016) and indicates that policy makers mighthave some leeway to increase public acceptance of refugees by highlighting human-itarian, instead of economic, aspects. Second, while the e�ects of the large refugeeinflow on the labour market and on the government budget remain to be seen, ourfindings suggest that developments in these areas will only have limited impact onpublic attitudes, at least among high-skilled natives.44
We focus on university students as an interesting group of the population since thetwo economic theories on natives’ attitudes towards refugees make opposing predic-tions for how education beliefs a�ect attitudes. Yet, one potential shortcoming of ourstudy is that we focus only on the upper part of the skill distribution, but remain silentabout less educated natives. To put our results into a broader perspective, we com-pare university students with other population groups. To do so, we draw on the 2016wave of the ifo Education Survey, a representative opinion survey on education policyin Germany that contains two questions on beliefs about refugees’ education level.45
Comparing respondents with a vocational degree, university graduates, and univer-sity students reveals that the latter two groups are more optimistic about refugees’education level: While 35 percent of university students and 27 percent of universitygraduates believe that refugees’ education level is “rather high” or “very high”, thisview is shared by only 20 percent of respondents with a vocational degree. Similarly,while 47 percent of university students and 43 percent of university graduates believethat refugees will help to reduce the shortage of skilled labour in Germany, only 33percent of those with a vocational degree hold this belief. This pattern of beliefs, to-gether with the positive relationship between beliefs about refugees’ education leveland general attitudes towards them (see Appendix Table A3.3), is consistent with thefinding that more highly educated natives exhibit more positive attitudes towards im-
44 This result di�ers somewhat from Bansak, Hainmueller and Hangartner (2016), who find that economicconcerns are important in the sense that respondents are more likely to accept asylum seekers if they worked inhigher-skilled occupations in their home country.45 Similar to our survey, one question asked respondents about their beliefs about refugees’ average educationlevel on a four-point scale (from 1=“very low” to 4=“very high”). The second question elicited respondents’ agree-ment with the following statement: “The refugees will help to reduce the skill shortage of the German economy”on a five-point scale (from 1=“completely disagree” to 5=“completely agree”). Note that di�erences in questionwording and the number of answer categories, respectively, hamper a direct comparison of results between theifo Education Survey and our survey. For more information on the ifo Education Survey, see Lergetporer, Wernerand Woessmann (2017).
90 Microeconometric Analyses on Determinants of Individual Labour Market Outcomes

3 Does the Education Level of Refugees A�ect Natives’ Attitudes?
migrants (e.g., d’Hombres and Nunziata, 2016). While this suggests that providing in-formation about refugees’ education level may a�ect natives with di�erent educationbackgrounds very di�erently, Bansak, Hainmueller and Hangartner (2016) find thatthe e�ects of asylum seekers’ attributes on their acceptance is homogeneous with re-spect to respondents education level. In order to investigate the external validity ofour findings, we consider the application of our experimental design to other groupsof the population an interesting avenue for future research. While survey experimentsare certainly subject to some artificiality, we have three reasons for considering thismethod informative and well-suited for answering our research question. First, in or-der to identify the causal e�ect of beliefs about refugees’ education level on attitudeswith naturally occurring data, one would need detailed measures of attitudes as wellas exogenous variation in education beliefs. We are not aware of any data source thatfulfils both requirements. Second, Barabas and Jerit (2010) provide evidence for theexternal validity of survey experiments: They show that the information e�ects in theirsurvey experiment are also present in a natural setting, in which news exposure coversthe same information. Therefore, survey experiments are able to uncover informatione�ects that are also present in a natural environment. Similarly, survey responses onattitudes toward migration have been shown to correspond closely to incentivised,actual political behaviour (see footnote 21). Third, Blinder and Krueger (2004) arguethat public opinion surveys are important for the political process as politicians de-vote enormous resources to assessing public opinion through surveys. In the light ofthe European refugee crisis, much of the political debate has focused on natives’ atti-tudes towards refugees and asylum policies, which are typically measured in opinionsurveys. The present chapter aims at contributing to understanding the underlyingdeterminants that drive public attitudes that may strongly a�ect the political feasibil-ity of asylum policy.
Microeconometric Analyses on Determinants of Individual Labour Market Outcomes 91

3 Does the Education Level of Refugees A�ect Natives’ Attitudes?
Figures and Tables
Figure 3.1 : E�ect of information treatment on beliefs about refugees’ education level
010
2030
40Pe
rcen
t
1 2 3 4 5
Low Skilled treatment Control group
010
2030
40Pe
rcen
t
1 2 3 4 5
High Skilled treatment Control group
Note: Agreement to statement “On average, refugees are well educated.” Answer categories: 1=“completelydisagree”, 2=“somewhat disagree”, 3=“neither agree nor disagree”, 4=“somewhat agree”, and 5=“completelyagree.”
92 Microeconometric Analyses on Determinants of Individual Labour Market Outcomes

3 Does the Education Level of Refugees A�ect Natives’ Attitudes?
Table 3.1 : Comparison of socio-demographic characteristics across control and treatment groups
Mean Di�erence to control group Di�erence
Control group High skilled Low skilledHigh and
Low skilled(1) (2) (3) (4)
UniversityDresden 0.81 -0.00 0.00 -0.00Konstanz 0.09 -0.01 -0.01 0.00Munich 0.08 0.01 0.00 0.01Chemnitz 0.02 0.00 0.01 -0.00
Male 0.54 -0.02 0.03∗ -0.05∗∗∗
Age 24.37 0.11 0.06 0.05Bachelor 0.30 0.02 -0.01 0.03∗
Master 0.20 0.02 0.02∗ -0.01Diploma 0.28 -0.02 -0.01 -0.01PhD 0.09 0.00 0.00 0.00Other study level 0.14 -0.01 -0.00 -0.01Semester 5.63 -0.10 0.02 -0.12Born abroad 0.07 0.02∗∗ 0.00 0.02∗
No parent born abroad 0.86 -0.02 -0.01 -0.01One parent born abroad 0.06 -0.01 0.01 -0.01No parent has college degree 0.37 -0.05∗∗∗ -0.03∗∗ -0.01Receives need-based student aid 0.42 -0.04∗∗ -0.04∗∗ -0.00Not encountered refugees 0.14 -0.00 0.01 -0.02Faculty
Language, Culture 0.12 -0.00 -0.01 0.00Psychology 0.00 0.00 0.00 -0.00Social Sciences and Pedagogy 0.11 -0.00 -0.01 0.00Law 0.02 0.01∗ 0.00 0.01Commercial Information Systems 0.06 -0.00 0.01 -0.01Business and Economics 0.04 0.01 0.01 0.01Maths and Science 0.09 0.01 0.01 0.00Medicine 0.06 0.01 -0.01 0.01Engineering 0.35 -0.01 0.01 -0.02Arts and Music 0.00 -0.00 0.00 -0.00Other faculty 0.13 -0.02∗ -0.02 -0.01
Survey completed 0.89 -0.00 0.00 -0.01Respondents 1,668 1,604 1,629
Notes: Column (1) reports means of the control group. Columns (2) and (3) report the di�erence in meansbetween control group and respective treatment group. Column (4) reports the di�erence in means betweenlow skilled treatment and high skilled treatment group. Significance levels of di�erences come from linearregressions of characteristics on the respective treatment dummies. All statistics refer to the analysis sample,except for the survey completion rates, which refer to the sample before applying sample restrictions; seeSection 3.3.4. Significance levels: ∗ p<0.10, ∗∗ p<0.05, ∗∗∗ p<0.01.
Microeconometric Analyses on Determinants of Individual Labour Market Outcomes 93

3 Does the Education Level of Refugees A�ect Natives’ Attitudes?
Tabl
e3.
2:E
�ect
ofin
form
atio
ntr
eatm
ento
nbe
liefs
abou
tref
ugee
s’ed
ucat
ion
leve
l
Agre
eDi
sagr
eeFi
ve-p
oint
scal
e
(1)
(2)
(3)
(4)
(5)
(6)
Hig
hsk
illed
info
rmat
ion
0.14
4∗∗∗
0.14
0∗∗∗
–0.1
00∗∗∗
–0.1
04∗∗∗
0.30
7∗∗∗
0.31
2∗∗∗
(0.0
15)
(0.0
15)
(0.0
17)
(0.0
16)
(0.0
35)
(0.0
34)
Low
skill
edin
form
atio
n–0
.051∗∗∗
–0.0
48∗∗∗
0.07
8∗∗∗
0.07
1∗∗∗
–0.1
42∗∗∗
–0.1
25∗∗∗
(0.0
13)
(0.0
13)
(0.0
17)
(0.0
17)
(0.0
33)
(0.0
32)
Cova
riate
sN
oYe
sN
oYe
sN
oYe
s
Cont
rolm
ean
0.18
0.18
0.39
0.39
2.67
2.67
Obs
erva
tions
4,83
14,
831
4,83
14,
831
4,83
14,
831
Adj.
R20.
040.
070.
020.
070.
040.
10
Note
s:De
pend
entv
aria
bles
:agr
eem
entt
ost
atem
ent“
On
aver
age,
refu
gees
are
wel
ledu
cate
d”:C
olum
ns(1
)+(2
):bi
nary
varia
ble
(1=“
com
plet
ely
agre
e”or
“som
ewha
tagr
ee”,
0ot
herw
ise)
;Col
umns
(3)+
(4):
bina
ryva
riabl
e(1
=“co
mpl
etel
ydi
sagr
ee”
or“s
omew
hatd
isag
ree”
,0ot
herw
ise)
;Co
lum
ns(5
)+(6
):in
tege
rval
uesf
rom
1to
5(1
=“co
mpl
etel
ydi
sagr
ee”,
2=“s
omew
hatd
isag
ree”
,3=“
neith
erag
ree
nord
isag
ree”
,4=“
som
ewha
tag
ree”
;5=“
com
plet
ely
agre
e”).
Cova
riate
sin
clud
eal
lcha
ract
eris
tics
from
Tabl
e3.
1.Co
ntro
lmea
nis
the
mea
nof
the
indi
cate
dou
tcom
eof
resp
onde
ntsi
nth
eco
ntro
lgro
up.R
obus
tsta
ndar
der
rors
repo
rted
inpa
rent
hese
s.Si
gnifi
canc
ele
vels
:∗p<
0.10
,∗∗
p<0.
05,∗
∗∗p<
0.01
.
94 Microeconometric Analyses on Determinants of Individual Labour Market Outcomes

3 Does the Education Level of Refugees A�ect Natives’ Attitudes?Ta
ble
3.3
:E�e
ctof
info
rmat
ion
trea
tmen
ton
belie
fsab
outr
efug
ees’
educ
atio
nle
vel(
follo
w-u
psu
rvey
)
Agre
eDi
sagr
eeFi
ve-p
oint
scal
e
(1)
(2)
(3)
(4)
(5)
(6)
Info
rmat
ion
trea
tmen
t0.
284∗
∗∗0.
295∗
∗∗–0
.193
∗∗∗
–0.2
04∗∗
∗0.
597∗
∗∗0.
619∗
∗∗
(0.0
37)
(0.0
37)
(0.0
40)
(0.0
39)
(0.0
81)
(0.0
80)
Cova
riate
sN
oYe
sN
oYe
sN
oYe
s
Cont
rolm
ean
0.17
0.17
0.45
0.45
2.62
2.62
Obs
erva
tions
555
555
555
555
555
555
Adj.
R20.
090.
130.
040.
080.
090.
14
Not
es:D
epen
dent
varia
bles
:agr
eem
entt
ost
atem
ent“
On
aver
age,
refu
gees
are
wel
ledu
cate
d”:C
olum
ns(1
)+(2
):bi
nary
varia
ble
(1="
com
plet
ely
agre
e"or
"som
ewha
tagr
ee",
0ot
herw
ise)
;Col
umns
(3)+
(4):
bina
ryva
riabl
e(1
="co
mpl
etel
ydi
sagr
ee"
or“s
omew
hat
disa
gree
”,0
othe
rwis
e);C
olum
ns(5
)+(6
):in
tege
rval
uesf
rom
1to
5(1
=“co
mpl
etel
ydi
sagr
ee”,
2=“s
omew
hatd
isag
ree”
,3=“
neith
erag
ree
nord
isag
ree”
,4=“
som
ewha
tagr
ee”;
5=“c
ompl
etel
yag
ree”
).In
form
atio
ntr
eatm
enti
ndic
ates
whe
ther
the
resp
onde
ntw
asas
sign
edto
the
info
rmat
ion
trea
tmen
tgro
up(=
1)or
toth
eco
ntro
lgro
up(=
0).C
ovar
iate
sinc
lude
allc
hara
cter
istic
sfro
mTa
ble
A3.2
.Con
trol
mea
nis
the
mea
nof
the
indi
cate
dou
tcom
eof
resp
onde
ntsi
nth
eco
ntro
lgro
up.R
obus
tsta
ndar
der
rors
repo
rted
inpa
rent
hese
s.Si
gnifi
canc
ele
vels
:∗p<
0.10
,∗∗
p<0.
05,∗
∗∗p<
0.01
.
Microeconometric Analyses on Determinants of Individual Labour Market Outcomes 95

3 Does the Education Level of Refugees A�ect Natives’ Attitudes?
Tabl
e3.
4:E
�ect
ofbe
liefs
abou
tref
ugee
s’ed
ucat
ion
leve
lon
labo
urm
arke
tand
fisca
lbur
den
conc
erns
Labo
urm
arke
tcon
cern
sFi
scal
burd
enco
ncer
ns
Inde
xIn
crea
seco
mpe
titio
nfo
rme
Incr
ease
com
petit
ion
inge
nera
lIn
dex
Mor
ere
venu
esth
anco
sts
Pay
mor
eta
xes
Less
gov’
tbe
nefit
s(1
)(2
)(3
)(4
)(5
)(6
)(7
)Re
fuge
esar
ew
ell
0.26
7∗∗∗
0.04
1∗∗
0.09
6∗∗∗
–0.0
080.
035
0.00
70.
015
educ
ated
onav
erag
e(0
.069
)(0
.017
)(0
.036
)(0
.064
)(0
.035
)(0
.035
)(0
.026
)Co
ntro
lmea
n-0
.01
0.04
0.26
-0.0
20.
300.
240.
11In
stru
men
tFst
atis
tic85
.985
.985
.985
.985
.985
.985
.9Re
spon
dent
s4,
818
4,81
84,
818
4,81
84,
818
4,81
84,
818
Note
s:De
pend
entv
aria
bles
:Col
umn
(1):
inde
xof
labo
urm
arke
tcon
cern
s,co
nsis
ting
ofth
etw
oin
dica
tors
inCo
lum
ns(2
)and
(3).
Colu
mn
(4):
inde
xof
fisca
lbur
den
conc
erns
,con
sist
ing
ofth
eth
ree
indi
cato
rsin
Colu
mns
(5)t
o(7
).Co
lum
ns(2
),(3
),(5
),(6
),an
d(7
):du
mm
yva
riabl
esw
hich
expr
essa
gree
men
twith
the
resp
ectiv
est
atem
ent(
1=“c
ompl
etel
yag
ree”
or“s
omew
hat
agre
e”,0
othe
rwis
e).S
eeAp
pend
ixTa
ble
A3.1
8fo
rthe
wor
ding
ofal
lsur
vey
ques
tions
and
Sect
ion
3.3.
1fo
rthe
cons
truc
tion
ofth
esu
mm
ary
indi
ces.
Allr
egre
ssio
nsin
clud
eth
ech
arac
teris
tics
repo
rted
inTa
ble
3.1.
Robu
stst
anda
rder
rors
repo
rted
inpa
rent
hese
s.Si
gnifi
canc
ele
vels
:∗p<
0.10
,∗∗
p<0.
05,∗
∗∗p<
0.01
.
96 Microeconometric Analyses on Determinants of Individual Labour Market Outcomes

3 Does the Education Level of Refugees A�ect Natives’ Attitudes?
Table 3.5 : E�ect of beliefs about refugees’ education level on general attitudes
Index Admit more #Refugees admitted Allowed to stayrefugees in future last year permanently
(1) (2) (3) (4)
Beliefs about education –0.043 –0.011 0.004 –0.007
(0.071) (0.035) (0.032) (0.037)
Control mean 0.02 0.31 0.22 0.65
Instrument F statistic 86.2 86.0 85.3 86.2
Respondents 4,830 4,805 4,810 4,829
Notes: Results from two-stage least-squares regressions. In the first stage, beliefs about refugees’ educationlevel are instrumented with the two binary indicators high skilled information and low skilled information (forfirst-stage results, see Table 3.2). Dependent variables: Column (1): index of general attitudes, consisting of thethree indicators in Columns (2), (3) and (4). Columns (2)-(4): dummy variables which express agreement with therespective statement (1=“completely agree” or “somewhat agree”, 0 otherwise). See Appendix Table A3.18 forthe wording of all survey questions and Section 3.3.1 for the construction of the summary index. All regressionsinclude the characteristics reported in Table 3.1. Robust standard errors reported in parentheses. Significancelevels: ∗ p<0.10, ∗∗ p<0.05, ∗∗∗ p<0.01.
Microeconometric Analyses on Determinants of Individual Labour Market Outcomes 97

3 Does the Education Level of Refugees A�ect Natives’ Attitudes?
Tabl
e3.
6:E
�ect
ofbe
liefs
abou
tref
ugee
s’ed
ucat
ion
leve
lon
opin
ion
form
atio
nas
pect
s
Refu
gees
’will
ingn
esst
oin
tegr
ate
Hum
anita
rian
aspe
cts
Pers
onal
expe
rienc
ew
/ref
ugee
s
Impo
rtan
tU
nim
port
ant
Impo
rtan
tU
nim
port
ant
Impo
rtan
tU
nim
port
ant
(1)
(2)
(3)
(4)
(5)
(6)
Refu
gees
are
wel
l0.
005
–0.0
06–0
.022
0.00
70.
019
–0.0
02
educ
ated
onav
erag
e(0
.025
)(0
.016
)(0
.028
)(0
.019
)(0
.034
)(0
.024
)
Cont
rolm
ean
0.88
0.04
0.86
0.06
0.70
0.12
Inst
rum
entF
stat
istic
86.1
86.1
86.7
86.7
86.1
86.1
Resp
onde
nts
4,83
14,
831
4,83
04,
830
4,83
14,
831
Refu
gees
’crim
inal
beha
viou
rRe
ligio
n/cu
lture
ofre
fuge
esEc
onom
icas
pect
s
Impo
rtan
tU
nim
port
ant
Impo
rtan
tU
nim
port
ant
Impo
rtan
tU
nim
port
ant
(1)
(2)
(3)
(4)
(5)
(6)
Refu
gees
are
wel
l0.
022
–0.0
400.
070∗
–0.0
590.
051
–0.1
07∗∗
∗
educ
ated
onav
erag
e(0
.039
)(0
.034
)(0
.040
)(0
.038
)(0
.039
)(0
.038
)
Cont
rolm
ean
0.54
0.26
0.45
0.37
0.39
0.37
Inst
rum
entF
stat
istic
86.2
86.2
86.1
86.1
86.2
86.2
Resp
onde
nts
4,83
04,
830
4,83
14,
831
4,82
84,
828
Not
es:R
esul
tsfr
omtw
o-st
age
leas
t-sq
uare
sre
gres
sion
s.In
the
first
stag
e,be
liefs
abou
tref
ugee
s’ed
ucat
ion
leve
lare
inst
rum
ente
dw
ithth
etw
obi
nary
indi
cato
rshi
ghsk
illed
info
rmat
ion
and
low
skill
edin
form
atio
n(fo
rfirs
t-st
age
resu
lts,s
eeTa
ble
3.2)
.Dep
ende
ntva
riabl
es:i
mpo
rtan
ceof
vario
usas
pect
sfor
resp
onde
nts’
opin
ion
form
atio
npr
oces
stow
ard
refu
gees
;res
pond
ents
rate
dea
chas
pect
ona
five-
poin
tsca
le:v
ery
impo
rtan
t,so
mew
hati
mpo
rtan
t,ne
ither
impo
rtan
tnor
unim
port
ant,
som
ewha
tuni
mpo
rtan
t,an
dve
ryun
impo
rtan
t.Im
port
ante
qual
s1fo
r“ve
ryim
port
ant”
or“s
omew
hati
mpo
rtan
t”,0o
ther
wis
e;un
impo
rtan
tequ
als1
for“
very
unim
port
ant”
or“s
omew
hatu
nim
port
ant”,
0ot
herw
ise.
Allr
egre
ssio
nsin
clud
eth
ech
arac
teris
ticsr
epor
ted
inTa
ble
3.1.
Cont
rolm
ean
isth
em
ean
ofth
ein
dica
ted
outc
ome
ofre
spon
dent
sin
the
cont
rolg
roup
.See
Appe
ndix
Tabl
eA3
.18
fort
hew
ordi
ngof
alls
urve
yqu
estio
ns.R
obus
tst
anda
rder
rors
repo
rted
inpa
rent
hese
s.Si
gnifi
canc
ele
vels
:∗p<
0.10
,∗∗
p<0.
05,∗
∗∗p<
0.01
.
98 Microeconometric Analyses on Determinants of Individual Labour Market Outcomes

3 Does the Education Level of Refugees A�ect Natives’ Attitudes?Ta
ble
3.7
:E�e
ctof
veile
dre
spon
setr
eatm
ent(
follo
w-u
psu
rvey
)
Incr
ease
com
petit
ion
form
e
Incr
ease
com
petit
ion
inge
nera
l
Mor
ere
venu
esth
anco
sts
Hum
anita
rian
aspe
cts
Econ
omic
aspe
cts
Lapt
opus
age
(1)
(2)
(3)
(4)
(5)
(6)
Veile
dtr
eatm
ent
–0.0
45–0
.045
–0.1
13–0
.270
∗∗∗
–0.2
06∗∗
∗–0
.112
(0.0
76)
(0.0
76)
(0.0
81)
(0.0
94)
(0.0
75)
(0.0
90)
Cova
riate
sYe
sYe
sYe
sYe
sYe
sYe
sM
ean
(dire
ctre
spon
se)
0.06
0.44
0.38
0.95
0.69
0.42
Obs
erva
tions
554
554
553
554
555
555
Adj.
R20.
130.
130.
070.
070.
030.
05
Note
s:De
pend
entv
aria
bles
:agr
eem
entt
oth
est
atem
ents
indi
cate
din
the
top
row
(onl
ytw
oan
swer
cate
gorie
s:ag
ree
ordi
sagr
ee).
Veile
deq
uals
1if
resp
onde
ntha
sbee
nas
sign
edto
veile
dre
spon
segr
oup
and
0if
assi
gned
todi
rect
resp
onse
grou
p.Th
edi
rect
resp
onse
grou
pis
dire
ctly
aske
dw
heth
erth
eyag
ree
with
ase
nsiti
veite
m.R
espo
nden
tsin
the
veile
dre
spon
segr
oup,
repo
rton
how
man
yof
N+1
item
s(w
hich
incl
ude
the
sens
itive
item
and
Not
heri
tem
s)th
eyag
ree
with
.M
ean
(dire
ctre
spon
se)i
sthe
mea
nof
the
outc
ome
ofre
spon
dent
sin
the
dire
ctre
spon
segr
oup.
Cova
riate
sinc
lude
all
char
acte
ristic
sfro
mAp
pend
ixTa
ble
A3.2
.Rob
usts
tand
ard
erro
rsre
port
edin
pare
nthe
ses.
Sign
ifica
nce
leve
ls:∗
p<0.
10,
∗∗p<
0.05
,∗∗∗
p<0.
01.
Microeconometric Analyses on Determinants of Individual Labour Market Outcomes 99

3 Does the Education Level of Refugees A�ect Natives’ Attitudes?
Appendix
Appendix A3.1 Appendix Tables and Figures
Figure A3.1 : Graphical depiction used in information treatment in follow-up survey
32 %29 %
13 %
21 %
0
10
20
30
40
50
60
Refugees German population Refugees German population
Perc
ent
Educational degrees of refugeesand of the German population
High school degree University degree
Notes: This figure shows the graphical depiction used in the information treatment in the follow-up survey,which was provided (in German) to participants in addition to written information; see Section 3.2. The originalGerman labels in the graph were: “Weiterführender Schulabschluss ” (high school degree) and “Universitäts-oder anderer Hochschulabschluss” (university degree).
100 Microeconometric Analyses on Determinants of Individual Labour Market Outcomes

3 Does the Education Level of Refugees A�ect Natives’ Attitudes?
Figure A3.2 : General attitudes toward refugees
05
1015
2025
in %
a lot fewer many more
Admit more refugees in future
010
2030
40
in %
far too many far too few
#Refugees admitted last year
010
2030
40
in %
strongly oppose strongly favor
Allowed to stay permanently
Notes: Figure shows distribution of answers to the general attitude questions, measured on a five-point scale.Figures are based on respondents in control group only.
Microeconometric Analyses on Determinants of Individual Labour Market Outcomes 101

3 Does the Education Level of Refugees A�ect Natives’ Attitudes?
Tabl
eA3
.1:C
ompa
rison
ofsa
mpl
ech
arac
teris
ticst
oun
iver
sity
stud
entp
opul
atio
ns
Uni
vers
ityof
Mun
ich
Tech
nica
lUni
vers
ityDr
esde
nAd
min
Data
Our
Sam
ple
Adm
inDa
taO
urSa
mpl
eFe
mal
e59
.9%
62.6
%Fe
mal
e42
.4%
44.1
%N
on-G
erm
an16
.2%
8.7%
Non
-Ger
man
13.1
%8.
1%Fa
culty
Facu
ltyCa
thol
icTh
eolo
gy1.
6%1.
9%M
athe
mat
icsa
ndSc
ienc
e11
.7%
10.0
%Pr
otes
tant
Theo
logy
1.5%
0.9%
Educ
atio
nan
dPe
dago
gy11
.5%
7.9%
Law
8.9%
6.6%
Law
2.8%
3.0%
Busi
ness
Adm
inis
trat
ion
5.5%
3.8%
Philo
soph
y6.
1%10
.7%
Econ
omic
s2.
3%3.
8%Li
ngui
stic
sand
Lite
ratu
re2.
8%4.
4%M
edic
ine
12.6
%12
.0%
Econ
omic
sand
Busi
ness
7.8%
6.2%
Vete
rinar
y3.
6%4.
3%El
ectr
ical
and
Com
pute
rEng
inee
ring
7.3%
6.1%
His
tory
and
ArtH
isto
ry4.
2%4.
7%Co
mpu
terS
cien
ce5.
1%5.
9%
Philo
soph
y2.
2%2.
4%M
echa
nica
lSci
ence
and
Engi
neer
ing
17.1
%15
.9%
Psyc
holo
gyan
dPe
dago
gy6.
4%9.
9%Ar
chite
ctur
e3.
2%2.
0%Cu
ltura
lStu
dies
5.9%
3.8%
Civi
lEng
inee
ring
5.2%
4.9%
Ling
uist
icsa
ndLi
tera
ture
15.5
%15
.8%
Envi
ronm
enta
lSci
ence
s6.
9%7.
0%
Soci
alSc
ienc
es4.
9%7.
6%Tr
ansp
orta
tion
and
Tra�
icSc
ienc
e4.
1%8.
9%
Mat
hem
atic
s,Co
mpu
terS
tudi
esan
dSt
atis
tics
9.2%
9.9%
Med
icin
e8.
5%7.
1%
Phys
ics
4.8%
4.5%
Chem
istr
yan
dPh
arm
acy
4.3%
2.8%
Biol
ogy
3.9%
2.8%
Geol
ogy
2.7%
2.6%
Note
s:Th
ead
min
istr
ativ
eda
tare
fert
oth
esu
mm
erte
rm20
16fo
rthe
Uni
vers
ityof
Mun
ich
and
toth
ew
inte
rter
m20
15/2
016
fort
heTe
chni
cal
Uni
vers
ityDr
esde
n.Fo
rthe
Uni
vers
ityof
Kons
tanz
(Uni
vers
ityof
Chem
nitz
),w
eon
lyha
dac
cess
toth
efa
culti
esof
“Bus
ines
sAdm
inis
trat
ion
and
Econ
omic
s”an
d“P
oliti
calS
cien
ce”(
“Bus
ines
sAdm
inis
trat
ion
and
Econ
omic
s”)a
ndth
eref
ore
cann
otco
mpa
refa
culty
com
posi
tions
.How
ever
,th
esh
are
offe
mal
esin
ours
ampl
eal
som
atch
the
adm
inis
trat
ive
reco
rdso
fthe
setw
oun
iver
sitie
s.
102 Microeconometric Analyses on Determinants of Individual Labour Market Outcomes

3 Does the Education Level of Refugees A�ect Natives’ Attitudes?
Table A3.2 : Comparison of socio-demographic characteristics across control and treatment group(follow-up survey)
Mean Di�erence between control groupControl group and information treatment
(1) (2)Ingolstadt 0.07 -0.01Munich 0.59 0.02Konstanz 0.21 0.01Chemnitz 0.13 -0.03Male 0.41 0.06Age 25.53 -0.85Bachelor 0.49 -0.00Master 0.24 -0.00PhD 0.09 0.01Other study level 0.18 0.00Semester 4.84 -0.19Born abroad 0.09 -0.02Mother born abroad 0.17 -0.03Father born abroad 0.18 -0.03No parent has college degree 0.38 0.05Government aid 0.26 -0.01Spoken to refugees 0.62 0.03Language, Culture 0.10 0.04Psychology 0.03 -0.01Social Sciences and Pedagogy 0.10 0.02Law 0.03 0.00Commercial Information Systems 0.09 -0.01Business and Economics 0.27 0.02Maths and Science 0.18 0.02Medicine 0.11 -0.06∗∗
Engineering 0.00 -0.00Arts and Music 0.04 0.00Other faculty 0.06 -0.02Participated in both waves 0.52 -0.03Veiled 0.49 0.01Respondents 293 289
Notes: Column (1) reports means of the control group. Column (2) reports the di�erence between control groupand information treatment group. Statistical significance is based on linear regressions of characteristic oninformation treatment dummy. Significance levels: ∗ p<0.10, ∗∗ p<0.05, ∗∗∗ p<0.01.
Microeconometric Analyses on Determinants of Individual Labour Market Outcomes 103

3 Does the Education Level of Refugees A�ect Natives’ Attitudes?
Table A3.3 : Correlations between beliefs about refugees’ education level and general attitudes
Bivariate correlations with beliefs about refugees’ education level:
Attitudes index 0.593∗∗∗
Germany should admit more refugees in future 0.524∗∗∗
Number of refugees Germany admitted last year 0.506∗∗∗
Refugees should be allowed to stay in Germany permanently 0.571∗∗∗
Notes: Correlations between beliefs about refugees’ education level and general attitudes toward refugees.Correlations are based on control group only. Attitude index is based on the three indicators in rows 2, 3 and 4.See Appendix Table A3.18 for the wording of all survey questions and Section 3.3.1 for the construction of thesummary index. Significance levels: ∗ p<0.10, ∗∗ p<0.05, ∗∗∗ p<0.01.
104 Microeconometric Analyses on Determinants of Individual Labour Market Outcomes

3 Does the Education Level of Refugees A�ect Natives’ Attitudes?Ta
ble
A3.4
:Rel
atio
nshi
pbe
twee
nge
nera
latt
itude
stow
ard
refu
gees
and
soci
o-de
mog
raph
icch
arac
teris
tics
Adm
itm
ore
Too
few
Allo
wAt
titud
ein
dex
refu
gees
infu
ture
refu
gees
last
year
perm
anen
tsta
y(1
)(2
)(3
)(4
)M
ale
–0.1
72∗∗
∗–0
.029
–0.0
14–0
.082
∗∗∗
(0.0
46)
(0.0
25)
(0.0
22)
(0.0
24)
Age
–0.0
16∗∗
0.00
30.
004
–0.0
12∗∗
∗
(0.0
07)
(0.0
04)
(0.0
03)
(0.0
04)
Born
abro
ad–0
.212
∗–0
.002
0.01
7–0
.174
∗∗∗
(0.1
19)
(0.0
57)
(0.0
51)
(0.0
63)
Atle
asto
nepa
rent
born
abro
ad–0
.077
–0.0
40–0
.043
–0.0
26(0
.079
)(0
.043
)(0
.038
)(0
.045
)At
leas
tone
pare
ntw
/col
lege
degr
ee0.
033
0.02
20.
035
0.02
8(0
.047
)(0
.025
)(0
.022
)(0
.025
)Sp
oken
tore
fuge
es0.
307∗
∗∗0.
196∗
∗∗0.
155∗
∗∗0.
132∗
∗∗
(0.0
60)
(0.0
32)
(0.0
28)
(0.0
36)
Seen
refu
gees
–0.0
170.
059∗
0.03
8–0
.011
(0.0
62)
(0.0
32)
(0.0
28)
(0.0
38)
Nee
d-ba
sed
stud
enta
id0.
109∗
∗0.
002
0.00
60.
065∗
∗∗
(0.0
47)
(0.0
25)
(0.0
22)
(0.0
25)
Fiel
dof
stud
yan
dde
gree
indi
cato
rsYe
sYe
sYe
sYe
sU
nive
rsity
indi
cato
rsYe
sYe
sYe
sYe
sO
bser
vatio
ns1,
646
1,63
61,
641
1,64
5Ad
j.R2
0.06
0.03
0.03
0.06
Note
s:De
pend
entv
aria
bles
:Col
umn
(1):
inde
xof
gene
rala
ttitu
des,
cons
istin
gof
the
thre
ein
dica
tors
inCo
lum
ns(2
),(3
)and
(4).
Colu
mns
(2)-(
4):d
umm
yva
riabl
esw
hich
expr
essa
gree
men
twith
the
resp
ectiv
est
atem
ent(
1=“c
ompl
etel
yag
ree”
or“s
omew
hat
agre
e”,0
othe
rwis
e).S
eeAp
pend
ixTa
ble
A3.1
8fo
rthe
wor
ding
ofal
lsur
vey
ques
tions
and
Sect
ion
3.3.
1fo
rthe
cons
truc
tion
ofth
esu
mm
ary
inde
x.In
clud
eson
lyre
spon
dent
sfr
omth
eco
ntro
lgro
up.R
obus
tsta
ndar
der
rors
repo
rted
inpa
rent
hese
s.Si
gnifi
canc
ele
vels
:∗p<
0.10
,∗∗
p<0.
05,∗
∗∗p<
0.01
.
Microeconometric Analyses on Determinants of Individual Labour Market Outcomes 105

3 Does the Education Level of Refugees A�ect Natives’ Attitudes?
Table A3.5 : Relationship between beliefs about refugees’ education level and respondents’ socio-demographiccharacteristics
Agree Disagree Five-point scale(1) (2) (3)
Male –0.120∗∗∗ 0.156∗∗∗ –0.392∗∗∗
(0.021) (0.025) (0.049)Age –0.011∗∗∗ 0.013∗∗∗ –0.030∗∗∗
(0.003) (0.004) (0.007)Born abroad –0.017 0.150∗∗ –0.248∗∗
(0.046) (0.064) (0.120)At least one parent born abroad –0.012 0.014 –0.019
(0.034) (0.047) (0.084)At least one parent w/ college degree 0.004 0.013 –0.030
(0.021) (0.026) (0.050)Spoken to refugees 0.060∗∗ 0.005 0.030
(0.028) (0.036) (0.067)Seen refugees 0.017 0.045 –0.090
(0.028) (0.038) (0.070)Need-based student aid 0.010 –0.064∗∗ 0.099∗∗
(0.021) (0.026) (0.049)Field of study and degree indicators Yes Yes YesUniversity indicators Yes Yes YesObservations 1,638 1,638 1,638Adj. R2 0.04 0.05 0.07
Notes: Dependent variables: agreement to statement “On average, refugees are well educated”:Column (1): binary variable (1=“completely agree” or “somewhat agree”, 0 otherwise); Column(2): binary variable (1=“completely disagree” or “somewhat disagree”, 0 otherwise); Column (3):integer values from 1 to 5 (1=“completely disagree”, 2=“somewhat disagree”, 3=“neither agreenor disagree”, 4=“somewhat agree”; 5=“completely agree”). See Appendix Table A3.18 for exactwording of outcome. Estimations based on control group only. Robust standard errors reportedin parentheses. Significance levels: ∗ p<0.10, ∗∗ p<0.05, ∗∗∗ p<0.01.
106 Microeconometric Analyses on Determinants of Individual Labour Market Outcomes

3 Does the Education Level of Refugees A�ect Natives’ Attitudes?
Table A3.6 : Characterizing compliers with the treatments on beliefs about refugees’ education level
Five-point Five-pointAgree Disagree scale Agree Disagree scale
(1) (2) (3) (4) (5) (6)High skilled information 0.060 –0.036 0.098
(0.117) (0.131) (0.274)x_male 0.014 –0.029 0.064 0.054∗∗ –0.009 0.072
(0.032) (0.034) (0.072) (0.027) (0.036) (0.067)x_age 0.003 –0.004 0.009 0.010∗∗∗ –0.010∗ 0.017∗
(0.005) (0.005) (0.011) (0.004) (0.005) (0.010)x_born_abroad 0.040 –0.144∗ 0.268 –0.001 0.002 –0.079
(0.072) (0.087) (0.180) (0.058) (0.089) (0.165)x_atleastoneparentforeign –0.044 0.091 –0.222∗ –0.006 –0.039 0.034
(0.056) (0.066) (0.132) (0.044) (0.065) (0.113)x_parentuniversity 0.006 0.016 –0.023 0.018 –0.011 0.045
(0.033) (0.036) (0.075) (0.028) (0.037) (0.069)x_spoketorefugee 0.048 0.001 0.084 0.001 –0.055 0.081
(0.044) (0.050) (0.099) (0.036) (0.050) (0.090)x_metrefugeepers 0.007 –0.013 0.030 –0.017 –0.027 0.040
(0.045) (0.053) (0.103) (0.037) (0.053) (0.095)x_bafoeg 0.001 0.034 –0.067 0.025 0.000 0.071
(0.033) (0.036) (0.075) (0.027) (0.036) (0.068)x_master –0.015 –0.005 0.011 –0.032 –0.006 –0.032
(0.045) (0.050) (0.103) (0.037) (0.052) (0.095)x_diplom –0.085∗∗ 0.069 –0.180∗ 0.006 0.011 –0.027
(0.040) (0.046) (0.095) (0.035) (0.047) (0.090)x_promotion 0.001 0.023 –0.023 –0.047 0.050 –0.022
(0.061) (0.070) (0.148) (0.051) (0.074) (0.133)x_other –0.024 –0.018 0.011 –0.010 –0.040 0.081
(0.053) (0.053) (0.115) (0.044) (0.056) (0.105)Male –0.117∗∗∗ 0.157∗∗∗ –0.386∗∗∗ –0.121∗∗∗ 0.158∗∗∗ –0.395∗∗∗
(0.020) (0.025) (0.048) (0.020) (0.025) (0.048)Age –0.011∗∗∗ 0.013∗∗∗ –0.030∗∗∗ –0.011∗∗∗ 0.013∗∗∗ –0.030∗∗∗
(0.003) (0.004) (0.007) (0.003) (0.004) (0.007)Born abroad –0.020 0.148∗∗ –0.249∗∗ –0.014 0.152∗∗ –0.256∗∗
(0.046) (0.064) (0.119) (0.046) (0.064) (0.119)At least one parent born abroad –0.015 0.018 –0.025 –0.017 0.008 –0.014
(0.034) (0.047) (0.083) (0.034) (0.047) (0.083)At least one parent w/ college degree 0.004 0.014 –0.032 0.003 0.014 –0.032
(0.021) (0.026) (0.049) (0.021) (0.026) (0.049)Spoken to refugees 0.060∗∗ 0.010 0.024 0.055∗∗ 0.005 0.022
(0.028) (0.036) (0.067) (0.028) (0.035) (0.067)Seen refugees 0.018 0.048 –0.090 0.012 0.047 –0.101
(0.028) (0.038) (0.070) (0.028) (0.037) (0.070)Need-based student aid 0.015 –0.069∗∗∗ 0.114∗∗ 0.010 –0.066∗∗∗ 0.106∗∗
(0.020) (0.025) (0.049) (0.020) (0.025) (0.049)Master 0.016 –0.036 0.035 0.009 –0.037 0.030
(0.028) (0.037) (0.069) (0.028) (0.037) (0.069)Diploma 0.005 –0.026 0.016 0.001 –0.015 0.006
(0.027) (0.035) (0.068) (0.027) (0.035) (0.067)PhD 0.028 –0.117∗∗ 0.183∗ 0.029 –0.103∗∗ 0.178∗
(0.039) (0.052) (0.098) (0.038) (0.052) (0.098)Other study level 0.002 –0.046 0.044 0.005 –0.070∗ 0.090
(0.035) (0.042) (0.084) (0.035) (0.042) (0.083)Low skilled information –0.320∗∗∗ 0.358∗∗∗ –0.679∗∗∗
(0.097) (0.137) (0.253)University*faculty FEs Yes Yes Yes Yes Yes YesObservations 3,227 3,227 3,227 3,242 3,242 3,242Adj. R2 0.06 0.05 0.08 0.03 0.06 0.08
Notes: Dependent variables: agreement to statement “On average, refugees are well educated”: Columns (1)+(4): binary variable(1=“completely agree” or “somewhat agree”, 0 otherwise); Columns (2)+(5): binary variable (1=“completely disagree” or “somewhatdisagree”, 0 otherwise); Columns (3)+(6): integer values from 1 to 5 (1=“completely disagree”, 2=“somewhat disagree”, 3=“neither agreenor disagree”, 4=“somewhat agree”; 5=“completely agree”). Variables starting with “x_” are the respective treatment interactions withthe indicated covariates (High Skilled in columns 1-3 and Low Skilled in columns 4-6). Robust standard errors reported in parentheses.Significance levels: ∗ p<0.10, ∗∗ p<0.05, ∗∗∗ p<0.01.
Microeconometric Analyses on Determinants of Individual Labour Market Outcomes 107

3 Does the Education Level of Refugees A�ect Natives’ Attitudes?
Table A3.7 : Persistence of information treatment e�ects on beliefs about refugees’ education level (follow-upsurvey)
Agree Disagree Five-point scale(1) (2) (3)
Information treatment 0.357∗∗∗ –0.276∗∗∗ 0.770∗∗∗
(0.052) (0.053) (0.105)Re-survey 0.043∗ –0.057∗ 0.106∗∗
(0.023) (0.032) (0.046)Information treatment * re-survey –0.143∗∗∗ 0.114∗∗∗ –0.292∗∗∗
(0.048) (0.042) (0.075)Covariates Yes Yes YesControl mean 0.16 0.44 2.66Information treatment e�ect in re-survey 0.214∗∗∗ -0.162∗∗∗ 0.478∗∗∗
( 0.054) ( 0.054) ( 0.103)Observations (respondents) 281 281 281Adj. R2 0.15 0.13 0.19
Notes: Dependent variables: agreement to statement "On average, refugees are well educated." Column (1):binary variable (1="completely agree" or "somewhat agree", 0 otherwise); Column (2): binary variable (1="com-pletely disagree" or "somewhat disagree", 0 otherwise); Column (3): integer values from 1 to 5 (1="completelydisagree", 2="somewhat disagree", 3="neither agree nor disagree", 4="somewhat agree"; 5="completelyagree"). Information treatment e�ect in re-survey is the linear combination of the coe�icients on Informationtreatment plus Information treatment * re-survey. Covariates include all characteristics from Appendix Ta-ble A3.2. Regressions only include respondents who participated in the follow-up survey and in the re-surveyabout one week later; see Section 3.2. Robust standard errors, adjusted for clustering at the respondent level,in parentheses. Significance levels: ∗ p<0.10, ∗∗ p<0.05, ∗∗∗ p<0.01.
108 Microeconometric Analyses on Determinants of Individual Labour Market Outcomes

3 Does the Education Level of Refugees A�ect Natives’ Attitudes?Ta
ble
A3.8
:Per
sist
ence
ofin
form
atio
ntr
eatm
ente
�ect
son
belie
fs(fo
llow
-up
surv
ey)
Estim
ates
high
scho
olde
gree
Estim
ates
univ
ersi
tyde
gree
Conf
iden
ceO
utco
me
Raw
Abs.
devi
atio
nW
ithin
5pp
Raw
Abs.
devi
atio
nW
ithin
5pp
7-po
ints
cale
(1)
(2)
(3)
(4)
(5)
(6)
(7)
Info
rmat
ion
trea
tmen
t9.
260∗∗∗
–4.8
09∗∗∗
0.30
1∗∗∗
3.57
2∗∗∗
0.43
30.
082
0.93
4∗∗∗
(1.6
05)
(1.1
20)
(0.0
54)
(1.1
14)
(0.8
66)
(0.0
63)
(0.1
60)
Cova
riate
sYe
sYe
sYe
sYe
sYe
sYe
sYe
sCo
ntro
lmea
n21
.34
14.0
10.
1713
.64
6.46
0.50
3.13
Obs
erva
tions
281
281
281
281
281
281
281
Adj.
R20.
100.
050.
110.
02–0
.06
–0.0
20.
11No
tes:
Depe
nden
tvar
iabl
es:C
olum
ns(1
)-(3)
:res
pond
ents
’est
imat
esof
the
shar
eof
refu
gees
inGe
rman
yw
hoho
lda
high
scho
olde
gree
;Col
.(1)
:raw
estim
ate
(inpe
rcen
t);C
ol.(
2):a
bsol
ute
devi
atio
nof
estim
ate
from
the
resp
ectiv
eva
lue
prov
ided
inth
ein
form
atio
ntr
eatm
enti
nth
esu
rvey
one
wee
kbe
fore
;Col
.(3)
:dum
my
varia
ble
indi
catin
gth
ates
timat
eis
with
in5
perc
enta
gepo
ints
from
the
resp
ectiv
eva
lue
prov
ided
inth
esu
rvey
one
wee
kbe
fore
.Co
lum
ns(4
)-(6)
:res
pond
ents
’est
imat
esof
the
shar
eof
refu
gees
inGe
rman
yw
hoha
vea
univ
ersi
tyde
gree
;Col
.(4)
:raw
estim
ate
(inpe
rcen
t);C
ol.
(5):
abso
lute
devi
atio
nof
estim
ate
from
the
resp
ectiv
eva
lue
prov
ided
inth
ein
form
atio
ntr
eatm
enti
nth
esu
rvey
one
wee
kbe
fore
;Col
.(6)
:dum
my
varia
ble
indi
catin
gth
ates
timat
eis
with
in5
perc
enta
gepo
ints
from
the
resp
ectiv
eva
lue
prov
ided
inth
esu
rvey
one
wee
kbe
fore
.Col
umn
7:re
spon
dent
s’co
nfid
ence
(on
ase
ven-
poin
tsca
le)t
hatt
heir
estim
ates
are
corr
ect.
Cova
riate
sinc
lude
allc
hara
cter
istic
sfro
mAp
pend
ixTa
ble
A3.2
.Con
trol
mea
nis
the
mea
nof
the
indi
cate
dou
tcom
eof
resp
onde
ntsi
nth
eco
ntro
lgro
up.I
nclu
deso
nly
resp
onde
ntsw
hopa
rtic
ipat
edin
the
follo
w-u
psu
rvey
and
inth
ere
-sur
vey
abou
tone
wee
kla
ter;
see
Sect
ion
3.2.
Robu
stst
anda
rder
rors
,adj
uste
dfo
rclu
ster
ing
atth
ere
spon
dent
leve
l,in
pare
nthe
ses.
Sign
ifica
nce
leve
ls:∗
p<0.
10,∗
∗p<
0.05
,∗∗∗
p<0.
01.
Microeconometric Analyses on Determinants of Individual Labour Market Outcomes 109

3 Does the Education Level of Refugees A�ect Natives’ Attitudes?
Table A3.9 : E�ect of information treatment on participation in re-survey
(1) (2)Information treatment –0.033 –0.328
(0.041) (0.374)Munich 0.391∗∗∗ 0.251
(0.111) (0.169)Chemnitz –0.104 –0.250
(0.146) (0.217)Konstanz 0.190∗∗ 0.274∗∗
(0.092) (0.133)Male –0.016 –0.016
(0.044) (0.067)Age –0.007∗∗ –0.008∗∗
(0.003) (0.003)Bachelor 0.018 0.017
(0.076) (0.123)Master 0.032 0.054
(0.080) (0.127)PhD 0.023 –0.095
(0.091) (0.138)Semester 0.001 0.002
(0.008) (0.011)Born abroad –0.167∗ –0.170
(0.100) (0.129)Mother born abroad –0.018 –0.001
(0.092) (0.119)Father born abroad –0.034 0.046
(0.080) (0.108)No parent has college degree –0.013 –0.001
(0.043) (0.064)Government aid –0.002 –0.012
(0.050) (0.076)Spoken to refugees –0.006 –0.044
(0.043) (0.062)Language, Culture 0.025 0.036
(0.108) (0.157)Social Sciences and Pedagogy 0.083 0.055
(0.109) (0.169)Law 0.097 0.006
(0.162) (0.242)Commercial Information Systems 0.147 0.146
(0.134) (0.195)Business and Economics 0.090 –0.068
(0.119) (0.172)Maths and Science 0.149 0.136
(0.104) (0.153)Medicine 0.066 0.083
(0.125) (0.182)Arts and Music –0.074 –0.152
(0.138) (0.208)Information x covariates No YesControl mean 0.52 0.52Observations 555 555Adj. R2 0.09 0.07
Notes: Dependent variable: dummy variable that equals 1 if respondent participates in re-surveyone week later; 0 otherwise. Information treatment indicates whether the respondent has beenassigned to the information treatment group (=1) or to the control group (=0). Covariates includeall characteristics from Appendix Table A3.2. Control mean is the mean of the indicated outcomeof respondents in the control group. Column (2) additionally includes interactions between theinformation treatment dummy and all covariates. An F-test that all interaction terms in Column (2) arejointly insignificant is not rejected (p-value = 0.89). Robust standard errors reported in parentheses.Significance levels: ∗ p<0.10, ∗∗ p<0.05, ∗∗∗ p<0.01.
110 Microeconometric Analyses on Determinants of Individual Labour Market Outcomes

3 Does the Education Level of Refugees A�ect Natives’ Attitudes?
Table A3.10 : E�ect of information treatment on beliefs about refugees’ education level by baseline beliefs
Five-point scale Agree Disagree(1) (2) (3)
High skilled information 0.329∗∗∗ 0.108∗∗∗ –0.140∗∗∗
(0.050) (0.017) (0.025)× high baseline education belief –0.010 0.070∗∗ 0.060∗∗
(0.063) (0.029) (0.030)Low skilled information –0.004 0.004 0.020
(0.046) (0.014) (0.024)× high baseline education belief –0.226∗∗∗ –0.103∗∗∗ 0.091∗∗∗
(0.059) (0.024) (0.032)High baseline education belief 0.832∗∗∗ 0.176∗∗∗ –0.417∗∗∗
(0.043) (0.018) (0.023)Controls Yes Yes YesRespondents 4,829 4,829 4,829Adj. R2 0.22 0.11 0.19
Notes: Dependent variables: agreement to statement “On average, refugees are well educated”: Column (1):binary variable (1=“completely agree” or “somewhat agree”, 0 otherwise); Column (2): binary variable (1=“com-pletely disagree” or “somewhat disagree”, 0 otherwise); Column (3): integer values from 1 to 5 (1="completelydisagree", 2="somewhat disagree", 3="neither agree nor disagree", 4="somewhat agree"; 5="completely agree").Baseline beliefs about refugees’ education level have been imputed for respondents in the High Skilled and LowSkilled treatments. The imputation procedure is described in Section 4.2. Covariates include all characteristicsfrom Table 3.1. Robust standard errors reported in parentheses. Significance levels: ∗ p<0.10, ∗∗ p<0.05, ∗∗∗
p<0.01.
Microeconometric Analyses on Determinants of Individual Labour Market Outcomes 111

3 Does the Education Level of Refugees A�ect Natives’ Attitudes?
Tabl
eA3
.11
:E�e
ctof
belie
fsab
outr
efug
ees’
educ
atio
nle
velo
not
herr
efug
ee-r
elat
edst
atem
ents
Inde
xCu
ltura
lIn
tegr
ate
Bene
ficia
lIn
crea
seIn
tegr
ate
into
Lang
uage
Good
for
enric
hmen
tin
toso
ciet
yfo
rGer
man
ycr
ime
labo
rmar
ket
skill
sobs
tacl
eec
onom
y
(1)
(2)
(3)
(4)
(5)
(6)
(7)
(8)
Refu
gees
are
wel
l–0
.031
–0.0
060.
038
0.04
90.
035
0.04
1–0
.018
0.06
1∗
educ
ated
onav
erag
e(0
.057
)(0
.037
)(0
.037
)(0
.037
)(0
.037
)(0
.037
)(0
.024
)(0
.037
)
Inst
rum
entF
stat
istic
85.8
85.8
85.8
85.8
85.8
85.8
85.8
85.8
Resp
onde
nts
4,82
44,
824
4,82
44,
824
4,82
44,
824
4,82
44,
824
Not
es:R
esul
tsfr
omtw
o-st
age
leas
t-sq
uare
sreg
ress
ions
.In
the
first
stag
e,be
liefs
abou
tref
ugee
s’ed
ucat
ion
leve
lare
inst
rum
ente
dw
ithth
etw
obi
nary
indi
cato
rshi
ghsk
illed
info
rmat
ion
and
low
skill
edin
form
atio
n(fo
rfirs
t-sta
gere
sults
,see
Tabl
e2)
.Dep
ende
ntva
riabl
e:Co
lum
n(1
):su
mm
ary
inde
x,co
nsis
ting
ofth
eou
tcom
esin
Colu
mns
(2)t
o(8
);se
eSe
ctio
n3.
1fo
rthe
cons
truc
tion
ofth
esu
mm
ary
inde
x.Co
lum
ns(2
)to
(8):
dum
my
varia
bles
that
expr
essa
gree
men
tto
the
indi
cate
dou
tcom
es;1
=“co
mpl
etel
yag
ree”
or“s
omew
hata
gree
”,0
othe
rwis
e.Se
eAp
pend
ixA
fort
hew
ordi
ngof
alls
urve
yqu
estio
ns.A
llre
gres
sion
sin
clud
eth
ech
arac
teris
tics
repo
rted
inTa
ble
3.1.
Robu
stst
anda
rder
rors
repo
rted
inpa
rent
hese
s.Si
gnifi
canc
ele
vels
:∗p<
0.10
,∗∗
p<0.
05,∗
∗∗p<
0.01
.
112 Microeconometric Analyses on Determinants of Individual Labour Market Outcomes

3 Does the Education Level of Refugees A�ect Natives’ Attitudes?Ta
ble
A3.1
2:C
orre
latio
nsbe
twee
nop
inio
nas
pect
s
Hum
anita
rian
Econ
omic
Refu
gees
’Re
ligio
n/cu
lture
Refu
gees
’will
ingn
ess
aspe
cts
aspe
cts
crim
inal
beha
vior
ofre
fuge
esto
inte
grat
e
Hum
anita
rian
aspe
cts
1
Econ
omic
aspe
cts
-0.1
50∗∗∗
1
Refu
gees
’crim
inal
beha
vior
-0.2
52∗∗∗
0.31
1∗∗∗
1
Relig
ion/
cultu
reof
refu
gees
-0.1
26∗∗∗
0.22
8∗∗∗
0.24
5∗∗∗
1
Refu
gees
’will
ingn
esst
oin
tegr
ate
0.00
819
0.26
2∗∗∗
0.40
7∗∗∗
0.20
5∗∗∗
1
Pers
onal
expe
rienc
ew
ithre
fuge
es0.
184∗∗∗
-0.0
0687
0.02
880.
118∗∗∗
0.15
5∗∗∗
Note
s:Pa
irwis
eco
rrel
atio
nsbe
twee
nth
esi
xop
inio
nas
pect
srep
orte
d.Co
rrel
atio
nsar
eba
sed
onco
ntro
lgro
upon
ly.S
eeAp
pend
ixTa
ble
A3.1
8fo
rthe
wor
ding
ofal
lsur
vey
ques
tions
.Eac
has
pect
ism
easu
red
ona
five-
poin
tsca
le:v
ery
impo
rtan
t,so
mew
hati
mpo
rtan
t,ne
ither
impo
rtan
tnor
unim
port
ant,
som
ewha
tun
impo
rtan
t,an
dve
ryun
impo
rtan
t.Si
gnifi
canc
ele
vels
:∗p<
0.10
,∗∗
p<0.
05,∗
∗∗p<
0.01
.
Microeconometric Analyses on Determinants of Individual Labour Market Outcomes 113

3 Does the Education Level of Refugees A�ect Natives’ Attitudes?
Tabl
eA3
.13
:Rel
atio
nshi
pbe
twee
nop
inio
nfo
rmat
ion
aspe
ctsa
ndge
nera
latt
itude
stow
ard
refu
gees
Hum
anita
rian
Econ
omic
Refu
gees
’Re
ligio
n/cu
lture
Refu
gees
’will
ingn
ess
aspe
cts
aspe
cts
crim
inal
beha
viou
rof
refu
gees
toin
tegr
ate
Hum
anita
rian
aspe
cts
1Ec
onom
icas
pect
s-0
.150∗∗∗
1Re
fuge
es’c
rimin
albe
havi
our
-0.2
52∗∗∗
0.31
1∗∗∗
1Re
ligio
n/cu
lture
ofre
fuge
es-0
.126∗∗∗
0.22
8∗∗∗
0.24
5∗∗∗
1Re
fuge
es’w
illin
gnes
sto
inte
grat
e0.
0081
90.
262∗∗∗
0.40
7∗∗∗
0.20
5∗∗∗
1Pe
rson
alex
perie
nce
with
refu
gees
0.18
4∗∗∗
-0.0
0687
0.02
880.
118∗∗∗
0.15
5∗∗∗
Note
s:Pa
irwis
eco
rrel
atio
nsbe
twee
nth
esi
xop
inio
nas
pect
srep
orte
d.Co
rrel
atio
nsar
eba
sed
onco
ntro
lgro
upon
ly.S
eeAp
pend
ixTa
ble
A3.1
8fo
rthe
wor
ding
ofal
lsur
vey
ques
tions
.Eac
has
pect
ism
easu
red
ona
five-
poin
tsca
le:v
ery
impo
rtan
t,so
mew
hati
mpo
rtan
t,ne
ither
impo
rtan
tnor
unim
port
ant,
som
ewha
tun
impo
rtan
t,an
dve
ryun
impo
rtan
t.Si
gnifi
canc
ele
vels
:∗p<
0.10
,∗∗
p<0.
05,∗
∗∗p<
0.01
.
114 Microeconometric Analyses on Determinants of Individual Labour Market Outcomes

3 Does the Education Level of Refugees A�ect Natives’ Attitudes?Ta
ble
A3.1
4:I
nfor
mat
ion
trea
tmen
te�e
ctso
nla
bour
mar
keta
ndfis
calb
urde
nco
ncer
ns
Labo
rmar
ketc
once
rns
Fisc
albu
rden
conc
erns
Inde
xIn
crea
seIn
crea
seco
mpe
titio
nIn
dex
Mor
ere
venu
esPa
yLe
ssgo
v’t
com
petit
ion
form
ein
gene
ral
than
cost
sm
ore
taxe
sbe
nefit
s
(1)
(2)
(3)
(4)
(5)
(6)
(7)
Hig
hsk
illed
info
rmat
ion
0.07
0∗∗
0.01
30.
032∗
∗0.
023
–0.0
040.
018
0.01
0
(0.0
30)
(0.0
08)
(0.0
16)
(0.0
29)
(0.0
16)
(0.0
15)
(0.0
11)
Low
skill
edin
form
atio
n–0
.051
∗–0
.006
–0.0
080.
036
–0.0
240.
021
0.00
6
(0.0
29)
(0.0
07)
(0.0
15)
(0.0
28)
(0.0
16)
(0.0
15)
(0.0
11)
Resp
onde
nts
4,82
74,
827
4,82
74,
827
4,82
74,
827
4,82
7
Not
es:D
epen
dent
varia
bles
:Col
umn
(1):
inde
xof
labo
rmar
ketc
once
rns,
cons
istin
gof
the
two
indi
cato
rsin
Colu
mns
(2)a
nd(3
).Co
lum
n(4
):in
dex
offis
cal
burd
enco
ncer
ns,c
onsi
stin
gof
the
thre
ein
dica
tors
inCo
lum
ns(5
)to
(7).
Colu
mns
(2),
(3),
(5),
(6),
and
(7):
dum
my
varia
bles
whi
chex
pres
sagr
eem
entw
ithth
ere
spec
tive
stat
emen
t(1=
“com
plet
ely
agre
e”or
“som
ewha
tagr
ee”,
0ot
herw
ise)
.See
Appe
ndix
Tabl
eA3
.18
fort
hew
ordi
ngof
alls
urve
yqu
estio
nsan
dSe
ctio
n3.
1fo
rthe
cons
truc
tion
ofth
esu
mm
ary
indi
ces.
Allr
egre
ssio
nsin
clud
eth
ech
arac
teris
ticsr
epor
ted
inTa
ble
1.Ro
bust
stan
dard
erro
rsre
port
edin
pare
nthe
ses.
Sign
ifica
nce
leve
ls:∗
p<0.
10,∗
∗p<
0.05
,∗∗∗
p<0.
01.
Microeconometric Analyses on Determinants of Individual Labour Market Outcomes 115

3 Does the Education Level of Refugees A�ect Natives’ Attitudes?
Table A3.15 : Information treatment e�ects on general attitudes
Index Admit more #Refugees admitted Allowed to stayrefugees in future last year permanently
(1) (2) (3) (4)
High skilled information –0.034 –0.023 0.001 –0.006
(0.031) (0.016) (0.014) (0.016)
Low skilled information –0.017 –0.023 –0.001 –0.002
(0.030) (0.016) (0.014) (0.016)
Respondents 4,852 4,823 4,828 4,851
Notes: Dependent variables: Column (1): index of general attitudes, consisting of the three indicators in Columns(2), (3) and (4). Columns (2)-(4): dummy variables which express agreement with the respective statement(1=“completely agree” or “somewhat agree”, 0 otherwise). See Appendix Table A3.18 for the wording of all surveyquestions and Section 3.1 for the construction of the summary index. All regressions include the characteristicsreported in Table 3.1. Robust standard errors reported in parentheses. Significance levels: ∗ p<0.10, ∗∗ p<0.05,∗∗∗ p<0.01.
116 Microeconometric Analyses on Determinants of Individual Labour Market Outcomes

3 Does the Education Level of Refugees A�ect Natives’ Attitudes?Ta
ble
A3.1
6:I
nfor
mat
ion
trea
tmen
te�e
ctso
not
herr
efug
ee-r
elat
edst
atem
ents
Inde
xCu
ltura
lIn
tegr
ate
Bene
ficia
lIn
crea
seIn
tegr
ate
into
Lang
uage
Good
for
enric
hmen
tin
toso
ciet
yfo
rGer
man
ycr
ime
labo
rmar
ket
skill
sobs
tacl
eec
onom
y
(1)
(2)
(3)
(4)
(5)
(6)
(7)
(8)
Hig
hsk
illed
info
rmat
ion
–0.0
14–0
.002
0.01
20.
023
0.00
80.
023
–0.0
060.
025
(0.0
26)
(0.0
16)
(0.0
17)
(0.0
17)
(0.0
16)
(0.0
17)
(0.0
11)
(0.0
17)
Low
skill
edin
form
atio
n–0
.003
0.00
2–0
.003
0.00
4–0
.008
0.00
80.
001
0.00
1
(0.0
26)
(0.0
16)
(0.0
17)
(0.0
17)
(0.0
16)
(0.0
17)
(0.0
10)
(0.0
17)
Resp
onde
nts
4,83
44,
834
4,83
44,
834
4,83
44,
834
4,83
44,
834
Not
es:D
epen
dent
varia
ble:
Colu
mn
(1):
sum
mar
yin
dex,
cons
istin
gof
the
outc
omes
inCo
lum
ns(2
)to
(8);
see
Sect
ion
3.1
fort
heco
nstr
uctio
nof
the
sum
mar
yin
dex.
Colu
mns
(2)t
o(8
):du
mm
yva
riabl
esth
atex
pres
sagr
eem
entt
oth
ein
dica
ted
outc
omes
;1=“
com
plet
ely
agre
e”or
“som
ewha
tagr
ee”,
0ot
herw
ise.
Appe
ndix
Tabl
eA3
.18
fort
hew
ordi
ngof
alls
urve
yqu
estio
ns.A
llre
gres
sion
sin
clud
eth
ech
arac
teris
tics
repo
rted
inTa
ble
3.1.
Robu
stst
anda
rder
rors
repo
rted
inpa
rent
hese
s.Si
gnifi
canc
ele
vels
:∗p<
0.10
,∗∗
p<0.
05,∗
∗∗p<
0.01
.
Microeconometric Analyses on Determinants of Individual Labour Market Outcomes 117

3 Does the Education Level of Refugees A�ect Natives’ Attitudes?
Tabl
eA3
.17
:Inf
orm
atio
ntr
eatm
ente
�ect
son
opin
ion
form
atio
nas
pect
s
Refu
gees
’will
ingn
esst
oin
tegr
ate
Hum
anita
rian
aspe
cts
Pers
onal
expe
rienc
ew
/ref
ugee
s
Impo
rtan
tU
nim
port
ant
Impo
rtan
tU
nim
port
ant
Impo
rtan
tU
nim
port
ant
(1)
(2)
(3)
(4)
(5)
(6)
Hig
hsk
illed
info
rmat
ion
0.01
1–0
.002
–0.0
130.
003
0.00
9–0
.004
(0.0
11)
(0.0
07)
(0.0
12)
(0.0
08)
(0.0
15)
(0.0
11)
Low
skill
edin
form
atio
n0.
011
0.00
2–0
.005
0.00
00.
000
–0.0
04
(0.0
11)
(0.0
07)
(0.0
12)
(0.0
08)
(0.0
15)
(0.0
11)
Cont
rolm
ean
0.88
0.04
0.86
0.06
0.70
0.12
Resp
onde
nts
4,85
34,
853
4,85
24,
852
4,85
44,
854
Refu
gees
’crim
inal
beha
vior
Relig
ion/
cultu
reof
refu
gees
Econ
omic
aspe
cts
Impo
rtan
tU
nim
port
ant
Impo
rtan
tU
nim
port
ant
Impo
rtan
tU
nim
port
ant
(1)
(2)
(3)
(4)
(5)
(6)
Hig
hsk
illed
info
rmat
ion
–0.0
00–0
.017
0.02
8–0
.023
0.03
2∗–0
.063
∗∗∗
(0.0
17)
(0.0
15)
(0.0
18)
(0.0
17)
(0.0
17)
(0.0
17)
Low
skill
edin
form
atio
n–0
.013
–0.0
00–0
.001
0.00
10.
014
–0.0
26
(0.0
17)
(0.0
15)
(0.0
17)
(0.0
17)
(0.0
17)
(0.0
17)
Cont
rolm
ean
0.54
0.26
0.45
0.37
0.39
0.37
Resp
onde
nts
4,85
24,
852
4,85
34,
853
4,85
04,
850
Note
s:De
pend
entv
aria
bles
:im
port
ance
ofva
rious
aspe
ctsf
orre
spon
dent
s’op
inio
nfo
rmat
ion
proc
esst
owar
dre
fuge
es;r
espo
nden
tsra
ted
each
aspe
cton
afiv
e-po
ints
cale
:ver
yim
port
ant,
som
ewha
tim
port
ant,
neith
erim
port
antn
orun
impo
rtan
t,so
mew
hatu
nim
port
ant,
and
very
unim
port
ant.
Impo
rtan
tequ
als1
for"
very
impo
rtan
t"or
"som
ewha
tim
port
ant"
,0ot
herw
ise;
unim
port
ante
qual
s1fo
r"ve
ryun
impo
rtan
t"or
"som
ewha
tuni
mpo
rtan
t",0
othe
rwis
e.Al
lreg
ress
ions
incl
ude
the
char
acte
ristic
srep
orte
din
Tabl
e3.
1.Co
ntro
lmea
nis
the
mea
nof
the
indi
cate
dou
tcom
eof
resp
onde
ntsi
nth
eco
ntro
lgro
up.S
eeAp
pend
ixTa
ble
A3.1
8for
the
wor
ding
ofal
lsur
vey
ques
tions
.Rob
usts
tand
ard
erro
rsre
port
edin
pare
nthe
ses.
Sign
ifica
nce
leve
ls:∗
p<0.
10,∗
∗p<
0.05
,∗∗∗
p<0.
01.
118 Microeconometric Analyses on Determinants of Individual Labour Market Outcomes

3 Does the Education Level of Refugees A�ect Natives’ Attitudes?Ta
ble
A3.1
8:W
ordi
ngof
surv
eyqu
estio
ns(m
ain
surv
ey)
Cont
ent
Wor
ding
Type
ofqu
estio
n
Perc
eive
ded
ucat
ion
leve
l“O
nav
erag
e,th
ere
fuge
esar
ew
elle
duca
ted.
”
Agre
emen
twith
stat
emen
t,cl
osed
-end
ed,5
answ
erca
tego
ries:
com
plet
ely
agre
e,so
mew
hata
gree
,nei
ther
agre
eno
rdis
agre
e,so
mew
hatd
isag
ree,
com
plet
ely
disa
gree
Labo
urm
arke
tcon
cern
s1:
“Inc
reas
eco
mpe
titio
nfo
rme”
“The
refu
gees
will
incr
ease
com
petit
ion
onth
ela
bour
mar
ketf
orm
epe
rson
ally
.”Se
eab
ove
Labo
urm
arke
tcon
cern
s2:
“Inc
reas
eco
mpe
titio
nin
gene
ral”
“In
gene
ral,
the
refu
gees
will
incr
ease
com
petit
ion
onth
ela
bour
mar
ket.”
See
abov
e
Fisc
alco
ncer
ns1:
“Mor
ere
venu
esth
anco
sts”
“The
refu
gees
will
brin
gm
ore
reve
nues
than
cost
sfor
the
gove
rnm
ent.”
See
abov
e
Fisc
alco
ncer
ns2:
“Pay
mor
eta
xes”
“Due
toth
ego
vern
men
tspe
ndin
gfo
rref
ugee
s,Iw
illha
veto
pay
mor
eta
xesi
nth
efu
ture
.”Se
eab
ove
Fisc
alco
ncer
ns3:
“Les
sgov
ernm
entb
enef
its”
“Due
toth
ego
vern
men
tspe
ndin
gfo
rre
fuge
es,I
will
have
tofo
rgo
gove
rnm
ent
bene
fitsi
nth
efu
ture
.”Se
eab
ove
Oth
erco
ncer
ns1:
“Cul
tura
lenr
ichm
ent”
“The
refu
gees
are
acu
ltura
lenr
ichm
entf
orGe
rman
y.”Se
eab
ove
Oth
erco
ncer
ns:
“Int
egra
tein
toso
ciet
y”“G
erm
any
will
succ
eed
inin
tegr
atin
gth
ere
fuge
esin
toso
ciet
y.”Se
eab
ove
Oth
erco
ncer
ns3:
“Ben
efic
ialf
orGe
rman
y”“G
ener
ally
spea
king
,the
refu
gees
are
bene
ficia
lfo
rGer
man
y.”Se
eab
ove
Oth
erco
ncer
ns4:
“Inc
reas
ecr
ime”
“The
crim
era
tew
illris
edu
eto
refu
gees
’cr
imin
albe
havi
our.”
See
abov
e
Oth
erco
ncer
ns5:
“Int
egra
tein
tola
bour
mar
ket”
“Ger
man
yw
illsu
ccee
din
inte
grat
ing
the
refu
gees
into
the
labo
urm
arke
t.”Se
eab
ove
Oth
erco
ncer
ns6:
“Lan
guag
esk
illso
bsta
cle”
“Lac
kof
lang
uage
skill
soft
here
fuge
esar
ean
obst
acle
fort
heir
labo
urm
arke
tin
tegr
atio
n.”
See
abov
e
Oth
erco
ncer
ns7:
“Goo
dfo
reco
nom
y”“O
vera
ll,th
ere
fuge
esar
ego
odfo
rthe
Germ
anec
onom
y.”Se
eab
ove
Note
s:Th
eta
ble
cont
inue
son
the
next
page
.
Microeconometric Analyses on Determinants of Individual Labour Market Outcomes 119

3 Does the Education Level of Refugees A�ect Natives’ Attitudes?
Wor
ding
ofsu
rvey
ques
tions
(mai
nsu
rvey
)con
t’d
Cont
ent
Wor
ding
Type
ofqu
estio
n
Gene
rala
ttitu
des1
:“A
dmit
mor
ere
fuge
esin
futu
re”
“Com
pare
dto
the
curr
ents
ituat
ion,
shou
ldGe
rman
yad
mit
mor
ere
fuge
es,l
essr
efug
ees,
orth
esa
me
num
ber
inth
efu
ture
?”
Clos
ed-e
nded
,5an
swer
cate
gorie
s:m
uch
mor
e,so
mew
hatm
ore,
the
sam
eam
ount
,so
mew
hatl
ess,
muc
hle
ss
Gene
rala
ttitu
des2
:“N
umbe
rofr
efug
eesa
dmitt
edla
stye
ar”
“Wha
tdo
you
thin
kab
outt
henu
mbe
rofr
efug
eesw
hich
Germ
any
adm
itted
last
year
?”
Clos
ed-e
nded
,5an
swer
cate
gorie
s:fa
rtoo
man
y,so
mew
hatt
oom
any,
abou
tthe
right
amou
nt,s
omew
hatt
oofe
w,f
arto
ofe
w
Gene
rala
ttitu
des3
:“A
llow
edto
stay
perm
anen
tly”
“Do
you
favo
uror
oppo
seth
atre
fuge
esar
eal
low
edto
stay
inGe
rman
ype
rman
ently
?”
Clos
ed-e
nded
,5an
swer
cate
gorie
s:st
rong
lyfa
vour
,so
mew
hatf
avor
,nei
ther
favo
rnor
oppo
se,
som
ewha
topp
ose,
stro
ngly
oppo
se
Aspe
ctsg
over
ning
opin
ion
form
atio
npr
oces
s1:
“Hum
anita
rian
aspe
cts”
“Hum
anita
rian
aspe
cts”
Impo
rtan
ceof
aspe
ct,c
lose
d-en
ded,
5an
swer
cate
gorie
s:ve
ryim
port
ant,
som
ewha
tim
port
ant,
neith
erim
port
antn
orun
impo
rtan
t,so
mew
hatu
nim
port
ant,
very
unim
port
ant
Aspe
ctsg
over
ning
opin
ion
form
atio
npr
oces
s2:
“Eco
nom
icas
pect
s”“E
cono
mic
aspe
cts”
See
abov
e
Aspe
ctsg
over
ning
opin
ion
form
atio
npr
oces
s3:
“Ref
ugee
s’w
illin
gnes
sto
inte
grat
e”“R
efug
ees’
will
ingn
esst
oin
tegr
ate”
See
abov
e
Aspe
ctsg
over
ning
opin
ion
form
atio
npr
oces
s4:
“Rel
igio
n/cu
lture
ofre
fuge
es”
“Rel
igio
n/cu
lture
ofre
fuge
es”
See
abov
e
Aspe
ctsg
over
ning
opin
ion
form
atio
npr
oces
s5:
“Ref
ugee
s’cr
imin
albe
havi
our”
“Ref
ugee
s’cr
imin
albe
havi
our”
See
abov
e
Aspe
ctsg
over
ning
opin
ion
form
atio
npr
oces
s6:
“Per
sona
lexp
erie
nce
with
refu
gees
”“P
erso
nale
xper
ienc
ew
ithre
fuge
es”
See
abov
e
120 Microeconometric Analyses on Determinants of Individual Labour Market Outcomes

3 Does the Education Level of Refugees A�ect Natives’ Attitudes?
Appendix A3.2 Description of the item count technique (ICT)
The item count technique (ICT) is a well-established experimental survey method to measurethe extent of social desirability bias. This bias arises when respondents, instead of answeringtruthfully, provide answers they believe to be socially desirable (Maccoby & Maccoby 1954,Edwards 1957, Fisher 1993). Our ICT design largely follows that in Co�man et al. (2017).Respondents are randomly assigned to either a direct response group or a veiled responsegroup. (Respondents keep their group assignment for all questions.) Participants in thedirect response group are asked to answer a sensitive question directly (e.g., agreement withthe statement “Economic aspects are important for my opinion formation process towardrefugees”). In addition, they are asked to indicate how many other N statements they agreewith. These N statements can include sensitive and nonsensitive items. We decided to includeother statements on refugees that were not related to the sensitive item of interest. In contrast,respondents in the veiled response group report how many of all N+1 statements (the sensitivestatement plus the N other statements) they agree with. All N+1 statements are the same as inthe direct response group. The di�erence in the average agreement with the N+1 statementsbetween the veiled response group and the direct response group is interpreted as the extentof under- or over-reporting due to social desirability bias. Adding this di�erence to the shareof respondents who agree with the sensitive statement in the direct response group yieldsthe true mean share of agreement with the sensitive statement. In addition to using the ICTtechnique for sensitive statements, we followed Co�man et al. (2017) and conducted anadditional ICT experiment for a nonsensitive placebo item (“I used a laptop computer forcompleting the survey”). This (non-critical) placebo item is unlikely to be a�ected by socialdesirability bias, which means that the average agreement with the placebo item should notdi�er between the direct response group and the veiled response group. To compare averagenumbers of agreement across the two groups of respondents, the ICT requires that all itemsare binary. Therefore, we use dummy variables to measure our ICT outcomes in the follow-upsurvey experiment (“agree” versus “disagree”) instead of using five-point scales as in themain survey. Note that the randomization of respondents for the information treatment wascompletely independent of the randomization of respondents for the ICT.
Microeconometric Analyses on Determinants of Individual Labour Market Outcomes 121


4 Entry Barriers and the Labour Market Outcomes ofIncumbent Workers: Evidence from a DeregulationReform in the German Cra�s Sector∗
4.1 Introduction
Regulations make opening a business an expensive and time-consuming endeavour in manycountries. Potential entrepreneurs have to incur costs that range from the time needed todo the paper work to the e�ort of acquiring occupational licenses needed to run a business(Djankov, 2009; Ciccone and Papaioannou, 2007; Kleiner, 2000). Entry barriers are o�enjustified based on the presumption that they secure quality standards of products and servicesby discouraging entry of low-quality firms (Arruñada, 2007). However, many entry barriersserve primarily the interests of incumbent firms to create rents for themselves (Stigler, 1971),which they o�en share with their workers (e.g., Card, Devicienti and Maida, 2014; Blanchflower,Oswald and Sanfey, 1996; Hildreth and Oswald, 1997). Because incumbent firms with marketpower also find it optimal to restrict output and therefore also employment,1 governmentsaround the world have started to deregulate entry barriers to increase the e�iciency of theeconomy (Djankov, 2009). While numerous papers show that reducing entry barriers triggerentrepreneurial activity, innovation, employment, and productivity, most of them are based oncountry-level, region-level, or firm-level (panel) data.2 Much less is known about labour marketconsequences of reducing entry barriers for incumbent workers, which requires longitudinalworker-level data to track individuals over time.
In this chapter, we use longitudinal administrative social security data to study the labour mar-ket consequences of a deregulation reform for incumbent workers in Germany. In 2004, theGerman government passed a law that reformed the German Trade and Cra�s Code (Handw-erksordnung) to foster entrepreneurial activity and to reverse the negative employment trendin cra� occupations. The law removed the requirement to hold the educational certificateof a Master Cra�sman (Meisterbrief) to found a business in 52 out of 93 cra� occupations(see Appendix Table A4.1 for a full list of cra� occupations). The reform was very successfulin increasing the number of businesses in deregulated occupations: two years a�er the re-form the number of businesses had doubled, and had tripled a�er ten years (see also, e.g.,
∗ This chapter was coauthored by Philipp Lergetporer, University of Munich and ifo Institute and Jens Ruhose,Leibniz Universität Hannover.1 See, e.g., Bertrand and Kramarz (2002); Blanchard and Giavazzi (2003); Felbermayr and Prat (2011).2 Djankov (2009) provides an overview. Section 4.3 presents a summary of the literature.
Microeconometric Analyses on Determinants of Individual Labour Market Outcomes 123

4 Entry Barriers and the Labour Market Outcomes of Incumbent Workers
Rostam-Afschar, 2014; Runst et al., 2018a).3 Occupations remained regulated if the specifictrade was hazardous and quality controls were needed to prevent dangers to health or lifeof third parties, or if apprenticeship education activity in the trade was high. Deregulatedoccupations include costume tailors, weavers, tile layers, and millers, while occupations suchas plumbers, electrical technicians, hairdressers, and butchers remained regulated. Overall,the reform a�ected a large part of the German economy because the cra�s sector makes up 14percent of social security employment, constitutes 16 percent of all businesses, and generates10 percent of all revenue in the economy (Statistisches Bundesamt, 2016).
Our main analysis compares labour market outcomes of the same incumbent worker beforeand a�er the reform in deregulated (treatment group) and regulated (comparison group)occupations using a matched di�erence-in-di�erences approach (Heckman, Ichimura andTodd, 1997; Heckman et al., 1998; Todd, 2008). Compared to workers in regulated occupations,those in deregulated occupations are, among other things, more likely to be female, foreign-born, older, less educated, have lower average earnings, and are more likely to be employedin manufacturing. Therefore, we use entropy balancing (Hainmueller, 2012) to constructweights for each worker in the comparison group such that the average characteristics of thecomparison group match exactly the average characteristics of the treatment group beforethe treatment. Compared to conventional matching, entropy balancing has the advantagethat it does not take the detour via estimating a propensity score to construct a comparisongroup, but instead implements a non-parametric matching algorithm that reweights thecomparison group observations such that they satisfy pre-specified balancing requirements.The procedure accounts for observable di�erences between the groups and the regressionadjustment eliminates remaining unobserved individual heterogeneity.
We find that the daily gross earnings of incumbent workers in deregulated occupations grewsignificantly less than those of workers in regulated occupations a�er the reform. Over theperiod from 2004 to 2014, workers in deregulated occupations experienced a negative averagee�ect on their earnings of about 2.3 percent (4 percent when using the non-matched compari-son group) relative to workers in regulated occupations. Year-specific estimates show that thetreatment e�ect becomes gradually larger over time to -4.3 percent in 2014 (non-matchedsample: -7 percent). We also find that unemployment among incumbent workers increasedby 0.7 percentage points (about 20 percent of the unemployment rate in our analytical sam-ple) more in the deregulated occupations than in the regulated occupations (non-matchedsample: one percentage point). Because firms in the cra�s sector are usually rather small,we also examine heterogeneity by the workers’ employer firm size and find that the e�ectsfor earnings and unemployment are largest among firms with less than 20 employees. Theresults are robust to a series of identification checks. For example, we find that pre-reformearning trends are very similar between the treatment and the comparison groups (matched3 There is a small, but growing literature on the e�ects of the reform of the German Trade and Cra�s Code onvarious outcomes (see Runst et al. (2018b) for an overview). Most of the studies are concerned with the numberof firms entering the market a�er the reform (Rostam-Afschar, 2014; Koch and Nielen, 2016; Müller, 2014, 2016;Runst et al., 2018a; Zwiener, 2017).
124 Microeconometric Analyses on Determinants of Individual Labour Market Outcomes

4 Entry Barriers and the Labour Market Outcomes of Incumbent Workers
and non-matched), lending credibility to the common trend assumption.4 We also carefullyevaluate the e�ects of the EU enlargement in 2004 and 2007 and the economic crisis in 2009,which may have a�ected workers in deregulated and regulated occupations di�erently.
While the earnings and unemployment e�ects on incumbent workers are economically rele-vant, we argue that they are relatively small when factoring in the large increase in the numberof new firms. For example, Bruhn (2011) finds that a similar reform in Mexico decreased theincome of incumbent businesses by 3 percent (similar to our e�ects), despite increasing thenumber of new firms by only 5 percent (compared to over 300 percent in our setting). U.S.studies that examine deregulation reforms in the airline industry (Card, 1986, 1998; Hirsch andMacpherson, 2000) and the trucking industry (Hirsch, 1993; Rose, 1987) document relativewage decreases of up to -10 percent to -15 percent for workers in deregulated industries. Thecomparison suggests that the new firms in our study, which emerged a�er the reform in 2004,did not generate strong competitive pressure. Nevertheless, the large increase in the numberof firms was su�icient to cause a slow adjustment in the pay scheme and employment struc-ture of incumbent firms over time. The slow pace of the adjustment process is likely due tothe low reform-induced competitive pressure and relatively strong labour market institutionsin Germany.
Alternatively, it could be that increased labour demand by incumbent and new firms increasedwage rates, which would have attenuated the negative reform e�ects for incumbent workers.However, we find significantly declining employment trends (similar to Koch and Nielen,2016; Zwiener, 2017) and almost constant average wage trends in deregulated occupationscompared to regulated occupations. Additional analyses using cross-sectional data fromthe German microcensus confirm these results for trends in net monthly income for bothemployed and self-employed cra�smen (self-employed are not included in the social securityrecords) (see also Fredriksen, 2017). The non-positive employment trends a�er the reform,which are in contrast to theoretical predictions and most of the empirical literature, mostlikely arise because newly established firms remained one-man businesses with very littleapprenticeship activity and low survival rates: about 60 percent of newly established firms hadalready disappeared a�er five years (Müller, 2014, 2016). We also discuss firm adjustments overprice decreases without a�ecting earnings due to, for example, investments in technology,physical capital, and innovation. However, none of these economic factors seem to havechanged significantly a�er the reform in incumbent firms. The most plausible reasons forthese non-e�ects are that customers do not perceive goods and services o�ered by firms withand without a Master Cra�sman certificate to be perfect substitutes (Fredriksen, Runst andBizer, 2018). Furthermore, we provide suggestive evidence that former employees who likelybecome self-employed are not positively selected from the workforce (in terms of earnings in2003), which may also explain higher failure rates relative to their established and experiencedcompetitors. Overall, the results of this study caution the deregulation of product markets
4 This makes it also unlikely that occupations were deregulated due to their pre-reform economic performance.
Microeconometric Analyses on Determinants of Individual Labour Market Outcomes 125

4 Entry Barriers and the Labour Market Outcomes of Incumbent Workers
where new competitors would be too weak to exert strong competitive pressure on incumbentfirms.
Our study contributes primarily to the literature that examines labour market e�ects of dereg-ulation policies within countries.5 Almost all of these studies find that reducing entry barriersleads to increasing entrepreneurial activity and overall employment growth.6 In contrast tothis chapter, most previous studies use regional- and firm-level variation in the exposure to aderegulation reform and do not exploit worker-level information. We also relate to a large U.S.literature on the e�ect of reducing entry barriers in specific industries on wages (see Fortinand Lemieux (1997) and Peoples (1998) for overviews). These studies show that industrywages decrease significantly a�er deregulating market entry. However, the evidence o�enrelies on cross-sectional data from the current population survey (CPS), which, other than ourdata, does not allow to control for unobserved worker characteristics.
The remainder of the chapter is structured as follows. Section 4.2 provides the institutionalbackground and explains the reform in detail. Section 4.3 discusses the theoretical backgroundand the related literature. Section 4.4 introduces the data. Section 4.5 presents our mainanalysis of the reform e�ects on incumbent workers’ labour market outcomes. Section 4.6 setsour findings in perspective to the overall reform e�ects on employment and wage growth, andon self-employed labour market outcomes. Section 4.7 provides a discussion of our findingsand connects them with the current literature. Section 4.8 concludes.
4.2 Reform of the German Trade and Cra�s Code 2004
Cra�s occupations such as carpenters and stonemakers have historically played an importantrole in the German economy and continue to do so until today (Statistisches Bundesamt,2016). Since the middle ages (with short interruptions), cra� occupations had been strictlyregulated and monitored by guilds (Brenke, 2008). The role of the guilds was to regulatethe supply of cra�smen through licenses and apprenticeship training, protect its membersthrough contract enforcement, reduce information asymmetries on quality as well as investin human capital and technology (Ogilvie, 2004, 2014).
In more recent years and until 2004, the supply of cra�smen had been regulated in two waysin Germany. First, only individuals with a “Master Cra�s Certificate” (Meisterbrief) were able toopen their own business and o�er services in their trade. Second, only master cra�smen wereallowed to educate apprentices. The Master Cra�s Certificate is a professional qualificationadministered by the chambers of cra�s and trade in the respective federal states. The certifi-cate requires roughly two years of coursework and costs for the examination vary betweentwo to ten thousand Euros (ZDH, 2014). As prerequisite for the Master Cra� Certificate exams,
5 Section 4.3 provides a detailed literature review.6 See studies by Aghion et al. (2008), Bertrand and Kramarz (2002), Branstetter et al. (2014), Bruhn (2011), Kaplan,Piedra and Seira (2011), Mullainathan and Schnabl (2010), and Yakovlev and Zhuravskaya (2013).
126 Microeconometric Analyses on Determinants of Individual Labour Market Outcomes

4 Entry Barriers and the Labour Market Outcomes of Incumbent Workers
cra�smen have to successfully finish their apprenticeship in their respective cra� trade andusually have to acquire some work experience as a journeymen.7
In 2004, the German government deregulated the access to self-employment by removingthe requirement to hold a master cra�s certificate for 52 out of 93 cra� occupations (seeAppendix Table A4.1 for a full list of regulated and deregulated cra� occupations). The other41 occupations remained regulated with the exception that journeymen who had worked forat least six years in their occupation (four of them in a leadership position) also received theoption to open their own business in 35 occupations.8 The reform goals for the amendment ofthe German Trade and Cra�s Code were to reverse the negative development in the numberof cra�smen and apprenticeships, ease entry into entrepreneurial activity, and ensure futureemployment. The reform was first announced at Chancellor Gerhard Schröder’s governmentdeclaration9 in March 2003 and then quickly came into force on January 1, 2004, less thanone year a�er the initial declaration.
The reform of the German Trade and Cra�s Code was a less prominent and less widely knownpart of a comprehensive welfare and labour relation reform package aimed at enhancingeconomic growth and increase competitiveness referred to as “Agenda 2010” or the “HartzReforms”. Implemented by the coalition government between the Social Democrats and theGreen Party, the Hartz reforms were a reaction to a decade of disappointing economic perfor-mance in the post reunification area.10 The Hartz reforms did not a�ect institutions involved inthe wage setting process, but were primarily concerned with limiting unemployment benefits,liberalizing temp agency work, reforming active labour market policies, and reorganizingthe Federal labour Agency. While some argue that the reform explains at least some of theimprovements in competitiveness of the German industrial sector, some others argue thatthe Hartz reforms were not essential (Dustmann et al., 2014).
Occupations remained regulated for two reasons. First, security concerns for customersprevented the deregulation of occupations with tasks that need high quality control. Intotal, 31 occupations remained regulated for this reason. Second, 11 occupations remainedregulated because they had already a high apprenticeship education activity. The secondrestriction argument was added as a compromise following political negotiations betweenopposing political parties, representatives of employers, labour unions, and employees. Asan overall result of these negotiations, deregulated occupations represent only 11 percent
7 Journeymen get their name from the old custom that a�er passing their apprenticeship examination, youngcra�smen le� their master to go on their journey and work in di�erent locations to acquire new knowledge andtechniques. In modern times, this custom has mostly seized to exist.8 However, Figure 4.1 indicates that this weaker deregulation did not a�ect the number of firms in theseoccupations.9 Gerhard Schröder’s Government Declaration: http://gerhard-schroeder.de/2003/03/14/regierungserklarung-agenda-2010/10 At that time, Germany was “the sick man of Europe” (The Economist, 2004). In 2003, the year before the reformwas introduced, the German economy was in recession, with high labour cost and an unemployment rate of 11.6percent (Statistisches Bundesamt, 2018a).
Microeconometric Analyses on Determinants of Individual Labour Market Outcomes 127

4 Entry Barriers and the Labour Market Outcomes of Incumbent Workers
of cra� businesses in 2003. Further anecdotal evidence suggests that regulated occupationswere prominently represented in the constituencies of the governing politicians. This isconsistent with the fact that some occupations are very similar to each other, yet one hasremained regulated (e.g., metal worker) and the other has been deregulated (e.g., metal andbell founder).
The reform had strong e�ects on business formation and entrepreneurial activity. Usingaggregated firm registry data from the German Confederation of Skilled Cra�s (Zentralverbanddes Deutschen Handwerks (ZDH)), Figure 4.1 displays the changes in the number of businessesin the deregulated occupations and in the regulated occupations (relative to 2003). Whilethe number of businesses in the still regulated occupations remained relatively constant,the number of businesses in deregulated occupations doubled between 2003 and 2006 andmore than tripled between 2003 and 2014. On average, the stock of businesses in deregulatedoccupations increased annually by 26 percent in the first three years and then increasedfurther by about 5 percent each year from 2007 to 2014.11
Using data from the German Microcensus12, Figure 4.2a shows the shares of self-employedindividuals in both the deregulated and regulated occupations (see Section 4.4.2 for descrip-tion of the data). The picture reveals an increase in the share of self-employed cra�smen inderegulated occupations.13 As may be expected, another e�ect of the reform was a drastic andimmediate decline in the number of Master Cra� examinations in the deregulated occupations.As shown in Figure 4.2b, Master Cra� Certificate examinations decreased by 60 percent a�erthe reform (see also Koch and Nielen, 2016). Examinations do not fall to zero because they arestill o�ered and remained to have a value by signalling high quality standards (Fredriksen,Runst and Bizer, 2018).
4.3 Labour Market E�ects of Entry Barriers: Related Literatureand Some Theory
Entry barriers are costs that new entrants have to incur to become active in a given productmarket. These costs can range from standardization of products, minimum capital require-ments, and time-consuming registration procedures to licenses that are required to run a
11 Supporting evidence on the role of entry barriers in the German cra�s sector on the likelihood of becoming self-employed comes from Prantl and Spitz-Oener (2009). They use the German reunification as a natural experimentto show that the entry barriers impeded entry into self-employment in East Germany compared to entry in WestGermany. Prantl (2012) further shows that entry barriers suppressed short-lived and long-lived entrants.12 Research Data Centres of the Federal Statistical O�ice and the statistical o�ices of the Länder, Microcensus,census years 1998-2012.13 Columns (7) and (8) of Table 4.8 confirms an increase of more than 2 percent among self-employed individualsin deregulated compared to regulated occupations a�er the reform. This finding confirms Rostam-Afschar (2014)and Runst et al. (2018a) who study the e�ects of the reform on entry into self-employment more rigorously. Seealso Koch and Nielen (2016); Müller (2014, 2016); Zwiener (2017).
128 Microeconometric Analyses on Determinants of Individual Labour Market Outcomes

4 Entry Barriers and the Labour Market Outcomes of Incumbent Workers
business (Djankov, 2009; Kleiner, 2000). Advocates for entry barriers argue that they cansecure and improve the quality of the products and services provided (Arruñada, 2007). Forexample, Anderson et al. (2016) show that occupational licensing in medical professions canbe highly beneficial because the licensing of midwives in the early 20th century in the UnitedStates led to reductions in infant and mother mortality. However, opponents argue that entrybarriers lead to ine�icient allocations of resources because they restrict competition andcreate rents for incumbent firms (Peltzman, 1976; Posner, 1975; Stigler, 1971).14 With entrybarriers in place, theory usually predicts that incumbent firms produce less output and chargehigher prices than they would in a more competitive environment.15
While the e�ects on wages and employment of reducing entry barriers are theoretically am-biguous and seem to depend on a multitude of factors, such as the level of initial competition,labour market institutions, and political economy factors as well as the technology and thespecific industry in question (see Djankov (2009) for a survey of the literature), standard eco-nomic theory predicts that reducing entry barriers for firms lead to increasing entrepreneurialactivity through increasing the number of active firms. Evidence in favour of this theory comesfrom numerous cross-country studies,16 and also from studies examining deregulation re-forms within countries by using regional and time variation in the reform exposure.17 Forexample, Bruhn (2011) and Kaplan, Piedra and Seira (2011) document that a reform in Mexico,which simplified the local registration process for new businesses, has increased the numberof new businesses by 5 percent. Branstetter et al. (2014) report an increase of 17 percent fora similar reform in Portugal. Aghion et al. (2008) report an average increase in the numberof factories by 6 percent a�er a large deregulation reform in India, which removed licensingrequirements to establish a new factory, expand capacity, start a new product line, or changelocation for entire industries.
Because incumbent firms with market power find it optimal to restrict output and thereforealso employment (Bertrand and Kramarz, 2002; Blanchard and Giavazzi, 2003; Felbermayrand Prat, 2011), deregulation and new firm entry should predict increases in employmentlevels. Most of the literature confirms this link at the country and regional level. For example,Bertrand and Kramarz (2002) and Ciccone and Papaioannou (2007) show that excessive entrybarriers harm employment growth. Other studies show that stringent anticompetitive productmarket regulation increases unemployment (Bassanini and Duval, 2006; Feldmann, 2008;Gri�ith, Harrison and Macartney, 2007). If incumbent firms and new entrants are e�ective
14 De Soto (1989) argues that entry barriers may also benefit bureaucrats and politicians by collecting bribesfrom entrants. (Mukoyama and Popov, 2014) provide a political economy model for the existence and dynamicsof entry barriers.15 See, e.g., Djankov (2009); Gittleman, Klee and Kleiner (2018); Kleiner and Krueger (2013); Weeden (2002).16 See, e.g.,Ciccone and Papaioannou (2007); Dreher and Gassebner (2013); Djankov et al. (2002); Fisman andSarria Allende (2010); Klapper, Laeven and Rajan (2006).17 Studies exist for Belgium (Schaumans and Verboven, 2008), France (Bertrand and Kramarz, 2002), Peru(Mullainathan and Schnabl, 2010), Portugal (Branstetter et al., 2014), Mexico (Bruhn, 2011; Kaplan, Piedra andSeira, 2011), India (Aghion et al., 2008), and Russia (Yakovlev and Zhuravskaya, 2013).
Microeconometric Analyses on Determinants of Individual Labour Market Outcomes 129

4 Entry Barriers and the Labour Market Outcomes of Incumbent Workers
competitors, meaning that they engage in similar markets (market commonality) and competefor similar resources (resource similarity) (Chen, 1996), then incumbent firms may react toincreased competition by increasing investments (Alesina et al., 2005) and innovative activity(Aghion, Howitt and Prantl, 2015; Gri�ith, Harrison and Simpson, 2010) to keep their long-runcompetitive advantage. While new firm entry can also be detrimental to innovation and growthby diminishing rents and thereby decreasing incentives to innovate and invest (Aghion et al.,2005),18 evidence for the United Kingdom and cross-country studies show a positive e�ectof deregulation on innovation (Aghion et al., 2009; Blundell, Gri�ith and van Reenen, 1999).Thus, it is not surprising that most studies eventually find beneficial e�ects of deregulationreforms on productivity and economic growth.19 For consumers, the literature shows thatderegulation reforms lead to lower prices in the a�ected industries and sectors. For example,Bruhn (2011) confirms that prices decrease a�er deregulation in Mexico. Schivardi and Viviano(2011) study the market e�ects of barriers to entry in the Italian retail market and find thathigher entry barriers lead to higher consumer prices. Bertrand and Kramarz (2002) confirmthat for the French retail industry. Thus, an overwhelming part of the literature shows thatthere are mostly positive economic e�ects from removing entry barriers.
In this study, we are mainly interested in understanding potential earnings and employmentoutcomes of workers who work in a firm that is a�ected by a deregulation. In many cases, themain beneficiaries of entry regulations are incumbent firms, which are protected from compe-tition by entry barriers and can therefore raise economic rents through charging markups onprices.20 There is strong evidence that firms share their economic rents with their employees,causing higher wages in many regulated markets and industries.21 To protect their productmarket position, firms may try to save costs following a deregulation reform by revising wagesof their workers. They may do that by re-negotiating labour contracts and collective bargain-ing agreements with labour unions (Peoples, 1998). However, to retain their competitiveadvantage, firms may also choose to invest in the human capital of their workforce becausefirms with more skilled labour work more e�iciently. Evidence on this channel comes fromFernandes, Ferreira and Winters (2014) and Guadalupe (2007) who show that returns to skillsincrease a�er a deregulation and from Bassanini and Brunello (2011) who show that firmsinvest more in the training of their employees. Earnings for incumbent workers may alsoraise when labour demand increases because of increasing product demand. Furthermore,because incumbent firms may invest more in technology and innovation, they might be ableto keep their competitive advantage without reducing earnings of their workers. Thus, theoret-
18 Aghion et al. (2009) argue that it depends on the specific industry and its’ technological advancement howfirms react to increasing competition. Thus, a higher entry threat can encourage innovation in sectors that areinitially close to the technological frontier, whereas it may discourage innovation in sectors that are initially farbelow the technological frontier.19 See, for example, Aghion et al. (2004, 2005, 2008, 2009); Barseghyan (2008); Dawson and Seater (2013); Djankov,McLiesh and Ramalho (2006); Schivardi and Viviano (2011).20 See, e.g., Djankov (2009); Gittleman, Klee and Kleiner (2018); Kleiner and Krueger (2013); Weeden (2002).21 See, for example, Arai and Heyman (2009); Card, Devicienti and Maida (2014); Christofides and Oswald (1992);Blanchflower, Oswald and Sanfey (1996); Guertzgen (2009); Hildreth and Oswald (1997); Rusinek and Rycx (2013).
130 Microeconometric Analyses on Determinants of Individual Labour Market Outcomes

4 Entry Barriers and the Labour Market Outcomes of Incumbent Workers
ically, whether deregulation increase or decrease wages of incumbent workers is ambiguous.Moreover, some labour markets (such as the German labour market) are characterized bysubstantial downward rigidity of wages (e.g., through strong labour unions or high minimumwages).22 If firms cannot easily revise wages, they may choose to adjust their labour costsover the employment margin.
Thus, while the economy-wide e�ects of reducing entry barriers are likely positive for em-ployment, innovation, and productivity, those policies may harm incumbent workers bydecreasing their wages and perhaps increase unemployment. However, in the longer run,incumbent workers may benefit from additional employment opportunities o�ered by newfirms, raising average wages in the labour market due to increasing labour demand. Thus,it is important to distinguish conceptually between long- and short-run welfare e�ects forincumbent workers because the reduction and redistribution of rents through deregulationmay also induce firms to adjust over longer periods (Blanchard and Giavazzi, 2003).
There is a large U.S. literature on the e�ect of reducing entry barriers in specific industries onearnings (see Fortin and Lemieux (1997) and Peoples (1998) for overviews).23 Most of thesestudies show that industry wages decrease significantly a�er deregulating market entry. Forexample, workers in the airline industry (Card, 1986, 1998; Hirsch and Macpherson, 2000)and the trucking industry (Hirsch, 1993; Rose, 1987) see their wages decrease by between 10percent to 15 percent a�er a major entry deregulation. MacDonald and Cavalluzzo (1996) findthat wages in the railroad industry first increase, but then decrease substantially—indicatingthe importance of studying long-run patterns. However, the evidence o�en relies on cross-sectional data from the current population survey (CPS), which does not allow to controlfor unobserved worker characteristics. Moreover, because reform e�ects depend on thepredetermined characteristics of the labour and product market, labour market e�ects fromthe deregulation of one entry barrier cannot easily be generalized to the deregulation of otherentry barriers in other markets.
Other studies that evaluate deregulation reforms within countries rely on regional variationin the exposure to a deregulation reform. For example, Bruhn (2011) provide some evidencethat deregulation may also reduce wages of incumbent employees in Mexico. The reform thatincreased the number of new firms by only 5 percent decreased the income of incumbentbusinesses by 3 percent, which is comparable to our e�ect size. Bertrand and Kramarz (2002)also suggest negative earnings e�ects for a deregulation in the French retail sector.
22 Fiori et al. (2012) document an interaction between product market and labour market regulation in a panelof OECD countries. They show that product market deregulation is more e�ective at the margin when labourmarket regulation is high. See also Blanchard and Giavazzi (2003), Ebell and Haefke (2009), Felbermayr and Prat(2011), and Koeniger and Prat (2007) for theoretical contributions.23 Studies include sectors such as banking (Black and Strahan, 2001; Cuñat and Guadalupe, 2009; Wozniak,2007), airline (Card, 1986, 1998; Hirsch and Macpherson, 2000), trucking (Hirsch, 1993; Rose, 1987), railroads(MacDonald and Cavalluzzo, 1996), and telecommunication (Majumdar, 2015).
Microeconometric Analyses on Determinants of Individual Labour Market Outcomes 131

4 Entry Barriers and the Labour Market Outcomes of Incumbent Workers
Hardly any evidence exists about the long-run employment prospects of incumbent workersa�er a deregulation reform and none of these studies use longitudinal (administrative) worker-level data. Based on the theoretical and empirical findings from the literature, we can derivesome expectations about the labour market e�ects of the reform of the German Trade andCra�s Code. Compared to other deregulation reforms studied in the literature, the evidencethat we present in Section 4.2 indicates that the reform led to a massive increase in thenumber of new firms. Under the assumption that those firms compete with incumbent firmsby targeting similar consumers and providing comparable goods and services, we shouldexpect that the reform placed competitive pressure on prices in the same cra� occupations.
If incumbent firms want to retain their profit margins, we may observe decreasing earningsover time as firms obtain the option to re-negotiate wage contracts. We may also observeincreasing unemployment. However, because most cra� services are labour intensive, weshould observe that employment is increasing in deregulated cra� occupations with theestablishment of new firms. Incumbent firms may try to retain and train their workforce,which may lead to average earnings growth in the long-run. Therefore, the overall reforme�ect is an empirical question.
There already exists a set of related studies that look at the economic e�ects of the reformof the German Trade and Cra�s Code (Runst et al., 2018b, provide an overview). The bur-geoning literature finds surprisingly little positive e�ects on overall employment and wagegrowth in deregulated occupations for self-employed and employees (Koch and Nielen, 2016;Fredriksen, 2017; Zwiener, 2017). However, these studies are based on either cross-sectionalor firm-level data, which does not allow them to track the same individual over time. Somesociological studies use cross-sectional German microcensus data to look at wages of workersin occupations that are regulated versus those that are not regulated (Bol, 2014; Bol andWeeden, 2015). However, this approach informs us about wage-level di�erences across thoseoccupations, but does not inform us about the causal e�ects of the deregulation reform.
Another study from sociology comes from Damelang, Haupt and Abraham (2018). Using SIABdata and a simple di�erence-in-di�erences design, they concentrate on incumbent workerearnings, but do not study unemployment. Their analysis stops already four years a�er thereform and they do not provide year-specific treatment e�ects. However, the literature impliesthat it is important to distinguish conceptually between long- and short-run welfare e�ectsbecause the reduction and redistribution of rents through deregulation may also induce firmsto adjust over longer periods. Moreover, we analyze pretreatment trends in detail and correctfor di�erent sample compositions, which turns out to matter for the results.
132 Microeconometric Analyses on Determinants of Individual Labour Market Outcomes

4 Entry Barriers and the Labour Market Outcomes of Incumbent Workers
4.4 Data
4.4.1 Sample of Integrated Labour Market Biographies (SIAB)
Our main analysis uses the German Sample of Integrated Labour Market Biographies (SIAB)from the Institute for Employment Research (IAB) (Antoni, Ganzer and vom Berge, 2016).24
The dataset provides detailed administrative longitudinal earnings records on a two percentrandom sample of individuals who are subject to social security. We also have information onthe detailed occupation, educational background, industry, employment status, and someinformation about the firm.
The analytical sample consists of full-time employees between 25 and 55 years old in the yearof the deregulation, 2003, who work in either a deregulated or regulated cra� occupationin 2003. To avoid (potentially endogenous) switching before the reform, we additionallyrequire that the individual has held the same occupation within the same firm for three yearsprior to the reform. We also only look at individuals who report more than ten Euro of dailywages in the five years before the treatment, i.e., from 1998 to 2003. This should not be abinding restriction for full-time regular employees (Card, Heining and Kline, 2013). Finally, wedrop employees who work in large firms, i.e., firms with more than 1500 employees, becausecra�smen firms are usually small to medium firms. It is likely that this sample may still includefirms that are not registered in the cra�s sector (e.g., firms may belong to the industrial sectoror the public sector) because the SIAB data do not allow us to exactly identify those firms.Because those firms are not directly a�ected by the reform, removing entry barriers in thecra� sector should not have a direct e�ect on their workers. However, the reform may have anindirect e�ect on those workers in the long-run because workers within the same occupationare able to switch across industry boundaries. This is why we include also workers who workin larger firms and who potentially do not work in the cra�s sector.25 In further analyses, weshow results by firm size because small firms (e.g., with less than 20 employees) are mostlikely to be cra�s firms.
To assign whether an individual is employed in a regulated or deregulated cra� occupation,we take the o�icial Trade and Cra�s Code, listing the names of occupations which remainregulated (Annex A) and which were deregulated (Annex B1). We map these occupations intothe 3-digit German Classification of Occupations 1988 (KldB88), which the SIAB data use toclassify occupations. Appendix Tables A4.2 and A4.3 show the mapping of occupations from24 This study uses the weakly anonymous Sample of Integrated labour Market Biographies (years 1975-2014).Data access was provided via on-site use at the Research Data Centre (FDZ) of the German Federal EmploymentAgency (BA) at the Institute for Employment Research (IAB) and subsequently remote data access.25 Runst et al. (2018a) propose to circumvent this assignment problem by including only occupations where theshare of cra� apprentices within each occupational code exceeds 60 percent. Data for this exercise comes fromthe Federal Institute for Vocational Education and Training. Replicating the results of Rostam-Afschar (2014), theyfind (as expected) stronger reform e�ects on self-employment in the German microcensus. However, droppingentire occupations from the sample because of low apprenticeship activity may lead to an endogenous sampleselection. We prefer to split the sample by firm size to capture firms registered in the cra�s sector.
Microeconometric Analyses on Determinants of Individual Labour Market Outcomes 133

4 Entry Barriers and the Labour Market Outcomes of Incumbent Workers
the Trade and Cra�s Code into the KldB88. For 38 occupations, the occupation name in theTrade and Cra�s Code and in the Classification of Occupations 1988 are identical.26 Further39 occupations can be matched without any di�iculties because the occupation names onlydi�er slightly, such as using a more modern word for the occupation. Thirteen occupationswhere the mapping is not so obvious, are mapped from the Cra�s and Trade Code usingdigressions and further research. These include cases where the 3-digit KldB88 is not detailedenough to list the specific occupation separately. For them, we look at the 4-digit level of theclassification to see in which code the occupation is included. Only four small occupationscannot be matched at all.
To study also economy-wide reform e�ects (see Section 4.6), we also use the SIAB data to lookat overall changes in employment and earnings in deregulated and regulated occupationsbefore and a�er the reform. For this analytical sample, we keep all employees who areemployed or unemployed and are between 20 and 60 years old. We again drop workerswho work in firms that have more than 1,500 employees. For the year 2003, this sampleshows that about 11.7 percent work in cra� occupations.27 The data further show that 9.3percent of all employment subject to social security is in regulated occupations, 2.4 percentis in deregulated occupations, 14 percent are unemployed, and 74 percent work in otheroccupations not related to the cra� sector.
4.4.2 Microcensus
Because the SIAB data only contain dependent employees who are subject to social security,we also use data from the German Microcensus to provide evidence on the earnings e�ectson self-employed individuals (FDZ der statistischen Ämter des Bundes und der Länder, 2012).Moreover, we can check the robustness of our results from the SIAB data by studying theimpact of deregulation on the net income of employees.
The German Microcensus is a compulsory household survey, which contains a 1 percentrandom sample of persons and households in Germany.28 The survey provides basic socio-demographic and labour market data in the form of yearly repeated cross sections. Theadvantage of this survey is that answering the questions is mandatory, which avoids selectivenon-response.
For our analysis, we use the waves from 1997 to 2012. The microcensus does not reportincome by di�erent income sources. To avoid the inclusion of income that is, e.g., raised
26 This also counts cases in which the Trade and Cra�s Code occupations matches two occupations in the KldB88,such as “Bricklayer and Concretor”, which is one occupation in the Cra� and Trade Code but corresponds to theoccupations of “bricklayer” and “concretor” separately in the KldB88.27 The number is comparable to o�icial statistics for employment in the cra�s sector for the year 2014 (Statistis-ches Bundesamt, 2016).28 We use the full 1 percent sample of the scientific use file (SUF), which is only available for on-site use atResearch Data Centers of the Federal Statistical O�ice and the statistical o�ices of the Länder.
134 Microeconometric Analyses on Determinants of Individual Labour Market Outcomes

4 Entry Barriers and the Labour Market Outcomes of Incumbent Workers
through capital and real estate, we keep only individuals who report labour earnings as theirprimary source of net income. The analytical sample consists of individuals who work in eitherregulated or deregulated cra� occupations, are between 18 and 65 years of age, and workfull-time. The microcensus uses the Classification of Occupations 1992, which is similar tothe 1988 classification in the SIAB. Based on the 4-digit 1992 classification of occupations,we use the same procedure to classify occupations into deregulated and regulated reformoccupations (see Appendix Table A4.4 for the mapping).
4.5 Reform E�ects on Incumbent Workers
4.5.1 Basic Empirical Setup
Using the administrative SIAB data, we track the labour market performance of individualswho worked in deregulated occupations before the reform in the year 2003 and compare themto individuals who worked in regulated occupations. According to our sample setup, workersare in the treatment group if they held an occupation in the years 2001, 2002, and 2003 thatwas eventually deregulated. Workers are in the comparison group if they have worked in anoccupation that remained regulated. Equation (4.1) shows the basic setup of the resultingdi�erence-in-di�erences model.
yit = α1 + α2deregulatedj(i) × post2003 + µt + µi + εit (4.1)
where y are labour market outcomes (log daily earnings and unemployment) for workeri at time t. The variable deregulated is an indicator variable that is one if occupation j isderegulated and zero otherwise. Assignment of occupation j to individual i is based on thelast year before the reform in 2003. Post is one if year t is a�er the reform in 2004 and zerofor years before the reform. We are mainly interested in the interaction between deregulatedand post, where the coe�icient α2 gives the average reform e�ect for workers who workin a deregulated occupation compared to someone who works in a regulated occupation.The e�ect is causal if the treatment group would have developed in the same way as thecomparison group had there been no treatment (common trend assumption). µi are individualfixed e�ects, which partial out unobserved individual heterogeneity. µt are time fixed e�ectsthat take out common time specific e�ects. εit is an error term that is clustered at the individuallevel.
4.5.2 Covariate Balancing before Treatment
Table 4.1 displays the mean and variance for a large set of individual covariates for the treat-ment and comparison group. Comparing means across the two samples, the table showsthat the treatment and comparison group are very di�erent in their characteristics prior to
Microeconometric Analyses on Determinants of Individual Labour Market Outcomes 135

4 Entry Barriers and the Labour Market Outcomes of Incumbent Workers
the reform. Individuals in regulated occupations compared to individuals in deregulatedoccupations constantly earn on average six to seven percent more over the entire period from1998 to 2003. Some reasons for this persistent earnings gap are that individuals in deregulatedoccupations, compared to those in regulated occupations, are more likely to be female, morelikely to have a foreign citizenship, and less well educated. Because employees in deregulatedoccupations are older on average than employees in regulated occupations, they also havehigher job and firm tenure. Another di�erence is that 77 percent of workers in deregulatedoccupations work in the manufacturing sector, where this is only the case for 38 percentin regulated occupations. Workers in regulated occupations are very likely to work in theconstruction sector (34 percent versus 6 percent in deregulated occupations) because theconstruction sector comprises many occupations with hazardous cra�s. This also explains whythe tasks of regulated compared to deregulated occupations are more likely to be categorizedas complex specialized tasks than professional tasks.
The table also documents that regulated and deregulated occupations di�er in terms ofcovariate variances. For example, the standard deviation of the log earnings variables showthat variances in the treatment group are larger than in the comparison group across allperiods. Studying earnings growth prior to the treatment at the bottom of the table, weobserve that there are only small di�erences in mean earnings growth. From 1998 to 2003,earnings in the deregulated occupations have increased by 23.3 percent on average. Earningsgrowth in the regulated occupations was very similar at 24.3 percent. However, the variance inthe earnings growth is twice as large in the regulated compared to the deregulated occupations.This di�erence gets even stronger when looking at the earnings growth since 1994.
4.5.3 Regression-adjusted Matched Di�erence-in-Di�erence
Large compositional di�erences between the deregulated and regulated groups are a potentialthreat to the common trend assumption of the simple di�erence-in-di�erence estimatorbecause it is unclear whether the two groups would have developed similarly without thereform. Moreover, because reform e�ects may be driven by a particular population group,compositional di�erences could also complicate the interpretation of the results. While theoverrepresentation of an a�ected population group does not bias estimates of the causalreform e�ects (given that the common trend assumption holds), it may undermine externalvalidity because the e�ects are scaled up or down depending on the relative weights of thepopulation group that is a�ected most. Thus, an analysis that is based on samples that arecomparable before the reform may more likely reflect the reform e�ect for a randomly drawnemployee from one of the deregulated occupations.
To allow for an apple-to-apple comparison that is not driven by compositional e�ects, we useentropy balancing to make the comparison group as similar as possible to the treatment groupbefore the reform. Hainmueller (2012) formulates entropy balancing as a non-parametricdata pre-processing method for binary treatment studies. The method incorporates covariate
136 Microeconometric Analyses on Determinants of Individual Labour Market Outcomes

4 Entry Barriers and the Labour Market Outcomes of Incumbent Workers
balancing in the first and second moments (and potentially higher moments) of the covariatedistribution directly into a maximum entropy reweighting function. By doing that, the ap-proach constructs weightsw(i, k) (with i indicating individuals in the treatment group and kin the comparison group) for each observation in the comparison group such that prespecifiedbalancing constraints are exactly fulfilled. In this study, we require exact balancing on allcovariates reported in Table 4.1. Showing covariate balancing a�er reweighting becomesredundant because means and variances of all covariates of the comparison group are byconstruction identical to the means and variances of the treatment group. The advantagesof entropy balancing compared to classical propensity score matching are that (i) iterativeand somewhat arbitrary searches for a matching function becomes redundant, (ii) that themethod retains all observations and merely reweights them, which is helpful in reducingstandard errors in the estimation, and (iii) most importantly that it can also handle di�erencesin the variance of covariates. Especially the last point seems to be important because Table 4.1reveals large di�erences in the earnings variance prior to the reform between the treatmentand comparison group.
Using the weights w(i, k), Equation (4.2) formulates the estimator for the treatment e�ect(Heckman, Ichimura and Todd, 1997; Heckman et al., 1998; Todd, 2008). In this setting, n1 isthe number of treated individuals and group membership is indicated by I1 (treated) and I0(comparison), respectively. The counterfactual comparison group is a weighted average ofthe change in outcome variables with weights equal tow(i, k).
α̂2 =1
n1
∑i∈I1
[(Y after
1i − Y before0i ) −
∑k∈I0
w(i, j)(Y after0j − Y before
0j )
](4.2)
The estimator is implemented in a di�erence-in-di�erences regression (see Equation (4.1)) witheach individual weighted byw(i, k) and standard errors clustered at the individual level. Theadvantage of the regression adjustment is that we can additionally partial out time-invariantselection on unobservables by including individual fixed e�ects.
4.5.4 Main Results
We start by plotting average earnings of the treatment group and the (non-matched andmatched) comparison group over time in Figure 4.3. Prior to 2003, we observe that workers inour analytical sample perform reasonably well with steadily increasing nominal earnings.29
Supporting the common trend assumption, both groups perform very similar over the entireperiod from 1994 to 2003. A�er the reform, however, earnings trajectories start to diverge.While earnings in regulated occupations seem to further increase, the earnings growth in thederegulated occupations is notably flatter. Compared to the hypothetical earnings growth of
29 Note that the steady earnings growth is likely an artefact of the sample selection where we require that eachindividual reported strictly positive earnings from 1998 to 2003. Earnings are also not adjusted for inflation.
Microeconometric Analyses on Determinants of Individual Labour Market Outcomes 137

4 Entry Barriers and the Labour Market Outcomes of Incumbent Workers
the matched comparison group, we observe a growing earnings gap between treatment andcomparison group.
Using Equation (4.1) to estimate the average earnings e�ect of the reform from 2004 to 2014,Table 4.2 reports that gross daily earnings of incumbent workers in deregulated occupationsdecrease relative to the earnings of workers in regulated occupations by about 4 percent(Column (1)). Weighting the comparison group by matching weights, the e�ect halves to -2.3percent (Column (2)). In Figure 4.4a, we plot coe�icient estimates and 95 percent confidenceintervals of yearly treatment e�ects to study the dynamics of the e�ect over time (see alsoAppendix Table A4.5). In the non-matched sample, we see that the negative e�ect on dailyearnings becomes significant in 2007, three years a�er the reform. Daily earnings are 2 percentlower for incumbent workers in deregulated than in regulated occupations at this time. Thee�ect becomes more negative over time and decreases to -7 percent in 2014. The reform e�ectbecomes gradually larger over time because new firms may need some time to be establishedand incumbent firms need some time to adapt to the reform. The reform e�ect may alsobecome larger because wage rates that are negotiated in collective bargaining agreementsneed some time until they can be changed and renegotiated. Results for the matched sampleare generally smaller, but not significantly di�erent from the non-matched results. In thissample, we already observe a significant negative coe�icient directly in the year a�er thereform. While estimates show some recovering in the years 2005 and 2006, earnings decreaseto -4.3 percent in 2014. Thus, it seems that the reform has caused a lower earnings growth forincumbent workers in the deregulated occupations compared to the earnings growth in theregulated occupations.
E�ect sizes are comparable to bargained earnings increases in collective bargaining agree-ments, which are recently around two to three percent of earnings.30 However, the e�ects ofderegulation appear rather modest when compared to the e�ects identified by Goldschmidtand Schmieder (2017) who document wage losses for jobs that have been outsourced of about10 percent to 15 percent. The same is true when compared to wage losses a�er deregulationreforms in the U.S. airline industry (Card, 1986, 1998; Hirsch and Macpherson, 2000) and thetrucking industry (Hirsch, 1993; Rose, 1987), which document wage decreases by between 10percent to 15 percent a�er deregulation. The results are more comparable to the findings ofother deregulation reforms, e.g., in Mexico (Bruhn, 2011; Kaplan, Piedra and Seira, 2011), onlythat the increase in the number of businesses due to the deregulation reform is much higherin our study. Moreover, when clustering standard errors at the occupation level to allow forarbitrary correlation of errors across workers within the same occupation, we cannot rejectthat the e�ects are statistically di�erent from zero. This casts first serious doubts on whetherthe reform has induced strong competitive pressure.
30 The yearly average collective agreement wage increase for all industries from the years 1998 to 2016 lies at 2.3percent, at 2.1 percent in the construction industry and at 2.5 percent in the raw materials and capital goodsindustry (see collective agreement database of the Hans-Böckler Foundation (2018)).
138 Microeconometric Analyses on Determinants of Individual Labour Market Outcomes

4 Entry Barriers and the Labour Market Outcomes of Incumbent Workers
Firms may also react over the extensive margin by laying o� workers. Therefore, Columns (3)and (4) in Table 4.2 report the results from linear probability models on the average unem-ployment rate in our sample. Compared to the matched (non-matched) comparison group,workers in deregulated occupations face a higher unemployment risk of 0.7 percentage-points(one percentage-point) on average. To be categorized as unemployed for this analysis, the em-ployment records have to list the worker as unemployed or that the worker is searching for ajob while currently employed.31 Figure 4.4b shows point estimates and 95 percent confidenceintervals for yearly treatment e�ects. While we do not observe e�ects for the first three years,in 2007 and 2008 the probability of being unemployed increases to statistically significant 0.8to 0.9 percentage-points.32 The probability peaks in 2009 with 1.5 percentage-points and thenhovers around one percentage-point until 2014.
In the interpretation of the e�ect size, we have to keep in mind that the sample consists onlyof individuals who held stable jobs within the same firm between 2001 and 2003. Thus, whilethe unemployment rate in this sample is zero in 2003, 3.5 percent of the workers experiencedsome unemployment in the period between 2003 and 2014. This indicates that the e�ectis about 20 percent (= 0.7/3.5) of the relative long-term unemployment probability of thesample. However, because overall employment in deregulated occupations is rather small(in 2003, only 2.4 percent of all employment subject to social security was in deregulatedoccupations; see Section 4.4.1.), the impact on the nation-wide unemployment rate may alsobe small.
In further analyses, Appendix Table A4.6 shows that the reform tended to decrease full-timeregular employment and increased marginal employment. However, results are not signifi-cantly di�erent from zero when using the matched comparison group. Therefore, we concludethat this adjustment mechanism is mainly driven by the di�erent sample compositions andless likely to be a direct e�ect of the reform.
4.5.5 Identification
The identifying assumption of these estimations is that earnings and employment in thederegulated occupations would have developed equally compared to earnings and employ-ment in the regulated occupations in the absence of the reform (common trend assumption).We already presented visual evidence that this seems to be the case in our sample (see Fig-ures 4.3 and 4.4).33 Table 4.1 also already documented that there is barely any economicallymeaningful di�erence in the average earnings growth between the treatment and comparison
31 We do not consider individuals who drop out of the sample or report zero earnings.32 E�ects are again not significant when clustering at the occupation level.33 Appendix Figure A4.1 plots average gross daily log earnings of incumbent workers in the regulated andderegulated occupations relative to the year 2003. The figure reiterates that trends before the reform are verysimilar.
Microeconometric Analyses on Determinants of Individual Labour Market Outcomes 139

4 Entry Barriers and the Labour Market Outcomes of Incumbent Workers
group.34 Those non-significant pretreatment trends in the non-matched sample suggest thatdi�erences between the matched and non-matched reform e�ects are more likely due todi�erent compositions of workers in regulated and deregulated occupations and not due todi�erent pre-reform economic trends.
To investigate common trends in pretreatment periods more formally, we move the reform tothe year 1998 to check whether the earnings pattern has already diverged between regulatedand deregulated occupations before 2003 in our baseline sample.35 Results in AppendixTable A4.8 confirm the descriptive analysis from Figure 4.3 that there are no meaningfulpretreatment trends in our baseline sample (Columns (1) and (2)). However, it could be thatearnings have diverged between the two occupational groups more generally. This may alsoa�ect future earnings of workers in our sample. Therefore, we use a new sample of workers,imposing the same set of sample restrictions as in our baseline case with 1998 as the referenceyear. Matching is performed on the years 1993 to 1998. On average, we find that workers inderegulated occupations even have slightly higher earnings over time prior to the reform yearin 2003. However, there are significant and negative e�ects in the non-matched sample forearnings in 2002 and 2003 of about -0.8 percent and -1.6 percent, respectively. The matchedsample does not show any economically significant earnings e�ects over the same period.This underscores the importance of using matching weights to correct for di�erent samplecompositions.
The common trend assumption may also be violated if the reform was anticipated by firmsand workers, which would give them the opportunity to self-select into one of the treatmentgroups. This is unlikely because the reform was passed and implemented within the year of2003, which made it di�icult for workers to switch occupations and for firms to adjust theirbusiness model already prior to the reform. In addition, restricting the sample to regularemployees who work in the same occupation and in the same firm for three years prior to thereform avoids that our results are a�ected by endogenous switching. However, because thesample would be larger by about a third without these restrictions, e�ects may be subject toa sample selection bias. Results are qualitatively and quantitatively similar when we allowfor occupational and firm switches before the reform and include non-regular employees(including unemployment and apprenticeship spells) (see Appendix Table A4.9). This impliesthat the results do not strongly depend on the sample restriction and it also implies thatswitching before the reform is not systematically related to the reform.
34 Appendix Table A4.7 shows that matching successfully addresses remaining di�erences in the earnings growthbetween the two groups.35 The reference year 1998 is arbitrarily chosen. However, the analysis needs a su�icient number of years beforeand a�er any given pseudo treatment year. We use five pretreatment years as in the baseline case. By starting inthe year 1993, the analysis avoids major economic changes that are due to the German reunification in 1989/90.The analysis stops in 2003 with the start of the true treatment. Thus, the years 1993 and 2003 establish thenatural upper and lower bounds for a common trend analysis. In any case, showing yearly treatment e�ectsmake the exact year of the pseudo-treatment less important.
140 Microeconometric Analyses on Determinants of Individual Labour Market Outcomes

4 Entry Barriers and the Labour Market Outcomes of Incumbent Workers
Another threat to identification comes from changes in the economy which a�ect deregulatedoccupations more negatively than regulated occupations in the period a�er 2004. As outlinedin Section 4.2, the reform was part of a larger reform package that aimed at reforming labourmarket institutions (especially unemployment insurance systems and assistance) and theorganization of the Federal Employment Agency. It is unlikely that these other reforms haddi�erential impacts on regulated and deregulated occupations, especially because the wagesetting process was not a�ected at all (Dustmann et al., 2014). We are more concerned abouttwo economic events that happened closely a�er the reform. The first event is the enlargementof the European Union in 2004 and 2007, which granted citizens from new member countriesaccess to the German labour market.36 While the data clearly show that the share of foreignworkers is twice as large in deregulated occupations than in regulated occupations (seeTable 4.1), these shares do not change much over time. For example, the SIAB data showthat overall 5.6 percent (10.7 percent) of workers in regulated (deregulated) occupations wereforeign citizens in the year 2003. These numbers change to 5.7 percent and 10.8 percent in2010, representing a negligible increase.37 The most likely reason for this low increase in theforeign workforce is that Germany allowed unlimited access to the German labour market forthe new 2004 (2007) member countries only from 2011 (2014) onwards. Nevertheless, we usea regional approach to test whether changes in the share of foreign workers at the county levela�ects the reform estimates. The share of foreign workers at the county level is computedbased on all workers in the SIAB data. Columns (1) and (3) of Table 4.3 show the results ofa triple di�erence-in-di�erences model, which interacts the yearly share of foreign workerswith the treatment interaction. We do not observe that the share of foreign worker interactsin meaningful ways with the treatment e�ect.
A second event is the economic and financial crisis of 2009. While earnings start to decreasemore in deregulated occupations than in regulated occupations already in 2007, Figure 4.4asuggests that workers in deregulated occupations are hit more by the crisis than workers inregulated occupations in 2009. However, the larger reform e�ect in 2009 seems to disappearagain in 2010 with e�ect sizes that are almost the same as in 2008. The most likely reason forthis seemingly transitory shock is that the crisis a�ected had its strongly e�ects on the export-oriented manufacturing sector which also comprised the largest share of individuals workingin deregulated occupations (see Table 4.1).38 Rinne and Zimmermann (2012) document thatmanufacturing production recovered quickly a�er the crisis, which may explain the transitoryincrease of the reform e�ect in 2009. Running regressions within industry groups, Appendix
36 In 2004, ten countries joined the EU: Cyprus, the Czech Republic, Estonia, Hungary, Latvia, Lithuania, Malta,Poland, Slovakia, and Slovenia. In 2007, Bulgaria and Romania joined the EU.37 Occupation-level regression results confirm no relationship between the share of foreign workers in deregu-lated compared to regulated occupations and the reform (Column (7) in Table 4.7). We stop in 2010 because theFederal Employment Agency introduced a new occupational classification (KldB2010) in the year 2011, which isvery close to the International Standard Classification of Occupations 2008. However, the major revision makesit impossible to clearly map old and new occupations, which basically invalidates comparisons over longer timeperiods.38 Rinne and Zimmermann (2012) document that the GDP in manufacturing decreased by 18 percent in 2009.
Microeconometric Analyses on Determinants of Individual Labour Market Outcomes 141

4 Entry Barriers and the Labour Market Outcomes of Incumbent Workers
Table A4.10 shows that the reform e�ects within manufacturing are in line with the baselinee�ects. The average e�ect seems more driven by the reform e�ects in the construction andtrade, maintenance, and repair industries, which are almost two times as large as the e�ect inmanufacturing. This shows that it is important to match on industry groups in the entropybalancing such that the e�ect is not dominated by a particular characteristic of the sample.
However, Rinne and Zimmermann (2012) also document that the crisis hit some regionsharder than others because economic activity and industries are unequally distributed acrossGermany. Using the unemployment share of the county as an indicator for the severity ofthe crisis, we estimate another triple di�erence-in-di�erences model to test the interactionof the crisis with the reform e�ect at the regional level (Columns (2) and (4) of Table 4.3).We use again all workers in a county to compute regional unemployment shares by usingthe SIAB data. While we do not find that reform-induced unemployment e�ects are strongerin regions with high unemployment growth, we do find that the earnings e�ect is slightlystronger with increasing unemployment: a one percentage-point increase in the regionalunemployment rate (seven percent increase in the national unemployment rate in 2003)39
increases the reform e�ect by 0.17 percentage-points. While this does not seem to be a stronge�ect when compared to the main reform e�ect of -2.34 percent, this indicates that localeconomic conditions matter to a certain extent for the outcome of the reform.
Economic shocks may also hit one particular occupation across industries (instead of severaloccupations within one industry). This may be a threat to our identification because it wouldmake other occupations that do not experience the shock bad comparisons. In our mainanalysis, we match on industries in the entropy balancing because we are more concernedabout industry-specific economic shocks (see above) than about occupation-specific shocks.Nevertheless, Appendix Table A4.16 provides alternative results when matching on sevencra� groups, categorizing occupations of the cra�s sector along similar tasks (see AppendixTable A4.1).40 The classification of occupations comes from the German Confederation ofSkilled Cra�s and includes (i) building and interior finishes trades, (ii) electrical and metal-working trades, (iii) woodcra�s and plastic trades, (iv) clothing, textiles, and leather cra�sand trades, (v) food cra�s and trades, (vi) health and body care trades as well as the chemicaland cleaning sector, and (vii) graphic design. Compared to the baseline specification, we findlarger reform e�ects when matching on cra� groups instead of industry groups. This suggeststhat controlling for industry-specific shocks may be more important.
A further threat to identification is that workers in deregulated occupations switch systemati-cally to close occupations in regulated occupations because they may receive higher earningsthere. This would contaminate the comparison group because the comparison group would
39 The average unemployment rate among all workers subject to social security payments in 2003 was equal to14 percent. The national rate of unemployment (including the entire workforce) was somewhat lower at 11.6percent in 2003 Federal Statistical O�ice (2018a).40 The overlap between industries and cra� groups is not large enough to consider cra� occupation-by-industryspecific e�ects.
142 Microeconometric Analyses on Determinants of Individual Labour Market Outcomes

4 Entry Barriers and the Labour Market Outcomes of Incumbent Workers
also be a�ected by the treatment. To shed some light on the extent of switching, we estimatewhether workers switch occupations and firms more frequently in deregulated compared toregulated occupations a�er the reform. Based on the matched comparison group, AppendixTable A4.11 reveals that occupational and firm switching is not systematically di�erent be-tween deregulated and regulated occupations (Columns (1) and (3)).41 However, at a moreaggregated level, workers are slightly more likely to switch from a deregulated occupation toa regulated occupation a�er the reform than the other way around (Column (2) in AppendixTable A4.11). Given that we assign treatment status based on the occupation in 2003, occu-pational switching between occupational groups would lead to an underestimation of thereform e�ect (assuming that switchers change occupations to earn higher wages).
Another way of studying the impact of potential switching on the reform e�ect is to dropregulated and deregulated occupations that are similar to each other. From the list of occu-pations, we identified three occupational groups that have to perform similar tasks. Theseoccupational pairs are (i) tile, slab and mosaic layer and cast stone and terrazzo maker (bothderegulated) and bricklayer and concretor (regulated), (ii) metal former, galvaniser, and metaland bell founder (all deregulated) and metal worker (regulated), and (iii) interior decorator(deregulated) and installer and heating fitter (regulated). Because of similar task requirements,skills should be more transferable and workers may find it particularly easy to switch betweenthese occupations. As expected, dropping those occupations from the sample yields largerreform e�ects (Appendix Table A4.12). Especially dropping occupations in sample (ii) raisesreform e�ects from -2.3 percent to -3.3 percent for earnings and from 0.7 percent to 1 percentfor unemployment. One reason could be that workers can switch occupations between thesecra� occupations very easily. Another interpretation could be that because those occupationsare o�en in the industrial manufacturing sector and not in the cra�s sector, the reform wouldnot a�ect earnings and unemployment in these occupations.
4.5.6 Heterogeneity by Firm Size
As mentioned earlier, the SIAB does not allow to distinguish between cra� businesses andbusinesses in other industries. This may attenuate the reform e�ect if our sample comprises alot of firms that are not directly a�ected by the reform. Because cra� businesses are usuallyrather small with no more than nine employees on average,42 and because we know thatthe reform has mainly produced one-man businesses, we expect that the reform e�ect isstrongest among small firms. The e�ects should also be considerable weaker in larger firmsbecause they may absorb the reform e�ect more easily and workers who are not working in thecra� sector can only be a�ected indirectly. Table 4.4 shows results by pretreatment average
41 In the non-matched sample, we observe that occupational switching is stronger in the deregulated occupationsthan in the regulated occupations a�er the reform. However, workers in deregulated compared to regulatedoccupations are less likely to change their firm a�er the reform. Results not shown.42 For example, the Federal Statistical O�ice (2018b) reports that the average firm has about nine employees,ranging from two to 33 employees depending on the specific occupation.
Microeconometric Analyses on Determinants of Individual Labour Market Outcomes 143

4 Entry Barriers and the Labour Market Outcomes of Incumbent Workers
firm size of the individual worker (see Appendix Figures A4.2 and A4.3 for yearly treatmente�ects). The entropy balancing procedure is rerun within each subsample to ensure a validcomparison group. The findings confirm our expectations. For workers in firms with less than20 employees, the reform e�ect in terms of earnings and unemployment is twice as large asin the overall sample. The e�ect fades out with increasing firm size.
4.5.7 Attrition
Overall, we observe that only 6.8 percent of all person-year observations are missing in ouranalysis. While workers may disappear from the social security records for various reasons(leave the labour force, migrate abroad, become a public servant, pass away), the reformshould also have triggered attrition in the deregulated occupations because self-employedworkers are not listed in the social security records. Dropouts account for 79 percent ofmissing person-year observations (5.4 percent of all person-year observations). Columns (1)and (2) of Table 4.5 document that workers drop out (slightly) more frequently in deregulatedoccupations than in regulated occupations. Appendix Table A4.13 reveals that yearly treatmente�ects may also increase up to 1.7 percentage-points in the year 2012. The other 21 percent ofmissing person-year observations (1.4 percent of all person-year observations) are not in theanalysis because workers report missing or zero earnings. This may happen when workersare still registered, but the employer does not report any earnings that are subject to socialsecurity payments. We do not know why no earnings are reported for these workers. However,it seems likely that some of them have become self-employed while still being registered withtheir former employer. Excluding dropouts, Columns (3) and (4) of Table 4.5 document thereporting of zero and missing earnings is also more frequent in deregulated occupations thanin regulated occupations. Finally, Columns (5) and (6) of Table 4.5 show highly significantresults for selective attrition, which is due to either dropping out or reporting of non-positiveearnings, respectively.
To get an idea about the (average) ability of potential new business owners, we comparethe earnings in 2003 of workers who we know drop out in future periods to the earningsof workers who do not drop out.43 Appendix Table A4.14 shows that dropouts who dropout at some year between 2004 and 2014 earn 11 percent less than non-dropouts in 2003(Column (1)). This negative selection is not di�erent between workers in deregulated versusregulated occupations (Column (2)). However, when concentrating on workers who drop outimmediately a�er the reform in the years 2004 to 2006 (2004 to 2008), we observe that theearnings disadvantage of dropping out of the social security records is five (three) log-pointslower for workers in deregulated occupations than in regulated occupations. However, theearnings disadvantage for dropping out is also six (five) log-points larger than in the averageover all years, leaving the overall negative earnings selection almost unchanged. Hence, whiledropouts from deregulated occupations earn slightly higher earnings than dropouts from
43 By dropouts, we refer to workers who drop out from the sample due to disappearing from the social securityrecords or due to reporting zero or missing earnings.
144 Microeconometric Analyses on Determinants of Individual Labour Market Outcomes

4 Entry Barriers and the Labour Market Outcomes of Incumbent Workers
regulated occupations, they still earn much lower earnings than workers who do not dropout. It is also interesting to note that the earnings advantage completely vanishes for laterdropouts in the years 2009 to 2014, indicating that the positive selection appears only in theearly periods.
Dropping out of the sample can also be related to other background characteristics. Control-ling for interactions between educational, personal, and job characteristics and whether theworker has worked in a deregulated occupation in 2003, further narrows the earnings gap be-tween dropouts and non-dropouts in deregulated occupations in 2003 (Appendix Table A4.15).However, it is still the case that dropouts are negatively selected compared to non-dropoutsin deregulated occupations. These findings suggest that working in a high-paying job prior tothe reform creates low incentives to start an own business.
Attrition may also be an identification problem if it is not related to the reform. For example,we would also detect a reform e�ect if workers in deregulated occupations with an otherwisehigher earnings growth dropped out of the sample. We already document above that thisis unlikely given that those who drop out are those with below-average earnings. Neverthe-less, we can test how large earnings of dropouts need to be for our results to go away. Webring missing observations back into the sample by imputing di�erent percentiles where thepercentiles are based on the yearly earnings distribution of workers in the cra�s sector. InTable 4.6, we calculate the average reform e�ects with those imputations at the 10th, 25th,50th, 75th, and 90th percentile. Estimates are generally in the same ballpark as our baselinee�ect of -2.34 percent. Even imputing the 90th percentile for everyone how dropped out ofthe sample gives still a negative and significant reform e�ect of -1.3 percent.
4.6 Reform E�ects on Overall Employment and Earnings
To set the results into perspective, we now turn to economy-wide e�ects of the reform. Theorysuggests that the deregulation should have had beneficial e�ects for employment growthand perhaps also for earnings growth (with only incumbent workers seeing earnings and em-ployment losses). We then also turn to a discussion about how the earnings of self-employedindividuals have changed due to the reform.
4.6.1 Employment and Earnings of Employees (SIAB)
Using SIAB data, Figures 4.5a and 4.5b present the evolution of employees subject to socialsecurity before and a�er the reform in deregulated, regulated, and other occupations (relativeto the year 2003). The analytical sample is based on workers who report valid occupationalcodes, work in firms with less than 1,500 employees, and are between 20 and 60 years old. Theanalysis starts in the year 1999 and stops in the year 2010 due to changes in the occupationalclassifications, which do not allow a coherent comparison over time. While total employmentin other occupations has increased by about 5 percent in 2010 and employment in regulated
Microeconometric Analyses on Determinants of Individual Labour Market Outcomes 145

4 Entry Barriers and the Labour Market Outcomes of Incumbent Workers
occupations has stabilized at some lower level, we observe ongoing decreases in employmentlevels in deregulated occupations. Results are confirmed by occupation-level regression usingoccupation fixed e�ects (Columns (1) to (3) in Table 4.7). They show that employment inderegulated occupations has decreased by about 8 percent more on average than in regulatedoccupations.44
Average earnings for (new and incumbent) employees at the occupational level are lowerin deregulated than in regulated occupations by about 1 percent to 1.6 percent (Column (5)and (6) in Table 4.7). However, the average e�ect is probably only due to the large drop inearnings in the year 2009 (see Figure 4.5c). The most likely reason for this drop is again thatthe economic crisis hit in particular the manufacturing sector, which employs the majority ofworkers in deregulated occupations. The analysis suggests that occupation-level regressionsare not able to capture the reform e�ects on incumbent workers because they do not trackindividual workers over time.
One of the reform goals was to halt the negative trend in apprentice numbers in cra� occu-pations through establishing new firms. However, opponents of the reform argued that thederegulation would do the opposite because the Master Cra�s Certificate is seen as a qualifi-cation (and also uno�icial obligation) to educate apprentices. Furthermore, the deregulationundermined firms’ incentives to educate apprentices, because they now could become directcompetitors by founding their own business, upon completion of their apprenticeship. A�erthe reform, business owners without a Master Cra�s Certificate had to apply for the right toemploy apprentices. Using SIAB data, Figure 4.5d indicates that the number of apprenticeshas decreased more in deregulated occupations than in regulated occupations. However,occupation-level regressions do not find a significant relationship between the number of ap-prenticeships in deregulated compared to regulated occupations and the reform (Column (4)in Table 4.7). These results are confirmed when examining firm registry data from the Ger-man Confederation of Skilled Cra�s in Appendix Figure A4.4. While there is a clear continueddownward trend in apprentice numbers in cra� occupations, the regulated and deregulatedoccupations do not actually di�er in the numbers of apprenticeships and apprenticeship finalexaminations.45
Overall, the results imply that the newly established firms did not create new job opportuni-ties. This is in strong contrast to other deregulation reforms studied elsewhere. Before wediscuss likely reasons for these di�erences to other studies in the literature in the next section,
44 By contrast, Koch and Nielen (2016) use representative firm panel survey data to evaluate the reform anddo not find significant e�ects on employment. They also do not find e�ects on lay-o�s, limited-term contracts,part-time work, and the number of employees on union tari�s. While our study, which uses administrativeindividual-level worker data, clearly indicates negative employment e�ects, the bottom line is that it is highlyunlikely that the reform has triggered positive employment growth.45 Koch and Nielen (2016) find slightly positive e�ects on the number of apprentices in deregulated compared toregulated occupations when using firm survey data. Results may di�er because the survey data contain onlyfirms with at least one employee subject to social security, biasing the results toward larger firms.
146 Microeconometric Analyses on Determinants of Individual Labour Market Outcomes

4 Entry Barriers and the Labour Market Outcomes of Incumbent Workers
we examine the performance of self-employed cra�smen. The analysis should give us anindication about the role of the entrepreneurs in explaining the reform e�ects.
4.6.2 Net Income of Self-Employed and Employees (Microcensus)
The SIAB data do not allow us to identify self-employed individuals because they are notsubject to social security payments. To study reform e�ects on the income situation of self-employed individuals, we use repeated cross-sections from the German Microcensus. Thelarge sample size enables us to concentrate on the labour market position of self-employedindividuals in cra� occupations. We can also verify the SIAB results on the overall economicsituation of employees in cra� occupations, using measures of net income instead of grossearnings. However, the cross-sectional nature of the survey does not allow us to track indi-viduals over time, which leaves us with comparing yearly occupational averages. This raisesconcerns about common trends in pretreatment periods, which we try to mitigate by control-ling for individual covariates and occupation fixed e�ects in the occupation-level regressionanalysis. Moreover, we cannot distinguish between newly self-employed individuals andindividuals who were already self-employed before the reform.
While we find that the number of self-employed individuals has increased in deregulatedcompared to regulated occupations (see also Rostam-Afschar, 2014; Runst et al., 2018a), we donot find substantial income e�ects for workers who work in cra� occupations (Columns (1) and(2) in Table 4.8). Studying the e�ects by employment status, we find negative but statisticallynon-significant e�ects on self-employed individuals, whereas the e�ects for employees areslightly positive (Columns (3) and (5) in Table 4.8).46 However, controlling for age, gender,highest school degree, highest professional degree, and nationality, we do not detect anyreform e�ects (Columns (4) and (6) in Table 4.8). The latter result confirms small overallearnings e�ects that we found with the SIAB data.
To sum up, the microcensus analysis suggests that the economy-wide economic position ofself-employed and employees has not changed dramatically a�er the reform. This is surprisinggiven that the reform substantially increased entrepreneurial activity. In the next section, wediscuss likely reasons for the reform e�ects.
4.7 Discussion
The reform of the German Trade and Cra�s Code in the year 2004 has led to a large increase inthe foundation of new businesses. While there has been no notable growth in the numberof new establishments in either occupational group, we documented that the number ofderegulated businesses increased annually by 26 percent in the first three years and then
46 Appendix Figure A4.6 plots average log monthly personal income of employees and self-employed individualsin cra� occupations over time.
Microeconometric Analyses on Determinants of Individual Labour Market Outcomes 147

4 Entry Barriers and the Labour Market Outcomes of Incumbent Workers
increased further by about 5 percent each year from 2007 to 2014. This is substantially highercompared to other deregulation reforms that are studied in the literature. For example, similarreforms in France, Mexico, Portugal, and India led to increases of between 5 percent and17 percent in the number of new firms (Aghion et al., 2008; Bertrand and Kramarz, 2002;Branstetter et al., 2014; Bruhn, 2011; Kaplan, Piedra and Seira, 2011).
As theory would suggest, we find that the economic position of incumbent workers in deregu-lated occupations compared to workers in regulated occupations was negatively a�ected bythe reform. On average, earnings increased less strongly by about 2.3 percent for deregulatedoccupations than for regulated occupations a�er the reform. The strength of the earningsreform e�ect is almost linearly increasing (in absolute terms) over time. For unemployment,we find an average increase of about 0.7 percent. As mentioned earlier, the earnings losses ofincumbent workers seem to be rather small compared to the large increase in new firms. Incontrast to the theory, however, we do not find increases in overall employment or averageearnings for new employees. This is also not in line with almost all of the studies mentionedbefore because these studies also document that deregulation triggers employment growthand also sometimes earnings growth for other employees.
What can explain the relatively small reform e�ect with respect to earnings? To have enduringand large labour market e�ects, the newly established businesses would have to representstable competitors for incumbent firms. While the aggregate numbers in Figure 4.1 indicatethat the stock of businesses is strictly increasing, findings by Müller (2014, 2016) indicate thatthe composition of firms has changed over time. Studying survival rates of newly foundedbusinesses, he shows that five-year survival rates hovered around 70 percent in both regulatedand deregulated occupations before the reform and dropped to around 50 percent in thederegulated occupations a�er the reform. Thus, about 60 percent of newly established firmshad already disappeared a�er five years (Müller, 2014, 2016). This is in line with the theoreticalmodel of Branstetter et al. (2014) who show that new firms have lower survival probabilitiesthan incumbent firms. Their model further postulates that new entrepreneurs have relativelylower talent than those already in the market. While we cannot compare skills of incumbententrepreneurs with the skills of new entrepreneurs, our dropout analysis in Section 4.5.7suggests that new entrepreneurs are not a positive selection when compared to the averageworker in the cra� occupations. Accordingly, Runst et al. (2018a) show that both entry andexit rates of firms have increased in the deregulated cra�s a�er the reform.
Furthermore, customers may have discriminated between cra�s o�ered by newly establishedfirms and cra�s o�ered by incumbent firms because incumbent firms still hold a MasterCra�smen Certificate to signal superior quality of their goods and services. In other words, itcould be that the two firms were not o�ering perfectly substitutable cra�s, which would havemitigated competitive pressure for incumbent firms. There are some pieces of evidence thatthis was the case. For example, Fredriksen, Runst and Bizer (2018) show that customers stillvalue the Master Cra� certificate and that firms in deregulated occupations use the certificateas a quality signal. While e�ective competitive pressure should have reduced prices for
148 Microeconometric Analyses on Determinants of Individual Labour Market Outcomes

4 Entry Barriers and the Labour Market Outcomes of Incumbent Workers
customers, there is little evidence that aggregate price indicators for goods and services inthe di�erent occupations are largely a�ected by the reform (RWI, 2012). However, becausedetailed data on prices are not available, the results of this analysis remain rather speculative.However, if firms do not experience large pressure to lower prices, we should observe that theearnings disadvantage of the reform is smaller for a selected group of workers who remainwith the same firm and stay in the same occupation a�er the reform. Columns (4) to (7) inAppendix Table A4.11 indicate that this is the case. The earnings e�ect is only half of theaverage e�ect for workers who have not changed the firm or the occupation. Treatmente�ects are much larger for occupation and firm switchers. Moreover, incumbent firms mayhave reduced competitive pressure by investing more in technology and innovation. However,Koch and Nielen (2016) use data from a representative establishment panel and find that thereform had insignificant e�ects on investments (per establishment or employee) and productinnovations.
What can explain the absence of a reform e�ect on overall employment and average earningsfor other employees? Müller (2014, 2016) shows that the majority of newly founded firms wereand remained one-man businesses with very little apprenticeship activity. He documents thatshares of one-man businesses in the deregulated occupations increased from 24 percent in1995 to 61 percent in 2012. The likely reason for limited employment growth was that newlyestablished firms were not able to compete at a large scale with incumbent firms. Therefore,they remained relatively small with little creation of further employment. The absence ofhigher labour demand through the new firms may also explain why there has not been ane�ect on average earnings growth for other employees in the economy.
4.8 Conclusion
In this chapter, we study the labour market e�ects of the reform of the German Trade andCra�s Code in 2004. Abolishing the requirement to hold a Master Cra�s Certificate to open anew business increased entrepreneurial activity massively, tripling the number of businesseswithin ten years. Using administrative longitudinal social security data and German Microcen-sus data, we find that the reform led to decreasing earnings and increasing unemployment forincumbent workers. However, contrary to the theory, the reform did not trigger employmentand earnings growth for others in a�ected occupations. The most likely reason for this findingis that the newly established firms remained one-man business with low ability to competeagainst incumbent firms. This makes it also unlikely that the reform strongly a�ected pricesin the cra�s sector. While the reform may have increased choice for customers, we concludethat the reform led to an average welfare loss for incumbent cra� workers in deregulatedoccupations because they experienced employment and earnings losses without having theopportunity to exploit new employment possibilities.
The study contributes to the current literature by documenting the labour market e�ectsof a deregulation reform that failed to produce intended e�ects of increasing employment
Microeconometric Analyses on Determinants of Individual Labour Market Outcomes 149

4 Entry Barriers and the Labour Market Outcomes of Incumbent Workers
dynamics within an industry. This is the case even if the increase in entrepreneurial activitywas much larger in the German reform than it was in reforms studied elsewhere. It is alsoone of the few studies that uses longitudinal administrative earnings data to track the sameworkers over long time periods. This allows us to sort out unobserved individual heterogeneityfrom the impact of di�erent sample compositions.
While decreasing entry barriers should generally foster competition, entrepreneurial activity,innovation, and employment growth, policy makers should be aware that there may be unin-tended consequences when the newly created businesses do not compete with incumbentfirms. If this is the case, it is likely that there are further (more important) barriers in placethat hold back new firms from becoming stable competitors. Thus, each deregulation reformshould collect and carefully evaluate possible industrial and occupational entry barriers be-fore the reform is implemented. While it is di�icult to identify all sorts of entry barriers inadvance, the success of each reform has to be constantly monitored and evaluated.
150 Microeconometric Analyses on Determinants of Individual Labour Market Outcomes

4 Entry Barriers and the Labour Market Outcomes of Incumbent Workers
Figures and Tables
Figure 4.1 : Changes in Number of Businesses (relative to 2003)
1.0
1.5
2.0
2.5
3.0
1998 2000 2002 2004 2006 2008 2010 2012 2014
RegulatedDeregulatedTotal
Notes: The figure shows the number of business in the deregulated and regulated cra�s. In 2003, the number ofbusinesses in the regulated (deregulated) cra�s sector was 587,762 (74,940).Source: German Confederation of Skilled Cra�s
Microeconometric Analyses on Determinants of Individual Labour Market Outcomes 151

4 Entry Barriers and the Labour Market Outcomes of Incumbent Workers
Figure 4.2 : Self-Employment and Master Cra� Examinations (relative to 2003)
0.8
1.0
1.2
1.4
1997 1999 2001 2003 2005 2007 2009 2011
Deregulated Regulated
(a) Self-employed
0.4
0.6
0.8
1.0
1.2
1.4
1998 2000 2002 2004 2006 2008 2010 2012
RegulatedDeregulated
(b) Master Cra� Examinations
Notes: The figure shows the share of self-employed individuals in Figure (a) and the number of master cra�examinations in Figure (b). Both figures show values relative to the year 2003.Source: Microcensus (Figure (a)) and German Confederation of Skilled Cra�s (Figure (b))
152 Microeconometric Analyses on Determinants of Individual Labour Market Outcomes

4 Entry Barriers and the Labour Market Outcomes of Incumbent Workers
Figure 4.3 : Log Earnings Before and A�er the Reform
4.1
4.2
4.3
4.4
4.5
1994 1996 1998 2000 2002 2004 2006 2008 2010 2012 2014
Regulated: non-matchedDeregulatedRegulated: matched
Notes: The figure shows average log gross daily earnings for the sample of incumbent workers. Earnings are incurrent values and not adjusted for inflation.Source: SIAB
Microeconometric Analyses on Determinants of Individual Labour Market Outcomes 153

4 Entry Barriers and the Labour Market Outcomes of Incumbent Workers
Figure 4.4 : E�ect on Log Earnings and Unemployment for Incumbent Workers over Time
0.02
0.00
-0.02
-0.04
-0.06
-0.08
1998 2000 2002 2004 2006 2008 2010 2012 2014
Matched Non-matched
(a) Log daily earnings
-0.01
0.00
0.01
0.02
0.03
1998 2000 2002 2004 2006 2008 2010 2012 2014
Matched Non-matched
(b) Unemployment
Notes: The figure shows coe�icient estimates and 95% confidence intervals of the reform e�ect on log grossdaily earnings in Figure (a) and on unemployment in Figure (b) for the sample of incumbent workers.Source: SIAB
154 Microeconometric Analyses on Determinants of Individual Labour Market Outcomes

4 Entry Barriers and the Labour Market Outcomes of Incumbent Workers
Figure 4.5 : Overall Employment and Earnings (relative to 2003)
0.80
0.90
1.00
1.10
1.20
1998 2000 2002 2004 2006 2008 2010
RegulatedDeregulatedOther occupations
(a) Total employment
0.80
0.90
1.00
1.10
1.20
1998 2000 2002 2004 2006 2008 2010
RegulatedDeregulatedOther occupations
(b) Full-time employment
0.80
0.90
1.00
1.10
1.20
1998 2000 2002 2004 2006 2008 2010
RegulatedDeregulatedOther occupations
(c) Gross daily earnings
0.80
0.90
1.00
1.10
1.20
1998 2000 2002 2004 2006 2008 2010
RegulatedDeregulatedOther occupations
(d) Apprenticeships
Notes: The figure shows average employment and gross daily earnings in deregulated, regulated, and otheroccupations. The analytical sample is based on workers who report valid occupational codes, work in firms withless than 1,500 employees, and are between 20 and 60 years old. Figure (a) plots total employment. Figure (b)restricts the sample to workers who are employed as regular full-time employees. Figure (d) restricts the sampleto apprentices. Figure (c) plots average daily earnings over all individuals who report positive earnings. Earningsare in current values and not adjusted for inflation. All time series are relative to the year 2003.Source: SIAB
Microeconometric Analyses on Determinants of Individual Labour Market Outcomes 155

4 Entry Barriers and the Labour Market Outcomes of Incumbent Workers
Table 4.1 : Covariate Balancing Before Matching, 2003
(1) (2) (3) (4) (5)
Deregulated Regulated Mean di�erence
Mean Variance Mean Variance ∆ Sig.
Log daily gross earnings 2003 4.351 0.166 4.421 0.148 -0.070 ***Log daily gross earnings 2002 4.340 0.156 4.403 0.135 -0.063 ***Log daily gross earnings 2001 4.323 0.156 4.384 0.133 -0.061 ***Log daily gross earnings 2000 4.281 0.175 4.342 0.152 -0.061 ***Log daily gross earnings 1999 4.236 0.192 4.304 0.168 -0.068 ***Log daily gross earnings 1998 4.191 0.211 4.254 0.192 -0.063 ***Female 0.229 0.177 0.089 0.081 0.140 ***Foreigner 0.086 0.079 0.042 0.040 0.044 ***Age: 12-34 0.183 0.150 0.231 0.178 -0.048 ***Age: 35-45 0.463 0.249 0.474 0.249 -0.011 ***Age: 46-55 0.354 0.229 0.294 0.208 0.060 ***Training: none 0.181 0.148 0.056 0.052 0.125 ***Training: vocational 0.764 0.181 0.872 0.112 -0.108 ***Training: university 0.018 0.018 0.042 0.041 -0.024 ***Training: missing info 0.037 0.036 0.031 0.030 0.006 ***Schooling: Haupt-/Realschule 0.920 0.271 0.895 0.094 0.025 ***Schooling: FH-Reife / Abitur 0.042 0.040 0.074 0.069 -0.032 ***Schooling: missing info 0.038 0.037 0.031 0.030 0.007 ***Ever unemployed 0.035 0.034 0.034 0.033 0.001Ever marginally employed 0.002 0.002 0.001 0.001 0.001 ***Changed firm within 6 years before reform 0.201 0.161 0.254 0.190 -0.053 ***Changed occupation within 6 year pre reform 0.145 0.124 0.134 0.116 0.011 **Industry: manufacturing 0.773 0.176 0.383 0.236 0.390 ***Industry: construction 0.062 0.058 0.338 0.224 -0.276 ***Industry: wholesale and retail trade 0.061 0.057 0.090 0.082 -0.029 ***Industry: real estate and business activities 0.071 0.066 0.057 0.054 0.014 ***Industry: other industries 0.033 0.032 0.132 0.114 -0.099 ***Tasks: professional tasks 0.949 0.049 0.808 0.155 0.141 ***Tasks: complex specialized tasks 0.051 0.049 0.192 0.155 -0.141 ***Job tenure: 0-3 years 0.127 0.111 0.185 0.151 -0.058 ***Job tenure: 4-7 years 0.283 0.203 0.299 0.210 -0.016 ***Job tenure: 8-14 years 0.365 0.232 0.334 0.223 0.031 ***Job tenure: 15-39 years 0.226 0.175 0.181 0.148 0.045 ***Firm tenure: 0-3 years 0.105 0.094 0.142 0.122 -0.037 ***Firm tenure: 4-7 years 0.249 0.187 0.270 0.197 -0.021 ***Firm tenure: 8-14 years 0.360 0.230 0.346 0.226 0.014 **Firm tenure: 15-39 years 0.286 0.204 0.242 0.183 0.044 ***Employees at firm (2001-2003 average) 241 98,528 175 85,241 66 ***Median wage at firm (2001-2003 average) 85.4 631.6 86.7 934.8 -1.3 ***Regional unemployment 2003 0.115 0.002 0.119 0.003 -0.004 ***Regional foreigner share 2003 0.070 0.003 0.065 0.003 0.005 ***Regional average daily earnings 2003 79.83 79.11 79.44 87.00 0.390 ***Growth regional unemployment 99-03 0.138 0.027 0.123 0.025 0.015 ***Growth regional foreigner share 99-03 0.061 0.109 0.083 0.142 -0.022 ***Growth regional average daily earnings 99-03 0.084 0.0004 0.085 0.0004 -0.001 ***
Growth log daily gross earnings 98-03 0.233 0.291 0.243 0.571 -0.010Growth log daily gross earnings 98-00 0.139 0.196 0.134 0.444 0.005Growth log daily gross earnings 00-03 0.093 0.088 0.103 0.306 -0.010 **Growth log daily gross earnings 94-03 0.509 0.982 0.539 2.036 -0.030
Observations 6,521 24,636Notes: The table shows mean and variance of covariates for the cross-section of workers in the year 2003 unless statedotherwise. All earnings variables are in current Euros and not adjusted for inflation. Column (5) indicates the significanceof a t-test for equality of means in the two samples. Significance level: * p<0.10, ** p<0.05, *** p<0.01.Source: SIAB
156 Microeconometric Analyses on Determinants of Individual Labour Market Outcomes

4 Entry Barriers and the Labour Market Outcomes of Incumbent Workers
Table 4.2 : Reform E�ects on Incumbent Workers
(1) (2) (3) (4)
Log daily earnings Unemployment
Non-matched Matched Non-matched Matched
Deregulatedj(i) × post2003 -0.0404*** -0.0234*** 0.0099*** 0.0069***(0.0021) (0.0063) (0.0010) (0.0024)
Constant 4.256*** 4.206*** 0.0171*** 0.0172***(0.0016) (0.0027) (0.0008) (0.0012)
R-squared 0.034 0.022 0.017 0.021Observations 496,084 493,568 503,705 501,156Individuals 31,327 31,157 31,327 31,157
Notes: The table shows average e�ects of the reform on log of gross daily earnings in Columns (1) and (2) andon being unemployed in Columns (3) and (4). Appendix Table A4.5 shows yearly treatment e�ects. Columns (1)and (3) refer to results using the non-matched comparison group and Columns (2) and (4) refer to results usingthe matched comparison group. All regressions include year and individual fixed e�ects. Average log dailyearnings are equal to 4.406 (4.351) in the non-matched (matched) sample in 2003. The unemployment rateof our sample is equal to zero in 2003 by construction and equal to 3.6% for the period from 2003 to 2014.Standard errors, clustered at the individual level, in parenthesis. Significance level: * p<0.10, ** p<0.05, ***p<0.01.Source: SIAB
Microeconometric Analyses on Determinants of Individual Labour Market Outcomes 157

4 Entry Barriers and the Labour Market Outcomes of Incumbent Workers
Table 4.3 : Reform E�ect Heterogeneity by Regional Characteristics
(1) (2) (3) (4)
Log daily earnings Unemployment
Foreign Unemployed Foreign Unemployed
Deregulatedj(i) × post2003 × share foreign 0.0067 -0.0331(0.1458) (0.0506)
Deregulatedj(i) × share foreign -0.1882 -0.0634(0.1414) (0.0591)
Post2003 × share foreign -0.1606 0.0929**(0.1201) (0.0370)
Share foreign 0.2065* 0.0776*(0.1092) (0.0404)
Deregulatedj(i) × post2003 × share unemployed -0.1730* 0.0270(0.0995) (0.0539)
Deregulatedj(i) × share unemployed 0.1860** -0.0243(0.0930) (0.0651)
Post2003 × share unemployed 0.0974 0.0695*(0.0658) (0.0371)
Share unemployed -0.7440*** 0.3720***(0.0658) (0.0474)
Deregulatedj(i) × post2003 -0.0221*** -0.0265*** 0.0075*** 0.0072***(0.0061) (0.0065) (0.0023) (0.0026)
Constant 4.206*** 4.186*** 0.0173*** 0.0285***(0.0027) (0.0030) (0.0012) (0.0018)
R-squared 0.022 0.024 0.021 0.025Observations 493,430 493,430 501,018 501,018Individuals 31,157 31,157 31,157 31,157
Notes: The table shows average e�ects of the reform on log of gross daily earnings in Columns (1) and (2)and on being unemployed in Columns (3) and (4). Share foreign refers to the percentage of foreign workersat the county level in the SIAB data. Share unemployed refers to the percentage of unemployed individualsat the county level in the SIAB data. Regional measures are based on all individuals in the SIAB who arebetween 20 and 60 years old. Both measures are computed separately by year and are demeaned to facilitateinterpretation. All regressions include year and individual fixed e�ects. Workers in the comparison group areweighted by matching weights. Standard errors, clustered at the individual level, in parenthesis. Significancelevel: * p<0.10, ** p<0.05, *** p<0.01.Source: SIAB
158 Microeconometric Analyses on Determinants of Individual Labour Market Outcomes

4 Entry Barriers and the Labour Market Outcomes of Incumbent Workers
Table 4.4 : Reform E�ect Heterogeneity by Firm Size
(1) (2) (3) (4)
Firm size (Number of employees)
Less than 20 20–100 100–250 More than 250
Panel A: log daily earnings
Deregulatedj(i) × post2003 -0.0451*** -0.0363*** -0.0270* -0.0125(0.0140) (0.0110) (0.0157) (0.0105)
Constant 4.069*** 4.182*** 4.186*** 4.321***(0.0063) (0.0046) (0.0071) (0.0047)
R-squared 0.012 0.017 0.031 0.055Observations 152,366 146,645 77,975 116,582Individuals 9,835 9,246 4,867 7,209
Panel B: unemployment
Deregulatedj(i) × post2003 0.0145*** 0.0078* 0.0051 0.0027(0.0054) (0.0046) (0.0068) (0.0041)
Constant 0.0302*** 0.0160*** 0.0162*** 0.0120***(0.0032) (0.0023) (0.0031) (0.0022)
R-squared 0.023 0.022 0.023 0.018Observations 155,446 148,999 79,014 117,697Individuals 9,835 9,246 4,867 7,209
Notes: The table shows average e�ects of the reform on log gross daily earnings in Panel A and on beingunemployed in Panel B. Sample splits, indicated in the column header, are based on the average individualfirm size from 2001 to 2003. All regressions include year and individual fixed e�ects. Entropy balancing is rerunon each subsample and workers in the comparison group are weighted by these matching weights. Standarderrors, clustered at the individual level, in parenthesis. Significance level: * p<0.10, ** p<0.05, *** p<0.01.Source: SIAB
Microeconometric Analyses on Determinants of Individual Labour Market Outcomes 159

4 Entry Barriers and the Labour Market Outcomes of Incumbent Workers
Table 4.5 : Attrition from Sample
(1) (2) (3) (4) (5) (6)
Dropped out Missing earnings Both
Non-matched
Matched Non-matched
Matched Non-matched
Matched
Deregulatedj(i) × post2003 0.0022* 0.0058* 0.0052*** 0.0044** 0.0071*** 0.0091**(0.0013) (0.0030) (0.0007) (0.0018) (0.0014) (0.035)
Constant 0.0000 0.0000 -0.0023*** -0.0020*** 0.0000 0.0000(0.0010) (0.0009) (0.0006) (0.0005) (0.0014) (0.0011)
R-squared 0.089 0.092 0.019 0.021 0.098 0.103Observations 532,559 529,669 503,705 501,156 532,559 529,669Individuals 31,327 31,157 31,327 31,157 31,327 31,157
Notes: The table documents the extent of sample attrition. In Columns (1) and (2), the dependent variable is an indicatorvariable that is one if the individual dropped out from the social security records, zero otherwise. In Columns (3) and (4),the dependent variable is an indicator variable that is one if the individual reports missing/zero earnings, zero otherwise.In Columns (5) and (6), the dependent variable is an indicator variable that is one if the individual reports missing/zeroearnings or dropped out of the sample, zero otherwise. Appendix Table A4.13 shows the results for yearly treatments.Columns (1), (3), and (5) refer to results using the non-matched comparison group and Columns (2), (4), and (6) refer toresults using the matched comparison group. All regressions include year and individual fixed e�ects. Standard errors,clustered at the individual level, in parenthesis. Significance level: * p<0.10, ** p<0.05, *** p<0.01.Source: SIAB
160 Microeconometric Analyses on Determinants of Individual Labour Market Outcomes

4 Entry Barriers and the Labour Market Outcomes of Incumbent Workers
Table 4.6 : Reform E�ects: Accounting for Attrition
(1) (2) (3) (4) (5)
Imputed earnings percentile
10th 25th 50th 75th 90th
Deregulatedj(i) × post2003 -0.0274*** -0.0218*** -0.0184*** -0.0157*** -0.0131**(0.0065) (0.0055) (0.0053) (0.0054) (0.0056)
Constant 4.191*** 4.191*** 4.191*** 4.191*** 4.191***(0.0029) (0.0025) (0.0025) (0.0026) (0.0026)
R-squared 0.018 0.020 0.035 0.052 0.066Observations 529,669 529,669 529,669 529,669 529,669Individuals 31,157 31,157 31,157 31,157 31,157
Notes: The outcome variable is imputed log gross daily earnings of incumbent workers. The imputation isbeing done for workers who have missing earnings due to attrition (drop out of the sample or report zero/noneearnings) from social security records. Missing earnings are imputed by the percentile indicated in the columnheader. Yearly earnings distributions are calculated based on daily earnings (including zero earnings) in theworking age population (20 to 60 years old). Imputing percentiles obtained from earnings distributions thatare based on log earnings yield almost identical estimates (results not shown). All regressions include yearand individual fixed e�ects. Workers in the comparison group are weighted by matching weights. Standarderrors, clustered at the individual level, in parenthesis. Significance level: * p<0.10, ** p<0.05, *** p<0.01.Source: SIAB
Microeconometric Analyses on Determinants of Individual Labour Market Outcomes 161

4 Entry Barriers and the Labour Market Outcomes of Incumbent Workers
Tabl
e4.
7:E
cono
my-
wid
eRe
form
E�ec
tson
Occ
upat
iona
lLev
el
(1)
(2)
(3)
(4)
(5)
(6)
(7)
Log
empl
oym
ent
Log
daily
earn
ings
Shar
efo
reig
nw
orke
rs
Tota
lO
ther
occu
patio
nsFu
ll-tim
eAp
pren
tices
Dere
gula
ted j×
post
2003
-0.0
835*
**-0
.192
0***
-0.1
010*
**0.
0196
-0.0
105
-0.0
162
-0.0
032
(0.0
147)
(0.0
160)
(0.0
158)
(0.0
459)
(0.0
180)
(0.0
199)
(0.0
029)
Regu
late
d j×
post
2003
-0.1
090*
**(0
.018
3)Co
nsta
nt5.
692*
**5.
950*
**5.
539*
**2.
959*
**3.
967*
**1.
732*
**0.
0956
***
(0.0
124)
(0.0
098)
(0.0
133)
(0.0
388)
(0.0
095)
(0.2
050)
(0.0
024)
Cont
rolv
aria
bles
nono
nono
noye
sno
R-sq
uare
d0.
436
0.08
00.
506
0.01
70.
294
0.42
80.
052
Obs
erva
tions
1,11
64,
100
1,11
61,
016
801,
355
801,
355
1,11
6O
ccup
atio
ns93
342
9390
9393
93
Note
s:Th
eta
ble
show
sreg
ress
ions
atth
eoc
cupa
tiona
llev
el.T
hean
alyt
ical
sam
ple
isba
sed
onw
orke
rsw
hore
port
valid
occu
patio
nalc
odes
,wor
kin
firm
swith
less
than
1,50
0em
ploy
ees,
and
are
betw
een
20an
d60
year
sold
.For
regr
essi
onsi
nCo
lum
ns(1
)to
(4)a
nd(7
),w
eco
llaps
eth
eda
tase
tatt
heoc
cupa
tion
leve
l.In
Colu
mns
(1)t
o(4
),th
ede
pend
entv
aria
ble
isth
elo
gav
erag
enu
mbe
rofw
orke
rsin
the
occu
patio
n.Co
lum
n(1
)use
allo
bser
vatio
nsin
dere
gula
ted
and
regu
late
doc
cupa
tions
.Col
umn
(2)u
sesa
lloc
cupa
tions
that
are
avai
labl
e.Co
lum
n(3
)use
sonl
yw
orke
rsw
hoar
eem
ploy
edas
regu
larf
ull-t
ime
empl
oyee
s.Co
lum
n(4
)res
tric
tsth
esa
mpl
eto
appr
entic
es.I
nCo
lum
n(7
),th
ede
pend
entv
aria
ble
isth
esh
are
ofm
igra
ntsw
ithin
the
sam
ple
ofin
divi
dual
swith
valid
occu
patio
nalc
odes
.In
Colu
mns
(5)a
nd(6
),th
ede
pend
entv
aria
ble
islo
gda
ilyea
rnin
gsan
des
timat
ion
take
spla
ceon
the
mic
roda
ta.C
ontr
olva
riabl
es:a
ge,a
gesq
uare
d,ge
nder
,edu
catio
n(8
cat.)
,and
fore
ign
citiz
ensh
ip.T
hean
alys
isis
rest
ricte
dto
the
year
sbet
wee
n19
99an
d20
10.A
llre
gres
sion
sinc
lude
occu
patio
nan
dye
arfix
ede�
ects
.Sta
ndar
der
rors
,clu
ster
edat
the
occu
patio
nall
evel
,in
pare
nthe
sis.
Sign
ifica
nce
leve
l:*p
<0.
10,*
*p<
0.05
,***
p<0.
01.
Sour
ce:S
IAB
162 Microeconometric Analyses on Determinants of Individual Labour Market Outcomes

4 Entry Barriers and the Labour Market Outcomes of Incumbent WorkersTa
ble
4.8
:Ref
orm
E�ec
tson
Mon
thly
Inco
me
and
Self-
Empl
oym
ent
(1)
(2)
(3)
(4)
(5)
(6)
(7)
(8)
Log
mon
thly
inco
me
Self-
empl
oyed
All
Empl
oyee
sSe
lf-em
ploy
ed
Dere
gula
ted j
(i)×
post
2003
0.01
170.
0084
0.01
130.
0002
-0.0
326
0.00
140.
0267
0.02
23(0
.010
7)(0
.013
4)(0
.010
8)(0
.008
7)(0
.035
3)(0
.035
2)(0
.019
9)(0
.019
3)Co
nsta
nt7.
071*
**5.
503*
**7.
052*
**5.
581*
**7.
355*
**5.
817*
**0.
068*
**-0
.613
***
(0.0
045)
(0.0
373)
(0.0
047)
(0.0
149)
(0.0
874)
(0.0
557)
(0.0
042)
(0.1
290)
Cont
rolv
aria
bles
noye
sno
yes
noye
sno
yes
R-sq
uare
d0.
102
0.25
20.
136
0.32
00.
067
0.11
10.
0751
0.19
44O
bser
vatio
ns45
1,09
830
4,32
139
6,36
326
0,66
654
,735
43,6
5547
6,89
232
2,63
5
Note
s:Th
eta
ble
show
sref
orm
e�ec
tson
log
mon
thly
netp
erso
nali
ncom
ein
Colu
mns
(1)t
o(6
)and
onan
indi
cato
rvar
iabl
eth
atis
one
ifth
ein
divi
dual
isse
lf-em
ploy
edan
dze
root
herw
ise
inCo
lum
ns(7
)and
(8).
The
anal
ytic
alsa
mpl
eis
base
don
indi
vidu
alsa
ged
betw
een
18an
d65
,wor
king
full-
time,
repo
rtin
ga
cra�
asga
infu
locc
upat
ion
inth
ere
spec
tive
year
,and
repo
rtin
gla
bore
arni
ngsa
sthe
irpr
imar
yso
urce
ofin
com
e.Al
lreg
ress
ions
incl
ude
occu
patio
nan
dye
arfix
ede�
ects
.Con
trol
varia
bles
:age
,age
squa
red,
gend
er,h
ighe
stsc
hool
degr
ee(8
cat.)
,hig
hest
prof
essi
onal
degr
ee(7
cat.)
,and
natio
nalit
ygr
oup
(3ca
t.).S
tand
ard
erro
rs,c
lust
ered
atth
eoc
cupa
tiona
llev
el,i
npa
rent
hesi
s.Si
gnifi
canc
ele
vel:
*p<
0.10
,**p
<0.
05,*
**p<
0.01
.Sou
rce:
Rese
arch
Data
Cent
reso
fthe
Fede
ralS
tatis
tical
O�i
cean
dth
est
atis
tical
o�ic
esof
the
Länd
er,M
icro
cens
us,c
ensu
sye
ars1
998-
2012
.
Microeconometric Analyses on Determinants of Individual Labour Market Outcomes 163

4 Entry Barriers and the Labour Market Outcomes of Incumbent Workers
Appendix
Appendix A4.1 Appendix Figures and Tables
Figure A4.1 : Log Earnings Before and A�er the Reform Relative to 2003
0.94
0.96
0.98
1.00
1.02
1994 1996 1998 2000 2002 2004 2006 2008 2010 2012 2014
RegulatedDeregulated
Notes: The figure plots average log gross daily earnings for the sample of incumbent workers in the regulatedand deregulated occupations relative to the year 2003.Source: SIAB
164 Microeconometric Analyses on Determinants of Individual Labour Market Outcomes

4 Entry Barriers and the Labour Market Outcomes of Incumbent Workers
Figure A4.2 : E�ect Heterogeneity by Firm Size: Log Daily Earnings
0.06
0.04
0.02
0.00
-0.02
-0.04
-0.06
-0.08
-0.10
-0.12
-0.141998 2002 2006 2010 2014
(a) Firm Size less than 20 Employees
0.06
0.04
0.02
0.00
-0.02
-0.04
-0.06
-0.08
-0.10
-0.12
-0.141998 2002 2006 2010 2014
(b) Firm Size 20-100 Employees
0.06
0.04
0.02
0.00
-0.02
-0.04
-0.06
-0.08
-0.10
-0.12
-0.141998 2002 2006 2010 2014
(c) Firm Size 100-250 Employees
0.06
0.04
0.02
0.00
-0.02
-0.04
-0.06
-0.08
-0.10
-0.12
-0.141998 2002 2006 2010 2014
(d) Firm Size more than 250 Employees
Notes: The figure shows coe�icient estimates and 95% confidence intervals of the reform e�ect on gross dailylog earnings using the matched comparison group for incumbent workers from 1998 to 2014 by the size of thefirm in the year 2003.Source: SIAB
Microeconometric Analyses on Determinants of Individual Labour Market Outcomes 165

4 Entry Barriers and the Labour Market Outcomes of Incumbent Workers
Figure A4.3 : E�ect Heterogeneity by Firm Size: Unemployment
0.06
0.04
0.02
0.00
-0.02
-0.04
-0.06
-0.08
-0.10
-0.12
-0.141998 2002 2006 2010 2014
(a) Firm Size less than 20 Employees
0.06
0.04
0.02
0.00
-0.02
-0.04
-0.06
-0.08
-0.10
-0.12
-0.141998 2002 2006 2010 2014
(b) Firm Size 20-100 Employees
0.06
0.04
0.02
0.00
-0.02
-0.04
-0.06
-0.08
-0.10
-0.12
-0.141998 2002 2006 2010 2014
(c) Firm Size 100-250 Employees
0.06
0.04
0.02
0.00
-0.02
-0.04
-0.06
-0.08
-0.10
-0.12
-0.141998 2002 2006 2010 2014
(d) Firm Size more than 250 Employees
Notes: The figure shows coe�icient estimates and 95% confidence intervals of the reform e�ect on unemploymentusing the matched comparison group for incumbent workers from 1998 to 2014 by the size of the firm in the year2003.Source: SIAB
166 Microeconometric Analyses on Determinants of Individual Labour Market Outcomes

4 Entry Barriers and the Labour Market Outcomes of Incumbent Workers
Figure A4.4 : Apprenticeships and Apprenticeship Examinations
0.6
0.8
1.0
1.2
1.4
1998 2000 2002 2004 2006 2008 2010 2012
RegulatedDeregulated
(a) Apprenticeships
0.6
0.8
1.0
1.2
1.4
1998 2000 2002 2004 2006 2008 2010 2012
RegulatedDeregulated
(b) Apprenticeships Examinations
Notes: The figures show the numbers of apprenticeships (Figure (a)) and the number of apprenticeship finalexaminations (Figure (b)) relative to 2003. Statistics based on firm registry data.Source: German Confederation of Skilled Cra�s
Microeconometric Analyses on Determinants of Individual Labour Market Outcomes 167

4 Entry Barriers and the Labour Market Outcomes of Incumbent Workers
Figure A4.5 : E�ects on Net Monthly Income of Self-Employed and Employees
-0.20
-0.10
0.00
0.10
0.20
1998 2000 2002 2004 2006 2008 2010 2012
Employees Self-Employed
Notes: The figure shows coe�icient estimates and 95% confidence intervals of the reform e�ect on log netmonthly income for self-employed individuals and employees who work in cra� occupations.Source: Research Data Centres of the Federal Statistical O�ice and the statistical o�ices of the Länder, Microcensus,census years 1998-2012.
168 Microeconometric Analyses on Determinants of Individual Labour Market Outcomes
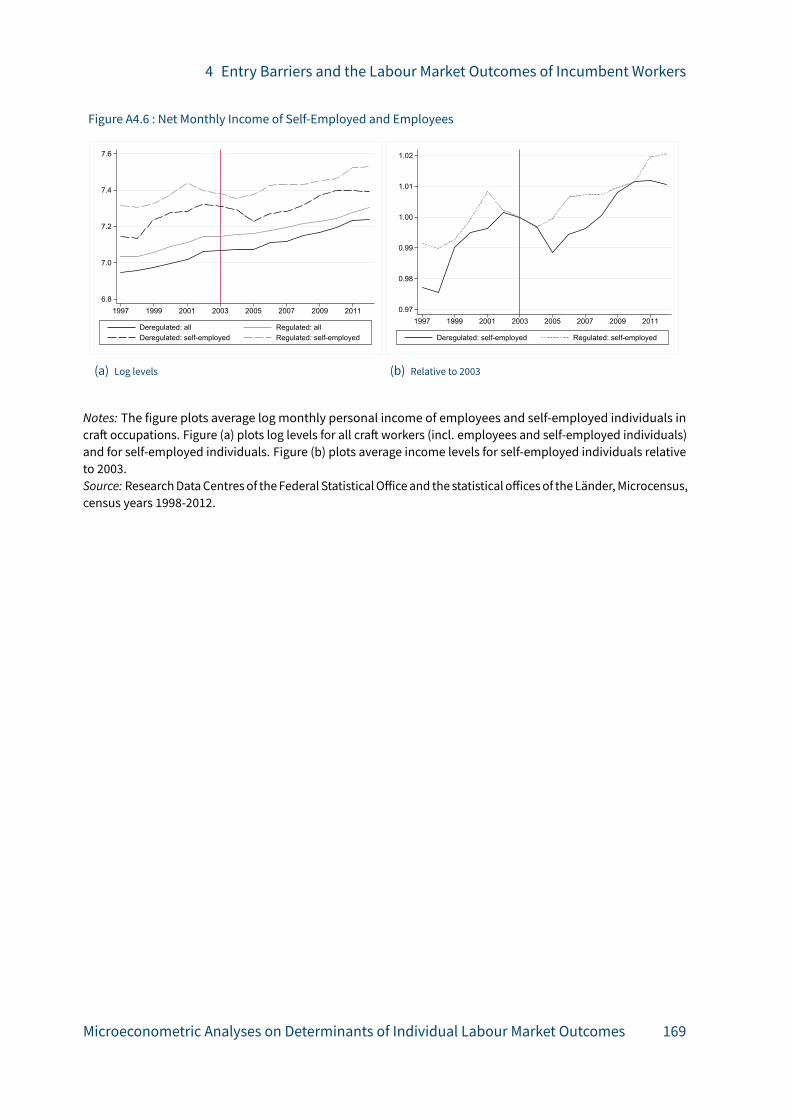
4 Entry Barriers and the Labour Market Outcomes of Incumbent Workers
Figure A4.6 : Net Monthly Income of Self-Employed and Employees
6.8
7.0
7.2
7.4
7.6
1997 1999 2001 2003 2005 2007 2009 2011
Deregulated: all Regulated: allDeregulated: self-employed Regulated: self-employed
(a) Log levels
0.97
0.98
0.99
1.00
1.01
1.02
1997 1999 2001 2003 2005 2007 2009 2011
Deregulated: self-employed Regulated: self-employed
(b) Relative to 2003
Notes: The figure plots average log monthly personal income of employees and self-employed individuals incra� occupations. Figure (a) plots log levels for all cra� workers (incl. employees and self-employed individuals)and for self-employed individuals. Figure (b) plots average income levels for self-employed individuals relativeto 2003.Source: Research Data Centres of the Federal Statistical O�ice and the statistical o�ices of the Länder, Microcensus,census years 1998-2012.
Microeconometric Analyses on Determinants of Individual Labour Market Outcomes 169

4 Entry Barriers and the Labour Market Outcomes of Incumbent Workers
Tabl
eA4
.1:L
isto
fReg
ulat
edan
dDe
regu
late
dCr
a�O
ccup
atio
ns
Dere
gula
ted
occu
patio
nsRe
gula
ted
occu
patio
ns
No
Grou
pN
ame
No
Grou
pN
ame
No
Grou
pN
ame
No
Grou
pN
ame
1I
Tile
,sla
b,an
dm
osai
cla
yer
27V
Mill
er1
IBr
ickl
ayer
and
conc
reto
r22
IIGu
nsm
ith2
ICa
stst
one
and
terr
azzo
mak
er28
VBr
ewer
and
mal
tste
r2
ISt
ove
and
air
heat
ing
me-
chan
ic23
IIPl
umbe
r
3I
Scre
edla
yer
29V
Win
ece
llarp
erso
n3
ICa
rpen
ter
24II
Inst
alle
rand
heat
ing
fitte
r4
IIVe
ssel
and
equi
pmen
tco
n-st
ruct
or30
VITe
xtile
clea
ner
4I
Roof
er25
IIEl
ectr
icst
echn
icia
n
5II
Cloc
kmak
er31
VIW
axch
antle
r5
IRo
adco
nstr
uctio
nw
orke
r26
IIEl
ectr
ical
mac
hine
engi
neer
6II
Engr
aver
32VI
Glas
sfin
ishe
r6
ITh
erm
alan
dac
oust
icin
sula
-tio
nfit
ter
27III
Join
er
7II
Met
alfo
rmer
33VI
Build
ing
clea
ner
7I
Wel
lsin
ker
28III
Boat
build
er8
IIGa
lvan
iser
34VI
IGl
assf
inis
her
8I
Ston
emas
on29
IVRo
pem
aker
9II
Met
alan
dbe
llfo
unde
r35
VII
Prec
isio
nop
ticia
n9
IPl
aste
rer
30V
Bake
r10
IICu
ttin
gto
olm
echa
nic
36VI
IGl
assa
ndch
ina
pain
ter
10I
Pain
tera
ndla
cque
rer
31V
Past
ry-c
ook
11II
Gold
smith
and
silv
ersm
ith37
VII
Prec
ious
ston
een
grav
eran
dcu
tter
11I
Sca�
olde
r32
VBu
tche
r
12III
Parq
uetl
ayer
38VI
IPh
otog
raph
er12
ICh
imne
ysw
eep
33VI
Disp
ensi
ngop
ticia
n13
IIISh
utte
rmec
hatr
onic
ste
chni
-ci
an39
VII
Book
bind
er13
IIM
etal
wor
ker
34VI
Hea
ring
aid
acou
stic
ian
14III
Mod
elbu
ilder
40VI
ITy
pese
tter
and
prin
ter
14II
Surg
ical
inst
rum
entm
aker
35VI
Ort
hotic
tech
nici
an15
IIITu
rner
(ivor
yca
rver
)an
dw
oode
nto
ym
aker
41VI
ISc
reen
prin
ter
15II
Coac
hbui
lder
36VI
Ort
hopa
edic
shoe
mak
er
16III
Woo
dca
rver
42VI
IFl
exog
raph
er16
IIPr
ecis
ion
engi
neer
37VI
Dent
alte
chni
cian
17III
Coop
er43
VII
Cera
mis
t17
IIM
otor
bike
and
bicy
cle
me-
chan
ic38
VIH
aird
ress
er
18III
Bask
etm
aker
44VI
IO
rgan
and
harm
oniu
mm
aker
18II
Refr
iger
atio
nm
echa
nic
39VI
IGl
azie
r
19IV
Cost
ume
tailo
r45
VII
Pian
oan
dha
rpsi
chor
dm
aker
19II
Com
mun
icat
ion
tech
nici
an40
VII
Glas
sbl
ower
and
glas
sap
pa-
ratu
smak
er20
IVEm
broi
dere
r,w
eave
r,kn
itter
46VI
IRe
edan
orga
nm
usic
alin
stru
-m
entm
aker
20II
Auto
mot
ive
mec
hatr
onic
ste
chni
cian
41VI
IM
echa
nic
for
tyre
san
dvu
l-ca
niza
tion
21IV
Mill
iner
47VI
IVi
olin
mak
er21
IIM
echa
nic
fora
gric
ultu
ralm
a-ch
iner
y22
IVSa
ilmak
er48
VII
Bow
mak
er23
IVFu
rrie
r49
VII
Met
alw
ind
inst
rum
ent
mak
er24
IVSh
oem
aker
50VI
IW
oode
nw
ind
inst
rum
ent
mak
er25
IVSa
ddle
r51
VII
Pluc
ked
inst
rum
entm
aker
26IV
Inte
riord
ecor
ator
52VI
IGi
lder
Note
s:Th
eta
ble
show
sde
regu
late
dcr
a�oc
cupa
tions
(zul
assu
ngsf
reie
sHa
ndw
erk)
that
ente
rin
Anne
xB1
ofth
eGe
rman
Trad
ean
dCr
a�s
Code
and
regu
late
dcr
a�oc
cupa
tions
(zul
as-
sung
spfli
chtig
esHa
ndw
erk)
that
ente
rin
Anne
xA
ofth
eGe
rman
Trad
ean
dCr
a�sC
ode.
The
grou
pnu
mbe
rgro
upsc
ra�
occu
patio
nsin
toth
atpe
rform
sim
ilart
asks
.Gro
upI:
build
ing
and
inte
rior
finis
hes
trad
es(B
au-u
ndAu
sbau
hand
wer
ke).
Grou
pII:
elec
tric
alan
dm
etal
wor
king
trad
es(E
lekt
ro-u
ndM
etal
lhan
dwer
ke).
Grou
pIII
:woo
dcra
�san
dpl
astic
trad
es(H
olzh
andw
erke
).Gr
oup
IV:
clot
hing
,tex
tiles
and
leat
herc
ra�s
and
trad
es(B
ekle
idun
gs-,
Text
il-un
dLe
derh
andw
erke
).Gr
oup
V:fo
odcr
a�s
and
trad
es(N
ahru
ngsm
ittel
hand
wer
ke).
Grou
pVI
:hea
lthan
dbo
dyca
retr
ades
asw
ella
sthe
chem
ical
and
clea
ning
sect
or(G
esun
dhei
ts-u
ndKö
rper
pfle
ge-,
chem
isch
eun
dRe
inig
ungs
hand
wer
ke).
Grou
pVI
I:gr
aphi
cde
sign
(Gla
s-,P
apie
r-,ke
ram
isch
eun
dso
nstig
eHa
ndw
erke
).
170 Microeconometric Analyses on Determinants of Individual Labour Market Outcomes

4 Entry Barriers and the Labour Market Outcomes of Incumbent Workers
Table A4.2 : Mapping of Occupations from Cra�s and Trade Code to Classification of Occupations 1988: Deregu-lated Occupations
Cra�s and Trade Code – Annex B1 Classification of Occupations 1988 (KldB88)
Code Name Code Name
1 Fliesen-, Platten- und Mosaikleger 483 Fliesenleger2 Betonstein- und Terrazzohersteller 112 Formstein-, Betonhersteller3 Estrichleger 486 Estrich-, Terrazzoleger4 Behälter- und Apparatebauer 252 Behälterbauer, Kupferschmiede und verwandte
Berufe5 Uhrmacher 286 Uhrmacher6 Graveure 232 Graveure, Ziseleure7 Metallbildner 193 Metallzieher7 Metallbildner 213 Sonstige Metallverformer (spanlose Verformung)7 Metallbildner 225 Metallschleifer7 Metallbildner 233 Metallvergüter7 Metallbildner 244 Metallkleber und übrige Metallverbinder8 Galvaniseure 234 Galvaniseure, Metallfärber9 Metall- und Glockengießer 202 Formgießer
10 Schneidwerkzeugmechaniker 291 Werkzeugmacher11 Gold- und Silberschmiede 302 Edelmetallschmiede12 Parkettleger – n/a13 Rollladen- und Sonnenschutztechniker 627 Übrige Fertigungstechniker14 Modellbauer 306 Puppenmacher, Modellbauer, Präparatoren15 Drechsler (Elfenbeinschnitzer) und Holzspielzeug-
macher183 Holzwarenmacher
16 Holzbildhauer 182 Holzverformer und zugehörige Berufe17 Böttcher 503 Stellmacher, Böttcher18 Korb- und Flechtwerkgestalter 184 Korb-, Flechtwarenmacher19 Maßschneider 351 Schneider20 Textilgestalter (Sticker, Weber, Klöppler, Posamen-
tierer, Stricker)342 Weber
20 Textilgestalter (Sticker, Weber, Klöppler, Posamen-tierer, Stricker)
346 Textilverflechter
20 Textilgestalter (Sticker, Weber, Klöppler, Posamen-tierer, Stricker)
354 Sticker
20 Textilgestalter (Sticker, Weber, Klöppler, Posamen-tierer, Stricker)
352 Oberbekleidungsnäher
20 Textilgestalter (Sticker, Weber, Klöppler, Posamen-tierer, Stricker)
356 Näher, a.n.g.
20 Textilgestalter (Sticker, Weber, Klöppler, Posamen-tierer, Stricker)
357 Sonstige Textilverarbeiter
21 Modisten 355 Hut-, Mützenmacher
Notes: The table continues next on page.
Microeconometric Analyses on Determinants of Individual Labour Market Outcomes 171

4 Entry Barriers and the Labour Market Outcomes of Incumbent Workers
Table A4.2, cont’d
Cra�s and Trade Code – Annex B1 Classification of Occupations 1988 (KldB88)
Code Name Code Name
22 Segelmacher 362 Textilausrüster23 Kürschner 378 Fellverarbeiter24 Schuhmacher 372 Schuhmacher25 Sattler und Feintäschner 374 Groblederwarenhersteller, Bandagisten25 Sattler und Feintäschner 375 Feinlederwarenhersteller25 Sattler und Feintäschner 376 Lederbekleidungshersteller und sonstige Lederver-
arbeiter26 Raumausstatter 491 Raumausstatter27 Müller 432 Mehl-, Nährmittelhersteller29 Brauer und Mälzer 422 Brauer, Mälzer29 Weinküfer 421 Weinküfer30 Textilreiniger 932 Textilreiniger, Färber und Chemischreiniger31 Wachszieher – n/a32 Gebäudereiniger 934 Glas-, Gebäudereiniger33 Glasveredler 135 Glasbearbeiter, Glasveredler34 Feinoptiker 135 Glasbearbeiter, Glasveredler35 Glas- und Porzellanmaler 514 Kerammaler, Glasmaler36 Edelsteinschleifer und -graveure 102 Eselsteinbearbeiter37 Fotografen 837 Photographen38 Buchbinder 163 Buchbinderberufe39 Drucker 173 Buchdrucker (Hochdruck)39 Drucker 174 Flach-, Tiefdrucker40 Siebdrucker 175 Spezialdrucker, Siebdrucker41 Flexografen 172 Druckstockhersteller42 Keramiker 121 Keramiker43 Orgel- und Harmoniumbauer 305 Musikinstrumentenbauer44 Klavier- und Cembalobauer 305 Musikinstrumentenbauer45 Handzuginstrumentenmacher 305 Musikinstrumentenbauer46 Geigenbauer 305 Musikinstrumentenbauer47 Bogenmacher 305 Musikinstrumentenbauer48 Metallblasinstrumentenmacher 305 Musikinstrumentenbauer49 Holzblasinstrumentenmacher 305 Musikinstrumentenbauer50 Zupfinstrumentenmacher 305 Musikinstrumentenbauer51 Vergolder 235 Emaillierer, Feuerverzinker und andere Metallober-
flächenveredler52 Schilder- und Lichtreklamehersteller 834 Dekorationen-, Schildermaler
172 Microeconometric Analyses on Determinants of Individual Labour Market Outcomes

4 Entry Barriers and the Labour Market Outcomes of Incumbent Workers
Table A4.3 : Mapping of Occupations from Cra�s and Trade Code to Classification of Occupations 1988: RegulatedOccupations
Cra�s and Trade Code – Annex A Classification of Occupations 1988 (KldB88)
Code Name Code Name
1 Maurer und Betonbauer 441 Maurer1 Maurer und Betonbauer 442 Betonbauer2 Ofen- und Lu�heizungsbauer 484 Ofensetzer, Lu�heizungsbauer3 Zimmerer 451 Zimmerer4 Dachdecker 452 Dachdecker5 Straßenbauer 462 Straßenbauer6 Wärme-, und Kälte- und Schallschutzisolierer 482 Isolierer, Abdichter7 Brunnenbauer 465 Kultur-, Wasserbauwerker8 Steinmetzen und Steinbildhauer 101 Steinbearbeiter9 Stukkateure 481 Stukkateure, Gipser, Verputzer
10 Maler und Lackierer 511 Maler, Lackierer (Ausbau)10 Maler und Lackierer 512 Warenmaler, -lackierer11 Gerüstbauer 453 Gerüstbauer12 Schornsteinfeger 804 Schornsteinfeger13 Metallbauer 301 Metallfeinbauer, a.n.g.14 Chirurgiemechaniker 285 Sonstige Mechaniker15 Karosserie- und Fahrzeugbauer 285 Sonstige Mechaniker16 Feinwerkmechaniker 284 Feinmechaniker17 Zweiradmechaniker 285 Sonstige Mechaniker18 Kälteanlagenbauer 285 Sonstige Mechaniker19 Informationstechniker 628 Sonstige Techniker20 Kra�fahrzeugtechniker 621 Maschinenbautechniker21 Landmaschinenmechaniker 621 Maschinenbautechniker22 Büchsenmacher 211 Blechpresser, -zieher, -stanzer23 Klempner 211 Blechpresser, -zieher, -stanzer24 Klempner 261 Feinblechner24 Installateur und Heizungsbauer 262 Rohrinstallateure25 Elektrotechniker 311 Elektroinstallateure, -monteure25 Elektrotechniker 622 Techniker des Elektofaches26 Elektromaschinenbauer 314 Elektrogerätebauer27 Tischler 501 Tischler28 Boots- und Schi�bauer 275 Stahlbauschlosser, Eisenschi�bauer29 Seiler 332 Spuler, Zwirner, Seiler30 Bäcker 391 Backwarenhersteller31 Konditoren 392 Konditoren32 Fleischer 401 Fleischer33 Augenoptiker 304 Augenoptiker34 Hörgeräteakustiker – n/a35 Orthopädietechniker 628 Sonstige Techniker36 Orthopädieschuhmacher – n/a37 Zahntechniker 303 Zahntechniker38 Friseure 901 Friseure39 Glaser 485 Glaser40 Glasbläser und Glasapparatebauer 132 Hohlglasmacher40 Glasbläser und Glasapparatebauer 133 Flachglasmacher40 Glasbläser und Glasapparatebauer 134 Glasbläser (vor der Lampe)41 Vulkaniseure und Reifenmechaniker 144 Vulkaniseure
Microeconometric Analyses on Determinants of Individual Labour Market Outcomes 173

4 Entry Barriers and the Labour Market Outcomes of Incumbent Workers
Table A4.4 : Mapping of Occupations from Cra�s and Trade Code to Classification of Occupations 1992 in theMicrocensus
Deregulated Regulated
Cra�s and Trade Code KldB92 Cra�s and Trade Code KldB92
1. Fliesen-, Platten- und Mo-saikleger
4830, 4831, 4832, 4833, 4837,4839
1. Maurer und Betonbauer 4410, 4411, 4412, 4413, 4414,4415, 4416, 4417, 4419, 4420,4421, 4422, 4423, 4424, 4425
2. Betonstein- und Terrazzoher-steller
1120, 1121, 1122, 1123, 1124,1125, 1127, 1129
2. Ofen- und Lu�heizungs-bauer
4840, 4841, 4842, 4843, 4847
3. Estrichleger 4860, 4861, 4862, 4863, 4864,4867, 4869
3. Zimmerer 4870, 4871, 4872, 4873, 4874,4875, 4876, 4877, 4879
4. Behälter- und Apparate-bauer
2520, 2521, 2522, 2527, 2529 4. Dachdecker 4880, 4881, 4882, 4883, 4884,4885, 4887, 4889
5. Uhrmacher 3080, 3081, 3082, 3083, 3084,3086, 3087, 3089
5. Straßenbauer 4610, 4611, 4612, 4613, 4614,4615, 4617, 4619
6. Graveure 2940, 2941, 2942, 2943, 2944,2947, 2949
6. Wärme-, Kälte- und Schall-schutzisolierer
4820, 4821, 4822, 4823, 4824,4825, 4826, 4827, 4828, 4829
7. Metallbildner 3231, 3232, 3237, 3239, 2016 7. Brunnenbauer 46628. Galvaniseure 2340, 2341, 2342, 2343, 2347,
23498. Steinmetzen und Steinbild-hauer
1010, 1011, 1012, 1013, 1014,1015, 1016, 1017, 1018, 1019
9. Metall- und Glockengießer 2010, 2011, 2012, 2013, 2014,2015, 2016, 2017, 2018, 2019
9. Stukkateure 4810, 4811, 4812, 4813, 4814,4817, 4819
10. Schneidwerkzeug-mechaniker
2951, 2952, 2953, 2954, 2957,2959
10. Maler und Lackierer 5101, 5102, 5103, 5107, 5109,5110, 5111, 5112, 5113, 5114,5115, 5116, 5117, 5119, 5120,5121, 5122, 5123, 5124, 5125,5126, 5127, 5128, 5129
11. Gold- und Silberschmiede 3021, 3022 11. Gerüstbauer 4431, 443712. Parkettleger 4915, 4916 12. Schornsteinfeger 8041, 804213. Rollladen- und Sonnen-schutztechniker
2591 13. Metallbauer 2540, 2541, 2542, 2543, 2547,2549, 2550, 2551, 2552, 2553,2557, 2559, 2560, 2561, 2562,2563, 2567, 2591, 2599
14. Modellbauer 5021, 5022, 5023, 5024, 5025,5026, 5027, 5028, 5029
14. Chirurgiemechaniker 8570
15. Drechsler undHolzspielzeugmacher
1851, 1855 15. Karosserie- und Fahrzeug-bauer
2870, 2871, 2872, 2873, 2877,2879
16. Holzbildhauer 1852 16. Feinwerkmechaniker 300017. Böttcher 5062 17. Zweiradmechaniker 281318. Korb- undFlechtwerkgestalter
1858 18. Kälteanlagenbauer 2661, 2662, 2667
19. Maßschneider 3510, 3511, 3512, 3513, 3514,3515, 3516, 3517, 3518, 3519
19. Informationstechniker 3171
20. Textilgestalter (Sticker, We-ber, Klöppler, Posamentierer,Stricker)
3520, 3521, 3522, 3523, 3524,3525, 3526, 3527, 3529, 3591,3410, 3411, 3412, 3413, 3414,3415, 3416, 3417, 3419, 3418,3440
20. Kra�fahrzeugtechniker 2810
21. Modisten 3541, 3542, 3543 21. Landmaschinen-mechaniker
2821
22. Segelmacher 3581 22. Büchsenmacher 300323. Kürschner 3780, 3781, 3782, 3783, 3784,
3787, 378923. Klempner 2610, 2611, 2612, 2613, 2614,
2617, 2619
Notes: The table is continued on next page.
174 Microeconometric Analyses on Determinants of Individual Labour Market Outcomes

4 Entry Barriers and the Labour Market Outcomes of Incumbent Workers
Table A4.4, cont’d
Deregulated Regulated
Cra�s and Trade Code KldB92 Cra�s and Trade Code KldB92
24. Schuhmacher 3720, 3721 24. Installateur und Heizungs-bauer
2680, 2681, 2682, 2687, 2690,2691, 2697, 2699
25. Sattler und Feintäschner 3741, 3742, 3743, 3744, 3745,3747
25. Elektrotechniker 6220, 6221, 6222, 6223, 6224,6225, 6226, 6228, 6229
26. Raumausstatter 4910, 4911 26. Elektromaschinenbauer 3130, 3131, 3132, 3133, 3134,3137, 3139
27. Müller 4351 27. Tischler 5010, 5011, 5012, 5013, 5014,5015, 5016, 5017, 5018, 5019
28. Brauer und Mälzer 4210, 4211, 4212, 4217, 4219 28. Boots- und Schi�bauer 5063, 5064, 506529. Weinküfer 4233 29. Seiler 332330. Textilreiniger 9310, 9311, 9312, 9313, 9314,
9315, 9317, 9318, 931930. Bäcker 3910, 3911, 3912, 3913, 3914,
3915, 3917, 3918, 391931. Wachszieher 1418 31. Konditoren 3920, 3921, 3922, 3923, 3924,
3925, 3927, 392932. Gebäudereiniger 9340, 9341, 9342, 9343, 9349 32. Fleischer 4010, 4011, 4012, 4013, 4014,
4015, 4017, 4018, 401933. Glasveredler 1350,1351, 1352, 1353, 1354,
135533. Augenoptiker 3041
34. Feinoptiker 1356, 1357, 1358, 1359 34. Hörgeräteakustiker 315335. Glas- und Porzellanmaler 5140, 5141, 5142, 5143, 5144,
5145, 5146, 5147, 514935. Orthopädietechniker 3071
36. Edelsteinschleifer und -graveure
1018 36. Orthopädieschuhmacher 3722
37. Fotografen 8370, 8371, 8372, 8373, 8374,8375, 8376, 8378, 8379
37. Zahntechniker 3031, 3032, 3037
38. Buchbinder 1780, 1781, 1782, 1783, 1784,1785, 1789
38. Friseure 9010, 9011, 9012, 9013, 9014,9015, 9016, 9017, 9018, 9019
39. Drucker 1740, 1741, 1742, 1743, 1749,1750
39. Glaser 4850, 4851, 4852, 4853, 4854,4855, 4856, 4857, 4859
40. Siebdrucker 1751 40. Glasbläser und Glasappa-ratebauer
1310, 1311, 1312, 1313, 1314,1315, 1316, 1317, 1318, 1319
41. Flexografen 1736 41. Vulkaniseure und Reifen-mechaniker
1450, 1451, 1452, 1453, 1454,1456, 1457, 1458, 1459, 1500,1501, 1507
42. Keramiker 1210, 1211, 1212, 1213, 1214,1215, 1216, 1217, 1218, 1219
43. Orgel- und Harmonium-bauer
3052
44. Klavier- und Cembalobauer 305145. Handzuginstrumenten-macher
3058
46. Geigenbauer 305447. Bogenmacher48. Metallblasinstrumenten-macher
3053
49. Holzblasinstrumenten-macher
3056
50. Zupfinstrumentenmacher 305551. Vergolder 512652. Schilder- undLichtreklamehersteller
8390, 8391, 8392, 8393, 8394,8395, 8397, 8399
Microeconometric Analyses on Determinants of Individual Labour Market Outcomes 175

4 Entry Barriers and the Labour Market Outcomes of Incumbent Workers
Table A4.5 : Yearly Treatment E�ects
(1) (2) (3) (4) (5) (6)
Log daily earnings Unemployment Attrition
Non-matched
Matched Non-matched
Matched Non-matched
Matched
Deregulatedj(i) × I(t = 2014) -0.0701*** -0.0431*** 0.0156*** 0.0091** 0.0150*** 0.0039(0.0060) (0.0114) (0.0030) (0.0043) (0.0040) (0.0071)
Deregulatedj(i) × I(t = 2013) -0.0643*** -0.0458*** 0.0106*** 0.00314 0.0188*** 0.0071(0.0060) (0.0105) (0.0030) (0.0042) (0.0040) (0.0068)
Deregulatedj(i) × I(t = 2012) -0.0535*** -0.0334*** 0.0174*** 0.0091** 0.0178*** 0.0182***(0.0059) (0.0101) (0.0030) (0.0041) (0.0040) (0.0063)
Deregulatedj(i) × I(t = 2011) -0.0525*** -0.0350*** 0.0141*** 0.0053 0.0114*** 0.0132**(0.0059) (0.0095) (0.0029) (0.0040) (0.0040) (0.0060)
Deregulatedj(i) × I(t = 2010) -0.0448*** -0.0224** 0.0159*** 0.0086** 0.0097** 0.0144**(0.0059) (0.0094) (0.0029) (0.0042) (0.0040) (0.0056)
Deregulatedj(i) × I(t = 2009) -0.0601*** -0.0374*** 0.0190*** 0.0148*** 0.0067* 0.0169***(0.0058) (0.0090) (0.0029) (0.0041) (0.0040) (0.0052)
Deregulatedj(i) × I(t = 2008) -0.0207*** -0.0180** 0.0094*** 0.0093** -0.0008 0.0103**(0.0058) (0.0074) (0.0029) (0.0036) (0.0040) (0.0048)
Deregulatedj(i) × I(t = 2007) -0.0207*** -0.0198*** 0.0081*** 0.0083** -0.0014 0.0051(0.0058) (0.0076) (0.0029) (0.0035) (0.0040) (0.0044)
Deregulatedj(i) × I(t = 2006) -0.0101* -0.0042 0.0042 0.0014 0.0030 0.0094**(0.0057) (0.0071) (0.0029) (0.0037) (0.0040) (0.0039)
Deregulatedj(i) × I(t = 2005) -0.0051 0.0001 0.0017 0.0023 0.0018 0.0056*(0.0057) (0.0069) (0.0029) (0.0034) (0.0040) (0.0031)
Deregulatedj(i) × I(t = 2004) -0.0056 -0.0114** -0.00007 0.0026 -0.0034 -0.0033(0.0056) (0.0045) (0.0028) (0.0027) (0.0040) (0.0024)
Baseline: t = 2003
Deregulatedj(i) × I(t = 2002) 0.0070 0.0000 0.0000 0.0000 0.0000 0.0000(0.0056) (0.0018) (0.0028) (0.0000) (0.0040) (0.0000)
Deregulatedj(i) × I(t = 2001) 0.0082 0.0000 0.0000 0.0000 0.0000 0.0000(0.0056) (0.0022) (0.0028) (0.0000) (0.0040) (0.0000)
Deregulatedj(i) × I(t = 2000) 0.0093* 0.0000 -0.0016 -0.0022 0.0000 0.0000(0.0056) (0.0032) (0.0028) (0.0014) (0.0040) (0.0000)
Deregulatedj(i) × I(t = 1999) 0.0018 0.0000 0.0019 -0.0006 0.0000 0.0000(0.0056) (0.0040) (0.0028) (0.0020) (0.0040) (0.0000)
Deregulatedj(i) × I(t = 1998) 0.0061 0.0000 0.0011 0.0014 0.0000 0.0000(0.0056) (0.0047) (0.0028) (0.0022) (0.0040) (0.0000)
Constant 4.254*** 4.206*** 0.0169*** 0.0165*** 0.0000 0.0000(0.0020) (0.0034) (0.0010) (0.0015) (0.0014) (0.0000)
R-squared 0.035 0.022 0.018 0.021 0.098 0.103Observations 496,084 493,568 503,705 501,156 532,559 529,669Individuals 31,327 31,157 31,327 31,157 31,327 31,157
Notes: The table shows yearly treatment e�ects of the reform on log of gross daily earnings in Columns (1) and (2), on being unemployedin Columns (3) and (4), and on attrition in Columns (5) and (6). The outcome variable is log gross daily earnings. Column (1) refers tothe non-matched sample, Column (2) to the matched sample from entropy balancing. All regressions include year and individual fixede�ects. Standard errors, clustered at the individual level, in parenthesis. Significance level: * p<0.10, ** p<0.05, *** p<0.01.Source: SIAB
176 Microeconometric Analyses on Determinants of Individual Labour Market Outcomes

4 Entry Barriers and the Labour Market Outcomes of Incumbent Workers
Table A4.6 : Other Labor Market Adjustment Mechanisms
(1) (2) (3) (4)
Full-time regular employee Marginal employment
Non-matched Matched Non-matched Matched
Panel A: average e�ects
Deregulatedj(i) × post2003 -0.0140*** -0.0029 0.0074*** 0.0026(0.0015) (0.0044) (0.006) (0.0019)
Constant 0.942*** 0.926*** -0.0008 -0.0008(0.0012) (0.0021) (0.0005) (0.0006)
R-squared 0.050 0.058 0.016 0.020
Panel B: yearly e�ects
Deregulatedj(i) × I(t = 2014) -0.0252*** -0.0033 0.0149*** 0.0069*(0.0043) (0.0076) (0.0019) (0.0040)
Deregulatedj(i) × I(t = 2013) -0.0173*** 0.0042 0.0142*** 0.0101***(0.0043) (0.0073) (0.0019) (0.0035)
Deregulatedj(i) × I(t = 2012) -0.0239*** 0.0006 0.0110*** 0.0037(0.0043) (0.0072) (0.0019) (0.0036)
Deregulatedj(i) × I(t = 2011) -0.0267*** -0.0019 0.0098*** 0.0025(0.0043) (0.0071) (0.0019) (0.0034)
Deregulatedj(i) × I(t = 2010) -0.0209*** -0.0056 0.0086*** 0.00007(0.0042) (0.0066) (0.0019) (0.0033)
Deregulatedj(i) × I(t = 2009) -0.0242*** -0.0149** 0.0107*** 0.0041(0.0042) (0.0062) (0.0019) (0.0031)
Deregulatedj(i) × I(t = 2008) -0.0112*** -0.0091* 0.0067*** 0.0015(0.0042) (0.0055) (0.0018) (0.0025)
Deregulatedj(i) × I(t = 2007) -0.0072* -0.0067 0.0056*** 0.0009(0.0042) (0.0053) (0.0018) (0.0024)
Deregulatedj(i) × I(t = 2006) -0.0004 -0.0006 0.0033* -0.0004(0.0041) (0.0051) (0.0018) (0.0022)
Deregulatedj(i) × I(t = 2005) 0.0041 0.0011 0.0014 -0.0003(0.0041) (0.0046) (0.0018) (0.0019)
Deregulatedj(i) × I(t = 2004) 0.0032 -0.0014 0.0009 0.0014(0.0041) (0.0034) (0.0018) (0.0013)
Baseline: t = 2003
Deregulatedj(i) × I(t = 2002) 0.0010 -0.0014 0.0000 0.0000(0.0041) (0.0013) (0.0018) (0.0000)
Deregulatedj(i) × I(t = 2001) 0.0001 -0.0017 0.0000 0.0000(0.0041) (0.0016) (0.0018) (0.0000)
Deregulatedj(i) × I(t = 2000) 0.0020 0.0003 0.0005 -0.0002(0.0041) (0.0028) (0.0018) (0.0006)
Deregulatedj(i) × I(t = 1999) 0.0004 0.0005 0.0004 -0.0001(0.0041) (0.0035) (0.0018) (0.0006)
Deregulatedj(i) × I(t = 1998) 0.0035 -0.0011 0.0000 –(0.0041) (0.0041) (0.0018) –
Constant 0.942*** 0.9270*** -0.0008 -0.0008(0.0014) (0.0029) (0.0006) (0.0006)
R-squared 0.050 0.058 0.016 0.020
Observations 503,705 501,156 503,705 501,156Individuals 31,327 31,157 31,327 31,157
Notes: The table shows reform e�ects on being in full-time regular employment in Columns (1) and (2) and on being in marginal employ-ment in Columns (3) and (4) from linear probability models. Marginal employment is recorded from the year 1999 onwards in the SIABdata. Columns (1) and (3) refer to results using the non-matched comparison group and Columns (2) and (4) refer to results using thematched comparison group. All regressions include year and individual fixed e�ects. Standard errors, clustered at the individual level,in parenthesis. Significance level: * p<0.10, ** p<0.05, *** p<0.01.Source: SIAB
Microeconometric Analyses on Determinants of Individual Labour Market Outcomes 177

4 Entry Barriers and the Labour Market Outcomes of Incumbent Workers
Table A4.7 : Average Earnings Growth A�er Matching
(1) (2) (3) (4) (5)
Period Deregulated Regulated Di�erence
∆ p-value
1998-2003 0.233 0.234 -0.001 0.8581998-2000 0.139 0.136 0.003 0.6732000-2003 0.093 0.096 -0.003 0.5561994-2003 0.510 0.523 -0.013 0.544
Notes: The table shows average growth rates of log daily gross earnings a�er matching.Source: SIAB
178 Microeconometric Analyses on Determinants of Individual Labour Market Outcomes

4 Entry Barriers and the Labour Market Outcomes of Incumbent Workers
Table A4.8 : Checking Common Trends in Pretreatment Periods
(1) (2) (3) (4)
Baseline sample New sample
Non-matched Matched Non-matched Matched
Panel A: average e�ects
Deregulatedj(i) × post1998 0.0010 0.0042 0.0043** 0.0056(0.0019) (0.0041) (0.0019) (0.0040)
Constant 4.030*** 3.991*** 4.141*** 4.088***(0.0013) (0.0029) (0.0012) (0.0018)
R-squared 0.245 0.240 0.049 0.069
Panel B: yearly e�ects
Deregulatedj(i) × I(t = 2003) -0.0061 0.0000 -0.0162*** -0.0003(0.0043) (0.0047) (0.0045) (0.0028)
Deregulatedj(i) × I(t = 2002) 0.0008 0.0000 -0.0087* -0.0028(0.0043) (0.0043) (0.0045) (0.0061)
Deregulatedj(i) × I(t = 2001) 0.0020 0.0000 0.0047 0.0111**(0.0043) (0.0042) (0.0045) (0.0049)
Deregulatedj(i) × I(t = 2000) 0.0032 0.0000 0.0029 0.0099**(0.0043) (0.0041) (0.0044) (0.0039)
Deregulatedj(i) × I(t = 1999) -0.0042 0.0000 -0.0010 0.00420.0043 (0.0037) (0.0044) (0.0031)
Baseline: t = 1998
Deregulatedj(i) × I(t = 1997) -0.0111** -0.0100** -0.0074* 0.00000.0044 (0.0040) (0.0044) (0.0012)
Deregulatedj(i) × I(t = 1996) -0.0059 -0.0062 -0.0080* 0.00000.0044 (0.0048) (0.0044) (0.0016)
Deregulatedj(i) × I(t = 1995) -0.0048 -0.0081 -0.0070 0.00000.0044 (0.0059) (0.0044) (0.0026)
Deregulatedj(i) × I(t = 1994) -0.0018 -0.0022 -0.0166*** 0.00000.0045 (0.0070) (0.0044) (0.0036)
Deregulatedj(i) × I(t = 1993) 0.0136*** 0.0013 -0.0082* 0.00000.0045 (0.0075) (0.0044) (0.0041)
Constant 4.027*** 3.990*** 4.142*** 4.088***(0.0016) (0.0047) (0.0015) (0.0024)
R-squared 0.245 0.240 0.049 0.069
Observations 332,153 330,383 374,522 357,047Individuals 31,327 31,157 34,924 32,945
Notes: The table checks common trends in pretreatment periods. The dependent variable in all regressions is log grossdaily earnings. Columns (1) and (2) use the same analytical sample that we use in our baseline regression without furtherrestrictions. Columns (3) and (4) use a new analytical sample, pretending that the reform has happened in the year 1998.Matching is based on the same set of covariats as in the baseline analysis. All regressions include year and individualfixed e�ects. Standard errors, clustered at the individual level, in parenthesis. Significance level: * p<0.10, ** p<0.05, ***p<0.01.Source: SIAB
Microeconometric Analyses on Determinants of Individual Labour Market Outcomes 179

4 Entry Barriers and the Labour Market Outcomes of Incumbent Workers
Table A4.9 : Labor Market E�ects for Incumbent Workers: Dropping Sample Restrictions
(1) (2) (3) (4) (5) (6)
Earnings Unemployment Attrition
Non-matched Matched Non-matched Matched Non-matched Matched
Deregulatedj(i) × post2003 -0.0353*** -0.0246*** 0.0059*** 0.0045* 0.0012 0.0043(0.0021) (0.0064) (0.0010) (0.0026) (0.0014) (0.0036)
Constant 4.113*** 4.135*** 0.0476*** 0.0421*** 0.0130*** 0.0000(0.0017) (0.0032) (0.0008) (0.0017) (0.0011) (0.0011)
R-squared 0.034 0.016 0.011 0.013 0.051 0.106Observations 812,246 657,423 836,388 671,225 914,090 711,382Individuals 53,770 41,846 53,770 41,846 53,770 41,846
Notes: The table shows results from regressions on the sample that includes occupational and firm switches before the reform andnon-regular employees (including unemployment and apprenticeship spells). All regressions include year and individual fixed e�ects.Standard errors, clustered at the individual level, in parenthesis. Significance level: * p<0.10, ** p<0.05, *** p<0.01.Source: SIAB
180 Microeconometric Analyses on Determinants of Individual Labour Market Outcomes

4 Entry Barriers and the Labour Market Outcomes of Incumbent Workers
Table A4.10 : E�ect Heterogeneity by Industry Group
(1) (2) (3) (4)
Industry group
Manufacturing Construction Trade,maintenance,
and repair
Real estate,renting, and
other businessactivities
Panel A: log daily earnings
Deregulatedj(i) × post2003 -0.0222*** -0.0469** -0.0408* -0.0119(0.0070) (0.0187) (0.0240) (0.0326)
Constant 4.261*** 4.178*** 4.026*** 3.909***(0.0030) (0.0092) (0.0114) (0.0133)
R-squared 0.026 0.016 0.013 0.015Observations 232,001 136,192 41,630 83,745Individuals 14,475 8,726 2,627 5,329
Panel B: unemployment
Deregulatedj(i) × post2003 0.0055** 0.0096 0.0184* 0.0069(0.0026) (0.0086) (0.0094) (0.0132)
Constant 0.0138*** 0.0288*** 0.0259*** 0.0283***(0.0013) (0.0050) (0.0053) (0.0059)
R-squared 0.020 0.026 0.024 0.028Observations 235,033 138,910 42,206 85,007Individuals 14,475 8,726 2,627 5,329
Panel C: attrition
Deregulatedj(i) × post2003 0.0042 0.0491*** 0.0187 0.0270*(0.0039) (0.0148) (0.0144) (0.0162)
Constant 0.0000 0.0000 0.0000 0.0000(0.0012) (0.0047) (0.0046) (0.0052)
R-squared 0.095 0.151 0.119 0.125Observations 246,075 148,342 44,659 90,593Individuals 14,475 8,726 2,627 5,329
Notes: The table shows average e�ects of the reform on log gross daily earnings in Panel A, on being unemployedin Panel B, and on dropping out of the sample (incl. missing/zero earnings) in Panel C. Sample splits, indicatedin the column header, are based on the industry group in the year 2003. Trade, maintenance, and repaircontains wholesale and retail trade, repair of motor vehicles, motorcycles and personal and household goods.Due to small samples, real estate, renting, and other business activities also contains other industries that wedo not further distinguish. All regressions include year and individual fixed e�ects. Entropy balancing is rerunon each subsample and workers in the comparison group are weighted by these matching weights. Standarderrors, clustered at the individual level, in parenthesis. Significance level: * p<0.10, ** p<0.05, *** p<0.01.Source: SIAB
Microeconometric Analyses on Determinants of Individual Labour Market Outcomes 181

4 Entry Barriers and the Labour Market Outcomes of Incumbent Workers
Tabl
eA4
.11
:Ref
orm
E�ec
tsby
Occ
upat
iona
land
Firm
Switc
hes
(1)
(2)
(3)
(4)
(5)
(6)
(7)
Switc
hLo
gda
ilyea
rnin
gs
Occ
upat
ion
Firm
Occ
upat
ion
Occ
upat
iona
lgr
oup
Firm
Sam
eDi
�ere
ntSa
me
Di�e
rent
Dere
gula
ted j
(i)×
post
2003
0.00
600.
0134
***
-0.0
040
-0.0
098*
*-0
.042
8**
-0.0
119*
**-0
.039
6***
(0.0
050)
(0.0
047)
(0.0
056)
(0.0
043)
(0.0
174)
(0.0
045)
(0.0
136)
Cons
tant
0.08
65**
*0.
0691
***
0.12
70**
*4.
238*
**4.
119*
**4.
234*
**4.
157*
**(0
.002
5)(0
.002
3)(0
.002
7)(0
.002
5)(0
.006
3)(0
.002
7)(0
.005
1)
R-sq
uare
d0.
105
0.09
00.
160
0.09
50.
045
0.12
10.
028
Obs
erva
tions
355,
020
355,
020
353,
079
357,
464
136,
104
292,
099
201,
469
Indi
vidu
als
31,1
5731
,157
31,1
5721
,529
9,62
817
,544
13,6
13
Note
s:In
Colu
mn
(1),
the
depe
nden
tvar
iabl
eis
anin
dica
torv
aria
ble
that
ison
eif
the
wor
kerh
asch
ange
doc
cupa
tion.
InCo
lum
n(2
),th
ede
pend
entv
aria
ble
isan
indi
cato
rva
riabl
eth
atis
one
ifth
ew
orke
rhas
chan
ged
the
occu
patio
ngr
oup.
InCo
lum
n(3
),th
ede
pend
entv
aria
ble
isan
indi
cato
rvar
iabl
eth
atis
one
ifth
ew
orke
rhas
chan
ged
the
firm
.The
anal
ysis
inth
ese
two
colu
mns
isre
stric
ted
toth
eye
ars1
999
to20
10be
caus
eof
non-
com
para
ble
occu
patio
nalc
lass
ifica
tions
inth
eot
hery
ears
.In
Colu
mns
(4)t
o(7
),th
ede
pend
entv
aria
ble
islo
gda
ilygr
osse
arni
ngs.
Colu
mns
(4)a
nd(5
)spl
itth
esa
mpl
eby
whe
ther
the
wor
kerw
orks
inth
esa
me
orin
adi
�ere
ntoc
cupa
tion
in20
10co
mpa
red
to20
03.C
olum
ns(6
)and
(7)s
plit
the
sam
ple
byw
heth
erth
ew
orke
rwor
ksin
the
sam
eor
ina
di�e
rent
firm
in20
10co
mpa
red
to20
03.A
llre
gres
sion
sinc
lude
year
and
indi
vidu
alfix
ede�
ects
.Wor
kers
inth
eco
mpa
rison
grou
par
ew
eigh
ted
bym
atch
ing
wei
ghts
.Sta
ndar
der
rors
,clu
ster
edat
the
indi
vidu
alle
vel,
inpa
rent
hesi
s.Si
gnifi
canc
ele
vel:
*p<
0.10
,**p
<0.
05,*
**p<
0.01
.So
urce
:SIA
B
182 Microeconometric Analyses on Determinants of Individual Labour Market Outcomes

4 Entry Barriers and the Labour Market Outcomes of Incumbent WorkersTa
ble
A4.1
2:E
xclu
ding
Occ
upat
ions
with
Sim
ilarT
asks
(1)
(2)
(3)
(4)
(5)
(6)
(7)
(8)
Dere
gula
ted
occu
patio
ns:
Tile
,sla
ban
dm
osai
clay
eran
dca
stst
one
and
terr
azzo
mak
erM
etal
form
er,g
alva
nise
r,an
dm
etal
and
bell
foun
der
Inte
riord
ecor
ator
All
Regu
late
doc
cupa
tions
:Br
ickl
ayer
and
conc
reto
rM
etal
wor
ker
Inst
alle
rand
heat
ing
fitte
rAl
l
Earn
ings
Une
mpl
oyed
Earn
ings
Une
mpl
oyed
Earn
ings
Une
mpl
oyed
Earn
ings
Une
mpl
oyed
Dere
gula
ted j
(i)×
post
2003
-0.0
231*
**0.
0067
***
-0.0
339*
**0.
0102
***
-0.0
238*
**0.
0068
***
-0.0
353*
**0.
0104
***
(0.0
066)
(0.0
025)
(0.0
063)
(0.0
024)
(0.0
063)
(0.0
024)
(0.0
068)
(0.0
026)
Cons
tant
4.20
1***
0.01
71**
*4.
189*
**0.
0169
***
4.21
0***
0.01
69**
*4.
186*
**0.
0162
***
(0.0
028)
(0.0
013)
(0.0
027)
(0.0
013)
(0.0
027)
(0.0
012)
(0.0
030)
(0.0
013)
R-sq
uare
d0.
023
0.02
00.
020
0.02
10.
022
0.02
10.
021
0.02
1O
bser
vatio
ns45
3,32
646
0,03
547
7,71
748
5,07
046
1,22
346
8,36
240
5,13
041
1,15
5In
divu
dals
28,5
6328
,563
30,1
7230
,172
29,1
0929
,109
25,5
3025
,530
Note
s:Th
eta
ble
show
sreg
ress
ions
forl
ogda
ilyea
rnin
gsan
dun
empl
oym
enti
nsu
bsam
ples
that
drop
occu
patio
nsin
dica
ted
inth
eco
lum
nhe
ader
.Col
umns
(7)a
nd(8
)dro
pal
locc
upat
ions
men
tione
din
the
othe
rcol
umns
.All
regr
essi
onsi
nclu
deye
aran
din
divi
dual
fixed
e�ec
ts.E
ntro
pyba
lanc
ing
isre
run
onea
chsu
bsam
ple
and
wor
kers
inth
eco
mpa
rison
grou
par
ew
eigh
ted
byth
ese
mat
chin
gw
eigh
ts.S
tand
ard
erro
rs,c
lust
ered
atth
ein
divi
dual
leve
l,in
pare
nthe
sis.
Sign
ifica
nce
leve
l:*p
<0.
10,*
*p<
0.05
,***
p<0.
01.
Sour
ce:S
IAB
Microeconometric Analyses on Determinants of Individual Labour Market Outcomes 183

4 Entry Barriers and the Labour Market Outcomes of Incumbent Workers
Table A4.13 : Attrition from Sample: Yearly Treatment Results
(1) (2) (3) (4) (5) (6)
Dropped out Missing earnings Both
Non-matched
Matched Non-matched
Matched Non-matched
Matched
Deregulatedj(i) × I(t = 2014) 0.00755** 0.00051 0.0088*** 0.0041 0.0150*** 0.0039(0.0037) (0.0067) (0.0023) (0.0034) (0.0040) 0.0071
Deregulatedj(i) × I(t = 2013) 0.0121*** 0.0045 0.0079*** 0.0036 0.0188*** 0.0071(0.0037) (0.0064) (0.0022) (0.0033) (0.0040) 0.0068
Deregulatedj(i) × I(t = 2012) 0.0096*** 0.0168*** 0.0096*** 0.0033 0.0178*** 0.0182***(0.0037) (0.0058) (0.0022) (0.0034) (0.0040) 0.0063
Deregulatedj(i) × I(t = 2011) 0.0071* 0.0125** 0.0049** 0.0022 0.0114*** 0.0132**(0.0037) (0.0055) (0.0022) (0.0033) (0.0040) 0.0060
Deregulatedj(i) × I(t = 2010) 0.0004 0.0085* 0.0098*** 0.0071** 0.0097** 0.0144**(0.0037) (0.0049) (0.0022) (0.0035) (0.0040) 0.0056
Deregulatedj(i) × I(t = 2009) -0.0013 0.0107** 0.0082*** 0.0079** 0.0067* 0.0169***(0.0037) (0.0045) (0.0022) (0.0031) (0.0040) 0.0052
Deregulatedj(i) × I(t = 2008) -0.0078** 0.0034 0.0069*** 0.0080** -0.0008 0.0103**(0.0037) (0.0039) (0.0022) (0.0031) (0.0040) 0.0048
Deregulatedj(i) × I(t = 2007) -0.0018 0.0049 0.0008 0.0018 -0.0014 0.0051(0.0037) (0.0035) (0.0022) (0.0029) (0.0040) 0.0044
Deregulatedj(i) × I(t = 2006) -0.0005 0.0018 0.0037* 0.0082*** 0.0030 0.0094**(0.0037) (0.0029) (0.0021) (0.0027) (0.0040) 0.0039
Deregulatedj(i) × I(t = 2005) -0.0003 0.0012 0.0022 0.0046** 0.0018 0.0056*(0.0037) (0.0021) (0.0021) (0.0022) (0.0040) 0.0031
Deregulatedj(i) × I(t = 2004) -0.0004 -0.0009 -0.0030 -0.0023* -0.0034 -0.0033(0.0037) (0.0020) (0.0021) (0.0013) (0.0040) 0.0024
Baseline: t = 2003
Deregulatedj(i) × I(t = 2002) 0.0000 0.0000 0.0000 0.0000 0.0000 0.0000(0.0037) (0.0000) (0.0021) (0.0000) (0.0040) (0.0000)
Deregulatedj(i) × I(t = 2001) 0.0000 0.0000 0.0000 0.0000 0.0000 0.0000(0.0037) (0.0000) (0.0021) (0.0000) (0.0040) (0.0000)
Deregulatedj(i) × I(t = 2000) 0.0000 0.0000 0.0000 0.0000 0.0000 0.0000(0.0037) (0.0000) (0.0021) (0.0000) (0.0040) (0.0000)
Deregulatedj(i) × I(t = 1999) 0.0000 0.0000 0.0000 0.0000 0.0000 0.0000(0.0037) (0.0000) (0.0021) (0.0000) (0.0040) (0.0000)
Deregulatedj(i) × I(t = 1998) 0.0000 0.0000 0.0000 0.0000 0.0000 0.0000(0.0037) (0.0000) (0.0021) (0.0000) (0.0040) (0.0000)
Constant 0.0000 0.0000 -0.0023*** -0.0020*** 0.0000 0.0000(0.0010) (0.0009) (0.0007) (0.0005) (0.0014) (0.0011)
R-squared 0.089 0.092 0.019 0.021 0.098 0.103Observations 532,559 529,669 503,705 501,156 532,559 529,669Individuals 31,327 31,157 31,327 31,157 31,327 31,157
Notes: The table documents the extent of sample attrition. In Columns (1) and (2), the dependent variable is an indicator variable thatis one if the individual dropped out from the social security records, zero otherwise. In Columns (3) and (4), the dependent variable isan indicator variable that is one if the individual reports missing/zero earnings, zero otherwise. In Columns (5) and (6), the dependentvariable is an indicator variable that is one if the individual reports missing/zero earnings or dropped out of the sample, zero otherwise.All regressions include year and individual fixed e�ects. Standard errors, clustered at the individual level, in parenthesis. Significancelevel: * p<0.10, ** p<0.05, *** p<0.01.Source: SIAB
184 Microeconometric Analyses on Determinants of Individual Labour Market Outcomes

4 Entry Barriers and the Labour Market Outcomes of Incumbent WorkersTa
ble
A4.1
4:E
arni
ngso
fWor
kers
Drop
ping
Out
ofth
eSa
mpl
e
(1)
(2)
(3)
(4)
(5)
(6)
(7)
(8)
2004
–201
420
04–2
006
2004
–200
820
09–2
014
Out
sam
ple i
-0.1
138*
**-0
.115
7***
-0.1
500*
**-0
.176
9***
-0.1
486*
**-0
.164
6***
-0.1
033*
**-0
.101
8***
(0.0
082)
(0.0
123)
(0.0
159)
(0.0
261)
(0.0
117)
(0.0
179)
(0.0
084)
(0.0
124)
Out
sam
ple i
×De
regu
late
d j(i)
0.00
370.
0517
0.03
15-0
.002
9(0
.016
5)(0
.032
0)(0
.023
4)(0
.016
9)De
regu
late
d j(i)
-0.0
007
-0.0
030
-0.0
037
0.00
14(0
.008
9)(0
.007
8)(0
.008
0)(0
.008
9)Co
nsta
nt4.
388*
**4.
388*
**4.
362*
**4.
364*
**4.
371*
**4.
373*
**4.
380*
**4.
380*
**(0
.004
4)(0
.006
7)(0
.003
8)(0
.005
7)(0
.004
0)(0
.005
9)(0
.004
4)(0
.006
7)
R-sq
uare
d0.
017
0.01
70.
010
0.01
00.
015
0.01
60.
013
0.01
3
Note
s:Th
ede
pend
entv
aria
ble
islo
ggr
ossd
aily
earn
ings
.Sam
ple
isre
stric
ted
toth
eye
ar20
03.O
utsa
mpl
eis
anin
dica
torv
aria
ble
that
ison
eif
the
wor
ker
disa
ppea
rsfro
mth
ean
alys
is(d
ueto
drop
ping
outf
rom
the
reco
rdso
rdue
tom
issi
ngan
dze
roea
rnin
gs),
zero
othe
rwis
e.In
Colu
mns
(1)a
nd(2
),w
eco
nsid
eral
ldro
pout
sfro
mth
esa
mpl
eov
eral
lyea
rsfr
om20
04to
2014
.In
Colu
mns
(3)a
nd(4
),w
eco
nsid
erea
rlydr
opou
tsfr
omth
esa
mpl
eov
erth
efir
sttw
oye
ars
from
2004
to20
06.I
nCo
lum
ns(5
)and
(6),
we
cons
ider
early
drop
outs
from
the
sam
ple
over
the
year
sfro
m20
04to
2008
.In
Colu
mns
(7)a
nd(8
),w
eco
nsid
erla
tedr
opou
tsfro
mth
esa
mpl
eov
erth
eye
arsf
rom
2009
to20
14.N
=31,
157
.Wor
kers
inth
eco
mpa
rison
grou
par
ew
eigh
ted
bym
atch
ing
wei
ghts
.Rob
ust
stan
dard
erro
rsin
pare
nthe
sis.
Sign
ifica
nce
leve
l:*p
<0.
10,*
*p<
0.05
,***
p<0.
01.
Sour
ce:S
IAB
Microeconometric Analyses on Determinants of Individual Labour Market Outcomes 185

4 Entry Barriers and the Labour Market Outcomes of Incumbent Workers
Table A4.15 : Earnings of Workers Dropping Out of the Sample: Controlling for Individual Characteristics
(1) (2) (3) (4) (5) (6)
All dropouts: 2004–2014 Early dropouts: 2004–2006
Outsamplei -0.1039*** -0.0651*** -0.0573*** -0.1696*** -0.1139*** -0.1048***(0.0118) (0.0111) (0.0110) (0.0251) (0.0214) (0.0209)
Outsamplei × Deregulatedj(i) 0.0104 0.0151 0.0292** 0.0629** 0.0511* 0.0714***(0.0160) (0.0148) (0.0144) (0.0310) (0.0267) (0.0255)
Deregulatedj(i) -0.0210 -0.0427** -0.0225 -0.0208 -0.0413** -0.0207(0.0206) (0.0192) (0.0259) (0.0197) (0.0190) (0.0259)
Constant 4.289*** 4.481*** 4.405*** 4.261*** 4.472*** 4.398***(0.0170) (0.0157) (0.0198) (0.0163) (0.0156) (0.0199)
Education control variables yes yes yes yes yes yesPersonal control variables no yes yes no yes yesJob control variables no no yes no no yes
R-squared 0.055 0.319 0.319 0.051 0.319 0.384
Notes: The dependent variable is log gross daily earnings. Sample is restricted to the year 2003. Outsample is an indicator variable that isone if the worker disappears from the analysis (due to dropping out from the records or due to missing and zero earnings), zero otherwise.Columns (1) to (3) consider all dropouts from the sample over all years from 2004 to 2014. Columns (4) to (6) consider early dropoutsfrom the sample over the first two years from 2004 to 2006. Control characteristics include the linear e�ect of the control variable andinteractions between the control variable and deregulated. Education control variables: training (4 cat.) and schooling (3 cat.). Personalcontrol variables: age (demeaned), age (demeaned) squared, gender, foreign citizenship. Age is demeaned to facilitate interpretation.Job control variables: industry (5 cat.), job tenure (4 cat.), and firm tenure (4 cat.). N = 31, 157. Workers in the comparison group areweighted by matching weights. Robust standard errors in parenthesis. Significance level: * p<0.10, ** p<0.05, *** p<0.01.Source: SIAB
186 Microeconometric Analyses on Determinants of Individual Labour Market Outcomes
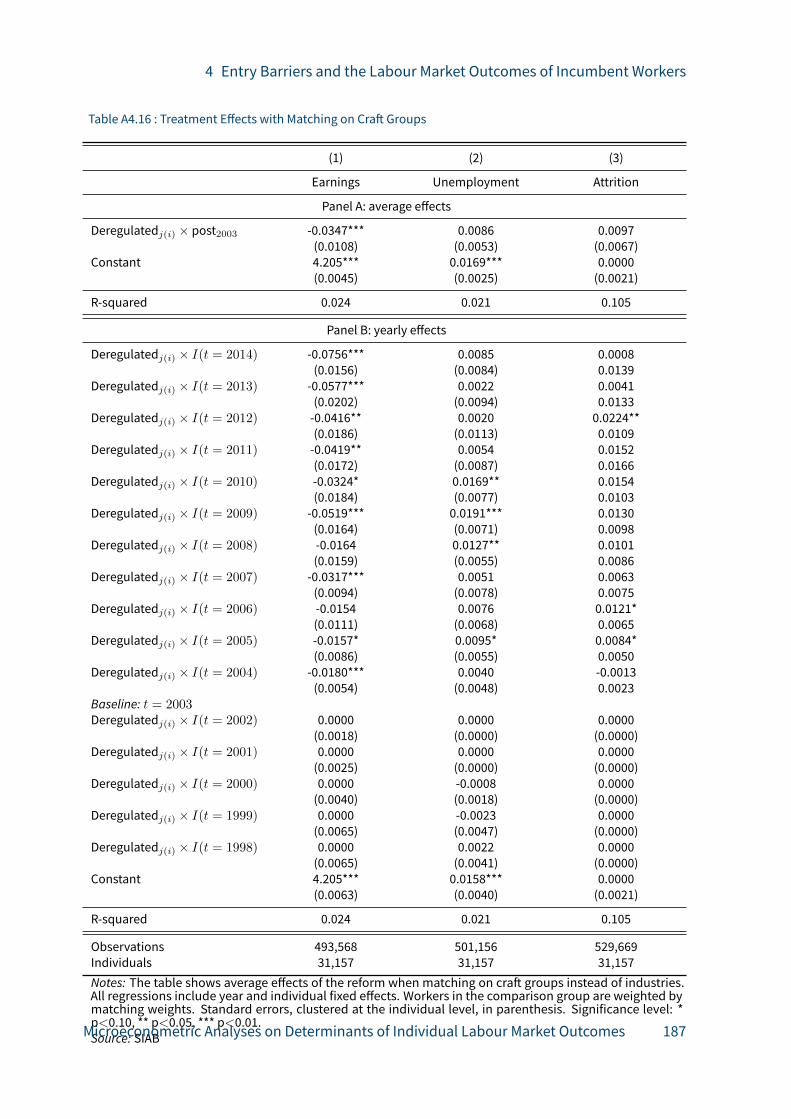
4 Entry Barriers and the Labour Market Outcomes of Incumbent Workers
Table A4.16 : Treatment E�ects with Matching on Cra� Groups
(1) (2) (3)
Earnings Unemployment Attrition
Panel A: average e�ects
Deregulatedj(i) × post2003 -0.0347*** 0.0086 0.0097(0.0108) (0.0053) (0.0067)
Constant 4.205*** 0.0169*** 0.0000(0.0045) (0.0025) (0.0021)
R-squared 0.024 0.021 0.105
Panel B: yearly e�ects
Deregulatedj(i) × I(t = 2014) -0.0756*** 0.0085 0.0008(0.0156) (0.0084) 0.0139
Deregulatedj(i) × I(t = 2013) -0.0577*** 0.0022 0.0041(0.0202) (0.0094) 0.0133
Deregulatedj(i) × I(t = 2012) -0.0416** 0.0020 0.0224**(0.0186) (0.0113) 0.0109
Deregulatedj(i) × I(t = 2011) -0.0419** 0.0054 0.0152(0.0172) (0.0087) 0.0166
Deregulatedj(i) × I(t = 2010) -0.0324* 0.0169** 0.0154(0.0184) (0.0077) 0.0103
Deregulatedj(i) × I(t = 2009) -0.0519*** 0.0191*** 0.0130(0.0164) (0.0071) 0.0098
Deregulatedj(i) × I(t = 2008) -0.0164 0.0127** 0.0101(0.0159) (0.0055) 0.0086
Deregulatedj(i) × I(t = 2007) -0.0317*** 0.0051 0.0063(0.0094) (0.0078) 0.0075
Deregulatedj(i) × I(t = 2006) -0.0154 0.0076 0.0121*(0.0111) (0.0068) 0.0065
Deregulatedj(i) × I(t = 2005) -0.0157* 0.0095* 0.0084*(0.0086) (0.0055) 0.0050
Deregulatedj(i) × I(t = 2004) -0.0180*** 0.0040 -0.0013(0.0054) (0.0048) 0.0023
Baseline: t = 2003Deregulatedj(i) × I(t = 2002) 0.0000 0.0000 0.0000
(0.0018) (0.0000) (0.0000)Deregulatedj(i) × I(t = 2001) 0.0000 0.0000 0.0000
(0.0025) (0.0000) (0.0000)Deregulatedj(i) × I(t = 2000) 0.0000 -0.0008 0.0000
(0.0040) (0.0018) (0.0000)Deregulatedj(i) × I(t = 1999) 0.0000 -0.0023 0.0000
(0.0065) (0.0047) (0.0000)Deregulatedj(i) × I(t = 1998) 0.0000 0.0022 0.0000
(0.0065) (0.0041) (0.0000)Constant 4.205*** 0.0158*** 0.0000
(0.0063) (0.0040) (0.0021)
R-squared 0.024 0.021 0.105
Observations 493,568 501,156 529,669Individuals 31,157 31,157 31,157Notes: The table shows average e�ects of the reform when matching on cra� groups instead of industries.All regressions include year and individual fixed e�ects. Workers in the comparison group are weighted bymatching weights. Standard errors, clustered at the individual level, in parenthesis. Significance level: *p<0.10, ** p<0.05, *** p<0.01.Source: SIABMicroeconometric Analyses on Determinants of Individual Labour Market Outcomes 187


5 Shocking Choice: Trade Shocks, Local LabourMarkets and Vocational Occupation Choices
5.1 Introduction
How do individuals cope with changing economic conditions and structures? Understandinghow individuals prepare for and react to change is a central economic question becauseit determines how they fare on the labour market. Economies transition from agricultural,to manufacturing, to service-based economies; a phenomenon commonly referred to asstructural change. With these transitions, the composition of labour markets changes in termsof the shares of individuals working in agriculture, manufacturing or services, depending onthe stage of development of an economy.1 At least two factors contribute to this transition:technological progress (Levy and Murnane, 1992) and globalization (Dauth and Suedekum,2016). Technological progress leads to automation and changes the modes of production andglobalization with international trade leads to products being produced all over the worldand traded. In such transition times, education is ever more important, because it enablesthe labour force to adapt to change, both in terms of technological advancement and newrequired skills (Nelson and Phelps, 1966). In particular, general, rather than specific skills arevaluable, because they are transferable and widely applicable. Therefore, they insure theindividual from unemployment (Krueger and Kumar, 2004).
This chapter looks at the impact of growing up in a region exposed to structural change onindividuals’ occupation choices. Do individuals enter vocational occupations that teach themspecific or general skills? The focus lies on occupations of young adults in Germany whoenter vocational education training through an apprenticeship. The main hypothesis is thatindividuals exposed to structural unemployment due to plant closures or mass lay-o�s intheir local labour market may be inclined to choose occupations that shelter them from suchforces by teaching adaptable and transferable skills. If individuals fail to update their choicesgiven the state of their local labour market and enter skill-specific occupations, this may haveimportant economic consequences on their future labour market outcomes as they will beless able to adjust to potential new jobs and skill requirements.
To obtain causal evidence of the e�ects of growing up exposed to structural change, thischapter uses local labour market exposure to import competition (trade shocks) from China
1 Between 1980 and 2010, the US manufacturing employment share has decreased by 52.0 percent from 21.0percent to 10.1 percent and for Germany, with traditionally higher manufacturing employment shares, it hasstill declined by 40.9 percent, from 34.0 percent to 20.1 percent. (U.S. Bureau of Labour Statistics, Percent ofEmployment in Manufacturing in the United States and Germany, retrieved from FRED, Federal Reserve Bank ofSt. Louis; https://fred.stlouisfed.org/series/USAPEFANA, [accessed 8 August, 2018].)
Microeconometric Analyses on Determinants of Individual Labour Market Outcomes 189

5 Trade Shocks and Vocational Occupation Choices
and Eastern Europe as an exogenous source of variation, following the seminal paper by Autor,Levy and Murnane (2003). Local labour market exposure to import competition has beenshown to decrease local manufacturing employment shares (e.g. Autor, Dorn and Hanson,2013; Dauth, Findeisen and Suedekum, 2014). This loss in manufacturing employment is theimplicit first stage to the reduced form regressions of the e�ect of import competition onvocational occupation choice in this chapter.
Using longitudinal individual-level administrative social security data, the chapter analysesthe causal e�ect of local import competition exposure at the age of 15 on vocational occupa-tion choices and subsequent labour market outcomes. The data, a 2 percent sample of allindividuals in Germany subject to social security, provide detailed information on individuals’occupational history, including the occupation during apprenticeship, earnings, age and whichcounty they work in. My sample contains 192,025 individuals which includes occupationalchoices made between 1991 and 2013. I exploit the exogenous rise in trade volumes with bothChina, following the accession to the WTO and Eastern Europe, a�er the fall of the iron curtainas an exogenous supply shock of manufacturing good imports to Germany (Dauth, Findeisenand Suedekum, 2014).
The measure of local labour market exposure to import competition is defined as the 10-yearchange in Chinese and Eastern European import exposure per worker in a county. Imports areapportioned to the county according to its share of national industry employment. Variationstems from initial local industry structures with respect to manufacturing employment sharesand within-manufacturing specialization patterns with respect to import-intensive industries.The import exposure measure is then the potential local per worker import exposure, givennational industry import volumes, in the style of a shi�-share measure (Bartik, 1991). In somemanufacturing industries, such as textiles or toys in the case of China, or car parts and ironand steel in the case of Eastern Europe, these countries became competitive, started havinga comparative advantage and exported goods to Germany, which then posed competitivepressure on regions specialized in these industries. I extend the literature on trade shocksby using time-varying local import exposure, exploiting both county-level and time variationin import exposure. One concern with import exposure is that employment and importsmay be positively correlated with unobserved shocks to domestic product demand. This isparticularly problematic here, as individuals’ vocational education occupation is of centralinterest, and push and pull factors stemming from labour demand should be shut down asmuch as possible. To isolate the supply-driven component of imports from China and EasternEurope, I use imports (and exports) to other high income countries as instruments for Chineseand Eastern European trade with Germany (following e.g., Autor, Dorn and Hanson, 2013;Dauth, Findeisen and Suedekum, 2014). Imports from China and Eastern Europe to other highincome countries predict imports to Germany well, but are unrelated to German local laboursupply and demand structures.
190 Microeconometric Analyses on Determinants of Individual Labour Market Outcomes

5 Trade Shocks and Vocational Occupation Choices
There is little evidence on adolescents’ occupation choices and how they are a�ected, inparticular in vocational education.2 Vocational education training is the relevant point ofentry into a broad class of middle-skill occupations that represent well over half of the Germanlabour force (Statistisches Bundesamt, 2018b).3 Occupations can be classified in terms of theirgenerality and skill-specificity in a detailed and consistent manner. I di�erentiate betweenskill-specific and general occupations using a skill-weights-based occupational specificitymeasure (Lazear, 2009), with which I show that manufacturing and cra� occupations aremore skill-specific than service and merchant occupations. The chapter analyses to whatextent individuals protect themselves from future unemployment from structural changeby possessing skills which are transferable and applicable to changing technology or newoccupations. For instance, jobs with a high share of computer use will teach the individualtransferable skills of IT knowledge that could be applied in another job, if the current onebecomes obsolete due to structural change. Since computation is such a central elementof technological change, one outcome is whether individuals choose occupations with highcomputer use. I also look at whether the occupation is manual labour, as manual labourtends to be highly skill-specific. In a second step, this chapter analyses the impact of importexposure on later life labour market outcomes in terms of earnings, unemployment as well asoccupational and regional mobility.
The results show that import exposure makes adolescents choose more skill-specific occu-pation groups in manufacturing and cra�s, more import-intensive manufacturing industriesin particular, and less general occupations in services and commerce (as merchants). Thissuggests that individuals do not shelter themselves from future import competition or automa-tion because they do not enter occupations which impart general skills. This also implies thatindividuals do not adjust away from the predominant industry structure of the county theygrew up in. The results also show that in terms of the task content of occupations, individualsexposed to more import competition are less likely to enter occupations with high computeruse, and more likely to enter manual occupations.
Moreover, I find that individuals exposed to import competition in their adolescence whoenter vocational education are adversely a�ected on the labour market in later life. They earnless 5 and 10 years a�er their apprenticeships and also experience less earnings growth. Theyare surprisingly more mobile in terms of occupational mobility, but less mobile regionally. Atleast, there is no negative e�ect on lifetime unemployment duration and they are more likelyto be employed immediately following their apprenticeship. This result is in line with thefinding from the general versus vocational education literature which shows that skill-specificeducation makes the transition from schooling to the labour market easier, but increases riskof unemployment in later life and leads to earnings losses (Hanushek et al., 2017a; Hampf andWoessmann, 2017). I do not find evidence that it increases unemployment later in life, but I do2 See Wolter and Ryan (2011) for a review on the existing literature on vocational education training.3 Keeping the level of education fixed at vocational education has the advantage that career paths are compara-ble and no potential income e�ects from trade shocks bias the results, since all vocational occupation trainingspay similar wages and are similar in length.
Microeconometric Analyses on Determinants of Individual Labour Market Outcomes 191

5 Trade Shocks and Vocational Occupation Choices
find losses in earnings instead. While the negative labour market outcomes cannot be directlycausally linked to the vocational occupation choices due to biases caused by self-selection,suggestive evidence shows that general skill occupation groups shelter individuals from theadverse e�ects of import competition on earnings growth. The negative e�ects of importcompetition on earnings growth seem to be entirely driven by those entering manufacturingoccupations.
An obvious channel as to why individuals still enter these occupations that a�ect them ad-versely are parents. I show suggestive evidence that while parental occupation is an importantdriver in adolescents’ occupation choices (i.e. individuals enter the same occupation as theirparents), having a father that worked in manufacturing and growing up in regions exposed toimport competition, actually decreases the probability of individuals to enter a skill-specificmanufacturing job. This suggests that potential first-hand negative experiences of job orincome loss due to import competition within a family, may work to dissuade individuals fromtaking up skill-specific occupations.
In terms of threats to identification, I show that the e�ects are not biased by endogenous sub-sample sorting in the sense of di�erential sorting into di�erent educational tracks due to tradeshocks. Moreover, using data on local supply and demand ratios of apprenticeship positions,I confirm that the e�ects are not purely labour demand driven. The results are further robustto various alternative definitions of import exposure. As far as e�ect heterogeneities go, Ifind that men and women make very di�erent choices when exposed to import competition.Women, as opposed to men, are more likely to enter service and merchant occupations whenexposed to local import competition during adolescence. They also choose occupations withhigher computer use. However, women are nevertheless still adversely a�ected by importcompetition in terms of later labour market outcomes.
The chapter is related to and contributes to several strands of literature: the literature on (1)general versus skill-specific education, (2) occupational skill-specificity, (3) the e�ect of busi-ness cycles on education choices and other outcomes, and of course (4) the impacts of tradeshocks on individuals. It has been shown that general education, in the sense of higher educa-tion at university, versus skill-specific apprenticeship-based or vocational education, teachesmore transferable skills that allow better adaptation to changing technologies, and thereforeact as an insurance against later unemployment. Krueger and Kumar (2004) show that on acountry level, economies that favour vocational education grow slower than countries thatfocus on general education, due to slower adaptations of new technologies, in particularwhen the pace of technological advancement increases. At the individual level, Hanusheket al. (2017a) and Hampf and Woessmann (2017) show that vocational education eases entryinto the labour market for young individuals but increases the risk of unemployment in laterlife and also reduces lifetime income. This chapter contributes to the literature by providing amuch more detailed approach to general versus skill-specific education than the dichotomyof vocational versus university education by looking at the skill-specificity across occupations.
192 Microeconometric Analyses on Determinants of Individual Labour Market Outcomes

5 Trade Shocks and Vocational Occupation Choices
I construct an occupational skill-specificity measure based on skill-weights using occupationalskills and tasks from a German employment survey to categorize occupation groups by theirspecificity similar to Gathmann and Schönberg (2010); Geel, Mure and Backes-Gellner (2011).Eggenberger, Rinawi and Backes-Gellner (2018) using skill requirements in Swiss trainingcurricula, find that there is a trade-o� between higher wages in more specific occupations butlower occupational mobility and therefore higher risk of unemployment. To my knowledge,my study is the first to look at the impact of economic conditions on the skill-specificity ofoccupation choices.
Business cycle conditions have been found to a�ect individuals’ schooling decisions and laterlife outcomes. Dellas and Koubi (2003) find that schooling decisions follow a countercyclicalpattern, showing that reduced opportunity costs during recessions play a major role in edu-cation decisions of individuals, and Adamopoulou and Tanzi (2017) find that in recessionsthe likelihood of university students to drop out decreases and on-time graduation increases.Many studies have further shown that economic conditions at the point of labour marketentry can have long and persistent e�ects on individual labour market outcomes. Studies byKahn (2010) and Oreopoulos, von Wachter and Heisz (2012) show that college graduates inthe United States experience income losses that persist for up to ten years when graduatingduring a recession. The predominant reason for this is the lower quality of the first job place-ment and skill-mismatch. Altonji, Kahn and Speer (2016) show that higher paying majors aresheltered from the negative e�ects of a recession. This chapter contributes to that literaturebecause it investigates the e�ect of trade induced structural change (i.e., a more permanentchange in economic conditions) on individual occupation decisions and the e�ects on laterlife outcomes.
Lastly, this chapter contributes to the literature on trade shocks. In their seminal paper, Autor,Dorn and Hanson (2013) show that import exposure from China can explain large shares ofthe declines in manufacturing employment in local labour markets in the US. For Germany,Dauth, Findeisen and Suedekum (2014) looking at trade with both China and Eastern Europe,show that although net exports have actually retained employment within manufacturingbecause of increased export opportunities, local labour markets with high import competi-tion have still seen decreasing employment in manufacturing and other industries. Importexposure has sped up structural change in German regions which specialized in import in-tensive industries and su�ered clear employment losses (Dauth and Suedekum, 2016). Muchof the literature on trade shocks has focused on the impact of regional aggregate employ-ment patterns (Autor, Dorn and Hanson, 2013; Dauth, Findeisen and Suedekum, 2014, 2017),explaining manufacturing employment changes through Chinese (and Eastern European)import competition. Dauth and Suedekum (2016) show that import exposure, driven by largeinitial shares of import manufacturing industries, speeds up regional structural change, i.e.,the decline in manufacturing employment. Several papers look at the e�ects of trade shockson individuals, namely on incumbent workers exposed to import competition at the level oftheir industry. Autor et al. (2014) find that workers more exposed to trade with China through
Microeconometric Analyses on Determinants of Individual Labour Market Outcomes 193

5 Trade Shocks and Vocational Occupation Choices
their industry of employment exhibit lower cumulative earnings and employment and higherreceipt of disability insurance. In another paper at the individual incumbent worker level forGermany, Dauth, Findeisen and Suedekum (2018) show that imports reduce earnings andinduce workers to leave their industry. In contrast, this study is the first to look at the e�ect oflocal labour market import shocks on individuals (not incumbent workers in manufacturingindustries), focusing on local import exposure for young labour market entrants and theirchoice of vocational education occupation.
The rest of the chapter is structured as follows: Section 5.2 explains the institutional back-ground of the vocational education training system in Germany and derives a conceptualframework with relation to the literature. Section 5.3 introduces the empirical set up, includingthe empirical identification strategy, the definitions of import exposure and occupationalspecificity and describes the data. Section 5.4 then presents and discusses the results in turn.Section 5.5 provides concluding remarks.
5.2 Conceptual Framework on Trade Shocks and VocationalOccupation Choices with Relation to the Literature
The aim of this chapter is to provide causal evidence on the e�ect of regional import competi-tion exposure in adolescence on the vocational occupation an individual enters. It focuseson analysing which type of occupation the person enters, what the task content of that oc-cupation is, and what the subsequent labour market outcomes are. This section derives aconceptual framework based on the existing literature on how structural change inducedby import competition may a�ect vocational occupation choices and to which extent thesemay shelter individuals from structural unemployment. I begin by providing context to theinstitutional background of the German dual vocational education training system.
5.2.1 Institutional Background on the Vocational Education System in Germany
The German Vocational Education Training (VET) system, also sometimes called the dualsystem, is an important and firmly established part of the German education system. Itscentral feature is cooperation between mainly small and medium sized companies, on the onehand, and publicly funded vocational schools, on the other hand. Individuals in VET spend partof their time working as an apprentice at a company and the other part at a vocational school.It is up to the individual to apply to and find an apprenticeship position at a company. VETusually lasts two to three-and-a-half years. The cooperation, contracts and training curriculaare regulated by the federal states. The German education system tracks its students froman early age into di�erent school tracks that determine their further course of education andworking life (Hanushek and Woessmann, 2006). Usually at the age of 10, at the end of primaryschool, students are divided into an academic track that will enable them to attend universityif completed, and a lower or middle track, upon completion of which students normally go
194 Microeconometric Analyses on Determinants of Individual Labour Market Outcomes

5 Trade Shocks and Vocational Occupation Choices
on to vocational education. While the share of individuals in any cohort in VET used to besubstantially higher, up to 70 percent during the 1970s, this share was still at 40 percent in2016 (Statistisches Bundesamt, 2018b). There are over 320 di�erent occupations that requirevocational education, which range from manual and technological to service, merchants orpublic service related occupations. Apprentices consistently make up about 5 percent of theGermany social security based labour force. In 2016, 28 percent of firms in Germany o�eredapprenticeships and 68 percent of apprentices were o�ered a full employment contract attheir training firm upon completion of VET (BIBB, 2016).
5.2.2 Vocational Occupation Choices
General versus Skill-Specific Education The central idea is that in the broad spectrum of320 di�erent occupations that individuals enter through VET, some occupations are more skill-specific and some more general in the skills they teach, so that they shelter individuals fromstructural unemployment caused by automation and trade because of transferable and widelyapplicable skills. In the literature, it has long been recognized that education is important be-cause it enables adaptation to change, be it in terms of technological advancement, structuralchange or economic conditions (Nelson and Phelps, 1966). Hanushek et al. (2017b) show thatreturns to skills are larger in faster growing economies, lending evidence to the hypothesis thateducation enables better adaptation of skills to technologies. The literature further recognizesthat general, rather than vocational education is better suited to reap the benefits of educationin terms of better adaptation to change, because more general and therefore transferable skillsare taught. By general education, the literature usually refers to tertiary education in the formof university education, while skill-, technology-, and occupational-specific education refersto vocational and apprenticeship based education (Ryan, 2003). Krueger and Kumar (2004)show that on a country level, economies that favour vocational education grow slower thancountries that focus on general education, due to slower adaptations of new technologies, inparticular when the pace of technological advancement increases. The authors o�er this aspotential explanation for di�erential growth rates between the United States (more generaleducation) and European countries (more vocational focus), since the rate of technologicaladvancement has picked up since the 1980s. At the individual level, Hanushek et al. (2017a)and Hampf and Woessmann (2017) show that vocational education eases entry into the labourmarket for young individuals but increases the risk of unemployment in later life and alsoreduces lifetime income. The reason is that while vocational education provides a more seam-less transition from the apprenticeship into regular employment, it does not impart enoughadaptive skills in case of unemployment later in life. With general education and transferableskills, the risk of unemployment is reduced because individuals are better able to adapt tonew occupations and new tasks. In times of globalization, structural change and skill-biasedtechnological change, this trade-o� becomes particularly relevant, where whole occupationsmay cease to exist due to automation processes or are o�-shored to other countries.
Microeconometric Analyses on Determinants of Individual Labour Market Outcomes 195

5 Trade Shocks and Vocational Occupation Choices
This chapter applies the same logic of general and skill-specific education horizontally withinthe vocational education system of Germany, namely through the vocational occupationchoice of individuals. While there has been much attention in research on college enrolmentand returns to college degrees (for a review see e.g. Oreopoulos and Petronijevic, 2013), ormajor choices (e.g. Altonji, Arcidiacono and Maurel, 2016; Card and Payne, 2017) and major-specific returns (Kirkeboen, Leuven and Mogstad, 2016; Hastings, Neilson and Zimmerman,2013), very little attention has been paid to outcomes within vocational education training.Holding a vocational education degree versus not having a professional degree at all is associ-ated with a premium of about 15 percent (Kugler, Piopiunik and Woessmann, 2017). However,very little is known about the di�erent occupations within vocational education, who choosesthem and why and which e�ects they have on individuals’ labour market outcomes. Deter-minants of education and occupational choices are naturally very di�icult to pin down, dueto the highly personal, multidimensional and therefore endogenous nature of this choice.Causal evidence on the returns to higher versus vocational education would be hard to obtain,due to issues of selection into either higher general education or vocational training, which asin Germany, is o�en determined by choices at much earlier points in life (Ryan and Unwin,2001). This chapter investigates individuals’ vocational education and career paths, holdingthe level of education fixed at the level of vocational education training. I argue, that just aswith general versus vocational education, there are di�erences in the generality and skill-,technology- and occupational specificity within vocational educations. With these di�erences,the same argument in terms of adaptation to change, in particular skill-biased technologicalchange holds. For example, while vocational training in manufacturing occupations will o�erproduction-technology specific skills, vocational training in more business or service orientedjobs will o�er more transferable skills such as communication or quantitative skills, that arebroadly applicable in other occupations. Looking only at vocational education further hasthe advantage that individuals’ level of education is kept fixed and career paths are compara-ble. The choice of higher versus vocational education would introduce an income question,and trade shocks per se may impact family incomes and therefore distort the e�ects. In therobustness checks, I investigate whether individuals select intro di�erent education trackswhich may lead to higher education di�erentially, but do not find any e�ects.
Occupational Specificity The di�erentiation between general and specific education alongthe lines of tertiary university versus vocational education, is very simplistic. Instead, thischapter distinguishes skill-specificity between occupations that require VET. Some occupa-tions teach more general skills that are transferable and can be applied in other occupationsor other industries. Such skill transferability is particularly important in times of structuralchange, in which with trade and automation, many occupations are either o�-shored or ceaseto exist due to automation altogether. Lazear (2009) provides a useful framework for occupa-tional specificity, called skill-weights approach, which assumes that occupations use di�erentskills with di�erent weights attached, so called skill bundles. The skill bundles of occupationshave di�erent distances to the skill bundle of the labour market on average. The further away
196 Microeconometric Analyses on Determinants of Individual Labour Market Outcomes

5 Trade Shocks and Vocational Occupation Choices
a skill bundle is from the average of the labour market, the more specific that occupation isand the more costly it is for a person with such skills to change occupations. Skill bundles thatare similar to the labour market on average, mean that people in such occupations shouldfind it easy to switch occupation. Geel, Mure and Backes-Gellner (2011) operationalise theskill-weights approach for German occupation using skills from a German employment surveyand construct a measure for occupational specificity using total absolute rank di�erences inskills in an occupation compared to the labour market on average. They find that the morespecific an occupation is, the higher the apprentice training cost for the firm and the lowerthe occupational mobility. Gathmann and Schönberg (2010) use tasks rather than skills in thesame employment survey, and they construct an angular distance measure of task-specifichuman capital. Eggenberger, Rinawi and Backes-Gellner (2018) look at skill requirements intraining curricula for Switzerland. They find a clear trade-o� between higher wages in morespecific occupations but lower occupational mobility and therefore higher risk of unemploy-ment. I construct a measure for occupational specificity using information on occupationalskills and tasks in order to rank occupational groups by their skill-specificity and show thatmanufacturing and cra� occupations are more specific than service or merchant occupations.
5.2.3 Impact of Economic Conditions on Young Individuals
We know from the literature that economic circumstances during childhood and adolescenceimpact individual education paths and later life outcomes. An extensive literature investigatesthe impact of the business cycle on individuals’ behaviour and choices and how these e�ectlifetime outcomes. Because of the short-term character of booms and recessions, meaningthat normally the economy will again return to its previous state, it would be optimal forindividuals to not change their behaviour Nevertheless, there is ample evidence, that beingexposed to a recession during youth, changes individuals’ beliefs, education choices andlater economic outcomes. In terms of beliefs, Giuliano and Spilimbergo (2014) find thatindividuals who experienced a recession when young believe that success in life depends moreon luck than e�ort, support more government redistribution, and tend to vote for le�-wingparties. Malmendier and Nagel (2011) find that recessions during adolescence lead to lowerparticipation in the stock market, lower willingness to take financial risk and lower investmentsas well as increased pessimism about future stock returns. As far as the impact on educationchoices go, there is evidence that schooling decisions follow a countercyclical pattern becauseof reduced opportunity costs of education. When the economy is in a downturn and goodjob opportunities become scarce, going to school is less costly in terms of forgone earnings.This e�ect seems to outweigh the income e�ect of a recession (Dellas and Koubi, 2003).From this follows that enrolment to college increases with economic downturns (Betts andMcFarland, 1995) and the likelihood of drop-outs decrease (Adamopoulou and Tanzi, 2017).College students also tend to choose high return majors such as STEM fields more o�enrather than business related studies when the economic situation is brittle (Liu, Sun andWinters, 2017; Blom, Cadena and Keys, 2015). Nagler, Piopiunik and West (2015) show thatteacher quality increases during recessions, as labour market entrants face less certain outside
Microeconometric Analyses on Determinants of Individual Labour Market Outcomes 197

5 Trade Shocks and Vocational Occupation Choices
options vis-à-vis the relatively safe teaching profession. Despite higher college enrolment rates,lifetime labour market incomes are actually shown to be adversely a�ected by recessions.Graduating from high-school, college or graduate school during a recession can have long-lasting detrimental e�ects on lifetime earnings and other outcomes (Raaum and Røed, 2006;Oreopoulos, von Wachter and Heisz, 2012; Kahn, 2010; Oyer, 2006), predominantly caused bya lower quality of first job placement. Also cyclical skill-mismatch has been found as a reasonfor adverse e�ects of graduating during a recession (Liu, Salvanes and Sørensen, 2012). Onthe other hand, Altonji, Kahn and Speer (2016) show that higher paying majors are shelteredfrom the negative e�ects of a recession. This chapter contributes to the literature in that itlooks at the e�ect of a more permanent change in economic conditions on education choicesand later labour market outcomes, namely structural change. If the business cycle impactsindividuals’ choices, then a more permanent, though slower change is expected to also havean impact.
5.2.4 Structural Change and Trade Shocks
Structural change Structural change, i.e., the slow change from a predominantly manufac-turing to service based economy, started in Germany like in most Western countries in the1970s. It can be said to be driven by both automation and trade, in that routine tasks becomeautomated and goods get produced where it is cheapest to do so. Structural unemployment isthen caused by a permanent mismatch between the skills of the workforce and the changingmode of production in the economy, because the demand for skills changes. Automation ofproduction processes implies that routine tasks, which are programmable, become increas-ingly redundant while more computational, communication and other generally transferableskills are more sought a�er (e.g. Autor, Levy and Murnane, 2003; Autor, Katz and Krueger, 1998).This phenomenon is referred to as skill-biased technological change. Autor, Levy and Murnane(2003) argue that as computers take over routine tasks, they increase demand for workerswho perform ‘non-routine’ tasks that are complementary to the automated processes. Sincecomputation is such a central element of technological change, this chapter also tests whetherindividuals choose occupations with high computer use. Computer use in occupations comeswith many general skills, that are transferable to other occupations, such as programming,communication or analysis. Spitz-Oener (2006) finds that occupations with high computeruse see most pronounced changes in skill requirements. The author generally shows that taskcomplexity within occupations has increased since the nineteen-eighties and the need formanual routine tasks has plummeted in Germany.
Trade shocks Other than automation, international trade is o�en said to be the other impor-tant factor driving structural change. Between 1993 and 2013, Germany has seen an over 20percent decline in manufacturing employment (e.g. Dauth, Findeisen and Suedekum, 2017).In the literature, the unexpected and rapid rise in Chinese productivity and the associated risein trade with China and the rest of the world, has been keenly exploited as an exogenous shock
198 Microeconometric Analyses on Determinants of Individual Labour Market Outcomes

5 Trade Shocks and Vocational Occupation Choices
in global trade. In their seminal paper, Autor, Dorn and Hanson (2013) analyse the impactof Chinese import competition on US local labour markets and show that trade with Chinaexplains one third of the decline in manufacturing in local labour markets. Identification stemsfrom di�erential initial industry structures across local labour markets. They also instrumenttrade volumes between the US and China with trade volumes between China and other highincome countries. They find that local markets more exposed to Chinese import competitionsee higher unemployment, lower labour force participation, and reduced wages. In anotherpaper, Autor et al. (2014) analyse the impact of industry trade exposure on labour marketoutcomes of incumbent workers. They find that workers more exposed to trade with Chinathrough their industry of employment exhibit lower cumulative earnings and employmentand higher receipt of disability insurance.
In Germany, import competition from China has also led to decreases in manufacturing em-ployment. Dauth, Findeisen and Suedekum (2014) estimate the local labour market e�ects oftrade with “the East” for Germany. They not only use trade with China, but also investigatetrade with Eastern Europe, which for Germany constituted another unexpected and sharprise in trade a�er the fall of the iron curtain. The results for Germany di�er substantially fromthose of the US, since Germany has a total current account surplus and more balanced tradewith China and Eastern Europe than the US. They find that net export exposure (exports minusimports) has actually slowed down the decline in manufacturing employment and regionsspecialized in export industries have seen increases in employment. Nevertheless, they alsofind that regions specialized in import competing industries have seen substantial employ-ment losses both in manufacturing and in other industries. They find that a 10-year change inlocal import exposure of 1000 Euro per worker reduced manufacturing employment relative tooverall employment by 0.19 percentage points. In another paper, Dauth and Suedekum (2016)show that large import exposure, driven by large initial shares of import manufacturing, spedup structural change, i.e the decline in manufacturing employment. This finding representsthe implicit first stage to the reduced form regression of import competition on occupationchoices in this chapter.
Generally, manufacturing employment has been on a secular decline in Germany. Dauth,Findeisen and Suedekum (2017) show that the transition from manufacturing to services isfuelled by new labour market entrants as well as unemployed who re-enter the labour market.They show that net exports pulled labour market entrants more into manufacturing and intoexport-oriented firms more generally. There is no direct switching between employment inmanufacturing and service without first undergoing unemployment. These estimates arebased on county aggregates. In another paper at the individual incumbent worker level, Dauth,Findeisen and Suedekum (2018) find that imports reduce earnings and induces workers toleave their industry. This chapter contributes to the literature, as it analyses the impact ofimports competition on individuals, focusing on regional import exposure for young labourmarket entrants and their choice of vocational education occupation.
Microeconometric Analyses on Determinants of Individual Labour Market Outcomes 199

5 Trade Shocks and Vocational Occupation Choices
5.3 Empirical Set-Up
This section describes the empirical model and identification strategy, how trade shocksand occupational specificity are constructed, the various data sources used, and provides adescriptive overview of the data.
5.3.1 Empirical Model
An individual growing up in a county exposed to stronger imports during his adolescence, ex-periencing unemployment in manufacturing, lay-o�s or plant closures, may choose a di�erentvocational occupation than otherwise. The regression analysis is a reduced form regressionof local import exposure on education choices, with local structural change (reductions inmanufacturing employment) being the conceptual first stage or channel driving the results.The regression estimation is therefore:
yr,ti = β1∆ImportExposureGer←C+EErt + β2∆ExportExposure
Ger→C+EErt +
β3Xi + β4Xr + γt∗s + εi(5.1)
where yr,ti is individual i’s outcome in terms of vocational occupation type, task content orlater labour market outcomes (which depends on county r and year t but does not vary bythem), ∆ImportExposurert is the import exposure per worker in county r and year twhenindividual i is 15, ∆ExportExposurert is export exposure per worker in county r and yeartwhen individual i is 15,Xi are individual controls,Xr are county controls, γt∗s are year by statedummies, and εi is an error term. Import and export exposures vary per year on the level of402 counties. Standard errors are clustered at the county level. The model is estimated usingOLS linear probability models for most outcomes which are binary4. β1 therefore denotesour coe�icient of interest, namely the increase in the probability of an individual havingoutcome y, when import exposure increases by 1000 Euro per worker in county r at year twhen individual i is 15.
5.3.2 Identification
The increases in trade with China and Eastern Europe can be said to have been exogenous fromthe point of view of German regions, as they stemmed from the respective domestic increasesin productivity and competitiveness. China’s accession to the WTO in 2001 and the fall ofthe iron curtain in Eastern Europe and its subsequent transition to democracy and marketoriented economies in 1990, were mostly exogenous supply shocks to the world economy.
4 Only the variables age at apprenticeship start and income are not binary
200 Microeconometric Analyses on Determinants of Individual Labour Market Outcomes

5 Trade Shocks and Vocational Occupation Choices
From the point of view of a German region with high shares of employment in an industryin which China or Eastern Europe started having a comparative advantage in and thereforestarted exporting to Germany, import competition is as good as random. Identification comesfrom di�erent initial industry specializations across counties. Take the example of two countieswith similar shares of employment in manufacturing in 1980. One county has high shares ofemployment in the textile industry, while the other specialists in the automotive industry.The county with high textile specialization experiences a strong import shock from China, astextile is one of the industries China has become competitive in. This county may experienceclosures of textile manufacturing plants and mass lay-o�s, with subsequently high shares ofunemployment. The other county with the automotive industry on the other hand, actuallybenefits from trade with China due to increasing export opportunities, as Germany retainedthe competitive advantage in the car industry. The local trade shocks are constructed by usinga shi�-share measure (Bartik, 1991), where national industry trade is apportioned by initiallocal industry employment structures (explained in detail in Section 5.3.3).
Nevertheless, a major concern with trade shocks is that employment and imports may bepositively correlated with unobserved shocks to domestic product demand, in which casethe e�ect on manufacturing employment, i.e., the implicit first stage to the reduced formregression in Equation 5.1 would be underestimated. This is particularly problematic here,as the choice of vocational education occupation is of central interest, and push and pullfactors stemming from labour demand should be shut down as much as possible. To isolatethe supply-driven component of imports and exports from China and Eastern Europe, I useimports and exports to and from other high income countries with China and Eastern Europe(following e.g. Autor, Dorn and Hanson, 2013; Dauth, Findeisen and Suedekum, 2014). Forthe exclusion restriction to hold, it is important that while those third group countries shouldbe similar to Germany, they should not be exposed to the same demand shocks as Germanynor should their trade flows with China and Eastern Europe a�ect counties in Germany otherthan through exogenous increases in imports. This is why no Euro area country or immediateneighbouring country is included. I use trade with Australia, Canada, Japan, Norway, NewZealand, Sweden, Singapore and the UK as instruments for trade with Germany, as in Dauth,Findeisen and Suedekum (2014). This way, the exogenous part of increased Chinese andEastern European competitiveness is extracted, shutting down factors that a�ect importsand regions at the same time, such as demand shocks. Trade flows of these third grouphigh income countries with China and Eastern Europe are therefore used to instrument tradeflows of Germany with China and Eastern Europe. I run the following two-stage least squaresregressions, to instrument both import and export exposure.First stages:
∆InstImportExposureGer←C+EErt = ζ1∆ImportExposure
Other←C+EErt +
ζ2∆ExportExposureGer→C+EErt + ζ3Xi + ζ4Xr + γt∗s + vi
(5.2)
Microeconometric Analyses on Determinants of Individual Labour Market Outcomes 201

5 Trade Shocks and Vocational Occupation Choices
∆InstExportExposureGer→C+EErt = ζ1∆ImportExposure
Ger←C+EErt +
ζ2∆ExportExposureOther→C+EErt + ζ3Xi + ζ4Xr + γt∗s + vi
(5.3)
Where ∆InstImportExposureGer←C+EErt and ∆InstExportExposureGer→C+EE
rt representthe instrumented import and export exposure, respectively and∆ImportExposureOther←C+EE
rt and ∆ExportExposureOther→C+EErt denote the respective
trade flow of China and Eastern Europe to and from the third group high income countries.The second stage can be written as:
yr,ti = β1∆InstImportExposureGer←C+EErt + β2∆InstExportExposure
Ger→C+EErt +
β3Xi + β4Xr + γt∗s + εi(5.4)
For the estimation to produce the true, unbiased causal e�ect of growing up in a county withhigh exposure to import competition on the vocational occupation choice and the subsequentcareer path, other than the instruments being valid, several further identifying assumptionsneed to hold. First, it needs to hold that counties developed along similar trends in terms ofapprenticeships before import exposure. One wants to make sure, that regions more exposedto imports later were not on a di�erential trend in terms of vocational education initiallyanyway, since the e�ect of import exposure on vocational occupation would then capture otherunderlying factors that had nothing to do with import competition. Figure 5.1 plots shares ofapprentices over the whole local working population for di�erent quantiles of import exposurein 2000. As the “treatment” of import exposure is continuous, i.e., represents a treatmentintensity, counties are split into five quantiles of 20 percent along their 2000 import exposurefrom both China and Eastern Europe. In Figure 5.2 one can see, that imports from China andEastern Europe are mostly flat until 1990, therefore one would not want to see di�erencesin trends of apprenticeship numbers in counties. Unsurprisingly, there exist di�erences inlevels, since import exposure is based on the initial industry structures (explained in detailbelow in 5.3.3), meaning that counties with high initial shares of manufacturing are later moreexposed to import competition and also tend to have higher shares of apprentices amongtheir working population. However, Figures 5.1a and 5.1b show no evidence that countiessaw di�erential trends in (a) total shares of apprentices, nor in (b) manufacturing apprentices.For numbers of manufacturing apprentices, the quantiles move further apart, but there areno large di�erences in general trends.
Another assumption that needs to hold, is that there are no large adjustments via interregionalmigration due to trade shocks. In the analysis, individuals are fixed to a county and assumed tobe “treated” by their county trade shock according to the first county in which they ever appearin the social security records. For the majority of individuals, this is the year they start theirapprenticeship. These individuals are “treated” by the trade shock in their county in the year
202 Microeconometric Analyses on Determinants of Individual Labour Market Outcomes

5 Trade Shocks and Vocational Occupation Choices
they are 15 years old, i.e., their year of birth plus 15 years. Therefore, an important assumptionof the analysis is that individuals do not change counties for their apprenticeships and moreimportantly, that this does not happen di�erentially due to trade shocks. This also impliesthat there is no di�erential migration of the families due to trade shocks. First one should notethat apprenticeships are an inherently local market and mobility for apprentices in Germanyis very low (Stockinger and Zwick, 2017). Furthermore, interregional adjustments throughmigration are generally sluggish in Germany. For example, the rate of German interregionalmigration was at only at 1.2 percent in 1995 (Tatsiramos, 2009). Lastly, Dauth, Findeisen andSuedekum (2014) find no e�ects of import and export exposure on population shi�s, showingthat regional adjustment in Germany does not pose a major concern.
5.3.3 Local Labour Market Import Exposure
Import exposure, as used in Equation 5.1 is defined as follows:
∆ImportExposurert =∑j
Lrjt−10
Ljt−10
∆ImpGER←C+EEjt
Lrt−10(5.5)
where ∆ImportExposurert can be thought of as the change in per worker imports in 1000Euro in county r at time t. Lrjt−10 is employment in county r, industry j at time t− 10, Ljt−10is employment in industry j at time t − 10 nationally and Lrt−10 is employment in countyr at time t − 10. ∆ImpC+EE←GER
jt are changes in import volumes between t and t − 10 inindustry j from China and Eastern Europe.“Eastern Europe” includes Bulgaria, Czech Republic,Hungary, Poland, Romania, Slovakia, Slovenia and all countries of the former USSR5. Thetotal 10-year change in industry j’s imports from China and Eastern Europe to Germany isapportioned to county r according to county r’s share in national industry j employment. Themeasure closely follows Dauth, Findeisen and Suedekum (2014), but extends their measure byintroducing yearly varying import exposures with 10-year rolling window changes. I use theinitial industry structure at the beginning of each period (t− 10). For example, trade exposurein 2000 refers to the change in import between 1990 and 2000 using the 1990 industry structureto apportion national industry trade volumes. In the robustness checks, I define alternativeindustry baselines, such as fixing them at 1990 (1993 for Eastern Germany) for all years aswell as lagging them by 10 years. The results are robust to using either. Export exposure perworker is defined along the same lines, using export volumes from Germany to China andEastern Europe.
Figure 5.3 shows import exposure for each region in 1990, 2000, 2003 and 2014 from importexposure from both China and Eastern Europe. With the availability of regional industrydata, 2003 (2004 for instruments) import exposure for formerly German Democratic Republic
5 Russia, Belarus, Estonia, Latvia, Lithuania, Moldova, Ukraine, Azerbaijan, Georgia, Kazakhstan, Kyrgyzstan,Tajikistan, Turkmenistan, Uzbekistan.
Microeconometric Analyses on Determinants of Individual Labour Market Outcomes 203

5 Trade Shocks and Vocational Occupation Choices
(GDR) counties is the earliest year possible. I analyse Eastern European and Chinese importshocks jointly in most analyses6. The maps show that there is considerable variation in importexposure both across regions and time. Average import exposure per worker increases from840 Euro 1990 (i.e., the increase between 1980 and 1990), to 5814 Euro in 2000 and 7082 Euroin 2007, where it peaks and then slowly ebbs down (which is natural, seeing as these arechanges, the level is steadily increasing as we saw in Figure 5.3.) The 10-year rolling windowchanges used in this chapter exploit the fact that trade volumes have increased steadily andsmoothly since the 1990s, while the other papers in the literature usually only look at one ortwo di�erent time intervals.
The instrumental variable of third group high income country import exposure used in Equa-tion 5.2 is constructed in the same manner as import exposure in 5.5:
∆InstImportExposurert =∑j
Lrjt−11
Ljt−11
∆Imp∑
Other←C+EEjt−11
Lrt−11(5.6)
where now ∆Imp∑
Other←C+EEjt−11 are imports from China and Eastern Europe to other high in-
come countries. For the instrument import and export exposure lagged industry employmentshares are used, at t− 11 (for change in trade between t and t− 10) to limit potential reversecausality in terms of employment due to anticipation in future trade exposure. Again, exportexposure is defined analogously.
5.3.4 Occupational Specificity Measure
To establish whether an occupation is general or specific, I construct a skill-specificity measurebased on various elements from Eggenberger, Rinawi and Backes-Gellner (2018); Gathmannand Schönberg (2010); Geel, Mure and Backes-Gellner (2011). The measure leans on Lazear(2009)’s skill-weights approach, which assumes that occupations use di�erent skills with di�er-ent weights attached (skill bundles) that makes them more or less general. Using informationfrom a German employment survey on required skills and tasks performed in the individuals’occupation, I construct a specificity measure for each occupation, by comparing skill-weightsin every occupation with skill-weights for the labour market on average. Table A5.1 reportsthe tasks and skills covered in the survey. Both tasks and skills are combined, in order to usemore available information and because skills and tasks are highly complementary.7 The
6 For the main regression I do also analyse Eastern European and Chinese import shocks separately7 Despite Acemoglu and Autor (2011)’s distinction between tasks and skills in that a skill is a unit of workactivity that produces output, while a skill is a workers endowment of capabilities, in this chapter I treat them asinterchangeable. You cannot perform a task without having the skill and stating that one requires a skill for thedaily job, implies that one performs the task attached to the skill. The way in which the survey is asked, the taskrequirements and skills hardly overlap, as one focuses more on operational tasks and the other on conceptionalskills. Using both provides broader information about each occupation.
204 Microeconometric Analyses on Determinants of Individual Labour Market Outcomes

5 Trade Shocks and Vocational Occupation Choices
occupational specificity measure is a skill-distance measure in that a higher skill distanceimplies a lower overlap in the skill bundle from one occupation to the general labour marketskill bundle. In a first step, the 31 tasks and skills are aggregated at the occupation level, whichprovides the skill-weights for each occupation. These are normalized to sum to one dividing bytheir sum, in order to take out skill-level e�ects. Then, tasks and skills are aggregated for thelabour market on average, using the survey weights to ensure skills weights are aggregated tobe representative of the labour market. I then construct an angular distance measure, similarto Gathmann and Schönberg (2010); Eggenberger, Rinawi and Backes-Gellner (2018):
SpecDistjl = 1 −∑n
i=1 xji ∗ xli√∑ni=1 x
2ji ∗
∑ni=1 x
2li
where i is a skill, x is the skill weight of skill i in occupation j and l denotes the general labourmarket. To obtain skill distance rather than similarity of skill bundles, the angular distanceis reversed by subtracting it from one. The larger the skill distance, the more specific andspecialized an occupation is and therefore the lower the transferability of skills to anotheroccupation. While highly specialized occupations may come with a wage premium, theyare also riskier, because if an individual becomes unemployed who was in a highly specificoccupation, he or she will find it more di�icult to find a new occupation to which the specificskill bundle can be applied.
Figure 5.4 ranks the four main outcome occupation groups by their skill specificity. Manufac-turing occupations are the most specific, followed by cra�smen. Service occupations andmerchants are less specific, meaning that the skills in those occupations are closer to those ofthe labour market on average.
5.3.5 Data Sources
Various high quality data sources are required to implement this empirical analysis, includ-ing individual administrative data, administrative firm data, data on trade flows, as well asinformation on skills and tasks within occupations, among other data sources.
Individual Social Security Data The main data on individual vocational occupations andcareer paths stem from the German Social Security system. The Sample of Integrated LabourMarket Biographies (SIAB)8 is a representative two-percent random sample drawn from thepopulation of individuals subject to social security (i.e., employed, o�icially job seekingetc.; it excludes self-employed and civil servants) in Germany, assembled by the Institute for
8 This study uses the weakly anonymous Sample of Integrated Labour Market Biographies (Years 1975-2014).Data access was provided via on-site use at the Research Data Centre (FDZ) of the German Federal EmploymentAgency (BA) at the Institute for Employment Research (IAB) and subsequently remote data access.
Microeconometric Analyses on Determinants of Individual Labour Market Outcomes 205

5 Trade Shocks and Vocational Occupation Choices
Employment Research (IAB) (Antoni, Ganzer and vom Berge, 2016). The data provide detailedadministrative information, on individuals’ occupations, employment status, earnings andimportantly on where a person works and lives on the county level. Since the apprenticeshipin the vocational education system is subject to social security, I observe individuals in thiseducational track at the start of their labour market career. I assume that the county I firstobserve them in, is the county the individuals grew up in, since apprenticeship markets arehighly localized and individuals rarely leave their parental home for their apprenticeship. Eachindividual is kept only once, in order to observe the type occupation the individual first entersfor his or her apprenticeship. Further life labour market outcomes are reported as cumulations.Individuals are included when they are aged 15 between 1990 and 2014 in western counties,and between 2003 and 2014 for eastern counties. This is because ten years earlier are theearliest years for which I can observe initial industry structures in the counties to construct thetrade shocks. The person is “treated” at the county where she is first observed in the data forthe year she is 15 years old. I choose age 15, because it is the year before individuals usuallyenter vocational education when they finish the middle track school. Here, the person hasobserved changed imports over 10 years since the age of 5, and has been “treated” by theimport shock in the sense that she has been exposed to the structural change and decliningemployment in manufacturing in her home county. She has witnessed increased levels ofstructural unemployment in her local labour market, perhaps even of her parents or friends(note that unfortunately, I have no information on family ties in the data).
Administrative Firm Data To calculate yearly county-level per worker trade shocks by ap-portioning the national industry trade shock to the local employment share of that industry,detailed county-level data on employment in each industry is required. I use the Establish-ment History Panel (BHP) (Schmucker et al., 2016)9, which is a 50 percent sample of all firmsin Germany, providing yearly information on the number of employees, industry classificationand county of operation. I use the years 1980-2014 for Western Germany and 1993-2014 forEastern Germany.10
Trade Volumes I use trade volumes from the United Nations’ Comtrade database, whichprovides extensive information on bilateral trade volumes, following Autor, Dorn and Hanson(2013) and Dauth, Findeisen and Suedekum (2014). Trade volumes between Germany andChina, Germany and Eastern Europe, as well as between China and Eastern Europe and theeight high income countries for the instrument are being used. Product-level (SITC Rev.3)Comtrade trade volumes are mapped into 3-digit German Industry Classifications, version
9 This study uses the weakly anonymous Establishment History Panel (Years 1975 2014). Data access wasprovided via on site use at the Research Data Centre (FDZ) of the German Federal Employment Agency (BA) atthe Institute for Employment Research (IAB) and remote data access.10 1993 is the first year for which data for Eastern Germany was reliably recorded post reunification.
206 Microeconometric Analyses on Determinants of Individual Labour Market Outcomes

5 Trade Shocks and Vocational Occupation Choices
93 (Federal Statistical O�ice, 2003) using a crosswalk11. I identify 93 manufacturing sectors,dropping industries related to fuel, oil and gas. Trade volumes are converted into 2010 EuroThis data is then aggregated to yearly (1980-2014) import and export volumes for each manu-facturing industry. It is then merged to the administrative firm data, for the trade shock to beapportioned by regional industry employment shares.
Data on Computer Use, Skills and Tasks To classify the extent of computer use withinoccupation, I use four waves of a survey lead by the Federal Institute for Vocational Educationand Training (BIBB) on individuals’ employment careers and occupation (the BIBB/IAB Qualifi-cation and Occupational Career Surveys 1992 and 1999 and BIBB/BAuA Employment Survey2006, 2012). I aggregate the question on whether working with a computer is a daily taskon the job on the level of 3-digit Occupation Classification 1993, and merge the occupationaverages to the occupations in the SIAB social security data. For the skill specificity measure,I further use the BIBB/IAB Qualification and Occupational Career Survey 1999 wave, whichprovides extensive details on the tasks and skills required in an individual’s occupation. I usethe 1999 survey wave because it inquires on a larger set of skills and tasks compared to otherwaves, and because it represents a central year of when occupational decisions are taken inmy sample. Unfortunately, the survey waves are rather inconsistent in the tasks and skillsinquired over time, which makes comparing occupational specificity di�icult across years.
Miscellaneous Data Sources Further, numbers of students and graduates stem from theRegional Statistical Data Catalogue of the Federal Statistical O�ice and the statistical o�icesof the Länder. Lastly, information on regional supply and demand ratios stem from theFederal Institute for Vocational Education and Training. This data is collected at the job centrelevel, a labour market region which is comprised of 2 to 4 counties. The data is available onoccupational level only between 2004 to 2011. Total supply-demand apprenticeship ratiosare available from 1998 to 2011. I also use data from the German Socio-Economic Panel tolook at the impact of parental occupations12.
5.3.6 Descriptive Overview
Figure 5.2 plots total import volumes from China and Eastern Europe over time, showing large,but fairly smooth increases over the past two decades. It illustrates why having yearly 10-yearrolling window changes in import exposure as treatment provides added value compared tousing only one or two non-overlapping 10-year increases. Table 5.1 reports summary statisticsfor all variables; import and export exposures, individual and regional characteristics as wellas all outcomes. Average import exposure over the entire time span is 4180 Euro 46 percentof the sample is female and 92 percent are German citizens. Table ?? shows that the states11 The crosswalk was kindly provided by Wolfgang Dauth12 Socio-Economic Panel (SOEP), data for years 1984-2013, version 30, SOEP, 2013, doi:10.5684/soep.v30.
Microeconometric Analyses on Determinants of Individual Labour Market Outcomes 207

5 Trade Shocks and Vocational Occupation Choices
in which I observe the individuals at age 15 are distributed as one would expect in terms ofgeneral populations and given the fact that Eastern German states are only included as of 2003.The years in which individuals are “treated” by import exposure at the age of 15 range from1991 to 2013, with again quite an even distribution and the early 2000s being represented themost.
Outcomes The chapter looks at a number of di�erent outcomes, to describe which kind ofvocational training occupations individuals exposed to import competition enter, and whattheir labour market outcomes are. The outcomes can be classified into three categories: (1)occupational groups, describing the type of occupation, (2) occupational task characteristics,describing what tasks the job entails, and (3) labour market outcomes, describing how indi-viduals do during and a�er their vocational education. The occupational groups are dummyvariables for whether an occupation is in manufacturing, represents a cra� occupation, isin services, or is a merchant occupation.13 Import-intensive manufacturing industries areidentified as a manufacturing industry exposed to imports above the median. 35.5 percent ofindividuals in the sample are in manufacturing, 24.6 percent in cra� occupations, 57.1 percentin service occupations, and 18.2 percent in merchant occupations. These occupations canbe ordered according to their occupational specificity, as shown in Figure 5.4. The specificitymeasure ranges between 0 and 1, with one being highly specific, meaning that there is nooverlap in the skill bundles of that occupation and the general labour market, and 0 meaningthe occupation is very general, with perfect overlapping skill bundles. Average skill specificityin the sample is 0.118; manufacturing has a skill specificity of 0.20, cra� occupation of 0.165,service of 0.136 and cra� occupations of 0.129. Manufacturing and cra� occupations beingthe more skill-specific, provide less potential for switching occupations, because the skillsin these occupations are not as transferable. Therefore, they provide less sheltering fromthe forces of structural change, such as trade and automation. Note that these occupationalgroups do not sum to 1, as they are not mutually exclusive. While manufacturing and servicesare mutually exclusive, cra�s and merchant occupations are subsets of both these groups.12.8 percent of individuals work in import manufacturing industries.
Considering what is known about increasing skill requirements and task-complexity withinoccupations (Spitz-Oener, 2006), I further look at what the chosen occupations entail interms of tasks. First, the extent of computer use in an occupation from the survey of the
13 Manufacturing and Service occupations are identified based on occupational grouping of the German Clas-sification of Occupations 1988 (Federal Employment Agency, 1998). Cra�s occupations are identified basedon the German Trade and Cra�s Code, using the same procedure as in Lergetporer, Ruhose and Simon (2018).Merchant occupations are identified using the o�icial classification of vocational training occupations of theFederal Institute for Vocational Education and Training.
208 Microeconometric Analyses on Determinants of Individual Labour Market Outcomes

5 Trade Shocks and Vocational Occupation Choices
Federal Institute for Vocational Education and Training is used14. This measure changes withinoccupations over time. 42 percent of occupations have frequent computer use. Further, I useBlossfeld (1987) to classify whether an occupation is “manual” (24 percent on average), “easymanual’ (3 percent on average) or “qualified manual” (21 percent on average).
Finally, the following labour market outcomes are considered: the individuals’ earnings duringthe apprenticeship (24 Euro gross daily earnings on average), what earnings are one, five andten years a�er finishing the apprenticeship (24.58, 50.83, 70.62 Euro gross daily earnings onaverage, respectively) as well as the earnings growth rates over five (127 percent) and ten years(162 percent). Moreover, I also look at the age at which an individual starts the apprenticeship(19 on average), whether the person is employed the first year a�er the apprenticeship (63percent), whether the person starts working in a di�erent county a�er the apprenticeship (29percent), how many occupational switches the person performs in their career (2.6 times onaverage), how many years the person is unemployed (0.77) and how many times she movescounties (1.25 times on average).
5.4 Impacts of Import Exposure on Vocational OccupationChoice and Labour Market Outcomes
This section presents and discusses results from the main regression on the three groups ofoutcomes: (1) occupational type, (2) occupational tasks and (3) labour market outcomes. Itthen checks for threats to identification in terms of endogenous sample selection and labourdemand. Further, results from robustness checks and heterogeneous e�ects across genderare reported.
5.4.1 Skill-Specific Versus General Skills Occupation Type
Table 5.2 reports the e�ects of local labour market import exposure on the choice of voca-tional occupation type. All regressions control for export exposure and include individual andregional controls as well as state by year fixed e�ects, meaning that the e�ects are identifiedwithin year and state. Panel A reports OLS results, panel B reports 2SLS IV results for the sameoutcomes. The coe�icients can be interpreted as the e�ect of a 1000 Euro increase in perworker import exposure on the likelihood of the outcomes in question. Column 1 shows thathigher import exposure increases the likelihood of an individual to enter a manufacturing VEToccupation. OLS gives a coe�icient of 0.14 percent increase per 1000 Euro per worker increase
14 The computer use on the job variable is taken from the occupation averages of four waves of the BIBB/IABQualification and Occupational Career Survey (1992, 1999) and BIBB/BAuA Employment Survey (2006, 2012). Theaverages for the survey year are used for occupations in the SIAB data for five years surrounding the survey year,such that the averages from 1992 are applied to occupations in the years 1990-1995, from 1999 to 1996-2001,from 2006 to 2003-2008 and from 2012 to 2009-2014. The results are not sensitive to changing around how theseyears are attributed.
Microeconometric Analyses on Determinants of Individual Labour Market Outcomes 209

5 Trade Shocks and Vocational Occupation Choices
in import exposure and the 2SLS IV coe�icient gives a larger coe�icient of 0.23 percent likeli-hood increase. Column 2 reports the coe�icients on the likelihood of an individual enteringa cra�smen VET occupation. The coe�icients are positive, and the 2SLS coe�icient impliesa 0.19 percent increase in the likelihood of entering a cra� occupation for a 1000 Euro perworker increase in import exposure. Columns 3 and 4 report the e�ects on entering a serviceand merchant occupation. Contrary to the previous columns, these coe�icients are negative,implying a reduction in the likelihood of entering a service or merchant occupation. Column 5finally shows e�ect of import exposure on entering an import manufacturing industry, i.e.,one of the industries that cause the trade shock. Perhaps unsurprisingly but disappointingly,adolescents enter more import-intensive industries that are prevalent in their labour market.This implies that they expose themselves to even more import competition in the future, andmay be subject to uncertain employment prospects.
Since outcomes in Columns 1-4 of Table 5.2 are ordered from le� to right by their occupa-tional skill specificity, it becomes quickly evident that the e�ect of import exposure inducesindividuals to enter more specific occupation groups (manufacturing and cra�s) and less themore general occupation groups (service and merchant). Additionally, individuals chooseto work more in the manufacturing industries, that will expose them even more to importcompetition and therefore risk of future unemployment. The results imply that despite importcompetition and resulting local structural unemployment as shown in Dauth, Findeisen andSuedekum (2014), (1) individuals go more into occupations that are threatened by importcompetition and (2) into occupations that do not provide easily transferable skill bundles tofacilitate occupational mobility in case of future unemployment. I control for manufacturingemployment per county, which means that the e�ects are not purely reflecting the fact thatindividuals enter whatever industry structure is prevalent in their county. With these voca-tional education occupations, individuals expose themselves even more to imports in thefuture instead of sheltering themselves from it, which may have detrimental e�ects on theirlater labour market outcomes.
In terms of the magnitude of the e�ects, the average import exposure per worker is 4180 Euro,which means the marginal e�ect given by the coe�icients should be multiplied by 4.18 to getthe average e�ect. In the case of manufacturing, the likelihood was increased on averageby (4.18*0.23 percent ≈) 1 percent. The di�erence between counties at the 75th and 25thpercentile of import exposure is 3591 Euro (Table A5.2 reports mean import exposures acrossdi�erent years and quantiles) in 2000, giving a di�erence in e�ects of 0.86 percentage points.Comparing the size of 2SLS IV and OLS coe�icients, OLS coe�icients tend to be consistentlysmaller (in absolute terms) than 2SLS coe�icients, pointing to the fact that there is a positivecorrelation between import demand shocks and labour demand, which means that OLSunderestimates the true e�ects.
In Appendix Table A5.3, I present results for considering import exposure from China andEastern Europe separately. The results show that the overall, i.e., combined e�ects of importexposure from China and Eastern Europe in the main e�ects are predominantly driven by
210 Microeconometric Analyses on Determinants of Individual Labour Market Outcomes

5 Trade Shocks and Vocational Occupation Choices
China, not Eastern Europe. This might be explained by the fact that for Eastern Europe, importand export exposure are highly correlated with a correlation coe�icient of 0.77. This suggeststhat there is much inter-industry trade and that therefore more employment opportunitiesmay have been retained for industries exposed to Eastern European imports, and thereforedo not pose much of a shock. On the other hand, Chinese import and export only have acorrelation coe�icient of 0.19, meaning that Germany does not export to China in the sameindustries as China exports to Germany. This can imply that only the import shock from Chinaactually impacted individual’s vocational education and labour market outcomes. Contraryto my results, Dauth, Findeisen and Suedekum (2014) find that trade with Eastern Europecaused much stronger industry employment displacement e�ects than trade with China, dueto the fact that trade with Eastern Europe increased earlier, as well as in other industries inwhich German counties had more initial specialization
5.4.2 Occupation Tasks: Computer Use and Manual Labour
The previous section establishes that individuals enter more skill-specific occupations andmore import exposed manufacturing industries. To further understand what that means interms of the skills and tasks required within the occupations an individual choose, Table 5.3reports results for computer use within occupations and whether the occupations is a manual,easy manual or qualified manual occupation. The table reports IV results. Column 1 reportsthe probability of entering an occupation with above median computer. Increased importcompetition reduces the probability of an individual entering an occupation with computeruse and the size of the coe�icient (0.2 percent) is similar to that of entering manufacturing.Computer use is of such central importance in technological progress and at the heart ofthe skill-biased technological change idea (Card and DiNardo, 2002) and those able to use acomputer can learn to control machines, analyse or communicate, even as manufacturingbecomes increasingly automated. Despite the globalization forces and structural change theindividuals in this sample are exposed to, they do no enter professions that may teach themimportant IT skills such as communication, data analysis or coding. This would act as aninsurance against unemployment, in case the industry in which the individual is employed, issubject to further import competition or automation.
Column 2 shows the impact of import exposure on entering a manual occupation. Again, thecoe�icient is very much in line with the size of the coe�icient on manufacturing, which isunsurprising since manufacturing is inherently manual in nature. In Columns 3 and 4, manualwork is further split up into easy manual and qualified manual occupations. The results showthat, at least, import exposure pulls individuals more into qualified manual labour, and thereis a null e�ect for easy/unqualified occupations. This finding is reassuring, since apprenticesgo into vocational education to learn a somewhat skilled occupation. This means that whilegrowing up in import competition exposed counties pulls individuals more into manual,less computerized vocational occupations, these occupations are at least those requiringqualifications and skills, and are not just simple manual labour.
Microeconometric Analyses on Determinants of Individual Labour Market Outcomes 211

5 Trade Shocks and Vocational Occupation Choices
5.4.3 Later Labour Market Outcomes
This section discusses the e�ects of import exposure on individual labour market outcomes.The upper panel of Table 5.4 reports e�ects on (log daily gross) earnings at di�erent stages.Being exposed to 1000 Euro per worker higher import exposure in their county than else-where when 15 (for those who enter vocational education subsequently) a�ects individualsnegatively, in that they earn 0.14 percent less during their apprenticeship, not significantlyless a year a�er finishing their apprenticeship, 0.44 percent less five years a�er finishing theirapprenticeship and 1.1 percent less ten years a�er finishing their apprenticeship15. Comparingthese marginal e�ects to the average increase in import exposure of 4180 Euro, the averageloss in income 10 years post apprenticeship due to import exposure amounts to 4.6 percent,which is a substantial reduction in income. Column 6 shows that 1000 Euro import exposureleads to 5.7 percentage points lower earnings growth over 10 years, which is also quite asizeable negative e�ect. These e�ects are independent of which occupations individualschoose, the only restriction being that individuals enter vocational education. The e�ects canbe compared to the literature on adverse e�ects of growing up in a recession, or growing up ina poor neighbourhood Oreopoulos, von Wachter and Heisz (2012) find that graduating fromcollege in a recession causes earnings losses for individuals for over ten years. An unemploy-ment rate of 5 percent implies an earnings loss of 9 percent initially, which slowly fades awayover a ten year period. Here by contrast we see that being exposed to import competitionand corresponding structural unemployment, causes losses in lifetime earnings that becomelarger over time.
The bottom panel of Table 5.4 shows the e�ects of import exposure on some additionallabour market outcomes, which may provide potential channels explaining these adverseincome e�ects. The results show, that individuals in more import exposed counties enterapprenticeships at an earlier age. This may be because individuals leave school earlier andenter VET with a lower degree. I find no evidence for this in Section 5.4.4 however, where Icheck for di�erential selection into education tracks. Another explanation is that individualsfind apprenticeship places faster or do not take time o�, but rather that their path ahead isclear and does not deviate from what is and has been prevalent in the local labour market.
Column 8 of Table 5.4 indicates that import exposure makes individuals more likely to beemployed the year immediately a�er finishing their apprenticeship. This result is in line withthe finding from Hanushek et al. (2017a), who show that “skill-specific” education helps withthe transition from schooling to the labour market. The result here suggests that this alsoseems to hold for general versus skill-specific occupations within vocational education. Thereis no significant e�ect on the number of years of unemployment, which shows that althoughindividuals take wage cuts, they are not more likely to be unemployed. Lastly, the results showthat individuals are less mobile in terms of regional (inter-county) mobility, but instead more
15 Duration of apprenticeships is not di�erentially a�ected, so these e�ects do not stem from di�erential firmtenure post apprenticeship
212 Microeconometric Analyses on Determinants of Individual Labour Market Outcomes

5 Trade Shocks and Vocational Occupation Choices
mobile in terms of occupational mobility. These results are in line with Dauth, Findeisen andSuedekum (2014) who show that there are no adjustments through interregional migrationdue to trade shocks.
Note that the above results just show the e�ect of import exposure on labour market outcomes,but ideally one would be interested in how the choice of VET occupation a�ects labour marketoutcomes, in particular, whether individuals are sheltered from trade and automation. In otherwords, does the hypothesis that individuals in service and merchant occupations are moresheltered and therefore experience less adverse earnings outcomes due to import exposure?It would be very di�icult to provide causal evidence on the e�ect of vocational occupationchoice on labour market outcomes, because occupation choice is an endogenous variablethat is correlated with unobserved individual characteristics such as talent or motivation. Aregression linking vocational occupation choice and labour market outcomes would su�erfrom selection bias, because a highly motivated individual, may take the rational occupationchoice and have a high income, but that same individual may have fared just as well in anyother occupation and the seeming positive relationship would be due to the unobservedfactor motivation.
Nevertheless, Table 5.5 presents suggestive evidence showing the e�ects of import exposureand import exposure interacted with the vocational education occupation choice on 10-yearearnings growth. Column 1 shows the results when import exposure is interacted with whetheran individual chooses a manufacturing occupation. The level e�ect of import exposure isinsignificant, while the interaction term shows a decline of 8 percentage points on 10-yearearnings growth for 1000 Euro import exposure if an individual pursued VET in a manufacturingoccupation. This implies that the adverse e�ect of import exposure is entirely driven byindividuals in manufacturing occupations and is zero for all other occupations.
In Column 2, both the level e�ect as well as the interaction term of import exposure with cra�occupations is negative. Contrary to this, in Columns 3 and 4 the interaction terms for serviceand merchant occupations respectively are positive and of similar magnitude as the levele�ect of import exposure, implying that the adverse e�ect on ten year earnings growth cancelsout. The results although not causal, suggest that indeed more general occupations in servicesand as merchants have a sheltering e�ect from the negative e�ects of import exposure duringadolescence.
An obvious channel as to why individuals still enter these occupations that a�ect them ad-versely would be their parents. Table A5.4 shows evidence from the German Socio-EconomicPanel, which allows to link family ties and also asks about youth’s occupational aspirations.Results in Panel A columns 1 and 2 show that the general results for occupation choices holdalso in this data (though the e�ects are not significant due to small sample sizes). Aspirationsof young individuals however, are a�ected in the opposite directions, and as one would haveexpected in the first place, namely choosing less manufacturing and more service occupationswhen exposed to import competition. Therefore, there seems to be a mismatch between aspi-
Microeconometric Analyses on Determinants of Individual Labour Market Outcomes 213

5 Trade Shocks and Vocational Occupation Choices
rations and actual choices. Panel B shows the impact of parental occupations on vocationaloccupation choices. Columns 1 and 2 show that while parental occupation is an importantdriver in adolescents’ occupation choices meaning that individuals enter the same occupationas their parents, columns 3 and 4 show that having a father that worked in manufacturing andgrowing up in regions exposed to import competition, actually decreases the probability ofindividuals to enter a skill-specific manufacturing job. This suggests that potential first-handnegative experiences of job or income loss due to import competition within a family, maywork to dissuade individuals from taking up skill-specific occupations.
5.4.4 Not an Endogenous Sub-sample
This chapter focuses on young individuals who self-select into apprenticeships, rather thangoing to university. Since this is a non-random subgroup of individuals, there must not be anydi�erential and therefore endogenous selection into this subgroup because of trade exposure;as this would introduce a bias into the estimations. Table 5.6 Column 1 shows the e�ect ofimports at time t on transitions from elementary school to higher school tracks at t− 5. Sincethe “treatment” of import exposure concerns 15 year-olds, these same individuals should nothave selected into academic track or middle track school di�erentially at the age of 10. As thecoe�icients show, there is no evidence of this. Columns 2 and 3 show the e�ects of importexposure at time t on 7th graders in academic and middle track schools at t− 3 and also showno e�ect. Column 4 presents the e�ect on graduates from the middle track at time t, againshowing no e�ect. Most importantly, there is also no e�ect on total numbers of apprenticesat t+1 from trade. This robustness check shows, that there was no di�erential selection intodi�erent education levels due to the trade shock. With no educational upgrading, it is clearthat keeping the level of education fixed at the vocational level and investigating individualvocational education occupation choices, is the relevant research question and thereforerelevant level of analysis.
5.4.5 Choice or No Choice?
So far, it is unclear whether the occupational paths on which young individuals embark canbe called “choices”, or whether they are entirely driven by labour demand. Since “choosing”an apprentice occupation di�ers importantly from choosing a university major in the sensethat it strongly depends on local availability of a firm o�ering an apprentice positions in suchan occupation, this is a major concern. Unavoidably a certain portion of the type of vocationaloccupation individuals enter, is due to their local industry structure. Nevertheless, any countywill also have service and merchant related apprenticeship positions on o�er, for exampleas accountants, tax consultants or procurement specialists. One wants to know whetherlimitations in apprenticeship choice are systematically related to trade shocks: if the samefirms, which are hit by import competition now also o�er less apprentice positions, or employmore apprentices as a way of having cheaper labour, any of the findings may be purely drivenby the labour demand side and have nothing to do with individual choices. Knowing which is
214 Microeconometric Analyses on Determinants of Individual Labour Market Outcomes

5 Trade Shocks and Vocational Occupation Choices
the driver makes an important di�erence for policy implications, i.e., whether an informationintervention in schools, or a policy aimed at the firm side would be e�ective in teaching moretransferable skills to young adults.
The results speak against the fact that individuals have no real choice in their apprenticeshipand have to take what is available on the local labour market, because the e�ects showthat young adults still go into manufacturing and import manufacturing despite the firmsbeing exposed to import competition and may see higher unemployment and firm closures.Moreover, it has been found that firms, at least in the short run, do not adjust the number ofapprentice places according to the business cycle (Luethi and Wolter, 2018), which speaksfor the fact that numbers of apprenticeship positions should be fairly stable. To furtherinvestigate this issue, I look at local supply-demand relations of apprenticeship positions.These statistics provide information, on exactly how many apprentice places were o�ered,how many new contracts were signed, how many candidates looked for an apprenticeshipand how many were le� without a spot. These data are available at the level of labour marketregions of job centres, which are constituted of two to four counties. While there are 402counties, there are 176 job centre labour market regions, which are sometimes referred toas German commuting zones. These data are available for all occupations aggregated from1998 to 2011, while between 2004 and 2011 they are also available on the occupation level.Table 5.7 shows results for the e�ect of import exposure (aggregated up to the labour marketregions), on outcomes concerned with supply-demand-ratios of apprenticeship positions forall occupations together. The supply-demand ratio in Column 1, is calculated by adding up allapprenticeship positions o�ered (new apprenticeship contracts (i.e., matches) plus unfilledpositions) and dividing them by all apprenticeship positions searched (new apprenticeshipcontracts plus unsuccessful candidates). A supply-demand ratio of 1 means that there isperfect clearing on the apprenticeship market; a number larger than one indicates excesssupply, a number less than one indicates excess demand of apprenticeship positions. Column2 looks at the numbers of unfilled apprentice positions, Column 3 at the number of successfullysigned new contracts and Column 4 at the number of unsuccessful apprenticeship candidatesin the given year. There are no significant e�ects of import exposure on any of these measures.These null-e�ects are robust to trying di�erent timings of the import shock, i.e., taking thelagged import shock, for example.
In Table 5.8, unsuccessful candidates by di�erent occupational groups are analysed ForColumns 1 and 2, vocational education occupations are split among manual or o�ice-based.For Columns 3, 4 and 5, I use the available information of which “chamber” the vocationaleducation is administered by (Chamber of Cra�s and Trade; Chamber of Industry and Com-merce or Public Services). There are no e�ects on the number of unsuccessful candidatesfor the occupational categories of manual, o�ice, cra�smen nor for industry and commerce.This shows, that there is no acute shortage of o�ice jobs even in import-exposed regions. Thismeans that there is no evidence that young individuals searching for apprenticeship placeswho really wanted to get an o�ice job were forced to take a manufacturing apprenticeship.
Microeconometric Analyses on Determinants of Individual Labour Market Outcomes 215

5 Trade Shocks and Vocational Occupation Choices
The only coe�icient which is significant is public service, meaning that there is an oversupplyof candidates for public service apprenticeships compared to the amount of places o�ered.While this shows that there is increased interest in public service, or perhaps just a shortageof apprenticeship position where import exposures are stronger, it is unlikely that this e�ecton unsuccessful public service apprenticeship places drives our main results, since the shareof apprenticeships in public service is below 4 percent (BIBB, 2016). This analysis providesevidence that local apprenticeship markets cleared well even in import exposed regions andthat the results are indeed likely to be driven by individual choices, rather than only by labourdemand.
5.4.6 Robustness Check: Alternative Measures of Import Shocks
To make sure that the results are not solely produced by the definition of import exposure Ichoose, Table 5.9, presents results of alternative definitions of import shocks. Coe�icientsare shown for a selection of outcomes: manufacturing occupation, cra�s occupation, importindustry, computer use and 10-year earnings growth.16
Each cell in Table 5.9 refers to a separate regression. There are four di�erent import exposuredefinitions, “baseline” being the same as in the main analysis, namely the 10-year rollingwindow changes between t and t− 10, with t− 10 as base year for the industry employmentstructures. “Cumulative” refers to 10-year rolling window cumulated import volumes appor-tioned by initial (t− 10) regional industry structures. “Current year” refers to the current yeartotal import exposure apportioned by initial regional industry structures at t − 10. “Fixedbaseline” refers to 10-year changes, like in baseline, but with fixed initial industry structure at1980 for the Western Germany and with 1993 for Eastern Germany. The alternative measuresof import exposure produce very similar results to the baseline, meaning that the resultsdo not hinge on just the 10-year year rolling window changes and t− 10 industry structurethat are used in the main analysis. Using cumulative import shocks, i.e., adding up all theimport volumes over ten years naturally produces a smaller coe�icient per 1000 Euro perworker, because the shock is numerically a lot larger (by a factor a little less than tenfold). Thecurrent-year import exposure gives very similar e�ects as the baseline in both significanceand magnitude, indicating that the baseline results are driven by the large increases in tradevolumes in later years, not by the starting levels, which where close to zero in all regions. Fixingthe baseline at 1990 or 1993 also gives very similar results though with a little smaller e�ectsizes. Not allowing the initial industry structure to vary at all over 20 years gives probablycleaner in terms of endogenous adaptation of counties but also less realistic representationsof the real trade shock. However, the results are still very similar that this does not give reasonfor concern.
16 The table shows only a selection of outcomes, the alternative measures work similarly well for all outcomes.The results are available upon request.
216 Microeconometric Analyses on Determinants of Individual Labour Market Outcomes

5 Trade Shocks and Vocational Occupation Choices
In a another robustness check, I investigate whether “shocking” individuals with trade shocksat di�erent ages changes the the results. The e�ects same identical to the estimates ofassignment the trade shock at the age of 15, or at 13 or 14 and 16 and 17.17 Since the trade“shock” constitutes a ten year change in import exposure and individuals are exposed beforeand a�er the same, it is not surprising that the results are the same. I choose to assign thetreatment at the age of 15, because it is usually a year or two before an adolescent in middleschool tracks choose their apprenticeship occupation.
5.4.7 Heterogeneities Across Gender
Males and females make inherently di�erent labour market decisions, in particular in themiddle-skill section of vocational education, where more than in high-skilled jobs, occupationsare strongly fragmented by gender. Whether women react di�erently than men to growing upin an import exposed county, is therefore an interesting question. I therefore estimate thefollowing regression equation:
yr,ti = β1∆ImportExposureGer←C+EErt + β2∆ExportExposure
Ger→C+EErt +
β3femalei + β4∆ImportExposureGer←C+EErt xfemalei+
β5Xi + β6Xr + γt∗s + εi.
(5.7)
If the individual is female, β1 + β4 is the e�ect of import exposure and only β1 if the individualis male. Table 5.10 reports selected results from heterogeneity analyses of interacting 10-year changes in import exposure with the individual being female.18 The top panels showsheterogeneous e�ects for occupation type and tasks. There is no di�erential e�ect of importexposure for women on entering manufacturing, cra�s or service occupations. While there areof course large level di�erences of men and women as can be seen from the female coe�icient,exposure to import competition does not induce a di�erent behaviour from men for thoseoccupation categories. However, females exposed to import competition enter merchantoccupations more and also occupations with more computer use. Females also chooserelatively less manual but more qualified manual occupations when exposed to imports.These results suggest that females shelter themselves more from import exposure, becausethey do chose slightly more general occupations with more computer use and less manuallabour. However, this is not reflected in the labour market outcomes of females. The lowerpanel of Table 5.10 shows heterogeneous e�ects of labour market outcomes. Import exposurea�ects females more adversely than men. In terms of earnings, females are worse o� duringthe apprenticeship, one year a�er and ten years a�er finishing the apprenticeship. Theyare also less likely to be unemployed the year a�er finishing their apprenticeship and are
17 Results available upon request.18 The variables were demeaned before building their interactions.
Microeconometric Analyses on Determinants of Individual Labour Market Outcomes 217

5 Trade Shocks and Vocational Occupation Choices
unemployed for more years throughout their careers. They are however, more mobile in termsof both occupational as well as regional mobility.
The results suggest that females are more adversely a�ected by import competition thanmen in terms of labour market outcomes, a finding that is also found in the graduating in arecession literature (e.g. Hershbein, 2009) and an important aspect for policy implications.
5.5 Concluding Remarks
In this chapter, I investigate the impact of growing up in a German region exposed to importcompetition from China and Eastern Europe. Looking at the choice of vocational occupationas the relevant point of labour market entry and to keep the educational level constant,the chapter provides causal evidence on the e�ect of local import shocks on (1) the type ofvocational occupation, (2) the task content of the occupation, and (3) the e�ect on further lifelabour market outcomes. The chapter uses individual-level longitudinal social security dataand other high quality data sources such as administrative firm data, bilateral trade data anddata on apprenticeship position for this empirical investigation.
The results show that import competition perpetuates vocational occupation choices ofindividuals, rather than leading to adjustments into more general and service oriented oc-cupations. First, I find that greater exposure to import competition pulls individuals moreinto manufacturing occupations, more into cra�smen occupations and import industries inparticular, and less into service and commerce occupations. The results imply that individualsdo not adjust away from the predominant industry structure of the county they grew up in, andtherefore do not protect themselves from future further forces of globalization through moreimport competition. Secondly, I find that the task content of occupations individuals choose,does not teach them general and transferable skills. I find that increased import exposuremakes adolescents less likely to enter occupations with high computer use, and more likelyto enter manual occupations. Lastly, I find that individuals exposed to import competitionin their adolescence who enter vocational education, are adversely a�ected on the labourmarket in later life. They earn less 5 and 10 years a�er their apprenticeships if finished and alsosee less earnings growth. They are more mobile in terms of occupational mobility, but lessmobile regionally. While not causal, I demonstrate that these adverse labour market outcomesare at least partly related to choices of vocational occupation types. Analysing occupationalchoices within vocational education is the right level of analysis for Germany, as there is nodi�erential selection into di�erent schooling tracks (academic versus non-academic track) inresponse to import shocks. Furthermore, looking at supply-demand ratios of apprenticeshippositions, I show that the results are not purely labour market demand driven. The results arealso robust to various import definitions.
I find that the e�ects are very heterogeneous across genders. Women, as opposed to men aremore likely to enter service oriented and merchant based occupations when exposed to local
218 Microeconometric Analyses on Determinants of Individual Labour Market Outcomes

5 Trade Shocks and Vocational Occupation Choices
import competition during adolescents. They also choose occupations more computer use.However, women are nevertheless still adversely a�ected by import competition in terms oflater labour market outcomes.
This chapter has contributed to the existing literature in several ways. It is the first study to lookat the e�ect of local import exposure on individuals who grew up in exposed regions. It usesyearly variation in import exposure in addition to regional variation. It is also the first studyto bring together the impact of trade shocks and occupation choice at labour market entry.It extends the literature on general versus skill specific education and applies it horizontallyto vocational education by combining it with occupational skill-specificity measures. It alsocontributes to the literature on the impact of economic conditions such as recessions onschooling decisions and later life outcomes, by showing the e�ect of structural change onpersonal vocational occupation choices and later life outcomes.
The chapter suggests that the adjustment of occupational choices into more service-orientedoccupations in response to import exposure does not take place at the level of young indi-viduals growing up in import exposed regions. Rather, initial industry structures seems tobe perpetuated by young labour market entrants, in that they are still more likely to choosemanufacturing and import industries when having been exposed to more import competitionat the age of 15. In terms of policy implications this calls for better informational access whenindividuals choose their apprenticeship positions. More job fares or better information aboutthe 320 di�erent possible occupations requiring vocational education may pose avenues forpotential policies targeted at young individuals.
Microeconometric Analyses on Determinants of Individual Labour Market Outcomes 219

5 Trade Shocks and Vocational Occupation Choices
Figures and Tables
Figure 5.1 : Apprentice Shares by Quantiles of Import Exposure in 2000
.04
.06
.08
.1
1980 1984 1988 1992 1996 2000 2004 2008 2012
20th percentile 40th percentile60th percentile 80th percentile100th percentile
(a) All apprentices.0
05.0
1.0
15.0
2.0
25.0
3
1980 1984 1988 1992 1996 2000 2004 2008 2012
20th percentile 40th percentile60th percentile 80th percentile100th percentile
(b) Manufacturing apprentices
Note: Shares of apprentices among all workers within a county. Counties divided into 5 quantiles along importexposures in 2000. Figure (a) refers to apprentices in all occupations, Figure (b) to apprentices in manufacturingoccupations.Source: Establishment History Panel.
220 Microeconometric Analyses on Determinants of Individual Labour Market Outcomes

5 Trade Shocks and Vocational Occupation Choices
Figure 5.2 : Total Trade Volumes in Billions of 2010 Euros
0
50
100
150
200
Trad
e Vo
lum
e in
Billi
on E
uro
1980 1990 2000 2010 2020
China Eastern EuropeBoth
Note: Import volumes from China, Eastern Europe and the two combined in 2010 billions of Euros.Source: UN Comtrade Data
Microeconometric Analyses on Determinants of Individual Labour Market Outcomes 221

5 Trade Shocks and Vocational Occupation Choices
Figure 5.3 : 10-year Changes in Import Exposure Per Worker
(a) 1990: change from 1980-1990 (b) 2000: change from 1990-2000
(c) 2003: change from 1993-2003 (d) 2014: change from 2004-2014
Note: 10-year changes in import exposure per worker in 1000 Euros. Figures (a) and (b) exclude former EasternGerman counties due to data availability.Source: UN Comtrade Data and Establishment History Panel, own calculations.
222 Microeconometric Analyses on Determinants of Individual Labour Market Outcomes

5 Trade Shocks and Vocational Occupation Choices
Figure 5.4 : Occupational specificity by Occupation Group0
.05
.1.1
5.2
Deg
ree
of S
peci
ficity
Manufacturing Craftsman Service Merchant
Note: The figure shows the average skill-specificity measures in the four occupational groups manufacturing,cra�smen, services and merchants. The skill-specificity is an angular distance measure representing the distancein skill bundles between an occupation and the average labour market; see Section 5.3.4. Source: BIBB/IABQualification and Occupational Career Surveys 1999, own calculations.
Microeconometric Analyses on Determinants of Individual Labour Market Outcomes 223

5 Trade Shocks and Vocational Occupation Choices
Tabl
e5.
1:S
umm
ary
Stat
istic
s
Var
Mea
nSt
dDe
vVa
rM
ean
Var
Mea
nSt
dDe
vTr
ade
Expo
sure
Year
whe
n15
Occ
upat
ion
Cate
gory
Impo
rtEx
posu
reO
vera
ll4.
1804
4.11
1319
910.
0490
Man
ufac
turin
g0.
3535
Impo
rtEx
posu
reEa
ster
nEu
rope
2.56
182.
5784
1992
0.04
68Cr
a�sm
en0.
2462
Impo
rtEx
posu
reCh
ina
1.61
862.
4284
1993
0.04
66Se
rvic
e0.
5713
Expo
rtEx
posu
reO
vera
ll4.
3094
4.08
8919
940.
0471
Mer
chan
t0.
1822
Expo
rtEx
posu
reEa
ster
nEu
rope
3.47
013.
1157
1995
0.04
84Im
port
Indu
stry
0.12
78Ex
port
Expo
sure
Chin
a0.
8393
1.30
9019
960.
0483
Indi
vidu
als
1997
0.04
78Sk
illsp
ecifi
city
0.11
830.
0460
Fem
ale
0.45
8019
980.
0465
Task
sGe
rman
0.92
8319
990.
0467
Com
pute
rUse
0.42
30St
ate
2000
0.04
48M
anua
l0.
2479
Schl
esw
ig-H
olst
ein
0.03
7620
010.
0472
Easy
Man
ual
0.03
07H
ambu
rg0.
0208
2002
0.05
83Q
ualif
ied
Man
ual
0.21
72Lo
wer
Saxo
ny0.
1112
2003
0.05
89La
bour
Mar
ket
Brem
en0.
0095
2004
0.05
59Gr
ossd
aily
Earn
ings
Nor
thrh
ine-
Wes
tpha
lia0.
2304
2005
0.05
55Du
ring
24.5
801
10.1
441
Hes
se0.
0780
2006
0.04
76O
neye
ara�
er50
.827
628
.443
5Rh
inel
and-
Pala
tine
0.05
6020
070.
0429
5ye
arsa
�er
70.6
205
35.7
110
Bade
n-W
urtt
embe
rg0.
1533
2008
0.03
8210
year
sa�e
r80
.879
743
.929
1Ba
varia
0.18
9320
090.
0311
Grow
tha�
er5
year
1.27
446.
5158
Saar
land
0.01
5220
100.
0219
Grow
tha�
er5
year
1.62
567.
4187
Berli
n0.
0372
2011
0.01
55Ag
eat
appr
entic
eshi
p19
.328
32.
3581
Bran
denb
urg
0.01
0520
120.
0062
Empl
oyed
first
year
a�er
0.63
35M
eckl
enbu
rg-V
orpo
mm
ern
0.00
8920
130.
0006
Di�e
rent
Coun
tya�
er0.
2936
Saxo
ny0.
0202
Occ
upat
ion
switc
hes
2.58
032.
1433
Saxo
nyAn
halt
0.01
11Co
unty
Switc
hes
1.25
531.
4486
Thur
inga
0.01
08Ye
arsu
nem
ploy
ed0.
7666
1.66
84No
te:N
=19
6,02
5.So
urce
:Ind
ivid
uals
ocia
lsec
urity
(SIA
B)da
ta.
224 Microeconometric Analyses on Determinants of Individual Labour Market Outcomes

5 Trade Shocks and Vocational Occupation Choices
Table 5.2 : E�ects of Import Exposure on Vocational Education Occupation Types
Panel A: OLS(1) (2) (3) (4) (5)
Manufacturing Cra�smen Service MerchantImport
ManufacturingImport Exposure 0.0014* 0.0015** -0.0011** -0.0009** 0.0016***
(0.0008) (0.0006) (0.0005) (0.0004) (0.0006)
N 196025 196025 196025 196025 196025R-squared 0.007 0.286 0.104 0.297 0.021Panel B: IV
(1) (2) (3) (4) (5)
Manufacturing Cra�smen Service MerchantImport
ManufacturingImport Exposure 0.0023** 0.0019** -0.0016** -0.0009** 0.0023***
(0.0011) (0.0008) (0.0007) (0.0006) (0.0007)
N 180000 180000 180000 180000 180000Note: Panel A refers to OLS regressions, Panel B to 2SLS IV regressions. The F-statistic for the first stage regressionin the 2SLS (Panel B) is 127.86. The outcome in column 1 is a dummy for whether the occupation an individualenters in in manufacturing, in column 2 a cra�s occupation, in column 3 a service, in column 4 a merchantoccupation. The outcome in column 5 is a dummy for whether the occupation in a import-intensive manufacturingindustry. The unit of observation is the individual, observed in the data once. The individual is “treated” by theimport shock in the county she is first observed in, in the year she is 15. The treatment refers to import exposureper worker (in 1000 Euro) at county level (402 counties) from both China and Eastern Europe. All regressions alsocontrol for the respective export exposure. All regressions control for the following covariates: manufacturingemployment in the county, and dummies for whether the individual is female or non-German. All regressionsinclude state-by-year fixed e�ects. Robust standard errors clustered on county level in parenthesis. Significancelevel: * p<0.10, ** p<0.05, *** p<0.01. Source: Individual social security (SIAB) data.
Microeconometric Analyses on Determinants of Individual Labour Market Outcomes 225

5 Trade Shocks and Vocational Occupation Choices
Table 5.3 : E�ects of Import Exposure on Occupation Task Characteristics
(1) (2) (3) (4)Computer use Manual Easy Manual Qualified Manual
Import Exposure -0.0020*** 0.0029** -0.0003 0.0015**(0.0006) (0.0012) (0.0002) (0.0007)
N 180000 180000 180000 180000F-Stat 1st stage 129.61 127.86 127.86 127.86Note: The outcome computer use stems from the BIBB occupation survey with four waves between1992-2012 and refers to a dummy indicating whether the majority of individuals in an occupationstate they use computers o�en or very o�en in their job. Outcomes in columns 2-4 refer to dummieswhether the classification is “manual”, “easy manual” or “qualified manual”, as classified by Bloosfeld.All results stem from 2SLS IV regressions. The unit of observation is the individual, observed in thedata once. The individual is “treated” by the import shock in the county she is first observed in, inthe year she is 15. The treatment refers to import exposure per worker (in 1000 Euro) at county level(402 counties) from both China and Eastern Europe. All regressions also control for the respectiveexport exposure. All regressions control for the following covariates: manufacturing employmentin the county, and dummies for whether the individual is female or non-German. All regressionsinclude state-by-year fixed e�ects. Robust standard errors clustered on county level in parenthesis.Significance level: * p<0.10, ** p<0.05, *** p<0.01. Source: Individual social security (SIAB) data.
226 Microeconometric Analyses on Determinants of Individual Labour Market Outcomes

5 Trade Shocks and Vocational Occupation ChoicesTa
ble
5.4
:E�e
ctso
fIm
port
Expo
sure
onEa
rnin
gsan
dO
ther
Labo
urM
arke
tOut
com
es
Gros
sdai
lyEa
rnin
gsPa
nelA
(1)
(2)
(3)
(4)
(5)
(6)
Durin
gap
pren
tices
hip
1ye
ara�
erap
pren
tices
hip
5ye
arsa
�er
appr
entic
eshi
p10
year
sa�e
rap
pren
tices
hip
Grow
tha�
er5
year
sGr
owth
a�er
10ye
ars
Impo
rtEx
posu
re-0
.001
4**
-0.0
013
-0.0
044*
*-0
.011
0***
-0.0
112
-0.0
579*
**
(0.0
006)
(0.0
011)
(0.0
018)
(0.0
033)
(0.0
082)
(0.0
192)
N18
0000
1500
0080
000
4400
077
000
4300
0Fs
tat1
stSt
age
127.
8691
.79
233.
4231
5.33
229.
6431
1.79
Oth
erLa
bour
Mar
ketO
utco
mes
Pane
lB(7
)(8
)(9
)(1
0)(1
1)Ag
eat
appr
entic
eshi
psst
art
Empl
oyed
first
year
a�er
appr
entic
eshi
p
Year
sun
empl
oyed
Tim
esco
unty
switc
hed
Occ
upat
ion
switc
hes
Impo
rtEx
posu
re-0
.010
0**
0.00
12**
0.00
08-0
.004
4**
0.00
50**
(0.0
046)
(0.0
006)
(0.0
017)
(0.0
022)
(0.0
025)
N18
0000
1800
0018
0000
1800
0018
0000
F-St
at1s
tst
age
127.
8612
7.86
127.
8612
7.86
127.
86No
te:E
ach
cell
refe
rsto
ase
para
tere
gres
sion
.Out
com
esin
pane
lAco
lum
ns1-
4re
fert
ogr
ossd
aily
earn
ings
,dur
ing,
one
year
upon
com
plet
ing
the
appr
entic
eshi
p,5
and
10ye
arsa
�ert
heap
pren
tices
hip,
resp
ectiv
ely.
The
outc
ome
inco
lum
n5
(6)r
efer
sto
grow
thbe
twee
nth
efir
stye
aran
dth
efi�
h(te
nth)
year
a�er
finis
hing
the
appr
entic
eshi
p.In
Pane
lB,t
heou
tcom
ein
colu
mn
7re
fers
toth
eag
eat
whi
chan
indi
vidu
albe
gins
hisa
ppre
ntic
eshi
p,co
lum
n8
isa
dum
my
forw
heth
erth
ein
divi
dual
isem
ploy
edth
eye
ara�
erfin
ishi
ngth
eap
pren
tices
hip,
colu
mn
9re
fers
toth
enu
mbe
rofy
ears
anin
divi
dual
isun
empl
oyed
thro
ugho
uthi
slife
,col
umn
10to
the
num
bero
ftim
esth
ein
divi
dual
mov
esco
unty
and
11th
enu
mbe
roft
imes
the
indi
vidu
alsw
itche
socc
upat
ions
.All
resu
ltsst
emfr
om2S
LSIV
regr
essi
ons.
The
unit
ofob
serv
atio
nis
the
indi
vidu
al,
obse
rved
inth
eda
taon
ce.T
hein
divi
dual
is“t
reat
ed”
byth
eim
port
shoc
kin
the
coun
tysh
eis
first
obse
rved
in,i
nth
eye
arsh
eis
15.T
hetr
eatm
entr
efer
sto
impo
rtex
posu
repe
rwor
ker(
in10
00Eu
ro)a
tcou
nty
leve
l(40
2co
untie
s)fro
mbo
thCh
ina
and
East
ern
Euro
pe.A
llre
gres
sion
sal
soco
ntro
lfor
the
resp
ectiv
eex
port
expo
sure
.All
regr
essi
onsc
ontr
olfo
rthe
follo
win
gco
varia
tes:
man
ufac
turin
gem
ploy
men
tin
the
coun
ty,
and
dum
mie
sfor
whe
ther
the
indi
vidu
alis
fem
ale
orno
n-Ge
rman
.All
regr
essi
onsi
nclu
dest
ate-
by-y
earf
ixed
e�ec
ts.R
obus
tsta
ndar
der
rors
clus
tere
don
coun
tyle
veli
npa
rent
hesi
s.Si
gnifi
canc
ele
vel:
*p<
0.10
,**p
<0.
05,*
**p<
0.01
.Sou
rce:
Indi
vidu
also
cial
secu
rity
(SIA
B)da
ta.
Microeconometric Analyses on Determinants of Individual Labour Market Outcomes 227

5 Trade Shocks and Vocational Occupation Choices
Table 5.5 : 10-Year Earnings Growth by Vocational Occupation Choice
(1) (2) (3) (4) (5)Manufacturing Cra�smen Service Merchant Import Manuf
Import Exposure -0.0113 -0.0333* -0.0896*** -0.0884*** -0.0637***(0.0208) (0.0191) (0.0219) (0.0224) (0.0193)
Import Exposure xOcc Category
-0.0866*** -0.0662*** 0.0780*** 0.0665*** 0.0516
(0.0219) (0.0248) (0.0192) (0.0197) (0.0720)N 43000 43000 43000 43000 43000F-Stat 1st stage 205.56 197.36 201.11 200.65 207.17Note: The results refer to the e�ects of import exposure on 10-year earnings growth, and the interaction of havingchosen the respective occupation type. All results refer to 2SLS IV regressions. The unit of observation is theindividual, observed in the data once. The individual is “treated” by the import shock in the county she is firstobserved in, in the year she is 15. The treatment refers to import exposure per worker (in 1000 Euro) at countylevel (402 counties) from both China and Eastern Europe. All regressions also control for the respective exportexposure. All regressions control for the following covariates: manufacturing employment in the county, anddummies for whether the individual is female or non-German. All regressions include state-by-year fixed e�ects.Robust standard errors clustered on county level in parenthesis. Significance level: * p<0.10, ** p<0.05, ***p<0.01. Source: Individual social security (SIAB) data.
228 Microeconometric Analyses on Determinants of Individual Labour Market Outcomes

5 Trade Shocks and Vocational Occupation Choices
Table 5.6 : Non-Endogenous Subsample: Selection into School Tracks
4th gradetransitions
7th grade Graduates Apprentices
Academictrack
Middleschool
Academictrack
Middleschool
Academictrack
(1) (2) (3) (4) (5) (6)Import Exposure -0.0005 -0.00057 -0.00017 -0.00015 -0.00001 0.0011
(0.0012) (0.00051) (0.00021) (0.00028) (0.00026) (0.0016)N 422 6320 6320 7318 5748 8736R-squared 0.235 0.024 0.561 0.277 0.549 0.077Note: Data for this analysis is at the county-year level for 402 counties across varying amounts of years, according todata availability. The outcomes represent shares of students over the total at the respective level. Import exposureis used at the respectively correct time to test non-di�erential selection into subsamples due to the treatment. Incolumn (1) it is tested whether the trade shock at t+6 (referring to the change of t-(t-10) in trade exposure), lead pupilsto di�erentially select into the academic track high-school a�er fourth grade, at t. In columns 2 and 3 the outcomesare shares of seventh graders in the middle track and academic track high-school at t, and the import shock refers tot+3. Columns 4 and 5 refer to graduates from middle school (with import at t) and academic track high-school (withtrade shock at t-4). All regressions include year and individual fixed e�ects and also control for export exposure. Robuststandard errors clustered on county level in parenthesis. Significance level: * p<0.10, ** p<0.05, *** p<0.01. Source:Regional Statistical Data Catalogue of the Federal Statistical O�ice and the statistical o�ices of the Länder.
Microeconometric Analyses on Determinants of Individual Labour Market Outcomes 229

5 Trade Shocks and Vocational Occupation Choices
Table 5.7 : Supply-Demand Relations for Apprenticeship Positions for All Occupations
(1) (2) (3) (4)
Supply-demandNon-filledpositions
New contractsUnsuccessful
applicantsImport Exposure -0.0000 -0.6203 -30.6334 0.2827
(0.0004) (1.0808) (22.0862) (1.1758)N 4793 4793 4793 4793R-squared 0.193 0.193 0.463 0.712Note: Analysis on the level of 176 job centre labour market regions. Outcomes refer to supply and demand ofapprentice positions in labour market regions. Column 1 refers to the suppy-demand ratio of apprenticeshippositions, with all supplied apprenticeship positions (new contracts and unfilled positions) over all demandedpositions (new contracts and unsuccessful candidate). Column 2 refers to non-filled positions, column 3 tonew apprenticeship contracts agreed and column 4 to the number of unsuccessful applicants. Years 1998-2011 are included. All regressions include year and labour market region fixed e�ects. All regressions includestate-by-year fixed e�ects. Robust standard errors clustered on labour market region level in parenthesis.Significance level: * p<0.10, ** p<0.05, *** p<0.01. Source: Federal Institute for Vocational Education andTraining.
230 Microeconometric Analyses on Determinants of Individual Labour Market Outcomes

5 Trade Shocks and Vocational Occupation Choices
Table 5.8 : Unsuccessful Apprenticeship Candidates by Occupation Category
(1) (2) (3) (4) (5)
Manual O�ice Cra�smenIndustry
and CommercePublic Service
Import Exposure 0.2569 0.2589 0.1456 0.3794 0.0176**(0.2437) (0.2941) (0.1927) (0.4094) (0.0077)
N 1168 1168 1168 1168 1168R-squared 0.548 0.532 0.554 0.534 0.458Note: Analysis on the level of 176 job centre labour market regions. Outcomes refer to supply and demand ofapprentice positions in labour market regions. The outcome are unsuccessful apprenticeship applicants in eachlabour market region. Years 2004-2011 are included. All regressions include state-by-year fixed e�ects. Robuststandard errors clustered on labour market region level in parenthesis. Significance level: * p<0.10, ** p<0.05,*** p<0.01. Source: Federal Institute for Vocational Education and Training.
Microeconometric Analyses on Determinants of Individual Labour Market Outcomes 231

5 Trade Shocks and Vocational Occupation Choices
Tabl
e5.
9:R
obus
tnes
sChe
ck:U
sing
Di�e
rent
Impo
rtEx
posu
reDe
finiti
ons
(1)
(2)
(3)
(4)
(5)
Man
ufac
turin
gCr
a�sm
enIm
port
Indu
stry
Com
pute
r10
Year
Earn
ings
Grow
thBa
selin
e0.
0014
*0.
0016
**-0
.004
3***
-0.0
017*
**-0
.065
2***
(0.0
008)
(0.0
007)
(0.0
016)
(0.0
005)
(0.0
202)
Cum
ulat
ive
0.00
02**
0.00
03**
*-0
.001
0***
-0.0
002*
**-0
.009
3***
(0.0
001)
(0.0
001)
(0.0
002)
(0.0
001)
(0.0
026)
Curr
entY
ear
0.00
13*
0.00
17**
*-0
.005
7***
-0.0
016*
**-0
.058
6***
(0.0
007)
(0.0
006)
(0.0
017)
(0.0
004)
(0.0
159)
Fixe
dBa
selin
e0.
0014
0.00
12*
-0.0
033*
*-0
.001
4***
-0.0
573*
**(0
.000
9)(0
.000
6)(0
.001
5)(0
.000
5)(0
.020
4)No
te:E
ach
cell
refe
rsto
sepa
rate
regr
essi
on.T
heal
tern
ativ
eim
port
expo
sure
mea
sure
sare
:Bas
elin
ere
fers
toou
rten
year
rolli
ngw
indo
wch
ange
sin
trad
eex
posu
resu
chas
inth
em
ain
resu
lts.C
umul
ativ
ere
fers
toro
lling
win
dow
ten
year
cum
ulat
edim
port
volu
mes
appo
rtio
ned
byin
itial
(t-10
)reg
iona
lind
ustr
yst
ruct
ures
.Cur
rent
year
refe
rsto
the
curr
ent
year
tota
lim
port
expo
sure
appo
rtio
ned
byin
itial
regi
onal
indu
stry
stru
ctur
esat
t-10.
Fixe
dba
selin
ere
fers
tote
nye
arch
ange
s,lik
ein
base
line,
butw
ithfix
edin
itial
indu
stry
stru
ctur
eat
1980
fort
heW
esta
ndw
ith19
93fo
rthe
East
.All
regr
essi
onsa
reO
LS.T
heun
itof
obse
rvat
ion
isth
ein
divi
dual
,obs
erve
din
the
data
once
.The
indi
vidu
alis
“tre
ated
”by
the
impo
rtsh
ock
inth
eco
unty
she
isfir
stob
serv
edin
,in
the
year
she
is15
.The
trea
tmen
tref
erst
oim
port
expo
sure
per
wor
ker(
in10
00Eu
ro)a
tcou
nty
leve
l(40
2co
untie
s)fro
mbo
thCh
ina
and
East
ern
Euro
pe.A
llre
gres
sion
sals
oco
ntro
lfor
the
resp
ectiv
eex
port
expo
sure
.All
regr
essi
onsc
ontr
olfo
rthe
follo
win
gco
varia
tes:
man
ufac
turin
gem
ploy
men
tin
the
coun
ty,a
nddu
mm
iesf
orw
heth
erth
ein
divi
dual
isfe
mal
eor
non-
Germ
an.A
llre
gres
sion
sinc
lude
stat
e-by
-yea
rfix
ede�
ects
.Rob
usts
tand
ard
erro
rscl
uste
red
onco
unty
leve
lin
pare
nthe
sis.
Sign
ifica
nce
leve
l:*p
<0.
10,*
*p<
0.05
,***
p<0.
01.S
ourc
e:In
divi
dual
soci
alse
curit
y(S
IAB)
data
.
232 Microeconometric Analyses on Determinants of Individual Labour Market Outcomes

5 Trade Shocks and Vocational Occupation ChoicesTa
ble
5.10
:Het
ereo
gene
ityAn
alys
isby
Gend
er
(1)
(2)
(3)
(4)
(5)
(6)
(7)
Man
ufac
turin
gCr
a�sm
enSe
rvic
eM
erch
ant
Com
pute
rM
anua
lQ
ualif
ied
Man
ual
Imp
Exp
0.00
13*
0.00
15**
-0.0
012*
*-0
.001
0**
-0.0
016*
**0.
0016
*0.
0012
**(0
.000
8)(0
.000
6)(0
.000
5)(0
.000
5)(0
.000
4)(0
.000
9)(0
.000
5)Fe
mal
e-0
.508
5***
-0.2
708*
**0.
5317
***
0.51
82**
*0.
1505
***
-0.4
997*
**-0
.316
1***
(0.0
063)
(0.0
039)
(0.0
062)
(0.0
068)
(0.0
020)
(0.0
065)
(0.0
043)
Imp
Exp
xFe
mal
e-0
.000
8-0
.000
50.
0011
0.00
14*
0.00
14**
-0.0
018*
0.00
21**
*
(0.0
008)
(0.0
006)
(0.0
007)
(0.0
007)
(0.0
005)
(0.0
009)
(0.0
007)
(8)
(9)
(10)
(11)
(12)
(13)
(14)
Earn
ings
durin
gap
pren
tices
hip
Earn
ings
1ye
ara�
erap
pren
tices
hip
Earn
ings
10ye
arsa
�er
appr
entic
eshi
p
Empl
oyed
a�er
appr
entic
eshi
p
Occ
upat
ion
switc
hes
Year
sun
empl
oyed
Tim
esco
untie
ssw
itche
dIm
pEx
p-0
.001
1**
-0.0
014
-0.0
128*
**0.
0005
0.00
40**
0.00
10-0
.002
7(0
.000
5)(0
.000
8)(0
.003
5)(0
.000
6)(0
.001
9)(0
.001
5)(0
.002
0)Fe
mal
e-0
.044
8***
-0.1
539*
**-0
.563
2***
-0.0
073*
*-0
.384
8***
-0.0
568*
**-0
.041
5***
(0.0
030)
(0.0
079)
(0.0
148)
(0.0
036)
(0.0
127)
(0.0
103)
(0.0
088)
Imp
Exp
xFe
mal
e-0
.000
9*-0
.004
0***
-0.0
121*
*-0
.002
4***
0.02
12**
*0.
0132
***
0.01
37**
*
(0.0
005)
(0.0
011)
(0.0
054)
(0.0
007)
(0.0
061)
(0.0
036)
(0.0
030)
Note
:Thi
stab
lesr
epor
tsth
eco
e�ic
ient
sofi
nter
estf
rom
inte
ract
ions
;im
port
expo
sure
,fem
ale,
and
thei
rint
erac
tion.
The
resu
ltsre
fert
oO
LSre
gres
sion
s.Th
eun
itof
obse
rvat
ion
isth
ein
divi
dual
,obs
erve
din
the
data
once
.The
indi
vidu
alis
“tre
ated
”by
the
impo
rtsh
ock
inth
eco
unty
she
isfir
stob
serv
edin
,in
the
year
she
is15
.The
trea
tmen
tref
erst
oim
port
expo
sure
perw
orke
r(in
1000
Euro
)atc
ount
yle
vel(
402
coun
ties)
from
both
Chin
aan
dEa
ster
nEu
rope
.All
regr
essi
ons
also
cont
rolf
orth
ere
spec
tive
expo
rtex
posu
re.A
llre
gres
sion
scon
trol
fort
hefo
llow
ing
cova
riate
s:m
anuf
actu
ring
empl
oym
enti
nth
eco
unty
,and
dum
mie
sfo
rwhe
ther
the
indi
vidu
alis
fem
ale
orno
n-Ge
rman
.All
regr
essi
ons
incl
ude
stat
e-by
-yea
rfix
ede�
ects
.Rob
usts
tand
ard
erro
rscl
uste
red
onco
unty
leve
lin
pare
nthe
sis.
Sign
ifica
nce
leve
l:*p
<0.
10,*
*p<
0.05
,***
p<0.
01.S
ourc
e:In
divi
dual
soci
alse
curit
y(S
IAB)
data
.
Microeconometric Analyses on Determinants of Individual Labour Market Outcomes 233

5 Trade Shocks and Vocational Occupation Choices
Appendix
Appendix A5.1 Appendix Tables
Table A5.1 : List of Tasks and Skills from BIBB Survey used for Skill Specificity Measure
TasksTeachConsultMeasure examineMonitorRepareSell, BuyOrganiseMarketingEvaluate InformationNegotiateDevelopProduceTend to people
SkillsMathsGermanPresentationForeign LanguagesSales, Marketing, PRDesignProgramme applicationSo�ware DevelopmentComputer literacyOther technical knowledgeLabour LawOther legal knowledgeManagementFinanceControllingProtection of LabourMedical ScienceOther Skills
Note: The skills and tasks stem from the BIBB/IAB Quali-fication and Occupational Career Surveys 1999.
234 Microeconometric Analyses on Determinants of Individual Labour Market Outcomes

5 Trade Shocks and Vocational Occupation Choices
Table A5.2 : Change in Import Exposure Per Worker by Quantiles and Years
PercentilesOverall 25th 50th 75th 100th1990 0.2546 0.5360 0.8616 1.71662000 2.3595 4.2749 5.9510 10.71292008 2.1580 4.1540 6.2708 13.34732014 2.1811 4.0019 6.0587 10.8712Eastern Europe 25th 50th 75th 100th1990 0.0832 0.2070 0.3230 0.67042000 1.7070 3.0035 4.2051 7.94482008 0.8035 1.7979 3.1105 6.51172014 1.0852 2.1264 3.5001 6.6666China 25th 50th 75th 100th1990 0.1257 0.2836 0.5075 1.16942000 0.5148 0.9946 1.5671 3.36542008 0.9402 1.8356 3.0902 7.84512014 0.8376 1.5215 2.3445 5.0357Note: Table refers to mean 10 year changes in per worker tradeexposure from Eastern Europe, China and both in 1000 Euro. Di-vision into quantiles is di�erent by each respective year to showtotal increases.
Microeconometric Analyses on Determinants of Individual Labour Market Outcomes 235

5 Trade Shocks and Vocational Occupation Choices
Table A5.3 : Results for Occupation Categories for Eastern Europe and China, IV and OLS
Panel A: OLS (1) (2) (3) (4) (5)
Eastern Europe Manufacturing Cra�smen Service MerchantImport
ManufacturingImport Exposure 0.0017 0.0021* -0.0013 -0.0064 0.0067*
(0.0017) (0.0012) (0.0011) (0.0039) (0.0035)N 196025 196025 196025 180000 180000R-squared 0.295 0.104 0.295 0.2798 0.021
Panel B: IV (1) (2) (3) (4) (5)
Eastern Europe Manufacturing Cra�smen Service MerchantImport
ManufacturingImport Exposure 0.0122** 0.0103*** -0.0067* -0.0064 0.0025*
(0.0048) (0.0036) (0.0039) (0.0039) (0.0036)N 180000 180000 180000 180000 180000F stat First Stage 17.51 17.51 17.51 17.51 17.51
Panel C: OLS (1) (2) (3) (4) (5)
China Manufacturing Cra�smen Service MerchantImport
ManufacturingImport Exposure 0.0017* 0.0026** -0.0016** -0.0014** 0.0033
(0.0010) (0.0012) (0.0007) (0.0006) (0.0023)N 196025 0.1000 196025 196025 196025R-squared 0.292 180000 0.295 0.286 0.021
Panel D: IV (1) (2) (3) (4) (5)
China Manufacturing Cra�smen Service MerchantImport
ManufacturingImport Exposure 0.0037** 0.0026** -0.0030*** -0.0025*** 0.0051*
(0.0017) (0.0012) (0.0011) (0.0010) (0.0029)N 180000 180000 180000 180000 180000F stat First Stage 15.34 15.34 15.34 15.34 15.34Note: These results refer results for separate regression by Eastern Europe and China, OLS and IV regressions.The treatment in Panel A (OLS) and B (IV) refers to Import Exposure per worker (in 1000 Euro) at county levelfrom Eastern Europe, in Panel C (OLS) and D (IV) from China. The outcome in column 1 is a dummy for whetherthe occupation an individual enters in in manufacturing, in column 2 a cra�s occupation, in column 3 a service,in column 4 a merchant occupation. The outcome in column 5 is a dummy for whether the occupation in aimport-intensive manufacturing industry. The unit of observation is the individual, observed in the data once.The individual is “treated” by the import shock in the county she is first observed in, in the year she is 15. Thetreatment refers to import exposure per worker (in 1000 Euro) at county level (402 counties) from both Chinaand Eastern Europe. All regressions also control for the respective export exposure. All regressions control forthe following covariates: manufacturing employment in the county, and dummies for whether the individualis female or non-German. All regressions include state-by-year fixed e�ects. Robust standard errors clusteredon county level in parenthesis. Significance level: * p<0.10, ** p<0.05, *** p<0.01. Source: Individual socialsecurity (SIAB) data.
236 Microeconometric Analyses on Determinants of Individual Labour Market Outcomes

5 Trade Shocks and Vocational Occupation Choices
Table A5.4 : Evidence on Youths Aspirations and E�ects of Parental Occupations
Adult occupations Youths’ aspirationsPanel A (1) (2) (3) (4)
Manufacturing Service Manufacturing ServiceImport Exposure 0.0010 -0.0010 -0.0008 0.0010
(0.0031) (0.0023) (0.0013) (0.0014)N 4302 4302 2090 2090R-squared 0.194 0.207 0.249 0.290
Adult occupationsPanel B (1) (2) (3) (4)
Manufacturing Service Manufacturing ServiceImport Exosure 0.0015 0.0002 0.0032 -0.0022
(0.0030) (0.0031) (0.0028) (0.0029)Father Manufacturing 0.1142*** -0.0841*** 0.1316*** -0.1081***
(0.0174) (0.0181) (0.0186) (0.0194)Imp Exp x Father Manuf -0.0046** 0.0064***
(0.0021) (0.0018)N 2762 2762 2762 2762R-squared 0.219 0.214 0.221 0.217Note: This table presents results from the German Socio-Economic panel. The household survey allows to linkfamilies together. In Panel A columns 1 and 2, the outcome refers to the vocational occupation choice of all adultsin the survey. The outcomes in Panel A columns 3 and 4 refer to occupational aspirations of 17 year olds in thehousehold. Outcomes in Panel B refer again to adult occupations. Import Exposure treatment is aggregated up to96 German planning regions. The unit of observation is the individual, observed in the data once. The individualis “treated” by the import shock in the county she is first observed in, in the year she is 15. The treatment refers toimport exposure per worker (in 1000 Euro) from both China and Eastern Europe. All regressions also control forthe respective export exposure. All regressions control for the following covariates: manufacturing employmentin the region, and dummies for whether the individual is female or non-German. All regressions include state andyear fixed e�ects. Robust standard errors clustered on county level in parenthesis. Significance level: * p<0.10,** p<0.05, *** p<0.01.Source: German Socio-economic panel data
Microeconometric Analyses on Determinants of Individual Labour Market Outcomes 237


Bibliography
Acemoglu, Daron, and David Autor. 2011. “Skills, Tasks and Technologies: Implications forEmployment and Earnings.” , ed. O. Ashenfelter and D. Card Vol. 4 of Handbook of LaborEconomics, Chapter 12, 1043–1171. Elsevier.
Adamopoulou, E�rosyni, and Giulia Martina Tanzi. 2017. “Academic Drop-Out and the GreatRecession.” Journal of Human Capital, 11(1): 35–71.
Aghion, P., R. Blundell, R. Gri�ith, P. Howitt, and S. Prantl. 2004. “Entry and ProductivityGrowth: Evidence from Micro-level Panel Data.” Journal of the European Economic Associa-tion, 2(2/3): 265–276.
Aghion, Philippe, Peter Howitt, and Susanne Prantl. 2015. “Patent Rights, Product MarketReforms, and Innovation.” Journal of Economic Growth, 20(3): 223–262.
Aghion, Philippe, Richard Blundell, Rachel Gri�ith, Peter Howitt, and Susanne Prantl. 2009.“The E�ects of Entry on Incumbent Innovation and Productivity.” The Review of Economicsand Statistics, 9(1): 20–32.
Aghion, Philippe, Robin Burgess, Stephen J. Redding, and Fabrizio Zilibotti. 2008. “The UnequalE�ects of Liberalization: Evidence from Dismantling the License Raj in India.” AmericanEconomic Review, 98(4): 1397–1412.
Aghion, Philippe, Robin Burgess, Stephen Redding, and Fabrizio Zilibotti. 2005. “Entry Lib-eralization and Inequality in Industrial Performance.” Journal of the European EconomicAssociation, 2-3(3): 291–302.
Alesina, Alberto, Armando Miano, and Stefanie Stantcheva. 2018. “Immigration and Redistri-bution.” National Bureau of Economic Research, Inc NBER Working Papers 24733.
Alesina, Alberto, Silvia Ardagna, Giuseppe Nicoletti, and Fabio Schiantarelli. 2005. “Regulationand Investment.” Journal of the European Economic Association, 3(4): 791–825.
Alesina, Alberto, Stefanie Stantcheva, and Edoardo Teso. 2018. “Intergenerational Mobilityand Preferences for Redistribution.” American Economic Review, 108(2): 521–54.
Almlund, Mathilde, Angela Lee Duckworth, James Heckman, and Tim Kautz. 2011. “PersonalityPsychology and Economics.” Vol. 4 of Handbook of the Economics of Education, Chapter 1,1–181. Elsevier.
Altonji, Joseph G., and Charles R. Pierret. 2001. “Employer Learning and Statistical Discrimina-tion.” The Quarterly Journal of Economics, 116(1): 313–350.
Microeconometric Analyses on Determinants of Individual Labour Market Outcomes 239

Bibliography
Altonji, Joseph G., Lisa B. Kahn, and Jamin D. Speer. 2016. “Cashier or Consultant? EntryLabor Market Conditions, Field of Study, and Career Success.” Journal of Labor Economics,34(S1): S361–S401.
Altonji, Joseph. G., Peter Arcidiacono, and Arnaud. Maurel. 2016. “The Analysis of Field Choicein College and Graduate School.” In Handbook of the Economics of Education. Vol. 5, , ed.Eric A. Hanushek, Stephen Machin and Ludger Woessmann, Chapter 7, 305–396. Elsevier.
Anderson, D. Mark, Ryan Brown, Kerwin Kofi Charles, and Daniel I. Rees. 2016. “The E�ect ofOccupational Licensing on Consumer Welfare: Early Midwifery Laws and Maternal Mortality.”National Bureau of Economic Research Working Paper 22456.
Anderson, Michael L. 2008. “Multiple Inference and Gender Di�erences in the E�ects of Early In-tervention: A Reevaluation of the Abecedarian, Perry Preschool, and Early Training Projects.”Journal of the American Statistical Association, 103(484): 1481–1495.
Angrist, Joshua, and Jorn-Ste�en Pischke. 2009. Mostly Harmless Econometrics: An Empiricist’sCompanion. . 1 ed., Princeton University Press.
Antoni, Manfred, Andreas Ganzer, and Philipp vom Berge. 2016. “Sample of Integrated LabourMarket Biographies (SIAB) 1975-2014.” IAB FDZ data report, 04/2016 (en), Nuremberg.
Arai, Mahmood, and Fredrik Heyman. 2009. “Microdata Evidence on Rent-Sharing.” AppliedEconomics, 41(23): 2965–2976.
Arceo-Gomez, Eva O., and Raymundo M. Campos-Vazquez. 2014. “Race and Marriage in theLabor Market: A Discrimination Correspondence Study in a Developing Country.” AmericanEconomic Review, 104(5): 376–80.
Arcidiacono, Peter, Patrick Bayer, and Aurel Hizmo. 2010. “Beyond Signaling and HumanCapital: Education and the Revelation of Ability.” American Economic Journal: AppliedEconomics, 2(4): 76–104.
Arrow, Kenneth J. 1973. “Higher Education as a Filter.” Journal of Public Economics, 2(3): 193–216.
Arruñada, Benito. 2007. “Pitfalls to Avoid When Measuring Institutions: Is Doing BusinessDamaging Business?” Journal of Comparative Economics, 35(4): 729–747.
Autor, David H., David Dorn, and Gordon H. Hanson. 2013. “The China Syndrome: Local LaborMarket E�ects of Import Competition in the United States.” American Economic Review,103(6): 2121–2168.
Autor, David H., David Dorn, Gordon H. Hanson, and Jae Song. 2014. “Trade Adjustment:Worker-Level Evidence.” The Quarterly Journal of Economics, 129(4): 1799–1860.
240 Microeconometric Analyses on Determinants of Individual Labour Market Outcomes

Bibliography
Autor, David H., Frank Levy, and Richard J. Murnane. 2003. “The Skill Content of Recent Techno-logical Change: An Empirical Exploration.” The Quarterly Journal of Economics, 118(4): 1279–1333.
Autor, David H., Lawrence F. Katz, and Alan B. Krueger. 1998. “Computing Inequality: HaveComputers Changed the Labor Market?” The Quarterly Journal of Economics, 113(4): 1169–1213.
Baert, Stijn, and Sunčica Vujić. 2018. “Does it Pay to Care? Volunteering and EmploymentOpportunities.” Journal of Population Economics, 31(3): 819–836.
Balart, Pau, Matthijs Oosterveen, and Dinand Webbink. 2018. “Test scores, noncognitive skillsand economic growth.” Economics of Education Review, 63: 134 – 153.
Bansak, Kirk, Jens Hainmueller, and Dominik Hangartner. 2016. “How Economic, Humanitar-ian, and Religious Concerns Shape European Attitudes toward Asylum Seekers.” Science,354(6309): 217–222.
Bansak, Kirk, Jens Hainmueller, and Dominik Hangartner. 2017. “Europeans support a propor-tional allocation of asylum seekers.” Nature Human Behaviour, 1(0133).
Barabas, Jason, and Jennifer Jerit. 2010. “Are Survey Experiments Externally Valid?” AmericanPolitical Science Review, 104(02): 226–242.
Barseghyan, Levon. 2008. “Entry Costs and Cross-Country Di�erences in Productivity andOutput.” Journal of Economic Growth, 13(2): 145–167.
Bartik, Timothy J. 1991. Who Benefits from State and Local Economic Development Policies?Books from Upjohn Press, W.E. Upjohn Institute for Employment Research.
Bassanini, Andrea, and Giorgio Brunello. 2011. “Barriers to Entry, Deregulation and WorkplaceTraining: A Theoretical Model with Evidence from Europe.” European Economic Review,55(8): 1152 – 1176.
Bassanini, Andrea, and Romain Duval. 2006. “The Determinants of Unemployment AcrossOECD Countries: Reassessing the Role of Policies and Institutions.” OECD Economic Studies,2006(1): 7–86.
Bauer, Thomas K., Magnus Lofstrom, and Klaus F. Zimmermann. 2000. “Immigration Policy,Assimilation of Immigrants and Natives’ Sentiments towards Immigrants: Evidence from 12OECD-Countries.” Institute for the Study of Labor (IZA) IZA Discussion Papers 187.
Bertrand, Marianne, and Esther Duflo. 2016. “Field Experiments on Discrimination.” NationalBureau of Economic Research, Inc NBER Working Papers 22014.
Bertrand, Marianne, and Francis Kramarz. 2002. “Does Entry Regulation Hinder Job Creation?Evidence from the French Retail Industry.” The Quarterly Journal of Economics, 117(4): 1369–1413.
Microeconometric Analyses on Determinants of Individual Labour Market Outcomes 241

Bibliography
Bertrand, Marianne, and Sendhil Mullainathan. 2004. “Are Emily and Greg More EmployableThan Lakisha and Jamal? A Field Experiment on Labor Market Discrimination.” AmericanEconomic Review, 94(4): 991–1013.
Betts, Julian R., and Laurel L. McFarland. 1995. “Safe Port in a Storm: The Impact of La-bor Market Conditions on Community College Enrollments.” Journal of Human Resources,30(4): 741–765.
BIBB. 2016. “Datenreport zum Berufsbildungsbericht 2016.” Bundesinstitut für Berufsbildung.
Bishop, John. 1989. “Occupational Training in High School: When Does It Pay O�?” Economicsof Education Review, 8(1): 1–15.
Black, Sandra E., and Philip E. Strahan. 2001. “The Division of Spoils: Rent-Sharing and Dis-crimination in a Regulated Industry.” American Economic Review, 91(4): 814–831.
Blanchard, Olivier, and Francesco Giavazzi. 2003. “Macroeconomic E�ects of Regulation andDeregulation in Goods and Labor Markets.” Quarterly Journal of Economics, 118(3): 879–907.
Blanchflower, David G., Andrew J. Oswald, and Peter Sanfey. 1996. “Wages, Profits, and Rent-Sharing.” Quarterly Journal of Economics, 111(1): 227–251.
Blinder, Alan S., and Alan B. Krueger. 2004. “What Does the Public Know about EconomicPolicy, and How Does It Know It?” Brookings Papers on Economic Activity, 2004(1): 327–387.
Blom, Erica, Brian C. Cadena, and Benjamin J. Keys. 2015. “Investment over the BusinessCycle: Insights from College Major Choice.” IZA Discussion Paper, , (9167).
Blossfeld, Hans-Peter. 1987. “Karriereprozese im Wandel der Arbeitsmarktstruktur.” Mitteilun-gen aus der Arbeitsmarkt- und Berufsforschung, 20(1): 74–88.
Blundell, Richard, Rachel Gri�ith, and John van Reenen. 1999. “Market Share, Market Valueand Innovation in a Panel of British Manufacturing Firms.” Review of Economic Studies,66(3): 529–554.
Bénabou, Roland, and Jean Tirole. 2016. “Mindful Economics: The Production, Consumption,and Value of Beliefs.” Journal of Economic Perspectives, 30(3): 141–164.
Bol, Thijs. 2014. “Economic Returns to Occupational Closure in the German Skilled Trades.”Social Science Research, 46: 9–22.
Bol, Thijs, and Kim A. Weeden. 2015. “Occupational Closure and Wage Inequality in Germanyand the United Kingdom.” European Sociological Review, 31(3): 354–369.
Booth, Alison, and Andrew Leigh. 2010. “Do Employers Discriminate by Gender? A FieldExperiment in Female-Dominated Occupations.” Economics Letters, 107(2): 236–238.
242 Microeconometric Analyses on Determinants of Individual Labour Market Outcomes

Bibliography
Borghans, Lex, Angela Lee Duckworth, James J. Heckman, and Bas ter Weel. 2008. “TheEconomics and Psychology of Personality Traits.” Journal of Human Resources, 43(4).
Branstetter, Lee, Francisco Lima, Lowell J. Taylor, and Ana Venâncio. 2014. “Do Entry Regula-tions Deter Entrepreneurship and Job Creation? Evidence from Recent Reforms in Portugal.”Economic Journal, 124(577): 805–832.
Brücker, Herbert, Nina Rother, and Jürgen Schupp. 2016. IAB-BAMF-SOEP-Befragung vonGeflüchteten: Überblick und erste Ergebnisse. Vol. 116 of DIW Berlin: Politikberatung kompakt,DIW Berlin, German Institute for Economic Research.
Brenke, Karl. 2008. “Reform der Handwerksordnung: Erfolgreich, Aber Viel Zu Halbherzig.”Vierteljahrshe�e zur Wirtscha�sforschung / Quarterly Journal of Economic Research, 77(1): 51–64.
Bruhn, Miriam. 2011. “License to Sell: The E�ect of Business Registration Reform on En-trepreneurial Activity in Mexico.” Review of Economics and Statistics, 93(1): 382 – 386.
Buber-Ennser, Isabella, Judith Kohlenberger, Bernhard Rengs, Zakarya Al Zalak, Anne Goujon,Erich Striessnig, Michaela Potančoková, Richard Gisser, Maria Rita Testa, and Wolfgang Lutz.2016. “Human Capital, Values, and Attitudes of Persons Seeking Refuge in Austria in 2015.”PLoS ONE, 9(11).
Bundesministerium des Inneren. 2016. “2015: Mehr Asylanträge in Deutschland als jemalszuvor.” Bundesministerium des Innern Pressemitteilungen.
Bursztyn, Leonardo. 2016. “Poverty And The Political Economy Of Public Education Spending:Evidence From Brazil.” Journal of the European Economic Association, 14(5): 1101–1128.
Card, David. 1986. “The Impact of Deregulation on the Employment and Wages of AirlineMechanics.” ILR Review, 39(4): 527–538.
Card, David. 1998. “Deregulation and Labor Earnings in the Airline Industry.” In RegulatoryReform and Labor Markets. , ed. James Peoples, Chapter 5, 184–247. Springer Science.
Card, David. 1999. “Chapter 30 - The Causal E�ect of Education on Earnings.” In . Vol. 3, PartA of Handbook of Labor Economics, , ed. Orley C. Ashenfelter and David Card, 1801 – 1863.Elsevier.
Card, David, and A. Abigail Payne. 2017. “High School Choices and the Gender Gap in STEM.”National Bureau of Economic Research, Inc NBER Working Papers 23769.
Card, David, and John E. DiNardo. 2002. “Skill-Biased Technological Change and Rising WageInequality: Some Problems and Puzzles.” Journal of Labor Economics, 20(4): 733–783.
Card, David, Christian Dustmann, and Ian Preston. 2012. “Immigration, Wages, And Composi-tional Amenities.” Journal of the European Economic Association, 10(1): 78–119.
Microeconometric Analyses on Determinants of Individual Labour Market Outcomes 243

Bibliography
Card, David, Francesco Devicienti, and Agata Maida. 2014. “Rent-Sharing, Holdup, and Wages:Evidence from Matched Panel Data.” Review of Economic Studies, 81(1): 84–111.
Card, David, Jörg Heining, and Patrick Kline. 2013. “Workplace Heterogeneity and the Rise ofWest German Wage Inequality.” The Quarterly Journal of Economics, 128(3): 967–1015.
Cavallo, Alberto, Guillermo Cruces, and Ricardo Perez-Truglia. 2017. “Inflation Expectations,Learning, and Supermarket Prices: Evidence from Survey Experiments.” American EconomicJournal: Macroeconomics, 9(3): 1–35.
Chen, Ming-Jer. 1996. “Competitor Analysis and Interfirm Rivalry: Toward a Theoretical Inte-gration.” Academy of Management Review, 21(1): 100–134.
Chetty, Raj, John N. Friedman, Nathaniel Hilger, Emmanuel Saez, Diane Whitmore Schanzen-bach, and Danny Yagan. 2011. “How Does Your Kindergarten Classroom A�ect Your Earnings?Evidence from Project Star.” The Quarterly Journal of Economics, 126(4): 1593–1660.
Christofides, Louis N., and Andrew J. Oswald. 1992. “Real Wage Determination and Rent-Sharing in Collective Bargaining Agreements.” Quarterly Journal of Economics, 107(3): 985–1002.
Ciccone, Antonio, and Elias Papaioannou. 2007. “Red Tape and Delayed Entry.” Journal of theEuropean Economic Association, 5(2-3): 444–458.
Clark, Damon, and Paco Martorell. 2014. “The Signaling Value of a High School Diploma.”Journal of Political Economy, 122(2): 282–318.
Co�man, Katherine B., Lucas C. Co�man, and Keith M. Marzilli Ericson. 2017. “The Size ofthe LGBT Population and the Magnitude of Antigay Sentiment Are Substantially Underesti-mated.” Management Science, 63(10): 3168–3186.
Cruces, Guillermo, Ricardo Perez-Truglia, and Martin Tetaz. 2013. “Biased Perceptions ofIncome Distribution and Preferences for Redistribution: Evidence from a Survey Experiment.”Journal of Public Economics, 98(C): 100–112.
Cuñat, Vicente, and Maria Guadalupe. 2009. “Executive Compensation and Competition in theBanking and Financial Sectors.” Journal of Banking & Finance, 33(3): 495–504.
Damelang, Andreas, Andreas Haupt, and Martin Abraham. 2018. “Economic Consequencesof Occupational Deregulation: Natural Experiment in the German Cra�s.” Acta Sociologica,61(1): 34–49.
Dauth, Wolfgang, and Jens Suedekum. 2016. “Globalization and Local Profiles of EconomicGrowth and Industrial Change.” Journal of Economic Geography, 16(5): 1007–1034.
Dauth, Wolfgang, Sebastian Findeisen, and Jens Suedekum. 2014. “The Rise Of The EastAnd The Far East: German Labor Markets And Trade Integration.” Journal of the EuropeanEconomic Association, 12(6): 1643–1675.
244 Microeconometric Analyses on Determinants of Individual Labour Market Outcomes

Bibliography
Dauth, Wolfgang, Sebastian Findeisen, and Jens Suedekum. 2017. “Trade and ManufacturingJobs in Germany.” American Economic Review, 107(5): 337–342.
Dauth, Wolfgang, Sebastian Findeisen, and Jens Suedekum. 2018. “Adjusting to Globalizationin Germany.” Institute for the Study of Labor (IZA) IZA Discussion Papers 11299.
Dawson, John W., and John J. Seater. 2013. “Federal Regulation and Aggregate EconomicGrowth.” Journal of Economic Growth, 18(2): 137–177.
de Quidt, Jonathan, Johannes Haushofer, and Christopher Roth. 2018. “Measuring and Bound-ing Experimenter Demand.” American Economic Review, 108(11): 3266–3302.
De Soto, Hernando. 1989. The Other Path. Harper & Row Publishers, Inc.
Degler, Eva, Thomas Liebig, and Anne-Sophie Senner. 2017. “Integrating Refugees into theLabour Market - Where Does Germany Stand?” ifo DICE Report, 15(3): 06–10.
Dellas, Harris, and Vally Koubi. 2003. “Business Cycles and Schooling.” European Journal ofPolitical Economy, 19(4): 843–859.
Deming, David J. 2017. “The Growing Importance of Social Skills in the Labor Market.” QuarterlyJournal of Economics.
Deming, David J., Noam Yuchtman, Amira Abulafi, Claudia Goldin, and Lawrence F. Katz.2016. “The Value of Postsecondary Credentials in the Labor Market: An Experimental Study.”American Economic Review, 106(3): 778–806.
d’Hombres, Bétrice, and Luca Nunziata. 2016. “Wish You Were Here? Quasi-Experimental Evi-dence on The E�ect of Education on Self-Reported Attitude Toward Immigrants.” EuropeanEconomic Review, 90: 201 – 224.
Djankov, Simeon. 2009. “The Regulation of Entry: A Survey.” World Bank Research Observer,24(2): 183–203.
Djankov, Simeon, Caralee McLiesh, and Rita Maria Ramalho. 2006. “Regulation and Growth.”Economics Letters, 92(3): 395–401.
Djankov, Simeon, Rafael La Porta, Florencio Lopez-de Silanes, and Andrei Shleifer. 2002. “TheRegulation of Entry.” Quarterly Journal of Economics, 117(1): 437–452.
Dreher, Axel, and Martin Gassebner. 2013. “Greasing the Wheels? The Impact of Regulationsand Corruption on Firm Entry.” Public Choice, 155(3-4): 413–432.
Dustmann, Christian, and Albrecht Glitz. 2011. “Migration and Education.” In Handbookof The Economics of Education. Vol. 4 of Handbook of the Economics of Education, , ed.Stephen Machin Eric A. Hanushek and Ludger Woessmann, 327 – 439. Elsevier.
Microeconometric Analyses on Determinants of Individual Labour Market Outcomes 245

Bibliography
Dustmann, Christian, and Ian P. Preston. 2007. “Racial and Economic Factors in Attitudes toImmigration.” The B.E. Journal of Economic Analysis & Policy, 7(1): 1–41.
Dustmann, Christian, Bernd Fitzenberger, Uta Schönberg, and Alexandra Spitz-Oener. 2014.“From Sick Man of Europe to Economic Superstar: Germany’s Resurgent Economy.” Journalof Economic Perspectives, 28(1): 167–88.
Dustmann, Christian, Francesco Fasani, Tommaso Frattini, Luigi Minale, and Uta Schönberg.2017. “On the Economics and Politics of Refugee Migration.” Economic Policy, 32(91): 497–550.
Ebell, Monique, and Christian Haefke. 2009. “Product Market Deregulation and the U.S. Em-ployment Miracle.” Review of Economic Dynamics, 12(3): 479–504.
Eggenberger, Christian, Miriam Rinawi, and Uschi Backes-Gellner. 2018. “Occupational Speci-ficity: A New Measurement Based on Training Curricula and its E�ect on Labour MarketOutcomes.” Labour Economics, 51: 97 – 107.
Elias, Julio J., Nicola Lacetera, and Mario Macis. 2015. “Sacred Values? The E�ect of Informationon Attitudes toward Payments for Human Organs.” American Economic Review, 105(5): 361–365.
Englmaier, Florian, and Georg Gebhardt. 2016. “Social Dilemmas in the Laboratory and in theField.” Journal of Economic Behavior & Organization, 128(C): 85–96.
Eurostat. 2016. “Asylum in the EU Member States: Record Number of Over 1.2 Million FirstTime Refugees Registered in 2015.” Eurostat News release of 4 March 2016.
Facchini, Giovanni, and Anna Maria Mayda. 2008. “From Individual Attitudes Towards Migrantsto Migration Policy Outcomes: Theory and Evidence.” Economic Policy, 23: 651–713.
Falk, Armin, Rafael Lalive, and Josef Zweimüller. 2005. “The Success of Job Applications: ANew Approach to Program Evaluation.” Labour Economics, 12(6): 739 – 748.
FDZ der statistischen Ämter des Bundes und der Länder. 2012. “Mirkozensus, Erhebungsjahre1998-2012.”
Federal Employment Agency. 1998. “Statistik der Bundesagentur für Arbeit: Klassifizierungder Berufe 1988.”
Federal Statistical O�ice. 2003. “German Classification of Economic Activities, Edition 1993(WZ 93).”
Federal Statistical O�ice. 2018a. “Arbeitslosigkeit im Zeitverlauf.”
Federal Statistical O�ice. 2018b. “Statistik der Bundesagentur für Arbeit, Arbeitslosigkeit imZeitverlauf.”
246 Microeconometric Analyses on Determinants of Individual Labour Market Outcomes

Bibliography
Felbermayr, Gabriel, and Julien Prat. 2011. “Product Market Regulation, Firm Selection, andUnemployment.” Journal of the European Economic Association, 9(2): 278–317.
Feldmann, Horst. 2008. “Business Regulation and Labor Market Performance Around theWorld.” Journal of Regulatory Economics, 33(2): 201–235.
Fernandes, Ana P., Priscila Ferreira, and L. Alan Winters. 2014. “Firm Entry Deregulation,Competition and Returns to Education and Skill.” European Economic Review, 70: 210 – 230.
Fiori, Giuseppe, Giuseppe Nicoletti, Stefano Scarpetta, and Fabio Schiantarelli. 2012. “Em-ployment E�ects of Product and Labour Market Reforms: Are there Synergies?” EconomicJournal, 122(558): F79–F104.
Fisman, Raymond, and Virginia Sarria Allende. 2010. “Regulation of Entry and the Distortionof Industrial Organization.” Journal of Applied Economics, 13(1): 91–111.
Fortin, Nicole M., and Thomas Lemieux. 1997. “Institutional Changes and Rising Wage Inequal-ity: Is There a Linkage?” Journal of Economic Perspectives, 11(2): 75–96.
Fredriksen, Kaja. 2017. “Do Legal Restrictions to Accessing Professions Impact Incomes? - TheGerman Cra�s Case.” ifh Working Paper No. 11.
Fredriksen, Kaja, Petrik Runst, and Kilian Bizer. 2018. “Masterful Meisters? Voluntary Certifica-tion and Quality in the German Cra�s Sector.” German Economic Review, forthcoming.
Gathmann, Christina, and Uta Schönberg. 2010. “How General Is Human Capital? A Task-BasedApproach.” Journal of Labor Economics, 28(1): 1–49.
Geel, Regula, Johannes Mure, and Uschi Backes-Gellner. 2011. “Specificity of occupationaltraining and occupational mobility: an empirical study based on Lazear’s skill-weightsapproach.” Education Economics, 19(5): 519–535.
Gittleman, Maury, Mark A. Klee, and Morris M. Kleiner. 2018. “Analyzing the Labor MarketOutcomes of Occupational Licensing.” Industrial Relations, 57(1): 57–100.
Giuliano, Paola, and Antonio Spilimbergo. 2014. “Growing up in a Recession.” Review of Eco-nomic Studies, 81(2): 787–817.
Goldschmidt, Deborah, and Johannes F. Schmieder. 2017. “The Rise of Domestic Outsourc-ing and the Evolution of the German Wage Structure.” Quarterly Journal of Economics,132(3): 1165–1217.
Gorman, Elizabeth H. 2005. “Gender Stereotypes, Same-Gender Preferences, and Organiza-tional Variation in the Hiring of Women: Evidence from Law Firms.” American SociologicalReview, 70(4): 702–728.
Gri�ith, Rachel, Rupert Harrison, and Gareth Macartney. 2007. “Product Market Reforms,Labour Market Institutions and Unemployment.” Economic Journal, 117(519): 142–166.
Microeconometric Analyses on Determinants of Individual Labour Market Outcomes 247

Bibliography
Gri�ith, Rachel, Rupert Harrison, and Helen Simpson. 2010. “Product Market Reform andInnovation in the EU.” Scandinavian Journal of Economics, 112(2): 389–415.
Grigorie�, Alexis, Christopher Roth, and Diego Ubfal. 2016. “Does Information Change AttitudesTowards Immigrants? Representative Evidence from Survey Experiments.” Institute for theStudy of Labor (IZA) IZA Discussion Papers 10419.
Guadalupe, Maria. 2007. “Product Market Competition, Returns to Skill, and Wage Inequality.”Journal of Labor Economics, 25(3): 439–474.
Guertzgen, Nicole. 2009. “Rent-Sharing and Collective Bargaining Coverage: Evidence fromLinked Employer-Employee Data.” Scandinavian Journal of Economics, 111(2): 323–349.
Haaland, Ingar, and Christopher Roth. 2017. “Labor Market Concerns and Support for Immi-gration.”
Hainmueller, Jens. 2012. “Entropy Balancing for Causal E�ects: A Multivariate Reweight-ing Method to Produce Balanced Samples in Observational Studies.” Political Analysis,20(1): 25–46.
Hainmueller, Jens, and Michael J. Hiscox. 2010. “Attitudes toward Highly Skilled and Low-skilled Immigration: Evidence from a Survey Experiment.” American Political Science Review,104(01): 61–84.
Hampf, Franziska, and Ludger Woessmann. 2017. “Vocational vs. General Education andEmployment over the Life Cycle: New Evidence from PIAAC.” CESifo Economic Studies,63(3): 255–269.
Hans-Böckler Foundation. 2018. “Collective Agreement Database.”
Hanushek, Eric A., and Ludger Woessmann. 2006. “Does Educational Tracking A�ect Perfor-mance and Inequality? Di�erences- in-Di�erences Evidence Across Countries.” EconomicJournal, 116(510): 63–76.
Hanushek, Eric A., and Ludger Woessmann. 2008. “The Role of Cognitive Skills in EconomicDevelopment.” Journal of Economic Literature, 46(3): 607–68.
Hanushek, Eric A., Guido Schwerdt, Ludger Woessmann, and Lei Zhang. 2017a. “GeneralEducation, Vocational Education, and Labor-Market Outcomes over the Lifecycle.” Journalof Human Resources, 52(1): 48–87.
Hanushek, Eric A., Guido Schwerdt, Simon Wiederhold, and Ludger Woessmann. 2015.“Returns to Skills Around the World: Evidence from PIAAC.” European Economic Review,73(C): 103–130.
Hanushek, Eric A., Guido Schwerdt, Simon Wiederhold, and Ludger Woessmann. 2017b. “Cop-ing With Change: International Di�erences in The Returns to Skills.” Economics Letters,153: 15 – 19.
248 Microeconometric Analyses on Determinants of Individual Labour Market Outcomes

Bibliography
Hastings, Justine, Christopher Neilson, and Seth D. Zimmerman. 2013. “Are Some DegreesWorth More than Others? Evidence from college admission cuto�s in Chile.” National Bureauof Economic Research, Inc NBER Working Papers 19241.
Heckman, James J. 2000. “Policies to Foster Human Capital.” Research in Economics, 54(1): 3–56.
Heckman, James J., Hidehiko Ichimura, and Petra E. Todd. 1997. “Matching as an EconometricEvaluation Estimator: Evidence from Evaluating a Job Training Programme.” Review ofEconomic Studies, 64(4): 605–654.
Heckman, James J., Hidehiko Ichimura, Je�rey Smith, and Petra Todd. 1998. “CharacterizingSelection Bias Using Experimental Data.” Econometrica, 66(5): 1017–1098.
Heckman, James, John Humphries, and Nicholas S. Mader. 2011. “The GED.” In . Vol. 3. 1 ed., ,ed. Erik Hanushek, Stephen Machin and Ludger Woessmann, Chapter 09, 423–483. Elsevier.
Heckman, James, Jora Stixrud, and Sergio Urzua. 2006. “The E�ects of Cognitive and Noncog-nitive Abilities on Labor Market Outcomes and Social Behavior.” Journal of Labor Economics,24(3): 411–482.
Heckman, James, Lance Lochner, and Petra Todd. 2006. “Earnings Functions, Rates of Returnand Treatment E�ects: The Mincer Equation and Beyond.” In . Vol. 1. 1 ed., , ed. Erik Hanushekand F. Welch, Chapter 07, 307–458. Elsevier.
Heineck, Guido, and Silke Anger. 2010. “The Returns to Cognitive Abilities and PersonalityTraits in Germany.” Labour Economics, 17(3): 535–546.
Heinz, Matthias, and Heiner Schumacher. 2017. “Signaling Cooperation.” European EconomicReview, 98(C): 199–216.
Hershbein, Brad. 2009. “Persistence in Labor Supply E�ects of Graduating in a Recession: TheCase of High School Women.” mimeo.
Hildreth, Andrew K. G., and Andrew J. Oswald. 1997. “Rent-Sharing and Wages: Evidence fromCompany and Establishment Panels.” Journal of Labor Economics, 15(2): 318–337.
Hirsch, Barry T. 1993. “Trucking Deregulation and Labor Earnings: Is the Union Premium aCompensating Di�erential?” Journal of Labor Economics, 11(2): 279–301.
Hirsch, Barry T., and David A. Macpherson. 2000. “Earnings, Rents, and Competition in theAirline Labor Market.” Journal of Labor Economics, 18(1): 125–155.
Humburg, Martin, and Rolf van der Velden. 2015. “Skills and The Graduate Recruitment Process:Evidence From Two Discrete Choice Experiments.” Economics of Education Review, 49: 24 –41.
Microeconometric Analyses on Determinants of Individual Labour Market Outcomes 249

Bibliography
Jeworrek, Sabrina, Bernd Josef Leisen, and Vanessa Mertins. 2017. “Gi�-Exchange in Societyand Individuals’ Attitudes toward Supporting the Integration of Immigrants.”
Kahn, Lisa B. 2010. “The Long-Term Labor Market Consequences of Graduating From Collegein a Bad Economy.” Labour Economics, 17(2): 303–316.
Kaplan, David S., Eduardo Piedra, and Enrique Seira. 2011. “Entry Regulation and BusinessStart-Ups: Evidence from Mexico.” Journal of Public Economics, 95(11-12): 1501–1515.
Karadja, Mounir, Johanna Mollerstrom, and David Seim. 2017. “Richer (and Holier) Than Thou?The E�ect of Relative Income Improvements on Demand for Redistribution.” The Review ofEconomics and Statistics, 99(2): 201–212.
Kübler, Dorothea, and Julia Schmid. 2015. “Take Your Time to Grow: A Field Experiment OnThe Hiring of Youths in Germany.” Social Science Research Center Berlin (WZB) DiscussionPapers, Research Unit: Market Behavior SP II 2015-205.
Kirkeboen, Lars J., Edwin Leuven, and Magne Mogstad. 2016. “Field of Study, Earnings, andSelf-Selection.” The Quarterly Journal of Economics, 131(3): 1057–1111.
Klapper, Leora, Luc Laeven, and Raghuram Rajan. 2006. “Entry Regulation as a Barrier toEntrepreneurship.” Journal of Financial Economics, 82(3): 591 – 629.
Kleiner, Morris M. 2000. “Occupational Licensing.” Journal of Economic Perspectives, 14(4): 189–202.
Kleiner, Morris M., and Alan B. Krueger. 2013. “Analyzing the Extent and Influence of Occupa-tional Licensing on the Labor Market.” Journal of Labor Economics, 31(S1): S173–S202.
Koch, Andreas, and Sebastian Nielen. 2016. “Ökonomische Wirkungen der Handwerksnov-elle 2004: Ergebnisse aus einem quasinatürlichen Experiment.” Institut für Mittelstands-forschung (IfM) Bonn Working Papers 07/16.
Koedel, Cory, and Eric Tyhurst. 2012. “Math Skills and Labor-Market Outcomes: Evidence froma Resume-based Field Experiment.” Economics of Education Review, 31(1): 131–140.
Koeniger, Winfried, and Julien Prat. 2007. “Employment Protection, Product Market Regulationand Firm Selection.” Economic Journal, 117(521): F302–F332.
Krueger, Dirk, and Krishna B. Kumar. 2004. “Skill-Specific rather than General Education: AReason for US–Europe Growth Di�erences?” Journal of Economic Growth, 9(2): 167–207.
Kugler, Franzsika, Marc Piopiunik, and Ludger Woessmann. 2017. “Bildung hat Zukun� - Bil-dungsstudie 2017.”
Kuziemko, Ilyana, Michael I. Norton, Emmanuel Saez, and Stefanie Stantcheva. 2015. “HowElastic Are Preferences for Redistribution? Evidence from Randomized Survey Experiments.”American Economic Review, 105(4): 1478–1508.
250 Microeconometric Analyses on Determinants of Individual Labour Market Outcomes

Bibliography
Lahey, Joanna N., and Douglas Oxley. 2016. “Discrimination at the Intersection of Age, Race,and Gender: Evidence from a Lab-in-the-Field Experiment.” Mimeo.
Lang, Kevin, and Michael Manove. 2011. “Education and Labor Market Discrimination.” Ameri-can Economic Review, 101(4): 1467–96.
Lazear, Edward P. 2009. “Firm-Specific Human Capital: A Skill-Weights Approach.” Journal ofPolitical Economy, 117(5): 914–940.
Lenz, Gabriel S. 2009. “Learning and Opinion Change, Not Priming: Reconsidering the PrimingHypothesis.” American Journal of Political Science, 53(4): 821–837.
Lergetporer, Philipp, Guido Schwerdt, Katharina Werner, and Ludger Woessmann. 2016. “In-formation and Preferences for Public Spending: Evidence from Representative SurveyExperiments.” CESifo Group Munich CESifo Working Paper Series 5938.
Lergetporer, Philipp, Jens Ruhose, and Lisa Simon. 2018. “Labor Market E�ects of DeregulatingEntry Barriers in the Cra�s Sector.”
Lergetporer, Philipp, Katharina Werner, and Ludger Woessmann. 2017. “Public Opinion onEducation Policy in Germany.” CESifo Group Munich CESifo Working Paper Series 6602.
Levy, Frank, and Richard J Murnane. 1992. “U.S. Earnings Levels and Earnings Inequality:A Review of Recent Trends and Proposed Explanations.” Journal of Economic Literature,30(3): 1333–81.
Lindqvist, Erik, and Roine Vestman. 2011. “The Labor Market Returns to Cognitive and Noncog-nitive Ability: Evidence from the Swedish Enlistment.” American Economic Journal: AppliedEconomics, 3(1): 101–28.
Liu, Kai, Kjell G. Salvanes, and Erik Ø. Sørensen. 2012. “Good Skills in Bad Times: Cyclical SkillMismatch and the Long-Term E�ects of Graduating in a Recession.” IZA Discussion Paper, ,(6820).
Liu, Shimeng, Weizeng Sun, and John Winters. 2017. “Up in STEM, Down in Business: ChangingCollege Major Decisions with the Great Recession.” Institute for the Study of Labor (IZA) IZADiscussion Papers 10996.
Luethi, Samuel, and Stefan Wolter. 2018. “Are Apprenticeships Business Cycle Proof?” Uni-versity of Zurich, Department of Business Administration (IBW) Economics of EducationWorking Paper Series 0146.
Lummis, Max, and Harlod Stevenson. 1990. “Gender Di�erences in Beliefs and Achievement:A Cross-Cultural Study.” Developmental Psychology, 26(2): 254–263.
MacDonald, James M., and Linda C. Cavalluzzo. 1996. “Railroad Deregulation: Pricing Reforms,Shipper Responses, and the E�ects on Labor.” ILR Review, 50(1): 80–91.
Microeconometric Analyses on Determinants of Individual Labour Market Outcomes 251

Bibliography
Macleod, W. Bentley, Evan Riehl, Juan E. Saavedra, and Miguel Urquiola. 2017. “The Big Sort:College Reputation and Labor Market Outcomes.” American Economic Journal: AppliedEconomics, 9(3): 223–61.
Majumdar, Sumit K. 2015. “Competitor Entry Impact on Jobs and Wages in Incumbent Firms:Retrospective Evidence from a Natural Experiment.” Business and Politics, 17(2): 291–326.
Malmendier, Ulrike, and Stefan Nagel. 2011. “Depression Babies: Do Macroeconomic Experi-ences A�ect Risk Taking?” The Quarterly Journal of Economics, 126(1): 373–416.
Mayda, Anna Maria. 2006. “Who Is Against Immigration? A Cross-Country Investigation ofIndividual Attitudes toward Immigrants.” The Review of Economics and Statistics, 88(3): 510–530.
Mueller, Gerrit, and Erik Plug. 2006. “Estimating the E�ect of Personality on Male and FemaleEarnings.” ILR Review, 60(1): 3–22.
Mukoyama, Toshihiko, and Latchezar Popov. 2014. “The Political Economy of Entry Barriers.”Review of Economic Dynamics, 17(3): 383–416.
Mullainathan, Sendhil, and Philipp Schnabl. 2010. “Does Less Market Entry Regulation Gen-erate More Entrepreneurs? Evidence from a Regulatory Reform in Peru.” In InternationalDi�erences in Entrepreneurship. , ed. Josh Lerner and Antoinette Schoar, Chapter 5, 15–177.University of Chicago Press.
Müller, Klaus. 2014. Stabilität und Ausbildungsbereitscha� von Existenzgründungen im Handw-erk. Vol. Göttinger Handwerkswirtscha�liche Studien, Band 94, Deutsches Handwerksinsti-tut.
Müller, Klaus. 2016. “Economic E�ects of Deregulation - Using the Example of the RevisedTrade and Cra�s Code 2004.” ifh Working Paper No. 5.
Mulligan, Casey B. 1999. “Galton versus the Human Capital Approach to Inheritance.” Journalof Political Economy, 107(S6): S184–S224.
Mummolo, Jonathan, and Erik Peterson. 2018. “Demand E�ects in Survey Experiments: AnEmpirical Assessment.” American Political Science Review.
Murnane, Richard, John B Willett, and Frank Levy. 1995. “The Growing Importance of CognitiveSkills in Wage Determination.” The Review of Economics and Statistics, 77(2): 251–66.
Nagler, Markus, Marc Piopiunik, and Martin R. West. 2015. “Weak Markets, Strong Teachers:Recession at Career Start and Teacher E�ectiveness.” National Bureau of Economic ResearchWorking Paper 21393.
Neal, Derek A., and William R. Johnson. 1996. “The Role of Premarket Factors in Black-WhiteWage Di�erences.” Journal of Political Economy, 104(5): 869–895.
252 Microeconometric Analyses on Determinants of Individual Labour Market Outcomes

Bibliography
Nelson, Richard R., and Edmund S. Phelps. 1966. “Investment in Humans, TechnologicalDi�usion, and Economic Growth.” The American Economic Review, 56(1/2): 69–75.
Neumark, David. 2016. “Experimental Research on Labor Market Discrimination.” NationalBureau of Economic Research Working Paper 22022.
Neumark, David. 2018. “Experimental Research on Labor Market Discrimination.” Journal ofEconomic Literature, 56(3): 799–866.
Nyhan, Brendan, and Jason Reifler. 2010. “When Corrections Fail: The Persistence of PoliticalMisperceptions.” 32: 303–330.
OECD. 2016. “Education at a Glance 2016: OECD Indicators.” OECD, Paris.
Ogilvie, Sheilagh. 2004. “Guilds, E�iciency, and Social Capital: Evidence from German Proto-Industry.” The Economic History Review, 57(2): 286–333.
Ogilvie, Sheilagh. 2014. “The Economics of Guilds.” Journal of Economic Perspectives,28(4): 169–192.
Oreopoulos, Philip. 2011. “Why Do Skilled Immigrants Struggle in the Labor Market? A FieldExperiment with Thirteen Thousand Resumes.” American Economic Journal: EconomicPolicy, 3(November): 148–171.
Oreopoulos, Philip, and Uros Petronijevic. 2013. “Making College Worth It: A Review of Re-search on the Returns to Higher Education.” National Bureau of Economic Research WorkingPaper 19053.
Oreopoulos, Philip, Till von Wachter, and Andrew Heisz. 2012. “The Short- and Long-TermCareer E�ects of Graduating in a Recession.” American Economic Journal: Applied Economics,4(1): 1–29.
O’Rourke, Kevin H., and Richard Sinnott. 2006. “The Determinants of Individual AttitudesTowards Immigration.” European Journal of Political Economy, 22(4): 838 – 861.
Osborne, Melissa, Herbert Gintis, and Samuel Bowles. 2001. “The Determinants of Earnings: ABehavioral Approach.” Journal of Economic Literature, 39(4): 1137–1176.
Ottaviano, Gianmarco I. P., and Giovanni Peri. 2012. “Rethinking the E�ect of Immigration onWages.” Journal of the European Economic Association, 10(1): 152–197.
Oyer, Paul. 2006. “Initial Labor Market Conditions and Long-Term Outcomes for Economists.”The Journal of Economic Perspectives, 20(3): 143–160.
Peltzman, Sam. 1976. “Toward a More General Theory of Regulation.” Journal of Law andEconomics, 19(2): 211–240.
Microeconometric Analyses on Determinants of Individual Labour Market Outcomes 253

Bibliography
Peoples, James. 1998. “Deregulation and the Labor Market.” Journal of Economic Perspectives,12(3): 111–130.
Posner, Richard A. 1975. “The Social Costs of Monopoly and Regulation.” Journal of PoliticalEconomy, 83(4): 807–828.
Prantl, Susanne. 2012. “The Impact of Firm Entry Regulation on Long-Living Entrants.” SmallBusiness Economics, 39(1): 61–76.
Prantl, Susanne, and Alexandra Spitz-Oener. 2009. “How Does Entry Regulation Influence EntryInto Self-Employment and Occupational Mobility?” Economics of Transition, 17(4): 769–802.
Protsch, Paula, and Heike Solga. 2015. “How Employers Use Signals of Cognitive and Noncog-nitive Skills at Labour Market Entry: Insights from Field Experiments.” European SociologicalReview, 31(5): 521.
Raaum, Oddbjørn, and Knut Røed. 2006. “Do Business Cycle Conditions at the Time of LaborMarket Entry A�ect Future Employment Prospects?” The Review of Economics and Statistics,88(2): 193–210.
Rich, Judith. 2014. “What Do Field Experiments of Discrimination in Markets Tell Us? A MetaAnalysis of Studies Conducted since 2000.” Institute for the Study of Labor (IZA) IZA Discus-sion Papers 8584.
Riley, John G. 2001. “Silver Signals: Twenty-Five Years of Screening and Signaling.” Journal ofEconomic Literature, 39(2): 432–478.
Rinne, Ulf, and Klaus F. Zimmermann. 2012. “Another Economic Miracle? The German LaborMarket and the Great Recession.” IZA Journal of Labor Policy, 1(3): 1–21.
Roemer, John.E. 1998. Equality of Opportunity. Harvard University Press.
Romano, Joseph P., and Michael Wolf. 2005. “Stepwise Multiple Testing as Formalized DataSnooping.” Econometrica, 73(4): 1237–1282.
Rose, Nancy L. 1987. “Labor Rent Sharing and Regulation: Evidence from the Trucking Industry.”Journal of Political Economy, 95(6): 1146–1178.
Rostam-Afschar, Davud. 2014. “Entry Regulation and Entrepreneurship: A Natural Experimentin German Cra�smanship.” Empirical Economics, 47(3): 1067–1101.
Ru�le, Bradley, and Ze’ev Shtudiner. 2015. “Are Good-Looking People More Employable?”Management Science, 61(8): 1760–1776.
Runst, Petrik, Jörg Thomä, Katarzyna Haverkamp, and Klaus Müller. 2018a. “A Replication of‘Entry Regulation and Entrepreneurship: A Natural Experiment in German Cra�smanship’.”Empirical Economics, forthcoming.
254 Microeconometric Analyses on Determinants of Individual Labour Market Outcomes

Bibliography
Runst, Petrik, Kaja Fredriksen, Till Proeger, Katarzyna Haverkamp, and Jörg Thomä. 2018b.“Handwerksordnung: ökonomische E�ekte der Deregulierung von 2004.” Wirtscha�sdienst,98(5): 365–371.
Rusinek, Michael, and François Rycx. 2013. “Rent-Sharing under Di�erent Bargaining Regimes:Evidence from Linked Employer-Employee Data.” British Journal of Industrial Relations,51(1): 28–58.
RWI. 2012. “Analyse der Ergebnisse der Unternehmensregisterauswertung Handwerk 2008.”
Ryan, Paul. 2003. “Evaluating Vocationalism.” European Journal of Education, 38(2): 147–162.
Ryan, Paul, and Lorna Unwin. 2001. “Apprenticeship in the British ‘Training Market’.” NationalInstitute Economic Review, 178(1): 99–114.
Schaumans, Catherine, and Frank Verboven. 2008. “Entry and Regulation: Evidence FromHealth Care Professions.” RAND Journal of Economics, 39(4): 949–972.
Scheve, Kenneth F., and Matthew J. Slaughter. 2001. “Labor Market Competition And IndividualPreferences Over Immigration Policy.” The Review of Economics and Statistics, 83(1): 133–145.
Schäfer, Armin, Robert Vehrkamp, and Jérémie Felix Gagné. 2013. “Prekäre Wahlen, Milieusund Soziale Selektivität der Wahlbeteiligung bei der Bundestagswahl 2013.” Bertelsman-Sti�ung.
Schivardi, Fabiano, and Eliana Viviano. 2011. “Entry Barriers in Retail Trade.” Economic Journal,121(551): 145–170.
Schlotter, Martin, Guido Schwerdt, and Ludger Woessmann. 2011. “Econometric Methods forCausal Evaluation of Education Policies and Practices: A Non-Technical Guide.” EducationEconomics, 19(2): 109–137.
Schmucker, Alexandra, Stefan Seth, Johannes Ludsteck, Johanna Eberle, and Andreas Ganzer.2016. “Establishment History Panel (BHP)1975-2014.” IAB FDZ data report, 03/2016 (en),Nuremberg.
Schueler, Beth E., and Martin R. West. 2016. “Sticker Shock: How Information A�ects CitizenSupport for Public School Funding.” Public Opinion Quarterly, 80(1): 90–113.
Schultz, Theodore W. 1975. “The Value of the Ability to Deal with Disequilibria.” Journal ofEconomic Literature, 13(3): 827–846.
Schwerdt, Guido, and Ludger Woessmann. 2017. “The Information Value of Central SchoolExams.” Economics of Education Review, 56(C): 65–79.
Spence, Michael. 1973. “Job Market Signaling.” The Quarterly Journal of Economics, 87(3): 355–374.
Microeconometric Analyses on Determinants of Individual Labour Market Outcomes 255

Bibliography
Spitz-Oener, Alexandra. 2006. “Technical Change, Job Tasks, and Rising Educational Demands:Looking outside the Wage Structure.” Journal of Labor Economics, 24(2): 235–270.
Statistisches Bundesamt. 2016. “Produzierendes Gewerbe. Unternehmen, tätige Personenund Umsatz im Handwerk – Jahresergebnisse 2013.”
Statistisches Bundesamt. 2018a. “Arbeitslosigkeit im Zeitverlauf.”
Statistisches Bundesamt. 2018b. “Bildungsstand der Bevölkerung - Ergebnisse des Mikrozen-sus 2016.”
Steinmayr, Andreas. 2016. “Exposure to Refugees and Voting for the Far-Right: (Unexpected)Results from Austria.” Institute for the Study of Labor (IZA) IZA Discussion Papers 9790.
Stigler, George J. 1971. “The Theory of Economic Regulation.” Bell Journal of Economics andManagement Science, 2(1): 3–21.
Stiglitz, Joseph E. 1975. “The Theory of Screening, Education, and the Distribution of Income.”American Economic Review, 65(3): 283–300.
Stockinger, Bastian, and Thomas Zwick. 2017. “Apprentice Poaching in Regional Labor Mar-kets.”
Tatsiramos, Konstantinos. 2009. “Geographic Labour Mobility and Unemployment Insurancein Europe.” Journal of Population Economics, 22(2): 267–283.
The Economist. 2004. “Germany on the Mend.”
Todd, Petra E. 2008. “Evaluating Social Programs with Endogenous Program Placement andSelection of the Treated.” In Handbook of Development Economics. . 4 ed., , ed. T. Paul Schultzand John A. Strauss, Chapter 60, 3847–3894. Elsevier B.V.
Tyler, John H., Richard J. Murnane, and John B. Willett. 2000. “Estimating the Labor MarketSignaling Value of the GED.” The Quarterly Journal of Economics, 115(2): 431–468.
UNHCR. 2015. “Syrian Refugee Arrivals in Greece: Preliminary Questionnaire Findings.” UNHCR.
von Redetzky, Marie-Claire, and Kristina Stoewe. 2016. “Flüchtlinge - Bildungsstand syrischerFlüchtlinge - 5 Gerüchte auf dem Prüfstand.” IW Köln.
Weeden, Kim A. 2002. “Why Do Some Occupations Pay More than Others? Social Closure andEarnings Inequality in the United States.” American Journal of Sociology, 108(1): 55–101.
Weinberger, Catherine J. 2014. “The Increasing Complementarity between Cognitive andSocial Skills.” The Review of Economics and Statistics, 96(5): 849–861.
Weiss, Andrew. 1995. “Human Capital vs. Signalling Explanations of Wages.” Journal of Eco-nomic Perspectives, 9(4): 133–154.
256 Microeconometric Analyses on Determinants of Individual Labour Market Outcomes

Bibliography
Welch, F. 1970. “Education in Production.” Journal of Political Economy, 78(1): 35–59.
Wiswall, Matthew, and Basit Zafar. 2015. “Determinants of College Major Choice: Identificationusing an Information Experiment.” Review of Economic Studies, 82(2): 791–824.
Woessmann, Ludger. 2016. “Bildung als Schlüssel zur Integration: Nur eine realistischeFlüchtlingspolitik wird Erfolg haben.” ifo Institute ifo Schnelldienst 69(1).
Wolter, Stefan, and Paul Ryan. 2011. “Apprenticeship.” In . Vol. 3. 1 ed., , ed. Erik Hanushek,Stephen Machin and Ludger Woessmann, Chapter 11, 521–576. Elsevier.
Wooldridge, Je�rey. 2008. Introductory Econometrics: A Modern Approach (with EconomicApplications, Data Sets, Student Solutions Manual Printed Access Card). . 4 ed., South-WesternCollege Pub.
Wozniak, Abigail K. 2007. “Product Markets and Paychecks: Deregulation’s E�ect on the Com-pensation Structure in Banking.” ILR Review, 60(2): 246–267.
Yakovlev, Evgeny, and Ekaterina Zhuravskaya. 2013. “The Unequal Enforcement of Liberal-ization: Evidence from Russia’s Reform of Business Regulation.” Journal of the EuropeanEconomic Association, 11(4): 808–838.
ZDH. 2014. “Daten und Fakten zum Handwerk für das Jahr 2014.”
Zizzo, Daniel. 2010. “Experimenter Demand E�ects in Economic Experiments.” ExperimentalEconomics, 13(1): 75–98.
Zwiener, Hanna Sarah. 2017. “Essays on the German Labor Market.” PhD diss. HU Berlin.
Microeconometric Analyses on Determinants of Individual Labour Market Outcomes 257

Lisa K. Simon
PERSONALINFORMATION
Born: 24th April 1990 in Hamburg Citizenship: GermanEmail: [email protected] Website:https://sites.google.com/site/lisaksimon
EDUCATION PhD in Economics Sept 2014 - Jan 2019Ludwig-Maximilans University Munich, GermanyMGSE Doctoral Programme, 1st Advisor: Ludger Woessmann2nd Advisor: Davide Cantoni, 3rd Advisor: Guido SchwerdtTitle: Microeconometric Analyses on Determinants of Individual Labour MarketOutcomes, grade: summa cum laudeVisiting Scholar Sep 2016 - Jun 2017UC Berkeley, Institute for Research on Labor and EmploymentSponsor: Jesse Rothstein; Funding: DAAD Scholarship
MSc Economics and Public Policy Sep 2012 - Jul 2014SciencesPo Paris, Polytechnique, ENSAE ParisTech, FranceCo-winner of Best Master Thesis for 2013/14
BA Hons Economics and International Relations Oct 2009 - Jun 2012Lancaster University, UKGraduated with First Class Honours, Top 1 on Programme
ACADEMIC EXPERIENCE Doctoral Student and Junior Economist, Sep 2014 - Feb 2019ifo Institute, Munich
Research stay at French Ministry of Health, Jan 2014 - Jul 2014DREES (Direction for Research, Studies, Evaluation and Statistics), Paris
Research Assistant to Nicolas Jacquemet, Oct 2013 - Jul 2014Experimental Economics, Paris School of Economics
Research stay at OECD, Health Division Apr 2013 - Aug 2013Directorate for Employment, Labour and Social A�airs, Paris
PROFESSIONALEXPERIENCE
PwC Advisory, Internship Jul 2011 - Oct 2011Pharma & Healthcare Consulting, MunichEuropean Parliament, Internship Aug 2010 - Oct 2010Assistant to MEP Dr. Thomas Ulmer EPP
LANGUAGES German (native), Polish (native), English (fluent), French (fluent)
SOFTWARE Stata, R, Excel VBA , LATEX, Microso� O�ice, Qualtrics
CONFERENCES 30th European Association of Labour Economics Conference (EALE), Lyon, 2018; American EconomicAssociation meetings, Philadelphia, January 2018; Verein für Socialpolitik Annual Conference, Vienna,2017; 29th European Association of Labour Economics Conference (EALE), St.Gallen, 2017; 23nd An-nual Congress of the European Economic Association (EEA), Lissabon 2017; 22nd Annual Meeting So-ciety of Labor Economics (SOLE), Raleigh, NC 2017; 30th Annual Conference of the European Societyfor Population Economics (ESPE), Berlin 2016; 24th European Workshop on Econometrics and HealthEconomics, Paris 2015; International Conference on Cultural Diplomacy and the UN, participant, NewYork and Washington D.C. 2012
SCHOLARSHIPS - Bernt Rohrer Foundation Publication Stipend for PhD Students in their final year (add-on stipend of500 Euro monthly), October 2017-October 2018
- German Academic Exchange Service (DAAD): 9 months scholarship for PhD students visiting a US De-partment, September 2016 - May 2017
TEACHING - Supervisor for undergraduate students writing Bachelorthesis, winter semester 2017/2018 and 2018/2019LMU
- Supervisor for undergraduate academic writing seminar, winter semester 2017/2018 LMU and summersemester 2016 LMU
- Teaching assistant undergraduate lecture “Economics of Education” (in German) winter semster 2015/2016LMU
REFEREEING - “Educational Research and Evaluation”


![INSTITUT AGAMA ISLA]YI NEGERI](https://static.fdokumen.com/doc/165x107/6313aa03b1e0e0053b0e7909/institut-agama-islayi-negeri.jpg)