CESifo Dice Report 2/2011 - ifo Institut
84
CESifo oint initiative of Ludwig-Maximilians-Universität and the Ifo Institute for Economic Research Reform Model Database Forum Research Reports News CORRUPTION Arvind K. Jain Stephen D. Morris Toke S. Aidt Eric M. Uslaner Johann Graf Lambsdorff Robert Klitgaard ENDING MILITARY CONSCRIPTION EU EASTERN ENLARGEMENT INSURANCE CROWDING OUT SCHOOL CHOICE IN THE NETHERLANDS FINANCIAL INCLUSION INSURANCE AND HEALTHCARE ACCESS PENSION POLICIES WORK-FAMILIY BALANCE FREE MOVEMENT OF LABOUR PENSION ACCOUNTING NEW AT DICE DATABASE CONFERENCES ,BOOKS Panu Poutvaara and Andreas Wagener Timo Baas and Herbert Brücker Joan Costa-Font Harry Anthony Patrinos The international platform of Ludwig-Maximilians University’s Center for Economic Studies and the Ifo Institute for Economic Research, Munich V OLUME 9, N O .2 S UMMER 2011 DICE REPORT Journal for Institutional Comparisons
-
Upload
khangminh22 -
Category
Documents
-
view
13 -
download
0
Transcript of CESifo Dice Report 2/2011 - ifo Institut
CESifo
oint initiative of Ludwig-Maximilians-Universität and the Ifo Institute for Economic Research
Reform Model
Database
Forum
Research Reports
News
CORRUPTION
Arvind K. JainStephen D. MorrisToke S. AidtEric M. UslanerJohann Graf LambsdorffRobert Klitgaard
ENDING MILITARY CONSCRIPTION
EU EASTERN ENLARGEMENT
INSURANCE CROWDING OUT
SCHOOL CHOICE IN THENETHERLANDS
FINANCIAL INCLUSION
INSURANCE AND HEALTHCARE ACCESS
PENSION POLICIES
WORK-FAMILIY BALANCE
FREE MOVEMENT OF LABOUR
PENSION ACCOUNTING
NEW AT DICE DATABASE
CONFERENCES, BOOKS
Panu Poutvaara andAndreas WagenerTimo Baas andHerbert BrückerJoan Costa-Font
Harry Anthony Patrinos
The international platform of Ludwig-Maximilians University’s Center for Economic Studies and the Ifo Institute for Economic Research, Munich
VO L U M E 9, N O . 2 S U M M E R 2011
DICE REPORTJournal for Institutional Comparisons
CESifo DICE Report ISSN 1612-0663 (print version)ISSN 1613-6373 (electronic version)A quarterly journal for institutional comparisonsPublisher and distributor: Ifo Institute for Economic Research e.V.Poschingerstr. 5, D-81679 Munich, GermanyTelephone ++49 89 9224-0, Telefax ++49 89 9224-1462, e-mail [email protected] subscription rate: n50.00Editors: Silke Friedrich, Christa Hainz, Wolfgang Ochel Editor of this issue: Wolfgang Ochel ([email protected])Copy editing: Anne Heritage, Paul Kremmel Reproduction permitted only if source is stated and copy is sent to the Ifo Institute.
DICE Database: www.cesifo-group.de/DICE

Volume 9, Number 2 Summer 2011_____________________________________________________________________________________
CORRUPTION
Corruption: Theory, Evidence and PolicyArvind K. Jain 3
Forms of CorruptionStephen D. Morris 10
The Causes of CorruptionToke S. Aidt 15
Corruption and InequalityEric M. Uslaner 20
Economic Approaches to AnticorruptionJohann Graf Lambsdorff 25
Fighting CorruptionRobert Klitgaard 31
Ending Military ConscriptionPanu Poutvaara and Andreas Wagener 36
EU Eastern Enlargement: The Benefits from Integration and Free Labour MovementTimo Baas and Herbert Brücker 44
Insurance Crowding Out and Long-Term Care PartnershipsJoan Costa-Font 52
School Choice in The NetherlandsHarry Anthony Patrinos 55
Financial Inclusion: Reforms in the Areas of Consumer Protection and Financial Literacy 60Health Insurance Cost Sharing and Differences in Healthcare Access and Cost by Incomein Eleven Countries 62Pension Policies – Pensionable Age and Life Expectancy 66Work-family Balance in an European Comparison 69Free Movement of Labour in the EU 71Pension Accounting 74
New at DICE Database, Conferences, Books 77
Forum
Research Reports
Database
News
Reform Model
DICE Report


CESifo DICE Report 2/20113
Forum
CORRUPTION: THEORY,EVIDENCE AND POLICY
ARVIND K. JAIN*
Given temptation, it is surprising that corruption isnot more prevalent. In an environment where wealthis the most important measure of success, can publicofficials be blamed for wanting to enrich themselvesby exploiting their powers? By definition, corruptionis: “… acts in which public power is used for person-al gains in a manner that contravenes the rules of thegame” (Jain 2001, 73). If corruption has been con-trolled, it is due to the ability of civil society and pub-lic institutions to check the behavior of public offi-cials. When unchecked, corruption is accompaniedby misallocation of resources, economic stagnation,social and economic disparities and, eventually, po-litical violence. The first decade of this century pro-vides ample casual evidence of these effects. Haiti,with a legacy of corrupt leaders, remains one of thepoorest countries in the world; Nigeria, despite its oilreserves, has a stagnant economy; 40 percent of thepopulation in India lives below poverty line while therichest family in the country builds a two-billion-dol-lar family residence; Tunisia, in spite of respectablegrowth rates for a number of years, found its corruptleader unceremoniously overthrown in early 2011.
To understand corruption, we must first recognizewhat form corruption takes, what allows it to thrive,what consequences it can have on the society andwhat measures have been successful in controllingcorruption.
What is corruption?
Like the heads of Hydra’s dragon, corruption pre-sents itself in many shapes though all originate fromthe same body politic. Forms of corruption differ fromone another in terms of both the source of power that
is exploited and the impact they have on the econo-my and the society. Let us look at two forms of cor-ruption, each occupying extreme positions on a scaleof corrupt activities. At one end is a somewhat be-nign example, such as a doorman asking for a smalltip to let you into the office.At the other end, we finda more malignant example of a leader treating soci-ety’s assets as personal property.
Most people are exposed to corruption in its benignform when they have to pay a bribe to receive a ser-vice from a government official. Quite often, the ser-vice would have been a right of the citizen; the bu-reaucrat may merely have discretion over imposingsome costs (in the form of delays and opportunitycosts of permit denial) on the citizen before grantingthe service. A bribe is demanded to reduce that cost.This form of bureaucratic corruption usually occursonce a regulatory regime has been determined andthe resource allocation decisions have been made –the bureaucrat is, in fact, interfering with the imple-mentation of decisions.
Economic models of bureaucratic corruption musttackle issues of information asymmetry (which agentsare corrupt and which will participate in propagatingcorruption) and uncertainties about costs (associatedwith probabilities and penalties of detection, as well aswith the purchase of loyalties of other agents) in addi-tion to all the usual unknowns such as demand andsupply. Rose-Ackerman (1978), Shleifer and Vishny(1993), Dabla-Norris (2002), Ahlin and Bose (2007),Lambert-Mogiliansky et al. (2007), among many oth-ers, provide examples of such models. Acemoglu andVerdier (2000) illustrate the role of corruption in gov-ernments’ attempts to correct market failures.
At the other extreme, “political” or “grand” corrup-tion arises from a rogue dictator’s control over acountry’s resource allocation and expenditure deci-sions. This leader will maximize his personal wealthrather than the welfare of the population. Of neces-sity, he will have to have acquired an almost com-plete control of political powers within the country.A portion of the wealth amassed through corruptionis used to purchase the loyalty of those who will helpthe dictator remain in power and to undermine the
CORRUPTION
* Concordia University, Montreal.

civic society and public institutions that may rise inopposition. This form of corruption leads to a misal-location of resources and an extreme degree of con-centration of wealth into the hands of a few. Exam-ples of this form of corruption abound. Zaire’s econ-omy stagnated, and the country was left in economicand political turmoil upon the departure of its cor-rupt leader – Mobutu. In Iraq, Saddam Hussein re-sorted to corruption in order to prevent the devel-opment of civic groups that could oppose his regime.The chaos that followed his departure was due, inpart, to a complete vacuum of political institutions inthe country.
Some dictators may appear to have a “benevolent”side to them, corruption is accompanied by sharingsome of the wealth with the population. SaddamHussein ensured that Iraqi citizens received educa-tion and health care while amassing an estimated USD 10 to 40 billion in personal wealth. During thenearly thirty years of Suharto’s dictatorship, Indo-nesia’s GDP increased by almost ten times while hestole an estimated USD 15 to 35 billion from the na-tion. Using his country’s oil wealth, Kazakh presi-dent Nazarbayev has created three billionaires with-in his family while raising the per capita GDP of cit-izens from USD 700 in 1994 to USD 9,000 at present.It is possible to argue that “benevolence” is reallyinvoluntary – that it is merely a reflection of the highcost of purchasing the loyalty of the public and ofthose who help maintain the corrupt structure. DiTella and Franceschelli (2009) provide evidence ofone such expenditure in Argentina – promises ofgovernment advertising revenues to the media inexchange for non-reporting of corruption. A slightlyless virulent form of this type of corruption ariseswhen powerful oligarchs ensure that political deci-sions are in accordance with their economic inter-ests. This may be an accurate description of corrup-tion in contemporary India and Russia (Lamont andFontanella-Khan 2011). Johnson and Kwak (2010)cite examples from the United States during theeighteenth century.
Political or grand corruption is difficult to model.Most studies have focused on individual cases (suchas Klitgaard 1990) and on the context of the persis-tence of corruption. Exceptions include Charap andHarm (2002) and Jain (1993).We will tackle the issueof persistence of corruption in the following section.
There are many ways to view corruption other thanin between the two extremes discussed above. Aidt
(2003) provides four ways to differentiate the rangeof corrupt activities. It is worthwhile to note that weexclude “fraud” and the mere existence of poverty(or worsening of income distribution) as signs of cor-ruption. Similarly, influencing public policy throughlegitimate routes, whether by providing informationor by making political contributions, is not necessar-ily evidence of corruption.“Political Action Commit-tees” in the United States and similar lobbying groupsin other countries have a legitimate role to play in mo-dern democracies. In the same vein, policy decisionsthat may be directed at specific voting groups, andhence in the personal interest of a politician, are notconsidered corrupt.
Why does corruption survive?
The conditions for corruption to arise are ubiqui-tous. Its survival, however, depends upon three con-ditions.
The first condition necessary for the emergence ofcorruption is that there be rents associated with agovernment’s regulatory powers. Let us consider therents associated with the sale of rights to serve thewireless market (A recent corruption scandal in In-dia puts the value of such rents at USD 38 billion inthat country). Barring pathologically honest bureau-crats, an entrepreneur will collude with public offi-cials to capture those rents. Potential losers from thisexchange, which include competitors and consumers,will have incentives to prevent such sales. A neces-sary corollary to this condition is that those who losefrom such a collusion (between entrepreneurs andcorrupt bureaucrats) are not able to organize and donot have access to effective political and legal meansto prevent the private sale of public property. Anti-cipation that well-developed public institutions willcoordinate the responses of the losers may preventcorruption from developing in the first place. Foellmiand Oechslin’s (2007) model illustrates how corrup-tion exists in imperfect capital markets but not incompetitive ones.
The second condition requires that corrupt bureau-cracies be somewhat independent within the remain-ing (if honest) administrative structure of the gov-ernment. External controls on the bureaucracy –whether imposed by the remainder of the adminis-trative system or by the society at large – must beweak. If some agents seem to get away with acts ofcorruption, the internal dynamics of a corrupt
CESifo DICE Report 2/2011 4
Forum

CESifo DICE Report 2/20115
Forum
bureaucracy will motivate other bureaucrats to ex-pend more effort on increasing the level of their illic-it income; some of that effort will have to be spent onensuring an appropriate redistribution of the illicitincome within the bureaucracy. Wade (1985) de-scribes an extreme example of such institutionaliza-tion of corruption. Corruption within the irrigationdepartment in one state in India grew to such an ex-tent that the entire effort of administrators was de-voted to managing the flow of illicit income ratherthan on meeting the needs of their clients.
The third condition requires that the public institu-tions controlling corruption be weak and ineffective.These institutions include civic groups that exert mo-ral pressures, political parties and the media thatcould expose the wrongdoing, and the legal systemthat would have the authority to prosecute and pun-ish the guilty.
Societies going through rapid modernization andeconomic expansion resulting from innovation (in-dustrial or information technology revolutions, forexample) are prime targets for corruption. Initial de-cades of industrial revolutions in most presently-in-dustrialized countries as well as periods of rapidgrowth in East Asia, China and India have been char-acterized by high levels of corruption. In all these so-cieties, the possibilities of economic expansion creat-ed the fuel for corruption to grow. Britain had morecorruption in eighteenth century and America in thenineteenth century than in adjoining centuries. Ef-fective political institutionalization lagged behindeconomic modernization (Huntington 1968, 59). Inboth these instances, however, the political modern-ization that followed was accompanied by a signifi-cant decrease in corruption. The development of po-litical institutions increased competition to such anextent that corrupt agents could no longer continueto exercise monopolistic control over the economicgrowth. Corruption-reducing political modernization,however, is not a foregone conclusion. Bliss and DiTella (1997) illustrate situations where agents “endo-genize” the level of competition and corruption canpersist in spite of increased competition.
Measures of economic and social development seemto correlate very strongly with a reduction in corrup-tion (Svensson 2005, 28–29). Treisman (2000) finds acorrelation between corruption and a host of othersocial characteristics, including type of legal system,colonial legacy and religion. While it is clear that thelevel of corruption in societies with well developed
political institutions is lower, it is difficult to establishthe direction of causation. Does development (eco-nomic, political or social) cause corruption to declineor is development possible only when corruptiondeclines? One reason we may not have an answer isthat researchers have not been able to distinguishbetween the different types of corruption – two ex-tremes of which were described as bureaucratic andpolitical corruption in the previous section. Most meas-ures of corruption used in empirical studies appearto define corruption as a monolithic entity definableby a cardinal number or a rank. Most commonlyused corruption measurements include the Corrup-tion Perception Index by Transparency Internatio-nal, Business International, International CountryRisk Guide and the Governance index by the WorldBank, which includes a measure of corruption (Jain2001, 76–77; Treisman 2000, Table A.2). These indicesare inadequate if the issue of causation between cor-ruption and social and political indicators is to beaddressed.
An important set of agents whose role is not wellunderstood is the intermediaries – those agents whofacilitate the conduct of corrupt activities betweenthe clients and the bureaucrats. Bose (2010) arguesthat these intermediaries may ensure the persistenceof corruption while Khanna and Johnston (2007)highlight the role of intermediaries in India in reduc-ing the risks associated with corrupt transactions.
Consequences of corruption
Persistent myths refer to corruption as the secondbest solution in view of inefficient government regu-lation or to its role as “the grease in the wheels ofcommerce”. Aidt (2003, F633–35) presents and thendemolishes the argument for “efficient corruption”.Kaufmann (1998) lays to rest the “grease” argument.While corruption may make one transaction easier,it gives rise to a demand for more corruption – al-most like adding sand to the machine, which willthen require more grease.
We can say with some certainty that corruption is notgood for economic growth. It is quite possible thatthe two types of corruption identified above havevery different effects. Countries marked with bureau-cratic corruption could grow as long as the resourceallocation process is not influenced by what moti-vates political or grand corruption – the interests ofthe decision maker, not the efficiency of the alloca-

tion process. The East Asian Tigers have witnessed arapid economic growth over the past four decades inspite of corruption. Casual evidence suggests that,for the most part, corruption in that region leads toredistribution of earnings, not to misallocation of in-vestments.
Benign forms of corruption affect the economy muchas a tax would. Based on a study of Ugandan firms,Fisman and Svensson (2007) show that corruptionreduces firms’ growth just as taxation can. Corruptionchanges prices and, hence, the equilibrium due toshifts in the supply and demand of public services.Political corruption affects growth by influencing de-cisions on resource allocations, by changing prices andby influencing the availability of resources. In addi-tion, corruption hurts the poor more than the othersegments of a society. Since the continuation of cor-ruption requires suppression of those who may op-pose corruption, it also inhibits the development ofsocial and political institutions.
Corruption is known to deter investment because itcan (negatively) bias an entrepreneur’s assessmentof the risks and returns associated with an invest-ment (Svensson 2005). Allocation of investment it-self will be biased in the presence of political cor-ruption. Corruption may provide incentives to lowerpublic expenditures (Pani 2009) and may encourageinvestment in large (inefficient) projects with con-centrated cash flows (and thus more subject to ex-propriation) than more efficient maintenance expen-ditures. Corrupt politicians, for example, encouragethe building of new schools rather than funding ex-penditures that would provide books and suppliesfor the classrooms. Corrupt officials will direct stateand private investment to areas which maximizetheir returns, not those of the society (Krueger 1993;Alesina and Angeletos 2005).
Serious empirical research on the link between cor-ruption and growth began with Mauro (1995; 1997).Allowing for some differences between the initialconditions of countries, Mauro found a negative rela-tionship between corruption and growth rates, andsurmised that worsening composition of public ex-penditure induced by corruption may play a role.Gyimah-Brempong (2002) and Pellegrini and Gerlagh(2004) validate this relationship after accounting fordifferences in the initial conditions of countries andtheir trade openness, political stability or education.Corruption inhibits growth of small and medium en-terprises (Tanzi and Davoodi 2001) – firms that usu-
ally make a large contribution to growth in moderneconomies. Wei (2000) found that foreign investorsare deterred by corruption in spite of incentives of-fered by host countries. Interestingly, he finds thatthe US’s own laws against bribery seem not to haveaffected the behaviour of US investors. This, as Craggand Woof (2001) point out, may be because anti-bribery laws are rarely enforced. Gupta, Mello andSharan (2001) show that corruption biases public ex-penditures in favour of the military because, as Hines(1995) has pointed out, high-technology goods of anoligopolistic industry are highly susceptible to cor-ruption.
Corruption introduces distortions in factors markets.It can lower tax revenues (and, hence, funds avail-able for public investments) either because corrup-tion induces inefficiencies in the tax-collection sys-tem (Imam 2007) or because corrupt democracieswill have incentives to lower tax rates (Pani 2009).Corruption will direct talent away from productiveactivities towards rent-seeking activities (Murphy,Shleifer and Vishny 1991; 1993). Examining enrol-ments in engineering and law, Tanzi and Davoodi(2001, 100) find that “…corruption allocates talent ina growth reducing fashion…”. Ahlin (2001) demon-strates the effect of bribery on the allocation of tal-ent away from entrepreneurship.
While corruption affects the whole economy, it seemsto target the poor. First, consistent with current de-bate which points to benefits for the poor from eco-nomic growth, corruption hurts the poor by lower-ing an economy’s growth rate. Second, corruptionintroduces costs and benefits that create a biasagainst the poor (Ahlin and Bose 2007). Third, cor-ruption can be causally linked to the worsening ofincome distribution.
Corruption reduces poor peoples’ access to publicgoods – a segment of society that perhaps needsthose goods more than any other. The poor, becauseof their limited initial wealth, are not able to pay thebribes required to obtain these services (Foellmi andOechslin 2007; Kulshreshtha 2007). The Global Cor-ruption Report for 2006 by Transparency Inter-national is replete with examples of corruption inhealth services in countries around the world and itseffects on the poor. Mauro (1997) found that govern-ment expenditures on education and health were ne-gatively and significantly related to corruption. Gupta,Davoodi and Tiongson (2001) examined a wide vari-ety of social indicators in a sample of 117 countries.
CESifo DICE Report 2/2011 6
Forum

CESifo DICE Report 2/20117
Forum
They presented survey as well as statistical evidencethat corruption leads to inefficient delivery of gov-ernment social services.
There is strong empirical support for a relationshipbetween corruption and income distribution. Elimi-nating the influence of other factors using instru-ment variables, Gupta, Davoodi and Alonse-Terme(2002) found a significant impact of corruption onthe Gini coefficient for income in a sample of 40 coun-tries over 1980–97. “A worsening in the corruptionindex of a country by one standard deviation (2.52points on a scale of 0 to 10) increases the Gini coef-ficient by 11 points, which is significant, given theaverage Gini value of 39” (p. 40).
Examining the data for a sample of African coun-tries, Gyimah-Brempong (2002, 205) concluded that“…corruption is positively correlated with incomeinequality in African countries, all things equal. …(One unit decrease in corruption index) is associatedwith between 4 and 7 units increase in Gini coeffi-cient of income inequality”. Extending the researchbeyond Africa, Gyimah-Brempong and Munoz deCamacho (2006) demonstrated that different regionsof the world are affected differently by corruption.These authors concluded that differences in theimpact of corruption are caused by variations in thetypes of corruption that exist in different regions andcountries. This conclusion is based on some implicitassumptions about the types of corruption. Their as-sumption is that, on the one hand, most African coun-tries suffer from the same type of corruption. On theother hand, the authors conclude that diverse regionsof the world, some of which had higher growth ratesthan Africa despite the presence of corruption, had adifferent type of corruption. You and Khagram (2005)find some evidence of causation in both directions –corruption affects poverty and poverty has some effecton corruption. Using the number of convictions as ameasure of corruption, Dincer and Gunalp (2005) findthat corruption and inequality are related in the US.
Fighting corruption
Perhaps the most important, and the most difficult,question about corruption is “how can we reducecorruption?”Attempts to fight corruption face a fun-damental contradiction: reducing corruption re-quires the commitment and cooperation of thosewho benefit from corruption, which is not in theirself-interest. In order for a campaign against corrup-
tion to succeed, it will require a strong moral com-mitment from the segment of leadership that aspiresto reduce corruption in addition to sufficient supportfrom the public.There are but a few examples of suc-cessful fights against corruption. More often thannot, a reduction in corruption accompanies econom-ic growth in open societies, where the cost of corrup-tion begins to exceed the ability of those who bene-fit from it to purchase compliance from other politi-cians and bureaucrats.
Hong Kong was able to fight corruption in the 1970safter an Independent Commission Against Corrup-tion was established in 1974. Georgia claims to havereduced its corruption level significantly in recentyears. Petty bureaucratic corruption in some states inIndia has been reduced while political corruptionthreatens to destabilize the country (Lamont et al.2011).
Successful campaigns to fight corruption occur alongthree dimensions. Laws must be strong enough tocreate a deterrence. It is, however, not enough tohave laws on the books – there must be a will toimplement them. Although US anti-bribery laws areamong the oldest in the industrialized world, theyare rarely enforced (Cragg and Woof 2001). Chinahas resorted to capital punishment for certain typesof corruption but has not been able to eliminate it.Corruption cannot be tackled without a strong civicsociety. The population must have powers to chal-lenge politicians and bureaucrats. Governmentsmust agree to introduce transparency in their opera-tions and allow information to flow freely.The “Rightto Information Act” in India that allows citizens todemand information from bureaucrats has givenmuch hope to activists in India. While it has beenused to fight petty corruption, it has done little toreduce instances of “grand” corruption. Finally, barri-ers to participation in the economic life of a societymust be removed. Corruption has its losers – the pop-ulation at large and those who are denied participa-tion in economic activity.When those who are hurt bycorruption are allowed to voice their discontent, thechances of a decline in corruption increase.
Concluding remarks
Neither corruption nor its study is new. Interest inthis subject, however, has become central to the dis-cussion of economic performance over the past twodecades. This has followed the realization that cor-
ruption may be the biggest barrier to removingpoverty in the developing world.
There is very little doubt that corruption hurts soci-eties. For the leaders of societies who engage in cor-ruption, however, the temptation to succumb to cor-ruption far exceeds any moral constraints or com-passion for those who may suffer as a result. Con-straints on their behavior may have to come fromoutside – a global leadership that places value on thereduction of poverty and suffering, and the resultingpeace dividend. Arriving at that type of enlightenedapproach is likely to take some time; in the mean-time, the best we can do is inform ourselves.
The remainder of this volume of DICE REPORTconsists of papers that elaborate on themes intro-duced in this essay: what forms does corruption take,what causes it, what are its consequences and howcan we fight it.
References
Acemoglu, D. and T. Verdier (2000), “The Choice Between MarketFailure and Corruption”, American Economic Review 90(1), 194-211.
Ahlin, C. R. (2001),“Corruption: Political Determinants and Macro-economic Effects”, Working paper, Department of Economics,Vanderbilt University.
Ahlin, C. R. and P. Bose (2007), “Bribery, Inefficiency and Bureau-cratic Delay”, Journal of Development Economics 84, 465–86.
Aidt, T. S. (2003), “Economic Analysis of Corruption: A Survey”,Economic Journal 113, F632–52.
Alesina, A. F. and G.-M. Angeletos (2005), “Corruption, Inequalityand Fairness”, MIT Department of Economics Working Paper no.05–16; Harvard Institute of Economic Research Discussion Paperno. 2070.
Bliss, C. and R. Di Tella (1997), “Does Competition Kill Corrup-tion?” Journal of Political Economy 105(5), 1001–23.
Bose, G. (2010), “Aspects of Bureaucratic Corruption”, AustralianSchool of Business Research Paper, ECON 14.
Charap, J. and C. Harm (2002), “Institutionalized Corruption andthe Kleptocratic State”, in G. T. Abed and S. Gupta, eds., Govern-ance, Corruption, and Economic Performance, International Mon-etary Fund, Washington DC.
Cragg, W. and W. Woof (2001), “Legislation against Corruption inInternational Markets: The Story of US Foreign Corrupt PracticesAct”, in A. K. Jain, ed., The Political Economy of Corruption, Rout-ledge, New York, 180–213.
Dabla-Norris, E. (2002), “A Game Theoretic Analysis of Corruptionin Bureaucracies”, in G. T. Abed and S. Gupta, eds., Governance,Corruption, and Economic Performance, International MonetaryFund, Washington DC.
Di Tella, R. and I. Franceschelli (2009), “Government Advertisingand Media Coverage of Corruption Scandals”, NBER WorkingPaper no. 15402.
Dincer, O. C. and B. Gunalp (2005),“Corruption, Income Inequality,and Growth: Evidence from U.S. States”, Working Paper Series,Massey University and Hacettepe University.
Fisman, R. and J. Svensson (2007), “Are Corruption and TaxationReally Harmful to Firm Growth? Firm Level Evidence”, Journal ofDevelopment Economics 83, 63–75.
Foellmi, R. and M. Oechslin (2007), “Who Gains from Non-Col-lusive Corruption?” Journal of Development Economics 82, 95–119.
Global Corruption Report 2006, Transparency International.
Gupta, S., H. Davoodi and E. Tiongson (2001), “Corruption andProvision of Health Care and Education Services”, in A. K. Jain, ed.,The Political Economy of Corruption, Routledge, New York, 111–41.
Gupta, S., H. Davoodi and R. Alonso-Terme (2002), “Does Corrup-tion Affect Income Inequality and Poverty?” Economics of Gov-ernance 3, 22–45.
Gupta, S., L. de Mello and R. Sharan (2001), “Corruption andMilitary Spending”, European Journal of Political Economy 17,749–77.
Gyimah-Brempong, K. (2002) “Corruption, Economic Growth andIncome Inequality in Africa”, Economics of Governance 2, 183–209.
Gyimah-Brempong, K. and S. M. de Camacho (2004), “Corruption,Growth, and Income Distribution: Are there Regional Differ-ences”, Economics of Governance 7, 245–69.
Hines, J. R. (1995), “Forbidden Payment: Foreign Bribery andAmerican Business after 1977”, National Bureau of Economic Re-search Working Paper no. 5266.
Huntington, S. P. (1968), Political Order in Changing Societies, YaleUniversity Press, New Haven.
Imam, P. A. (2007), “Effect of Corruption on Tax Revenues in theMiddle East”, IMF Working Paper no. 07/270.
Jain, A. K. (1993), “Dictatorship, Democracies and Debt Crisis”, inS. P. Riley, ed., The Politics of Global Debt, St. Martin’s Press, NewYork.
Jain, A. K. (2001), “Corruption: A Review”, Journal of EconomicSurveys 15(1), 71–121.
Johnson, S. and J. Kwak (2010), 13 Bankers: The Wall Street Take-over and the Next Financial Meltdown, Pantheon Books, New York.
Kaufmann, D. (1998), “Research on Corruption: Critical EmpiricalIssues”, in A. K. Jain, ed., Economics of Corruption, Kluwer Aca-demics, 129–76.
Khanna, J. and M. Johnston (2007),“India’s Middlemen: Connectingby Corrupting?” Crime, Law and Social Change 48, 151–68.
Klitgaard, R. (1990), Tropical Gangsters, Basic Books, New York.
Krueger, A. O. (1993), “Virtuous and Vicious Circles in EconomicDevelopment”, American Economic Review 83(2), 351–55.
Kulshreshtha, P. (2007),“Bureaucratic Corruption: Efficiency Virtueor Distributive Vice?”, Journal of Development Economics 83,530–48.
Lambert-Mogiliansky, A., M. Majumdar and R. Radner (2007),“Strategic Analysis of Petty Corruption: Entrepreneurs and Bu-reaucrats”, Journal of Development Economics 83, 351–67.
Lamont, J. and J. Fontanella-Khan (2011), “India: Writing is on theWall”, Financial Times, 22 March 2011, 7.
Mauro, P. (1995), “Corruption and Growth”, Quarterly Journal ofEconomics 110(3), 681–712.
Mauro, P. (1997), “The Effects of Corruption on Growth, Invest-ment, and Government Expenditure: A Cross–Country Analysis”,in K. A. Elliott, ed., Corruption and the Global Economy, Institutefor International Economics, Washington DC, 83–107.
Murphy, K. M., A. Shleifer and R. Vishny (1991), “The Allocation ofTalent: Implications for Growth”, Quarterly Journal of Economics106, 503–30.
Murphy, K. M., A. Shleifer and R. Vishny (1993), “Why is Rent-Seeking so Costly to Growth?” American Economic Review 82(2),409–14.
Pani, M. (2009), “Hold Your Nose and Vote: Why Do Some Demo-cracies Tolerate Corruption?” IMF Working Paper no. 83.
Pellegrini L. and R. Gerlagh (2004), “Corruption’s Effect onGrowth and Its Transmission Channels”, Kyklos 57(3), 429–56.
Rose-Ackerman, S. (1978), Corruption: A Study in Political Eco-nomy, Academic Press.
CESifo DICE Report 2/2011 8
Forum
CESifo DICE Report 2/20119
Forum
Shleifer, A. and R. Vishny (1993), “Corruption”, Quarterly Journalof Economics 108(3), 99–617.
Svensson, J. (2005), “Eight Questions about Corruption”, Journal ofEconomic Perspectives 19(3),19-42.
Tanzi, V. and H. Davoodi (2001), “Corruption, Growth and PublicFinances”, in A. K. Jain, ed., The Political Economy of Corruption,Routledge, New York, 89–110.
Treisman, D. (2000), “The Causes of Corruption: A Cross-NationalStudy”, Journal of Public Economics 76, 399–457.
Wade, R. (1985), “The Market for Public Office: Why the IndianState is not Better at Development”, World Development 13(4),467–97.
Wei, S.-J. (2000), “How Taxing is Corruption to International In-vestors”, The Review of Economics and Statistics 82, 1–11.
You, J.-S. and S. Khagram (2005), “A Comparative Study of Ine-quality and Corruption”, American Sociological Review 70, 136–57.

FORMS OF CORRUPTION
STEPHEN D. MORRIS*
Introduction
As the intense debate over definition demonstrates,corruption refers to a broad range of behavior. Nor-mally defined as the abuse of public power for per-sonal gain (Nye 1967), most equate corruption withbribery, where an illegal payment is made to a gov-ernment official in return for some type of official,state-sanctioned, authoritative act that has a selectiveand tangible impact and that in the absence of thesecret payment would not otherwise have been made(Johnston 2005, 18). But beyond bribery, corruptionalso includes kickbacks which operate much like abribe, but where the illegal payment is made after theservice is rendered, usually from a portion of the gov-ernmental award itself, and extortion where the publicofficial threatens to use (or abuse) state power toinduce the payment of a bribe.While such acts involvetransactions between citizen and government official,corruption also includes graft and embezzlement,where public officials act alone to appropriate publicfunds or divert their use. Closely related to graft,fraud refers to the various, often complex and imagi-native schemes orchestrated by officials to appropri-ate public funds, often with civilian accomplices.Thesemay include establishing fake companies, listing ghostworkers to pad payrolls, overbilling the governmenton contracts, or otherwise fixing the books to hide thedisappearance of public funds. Beyond these actscommonly associated with corruption, corruption alsoencompasses such diverse activities as nepotism, fa-
voritism and conflict of interest, where public-sectorjobs or benefits are illegally channeled to family,friends or to the benefit of the decision-makers own in-terests. Even within the partisan and electoral realms,corruption encompasses a range of activities such asillegal campaign contributions, illegal expenditures, elec-
toral fraud and vote buying.
Despite a largely methodologically-driven tendencyin the literature to create and utilize one standardmeasure of something called corruption, numerousscholars have peered inside the broad concept to dif-ferentiate and identify distinct types and forms ofcorruption. Differences center on the participants in-volved in a corrupt act, the types of norms the act vio-lates, the nature of the transaction, the broader con-text within which the act occurs and the purpose, out-come or motive of the act. Such analytical distinc-tions are not only important in developing a betterunderstanding of the phenomenon, but are also cru-cial in exploring the causes and consequences of cor-ruption and in crafting strategies to fight it.This essaypresents some of the classificatory schemes, illus-trates their use in theory and discusses some of theon-going theoretical and methodological challenges.
Types of corruption
Institutional location of the actor and norms
Whereas by definition political corruption involves“public officials” – thereby differentiating the con-cept from fraud taking place within society – thesheer vastness of the public sector means that cor-ruption can occur at virtually any place within thegovernment. An easy means of differentiating formsof corruption centers on the institutional location ofthe public official involved (i.e., corruption withinthe executive branch, the legislature or the judiciary,the local government, the police, customs agents,building inspectors, etc.). Two broad categories ofcorruption based on institutional location include“upper-level” and “lower-level” corruption. The for-mer involves presidents, ministers, members of thelegislature, governors and other high-ranking offi-cials, while lower-level corruption relates to civil ser-vants. The upper-level/ lower-level distinction largelyparallels differences based on the distinct politicalroles or functions of the public officials and thenorms governing their behavior. The term “politicalcorruption” thus tends to refer to corruption occur-ring at the policymaking stage or, in Eastonian terms,the input side of the political system, whereas “bu-reaucratic” or “administrative” corruption relates to
CESifo DICE Report 2/2011 10
Forum
* Middle Tennessee State University.

CESifo DICE Report 2/201111
Forum
the implementation of policy carried out by lower-level officials or the output side of the equation(Bardhan 2006; Scott 1972). Because of their differ-ent functions within the system, these two forms ofcorruption also violate different norms. “Bureaucra-tic corruption” involves the violation of first-ordernorms (the written rules and laws that are the prod-uct of politicians’ decision making), whereas “politi-cal corruption” committed by policymakers entailsthe violation of more nebulous second-order norms(the often unwritten guidelines determining how po-liticians should make decisions, such as impartialityand fairness; Warren 2004).
The nature of the transaction
A second taxonomic approach differentiates corrup-tion based on certain characteristics of the transac-tion. A number of schemes have been developedalong these lines. One rather simple approach relatesto the direction of corrupt influence. It draws a dis-tinction between “bribery” and “extortion”. In bri-bery, societal interests use extra-legal payments orbribes to influence the content of state policy or itsimplementation. At a broader, more systemic level,this form of corrupt influence can take on the char-acteristics of “state capture”, whereby an entireagency or institution operates on behalf of societalinterests. Extortion, by contrast, involves the use andabuse of state power by public officials to demandextra-legal payments or rents in return for providinga legitimate or illegitimate service. In extortion, thedirection of influence moves from state to society,while bribery reverses the direction. It is quite dif-ferent when drug traffickers have half the police ontheir payroll doing their bidding versus when thepolice shake down petty thieves or extort “bribes”from citizens for real or imagined offenses.
A second and more elaborate approach based onaspects of the corrupt transaction is offered by SyedAlatas (1990, cited in Heywood 1997, 425–26). Hedistinguishes six forms of corruption. “Transactive”corruption involves the mutual arrangement be-tween a donor and a recipient; “extortive” corrup-tion implies some form of compulsion usually harm-ing a party; “defensive” corruption refers to the actthe victim of extortion is compelled to engage in;“investive” corruption involves an act with no imme-diate payoff, but an understanding of a favor some-times in the future; “nepotistic” corruption relates tofamily members being appointed to positions in thegovernment; “autogenic” corruption entails one per-
son acting alone with no official-citizen exchange;and “supportive” corruption refers to acts designedto protect and strengthen existing corruption.
A third approach based on characteristics of thetransaction is essentially a typology based on the rel-ative size and frequency of the acts. This distinctionis commonly expressed in terms of “grand” versus“petty” corruption. At one end, “grand corruption”involves large sums of money and usually less fre-quent transactions, while at the other end “petty cor-ruption” refers to smaller and more routine pay-ments. This distinction tends to parallel those rootedin the institutional position of the state official in-volved, with “grand corruption” more likely to occuramong high level government officials who have lim-ited interaction with the public, while “petty corrup-tion” tends to take place among low-level, bureau-cratic workers who regularly interact with the public.
Systemic framework
Though somewhat related to differences based on sizeand frequency, distinctions are also often based on thebroader pattern of corruption within the system. Thisapproach focuses not just on the individual corruptact, but rather on the context in which the act occurs.Mark Robinson (1988), for example, identifies threeforms of corruption: “incidental” corruption, which isconfined to malfeasance on the part of the individualand is thus rare; “institutional” corruption referring tocertain institutions that may be riddled with corrup-tion due largely to the absence of controls; and “sys-temic” corruption which reflects situations where cor-ruption is deeply entrenched and pervasive through-out society.A similar sort of distinction contrasts “cen-tralized” and “decentralized” corruption dependingon the level of control exercised by the political eliteover local officials (Bardhan 2006, 344).This approachtends to parallel other distinctions as well. Institution-al, systemic and centralized corruption, for instance,usually involves elaborate webs and chains of illegalpayoffs inside government, often to the benefit of su-periors or the political party.
Motive or purpose
A final approach distinguishes types of corruptionbased on the motives, purpose or outcome of the cor-rupt act. The range, of course, can be rather exten-sive. Does the corrupt act – for example, allowing amurderer to go free – result in the diversion of mil-lions of dollars from a program designed to help the

poor or simply in speeding up the award of a licensethat would have been granted in time anyway? Oneeasy distinction based on motive separates corruptionthat promotes purely personal interests from corrup-tion that benefits a clique, a political party or an insti-tution which may be more systematic. In a discussionof the link between organized crime and corruption,for instance, Margaret Beare (1997, 161–69) offers anon-exhaustive taxonomy of corruption based largelyon motive or outcome. She identifies four types:“bribes/kickbacks”, which are paid or demanded in re-turn for being allowed to do legitimate business;“elec-tion/campaign corruption”, designed to ensure con-tinuing influence; “protection corruption”, paymentsin exchange for being allowed to engage in illegiti-mate business; and “systemic top-down corruption”,where the nation’s wealth is systematically siphoned-off by the ruling elites.
Theoretical linkages and methodological challenges
Identifying different forms of corruption – whetherbased on the institutional location of the partici-pants, the norms, the nature of the transaction or theunderlying motives – is useful largely to the extentthat it advances our theoretical understanding of cor-ruption (Gerring 1999). Recognizing different formsof corruption, in short, leads to a series of questions:To what extent do the various types of corruption ac-tually go together? Do all forms of corruption stemfrom the same underlying causes or are the differenttypes of corruption caused by different factors? Dothe different forms of corruption have different af-fects on society or the political system?
Much of the corruption literature exploring the un-derlying causes and consequences of corruption failto differentiate forms of corruption. Corruption, inother words, is treated generically as a singular classof political behavior. This is especially true of thebulk of the quantitative, cross-national studies be-cause of the way corruption is normally measured.On the one hand, an argument can be made that po-litical corruption of any stripe facilitates all or othertypes of corruption and/or that all types of corrup-tion stem from similar causes. Factors, such as per-missiveness or tolerance, the lack of trust or socialcapital or even the lack of democracy, for instance,would seem to feed bureaucratic corruption as wellas political corruption, bribery as well as extortion,corruption within the police, the judiciary, the par-ties, ad infinitum. Indeed, formal models show that
corrupt activity generally depends on how much cor-rupt activity is taking place throughout society, sug-gesting a common pattern (Bardhan 2006, Mishra2006). Such an assertion that leads to grouping dif-ferent forms of corruption together not only justifiesthe use of crude, composite measures of the phe-nomenon but it also sustains the search for a com-mon set of causal factors and unified or one-dimen-sional consequences.
On the other hand, a wide range of theories suggestthat different forms of corruption may not necessar-ily go together and that certain factors may relateonly to certain types of corruption and not others.Mocan (2004) and Morris (2008), for instance, findweak and limited correlations linking perceptions ofcorruption from actual involvement in paying bribesor being asked to pay a bribe, particularly among de-veloping countries. Mocan (2004), for example, findsthat when the quality of the institution (measured bythe risk of expropriation) is controlled for, the weakassociation between corruption and corruption per-ception actually disappears. Taking a different ap-proach, Bardhan (2006) distinguishes bureaucraticfrom political corruption and finds that at least in thecase of the United States, the two do not go togetherand that the United States suffers high levels ofpolitical corruption, but low levels of bureaucraticcorruption.
Michael Johnston’s (2005) work on corruption syn-dromes, in turn, highlights different causes for differ-ent patterns of corruption. Casting the balance ofeconomic opportunities and political opportunities,weak or strong state and civil society as key causalagents, Johnston identifies four syndromes of corrup-tion – interest group bidding, elite hegemony, frag-mented patronage and patronage machines – that dif-fer in terms of the underlying causal agents, the pat-terns or forms of corruption within the society, in theconsequences for the political system, and hence onthe approaches needed to curb corruption. In a com-parison of corruption in Latin America, DanielGingerich (2009) similarly links different types of pro-portional representation electoral systems to distinctclasses of corruption. The open-list, proportional rep-resentation (PR) system found in Brazil tends to cre-ate strong incentives for legislators to amass a per-sonal following by distributing pork and private goodsto supporters back home via, in part, corruption. Butwhile the open-list PR system in Brazil feeds individ-ual schemes of corruption to pay for expensive per-sonal election campaigns, the closed-list PR system
CESifo DICE Report 2/2011 12
Forum

CESifo DICE Report 2/201113
Forum
found in Argentina and Bolivia fosters a different pat-tern of corruption, where the power of the party elite,coupled with a more politicized bureaucracy, pushesparty leaders to strike deals with bureaucrats andchannel public resources to help the party.
Tying different forms of corruption to different con-sequences, Morris (1991) links broad forms of corrup-tion to political outcome. Focusing on Mexico, I arguethat while extortion can help solidify the elite andenhance centralized control, bribery tends to have theopposite effect, undermining elite unity and politicalstability. In a similar way, Mushtaq Khan (1998) showshow different forms of corruption can have differenteconomic outcomes. Specifically, he demonstratesthat the corruption found in Korea created strongincentives for the state to re-allocate rights and re-sources in a way that maximized economic growth,while the type of corruption prevalent in South Asiancountries enriched political intermediaries and thustended to undermine economic growth.
A somewhat different theoretical approach links dis-tinct forms of corruption to different perceptions ofthe seriousness or level of corruptness by elite andthe public. One of the earliest explorations of this byArnold Heidenheimer (1970) relates the perceptionof corruptness to the nature of obligations within so-ciety. In a similar approach using opinion data, JohnPeters and Susan Welch (1978) find that acts involv-ing a non-political official (judge rather than politi-cian), a public role (rather than private citizen), do-nations from constituents rather than non-con-stituents and large payoffs tend to be deemed moreserious. A more recent study in France by Lascoumesand Tomescu-Hatto (2008) also gauges the level ofcorruption for a range of different corrupt acts. Thisenables the researchers to distinguish four groups ofcitizens based on their different perceptions of thedegree of tolerance for certain acts of favoritism (con-demn or not) and overall perception of the extent ofcorruption among public officials.
Much of the difficulties in studying different formsof corruption are methodological. Despite the nu-merous taxonomies and typologies developed byanalysts, we still lack the tools to adequately measurethe different classes of corruption. To date, Trans-parency International’s Corruption Perception In-dex stands as the most frequent measure used in em-pirical work exploring the causes or consequences ofcorruption. This indicator, however, is one-dimen-sional and does not differentiate among types or
forms of corruption (Johnston 2005, 19). While im-portant in advancing the study, the use of crude, one-dimensional measures of corruption cannot reallyaddress questions related to the different types ofcorruption. It may not be enough simply to say thata county suffers extensive or systemic corruption, orto expect the same causal factors to lie behind allforms of corruption or for all to exert a similar im-pact. Unfortunately at this stage, this may be all thatstandardized measures of corruption can tell us andall that we can learn from a global perspective.Though still relying on perceptions as measuredthrough opinion polls, Transparency International’smore elaborate Corruption Barometer does differ-entiate corruption by institutional location. This pro-vides an important methodological tool to differenti-ate countries based not only on the overall level ofcorruption, but different patterns of corruption. Partof the theoretical challenge, of course, is to use thisdata to test and refine theories differentiating causeand consequence, moving the study beyond its one-dimensional focus.
Conclusion
Clearly corruption encompasses a wide range of be-havior. As discussed, analysts have identified a num-ber of subcategories or forms of corruption, some ofwhich are more commonly employed than others.Among the criteria most commonly used to drawdistinctions are: the institutional location and func-tion of the public official involved (“political corrup-tion” versus “bureaucratic corruption”), the direc-tion of influence (“bribery” versus “extortion”), andthe size and frequency of the transaction (“grandcorruption” versus “petty corruption”). But despitethese and other efforts to tease out different formsof corruption, understanding the relationship amongthe classes of corruption, their determinants andtheir consequences continues to confront both theo-retical and methodological challenges.
References
Alatas, S. H. (1990), Corruption: Its Nature, Causes and Conse-quences, Aldershot, Avebury.
Bardhan, P. (2006), “The Economist’s Approach to the Problem ofCorruption”, World Development 34(2), 341–48.
Beare, M. E. (1997), “Corruption and Organized Crime: Lessonsfrom History”, Crime, Law and Social Change 28, 155–72.
Gerring, J. (1999), “What Makes a Concept Good? A CriticalFramework for Understanding Concept Formation in the SocialScience”, Polity 31(3), 357–94.

Gingerich, D. W. (2009), “Ballot Structure, Political Corruption, andPerformance of Proportional Representation”, Journal of Theore-tical Politics 21(4), 509–41.
Heidenheimer, A. J. (1970), “Perspectives on the Perception of Cor-ruption”, in Heidenheimer, ed., Political Corruption: Readings inComparative Analysis, Transaction Books, New Brunswick, NJ,18–28.
Heywood, P. (1997), “Political Corruption: Problems and Per-spectives”, Political Studies 45(3), 417–35.
Johnston, M. (2005), Syndromes of Corruption: Wealth, Power andDemocracy, Cambridge University Press.
Khan, M. H. (1998), “Patron-Client Networks and the EconomicEffects of Corruption in Asia”, European Journal of DevelopmentResearch 10(1), 15–40.
Lascoumes, P. and O.Tomescu-Hatto (2008),“French Ambiguities inUnderstandings of Corruption: Concurrent Definitions”, Perspec-tives on European Politics and Society 9(1), 24–38.
Mishra, A. (2006), “Persistence of Corruption: Some TheoreticalPerspectives”, World Development 34(2), 349–58.
Mocan, N. (2004), “What Determines Corruption? InternationalEvidence from Micro Data”, National Bureau of EconomicResearch, Working Paper no. 10460.
Morris, S. D. (1991), Corruption and Politics in ContemporaryMexico, Tuscaloosa, University of Alabama Press.
Morris, S. D. (2008), “Disaggregating Corruption: A Comparison ofParticipation and Perceptions in Latin America with Special Focuson Mexico”, Bulletin of Latin American Research 27(3), 388–409.
Nye, J. S. (1967), “Corruption and Political Development: A Cost-Benefit Analysis”, American Political Science Review 61(2), 417–27.
Peters, J. and S. Welch (1978), “Politics, Corruption, and PoliticalCulture”, American Politics Quarterly 6(3), 345–57.
Robinson, M. (1998), “Corruption and Development: An Intro-duction”, in M. Robinson, ed., Corruption and Development, FrankCass, London, 1–14.
Scott, J. C. (1972), Comparative Political Corruption, Prentice Hall,Englewood Cliffs, NJ.
Warren, M. E. (2004), “What Does Corruption Mean in a Demo-cracy?” American Journal of Political Science 48(2), 328–43.
CESifo DICE Report 2/2011 14
Forum

CESifo DICE Report 2/201115
Forum
THE CAUSES OF CORRUPTION
TOKE S. AIDT*
Corruption: what and where
Corruption is a persistent feature of human soci-eties over time and space. The sale of parliamentaryseats in the “rotten boroughs” of Great Britain be-fore the Great Reform Act of 1832 and “machinepolitics” in the expanding immigrant cities in theUnited States at the turn of the 19th century arejust two historical examples. Contemporaneous ex-amples also abound, and not only from developingcountries, such as Nigeria, India and the Philippines,and transition economies, such as Russia. The re-cent “expenses scandal” that engulfed the House ofCommons in the United Kingdom serves as a time-ly reminder that corruption regularly shows its facealso in the developed world.
While corruption is usually recognised when con-fronted with it, it has proved more difficult to findand agree on a precise and encompassing defini-tion. Most economists, however, are satisfied withsome version of the follow-ing definition: “corruptionis an act in which the pow-er of public office is usedfor personal gain in a man-ner that contravenes therules of the game” (Jain2001) or corruption is “thesale by government officialsof government property forpersonal gain” (Shleifer andVishny 1993). The latter is
also the definition that the World Bank employs.Examples of corruption thus defined include takingbribes in return for issuing licenses; accepting a kick-back for granting a defense contract; not enforcingrules and regulations in exchange for a payment andso on.
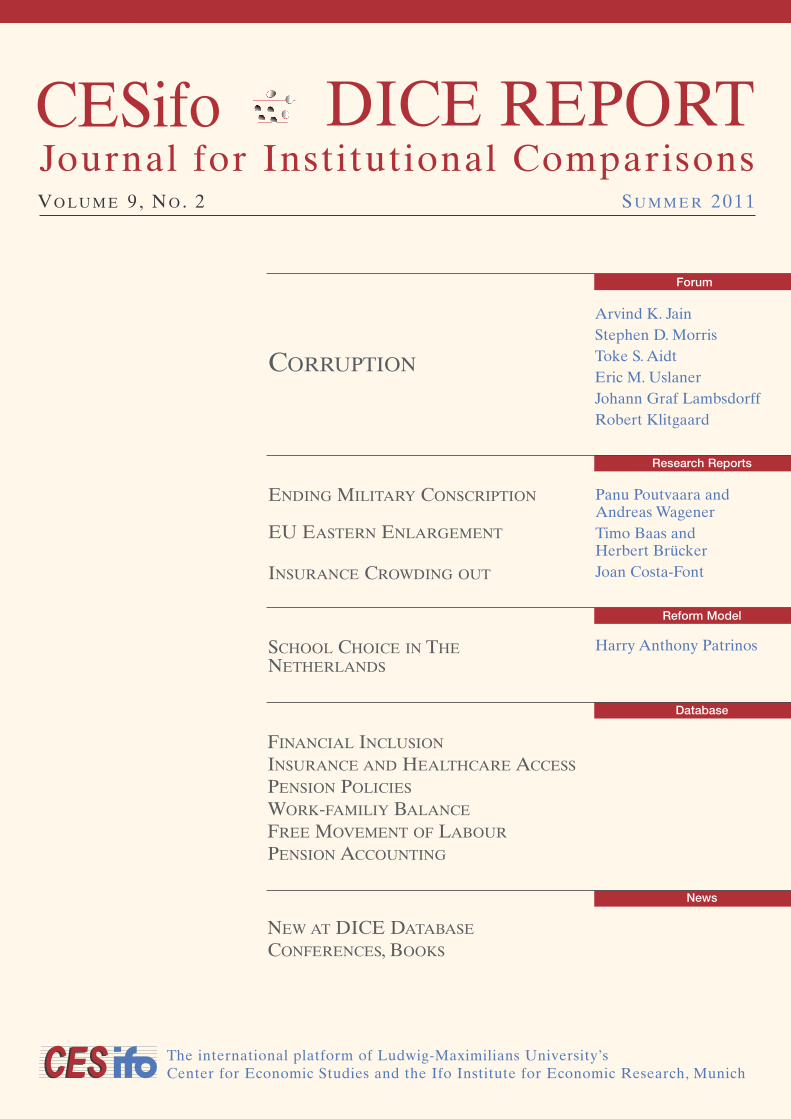
The Figure provides a snap-shot of the world dis-tribution of corruption in 2010 based on the cor-ruption perception index published yearly byTransparency International. Each bar representsone of the 178 countries surveyed in 2010. Theindex ranges from 0 to 10, with a score of 10 indi-cating absence of corruption and a score of 0 indi-cating widespread corruption. To the left with highindex values, we find the Scandinavian countriesand Singapore, in the middle of the distribution wefind countries like Thailand and Greece, while themost corrupt countries located to the far right in-clude Iraq, Afghanistan and Somalia. A major chal-lenge for economists and other social scientistsinterested in the causes of corruption and in offer-ing advice to policy makers is to explain not onlywhy corruption varies over time, as suggested bythe two historical examples given above, but also toexplain the distribution of corruption across theworld illustrated in the Figure.
* Faculty of Economics and JesusCollege, University of Cambridge,UK. E-mail: [email protected]. This report was written whilevisiting the Institute for Quanti-tative Social Science at HarvardUniversity. The hospitality of theInstitute is gratefully appreciated.I am also grateful to Jakob de Haanfor helpful advise.
0
2
4
6
8
10
Source: Transparency International (http://www.transparency.org).
WORLD DISTRIBUTION OF (PERCEIVED) CORRUPTION 2010
Corruption perceptions index
Countries
Notes: The corruption perceptions index scores countries on an inverse scale from 10 (very clean) to 0 (highly corrupt). Each bar represents one of the 278 countries surveyed and ordered from low to high corruption.
Figure

A conceptual framework
To structure thinking about a complex issue such ascorruption, it is useful to have a conceptual frame-work in mind. At the risk of over-simplifying a vasttheoretical literature on the causes of corruption, sur-veyed superbly in, e.g.,Tanzi (1998), Rose-Ackerman(1999) or Jain (2001), at least three conditions arenecessary for corruption in the public sector to ariseand persist:
1. Discretionary power: the relevant public officials(bureaucrats, politicians, etc.) must possess theauthority to design or administer regulations andpolicies in a discretionary manner.
2. Economic rents: the discretionary power mustallow extraction of (existing) rents or creations ofrents that can be extracted.
3. Weak institutions: the incentives embodied in po-litical, administrative and legal institutions mustbe such that public officials are left with an incen-tive to exploit their discretionary power to extractor create rents.
Much, if not all, theoretical work on the causes ofcorruption can be linked back to these three basicconditions. Two contrasting views about how theseconditions interact, however, stand out. The first viewis the “institutional view”. It emphasises the role of in-stitutions (broadly defined to include political, bu-reaucratic, juridical and economic institutions) andpresumes a causal order running from weak institu-tions to corruption to poor economic outcomes. Togive an example, the absence of democratic account-ability may foster political corruption which, in turn,encourages rent extraction and excessive regulationof economic activity. Corruption is, in other words,seen as the symptom that something else, more fun-damental, is wrong. Of course, feedbacks from eco-nomic conditions to corruption are usually also ac-knowledged as being important because they affectthe presence or absence of economic rents, and it isalso possible over longer time spans to imagine thatcorruption could be the cause of weak institutions.Yet, the organising and in many cases very powerfulanalytic principle is to look for weaknesses in theinstitutional framework to find the root causes ofcorruption.
The second view is the “social interactions view”. Itemphasises that corruption is the outcome of self-reinforcing social processes and downplays thecausal role of institutions. The basic idea can be illus-trated with an example along the lines of Andvig and
Moene (1990). Corrupt colleagues are less likely toreport that you are corrupt than honest colleaguessimply because corrupt colleagues do not want torisk triggering an external inquiry. This makes theprobability of being discovered/reported a decreas-ing function of how many others in the relevant so-cial group take bribes. The incentive of any one indi-vidual to accept a bribe is obviously stronger whenthe likelihood of being discovered is lower. Com-bining these plausible assumptions, two types of sta-ble situations can emerge: one in which no one takesbribes because anyone who does would be reportedand punished, and one in which everyone take bribesbecause no one will ever be reported and caught. Inother words, societies with otherwise very similar in-stitutions and economic conditions may end up withvery different levels of corruption. Shifts in institu-tions and economic conditions may trigger a swingfrom one equilibrium to the other, but it requires bigshifts. According to this view, the key to understand-ing corruption is to understand how underlying so-cial interactions work.
Cross-national studies on the causes of corruption
At the macroeconomic level, much of what we knowabout the causes of corruption originates from cross-national comparisons of survey-based corruptionindices. These indices can be divided, roughly speak-ing, into two categories. The first category containsindices based on corruption perceptions, i.e., subjec-tive assessments by business consultants, by localand international businessmen or by ordinary citi-zens about how much corruption there is in a givencountry. The three most popular indices of this typeare the Corruption Perception Index, published byTransparency International (and shown in the Figu-re), the Control of Corruption Index, published bythe World Bank, and the Corruption Index publishedby the International Country Risk Guide. Thesemeasures of corruption have many weaknesses (see,e.g., the extensive discussion in Lambsdorff 2005);one of the major ones being that there may be a sig-nificant gap between perceptions and facts. The sec-ond category includes indices of experienced corrup-tion. As the name suggests, these derive from self-reported experiences with corruption. The WorldBank’s World Business Environment Survey, forexample, asks managers in many countries to re-spond to the following statement: “It is common forfirms in my line of business to have to pay some ir-regular ‘additional’ payment to get things done”.
CESifo DICE Report 2/2011 16
Forum

CESifo DICE Report 2/201117
Forum
Clearly, these indices are also problematic becauseof reporting biases, etc., but other than data for a fewcountries on criminal convictions or legal cases re-lated to corruption (e.g., Italy and the US, see Goeland Nelson 2011), these are the macro data avail-able, and they have, despite their weaknesses, givena significant boost to research into the causes of cor-ruption during the past decade. In fact, 35 (and stillcounting) published, empirical studies have investi-gated the relationship between these indices and atleast 75 potential causes of corruption.
The potential causes can usefully be divided intofour groups: (1) economic and demographic factors;(2) political institutions; (3) judicial and bureaucrat-ic factors; and (4) geographical and cultural factors.The typical study limits attention to a small numberof potential causes of particular interest and exam-ines the reliability of the results by varying the set ofcontrol variables (see, e.g., Treisman 2000, Paldam2002 or Lambsdorff (2005) for examples of this ap-proach). Unfortunately, it is not uncommon to dis-cover that variables – such as press freedom, the sizeof the public sector, economicfreedom or the level of democra-cy – found to be significantly cor-related with corruption in onestudy are insignificant in anotherwhich uses an alternative modelspecification. Moreover, Treisman(2007) points out that “standard”determinants of perceived corrup-tion, such as GDP per capita andmeasures of political and bureau-cratic institutions, are largely un-correlated with measures of ex-perienced corruption. This is clear-ly unsettling. One way out of theforest, originally proposed bySala-i-Martin (1997) in a differentcontext, is to use so-called Sensi-tivity Analysis to establish whichof the many potential determi-nants or causes are robustly cor-related with corruption. This in-volves a systematic evaluation ofall possible linear (regression) mo-dels with corruption as the depen-dent variable and a fixed numberof potential determinants (typi-cally 3 to 5) from the target list ofup to 75 as the explanatory vari-ables. Sala-i-Martin (1997)’s crite-
rion for robustness is that 95 percent of the cumulat-ed density associated with the estimated coefficientson the variable of interest (e.g., GDP per capita)across all the models considered should be on oneside of zero. Sturm and de Haan (2005), however,advocate going one step further and demand that arobust variable should be significant at the 5 percentlevel in at least 90 percent of all the regressions con-sidered (test 1) and when there is more than one out-come variable (as is the case with corruption whereone needs to study alternative indices) that thisshould be true for the majority of outcome variablesconsidered (test 2). The result of such a SensitivityAnalysis applied to the determinants of five widelyused corruption perception indices (including thethree mentioned above) are reported in de Haanand Seldadyo (2005) and Seldadyo (2008). The Tablesummarises the results by listing the 12 most robustdeterminants of corruption and their correlationwith corruption. All 12 variables pass Sala-i-Martin(1997)’s criterion for robustness for at least one cor-ruption index, but we see that only six, in addition,pass test 1 and that only two pass test 2. Based on
Table
The top-12 most robust determinants of cross-national corruption perceptions
Variable name GroupSign of
correlationTest 1 Test 2
Government effectiveness (3) (–) Yes Yes
Rule of law (3) (–) Yes Yes
GDP per capita (1) (–) Yes No
Regulatory quality (3) (–) Yes No
Political polarisation (2) (–) Yes No
Protestant fraction of thepopulation (4) (–) Yes No
Presidentialism (2) (–) No No
Absolute latitude (4) (–) No No
Voice and accountability (2) (–) No No
Wage bill in % of GDP (3) (+) No No
Population size (1) (+) No No
Economic freedom (1) (–) No No
Notes: For the full set of variables included in the Sensitivity Analysis and forinformation on definitions and sources, see Appendix 2 in Seldadyo (2008).The 12 variables are the only ones that pass Sala-i-Martin’s criterion forrobustness for at least one of the five corruption perception indices studied.“Group” refers to the four categories of causes of corruption listed in themain text. “Sign of correlation” refers to the sign of the coefficient on therelevant variable in 95% of the regressions. The outcome variable of theseregressions is one of the five corruption indices, ordered such that highervalues mean higher levels of corruption. Each regression includes up-to-threepotential determinants, lagged by a suitable number of years. “Test 1” re-quires that the variable is significant at the 5% level in at least 90% of allthe regressions considered. “Test 2” requires that test 1 is passed for three ofthe five corruption perception indices considered.
Source: Seldadyo (2008: chapter 3).

this, the two most robust determinants of corruptionare “government effectiveness” and “rule of law”,from the World Bank’s Governance Matter Data-base (Kaufmann et al. 2006). Both of these variablescorrelate negatively with perceived corruption, how-ever measured. “Government effectiveness” is a com-posite index related to the quality of public services,the quality of the bureaucracy, the competency ofcivil servants, and to the independence of the civilservice from political pressures, while “rule of law” isan index related to the extent to which agents haveconfidence in and abide the rules of society, the ef-fectiveness and predictability of the judiciary and theenforceability of contracts. A single variable fromeach of the groups also passes test 1 (but not test 2).They are GDP per capita, the degree of politicalpolarisation, regulatory quality and the fraction ofProtestants in the population, which are all negative-ly correlated with corruption.
While the Sensitivity Analysis methodology is help-ful in finding robust correlations, it does not resolvethe much more thorny issue of causality. In fact, formany of the variables that make it to top-12, we sus-pect that the causality might run the other way. Forexample, perhaps the government is effectivebecause corruption is low; or agents have trust in therule of law because corruption is low; and GDP percapita is high because of low corruption, rather thanthe other way around.1
The corruption-development nexus
The question of causality is particularly pressing inthe case of the corruption-development nexus. Doesthe strong and robust correlation between GDP percapita and the various corruption indices tell us thatdevelopment reduces corruption or does it tell usthat corruption is an obstacle to development? Bothdirections of causation are plausible. On the onehand, corruption feeds on rents, and corrupt publicofficials have an incentive to create and maintainrent-creating but inefficient economic policies. Thelikely consequence of such inefficiencies is a reduc-tion in national income. Likewise, corruption oftenworks as a tax on factor accumulation and on invest-ments in manufactured and human capital. This canretard economic growth. On the other hand, highlevels of national income may be associated with a
greater willingness to combat corruption or, moresubtlety, high economic growth may provide incen-tives for public officials to eliminate corruption-in-duced economic inefficiencies in the present in orderto hang on to their office or job for the future whereeven bigger rents can be extracted (Aidt and Dutta2008). It is, of course, also possible that GDP percapita and corruption are jointly determined andcaused by the same underlying institutional or cul-tural factors.
Recent research has made some headway in sortingout this puzzle. When applied at the macro level, thetheories of corruption based on social interaction ef-fects suggest that corruption and economic develop-ment may feed on each other and that we should,therefore, not expect to observe simple linear andunidirectional relationships between proxies for thetwo. Corruption-development traps may lock somecountries into a “bad” equilibrium with high-corrup-tion-low-growth, while others may converge to a“good” equilibrium with low-corruption-high-growth(Blackburn et al. 2006). Aidt et al. (2008) and Aidt(2009) model such interdependencies empiricallyand find robust evidence that countries endogenous-ly sort themselves into different corruption-growthregimes depending on the initial quality of theirpolitical institutions, and that, in the short to mediumrun, corruption and growth feed on each other: highgrowth tends to lower corruption which, in turn, en-hances the growth potential. Moreover, using instru-mental variables to isolate the link from corruptionto growth, it appears that conditional on convergingto the “bad” equilibrium, corruption has little effecton growth, while the impact is large and negative forcountries converging to the “good” equilibrium.
Gundlach and Paldam (2009), on the other hand, in-quire into the causal order over the very long run.Their starting point is the widely accepted assump-tion that all countries had more or less the same(low) level of income per capita about 200 years agoand that the actual cross-national income distribu-tion today, therefore, effectively represents differ-ences in long-run growth rates. The work by Dia-mond (1997), moreover, suggests that deep pre-his-torical factors, such as the number of domesticablebig mammals in pre-history, the number of domesti-cable wild grasses in pre-history, climatic conditionsfavourable for agriculture, relative East–West orien-tation, etc., sowed the seeds that explain cross-na-tional income patterns today. Since one can reason-ably assume that such factors are exogenous to cur-
CESifo DICE Report 2/2011 18
Forum
1 Seldadyo (2008) uses lagged values of the potential determinantsin his Sensitivity Analysis to partially address this issue.

CESifo DICE Report 2/201119
Forum
rent corruption patterns, they can, in principle, beused as instruments for national income in an esti-mation of the income effect on corruption. Based onthis approach, Gundlach and Paldam (2009) con-clude unambiguously that the long-run causalityruns from (high) income to (low) corruption or asthey put it, societies grow honest. Adding the twopieces of evidence, it appears that in the short tomedium run, corruption and economic developmentfeed on each other in a self-reinforcing social pro-cess,2 while in the very long run, the process of devel-opment dominates and is what causes corruptionlevels to fall. The precise mechanism through whichthis is supposed to happen remains, however, unclear,but we may conjecture that it has to do with invest-ments in stronger and more robust institutions.
Concluding remarks
So what are the causes of corruption? The shortanswer is that many factors play a role and in differ-ent ways at different time horizons. Yet, for practicalpurposes, applying the two general principles – insti-tutional weaknesses and social interaction effects –alluded to above will in most cases not miss the tar-get too badly and, therefore, offer a workable guideto those interested in understanding the causes ofcorruption and in doing something about them.
References
Aidt, T. S. and J. Dutta (2008), “Policy Compromises: Corruptionand Regulation in a Democracy”, Economics and Politics 20(3),335–60.
Aidt, T. S., J. Dutta and V. Sena (2008), “Governance Regimes,Corruption and Growth:Theory and Evidence”, Journal of Compa-rative Economics 36, 195–220.
Aidt, T. S. (2009), “Corruption, Institutions and Economic De-velopment”, Oxford Review of Economic Policy 25, 271–91.
Andvig, J. C. and K. O. Moene (1990), “How Corruption may Cor-rupt”, Journal of Economic Behaviour and Organization 13(1),63–76.
Blackburn, K., N. Bose and E. M. Haque (2006),“The Incidence andPersistence of Corruption in Economic Development”, Journal ofEconomic Dynamics and Control 30, 2447–67.
de Haan, J. and H. Seldadyo (2005), “The Determinants ofCorruption: A Reinvestigation”, unpublished paper prepared forthe EPCS-2005 Conference Durham, England, 31 March–3 April2005.
Diamond, J. (1997), Guns, Germs, and Steel: The Fates of HumanSocieties, Norton, New York.
Goel, R. K. and M. A. Nelson (2011), “Measures of Corruption andDeterminants of US Corruption”, Economics of Governance, inpress.
Gundlach, E. and M. Paldam (2009), “The Transition of Corruption:From Poverty to Honesty”, Economics Letters 103(3), 146–48.
Jain A. K. (2001), “Corruption: A Review”, Journal of EconomicSurveys 15(1), 71–121.
Kaufmann, D., A. Kraay and M. Mastruzzi (2006), “MeasuringGovernance Using Cross-country Perceptions Data”, in S. Rose-Ackerman, ed., International Handbook on the Economics of Cor-ruption, Edward Elgar, Cheltenham, UK.
Lambsdorff, J. G. (2005), Consequences and Causes of Corruption:What do We Know from a Cross-Section of Countries?, Universityof Passau, Passau.
Paldam, M. (2002), “The Cross-country Pattern of Corruption:Economics, Culture and the Seesaw Dynamics”, European Journalof Political Economy 18(2), 215–40.
Rose-Ackerman, S. (1999), Corruption and Government, Causes,Consequences and Reform, Cambridge University Press, Cam-bridge, UK.
Sala-i-Martin, X. X. (1997), “I Just Ran Two Million Regressions”,American Economic Review, Papers and Proceedings 87(2), 178–83.
Seldadyo, H. (2008), Corruption and Governance Around theWorld: An Empirical Investigation, Ph.D. dissertation, Rijks-universiteit Groningen, PPI Publishers, Enschede, The Netherlands.http://dissertations.ub.rug.nl/FILES/faculties/feb/2008/h.s.gunar-di/11_thesis.pdf
Shleifer, A. and R. W. Vishny (1993), “Corruption”, QuarterlyJournal of Economics 108, 599–618.
Sturm, J.-E. and J. de Haan (2005), “Determinants of Long TermGrowth: New Results Applying Robust Estimation and ExtremeBounds Analysis”, Empirical Economics 30(3), 597–617.
Tanzi, V. (1998), “Corruption Around the World: Causes, Conse-quences, Scope and Cures”, IMF Staff Papers 45 (4), 559–94.
Treisman, D. (2000), “The Causes of Corruption: A Cross-nationalStudy”, Journal of Public Economics 76, 399–57.
Treisman, D. (2007), “What Have we Learned About the Causes ofCorruption From Ten Years of Cross-national Empirical Re-search?”, Annual Review of Political Science 10, 211–44.
2 Paldam (2002) refers to this as seesaw dynamics.

CORRUPTION AND
INEQUALITY
ERIC M. USLANER*
Introduction
Corruption flouts rules of fairness and gives somepeople advantages that others do not have. Cor-ruption transfers resources from the mass publicto the elites – and generally from the poor to therich (Tanzi 1998). It acts as an extra tax on citi-zens, leaving less money for public expenditures.Corrupt governments have less money to spendon their own projects, pushing down the salariesof public employees. In turn, these lower-levelstaffers will be more likely to extort funds fromthe public purse. Government employees in cor-rupt societies will thus spend more time liningtheir own pockets than serving the public.Corruption thus leads to lower levels of econom-ic growth and to ineffective government (Mauro1997; 5, 7).
Most accounts of the roots and remedies for cor-ruption are institutional. Corruption, most acade-mic and policy analysts argue, stems from badgovernmental institutions – especially the lack ofdemocracy, free and unfair elections, and an inef-fective judiciary. I argue that institutional accountsof the roots – and the solutions – to corruption arelacking (Uslaner 2008). In an extensive six-equa-tion model of corruption across a wide range ofsocieties, I find little support for institutional ac-counts of corruption. Corruption is not shaped bydemocracy, the structure of a country’s electoralsystem, whether government is centralized ordecentralized (measured by federalism) or by theshare of a country’s government expendituresspent at the local or national level.
Inequality and corruption
The link between inequality and corruption seemscompelling. Corruption is exploitive. Inequalitybreeds corruption by: (1) leading ordinary citizens tosee the system as stacked against them (Uslaner2002, 181–83); (2) creating a sense of dependencyamong ordinary citizens and a sense of pessimism forthe future, which in turn undermines the moral dic-tates of treating neighbors honestly; and (3) distort-ing the key institutions of fairness in society, thecourts, which ordinary citizens see as their protectorsagainst evil-doers, especially those with more influ-ence than they have (Glaeser, Scheinkman andSchleifer 2003; You and Khagram 2005).
Economic inequality creates political leaders whomake patronage a virtue rather than a vice, since itprovides jobs for ordinary citizens. These leadershelp their constituents, but more critically they help
themselves. Inequality breeds corruption and leadsto a dependency of the poor on the political leaders.Inequality leads to clientelism – leaders establishthemselves as monopoly providers of benefits foraverage citizens. Ordinary people do not approve of
corruption: Those at the bottom of the economic(and often social) ladder see it as necessary for sur-vival. Corrupt leaders form the key line of defenseagainst other groups in society that exploit you.
The inequality trap
Inequality thrives when there is low trust in out-groupsand high trust in your own group, as Gambetta (1993)argues with respect to the success of the Mafia insouthern Italy, widely known for low trust among itscitizens (Banfield 1958). Unequal relations betweengroups in society – whether they are economic, reli-gious, racial, or some combination – reinforce ties toyour in-group. High levels of inequality are the singlemajor factor driving down trust in people who are dif-ferent from yourself (generalized trust), as Uslaner(2002, chs. 6, 8) and Uslaner and Brown (2005) haveshown in several different contexts: in the UnitedStates over time, across the American states and acrosscountries without a legacy of Communism.
CESifo DICE Report 2/2011 20
Forum
*University of Maryland – College Park.

CESifo DICE Report 2/201121
Forum
Generalized trust has many positive consequences:at the individual level, it leads to more acts of altru-ism for people of different backgrounds as well asgreater tolerance. At the aggregate level, it leads togreater economic growth, to more redistribution fromthe rich to the poor and to less corruption (Uslaner2002, chs. 7, 8; Uslaner 2008).
Across countries, the correlation between inequalityand corruption is weak. But there is strong supportfor the argument that inequality leads to greater cor-ruption through trust. My model suggests the follow-ing dynamic of a vicious circle that makes it difficultto end corruption:
inequality → low trust → corruption → more inequality.
Corruption not only thrives under conditions of highinequality and low trust, but in turn it leads to moreinequality (and thus less trust). For many countries,the trap is inescapable. Corruption aggravatesinequality: The well-off can afford bribes, but thepoor often do without basic services. And corruptionrobs the state of resources for providing basic ser-vices to all citizens, but especially the poor. Peoplewho turn to the informal economy have few legalrights (their employment is not legal and there areno contracts or unions representing workers in theinformal sector). Corruption is rampant in those ser-vices the poor most depend upon: the police, theschools and the medical sector.
Countries with high levels of corruption have poor ser-vice delivery. The failure of corrupt states with risinginequality to provide basic services illustrates the in-equality trap: the wealthy have options to protectthemselves against the failure of public services. Theymay bribe local authorities to ensure that their servicesare fixed first. They may not have to rely exclusivelyupon state-provided services. The poor cannot affordbribes. Nor do they have the option of using alternativeservices. When governments do not have the resourcesto provide services, the poor will suffer more. In theformer Communist countries of central and easternEurope there are strong statistical linkages betweenlevels of inequality, corruption, and the perceived qual-ity of service delivery. Poor service delivery in turnleads to lower levels of trust in government – whichthen leads to greater tax evasion – and fewer resourcesin the treasury to fund basic services (Hanousek andPalda 2007; Uslaner 2010; Uslaner in press).
Inequality, trust and corruption form a vicious circlethat is very difficult to break. Inequality, trust and
corruption are all “sticky”.They do not change muchover time, so that countries that were unequal (lowtrusting, corrupt) in the past remain so today. Thecorrelations over time for trust (from 1980 to 1995),economic inequality (1963 to 1996 for one measureand 1980–90 for another), and corruption (1980/85 to2010) are all very powerful, providing strong supportfor the inequality trap argument. I estimated a cross-national aggregate statistical model – allowing for re-ciprocal effects of inequality upon corruption, trustupon corruption and inequality upon trust – andfound very strong evidence in favor of the inequalitytrap argument (Uslaner 2008, chs. 2, 4).
What about institutions? Social scientists do not havethe luxury of laboratory experiments the way physicaland natural scientists do, so we largely have to relyupon cross-sectional models. However, in the late1980s and early 1990s we had a rare opportunity toobserve a natural experiment, as Communist govern-ments fell in central and eastern Europe as well as Asiaand democratic governments emerged in many otherparts of the world as well. Either cross-sectionally orespecially over time, the relationships between democ-racy and corruption are very weak. Most notably, thecorrelations between changes in the Freedom Housemeasures of democracy (political and civil rights indi-cators) and changes in the Transparency Internationalindicator of corruption from 1980 to 2004 are essen-tially zero. Moving the start date closer to the fall ofCommunism – 1988 – does nothing to change thesecorrelations. Greater democratization simply does notmean less corruption.
Not only does democracy not matter, but almost allother institutional “causes” of corruption fall to sta-tistical insignificance in my model: parliamentary sys-tems, type of electoral list, the type of executive, thelevel of pay to government workers, and centraliza-tion of government. Nor does a free press act as a bul-wark against corruption: many people are likely to seethe press as just one more competitor for power withcorrupt leaders – not necessarily any more “moral”.
There is one institutional factor that has a big impacton corruption: the fairness of the legal system.This isan institutional measure of inequality: whether thecourts and the police treat people of different back-grounds and incomes as equals before the law. It isnot the same as a measure of judicial quality or thenumber of courts or how “efficient” they are. Whatmatters for the courts is the perception that they arefair (Tyler 1990).

Democratization seemed to promise a new era forpeople in transition countries in particular. Roman-ians, Bulgarians, Serbs and others in central and east-ern Europe and the former Soviet states in Asia sawthe emergence of market democracy as their ticketto prosperity, to making their countries just like Lu-xembourg. But the reality was very different: in vir-tually every transition country, inequality, the size ofthe informal sector, and corruption increased – whiletrust remained low. Democracy and the market werenot cure-alls. Newly enfranchised voters cast theirballots for corrupt leaders (as Americans did formany years and people in many other countries. Ad-vanced democracies such as Italy and Japan as wellas Third World nations still do. Markets were oftendominated by the old oligarchs of the Communist re-gimes who continued to pillage the country undercapitalism as they had done under socialism. Arrestsof corrupt business people such as Mikhail Khodor-kovsky in Russia were political vendettas more thanthey were drives toward greater transparency.
Inequality and corruption: the direct links
The inequality trap argument would be more com-pelling if there were some evidence that there is adirect linkage from inequality to trust rather thansimply an indirect one. Where corruption is high (inAfrica and central and eastern Europe), there isstrong evidence for such a direct linkage in publicattitudes. Where corruption is low (the Nordic coun-tries, the United States and Singapore), people donot see a direct tie between corruption and inequal-ity (Uslaner 2008, chs. 4, 5, 6, 7).
Inequality is a persistent prob-lem in Africa. Williams (1987,130) argues, “In the conditions ofunderdevelopment, with their at-tendant shortages and paucity ofresources, corruption tends most-ly to accentuate and aggravate thepolitical and economic inequali-ties which have characterized somay African states for so long.”While historically low in transi-tion countries, inequality rosesharply after the fall of Commu-nism. In transition countries, mostpeople believe that the only wayyou can become rich is by beingdishonest. In the 1999 Internation-
al Social Survey Programme, 51.8 percent of the re-spondents in the nine transition countries surveyedbelieved that to get to the top, you must be corruptcompared to 28.3 percent on average in the other 18countries (mostly Western democracies). FormerKazakh Prime Minister Akezhan Kazhegeldin said ofcorruption: “There is a small group of people gettingrich – and I mean really rich – in Kazakhstan whilethe rest of society remains really poor. The leader-ship is not interested in pushing a market economy.They keep two sets of books, one for themselves andanother for everyone else” (Stodghill 2006, BU9).
Using data from the Afrobarometer and surveysfrom the World Bank, the government of Estonia,and a Romanian colleague, I show that: (1) the pub-lic is far more likely to see high levels of corruptionthan are elites; (2) people see a clear link betweenboth economic and legal inequality, on the one hand,and corruption on the other hand; and (3) grand cor-ruption, but not petty corruption, leads to lower lev-els of trust.
Grand corruption involves extending the advantagesof those already well endowed. Petty corruptiondoes not affect how people judge each other. Smallbribes to see the doctor earlier, to get out of a trafficoffense, to obtain a permit or a public service, oreven to get a good grade from university professorsdo not enrich the recipients. They may reap enoughto take their spouse out to dinner, but not to ownmansions in Europe or to have hefty bank accountsin Switzerland or the Cayman Islands. Petty corrup-tion may even be seen as “rational bargains” for theaverage citizen: it may well be worth your while to
CESifo DICE Report 2/2011 22
Forum
0.0
0.2
0.4
0.6
0.8
1.0
2 3 4 5 6 7 8 9 10
Source: International Crime Victimization Survey (ICVS) and Corruption Perceptions Index of Transparency International (IT).
PICKPOCKETING AND CORRUPTION
TI corruption perceptions index 2005
Pickpocketing frequency (ICVS)
DEa)
UK
AT
BG
CZ
IT
DK
ROBY
LV
LTJP
SK
PL
HR
NL
UGRU
ES
FIEE
HU
NZCA
US AU
NO
PT
r2 = 0.659 N = 48
CR
a) West Germany
FR
BE
BW
IN
TN
ZA
ID PHAR
BR
CNUA
CORSGE
SI SE
EG
CH
Figure

CESifo DICE Report 2/201123
Forum
pay a small bribe rather than to spend a day in courtor wait hours at the doctor’s office. The political bossGeorge Washington Plunkitt in nineteenth-centuryNew York City distinguished between “honest graft”and “dishonest graft” (Riordan 1948).
Grand corruption, not small bribes, upsets people andleads to lower levels of trust in fellow citizens. I ob-tained similar results using different surveys in Ro-mania and Africa (Uslaner 2008, chs. 5 and 8). A 2008cable from the American Embassy in Tunis to the StateDepartment in Washington, made public by WikiLeaksand entitled, “What’s Yours Is Mine”, found the samedynamic underlying the unrest that ultimately toppledthe government of Tunisia: “Although the petty cor-ruption rankles, it is the excesses of President (Zine el-Abidine) Ben Ali’s family that inspire outrage amongTunisians” (Shane 2011).
Grand corruption reinforces the argument of the(late) comedian George Carlin that “honesty is thesecond best policy”. A corrupt political culture goeshand-in-hand with other economic crimes – but notcrimes of violence. Notably, there is a powerful cor-relation between the level of corruption in a societyand the frequency of pickpocketing (Uslaner 2008,ch. 3; see Figure 1).
Where corruption is relatively low, people do not seea direct connection among inequality, trust and cor-ruption. Using surveys from the Nordic countries(the World Values Survey 1995), the American Na-tional Election Study (2004), the General Social Sur-vey in the United States (1987) and the Asian Ba-rometer 2004 for Singapore, I find no relationship be-tween perceptions of inequality or social trust andcorruption. And this is exactly how it should be. Lowcorruption was not born with American indepen-dence. Stories of malfeasance were common, especial-ly in large cities and the South, in the United States –and it reflected high levels of inequality. Using dataon historical inequality in the United States fromEmmanuel Saez and Claudia Goldin’s time series esti-mates (with Edward Glaeser) of corruption frompress reports, I find that inequality explains 45 percentof the variance in inequality over 59 years (1916–74).
Is there a way out of the inequality trap?
Most countries that are highly unequal, with lowtrust and corruption remain so. But not all do so.There are at least three exceptions: Singapore, Hong
Kong and Botswana – three places that do not imme-diately come to mind as having much in common.But all three “conquered” corruption – and two (Sin-gapore and Hong Kong) are not democracies.
How did they do it? Of course, each had strong anti-corruption commissions. Hong Kong’s and Singapore’scommissions are widely known. But Nigeria has hadmany anti-corruption commissions, and most peoplesee these commissions as facilitators, not obstacles,to corruption.The common elements in the strugglesagainst corruption in Singapore, Hong Kong andBotswana are:
• Small size, so that it is easier to monitor corrup-tion.
• Relative wealth, so that conquering corruptionwas less costly.
• More critically, government policies designed toengage the public in the anti-corruption cam-paign, from lessons in morality in elementaryschool, to mass campaigns to report illegal actsand, especially, government programs to enhancethe welfare of ordinary people – all aimed at re-ducing inequality, so that the public felt little needto support corrupt leaders.
• Finally, and perhaps most importantly, all threeplaces faced external threats: Botswana was sur-rounded by South Africa and (then-called) Rho-desia. Singapore and Hong Kong faced threats totheir economic and political systems by radicalunions supported by China. Their leaders mayhave seemed “enlightened”, but enlightenment iseasier when the survival of your regime is at stake.To gain the support of their publics against theiropposition, the leaders had to make the lives oftheir citizens better. To do so, they needed to in-crease public welfare and to make the investmentclimate stronger. Singapore and Hong Kong be-came rich (and Botswana relatively well-off) by be-ing honest and improving the lives of their citizens.
The “way out” of the inequality trap, then, is to freeordinary people from having to depend upon cor-rupt leaders for their livelihood. Universalistic socialwelfare programs, as practiced in the Nordic coun-tries, are the most likely to reduce inequality andmake the lives of all citizens better as well as toincrease social trust (Rothstein and Uslaner 2005).And the universal social welfare program that worksbest to reduce inequality is universal free public edu-cation. The “biggest successes” in the fight againstcorruption throughout history – from the Nordiccountries to the United States and South Korea –

have occurred in countries that have adopted uni-versal public education (Uslaner 2008, ch. 9).
This is a daunting task for at least two reasons. First,when people see the rich getting richer and the poorgetting poorer, they are more likely to demand redis-tributive social welfare programs rather than univer-salistic policies. If the rich get rich by being corrupt,why should they or their children share in the boun-ty of programs Rothstein and I have called “all forall”? Second, universal public education is extreme-ly expensive. Wherever I talk about this “remedy”,policy-makers and academics alike shake their headsand say that their (poor) country simply cannotafford it. I ask them how long they can “afford” highlevels of corruption.
References
Banfield, E. (1958), The Moral Basis of a Backward Society, FreePress, New York.
Gambetta, D. (1993), The Sicilian Mafia: The Business of PrivateProtection, Harvard University Press, Cambridge, MA.
Glaeser, E. L., J. Scheinkman and A. Shleifer (2003), “The Injusticeof Inequality”, Journal of Monetary Economics 50, 199–222.
Hanousek, J. and F. Palda (2006), “Quality of Government Servicesand the Civic Duty to Pay Taxes in the Czech and Slovak Republics,and other Transition Countries”, in N. Hayoz and S. Hug, eds., Trust,Institutions, and State Capacities: A Comparative Study, PeterLang AG, Bern, Switzerland, 327–60.
Mauro, P. (1997), “Why Worry About Corruption?” Washington:International Monetary Fund.
Riordan, W. (1948), Plunkitt of Tammany Hall, Alfred A. Knopf,New York..Rothstein, B. and E. M. Uslaner (2005), “All for All: Equality,Corruption, and Social Trust”, World Politics 58, 41–72.
Shane, S. (2011), “Cables from American Diplomats Portray U.S.Ambivalence on Tunisia”, New York Times, January 11,http://www.nytimes.com/2011/01/16/world/africa/16cables.html?_r=1&scp=5&sq=corruption%20tunisia&st=cse (accessed January 24,2011).
Stodghill, R. (2006), “Oil, Cash, and Corruption: How InfluenceFlowed Through Political Pipeline”, New York Times, Washingtonedition (November 5), BU1, BU8–BU9.
Tanzi, V. (1998), “Corruption Around the World: Causes, Conse-quences, Scope and Cures”, IMF Staff Papers 45, 559–94.
Tyler, T. (1990), Why People Obey the Law, Yale University Press,New Haven.
Uslaner, E. M. (2002), The Moral Foundations of Trust, CambridgeUniversity Press, New York.
Uslaner, E. M. (2008), Corruption, Inequality, and the Rule of Law,Cambridge University Press, New York.
Uslaner, E. M. (2010), “Tax Evasion, Corruption, and the SocialContract in Transition”, in J. Alm, J. Martinez-Vazquez and B.Torgler, eds., Developing Alternative Frameworks for ExplainingCompliance, Routledge, London, 206–25.
Uslaner, E. M., “The Inequality Trap and Trust in Government”, inM. Hooghe and S. Zmerli, eds., Political Trust: Why Context Mat-ters. Causes and Consequences of a Relational Concept, ECPRPress, Essex, UK, in press.
Uslaner, E. M. and M. Brown (2005), “Inequality, Trust, and CivicEngagement”, American Politics Research 31, 868–94.
Williams, R. (1987), Political Corruption in Africa, GowerPublishing, Aldershot, UK.
You, J. and S. Khagram (2005), “A Comparative Study of Inequalityand Corruption”, American Sociological Review 70 (February),136–57.
CESifo DICE Report 2/2011 24
Forum

CESifo DICE Report 2/201125
Forum
ECONOMIC APPROACHES TO
ANTICORRUPTION
JOHANN GRAF LAMBSDORFF*
Introduction
Fighting corruption has played a prominent role inresearch in the last 15 years. Countries where briberyand embezzlement among public servants and politi-cians are effectively contained allocate capital moreefficiently, grow faster, preserve the environment,attract investors, avoid inequality in income andwealth, enhance trust in politics and foster happinessamong its citizens (Lambsdorff 2007). The empiricalevidence is strong and has focused attention on thenecessity of good governance.
At the same time there is little consensus on howto contain corruption. Some economists have ad-vocated the idea that corruption is necessarilya consequence of bureaucracy and government.Downsizing the public sector was thus seen as aremedy. The resulting implementation of privati-zation and deregulation has often failed, however,and even led to increased rather than decreasedcorruption. Political reform, suchas strengthening participatorygovernment, democracy and de-centralization, are guiding prin-ciples in their own right, but donot necessarily offer the silver bul-let that helps reduce overall cor-ruption. Instead they can gener-ate transitory problems that mayeasily go along with increasedcorruption.
Legal reform has been given con-siderable attention lately, particu-larly in connection with criminallaw. Milestones include the 1997
OECD convention, where all member states commit-ted themselves to enact laws criminalizing the briberyof foreign officials and in 2003 the United NationsConvention Against Corruption, where 140 signingstates agreed to fight corruption in all of its forms.
There is a widespread consensus that incentives forcitizens, businesspeople, politicians and public servantsmust be created that discourage bribery. It should beturned from a high profit and low risk strategy to arisky activity that promises only little gain. But whatare the risks that corrupt actors are exposed to? Andhow can we modify them? There is little doubt thatsevere penalties and high risks of detection are crucial.But can such an approach be successful when prose-cutors are not independent, judges poorly paid, lobby-ists masters of camouflage, businesspeople in search oflegal loopholes and politicians willing to offer benefitsfor a price?
Approaches to anticorruption
Given the difficulties of fighting corruption, thechances for good governance frequently appearrather poor, particularly when observing how costlyit may be to pay high salaries in the public sector andmaintain necessary control mechanisms.
*University of Passau, Germany.
0
10
20
30
40
50
60
0 1 2 3 4 5 6 7 8 9 10
Source: World Bank.
CORRUPTION AND POVERTY
Corruption perceptions index 2008
Income per head in USD 1 000, 2007
Bhutan
Luxembourg
New Zealand
Chile
UruguaySaint Lucia
St. Vincent and the Grenadines
Greece
Saudi ArabiaEquatorial Guinea
LibyaRussia
VenezuelaBelarus
Botswana
Cape Verde
JordanDominica
Norway
Figure 1

This may explain why, as shown in Figure 1, there isa strong correlation between poverty and corrup-tion. Rich countries such as Luxembourg, Norway,Denmark, Germany or the United States performmuch better than poor countries such as Zimbabwe,Afghanistan or Myanmar. Some outliers, however,are also noteworthy. Countries endowed with rawmaterials such as Saudi Arabia, Equatorial Guineaand Russia are rich but marked by higher levels ofcorruption. Other countries such as Chile, Jordan orBotswana are rather poor but still successful in con-taining corruption. Can they teach us a lesson?
Data on convictions related to fraud are also illus-trative (even when recognizing that definitions andaggregation may differ from one country to anoth-er). More convictions suggest that a higher level ofdeterrence is achieved. This helps reduce perceivedlevels of corruption, as shown in Figure 2. Yet, thecorrelation is rather poor. One is tempted to reasonthat convictions in court may explain only a smallfraction of the risk faced by potential perpetrators. Itis noteworthy to see Chile again as an outlier. Thenumber of convictions is rather small relative to thecountry’s success in containing corruption.
Corrupt reciprocity
In addition to deterrence there are numerous otherpreventive measures that are salient in reducing cor-ruption. These range from eliminating distortingstate intervention, simplification of rules and proce-dures, to administrative rules or procurement law.I want to discuss one aspect that has become the fo-
cus of scrutiny lately. Corruptionis an arduous type of business, andone approach for reform concen-trates on rendering corrupt trans-actions even more troublesome.
Bribe paying companies are oftenbetrayed. After receiving a pay-ment, public servants and politi-cians fail to deliver the promisedservice. Other companies are ex-torted, threatened with criminalprosecution or forced to pay an-other bribe. The Wall Street Jour-nal (31 January 2007) reportedthe prosecutorial investigation ofM. Kutschenreuter, an executivemanager at the German Siemens.
A former Saudi-Arabian local representative, whosecontract had been cancelled by Siemens, he alleged-ly blackmailed the firm. He requested more thanUSD 900 million as hush money and threatened topass on documents about corruption in telecommu-nications contracts to the SEC. In negotiations bothsides agreed on a payment of USD 50 million.
This case study is symptomatic for corrupt transac-tions. The risks of mutual betrayal are manifold, asthe following cartoon illustrates. Corruption requirescriminal expertise. Money flows must be camou-flaged, measures against blackmailing must be taken,and, foremost, the enforcement of promised servicesmust be ensured. Those who engage in this business
CESifo DICE Report 2/2011 26
Forum
0
1
10
100
1 000
0 1 2 3 4 5 6 7 8 9 10
Source: United Nations (2007), Survey of Crime Trends and Operations of Criminal Justice Systems.
PERCEIVED CORRUPTION AND THE NUMBER OF CONVICTIONS
Corruption perceptions index 2008
Convictions related to fraud per 100,000 inhabitants in 2004
Czech Rep.
Bahrain
Germany
Finland
Netherlands
Chile
Ecuador
Uganda
Costa Rica
Poland
KoreaCroatia
Belanus AlgeriaPalestine
Figure 2
“A man of principle. He accepted the bribe but he wouldn’t give me the license because that would be against the rules”Source: Laxman, Times of India

CESifo DICE Report 2/201127
Forum
delve into a criminal sphere in which networks are asimportant as mutual trust. Trust, on the other hand,must be complemented by credible threats to retali-ate malfeasance (Gambetta 2009).
This is well illustrated by another recent case, docu-mented on 26 June 2007 by the Süddeutsche Zei-tung. In a recent trial in Munich, Germany, HolgerPfahls was charged with accepting bribes while hold-ing a position of a defense secretary under formerChancellor Helmut Kohl from 1989 to 1992. He was ac-cused and found guilty of accepting the equivalent ofalmost EUR 2 million from German-Canadian busi-nessman Karlheinz Schreiber for pushing through adeal to deliver 36 Fuchs armored vehicles to SaudiArabia. In court Mr Pfahls is quoted as giving the fol-lowing description of the alleged briber (own transla-tion): “Schreiber told me that I was just one out ofmany who receives bribes. When Schreiber hatessomeone, his hatred is so profound that he wants todestroy him, even if that means his own demise. Onthe other hand, he is a real buddy, highly talented increating a pleasant atmosphere.” Mr Schreiber hasmastered the skill of creating a pleasant trusted at-mosphere while at the same time threatening retalia-tion, forcing his counterparts to honor their promises.
Empirically there is also a strong correlation betweenthe likelihood to pay a bribe and confidence in cor-rupt reciprocity. Figure 3 shows data from a 2009worldwide survey of households (Transparency Inter-national 2009). Households in 66 countries were asked,first, whether they paid a bribe in the last 12 monthsand, second, whether the delivery of the corrupt serviceis certain after making such payments. As shown, thelikelihood of paying bribes increases with the certain-
ty of delivery. Among households that are extremelycertain about the delivery 28 percent pay bribes. Butonly 13 percent of households pay bribes if they areextremely uncertain whether a bribed public officialwill deliver the corrupt service.
This finding provokes a novel approach to reform.The frequency of bribery can be reduced by render-ing reciprocity uncertain, by undermining the stabil-ity of corrupt transactions. I labeled this method foranticorruption “the principle of the invisible foot”(Lambsdorff 2007, 2009). The wording is chosen inline with the well-known economic principle of theinvisible hand. Outcomes desired by society can beachieved without altruistically motivated individuals.In the words of Adam Smith (1776, 16): “It is notfrom the benevolence of the butcher, the brewer, orthe baker that we expect our dinner, but from theirregard to their own interest.” The invisible hand ofmarket competition assures the desired outcomes. Amechanism is in place that substitutes for a lack ofindividual morality.
This poses the question whether we have a similarmechanism at our disposal for ensuring good gover-nance. Can there be good governance without bene-volent politicians and without altruistic public ser-vants? Competition does not represent this type ofmechanism, because corrupt politicians may have anedge over their competitors in gaining funding, re-cruiting loyal followers and organizing majorities fortheir goals. But the principle of the invisible foot maygive rise to hope. Actors who are willing to engage incorruption often end up being the victims of betrayal.They may fail to profit from bribery and lose theirreputation for honest business. Abstaining from cor-
ruption may then be motivated byself-interest.Temptations to give ortake bribes may be rejected notdue to moral concern but becauseof the inherent uncertainty thatsurrounds such deals.
Perspectives for reform
A plethora of proposals emergeonce we approach corruption fromthis perspective. For example, dueto their uncertainty, corrupt trans-actions are often arranged by spe-cialized agents experienced in cam-ouflaging, avoiding extortion, giv-
0
20
40
60
80
100
DK/NA Extremelyuncertain
Uncertain Fairly certain Certain Extremelycertain
no don't know / no answer yesOn the past 12 months, have you or anyone living in your household paid a bribe in any form?
Source: Own research based on Transparency International (2009): Survey among 70 110 households in 66 countries.
Share in %
UNCERTAIN RECIPROCITY REDUCES BRIBERY
If some paid a bribe in order to obtain a service or to resolve a problem how certain would the delivery of the service or the resolution of the problem after the payment be?
Figure 3

ing legal appearance to seemingly corrupt deals and
enforcing illegal transactions. Intermediaries enjoy
the advantage of being return customers. While a
stranger may easily be cheated, intermediaries pro-
mise future business and can spread an individual’s
reputation as either being a cheater or an “honest”
criminal. Making life harder for intermediaries could
thus be an important approach to reform (Lambs-
dorff 2011). Intermediaries may be required to regis-
ter their business and be subject to annual auditing,
which would prevent them from passing on parts of
their commissions as bribes.
Equally important is the observation that not all
penalties and types of deterrence are advisable. This
is particularly apparent with rigid gift-taking limits.
Such measures may render the minor sinners de-
pendent on a briber. After an innocent error they
can become hostage to someone who was giving
them a gift beyond the allowed limit. For many this
marks the beginning of a corrupt career. Their ini-
tial perpetration makes them reliable partners for
future corrupt transactions. The gift-limit rule
serves to strengthen the stability of future corrupt
transactions rather than to help the minor sinners
protect their integrity. Instead of rigid rules it would
be better to train employees how to deal with con-
flicts of interest, to sort out possible previous mis-
takes and to regain a life of justice. Conversely,
those who bribe public servants and make them de-
pendent deserve less backslapping.
Gender equality
Gender equality has been found to be closely relat-
ed to the success in fighting corruption. There is sig-
nificant evidence that a larger share of women in the
working population and in parliament goes along
with lower perceived levels of corruption, alas, with
uncertain causality (Swamy et al. 2001). But causa-
tion has been ascertained in experimental investiga-
tions, which revealed that women differ in their reac-
tion to bribes. While men have a tendency to recip-
rocate, for example by delivering a contract to the
briber, women are willing to act opportunistically,
taking a bribe while cheating the briber (Lambsdorff
and Frank 2011). Women are commonly found to
exhibit a high sense of fairness and the avoidance of
behavior that contributes to inequality. But they were
not found to apply a higher moral standard in cor-
rupt transactions; rather they had a reduced sense of
reciprocity.
Men, on the other hand, are more willing to recipro-cate but also to retaliate if they are cheated, even ifthis is costly to them. This suggests that women maybe preferable for routine inspections, in workplacesituations that are comparable to the anonymoussetting that was tested in the experimental laborato-ry. Men, on the other hand, may need more rigid gift-limit rules, given that they cannot take gifts withoutan inclination to reciprocate.
The four-eyes principle
Subjecting individual decisions to peer review is astandard organizational method. Individuals oftentend to follow narrow, selfish interests which mayovershadow the pertinent concerns. Having a sec-ond, independent person supervise important deci-sions is thought to ensure that a control mechanismis in place. Reports on anticorruption in the publicsector thus often emphasize a rigid application of thefour-eyes principle as a method for containing cor-ruption. Bribing two, it seems, is more demandingthan bribing just one decision maker.
What appears most intuitive to the layman has beencritically challenged by laboratory experiments.Schikora (2010) employs a game similar to the oneby Lambsdorff and Frank (2011), where bribe-takerscan cheat the briber. He compares one treatmentplayed among individuals with a treatment wherebribe-takers decide in groups of two. Only if bothagree to the bribe will it be accepted. Nonethelessthere is more bribery in the group version. This isbecause the game is played repeatedly and as a re-sult issues of reputation become salient. The experi-ments show that groups follow a maximizing strate-gy more than individuals do and are better at culti-vating a reputation for reliable reciprocity. The mu-tual control exercised between two actors backfires,because rather than serving the public it is employedto uphold the actors’ corrupt reputation. Thus re-search casts doubt on naïve expectations regardingthe four-eyes-principle. How peer review should beorganized to better contain risks of corruption willthus be food for future research.
Asymmetric penalties
Bribery differs from many other forms of crime inthat it involves two perpetrators. It suffices for lawenforcers to convince just one of the perpetrators tocollaborate and self-report. Take a simple thoughtexperiment. A briber is allowed to keep the awarded
CESifo DICE Report 2/2011 28
Forum

CESifo DICE Report 2/201129
Forum
contract and entitled to claim back the bribe if hereports the infraction to prosecutors. Bribery and sub-sequent reporting is turned into an attractive strate-gy. Such a provision would be quite unfair, but alsoquite effective. A bribe-taker will recognize these in-centives and, fearing the increased probability of de-tection, be inclined to reject bribes (Yadlin 2006).Self-reporting combined with leniency would thus bea valuable tool in destabilizing corrupt transactions.In contrast, if both briber and bribe-taker face iden-tical penalties, these embed the two perpetrators in-to mutual dependence and silence.
But leniency programs must be fine-tuned so as notto backfire. Feess and Walzl (2004) warn that incen-tives given to those who report should not be exces-sive. What is even more important is how to dealwith perpetrators who deceive each other. Imaginethat a briber is still waiting for his contract to beawarded and is fearful that the bribe-taker maycheat. Will the briber be entitled to obtain leniencyin exchange for reporting? Obviously, this type ofleniency would backfire. If those who are cheatedare invited to report, bribe-takers will not darecheat. This type of leniency would enhance corruptreciprocity and support the enforcement of bribetransactions (Buccirossi und Spagnolo 2006).
There are two models for taking care of these con-cerns. One approach would be to penalize bribe-giv-ing but not bribe-taking. In the 1990s in Chile thepayment of a bribe was a criminal offense, butaccepting a bribe was not unless accompanied by anabuse of office. Even today Chile’s Codigo Penal, thecriminal code, is strict with respect to extortion, mis-appropriation, falsification of information and fraudbut little punishment is added when these infractionsare carried out in exchange for a bribe (Rose-Ackerman 2010, 222). The advantage is that bribe-takers are free to cheat bribers, without fears of re-prisal. This model can also be linked to leniencytowards bribers in exchange for reporting.As long asthey do not receive the promised contract they arenot in a position to threaten the bribe-taker.
Another option would be to reverse the onus of proofand grant leniency to any perpetrator, the briber orthe bribe-taker, who can prove to have cheated theircounterpart. While this option would also destabilizecorrupt transactions, currently there is no country orinstitution where experience with such provisionshas been gathered. More research is required to de-velop this thought experiment into rules than can beimplemented.
Contract penalties
Monetary fines linked to business contracts can alsobe helpful in containing corruption. For example, thegeneral terms and conditions of purchasing of theDeutsche Bahn AG (Allgemeine Einkaufsbedingun-gen AEB) set a fine of up to 7 percent of the grossaccounted sum to be paid by a contractor who paysa bribe. Similar provisions can be found in the USSentencing Guidelines. Also the “integrity pacts” byTransparency International incorporate similar typesof fines. In my opinion a fine of 30 times the amountof the bribe would be adequate. Such a value wouldcorrelate with the advantage achieved by the bribery,i.e., a light penalty for the flowers given to a low-level clerk and severe sanctions for transferring largesums of money to key decision makers.
Another advantage of such fines is that they areborne by companies, not individuals alone. Compa-nies will lose the incentive to induce their employeesto pay bribes. Not only would the employees riskpenalties, the companies would also face the risks ofmonetary fines. There are further advantages to suchfines. The circumstances for detecting a malfeasancecan be taken into account. Imagine a manager whohears about allegations of a bribe paid by a subordi-nate to secure a contract, contrary to the manager’spolicy. But should the manager investigate the casefurther, as required by his supervisory duty? Imaginethat his company would have to pay a fine. Wouldn’tit then be in the corporate interest to destroy all evi-dence rather than bringing them to light? Monetaryfines are then at risk of generating adverse incentives.
The downside effects of monetary fines can beavoided by granting leniency in cases of self-report-ing (but keep in mind that leniency may not begranted if the company was cheated and the paidbribe was not reciprocated). Such provisions wouldenhance the manager’s incentives to investigate theallegation, in order to secure lenient treatment forthe company. This is an advantage of fines as com-pared to blacklisting, where potential leniency is pos-sible only at the discretion of prosecutors or the pro-curement agency. It is also superior to provisions thatrender the contract obtained by help of bribery nulland void, as such provisions do not deter unsuccess-ful bribery that was not reciprocated. Monetary finesare also superior to liability for damages to the prin-cipal and the competing bidders, as they can be madedependent on a company’s effort to come forwardwith evidence and report the infraction.

Conclusion
As this article explained, corrup-tion is not only reduced by deter-rence such as is provided by a strictcriminal code and a high risk of de-tection. It is also undermined bythe risk that bribes may not bereciprocated.
Why is Chile successful in fightingcorruption? Why is it widely per-ceived to exhibit low levels of bri-bery despite being rather poor andnot diligent in convicting fraud-sters? One explanation might beits described policy of penalizingbribe-giving but not bribe-taking,which makes it attractive to take bribes without recip-rocating them.
Indeed, as shown in Figure 4, Chileans are particu-larly uncertain with respect to corrupt reciprocity.More than 32 percent respond that after paying abribe it is extremely uncertain whether the promisedfavor will be returned. Among 66 countries this wasthe second highest value. A policy that effectively in-hibits corrupt reciprocity rather than exercisingzero-tolerance towards gift-takers is likely to explainChile’s success. Rather than focusing on a policy ofzero-tolerance, a more tricky avenue is advisable.
References
Buccirossi, P. and G. Spagnolo (2006), “Leniency Policies and IllegalTransactions”, Journal of Public Economics 90,1281–97.
Feess, E. and M. Walzl (2004), “Self-reporting in Optimal Law En-forcement when there are Criminal Teams”, Economica 71, 333–48.
Gambetta, D. (2009), Codes of the Underworld: How CriminalsCommunicate, Princeton University Press, Princeton, New Jersey.
Lambsdorff, J. Graf and B. Frank (2011), “Corrupt Reciprocity –Experimental Evidence on a Men’s Game”, International Reviewof Law and Economics, in press.
Lambsdorff, J. Graf (2007), The New Institutional Economics ofCorruption and Reform: Theory, Policy, and Evidence, CambridgeUniversity Press, Cambridge, UK.
Lambsdorff, J. Graf (2009), “The Organization of Anticorruption –Getting Incentives Right”, in R. Rotberg, ed., Corruption, GlobalSecurity, and World Order, Harvard Kennedy School und theBrookings Institution Press, Washington DC, 389–415.
Lambsdorff, J. Graf (2011), “Corrupt Intermediaries in Interna-tional Business Transactions: Between Make, Buy and Reform”,European Journal of Law and Economics, in press.
Rose-Ackerman, S. (2010), “The Law and Economics of Briberyand Extortion”, Annual Review of Law and Social Science 6, 217–38.
Schikora, J. (2010), “Bringing the Four-Eyes-Principle to the Lab”,paper presented at the annual meeting of the Verein für Socialpoli-tik, (accessed 12 April 2011) http://www.econstor.eu/dspace/handle/10419/37465
Swamy, A., S. Knack, Y. Lee und O. Azfar (2001), “Gender andCorruption”, Journal of Development Economics 64, 25–55.
Smith, A. (1776), An Inquiry into the Nature and Causes of theWealth of Nations, edited by S. M. Soares MetaLibri, 2007.
Transparency International (2009), 2009 Global Corruption Baro-meter, Transparency International, Berlin, Germany.
United Nations (2007),“The Tenth United Nations Survey of CrimeTrends and Operations of Criminal Justice Systems (Tenth CTS,2005-2006)”, http://www.unodc.org/unodc/en/data-and-analysis/Tenth-United-Nations-Survey-on-Crime-Trends-and-the-Opera-tions-of-Criminal-Justice-Systems.html.
Yadlin, O. (2006), “The Conspirator Dilemma: Introducing the‘Trojan Horse’ Enforcement Strategies”, Review of Law and Eco-nomics 2(1), 25–43.
CESifo DICE Report 2/2011 30
Forum
0.00
0.05
0.10
0.15
0.20
0.25
0.30
0.35
DK/NA Extremelyuncertain
Uncertain Fairly certain Certain Extremelycertain
other countries
Chile
If some paid a bribe in order to obtain a service or to resolve a problem how certain would the delivery of the service or the resolution of the problem after the payment be?
Source: Own research based on Transparency International (2009): Survey among 1 001 Chilean and 69 109 households in another 65 countries.
Share of respondents
CORRUPT RECIPROCITY IS UNCERTAIN IN CHILE
Figure 4

CESifo DICE Report 2/201131
Forum
FIGHTING CORRUPTION
ROBERT KLITGAARD*
Introduction
Around the world, citizens are crying out against cor-ruption.As demonstrated recently in northern Africa,the Middle East and India, corruption foments dis-trust, anger and instability. New leaders like PetrNecˇas in the Czech Republic and Mauricio Funes inEl Salvador have prioritized the fight against corrup-tion. President Benigno Aquino of the Philippineswas elected last year with the campaign slogan “Ifthere is no corruption, there will be no poverty.”
At the end of his 1985 book Bribes, the Americanlaw professor and Judge John T. Noonan made a re-markable prediction: “As slavery was once a way oflife and now…has become obsolete and is incompre-hensible, so the practice of bribery in the centralform of the exchange of payment for official actionwill become obsolete” (706).
Noonan demonstrated that bribery is not culturallyrelative. Anywhere one goes, bribery is consideredshameful, a sell-out to the rich and a betrayal of thetrust that he called “a precious necessity of everysocial enterprise” (704). Bribery, he concluded, vio-lates a divine paradigm. According to Noonan, thesemoral forces, coupled with increased information,communication and competition, will result in thedemise of systemic corruption.
Noonan’s book was published 26 years ago. Andwhile his prediction came true for Singapore and afew other countries, the trend for the world as awhole is flat, if one judges from Transparency Inter-national’s Corruption Perceptions Index. In a recentbook about Asia, the economist John MalcolmDowling noted that rising incomes have not neces-sarily yielded lower corruption. Instead, he wrote, “a
large group of poor countries are caught in a lowlevel corruption trap at the same time that others athigh levels of income are becoming more and morehonest” (2008, 273).
Even rich countries exhibit worrying signs. A govern-ment review of police corruption in New South Walesrevealed a correlation between the availability of ille-gal drugs and corrupt activities such as protecting viceand taking payoffs (Committee on the Office of theOmbudsman and the Police Integrity Commission2002). Cost overruns – often a telltale sign of corrup-tion – have risen sharply over the past 50 years in USpublic works projects (Engerman and Sokoloff 2006).And daily news reports provide examples of private-sector fraud and conflicts of interest, from GoldmanSachs to Tenaris, even FIFA.
Even where corruption has been successfully reduced,there are also examples of “re-corruption” (Dininio2005).The case of the cleaned-up Philippine Bureau ofInternal Revenue (Klitgaard 1988, chs. 2–3) has beenstudied all over the world. But when I visited Manila afew years ago, the head of the BIR confided to me thatit was once again rife with corruption.
Was Noonan simply wrong, then? Is fighting corrup-tion a lost cause? It is remarkable how often we ex-press outrage over corruption and then quickly moveto cynicism. Remarkable, too, how reluctant we are toconsider corruption with the same cool, analyticalpowers we apply to other cases of policy and man-agement.
Where cynicism reigns, complacency follows. It iseasier for us to accept that nothing can be doneabout an issue if we can persuade ourselves it doesnot matter. “Corruption? So what? It is grease in thewheels of commerce and glue in fractured polities.Corruption has its functions, even its benefits, espe-cially where neither states nor markets work well.”
But corruption turns out to slow economic growth,cripple social services and defraud justice, as otherpapers in this issue demonstrate (see also Klitgaard,Fedderke and Arkamov 2005). Former World BankPresident Paul Wolfowitz called corruption “the sin-
* University Professor, Claremont Graduate University, Clare-mont, CA 91711 US.

gle most important obstacle to development”; today,the Bank’s website says, “The Bank has identifiedcorruption as among the greatest obstacles to eco-nomic and social development.”1
Fortunately, we can learn from a number of exam-ples of impressive progress against corruption incities, ministries and countries, from Mozambique toColombia, from Indonesia to Qatar, as well as epicsuccesses such as Singapore. Though contexts differ,lessons emerge. Leaders who wish to fight systemiccorruption need to change a corrupt institutional cul-ture. They need to mobilize and coordinate a varietyof resources inside and outside the government.They have to think in terms of corrupt systems in-stead of corrupt individuals. In some cases, they needto deal with corruption as a form of organized crime.
Change the institutional culture
“Institutional culture” refers to a set of norms andexpectations. When corruption is systemic, the insti-tutional culture has grown sick. The norm is corrup-tion; expectations are that corruption will continue.Cynicism and despair are widespread. Change seemsimpossible.
And yet there are cases where leaders have made sub-stantial progress in changing the institutional culture.They begin by sending a strong signal of change. Theypublicize their intent to attack corruption. But in cor-rupt societies, words have little impact. The culture ofcorruption contains the idea that big fish will swimfree, that the powerful enjoy impunity. Successful lead-ers change this idea through impressive action.
An important initial step is to fry big fish. Just afterPresident Andrés Pastrana assumed power in Co-lombia in 1998, his anti-corruption team flew to sev-eral regions and held hearings about supposedly cor-rupt mayors and governors. The team had the powerto suspend people from these offices – somethingthat leaders in other countries may not have – andthe team used this power to send a signal not only tothe local leaders but to the whole country. Pastrana’santi-corruption team also went after a specific case ofcorruption in the Congress – choosing as the big fishpeople from the president’s own party. PresidentEnrique Bolaños of Nicaragua went one step further.
He locked up the former president, Arturo Alemán,under whom Bolaños had served as vice-president, oncharges of corruption. Under President Susilo Bam-bang Yudhoyono, Indonesia’s Corruption EradicationCommission has won global praise for its performance.It has successfully prosecuted scores of public servants,some of them extremely senior, as well as businesspeople giving bribes.
A second lesson: pick low-hanging fruit. Effective re-forms do not tackle the most difficult domain of cor-ruption first. Instead, they create near-term success-es that are highly visible and change expectations.Momentum is created, enabling longer-term reformson harder problems. This emphasis on early wins is atheme in the new World Development Report(World Bank 2011).
Finally, successful leaders bring in new blood. Eventhough they work with people within existing insti-tutions, they also invite in young people to be “eyesand ears” (Mayor Ronald MacLean-Abaroa in LaPaz, Bolivia), business people to take important pub-lic positions (the anti-corruption czar under Presi-dent Pastrana), and young accountants to partnerwith “senior heroes” and investigate cases in depth(Judge Efren Plana in the Philippines’ Bureau of In-ternal Revenue).
Mobilize and coordinate
A successful fight against systemic corruption mustinvolve more than one agency of government. Forexample, success requires the help of the supremeaudit authority, the police, the prosecutors, the courts,the financial functions of government and others.What’s more, the fight against corruption requires thehelp of the business community and civil society.Theycan provide unique information about where corrup-tion is occurring and how corrupt systems work.
This suggests an apparent paradox. The fight againstsystemic corruption requires a strong leader – some-one strategic and brave and politically astute. Butthe leadership trait that is most important is the abil-ity to mobilize other actors and to coordinate theirefforts productively. The task is not command andcontrol, but mobilization and coordination.
For example, in Colombia the anti-corruption czarsof Presidents Pastrana and Álvaro Uribe createdmechanisms for coordination across major minis-
CESifo DICE Report 2/2011 32
Forum
1 http://web.worldbank.org/WBSITE/EXTERNAL/EXTSITE-TOOLS/0,,contentMDK:20147620~menuPK:344192~pagePK:98400~piPK:98424~theSitePK:95474,00.html

CESifo DICE Report 2/201133
Forum
tries and agencies of government (auditing, investi-gation, prosecution and so forth). Hong Kong’s In-dependent Commission against Corruption works inthree areas – prosecution, prevention and public re-lations. In each area, the ICAC works closely withand through other government agencies.
Successful reformers do something good for theirpublic sector employees. For example, new systemsof performance measurement are linked with betterpay, promotion policies and “bonuses” such as over-seas trips and courses.
Those who successfully fight systemic corruption in-volve the people. Mayor MacLean-Abaroa invitedcitizens’ groups to become involved in local publicworks, which enabled new kinds of accountability. Sodid Mayor Jesse Robredo in Naga City, Philippines,and Mayor Elba Soto in Campo Elias, Venezuela.Mayor Soto created an Office for Development andCitizen Participation, using citizens as eyes and earsto insure successful implementation of public works.
Citizens know where corruption is and how corruptsystems work. Lawyers understand the workings ofcorruption in legal systems. Accountants know theillicit games played with audits. Business peopleunderstand how corrupt systems of procurement andcontracting work. Citizens know where briberyshapes the services they receive (or don’t receive).This knowledge can be culled in many ways.
In surveys, people can be asked where they perceivecorruption to be occurring. In confidential interviews,insiders can be asked how a corrupt system works.For example, a study of a procurement system maylay out the various steps: prequalification of bidders,technical criteria and their weights, the judging of thevarious bids, the process for post-award changes, andthe payment of the contract. Each of these may besubject to corruption. Interviewees are asked, in ef-fect,“Here is how things are supposed to work in pre-qualification. In your experience, what problems tendto emerge? How prevalent do you guess these prob-lems are? What distortions are created?” The resultsof many such interviews (perhaps 15 or more) can bethe basis for a diagnostic assessment of a procure-ment system and then of remedial actions.
The Internet can be used to publicize all contracts andbudgets – and also to enable citizens to denounce casesof inefficiency and possible corruption, as PresidentBenigno Aquino is now doing in the Philippines.
The press can play a leading role. Following the tsu-nami in Aceh, Indonesia, a team of local journalistsproduced a daily one-hour radio program dedicatedto the rehabilitation and reconstruction effort. Thesejournalists acted as watchdogs, often drawing atten-tion to cases of corruption.
Reform systems
In the long term, curing systemic corruption requiresbetter systems. Successful leaders understand thatbetter systems go well beyond better laws and newcodes of conduct. They implicitly or in MacLean-Abaroa’s case explicitly apply the formula
Corruption = Monopoly + Discretion –
Accountability
to guide their systemic reforms. Corruption flourish-es when someone has monopoly power over a goodor service and has the discretion to decide how muchyou receive and where accountability and transpar-ency are weak. So, to fight corruption we must re-duce monopoly power, reduce discretion and in-crease accountability in many ways.
Reducing monopoly power means enabling competi-tion, as in government contracts in Korea, Colombia,and many other countries. Mayor MacLean-Abaroagot the city of La Paz out of the construction business,meaning that public works could be carried out byany of a number of private companies. Mexico putsonline all government contracts and procurementplans before and after the decisions are made, soprices and winners are public knowledge. Argentinareduced corruption in hospitals by publishing pricesof all purchases throughout the hospital system.
Limiting discretion means clarifying the rules of thegame and making them available to everyone. MayorMacLean Abaroa created a citizens’ manual, whichdescribed simply and in three languages what wasrequired to obtain a permit, build a house, start a bu-siness and so forth. President Pastrana limited dis-cretion by making the rules of the game availableonline. Judge Plana simplified the tax code, making itsimpler to understand and reducing thereby theeffective discretion of BIR employees.
Enhancing accountability means many things, andcreative leaders use a remarkable variety of meth-ods. One way to improve accountability is to improvethe measurement of performance. Leaders can workwith their employees and clients to create new sys-

tems for measuring the performance of agencies andoffices – and then link rewards to results. Exemplarsinclude the Public Affairs Centre in Bangalore, India(Paul 2002) and Ciudadanos al Día in Peru.
Another method is listening and learning from busi-nesses and from citizens. This includes mechanismsfor public complaints, but it goes beyond the report-ing of individual instances of abuse to the diagnosisof corrupt systems. President Pastrana’s Colombie-
mos campaign linked up the veedurías around Co-lombia, enabling these non-government organiza-tions to provide better oversight of public programsand leaders.
Accountability is also increased by inviting outsideagencies to audit, monitor and evaluate, for examplePeru’s Ciudadanos al Día. Finally, the press can be animportant source of accountability if they are invitedto be partners in reform instead of treated as poten-tial political enemies.
Successful reformers recognize that corruption is aneconomic crime, not a crime of passion. Reformerswork hard to change the risk-reward calculations ofthose who might give bribes and those who mightreceive them. Raising pay is good, especially for min-isters and other government leaders. Salaries shouldbe somewhat competitive with the private sector –perhaps 80 percent is a good norm. But note thatbeyond some reasonable minimum that enables lead-ers to live well, the level of pay does not have muchof an effect on corrupt calculations. “Should I takethis bribe or not?”The answer depends on the size ofthe bribe (which is a function of my monopoly powerand my discretion), the chance I’ll be caught (a func-tion of accountability) and the penalty I’ll pay if I’mcaught. It only depends a little on my level of income,at least once I have enough to live on. Therefore,once salaries for top officials are “reasonable”, lead-ers should emphasize improving informationabout performance and the incentives attendinggood and bad performance.
What about ethics and morality? Successful leadersset a good example. They sometimes create trainingprograms for employees and citizens. Nonetheless, inthe success stories I have studied, what might becalled “moral initiatives” are not the key feature ofthe long-term reforms. The keys are systems thatprovide better incentives for imperfect human be-ings to perform in the public interest – and to avoidcorruption.
Subverting corruption
What if the people on top are themselves corrupt?When corruption has become systemic, it resemblesorganized crime. It has its own parallel system of re-cruitment and hierarchy, of rewards and punish-ments, of contracts and enforcement. This parallelsystem has some inherent weaknesses. For example,in no country of the world are bribery and extortionlegal. Therefore, they must be kept (somewhat) se-cret. The money gained must be hidden. New mem-bers cannot be openly recruited.The mechanisms forenforcement are illicit.
How can these corrupt systems be subverted?Obviously we cannot count on members of orga-nized crime to clean themselves. Instead, we mustanalyze the corrupt systems and ask, “How mightthey be destabilized?” Who is “we”? It can be a newpresident and his or her team, or a new mayor orhead of a public enterprise. But it can also be youand me as members of civil society. Around theworld we see new examples of citizen activism, ofbusiness groups entering into “integrity pacts”, ofintellectuals, journalists and religious leaders goingbeyond lectures and sermons to analyze corrupt sys-tems and work together to subvert them.
For example, one corrupt system of road building (ina country I am not free to mention) involved sena-tors, government executives and key business people.The system included many “emergency works” thatwere let on a noncompetitive basis – at a price 30 per-cent higher than works bid competitively. The sur-charge was shared corruptly. This system did notinvolve all senators, all government officials or allbusinesses. With the help of a team of analysts, thecorrupt systems were analyzed.The lifestyles of somecorrupt senators and officials were documented.Finally, the results were publicized in the press andinternationally. The corrupt system could not with-stand the light, and soon the key figures were in jail.
Those wishing to fight systemic corruption will mobi-lize people in the same way. Together, they can ana-lyze corrupt systems and document lifestyles far outof proportion to official pay. And together, they cansubvert organized crime and corruption.
All of these points mean that the fight against sys-temic corruption should focus on systems ratherthan individuals. Corruption is a crime of calculation,and regarding this sensitive subject, we have to be at
CESifo DICE Report 2/2011 34
Forum

CESifo DICE Report 2/201135
Forum
our coolest and most cerebral to make progress. Wehave to analyze ways to shock corrupt administrativecultures into seeing that change is possible. We haveto reduce monopoly, clarify official discretion andenhance accountability. We must improve informa-tion and incentives. In some cases, we may have tosubvert corrupt systems that resemble organizedcrime. In all these steps, we must go beyond govern-ment to involve citizens, journalists, non-governmentorganizations, businesses and government officials inthe diagnosis and remediation of corrupt systems.
References
Committee on the Office of the Ombudsman and the Police Integ-rity Commission (2002), Research Report on Trends in Policy Cor-ruption, Parliament House, Sydney.
Dininio, P. (2005),“The Risks of Recorruption”, in B. I. Spencer, ed.,Fighting Corruption in Developing Countries: Strategies and Ana-lysis, Kumarian Press, Bloomfield, Conn.
Dowling, J. M. (2008), Future Perspectives on the Economic Devel-opment of Asia, Advanced Research in Asian Economic Studies,vol. 5. World Scientific, Singapore.
Engerman, S. L. and K. L. Sokoloff (2006), “Digging the Dirt atPublic Expense: Governance in the Building of the Erie Canal andOther Public Works”, in E. L. Glaeser and C. Goldin, eds., Corrup-tion and Reform: Lessons from America’s Economic History, Uni-versity of Chicago Press, Chicago.
Klitgaard, R. (1988), Controlling Corruption, University of Califor-nia Press, Berkeley and Los Angeles.
Klitgaard, R., J. Fedderke and K. Akramov (2005), “Choosing andUsing Performance Measures: The Case of Foreign Aid”, in R.Klitgaard and P. C. Light, eds., High-Performance Government:Structure, Leadership, and Incentives, The RAND Corporation,Santa Monica.
Noonan, J. T. (1985), Bribes, Macmillan, New York.
Paul, S. (2002), Holding the State to Account: Citizen Monitoring inAction, Books for Change, Bangalore.
World Bank (2011), The World Development Report 2011: Con-flict, Security, and Development, World Bank, Washington, DC.

ENDING MILITARY
CONSCRIPTION*
PANU POUTVAARA* AND
ANDREAS WAGENER**
Current trends
Throughout most of the 20th century, military con-scription (the draft) was a prominent feature of na-tional military doctrines. Both world wars werefought mainly by conscripts. Among the 12 foundingcountries of NATO in 1949, only Canada did not relyon conscription (Iceland did and still does not havearmed forces). While the United Kingdom (1960),Luxembourg (1967) and the United States (1973)adopted all-volunteer forces quite early during theCold War, military conscription was the dominantmode of peacetime recruitment in the alliance untilmid-1990s. Likewise, throughout the entire existence(1955–91) of the Warsaw Pact, all its members usedconscription.
Figure 1 maps the changes in mil-itary recruitment across Europesince 1993 (after the break-up ofCzechoslovakia and Yugoslavia).Initially only Ireland, Luxem-bourg, Malta and the UnitedKingdom relied on all-voluntaryservice. In 2011, most countriesdo. The only EU countries stillusing conscription are Austria,Cyprus, Denmark (in which it isquite easy to avoid the service inpractice), Estonia, Finland andGreece.
Figure 2 presents military recruitment regimes world-wide. Conscription is still dominant in Asia and Africa.In Latin America the use of conscription has been in asteady decline, with (de facto) abolitions in Uruguay(1989), Nicaragua (1990), Honduras (1994), Argentina(1995), Peru (1999), Chile (2005) and Ecuador (2008).
While the decision to abolish or maintain the mili-tary draft has country-specific aspects in each singlecase, certain groups of motivations for the abolitionof conscription can be identified:
• Conscription in the US was abolished in 1973, to-wards the end of the Vietnam War. Liberal defer-ment rules and, later, the use of lotteries had gen-erated a strong sense of the unfairness and biasedselectiveness of the draft system, which added tothe public discontent with the Vietnam War. Inthe debate about the pros and cons of abolishingthe draft, economists (most notably Milton Fried-man) had substantial impact, arguing that con-scription is “inequitable, wasteful, and inconsis-tent with a free society” (Friedman 1974, 253).
• In continental Europe, with its dominant histori-cal view that every citizen has an obligation to
CESifo DICE Report 2/2011 36
Research Reports
* University of Munich and Ifo Institutefor Economic Research.** University of Hannover and Ifo Insti-tute for Economic Research.We thank Max Ostermayer for helping uswith the figures.
Sources: Own compilation, based on Wikipedia (2011), “Conscription” and selected gov-ernment sources.
Figure 1
MILITARY RECRUITMENT IN EUROPE, 1993–2011

CESifo DICE Report 2/201137
Research Reports
perform some service at the call of the state, thedecline in the use of conscription followed theend of the Cold War. After the collapse of theSoviet Union and the end of the Warsaw Pact,European governments no longer saw the need toprepare for large-scale warfare in Europe. Thisallowed many countries to seek budgetary savingsby reducing the sizes of armies and reserves. Atthe same time, military capabilities were increas-ingly aimed at peacekeeping and internationalmissions for which conscripts are ill-suited and, inmost countries, inadmissible by law. Military tech-nology moved away from territorial mass forcesto smaller, mobile units equipped with sophisti-cated weaponry, increasing the necessity of pro-fessionalization. The smaller intake of drafteesraised equity concerns as conscription was nolonger hitting the full (male) age cohort but onlythose unlucky enough to be called up to service.
• For the Baltic, central and eastern European coun-tries, which all started out with conscript armies,the prospect of NATO membership meant thenecessity of downsizing and restructuring theirarmed forces. The role model of the alliance lead-ers, increasing levels of draft avoidance, and thepublic opinion that conscript forces were a vestigeof the Cold War or Soviet totalitarianism promot-ed the eventual abolition of conscription in allcountries except for Estonia (Williams 2005).
• Many Latin American countries were ruled bymilitary dictatorships until the 1980s. The juntas
relied heavily on conscription for military reasons(in border disputes and inner conflicts with Mar-xist movements) as well as for sake of indoctrina-tion and social control. During their regimes thesearmies had amassed dismal records of reckless mili-
tarism, human rights violations,economic mismanagement andcorruption. In the wake of demo-cratization, armed forces sufferedconsiderable losses in prestige,leading civilian goverments inquite a number of countries toabolish or suspend conscription.
Typically, also countries withoutconscription during peacetime re-tain the option to re-introduceconscription in case of war – whenit might be infeasible to mobilizethe necessary manpower by vol-unteers or through fiscal taxes
alone. Similar arguments can explain the use of con-scription in countries like Israel, where the militarydoctrine relies on the ability to mobilize most citi-zens to fight in case of a large-scale conflict.Generally, there is a positive correlation between themilitary threat perceived by countries and their useof conscription (Mjoset and van Holde 2002). Therecent abolishment of military draft in severalEuropean countries can then be explained by (theperception of) reduced military threat after the fallof the Iron Curtain.
The economic case against conscription
Economists traditionally were and are unambiguousin favoring a volunteer army (for surveys see Sandlerand Hartley 1995, chapter 6; Warner and Asch 2001or Poutvaara and Wagener 2007a, 2011), echoingAdam Smith’s verdict of the “irresistible superioritywhich a well-regulated standing [i.e., all-volunteer]army has over a militia [i.e., temporary conscrip-tion]” (Smith 1976, 701). Smith’s arguments focus oncomparative advantage and the benefits from spe-cialization. Military conscription violates the princi-ple of comparative advantage, which demands thatjobs be assigned to those who are relatively mostproductive in doing them, by forcing everybody intoa military occupation, irrespective of relative pro-ductivities. In consequence, the match between peo-ple and jobs will be inefficient. Benefits from spe-cialization arise when individuals become more pro-ductive due to experience and frequent practice.Effective military operations require a considerabledegree of training and mastery in handling complexweapon systems. Drafted short-term soldiers are in-ferior to long-term professionals. In combat, the useof less advanced military technology, lack of training,
Figure 2
MILITARY RECRUITMENT AROUND THE WORLD
Sources: Own compilation, based on CIA (2011), “World Factbook”, Wikipedia (2011)“Conscription” and selected government sources.

and the easy availability of apparently expendablesoldiers lead to higher casualties and “cannon-fod-der”-type battlefield tactics.1
Consequences of the abolition of conscription
Military expenditures, personnel and budgets
While quite a number of countries have abolishedconscription over the past 20 years, a comparativestudy of their experiences – military, fiscal or econo-mic – is still missing. In parts, this is due to the fact thatthe abolition of the draft generally runs parallel toother changes (say, shifts in political regimes, geo-political developments or military technologies) thatmake it difficult to isolate the “pure” draft effects.Econometric analyses are not available, and compar-isons have to be based on rough summary indicators.
For the government budget, oper-ating a draft system is generallycheaper than a professional army.Conscripts are not paid the mar-ket value of their labor service andare granted fringe benefits such ashealth plans, family support, old-age provisions, etc., on a muchsmaller scale than professional sol-diers (if at all). These savings arepartially offset by the generallysmaller size of all-volunteer forces(allowed for due to increased pro-ductivity). In an early study, Oneal(1992) found that budgetary sav-ings from conscription in NATOaveraged around 9.2 percent ofnational military expenditures in1974, but decreased subsequentlyto only 5.7 percent in 1987.Warnerand Asch (2001) report that thebudgetary costs of abolishing con-scription in the US in 1973 came at10 to 15 percent of the 1965 mili-tary budget (which was chosen as areference point to exclude theeffect of the Vietnam War).
Similar studies are, to our knowledge, not availablefor the more recent abolitions of military conscrip-tion, say, in European NATO members. However,some summary indicators may also provide interest-ing insights. Compared to the 1980s, the “militariza-tion” of society has declined across NATO, both interms of the share of the labor force working for themilitary (a decline from an average of 2.7 to 1.1 per-cent between the late 1980s and the late 2000s) and,with the notable exception of the US over the pastdecade, defense expenditures as a share of GDP,which dropped from an average of 4.8 to 2.9 percent(NATO 2010). For more detailed comparisons, wegroup “old” NATO countries (i.e., members as of1985) in Figures 3 and 4 according to their recruit-ment regimes.
As Figure 3 shows, there are no obvious differencesin military expenditure trends between “old” NATO
CESifo DICE Report 2/2011 38
Research Reports
1 As early as the 19th century Germaneconomist J. H. von Thuenen (1875) ar-gued that the carnage of Napoleon’spoorly prepared winter campaigns inRussia could escalate only because sol-diers were easily available through thesystem of conscription.
0
0.5
1
1.5
2
2.5
3
1 2 3 4 5
0.0
0.5
1.0
1.5
2.0
2.5
3.0
3.5
4.0
1985–89 1990–94 1995–99 2000–04 2005–09
conscription (a)abolition (b)UK and CAUSA
Source: Own calculations based on NATO (2010), p. 4.
in % of labour force
MILITARY AND CIVILIAN PERSONNEL IN THE ARMED FORCES OF "OLD" NATO MEMBERS, 1985–2009
(a) Unweighted averages across 1985 NATO members using conscription over full period, 1985–2009 (DK, GE, GR, NO, TK). (b) Unweighted averages across 1985 NATO members which abolished conscription after 1985 (BE, FR, IT, NL, PT, SP). Luxembourg is omitted as an outlier.
5-year averages
Figure 4
0
0.5
1
1.5
2
2.5
3
1 2 3 4 5
0
1
2
3
4
5
6
7
1985–89 1990–94 1995–99 2000–04 2005–09
conscription (a)abolition (b)UK and CAUSA
Source: Own calculations based on NATO (2010), p. 9.
% of GDP
DEFENCE EXPENDITURES OF "OLD" NATO MEMBERS, 1985–2009in 2000 prices
(a) Unweighted averages across 1985 NATO members using conscription over full period, 1985–2009 (DK, GE, GR, NO, TK). (b) Unweighted averages across 1985 NATO members which abolished conscription after 1985 (BE, FR, IT, NL, PT, SP). Luxembourg is omitted as an outlier.
5-year averages
Figure 3

CESifo DICE Report 2/201139
Research Reports
members that never had, always had or abolishedconscription, except for different starting levels.There is no clear correlation between military ex-penditure and the use of conscription; if anything,countries with conscription seem to afford largermilitary budgets. As Figure 4 (quite unsurprisingly)indicates, the share of people working for the mili-tary is higher in conscription countries. Remarkably,the reduction in army personnel has been largest inconscription countries, both in absolute and in rela-tive terms (which may indicate a problem of unfair-ness due to selective draft calls). A bit more surpris-ingly, there is no indication that the abolition of con-scription led to disruptions in army sizes or militarybudgets that would not, in similar orders of magni-tude, occur also in countries that did not change mil-itary regimes.
Conscription involves a distorted factor-price ratiobetween labor and other military production factors,leading to an excessive staffing of armies and too lit-tle investment. This is indeed reflected in militarybudgets: as Figure 5 illustrates, military budgets incountries with all-volunteer forces are less person-nel-intensive than in conscription countries.
Remarkably, the share of personnel expenditureshas always been highest in the group of countriesthat decided, in the 1990s and early 2000s, to abolishconscription. The relatively flat trend of these coun-tries in Figure 5 should be interpreted with somecaution; the averaging across countries flattens di-vergent trends in single countries. Upon suspensionof conscription, the costs of personnel in the totaldefense budget decreased in the Netherlands, Spainand Portugal but increased considerably in Belgium
and Italy. The interpretation also changes with thedefinition of personnel expenditure. Using a narrow-er definition that only accounts for military (but notfor civilian) personnel, Buch (2010) reports that theshare of personnel expenditure rose upon the suspen-sion of conscription from 41 to 50 percent in Spain,from 30 to 37 percent in France, from 43 to 58 percentin Belgium – but decreased from 47 to 36 percent in theNetherlands. Again, there seems to be no general rule.
This picture is mirrored by changes in the share ofinvestment and other expenditures: where there wasa relative increase in personnel expenditure, therewas a relative cut in investments – and vice versa.
Intangible and indirect effects
Although budgetary costs of conscription are small-er, its total social costs are likely to be substantiallylarger than with an all-volunteer army. The use ofcompulsion in itself suggests that the real costs ofconscription are higher than its budgetary ones, andabolishing the draft will save society these opportu-nity costs. Using empirical methods that were sophis-ticated for their time, Oi (1967, 59) conservativelyestimated the opportunity costs of the US militarydraft in the late 1960s to be around USD 5.3 billion(in 1960 values), when budgetary personnel expendi-ture amounted to USD 12.7 billion. Kerstens andMeyermans (1993) estimate that the social cost ofthe (abolished) draft system in Belgium amounted totwice its budgetary cost.
Economically, military draft is an (in-kind) tax, andshares with all other taxes the feature that it is notneutral but rather induces substantial avoidance ac-
tivities and, thus causes economicdistortions and deadweight los-ses. For example, conscriptiongoes along with various ways of“dodging”, inefficient employment,preemptive emigration, pretendedschooling, hasty marriages, bribingrecruitment officers, faking med-ical certificates, etc. These hard-to-be-measured costs would besaved in case of abolition.
By postponing, interrupting oreven discouraging higher educa-tion and entry into the labor mar-ket, conscription also has a nega-tive effect on the accumulation ofhuman capital (see Keller et al.
0
0.5
1
1.5
2
2.5
3
1 2 3 4 5
0
20
40
60
80
1985–89 1990–94 1995–99 2000–04 2005–09
conscription (a)abolition (b)UK and CAUSA
Source: Own calculations based on NATO (2010), p. 6.
in % of defence expenditures
SHARE OF PERSONNEL EXPENDITURES, 1985–2009
(a) Unweighted averages across 1985 NATO members using conscription over full period, 1985–2009 (DK, GE, GR, NO, TK). (b) Unweighted averages across 1985 NATO members which abolished conscription after 1985 (BE, FR, IT, NL, PT, SP). Until 1995 without France, until 1990 without Spain. Luxembourg is omitted as an outlier.
5-year averages
Figure 5

2010 and the references therein). At the macrolevel, the disruption of human capital investmentsby military conscription translates into lower stocksof human capital, reduced labor productivity andsubstantial losses in GDP (Lau et al. 2004). From1960 to 2000, GDP growth rates in OECD countrieswith conscription were lower by up to a quarter per-centage point than in countries with all-volunteerforces (Keller et al. 2009). This is remarkably largegiven that military expenditures or the size of themilitary labor force per se do not seem to exert anysystematic effect on GDP and its growth (Dunne etal. 2005).
Transition problems
The experiences of countries that switched from con-
script to all-volunteer forces show that the transition
is rocky (Warner and Asch 2001; Williams 2005;
Rostker 2006; Buch 2010). Initially, all countries seem
to have problems in meeting their requirements for
staffing and quality in the military. Enticing new
recruits to join the forces is difficult, turnover rates
are high, imbalances across occupational specialties
arise, with too few people with the cognitive apti-
tudes, skills, technical abilities and work experiences
useful in professional armies. Projected savings may
only materialize later than anticipated since, e.g., the
military pay, post-service benefits and working and
living conditions to attract new staff turn out to be
more costly than foreseen, the extant staff needs re-
training, redundant military bases cannot be closed
down immediately, etc.
Such difficulties may lead some to call into question
the efficiency gains attributed to all-volunteer forces.
Thus, the share of the military budget devoted to
personnel actually increased during the first few
years after the 1973 abolition of conscription in the
US, in spite of a reduction in army size (Williams
2005). Physical or intellectual recruitment standards
for soldiers have been lowered in several countries
(Williams 2005; Buch 2010). In the Netherlands, some
army units remained understaffed, and France
appears to have down-scaled its ambitions for out-of-
area deployability of its armed forces (Buch 2010).
These non-negligible transitory problems do, how-
ever, not qualify as arguments against all-volunteer
forces. Rather, they merely reflect to what dramat-
ic extent conscription insulated the military from a
most elementary feature of standard labor mar-
kets: if one wishes to hire staff in sufficient number
and of decent quality, pay and working conditionshave to be competitive with the qualification andoutside options of those one wishes to hire. AsWarner and Asch (2001) demonstrate for the US,eventually the economists’ predictions have borneout: efficiency gains of the all-volunteer force werereaped with the additional benefit that the bud-getary costs for military personnel reflect its trueeconomic costs.
Myths about the draft
Proponents of the military draft argue that the oppor-tunity costs of conscription are tolerable since theyare compensated for by additional societal, military orpolitical advantages of conscription over all-volunteerforces. However, a closer look at these alleged extrabenefits of conscription reveals that they are largelymythical.
Myth 1: A conscript military is more “representative”
of society than a professional army.
All-volunteer forces are thought to prey dispropor-tionately on the poorly educated, the lower classes,ethnic minorities or otherwise marginalized strata ofsociety. By contrast, conscription is considered to bemore egalitarian since all are included in universalservice.
In fact, there is hardly any reason to believe thatconscription makes the military (more) representa-tive. First, a genuine cross-section of the populationin the army was never the aim in conscription coun-tries: conscription covered substantially less than 50percent of the population; it excluded women,migrants and often certain religious groups, fathersor gays. Second, even for its main targets (youngmales), the military draft is de facto biased, typical-ly favoring individuals of high socio-economic oreducational status with shorter terms of service,complete exemptions, legal and illegal buyoutoptions or privileged work conditions (e.g., doctorsor athletes). Third, the claim that the social compo-sition in all-volunteer forces is more biased towardsthe disadvantaged than in conscript armies is stillopen to debate.2
CESifo DICE Report 2/2011 40
Research Reports
2 Segal and Segal (2004) report that the US all-volunteer military ismore female, less white, more married, better educated and moremiddle-class than the draft-era military.

CESifo DICE Report 2/201141
Research Reports
Myth 2: Conscription promotes peace
It is sometimes argued that a conscript army, whichdraws from all quarters of society, provides a checkon military adventurism since it cannot be deployedwithout a fair measure of public support. Empirical-ly, this “peacemaker” argument is dubious. In fact,the military draft may even contribute to a milita-rization of society by instilling in conscripts the viewthat killing for the home country is a patriotic duty.The possible legitimization for the production anduse of violence may even raise the likelihood andseverity of armed conflicts. Studying violent inter-state conflicts from 1886 to 1992, Choi and James(2003) find that a military manpower system basedon conscripted soldiers is associated with more mili-tary disputes than professional or voluntary armies.Similarly, Anderson et al. (1996) conclude that “war-like” states are more likely to rely on conscription.Linking conscription with democracy changes thispicture somewhat (Vasquez 2005); still, there is noconvincing evidence that the military draft has anymediating effect on the likelihood or severity of in-ternational military disputes.
Within societies, conscription may even contribute tobrutalization: Using data on Argentine draft lotter-ies, Galiani et al. (2011) show that having been con-scripted increases the likelihood of developing acriminal record; this holds also for those who servedduring peacetime.
Myth 3: Conscription is a better match with democra-
cy than all-volunteer armies
Military conscription is often attributed with agreater affinity with democracy than an all-volunteerforce. Army structures, which operate on the basis oforder and command rather than on voting, are inher-ently non-democratic. Still conscripts may act asmediators between a society and its army, while aprofessional military tends to alienate from societyand form a “state within a state”. Advocates of con-scription appeal to the soldat citoyen, referring backto the origins of modern draft in France and Prussia,as a figure that bridges the gap between army andcivil society.
Economically, the “isolation” of the military fromthe rest of society is just an example of an increaseddivision of labor. In a sense, every specialized work-er is “alienated” in his work from the rest of society,but calls for compulsory internships of all members
of society in any or all sectors of the economy haveso far been unheard of. But even if the alienationfrom the rest of society were particularly trouble-some in the military, conscription is not a solution.Praetorian tendencies are most likely to emergefrom the officers’ corps, which has always consistedof professionals. Moreover, the democratic controlsarising from a draft are open to debate. In democra-tic countries like Argentina, Brazil, Chile, Greece orTurkey conscription did not help to prevent militarycoups in the past. Conversely, recent experiencesfrom Latin America demonstrate that democratiza-tion and the abolition of conscription may be inter-twined. Exemplarily democratic countries (like theUK, the US, Australia, Canada or New Zealand)have traditionally run all-volunteer armies withoutever facing the risk of regime change or militarycoups. All these observations as well as the econo-metric evidence established by Mulligan and Shleifer(2005) and Pfaffenzeller (2010) indicate that nocausality in whatever direction exists between theform of government and the structure of armedforces in a country.
Myth 4: Conscription provides better reserves
A precautionary argument in favor of military con-scription is that it provides manpower reserves toaugment the regular army in the case of a militaryemergency. If this argument should imply that re-serves cannot be maintained with all-volunteer forces,then it is empirically false, as the examples of all coun-tries with professional armies show. Moreover, thereserve argument loses validity if reservists are notappropriately prepared for their assignments in caseof mobilization.
A key issue for maintaining militarily meaningful re-serves is that reservists are paid sufficient compensa-tion for their participation in regular exercises. Suchcontracted (as contrasted to conscripted) reservistswould make the true opportunity costs of alternativemilitary strategies visible and help to allocate re-sources efficiently between personnel and material.
Obstacles for abolition
The inefficiency of conscription results to a great ex-tent from ignoring comparative advantage and spe-cialization, which results in higher social costs thanwith a voluntary army. At the same time, there is noempirical support for the claim that the use of con-

scription would help to protect democracy, promotesocial cohesion or tame belligerence. Given that hard-ly any argument in favor of the draft survives undercloser scrutiny, the question arises why so many coun-tries still have a hard time in eliminating conscriptionor do not even consider it. A number of obstacles tothe abolition of the military draft are conceivable:
Special interests: Several societal groups benefit fromconscription – and therefore favor it. These includelabor unions (that favor conscription as it keepspotential competitors off the private labor market;see Anderson et al. (1996) for empirical support),bureaucracies (for reasons of inertia and fear of or-ganizational change), the military itself (which mightfear a loss in their social status, importance and visi-bility), or regional interests (in areas where militarybases would become redundant by the absence ofconscripts). Special mention goes to the various or-ganizations and firms in the welfare industry thatbenefit from the cheap labor provided by conscien-tious objectors to military service. Needless to say –we hope – all economic arguments against forcedlabor in the military also apply mutatis mutandis inthe social sector.
Intergenerational issues: From an intergenerationalperspective, military conscription is similar to a pay-as-you-go pension scheme: its introduction is a (tempo-rary) way around higher fiscal taxes, the static in-efficiencies remain largely unnoticed and its dynamiccosts only surface with considerable time lags. As foran unfunded pension scheme, starting a draft schememeans making a “gift” (in the form of a reduced fiscaltax burden) to the cohorts that are beyond draft age atthat moment. Such a gift may be revolved from cohortto cohort, but it can never be undone in a Pareto-improving manner (Poutvaara and Wagener 2007b).The abolition of the draft would impose an extra fiscalburden on age cohorts beyond the draft age. Sincethese largely outnumber younger cohorts at or belowthe draft age, retaining military draft garners wide-spread political support. The casual observation thatthe staunchest advocates of conscription usually comefrom age groups well above draft age provides supportfor this view.
Non-democratic and developing countries: In non-democratic regimes – which are currently the dominantusers of conscription – popular support for conscrip-tion is less politically relevant. In these cases, aspects ofindoctrination, intimidation and social control, the eco-nomic benefits to the ruling cliques from exploiting
their populations by forced labor and the desire tomaintain numerically large armies seem to be attrac-tive features of military draft. For developing countries,with their inability to raise sufficient fiscal revenuesand their generally lower opportunity costs of labor,the in-kind tax of military draft could even be econom-ically efficient from an optimal-tax perspective.
Conclusions
Conscription is an inefficient form of recruiting sol-diers for an army. As the strikingly positive experi-ences of the UK or the US exemplify, its abolitiontherefore is worthwhile – in spite of transition prob-lems and potentially negative effect on governmentbudgets. All-volunteer forces deliver modern, high-technology defense capabilities at lower and moretransparent instantaneous and dynamic costs thantheir conscript counterparts.
Each country’s decision to retain or eliminate con-scription is motivated by a unique array of differentfactors (although, as in France or Germany, con-scription may happen to be abolished in an almostcavalier way). Economic arguments unfortunatelyappear to focus primarily on the state in terms ofbudgetary expenditures and military capabilities.The adverse effects of conscription on the well-beingof individual citizens and the substantial excess bur-den of the draft tax rarely enter into the discussion.More empirical research on these issues may con-tribute to the final elimination of peacetime con-scription and related forms of forced labor.
References
Anderson, G. M., D. Halcoussis and R. D. Tollison (1996), “Draftingthe Competition. Labor Unions and Military Conscription”,Defence and Peace Economics 7, 189–202.
Buch, D. (2010),“Die Zukunft der deutschen Wehrpflicht”, Workingpaper FG03-AP01, Stiftung Wissenschaft und Politik, Berlin.
Choi, S.-W. and P. James (2003), ”No Professional Soldiers, NoMilitarized Interstate Disputes? A New Question for Neo-Kantianism”, Journal of Conflict Resolution 47, 796–816.
Dunne, J. P., R. P. Smith and D. Willenbockel (2005), “Models ofMilitary Expenditure and Growth: A Critical Review”, Defence andPeace Economics 16, 449–61.
Friedman, M. (1974), “Why Not a Voluntary Army?”, in J. O’Sullivanand A. M. Meckler, eds., The Draft and Its Enemies: A DocumentaryHistory, University of Illinois Press, Chicago/Urbana, 253–63.
Galiani, S., M. A. Rossi and E. Schargrodsky (2011), “Conscriptionand Crime: Evidence from the Argentine Draft Lottery”, AmericanEconomic Journal: Applied Economics 3, 119–36.
Keller, K., P. Poutvaara and A. Wagener (2010), “Does MilitaryDraft Discourage Enrollment in Higher Education? Evidence fromOECD Countries”, Finanzarchiv 66, 97–120.
CESifo DICE Report 2/2011 42
Research Reports

CESifo DICE Report 2/201143
Research Reports
Keller, K., P. Poutvaara and A. Wagener (2009), “Military Draft andEconomic Growth in OECD Countries”, Defence and Peace Econo-mics 20, 373–93.
Kerstens, K. and E. Meyermans (1993), “The Draft versus an All-Volunteer Force: Issues of Efficiency and Equity in the BelgianDraft”, Defence Economics 4, 271–84.
Lau, M. I., P. Poutvaara and A. Wagener (2004), “Dynamic Costs ofthe Draft”, German Economic Review 5, 381–406.
Mjoset, L. and S. van Holde (2002), “Killing for the State, Dying forthe Nation: An Introductory Essay on the Life Cycle of Conscrip-tion into Europe’s Armed Forces”, in L. Mjoset and S. van Holde,eds., The Comparative Study of Conscription in the Armed Forces,JAI Press, Amsterdam, 4–98.
Mulligan, C. and A. Shleifer (2005), “Conscription as Regulation”,American Law and Economics Review 7, 85–111.
NATO (2010), “Financial and Economic Data Relating to NATODefence”, Press Release PR/CP(2010)078, NATO Public Diplom-acy Division, Brussels.
Oi,W.Y. (1967),“The Economic Costs of the Draft”, American Eco-nomic Review (Papers and Proceedings) 57, 39–62.
Oneal, J. R. (1962), “Budgetary Savings from Conscription andBurden Sharing in NATO”, Defence Economics 3, 113–25.
Pfaffenzeller, S. (2010), “Conscription and Democracy: TheMythology of Civil-Military Relations”, Armed Forces & Society 36,481–506.
Poutvaara, P. and A. Wagener (2011), “The Political Economy ofConscription”, in C. Coyne and R. Mathers, eds., Handbook on thePolitical Economy of War, Edward Elgar, London, 154–75.
Poutvaara, P. and A. Wagener (2007a), “Conscription: EconomicCosts and Political Allure”, Economics of Peace and Security Jour-nal 2, 5–15.
Poutvaara, P. and A. Wagener (2007b), “To Draft or Not to Draft:Inefficiency, Intergenerational Incidence, and Political Economy ofMilitary Conscription”, European Journal of Political Economy 23,975–87.
Rostker, B. (2006), I Want You! The Evolution of the All-VolunteerForce, The RAND Corporation.
Sandler, T. and K. Hartley (1995), The Economics of Defense,Cambridge University Press, Cambridge.
Segal, D. R. and M. W. Segal (2004), “America’s Military Popula-tion”, Population Bulletin 59, 1–40.
Smith, A. (1776), An Inquiry into the Nature and Causes of theWealth of Nations, reprinted in W. B. Todd, ed., (1976), GlasgowEdition of the Works and Correspondence of Adam Smith, vol. I,Oxford University Press, Oxford.
Thuenen, J. H. von (1875), Der isolierte Staat in Beziehung aufLandwirtschaft und Nationalökonomie, 3rd ed., Wiegardt, Hempel& Parey, Berlin (English edition: Isolated State (1966), PergamonPress, Oxford/New York).
Vasquez, J. P. (2005), “Shouldering the Soldiering: Democracy,Conscription, and Military Casualties”, Journal of Conflict Resolu-tion 49, 849–73.
Warner, J T. and B. J.Asch (2001),“The Record and Prospects of theAll-Volunteer Military in the United States”, Journal of EconomicPerspectives 15, 169–92.
Williams, C. (2005), “From Conscripts to Volunteers. NATO’sTransitions to All-Volunteer Forces”, Naval War College Review 58,35–62.

EU EASTERN
ENLARGEMENT: THE
BENEFITS FROM
INTEGRATION AND FREE
LABOUR MOVEMENT
TIMO BAAS* AND
HERBERT BRÜCKER**
Introduction
Twelve countries with a population of approximate-ly 104 million persons joined the European Union(EU) in the course of its eastern enlargement round.Eight central and eastern European countries1 plusCyprus and Malta were admitted on 1 May 2004,while Bulgaria and Romania acceded on 1 January2007. A number of agreements before accessionfacilitated the removal of trade barriers and restric-tions on capital mobility between the EU and thenew member states already before their accession.Today, trade links with the 2004 and 2007 accessioncountries and the EU-15 countries are particularstrong. The share of the incumbent member states ofthe EU (EU-15) among the trading partners of theeight central and eastern European countries whichjoined the EU in 2004 (EU-8) is between 35 percent(Lithuania) and 64 percent (Czech Republic) forexports and between 39 percent (Slovakia) and 60percent (Poland) for imports.As is the case for trade,the rules of the Common Market for free capitalmobility have also applied since the accession of thenew member states.
In contrast, the free movement of workers was sub-ject to transitional agreements which enabled theEU-15 member states to restrict labour mobilityfrom the central and eastern European countries for
a maximum of up to seven years.2 Moreover, theaccession treaties granted Austria and Germany theright to suspend the free trade of services also for atransitional period up to seven years. These transi-tional arrangements were utilised to protect certain“sensitive” branches like construction and cleaning.According to the so-called “2+3+2” formula, restric-tions on labour mobility and the service trade couldbe prolonged after an initial two-year period foranother three years. A further prolongation for thelast two year period requires that the respective EUmember state sees serious imbalances in its labourmarkets or that introducing the free movementwould involve the threat of such imbalances.
However, not all member states applied transitionalperiods for the free movement of workers. When theeight new member states joined the EU, Sweden andIreland had already opened their labour markets in2004, while the UK kept only minor restrictionsregarding access to the welfare system. The othercountries maintained their restrictions on labourmigration in the initial phase after accession,although some bilateral agreements for seasonalworkers as well as quotas for a small number ofmigrants eased labour market access slightly. Step bystep most EU member states opened their labourmarkets during the first five years after accessionwith the notable exception of Austria and Germany.Both of these countries, which attracted the majorityof migrants from the new member states before theEU’s Eastern enlargement, applied the restrictionson the free movement of workers and the servicetrade until the end of the seven-year period. Theserestrictions fathered out in May 2011.As for Bulgariaand Romania, which joined in 2007, most EU mem-ber states maintained the restrictions on labourmigration after their accession. Notable exceptionsare Spain and most of the new member states whichjoined the EU in 2004. Whether the old EU memberstates will maintain their restrictions on labourmigration from Bulgaria and Romania in the finalphase of the transitional period starting in 2012 hadnot yet been decided when this article was written.
CESifo DICE Report 2/2011 44
Research Reports
* Institute for Employment Research (IAB), Nuremberg, and FreeUniversity of Berlin.**Institute for Employment Research (IAB), Nuremberg, andUniversity of Bamberg.1 The Czech Republic, Estonia, Hungary, Latvia, Lithuania, Poland,the Slovak Republic and Slovenia.
2 Cyprus and Malta were not affected by the transitional arrange-ments for the free movement of workers.

CESifo DICE Report 2/201145
Research Reports
The different application of transitional periodsresulted in a shift of migration flows from the mainrecipient countries before the EU’s eastern enlarge-ments which kept their migration restrictions inplace, i.e.,Austria and Germany, towards those whichopened their labour markets immediately afteraccession of the new member states in 2004 like theUK and Ireland. For the whole European Union,eastern enlargement increased labour mobility sub-stantially. Today it is still an open question whetherand to which extent the opening of the Austrian andGerman labour markets will result in a further redis-tribution of migration flows within the EU. Cur-rently, labour market conditions in Germany aremuch more favourable than seven years ago, and la-bour markets in the UK and Ireland have not yet re-covered from the economic and financial market cri-sis. Moreover, Spain, which, together with Italy, is themain recipient of migrants from Bulgaria and Ro-mania, is heavily affected by the consequences of thefinancial and economic crisis and the emerging eurocrisis.This may encourage migrants particularly fromthe EU-8 countries to move toGermany or Austria rather thanto UK or Ireland. Migrant net-works, the high share of Englishlanguage proficiency among theyoung cohorts in the EU-8 coun-tries and the higher net earningsin the UK and Ireland might oth-erwise still be strong pull factorsand work against a redistributionof migration flows.
This paper analyses the effects ofintegrating the new member statesfrom Central and Eastern Europein the goods and factor marketsof the EU during the first sevenyears of the EU’s eastern enlarge-ment. We address the effects oftrade and migration in a jointframework, since we believe thata separate analysis does not makesense due to the many interac-tions between goods and labourmarkets.
Trade after the EU’s easternenlargement
The EU already started to inte-grate the prospective member
states from Central and Eastern Europe in the early1990s into its markets for goods and capital. Prior tothe EU’s eastern enlargement, the accession coun-tries signed various agreements to ensure free tradebetween the EU and the accession countries andamong accession countries themselves. As a firststep, two free trade areas were founded, the CentralEuropean Free Trade Area (CEFTA) consisting ofthe (former) Czechoslovakia, Hungary and Poland,and the Baltic Free Trade Agreement consisting ofEstonia, Latvia and Lithuania. The EU signed tradeagreements with these free trade areas which result-ed in a substantial removal of tariffs and other tradebarriers. In the next step, the European Agreements(EA), which created a free trade area between theEU member countries and the accession countries,were signed in 1997. The trade provisions agreedwithin these contracts included the removal of tariffsand quantitative restrictions for almost all kinds oftraded goods. For agricultural goods, however,numerous restrictions were maintained. Moreover,the new member states did not apply the external
Table 1
Exports to the new EU member states (EU-10) in percent of totalexports, 2000–10
2000 2001 2002 2003 2004 2005 2006 2007 2008 2009 2010
Austria 8 8 8 8 9 9 9 10 11 11 11
Belgiuma) 1 1 2 2 2 2 2 2 3 2 3
Bulgaria 3 3 3 3 3 4 5 6 6 5 6
Cyprus 2 2 3 3 2 1 1 2 2 2 2Czech Re-publicb) 10 10 10 10 10 11 11 11 12 11 11
Denmark 2 3 3 3 3 3 4 4 4 4 4
Estonia 7 7 8 9 11 11 13 14 13 12 12
Finland 6 6 6 6 6 7 7 7 8 7 6
France 2 2 3 3 3 3 3 3 3 3 3
Germanyc) 6 6 7 7 7 7 8 8 9 8 9
Greece 7 8 8 7 7 7 9 10 11 10 11
Hungary 4 4 4 5 5 7 9 10 10 9 10
Ireland 1 1 1 1 1 1 1 1 1 1 1
Italy 4 4 5 5 5 5 6 6 7 6 6
Latvia 10 11 11 11 14 19 21 23 25 26 26
Lithuania 16 16 14 16 16 18 20 21 20 20 19
Luxembourg 1 1 1 1 2 2 3 3 3 2 2
Malta 1 1 1 2 2 2 2 3 2 2 1
Netherlands 1 2 2 2 2 3 3 3 3 3 3
Poland 0 0 0 0 7 8 9 9 9 9 9
Portugal 1 1 1 1 1 1 1 1 1 2 2
Romania 4 4 4 4 5 6 7 8 8 7 8
Slovakia 0 0 0 0 15 16 17 16 17 17 18
Slovenia 5 5 6 6 7 7 8 10 10 10 11
Spain 2 2 2 2 2 2 2 3 3 3 3
Sweden 3 3 4 4 4 4 5 5 5 4 5
United King-dom
2 2 2 2 2 2 3 3 3 3 3
a) Belgium and Luxembourg before 1998. – b) Czechoslovakia before 1992. – c) Before1991: Without former GDR.
Source: Authors’ calculations based on the Eurostat External Trade Database.

tariff vis-à-vis non-EU countries before their acces-sion. The technical standards of the EU have beenintroduced in the accession countries gradually dur-ing the integration process.
The stepwise integration of the new member statesinto the Common Market of the EU is associatedwith the restructuring of trade and production pat-terns. Using a gravity-model framework Antimianiand Constantini (2010) found that economic inte-gration induced by the enlargement process hadpositive effects on the exports of the EU as well ason its competitiveness. This result holds especiallyfor those countries which joined the EU in 2004and is more evident for high-tech sectors than forlow-tech sectors. As the share of tradable goodsproduced by high-tech sectors is larger, the integra-tion process resulted in higher international com-petitiveness of the new member states and there-fore stronger exports.
A customs union affects not only the production sec-tors of the economy but also thedirection of trade. According toeconomic theory, establishing acustoms union may lead to threedifferent kinds of effects. A re-duction of tariffs and other trans-action costs results in a reductionof foreign good prices and maytherefore increase the demand forthese goods. This effect increasestrade and is recognised as mutu-ally beneficial. A second effect,the trade diversion effect, is con-nected with differences in thereduction of trade costs amongtrading partners. The removal oftariffs and a reduction of transac-tion costs for a single group oftrading partners only might resultin a trade diversion from formertrading partners that do not bene-fit from a cost and tariff reductiontowards the customs union. Thiseffect is not necessarily mutuallybeneficial and might harm someof the trading partners. The thirdeffect, trade displacement, is re-lated to a more efficient use of re-sources in shifting production andtrade from one member state toanother.
With exception of the year 2009, where trade de-clined sharply in the aftermath of the financial andeconomic crisis, we saw an increase in intra- andextra-EU trade of the EU member countries for thewhole decade up to 2010. In this time the share ofthe countries that joined the EU in 2004 (EU-10) inthe total trade of EU countries increased withrespect to both imports and exports (Tables 1 and2). Whether this fact indicates trade diversion fromtrading partners outside the EU to trading partnersinside the enlarged Union is still an open question.In an early study on EU-enlargement Wilhelmsson(2006) found that the integration process hasresulted in trade creation and, to a smaller extent,trade diversion but not in trade displacement. Thetrade creation effect can be observed between thegroup of EU member countries which joined in 2004and 2007 and the incumbent EU member states aswell as within the group of the new member states.However, most of the trade creation effect can betraced back to exports from the old to the new mem-ber states.
CESifo DICE Report 2/2011 46
Research Reports
Table 2
Imports from the new EU member states (EU-10) in percent of totalimports, 2000–10
2000 2001 2002 2003 2004 2005 2006 2007 2008 2009 2010
Austria 11 12 13 13 11 10 10 10 11 11 12Belgiuma) 2 2 2 2 2 2 2 2 2 3 3
Bulgaria 5 5 5 6 6 7 7 9 9 11 10
Cyprus 1 1 1 1 1 2 1 2 4 3 3
Czech Re-publicb) 12 12 12 12 13 15 16 16 17 17 16
Denmark 4 4 4 4 4 5 5 6 7 6 7
Estonia 8 10 11 11 15 17 18 21 25 29 27
Finland 5 6 5 5 6 7 5 6 7 7 7
France 2 2 2 2 2 3 3 4 4 5 5
Germanyc) 8 9 10 11 10 9 10 11 11 11 12
Greece 2 2 2 2 2 2 3 3 3 4 3
Hungary 7 7 7 8 9 10 11 12 12 13 13
Ireland 1 1 1 1 1 1 2 2 2 2 2
Italy 3 3 3 4 4 4 5 5 5 6 6
Latvia 22 23 24 24 28 31 32 33 34 36 35
Lithuania 11 10 11 12 18 18 20 23 21 23 21
Luxembourg 1 2 2 1 1 1 1 1 2 1 2
Malta 1 1 1 1 1 1 1 1 1 2 1
Netherlands 2 2 2 2 2 2 2 3 3 4 4
Poland - - - - 9 9 9 9 9 10 10
Portugal 1 2 2 2 2 2 2 2 2 2 2
Romania 8 9 9 10 10 10 10 15 16 17 17
Slovakia - - - - 28 30 30 30 31 33 33
Slovenia 8 8 8 8 9 9 9 8 9 9 9
Spain 1 1 2 2 2 2 3 3 3 3 4
Sweden 4 4 5 6 6 6 7 7 7 8 8
United King-dom
2 2 2 2 3 3 3 4 4 4 5
a) Belgium and Luxembourg before 1998. – b) Czechoslovakia before 1992. –c) Before 1991: Without former GDR.
Source: Authors’ calculations based on the Eurostat External Trade Database.

CESifo DICE Report 2/201147
Research Reports
Migration after EU eastern enlargement
The scale and direction of migration from the new
member states
The EU eastern enlargement is associated with asubstantial increase in migration from the new mem-ber states.The number of nationals from EU-8 coun-tries residing in EU-15 countries increased from900,000 in 2004 to 2.4 million in 2010. The net inflowof migrants from the EU-8 amounted to 210,000people p.a. on average since 2004, with most mi-grants heading to the UK and Ireland, which openedtheir labour markets immediately after EU enlarge-ment (Table 3).
The propensity to migrate varies largely across thesending countries from the EU-8 and Bulgaria andRomania (EU-2). 5.4 percent of the population ofLithuania, 4.3 percent of the population of Polandand 4.0 percent of the population of Estonia residedin EU-15 countries, while only 1.1 percent of thepopulation of the Czech Republic and 1.7 percent ofthe Hungarian population lived in the EU-15 in2010. In sum, people from a country with a highGDP per capita are less willing to move to an EU-15country than people from countries with a low GDPper capita. However, other factors like the similarityof the language, geographical distance, labour mar-ket conditions, networks of migrants and hospitalityplay also an important role for the migration pro-
pensity and the choice of destinations. In some EU-8 member countries’ ethnic minorities, particularlyethnic Russians, are especially likely to move to EU-15 countries which results in a high share of peoplefrom those countries living in EU-15 countries.
The economic rationale behind the free movementof workers is a better allocation of human resourceswithin the Common Market. Prior to the financialmarket crisis most migrants moved to Ireland andthe UK, increasing production there and reducingunemployment in their home countries. Since the be-gin of the EU’s eastern enlargement and the GreatRecession the GDP of the UK grew by 2–3 percenton average, while the Polish unemployment rate de-clined from more than 19 percent to 7 percent. Asimilar decline was reported for Lithuania (7 per-centage points) and Estonia (4 percentage points),but due to the economic and financial market crisisthe unemployment rate went up again in both coun-tries by 14 and 10 percentage points.
The financial market crisis affected the labour mar-kets heavily in Ireland and the UK. As a conse-quence, we observe a decline in the number of resi-dents from the EU-8 in Ireland and a drop in the netimmigration rate in the United Kingdom from thiscountry group. According to recent studies (e.g.,Baas and Brücker 2010; 2011) differences in eco-nomic and labour market conditions may result in afurther redistribution of migration from the UK and
Table 3
Nationals from the EU-8 in the EU-15, 2000 – 2010
2000 2001 2002 2003 2004 2005 2006 2007 2008 2009 2010
AT 52,786 54,947 57,301 59,622 67,675 75,143 80,706 86,911 94,084 98,317 103,755
BE 9,667 12,102 14,106 16,151 19,524 25,638 32,199 42,918 40,400 40,200 52,900
DK 8,763 9,470 9,664 9,963 10,762 12,770 16,203 21,807 30,033 33,179 36,590
FIN 12,804 13,860 14,712 15,825 16,459 18,266 20,801 23,957 27,464 30,877 35,068
FRA 40,852 48,480 48,984 34,451 48,584 36,783 50,418 43,227 41,573 48,145 64,800
DE 434,593 453,100 466,382 480,690 438,828 481,672 525,078 554,372 567,466 576,432 612,310
GRE 13,832 13,042 14,887 16,413 15,194 19,513 18,357 20,257 35,100 31,100 24,300
IRL 1,182 4,775 15,036 27,229 42,988 93,243 135,800 194,400 215,700 191,800 184,100
ITA 40,433 40,108 41,431 55,593 67,755 79,819 94,215 117,042 128,813 137,306 132,200
LX 1,063 1,100 1,136 1,518 2,164 3,252 3,940 4,561 5,362 6,232 6,666
NL 10,063 11,152 12,147 13,048 17,814 23,155 28,344 36,317 48,131 58,201 65,276
PT 437 492 587 662 842 1,061 1,373 2,477 2,502 2,843 2,800
ESP 16,396 23,672 34,076 42,672 55,735 70,576 103,190 126,971 137,068 139,558 141,465
SWE 23,884 22,868 21,376 21,147 23,257 26,877 33,757 42,312 50,575 57,669 62,440
UK 59,153 67,174 71,035 100,958 161,693 290,730 488,895 656,594 747,100 752,100 864,600EU-15 725,908 776,341 822,860 895,942 989,274 1,258,498 1,633,277 1,974,123 2,171,371 2,203,958 2,389,271
Notes: Labour Force Survey Data for France, UK and Ireland. Belgium and Luxembourg: national population statisticsextrapolated with Labour Force Survey data. All other countries: national population statistics.-- In some countries the 2010figures are based on extrapolations from previous years.
Source: Author's calculations based on the Eurostat Labour Force Survey, British Labour Force Survey and the nationalpopulation statistics from Austria, Belgium, Denmark, Finland, Germany, Greece, Italy, Luxembourg, Netherlands, Portugal, Spain
and Sweden.

Ireland back to the former main receiving countries,i.e., Germany and Austria. However, the economicconditions remain unstable in the aftermath of theGreat Recession and the emerging euro crisis. Thescale and the direction of future migration flowsfrom the EU-8 as well as from Bulgaria andRomania are therefore highly uncertain.
The skills composition of the labour force from the
new member states
In recent years the EU-8 countries have been able toimprove qualifications of their young population.The number of high school drop-outs decreasedwhile the number of people with a university degreeincreased sharply. In 2010 the formal structure ofqualifications of people within the age group of 25 to35 years matched the formal qualification levels inthe EU-15 countries. More than 30 percent of peoplein this age group hold a university degree, while33.5 percent of people in the EU-15 countries holdsimilar qualifications. With higher secondary educa-tion EU-8 countries outpace EU-15 countries. Morethan 61 percent of the people between 25 and 35years of age hold an upper secondary educationdegree; in EU-15 countries only slightly more than44 percent hold a similar degree. As a consequence,the share of individuals with less than upper sec-ondary education in the EU-8 is well below that ofthe EU-15.
However, there seem to be substantial problems inthe approval and acknowledgement of occupationalqualifications. Nearly 54 percent of EU-8 migrantsfrom Poland in the UK report that they hold anoccupational qualification which is not recognised inthe host country. Similar figures are reported forother EU countries like Germany (36 percent). Asubstantial number of migrants from the new mem-ber states are therefore occupied well below theireducational levels.
The labour market performance of migrants from the
new member states
Even after the economic and financial market crisis,the employment rate of EU-8 migrants is higherthan that of natives. In 2010, the employment rate ofthe native labour force in the UK was about 49 per-cent and that of EU-8 labour force 70 percent. Asimilar figure is reported for Ireland, the employ-ment rate of EU-8 labour force is 69 percent there,while that of the native labour force is 45 percent.
The high employment rate of migrants correspondswith their low age. Nearly 83 percent of migrantsstaying in the UK in 2009 are below the age of 35.The share of the population active in labour marketsis especially high in this age group. However, duringthe years of crisis we saw a sharp decrease of theemployment rate in Ireland, corresponding to a risein the unemployment rate of EU-8 migrants up to19.3 percent. In the UK, the unemployment rates ofEU-8 migrants remained at 5.5 percent well belowthe unemployment rate of natives (7.8 percent) inthe course of the crisis. One reason might be thatmigrants in the UK with a working duration of up totwelve months only have restricted access to the wel-fare system.
A macroeconomic analysis of EU enlargement andmigration
The previous sections have described the structure oftrade and employment during the period of the tran-sitional arrangements. In this section, we extend theanalysis by employing a multi-sectoral computablegeneral equilibrium (CGE) model to quantify theeffects of EU enlargement for the German economy.A multi-sectoral CGE framework not only has theadvantage of enabling us to identify the impact ofimmigration on different sectors of the economy butalso to consider the interaction between migrationand trade. Note that the interaction between migra-tion and trade may mitigate the potential labour mar-ket effects of immigration. Moreover, migrationrelated factors such as remittances have a substantialimpact on trade and other capital movements.
The model we employ here comprises 16 commodi-ties, 16 domestic industries and reflects trade of in-termediary and final goods as well as the movementof capital. It is assumed that labour markets are im-perfect and that wages adjust to changes in the un-employment rate by a wage-setting curve. The sameelasticities of the wage-setting curves as in Brückerand Jahn (2011) are used. We also assume that phys-ical capital adjusts to changes in labour supply andtrade. The speed of adjustment is based on empiricalestimates. A more detailed description of the modelis presented in Baas and Melzer (2011).
We restrict our analysis to Germany, which openedtheir labour markets in May 2011, utilising the wholetime-span of the transitional periods. Please notethat Germany was the main destination for migra-
CESifo DICE Report 2/2011 48
Research Reports

CESifo DICE Report 2/201149
Research Reports
tion from the EU-8 countries in absolute terms be-fore 2004. Baas and Brücker (2011) expect thatGermany will again receive a large share of futuremigration flows from the EU-8 considering itsfavourable labour market conditions in Germanyand the ongoing crisis in Ireland and the UK.
The evolution of trade and migration in Germany
since EU enlargement
In this simulation exercise we quantify the effects oftrade and migration after the EU accession of theten new member states in May 2004. Germany is oneof the European countries which was most affectedby the reduced transaction costs and, as a result, ben-efited substantially in terms of increasing trade withthe new member states. The transaction costs fortrade between the EU-15 and the EU-8 were alreadysubstantially reduced after the signature of the Eu-rope Agreements. During the 2004–10 period con-sidered here, Germany increased its exports to thenew member states (EU-8) by 7 percent, while ex-ports to non-EU member states increased only by4 percent during the same period of time. Importsfrom EU-8 countries increased less dramatically – by3.3 percent – leaving Germany with a considerabletrade surplus.
During the first seven years since accession, Ger-many kept its labour markets closed for EU-8 mi-grants. The increase in migration was therefore mod-erate, the stock of people in Germany from EU-8countries increased by 174,000 dur-ing the seven year period afterthe EU’s eastern enlargement in2004. Even considering the high-er employment rate of EU-8 mi-grants compared to the native la-bour force, employment in Ger-many increased after EU enlarge-ment by no more than the tinyamount of 0.25 percent. Howev-er, recent migration projectionsexpect an increase in migrationfrom the EU-8 countries duringthe next decade. For a simulationof these effects see Baas andBrücker (2010; 2011).
Simulation results
Our simulation results are largelydriven by the increasing trade with
the new member states. In our model, intermediategoods are treated as inputs like capital and labour.Trade can affect wages and the rents for capital bydifferent channels. In our case, German workersand capital owners benefit from both the higherexport demand and decreasing prices for intermedi-ate goods. The wages of German workers increasedby 0.8 percent as a consequence of EU enlarge-ment. As outlined above, we consider imperfectlabour markets here. Thus, EU enlargement resultsnot only in increasing wages, but also in decreasingunemployment. The social security system benefitsfrom the decreasing unemployment rate as well.The expenses for transfers to unemployed house-holds are reduced and national insurance contribu-tions rise. In our model we don’t distinguish be-tween the social security system and the state sec-tor. As a consequence, governmental expenses andtax revenues increase.
Secondary to the trade effects, the German economyexperienced a slight increase in migration. Immi-gration from the EU-8 into Germany has increasedby a mere 147,000 person through eastern enlarge-ment compared to the pre-enlargement status.Hence, the effects of migration are tiny in Germanywhile trade effects are relatively strong. If the partic-ipation rates of recent arrivals resemble those oftheir counterparts with a longer immigration history,EU eastern enlargement has increased the labourforce by 93,000 persons in Germany. This figuretakes into account an employment rate of migrants
Table 4
Macroeconomic effects of EU enlargement and migration in Germany
Base year(2004)
EU enlargementeffects
change in %
GDP (million �) 2,211,200 1.17
GDP per capita (�) 26,791 0.93
Private consumption (million �) 1,239,350 1.00
Investment (million �) 377,050 0.76
Government consumption (million �) 453,240 0.37
Taxes (million �) 231,490 0.88
Exports intra EU (million �) 514,790 4.54
Exports extra EU (million �) 311,461 2.61
Imports intra-EU (million �) -405,720 4.17
Imports extra EU (million �) -278,971 2.04
Wages (hourly, �) 32 0.68
Employed labour (1,000 persons) 39,361 0.25
change in per-centage points
Unemployment rate in percent 9.20 -0.48
Source: Authors’ calculations.

from the EU-8 in Germany of 63 percent, which isslightly higher than the employment rate of natives.
Overall, we see that the reduction of transactioncosts in the course of EU enlargement and the mod-est immigration has increased the German GDP by1.2 percent and the GDP per capita by 0.9 percent.Workers have benefited by higher wages (+0.7 per-cent) and reduced unemployment (-0.5 percentagepoints) (Table 4).
Trade and migration also have some impact on thesectoral structure of the economy. The manufactur-ing sector producing tradable goods is affected bythe additional labour supply and a reduction intransaction costs. On average, sectors producingnon-tradable goods, like hotels and restaurants, pub-lic services, education and administration gain fromthe enhanced labour force but less than proportion-ally from trade integration. However, the migrationeffects of EU enlargement are relatively small, evenon a sectoral base, and outpaced by the effects of areduction in transaction costs (Table 5).
Conclusions
Seven years after the EU’s eastern enlargement,trade and migration between the old and the new
member states have increasedsubstantially. Since the 1990s, theEurope Agreements and the form-ing of regional free trade areasresulted in a process of continuousintegration of goods and servicemarkets. This process has not yetcome to a halt. In the last sevenyears nearly all EU-15 countriesexperienced an increased in tradeshares with the EU-8 countries.
The formation of a customs unionbetween EU-8 and EU-15 coun-tries has fanned fears that thisprocess could result in a trade div-ersion which would negatively af-fect the trade links of the new andthe old member states of the EUwith non-EU countries in EasternEurope. The share of non-EUcountries in the trade of the newmember states has indeed declinedconsiderably in the course of theeastern enlargement process, but
we do not see a decline in absolute trade figures.
Germany, the main trading partner among the EU-15 countries of the new member states, has benefit-ed substantially from the new trade links. As oursimulation has demonstrated, both intra-EU andextra-EU trade has increased as a consequence ofthe EU enlargement, albeit the growth rate ofintra-EU trade is about twice as high as that ofextra-EU trade.
However, migration from the new member states
was very moderate in Germany after the EU’s east-
ern enlargement. The domestic workforce grew only
by 0.25 percent through the influx of workers from
the EU-8. Other countries which had already
opened their labour markets in 2004 benefited from
much higher shares of EU-8 migrants. In the UK, the
labour force increased by 560,000 workers, while that
of Ireland increased by 130,000 workers. This indi-
cates that the transitional arrangements for the free
movement of workers from the EU-8 resulted in a
strong diversion of the pre-enlargement migration
structure. Germany and Austria, which absorbed 60
percent of EU-8 migrants before enlargement, re-
ceived only 17 percent of the net inflows thereafter,
while the UK and Ireland attracted 70 percent of
migrants.
CESifo DICE Report 2/2011 50
Research Reports
Table 5
Sectoral effects of EU enlargement and migration in Germany
Base year
(2004)
EU enlarge-
ment effects
Value added
in million � Change in %
Agriculture, hunting and forestry 47,730 0.00
Fishing 420 0.20
Mining and quarrying 12,590 0.20
Manufacturing 1,357,440 1.30
Electricity, gas and water supply 91,220 0.10
Construction 189,440 0.50
Wholesale and retail trade; repair of motor
vehicles, motorcycles and personal and house-
hold goods
343,810 0.00
Hotels and restaurants 62,070 0.30
Transport, storage and communication 261,690 0.00
Financial intermediation 221,390 0.00
Real estate, renting and business activities 676,450 0.10
Public administration and defence; compulsory
social security175,940 0.40
Education 114,210 0.40
Health and social work 204,850 0.40
Other community, social and personal service
activities153,330 0.20
Activities of households 6,620 0.70
TOTAL 3,919,200 0.60
Source: Authors’ calculations.
CESifo DICE Report 2/201151
Research Reports
As a consequence, the economic effects of the EU’seastern enlargement in Germany are largely drivenby the increasing trade with the new member states.Labour migration has so far played only a secondaryrole, if at all. Our simulation results indicate that theseven years of EU enlargement resulted in a sub-stantial gain in GDP (almost 1.2 percent), while thegain in GDP per capita is slightly less than one per-cent. The tradable sectors of the economy receivedthe lion-share of the increases in production, whileproduction in most non-tradable sectors increasedless than proportionally, if at all. Workers benefitedby a substantial increase in wages (almost 0.6 per-cent) and a reduced unemployment rate (minus0.5 percentage points).
In May 2011, Germany and Austria finally openedtheir labour markets for migrants from the new mem-ber states. Given the favourable development of theGerman economy and the deteriorating situation inalternative destinations such as the Ireland and theUnited Kingdom, it is likely that Germany will receivea much larger share of the migrants from the newmember states than in the past. Nevertheless, the num-ber of EU-8 nationals who will migrate to Germany orAustria is hard to predict at present. If the net migra-tion from the new member states once again achievesthe scale it had before the financial and economic cri-sis, i.e., an annual figure of about 230,000 persons p.a.,and if Germany attracts the same share as before EUenlargement (60 percent), then annual net migrationwill be about 140,000 persons.At a high share of 45 per-cent Germany would experience an annual net immi-gration from the EU-8 of about 100,000 persons p.a.Asthe simulations by Baas and Brücker (2011) show, thenon-tradable sectors would benefit most from theopening of the labour markets, but the manufacturingsector would also see considerable growth in terms ofemployment and production. The GDP and the GDPper capita would grow even more than shown in thesimulations presented here, while the wages woulddecline modestly and the unemployment rate increaseslightly compared to a scenario without free labourmobility. Overall, the effects of trade and migration, theGDP per capita and wages will increase as a conse-quence of the EU’s eastern enlargement, while theunemployment rate will tend to decline in a settingwith imperfect labour markets.
References
Antimiani, A. and V. Costantini (2010), “Trade Performances andTechnology in the Enlarged European Union”, Department ofEconomics, University Roma Tre, mimeo.
Baas, T. and S. Melzer (2011), “Macroeconomic Effects of Remit-tances and Temporary Migration”, IAB-Discussion Paper, in press.
Baas, T. and H. Brücker (2011), “Arbeitnehmerfreizügigkeit zum 1.Mai 2011: Mehr Chancen als Risiken für Deutschland”, IAB Kurz-bericht 10.
Baas, T. and H. Brücker (2010), “Wirkungen der Zuwanderungenaus den Neuen Mittel- und Osteuropäischen EU-Staaten auf Ar-beitsmarkt und Gesamtwirtschaft”, WISO Diskurs.
Brücker, H., T. Baas, I. Beleva, S. Bertoli, T. Boeri, A. Damelang, L.Duval, A. Hauptmann, A. Fihel, P. Huber, A. Iara, A. Ivlevs, E. J.Jahn, P. Kaczmarczyk, M. E. Landesmann, J. Mackiewicz-Lyziak, M.Makovec, P. Monti, K. Nowotny, M. Okólski, S. Richter, R. Upward,H. Vidovic, K. Wolf, N. Wolfeil, P. Wright, K. Zaiga and A.Z’ylicz(2009), Labour Mobility within the EU in the Context of Enlarge-ment and the Functioning of the Transitional Arrangements, Reportfor the European Commission, DG Employment, Social Affairs andEqual Opportunities, Nuremberg, IAB.
Brücker, H. and E. J. Jahn (2011), “Migration and Wage-Setting:Reassessing the Labor Market Effects of Migration”, ScandinavianJournal of Economics 113(2), 32.
Wilhelmsson, F. (2006), Trade Creation, Diversion and Displacementof the EU Enlargement Process, Lund University, mimeo

INSURANCE CROWDING OUT
AND LONG-TERM CARE
PARTNERSHIPS
JOAN COSTA-FONT*
Introduction
Insurance for long-term care (LTC), i.e., coveragefor the costs of personal care for elderly dependentindividuals has been markedly underdevelopedcompared to insurance for health and longevityrisks, especially in Europe. This is puzzling becausethe costs associated with LTC are high but it is arelatively low-probability, and hence one shouldexpect such a contingency to meet the requiredinsurability conditions. Even in the US, barely 10percent of the elderly have private LTC insurancewhen it is estimated that more than 50 percent canafford it (Brown and Finkelstein 2004; 2007), Per-haps, the largest LTC insurance market in Europeis the French one, offering reimbursement insur-ance to three million policies and covering lessthan one percent of its population. I offer an expla-nation based on the interaction between family,government and markets. More precisely, there ap-pears to be some form of crowding out, especiallyfrom society or from the existence of strong familyties (Costa-Font 2010).
Is there public insurance crowding out?
Some scholars argue in the context of the US thatthe expansion of public subsidisation for LTC fuelsconcerns about private insurance being crowded outby public LTC insurance programmes (Pauly 1990).However, empirical evidence does not appear toconfirm this phenomenon (Brown and Finkelstein2007; Sloan and Norton 1997). The main reason isthat LTC programmes have not typically aimed at
entirely replacing individuals in activities for which
they normally take financial responsibility, but in-
stead have focused primarily on correcting the fail-
ures of private insurance markets in providing cov-
erage, and, to an extent, pursuing equity and redis-
tributive goals. In Europe, Germany adopted a com-
pulsory social insurance scheme where very affluent
individuals can opt out from public insurance (and
buy insurance privately), and Scandinavian countries
exhibit different forms of tax financed and locally
provided assistance for frail elderly in need of long-
term care. However, even in those countries that
have implemented generous public financing, public
insurance does not cover all costs (and cost sharing
arrangements are in place), the market for comple-
mentary long-term care insurance is still either small
or inexistent.
Family crowding out?
The obvious alternative to market and state financ-
ing is personal financing of LTC, either individual-
ly or within the family. This form of financing has
some advantages. For instance, it has lower trans-
action costs, can induce altruism and reduce prob-
lems associated with information asymmetry. The
obvious downside is the limited risk pooling, which
implies large sunk and administrative costs in the
event that an individual needs long-term care.
Finally, self-insurance of LTC costs comes with in-
dividuals maintaining a positive fraction of re-
sources to bequeath, which can give rise to some
forms of ex ante moral hazard to stimulate care
giving within the family (Zweifel and Strüwe 1996).
It is important to note that even when different
forms of insurance are available, as is the case in
the US, the family is still the main LTC provider. In
the US, a country exhibiting high LTC insurance
development, the value of informal care is estimat-
ed to be USD 375 million, whereas the cost of paid
services is USD 230 billion, while public expendi-
ture on LTC is 2.9 percent of GDP (Gleckman
2010). Hence, it appears that family ties can crowd
out the development of LTC insurance coverage
(Costa-Font 2010).
CESifo DICE Report 2/2011 52
Research Reports
* London School of Economics and Political Science.

CESifo DICE Report 2/201153
Research Reports
The evidence
Figure 1 shows a negative association between “fami-lism” and LTC expenditure as a percentage of theGDP in a set of European countries where data wereavailable. Furthermore, the 2007 special Eurobarome-ter survey containing data on long-term care revealsthat 30 percent of Europeans believe that the bestoption for the elderly parent is to live with one of theirchildren; 27 percent believe that elderly individualsshould stay at home and receive regular care visits,from either a public or private care-service provider,and about one-quarter of the sample believe that chil-dren themselves should provide the care. Consistently,agreement with the idea that close relatives shouldcare for dependent people, even if that means that theyhave to sacrifice their careers to some extent, rangesfrom only 7 percent in Sweden to 77 percent in Turkey.
Figure 2 plots the expectations of private and publicLTC insurance coverage in different European coun-
tries against a measure of familism, namely distanceto children. In all cases we observe a negative associ-ation between familism and support for insuranceschemes for LTC, although the association is steeperfor social insurance than for private health insurance.This evidence is supplemented by complementaryevidence from Costa-Font (2010) suggesting that fam-ily ties reduce the likelihood of individuals to expectboth public and private insurance coverage of LTC.
Conclusion and implications
In light of the evidence we conclude that a stablecontract to fund LTC should attempt to circumventboth public and family (or social) crowding out (seeCosta-Font 2010 for more details) .That is, insurancedesigns need to accommodate existing regimes ofintra-household transfers.
Two examples of models where such accommoda-tion can take place are the part-nership models proposed in theUK and the partnership systemsexisting in the US. The formerrefers to a proposal (LeGrand2003) endorsed by the 2005Wanless Report Securing Good
Care for Older People, wherebythe state is asked to provide acertain level of coverage, andindividuals are encouraged tofund extra care themselves withmatched government fundingup to the “benchmark” level ofpublic financing.
Partnership models have beenextensively implemented in theUS from 1980 onwards to allowstates to promote the purchaseof private LTC insurance by of-fering consumers access to pub-lic insurance (Medicaid) underspecial eligibility rules, shouldadditional LTC coverage (be-yond what the policies provide)be needed. The original demon-stration model has been under-way since 1992 in California,Connecticut, Indiana and NewYork and has since expanded toother states.
0
5
10
15
20
25
30
0.00 0.01 0.02 0.03 0.04 0.05 0.06 0.07 0.08
Sources: World Values Survey (2000); OECD data, 2007.
FAMILISM AND LTC EXPENDITUREQuestion: % agreeing that the family is important in life
LTC expenditure % GDP
% Disagree family is important in life
Figure 1
0
10
20
30
40
50
0 10 20 30 40 0
20
40
60
80
0 10 20 30 40
Private insurance
Source: Costa-Font (2010).
FAMILISM AND INSURANCEa) EXPECTATIONS
a) Private and public.
% insurance
Social insurance % insurance
familism familism
Figure 2

References
Brown, J. R. and A. Finkelstein (2007), “Why is the Market forLong-term Care Insurance so Small?”, Journal of Public Economics91(10), 1967–91.
Brown, J. R. and A. Finkelstein (2004), “The Interaction of Publicand Private Insurance: Medicaid and the Long-Term CareInsurance Market”, NBER Working Paper no.10989.
Costa-Font, J. (2010), “Family Ties and the Crowding Out of Long-Term Care Insurance”, Oxford Review of Economic Policy 26(4),691–712.
Gleckman, H. (2010), Long-term Care Financing Reform: Lessonsfrom the US and Abroad, The Commonwealth Fund.
Le Grand J. (2003), Motivation, Agency and Public Policy: OfKnights and Knaves, Pawns and Queens, Oxford University Press,Oxford.
Pauly, M. (1990), “The Rational Nonpurchase of Long-Term CareInsurance”, Journal of Political Economy 98(1), 153–67.
Sloan, F. A. and E. C. Norton (1997), “Adverse Selection, Bequests,Crowding Out, and Private Demand for Insurance: Evidence fromthe Long-term Care Insurance Market”, Journal of Risk and Un-certainty 15 (3), 201–19.
Zweifel, P. and W. Strüwe (1996), “Long-term Care Insurance andBequests as Instruments for Shaping Intergenerational Relation-ships”, Journal of Risk and Insurance 12, 65–76.
CESifo DICE Report 2/2011 54
Research Reports

CESifo DICE Report 2/201155
Reform Model
SCHOOL CHOICE IN THE
NETHERLANDS
HARRY ANTHONY PATRINOS*
Introduction
The Dutch education system is characterized byschool choice, made possible by public funding. Mostschools are run by private school boards, a trend thathas been increasing over the past century and a half.Publicly-funded school choice promotes competitionbetween schools, resulting in efficiency as measuredby high test scores in international student achieve-ment assessments such as PISA and TIMSS. Thecountry achieves high scores even after controllingfor national income and expenditure per student.The substantial degree of competition in the systemis one determinant of its high academic achievementrates.Thus, a large school choice system can promoteefficiency and equity without necessarily leading toprivatization or to reduced public scrutiny.
The organization of schooling
The origins of the Dutch education system can betraced back to the 1917 “schools to the parents” move-ment (James 1984; Patrinos 2002). A series of socialand political changes in the country resulted in par-ents being able to choose whatever school they wishfor their children while the state pays most of thecost. Article 23 of the Dutch Constitution ended thestate monopoly in education.At the time, all parts ofsocial life were segmented – often referred to as“pillarization” in the literature – for a period as longas 1870 to 1960 as part of a political compromise.Not only were schools organized along political andreligious lines, but so too were other aspects. Whilethe segmentation has ended, schools continue to be
oriented in a particular way. Thus, freedom of edu-cation was originally based on principles of freedomof religion.
The school system combines centralized educationpolicy with decentralized administration and man-agement of schools. Policy is determined centrally inthe Dutch education system, but the administrationand management of schools is decentralized to theschool level. The central government exercises ulti-mate control over both public and private schoolsand sets national standards for all schools. Never-theless, how to teach is left up to schools to deter-mine. In fact, school discretion is limited only by em-ployment laws; teacher qualifications, pay and condi-tions; and building standards. Funding mechanismsare designed to control national expenditures. Poorschools try to cut costs by improving efficiency, suchas using more extensive methods of teaching.
Central control is exercised over both public and pri-vate schools. The system is characterized by a largecentral staff; many school advisory services and coor-dination bodies; a strong Education Inspectorate; andstringent regulations. The central government, throughthe Minister of Education, Culture and Science, con-trols education by means of legislation, taking ac-count of the provisions of the Constitution. Its primeresponsibilities with regard to education relate to thestructuring and funding of the system, the manage-ment of public-authority institutions, inspection, ex-aminations and student support. Control may be exer-cised by imposing qualitative or quantitative stand-ards relating to the educational process in schools andattainment results, by means of arrangements for theallocation of financial and other resources, and by im-posing conditions to be met by schools. The centralgovernment decides what types of school may exist;the length of courses in each type of school; standardsfor teaching staff; number of teaching periods; sal-aries; examinations; and the norms for the establish-ment and closure of schools.
Most schools are private, and most private schoolsare managed by a religious organization, while pub-lic schools are managed by municipal authorities. All
* Lead Education Economist World Bank. The views expressedhere are those of the author and should not be attributed to theWorld Bank Group.

schools are governed by a legally recognized author-ity (school board).The school board is responsible forimplementing legislation and regulations in schools.There is, despite school choice and diversity of supply,no significant elite school sector (Karsten et al. 1995).Primary and secondary schools receiving publicfunds must be not-for-profit. Nevertheless, schoolboards are able to retain surplus earnings. There area few for-profit schools, representing less than onepercent of total enrollments (Hirsch 2002), but theyare too small to receive government funds.
Competition and funding
Competition and equal funding are hallmarks of theDutch education system. Under article 23 of the Con-stitution, all educational institutions – public and pri-vate – are funded equally. This means that govern-ment expenditure on public educational institutionsmust be matched by expenditure on private, govern-ment-funded educational institutions. Schools quali-fy almost automatically for funding, provided theymeet the quality standards and funding conditionsimposed by law for the school system as a whole.Funds are channeled from the Ministry to education-al institutions both directly and indirectly. Schoolsreceive a block grant to cover their staffing costs inaddition to the block grant already allocated for run-ning costs. As a result, school boards now receive asingle sum of money, which they are free to spend attheir own discretion, giving them more scope tomanage the school as they see fit.
There is relative ease of entry for new providers. Asmall number of parents can and do start a school.The requisite number of parents required to set up aschool varies according to population density, from200 for small municipalities to 337 for The Hague.The central government provides initial capital costsand ongoing expenses, while the municipality pro-vides buildings. Schools also receive a small fund foroperating expenses that they may allocate at theirdiscretion among activities such as maintenance,cleaning, heating, libraries and teaching aids. Thesum is determined separately by each municipality,which must then give all public and private schoolsthe same per capita amount.
Students and their families are entitled to choose theschool – public or private – they wish to attend. Themain impediments to choice are distance, althoughparents are free to choose a school anywhere in their
city of residence or indeed anywhere in the countrysince there is no catchment area. Public schools mustadmit all pupils, and most pursue non-restrictiveadmissions policies. A school cannot refuse to admita child if parents are unable or unwilling to pay.Once it is certain that a child is to be admitted to theschool, a written contract between the school and theparents is written and signed, stating what the par-ental contribution is to be used for and what willhappen if it is not paid in full.
School funding is on a per capita basis. That is,money follows students and each school receives foreach enrolled student a sum equivalent to the percapita cost of public schooling (Patrinos 2002). Theschool that receives the funds is then entitled tofunding that will cover specified amounts of teachersalaries and other expenses. The number of teachersto which a school is entitled depends on its numberof students. Private schools can and do supplementthis funding by charging ancillary fees; however, thisright is severely limited. There is no evidence ofrefusing at-risk students (Karsten and Meijer 1999).Municipal schools charge small fees during the 12-year compulsory stage of schooling. Schools arefully accountable to the parents for the use of feescollected. Moreover, parents can claim back theirchild’s travel costs if there is no school (or no schoolof the denomination or educational character soughtby the parents) within a radius of six kilometersalong a route considered safe and accessible to chil-dren. Parents apply to the municipal authorities, whodraw up rules on this matter.
Other private contributions and sponsorship areallowed, but no advertising materials are permitted,and schools may not become dependent on sponsors(Droog 2001; de Vijlder 2001). The central govern-ment pays most of the running costs. Limited localgovernment discretion is allowed. Municipalities organize and pay for minority language teaching. Sal-aries are based on fixed scales that take into accounteducation and experience. While the freedom to or-ganize teaching means that schools are free to deter-mine how to teach, the Ministry of Education, Cul-ture and Science does, however, impose a number ofstatutory standards in relation to the quality of edu-cation.These prescribe the subjects to be studied, theattainment targets and the content of national exam-inations. There are also rules about the number ofteaching periods per year, teacher training and teach-ing qualifications, the rights of parents and pupils tohave a say in school matters, and the planning and
CESifo DICE Report 2/2011 56
Reform Model

CESifo DICE Report 2/201157
Reform Model
reporting obligations of schools. As a rule, schoolsenjoy considerable freedom in the choice of text-books and materials, and in the way they managetheir affairs. The Education Inspectorate is chargedby the Minister of Education with supervising themanner in which schools fulfill their responsibilities.The financing procedure is somewhat different at thesecondary level. All teacher salaries and buildingcosts are covered directly by the municipality. Inaddition, municipal and private secondary generalschools that are included in the Minister of Edu-cation’s three-year plan receive the same discre-tionary fund per capita. Since 80–90 percent of allcurrent school expenditures are for teacher salaries,this immediately places the bulk of budgetary deci-sions in the hands of the central government.
Most children in the Netherlands attend privateschools (Figures 1 and 2) and the trend over the past
150 years is increasing. While 35 percent of schoolsare public, 29 and 27 percent are Catholic and Pro-testant (Hupe and Meijs 2000). There are also pri-vate non-denominational schools that are run by anassociation or foundation but are not based on anyspecific religious or ideological beliefs. Like somepublic schools, many privately run schools base theirteaching on specific educational principles.
Education in the Netherlands is free for the compul-sory, first ten years of schooling. At all levels of edu-cation, the Dutch government spends the OECDaverage (OECD 2009). Education spending as a pro-portion of GDP is 4.8 percent. Thus, achievement lev-els are high, while relative costs are low. To deal withdisadvantage, a weighted funding formula is used. Forevery ethnic minority student, a school receives 1.9times the amount paid for other children. This is ex-tra funding for personnel. Native children from disad-
vantaged backgrounds receive 1.25times the amount (Ritzen et al.1997; see Leuven et al. 2007 for anevaluation).
Achievements
The Netherlands scores high ininternational academic achieve-ment tests. For example, in Trendsin International Mathematics andScience Study (TIMSS), Nether-lands scored near the top in bothsubjects in 2007, repeating its per-formance in earlier years, such asin 2003, 1999 and 1995.The Nether-lands consistently scores in the topten in math and science. As basedon TIMSS in 2008, the Netherlandswas the second best performingcountry in mathematics and sci-ence achievement in the final yearsof secondary school. In compari-son to other countries the Nether-lands also achieves high TIMSSscores, even when controlling forlevel of national income (as well asexpenditure per student).
In the OECD’s Programme forInternational Student Assessment(PISA), the Netherlands does verywell. In all three subjects, math, sci-ence and reading, the Netherlands
0
20
40
60
80
100
1830 1850 1870 1890 1910 1930 1950 1970 1990 2010
Public Private
Sources: James (1984); M. K. Justesen (2002); Ministry of Education.
PRIMARY PUBLIC AND PRIVATE ENROLLMENT%
Figure 1
0
20
40
60
80
100
1830 1850 1870 1890 1910 1930 1950 1970 1990 2010
Public Private
Sources: James (1984); M. K. Justesen (2002); Ministry of Education.
SECONDARY PUBLIC AND PRIVATE ENROLLMENT%
Figure 2

consistently scores above the OECD average (Ta-ble). Research has found that confessional schoolsperform better than public schools (see, for example,Dijkstra et al. 2001). Despite the fact that there is noelite school sector, there is some evidence of higherquality in private schools, especially Catholic andProtestant secondary schools (Dronkers 1995). Acareful analysis of school performance in the Nether-lands shows that Catholic schools out-perform otherschools, especially public schools (Levin 2002). Thesuperior performance holds even after controlling foreducational practices and selection. The results showthat Catholic schools perform better, when schoolingchoice is available and affordable for the majority offamilies.
In the latest analysis of Dutch education performance,Patrinos (2011) uses an instrumental variable ap-proach. The estimate of the impact of private schoolattendance is associated with higher test scores inmath, reading and science achievement equivalent to0.19, 0.31 and 0.21 of a standard deviation, all largeand significant effects. Therefore, not only is privateschool attendance contributing to achievement inthe Netherlands, but it is made possible because ofthe school financing model.
Conclusions
There is significant freedom of education in theNetherlands. Parents have the opportunity to chooseschools, to establish schools, to organize teaching and
to determine the principles of theschool. This has resulted in a largenumber of non-public schools fi-nanced by the state. Moreover,parents can typically choose amongseveral schools. Parents have ac-cess to a variety of schools, accessis not selective, all schools are pub-licly financed and receive equalfunding, there is ease of entry forproviders into the market, and in-formation flows. Most children inthe Netherlands attend privately-managed schools. Private schoolsare not for profit and usually man-aged by a foundation or church.
The Netherlands shows that alarge private sector with equalpublic funding does not necessar-ily mean decentralization and a
weak central role. Choice can coexist with a strongcenter. Interestingly, as the center has moved awayfrom any direct provision of education services itsrole in policy making, evaluation and informationdissemination increased. Therefore, the fear of thestate’s retreat from matters of importance in educa-tion policy with the introduction of market forces isnot founded.
References
de Vijlder, F. J. (2001), “Choice and Financing of Schools in theNetherlands: The Art of Maintaining an Open System Responsiveto its Changing Environment”, Max Groote Expert Center, Univer-sity of Amsterdam, mimeo.
Dijkstra, A., J. Dronkers and S. Karsten (2001), “Private Schools asPublic Provision for Education School Choice and Marketization inthe Netherlands and Elsewhere in Europe”, Occasional Paper no.20, National Center for the Study of Privatization in Education,Teachers College, Columbia University.
Dronkers, J. (1995), “The Existence of Parental Choice in theNetherlands”, Educational Policy 9(3), 227–43.
Droog, M. G. A. (2001), “Information Dossier on the Structure ofthe Education System in the Netherlands 2000”, Netherlands Ministryof Education, Science and Culture, EURYDICE Unit.
Hirsch, D. (2002), “School: A Choice of Directions”, OECD CERIWorking Paper: What Works in Innovation in Education.
Hupe P. L. and L. C. P. M. Meijs (2000), Hybrid Governance: TheImpact of the Nonprofit Sector in the Netherlands, Social and Cul-tural Planning Office, The Hague.
James, E. (1984), “Benefits and Costs of Privatized Public Services:Lessons from the Dutch Educational System”, Comparative Educa-tion Review 28(4), 605–64.
Justesen, M. K. (2002), Learning from Europe. The Dutch andDanish School Systems, Adam Smith Institute, London.
Karsten, S., I. Groot and M. A. Ruiz (1995), “Value Orientations ofthe Dutch Educational Elite”, Comparative Education Review 39(4), 508–21.
CESifo DICE Report 2/2011 58
Reform Model
Table
PISA 2009 results
Math Science Reading
1Shanghai-China
600Shanghai-China
575Shanghai-China
556
2 Singapore 562 Finland 554 Korea 539
3Hong Kong-China
555Hong Kong-China
549 Finland 536
4 Korea 546 Singapore 542Hong Kong-China
533
5Chinese-Taipei
543 Japan 539 Singapore 526
6 Finland 541 Korea 538 Canada 524
7 Liechtenstein 536New Zea-land
532 New Zealand 521
8 Switzerland 534 Canada 529 Japan 520
9 Japan 529 Estonia 528 Australia 515
10 Canada 527 Australia 527 Netherlands 508
11 Netherlands 526 Netherlands 522 Belgium 506
Source: OECD (2007).

CESifo DICE Report 2/201159
Reform Model
Karsten, S. and J. Meijer (1999), “School-Based Management in theNetherlands: The Education Consequences of Lump-Sum Fund-ing”, Educational Policy 13(3), 421–39.
Leuven, E., M. Lindahl, H. Oosterbeek and D. Webbink (2007),“The Effect of Extra Funding for Disadvantaged Pupils on Achieve-ment”, Review of Economics and Statistics 89(4), 721–36.
Levin, J. D. (2002), Essays in the Economics of Education, PhDDissertation, University of Amsterdam.
OECD (2007), PISA 2006: Science Competencies for Tomorrow’sWorld, Paris.
OECD (2009), Education at a Glance, Paris.
Patrinos, H. A. (2002), “Private Education Provision and Public Fi-nance: The Netherlands as a Possible Model”, Occasional Paper no.59, National Center for the Study of Privatization in Education,Teachers College, Columbia University.
Patrinos, H. A. (2011), “Private Education Provision and Public Fi-nance: The Netherlands”, Education Economics, in press.
Ritzen, J. M. M., J. Van Dommelen and F. J. De Vijlder (1997),“School Finance and School Choice in the Netherlands”, 16(3),329–35.
Teelken, C. (1998), “Market Mechanisms in Education: A Com-parative Study of School Choice in the Netherlands, England andScotland”, Ph.D. Dissertation, University of Amsterdam.

FINANCIAL INCLUSION:REFORMS IN THE AREAS OF
CONSUMER PROTECTION AND
FINANCIAL LITERACY
During the recent financial crisis both household in-vestors and borrowers were confronted with un-pleasant surprises. Individual investors learned thatthe financial products they bought were much riski-er than they had perceived. Borrowers found them-selves overindebted and unable to service theirloans. How did this come about? Investors were look-ing for high-yield investments and banks began of-fering newly designed products with the promise ofhigher returns. In addition many households wereinterested in more and higher loans to finance con-sumption, for example, and banks were often willingto grant them. Thus, for both investors and borrow-ers the demand for a financial service or product andits supply had an impact on the outcome. Both situa-tions show how far-reaching financial decisions canbe if mistakes are made – not only for the individualhousehold but for the entire economy as the follow-ing statement shows: “Lack of effective disclosureand deceptive advertising on the part of providersand failure to understand financial products on thepart of consumers contributed to the collapse of thesubprime mortgage market in the United States”(CGAP/WB 2010, 23).
This implies that the institutional environment inwhich financial services and products are offeredplays an important role. Improving institutions shouldthus help to prevent negative outcomes in the fu-ture.The Table provides some information on the re-forms carried out in different countries. Financial in-clusion is, of course, a topic of high priority in devel-opment economics. In this context it has many moreaspects than the two we focus on here. But these twoaspects are highly relevant for industrialised coun-tries as well – as the financial crisis has shown. Theinformation comes from a survey conducted on fi-nancial inclusion in a joint initiative by the Con-sultative Group to Assist the Poor (CGAP) and theWorld Bank Group among financial regulators onthe agenda under purview of their agency.
Consumer protection aims at protecting consumersagainst unfair or deceptive practices by financial ser-vice providers, at improving transparency by com-plete disclosure of clear, adequate and comparable
information about prices, terms and conditions offinancial products and services, and at establishing arecourse mechanism to address complaints and re-solve disputes quickly and inexpensively (CGAP/WB 2010, 24). “Financial literacy refers to the needto inform the public about the basics of financial ser-vices and ensure individuals’ ability to make in-formed judgments and effective decisions about theuse and management of their finances.” (CGAP/ WB2010, 17).
In both areas many countries initiated reforms in2009. In the area of consumer protection the mostcommon reforms aim at disclosure requirements anddispute resolution systems. In some countries, amongthem the Czech Republic and Finland, fraud protec-tion is also improved.The extension of deposit insur-ance is sometimes also considered to be consumerprotection. Reforms in the area of financial literacycomprise, for instance, the creation or update of fi-nancial education school programs, the establish-ment of financial literacy weeks and the launch offinancial learning centres. As the Table shows, nearlyall countries in our sample have introduced reformsthat contribute to consumer protection. From theTable we also see that only a few countries have im-proved financial literacy (CGAP/WB 2010).
CESifo DICE Report 2/2011 60
Database
Table
Financial inclusion: areas of reform in 2009
Consumerprotection
Financialcapability
Austria +Belgium +Bulgaria + +Czech Republic +Finland +France +Hungary +Ireland +Italy +Latvia +Lithuania +Portugal +Slovak Republic +Spain + +United Kingdom + +
Croatia + +Macedonia
Switzerland +Turkey
Canada + +Japan +New Zealand + +United States +
Source: CGAP/WB (2010).

CESifo DICE Report 2/201161
Database
Numerous countries have put in place reforms relat-ed to consumer overindebtedness. Here measures onthe supply as well as the demand side should help toimprove the situation. On the supply side, requiringstricter risk management and improving transparen-cy in credit markets were the first measures. In thisrespect, the rules under which credit bureaus andcredit registries operate are of particular importance(see Hainz 2011 for a more comprehensive treatmentof information sharing arrangements). Portugal, forexample, makes credit bureau consultation mandato-ry. But, of course, the demand side for loans must alsobe addressed by providing better education on howto make financial decisions (CGAP/WB 2010).
The distortions that became evident during the fi-nancial crisis clearly indicate that the scope forimproving the institutional environment is huge.Thus,we can expect to see many more reforms in the twoareas investigated here in the coming years.
C. H.
References
CGAP/WB (Consultative Group to Assist the Poor/World BankGroup) (2010), Financial Access 2010: The State of Financial In-clusion through the Crisis, Washington DC.
Hainz C. (2011), “Measuring Information Sharing in CreditMarkets”, CESifo DICE Report 9(1), 21–27.

HEALTH INSURANCE COST
SHARING AND DIFFERENCES
IN HEALTHCARE ACCESS AND
COST BY INCOME IN ELEVEN
COUNTRIES
The level of health insurance cost sharing varies in-ternationally and so does the importance of out-of-pocket healthcare spending. Deductibles and co-pay-ments are two main cost sharing mechanisms. A de-ductible determines the amount a patient has to payout of pocket before insurance coverage takes effect.Deductibles usually refer to annual expenditure butcan also be by case. For instance, someone with aUSD 1,000 annual deductible would have to pay forall healthcare accessed in that year until the USD1,000 limit is reached. Insurance would cover anyadditional costs. Co-payments accrue at the point ofservice. For instance, in Germany, patients coveredunder the Statutory Health Insurance system payEUR 10 for the first doctor visit in each quarter,EUR 10 for each of the first 28 days in hospital care,and 10 percent of the cost of prescribed medications(up to a maximum of EUR 10 per prescription). Athird determinant of out-of-pocket spending is thecomprehensiveness of benefit packages. While mostcountries tightly regulate insurance markets toensure that a comprehensive package is offeredunder all insurance types, some – for example theUnited States – are less restrictive.
The aim of cost sharing is to increase cost awarenessamong patients which, ideally, limits wasteful health-care use without incentivizing patients to forgo nec-essary care (Cutler und Zeckhauser 2000).The RANDHealth Insurance Experiment 1974–82 empiricallytested the effects of cost sharing schemes on health-care use and health outcomes for the US (Newhouse2004). The results showed that healthcare use de-clined across all income levels when cost sharing in-creased. At the same time, however, the healthcareuse reductions negatively affected the health of thepoor, putting in into question the usefulness of cost-sharing as a cost containment instrument.
In a recent empirical study, Schoen et al. (2010) ex-amined the differences in healthcare access and costbetween individuals with above and below-medianincomes in 11 countries with different cost sharingprovisions. The international differences in provi-
sions are shown in Table 1. With the exception of theUS, Switzerland and the Netherlands, where thestandard insurance is private, none of the 11 countrieshas a deductible in its primary health insurancescheme. To avoid catastrophic health costs, Switzer-land and the Netherlands, however, cap the de-ductible and require private insurers by law to offer acomprehensive benefit package. At the other end ofthe spectrum, the tax-financed British public healthsystem provides healthcare free of deductibles andexempts low income households from the limited co-payments. Canada’s national healthcare system alsohas no deductibles, but benefits are less generous thanin other countries – prescription drugs and dental careare not part of the core benefit package. In France,almost all buy supplementary private insurance tocover the co-payments accruing in the public healthsystem. Germany, Norway, Sweden and Switzerlandavoid catastrophic health costs by placing annual in-come-related or absolute spending caps on co-pay-ments, and Australia and New Zealand subsidize co-payment expenditure above a certain limit.
Table 2 summarizes Schoen et al.’s (2010) analysisfor six measures of healthcare access and cost for re-spondents with below and above-median incomes.The percentages are adjusted for differences in age,health status and – for the US – whether the respon-dent has health insurance.
The above-median income group is more confidentto receive the most effective treatment availableacross all countries. The difference between individ-uals with above and below-median incomes is small-est and not statistically significant in the UK, fol-lowed by Germany and France. In contrast, in the USthe difference is 17 percentage points.
Confidence in being able to afford necessary medicaltreatment is also more common among individualswith higher incomes in all countries. The UK againhas the smallest gap between individuals with highand low incomes. Public, tax-financed healthcare,however, does not seem to remove income differ-ences in perceived affordability by itself as thelargest difference – 28 percentage points – is foundin Canada.
The third access measure is the share of respondentswho did not fill a prescription or skipped a dose, hada medical problem but did not visit a doctor or hadskipped a test, treatment or follow-up for cost rea-sons.With the exception of the UK, forgone care due
CESifo DICE Report 2/2011 62
Database

CESifo DICE Report 2/201163
Database
Table 1
Cost sharing in 11 high-income countries, 2010
Benefit packageCountry (2008 per capita
spending onhealth care; population)a)
Deduct-ible
Annual out-of-pocket maximum
Medica- tion: core
benefit
Cost sharingfor primary care visits
Role of privateinsurance
Provisions forlow-income
patients
France(USD 3,696;61.8 million)
No No Yes Yes
90% buy coveragefor suppl. cost shar-ing and some extra benefits
Supplements costsharing; exemp-tion for chronicdisease
Germany (USD 3,737;82.1 million)
No
2% of income;1% for patients
with chronic diseases and low
incomes
Yes Yes
Approx. 20% buy coverage for suppl.cost sharing andamenities; 10% buy a substitute and opt out of social in-surance
Income-relatedcontribution forinsurance; out-of-pocket maximum 1% of income
Netherlands(USD 4,063;16.4 million)
EUR 165–665
(USD219–883)
No Yes No
Private plans pro-vide core benefits;80% buy extra benefits
Income-relatedpremium assist-ance (approx.40% receive)
Sweden(USD 3,470;9.2 million)
No
SEK 900 (USD 127) forhealth services;
SEK 1,800 (USD 254) for
pharmaceuticals
Yes Yes
Fewer than 5% buycoverage for fasteraccess and use ofprivate providers
None
UnitedKingdom(USD 3,129;60.5 million)
No No Yes No
Approx. 10% buy coverage for bene-fits and private fa-cilities
Cost-sharingexemption
Norway (USD 5,003;4.8 million)
NoNOK 1,615 (USD 271)
Yes Yes
Fewer than 5% buycoverage for fasteraccess and use ofprivate providers
None
Switzerland (USD 4,627;7.6 million)
CHF 300–2,500 (USD289–
2,405)
CHF 700 (USD 673)
maximum afterdeductible
Yes Yes
Private plans pro-vide core benefits;70% buy extra benefits
Income-relatedpremium assist-ance (30% re-ceive); deductibleexemption
Australia (USD 3,353 in 2007;21.4 million)
No
80% out-of-pocket subsidy
if exceedsAUD 1,126 (USD 1,033)
Yes Yesb)
50% buy coveragefor suppl. cost shar-ing and access toprivate facilities
Lower cost shar-ing; lower out-of-pocket maximum before 80% sub-sidy
Canada(USD 4,079;33.1 million)
No No No c) No
Approx. 67% buycoverage for extra benefits
Some cost-shar-ing exemptions;varies by pro-vincec)
New Zealand(USD 2,683;4.3 million)
No
Subsidies after12 doctor visits or20 prescriptions in
previous year
Yes Yes
Approx. 33% buy coverage for suppl.cost sharing, private facilities, and spe-cialists; small shareof total spending
Lower cost sharing
United Statesd)
(USD 7,538;304.5 million)
Yes, nolimit
No
Yes for Medicaid,Medicarew/supple-
ment
Yes
66% have privateprimary insurance;supplements andsubstitutes for Medicare
Medicaid sepa-rate; 2010 re-forms lower pre-mium and costsharing starting in2014
Notes: Currency converted to US dollars using http://oanda.com on 9 August 2010.a) Spending adjusted for cost of living. – b) To make services free or low cost to patients, the majority of Australianprimary care providers bill the government direct for the covered amount (referred to as “bulk billing”). – c) Varies byprovince; there is no national requirement for core Canadian Medicare benefits. – d) Before passage of the AffordableCare Act.
Source: Schoen et al. (2010).

to cost is more prevalent among individuals withbelow-median incomes in all countries. The relativedifference is largest in Norway, where individualswith below-median incomes are more than fourtimes more likely to forgo care. In absolute terms,the difference is largest in the US where 39 percentof below median income respondents have forgonecare for cost reasons. Despite its capping of co-pay-ments, Germany has the second largest share of indi-viduals with both above and below-median incomeswho have not used health services because of cost.
With regards to out-of-pocket healthcare spending,the United Kingdom, Sweden and France have the
lowest share of respondents with annual spendingabove USD 1,000. The highest share is found in theUS, Switzerland and Australia, where the differ-ences between above and below-median incomeearners are also large. Higher out-of-pocket spend-ing, however, only appears to translate into wide-spread payment problems in the US, where they arereported for 24 percent in the below-median in-come group. In all other countries, the percentage isbelow 13 percent. The lowest percentage is againfound in the UK, where only 3 percent report pay-ment issues.
S. N.
CESifo DICE Report 2/2011 64
Database
Table 2
Healthcare access and cost by income-level in 11 countries, 2010
Country,income level(sample size)
Percent who were confident
or very con-fident that theywould receivemost effective
treatment
Percent who were confident
or very con-fident that
they would beable to affordneeded care
Percent who experiencedat least one
accessbarrier due
to cost
Percent who had out-of-
pocket spending of USD 200 or
less
Percent who had out-of-
pocket spending of
USD 1,000 ormore
Percent who had seriousproblemspaying or
were unableto pay medical
bills
FranceAbove average (619) 88 78a) 8a) 41a) 5 2a)
Below average (508) 85 67 17 53 5 13
GermanyAbove average (289) 82 77a) 17a) 40a) 10a) 1a)
Below average (223) 78 62 27 52 5 7
NetherlandsAbove average (488) 88a) 87a) 3a) 37 11 2a)
Below average (224) 81 65 13 42 7 11
SwedenAbove average (917) 70a) 79a) 5a) 52 2 2a)
Below average (598) 58 61 14 49 2 9
United KingdomAbove average (342) 95 93a) 4 88 0 2Below average (274) 92 87 4 86 0 3
NorwayAbove average (638) 72a) 79a) 4a) 30a) 16 1a)
Below average (201) 63 57 21 39 15 10
SwitzerlandAbove average (354) 91a) 86a) 7a) 19a) 34a) 2a)
Below average (569) 86 67 12 26 20 9
AustraliaAbove average (855) 79a) 77a) 12a) 23a) 31a) 5a)
Below average (1,649) 73 56 22 44 16 10
CanadaAbove average (1,155) 80a) 79a) 6a) 48 17a) 2a)
Below average (1,161) 71 51 18 51 12 9
New ZealandAbove average (296) 87a) 85a) 8a) 56a) 11a) 2a)
Below average (419) 78 67 15 68 6 6
United StatesAbove average (853) 82a) 74a) 20a) 24a) 45a) 9a)
Below average (861) 65 50 39 38 29 24
Note: Percentages were adjusted based on logistic regression to control for health status, age, and – in the US – in-surance status. Average is the median.a) Indicates significant within-country differences with below-average income (p < 0:05).
Source: Schoen et al. (2010).

CESifo DICE Report 2/201165
Database
References
Cutler, D. M. and R. J. Zeckenhauser (2000), “The Anatomy ofHealth Insurance”, in A.J. Culyer and J.P. Newhouse, eds.,Handbook of Health Economics, vol. 1, Elsevier Science, Amster-dam, 563–646.
Newhouse, J. P. (2004), “Consumer-directed Health Plans and theRAND Health Insurance Experiment“, Health Affairs 23(6),107–13.
Schoen, C., R. Osborn, D. Squires, M. M. Doty, R. Pierson and S.Applebaum (2010), “How Health Insurance Design Affects Accessto Care and Costs, by Income, in Eleven Countries”, Health AffairsWeb First, 18 November 2010.

PENSION POLICIES
– PENSIONABLE AGE AND
LIFE EXPECTANCY
Increasing life expectancy is generally praised be-cause people live longer and healthier lives. For pen-sion systems, however, a longer life expectancy con-stitutes a serious economic and political challenge.
As life expectancy increases, people spend moretime in retirement if the pensionable age, the age atwhich people can cease work and receive full bene-fits, is left unchanged. The longer duration of retire-ment leads to increasing costs of pension systems.The OECD (2011) draws attention to this problem
by giving an overview of the development of pen-sionable age and life expectancy over time in theOECD countries and presenting how governmentsdeal with longer retirement durations.
Some key indicators are summarised in Table 1. Thefirst six columns show the pensionable age for menand women in 1958 and 2010, respectively, as well asa forecast for the pensionable age in 2050.1
In most countries the pensionable age is set out ex-plicitly. In others, however, the eligibility to draw apension does not depend on age but on years of con-tribution (e.g., 37 years in Greece or 25 years for male
CESifo DICE Report 2/2011 66
Database
Table 1
Pensionable age and life expectancy
Pensionable age Life expectancy after pensionable age
Men Women Men Women
1958 2010 2050 1958 2010 2050 1958 2010 2050 1958 2010 2050
Australia 65 65 67 60 62 67 12.5 18.6 19.7 19.4 24.3 23.3Austria 65 65 65 60 60 65 12 17.5 21.1 18.6 25.1 24.5
Belgium 60 60 60 60 60 60 15.3 21.1 24.8 18.5 25.8 29.8
Canada 69 65 65 69 65 65 18.3 21.4 21.4 24.8
Czech Republic 60 61 65 60 58.7 65 15.4 17 18.1 18.5 23.8 22.5
Denmark 65 65 67 60 65 67 13.7 16.4 17.2 19.3 19.8 21
Finland 65 65 65 65 65 65 11.5 16.8 19.8 13.7 21 24,7
France 65 60.5 61 65 60.5 61 12.5 21.7 24.8 15.6 26.5 29.5
Germany 63 65 65 60 65 65 14.2 17 20.3 18.1 20.7 24.4
Greece 57 57 60 57 57 60 19.9 24 24.1 21.5 27.1 28.3
Hungary 60 60 65 55 59 65 15.6 16.5 16.3 22.6 22.6 21.1
Iceland 67 67 67 67 67 67 16.8 19.8 19.2 22.9
Ireland 70 65 65 70 65 65 7.6 16.9 20 9.4 20.6 24.3
Italy 60 59 65 55 59 65 22.8 20.9 27.4 25.5
Japan 60 64 65 55 62 65 14.8 19.8 21.6 22.8 26.7 27.7
Korea 60 65 60 65 20.2 19.3 25.2 24.5
Luxembourg 65 60 60 65 60 60 12.5 20.8 24.6 14.5 24.9 28.6
Mexico 65 65 65 65 65 65 14.2 17.2 18.9 14.6 19.4 21.9
Netherlands 65 65 65 65 65 65 13.9 17.3 20.6 15.3 20.4 23.5
New Zealand 60 65 65 60 65 65 18.1 21.2 20.9 24.3
Norway 70 67 67 70 67 67 9.5 15.7 18.9 11.1 18.9 22.5
Poland 60 65 65 60 60 60 15.9 14.4 17.2 18.7 23.1 26.6
Portugal 65 65 65 65 65 65 12.4 16.3 19.2 14.5 20.2 23.6
Slovak Republic 60 62 62 60 57 62 16.6 14.9 18.6 18.4 24.9 23.9
Spain 65 65 65 65 65 65 13.1 17.9 21.4 15.3 21.8 25.1
Sweden 67 65 65 67 65 65 11.7 17.9 21.1 13.3 21.1 24.2
Switzerland 65 65 65 60 63 64 12.9 18.9 22.4 19 24.1 26.6
Turkey 44.9 62.3 41 60.8 31.1 22.5 36.9 23.2
United Kingdom 65 65 68 60 60 68 11.9 16.9 16.9 18.9 24.5 21.9
United States 65 66 67 65 66 67 12.8 16.8 17.7 15.8 19.3 21.9
Average 63.9 62.9 64.6 62.3 61.8 64.4 13.4 18.5 20.3 17 23.3 24.6
Note: Germany refers to West Germany for 1958. Czechoslovakian data are used for the Czech and Slovak Republicswhere appropriate. Where there is more than one value per calendar year, these have been averaged. The recentchange in pensionable age in the UK is not reflected in the Table.Life-expectancy is calculated using data from 1960 for the pensionable age in 1958.
Source: OECD (2011, 25–26, 29–30).
1 A more detailed presentation of the development over time isprovided in the OECD (2011) report.

CESifo DICE Report 2/201167
Database
workers in Turkey). For the sake of comparison, it isassumed that each individual started to work at theage of 20 and works uninterruptedly until retirement(e.g., leading to a pensionable age of 57 in Greece and45 in Turkey). Although there are different pensionprogrammes for different groups of workers, theOECD (2011) focuses on private-sector workers.Earlier retirement ages for workers in public sectorsor hazardous and arduous occupations are not takeninto account.
The cross-time view shows that for 14 countriesmen’s pensionable age in 2010 is the same as in 1958,seven countries have a lower and seven countrieshave a higher pensionable age for male workers. Theaverage pensionable age for men was lowered from64.3 to 62.9 years between 1958 and 2010. A moredetailed picture of the development between 1958and 2010 shows that following an average low pointof 62.4 years in 1993, the majority of countries in-creased the pensionable age up to 2010 or set up re-forms to do so in the future.
The 2050 forecast predicts that 18 countries will keeppensionable age for men at the level of year 2010,either because they already increased it (e.g., Ger-many) or because pensionable age was considered tobe high enough without a reform (e.g., Austria). Mean-while, twelve countries will experience an increase inpensionable age from 2010 up to 2050. There is noOECD country planning to lower the pensionable agefor men facing further increases in life expectancy.
The trend indicates that governments aim to equalisethe retirement ages of men and women by increasingwomen’s pensionable age faster than men’s. The dif-ference in average was 1.6 years in 1958, but decreasedto 1.1 years in 2010. It is forecasted to be only 0.2 yearsin 2050 when Poland, Switzerland and Turkey are pro-jected to be the only countries with pensionable agelower for women than for men. In 2010, gender differ-ences could still be found in eleven countries.
A key question is whether increases in pensionableage can keep up with the increase in life expectancy.An indicator is the life expectancy after pensionableage presented in the second half of Table 1.
Between 1958 and 2010, no country compensatedthe increasing life expectancy by setting up a higherpensionable age. Therefore, life expectancy at pen-sionable age increased in all OECD countries. Theaverage duration of retirement rose from 13.4 years
in 1958 to 18.5 years in 2010 for men and similarlyfrom 17 to 23.3 years for women. Obviously, higherlife expectancy caused people to spend more time atthe receiving end, heaping cost pressure on the pen-sion systems. Future changes in pensionable age, de-scribed above, have to cover future increases in lifeexpectancy and perhaps even compensate for thepast increases in retirement duration.
Based on the OECD (2011) forecast drawn from cur-rent reform plans, men’s retirement duration will in-crease on average by another 1.8 years up to 20.3 yearsin 2050 while women in 2050 will spend 24.6 years onaverage in retirement, indicating an increase of only1.3 years against 2010. Current and future reforms inmany OECD countries will compensate for largerparts of the future increase in life expectancy in con-trast to the pension system changes in the second halfof the 20th century.
In Hungary, Italy, Korea and Turkey the retirementage will be increased by an amount that will even over-compensate higher life expectancy and therefore re-duce the time in retirement for both men and women.2
Australia, Austria, the Czech Republic, the SlovakRepublic and the UK will reduce years of retirementfor women, but not for men. All other countries willstill face higher retirement duration, but generally to asmaller extent than in the past. Therefore, reforms inmany countries appear to be promising, but changingthe pensionable age is not the magic bullet for pensionsystems under increasing life expectancy.
Besides the explicit setup of pensionable age, gov-ernments have developed ways to link pension sys-tems’ parameters directly to life expectancy. Accord-ing to Table 2, seven countries have introduced amandatory defined-contribution plan. Under thisscheme, contributions and investment returns accu-mulated during work life are converted into a regu-lar pension payment (“annuity”). This annuity de-pends on the retirees’ life expectancy at the time ofretirement. Under notional-accounts schemes accu-mulated contributions and notional interest are alsoconverted into a regular benefit payment. Here, theconversion rate is linked directly to life expectancy.
In this manner pension benefits are linked directly tolife expectancy. Under defined-contribution plans,which was most common in the 20th century, bene-
2 These reforms should be viewed, however, in light of the fact thatTurkey, Italy and Greece had the lowest pensionable age and thelongest average retirement duration in 2010.
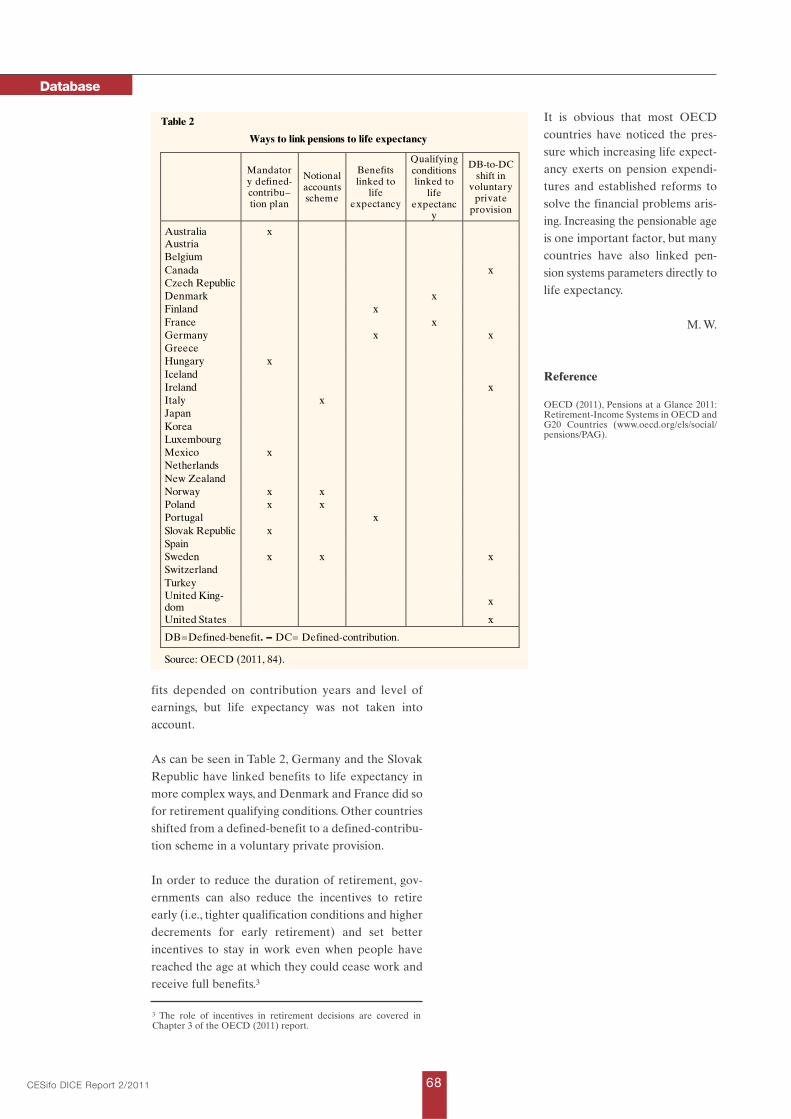
fits depended on contribution years and level ofearnings, but life expectancy was not taken intoaccount.
As can be seen in Table 2, Germany and the SlovakRepublic have linked benefits to life expectancy inmore complex ways, and Denmark and France did sofor retirement qualifying conditions. Other countriesshifted from a defined-benefit to a defined-contribu-tion scheme in a voluntary private provision.
In order to reduce the duration of retirement, gov-ernments can also reduce the incentives to retireearly (i.e., tighter qualification conditions and higherdecrements for early retirement) and set betterincentives to stay in work even when people havereached the age at which they could cease work andreceive full benefits.3
It is obvious that most OECDcountries have noticed the pres-sure which increasing life expect-ancy exerts on pension expendi-tures and established reforms tosolve the financial problems aris-ing. Increasing the pensionable ageis one important factor, but manycountries have also linked pen-sion systems parameters directly tolife expectancy.
M. W.
Reference
OECD (2011), Pensions at a Glance 2011:Retirement-Income Systems in OECD andG20 Countries (www.oecd.org/els/social/pensions/PAG).
CESifo DICE Report 2/2011 68
Database
Table 2
Ways to link pensions to life expectancy
Mandatory defined-contribu–tion plan
Notionalaccountsscheme
Benefitslinked to
life expectancy
Qualifyingconditionslinked to
life expectanc
y
DB-to-DC shift in
voluntaryprivate
provision
Australia xAustria
Belgium
Canada x
Czech Republic
Denmark x
Finland x
France x
Germany x x
Greece
Hungary x
Iceland
Ireland x
Italy x
Japan
Korea
Luxembourg
Mexico x
Netherlands
New Zealand
Norway x x
Poland x x
Portugal x
Slovak Republic x
Spain
Sweden x x x
Switzerland
Turkey
United King-dom
x
United States x
DB=Defined-benefit. – DC= Defined-contribution.
Source: OECD (2011, 84).
3 The role of incentives in retirement decisions are covered inChapter 3 of the OECD (2011) report.

CESifo DICE Report 2/201169
Database
WORK-FAMILY BALANCE IN
AN EUROPEAN COMPARISON
A new study on reconciliation of work and familylife conducted by the Cologne Institute for Econo-mic Research by order of the Federal German Mi-nistry for Family Affairs, Senior Citizens, Womenand Youth and the Robert Bosch Stiftung ranks fam-ily-friendliness as important in most companies inEurope. Furthermore it is observable that a flexibili-sation of working hours and of working organisation(e.g., child care or home care schemes) gives parentsmore time to attend to family commitments. Espe-cially in a period of demographic change associatedwith an observable decrease in the number of avail-able skilled workforce it is important for young par-ents and for those who care for the elderly to havethe possibility to participate as much as possible inworking life.
From the end of October 2009 until December 2009,more than 5,000 executives and personnel managerswere surveyed via computer-based interviews in sixEuropean countries (France, Germany, Italy, Poland,Sweden and the United Kingdom). It was a random-ised sample. For representative indications, the re-sults were projected by a 3x2 matrix. The sample wasdivided into three classes of company size (5–49,50–249, 250 and more employees) and two sectoralgroups (manufacturing companies and service sec-tor). More than 1300 firms were surveyed in Ger-many, while in the other countries the number of sur-veyed companies was about 750 each. This was nec-essary to ensure comparability with the 2006 Com-pany Survey on Reconciliation of Work and FamilyLife in Germany.
The key findings of the study are:
• Family-friendliness is important.• Many companies show a positive attitude towards
reconciliation of work and family life.• Family-friendly companies are highly dedicated
to work-life balance.• Flexible working time arrangements, support for
employees on parental leave and caring for chil-dren and other dependants are used to reconcilework and family life.
• Family-focused services are more the exceptionthan the rule.
• Stimuli for companies to introduce family-friend-ly measures are similar.
• Regulatory basis for human resources policy
measures differs from country to country.
• Family-friendliness in spite of the economic crises.
In more detail, family-friendliness is an important
issue in the reconciliation of work and family life. In
Sweden 86 percent and in the United Kingdom more
than 93 percent of the companies regarded family
friendliness as important or rather important (Table).
In comparison with the other four European coun-
tries, in Sweden and the United Kingdom the impor-
tance of family friendliness is significantly higher.
Regarding other control variables, such as the im-
portance of family friendliness for both employees
and executives, again Sweden and the United King-
dom generate the highest values. For France, Ger-
many, Italy and Poland the significance of family
friendliness is lower.
Table
The importance of family-friendly policies for the respondent companies
Share of companies, in %
For the company
Impor- tant
Ratherimpor-
tant
Ratherunimpor-
tant
Unimpor-tant
France 48.1 35.2 10.7 6.1Germany 58.2 21.5 15.1 5.2Italy 43.5 38.4 14.7 3.4Poland 22.8 59.5 14.0 3.7Sweden 62.1 24.1 9.6 4.3UnitedKingdom 52.5 40.9 5.1 1.6
For employees
Impor- tant
Rather impor-
tant
Ratherunimpor-
tant
Unimpor-tant
France 61.0 32.5 3.9 2.5Germany 59.1 22.0 13.3 5.7Italy 49.7 39.7 9.8 0.8Poland 32.3 53.2 12.2 2.2Sweden 67.0 23.6 6.7 2.7UnitedKingdom 59.4 36.5 3.3 0.8
For executives/experts
Impor- tant
Ratherimpor-
tant
Ratherunimpor-
tant
Unimpor-tant
France 52.8 31.9 10.3 4.9Germany 50.7 17.9 21.4 9.9Italy 42.2 44.4 10.7 2.7Poland 27.8 53.3 16.3 2.6Sweden 63.7 22.6 11.0 2.7UnitedKingdom 54.6 39.6 4.3 1.4
Source: Federal Ministry for Family Affairs, Senior Citi-
zens, Women and Youth (2010, 11).

The survey was conducted during the economiccrises. Hence, it was assumed that companies losttheir willingness to introduce or continue humanresources policies for a better work-life balance.But according to the Figure it was only in Italy thatthe companies (around 40 percent) withdrew orpostponed policies affecting work-life balances. InGermany just 7 percent and in the United Kingdomless than 3 percent of the companies reacted simi-larly. This low proportion of companies indicatesthat the reconcilability of work and family life has ahigh significant weight for companies. The compa-nies were also asked about their expected signifi-cance of work-life balance policies in the next fiveyears. Apart from Poland, in all countries the expec-tation of an increase in the significance of reconcil-ing work and family life is higher than the expecta-tion of a decrease.
A. R.
Reference
Federal Ministry for Family Affairs, Senior Citizens, Women andYouth (2010), Final Report: European Company Survey on Recon-ciliation of Work and Family Life, in collaboration with the RobertBosch Stiftung and the Cologne Institute for Economic Research.
CESifo DICE Report 2/2011 70
Database
2.6
7.0
10.1
12.4
15.1
39.2
0 10 20 30 40 50
25.0
22.9
20.3
18.6
16.4
9.5
71.3
69.5
68.1
72.2
72.7
76.7
7.6
11.7
8.7
10.9
13.8
3.6
0 20 40 60 80 100
United Kingdom
Germany
France
Poland
Sweden
Italy
Increasing Remaining constant Declining
Source: Federal Ministry for Family Affairs, Senior Citizens, Women and Youth (2010), p. 32.
WITHDRAWAL OR POSTPONEMENT OF WORK-LIFE BALANCE AND EXPECTED SIGNIFICANCE OF WORK-LIFE BALANCE POLICIES
IN THE NEXT FIVE YEARS
Share of companies
in %
Figure

CESifo DICE Report 2/201171
Database
FREE MOVEMENT OF
LABOUR IN THE EU
Following enlargement of the EU to 27 members by
the accession of ten countries in 2004 and the accession
of two more countries in 2007, the 15 former member
states (EU-15) agreed on transitional periods that limit
the free movement of workers from these member
states.1 Until 2006, access to the labour markets of the
EU-15 was exclusively dependent on national policies.
After mid-2006, the EU-15 could choose to maintain
national restrictions or allow free movement of work-
ers and after 2009 they were required to obtain autho-
risation to continue applying national measures for two
more years. This was granted only if a country experi-
enced “serious disturbances” in its labour market. Free
movement between all member states was to be guar-
anteed by May 2011 at the latest for the citizens of the
countries that joined in 2004, and by January 2014 for
citizens of Bulgaria and Romania.2
Delegating the decision on transitional periods to the
national level has had important consequences: While
Ireland, the United Kingdom, and Sweden opened uptheir labour markets to migrants from the new eightmember states (NMS-8) in 2004, Germany and Austriaretained restrictions on immigration from the NMS-8countries until 31 April 2011. The other EU-15 coun-tries stopped national measures that restrict migrationfrom the NMS-8 between 2006 and 2009 (Table).
Now that the transition period affecting migrantsfrom the NMS-8 is over, a change in migration dy-namics is expected. The EU eastern enlargement hasalready led to an increase in the migration flowsfrom the NMS-8 to the EU-15 countries. From 2004to 2009, an average of 250,000 citizens from theNMS-8 migrated to EU-15 countries per year. Thesemigration flows abated during the financial crises.While more than 60 percent of the migration streamsfrom the NMS-8 to EU-15 countries went to Ger-many and Austria before the eastern enlargement,this fraction has decreased to 20 percent thereafter.The percentage of migration flows to the UK and
1 Nations that joined the EU in 2004: Czech Republic, Cyprus,Estonia, Hungary, Latvia, Lithuania, Malta, Poland, Slovak Republic,Slovenia). Nations that joined in 2007: Bulgaria, Rumania.2 Malta and Cyprus are excluded from these migration restrictions.
Table
Free movement of labour in the EU-15, 2009–11
New regulations for employees from thecentral and eastern European newmember states since 1 May 2006
Restrictions
Austria Restrictions remain valid. New EU citizens wishing to work in Austria still need awork permit, which the employer must apply for. The La-bour Market Service will confirm freedom of movementonce the worker has been legally employed for one year.
Belgium No limitations on workers for EU-8.
Restrictions on workers from Bulgariaand Romania.
Nationals from Bulgaria and Romania are obliged to hold a work permit up to 31 Dec. 2011. Nationals from these states benefit from an accelerated procedure for obtaining awork permit in a profession with a labour shortage. Underthis simplified procedure, the work permit is granted within5 days of the request being lodged by the competent regional authority.
Denmark No restrictions since 1 May 2009. Work and residence permit is no longer required, and citizens from these countries enjoy the same rights as other EU citizens.
Finland As of 1 May 2006 all restrictions werelifted regarding workers from new mem-ber states.
France No regulations on workers from EU-8countries. For workers from Bulgaria andRomania there are restrictions during the second transitional period from 1 Jan.2009 until 31 Dec. 2011.
For Bulgaria and Romania: French employers can use asimplified procedure for introducing foreign labour for 61occupations from 7 major fields of activity. For these oc-cupations, foreign labour departments will not use the jobsituation in France as an objection.
Germany Restrictions on access to the Germanlabour market will remain in force until 30 April 2011 for those countries whichjoined the EU on 1 May 2004 (EU-8),and until 31 Dec. 2012 for the countrieswhich joined on 1 Jan. 2007 (Bulgaria andRomania).
Employees from EU-8 countries must apply for a workpermit. Only after a labour-market examination, in whichcitizens of the EU-8 are treated preferentially vis-à-visapplications from third-party countries, can a permit begranted.

Ireland, on the other hand, has gone up to more than
60 percent after the EU eastern enlargement (Baas
and Brücker 2010, OECD 2010). This suggests that
the migration flow to Germany and Austria will in-
crease now that these countries have also opened
their labour markets to immigration from the NMS-8.
While Germany and Austria were the only EU-15
countries still restricting immigration from the NMS-
8 at the beginning of this year, several countries still
impose restrictions on the two countries that joined
the EU in 2007 – Bulgaria and Romania (Table).
Hence, one last change in migration dynamics can be
CESifo DICE Report 2/2011 72
Database
Table continued
New regulations for employees from thecentral and eastern European newmember states since 1 May 2006
Restrictions
Greece As of 1 May 2006 all restrictions werelifted for workers from the EU-8 and inJanuary 2009 for workers from Bulgariaand Romania.
Ireland No special limitations on workers fromEU-8 (since 2004).
Restrictions on workers from Bulgariaand Romania.
Bulgarian and Romanian Job Seekers will continue torequire a work permit. However, any of these citizens whowere in Ireland on 1 Jan. 2007 for a period of 12 months ormore and holding a valid work permit for that time will nolonger have any restrictions and will, along with theirspouses, have unrestricted access to the labour market andstate employment services.
Italy There is a transitional arrangement for a period of one yearprior to allowing citizens of Romania and Bulgaria to havefull access to paid employment (except self-employment).The transitional arrangement has opened the followingsectors: agriculture and hotel and tourism, domestic workand care services, construction, engineering, managerial and highly skilled work, and seasonal work.
Since 27 July 2006 no restrictions con-cerning the free movement of workersfrom EU-8 are in force, thus giving fulleffect to the free entry of all nationals from the new member states to theItalian job market.
Restrictions on workers from Bulgariaand Romania.
Any employer who wishes to hire a Romanian or Bulgarian worker for one of the above sectors must comply with theemployment regulations currently in force and notify the jobcentres as well as the competent social security and welfare institutions.
Luxembourg The restrictions on workers from EU-8were abolished.
Limitations on workers from Bulgaria andRomania only.
For Bulgarian and Romanian workers the labour market isgenerally suspended. However, a transitional regime from1 Jan 2007 in some sectors work permits will be readilygranted to Bulgarian and Romanian nationals under a mini-mal and simplified procedure, without, however, abolishingthe need for a work permit. The sectors concerned are agri-culture, viticulture, and the hotel and catering sector. Forthe financial sector, people with specific qualifications for which there is a need that is not met on the labour market,the same flexibility measures will be applied. In other sec-tors, depending on the labour market situation, the proce-dure for granting work permits will be simplified and thedeadlines reduced.
Netherlands Since 1 May 2007: No special limitationson workers from the EU-8 but restric-tions for workers from Bulgaria andRomania.
For workers from these 2 countries a work permit will beissued whenever there are no workers available in the Netherlands or other EU member states and the employerconcerned can offer proper working conditions and accom-modation.
Portugal No restrictions since January 2009.
Spain No restrictions since January 2009.
Sweden No special limitations on workers fromthe new member states (since 2004).
UnitedKingdom
No special limitations on workers fromthe EU-8.
Restrictions on workers from Bulgariaor Romania
At the heart of the new regulations is the restriction of low-skilled workers to existing quota schemes in the agriculturaland food processing sectors. Skilled workers will continue tobe able to work in the UK if they qualify for a work permitor under the Highly Skilled Migrant Programme.
Most countries of the EU-15 have bilateral agreements with the individual new member states that allow specific la-bour migration (seasonal work, contingents for specific industries, etc.) or temporarily limit this migration.
Source: Ifo DICE Database: “Free Movement of Labour in the EU-15, 2009–2011”, data from the European Commis- sion: EURES, The European Job Mobility Portal.

CESifo DICE Report 2/201173
Database
expected once all migration restrictions have beeneliminated.
Even though there will soon be no more restrictionson labour migration in Europe, it is still crucial todesign policies so that the international mobility ofworkers can unlock mutual benefits for all partiesinvolved.
S. F.
References
Baas, T. and H. Brücker (2010), “Wirkungen der Zuwanderungenaus den Neuen Mittel- und Osteuropäischen EU-Staaten auf Ar-beitsmarkt und Gesamtwirtschaft”, Expertise im Auftrag des Ge-sprächskreises Migration und Integration der Friedrich-Ebert-Stif-tung.
European Commission, EURES: The European Job Mobility Por-tal, http://ec.europa.eu/eures/main.jsp?&countryId=&accessing=0&content=1&restrictions=0&step=0&acro=free&lang=en,accessedApril 2011.
OECD (2010), International Migration Outlook, SOPEMI 2010,Paris.

PENSION ACCOUNTING
Pension accounting is a complex task. National pen-sion accounting rules vary and comparing them isdifficult. Glaum (2009) compares standards for ac-counting pensions in the US, the UK and six conti-nental European countries.
While UK and Dutch pension accounting rules aresimilar to the International Accounting Standard
(IAS) 19 and Financial Accounting Standard (FAS)87, French, German, Italian, Spanish and Swiss rulesare clearly different (Table). For example, in Ger-man accounting law, there are no explicit rules forthe valuation of pension obligations, and French andSwiss accounting standards do not generally requirethe recognition of pension liabilities. Furthermore,disclosure rules also vary across countries, with re-quirements generally being much less extensive incontinental Europe than in Anglo-Saxon countries,or in comparison to International Financial Report-
CESifo DICE Report 2/2011 74
Database
Table
National pension accounting rules: overview
2. Recognition in the balance sheet1. Specific standard forpension accounting
2.1.Recognition of
liability mandatory
2.2.Smoothing mecha-
nism for balancesheet
2.3.Presentation inbalance sheet
(gross/net)
France No;recommendation, but no obliga-tion to apply IAS 19 (however:application of SoRIE option notallowed).
Recognition of liability forpension obligations is notmandatory; if companiesrecognise a liability, appli-cation of IAS 19 is recom-mended (without SoRIEoption); in case of volun-tary recognition, IAS 19defines minimum liability.
n.a. (see 2.1) n.a. (see 2.1)
Germany Currently only rudimentary rulesin German Commercial Code(HGB), paragraph 249 and para-graph 253; reform of HGB in pre-paration, planned: market-basedvaluation of pension obligations.
Yes;if internally financed (ex-cept for pre-1985 liabili-ties); optional for fundingdeficits in case of externalfinancing.
No Gross (net incase of funding through separatelegal units).
Italy No;Codice Zivile, paragraph 21.20applies only to severance pay-ments (TFR); no specific rules for defined benefit obligations (whichare uncommon in Italy).
n.a. (see 1.) n.a. (see 1.) n.a. (see 1.)
Netherlands Dutch Accounting Standard
(RJ 271); alternatively, companiesmay opt to apply IAS 19 or FAS87; it is also allowed to adopt IFRScompletely on a voluntary basis;DB pensions in multi-employerfunds may be accounted for asDC plans; new Dutch standard271 to be published in 2009.
Yes Corridor approach(optional; SoRIEoption not allowed
under RJ 271).
Net
Spain Yes;new rules to be applied as ofJanuary 2008; special rules forfinancial institutions.
Yes Until 2007: same asIFRS, immediate recognition in P&L was common prac-tice; since January 2008: only SoRIE-option allowed.
Net
UnitedKingdom
FRS17 “Retirement Benefits”. Yes No Net in case ofplan assets.
Switzerland Yes;FER 16 and 26.
No;only, if pension fund isactuarially underfunded.
Yes;due to actuarialvaluation.
Net
IFRS IAS 19 “Employee Benefits”. Yes Corridor(optional).
Net in case ofplan assets.
UnitedStates
FAS 87/158 “Employers’ Ac-counting for Pensions”.
Yes No Net in case ofplan assets.

CESifo DICE Report 2/201175
Database
Table continued
3. Valuation of liabilities
3.1.Specifiedmethod
3.2.Guidance onassumptions
3.3.
Interest rate
3.4.
Salary rate
3.5.
Benefit rate
3.6.
Mortality rate
France n.a. (see 2.1) n.a. (see 2.1) n.a. (see 2.1) n.a. (see 2.1) n.a. (see 2.1) n.a. (see 2.1)
Germany No;mostly entry age normal cost method (“Teil-wertverfahren”)or projected unitcredit method.
Yes No explicit rule; traditionallyadoption ofinterest ratespecified in tax code 6% p.a..
No projec-tions re-quired.
No projectionsrequired.
No; actuarially determined.
Italy n.a. (see 1.) n.a. (see 1.) n.a. (see 1.) n.a. (see 1.) n.a. (see 1.) n.a. (see 1.)
Netherlands Yes;projected unitcredit method.
Yes Yes;market based.
Yes Yes No;actuarially determined.
Spain No;recommended:projected unitcredit method.
No No;actuarially de-termined.
No;actuarially determined.
No;actuarially determined.
No;actuarially determined.
UnitedKingdom
Yes;projected unitcredit method.
Yes Yes;market based,high qualitycorporate bonds.
Yes Yes No;actuarially determined.
Switzerland No;actuarially de-termined.
No No;actuarially de-termined.
No;actuarially determined.
No;actuarially determined.
No;actuarially determined.
IFRS Yes;projected unitcredit method.
Yes Yes;market-based,high qualitycorporate bonds.
Yes Yes No;actuarially determined.
UnitedStates
Yes;projected unitcredit method.
Yes Yes;market-based,high qualitycorporate bonds.
Yes Yes No;actuarially determined.
5. Pensions costs4. Valuation of assets
5.1. Explicit rules 5.2. Smoothing mechanism
France Same as IAS 19: fair value. n.a. (see 2.1) n.a. (see 2.1)
Germany Cost;fair value or actuarial value incase of external financing.
No Yes;implicit in traditional (tax-based) valuation practices.
Italy n.a. (see 1.) n.a. (see 1.) n.a. (see 1.)
Netherlands Fair value or allocated fair valuefor joint, multi-employer pension funds.
Yes Corridor (optional).
Spain Fair value. Yes (but only SoRIE approach foractuarial gains and losses).
Only for prior service costs.
UnitedKingdom
Fair value. Yes No
Switzerland Fair value. No Yes;implicit in actuarial valuation.
IFRS Fair value. Yes Corridor (optional).
UnitedStates
Fair value. Yes Corridor (optional).
DB = Defined Benefit; – DC = Defined Contribution; – IAS = International Accounting Standard; – IFRS = Inter-national Financial Reporting Standards; – P&L = Profit & Loss; – SoRIE = Statement of Recognized Income andExpense.
Source: Glaum, M. (2009), 300-01.

ing Standards (IFRS). The lack of precise rules forthe recognition and valuation of pension obligationsand pension costs, combined with relatively lenientdisclosure requirements, opens up wide scope formanagerial discretion and earnings management. Asa consequence, it is likely that both the relevanceand the reliability of pension accounting informationwill vary across countries.
Following the European Union’s IFRS Regulationof 19 July 2002, all publicly traded companies in theEuropean Union are required, in most cases since2005, to prepare their consolidated financial state-ments in accordance with IFRS. Hence, the above-discussed national accounting standards have losttheir importance for stock-listed companies. Hence,since IAS 19 is very similar to FAS 87, one couldexpect pension accounting, in particular, to have be-come homogeneous, or at least very similar, for Eu-ropean and US stock-listed companies. However,there are serious reasons to expect that the very dif-ferent institutional environments across Europe willcontinue to bring about country-specific accountingpractices, despite the introduction of a single set ofaccounting standards.
Corporate pension systems differ across countries.This may affect how companies account for pensionobligations, and it may have bearings on the waypension accounting information is processed. Glaum(2009) summarises important features of the occupa-tional pension systems of the US, the UK, and of sixcontinental European countries. Form the viewpointof accounting, characteristics of occupational pen-sion systems differ across countries. There are pro-nounced differences in funding practices. Variationin funding ratios is partly the result of differences inpension fund regulation. Another driving force istaxation. These institutional differences have conse-quences for how pension obligations are accounted.
W. O.
Reference
Glaum, M. (2009), “Pension Accounting and Research: A Review”,Accounting and Business Research 39(3), Special Issue Internatio-nal Accounting Policy Forum, 273–311.
CESifo DICE Report 2/2011 76
Database

CESifo DICE Report 2/201177
News
NEW AT DICE DATABASE
Recent entries to the DICE Database
In May 2011 the DICE Database received about 80new entries, consisting partly of updates of existingentries and partly of new topics. Some topics arementioned below:
• Admission channels for the immigration of for-eign investors
• Anti-trust policy• Burden of government regulation• Competition advocacy in telecommunications• Corporate income tax rates• Fiscal balances• Institutional models of governance on climate
change• Taxes on international trade• Wage replacement in case of sickness• World competitiveness of economies.
FORTHCOMING CONFERENCES
VENICE SUMMER INSTITUTE 201118–23 July 2011, in Venice
• Globalisation, Trade, FDI and the MultinationalFirm
Scientific organisers: Sjoerd Beugelsdijk, StevenBrakman, Hans van Ees and Harry Garretsen
• China and the Global Economy Post Crisis
Scientific organisers: Peter Egger and JohnWhalley
• The Economics of Conflict – Theory and PolicyLessons
Scientific organiser: Karl Wärneryd
• Global Interdependence, Decoupling andRecoupling
Scientific organisers: Yin-Wong Cheung andFrank Westermann
• Lessons from the Economics of Crime: WhatWorks in Reducing Offending?
Scientific organisers: Olivier Marie andPhilip J. Cook
CESifo Area Conference on Economics of Edu-cation2–3 September 2011, in Munich
The keynote lecture will be delivered by MichaelKremer (Harvard University).
Scientific organisers: Eric A. Hanushek andLudger Woessmann
CESifo Area Conference on Energy and ClimateEconomics14–15 October 2011, in Munich
The keynote speaker will be Ujjayant Chakravorty,University of Alberta.
Scientific organiser: Michael Hoel
CESifo Area Conference on Behavioural Economics28–29 October 2011, in Munich
The keynote lecture will be delivered by David Laib-son (Harvard University) and Sendhil Mullainathan(Harvard University).
Scientific organisers: Klaus Schmidt and Ernst Fehr
NEW BOOKS ON INSTITUTIONS
Law and EconomicsRobert Cooter and Thomas UlenPrentice Hall, Boston 2012
Research Handbook on the Economics of FamilyLawLloyd R. Cohen and Joshua D. Wright (eds.)Edward Elgar Publishing 2011


DICEDatabase for Institutional Comparisons in Europe
www.cesifo-group.de/DICE
The database DICE was created to stimulate the political and academicdiscussion on institutional and economic policy reforms. For this purpo-se, DICE provides country-comparative information on institutions, re-gulations and the conduct of economic policy.
To date, the following main topics are covered: Business and FinancialMarkets, Education and Innovation, Energy and Natural Environment,Infrastructure, Labour Market and Migration, Public Sector, Social Po-licy, Values. Information about Basic Country Characteristics is pro-vided for the convenience of the user.
The information of the database comes mainly in the form of tables – with countries as the first column – but DICE contains also several graphs and short reports. In most tables, all 27 EU and some importantnon-EU countries are covered.
DICE consists primarily of information which is – in principle – alsoavailable elsewhere but often not easily attainable. We provide a veryconvenient access for the user, the presentation is systematic and themain focus is truly on institutions, regulations and economic policy con-duct. Some tables are based on empirical institutional research by Ifoand CESifo colleagues as well as the DICE staff.
DICE is a free access database.
Critical remarks and recommendations are always welcome. Please address them to [email protected] [email protected]@ifo.de