CESifo Working Paper no. 7410
116
7410 2018 December 2018 The Origins of Common Iden- tity: Evidence from Alsace- Lorraine Sirus H. Dehdari, Kai Gehring
-
Upload
khangminh22 -
Category
Documents
-
view
1 -
download
0
Transcript of CESifo Working Paper no. 7410

7410 2018 December 2018
The Origins of Common Iden-tity: Evidence from Alsace-Lorraine Sirus H. Dehdari, Kai Gehring

Impressum:
CESifo Working Papers ISSN 2364‐1428 (electronic version) Publisher and distributor: Munich Society for the Promotion of Economic Research ‐ CESifo GmbH The international platform of Ludwigs‐Maximilians University’s Center for Economic Studies and the ifo Institute Poschingerstr. 5, 81679 Munich, Germany Telephone +49 (0)89 2180‐2740, Telefax +49 (0)89 2180‐17845, email [email protected] Editors: Clemens Fuest, Oliver Falck, Jasmin Gröschl www.cesifo‐group.org/wp An electronic version of the paper may be downloaded ∙ from the SSRN website: www.SSRN.com ∙ from the RePEc website: www.RePEc.org ∙ from the CESifo website: www.CESifo‐group.org/wp

CESifo Working Paper No. 7410 Category 13: Behavioural Economics
The Origins of Common Identity: Evidence from Alsace-Lorraine
Abstract The quasi-exogenous division of the French regions Alsace and Lorraine after the Franco-Prussian War allows us to provide evidence about group identity formation within historically homogeneous regions. Using several measures of stated and revealed preferences spanning over half a century, we show that being exposed to occupation and repression for many decades caused a persistently stronger regional identity. The geographical RDD results are robust across all specifications. We document two mechanisms using data on regional newspapers and regionalist parties. The differences are strongest for the first two age cohorts after WWII and associated with preferences for more regional decision-making.
JEL-Codes: D910, H700, N400, Z190.
Keywords: group identity, regional identity, identity formation, persistence of preferences, homogenization policies, assimilation, Alsace-Lorraine.
Sirus H. Dehdari Uppsala University Uppsala / Sweden
Kai Gehring University of Zurich Zurich / Switzerland
December 11, 2018 We thank Alberto Alesina, Olivia Bertelli, Carles Boix, Konrad Burchardi, Davide Cantoni, Eric Chaney, Melissa Dell, Axel Dreher, Vasilika Fouka, Boris Gershman, Nathaniel Lane, Horacio Larreguy, Raphael Frank, Andreas Madestam, Shom Mazumder, Pierre-Guillaume Méon, Stelios Michalopolous, Nathan Nunn, Per Petterson-Lidbom, Torsten Persson, James Robinson, David Strömberg, Jakob Svensson, Hans-Joachim Voth, Fabian Wahl, and conference participants at the NBER Summer Institute 2017, the CesIFO workshop in Venice 2017, the History Tea (Harvard University), Solvay Business School Brussels 2017, the BBQ 2017 conference at Lago di Garda, the EEA/ESEM 2016 in Geneva, the Silvaplana Workshop in Political Economy 2016, the SSES in Lugano 2016, AEL in Heidelberg 2016, ASWEDE in Gothenburg 2016, the Politics and History Network at Princeton University 2016, the Royal Economic Society Junior Symposium in Brighton 2016, Stockholm University and the University of Freiburg for feedback and great suggestions. The same holds for seminar comments at Barcelona, ETH Zurich, Hannover University, Harvard University, Heidelberg University, and Mannheim University. Excellent research assistance was provided by Janine Albiez, Philipp Kerler, Max Huppertz, Eva Marti, Norah Schmidlin, Alfred Sutter and Lukas Willi. We thank Valerie Baldinger and Michele McArdle for proof-reading. Kai Gehring acknowledges funding from the Swiss National Science Foundation Ambizione project PZ00P1174049. This is a new version of CESifo Working Paper Series No. 6556.

1 Introduction
The formation of common group identities at the regional, ethnic or country level is a important,
yet poorly understood aspect of human behavior. Even though recent evidence suggests that hetero-
geneity within groups is on average greater than heterogeneity between groups (Desmet et al., 2017),
we still observe strong existing group identities. These identities also have important e�ects both
economically and politically (see summary in Kranton, 2016). Among others, arbitrarily determined
national borders are associated with strong ethnic identities and weak common national identities
in Africa, often related to con�ict, violent struggles for autonomy, and inferior development (e.g.,
Besley and Reynal-Querol, 2014; Michalopoulos and Papaioannou, 2014, 2016; Rohner et al., 2013).
In Europe, the strength of regional identities relative to national identities fuels separatism in re-
gions like Catalonia, Flanders, and Scotland. At the same time, there exist culturally heterogeneous
countries like Switzerland and the US, which exhibit a strong sense of common identity.
One reason for the di�culty of disentangling the factors in�uencing the identity formation process
is the inadequacy of laboratory experiments to emulate identity formation. Experiments can only
study groups of limited size for a short time period, and have to rely on arti�cial/restricted manipu-
lations. For instance, it is hard to simulate violent repression, even though occupations and changes
in nation status occurred frequently in history. Almost all current nation-states are composed of
initially heterogeneous regions, which were more or less forcefully integrated and assimilated during
the process of state formation. Observational studies, in contrast, can exploit these historical events,
but struggle to distinguish their e�ect from other aspects that are speci�c to particular regions.
Our paper exploits a historical experiment that provides us with a unique opportunity to study
the causal e�ect of occupation and intrusive assimilation policies. The French regions of Alsace
and Lorraine were, as we explain in more detail below, split in an exogenous way into one part
that always remained French and a (treated) part. The treated part was �rst in 1870 occupied by
Germany and then became French again after WWI. The treated part was subject to more intrusive
assimilation attempts by �rst the German and then the French central government. It took until the
1950s for tensions to calm down, which marks the end of our treatment period. This setting allows us
to compare regional identity in a treated and control area that: (i.) belong to the same historically
homogeneous regions, (ii.) were split in an exogenous way, (iii.) had one area clearly exposed to more
repression and intrusive homogenization policies, (iv.) belong to the same institutional environment
today, and (v.) allow us to gather outcome variables at a very �ne-grained local geographical level.
Figure 1 shows the treated and untreated area of the Alsace and Lorraine regions. We �rst verify
that there are no pre-treatment di�erences in regional and national identity, based on the Cahiers de
doléances from 1789. Our main results using a geographical Regression Discontinuity Design (RDD)
document a stronger regional identity in the treated area after that period, using municipal-level
data from a referendum about higher regional autonomy in 1969 as a proxy for regional identity.
We then show that this e�ect persists by using two related referenda in 1992 and 2005. We augment
these measures of revealed preferences with survey evidence that people in the treated area state a
stronger regional identity, while national identity is similarly strong in both areas.
1

Figure 1: Geographical location of the treated and untreated area
"
"
"
LUXEMBOURG
FRANCE
BELGIUM
SWITZERLAND
GERMANY
Brussels
Metz
Strasbourg
Notes: The map shows the division of Alsace and Lorraine after 1871. The treated area is shaded in light grey, and theuntreated control area in dark grey. Both areas belong to France today. Current national borders are in bold.
One crucial advantage of our setting is the exogenous drawing of the border in 1870/71 due to
disagreements within the German leadership, and the fact that the region returned to France after
WWI. This enables us to compare people in the treated area with those in the control area after
the treatment period (1870-1950s) ended, all of whom belong to the same institutional environment
today. Thus we can use a wide range of variables as proxies for regional identity and as covariates.
One inherent feature of this natural experiment is that the treated part experienced two changes in
nation status: French to German, and German back to French. This means the treated area was
exposed to more intrusive homogenization policies as part of the forceful integration into both the
German, and then later the French nation-state. This could reduce the external validity if the initial
occupier, Germany would have been successful in installing a strong German identity. In such a
case, a clash between two competing national identities could explain the observed di�erences in
regional identity, instead of, or in addition to, the higher exposure to forceful assimilation.
We discuss and provide evidence, however, that Germany never succeeded in installing a strong
German identity. First, we do not �nd signi�cant di�erences in French national identity in our
survey data, as well as in a robustness test that uses support for the French national soccer team
during the World Cup 2014 on Twitter. Second, we are able to replicate our results focusing only
on French-speaking areas, where it was least likely that any German homogenization was successful.
Third, historical qualitative evidence documents the foundation of regional political organizations
and newspapers, as well as strong support for regionalist parties already during the treatment period.
No comparable development occurred in the part that always remained French. Detailed historical
evidence also speci�cally explains stronger regional identity in the treated area a plausible reaction to
the intrusive homogenization policies enforced by the German and the French government between
1870 and the 1950s (Carrol and Zanoun, 2011; Höpel, 2012; Rothenberger, 1975).
Besides these concerns about the interpretation of the e�ect, there are other potential threats to
identi�cation. As the treatment border coincides with the current département border, di�erences
between départements, such as a better policy in the treated area, could also cause a stronger regional
2

identity. We consider a wide range of post-treatment socio-economic factors and public goods to
show that there are no problematic discontinuities at the border. Moreover, the exogeneity of the
border is less credible in Alsace, where it largely coincides with the linguistic dialect border. All our
results hold when excluding Alsace and German-dialect speaking areas from the analysis. We also
run three important placebo tests. In the �rst, we show that there are no signi�cant discontinuities
at the older historical border of the two pre-1870 départements dividing Lorraine. Moreover, two
other tests verify that distance to Paris or the closest external border does not a�ect the results. The
second placebo test shows that there are no discontinuities at the border separating the untreated
area from the rest of France. The third compares all French border départements with their adjacent
neighbors. There are on average only much smaller and mostly insigni�cant discontinuities in the
share of yes votes for the 1992 and 2005 referenda, and no regional or national identity di�erences
in the survey results.
We then provide a simple formal model of identity transmission to explain how a temporary
historical shock can lead to persistent di�erences in regional, but not necessarily national, identity.
It models national and regional identity formation as being in�uenced by inputs from the central
state as well as from regional agents. To align with the existing literature (e.g. Bisin et al., 2011;
Doepke and Zilibotti, 2017), we use the example of public schooling as an activity of the central
state versus private input by the parents and other regional actors. Regional agents can invest
in the regional identity of their children directly or by forming regional organizations like parties,
associations and newspapers. We can provide evidence on these mechanisms. Still, note that for a
concept like identity, any variable that we label a mechanism or input in the process can also itself
be considered as an outcome signaling regional identity.
Regarding the formation of regionalist organizations, the historical evidence is detailed and
clear. Many such organizations were established in the treated area already during the treatment
period (Anderson, 1972; Carrol and Zanoun, 2011), while no such development is reported from
the control area. Despite occasional attempts to shut particular organizations and newspapers
down, regionalist parties were politically successful during the treatment period. Even though being
accused of conspiring with Nazi Germany in WWII (partly unfounded) was a huge blow in particular
in Lorraine, we can show that regionalist parties remain signi�cantly stronger in the treated area
today. This holds particularly in formerly Alemanic-speaking areas. The second mechanism we
can provide evidence for are di�erences in subscription rates to a regional newspaper. Regional
newspapers are an interesting mechanism because every consumer can choose between regional and
national newspapers. A regional newspaper is a valuable source of information about regional
culture for the subscribers and their children, and also contains information about regional events
and associations. We �nd that subscription rates are also signi�cantly higher in the treated area
within Lorraine.
Furthermore, distinguishing the prior survey results by age cohort shows that the di�erences
in regional identity are strongest for the two age cohorts after the treatment period ended. The
di�erences remain stronger when incorporating Alsace in the analysis, which could be related to the
3

stronger presence of regionalist parties or linguistic di�erences. Finally, we show that the di�erences
in regional identity have important policy implications. People in the treated area show a signi�-
cantly stronger preference for regional decision-making in many dimensions including schooling.
To set these results in a broader context, it is useful to consider alternative ways to verify the
e�ect of repressing a particular group on their identity in observational studies. One solution is to
study speci�c groups of immigrants living in the same host country, but being exposed to repressive
policies in certain parts of the country and not in others (the approach in Fouka, 2018). This has
the advantage that everyone can be observed in largely the same institutional environment, and that
comparable outcome variables are available. One limitation is that migrants are a selected share
of the initial population. Observing the behavior of a minority immigrant group in a foreign host
country does also not necessarily have to correspond to the reaction of people whose home regions
are integrated in larger nation-states. Our evidence is thus complementary to Fouka (2018).
Historically and contemporaneously, there are many examples of regions that are a part of
current nation-states and experienced, or still experience, tensions with the central state. In Europe,
examples range from Catalonia in Spain, to Corse in France, and Scotland in the UK. More violent
examples of homogenization policies and repressive policies today are Chechnya and Crimea with
their mixed populations in Russia, as well as Tibet and the Uighurs in China.1 All those regions
are or were at some point exposed to a "treatment" composed of more or less intrusive attempts
to impose a common national identity. Empirically, however, there are no clear corresponding
counterfactuals for a meaningful comparison.
There are also a few selected cases where initially homogeneous regions were split between di�er-
ent nation-states. The Kurdish region was split between Iran, Iraq and Turkey; the Austrian region
Tyrol was split into Austrian Tyrol and South Tyrol in Italy; and the Basque region was split be-
tween France and Spain. For the two latter cases, we know that the parts which experienced arguably
more tensions with the central state (in Italy and Spain) also exhibit a stronger regional identity and
stronger regionalist parties. Nonetheless, it is hard to attribute these di�erences causally to forceful
integration and homogenization policies, as the respective parts can only be observed in di�erent
nation-states today. The fact that our causal e�ect aligns with stronger regionalism in cases where
we can only study correlations, and with the evidence on immigrants in Fouka (2018), is reassuring.
Hence, we are convinced that our �nding is not speci�c to our case, or that the repeated change in
nation status does not a�ect the external validity of our results in a problematic way.
Our research adds and relates to di�erent strands of literature. First, it adds to the literature on
identity economics (e.g, Akerlof and Kranton, 2000; Fouka, Mazumder, and Tabellini, 2017; Lowes,
Nunn, Robinson, and Weigel, 2017) and on the persistence and transmission of culture, identities
and values (e.g, Bisin and Verdier, 2010; Gennaioli and Rainer, 2007; Giuliano and Nunn, 2016;
Voigtländer and Voth, 2012 and Tabellini, 2008). Most existing models consider the case of two
groups, a minority and majority group, and the choice whether to transmit certain values to the
1 The Polish regions of Silesia and Bohemia, as well as Kaliningrad and Danzig originally featured a strong in�uenceof German culture, which the central government tried to eliminate after WW2. Scania in Sweden was once Danish,and still has a distinct regional identity. Selected Sources can be found in Online Appendix, Section M.
4

next generation via parental investment. Bisin et al. (2011) explain how oppositional identities
can persist, and Fouka (2018) models how both vertical socialization (parental investment) and
horizontal socialization (schooling) in�uence the strength and transmission of a group identity. Our
results model also re�ects input from these two dimensions and provides evidence on the mechanisms.
There are also related strands of literature ranging from political science to sociology and so-
cial psychology. It is widely accepted that a common identity needs not to be based on objectively
aligned preferences (Turner, 1982). Tajfel et al. (1971, p.16) argue that �awareness of a common cat-
egory membership� is a necessary and su�cient condition for individuals to feel and act as a group.
It seems plausible that the intrusive assimilation policies strengthened the awareness of Alsatians
and Lorrainians of their cultural distinctiveness and led to an �alienation� of the a�ected citizens
(Goodfellow, 1993, p.454). Leed (1981) argues that such a common experience strengthens the per-
ceived importance of common group experiences and traits. The rejection-identi�cation hypothesis
(Branscombe et al., 1999) argues that the perceived common identity between an individual and a
group can be a�ected not only by changing actual norms or preferences, but also by changing the
importance assigned to di�erent attributes. For instance, Depetris-Chauvin et al. (2018) show that
the success of a common national sports team can increase national identity in Africa in the short
term, arguably without changing actual intergroup di�erences.
We also relate to an emerging literature on policies that a�ect identities (e.g. Alesina and Reich,
2018).2 Dell and Querubin (2017) document that bombing a region in Vietnam increased hostility
towards the central government. Scholars also partly explain the below-average school performance
of African Americans in the US with the perception of investments in education as acting �white�
and opposed to black group identity (Fryer Jr. and Torelli, 2010), while for Asian Americans no such
e�ects are observed. Our paper compares areas where people formerly possessed the same identity
within the historical regions of Alsace and Lorraine by exploiting the exogenous border location.
One important mechanism through which the state can in�uence identity formation is schooling
(e.g., Bandiera et al., 2017; Lott, 1999; Ortega and Tangerås, 2008). Carvalho and Koyama (2016)
model how an education system that marginalizes a certain identity can cause cultural resistance
on part of the marginalized group. Our model explains how this resistance can lead to persistent
di�erences. The long run persistence of such an e�ect is not unusual, compared to other papers that
document persistence over periods stretching more than a century (Becker et al., 2015; Guiso et al.,
2016). Compared to many other papers, we can document the treatment e�ect in the mid range, as
well as in the long run about half a century later.
Our paper is structured as follows. Section 2 explains the historical background of Alsace and
Lorraine, the exogeneity of the border, and describes our theoretical framework. Section 3 dis-
cusses the data and identi�cation strategy, whilst Section 4 presents the main results. Section 5
discusses mechanisms, persistence and policy implications, and Section 6 evaluates potential threats
to identi�cation. Section 7 concludes.
2 As well as to the literature about the size of nations and secessionism. Secessionism and separatist con�ict can bedriven by economic factors (Gehring and Schneider, 2016) and cultural di�erences (modeled as preference hetero-geneity in Alesina and Spolaore, 1997).
5

2 Historical background and theoretical framework
2.1 History of Alsace and Lorraine: Division, borders and homogenization poli-
cies
To put our natural experiment into perspective, it is helpful to brie�y discuss some important
aspects of the history in the Alsace and Lorraine regions. Both regions have been autonomous
political entities as far back as the 7th century. Under Charles the Bald, all of modern Lorraine
was �rst united as a part of the Duchy of Lotharingia. Over the centuries, both regions developed
strong regional identities with speci�c traditions and norms. After the Thirty Years' War (1618-
1648), the Treaty of Westphalia ceded the Lorrainian cities of Metz, Verdun and Toul and all of
Alsace to France. The rest of Lorraine e�ectively became French in 1767. Thus, at the time of the
Franco-Prussian War in 1870/71, Alsace and Lorraine had been French for more than a century and
were exposed to the same degree to nation building policies of Napoleon and other French leaders.
The peace treaty ending the Franco-Prussian War �July 19, 1870 to May 10, 1871 � then stip-
ulated that large parts of Alsace and the eastern part of Lorraine were ceded to the newly created
German state. The resulting border does not follow (i.) the existing départment borders (Figure
2b), (ii.) any older historical border (Figures A4 - A7)3, (iii.) the historical linguistic border be-
tween French and German dialect speakers (Figure 2c). Of course, we want to better understand the
reasons for this surprising decision. Luckily, historians cover the war period and negotiation process
in detail.
There were three important groups in the negotiation. On the German side a faction led by
Chancellor Bismarck and a faction composed of the charismatic military general von Moltke and the
aged emperor Wilhelm I. The French side was represented by the leader of the anti-war conservative
party, Adolphe Thiers. Obviously, the aim of the French side was to avoid any loss of territory.
On the German side, the cautious statesman Chancellor Bismarck wanted to restrain territorial
expansion to the Alemannic-dialect speaking parts of Alsace and Lorraine (Lipgens, 1964), in order
to ease integration and avoid humiliating the French. In contrast, the historical literature indicates
that the military faction led by von Moltke had always planned to conquer as much territory as
possible (Förster, 1990), and keep it to weaken the arch-enemy in subsequent con�icts.
The negotiation process went back and forth and led to a �nal border demarcation that was
exogenous to socio-economic considerations, in particular within Lorraine (Förster, 1990; Lipgens,
1964; Messerschmidt, 1975). The historical accounts document that pride, rather than precise strate-
gic considerations, dominated the negotiation.4 Bismarck was willing to �save Metz for France�, and
considered retaining French parts of Lorraine altogether as a �folly of the �rst order� (Wawro, 2005
p. 206). Von Moltke, however, considered having conquered Metz as one of the military's greatest
achievements, and convinced Wilhelm I that a return would be a �national humiliation�. Another
illustrative example is that Thiers was able to move the border a little further towards Germany in
3 All tables and �gures denoted with an A are shown in the Online Appendix.4 There is one important exception where explicit strategic considerations mattered, regarding the fortresses of Belfort.This a�ects a small area in the far South, but we anyway exclude it from our estimations.
6
exchange for o�ering the German military to conduct a victory parade through the Champs Elysees
in Paris, which they proudly accepted.
Figure 2: Historical maps: before, during and after German occupation
(a) Alsace and Lorraine: Fully inte-grated into France before division (1870)
(b) Alsace and Lorraine during Germanoccupation (1871-1918)
(c) Alsace and Lorraine: Treatment bor-der vs. French vs. Alemanic languageborder.
(d) Alsace and Lorraine after return toFrance 1918 & after treatment period(1950s - today)
Notes: Moselle is the treated part in Lorraine, Meuse and Meurte-et-Moselle the untreated parts. Bas-Rhin and Haut-Rhincompose Alsace, Vosges serves as their counterfactual. The language border in Figure (c) marks the historical linguistic border.
The �nal result was a compromise in which, at least partly, �Bismarck, [...], quite uncharacter-
istically wilted under the pressure� (Wawro, 2005 p.305). The border was decided in the central
negotiation process and, as Figure 2 shows, drawn without considering speci�c local circumstances.
To augment this historical evidence, we will show that there are no discontinuities in geographical
factors at the border, no indications that pre-treatment regional identity was stronger on one side
than the other, and no problematic di�erences in post-treatment variables.
7

The annexed area was incorporated into the German Empire as the Reichsland Elsass-Lothringen.
In Alsace, the départements already in place during French rule were converted into the German
districts of Oberelsass and Unterelsass, corresponding to the former (and current) départements
Haut-Rhin and Bas-Rhin, respectively. In Lorraine, out of parts from the former départements
Moselle and Meurthe, the district Lothringen was created, corresponding to today's département
Moselle. France regained control of the lost provinces after WWI and kept this administrative
delineation until today (see Figure 2d).5
Hence, the "treatment" we capture is the exposure to repressive homogenization policies and
the suppression of group identity associated with occupation and integration into a nation-state.
This does not allow us to trace the treatment e�ects back to any particular policy, or distinguish
exactly what share was caused by French and German policies. Nonetheless, forceful integration
into a nation-state is usually not only con�ned to a single policy, but brings with it a broad set of
assimilation policies. What matters is that we are capturing a set of policies that is predominately
intrusive, as opposed to more peaceful integration policies like building better transport connections
and enhancing trade. Unless regions voluntarily founded a nation like Germany in 1870 or the US
in 1776, such policies were a common feature of many integration processes.
Historians emphasize the homogenization policies by both Germany and France as the crucial
aspect in which the treated area di�ered between 1870 and the 1950s (Goodfellow, 1993). Table
1 presents examples of the homogenization policies, which are divided into �ve categories for the
sake of clarity: Language policies, aiming to oust local languages and foster the use of the national
language; Media policies, restricting the freedom of press; Social, political, military freedom, and
equality policies, aiming to restrict political rights, participation, socio-regional gatherings, and the
choice to serve in the military; Separation and segregation policies, aiming to separate or segregate
locals according to origin or nationality; and Regional institutions and administrative personnel,
aiming at replacing regional institutions and administration. Table A8 shows a comprehensive list
of both German and French policies until the early 1950s.
Examples of political restrictions under German rule include that Alsace-Lorraine initially had
no representatives in the Bundesrat or the Reichstag (Vajta, 2013). Due to doubts about the loyalty
of the new citizens, the treated area never became an integrated part of Germany; instead the are
remained an imperial territory under the direct authority of Kaiser Wilhelm I (Carrol and Zanoun,
2011). As part of the �Kulturkampf� (culture war), government regulations restricted particular
types of education (Silverman, 1966). Restrictions on the press were not lifted until 1898. The
government also kept the French dictatorship paragraph of 1849 in force, which allowed house
searches, the expulsion of agitators, and the prohibition of political organizations (Carrol, 2010).
When Strasbourg University was reopened as �Kaiser-Wilhelm-Universität�, its aim was to replace
regional traditions and to homogenize the annexed region (Höpel, 2012).
France regained control of the "lost provinces" in Alsace and Lorraine after the Treaty of Ver-
sailles (1919). The homogenization policies aimed at realigning the preferences and values of the lost
5 A short exemption was WWII, when both areas, together with other parts of France, were occupied by Germany.
8

Table 1: Overview of policy categories and examples (see details in Table A8)
Policy category Example
Language policies 1920: French becomes the only language taught in school (Grasser,1998).
Media 1927/ 28: Banning of three autonomist journals, the "Volksstimme",the "Zukunft" and the "Wahrheit" (Goodfellow, 1993).
Social, political, military freedom,equality
1927/28: Colmar trials: 15 prominent autonomists are arrested andtried for participation in a plot to separate Alsace from France(Goodfellow, 1993).
Separation and segregation 1918: Locals are classi�ed according to an identity-card system.Lower classi�cation leads to, e.g. travel bans (Harvey, 1999).
Regional institutions andadministrative personnel
1924: Ministerial Declaration by Premier Edouard Herriot imposesa centralized administration, French laws and intuitions (Carrol andZanoun, 2011).
citizens by France are described as even more repressive than the German ones (Anderson, 1972;
Harvey, 1999). For instance, German was removed as an o�cial language, though it was the mother
tongue of a majority of the population. Furthermore, it was prohibited to teach in the Germanic
dialect; teaching German as a second language also remained banned in schools until the early 1950s.
The families of the about 200,000 Germans who had settled in the region after 1871 were deported
in order to �remove any trace of German in�uence� (Carrol and Zanoun, 2011, p.469).
Moreover, a special commission, called Commissions de Triage, was formed to ascertain the
�Frenchness� of the population in the re-annexed area (Carrol and Zanoun, 2011). Municipal names,
street names and family names were almost all changed to French. Between 1926 and 1930, several
newspapers promoting the regional cause were forbidden, and members of regionalist parties were
put into jail. France consequently replaced bureaucrats and local teachers with external bureaucrats
who were not familiar with the local circumstances and traditions. While historians suggest that
these policies contributed to the formation of a stronger regional identity (Harvey, 1999), the next
section will provide a simple model and de�nition to put these events into perspective.
2.2 Theoretical framework
This section introduces our de�nition of group identity and describes a simple model of cultural trans-
mission with multiple identities and the model's predictions (Online Appendix Section A presents
the formal model). Most existing models describe a setting where people have to choose between
di�erent, potentially oppositional, identities, but cannot hold more than one identity. Our setting
requires a model where each person possesses multiple identities, such as being a citizen of her mu-
nicipality, region or country. An important feature of these multiple identities is that they are not
necessarily substitutes for each other, or at least not perfect substitutes.
Our approach relates to the literature on the size of nations, which models common identity or the
9

lack of it as preference heterogeneity, as well as to the literature on identity formation (Akerlof and
Kranton, 2000) and oppositional identities (Bisin et al., 2011). We want to emphasize a de�nition
of a common identity that builds on Shayo (2009), and relies on the perceived heterogeneity or
distance to other members of a group. Hence, the common identity of an individual i and a group
j ∈ {R,N} = J , with R and N corresponding to Region and Nation, depends on the perceived
distance to the average group member:
hi,j = 1−
(∑k∈K
ωk(pik − p
jk)
2
)1/2
,
where pik represents the preferences (or traditions, values and norms) of individual i regarding an
attribute indexed k, pjk represents the preferences of the average member of the region or the nation,
and K is the set of all attributes. An important part of this heterogeneity function are the ωk, which
can be understood as attention weights. Higher weights indicate that the tradition, value or norm
k has a larger in�uence on the strength of common identity.
These weights are an important distinction as compared to standard models. Desmet et al. (2017)
use the World Value Surveys to show that within-group variation in values and preferences is larger
than between-group variation. Accordingly, the fact that strong group identities (e.g., regional or
ethnic) nevertheless exist is only feasible when recognizing that it is the perception of heterogeneity
that matters. The intuition of this approach is easy to understand. People from di�erent regions
di�er in their shared history, in the spoken dialect, local cuisine or music. Still, the degree to which
this a�ects common national identity depends on how much people emphasize the traits that di�er
relative to the traits they share with people from other regions.
Our model illustrate how a temporary historical shock can lead to persistent di�erences in re-
gional identity, but not necessarily in national identity. Every individual is a member of two groups:
region and nation. Regional agents �parents and regional citizens �as well as the central govern-
ment can in�uence the strength of regional and national identity through investments. We assume
the preferences pk to be �xed, thus what the investments can achieve is a subsequent change in
the weights ωk. The nation-state chooses exogenously how much to invest in regional and national
identity, for instance through public schooling (similar to Bisin et al., 2011). Regional agents re-
spond to the choice of the central state, and select the best combination of regional and national
identity investments. An investment in regional identity increases the weight put on an attribute
that individuals from the region share, e.g. a tradition, value, or common history.
Regional agents combine Beckerian altruism about the future economic well-being of children
with a paternalistic value assigned to their own regional identity (cf. Doepke and Zilibotti, 2017;
Bénabou and Tirole, 2011). A strong common regional identity can help individuals to feel socially
compatible with fellow group members. The cost associated with a lack of regional identity are not
only psychological, in that a lack of social compatibility can also hurt business and employment
opportunities. Of course, the same holds for national identity. If someone does not know how to
comply with national traditions, it is more di�cult to �nd a job in the centrally controlled public
10

Figure 3: Timeline of events treated vs. control areasTable 1: Timeline - Treated vs. control areas
1919
Identity?
Common region
Common policy
Common identity
Common policy
Common region German rule
French rule
194519401919
State policies repressing regional identity
1871 1953
Bordeaux
Trials
Franco -
Prussian
War WWI WWII
Stage 1 Stage 2 Stage 3
1
administration and to trade with other regions in the same country.
We make two key assumptions. First that regional actors invest in technologies to transmit
regional culture, and second that these investments have a �xed cost component, which has to be
paid only once. In other words, one generation can set up an organization or learn how to privately
teach a regional tradition, and the next generation inherits this ability.6 It is well documented for
Alsace-Lorraine that regional actors set up organizations like regionalist parties and newspapers
(Goodfellow, 1993). Moreover, immigrants in foreign countries engage in e�orts to teach their
children the culture of their home country. It is plausible that setting up an organization has a �xed
cost component, and that a regional tradition that was actively practiced during one's childhood
is easier to teach. For instance, once a regionalist party has been founded, future generations can
bene�t from the existing organizational and physical structure of the party.
The game then unfolds in three stages, resembling the historical events as illustrated in Figure
3. In Stage 1 (until 1870/71), both areas are exposed to the same public schooling policy. Because
they belong to homogeneous regions, there is no reason to expect di�erences in regional agents'
decision on how much to invest in infrastructure that facilitates the transmission of regional or
national traditions and norms to future generations. In Stage 2 (1871 � ∼1953), people in the
treated area are exposed to intrusive policies, exempli�ed by a public schooling policy that represses
regional culture or at least teaches it less than in the counterfactual untreated area. If their utility
from regional identity is high enough, regional agents invest a �xed cost, for instance in establishing
organizations or in creating technologies to transmit regional identity to future generations. If
schools no longer teach children a regional tradition like a song or dance, parents have to choose
whether to invest in the ability to teach their children themselves. Alternatively, regional agents
can cooperate to set up a regional party, association, or newspaper, which fosters regional culture.
6 For simplicity, these costs are modeled as a one-time �xed cost, but the model could be extended to include variablecosts. This could be the time spent on teaching children a regional tradition or attending regionalist party event.
11

Finally, in Stage 3 (after ∼1953), the temporary shock is over and public schooling returns to
teaching regional and national culture at similar levels in both areas. Nonetheless, the optimal level
of investing in regional identity transmission remains higher in the treated area if regional agents
choose to invest the �xed costs in Stage 2. As long as regional agents have no incentive to invest
in the ability to teach national traditions, national identity should eventually converge back to the
same level in the treated and non-treated area.
The model thus requires that, at some point, policies converge after the treatment period has
ended with regard to the teaching of regional and national traditions. In fact, public schooling
policy was slowly adapted after WWII and once again permitted the teaching of regional culture
and dialect. The Bordeaux Trial in 1953, with the convictions of soldiers from Alsace-Lorraine who
fought for the German side, can be thought of as a last event potentially reactivating memories of
suppressive policies. Today, the treated area uses the same school curricula as the rest of France,
and is fully accepted as a part of the country.7
3 Data, measures, and identi�cation strategy
3.1 Data
France is divided into 22 regions, which consist of 96 départments. These are further divided into
323 arrondisements and 1,995 cantons, but those two sub-units are of lesser importance and do
not possess the status of a legal entity. The lowest unit are the 3,320 municipalities in Alsace
and Lorraine. For our regression discontinuity estimations, we focus on this municipality level,
using shape�les from www.data.gouv.fr . The National Institute of Statistics and Economic Studies
(INSEE) provides data on municipality characteristics like age composition, commercial activity
and education. Electoral data, such as voter turnout, election results, and referenda results, are
obtained from the Center for Socio-Political Data (CDSP). In addition, we use survey results at the
départment level from a large scale survey, the Observatoire Interrégional du Politique carried out
in 1999, 2001 and 2003. In contrast to all other French surveys, it o�ers a su�ciently large number
of observations at the départment level.
We present both results on di�erences in stated versus revealed preferences. Stated preferences
have the obvious advantage that we can use direct questions asking people about the strength of
their respective identities. However, those are "costless" answers, and might thus exaggerate existing
di�erences or yield biased estimates. A measure of revealed preferences is ideally a costly decision,
where a representative sample of the population in the treated and untreated area face a decision
that signals the strength of regional identity. In addition to survey evidence, we bene�t from the fact
that France repeatedly held nationwide referenda that directly touched upon questions relating to
7 Note that the equilibrium level of national and regional identity in both areas depends on the objective functions ofthe parents and other regional agents, as well as the cost of transmitting traditions. There can be functional formsand costs, for which it is optimal to give up regional culture altogether. Also note there is one remaining di�erencewith regard to schooling. Students in the treated area still receive a few hours of religious classes in school today.We will demonstrate that this is unrelated to our outcome variables.
12

the political in�uence of regions, the recognition of regional culture, and regional decision-making.
Our main measure of regional identity at the municipal level is the agreement in three referenda
from 1969, 1992, and 2005. The referenda are a good measure as they were important decisions
with a political cost to them, and contain no binding monetary constraint preventing certain groups
or parts of the population from voting. We use data on voter turnout to verify that the results are
representative of the underlying population. With regards to national identity, we can use a clear
measure of stated national identity in surveys. In our robustness section, we also use data from tweets
supporting the French national team during the soccer World Cup 2014 as an alternative. Regarding
mechanisms, we present results about regionalist parties and regional newspaper subscriptions. The
following paragraphs describe the indicators, which capture revealed preferences.
Referendum on Regionalization (De Gaulle), 1969
First, we use a referendum that President Charles De Gaulle held in 1969, which explicitly focused
on decentralization and establishing regions as an important political unit in the French constitution
(Bon, 1970). Regions were supposed to take control of public utilities, housing, urbanization, and be
able to borrow money on their own. Furthermore, they would be independent contractual parties,
be able to set up public organizations, and be part of an adapted second chamber representing
the territorial collectivities. De Gaulle justi�ed the referendum by saying that, whenever possible,
decision-making should happen closer to the citizens. Moreover, he stated that the regions' cultural
importance should be re�ected politically. In the end, 52.4 percent of French voters rejected the
proposal and De Gaulle resigned immediately afterwards. We digitized newspapers from April
1969, which we then transcribed and matched to the current municipalities for the three Lorrainian
départements.8 For Alsace, we rely on département level results, which are available for free nation-
wide.
Referendum on Maastricht Treaty, 1992
The Maastricht Treaty included several reform proposals about the institutional and political struc-
ture of the European Union (EU). The important aspect is that, assuming equal bene�ts and equal
costs from EU reform at the border, the treaty was expected to enhance the role of regions in the
EU by fostering both regional decision-making and the expression of regional identity. The treaty
was a huge step forward for regions in the institutional landscape in Europe. It formally introduced
the principle of subsidiarity, which codi�ed the aim that decision-making should be at the lowest
feasible level of authority in the EU (Treaty on the European Union, 1992). In addition, it estab-
lished a Committee of the Regions as part of the European institutional structure, which �created a
political space for regions� (Fitjar, 2010, p.528). Based on this, the perception of the treaty at that
time was that it would allow regions to �seek a greater voice in EU a�airs� and �reignite calls for
decentralization and regional autonomy� (Chacha, 2013, p.209; Scott et al., 1994).
8 We are very thankful to the director of the Lorrainian departmental archive, Jean-Eric Jung.
13

Referendum on Constitution for Europe, 2005
The Treaty establishing a Constitution for Europe would have a been a large step towards more
European integration. For instance, it aimed to introduce majority voting in more areas and establish
a single constitutional text. Again, our use of the referendum results at the municipality level
assumes that, at the treatment border, the costs and bene�ts of these integration steps are the
same. The one exception is that the treaty's e�ect on the scope of regional decision-making and
the ability to express regional identity will be di�erent if regional identity is stronger in the treated
area. O�cial assessments of the regional and local authorities associations, which were publicly
available and communicated to voters (CEMR, 2004, source of all following citations), regard them
as �an achievement for regional and local authorities�, which would �strengthen the role of local
and regional governments�. An important point was the reinforcement of the subsidiarity principle
and �greater recognition to the role of regional authorities� as well as �respect for regional and local
self-government as part of national identities�. Cross-border regions were introduced as a new way
of representing common regional interests formerly divided by nation-states.
The widespread opinion in 1992 and 2005 was that the EU was �moving towards a Europe
of the regions� (Chacha, 2013 p.208). EU integration was seen as reducing the costs of regional
autonomy and allowing regions to bypass national governments and deal with Brussels directly.
For that reason, regionalist parties �favor European integration because it creates a more favorable
political opportunity structure for their subnational autonomy movements� and �perceive the EU
`as an ally against the central state� (Jolly, 2007, p.110 & 124). The moderate regionalist Alsatian
party Le parti Alsacien, for instance, campaigns on its website for an �independent Alsace in a federal
European Union�.
Regional newspaper subscriptions and regionalist parties
In addition, we use data on regional newspaper subscriptions and regionalist parties to examine
potential mechanisms. These variables capture investments in transmitting and maintaining regional
identity made by regional agents, as discussed in Section 2.2. Although we use them to measure
mechanisms, the share of households that subscribe to regional newspapers and the vote share of
regionalist parties is itself of course also a proxy for regional identity. We received access to municipal
level data for subscriptions to the Lorrainian newspaper �Le Republicain Lorraine�, but only for the
year 2014, nine years after the third referendum. Regionalist party results are from the 2015 regional
elections, where all moderate regionalist parties in Alsace and Lorraine ran on a joint list.
Out of all measures, the �rst referendum in 1969 has the advantage that it clearly focuses
on fostering regions as an important political unit in France, thus clearly relating and measuring
di�erences in regional identity. As explained above, the two referenda in 1992 and 2005 were both
also clearly related to the political recognition of regions and more regional decision-making, and
perceived as such by the population. It is reassuring that there the strong overlap between regional
and European identity is not only documented by other studies (Chacha, 2013), but also visible in our
data (see Table A21). Moreover, département level data shows that, already in 1972, a referendum
14

Table 2: Variables, level of aggregation and region in order of appearance
# Content Preferences Year(s) Level Paper Appendix a
1 Geographic variables - - Munb Lc A+Lc
2 Cahiers de doléances Stated 1789 Dep b L A+L3 Survey I Stated 1999, '01, '03 Dep L A+L4 Referendum Revealed 1969 Mun L -5 Referenda Revealed 1992,'05,'07 Mun L, A+L -6 Regional Newspaper Revealed 2014 Mun L -7 Regionalist parties Revealed 2015 Mun A+L -8 Survey II Stated 1999, '01, '03 Dep L, A+L L, A+L
Notes: This table provides an overview about the main variables in order of appearance throughout the paper.Preferences are distinguished between revealed and stated preferences, the level of aggregation is either départe-ment or municipality. The last two columns show where we use variables for either only Lorraine or for bothAlsace and Lorraine. The table refers to the main regressions, robustness tests for di�erent variables at variouslevels are shown in the Appendix in addition.
a Appendix = Online Appendix. Figures and Tables with "A"+Number.b Levels are either Mun = municipality or Dep = départementc Regions refer to L = Lorraine or A+L = Alsace and Lorraine, respective to which data is presented in the mainpaper or the online appendix
about EU expansion yielded a comparable vote pattern in the region than the 1969 referendum
on the establishment of regions (Figure A11d). Nonetheless, as those two referenda also relate to
broader questions about the European Union, we show that treated and control municipalities at the
border do not di�er in other factors that might make European integration more or less bene�cial.
We also compute geographical characteristics to evaluate the exogeneity of the border. The
data on terrain ruggedness is from Nunn and Puga (2012), but we use it at a more disaggregated
level. Raw elevation data comes from the NASA Shuttle Radar Topography Mission (SRTM) data
set. Data on soil suitability for potatoes and wheat, the two most important crops, comes from the
FAO's Global Agro-Ecological Zones database (GAEZ). To best approximate pre-�Green Revolution�
growing conditions in 19th and early 20th-century Europe, we choose a medium input intensity and
irrigation.9
Most of the outcome measures are available for both Alsace and Lorraine, except the referendum
in 1969 and the regional newspapers. Table 2 shows their availability and usage. Table A6 shows
summary statistics for our variables of interest in the full sample of municipalities in Alsace and
Lorraine. Tables A1 and A7 show de�nitions and sources, as well as descriptive statistics for the
variables. The next section begins by focusing on Lorraine, which provides a better counter-factual,
due to the exact location of the border being more clearly exogenous. Later, we show that the results
hold when including Alsace. This is reassuring with regard to the external validity of the results,
and allows us to compare the two regions with regard to the mechanisms.
9 Ruggedness: http://diegopuga.org/data/rugged/. Elevation: accessed through the web page of ESRI.Soil Suitability: http://www.fao.org/nr/gaez/en/.
15

3.2 Identi�cation strategy
Our treatment variable in the municipal level regression is a deterministic function of the geographical
location of a municipality. We then test for a discontinuity at the threshold de�ned by the treatment
border dividing the treated from the control area in Alsace and Lorraine. The causal interpretation
draws on studying municipalities close to the former border using a RDD. Formally, the following
regression model:
yc = α+ βTreatmentc + p(distance to borderc) + z′cγ + εc, (1)
where yc is the outcome variable of interest for municipality c, Treatmentc is a dummy taking the
value 1 for municipalities in the formerly occupied region, and 0 otherwise. p(.) allows for di�erent
functional form of the running variable, which measures the direct distance from the municipality
centroid to the former national border. zc comprises the distances to the city of Metz, city of
Strasbourg, city of Nancy, and the current French-German border. As suggested by Gelman and
Imbens (2017), we include a linear term for the distance, allowing its coe�cient to vary on either
side of the border. This means that we estimate a local linear regression model according to (1) close
to the former border, using a uniform kernel density function, for di�erent bandwidths. Figures A21
through A27b present estimates from plausible alternative speci�cations.10 All results from those
speci�cation are in line with those presented in the main paper.
The treatment e�ect in (1), β is given by
β = limxc→0+
E [yc |xc ]− limxc→0−
E [yc |xc ] , (2)
where xc is the distance to the border normalized at 0. This means that the distance for munici-
palities in the treated region is equal to the actual distance, while it is equal to the actual distance
multiplied by minus one for municipalities in the untreated region. Under the assumption of the
conditional expectation function, E [yc |xc ], being continuous, the treatment e�ect is equal to the
di�erence in the outcomes at the border between municipalities in the treated and untreated area.
This assumes that all other factors relevant in explaining the outcome are continuous at the border
and that the treatment is orthogonal to potential outcomes. We address this by formally testing for
discontinuities in geographic factors, which are not a�ected by the treatment. Speci�cally, we show
that there is no discontinuity in terrain ruggedness, elevation, and soil suitability for the production
of potatoes, wheat, and barley (Table A14 and Figure A8).11
Moreover, to get a sense of identity before 1871, we make use of the fact that Louis XVI, shortly
10Dell (2010) discusses why a semi-parametric approach could be superior when the geospatial data is not precise interms of geographical location. In our case, we do not have data on individuals and, for instance, their addresses.Instead, our outcome variables measure the municipality level aggregate of individual actions, and we approximatetheir location in relation to the former border by the distance from the municipality centroid.
11We �nd no discontinuity for any of these measures, suggesting that they are orthogonal to our treatment variable.Figure A18 to A27 show that the results are not a�ected when (i) omitting controls, controlling for (ii.) bordersegments and (iii.) distance to the language border, controlling for (iv.) longitude, latitude, as well as (v.) bothand their interaction to compare only actual neighboring municipalities.
16
before the French revolution, wanted to assess the loyalty of his citizens. This data, known as the
�Cahiers de doléances�, speci�cally asks about the relative strength of regional identity compared to
national identity. This was originally text data, which was transformed to a numerical scale between
1 and 3, and aggregated to between 4 and 8 units per départment Hyslop (1968). Following Johnson
(2015), we exclude the �rst estate, clergy, which was more driven by religious policy. We include
the second estate, nobility, the third estate, other citizens, as well as the category uni�ed orders. If
assessments for more than one estate are available, we take the arithmetic average. Table 3 shows
that the average response for all four départements within Lorraine is equal or approaching 2, and
that there is no statistically signi�cant di�erence between Moselle and the untreated départements.
Table 3: National vs. Regional identity in Lorraine in 1789 (Cahiers de doléances)
Mean Std. dev. Obs.
Lorraine (average) 2.021 0.541 24
Moselle (treated) 2.000 0.816 7
Meurthe-et-Moselle 2.000 0.598 8
Meuse 2.000 0.000 4
Vosges 2.100 0.224 5
Di�erence Std. dev.a Obs.
Moselle vs. untreated -0.029 0.349 24
Notes: National identity in 1789 based on Cahiers de doléances for each département in Lorraine (and Vosges). The
measures are based on an index created by Hyslop (1968), where the value 3 corresponds to "National patriotism strongest",
2 corresponds to "Mixed loyalties: national patriotism combined with regionalism or class spirit, or both.", and 1 corresponds
to "Other loyalties, regional, or class, or both, outweigh national patriotism". Hyslop (1968) computed these values at the
level of selected important city areas based on more disaggregate reports in verbal form. We assign the city areas to current
départements.a Heteroscedasticity-consistent standard errors.
4 Main results
4.1 Survey evidence
We begin by considering survey evidence on stated di�erences in identity. The Observatoire In-
terrégional du Politique (OIP) surveys include direct questions proxying for the perceived common
identity of the average individual. The parameter of interest ∆ comes from the equation:
yi = π + ∆Treatmenti + Γ′iλ+ ηi, (3)
where Treatmenti = 1[individual in treated area], and Γ contains controls for age, education, em-
ployment status, and gender. As the geographic precision of the survey is the département, our
estimation compares the conditional means of regional and national identity in the treated and the
untreated area.
According to Table 4, people in the treated area clearly express a signi�cantly stronger common
17

regional identity today. In contrast, there is no di�erence in common French identity. We also
compute the ratio of regional relative to national identity, and standardize this variable to ease
interpretation. People in the treated areas of Lorraine exhibit a ratio that is 14 percent of a stan-
dard deviation higher. It is interesting that there is no di�erence with regard to national identity,
emphasizing the importance of our model and de�nition where identities need not to be substitutes.
This is the comparison within Lorraine, Table A19 shows that the di�erences remain similar, but
larger in magnitude when including Alsace.
Table 4: Survey results, Lorraine
Survey question Mean,control
∆ P-value No. obs.
Feel close to region (Regional identity) 3.362 0.154 <0.001 1314Feel close to nation (National identity) 3.635 0.028 0.409 1313Regional identity/National identity (standardized) -0.138 0.138 0.011 1311
Notes: Sources are the Observatoire Interrégional du Politique (OIP) 1999, 2001, and 2003, using respondents in Lorraine,at the département level. Identity is measures on a 4-point Likert-scale. Table A19 shows similar results for all of Alsaceand Lorraine. A positive ∆ indicates that people in the treated region agree more with the statement.
Note that the survey results measure di�erences in stated preferences instead of in revealed
preferences, and could be a�ected by omitted variables. If, for instance, the proximity to neighboring
countries correlates with regional identity, this could a�ect the results, as the treated area is closer
to neighboring countries. The next section proceeds with municipal level data on three outcomes
revealing regional identity, and resolves concerns about omitted variables through a geographic RD
design.
4.2 Referenda results
Figure 4 provides maps of the referenda results from 1969, 1992, and 2005. Figures 4b (available
within Lorraine only), 4c and 4d show higher agreement to the referenda that would strengthen re-
gional decision-making powers in the treated area to the right of the former border.12 It is important
to note that there are no obvious visible di�erences in turnout for all three votes (see Figure A12).
Moreover, Figure A11c shows no comparable pattern of support for De Gaulle in the 1968 presi-
dential election, suggesting that preferences about him as a person do not explain the di�erences in
1969.
Table 5 shows OLS estimates of the di�erences in outcomes between the treated and the untreated
areas, including controls. Including all municipalities in the regions enables us to assess the external
validity of the following RD estimates. Although the RDD has advantages in most dimensions,
potential sorting is more likely to be an issue at the border because the costs of moving to neighboring
municipality are lower. The OLS speci�cations avoid this problem. If both approaches yield similar
12Figure A11a shows at the départment level that the comparison for 1969 using Alsace suggests a similar, if notlarger, di�erence. The yes-vote share out of all eligible voters was above 50 percent in Alsace and between 40 and45 percent in neighboring Vosges.
18

Figure 4: Maps of municipal level outcomes of referenda in 1969, 1992 and 2005
Notes (a): The light grey area is the comparison within thehistorical region of Lorraine, where the border is clearlyexogenous. The dark grey area includes Alsace and Vosgesas its comparison, where the border partly coincides withthe historical language border.
(a) Within Lorraine and Alsace
0 25 50 Kilometers
LegendShare "Yes" 1969
0.00 % - 35.00 %35.01 % - 55.00 % 55.01 % - 75.00 %75.01 % - 100.00 %
Notes (b): Share of yes votes in Charles De Gaulle's 1969referendum on more regional decision-making. Results weredigitized from historical newspapers and assigned to currentmunicipalities. The treatment border is highlighted inwhite. Darker shades re�ect higher values. Figure A11ashows no comparable di�erences in prior support for DeGaulle.
(b) Share "Yes" 1969 (Regional identity)
LegendShare "Yes" 1992
0.00 % - 40.00 %40.01 % - 55.00 % 55.01 % - 70.00 %70.01 % - 100.00 %
0 25 50 Kilometers
Notes (c): Share of yes votes in the referendum in 1992 onthe Maastricht treaty. The treatment border is highlightedin white. Darker shades re�ect higher values. Figure A12cshows no di�erences in turnout between both areas.
(c) Share "Yes" 1992 (Regional identity)
LegendShare "Yes" 2005
0.00 % - 30.00 %
30.01 % - 45.00 %
45.01 % - 60.00 %
60.01 % - 100.00 %
0 25 50 Kilometers
Notes (d): Share of yes votes in the referendum in 2005 onthe constitution for Europe. The treatment border ishighlighted in white. Darker shades re�ect higher values.Figure A12d shows no di�erences in turnout between bothareas.
(d) Share "Yes" 2005 (Regional identity)
19

results, we can not only disregard worries about sorting, but also have more faith in the causal
interpretation of the départment level survey results.
For Share Yes 1969, Share Yes 1992, and Share Yes 2005, the coe�cients indicate stronger
regional identity in the treated area. The interpretation of the regression coe�cient for the treatment
variable is the average di�erence in percentage points between treated and untreated municipalities.
It is illustrative to relate them to the average vote share of the whole region. For instance, the
coe�cient of Share Yes 1969 is 14.1 percentage points, which equates to almost 24 percent of the
average yes-vote share of 59.2 in all of Lorraine. The coe�cient of Share Yes 1992 is 4.2 points,
almost 10 percent of the average yes-vote share, and the 6.2 in Share Yes 2005 correspond to about
15 percent.13
Table 5: OLS estimates using municipalities in Lorraine
Dep. Variable: Share Yes 1969 Share Yes 1992 Share Yes 2005
(2) (3) (4)
Treatment 13.595 5.917 6.633
(1.443) (0.985) (1.070)
[<0.001] [<0.001] [<0.001]
Adj. R-squared 0.272 0.095 0.048
Obs. 1612 1743 1747
Notes: OLS estimates using whole sample of municipalities in all départements in Lorraine. The outcomes are the share
of Yes votes in the 1969 referendum, in the 1992 referendum, and in the 2005 referendum. Included controls: distance to
Germany (border), distance to Metz, distance to Strasbourg, distance to Nancy. Conley standard errors are displayed in
parentheses and p-values in brackets.
Accordingly, the OLS estimates are in line with our predictions and the survey results concerning
to regional identity. Now we turn to the RDD results. Our baseline RD estimation shows estimated
treatment e�ects on all three outcome variables from Figure 4 for bandwidths of 10, 15 and 20
kilometer. In addition, we include one speci�cation using the optimal IK bandwidth (Imbens and
Kalyanaraman, 2012). For all outcomes, this is larger than 20 kilometers, suggesting that smaller
bandwidths are rather conservative. The closest choice of 10 kilometers basically compares only
municipalities directly at the border with their direct neighbors. This should eliminate all concerns
regarding comparability, as distances to neighboring countries or cities are virtually identical.
Table 6 shows that the estimated treatment e�ect on regional identity e�ect remains positive
and statistically signi�cant for Share Yes 1969, Share Yes 1992 and Share Yes 2005 across all
bandwidths. The coe�cient for 1969, which provides the clearest measure of regional identity, is
about 13 percentage points at the smallest bandwidth of 10 kilometers. This re�ects the mid range
reaction at a time when the population still contained both individuals who experienced repression,
as well as individuals who grew up later and were a�ected only indirectly through the investments13 Supporting our interpretation of the 1992 and 2005 referenda as signaling di�erences in regional identity, there is alsoa highly signi�cant correlation between stating a stronger than average regional and stating a stronger Europeanidentity, in Alsace and Lorraine as well as in France overall (Table A21); 85 percent of respondents stating a strongerEuropean identity also express a stronger regional identity.
20
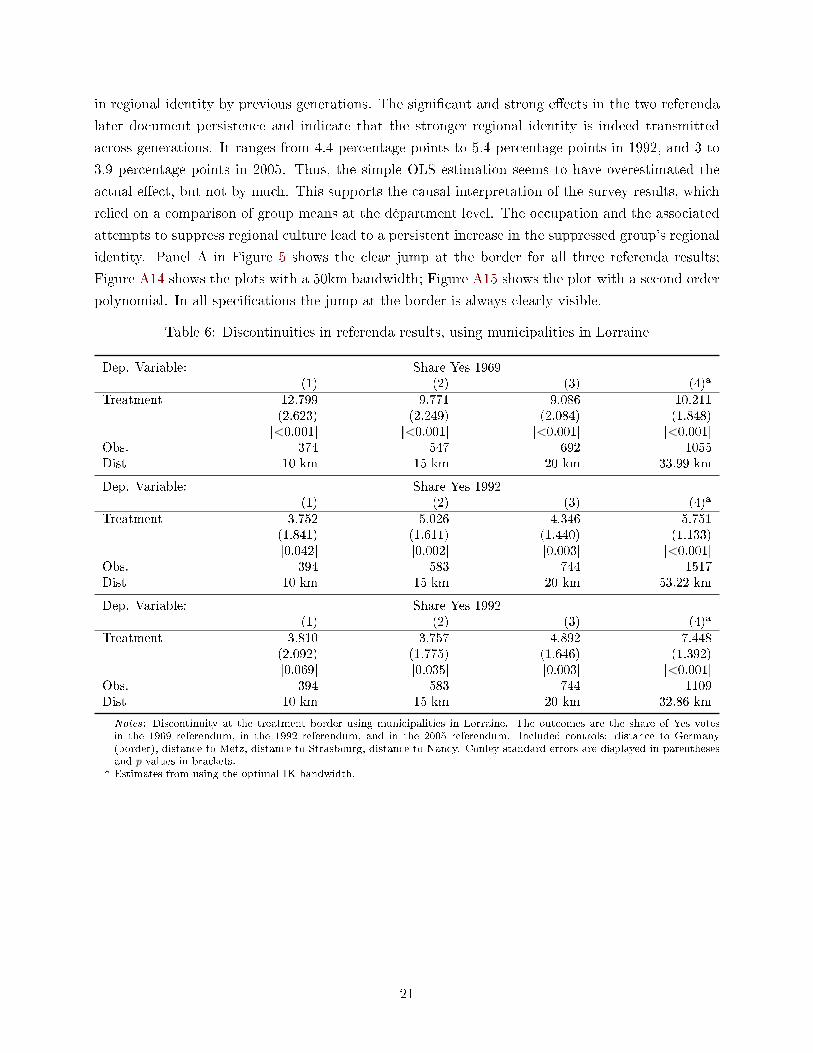
in regional identity by previous generations. The signi�cant and strong e�ects in the two referenda
later document persistence and indicate that the stronger regional identity is indeed transmitted
across generations. It ranges from 4.4 percentage points to 5.4 percentage points in 1992, and 3 to
3.9 percentage points in 2005. Thus, the simple OLS estimation seems to have overestimated the
actual e�ect, but not by much. This supports the causal interpretation of the survey results, which
relied on a comparison of group means at the départment level. The occupation and the associated
attempts to suppress regional culture lead to a persistent increase in the suppressed group's regional
identity. Panel A in Figure 5 shows the clear jump at the border for all three referenda results;
Figure A14 shows the plots with a 50km bandwidth; Figure A15 shows the plot with a second order
polynomial. In all speci�cations the jump at the border is always clearly visible.
Table 6: Discontinuities in referenda results, using municipalities in Lorraine
Dep. Variable: Share Yes 1969(1) (2) (3) (4)a
Treatment 12.799 9.771 9.086 10.211(2.623) (2.249) (2.084) (1.848)
[<0.001] [<0.001] [<0.001] [<0.001]Obs. 374 547 692 1055Dist 10 km 15 km 20 km 33.99 km
Dep. Variable: Share Yes 1992(1) (2) (3) (4)a
Treatment 3.752 5.026 4.346 5.751(1.841) (1.611) (1.440) (1.133)[0.042] [0.002] [0.003] [<0.001]
Obs. 394 583 744 1517Dist 10 km 15 km 20 km 53.22 km
Dep. Variable: Share Yes 1992(1) (2) (3) (4)a
Treatment 3.810 3.757 4.892 7.448(2.092) (1.775) (1.646) (1.392)[0.069] [0.035] [0.003] [<0.001]
Obs. 394 583 744 1109Dist 10 km 15 km 20 km 32.86 km
Notes: Discontinuity at the treatment border using municipalities in Lorraine. The outcomes are the share of Yes votesin the 1969 referendum, in the 1992 referendum, and in the 2005 referendum. Included controls: distance to Germany(border), distance to Metz, distance to Strasbourg, distance to Nancy. Conley standard errors are displayed in parenthesesand p-values in brackets.
a Estimates from using the optimal IK bandwidth.
21

Figure 5: RD plots for voting outcomes 1969, 1992 and 2005
Panel A: Regional identity at the treatment border
●●
● ● ●
● ● ●●
●
40
60
80
−20 −10 0 10 20
km
Sha
re Y
es 1
969
(a) Share Yes 1969
● ● ● ●●
●
●
●●
●
40
45
50
55
60
−20 −10 0 10 20
km
Sha
re Y
es 1
992
(b) Share Yes 1992
●●
● ●●
●
● ●●
●
30
40
50
60
−20 −10 0 10 20
km
Sha
re Y
es 2
005
(c) Share Yes 2005
Panel B: Regional identity at a placebo border
●●
●
● ● ●● ●
● ●
30
40
50
60
−20 −10 0 10 20
km
Sha
re Y
es 1
992
(d) Share Yes 1992
● ●
●● ● ● ● ● ● ●
30
40
50
60
−20 −10 0 10 20
km
Sha
re Y
es 2
005
(e) Share Yes 2005
Notes: (a), (b), (c): RD plot using municipalities in Lorraine, 20 kilometer distance to the treatment border, with �rst degree
polynomial �t varying on each side. Dots represent binned means using 4 kilometer bins. (d), (e): RD plots using
municipalities within 50 kilometers of the border separating non-annexed Lorraine from rest of France.
Figure 6: Estimation plots for 1969 referendum, within Lorraine
●●●
●●●●●●●●●●●●●●●●●●●●●●●●●●●●●●●●●●●●●●
10 20 30 40 50
05
10
Bandwidth, km
Coe
ffici
ent e
stim
ates
15
Notes: Estimates of treatment e�ect, bandwidths ranging between 10 and 50 kilometers, within Lorraine, �tted using �rst
degree polynomial. Dashed vertical line at optimal IK bandwidth. Solid vertical lines represent 90 percent con�dence intervals
(based on Conley standard errors).
22

Historical evidence suggests that Alsace and Lorraine were as well integrated into France prior
to the Franco-Prussian War as other regions. We implement a placebo test using the 1992 and 2005
referenda results in the regions geographically west of the control area, and check for a discontinuity
at the border between this western part of Lorraine and the rest of France to further validate this. If
the complete region was already exhibiting a stronger regional identity previously, we would expect
a discontinuity here. Figure 5, Panel B, however, clearly illustrates that in contrast to Panel A
there is no discontinuity at this placebo border. Table A12 shows the absence of discontinuities
in the corresponding regression table. Table A30 shows another placebo test using the pre-1870
départment border within Moselle, and also �nds no signi�cant discontinuities.
Although Table 6 indicates already that the choice of the bandwidth does not a�ect our results,
Figure 6 clari�es this further. It depicts the individual coe�cients and con�dence intervals across
all plausible bandwidths ranging from 10 to 50 kilometers for the 1969 referendum. The e�ect size
varies little and is always positive. As we would expect, the estimation becomes more precise as we
increase the bandwidth, and the coe�cient remains remarkably stable. Figure A18 to A27 show the
same plot for the 1992 and 2005 referenda. Moreover, they show that the results are not a�ected
when using no control variables, or when additionally controlling for (ii.) border segments, (iii.)
distance to the language border, (iv.) longitude, latitude, as well as (v.) longitude, latitude and the
interaction between the two.
The causal interpretation of the coe�cients rests on the assumption that the untreated municipal-
ities can be viewed as counter-factuals for the treated communes. We want to remedy one potential
concern by considering potential post-treatment discontinuities in socio-demographic characteristics.
Note that those factors might be a�ected by the treatment and act as channels through which the
treatment a�ects the outcome. Based on the literature on the determinants of voter preferences and
turnout (e.g., Franklin, 2004), we examine potential discontinuities in yearly median income, mean
age, education, and occupation. Table A17 shows that there are no discontinuities within-Lorraine.
In a next step, we want to examine whether we can �nd the same results when including Alsace
in the analysis. The treatment border in Alsace partly follows linguistic di�erences, hence the
counterfactual municipalities in Vosges might di�er with regard to the traditional dialect and culture.
Table A17 indicates that at the border the treated municipalities in Alsace are richer and slightly
younger on average. However, when looking at the extented RDD results in Table 7, we �nd that the
treatment e�ects when including Alsace are of a similar magnitude and remain statistically highly
signi�cant.
23

Table 7: Discontinuities in referenda results, Alsace and Lorraine
Dep. Variable: Share Yes 1992 Share Yes 2005
(1) (2)a (3) (4)a
Treatment 4.353 3.787 2.957 6.443
(1.748) (0.859) (1.742) (1.090)
[0.013] [<0.001] [0.090] [<0.001]
Obs. 604 2781 603 1849
Dist 10 km 60.88 km 10 km 33.37 km
Notes: Discontinuity at the treatment border in Lorraine. The outcomes are the share of Yes votes in the 1992 referendum,
and in the 2005 referendum. Included controls: distance to Germany (border), distance to Metz, distance to Strasbourg,
distance to Nancy. Conley standard errors are displayed in parentheses and p-values in brackets.a Estimates from using the optimal IK bandwidth.
5 Mechanisms, persistence and policy preferences
5.1 Mechanisms
After documenting that there is a causal e�ect of occupation, repression and the associated homoge-
nization policies on regional identity, we are interested in potential mechanisms. It is plausible that
the exposure during the treatment period unconsciously changed the attitudes of treated individu-
als, which a�ects potentially unobservable aspects of raising their children (Dohmen et al., 2012).
Moreover, people in the treated area could also consciously have decided to invest in instruments
that help to express, strengthen and transmit regional identity. The theoretical model in Section
2.2 focuses on investments made by regional agents, for instance by founding regional organizations
like clubs, political parties, and media outlets.14 We cannot reliably compare clubs as the legal rules
for establishing and registering a club di�er between the treated and control area, and the available
information about festivities does not reliably identify those related to regional culture. However,
we can exploit information about regionalist parties and regional media usage. Note that logically
all discontinuities re�ecting potential mechanisms can also be considered as outcomes (and are thus
bad controls in a regression using the other outcomes), which is why we are not able to estimate
how much any particular mechanism has contributed to the di�erences.
Regionalist parties are also interesting with regard to the chronological order of cause and e�ects.
Fouka (2017) �nds that, in her sample of German immigrants exposed to repressive policies in
the US, the observed increase in common group identity occurs only after the treatment ended
(Fouka, 2018). Accordingly, we are also interested in whether the e�ects that we document begin to
materialize during or after the treatment. Historical evidence indicates that the repressive policies
already triggered an increase in regional identity during the treatment period (Goodfellow, 1993;
Harvey, 1999). This could be observed through periods of public protest, the establishment of
14Ochsner and Roesel (2017) suggests that war memorials and statues also function as a technology to transmit acommon history. There are some well-known statues in Lorraine that might reactivate the memory of repressivepolicies, but they are mostly related to WWI or WWII, which makes a distinction di�cult.
24

regional newspapers (Callender, 1927), and the emergence and success of regionalist parties.
Regionalist parties
Regionalist parties emerged and enjoyed great electoral success during German occupation, with a
vote share of between 30.2 percent and 56.6 percent (Hiery, 1870). The success of regionalist parties
continued during the interwar period under French rule. The Independent Regional Party for Alsace-
Lorraine, for instance, received 11.5 percent of the votes in Bas-Rhin in 1928. Zanoun(2009, p.62)
suggests that �autonomists were also present in the Moselle and like their Alsatian counterparts
demanded autonomy for Alsace-Lorraine.� Accordingly, the historical evidence indicates that both
German and French policies triggered investments in the creation of regionalist parties that then
enjoyed electoral success. There were no comparable successful parties during the treatment period
in the untreated area. It is also important to note that historians classify the vast majority of these
parties after WWI as aiming for more regional autonomy, rather than for a return to Germany
(Rothenberger, 1975). After the end of WWI, the regional parliament even proclaimed a sovereign
region of Alsace-Lorraine. This, however, was not accepted by the French government.
Support for regionalist parties collapsed in the build-up to WWII, as the parties were perceived
as being associated with Nazi-Germany. These accusations under French rule were apparently more
widespread in Lorraine and less in Alsace, where a larger share su�ered under the intrusive French
language policies and saw regionalist parties as �ghting to reestablish bilingualism. Up until today,
political regionalism is much stronger in Alsace than in Lorraine, where support for regionalist
parties never recovered to pre-war levels. Alsace features two regionalist parties, the right-wing
�Alsace d'abord� and the moderate �Le Parti Alsacien/Unser Land�. Both are rather successful, the
former winning about 9 percent and the latter winning around 15 percent of the votes in the 2010
regional elections. In contrast, the party �Vosges d'abord� in the neighboring untreated départment
enjoyed little electoral success. In upper Lorraine, the �Parti des Mosellans� and the more established
�Parti Lorrain� are the remaining regionalist parties, campaigning for a strong Lorraine region in a
�Europe of the Regions�.
The 2015 regional elections allow us to evaluate remaining di�erences between the treated and
untreated area systematically, as all moderate regionalist parties in the region formed a joint list.
Within Lorraine, the combined average vote share is 2.1 percent, nearly twice as much compared to
the 1.1 percent in the untreated neighboring Meurte-et-Moselle. The di�erence in the averages is also
visible in using the RDD. With a bandwidth of 15 or 20 kms and with the e�cient bandwidth, the
causal e�ect is about 0.4-0.5 percentage points. It remains positive, however, becomes insigni�cant
with the 10km bandwidth. When including Alsace the di�erences are more pronounced. This is in
line with the historical evidence cited above about the di�culties initially strong regional parties
faced in Lorraine. The share is between 1.2 and 2.5 percentage points higher in the treated area,
with p-values smaller than 0.05 for all bandwidths. Hence, regionalist parties are one plausible
mechanism through which the stronger regional identity in the treated area has been maintained.
25

Regional newspaper subscriptions
In addition to regionalist parties, we analyze the share of households subscribing to the regional
newspaper �Le Republicain Lorraine�. We received access to data from one Lorrainian regional
newspaper for the year 2014, allowing us to compare the treated and the untreated area within
Lorraine. No Alsatian regional newspaper is widely enough read in the départment of Vosges to allow
for a meaningful comparison. Newspapers are particularly interesting as a transmission mechanism.
They not only provide information to the parents within a household and work as a signal of regional
attachment to other households, but also can be used as a useful instrument to transmit regional
culture to children.
Table 8 shows a clear discontinuity in subscription rates at the treatment border. At the 10
kilometer bandwidth, the share of subscribers out of all households is around 10 percentage points
higher on the treated side. The result is highly signi�cant with p-values below 0.01 in all speci�-
cations, and the clear discontinuity is also graphically visible in Figure 7 and in the map in Figure
A29). Table A10 shows that the e�ect size is not driven by di�erences in the spoken dialect. We
can also try to disentangle supply and demand side explanations by controlling for the number of
points of sale in 2014 (there are more regional o�ces in the treated area). Conditioning on supply
side di�erences barely a�ects the point estimates, suggesting that demand side di�erences dominate
(Table A31).
To sum up, there are identi�able di�erences in two plausible and relevant mechanisms. Region-
alist parties are an important instrument to express regional identity, and also to maintain and
popularize the importance of regional culture. This channel seems relevant for both regions, but
stronger for Alsace. Within Lorraine, we �nd strong and sizeable di�erences in subscription rates
to regional newspapers. We cannot estimate which share of the di�erences in the survey questions
and in the referenda can be explained by those mechanisms in a precise econometric way, but the
size of the e�ects is su�ciently high to be considered a relevant transmission channel.
Figure 7: RD plot, share households with subscription of �Le Republicain Lorraine�
●●
● ●●
●●
● ● ●
0
10
20
30
−20 −10 0 10 20km
Sha
re s
ubsc
riptio
ns
Notes: RD plots using only municipalities within Lorraine, with �rst degree polynomial �t varying on each side. Black dotsrepresent means using 4 km bins, our mos conservative strategy is t also relevant with regard.
26
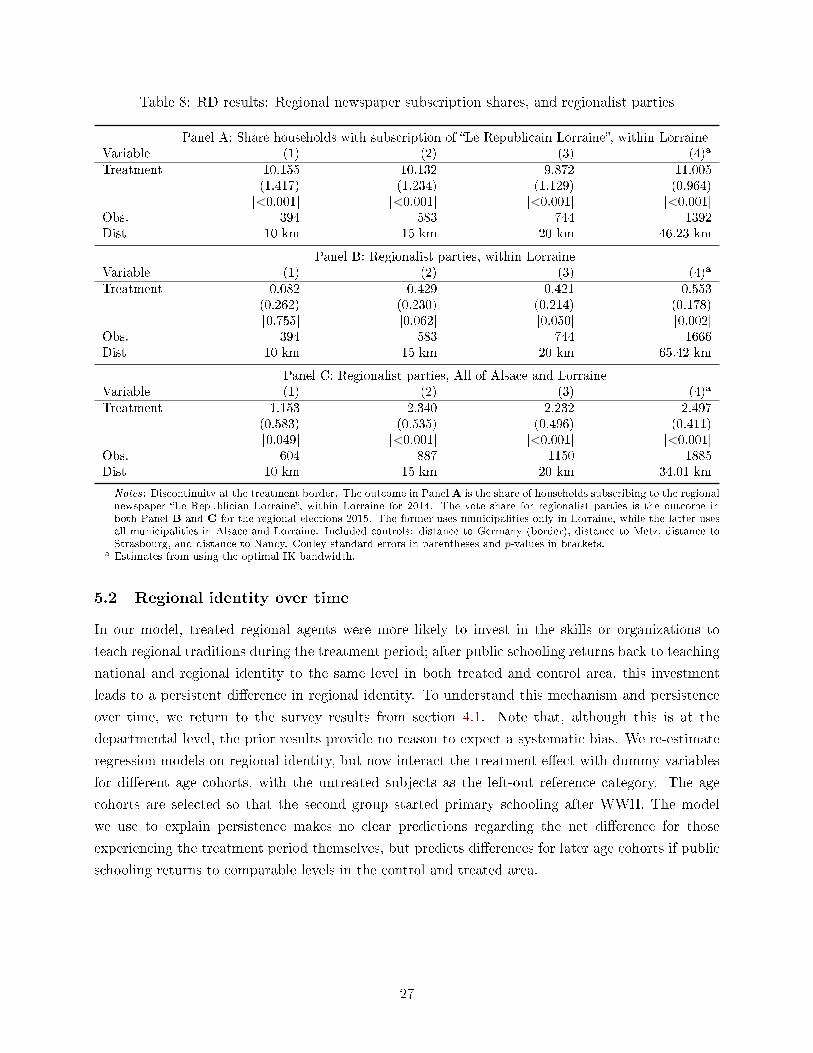
Table 8: RD results: Regional newspaper subscription shares, and regionalist parties
Panel A: Share households with subscription of �Le Republicain Lorraine�, within LorraineVariable (1) (2) (3) (4)a
Treatment 10.155 10.132 9.872 11.005(1.417) (1.234) (1.129) (0.964)
[<0.001] [<0.001] [<0.001] [<0.001]Obs. 394 583 744 1392Dist 10 km 15 km 20 km 46.23 km
Panel B: Regionalist parties, within LorraineVariable (1) (2) (3) (4)a
Treatment 0.082 0.429 0.421 0.553(0.262) (0.230) (0.214) (0.178)[0.755] [0.062] [0.050] [0.002]
Obs. 394 583 744 1666Dist 10 km 15 km 20 km 65.42 km
Panel C: Regionalist parties, All of Alsace and LorraineVariable (1) (2) (3) (4)a
Treatment 1.153 2.340 2.232 2.497(0.583) (0.535) (0.496) (0.411)[0.049] [<0.001] [<0.001] [<0.001]
Obs. 604 887 1150 1885Dist 10 km 15 km 20 km 34.01 km
Notes: Discontinuity at the treatment border. The outcome in Panel A is the share of households subscribing to the regionalnewspaper �Le Republician Lorraine�, within Lorraine for 2014. The vote share for regionalist parties is the outcome inboth Panel B and C for the regional elections 2015. The former uses municipalities only in Lorraine, while the latter usesall municipalities in Alsace and Lorraine. Included controls: distance to Germany (border), distance to Metz, distance toStrasbourg, and distance to Nancy. Conley standard errors in parentheses and p-values in brackets.
a Estimates from using the optimal IK bandwidth.
5.2 Regional identity over time
In our model, treated regional agents were more likely to invest in the skills or organizations to
teach regional traditions during the treatment period; after public schooling returns back to teaching
national and regional identity to the same level in both treated and control area, this investment
leads to a persistent di�erence in regional identity. To understand this mechanism and persistence
over time, we return to the survey results from section 4.1. Note that, although this is at the
departmental level, the prior results provide no reason to expect a systematic bias. We re-estimate
regression models on regional identity, but now interact the treatment e�ect with dummy variables
for di�erent age cohorts, with the untreated subjects as the left-out reference category. The age
cohorts are selected so that the second group started primary schooling after WWII. The model
we use to explain persistence makes no clear predictions regarding the net di�erence for those
experiencing the treatment period themselves, but predicts di�erences for later age cohorts if public
schooling returns to comparable levels in the control and treated area.
27

Figure 8: Identity di�erences by age cohort
0.2
.4.6
Trea
tmen
t effe
ct
<1945 1946-1955 1955-1964 1965-1974 >1974
Begin of primary school in
Regional identity
(a) Treatment e�ect in Lorraine
0.2
.4.6
Trea
tmen
t effe
ct
<1945 1946-1955 1955-1964 1965-1974 >1974
Begin of primary school in
Regional identity
(b) Treatment e�ect in Alsace and Lorraine
Notes: The treatment e�ects refer to the parameter ∆ in the equation: yig = π +∑
g ∆g ×Ageg × Treatmentig + Γ′iλ+ ηig ,
where Treatmentig = 1[individual in treated region] and Γ comprises controls for (reported) age, employment status and sex.g indicates to which age cohort an individual belongs, the group of untreated participants act as the baseline category. Agecohorts are selected such that the second group started schooling after the end of treatment and the end of WWII. A positive∆ indicates that people in the treated region exhibit a higher value compared to the control area. Sources are the ObservatoireInterrégional du Politique (OIP) 1999 and 2001.
The left-hand side of Figure 8 shows the results within Lorraine, and the right-hand side graph
shows results within Alsace and Lorraine combined. The results show several interesting patterns.
First, the treatment e�ect is positive for all age cohorts. Second, the e�ect is already positive for
the age cohort who began primary schooling prior to 1945, and thus certainly experienced repression
themselves. Third, it is strongest for the age cohort who began attending primary school between
1946 and 1964 and declines for later cohorts. Fourth, it remains stable and statistically signi�cant
when considering Alsace and Lorraine, but is much smaller for the last two age cohorts within
Lorraine. Given that the local dialect is also barely used anymore among younger age cohorts today,
our prior results suggest that the stronger presence of regionalist parties in Alsace might explain the
stronger persistence when including Alsace.15
5.3 E�ects on policy preferences
In contrast to studies assessing the e�ect of, for instance, exposure to the rule of law (Lowes et al.,
2017), di�erences in regional identity should not generally result in strong discrepancies in factors
like rule-following behavior or risk aversion. We would, however, expect di�erences with regard to
regional decision-making and preferences about the allocation of political competencies that relate to
regional culture. Models on the size of nations like Alesina and Spolaore (1997) suggest that besides
economic concerns (Boix et al., 2011; Gehring and Schneider, 2016), the (perceived) preference
15Figure A13 shows similar results when measuring regional identity relative to national identity. Note that a potentialdynamic extension of the model, where parents also face a variable cost of teaching with a time-varying α parameterfor the relative return to identity, could explain a decline over time. If parents reduce the value they assign to regionalculture over time, it can become no longer optimal to teach it at home even without the �xed costs component: thedi�erences between treated and control area would disappear over time. Reasons could, for instance, be a largershare of children moving out of the region to study or work, increasing the economic returns to national identity.
28

heterogeneity is the major factor in�uencing preferences about secession versus autonomy. We also
use the OIP surveys to measure the consequences of a stronger regional identity. Table 9 provides
clear evidence that the identity di�erences in Alsace and Lorraine also a�ect policy preferences
in line with size-of-nation models. People in the treated area feel better informed about regional
policies and have a more positive perception of regional democratic processes. When asked whether
they would be concerned that more regional autonomy would increase inequality between regions, a
signi�cantly lower share of the population is concerned.
We also create three comprehensive proxy variables regarding the transfer of policy competencies
to the regional level, more regional autonomy, and the allocation of responsibility for education
policy. Each proxy is the average of several survey items in the OIP survey, to make sure di�erences
are not caused by di�erent understandings of any one particular question. Figures A2 through A5
list the individual questions in each sub-category. The average individual in the treated area favors
transferring policy competencies from the national to the regional level as well as more regional
autonomy signi�cantly more often. Education policy is particularly interesting, as common state
education is a major mechanism of imposing an identity, and in�uences how traditions and culture
are taught. Again, treated subjects express clearly more favorable views towards setting educational
policy and standards at the regional level. Table A22 shows very similar results focusing only on
Lorraine.
Table 9: Survey results: policy preferences
Survey question Mean,control
∆ P-value No. obs.
Democracy works well in France 2.536 -0.035 0.324 2606Democracy works well within region 2.630 0.188 <0.001 2575Well informed about regional policies 2.704 0.172 <0.001 2604In favor: transfer policy competence to region (avg. 10) 3.031 0.078 0.002 1218In favor: allow more autonomy at reg. level (avg. 5) 2.134 0.132 <0.001 2619Educ. policy should be set at reg. level (avg. 5) 2.855 0.124 0.002 1204Concerned reg. admin. would increase interreg. inequality 3.208 -0.314 <0.001 1204
Notes: Sources are the Observatoire Interrégional du Politique (OIP) 1999, 2001, and 2003, using respondents in all of Alsaceand Lorraine, on département level. The Online Appendix shows similar results for within-Lorraine only. The parameter∆ comes from the equation: yi = π + ∆Treatmenti + Γ′iλ + ηi, where Treatmenti = 1[individual in treated region] andΓ comprises of controls for (reported) age, employment status and sex. A positive ∆ indicates that people in the treatedregion agree more with the statement. Avg. "x" indicates that the factor is composed of "x" underlying survey items. Theunderlying survey questions are shown in Table A2.
29

6 Robustness: Alternative explanations
This section discusses alternative explanations to this interpretation, including threats to identi�ca-
tion and the interpretation of what constitutes the treatment.
6.1 Results are due to linguistic di�erences
One concern regarding the interpretation of our results is that the border � mostly in Alsace � coin-
cides with di�erences between German dialect speakers � mostly Alsatian and Moselle Franconian �
and French dialect speakers. German dialect speakers might develop a stronger regional identity due
to the linguistic divide between them and the rest of France, could be exposed to a larger extent to
German media, or exhibit di�erent trading patters (Egger and Lassmann, 2015). Although linguists
describe the use of the German Alemannic dialect as steadily declining and now as being mostly
used by older generations (Vajta, 2013), we trace back the historical language border to separate
the treatment e�ect from linguistic di�erences. We rely on Harp (1998) and overlay his map with
the municipality boundaries to georeference the border along the French municipality boundaries.
Figure 2c shows the resulting language border.16
To address a potential correlation between spoken (or formerly spoken) dialect and agreement
as our proxy for regional identity, we then exclude all German-dialect speaking municipalities and
re-estimate the treatment e�ect within Lorraine. The estimates in Table 10 remain comparable in
size and highly signi�cant and reinforce our hypothesis of a persistently stronger regional identity.
Accordingly, the results hold even when comparing only directly neighboring municipalities in the
same historical region speaking the same dialect.
Table 10: Discontinuities in referenda results, within Lorraine, excluding German-speaking munici-palities
Dep. Variable: Share Yes 1969 Share Yes 1992 Share Yes 2005
Variable (1) (2)a (3) (4)a (5) (6)a
Treatment 13.019 9.407 4.126 4.089 3.830 5.015
(2.645) (1.960) (1.850) (1.234) (2.117) (1.592)
[<0.001] [<0.001] [0.026] [0.001] [0.071] [0.002]
Obs. 366 923 385 1269 385 720
Dist 10 km 39.41 km 10 km 61.96 km 10 km 21.48 km
Notes: Discontinuity at the treatment border using municipalities in Lorraine, excluding German-speaking municipalities.
The outcomes are the share of Yes votes in the 1969 referendum, in the 1992 referendum, and in the 2005 referendum.
Conley standard errors in parentheses and p-values in brackets.a Estimates from using the optimal IK bandwidth.
16 See also a similar maps in Callender, 1927. The border was formed in the 8th century and barely moved untilthe 19th century. Callender (1927, p.430) cites the Count Jean de Pange who traces the border back to barbaricinvasions and stated that �in Lorraine the limits of the languages bear no relation to the topography of the country.They form an irregular fringe, [...] these limits, arbitrarily traced by historical accident, have not appreciably alteredin �fteen centuries.� We provide the best approximation of the border with the municipality polygons and choosethe shortest path around the municipality.
30

6.2 Regional identity higher in border départements
When comparing regional identity in the treated and the untreated areas, we are also comparing
citizens of two di�erent départements. Figure 2d demonstrates how the former French-German
border coincides with the border between the départements of Moselle and Meurthe-et-Moselle, and
that Moselle is closer to the country border and further away from Paris. One concern is that
citizens in départements bordering a foreign country are simply more in favor of the EU, or have
a stronger regional identity, due to their distance to Paris. Although our RDD only compares
municipalities at the border between two départments, one might worry that the policies conducted
at the département-level result in di�erences in regional identity even at the border. For instance,
if border départements are better at providing public goods, their citizens might develop a stronger
bond to their local government, and thus feel more close to their region. We argue that it is
unlikely that these concerns in�uence our results. First of all, the amount of policy competence
at the département level is limited (see Table A16). Second, if there indeed exist di�erences in,
for instance, public good provision or other policies a�ecting socio-demographic characteristics, we
would have have detected discontinuities in any of the large set of covariates we examine at the
border, as seen in Table A17. Third, we examine di�erences in the survey questions presented in
Tables 4 and 9 between départements bordering a foreign country, and their direct adjacent neighbor.
These estimates, presented in Table A29, show that for all but one survey question, there are no
statistically signi�cant di�erences between border départments and their adjacent neighbors.
In this table, we have also included one question capturing how satis�ed respondents are with
the projects undertaken by their regional council, as well as two questions on general views about
the EU. Again, one might suspect that the policies implemented by border départements are more
aligned with EU policies in general. As we an see in Table A29, there are no statistically signi�cant
di�erences in the two questions regarding satisfaction with the EU, or with the regional council.17
Similarly, we can compare the referenda results in 1992 and 2005 at the border separating all
border départements from their adjacent neighbors.18 We are interested in comparing the disconti-
nuity at this border with the estimated treatment e�ects reported in Table 6. We want to investigate
whether our results are merely driven by the fact that the treated département of Moselle di�ers
from its neighbors due to bordering a foreign country. As discussed above, since the estimated treat-
ment e�ect within Lorraine only considers municipalities that are similar in all observable factors,
we might worry that policies conducted in Moselle di�er from those in the neighboring untreated
départements.
We estimate equation (1) using only municipalities in border départements and their immediate
neighbors, including the same set of controls as for the estimates presented in Table 6. Since this
border is much longer than the treatment border and covers all of France, we also control for the
17 It is worth mentioning that although these estimates are not statistically signi�cantly di�erent from zero, some arealso not statistically distinguishable from the estimates from the within Lorraine comparison.
18 Since we only have data on the 1969 referendum for Lorraine, we are unable to do any other comparison using thesedata.
31

geographical coordinates of the municipality centroids.19 Figure A17 compares the discontinuities at
the border dividing all border départements from their neighbor départements one degree removed
from the border (red dots) with the estimated treatment e�ects within Lorraine (red squares) for
bandwidths of 10, 15, and 20 kilometers. In all but one case, there is no statistically signi�cant
discontinuity at the border separating border départements from rest of France. Although the 90
percent con�dence intervals partly overlap, the magnitude of the treatment e�ect within Lorraine is
much larger.
6.3 Migration into and out of the treated area
Another concern is the role of migration to the treated area, and emigration to other parts of
France or destinations like the US. Migration mostly happened at two distinct points in time; when
Germany annexed the area and when France took it back. First, after 1870, the Germans imposed a
requirement that everyone who wanted to remain in the area had to give up her French nationality
and opt for German citizenship. Earlier expectations of a large exodus of more than 130,000 people
(Vajta, 2013) declined to less than 50,000 when it became clear that this would mean having to leave
the region. In addition, Germans migrated or were sent to work in the area between 1870 and the
end of WWI in 1918. However, as mentioned above, a large share of those immigrants were forced
to leave again after the French re-annexation of the area (Harvey, 1999). Nevertheless, a certain
share of those Germans or their o�spring remain in the area. Conceptually, this should bias against
our results, as German immigrants are less likely to exhibit a strong Alsatian or Lorrainian identity.
Second, there was a smaller in magnitude in�ow of French people from other regions after WWI
and the re-annexation. To some degree, they took up posts in the local administration and schools to
replace regional traditions and culture with a strong national identity. Again, as these were French
citizens from other regions, they should exhibit a weaker regional identity and also bias against
our results. In terms of migration a�ecting the composition of the treated and control group, it
is reassuring to remember that there are no discontinuities in the socio-economic structure of the
population today. Nevertheless, we use a digitized version of census data for the years 1916 to
1946 to compute changes in population at the municipal level. The results in Table A26 show no
signi�cant discontinuities for any of these measures at the border. Table A27 shows that employing
these changes as additional control variables also does not a�ect our results.
6.4 Local laws and their e�ects
Since 1924, the treated areas in Alsace and Lorraine enjoy the freedom to deviate from certain rules
imposed by the central state. The deviations, known as the local laws, were limited to selected areas
and further diminished over time. Glenn (1974, p.772) stated that, already by the 1970s, �local
doctrine is generally of declining importance. There are few, if any, local jurists remaining (...) and
the local law is taught only in two or three optional courses (...)�. Moreover, French courts refused to
make any reference to German jurisprudence and interpret local laws according to French standards
19Figure A23 shows this does not change much.
32

and principles. Accordingly, the visibility of the laws and their potential in�uence on the salience of
regional �uniqueness� was most likely much higher for the �rst generations after WWII than for more
recent generations. Still, some di�erences exist with regard to a small number of welfare policies
(including payments to sick employees), which remain more generous in Alsace-Lorraine and include
two additional days of vacation. Other di�erences exist with regard to personal bankruptcy law and
the aforementioned voluntary associations.
The sheer existence of this set of local rules can work as a mechanism to maintain regional
identity. In terms of our model, they could increase the salience of items that all people in the
treated area have in common. A potential concern would be if the local laws decisively in�uence a
third factor that drives the measured di�erences in regional identity and is unrelated to occupation
and the suppression of group identity. To test the extent to which the remaining exceptions led to
potentially problematic di�erences in the socio-economic environment, we run RD regressions on all
available municipal level variables that could plausibly be in�uenced by the local laws. This includes
items in the categories work occupations, economic activity, public goods and population density.
In a second step, we assess how these are correlated with our main outcome in the RDD. Table
A18 shows that, for about 25 tests of covariates, only one turns out to be signi�cant when using
the 10 km bandwidth; there seems to be a somewhat smaller number of industrial companies in
the treated area. Based on this, the last two columns show that industrial companies are positively
correlated with agreement in the referenda. Accordingly, while the one signi�cant di�erence could
be coincidental, it would bias against our main results.20
6.5 Other
We discuss four alternative explanations in more detail in the Online Appendix D. Outliers within
Lorraine, could be an issue; large urban agglomerations like Metz historically enjoyed greater au-
tonomy and might have developed a stronger identity. Moreover, people residing in cities are often
diverse and likely to support more European integration for reasons unrelated to regional identity.
Even though we already control for distance to major cities, we also show that excluding munici-
palities belonging to the metropolitan area of Metz does not a�ect our most conservative estimates
within Lorraine. We also discuss the role of the German occupation during WWII, and show why
it does not a�ect the interpretation of our results.
Another aspect in which the local laws di�er from the rest of France is religion. Historically,
the church played a larger role in the average citizen's life in the treated area until after WWI, and
still does, to a smaller degree, today. In contrast to the rest of France, pupils in the area are still
20Another potentially biasing factor in the referenda could be di�erences in European Union fund receipts if thetreated area would receive signi�cantly more money which could directly a�ect the likelihood to vote yes or indirectlythrough potential growth e�ects (Becker et al., 2010). However, the funds are allocated to regions, not départements(the respective categories in the 2014-2020 period are �Lorraine et Vosges - ERDF/ESF� and �Lorraine - RuralDevelopment�). The whole region is responsible for the within-region allocation and there is no reason to assumethat municipalities just right of the former border in the treated area would be awarded more funds. In the 2007-2013period, neither Lorraine nor Alsace were eligible under the convergence, competitiveness or employment objective.For the 2000-2006 period receipts per capita in the treated part of Alsace Lorraine were 100¿ compared to 180¿in the untreated area.
33

subjected to compulsory religious classes at school (usually two hours per week). We show that in
France (for both referenda) there is no relationship between religiosity as well as religious denom-
ination and regional identity or support for the European Union. We also explain why di�erences
in the bene�ts from trade are not a plausible explanation. Finally, we discuss the relative impor-
tance of homogenization policies in strengthening regional identity, and the unsuccessful attempts
to "Germanize" the individuals in the treated area.
7 Concluding remarks
Our paper uses a unique natural experiment that o�ers variation in the exposure to occupation and
the suppression of regional identity within historically homogeneous regions. The setting allows us
to observe both a treated and control area in the same institutional environment today. To the
best of our knowledge, this is the �rst causal evidence of the e�ect of forceful integration and the
often associated homogenization policies on the identity of a suppressed group in their home region.
Studying minority groups within their home region in larger nation-states is relevant for a large
range of regions, not only regions like the Kurdish part in Turkey, Iran, and Iraq, the Xinjiang
Uyghur region in China, Chechnya and Crimea in Russia, but also minority regions in established
democracies like the Basque country and Catalonia in Spain.
Our results show that regional identity, both using stated and revealed preferences, is stronger
today in the treated part of the regions Alsace and Lorraine in France. This is in line with and
complements evidence by Fouka (2018) on the negative e�ect of intrusive homogenization policies on
German immigrants in the United States. In contrast to her study, instead of observing immigrants
as a selected share of the initial population, we capture the full population in their home region. We
show historical evidence that conscious investments in regional identity in the form of establishing
newspapers and parties began already during the treatment period. Our data then allows us to trace
the medium term e�ect in 1969, about 15 years after the end of the treatment, as well as about half
a century later. Our survey data also suggest that a positive treatment e�ect is already visible for
age cohorts who were themselves exposed, as well as for later generations.
Our evidence on potential mechanisms suggest that regionalist parties played an important role,
somehow more so in Alsace than in Lorraine. Within Lorraine, we show that in treated municipalities
households more often subscribe to a regional newspaper, which signals regional attachment and
provides information about regional traditions and culture to both parents and children. Moreover,
we show that a stronger regional identity has important policy implications in line with size-of-
nations models. Treated individuals both express more satisfaction with regional democracy, and
prefer more regional-decision making and a shift of policy competencies about policies like education
to the regional level.
What can we learn from these results for policies and future research? It is important to take into
account to what degree identities constitute substitutes and are perceived as aligned or oppositional.
Our study demonstrates that people with a stronger regional identity do not necessarily have a weaker
34

national identity. We show how this can be integrated into theoretical models using our adapted
conceptualization of common identity, which relies on the salience or weights put on attributes that
an individual has in common with the rest of the group. This de�nition can also explain why there
are strong existing group identities even though actual within-group heterogeneity is larger than
between-group di�erences (Desmet et al., 2017). When people hold multiple identities, whether the
state can impose a new identity depends on the degree to which it is perceived as oppositional to
the existing identity (relating to, e.g., Benjamin et al., 2010; Carvalho and Koyama, 2016).
The results are also important for analyzing separatism and the number and size of nations
(Alesina and Spolaore, 1997), where separatist tendencies are explained by economic, e.g. regional
resources (Gehring and Schneider, 2016), and cultural reasons relating to preference heterogene-
ity. We argue that a common group identity is best modeled as perceived preference homogeneity.
Cases like Catalonia, where central government policies are perceived as discriminatory or repressive
towards a particular region and fuel existing separatist tendencies, suggest a similar mechanism.
Finally, it is important to stress that the strengthening of group identity is not necessarily the
deterministic outcome or natural reaction to suppressive policies. Our model provides some guidance
in that respect. Whether parents or other members of the suppressed groups are willing to invest
in the skills to maintain their traditions depends on the relative utility they derive from their own
group identity and from an overarching common national identity. Central state policies can be so
repressive that existing group identities disappear. Yet, our results also suggest that a joint identity
embracing existing groups can be built up without necessarily replacing existing identities. This,
however, requires the central authority to accept regional identities and an institutional setup that
allows for su�cient regional autonomy.
Bibliography
Akerlof, G. A. and R. E. Kranton (2000): �Economics and Identity,� The Quarterly Journalof Economics, 115, 715�753.
Alesina, A. and B. Reich (2018): �Nation Building and Education,� mimeo.
Alesina, A. and E. Spolaore (1997): �On the Number and Size of Nations,� The QuarterlyJournal of Economics, 112, 1027�1056.
Anderson, M. (1972): �Regional Identity and Political Change: The Case of Alsace from the Thirdto the Fifth Republic,� Political Studies, 20, 17�30.
Bandiera, O., M. Mohnen, I. Rasul, and M. Viarengo (2017): �Nation-Building ThroughCompulsory Schooling During the Age of Mass Migration,� mimeo.
Becker, S. O., K. Boeckh, C. Hainz, and L. Woessmann (2015): �The Empire is Dead,Long Live the Empire! Long-run Persistence of Trust and Corruption in the Bureaucracy,� TheEconomic Journal.
Becker, S. O., P. H. Egger, and M. Von Ehrlich (2010): �Going NUTS: The E�ect of EUStructural Funds on Regional Performance,� Journal of Public Economics, 94, 578�590.
Bénabou, R. and J. Tirole (2011): �Identity, Morals, and Taboos: Beliefs as Assets,� TheQuarterly Journal of Economics, 126, 805�855.
Benjamin, D. J., J. J. Choi, and A. J. Strickland (2010): �Social Identity and Preferences,�American Economic Review, 100, 1913�1928.
35
Besley, T. and M. Reynal-Querol (2014): �The Legacy of Historical Con�ict: Evidence fromAfrica,� American Political Science Review, 108, 319�336.
Bisin, A., E. Patacchini, T. Verdier, and Y. Zenou (2011): �Formation and Persistence ofOppositional Identities,� European Economic Review, 55, 1046�1071.
Bisin, A. and T. Verdier (2010): �The Economics of Cultural Transmission and Socialization,�Handbook of Social Economics, 1, 339�416.
Boix, C., B. Codenotti, and G. Resta (2011): �War, Wealth and the Formation of States,� inPolitical Economy of Institutions, Democracy and Voting, Springer, 45�74.
Bon, F. (1970): �Le Référendum du 27 avril 1969: Suicide Politique ou Necessité Stratégique?�Revue Francaise de Science Politique, 20.
Branscombe, N. R., M. T. Schmitt, and R. D. Harvey (1999): �Perceiving Pervasive Dis-crimination among African Americans: Implications for Group Identi�cation and Well-being.�Journal of Personality and Social Psychology, 77, 135.
Callender, H. (1927): �Alsace-Lorraine Since the War,� Foreign A�airs, 5, 427�437.
Carrol, A. (2010): �Socialism and National Identity in Alsace from Reichsland to République,1890-1921,� European History Quarterly, 40, 57�78.
Carrol, A. and L. Zanoun (2011): �The View from the Border: A Comparative Study ofAutonomism in Alsace and the Moselle, 1918�29,� European Review of History, 18, 465�486.
Carvalho, J. P. and M. Koyama (2016): �Resisting Education,� GMU Working Paper in Eco-nomics No. 13-18.
CEMR (2004): �Hearing on the Draft Treaty Establishing a Constitution for Europe in the EuropeanParliment's Committee on Constitutional A�airs,� Tech. rep., European Associations represent-ing regional and local authorities (AEBR, AER, CEMR, CPMR, EUROCITIES, CALRE andREGLEG).
Chacha, M. (2013): �Regional Attachment and Support for European Integration,� European UnionPolitics, 14, 206�227.
Dell, M. (2010): �The Persistent E�ects of Peru's Mining Mita,� Econometrica, 78, 1863�1903.
Dell, M. and P. Querubin (2017): �Nation Building Through Foreign Intervention: Evidencefrom Discontinuities in Military Strategies,� Quarterly Journal of Economics, 1, 64.
Depetris-Chauvin, E., R. Durante, and F. R. Campante (2018): �Building Nations ThroughShared Experiences: Evidence from African Football,� .
Desmet, K., I. Ortuño-Ortín, and R. Wacziarg (2017): �Culture, Ethnicity and Diversity,�American Economic Review, 107(9), 2479-2513.
Doepke, M. and F. Zilibotti (2017): �Parenting With Style: Altruism and Paternalism inIntergenerational Preference Transmission,� Econometrica, 85, 1331�1371.
Dohmen, T., A. Falk, D. Huffman, and U. Sunde (2012): �The Intergenerational Transmissionof Risk and Trust Attitudes,� The Review of Economic Studies, 79, 645�677.
Egger, P. H. and A. Lassmann (2015): �The Causal Impact of Common Native Language onInternational Trade: Evidence from a Spatial Regression Discontinuity Design,� The EconomicJournal, 125, 699�745.
Fitjar, R. D. (2010): �Explaining Variation in Sub-state Regional Identities in Western Europe,�European Journal of Political Research, 49, 522�544.
Förster, S. (1990): �General-Feldmarschall Helmuth von Moltke und die KriegsgeschichtlichenFolgen des Deutsch-französischen Krieges,� Pariser Historische Studien, 29, 86�91.
Fouka, V. (2017): �How do Immigrants Respond to Discrimination? The Case of Germans in theUS During World War I,� Tech. rep., Mimeo.
��� (2018): �Backlash: The Unintended E�ects of Language Prohibition in US Schools AfterWorld War I,� Stanford Center for International Development Working Paper No. 591.
Fouka, V., S. Mazumder, and M. Tabellini (2017): �From Immigrants to Americans: Race
36

and Assimilation during the Great Migration,� Tech. rep., Mimeo.
Franklin, M. N. (2004): Voter Turnout and the Dynamics of Electoral Competition in EstablishedDemocracies Since 1945, Cambridge University Press.
Fryer Jr., R. G. and P. Torelli (2010): �An Empirical Analysis of Acting White,� Journal ofPublic Economics, 94, 380 � 396.
Gehring, K. and S. Schneider (2016): �Regional Resources and Democratic Secessionism,� ETHand University of Zurich CIS Working Paper Series No. 90.
Gelman, A. and G. Imbens (2017): �Why High-order Polynomials Should not be Used in Regres-sion Discontinuity Designs,� Journal of Business & Economic Statistics, (forthcoming).
Gennaioli, N. and I. Rainer (2007): �The Modern Impact of Precolonial Centralization inAfrica,� Journal of Economic Growth, 12, 185�234.
Giuliano, P. and N. Nunn (2016): �Understanding Cultural Persistence and Change,� NBERWorking Paper No. 23617.
Glenn, H. P. (1974): �Local Law of Alsace-Lorraine, A Half Century of Survival,� Int'l & Comp.LQ, 23, 769�781.
Goodfellow, S. (1993): �From Germany to France? Interwar Alsatian National Identity,� FrenchHistory, 7, 450�471.
Grasser, J.-P. (1998): Une Histoire de l'Alsace, vol. 1, Éditions Jean-Paul Gisserot.
Guiso, L., P. Sapienza, and L. Zingales (2016): �Long-term Persistence,� Journal of the Eu-ropean Economic Association, 14, 1401�1436.
Harp, S. L. (1998): Learning to be Loyal: Primary Schooling as Nation Building in Alsace andLorraine, 1850-1940., De Kalb: Northern Illinois University Press.
Harvey, D. A. (1999): �Lost Children or Enemy Aliens? Classifying the Population of Alsace Afterthe First World War,� Journal of Contemporary History, 34, 537�554.
Hiery, H. (1870): �Wahlen und Wahlverhalten im Reichsland Elsaÿ-Lothringen,� An-gelo Ara/Eberhard Kolb (Hg.): Grenzregionen im Zeitalter der Nationalismen: Elsaÿ-Lothringen/Trient�Triest, 1914, 71�89.
Höpel, T. (2012): �The French-German Borderlands: Borderlands and Nation-building in the 19thand 20th Centuries,� European History Online (EGO).
Hyslop, B. F. (1968): French Nationalism in 1789, According to the General Cahiers, New York:Octagon Books, 1968 [c1934].
Imbens, G. and K. Kalyanaraman (2012): �Optimal Bandwidth Choice for the RegressionDiscontinuity Estimator.� The Review of Economic Studies, 79, 933 � 959.
Johnson, N. D. (2015): �Taxes, National Identity, and Nation Building: Evidence from France,mimeo,� GMU Working Paper in Economics No. 15-33.
Jolly, S. K. (2007): �The Europhile Fringe? Regionalist Party Support for European Integration,�European Union Politics, 8, 109�130.
Kranton, R. E. (2016): �Identity Economics 2016: Where Do Social Distinctions and Norms ComeFrom?� American Economic Review: Papers and Proceedings, 106, 405�09.
Leed, E. J. (1981): No Man's Land: Combat and Identity in World War 1, Press Syndicate of theUniversity of Cambridge.
Lipgens, W. (1964): �Bismarck, die Ö�entliche Meinung und die Annexion von Elsaÿ und Lothrin-gen 1870,� Historische Zeitschrift, 199, 31�144.
Lott, Jr, J. R. (1999): �Public Schooling, Indoctrination, and Totalitarianism,� Journal of PoliticalEconomy, 107, 127�157.
Lowes, S., N. Nunn, J. A. Robinson, and J. L. Weigel (2017): �The Evolution of Cultureand Institutions: Evidence From the Kuba Kingdom,� Econometrica, 85, 1065�1091.
Messerschmidt, M. (1975): Militär und Politik in der Bismarckzeit und im Wilhelminischen
37

Deutschland, vol. 43, Wiss. Buchges.
Michalopoulos, S. and E. Papaioannou (2014): �National Institutions and Subnational Devel-opment in Africa,� The Quarterly Journal of Economics, 129, 151�213.
��� (2016): �The Long-run E�ects of the Scramble for Africa,� American Economic Review, 106,1802�1848.
Nunn, N. and D. Puga (2012): �Ruggedness: The Blessing of Bad Geography in Africa,� Reviewof Economics and Statistics, 94, 20�36.
Ochsner, C. and F. Roesel (2017): �Activating History � The Turkish Sieges of Vienna, Anti-Turkish Campaigns, and the Rise of Right-wing Populism,� mimeo.
Ortega, J. and T. P. Tangerås (2008): �Unilingual versus Bilingual Education: a PoliticalEconomy Analysis,� Journal of the European Economic Association, 6, 1078�1108.
Rohner, D., M. Thoenig, and F. Zilibotti (2013): �Seeds of Distrust: Con�ict in Uganda,�Journal of Economic Growth, 18, 217�252.
Rothenberger, K.-H. (1975): Die Elsass-lothringische Heimat- und Autonomiebewegung Zwis-chen den Beiden Weltkriegen, vol. 42, Herbert Lang.
Scott, A., J. Peterson, and D. Millar (1994): �Subsidiarity: A Europe of the Regions v. theBritish Constitution?� Journal of Common Market Studies, 32, 47�67.
Shayo, M. (2009): �A Model of Social Identity With an Application to Political Economy: Nation,Class, and Redistribution,� American Political Science Review, 103, 147�174.
Silverman, D. P. (1966): �Political Catholicism and Social Democracy in Alsace-Lorraine, 1871-1914,� The Catholic Historical Review, 52, 39�65.
Tabellini, G. (2008): �The Scope of Cooperation: Values and Incentives,� The Quarterly Journalof Economics, 123, 905�950.
Tajfel, H., M. G. Billig, R. P. Bundy, and C. Flament (1971): �Social Categorization andIntergroup Behaviour,� European Journal of Social Psychology, 1, 149�178.
Turner, J. C. (1982): �Towards a Cognitive Rede�nition of the Social Group,� Social Identity andIntergroup Relations, 15�40.
Vajta, K. (2013): �Linguistic, Religious and National Loyalties in Alsace,� International Journalof the Sociology of Language, 2013, 109�125.
Vlachos, S. (2017): �Inglorious Wars and Political Radicalisation,� mimeo.
Voigtländer, N. and H.-J. Voth (2012): �Persecution Perpetuated: The Medieval Origins ofAnti-Semitic Violence in Nazi Germany,� The Quarterly Journal of Economics, 127, 1339�1392.
Wawro, G. (2005): The Franco-Prussian War: The German Conquest of France in 1870-1871,Cambridge University Press.
Zanoun, L. (2009): �Interwar Politics in a French Border Region: the Moselle in the Period of thePopular Front, 1934-1938,� Ph.D. thesis, The London School of Economics and Political Science(LSE).
38

Online Appendix to “The origins of common identity: Division,
homogenization policies and identity formation in Alsace-Lorraine”
Sirus H. Dehdari∗
Uppsala UniversityKai Gehring†
University of Zurich
December 11, 2018
Contents
A Theoretical framework 4
B Descriptives 9
C Overview of repressive policies 17
D Alternative explanations 21D.1 Support driven by urban agglomerations . . . . . . . . . . . . . . . . . . . . . . . . . 21D.2 Religiosity and EU support, relevant for 1992 and 2005 referenda . . . . . . . . . . . 21D.3 Differences in benefits from trade . . . . . . . . . . . . . . . . . . . . . . . . . . . . . 22D.4 The relative importance of homogenization policies . . . . . . . . . . . . . . . . . . . 22D.5 The role of World War II . . . . . . . . . . . . . . . . . . . . . . . . . . . . . . . . . 22D.6 The influence of Germanization . . . . . . . . . . . . . . . . . . . . . . . . . . . . . . 23
E Historical maps 29
F Smoothness/ Balance tests 33
G Referendum 1969 38
H Additional regressions 41
I Placebo regressions 50
J Alternative RDD specifications 54
K Mechanisms: Newspapers & regionalist parties 66
L Twitter 71
M Links: Examples of other suppressed regions 73

List of Tables
A1 Variable description and sources . . . . . . . . . . . . . . . . . . . . . . . . . . . . . 10A2 Survey questions (i.) . . . . . . . . . . . . . . . . . . . . . . . . . . . . . . . . . . . . 11A3 Survey questions (ii.) . . . . . . . . . . . . . . . . . . . . . . . . . . . . . . . . . . . . 12A4 Survey questions (iii.) . . . . . . . . . . . . . . . . . . . . . . . . . . . . . . . . . . . 13A5 Survey questions (iv.) . . . . . . . . . . . . . . . . . . . . . . . . . . . . . . . . . . . 14A6 Descriptive statistics for outcome variables and treatment . . . . . . . . . . . . . . . 16A7 Descriptive statistics for RDD control and pre-treatment variables . . . . . . . . . . 16A8 Detailed Overview of Repressive Policies in Alsace and Lorraine . . . . . . . . . . . . 17A9 Discontinuities in referenda results, within Lorraine, excluding urban agglomeration
Metz . . . . . . . . . . . . . . . . . . . . . . . . . . . . . . . . . . . . . . . . . . . . . 24A10 Newspaper subscription shares: excluding Metz, and discontinuity at language border 25A11 Share of Yes votes and religion, all of France. . . . . . . . . . . . . . . . . . . . . . . 26A12 Placebo test: Border between Alsace and Lorraine, and the rest of France . . . . . . 28A13 Effects at the language border . . . . . . . . . . . . . . . . . . . . . . . . . . . . . . . 28A14 Pre-treatment variables balance test, within Lorraine . . . . . . . . . . . . . . . . . . 33A15 Pre-treatment variables balance test, Alsace and Lorraine . . . . . . . . . . . . . . . 33A16 Division of Powers: Sub-levels of Governance in France . . . . . . . . . . . . . . . . 35A17 Post treatment covariate balancing: 4 main categories . . . . . . . . . . . . . . . . . 36A18 Post-treatment covariate balancing: 25 categories incl. public good provision . . . . 37A19 Survey results, Alsace and Lorraine . . . . . . . . . . . . . . . . . . . . . . . . . . . . 41A20 Overlap strength of regional and European identity in treated and control areas (A+L) 41A21 OIP Survey results, 1999 and 2001: European and regional attachments . . . . . . . 41A22 Survey results: policy preferences, within Lorraine . . . . . . . . . . . . . . . . . . . 42A23 OLS estimates using all municipalities in Alsace and Lorraine . . . . . . . . . . . . . 42A24 Discontinuities in turnout, within Lorraine . . . . . . . . . . . . . . . . . . . . . . . . 43A25 RD results: Turnout, Alsace and Lorraine . . . . . . . . . . . . . . . . . . . . . . . . 44A26 Differences in population changes between 1916-1946 (within Lorraine) . . . . . . . . 44A27 Discontinuities in referenda results, within Lorraine, controlling for historical migration 47A28 Placebo test: Border between Alsace and Lorraine, and the rest of France . . . . . . 50A29 Survey results, comparing border regions with their adjacent neighbors . . . . . . . . 52A30 Placebo test: RD estimates at the pre-1870 border between historical Moselle and
Meurthe, within current Moselle . . . . . . . . . . . . . . . . . . . . . . . . . . . . . 53A31 RD results: Subscription shares of regional newspaper, controlling for the number of
sales points . . . . . . . . . . . . . . . . . . . . . . . . . . . . . . . . . . . . . . . . . 66A32 List of Twitter Keywords . . . . . . . . . . . . . . . . . . . . . . . . . . . . . . . . . 72
2

List of Figures
A1 Threshold costs for teaching regional tradition . . . . . . . . . . . . . . . . . . . . . . 7A2 Timeline of outcomes . . . . . . . . . . . . . . . . . . . . . . . . . . . . . . . . . . . . 15A3 Estimation plots for 1992 and 2005 referenda, within Lorraine . . . . . . . . . . . . . 27A4 Map of Lotharingia around 1000 A.D. . . . . . . . . . . . . . . . . . . . . . . . . . . 29A5 Map of Lotharingia around 1000 A.D., zoomed in with 1870 border . . . . . . . . . . 30A6 Map of Lorraine in the 1378 century . . . . . . . . . . . . . . . . . . . . . . . . . . . 31A7 Map of Lorraine in the 17th century . . . . . . . . . . . . . . . . . . . . . . . . . . . 32A9 Sample from L’Est Republicain showing voting results . . . . . . . . . . . . . . . . . 38A10 Agreement referendum about establishing regions as political entity, 1969 . . . . . . 39A11 Election and referendum results, 1968 and 1969 . . . . . . . . . . . . . . . . . . . . . . . 40A12 The average and standard deviation of critical parameters . . . . . . . . . . . . . . 45A13 Identity differences by age cohort, relative to National identity . . . . . . . . . . . . 46A14 RD plots, within Lorraine (50 kilometers, 20km in paper), 1st degree polynomial . . . . . . 48A16 Departments at the national borders: 1st and 2nd row . . . . . . . . . . . . . . . . 51A17 The average and standard deviation of critical parameters . . . . . . . . . . . . . . 55A18 Estimation plots for 1969 referendum, within Lorraine . . . . . . . . . . . . . . . . . 56A19 Estimation plots, 1969 referendum, controlling for border segments, and distance to
language border . . . . . . . . . . . . . . . . . . . . . . . . . . . . . . . . . . . . . . . 57A20 Estimation plots, 1969 referendum, controlling for longitude, latitude and their in-
teraction . . . . . . . . . . . . . . . . . . . . . . . . . . . . . . . . . . . . . . . . . . . 58A21 Estimation plots for 1992 and 2005 referenda, whole border . . . . . . . . . . . . . . 59A22 Estimation plots for 1992 and 2005 referenda, no controls . . . . . . . . . . . . . . . 60A23 Estimation plots, controlling for longitude and latitude . . . . . . . . . . . . . . . . . 61A24 Estimation plots, controlling for longitude, latitude and their interaction . . . . . . . 62A25 Estimation plots for 1992 and 2005 referenda, controlling for border segments . . . . 63A26 Estimation plots for 1992 and 2005 referenda, controlling for border segments (within
Lorraine) . . . . . . . . . . . . . . . . . . . . . . . . . . . . . . . . . . . . . . . . . . 64A27 Estimation plots, controlling for distance to language border . . . . . . . . . . . . . . 65A28 RD plot, share of households with subscription of “Le Republicain Lorraine”, 2nd
degree polynomial . . . . . . . . . . . . . . . . . . . . . . . . . . . . . . . . . . . . . 66A29 Newspaper subscription shares . . . . . . . . . . . . . . . . . . . . . . . . . . . . . . 67A30 Subscription page Le Republicain Lorraine (1) . . . . . . . . . . . . . . . . . . . . . 68A31 Subscription page Le Republicain Lorraine (2) . . . . . . . . . . . . . . . . . . . . . 68A32 Homepage (main) Le Republicain Lorraine . . . . . . . . . . . . . . . . . . . . . . . . 69A33 Homepage (regional) Le Republicain Lorraine . . . . . . . . . . . . . . . . . . . . . . 69A34 Vote shares of regionalist parties . . . . . . . . . . . . . . . . . . . . . . . . . . . . . 70
3

A Theoretical framework
The common identity of an individual i and a group j ∈ {R,N} = J , with R and N correspondingto Region and Nation, depends on the perceived distance to the average group member:
hi,j = 1−
(∑k∈K
ωk(pik − p
jk)
2
)1/2
,
where pik represents the preferences (or traditions, values and norms) of individual i regarding an
attribute indexed k, pjk represents the preferences of the average member of the region or the nation,and K is the set of all attributes. An important part of this heterogeneity function are the ωk, whichcan be understood as attention weights. Higher weights indicate that the tradition, value or normk has a larger influence on the strength of common identity.
Assume for simplicity that the attributes in K can be categorized in a number of subsets: KR,KN , and Ko. KR are those attributes that the individual has in common with the other peoplein his region, for instance speaking the local dialect or in Alsace cooking the local specialty “tarteflambee”. The vector ωR comprises of the weights for all attributes belonging to KR. For theseattributes, we assume pi − pR = 0, meaning that individuals within a region share the attributes.1
We use the scalar ωR =∑
k∈KRωk as the sum of all weights put on common regional culture.
KN are the attributes that the individual has in common with the rest of the nation. In France,consider common history or traditions that are widely shared, for instance celebrating the 14th ofJuly, the French language or French cuisine. As with regional attributes, the scalar ωN =
∑k∈KN
ωkis the sum of all weights put on national culture. The remaining attributes are represented by Ko
and are neither clearly aligned with the region nor the nation, for example preferences about socialor economic questions that show a lot of variation both within regions and nations. Other identitiesrelating to, for instance, their municipality can also be thought of as based on attributes containedin Ko, but we focus on regional and national identity as the main distinction between treated andcontrol area. All weights sum up so that ωo +
∑j∈J ωj = 1, where ωo is the sum of the weights put
on the remaining attributes.2
Regional agents, for instance parents, but also other regional citizens, decide whether and howmuch to invest in influencing the identity formation of children. They do so by maximizing theexpected utility that future generations derive from their regional and national identity. We choosea specific functional form for the sake of easier exposition and drop the i subscript for individuals,as we focus on differences between people in the treated and untreated area, equivalent to usingone representative citizen for each area. Hence, we can write the utility of a regional agent basedon the weights of future generations as
U = ωαR + ωαN − C,
1 This is a simplifying assumption that makes the following comparisons much clearer. One could instead define theset of common regional or national attributes as those with a distance lower than some positive threshold value.
2 We assume the p’s to be fixed, and only ω to vary. In other words, we assume that perceived distance to other groupmembers rests on underlying differences which an individual herself cannot influence. Of course, there are exceptionsin reality but it is also true that many attributes that are crucial for common identities rest on such factors like placeof birth, joint mother tongue or skin color. What varies is whether these differences are relevant when individualsassess their degree of common identity with a particular group. Take for instance the controversial case of Crimeain Ukraine: Before the tensions between Russia and the Ukraine there was no strong separatist movement in theregion. Russia’s claim to the region is based on the existence of a Russian speaking minority and a common history,and an important policy aim was to increase the salience of these attributes among people in the region.
4

with 0 < α < 12 . This means that a positive utility is assigned to individuals sharing the regional
identity (ωR), but the potential benefits of alignment with the rest of the nation is also taken intoaccount (ωN ), as argued above. We assume α to be the same for both identities but this could easilybe adapted. Accordingly, both identities are to some degree substitutes, but the optimal choice willusually be to possess some regional and some national identity as α < 1
2 . As we describe below indetail, it is costly for regional agents to actively be involved in influencing individuals’ identities.For simplicity, this cost is modeled as C. Our analytical results would hold, however, also with anycost function that has a fixed cost component.
The transmission of weights (ωR and ωN ) is influenced by investment in regional identity andpublic schooling. Hence, the ωj of an individual is a function of the traditions regional agents choseto transmit and the traditions transmitted via public schooling. Just like regional agents, publicschooling can spend time on teaching both regional and national culture, as well as on other subjects
unrelated to identity. The weights of an individual when growing up are then formed as ωj =tPj +tSj
2for j = {R,N}, with tPj and tSj denoting the investments made by the regional community (i.e., by
parents and other regional actors) and public schooling by the central nation-state. Let tSR+tSN ≤ 1,but in most situations it is more realistic to think of it as smaller that one as schooling also spendstime on teachings subjects like math or sciences. For regional agents, we assume tPR + tPN = 1for simplicity if the benefits from transmitting regional or national culture exceeds the costs, asdiscussed below. The total amount of investments in transmitting regional identity decides themagnitude of the sum of the weights ωR and ωN , which translates into the weights individuals willput on these sets of attributes and the strength of their identities.3
When regional agents choose tPR and tPN . they weight the benefits of transmitting regional or na-tional culture against a (fixed) costs CPj τj ≥ 0. Take for instance the ability to teach regional musicor dances to children. Parents need to learn the text or moves and how to convey this information orskill, which is an important fixed cost. Alternatively, consider the foundation of a regionalist party:regional agents need to make an initial investment in the appropriate organizational structure andphysical infrastructure for the party to function. Accordingly, we make one central, but plausible,assumption. Individuals who engaged in actively practicing a tradition themselves within their ownfamily inherit the ability to teach it to their own children. This means that if one generation paidthe fixed costs, the next generations do not have to bear the fixed cost component of learning howto transmit the tradition. This argument is maybe even more obvious when considering regionalorganizations, like regionalist parties, clubs or newspapers or other associations. All of those clearlyhave a fixed cost component of being established. Even if there is some depreciation, the nextgeneration(s) will face lower costs if the older generations did already set up these organizations.Accordingly, τj = 0 if individuals were themselves exposed to tPj > 0.4
The (fixed) cost of influencing identity for regional agents is then given by the following costfunction:
C = C(tPR, 1− tPR) =
CPR τR if tPR = 1
CPNτN if tPN = 1
CPR τR + CPR τR if 0 < tPR < 1
0 if tPR = tPN = 0
If time is the limiting factor, transmitting one tradition also creates opportunity costs reflecting less
3 This means that all attributes belonging to ωj (for j ∈ {R,N}), receives equal weights of ωj/|Kj |. The weight puton the remaining attributes is given by ωo = 1− ωR − ωN .
4 The complete notation including the subscript i for individuals is τj = 1[i ∈ T ], ∀i ∈ I and T ⊂ I. I is the set of allindividuals, and T is the subset of individuals that did not inherit the ability to transmit j culture.
5

time spent on transmitting other traditions. With the public schooling parameter selected by thecentral nation-state exogenously given, plugging in the expressions for the weights into the utilityfunction maximized by the regional agents gives
U(tPR, 1− tPR) =
(tPR + tSR
2
)α+
((1− tPR) + tSN
2
)α− C(tPR, 1− tPR)
= B(tPR, 1− tPR)− C(tPR, 1− tPR),
where B(tPR, 1−tPR) is the benefit from transmitting traditions. The optimal choice of regional agentsis a function of the degree to which regional and national culture is taught by the public schoolingsystem, the utility they derive from both identities and the costs associated with transmission. This
leads to an optimal investment of tPR∗
=(
1+tSN−tSR
2
), conditional on being incentive-compatible, i.e.
if the utility from transmitting the optimal level exceeds the utility from not transmitting at all. LetB(tPR, 1−tPR) = B(tPR, 1−tPR)−B(0, 0) denote this excess utility. The first number in the parentheseshere and in the following refers to regional traditions, and the second number to national traditions.Consider four different cases:
Case 1 If B(tPR∗, 1 − tPR
∗) ≥ C(tPR
∗, 1 − tPR
∗) for 0 < tPR
∗< 1, then tPR = tPR
∗=(
1+tSN−tSR
2
)and
tPN = tPN∗
= 1−(
1+tSN−tSR
2
). This means that regional agents will invest in transmitting both
regional and national traditions.
Case 2 If B(tPR∗, 1 − tPR
∗) < C(tPR
∗, 1 − tPR
∗) and U(1, 0) > U(0, 1), and B(1, 0) ≥ C(1, 0), then
tPR = 1 and tPN = 0. This means the regional agents will only invest in transmitting regionaltraditions.
Case 3 If B(tPR∗, 1 − tPR
∗) < C(tPR
∗, 1 − tPR
∗) and U(1, 0) < U(0, 1), and B(0, 1) ≥ C(0, 1), then
tPR = 0 and tPN = 1. This means that regional agents will only invest in transmitting nationaltraditions.
Case 4 If U(0, 0) = maxU(tPR, 1− tPR), then tPR = tPN = 0. This means the regional agents will notinvest anything in transmitting any traditions.
Figure A1 shows the distribution of costs for which it is optimal for regional agents to invest ininfrastructure that facilitates the transmission of regional traditions and culture. A decrease in tSRmakes transmitting regional traditions the best choice for agents along a larger range of parametervalues. We can use this framework to analyze the natural experiment, which can best be describedin the three stages introduced in the paper.
Stage 1
In the first stage, public schooling policy is identical in both areas. regional agents decide to investeither in emphasizing regional or national traditions, both traditions, or none of them. The optimalchoice of transmission depends on i) the nation-state’s public investment in teaching regional andnational traditions, and ii) the cost of learning to influence and transmit regional and nationaltraditions. For public investments tSR,stage1, tSN,stage1, there exist costs CPR > CPR,stage1 and CPN >
CPN,stage1 such that regional agents decide not to invest in teaching any traditions, where CPR and
CPN are the maximum allowed (threshold) costs for regional agents to invest time in regional andnational traditions, respectively. Regional agents invest time if the costs of doing so are lower than
6

Figure A1: Threshold costs for teaching regional tradition
0.0
0.2
0.4
0.6
0.8
0.0 0.1 0.2 0.3 0.4 0.5Public investment in regional tradition
Thr
esho
ld c
ost f
or r
egio
nal t
radi
tion
Notes: The solid black line indicates the threshold costs CPR of investments in transmiting regional culture and traditions. The
gray area represents those parameter constellations where the costs are lower than the threshold costs, so that regional agentswill invest in transmitting regional traditions. The less regional traditions are taught in public schools, the higher the costsreginal agents are willing to pay to maintain regional culture and traditions.
the threshold cost CPR,stage1 and CPN,stage1 for the respective traditions. We assume that in the firststage, the costs are above the threshold in the treated and control area so that parents decide notto learn and teach privately.
Stage 2
After occupation and reflecting the intrusive policies, public schooling in the treated area does notteach regional traditions any more, so that tSR,stage2 = 0 in the treated region. This increases thethreshold cost and it is now optimal for parents to invest in teaching regional traditions for a largerrange of costs CPR . As national traditions are still taught to a high degree by the state, regional agentsdecide to spend all their time teaching and transmitting regional traditions and tPR,stage2 = 1. In thecontrol area there was no comparable shock, and public and private investments remain unchanged.
Stage 3
In the third stage, the temporary shock is over and tSR,stage3 reverts to the same level in both thetreated and the untreated area. If nation-state public investment in regional traditions reverts backto a high enough level, for instance comparable to stage 1, regional agents in the untreated areaare not willing to bear more costs of learning the regional traditions as CPR > CPR,stage3. However,if regional traditions were taught and transmitted in the treated area during stage 2, for instancethrough regional organizations, regional agents in the area do not have to bear the fixed costs(τj = 0) and they choose tPR = tPR
∗> 0. Accordingly, a higher level of teaching regional culture
can persist after the shock is over. This difference persists for the first generation; its long termpersistence depends on whether tPj > 0, i.e. regional agents put enough value and time on regionalculture so that their children acquire and imitate this behavior.
Note: Our model does not rule out that central-states can be successful in completely eradicatingregional culture and identity. If the benefits from national identity are high enough (or the costsof not having it sufficiently), regional agents would rationally decide not to invest in maintainingregional traditions. Another, more positive, possibility that could easily be integrated is the degreeto which national and regional identity are perceived as oppositional. If the central state chooses lessintrusive measures of integration, like better infrastructure, bilingual teaching or better transport
7

connections, both regional and national identity could persist and prosper. There is a theoreticalupper limit due to time and monetary constraints, but those constraints do not seem to be majorfactors explaining identity conflicts in contrast to aspects where two identities seem incompatible.France provides a good example of that. After the central state relaxed its policies in the 1950s,reported tensions disappeared and our results show that national identity is equally strong in thetreated and untreated area today, even though regional identity is stronger in the treated area.
8

B Descriptives
9

Table A1: Variable description and sources
Variable Definition Source
Dependent VariablesShare Yes 1969 Share of Yes votes in the 1969 constitutional referendum L’Est RepubblicainShare Yes 1992 Share of Yes votes in the 1992 referendum (Maastricht Treaty) Centre de donnees socio-politiques (CDSP)Share Yes 2005 Share of Yes votes in the 2005 referendum (European Constitution Treaty) Centre de donnees socio-politiques (CDSP)Turnout, 1969 Voter turnout in the 1969 constitutional referendum L’Est RepubblicainTurnout, 1992 Voter turnout in the 1992 referendum (Maastricht Treaty) Centre de donnees socio-politiques (CDSP)Turnout, 2005 Voter turnout in the 2005 referendum (European Constitution Treaty) Centre de donnees socio-politiques (CDSP)Subscription regional newspaper Subscriptions to ”Le Republicain Lorraine”/No.households in 2014 Le Republicain LorraineShare Tweets Germany Number of tweets about Germany during the 2014 World Cup TwitterShare Tweets France Number of tweets about France during the 2014 World Cup Twitter
Pre-treatment variablesRuggedness Index of variance of elevation in each municipality Global elevation data setElevation Raw elevation data NASA SRTM data setPotato Soil suitability for production of potatoes (medium input intensity and irrigation) IIASA/FAO, 2012Wheat Soil suitability for production of wheat (medium input intensity and irrigation) IIASA/FAO, 2012Barley Soil suitability for production of barley (medium input intensity and irrigation) IIASA/FAO, 2012
CovariatesMedian income Median income in 2008 INSEEMean age Mean age in 2006 INSEEEducation Share of people with a high school degree INSEEOccupation Share of blue-collar workers INSEEWorkers, 2006 Share of workers in 2006 INSEEFarmers, 2006 Share of farmers in 2006 INSEEArtisans, 2006 Share of artisans in 2006 INSEEExecutives, 2006 Share of executives in 2006 INSEEIntermediate prof., 2006 Intermediate professionals in 2006 INSEECompanies, 2011 Number of companies per capita in 2011 INSEECommercial est., 2011 Number of commercial establishments per capita in 2011 INSEEIndustrial est., 2011 Number of industrial establishments per capita in 2011 INSEEBuilding est., 2011 Number of building establishments per capita in 2011 INSEEPublic est., 2011 Number of public establishments per capita in 2011 INSEETheatre rooms, 2013 Number of theatre rooms per capita in 2013 INSEEAthletic centers, 2013 Number of athletic centers per capita in 2013 INSEEMultisport fac., 2013 Number of multisport facilities per capita in 2013 INSEESwimming fac., 2013 Number of swimming facilities per capita in 2013 INSEEPsychiatric est., 2013 Number of psychiatric establishments per capita in 2013 INSEEService houses, 2013 Number of service houses per capita in 2013 INSEEHealth care, 2013 (short) – INSEEHealth care, 2013 (medium) – INSEEHealth care, 2013 (long) – INSEEPost offices, 2013 Number of post offices per capita in 2013 INSEEElementary schools, 2013 Number of elementary schools per capita in 2013 INSEEHigh schools, 2013 Number of high schools per capita in 2013 INSEEVocational training, 2013 Number of secondary schools with vocational training per capita in 2013 INSEETech. vocational training, 2013 Number of secondary schools with technical vocational training per capita in 2013 INSEE
Notes: Variable description and source for all variables used in the paper and this Online Appendix. XXX
10

Table A2: Survey questions (i.)
Variable Question Categories/Scale Source
Regional identity ”Could you tell me whether youfeel very attached, rather
attached, not very attached or notattached at all to [name of
region]?”
4 = very attached; 3 = ratherattached; 2 = not very attached; 1
= not attached at all
OIP 99/2001Q2a3
National identity ”Could you tell me whether youfeel very attached, rather
attached, not very attached or notattached at all to France?”
4 = very attached; 3 = ratherattached; 2 = not very attached; 1
= not attached at all
OIP 99/2001Q2a2
European identity ”Could you tell me whether youfeel very attached, rather
attached, not very attached or notattached at all to Europe?”
4 = very attached; 3 = ratherattached; 2 = not very attached; 1
= not attached at all
OIP 99/2001Q2a1
Regional relative to National identity (standardized) Relation of two identities,standardized with standard
deviation 1 and mean 0
OIP 99/2001
European relative to national identity (standardized) Relation of two identities,standardized with standard
deviation 1 and mean 0
OIP 99/2001
Democrazy works well within France ”Personally, do you reckon thedemocracy in France to function
very well, fairly well, not very wellor not well at all?”
4 = very well; 3 = fairly well;2 = not very well; 1 = not well at
all
OIP 99/2001Q4
I feel well informed about regional policies ”You personally, do you thinkthat you are well or badly
informed about the actions of theregional council of [name of
region]?”
4 = very well; 3 = rather well;2 = rather badly; 1 = very badly
OIP 99/2001Q14
Democary works well within the region ”And in [name of region], do youreckon the democracy to function
very well, fairly well, not very wellor not well at all?”
4 = very well; 3 = fairly well;2 = not very well; 1 = not well at
all
OIP 99/2001Q5
I am concerned regional administration would increase interregional inequality ”If the region takes action in allthose domaines instead of the
state, are you concerned aboutthe development of interregional
inequality?”
4 = Yes, very much so; 3 = Yes,somewhat; 2 = No, not very
much; 1 = No, not at all
OIP 2003Q11a2
Notes: Description of survey questions from the Observatoire Interregional du Politique (OIP) 1999 and 2001. The values of the categories are reversed compared to theoriginal question categories. Questions were originally in French and have been translated.
11

Table A3: Survey questions (ii.)
Variable Question Categories/Scale Source
Power Transfer Region ”Are you in favor of the transfer of all the power andmeans of the state to the regions?”
(Average across 10 policy dimensions)
Value between 1 and 4.4 = ”Strongly in favor” and 1 = ”Strongly against”
1 ”Are you in favor of the transfer of all the power and meansof the state to the regions regarding the choice in setting up
high schools?”
4 = Strongly in favor; 3 = Somewhat in favor;2 = Somewhat against; 1 = Strongly against
OIP2001Q36a1
2 ”Are you in favor of the transfer of all the power and meansof the state to the regions regarding the management of high
school teachers?”
4 = Strongly in favor; 3 = Somewhat in favor;2 = Somewhat against; 1 = Strongly against
OIP2001Q36a2
3 ”Are you in favor of the transfer of all the power and meansof the state to the regions regarding the management of
administrative personnel in high schools?”
4 = Strongly in favor; 3 = Somewhat in favor;2 = Somewhat against; 1 = Strongly against
OIP2001Q36a3
4 ”Are you in favor of the transfer of all the power and meansof the state to the regions regarding the definition of school
programmes and certificates?”
4 = Strongly in favor; 3 = Somewhat in favor;2 = Somewhat against; 1 = Strongly against
OIP2001Q36a4
5 ”Are you in favor of the transfer of all the power and meansof the state to the regions regarding the choice in setting up
university centers in the region?”
4 = Strongly in favor; 3 = Somewhat in favor;2 = Somewhat against; 1 = Strongly against
OIP2001Q36a5
6 ”Are you in favor of the transfer of all the power and meansof the state to the regions regarding the choice of high school
creation?”
4 = Strongly in favor; 3 = Somewhat in favor;2 = Somewhat against; 1 = Strongly against
OIP2001Q36a6
7 ”Are you in favor of the transfer of all the power and meansof the state to the regions regarding evironmental policies like
water policy?”
4 = Strongly in favor; 3 = Somewhat in favor;2 = Somewhat against; 1 = Strongly against
OIP2001Q36a7
8 ”Are you in favor of the transfer of all the power and meansof the state to the regions regarding cultural policies like
heritage conservation?”
4 = Strongly in favor; 3 = Somewhat in favor;2 = Somewhat against; 1 = Strongly against
OIP2001Q36a8
9 ”Are you in favor of the transfer of all the power and meansof the state to the regions regarding sport policies?”
4 = Strongly in favor; 3 = Somewhat in favor;2 = Somewhat against; 1 = Strongly against
OIP2001Q36a9
10 ”Are you in favor of the transfer of all the power and meansof the state to the regions regarding the support of social
housing?”
4 = Strongly in favor; 3 = Somewhat in favor;2 = Somewhat against; 1 = Strongly against
OIP2001Q36a10
Notes: Description of survey questions from the Observatoire Interregional du Politique (OIP) 2001. The values of the categories are reversed compared to the originalquestion categories. Questions were originally in French and have been translated.
12

Table A4: Survey questions (iii.)
Variable Question Categories/Scale Source
Autonomy Region ”Could you tell me whether reforms empowering theregional councils are a very good thing, a rather goodthing, a rather bad thing or a very bad thing for the
years to come?”(Average across 5 areas)
Value between 1 and 4.1 = ”It’s a very bad thing.” and 4 = ”It’s very good thing.”
1 ”Here are a certain number of reforms that are under way orunder discussion. Could you tell me, for each one of these,
whether it is a very good thing, a rather good thing, a ratherbad thing or a very bad thing for the years to come? -
Authorizing the regional councils to adapt the national laws andregulations in their respective regions, under the control of the
Parliament.”
4 = A very good thing; 3 = A rather good thing;2 = A rather bad thing; 1 = A very bad thing
OIP2001Q35a1
2 ”Here are a certain number of reforms that are under way orunder discussion. Could you tell me, for each one of these,
whether it is a very good thing, a rather good thing, a ratherbad thing or a very bad thing for the years to come? -
Authorizing the regional councils to negotiate and manage theEuropean funding without state involvement.”
4 = A very good thing; 3 = A rather good thing;2 = A rather bad thing; 1 = A very bad thing
OIP2001Q35a2
3 ” Here are a certain number of reforms that are under way orunder discussion. Could you tell me, for each one of these,
whether it is a very good thing, a rather good thing, a ratherbad thing or a very bad thing for the years to come? - Giving
the regional councils more freedom in deciding over theirfinancial resources without depending on the state.”
4 = A very good thing; 3 = A rather good thing;2 = A rather bad thing; 1 = A very bad thing
OIP2001Q35a3
4 ”Here are a certain number of reforms that are under way orunder discussion. Could you tell me, for each one of these,
whether it is a very good thing, a rather good thing, a ratherbad thing or a very bad thing for the years to come? -Developing the study of regional languages at school.”
4 = A very good thing; 3 = A rather good thing;2 = A rather bad thing; 1 = A very bad thing
OIP2001Q35a4
5 ”Here are a certain number of reforms that are under way orunder discussion. Could you tell me, for each one of these,
whether it is a very good thing, a rather good thing, a ratherbad thing or a very bad thing for the years to come? - Assigning
new fields of competence to the regional councils.”
4 = A very good thing; 3 = A rather good thing;2 = A rather bad thing; 1 = A very bad thing
OIP2001Q35a5
Notes: Description of survey questions from the Observatoire Interregional du Politique (OIP) 2001. The values of the categories are reversed compared to the originalquestion categories. Questions were originally in French and have been translated.
13

Table A5: Survey questions (iv.)
Variable Question Categories/Scale Source
Education Region ”Are you in favor of the transfer of all the powerand means of the state to the regions regarding
education policy and standards?” (Average across5 questions)
Value between 1 and 4.1 = ”Strongly against” and 4 = ”Strongly in favor”
1 ”Are you in favor of the transfer of all the power andmeans of the state to the regions in the following field: -
The choice in setting up high schools?”
4 = Strongly in favor; 3 = Somewhat in favor;2 = Somewhat against; 1 = Strongly against
OIP2003Q12a1
2 ”Are you in favor of the transfer of all the power andmeans of the state to the regions in the following field: -
The management of high school teachers?”
4 = Strongly in favor; 3 = Somewhat in favor;2 = Somewhat against; 1 = Strongly against
OIP2003Q12a2
3 ”Are you in favor of the transfer of all the power andmeans of the state to the regions in the following field: -
The management of administrative personnel in highschools?”
4 = Strongly in favor; 3 = Somewhat in favor;2 = Somewhat against; 1 = Strongly against
OIP2003Q12a3
4 ”Are you in favor of the transfer of all the power andmeans of the state to the regions in the following field: -
The definition of school programmes and certificates?”
4 = Strongly in favor; 3 = Somewhat in favor;2 = Somewhat against; 1 = Strongly against
OIP2003Q12a4
5 ”Are you in favor of the transfer of all the power andmeans of the state to the regions in the following field: -
The choice in setting up university centers in the region?”
4 = Strongly in favor; 3 = Somewhat in favor;2 = Somewhat against; 1 = Strongly against
OIP2003Q12a5
Opinion on Democracy in EU ”And in the European Union, do you consider democracyto work very well, rather well, not very well or not well at
all?”
4 = Very well; 3 = Rather well; 2 = Not very well; 1 =Not well at all
OIP 2000 Q10
Opinion on France in EU ”Generally, do you think that fact that France is part ofthe European Union is a good or a bad thing?”
1 = Good thingl; 0 = Bad thingPEF 2002 V2
Q242
Opinion on Regional Council ”Would you say that the project of the Regional Councilof [respondent’s region] is going more in the right or more
in the wrong direction?”
1 =Right direction; 0 = Wrong directionOIP 99/2001
Q9/Q10
Notes: Description of survey questions from International Social Survey Programme (ISSP) 2003, National Identity (II), and ISSP 2004, Citizenship, and the ObservatoireInterregional du Politique (OIP) 2003. The values of the categories are reversed compared to the original question categories. Questions were originally in French and havebeen translated.
14

Figure A2: Timeline of outcomes
1789
1874
1912
1969
1972
1992
1999
2001
2003
2005
2007
2014
2015
Louis XVI assesses his citizens' loyalty in the Cahiers dedoléances. Results reveal that there is no pre-treatmentdi�erence in regional identity in the treatment and con-trol area.
New regionalist parties emerge and gather between 30%and 98% of votes in Reichstag elections during this pe-riod.
Referendum on decentralization, explicitly strengtheningthe political role of regions in the constitution; held bypresident Charles de Gaulle.
Referendum on EC enlargment. The EC as a precessorof the EU is seen as an actor fostering the autonomy ofregions.
Referendum on the Treaty of Maastricht, introducing thecodi�ed aim of decision making at the lowest administra-tive level feasible, thereby strengthening the autonomy ofregions.
Large scale evidence from the Observatoire Interrégionaldu Politique surveys indicates stronger common regionalidentities in the treated area.
Referendum on the "Constitution of Europe", strengthen-ing the role of regional authorities.
National election, where vote shares for the nationalistparty "Front National" proxies national identity.
Data on subscriptions to a local newspaper proxy regionalidenti�cation.
Regional elections, where vote shares of regionalist partiesdisplay political regionalism.
Notes: Distances on the straight parts of the timeline are proportional to years. The curled line is proportional to five yearsand the zigzag line is proportional to 25 years.
15

Table A6: Descriptive statistics for outcome variables and treatment
Variable Mean Std. dev. Min. Max.
Treatment 0.52 0.50 0.00 1.00Yes 69 59.69 14.28 5.65 94.74Yes 92 53.91 11.39 0.00 86.25Yes 05 45.51 9.96 6.67 81.01Newspaper subscriptions 14.62 7.63 0.00 32.90Turnout 69 84.59 7.56 7.41 100.00Turnout 92 74.40 6.04 52.44 100.00Turnout 05 73.28 6.40 50.79 100.00
Notes: Descriptive statistics for the binary treatment variable, Share Yes 1969, Share Yes 1992 and Share Yes 2005, in therespective referenda, and share of newspaper subscriptions, whereas Turnout 1969, 1992, and 2005, refers to turnout in therespective year.
Table A7: Descriptive statistics for RDD control and pre-treatment variables
Variable Mean Std. dev. Min. Max.
Distance to Metz 83.47 44.39 1.60 203.16Distance to Strasbourg 107.53 50.32 0.02 223.02Distance to Nancy 73.97 34.89 0.06 164.98Distance to Germany 50.87 35.48 0.33 141.55Elevation 300.51 119.71 110.12 1045.90Ruggedness 0.73 0.68 0.01 5.18Potato 7091.57 474.12 3665.80 7848.00Wheat 6104.37 326.52 3873.60 6687.00Barley 6099.83 323.85 3873.6 6687Median income 2008 31.56 6.00 17.69 53.55Mean age 2006 39.60 3.01 28.26 63.07Education 1999 0.20 0.07 0.00 0.58Occupation 2006 0.19 0.07 0.00 0.50
Notes: Descriptive statistics for variables used as covariates (for variables used in the main paper) and pre-treatmentvariables. Distances are in kilometers. Potato and wheat refer to the suitability of the soil to grow the respective crop,based on FAO data. Other variables were chosen with the aim to have the date date closest to our main outcome variables.
16

C Overview of repressive policies
Table A8: Detailed Overview of Repressive Policies in Alsace and Lorraine
Time Period Ruled By Policy Policy Category Source
1871-1902 GermanyReactivation of the 1849 “dictatorship paragraph”:
permitted house searches, the expulsion of agitatorsand prohibiting political organizations.
Social, political, militaryfreedom, equality
Carrol (2010);Grasser (1998)
Beginning1871/72
Germany
Bismarcks Kulturkampf : government seriouslyrestricted Catholic education as well as the Catholicpress. Moreover, some religious orders were expelled
from the Reichsland.
Regional institutions andadministrative personnel
Silverman (1966)
May 1872 GermanyStrasbourg University is reopened as
“Kaiser-Willhelm-Universitaet”.Language Hopel (2012)
Oct. 1872 Germany Introduction of obligatory military service.Social, political, military
freedom, equalityGrasser (1998)
1873 Germany French is prohibited to be taught in schools. Language Grasser (1998)
1878 GermanyLegislation to restrict the political participation of
the people.Social, political, military
freedom, equalityCarrol (2010)
1882 Germany The use of French is prohibited in the Delegation. Language Grasser (1998)
1887 GermanyChoral and gymnastic societies are banned as they
are seen as opportunities for the coming-together ofpro-French minded people.
Social, political, militaryfreedom, equality
Carrol (2010)
1890 onward GermanyUnwelcome legislation (e.g. German trade
regulations) is introduced in Alsace-Lorraine.Regional institutions andAdministrative Personnel
Hopel (2012)
1890 onward GermanyGerman becomes the only official language anddistrict and county councils become obliged to
embrace German as their only language.Language Grasser (1998)
Until 1898 Germany Restrictions are imposed on the press. Media Silverman (1966)
1914 GermanyCitizens sympathizing with the French are taken in
“protective detention” without trial.
Separation and segregation;Social, political, military
freedom, equalityHarvey (1999)
17
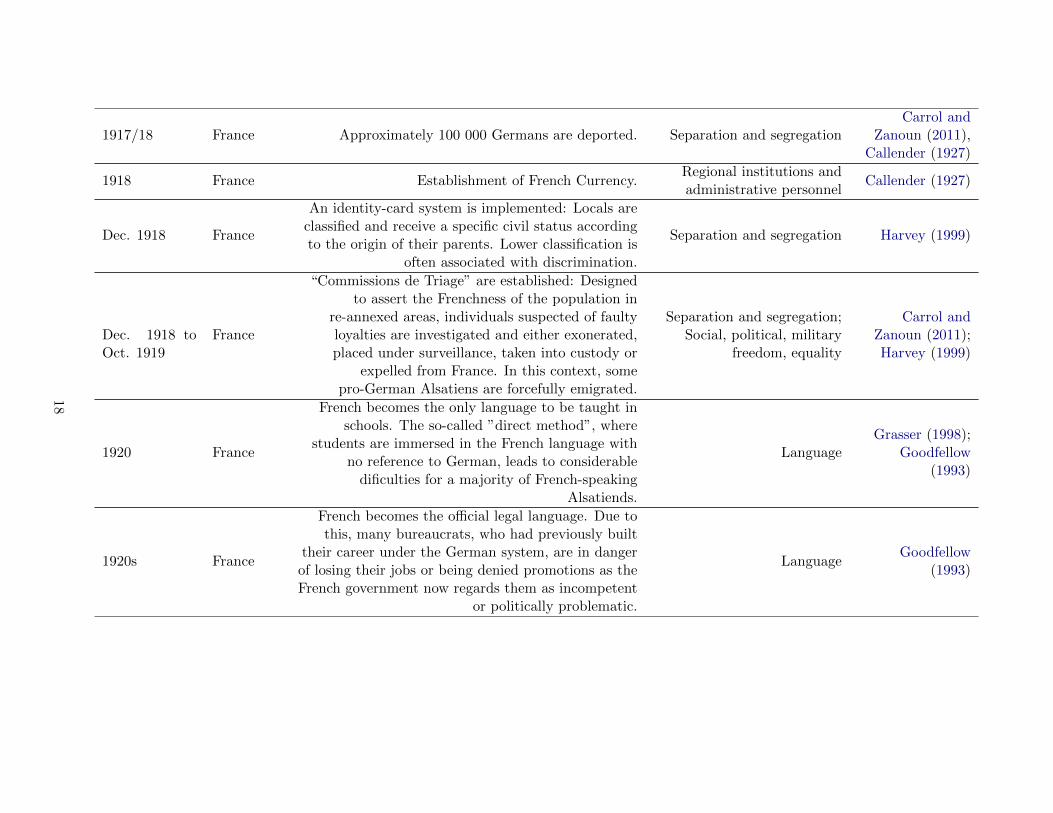
1917/18 France Approximately 100 000 Germans are deported. Separation and segregationCarrol and
Zanoun (2011),Callender (1927)
1918 France Establishment of French Currency.Regional institutions andadministrative personnel
Callender (1927)
Dec. 1918 France
An identity-card system is implemented: Locals areclassified and receive a specific civil status accordingto the origin of their parents. Lower classification is
often associated with discrimination.
Separation and segregation Harvey (1999)
Dec. 1918 toOct. 1919
France
“Commissions de Triage” are established: Designedto assert the Frenchness of the population in
re-annexed areas, individuals suspected of faultyloyalties are investigated and either exonerated,placed under surveillance, taken into custody or
expelled from France. In this context, somepro-German Alsatiens are forcefully emigrated.
Separation and segregation;Social, political, military
freedom, equality
Carrol andZanoun (2011);Harvey (1999)
1920 France
French becomes the only language to be taught inschools. The so-called ”direct method”, where
students are immersed in the French language withno reference to German, leads to considerable
dificulties for a majority of French-speakingAlsatiends.
LanguageGrasser (1998);
Goodfellow(1993)
1920s France
French becomes the official legal language. Due tothis, many bureaucrats, who had previously built
their career under the German system, are in dangerof losing their jobs or being denied promotions as theFrench government now regards them as incompetent
or politically problematic.
LanguageGoodfellow
(1993)
18
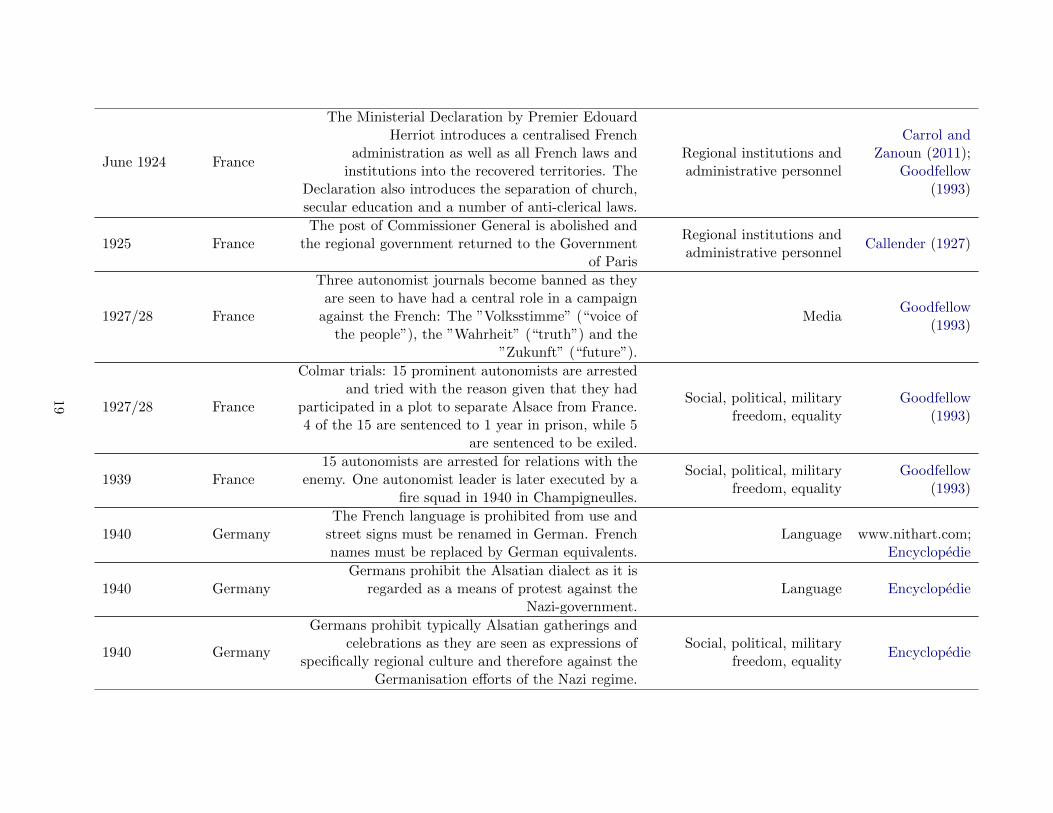
June 1924 France
The Ministerial Declaration by Premier EdouardHerriot introduces a centralised French
administration as well as all French laws andinstitutions into the recovered territories. The
Declaration also introduces the separation of church,secular education and a number of anti-clerical laws.
Regional institutions andadministrative personnel
Carrol andZanoun (2011);
Goodfellow(1993)
1925 FranceThe post of Commissioner General is abolished and
the regional government returned to the Governmentof Paris
Regional institutions andadministrative personnel
Callender (1927)
1927/28 France
Three autonomist journals become banned as theyare seen to have had a central role in a campaign
against the French: The ”Volksstimme” (“voice ofthe people”), the ”Wahrheit” (“truth”) and the
”Zukunft” (“future”).
MediaGoodfellow
(1993)
1927/28 France
Colmar trials: 15 prominent autonomists are arrestedand tried with the reason given that they had
participated in a plot to separate Alsace from France.4 of the 15 are sentenced to 1 year in prison, while 5
are sentenced to be exiled.
Social, political, militaryfreedom, equality
Goodfellow(1993)
1939 France15 autonomists are arrested for relations with the
enemy. One autonomist leader is later executed by afire squad in 1940 in Champigneulles.
Social, political, militaryfreedom, equality
Goodfellow(1993)
1940 GermanyThe French language is prohibited from use and
street signs must be renamed in German. Frenchnames must be replaced by German equivalents.
Language www.nithart.com;Encyclopedie
1940 GermanyGermans prohibit the Alsatian dialect as it is
regarded as a means of protest against theNazi-government.
Language Encyclopedie
1940 Germany
Germans prohibit typically Alsatian gatherings andcelebrations as they are seen as expressions of
specifically regional culture and therefore against theGermanisation efforts of the Nazi regime.
Social, political, militaryfreedom, equality
Encyclopedie
19

1940 GermanyGerman is made the official language of the
administration.Language Grasser (1998)
1945-1952 FranceTeaching of German is de jure prohibited in schools,de facto this is applied in about half of the schools.
Language
www.
alsace-lorraine.
org; Anderson(1972)
1953 FranceBordeaux trials: 13 Alsatian malgre-nous are
sentenced to death due to their involvement in themassacre of Oradour-sur-Glane.
Social, political, militaryfreedom, equality
Boswell (2008)Collins (2007)
Notes: Encyclopedie refers to www.encyclopedie.bseditions.fr.
20

D Alternative explanations
D.1 Support driven by urban agglomerations
Another potential concern is whether the effect is driven by outliers. More specifically, it mightbe driven by urban agglomerations for two potential reasons. Historically, cities enjoyed greaterautonomy and might have developed a stronger local identity relative to national identity. Moreover,cities today attract people from a diverse set of places, who could on average be more likely tosupport the EU. A visual inspection of the maps in Figures A12a and 4c in the main text suggeststhat the area surrounding Metz does in these cases feature high shares of yes votes. We testwhether this is a problem by excluding municipalities belonging to the metropolitan area as definedby INSEE (Table A9 also uses 10 or 15 kilometers from Metz as an alternative cut-off). Dependingon bandwidth length, this means that between 30 and 38 municipalities are excluded. Table A10presents the results for the analysis of newssaper subscriptions within Lorraine excluding Metz(Panel A). All point estimates are very similar and still statistically significant.
D.2 Religiosity and EU support, relevant for 1992 and 2005 referenda
One distinct feature in which the local laws strongly differ from the rest of France is with regard toreligion. Historically, the church played a larger role in the average citizens life in the treated areauntil after WWI, and still does to some degree until today. In contrast to the rest of France, pupilsin the area are still subjected to compulsory religious classes at school (usually two hours per week).This is not uncommon in other European countries, for instance, many of the southern Germanstates feature a similar policy. Usually these classes are not dogmatic, but transmit informationabout religions in general, of course still with an emphasis on Christianity. If religion or religiousdenomination is related to a more favorable attitude towards the EU, part of the effect we measureand attribute to differences in exposure to intrusive policies might be driven by differences inreligious identity.
However, the available literature indicates no direct relationship between religious attachmentsand European integration and “even indirect effects of religion on Euroscepticism are small or appearto cancel each other out”(Boomgaarden and Freire, 2009, p.1). To the opposite, albeit minimally, itis argued that “actors such as religious parties and the churches have strayed from the integrationistpath and contributed to Euroscepticism” (Minkenberg, 2009, p.1190).
To make sure this is really no concern, we examine the purported relationship in a more sys-tematic way as well. In the specific French context, there are no municipal level measures onreligious affiliation and the share of people who consider themselves secular, due to the specificsecular constitution and approach in France. Nonetheless, we can use outcomes aggregated at thedepartment level for all of France to assess the relationship between religion and voting in the EUreferendum. Table A11 shows results for two variables that measure the intensity of religiousnessand religious denomination. Attendance measures how often subjects attend religious services, bothas a continuous variable and coded as a set of dummies with never attending as the reference cat-egory. Denomination relates to the share of people who perceive themselves as Roman Catholic,Protestant, Christian Orthodox, Jewish, Muslim or other faiths, with no religious affiliation as thereference category.
The results show no difference for Attendance in both 1992 and 2005. With Attendance codedas individual dummies, there is also no stable relationship. Only very enthusiastic churchgoers havea marginally significant positive correlation compared to those who never attend in 2005, but not in1992. The pattern is similar for denomination. The only positive correlation which is significant atthe 10 percent level is with Protestant in 1992, but it also disappears in 2005. Overall, this supports
21

the existing literature that religion does not play a major role for attitudes towards the EU. Thus,the concern that religious differences would contaminate our main results appears unfounded.
D.3 Differences in benefits from trade
One of the main benefits of more integration that is usually mentioned is increased gains from tradestemming from lower trade costs (Alesina and Spolaore, 1997). Accordingly, we need to assume thatthese benefits are comparable close to the border. Clearly, distance to the respective neighboringstates correlates with trade costs; municipalities that are closer to the country borders could benefitmore from increased trade and thus exhibit higher agreement to more EU integration. At the sametime, relying less on trade with the rest of France and more on exports could also foster a strongerregional relative to national identity. There are two ways to evaluate whether this is problematicin our cases.
Firstly, our smallest bandwidth is 10 kilometers only, so that it seems implausible that therelatively small additional distance between treated and control municipalities affects trade costssufficiently to explain the results. Moreover, our estimates are robust to controlling for distance tothe German as well as to other borders. Secondly, the point estimates of the treatment effect barelychange when we increase the bandwidths and include more municipalities (Figure A3). Thirdly,if distance to the border has a significant effect, we would expect to see a significant, or at leastpositive difference between former Lorraine and the rest of France as well. As the differences inTable A12 are neither always positive, nor significant, differences in trade benefits do not seem tobe problematic.
D.4 The relative importance of homogenization policies
By design of the experiment we exploit, it is impossible to exactly distinguish the effect of homog-enization policies from the effect of occupation and repression in general. It seems plausible thatrepression itself provokes a backlash, but the historical literature specifically emphasizes the crucialrole of homogenization policies steered at suppressing regional identity (e.g. De La Valette, 1925;Goodfellow, 1993; Harp, 1998; Harvey, 1999; Heffernan, 2001; Zanoun, 2009). Even more than Ger-man policies, French policies after World War I clearly aimed at eliminating all signs of regionalparticularities that were deemed dangerous. Many of these policies plausibly affected the Alemanic-dialect speaking areas more severely, for instance repeated prohibitions of specific newspapers andparties associated with the usage of the German language.
As intrusive French homogenization policies comprised the second and more recent part of thetreatment period, there could be a stronger treatment effect on the German-dialect speaking partof Lorraine. Panel B and C in Table A13 indeed shows a significantly higher share of yes votes onthe German speaking side in both 1992 and 2005. Of course, this heterogeneous treatment effectcould partly be driven by other unobserved differences due to language. Accordingly, while keepingthe caveats in mind, this is suggestive evidence supporting the important role of homogenizationpolicies in creating the backlash.
D.5 The role of World War II
It is not absolutely clear how to interpret the role of WWII. During most of the war, the treatedand untreated area were occupied by Germany. German policies were surely repressive, but thesuppression of regional identity and traditions was not the main objective and a potential suppres-sion of French identity took place in all occupied parts of France. Neither the treated nor control
22

area belonged to the self-governed Vichy part of France. We are thus reluctant to emphasize therole of WWII, even though it was clearly a drastic shock influencing the lives of many people.
Nonetheless, one concern is that the shock was stronger in the treated area, as a sizable numberof young men were drafted into the German military and exposed to different and potentially moreintense war experiences. This difference in exposure probably led to a final phase of perceivedalienation and repression, because the French central government sentenced some of these so-calledmalgre-nous who were in the Waffen-SS to death in the Bordeaux Trial in 1953 for their involvementin war crimes. This punishment was perceived as unfair and caused massive public outrage andprotest, because it did not take the historical circumstances into account.5 It was probably thelast major part of a set of policies which was imposed by the national majority in disregard of thelocal preferences and opinions. By 1964, all French citizens who had collaborated with the Nazisincluding the convicts from the Bordeaux trials had benefited from a general amnesty.
Based on the results in Vlachos (2017), using variation within Alsace, the only outcome cor-related significantly with a higher share of war veterans is higher support for candidates of theright-wing National Front. In an earlier version of this paper (Dehdari and Gehring, 2016), weshow that there is no difference in support for nationalist leader Jean-Marie Le Pen in the 2007presidential election.6 Thus, there does not seem to be a problematic discontinuity with regard toWWII exposure at the border we exploit. Finally, the composition of the population might havebeen affected differently, but Table A17 and A18 indicate no problematic differences.
D.6 The influence of Germanization
Although feeling more German would not directly explain a stronger regional identity, being exposedto German ideas, newspapers and institutions for nearly fifty years could affect preferences. In ourmodel, however, there is no reason to expect a persistently stronger German identity after theoccupation ended. Although identities based on different levels (regional, national) need not to besubstitutes, national identities probably are to some degree. Accordingly we would expect that astronger German identity is related to a weaker French identity. Although we find no such differencein the survey results, we also code a variable based on tweets issued using Twitter about the Frenchand German national football team during the World Cup in 2014 as a robustness test. When usingthis as an alternative measure of German and French national identity at the local level withinLorraine, we find no significant difference at the 10 kilometers and at the optimal IK bandwidth(see Online Appendix Section L). The analysis rests on relatively few tweets, but the results are inline with the survey evidence and suggest no difference in German or French national identity.7
5 Nearly all mayors of towns in Alsace attended a public protest walk in Strasbourg. For alternative versions andviews about the actions and historical circumstances see http://www.scrapbookpages.com/Oradour-sur-Glane/
Story/index.html.6 Results available upon request.7 The historical and sociological literature also argues that although citizens accepted their legal belonging to Germany,
they did so “without feeling German themselves” (Hopel, 2012, p.37). De La Valette (1925) refers to a disillusionedGerman journalist saying “Alsace does not want us; the Alsatians are lost to us”. Carrol (2010, p.66) cites agovernment official stating that “Prussian methods had failed to instil alien national sentiments into the minds of apeople who were proud of their history”. It also seems to be partly misleading to frame the regionalist parties in the1920s and 30s as pro-German. The “Landespartei” is described as “referring in its manifesto to the right of peoplesto self-determination and looked forward to the day when a ‘free Alsace- Lorraine’ would be the mediator betweenFrance and Germany in a United States of Europe” (Anderson, 1972). Similarly, the UPR called for “administrativedecentralization, a regional elected council and the recognition of bilingualism” rather than for a return to Germany.
23

Table A9: Discontinuities in referenda results, within Lorraine, excluding urban agglomeration Metz
Panel A: Excluding Metz AgglomerationDep. Variable: Share Yes 1969 Share Yes 1992 Share Yes 2005
(1) (2)a (3) (4)a (5) (6)a
Treatment 13.194 12.029 4.082 3.599 4.283 5.791(2.621) (1.949) (1.940) (1.269) (2.087) (1.452)
[<0.001] [<0.001] [0.036] [0.005] [0.041] [<0.001]Obs. 337 817 355 1152 355 779Dist 10 km 34.09 km 10 km 53.78 km 10 km 26.22 km
Panel B: Excluding within 10 kilometers from MetzDep. Variable: Share Yes 1969 Share Yes 1992 Share Yes 2005
(1) (2)a (3) (4)a (5) (6)a
Treatment 12.670 10.678 3.822 5.867 4.000 7.341(2.633) (1.795) (1.850) (1.137) (2.082) (1.340)
[<0.001] [<0.001] [0.040] [<0.001] [0.055] [<0.001]Obs. 372 1145 392 1436 392 1171Dist 10 km 38.47 km 10 km 49.06 km 10 km 35.71 km
Panel C: Excluding within 15 kilometers from MetzDep. Variable: Share Yes 1969 Share Yes 1992 Share Yes 2005
(1) (2)a (3) (4)a (5) (6)a
Treatment 12.367 10.585 3.940 5.483 4.450 7.082(2.668) (1.891) (1.889) (1.151) (2.033) (1.225)
[<0.001] [<0.001] [0.038] [<0.001] [0.029] [<0.001]Obs. 353 1017 372 1316 372 1339Dist 10 km 34.56 km 10 km 44.81 km 10 km 45.98 km
Notes: Discontinuity at the treatment border using municipalities in Lorraine, excluding Metz. Panel A excludes all municipalities in Metz Agglomeration, Panel B excludesall municipalities within 10 kilometers from Metz, and Panel C excludes all municipalities within 15 kilometers from Metz. Outcomes are share of Yes votes in the 1969referendum, share of Yes votes in the 1992 referendum, and share of Yes votes in the 2005 referendum. Conley standard errors in parentheses and p-values in brackets.Short Interpretation: Independent cities might have developed a historically stronger regional identity. In case there would be more major cities on the treated side, andclose to the border, this could bias our estimate. Excluding Metz as the major city in Lorraine does not affect the results. This does also alleviate concerns that municipalareas are more cosmopolitan and might thus agree more to the two later referenda. For the 1969 vote, the latter concern is irrelevant. For all three outcome variables, thisomission does not affect our results.
a Estimates from using the optimal IK bandwidth.
24

Table A10: Newspaper subscription shares: excluding Metz, and discontinuity at language border
Panel A: Excluding MetzVariable (1) (2) (3) (4)a
Treatment 7.980 7.667 6.927 6.891(1.527) (1.361) (1.315) (1.317)
[<0.001] [<0.001] [<0.001] [<0.001]Obs. 259 365 455 450Dist 10 km 15 km 20 km 19.71 km
Panel B: Effect at the language borderVariable (1) (2) (3) (4)a
Treatment -0.763 0.088 0.110 0.245(0.954) (0.804) (0.801) (0.809)[0.424] [0.913] [0.891] [0.762]
Obs. 291 394 490 452Dist 10 km 15 km 20 km 17.71 km
Panel C: Excluding German-speaking municipalitiesVariable (1) (2) (3) (4)a
Treatment 10.000 9.815 9.777 10.247(1.421) (1.247) (1.149) (1.092)
[<0.001] [<0.001] [<0.001] [<0.001]Obs. 385 553 684 937Dist 10 km 15 km 20 km 34.32 km
Notes: Discontinuity in newspaper subscription shares at the treatment border using municipalities in Lorraine (Moselle,Meurthe et Moselle, and Meuse), and at the language border using municipalities in Moselle. Panel A excludes all mu-nicipalities in the Metz agglomeration, panel B tests for discontinuities at the language border, and panel C excludes allGerman-speaking municipalities. Conley standard errors in parentheses and p-values in brackets.
a Estimates from using the optimal IK bandwidth.
25

Table A11: Share of Yes votes and religion, all of France.
Dep. Variable: Share of Yes votes 1992 Dep. Variable: Share of Yes votes 2005(1) (2) (3) (4) (5) (6)
Attendance [mean] -1.839 -1.774[0.167] [0.113]
Attendance: Weekly 0.114 0.099[0.167] [0.135]
Attendance: 2-3 times a month 0.002 0.025[0.983] [0.788]
Attendance: Once a month -0.052 -0.097[0.625] [0.164]
Attendance: Sev. times a year 0.057 0.054[0.114] [0.144]
Attendance: Less freq. 0.036 -0.001[0.391] [0.988]
Roman Catholic 0.029 0.004[0.291] [0.902]
Protestant 0.353 0.146[0.054] [0.321]
Christian Ortodox 0.115 0.267[0.846] [0.585]
Jewish 0.847 1.095[0.116] [0.278]
Moslem -0.092 0.008[0.437] [0.955]
Other Religions -0.155 0.010[0.495] [0.971]
Obs. 94 94 94 94 94 94
Notes: This table tests whether there is a clear relationship between religious affiliation and voting in the two referenda 1992 and 2005. The OLS estimates use aggregatesurvey results at the departement-level. Attendance refers to how often the respondents attend religious services. Never attending is the omitted reference category forattendance, no religious denomination is the omitted reference category for religion. Controls: Sex, Age, Years of schooling, Urban vs Rural, Union membership, Degree,Income, and Household size. p-values in brackets. There is no systematic effect of religion, which is reassuring as the areas in former Alsace-Lorraine has a slightly differenthistory with regard to schooling. Accordingly, these differences and schooling should not explain our results.Short Interpretation: Religious beliefs and denomination could affect voting in the referenda. We show for all of France that such a relationship never shows up significantlyat any level, both for intensity of belief measured by church attendance, as well as when using denomination as the variable of interest. We conclude that there are somedifferences with regard to the treatment of religion between the departments, but none that closely influences or could explain our result.
26

Figure A3: Estimation plots for 1992 and 2005 referenda, within Lorraine
●●●
●●●●●●●●●●●●●●●●●●●●●●●●●●●●●●●●●●●●●●
10 20 30 40 50
−2
26
Bandwidth, km
Coe
ffici
ent e
stim
ates
(a) Share Yes 1992
●●●●●●●●●●●●●●
●●●●●●●●●●●●●●●●●●●●●●●●●●●
10 20 30 40 50
−2
26
10
Bandwidth, km
Coe
ffici
ent e
stim
ates
(b) Share Yes 2005
Notes: Estimates of treatment effect, bandwidths varying between 10 to 50 kilometers, within Lorraine. 1st degree polynomial. Dashed vertical line at the optimal IK bandwidth.Solid vertical lines represent 90% confidence intervals (based on Conley standard errors).
27

Table A12: Placebo test: Border between Alsace and Lorraine, and the rest of France
Panel A: Share Yes 1992Variable (1) (2) (3) (4)a
Treatment -3.168 -0.649 0.058 3.170(2.040) (1.728) (1.465) (0.769)[0.121] [0.707] [0.968] [<0.001]
Obs. 404 606 814 11416Dist 10 km 15 km 20 km 218.68 km
Panel B: Share Yes 2005Variable (1) (2) (3) (4)a
Treatment 0.208 1.045 1.496 0.135(2.006) (1.666) (1.453) (0.735)[0.917] [0.531] [0.303] [0.854]
Obs. 405 608 816 10899Dist 10 km 15 km 20 km 209.71 km
Notes: RD estimates using bandwidths of 10, 15, and 20 kilometers from the border between Alsace and Lorraine, and therest of France. Included controls: distance to Germany (border), distance to Metz, distance to Strasbourg, and distance toNancy. Conley standard errors in parentheses and p-values in brackets.
a Estimates from using the optimal IK bandwidth.
Table A13: Effects at the language border
Panel A: Share Yes 1969Variable (1) (2) (3) (4)a
Treatment -3.094 -0.595 1.486 0.169(2.544) (2.182) (1.999) (2.100)[0.225] [0.785] [0.458] [0.936]
Obs. 285 386 479 408Dist 10 km 15 km 20 km 15.81 km
Panel B: Share Yes 1992Variable (1) (2) (3) (4)a
Treatment 2.033 3.454 4.738 4.557(1.399) (1.247) (1.101) (0.949)[0.147] [0.006] [<0.001] [<0.001]
Obs. 534 733 954 1265Dist 10 km 15 km 20 km 31.20 km
Panel C: Share Yes 2005Variable (1) (2) (3) (4)a
Treatment 2.622 4.360 4.552 4.654(1.075) (0.976) (0.902) (0.963)[0.015] [<0.001] [<0.001] [<0.001]
Obs. 535 734 955 778Dist 10 km 15 km 20 km 15.89 km
Notes: RD estimates using bandwidths of 10, 15, and 20 kilometers from the language border within Moselle. Includedcontrols: distance to Germany (border), distance to Metz, distance to Strasbourg, and distance to Nancy. Conley standarderrors in parentheses and p-values in brackets.Short interpretation: The differences in 1992 and 2005 could signal that individuals who spoke German would profit morefrom European integration, e.g. through more exchange with Germany, or were exposed to the EU friendly German mediato a higher extent. We exclude those municipalities as a robustness test.
a Estimates from using the optimal IK bandwidth.
28

E Historical maps
Figure A4: Map of Lotharingia around 1000 A.D.
Notes: Map depicting the former Duchy of Lotharingia, around 1000: Pink= Lower Lorraine, Purple = Upper Lorraine,Orange = Frisia (effectively detached from Lotharingia). This map is used in the Allgemeiner historischer Handatlas byGustav Droysen in 1886. Alsace was a part of the duchy of Swabia at that time.
29
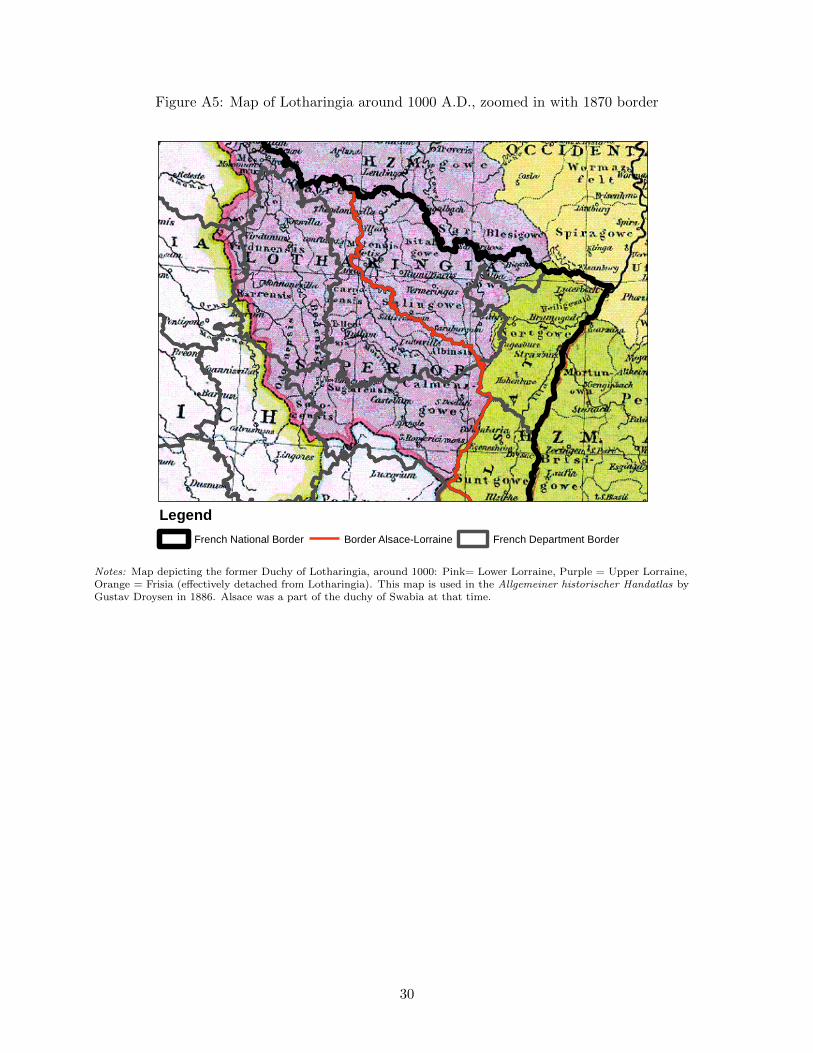
Figure A5: Map of Lotharingia around 1000 A.D., zoomed in with 1870 border
LegendFrench National Border Border Alsace-Lorraine French Department Border
Notes: Map depicting the former Duchy of Lotharingia, around 1000: Pink= Lower Lorraine, Purple = Upper Lorraine,Orange = Frisia (effectively detached from Lotharingia). This map is used in the Allgemeiner historischer Handatlas byGustav Droysen in 1886. Alsace was a part of the duchy of Swabia at that time.
30

Figure A6: Map of Lorraine in the 1378 century
Notes: Map of Lorraine in the 14th century. This is a modified extract from the map Deutschland beim Tode Karl IV. by KarlWolf in Meyers Lexikon 6. Auflage. The red line shows the border from the Franco-Prussian war, clearly not following thepre-existing borders and cutting through historical entities. Created from authors’ own version of the map.
31
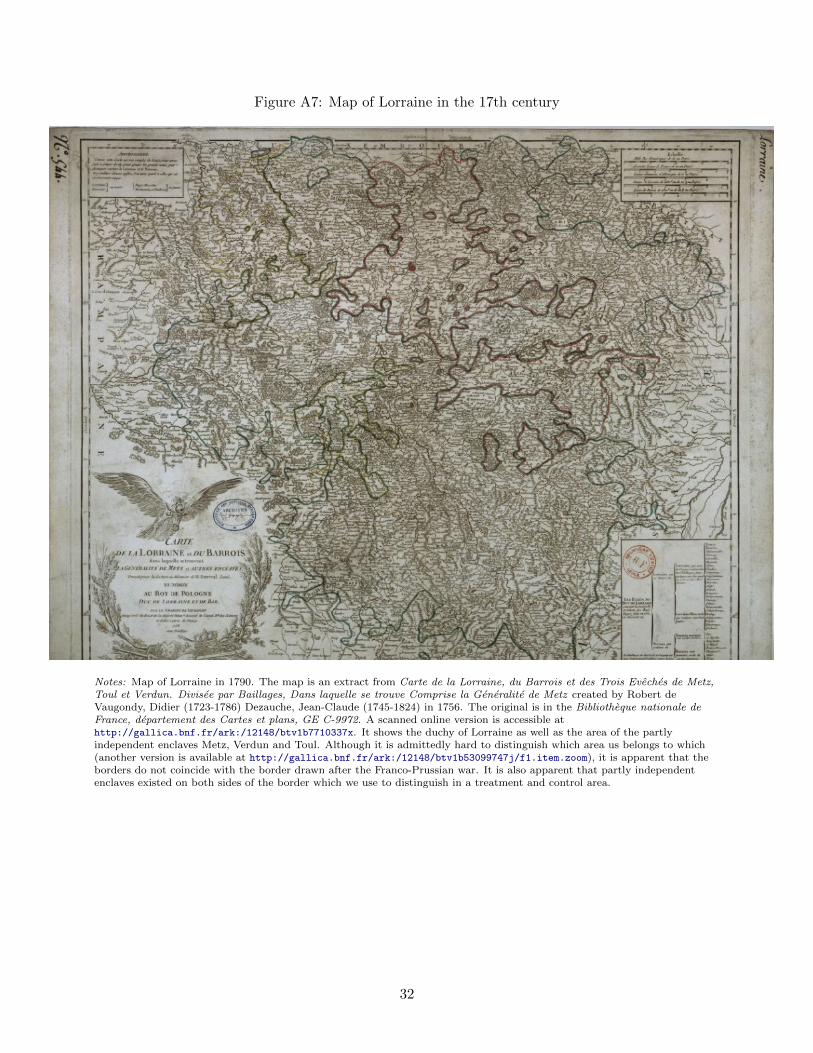
Figure A7: Map of Lorraine in the 17th century
Notes: Map of Lorraine in 1790. The map is an extract from Carte de la Lorraine, du Barrois et des Trois Eveches de Metz,Toul et Verdun. Divisee par Baillages, Dans laquelle se trouve Comprise la Generalite de Metz created by Robert deVaugondy, Didier (1723-1786) Dezauche, Jean-Claude (1745-1824) in 1756. The original is in the Bibliotheque nationale deFrance, departement des Cartes et plans, GE C-9972. A scanned online version is accessible athttp://gallica.bnf.fr/ark:/12148/btv1b7710337x. It shows the duchy of Lorraine as well as the area of the partlyindependent enclaves Metz, Verdun and Toul. Although it is admittedly hard to distinguish which area us belongs to which(another version is available at http://gallica.bnf.fr/ark:/12148/btv1b53099747j/f1.item.zoom), it is apparent that theborders do not coincide with the border drawn after the Franco-Prussian war. It is also apparent that partly independentenclaves existed on both sides of the border which we use to distinguish in a treatment and control area.
32

F Smoothness/ Balance tests
Table A14: Pre-treatment variables balance test, within Lorraine
(1) (2) (3) (4) (5)Dep. Variable: Barley Wheat Potato Elevation Ruggedness
Bandwidth 10 kmTreatment 10.799 76.157 66.839 6.491 10.914
(224.053) (234.694) (143.681) (7.660) (8.497)[0.962] [0.746] [0.455] [0.603] [0.244]
Obs. 403 403 403 408 408
Bandwidth 20 kmTreatment -270.251 -124.417 -159.527 -6.532 5.023
(191.811) (204.683) (119.636) (7.990) (6.274)[0.159] [0.543] [0.183] [0.414] [0.424]
Obs. 756 756 756 765 765
Notes: Tests for discontinuities in pre-treatment variables for the whole border. Ruggedness is the mean index of thevariation in elevation, while Elevation is the mean elevation. Potato, Wheat, and Barley refer to the soil suitability forpotato and wheat production, respectively. Details and sources are provided in the Online Appendix. Controls includedare: distance to Germany (border), distance to Metz, distance to Strasbourg, and distance to Nancy. Standard errors inparentheses and p-values in brackets.
Table A15: Pre-treatment variables balance test, Alsace and Lorraine
(1) (2) (3) (4) (5)Dep. Variable: Barley Wheat Potato Elevation Ruggedness
Bandwidth 10 kmTreatment 278.059 348.124 129.626 -25.229 -3.949
(242.550) (244.659) (140.356) (19.798) (11.726)[0.252] [0.389] [0.155] [0.203] [0.356]
Obs. 614 614 614 619 619
Bandwidth 20 kmTreatment -190.426 –103.692 -202.730** -6.090 5.911
(175.961) (179.980) (102.171) (14.113) (8.133)[0.279] [0.565] [0.047] [0.666] [0.467]
Obs. 1164 1164 1164 1173 1173
Notes: Tests for discontinuities in pre-treatment variables for the whole border. Ruggedness is the mean index of thevariation in elevation, while Elevation is the mean elevation. Potato, Wheat, and Barley refer to the soil suitability forpotato and wheat production, respectively. Details and sources are provided in the Online Appendix. Controls includedare: distance to Germany (border), distance to Metz, distance to Strasbourg, and distance to Nancy. Standard errors inparentheses and p-values in brackets.
33

Figure A8: Discontinuities of pre-treatment variables using all of Alsace and Lorraine
● ● ● ● ● ● ● ●●
●● ●
●
●
●● ● ●
● ●
0.0
0.5
1.0
1.5
2.0
−50 −25 0 25 50km
Rug
edne
ss
(a) Ruggedness
● ●● ●
● ● ● ●●
●●
●
●●
●
●● ● ● ●
200
300
400
500
−50 −25 0 25 50km
Ele
vatio
n
(b) Elevation
● ● ● ● ● ● ● ●●
● ●
●●
●●
● ●● ● ●
6800
7200
7600
−50 −25 0 25 50km
Soi
l sui
tabi
lity,
pot
ato
(c) Soil suitability, potato
● ● ● ● ● ● ● ● ●● ●
●●
● ●● ●
● ● ●
5500
6000
6500
−50 −25 0 25 50km
Soi
l sui
tabi
lity,
whe
at
(d) Soil suitability, wheat
34

Table A16: Division of Powers: Sub-levels of Governance in France
Level: Central Regional Departmental Municipal
All National Policies Regional Transport DepartmentalTransport
Municipal Transport
Defence Education (highschool), vocationaltraining andapprenticeship
Education (ordinarysecondary school),vocational training(music, dance anddrama)
Justice Environment Environment(particularlyprotection waste andwater plants)
Environment (waterand waste)
Foreign Affaires Regional Planning Planning (incooperation withRegion)
Security EconomicDevelopment
EconomicDevelopment (rural,social, inclusion)
Housing
ScientificDevelopment
Public health (incl.sanitary protection &vaccination)
Public health (incl.vaccination)
Notes: This table gives an overview over the distribution of competences among the different levels of governance in France.The information is obtained from the website of the European Committee of the Regions.
35

Table A17: Post treatment covariate balancing: 4 main categories
Panel A: Alsace and LorraineMedian income 2008 Mean age 2006 Education 1999 Occupation 2006
Variable (1) (2)a (3) (4)a (5) (6)a (7) (8)a
Treatment 1.138 1.864 -0.353 -0.645 0.002 0.006 0.009 -0.010(0.947) (0.731) (0.541) (0.270) (0.005) (0.003) (0.014) (0.008)[0.230] [0.011] [0.515] [0.017] [0.621] [0.023] [0.515] [0.218]
Obs. 507 1445 604 2393 604 2368 604 1808Dist 10 km 29.92 km 10 km 47.14 km 10 km 46.33 km 10 km 32.54 km
Panel B: Alsace vs. VosgesMedian income 2008 Mean age 2006 Education 1999 Occupation 2006
Variable (1) (2)a (3) (4)a (5) (6)a (7) (8)a
Treatment 4.627 3.543 -1.414 -1.056 0.010 0.019 0.016 -0.011(1.135) (0.803) (0.841) (0.409) (0.008) (0.004) (0.026) (0.014)
[<0.001] [<0.001] [0.094] [0.010] [0.257] [<0.001] [0.526] [0.455]Obs. 196 813 210 1022 210 1284 210 727Dist 10 km 38.61 km 10 km 49.54 km 10 km 72.07 km 10 km 33.19 km
Panel C: Within LorraineMedian income 2008 Mean age 2006 Education 1999 Occupation 2006
Variable (1) (2)a (3) (4)a (5) (6)a (7) (8)a
Treatment 0.236 0.815 0.059 -0.239 0.002 0.002 0.009 -0.013(1.015) (0.868) (0.641) (0.382) (0.006) (0.003) (0.016) (0.010)[0.816] [0.348] [0.927] [0.532] [0.696] [0.523] [0.589] [0.193]
Obs. 311 719 394 1284 394 1617 394 1031Dist 10 km 25.13 km 10 km 40.45 km 10 km 60.08 km 10 km 29.60 km
Notes: Panel A tests for discontinuities in covariates using all departements in Alsace and Lorraine, Panel B uses only municipalities in Bas-Rhin, Haut-Rhin, and Vosges,while Panel C uses municipalities within Lorraine. Education refers to the share of people above 18 with a high school degree and occupation to the share of blue-collarworkers in the total population. Controls: distance to Germany (border), distance to Metz, distance to Strasbourg, and distance to Nancy. Conley standard errors inparentheses and p-values in brackets. Strong differences would indicate problems in the exogenous nature of our treatment assignment, or the comparability of our treatmentand control group. There are no clear or significant differences in these main variables.
a Estimates from using the optimal IK bandwidth.
36
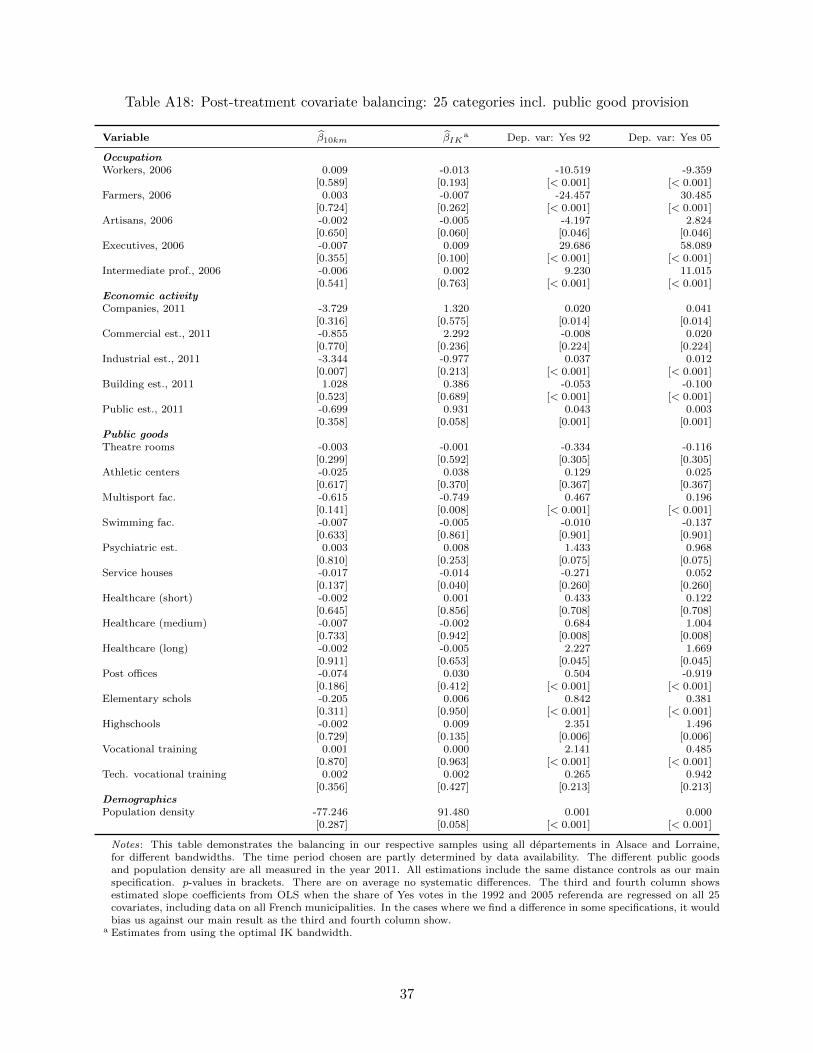
Table A18: Post-treatment covariate balancing: 25 categories incl. public good provision
Variable β10km βIKa Dep. var: Yes 92 Dep. var: Yes 05
OccupationWorkers, 2006 0.009 -0.013 -10.519 -9.359
[0.589] [0.193] [< 0.001] [< 0.001]Farmers, 2006 0.003 -0.007 -24.457 30.485
[0.724] [0.262] [< 0.001] [< 0.001]Artisans, 2006 -0.002 -0.005 -4.197 2.824
[0.650] [0.060] [0.046] [0.046]Executives, 2006 -0.007 0.009 29.686 58.089
[0.355] [0.100] [< 0.001] [< 0.001]Intermediate prof., 2006 -0.006 0.002 9.230 11.015
[0.541] [0.763] [< 0.001] [< 0.001]Economic activityCompanies, 2011 -3.729 1.320 0.020 0.041
[0.316] [0.575] [0.014] [0.014]Commercial est., 2011 -0.855 2.292 -0.008 0.020
[0.770] [0.236] [0.224] [0.224]Industrial est., 2011 -3.344 -0.977 0.037 0.012
[0.007] [0.213] [< 0.001] [< 0.001]Building est., 2011 1.028 0.386 -0.053 -0.100
[0.523] [0.689] [< 0.001] [< 0.001]Public est., 2011 -0.699 0.931 0.043 0.003
[0.358] [0.058] [0.001] [0.001]Public goodsTheatre rooms -0.003 -0.001 -0.334 -0.116
[0.299] [0.592] [0.305] [0.305]Athletic centers -0.025 0.038 0.129 0.025
[0.617] [0.370] [0.367] [0.367]Multisport fac. -0.615 -0.749 0.467 0.196
[0.141] [0.008] [< 0.001] [< 0.001]Swimming fac. -0.007 -0.005 -0.010 -0.137
[0.633] [0.861] [0.901] [0.901]Psychiatric est. 0.003 0.008 1.433 0.968
[0.810] [0.253] [0.075] [0.075]Service houses -0.017 -0.014 -0.271 0.052
[0.137] [0.040] [0.260] [0.260]Healthcare (short) -0.002 0.001 0.433 0.122
[0.645] [0.856] [0.708] [0.708]Healthcare (medium) -0.007 -0.002 0.684 1.004
[0.733] [0.942] [0.008] [0.008]Healthcare (long) -0.002 -0.005 2.227 1.669
[0.911] [0.653] [0.045] [0.045]Post offices -0.074 0.030 0.504 -0.919
[0.186] [0.412] [< 0.001] [< 0.001]Elementary schols -0.205 0.006 0.842 0.381
[0.311] [0.950] [< 0.001] [< 0.001]Highschools -0.002 0.009 2.351 1.496
[0.729] [0.135] [0.006] [0.006]Vocational training 0.001 0.000 2.141 0.485
[0.870] [0.963] [< 0.001] [< 0.001]Tech. vocational training 0.002 0.002 0.265 0.942
[0.356] [0.427] [0.213] [0.213]DemographicsPopulation density -77.246 91.480 0.001 0.000
[0.287] [0.058] [< 0.001] [< 0.001]
Notes: This table demonstrates the balancing in our respective samples using all departements in Alsace and Lorraine,for different bandwidths. The time period chosen are partly determined by data availability. The different public goodsand population density are all measured in the year 2011. All estimations include the same distance controls as our mainspecification. p-values in brackets. There are on average no systematic differences. The third and fourth column showsestimated slope coefficients from OLS when the share of Yes votes in the 1992 and 2005 referenda are regressed on all 25covariates, including data on all French municipalities. In the cases where we find a difference in some specifications, it wouldbias us against our main result as the third and fourth column show.
a Estimates from using the optimal IK bandwidth.
37

G Referendum 1969
In 1968 Charles de Gaulle observed widespread dissatisfaction with the political system and agrowing demand for institutional change. In an attempt to satisfy this demand, he announced aconstitutional referendum to be held in 1969. The main policy change proposed in the referendumwas increasing the political power of regional governments. De Gaulle was convinced that increasingregions’ autonomy to settle local affairs locally would restore political balance.8 Moreover, hebelieved that the provinces were still close to the heart of the french people.9 Figure A9 shows asample of the newspaper we use the primary data source for the referendum outcome. Figure A9bshows samples of voting results disaggregated on the municipality level.
Figure A9: Sample from L’Est Republicain showing voting results
(a) L’Est Republicain title page (b) Voting results on municipality level
8 ”Rien n’est plus important pour l’equilibre moral et social de la France que l’organisation, une organisation nouvelle,des contacts et de la cooperation, entre ceux qui dirigent et ceux qui sont diriges.” (De Gaulle, 1969)
9 ”Et cependant, bien que les regions fussent officiellement ignorees depuis, les regions, je veux dire, les provinces,fussent officiellement ignorees depuis 179 ans. Elles n’ont jamais cesse d’exister dans l’esprit et dans le coeur desfrancais” (De Gaulle, 1969)
38

Figure A10: Agreement referendum about establishing regions as political entity, 1969
Notes: Referendum on creating regions as political entity (1969). Vote shares out of all eligible voters, i.e. out of yes votes, novotes, blanks and abstentions. There is no comparable map showing only the yes share out of valid votes, but this OnlineAppendix shows maps of abstentions that do not differ between departments. Source: Lancelot and Lancelot (1970).
39

Figure A11: Election and referendum results, 1968 and 1969
(a) Legislative election 1968 (b) Abstention 1969 referendum
(c) Share of yes votes in 1969 referendum (d) Share of yes votes in 1972 referendum
Notes: Figure a) shows vote shares for the Gaullist right-wing party Union for the Defense of the Republic (U.D.R.) in thelegislative elections of 1968. Figures b) and c) shows the share of absentees and share of yes votes (among all votes, includinginvalid/blank votes), respectively, in the 1969 constitutional referendum about decentralization and establishing the regions asan important political unit in the Constitution. Figure d) presents results for the 1972 referendum, which was about ”TheTreaty of Accession” the question was about whether Denmark, Ireland, Norway and the United Kingdom should be allowedto become members of the ”European Communities”, a predecessor of the European Union. There were no differences in voteshares for U.D.R or share of absentees between the Moselle (treated) and Meurthe-et-Moselle (non-treated), while the share ofyes votes in both the 1969 and the 1972 referenda was higher in Moselle.Source: Figures a), b) and c) are from Lancelot and Lancelot (1970). Figure d) is from Leleu (1976). .
40

H Additional regressions
Table A19: Survey results, Alsace and Lorraine
Survey question Mean,control
∆ P-value No. obs.
Feel close to region (Regional identity) 3.362 0.209 <0.001 2617Feel close to nation (National identity) 3.635 -0.003 0.906 2617Regional identity/National identity (standardized) -0.138 0.226 <0.001 2614
Notes: Sources are the Observatoire Interregional du Politique (OIP) 1999, 2001, and 2003, using respondents in all ofAlsace and Lorraine, on departement level. Identity is measures on a 4-point Likert-scale. The parameter ∆ comes fromthe equation: yi = π + ∆Treatmenti + Γ′iλ + ηi, where Treatmenti = 1[individual in treated region] and Γ comprises ofcontrols for (reported) age, employment status and sex. A positive ∆ indicates that people in the treated region agree morewith the statement.
Table A20: Overlap strength of regional and European identity in treated and control areas (A+L)
14.38%
85.62%
Both European and regional identity relatively strongerOnly European identity relatively stronger
Identity differences treated compared to control area(conditional on stating stronger EU identity)
Notes: Higher (lower) means that an individual in the treated area exhibited a higher (lower) ratio of Regional to National orEuropean to National identity compared to the mean ratios in the untreated area. Higher is mathematically defined as largeror equal. Very few observations are exactly equal to the mean. We are mostly interested in the overlap of the two, but alsothe overall sum. The overlap is also visualized in the pie chart on the right. The red area indicates the share of persons whichanswered with both higher or equal European identity and Regional identity. Data is from the OIP 1999, 2001, and 2003, usingrespondents in all of Alsace and Lorraine.
Table A21: OIP Survey results, 1999 and 2001: European and regional attachments
Dep. Var: Attachment: Europe Within Lorraine All of FranceVariable (1) (2) (3) (4)Attachement: Region 0.186*** 0.185*** 0.097*** 0.097***
(0.030) (0.031) (0.007) (0.007)Obs. 1388 1388 25602 25602Controls No Yes No Yes
Notes: Observatoire Interregional du Politique (OIP) survey results from 1999 and 2001, asking question on how strongrespondents attachment is to Europe, and respondent’s Region. Attachment is based on a 1-4 scale, with 1 corresponds toDisagree strongly, and 4 corresponds to Strongly agree. Controls are age, sex, employment status, and survey year. ***, **and * indicate statistical significance at 1%, 5% and 10% levels, based on heteroscedasticity-consistent standard errors.
41

Table A22: Survey results: policy preferences, within Lorraine
Survey question Mean,control
∆ P-value No. obs.
Democracy works well in France 2.536 -0.023 0.616 1316Democracy works well within region 2.630 0.111 0.008 1290Well informed about regional policies 2.704 0.089 0.021 1308In favor: transfer policy competence to region (avg. 10) 3.031 0.092 0.005 605In favor: allow more autonomy at reg. level (avg. 5) 2.134 0.108 0.025 1315Educ. policy should be set at reg. level (avg. 5) 2.855 0.112 0.024 574Concerned reg. admin. would increase interreg. inequality 3.208 -0.172 0.037 574
Notes: Sources are the Observatoire Interregional du Politique (OIP) 1999, 2001, and 2003, using respondents withinLorraine, on departement level. The paper shows similar results for Alsace and Lorraine. The parameter ∆ comes fromthe equation: yi = π + ∆Treatmenti + Γ′iλ + ηi, where Treatmenti = 1[individual in treated region] and Γ comprises ofcontrols for (reported) age, employment status and sex. A positive ∆ indicates that people in the treated region agree morewith the statement. Avg. ”x” indicates that the factor is composed of ”x” underlying survey items.
Table A23: OLS estimates using all municipalities in Alsace and Lorraine
C: Share Yes 1992 D: Turnout 1992Variable (1) (2) (3) (4)Treatment 11.941 4.865 -0.652 2.081
(0.473) (0.789) (0.262) (0.470)[<0.001] [<0.001] [0.013] [<0.001]
Obs. 3137 3137 3137 3137Controls No No No No
E: Share Yes 2005 F: Turnout 2005Variable (1) (2) (3) (4)Treatment 6.990 6.185 -3.115 -0.023
(0.434) (0.855) (0.276) (0.470)[<0.001] [<0.001] [<0.001] [0.960]
Obs. 3141 3141 3141 3141Controls No No No No
Notes: OLS estimates using whole sample of municipalities in all departements in Alsace and Lorraine. Included controls:distance to Germany (border), distance to Metz, distance to Strasbourg, distance to Nancy. Conley standard errors inparentheses and p-values in brackets. For Share Yes 1992 and Share Yes 2005, the coefficients indicate a higher regionalidentity in the treated region. Although the interpretation of the regression coefficient for the treatment variable is theaverage difference in percentage points between treated and untreated municipalities, it is important to relate them to theaverage vote share of the whole region. The small difference in turnout in 2005 becomes insignificant when we add controls(Panel F). The coefficient for Turnout 1992 changes signs when controls are added, and becomes insignificant in the RDDat the border.
42

Table A24: Discontinuities in turnout, within Lorraine
Dep. Variable: Turnout 1969(1) (2) (3) (4)a
Treatment 2.049 0.473 -0.567 1.265(1.091) (1.009) (0.961) (0.860)[0.061] [0.639] [0.555] [0.141]
Obs. 374 549 694 900Dist 10 km 15 km 20 km 27.55 km
Dep. Variable: Turnout 1992(1) (2) (3) (4)a
Treatment -0.861 -1.145 -1.646 -0.899(1.229) (1.056) (0.967) (0.908)[0.484] [0.278] [0.089] [0.322]
Obs. 394 583 744 873Dist 10 km 15 km 20 km 24.21 km
Dep. Variable: Turnout 2005(1) (2) (3) (4)a
Treatment 0.804 -0.650 -2.413 -1.774(1.222) (1.124) (1.092) (0.898)[0.511] [0.563] [0.027] [0.048]
Obs. 394 583 744 1153Dist 10 km 15 km 20 km 34.58 km
Notes: Discontinuity at the treatment border using municipalities in Lorraine. Outcomes are turnout in the 2007 presidentialelection (first round), turnout in the 1969 referendum, turnout in the 1992 referendum, and turnout in the 2005 referendum.Conley standard errors in parentheses and p-values in brackets.
a Estimates from using the optimal IK bandwidth.
43

Table A25: RD results: Turnout, Alsace and Lorraine
Turnout 1992 Turnout 2005Variable (1) (2)a (3) (4)a
Treatment -0.529 0.368 0.219 0.500(1.077) (0.733) (0.994) (0.569)[0.623] [0.616] [0.826] [0.380]
Obs. 604 1365 603 2443Dist 10 km 24.25 km 10 km 48.66 km
Notes: RD estimates using bandwidths of 10, 15, and 20 kilometers from the former French-German border. Includedcontrols: distance to Germany (border), distance to Metz, distance to Strasbourg, and distance to Nancy. Conley standarderrors in parentheses and p-values in brackets.
a Estimates from using the optimal IK bandwidth.
Table A26: Differences in population changes between 1916-1946 (within Lorraine)
Panel A: Population difference 1916 to 1926Variable (1) (2) (3) (4)a
Treatment -5.980 -2.309 -0.494 -4.909(6.117) (6.747) (6.582) (5.374)[0.329] [0.732] [0.940] [0.361]
Obs. 394 581 740 1402Dist 10 km 15 km 20 km 47.13 km
Panel B: Population difference 1936 to 1946Variable (1) (2) (3) (4)a
Treatment -4.525 -4.018 -3.866 -3.944(3.632) (2.894) (2.571) (2.105)[0.213] [0.166] [0.133] [0.061]
Obs. 393 581 741 1153Dist 10 km 15 km 20 km 34.80 km
Panel C: Population difference 1916 to 1946Variable (1) (2) (3) (4)a
Treatment -13.061 -6.966 -2.662 -10.720(10.206) (11.342) (11.130) (9.039)
[0.201] [0.539] [0.811] [0.236]Obs. 393 580 739 1433Dist 10 km 15 km 20 km 48.95 km
Notes: All estimates include population differences for municipalities only within Lorraine. Included controls: distance toGermany (border), distance to Metz, distance to Strasbourg, distance to Nancy. Conley standard errors in parentheses andp-values in brackets.
a Estimates from using the optimal IK bandwidth.
44

Figure A12: Maps of municipal level turnout in referenda in 1969, 1992 and 2005; and the presi-dential election of 2007
Notes (a): The light grey area is the comparison within thehistorical region of Lorraine, where the border is clearlyexogenous. The dark grey area includes Alsace and Vosgesas its comparison, where the border partly coincides withthe historical language border.
(a) Within-Lorraine and Alsace
Legend
Turnout 1969
0.00 % - 70.00 %
70.01 % - 80.00 %
80.01 % - 90.00 %
90.01 % - 100.00 %
0 25 50 Kilometers
Notes (b): Turnout in the constitutional referendum in1969. Areas where data is not available are left blank. Datais available for the departments of Meuse,Meurthe-et-Moselle and Moselle. The treatment borderformerly dividing the area is highlighted in white. Darkershades reflect higher values.
(b) Turnout 1969
LegendTurnout 1992
0.00 % - 60.00 % 60.01 % - 70.00 % 70.01 % - 80.00 %80.01 % - 100.00 %
0 25 50 Kilometers
Notes (c): Turnout in the referendum in 1992. Thetreatment border formerly dividing the area is highlightedin white. Darker shades reflect higher values.
(c) Turnout 1992
Legend
Turnout 2005
0.00 % - 60.00 %
60.01 % - 70.00 %
70.01 % - 80.00 %
80.01 % - 100.00 %
0 25 50 Kilometers
Notes (d): Turnout in the referendum in 2005. Thetreatment border formerly dividing the area is highlightedin white. Darker shades reflect higher values.
(d) Turnout 2005
45
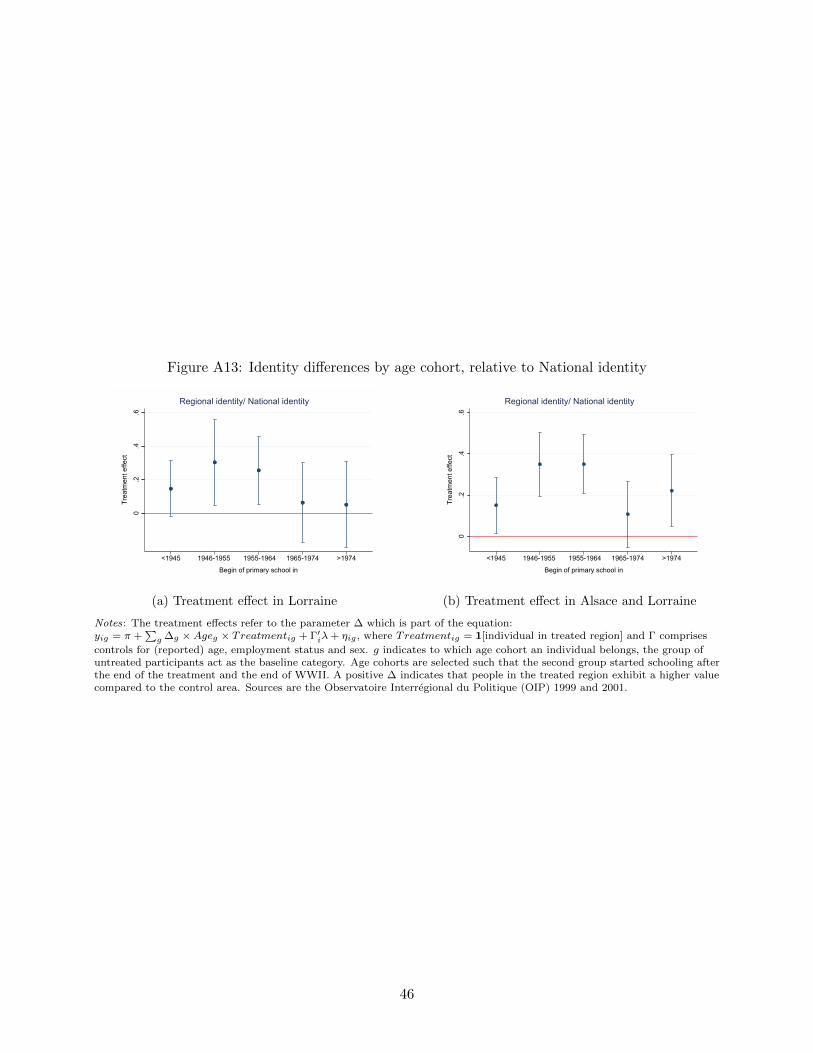
Figure A13: Identity differences by age cohort, relative to National identity
0.2
.4.6
Trea
tmen
t effe
ct
<1945 1946-1955 1955-1964 1965-1974 >1974
Begin of primary school in
Regional identity/ National identity
(a) Treatment effect in Lorraine
0.2
.4.6
Trea
tmen
t effe
ct
<1945 1946-1955 1955-1964 1965-1974 >1974
Begin of primary school in
Regional identity/ National identity
(b) Treatment effect in Alsace and Lorraine
Notes: The treatment effects refer to the parameter ∆ which is part of the equation:yig = π +
∑g ∆g ×Ageg × Treatmentig + Γ′iλ+ ηig , where Treatmentig = 1[individual in treated region] and Γ comprises
controls for (reported) age, employment status and sex. g indicates to which age cohort an individual belongs, the group ofuntreated participants act as the baseline category. Age cohorts are selected such that the second group started schooling afterthe end of the treatment and the end of WWII. A positive ∆ indicates that people in the treated region exhibit a higher valuecompared to the control area. Sources are the Observatoire Interregional du Politique (OIP) 1999 and 2001.
46

Table A27: Discontinuities in referenda results, within Lorraine, controlling for historical migration
Dep. Variable: Share Yes 1969 Share Yes 1992 Share Yes 2005(1) (2)a (3) (4)a (5) (6)a
Treatment 11.937 10.809 3.637 5.777 3.547 7.227(2.515) (1.590) (1.813) (1.124) (2.064) (1.366)
[<0.001] [<0.001] [0.046] [<0.001] [0.087] [<0.001]Obs. 373 1260 393 1508 393 1102Dist 10 km 44.43 km 10 km 53.22 km 10 km 32.86 km
Notes: Discontinuity at the treatment border using municipalities in Lorraine, controlling for migration between 1916 and1946 (changes in population between 1916 and 1926, between 1936 and 1946, and between 1916 and 1946). Outcomes areshare of Yes votes in the 1969 referendum, share of Yes votes in the 1992 referendum, and share of Yes votes in the 2005referendum. Conley standard errors in parentheses and p-values in brackets.
a Estimates from using the optimal IK bandwidth.
47

Figure A14: RD plots, within Lorraine (50 kilometers, 20km in paper), 1st degree polynomial
● ●
● ●●
●●
●
●
●
●●
●
●●
●●
●
●●
40
50
60
70
80
−50 −25 0 25 50
km
Sha
re Y
es 1
969
(a) Share Yes 1969
●
●●
●●
● ● ● ● ●
●● ●
● ● ● ● ●● ●
30
40
50
60
70
−50 −25 0 25 50
km
Sha
re Y
es 1
992
(b) Share Yes 1992
● ● ●● ● ●
● ● ● ●
●●
● ● ●●
●● ● ●
30
40
50
60
70
−50 −25 0 25 50
km
Sha
re Y
es 2
005
(c) Share Yes 2005
Notes: RD plots, using municipalities in Lorraine. Fitted line based on first degree polynomial. Black dots represent meansusing 5km bins.
48

Figure A15: RD plots, within Lorraine (50 kilometers), 2nd degree polynomial
● ●● ● ●
●● ●
●●
●●
●● ●
●●
●●
●
40
60
80
−50 −25 0 25 50
km
Sha
re Y
es 1
969
(a) Share Yes 1969
●
●●
●●
● ● ● ●●
●●
●
● ● ● ● ●
●●
40
50
60
70
−50 −25 0 25 50
km
Sha
re Y
es 1
992
(b) Share Yes 1992
● ● ●●
●●
● ● ● ●
●
●●
● ●
●●
● ● ●
30
40
50
60
−50 −25 0 25 50
km
Sha
re Y
es 2
005
(c) Share Yes 2005
Notes: RD plots, using municipalities in Lorraine. Fitted line based on 2nd degree polynomial. Black dots represent meansusing 5km bins.
49

I Placebo regressions
Table A28: Placebo test: Border between Alsace and Lorraine, and the rest of France
Panel A: Share Yes 1992Variable (1) (2) (3) (4)a
Treatment -3.168 -0.649 0.058 3.170(2.040) (1.728) (1.465) (0.769)[0.121] [0.707] [0.968] [<0.001]
Obs. 404 606 814 11416Dist 10 km 15 km 20 km 218.68 km
Panel B: Share Yes 2005Variable (1) (2) (3) (4)a
Treatment 0.208 1.045 1.496 0.135(2.006) (1.666) (1.453) (0.735)[0.917] [0.531] [0.303] [0.854]
Obs. 405 608 816 10899Dist 10 km 15 km 20 km 209.71 km
Notes: RD estimates using bandwidths of 10, 15, and 20 kilometers from the border between Alsace and Lorraine, and therest of France. Included controls: distance to Germany (border), distance to Metz, distance to Strasbourg, and distance toNancy. Conley standard errors in parentheses and p-values in brackets.
a Estimates from using the optimal IK bandwidth.
50

Visualization of Border Department Variables
Figure A16: Departments at the national borders: 1st and 2nd row
0 90 18045 KilometersPeriphery DepartmentsFirst RowSecond Row
Notes: This is the visualization of the border variable used in the robustness section of this paper. The dummy equals 1 (darkgrey) if the department is located at French national border and 0 (light grey) if the department borders one department, forwhich the dummy variable is 1.
51

Table A29: Survey results, comparing border regions with their adjacent neighbors
Survey question Mean,control
∆ P-value No. obs.
Feel close to region (Regional identity) 3.355 -0.003 0.982 8108Feel close to nation (National identity) 3.635 -0.122 0.169 8116Feel close to the EU (EU identity) 2.621 -0.040 0.754 8027Regional identity/National identity (standardized) -0.046 0.044 0.694 8100Democracy works well in France 2.526 0.095 0.472 8104Democracy works well within region 2.622 0.181 0.139 7932Well informed about regional policies 2.591 0.054 0.669 8058In favor: transfer policy competence to region (avg. 10) 3.058 -0.099 0.206 3793In favor: allow more autonomy at reg. level (avg. 5) 2.223 0.675 <0.001 8110Opinion about project of regional council 1.895 -0.021 0.745 4635Educ. policy should be set at reg. level (avg. 5) 2.872 0.022 0.857 3397Concerned reg. admin. would increase interreg. inequality 3.170 -0.114 0.578 3397Satisfaction with democracy in EU 2.274 -0.022 0.891 3218France part of EU is a good thing 0.321 0.013 0.914 1259
Notes: Sources are the Observatoire Interregional du Politique (OIP) 1999, 2001, and 2003, and the Panel Electoral Francais2002, using respondents in all departement bordering a foreign country, and their adjacent neighbors (except departementsin Alsace and Lorraine). Identity is measures on a 4-point Likert-scale. Avg. ”x” indicates that the factor is composed of ”x”underlying survey items. The underlying survey questions are shown in Table A2. A positive ∆ indicates that respondents ina border departement agree, on average, more with the statement than respondents in departements adjacent to departementsat national borders.
52

Table A30: Placebo test: RD estimates at the pre-1870 border between historical Moselle and Meurthe, within current Moselle
Panel A: Share Yes 69Within current Moselle Within current Meurthe-et-Moselle
Variable (1) (2) (3) (4)a (5) (6) (7) (8)a
Treatment 1.185 -2.383 -3.833 -3.923 -1.512 7.934 6.108 -6.839(2.558) (2.226) (2.081) (2.002) (6.570) (6.059) (5.789) (4.120)[0.644] [0.285] [0.066] [0.051] [0.819] [0.195] [0.294] [0.098]
Obs. 188 270 361 424 47 75 108 525Dist 10 km 15 km 20 km 23.86 km 10 km 15 km 20 km 70.74 km
Panel B: Within current MoselleShare Yes 92 Share Yes 05
Variable (1) (2) (3) (4)a (5) (6) (7) (8)a
Treatment -1.020 -0.892 1.196 0.665 -1.832 -2.947 -1.295 0.866(2.228) (2.047) (1.909) (1.933) (2.271) (1.853) (1.659) (1.664)[0.648] [0.664] [0.532] [0.731] [0.421] [0.113] [0.436] [0.603]
Obs. 186 270 361 340 189 273 364 462Dist 10 km 15 km 20 km 18.74 km 10 km 15 km 20 km 25.65 km
Panel C: Within current Meurthe-et-MoselleShare Yes 92 Share Yes 05
Variable (1) (2) (3) (4)a (5) (6) (7) (8)a
Treatment -7.063 -10.198 -8.504 -2.539 -9.075 2.516 7.873 6.737(8.412) (6.030) (4.937) (2.479) (5.273) (6.121) (5.652) (3.249)[0.406] [0.095] [0.088] [0.306] [0.093] [0.682] [0.167] [0.039]
Obs. 50 83 116 578 50 83 116 239Dist 10 km 15 km 20 km 76.16 km 10 km 15 km 20 km 33.66 km
Notes: RD estimates at pre-1871 border between the departements Moselle and Meurthe. Panel A uses municipalities within modern Moselle while Panel B uses municipalitieswithin modern Meurthe-et-Moselle. Controls added. Conley standard errors in parentheses and p-values in brackets.
a Estimates from using the optimal IK bandwidth.Interpretation: The historical border within current Moselle provides a good placebo test, as it does mostly not follow the current borders. Note that the estimates withincurrent Meurthe-et-Moselle have different signs and switch signs for the Share Yes 05 estimations.
53

J Alternative RDD specifications - bandwidth plots
This page provides an overview over the subsequently shown bandwidth plots in which we showthe robustness of our results against variations in control variables and geographic areas. All plots
depict all coefficient from RDD regressions varying the bandwidth smoothly between 10 and 50kms. This ensures that our results are not driven by a too conservative or too large bandwidth
choice. The results show that our findings are robust to these different bandwidth choices, and notdependent on any particular mechanisms or formula for bw determination.
1969 referendum
A18a Coefficient plots on the 1969 referendum including control variables, LorraineA18b Coefficient plots on the 1969 referendum without control variables, LorraineA19a Coefficient plots on the 1969 referendum controlling for border segments, LorraineA19b Coefficient plots on the 1969 referendum controlling for the distance to the language border,
LorraineA20a Coefficient plots on the 1969 referendum controlling for longitude and latitude, LorraineA20b Coefficient plots on the 1969 referendum controlling for longitude, latitude and their interaction,
Lorraine
1992 and 2005 referenda
A3a Coefficient plots on the 1992 referendum, LorraineA3b Coefficient plots on the 2005 referendum, LorraineA21a Coefficient plots on the 1992 referendum, Alsace and LorraineA21b Coefficient plots on the 2005 referendum, Alsace and LorraineA22a Coefficient plots on the 1992 referendum within Lorraine using no controlsA22b Coefficient plots on the 2005 referendum within Lorraine using no controlsA23a Coefficient plots on the 1992 referendum within Lorraine, controlling for longitude and latitudeA23b Coefficient plots on the 2005 referendum within Lorraine, controlling for longitude and latitudeA24a Coefficient plots on the 1992 referendum within Lorraine, controlling for longitude, latitude and
their interactionA24b Coefficient plots on the 2005 referendum within Lorraine, controlling for longitude, latitude and
their interactionA25a Coefficient plots on the 1992 referendum controlling for border segmentsA25b Coefficient plots on the 2005 referendum controlling for border segmentsA26a Coefficient plots on the 1992 referendum within Lorraine controlling for border segmentsA26b Coefficient plots for the treatment effect on the 2005 referendum controlling for border segments,
LorraineA27a Coefficient plots on the 1992 referendum controlling for distance to the language border, LorraineA27b Coefficient plots on the 2005 referendum controlling for distance to the language border, Lorraine
54

Figure A17: Comparing treatment effects within Lorraine with discontinuity between border regionsand their adjacent neighbors
● ●●
0
2
4
6
8
10 km 15 km 20 kmBandwidth
Est
imat
ed tr
eatm
ent e
ffect
(a) Share Yes 1992
●
●●0
2
4
6
8
10 km 15 km 20 kmBandwidth
Est
imat
ed tr
eatm
ent e
ffect
(b) Share Yes 2005
Notes: These graphs compare the estimated treatment effects within Lorraine reported in Table 6 (red squares) with estimateddiscontinuities at the border dividing all border departements from their adjacent neighbors (red dots). 90 percent confidenceintervals, based on Conley standard errors show that in most cases, the confidence intervals overlap. However, only in a fewcases do the confidence intervals for the estimated treatment effect overlap the estimates of the discontinuity at the borderdepartements.
55

Figure A18: Estimation plots for 1969 referendum, within Lorraine
●●●
●●●●●●●●●●●●●●●●●●●●●●●●●●●●●●●●●●●●●●
10 20 30 40 50
05
10
Bandwidth, km
Coe
ffici
ent e
stim
ates
15
(a) Share Yes 1969
●●●●●●●●●●●●●●●●●●●●●●●●●●●●●●●●●●●●●●●●●
10 20 30 40 50
05
15
Bandwidth, km
Coe
ffici
ent e
stim
ates
(b) Share Yes 1969, no controls
Notes: Estimates of treatment effect, bandwidths varying between 10 to 50 kilometers, within Lorraine. 1st degree polynomial. Dashed vertical line at the optimal IKbandwidth. Solid vertical lines represent 90% confidence intervals (based on Conley standard errors). (a) shows the results with controls, (b) without controls.
56

Figure A19: Estimation plots, 1969 referendum, controlling for border segments, and distance to language border
●●●
●●●●●●●●●●●●●●●●●●●●●●●●●●●●●●●●●●●●●●
10 20 30 40 50
05
10
Bandwidth, km
Coe
ffici
ent e
stim
ates
(a) Control for border segments
●●●
●●●●●●●●●●●●●●●●●●●●●●●●●●●●●●●●●●●●●●
10 20 30 40 50
05
10
Bandwidth, km
Coe
ffici
ent e
stim
ates
(b) Control for distance to language border
Notes: Estimates of treatment effect, bandwidth of 10 to 50 kilometres, within Lorraine. (a) adds controls for border segments and (b) controls for distance to language border.Dashed vertical line at the optimal IK bandwidth. Solid vertical lines represent 90% confidence intervals (based on Conley standard errors).
57

Figure A20: Estimation plots, 1969 referendum, controlling for longitude, latitude and their interaction
●●●
●●●●●●●●●●●●●●●●●●●●●●●●●●●●●●●●●●●●●●
10 20 30 40 50
05
10
Bandwidth, km
Coe
ffici
ent e
stim
ates
(a) Controlling for longitude and latitude
●●●
●●●●●●●●●●●●●●●●●●●●●●●●●●●●●●●●●●●●●●
10 20 30 40 50
05
10
Bandwidth, km
Coe
ffici
ent e
stim
ates
(b) Controlling for longitude and latitude, and interaction
Notes: Estimates of treatment effect, bandwidth of 10 to 50 kilometres, within Lorraine, controlling for longitude, latitude and their interaction. Dashed vertical line at theoptimal IK bandwidth. Solid vertical lines represent 90% confidence intervals (based on Conley standard errors). It is unclear whether controls should be included in these kindof regressions, but as the graphs show this does not affect our results.
58

Figure A21: Estimation plots for 1992 and 2005 referenda, whole border
●●●
●●●●●●●●●●●●●●●●●●●●●●●●●●●●●●●●●●●●●●
10 20 30 40 50
−2
26
Bandwidth, km
Coe
ffici
ent e
stim
ates
(a) Referendum 1992
●●●●●●●●●●●●●●●●●●●●●●●●●●●●●●●●●●●●●●●●●
10 20 30 40 50
−2
26
Bandwidth, km
Coe
ffici
ent e
stim
ates
(b) Referendum 2005
Notes: Estimates of treatment effect, bandwidths varying between 10 to 50 kilometres, for the whole border. Local linear regressions, i.e. using a 1st degree polynomial. Dashedvertical line at the optimal IK bandwidth. Solid vertical lines represent 90% confidence intervals (based on Conley standard errors).
59

Figure A22: Estimation plots for 1992 and 2005 referenda, no controls
●●●●●●
●●●●●●●●●●●●●●●●●●●●●●●●●●●●●●●●●●●
10 20 30 40 50
−2
26
Bandwidth, km
Coe
ffici
ent e
stim
ates
(a) Referendum 1992
●●●●●●●●●●●●●●
●●●●●●●●●●●●●●●●●●●●●●●●●●●
10 20 30 40 50
−2
26
Bandwidth, km
Coe
ffici
ent e
stim
ates
(b) Referendum 2005
Notes: Estimates of treatment effect, bandwidth of 10 to 50 kilometres, within Lorraine. Local linear regressions, i.e. using a 1st degree polynomial. This specification isincluding no controls to show that these are not driving our main result. Dashed vertical line at the optimal IK bandwidth. Solid vertical lines represent 90% confidence intervals(based on Conley standard errors).
60

Figure A23: Estimation plots, controlling for longitude and latitude
●●●●●●●●●●
●●●●●●●●●●●●●●●●●●●●●●●●●●●●●●●
10 20 30 40 50
−2
26
Bandwidth, km
Coe
ffici
ent e
stim
ates
(a) Referendum 1992
●●●●●●●●●●●●●●
●●●●●●●●●●●●●●●●●●●●●●●●●●●
10 20 30 40 50
−2
26
Bandwidth, km
Coe
ffici
ent e
stim
ates
(b) Referendum 2005
Notes: Estimates of treatment effect, bandwidth of 10 to 50 kilometres, within Lorraine. These specifications are in addition controlling for longitude and latitude. Dashedvertical line at the optimal IK bandwidth. Solid vertical lines represent 90% confidence intervals (based on Conley standard errors). As the graphs clearly show that the resultsare not substantially altered by the inclusion.
61

Figure A24: Estimation plots, controlling for longitude, latitude and their interaction
●●●
●●●●●●●●●●●●●●●●●●●●●●●●●●●●●●●●●●●●●●
10 20 30 40 50
−2
24
6
Bandwidth, km
Coe
ffici
ent e
stim
ates
(a) Referendum 1992
●●●●●●●●●●●●●●●●●●●●●●●●●●●●●●●●●●●●●●●●●
10 20 30 40 50
−2
26
10
Bandwidth, km
Coe
ffici
ent e
stim
ates
(b) Referendum 2005
Notes: Estimates of treatment effect, bandwidth of 10 to 50 kilometres, within Lorraine, controlling for longitude, latitude and their interaction. Dashed vertical line at theoptimal IK bandwidth. Solid vertical lines represent 90% confidence intervals (based on Conley standard errors). It is debated whether these controls should be included inthese kind of regressions, but as the graphs clearly show our results are not depending on it.
62

Figure A25: Estimation plots for 1992 and 2005 referenda, controlling for border segments
●●●
●●●●●●●●●●●●●●●●●●●●●●●●●●●●●●●●●●●●●●
10 20 30 40 50
−2
26
Bandwidth, km
Coe
ffici
ent e
stim
ates
(a) Referendum 1992
●●●●●●●●●●●●●●●●●●●●●●●●●●●●●●●●●●●●●●●●●
10 20 30 40 50
−2
26
Bandwidth, km
Coe
ffici
ent e
stim
ates
(b) Referendum 2005
Notes: Estimates of treatment effect, bandwidth of 10 to 50 kilometres, all of Alsace and Lorraine, controlling for north, mid, and south border segments. Dashed vertical lineat the optimal IK bandwidth. Solid vertical lines represent 90% confidence intervals (based on Conley standard errors). It is an ongoing debate whether this type of controlshould be included in this type of regression, but as the graphs clearly show our results are not affected by this.
63

Figure A26: Estimation plots for 1992 and 2005 referenda, controlling for border segments (within Lorraine)
●●●●●
●●●●●●●●●●●●●●●●●●●●●●●●●●●●●●●●●●●●
10 20 30 40 50
−2
26
Bandwidth, km
Coe
ffici
ent e
stim
ates
(a) Referendum 1992
●●●●●●●●●●●●●●●●●●●●●●●●●●●●●●●●●●●●●●●●●
10 20 30 40 50
−2
26
10
Bandwidth, km
Coe
ffici
ent e
stim
ates
(b) Referendum 2005
Notes: Estimates of treatment effect, bandwidth of 10 to 50 kilometres, within Lorraine, controlling for north, mid, and south border segments. Dashed vertical line at theoptimal IK bandwidth. Solid vertical lines represent 90% confidence intervals (based on Conley standard errors). It is debated whether these controls should be included inthese kind of regressions, but as the graphs clearly show our results are not depending on it.
64

Figure A27: Estimation plots, controlling for distance to language border
●●●
●●●●●●●●●●●●●●●●●●●●●●●●●●●●●●●●●●●●●●
10 20 30 40 50
−2
26
Bandwidth, km
Coe
ffici
ent e
stim
ates
(a) Referendum 1992
●●●●●●●●●●●●●●
●●●●●●●●●●●●●●●●●●●●●●●●●●●
10 20 30 40 50
−2
26
10
Bandwidth, km
Coe
ffici
ent e
stim
ates
(b) Referendum 2005
Notes: Estimates of treatment effect, bandwidth of 10 to 50 kilometres, within Lorraine, controlling for distance to the historical language border. Dashed vertical line at theoptimal IK bandwidth. Solid vertical lines represent 90% confidence intervals (based on Conley standard errors). In addition to omitting municipalities that were formerlyGerman-speaking, this is an additional test that our results are not driven by linguistic differences. It is also an indication that the border within Lorraine was truly exogenousto our outcome (and not endogenous to pre-existing linguistic differences) as the coefficients are barely affected by including the distance.
65

K Mechanisms: Newspapers & regionalist parties
Table A31: RD results: Subscription shares of regional newspaper, controlling for the number ofsales points
Share households with subscription of “Le Republicain Lorraine”Variable (1) (2) (3) (4)a
Treatment 9.880 9.958 9.979 11.122(1.376) (1.218) (1.112) (0.950)
[<0.001] [<0.001] [<0.001] [<0.001]Obs. 394 583 744 1392Dist 10 km 15 km 20 km 46.23 km
Notes: RD estimates using bandwidths of 10, 15, and 20 kilometers from the border between Alsace and Lorraine, andthe rest of France. Included controls: distance to Germany (border), distance to Metz, distance to Strasbourg, distance toNancy, and number of sales points where the newspaper can be bought locally. Conley standard errors in parentheses andp-values in brackets.
a Estimates from using the optimal IK bandwidth.
RD Plots and maps for regional newspaper subscription
Figure A28: RD plot, share of households with subscription of “Le Republicain Lorraine”, 2nddegree polynomial
●●
● ●●
●●
● ● ●
0
10
20
30
−20 −10 0 10 20
km
Sha
re s
ubsc
riptio
ns
Notes: RD plots using only municipalities within Lorraine. Fitted line based on 2st degree polynomial.
66

Figure A29: Newspaper subscription shares
Legend
Newspaper subscription, in percent
0,00
0,01 - 5,00
5,01 - 10,00
10,01 - 20,00
20,01 - 33,00
Notes: Municipal level averages share of newspapers subscribers to Le Republicain Lorraine within Lorraine. The white solidline indicates the treatment border that divided the region. The treated area is on the right hand side of the white line. Whitemunicipality polygons indicate missing data. Darker colors reflect higher shares, and indicate a higher regional identity.
67

Le Republicain Lorraine
Figure A30: Subscription page Le Republicain Lorraine (1)
Notes: This is from the subscription page of the newspaper. We use the number of all subscriptions, but our source suggestedthat almost all subscriptions were still print subscriptions in 2014.
Figure A31: Subscription page Le Republicain Lorraine (2)
Notes: This is from the subscription page of the newspaper. We use the number of all subscriptions, but our source suggestedthat almost all subscriptions were still print subscriptions in 2014.
68

Figure A32: Homepage (main) Le Republicain Lorraine
Notes: This screenshot shows a random example of the main news contained in the newspaper (Date: 2017.19.10).
Figure A33: Homepage (regional) Le Republicain Lorraine
Notes: This screenshot shows an example of the regional news contained in the newspaper (Date: 19.10.2017).
69

Regionalist parties
Figure A34: Vote shares of regionalist parties
Legend
Vote share for regionalist parties, as percent
0,00 - 1,00
1,01 - 2,00
2,01 - 5,00
5,01 - 10,00
10,01 - 36,73
Notes: Municipal level vote shares for the list “Non a l’ACAL, Oui a nos regions!” in the 2015 regional elections. The listcomprised of the parties “Unser Land”, “Parti des Mosellans”, and “Parti Lorrain”. The white solid line represents thetreatment border formerly dividing the region. Darker colors reflect higher shares, and indicate a higher regional identity.
70

L Twitter
Georeferencing
There are two ways in which Twitter users indicate their geographic location:
1. User-provided georeferencing: User can tag a location in their tweet directly. This typeof tweet is unreliable for research, because the location tagged doesn’t necessarily coincidewith the location of the person tweeting.
2. GPS-provided georeferencing: The GPS function in mobile phones allows Twitter mes-sages sent via the phone to contain the coordinates of the user’s location. Due to the op-tionality of the GPS function, only 2- 3 percent of all Twitter users can be georeferenced thisway. Due to the abundance of tweets, this method still generates a large number of possibleobservations.
Availability of data
It is possible to collect a random selection of tweets at any given point in time via Twitter’s API(Application Programming Interface).
Twitter data Lorraine
The relevant tweets were identified and analyzed in a three-step process.
1. Over the period of the Football World Cup 2014 a random sample of tweets was obtained viaTwitter’s API. This method resulted in 18’278 observations.
2. Because Twitter only allows for data selection in geographic areas of rectangular shape,ArcGIS was used to identify the tweets specifically located in Lorraine.
3. The content of the selected tweets were then analyzed based on a selection of keywords aboutthe German and French national football teams. The lists of keywords are displayed inTable A32.
71

Table A32: List of Twitter Keywords
List France List Germany
les Bleus #BLEUS mannschaft allemagne#SPAFRA #FRA DFB Team #GER#ESPFRA #UKRFRA #GERPOL #FRAGER#SWEFRA #SUIFRA #FRADEU #FRAALL#SWIFRA #ECUFRA #TeamGermany #DEULandreau Lloris #ALL #HOLDEU
Ruffier Debuchy #NEDGER #NEDALLDigne Evra #DENDEU #DANDEU
Koscielny Mangala #DANGER #DENGERSagna Sakho #DANALL #DENALLVarane Cabaye #USAGER #USAALLMatuidi Mavuba #USADEU #BRADEUPogba Schneiderlin #BRAALL #BRAGERSissoko Valbuena Neuer Wiese
Benzema Cabella Zieler BadstuberGiroud Griezmann Boateng HowedesRemy Deschamps Hummels Lahm
Carrasso Mandanda Mertesacker SchmelzerClichy Mexes Bender GotzeRami Reveillere Gundogan Khedira
Arfa Diarra Kroos OzilM’Vila Malouda Reus Schweinsteiger
Marvin Martin Nasri Gomez KloseRibery Valbuena Muller PodolskiMenez Blanc Schurrle Low
Boghossian Gasset Flick KopkeRaviot Weidenfeller Durm
Großkreutz MustafiDraxler GinterKramer
72

M Links: Examples of other suppressed regions
• Scania, Swedenhttps://sverigesradio.se/sida/artikel.aspx?programid=83&artikel=1915851
• Silesia, Bohemia, Kaliningrad and Danzig, Poland and the Czech Republichttp://homepage.univie.ac.at/philipp.ther/breslau/html/Entdeutschung%20und%20Polonisierung.%20Die%20Umwandlung%20Breslaus%20in%20eine%20polnische%20Stadt.htmlhttps://web.archive.org/web/20071208130441http://www.haus.pl/de/opis/arb4.htmlhttps://www.britannica.com/place/Silesiahttps://www.economist.com/eastern-approaches/2013/05/07/the-expulsion-of-sudeten-germans-is-still-rawhttps://www.britannica.com/place/Bohemiahttps://www.britannica.com/place/Gdansk
http://dfk-danzig.eu/de/deutsche-in-danzig/deutsche-in-danzig
• Chechnya, Russiahttps://www.britannica.com/place/Chechnyahttp://linguistics.berkeley.edu/ ingush/ingush people.html
https://www.economist.com/news/2003/03/25/putins-proposition
• Kurds in Turkey, Iran, Iraq and Syriahttps://www.nytimes.com/2008/02/17/magazine/17turkey-t.html?ex=1361854800&en=df64cf85326e2103&ei=5124&partner=permalink&exprod=permalink
https://www.bbc.com/news/world-middle-east-29702440
• South Tyrol, Italyhttps://www.tandfonline.com/doi/full/10.1080/1369183X.2017.1352465
• Xinjiang, Chinahttps://www.economist.com/china/2015/06/27/tongue-tied
https://www.economist.com/briefing/2018/05/31/china-has-turned-xinjiang-into-a-police-state-like-no-other
• Tibet, currently occupied by Chinahttps://www.economist.com/china/2016/09/17/the-plateau-unpacified
https://www.nytimes.com/2010/07/25/world/asia/25tibet.html
• Crimea, formerly in Ukrain, annexed by Russia 2014https://www.economist.com/news/2015/06/11/bad-memory
https://www.economist.com/eastern-approaches/2014/03/17/ukraines-amputation
73

Additonal References
Alesina, A. and E. Spolaore (1997): “On the Number and Size of Nations,” The QuarterlyJournal of Economics, 112, 1027–1056.
Anderson, M. (1972): “Regional Identity and Political Change: The Case of Alsace from theThird to the Fifth Republic,” Political Studies, 20, 17–30.
Boomgaarden, H. G. and A. Freire (2009): “Religion and Euroscepticism: Direct, Indirect orno Effects?” West European Politics, 32, 1240–1265.
Boswell, L. (2008): “Should France be ashamed of its history? Coming to terms with the past inFrance and its eastern Borderlands,” Totalitarian Movements and Political Religions, 9, 237–251.
Callender, H. (1927): “Alsace-Lorraine Since the War,” Foreign Affairs, 5, 427–437.
Carrol, A. (2010): “Socialism and National Identity in Alsace from Reichsland to Republique,1890-1921,” European History Quarterly, 40, 57–78.
Carrol, A. and L. Zanoun (2011): “The View from the Border: A Comparative Study ofAutonomism in Alsace and the Moselle, 1918–29,” European Review of History, 18, 465–486.
Collins, J. (2007): “Beyond history: Memory and justice at oradour-sur-glane,” ContemporaryFrench Civilization, 31, 203–230.
De Gaulle, C. (1969): “Entretien avec le journaliste Michel Droit, avant le referendum sur la cre-ation des regions et la reforme du Senat fixe au 27 avril,” https://fresques.ina.fr/de-gaulle/fiche-media/Gaulle00282/entretien-avec-michel-droit.html.
De La Valette, J. (1925): “The Absorption of Alsace and Lorraine,” Journal of the BritishInstitute of International Affairs, 4, 30–46.
Dehdari, S. and K. Gehring (2016): “The Origins of Common Identity: Division, Homogeniza-tion Policies and Identity Formation in Alsace-Lorraine,” Center for Comperative and Interna-tional Studies (CIS), Working paper.
Goodfellow, S. (1993): “From Germany to France? Interwar Alsatian National Identity,” FrenchHistory, 7, 450–471.
Grasser, J.-P. (1998): Une Histoire de l’Alsace, vol. 1, Editions Jean-Paul Gisserot.
Harp, S. L. (1998): Learning to be Loyal: Primary Schooling as Nation Building in Alsace andLorraine, 1850-1940., De Kalb: Northern Illinois University Press.
Harvey, D. A. (1999): “Lost Children or Enemy Aliens? Classifying the Population of AlsaceAfter the First World War,” Journal of Contemporary History, 34, 537–554.
Heffernan, M. (2001): “History, Geography and the French National Space: The Question ofAlsace-Lorraine, 1914-18,” Space and Polity, 5, 27–48.
Hopel, T. (2012): “The French-German Borderlands: Borderlands and Nation-building in the19th and 20th Centuries,” European History Online (EGO).
Lancelot, M.-T. and A. Lancelot (1970): “Atlas des elections francaises de 1968 et 1969,”Revue francaise de science politique, 312–328.
74

Leleu, C. (1976): “The French Referendum of April 23, 1972,” European Journal of PoliticalResearch, 4, 25–46.
Minkenberg, M. (2009): “Religion and Euroscepticism: Cleavages, Religious Parties and Churchesin EU member States,” West European Politics, 32, 1190–1211.
Silverman, D. P. (1966): “Political Catholicism and Social Democracy in Alsace-Lorraine, 1871-1914,” The Catholic Historical Review, 52, 39–65.
Vlachos, S. (2017): “Inglorious Wars and Political Radicalisation,” mimeo.
Zanoun, L. (2009): “Interwar Politics in a French Border Region: the Moselle in the Period of thePopular Front, 1934-1938,” Ph.D. thesis, The London School of Economics and Political Science(LSE).
75