Working Paper 608 February 2022
68
Working Paper 608 February 2022 The Long-Run Decline of Education Quality in the Developing World Abstract We use comparable, survey-based literacy tests for repeated cross-sections of men and women born between 1950 and 2000 to study education outcomes across cohorts in 87 countries. We find that education quality, defined as literacy conditional on completing five years of schooling, stagnated or declined across the developing world over half a century, with pronounced drops in both South Asia and sub-Saharan Africa. Increases in schooling outpaced the decline in education quality, leading to large increases in unconditional literacy. Shifts in student composition can explain only part of the downward trend in education quality we observe: the decline pre-dates the abolition of school fees in most countries, and patterns in adult height suggest students in later decades were healthier and wealthier than those in earlier cohorts. www.cgdev.org Alexis Le Nestour, Laura Moscoviz, and Justin Sandefur Keywords:literacy, school quality, access to education JEL: I25, N37, O15
-
Upload
khangminh22 -
Category
Documents
-
view
2 -
download
0
Transcript of Working Paper 608 February 2022
Working Paper 608 February 2022
The Long-Run Decline of Education Quality in the Developing World
Abstract
We use comparable, survey-based literacy tests for repeated cross-sections of men and women born between 1950 and 2000 to study education outcomes across cohorts in 87 countries. We find that education quality, defined as literacy conditional on completing five years of schooling, stagnated or declined across the developing world over half a century, with pronounced drops in both South Asia and sub-Saharan Africa. Increases in schooling outpaced the decline in education quality, leading to large increases in unconditional literacy. Shifts in student composition can explain only part of the downward trend in education quality we observe: the decline pre-dates the abolition of school fees in most countries, and patterns in adult height suggest students in later decades were healthier and wealthier than those in earlier cohorts.
www.cgdev.org
Alexis Le Nestour, Laura Moscoviz, and Justin Sandefur
Keywords:literacy, school quality, access to education
JEL: I25, N37, O15

Center for Global Development2055 L Street NW
Washington, DC 20036
202.416.4000(f) 202.416.4050
www.cgdev.org
The Long-Run Decline of Education Quality in the Developing World
Alexis Le Nestour, Laura Moscoviz, Justin SandefurCenter for Global Development
This project benefited from discussions with Girin Beeharry, Asyia Kazmi, and Lant Pritchett, and comments from Maryam Akmal, Lee Crawfurd, David Evans, Eric Hanushek, Susannah Hares, Kim Lehrer, Isaac Mbiti, Jack Rossiter, Arvind Subramanian, Francis Teal, Andrew Zeitlin, and seminar participants at RISE and CSAE Oxford. This work was supported by a grant from the Bill & Melinda Gates Foundation. The views expressed here should not be attributed to the Center for Global Development or its funders. All remaining errors are our own.
Alexis Le Nestour, Laura Moscoviz, and Justin Sandefur, 2022. “The Long-Run Decline of Education Quality in the Developing World.” CGD Working Paper 608. Washington, DC: Center for Global Development. https://www.cgdev.org/publication/long-run-decline-education-quality-developing-world
The Center for Global Development works to reduce global poverty and improve lives through innovative economic research that drives better policy and practice by the world’s top decision makers. Use and dissemination of this Working Paper is encouraged; however, reproduced copies may not be used for commercial purposes. Further usage is permitted under the terms of the Creative Commons License.
The views expressed in CGD Working Papers are those of the authors and should not be attributed to the board of directors, funders of the Center for Global Development, or the authors’ respective organizations.

1 Introduction
International organizations like the World Bank and UNESCO have declared a “learningcrisis” in the developing world, with many school systems failing to reliably produce evenbasic literacy and numeracy skills [World Bank, 2018, UNESCO, 2013]. Pupils in India,for instance, score on average at about the 5th percentile for pupils at a similar grade inadvanced economies on international learning assessments, while nearly 80 percent of SouthAfrican children cannot read for meaning in any language by fourth grade [Das and Zajonc,2010, Howie et al., 2017]. The economic consequences of improving education quality arepoorly understood, but potentially large. Recent work in the macroeconomics of developmenthas suggested that education quality may outperform quantity measures in explaining long-run growth in econometric tests, and accounting for quality differentials roughly doublesthe explanatory power of education in a development accounting framework [Hanushek andKimko, 2000, Hanushek and Wossmann, 2006, Schoellman, 2012].1
The idea of a learning “crisis” implies something new. But we lack reliable, long-termmeasures of education quality over time, particularly for the developing world, to evaluatecompeting explanations for this crisis.2 For instance, one prominent narrative is that theexpansion of mass schooling, e.g., after the abolition of user fees in many African countries inthe 1990s and 2000s, led to a quality decline [Ruto and Mugo, 2005, Pritchett, 2013, Taylorand Spaull, 2013, Atuhurra, 2016].3 Another complementary narrative is that countries atthe top of the league table in international learning assessments (e.g., Finland or Vietnam)hold reform lessons for their neighbors [Sahlberg, 2007, Dang and Glewwe, 2018]. Thisargument often attributes current success to current educational policies, and elides thequestion of timing. Is, say, Vietnam’s success a feature of reforms to its education systemduring its recent liberalization period, or a longer-standing national characteristic? Are the
1This view is not universal: Caselli [2005] questions the explanatory power of test scores in developmentaccounting, based on the weak observed Mincerian returns to test scores for individual incomes in U.S. microdata. Kraay [2018] suggests a different approach, eschewing the Mincerian literature, and attributing abigger role to education quality.
2While a number of developing countries have participated in multiple rounds of international or regionallearning assessments, the time span covered is generally limited. For instance, 14 African countries partic-ipated in two rounds of the SACMEQ study from 2000 to 2007 while the PASEC, which covers 18 Africancountries, started in 1995 but has no strict comparability across countries before 2014 and no comparabletime series. 19 Latin American countries participated in the Laboratorio SERCE and TERCE tests from1997 to 2019, and 41 developing countries participated in multiple rounds of TIMSS, PIRLS, or PISA,generally spanning just a single decade or less.
3Though see also Blimpo et al. [2019] for a contradictory finding from The Gambia.
2

lagging learning outcomes in India, or the truly abysmal outcomes we document in Nigeria,the result of a contemporary crisis or do they have deeper historical roots?
To answer these questions, we construct new, comparable time series of education qualityfor 88 developing countries, stretching from cohorts born in the 1950s up to the late 1990s.We define education quality as the literacy rate for an adult with a given level of schooling,typically five years of primary school. This is roughly analogous to major internationallearning assessments such as TIMSS, PIRLS, etc., which measure education quality withstandardized tests in a specified grade. To estimate literacy across age cohorts, we draw onrepeated cross-sections from the Demographic and Health Surveys (DHS) run by USAID andMultiple Indicator Cluster Surveys (MICS) run by UNICEF, which provide direct, ratherthan self-reported, tests of literacy for adult women and, in a subset of survey rounds, men,aged 15 to 49, mostly measured between the early 2000s and late 2010s. We also disaggregateresults for some larger countries, i.e., India, Nigeria, and Indonesia, to look for patterns ofdivergence or convergence among sub-national units.
The core analytical challenge throughout the paper is to identify cohort effects in re-peated cross-sectional data. As is well known, age, period, and cohort effects cannot beseparately identified in a simple linear model without invoking auxiliary assumptions aboutthe underlying data generating process [Fosse and Winship, 2019]. To achieve identification,we follow Deaton and Paxson [1994] and impose the restriction that period effects sum tozero and are orthogonal to a trend. This method has been widely used in the economicsliterature dealing with age, period and cohort models (e.g., by Lagakos et al. [2018] to esti-mate experience-wage profiles). In our setting, the substantive content of the Deaton-Paxsonnormalization is that we allow for literacy to accumulate or decay over an individual’s lifecycle, and to vary from one cohort to another, but rule out sustained periods where the adultpopulation acquires or loses literacy en masse. This assumption is corroborated by ,the factindividuals with zero schooling also show nearly zero literacy in our data with no upwardtrend over time. In short, we interpret systematic differences between surveys that cannotbe accounted for by age or cohort effects as survey effects, i.e., artifacts of data collectionrather than facts about the world.
Results from our age-period-cohort model of literacy rates reveal a picture of overallstagnation in education quality in the developing world, and fairly stable gaps in qualityacross countries. We find virtually no case worldwide of dramatic improvements in educationquality over a fifty-year time horizon, and for most of the 87 countries in our sample we see
3
flat lines, with little movement up or down. This flat trend holds over multiple decades forsome notable high-performers like Burundi and Vietnam, and low-performers like Nigeria.However, we also find evidence of significant secular decline in education quality for a smallnumber of large developing countries, notably India and Ethiopia.
Changing patterns of selection into school are an obvious potential explanation for de-clines in measured quality, which we explore in detail in Section 6. This is particularlysalient given the dramatic increase in average years of schooling observed in most countriesin our sample over this time frame, and the possibility that marginal students possessedlower levels of non-school inputs in the human capital production function (e.g., worse nu-trition). Indeed, we find that on average the selection of pupils into schooling on the basis ofheight, a characteristic largely determined prior to schooling decisions, weakens over time.Furthermore, in countries and time periods where enrollment expanded more rapidly, edu-cation quality declined more quickly, consistent with (though clearly not definitive proof of)a selection effect. Controlling for pupil height or local enrollment trends significantly damp-ens the measured downward trend in education quality in our overall sample, but leavesa significant negative trend for both men and women. Furthermore, average adult heightamong individuals who went to school is increasing over this period, implying that enteringpupils may have been better prepared in absolute terms even if they comprised a less selectgroup relative terms. We also find, on average, no significant trend break in observed educa-tion quality when countries abolished user fees for primary schooling, a policy change whichputatively expanded access to schooling for marginal pupils.
Our results add a new dimension (i.e., the evolution of quality over time) to the largeliterature measuring human capital around the world, with relevance for a variety of empiricalapplications. The most widely used human capital measure in the economics, based on Barroand Lee [1993] and subsequent updates, focused initially on quantity rather than quality.More recent work has incorporated richer measures of education quality, but this has comeat the cost of either limited coverage for the developing world, or short time series [Yue Yin,2018, Sulis et al., 2020, Gustafsson, 2016, Van Damme and Bellens, 2017, Kraay, 2018, Pateland Sandefur, 2020]. 4By combining a quality dimension with long time series and broad
4The World Bank’s Harmonized Learning Outcomes, based on early work by Altinok and Murselli [2007]and extended and refined in Altinok et al. [2018], is an important instance of this approach, which covers alarge number of developing countries and reports figures from 1965 onward. Note, however, that the actualtesting data before 1990 covers only 23, mostly advanced economies, increasingly gradually thereafter. Thusin more recent applications the World Bank has restricted focus to a 2000-2017 timeframe [Angrist et al.,2021]. Our approach here sacrifices some of the richness of the learning assessments used in this test
4
developing country coverage, the results here would potentially enable future work to revisitearlier cross-country findings on the determinants of test-score performance, and conversely,the role of education quality in promoting economic development [Hanushek and Wossmann,2006, Wossmann and Hanushek, 2007]. As an illustration, we find a strong correlation ofquality with subsequent economic growth in our developing country sample, though thisfinding is not robust to controlling for unobserved country effects.
The following section describes the coverage of our survey data sources in more detailand in Section 3 we describe and present some basic validation tests of our measure ofeducation quality. We then turn to our core empirical strategy to overcome the challengeof disentangling age, period, and cohort effects in repeated cross-sectional data on literacyin Section 4. Having found mostly downward trends in observed quality, Section 6 thenexamines whether changing patterns of selection into schooling drive these trends. Finally,Section 5 presents various stylized facts based on the trends in education quality that wecalculate, and section 7 concludes.
2 Data
Our dataset consists in the universe of Demographic and Health (DHS) and Multiple Indica-tor Cluster surveys (MICS) as of January 2021 with information on literacy and schooling.DHS and MICS collect nationally representative information on literacy and schooling ofwomen, and in some cases men, aged 15 to 49.5 Since 2000, reading abilities are tested witha short literacy test consisting on reading four simple sentences out loud. Interviewers thenscore individuals on a three point scale: “cannot read at all”, “able to read only parts of thesentence” and “able to read whole sentence”. We use a 0-1 scale for literacy with individuals“able to read only parts of the sentence” scoring 0.5 point. Prior to 2000, literacy was self-reported by individuals on a similar three point scale and surveys with self-reported data onliteracy are excluded to keep a consistent measure of literacy over time.
The surveys do not test individuals with secondary schooling and, in a few MICS surveys,also lack literacy data on individuals with no schooling. In the latter case, we make the
linking literature to allow us to (a) avoid difficult questions about harmonization by relying on identicalsurvey questions across countries, and (b) directly measure literacy across cohorts spanning multiple decadeswithout imputation or extrapolation.
5While statistics for women are nationally representative, those for men are often not perfectly so, becausemen are sampled only from households with adult women present.
5

assumption that individuals with no schooling are illiterate.6 We follow the DHS and MICSconvention of assuming that individuals with secondary education are literate to constructtrends of literacy.7
Note this missing data problem has little effect on our analysis. While the unconditionalliteracy rates reported below rest on the assumptions we make about literacy at the top andbottom of the schooling distribution, the school quality measures that are the focus of thepaper are much less fragile to this missing data problem, as they focus on individuals withfive years of primary schooling, all of whom are tested.
Individuals chose the language they want for the literacy test. In most countries, readingcards have been translated into all local languages and across the whole woman sample thereare only 0.25 percent of tests that could not take place because of the lack of availabilityof reading cards in the local language. In a small share of interviews (0.17 percent in thewoman sample), individuals could not be tested because they are visually impaired. Theseobservations are excluded from the analysis and the final woman sample includes 99.5 percentof the observations.
Overall, data coverage for men is lower than for women, with fewer countries covered anda total sample size five times smaller (4.6 million observations for women and 1 million formen). Samples of women are nationally representative, although in seven countries only ever-married women have been interviewed 8 but samples for men are not perfectly representative,as men are selected only from households with women respondents, excluding men livingalone.
All available DHS and MICS datasets for a country are used for our estimates, withthe exception of pre-2000 surveys that collected self-reported literacy. To the exception ofPanama and Trinidad-and-Tobago, no country in our dataset is classified as high-income
6Where these observations are not censored, the median literacy rates for individuals with zero schoolingare 2 percent for women and 5 percent for men, based on all surveys with at least 10 percent of the populationreporting zero schooling. In only 34 surveys out of 242 for women and 22 of 93 for men, the rate of literacyis higher than 10 percent for individuals with no schooling.
7This assumption is questionable in some countries such as Ghana where literacy rates at the end ofprimary school are still low, and a few recent DHS surveys that test all adults allow us to test (and reject)this assumption. The numbers of surveys with full coverage is too low, and too recent, to serve as the basisof our main analysis.
8Only ever-married women were interviewed in Afghanistan, Bangladesh, Egypt, Indonesia, Jordan, Nepaland Pakistan. Given that most women eventually marry in these countries, potential selection biases shouldbe minimal.
6

countries,9 and so our estimates should be seen as representative of non high-income coun-tries. Data coverage is excellent in the woman and man samples for Sub-Saharan Africa andSouth Asia10 with 99 percent of the population covered for women and men in South Asiaand 97 and 86 percent of women and men respectively in Sub-Saharan Africa (see table 1).Coverage is also good for Middle East and North Africa for women (75 percent of the popu-lation excluding high income countries) but in this region men are not surveyed and there noavailable survey. Similarly, in Latin America and Caribbean the coverage is much better forwomen (41 percent) than for men (10 percent) and the coverage of the region suffers fromthe absence of data for Brazil, whose surveys pre-date 2000 and only includes self-reportedliteracy measures, and the fact that there is only one survey available for Mexico. Becausethere is no available data for China, the coverage for the East and Asia Pacific region is 30percent for women and 26 percent for men but goes up to and 91 and 77 percent for womenand men respectively when China is excluded. Finally, there are only few countries withavailable data in the European and Central Asia region making up 5 and 1 percent of thepopulation of the region for women and men respectively. In this region, some countries areexcluded (e.g. Tajikistan, Ukraine) because virtually all individuals reach secondary schoolmaking it impossible to estimate our measure of school quality on individuals with primaryschooling or less. Because of the low coverage in the Europe and Central Asia region, we donot report regional averages for this region. Similarly, no regional averages are reported formen for the Middle East and North Africa and the Latin America and Caribbean regions.
There are a large number of individuals in the samples who are still in primary schoolbetween the age of 15 and 19. 21 (17) percent of women (men) are still in primary schoolat age 15 and rates decrease to 2 and 1 percent for women and men respectively by age20. Including individuals who are still in primary school could bias our estimates as thecomposition of cohorts might change between two surveys. For this reason, samples arerestricted to individuals aged 20 to 49.
DHS and MICS surveys provide information on the number of years of education anindividual has reached. We only consider formal education in our estimates. In the fewcases where the length of primary schooling has changed between two surveys (e.g. Angola),we set the length of primary to the lowest value of the two surveys and considered thatindividuals who exceeded this value in the other survey have reached secondary school and
9World Bank classification as of 1st of July 2020 https://datahelpdesk.worldbank.org/knowledgebase/articles/906519-world-bank-country-and-lending-groups
10Region classification follows World Bank classification. See here for the complete list: https://datahelpdesk.worldbank.org/knowledgebase/articles/906519-world-bank-country-and-lending-groups
7

are literate. Age is computed as the mean year of interview minus year of birth in all surveys.We do so to avoid any variance in age for individuals born the same year and interviewedduring the same survey. Indeed, in some cases, surveys take a long time to administer andplaces surveyed first may have different characteristics than later-surveyed places, whichmight create some spurious age effects.
3 Measuring education quality
Although measuring the quantity of education of a population is usually straightforwardusing administrative data or household surveys, measuring the quality of this educationremains challenging. Large national or international assessment programs make considerableefforts to measure learning in school in a reliable way via standardized tests of representativestudent samples. However, because of the cost and complexity of collecting such data,standardized tests happen only infrequently, and very few low- and lower-middle incomecountries participate in internationally comparable assessments whatsoever. In order tomeasure educational quality in a large number of developing countries and over time, wepropose a measure of educational quality based on data available in household surveys,following Oye et al. [2016], and Gollin et al. [2014]. We use the adult literacy rate as ourproxy measure of human capital, and conceive of the quantity and quality of schooling asinputs in the literacy production function. The main advantage of literacy as an outcome isthat it is available across a wide range of countries and time periods and is measured in acomparable way. While literacy alone is clearly a low bar against which to judge educationsystems, ceiling effects are less worrisome in our context, as only a handful of countries reportrates above 90 percent in any year.
We define educational quality as the tendency for schooling to generate learning. Moreprecisely, we measure quality as the expected level of literacy conditional on five years ofschooling.11. Primary schooling lasts between four to eight years in sampled countries, withsix years being the most common length (63 percent of countries in our sample). Five yearsis thus close to the end of primary in most countries.
11This measure, essentially capturing the strength of the cross-sectional correlation between schooling andliteracy serves as a substitute for a more ideal measure, where longitudinal panel data is available, trackinglearning as students progress through grades. See Muralidharan et al. [2019], Andrabi et al. [2011], Singh[2019]
8

More formally, let Lijt ∈ {0, 1, 2} be the level of literacy and Gijt the maximum gradeattained of an individual i in country j at time t. Our indicator of educational quality facedby an individual in j born in year t is defined as the predicted value L̂jt at G = 5 from thefollowing regression:
Lijt = αjt + βjtGijt + uijt (1)
Obvious alternative definitions include using the estimated β̂ or the simple average ofliteracy conditional on five years of schooling. The former has a weaker correlation withindependent measures of school quality discussed in the next section. The latter performsquite similarly to our preferred measure. One advantage of our regression-based approachis that it allows us to make use of the full dataset, whereas the number of individuals withexactly five years of schooling can become small for some country-sex-birth year cells.
3.1 Comparison with international test scores
To assess the validity of our measure, we briefly examine its cross-country correlation withalternative measures of school quality, as well as per capita GDP and education spending,before turning to our primary analysis of trends over time.
Across countries, our measure of average education quality shows a significant and roughlylinear, positive relationship with independent measures of student performance based onmore detailed standardized tests – though the correspondence is far from perfect.
No single standardized test covers a large share of developing countries. To examinecorrelations across a relatively large number of countries, we draw on results reported by Al-tinok et al. [2018] who provide rough correspondences to link scores across international andregional tests on a common scale. The resulting scores, produced by the World Bank underthe rubric of Harmonized Learning Outcomes (HLO), combine national averages from vari-ous underlying assessments (PASEC, LLECE, EGRA, PISA, SACMEQ and TIMSS/PIRLS)spanning 163 countries. As time-series variation is limited, we focus here on cross-countrypatterns at a point in time.
We match the birth cohorts in our data to the corresponding survey year and estimateage for each of the tests underlying HLO estimates. Based on the grade at which the testsare administered, we assume the average age of test takers for PASEC, SACMECQ andLLECE is 12 years, for EGRA is 8 years, 10 for TIMSS/PIRLS, and 15 for PISA. We can
9

match 117 country, sex and survey-year cells from our data to the HLO estimates, spanning40 countries.
Figure 1a shows the comparison between our measure of expected literacy at grade fiveand HLO estimates. We observe a relatively linear relationship, with one standard deviationin HLO (100 points) equivalent to about 18 percentage points of expected literacy at gradefive. The Spearman correlation is 0.41 for the whole sample with no meaningful differencebetween men and women.
3.2 Comparison with income per capita and educational spending
We also see that richer countries and countries that spend more on education tend to havebetter school quality by our measure, though again there are some notable exceptions. Theestimated correlation coefficients between school quality and GDP per capita or educationspending, respectively, are high and positive (0.4 and 0.5). Figure 1b also shows that agroup of countries perform well despite low GDP per capita and education spending suchas Burundi, Rwanda, Madagascar and Lesotho in Africa; Myanmar, Nepal, and Vietnam inAsia.
4 Empirical strategy for disentangling age, period, and
cohort effects
The primary goal of the empirical analysis that follows is to measure the evolution of thequality of schooling over time — i.e., trends in literacy conditional on years of schooling.Recall that our survey data reports literacy and schooling for repeated cross-sections ofwomen and men of various ages, observed at multiple survey years in each country. Thusour core challenge is to disentangle the role of age, period, and cohort effects in these repeatedcross-sections.
Age-period-cohort (APC) models of this sort are widely used in demography, sociology,political science and, to a lesser degree, economics (see Fosse and Winship [2019] for a recentreview). In our setting, age captures life-cycle effects on literacy, which may evolve even afteran individual leaves school if they acquire human capital throughout their career, or insteadit decays as time passes. Period effects allow for the possibility that contemporaneous events
10

may affect measured literacy, e.g., if economic booms increase formal employment whichcontributes to literacy through on-the-job learning. Cohort effects, which are our primaryobject of interest, capture differences in literacy conditional on schooling for individualsborn (and hence educated) in different years. These cohort effects capture secular trends inschools’ value added, as well as trends in other non-school inputs into learning such as early-childhood nutrition and – as discussed at length below – changes in selection into schoolingbased on scholastic ability.
The basic model poses a fundamental identification challenge. If we posit that age, period,and cohort effects are linear and additive, there is an obvious, perfect collinearity between thethree factors (age = period − cohort), making it impossible to estimate the model withoutinvoking additional functional-form assumptions. The following sub-sections briefly motivatethe modeling assumptions we invoke, and our reasons for eschewing alternative approaches.
4.1 Assumptions underlying our modeling approach
In most of what follows we adopt one of the most common approaches to estimating APCmodels in the economic literature: the Deaton-Paxson (DP) normalization [Deaton and Pax-son, 1994].12 The DP approach imposes a parametric restriction on period effects: specifi-cally, that the period effects do not contain any linear time trend. In practical terms, thevariables are detrended and the period effects are restricted to be orthogonal to a linear timetrend. This approach provides a solution to the APC identification problem and the modelis just identified. OLS regressions or other estimation methods can then be used to estimatecoefficients for age, period, and cohort. However, the DP method requires a minimum ofthree surveys for the model to be identified. A shorter cohort cycle can yield biased estimatesas the method would attribute any variation in literacy between the first and second surveyto age and cohort effects.
The choice of the best method to estimate our APC model depends on what assumptionswe’re willing to make about the true age, period and cohort effects. First, we do not wantto impose restrictions on cohort effects, whose estimation is our main research goal.
Second, we want to allow that there might be age effects, although we do not have astrong prior on their direction. The estimation of age effects is also a secondary researchgoal for us. Finding evidence for negative age effects would demonstrate that some of the
12See also Hanoch and Honig [1985] for an earlier presentation of a similar approach.
11

education is wasted but finding positive age effects would show that the consequences oflow quality education can be overcome as individuals age. Because of the limited numberof large longitudinal datasets including information on adult cognitive skills, the process ofliteracy retention or acquisition after students leave school in developing countries is stillnot very well known. There is some limited evidence that literacy skills continue to evolveafter individuals leave school and that changes in adult literacy vary by sex, grate attainedor personal circumstances. For instance, Gorman and Pollitt [1997], using a longitudinaldataset of teenagers in Guatemala, find that literacy continues to increase after studentsleave school but that the increase was stronger for students who completed fewer grades. Ina longitudinal study of teenagers in Malawi, Soler-Hampejsek et al. [2018] find that literacylevels in English tend to deteriorate after students leave school but skills in local languageremain the same. Moreover, they find that grade attained, rather than life experience orpersonal characteristics, is the main determinant of variability in literacy retention, suchas the ones who achieved more grades were more able to keep their level of literacy afterleaving school. They also find that girls tend to lose literacy skills faster than boys. Inanother study using the same data from Malawi and longitudinal data from Zambia andBangladesh, Psaki et al. [2019] find that early child-bearing is associated with larger lossesin literacy skills for adolescent girls, with stronger effects for girls with low attainment (gradeseven or below). The three previous studies are focused on learning retention of adolescentsbut, to our knowledge, there is no longitudinal study on literacy changes for adults. It hasbeen found that adults who take part in adult literacy programs often relapse to illiteracy,which might be due to low proficiency levels, lack of use of literacy skills or difficulty inteaching people how to read at an age where the brain is less malleable [Abadzi, 2003].
Third, to achieve identification we assume that period effects do not exhibit a trend, thatis there is no societal change that allows adults to learn (or forget) how to read. The roll outof adult literacy programs could be a factor of a positive trend in period effects (or negativeif they tend to be closed down) but their effectiveness has been questioned and they often donot reach a large share of the population. Adoption of mobile phones could also be a factorin a positive trend in period effects but the relative short span of our data (on average 10years and maximum 20 years) may not be sufficient to see a change. Note that we allow forthe possibility of systematic differences between different periods because of survey effects.Indeed, although DHS and MICS surveys are of good quality, challenges in collecting datain developing countries might lead to some sampling variance between surveys and changesin reading cards or interviewer training could slightly change the grading of on the literacy
12

scale. However, we see no reason to anticipate a systematic trend in these survey effectsacross multiple rounds. For these reasons, using a DP normalization, which assumes noperiod trends, seem the most appropriate but we will first turn a visual description of ourdata to see how our assumptions hold.
4.2 The Deaton-Paxson normalization
The DP normalization can be written as:
Liban =max∑
b=min+1
(αb + βbGib)Cb +49∑
a=16
(δaAa) +N∑
n=3
(θnS∗n) + uiban (2)
where a is the age of an individual interviewed in survey n and born in cohort b and Gib
being the number of completed years of primary schooling. Aa takes the value one if anindividual is aged a. Age fixed-effects estimated in model 2 reflect systematic differences inliteracy rates for individuals born the same year but interviewed at different ages. S∗n is aset of N − 2 period dummies that have been transformed to be make period effects effectsorthogonal to a time-trend and add to zero. Adapting the notation of Deaton [1997], theperiod dummies are transformed such that:
S∗n = Sn − [(n− 1)S2 − (n− 2)S1] (3)
where Sn are the raw period dummies.
We perform estimates separately by sex for each country with at least three availablesurveys and 500 observations and include individuals with some primary schooling. Themodel includes fixed effects for age, cohort and period (survey). 13
The large number of fixed effects can make models difficult to estimate, especially whenusing a Tobit estimator. We also test a more parsimonious model where age fixed effects arereplaced by age and age squared as described in equation (4).
13We omit individuals with zero years of schooling as age effects for them may differ and their inclusioncould bias our predictions. Individuals with no schooling have on average very low levels of literacy (5.5percent and 9.5 percent for 20 year-old women and men respectively) and so it can be expected that ageeffects for them will be non-negative. An APC decomposition of literacy using the DP normalization forpeople with no schooling shows small and positive age effects (median effect: 0.08 pp per year or 2.4 pp over30 years) and very small cohort effects (median effect 0.03 pp per year). See figure 10 in Appendix. Thesesamll effects imply people with no schooling usually do not manage to learn how to read later in life.
13

Liban =max∑
b=min+1
(αb + βbGib)Cb + γAa + δA2a +
N∑n=3
(θnSn) + uiban (4)
We estimate equations (2) and (4) for 24 countries for men and 47 for women. Literacyrates are bounded in the interval [0;1] and the Tobit estimator avoids predictions outsidethis interval which, in principle, may influence the magnitude of age and cohort effects. Inpractice, a summary of the trends in age and cohort effects in Figure 11 in the appendixshows that OLS and Tobit estimates give similar results.
4.3 A note on countries with only one or two survey rounds
As mentioned earlier, there are several cases of country-sex pairs with only two availablesurveys (38 cases) or even one (36 cases), rendering the DP normalization impossible. Whentwo surveys are available, it is possible to fit an age-cohort model (AC) ignoring the effectof period or survey. In essence, the model attributes the entire difference in literacy betweensurveys for the same cohort to age effects, which given our assumptions of zero or smallperiod effects seems reasonable. The risk is that if the differences between two surveysactually reflects a survey effect, spurious age effects could be estimated, which would biascohort effects. In order to estimate an AC model, only controls for age and cohort effectsare included.. The model is estimated by including age and age squared instead of age fixedeffects. In the case of only one available survey, the fitted model is a pure cohort model (C),as no separate age and period effects can be estimated. Since, in most cases, age effects tendto be negative not controlling for it could bias cohort trends upward.
To test the sensitivity of our results to the inclusion of age and period effects, we run anAC and C models on country/sex cases with at least three available surveys and compare it tothe APC results. Results can be seen in figure 12 in Appendix. Ignoring period effects doesnot change the estimated age and cohort effects in a meaningful way and makes it possibleto obtain reliable estimates when only two surveys are available. However, the cohort-onlymodel produces trends in cohort effects which tend to be flatter. Nevertheless, we reportresults from countries with only one available survey using this cohort-only approach, as thetrends across recent cohorts remain informative, but it seems likely that the long term-trendshere may underestimate the true decline in school quality.
14

5 Main results: cohort effects in education quality around
the world
Estimating the age-period-cohort model described above provides us with measures of cohorteffects in education quality for each country in our sample: 87 countries in the case of women,and 58 for men. In most countries the trends span about 40 years, from the cohort born inthe mid 1950’s to the cohort born in the mid 1990’s. All the results discussed in this sectionare based on the Tobit model with age and age squared for countries presented above, butthe qualitative conclusions of our discussion are not driven by the choice of the specificationor by the inclusion of cases with one or two available surveys.
5.1 Graphical analysis for selected large countries
Following Yang and Land (2013), we first present a visual description of the data to detectpotential age or period effects and see if our assumptions on age and period effects mighthold. Figure 2 shows the literacy rate across cohorts and surveys for women with four tosix years of primary schooling in the eight largest countries in our dataset with at least foursurveys, with the exception of India where only two surveys are available.14 If there were noage, period or survey effects, we would expect that literacy rates for women born the sameyear but interviewed at different dates would be on average the same and literacy rate trendsestimated with different surveys would overlap. This tends to be the case in countries suchas Indonesia, Nigeria or Egypt. In these three countries, it is unlikely that there are largeperiod or age effects as women born the same year tend to have roughly the same literacyrate when they are interviewed at different dates.15 In the cases of Bangladesh, Tanzaniaor Kenya, there are relatively large differences between surveys but no obvious pattern of adecrease or increase in literacy across surveys, suggesting that differences might be due tosurvey effects. Finally, in the case of Ethiopia and India, there is a systematic pattern ofwomen interviewed in more recent surveys showing lower rates of literacy, suggesting negativeperiod or age effects. This seems particularly large in Ethiopia, where women born the sameyear lost about 30 percentage points of literacy between the 2000 and 2016 survey. The 10
14Data for India are also shown in the graph because Indian population makes up about one third of thetotal population of the countries in our sample and Indian trend can have a large impact on the global trend.
15We cannot rule out the rather implausible case of large and opposite age and period effects cancellingeach other.
15

percentage-point loss in India in 10 years is also relatively large but, as only two surveysare available, cannot be unambiguously attributed to either period or age effects. Based onadditional data analysis (see Appendix A.5), however, we argue that the difference in literacyrates between the two surveys in India is mainly due to age effects. Overall, this descriptiveanalysis suggests that we should expect moderate age or period effects in most cases. Periodeffects seem to matter and could create spurious age or period effects, especially in caseswith a low number of surveys.
Systematic differences in literacy rates between surveys could also be due to differencesin sampling. If this were the case, we would also expect to see differences across surveyrounds in other indicators, including time invariant characteristics like schooling. However,we show in figure 3 that the share of women born in the same cohort accessing grade 5 isvery stable across surveys. For instance, while literacy conditional on schooling for womenin a given cohort in Ethiopia appears to decline between survey rounds systematically from2000 and 2019, schooling does not. This pattern is consistent with the idea that literacymay decay over the lifecycle, but schooling, by definition, cannot.
We turn now from ‘raw’ data to the core estimation results. Figure 4 shows the estimatedage, period and cohort effects for women for the eight large countries discussed previously.The estimates are based on the Tobit estimator using the Deaton-Paxson normalization.In all countries, period effects tend to be very small, suggesting that there are no largesystematic differences in literacy rates between survey rounds once we control for age andcohort effects.
Age effects, shown in the first column of Figure 4 tend to be either flat or declining.This suggests that for this subset of countries – especially India, Bangladesh, and Ethiopia– rather than acquiring human capital in the form of literacy over their life cycle, womentend to lose it through a process of decay during their adult lifetimes. Kenya and Nigeriaalso show slight evidence of such decay, with only Egypt showing any sign of human capitalacquisition over women’s adult lifetimes.
The trends in cohort effects, which are our main object of interest, show a fairly sharpdownward trend in India, Nigeria, and Ethiopia. Taken at face value, the estimates forIndia suggest the probability a woman with five years of schooling would become literatewas nearly 100 percent for the 1960s birth cohorts, but had fallen to roughly 40 percentfor the mid-1990s cohorts. The India results – again, based on just two survey rounds –are somewhat fragile to our modeling assumptions though, which we explore in detail in
16

Appendix A.5. Ethiopia has experienced a similar decline in education quality as India,though with a slightly less dramatic downward slope. Nigeria, for its part, started off ata lower baseline level of education quality, and has reached a lower point today: with onlyabout 20 percent of adult women educated in the late 1990s able to read.
The other five countries in Figure 4 show relatively flat trends in education quality, asmeasured by cohort effects. Their quality levels though, are far from uniform: while fiveyears of schooling are a virtual guarantee of literacy in Indonesia, that is true for only lessthan half of educated women in Egypt. The remaining large countries (Bangladesh, Kenya,and Tanzania) fall somewhere in between, and all of them outperform Nigeria.
5.2 On average, education quality in the developing world has de-
clined steadily over multiple decades, albeit with significant
heterogeneity in levels and trends
Similar patterns hold for a broader set of countries. For brevity we focus on regional averages,leaving country-by-country statistics for the appendix (Tables 7 and 8 for women and menrespectively). Regional averages are a simple average of the countries in the sample, withoutpopulation weights.
We focus on three main indicators to document changes in educational outcomes: shareof birth cohort accessing grade five, as well as the literacy rate and average education quality(i.e., estimated literacy for an adult with five years of schooling) where the latter two statisticsare both corrected for age and period effects per the Deaton-Paxson normalization describedabove.
Several broad patterns stand out in the regional trends shown in Tables 2 and 3.
First, most of the gains in literacy are associated with school expansion (rather thanany improvement in education quality, as we show below). Schooling figures show consistentprogress in access to education for both men and women across all regions. From the cohortborn in the 1960’s to the cohort born in the 1990’s, women’s access to five or more yearsof schooling has increased by 42 percentage points in South Asia (from 34 to 76 percent),25 percentage points in Sub-Saharan Africa (from 41 to 66 percent) and reached above 90percent in East Asia and Pacific and Latin America regions. Improvements for men were lessimpressive as they started from higher levels but were still large (+12 pp in East Asia, +22
17

pp in South Asia and +17 pp in Sub-Saharan Africa). These large gains were accompaniedby similar increases in literacy rates across cohorts.
Second, there is large variance across countries in the level of education quality. In Ghana,Guinea, the Gambia, Sierra Leone and Nigeria 20 percent or less of women are able to readat grade five whereas in Vietnam, Rwanda, Burundi, El Salvador, Guatemala, Honduras,Costa Rica and Bolivia more than 95 percent can read by the end of grade five.
Third, despite big cross-country differences in education quality, there are very few casesof dramatic improvements in education quality. In most cases, cross-country gaps in ed-ucation quality seem to have emerged at least several decades ago. Trends over time aregenerally flat or declining. In two thirds of countries in our sample, the difference betweenthe education quality faced by the oldest and youngest decadal cohorts is less than 10 per-centage points. However, where trends in education quality exist, the trend in educationquality tends to be negative. In 56 countries in the sample of women, education qualitydecreased between the cohort born in the 1960’s and the cohort born in the 1990’s, while itincreased in 14 countries and did not change by more than +/- 5 percentage points in theremaining 17 countries (see Figure 6). Although some countries that were already perform-ing well have managed to improve their education quality (e.g. Vietnam, Pakistan, Peru),no country that was doing poorly in the past has managed to improve its education qualitymeaningfully.
Finally, despite the general picture of stagnation, regional trends show strikingly differentpatterns in the evolution of school access and – the more novel contribution of this paper –education quality. To highlight the latter point, Figure 5 shows the trends in raw, uncondi-tional literacy and education quality (i.e., literacy conditional on schooling) for women andmen on a consistent sample of countries from the birth cohort born in 1955 to the birth co-hort born in 1998. We observe five regions that have followed different trends in educationaloutcomes.
East Asia and Latin America show steady, gradual increases in literacy, and relativestability in education quality over multiple decades. The two regions with the largest gainsin literacy are the Middle East and North Africa and South Asia. The former has seen fairlystagnant education quality, while South Asia has seen a precipitous decline. For the 1960scohorts South Asia shows among the highest education quality rates in the world, but sincethen the region has experienced the largest drop (-31 percentage points for women and -35percentage points for men). Finally, Sub-Saharan Africa has experienced steady progress
18

in literacy, especially for women; however, it has experienced the second largest drop ineducation quality (-24 pp for women and men).
5.3 The gender gap in education quality has decreased over time
(in conjunction with a declining gender gap in school access)
Education quality for men and women can be compared for a sub-sample of countries andcohorts (see Table 4). In Sub-Saharan Africa, the number of countries with a positive gendergap in favor of men has remained stable between the 1960’s to the 1990’s with 12 countriesout of 35 countries with data for men and women. The gender gap in education qualityhas decreased slightly but remained very high (+9 percentage points for men). Unlike Sub-Saharan Africa, the gender gap has decreased in South Asia and education quality for menand women has converged over the past three decades and education quality for the lastcoohort born in the 1990’s is almost identical. In East Asia and Pacific, the gender gap hasremained positive for women between the 1960s and the 1980s.
5.4 Education quality is correlated with long-term growth
Our estimates allow us to revisit the relationship between schooling, education quality andeconomic growth [Mankiw et al., 1992, Wossmann and Hanushek, 2007]. Because our esti-mates of education quality and schooling cover longer time-spans, we are able to estimate thestock of human capital available at different dates and see if it explains subsequent economicgrowth. We follow standard practice in the literature and specify the growth equation as afunction of initial income per capita and the stock of human capital measured by the quan-tity of schooling and education quality. We use our measure of education quality, expectedliteracy at grade five, as a measure of education quality and two separate measures of schoolquantity: the number of years of schooling of the adult population following Barro and Lee[2013], and the share of the population accessing grade five from our own estimates, suchthat:
Yi,2019 − Yit = α + βYit + γSit + δQit + uit (5)
where Yit is log per capita GDP in country i in year t, growth on the left-hand side is measureup to the latest available data (2019), Sit is the quantity of schooling of the adult population,and Qit is the average expected literacy rate at grade five of the population aged 20 to 40.
19

Note that both education quantity and quality are measured in the baseline year. Quantityis either measured as the number of years of schooling of the adult population aged 20 to 40from Barro and Lee [2013], or as the share of the female population aged 20 to 40 (or thehighest available age) with at least five years of schooling in year i.
Results are presented in Table 5. Using either definition of education quantity, thereis a correlation between initial education quality and subsequent economic growth. Forinstance, in column (5), economic growth from 2010 to 2019 was 0.7 percentage pointshigher in countries with one standard deviation (sd=0.23) higher education quality. Theseassociations between education quality and growth appear, if anything, to be increasing inmagnitude over time.
6 Accounting for changing patterns of selection into school
So far we have followed the convention in the education assessment literature by defining‘school quality’ as a simple conditional average, the literacy rate conditional on five years ofschooling. Obviously, the evolution of school quality defined this way may reflect changes inschools’ value added, or changes in the composition of pupils. The expansion of schoolingunder free primary education reforms in the 1990s and 2000s, for instance, incorporateda growing share of children from more disadvantaged backgrounds who might have moredifficulty learning to read [Deininger, 2003, Bold et al., 2015].
In a study using panel data from Vietnam, Peru, India and Ethiopia, Singh [2019] findsthat differences in test scores between countries are mainly due to differences in school qualityrather than differences in child’s endowments, suggesting that differences in composition ofstudents may not be driving our results. The literature on the Mincerian wage returns toschooling is also potentially informative here. While we are not concerned with earnings,there is a general consensus that OLS estimate of the returns to schooling, while theoreticallysubject to the same upward bias due to unobserved ability that concerns us here, appearquite similar to well-identified estimates from natural experiments Card [1999]. Nevertheless,there is recent evidence from secondary schooling in Ghana that (upward) selection bias issometimes real and significant [Ware, E. O., Kornu, D. D. K., & Adusei, 2018].
In the absence of a valid instrumental variable for access to schooling, we do not attemptto provide a point estimate of the impact of selection on school quality. Instead, we attemptto provide some insight into the possible magnitude of selection and how the cohorts ofwomen and men have changed over time.
20
6.1 Comparing height between women who did and did not go to
school as an indicator of selection
Because our data is based on surveys of adult women and men, we lack any direct measureof their academic ability or even socioeconomic status in childhood to examine patterns ofselection into school directly. However, adult height provides a rough but well-establishedindicator of childhood health and nutrition [Garenne, 2011, Currie and Vogl, 2013]. Adultheight is recorded for women in 64 countries in our dataset. We focus on women here becauseof limited anthropometric data coverage for men. Figure 7 shows the trends in female adultheights by schooling status.
We use trends in adult height to examine two ways non-school inputs in the humancapital production function may bias our estimates of trends in school quality. First, long-term improvements in overall child well-being could contribute to improvements in cognitiveskills and thus apparent trends in our measure of school quality (i.e., literacy with five yearsof schooling). Overall the height of women with at least some schooling has risen over timefor a slim majority (37 of 64) of countries in our sample, with an average rate of increaseunder 0.1 centimeters per year.
Second, changes in the height-gap between women with and without schooling may tellus something about the degree of selection into schooling over time. Looking at all women(rather than just those with schooling), we see even stronger positive trends in heightt, witha positive increase in 44 of 64 countries and an average increase of about 0.2 centimetersper year. In short, the height-advantage of girls in school appears to have narrowed overtime. This could be due to an improvement in nutrition at the bottom of the distributionor, alternatively, a reduction in the degree of selection into school on socioeconomic status.The latter alternative would be consistent with the idea that the expansion of school systemsincorporated relatively more disadvantaged students. Indeed for women born in the 1960’s,the average adult height of thos who went to school was 0.47 centimeters taller than thegeneral population, but that difference shrunk to 0.27 centimeter for women born in 1990’s.
6.2 Does measured school quality fall when access to schooling ex-
pands?
The correlation between the share of individuals accessing school and school quality is pos-itive across the whole sample (r=0.23 when pooling men and women). This positive rela-tionship is mainly driven by the correlation between countries (r=0.43 for men and r=0.38
21

for women), while the correlations within countries are negative (r=-0.3 for men and r=-0.38 women). Countries with higher access to schooling have better school quality, butas the share of individuals accessing school increases within a country, school performancedecreases.
However, these correlations could be biased by time trends in education expansion andschool quality. The association between selection into school and school quality can betested more formally using results from cohort estimates that provide long time series foreach country. Table 6 shows the results of country fixed-effects models for women and menrespectively where the dependent variable is school quality from our APC model above. Wecontrol for year of birth to allow for trends in underlying share quality, and focus on thecoefficient on the share of a cohort with some schooling, as well as the share with secondaryschooling, to capture the role of selection into school. We also include administrative dataon repetition rates, available from the 1970’s onward, to test if changes in school quality canbe explained by changes in repetition practices16 Finally, for a sub-sample of countries, wecontrol for the height of women with some schooling.
Column (1) shows downward trends of about -4.6 and -5.9 percentage points per decadein school quality. for women and men, respectively. Controlling for the share of the cohortthat has attended school or has reached secondary schooling (column (2)) has little impactin the men’s sample but reduces the magnitude of the decline among women by almost 2points. Of course, this attenuation of the coefficient on birth year could be due changes inselection of students or to the fact that as school systems expand it is harder and harder forgovernments to keep quality constant.
Controlling for repetition rates in column (3) has little effect on the estimated seculartrend. However, repetition rates may be of independent interest, and are strongly associatedwith changes in school quality for both men and women. An extra year of schooling due torepetition is associated with a 12.1 and 6.8 percentage points increase in school quality forwomen and men, respectively. This is a relatively large effect; our estimates show that about73 percent of men and women can read after five years of schooling, equivalent to about 14.6percentage points of extra literacy per year of schooling. Our coefficient on repetition would
16Repetition data is taken from the UNESCO Instiute for Staitstics. Data are matched for men and womenseparately. Gaps in data are interpolated. We match repetition rates to cohorts when students are 10 yearsold. The indicator for repetition rate is the cumulative repetition rates from grade one to five, that is thenumber of extra years of schooling a student would have at grade five if she had experienced her countryrepetition rates when she was 10.
22

suggest that an extra year due to repetition is worth about half to more than three quartersof a year of regular schooling. Notably, some of the best performing countries have very highlevels of repetition (e.g. Madagascar, Rwanda or Burundi).
Finally, in column (5), we control for the height of women with schooling, which is positiveand statistically significant at 5 percent. Once again, controlling for this association doeslittle to change the trend in measured school quality.
Overall, selection into school and changes in repetition practices may explain some of thedownward trend in school quality but, in a simple regresion framework, fail to account forall of it.
6.3 Free primary education as an exogenous shift in access
Over the past 50 years, many developing countries abolished user fees for primary school. Inat least some cases, these free primary education (FPE) reforms led to a significant increasein schooling levels at the national level [Deininger, 2003, ?, ?].These putatively exogenous,policy-induced increases in access to schooling can shed light on how enrollment changesaffected trends in school quality.
FPE policies could affect school quality through several channels. First,lowering barriersto school entry might change the composition of pupils. Second, FPE clearly increasedthe number of pupils in some countries which, absent comparable increases in staffing andschool expenditure, would lead to a deterioriation in resources per pupil. Third, whilemore speculative FPE may have undermined the accountability of school officials to localcommunities..In short, while FPE does not isolate the role of selection into schooling, itdoes offer the possibility of overcoming reciprocal causation between school quality andenrollment.
We examine 51 FPE reforms across 27 developing countries compiled by Crawfurd andAli [2022], drawing on earlier compilations from Bhalotra et al. [2014] and Tomasevski[2006],among others, for which we have overlapping data. For each reform episode, weestimate an interrupted time series model with a break for the birth cohort that was eightyears-old when fees were abolished.17 We restrict analysis to countries with data for cohortsborn at least 10 years on either side of the policy introduction, and present estimates for up
17Results are robust to alternative age cutoffs at 6, 8, 10 and 12 years old when the policy was introduced.
23

to 20 years on either side. Estimates were weighted by the size of the sample of the cohortto give more weight to more precise estimates.
The interrupted time series estimates of the share of students accessing grade five beforeand after the FPE reforms show that the mean trend increased from 0.7 percentage pointsper year to 1.2 percentage points per year after fees were abolished. Figure 8 illustratesthese calculations for three cases with particularly large accelerations in schooling after theabolition of fees: women in Ethiopia, Madagascar, and Mali. In each case the accelerationin the increase in average schooling was accompanied by an acceleration in the decline inschool quality (or, in the case of Mali, a sudden drop in quality and continued decline).
A summary of these changes in trends in school quality before and after FPE reformsis shown for all available countries in Figure 9 for women and men separately. In 27 cases,we observe no statistically significant change in the trend of school quality before and afterthe implementation of the FPE reform. There are more statistically significant negativeeffects than positive ones (20 vs 3) and the mean effects are -0.4 percentage point per yearfor women and -0.9 for men with only few cases of a very rapid drop in school qualityafter the introduction of FPE reforms. Although the general trends in school quality werealready decreasing before the FPE reforms (-0.2 percentage points for women and men),average declines in school quality have accelerated substantially after the reforms (-0.6 and-1.1 percentage points per year for women and men respectively) and could explain a largeshare of the drop in quality in the sub-sample of countries having introduced FPE.
Overall, the data suggest some role for selection effects in depressing school quality,but several signs suggest selection alone cannot explain the long-term trends we observe.Various patterns point in opposite directions. For instance, by one measure the compositionof students has improved over time: students in later decades appear healthier than theirpeers in earlier decades, as proxied by their adult height. But selection into schooling on(future) height has declined. Looking across countries and over time, a larger share ofstudents accessing schooling is associated with a drop in measured quality. But controllingfor enrollment changes in a simple regression framework fails to explain away the long-term deterioration in school quality overall. Similarly, FPE reforms are associated with anacceleration both schooling levels and of the negative trend in school quality. But schoolquality was decreasing before the introduction of these reforms and FPE reforms might alsohave been associated with a reduction of resources per students.
24

7 Conclusion
We use literacy tests in survey data to construct long-term trends in literacy for 87 developingcountries, spanning birth cohorts from the 1950s to 2000. We show that over this periodliteracy rates have increased substantially, but virtually all progress has been due to theincrease in access to school rather than any improvement school quality, measured as thepropensity for schooling to generate literacy after five years of schooling.
Overall, our measure of school quality is low in developing countries, with about 70% ofwomen able to read after grade five, and has been declining over time. From the 1950s to2000, school quality deterioration implied the probability that a woman with five years ofschooling could read a sentence fell by roughly two to four percentage points per decade,and about six percentage points for our smaller sample of countries with data on men. Nev-ertheless, literacy gains associated with increased schooling rates far outpaced the offsettingeffect of declining quality, i.e., literacy conditional on schooling.
Two limitations of our approach bear repeating. First, our reliance on simple literacytests as a measure of human capital clearly ignores important higher-order skills, not tomention numeracy and other domains. Nevertheless, we argue that literacy remains a usefulproxy for learning levels in many school systems, where literacy is far from universal, andputs our focus on the lower parts of the learning distribution which are often ignored in favorof policy attention to students passing competitive exams for elite secondary and tertiaryschools.
A second limitation is our inability to precisely quantify the role of changing patterns ofselection into schooling (or into higher grades) in explaining the changes in school qualitythat we observe. Of particular concern is that reduced selectivity, e.g., enrollment of morelow-income or otherwise under-prepared students as schooling systems have expanded, mightcreate a spurious impression of declining school quality. We have shown that countries andperiods with faster enrollment growth did indeed experience significantly faster deteriorationin school quality. But allowing for these effects does not appear to overturn our main findingof declining school quality. Furthermore, correcting for differences across countries andperiods in grade repetition rates, or the height of individuals (an indicator of socio-economicstatus that is mostly determined prior to schooling) also does little to change the picture ofdeclining quality.
25

From a policy perspective, the fact that most developing countries with high (uncondi-tional) literacy rates achieved them primarily by increasing average years of schooling ratherthan school quality may be instructive for lagging countries. Expanding access to schoolinghas produced remarkable gains in overall literacy, while not much else has.
Turning to implications for future work, our hope in embarking on this project wasthat by constructing long-term trends in school quality, we could identify countries whichhave made transformational changes, and risen quickly in global league tables of learningoutcomes. Such exemplars appear not to exist. Instead, the rank-ordering of countries’school quality has been relatively stable over decades. Nevertheless, moderate improvementsover the period of a decade or more do exist, and future research could usefully complementthe large literature on policy evaluations by taking a historical lens to try to understand thesesuccessful reformers. Future research could also usefully refine our measurement methods.Literacy is a crude indicator for overall learning levels, and it would be useful to corroboratethe trends we measure with additional datasets containing more fine-grained learning metrics.,
26

References
Helen Abadzi. Improving Adult Literacy Outcomes Lessons from Cognitive Research forDeveloping Countries, volume 0932. 2003. ISBN 0821354930.
Nadir Altinok and H Murselli. International database on human capital quality. EconomicsLetters, 96(2), 2007.
Nadir Altinok, Noam Angrist, and Harry Patrinos. Global data set on education quality(1965-2015). World Bank Policy Research Working Paper 8314, (January):82, 2018.
Tahir Andrabi, Jishnu Das, Asim Ijaz Khwaja, and Tristan Zajonc. Do value-added estimatesadd value? Accounting for learning dynamics. American Economic Journal: AppliedEconomics, 3(3):29–54, 2011.
Noam Angrist, Simeon Djankov, Pinelopi K Goldberg, and Harry A Patrinos. Measuringhuman capital using global learning data. Nature, 592(7854):403–408, 2021.
Julius F Atuhurra. Does community involvement affect teacher effort? Assessing learn-ing impacts of Free Primary Education in Kenya. International Journal of EducationalDevelopment, 49:234–246, 2016.
Robert Barro and Jong-Wha Lee. International Trade, Distortions and Long-Run EconomicGrowth. IMF Working Papers, 92(90):i, 2013.
Robert J Barro and Jong-Wha Lee. International comparisons of educational attainment.Journal of Monetary Economics, 32(3):363–394, 1993.
Sonia Bhalotra, Kenneth Harttgen, and Stephan Klasen. The impact of school fees on school-ing outcomes and the intergenerational transmission of education. UNESCO, Backgroundpaper for the Education for All Global Monitoring Report, 2014.
Moussa P Blimpo, Ousman Gajigo, and Todd Pugatch. Financial constraints and girls’secondary education: Evidence from school fee elimination in The Gambia. The WorldBank Economic Review, 33(1):185–208, 2019.
Tessa Bold, Mwangi Kimenyi, Germano Mwabu, and Justin Sandefur. Can free provisionreduce demand for public services? evidence from kenyan education. The World BankEconomic Review, 29(2):293–326, 2015.
27

David Card. The Causal Effect of Education on Earnings. Handbook of Labor Economics,3:1801–1863, 1999.
Francesco Caselli. Accounting for cross-country income differences. Handbook of EconomicGrowth, 1:679–741, 2005.
Lee Crawfurd and Aisha Ali. The case for free secondary education. In Justin Sandefur,editor, Schooling for All, chapter 3. Center for Global Development, 2022.
Janet Currie and Tom Vogl. Early-life health and adult circumstance in developing countries.Annual Review of Economics, 5(1):1–36, 2013.
Hai Anh H. Dang and Paul W. Glewwe. Well Begun, but Aiming Higher: A Review ofVietnam’s Education Trends in the past 20 Years and Emerging Challenges. Journal ofDevelopment Studies, 54(7):1171–1195, 2018.
Jishnu Das and Tristan Zajonc. India shining and Bharat drowning: Comparing two Indianstates to the worldwide distribution in mathematics achievement. Journal of DevelopmentEconomics, 92(2):175–187, 2010.
Angus Deaton. The analysis of household surveys: a microeconometric approach to develop-ment policy. World Bank Publications, 1997.
Angus Deaton and Christina Paxson. Intertemporal Choice and Inequality. Journal ofPolitical Economy, 102(3):437–467, 1994.
Klaus Deininger. Does cost of schooling affect enrollment by the poor? Universal primaryeducation in Uganda. Economics of Education Review, 22(3):291–305, 2003.
Ethan Fosse and Christopher Winship. Analyzing age-period-cohort data: A review andcritique. Annual Review of Sociology, 45:467–492, 2019.
Michel Garenne. Trends in nutritional status of adult women in sub-Saharan Africa. DHSComparative Reports, (27):xv–pp, 2011.
Douglas Gollin, David Lagakos, and Michael E Waugh. The agricultural productivity gap.The Quarterly Journal of Economics, 129(2):939–993, 2014.
Kathleen S Gorman and Ernesto Pollitt. The contribution of schooling to literacy inGuatemala. International Review of Education, 43(4):283–298, 1997.
28

Jan Eric Gustafsson. Lasting effects of quality of schooling: Evidence from PISA and PIAAC.Intelligence, 57:66–72, 2016.
Giora Hanoch and Marjorie Honig. “True” age profiles of earnings: Adjusting for censoringand for period and cohort effects. The Review of Economics and Statistics, pages 383–394,1985.
Eric A. Hanushek and Dennis D. Kimko. Schooling, labor-force quality, and the growth ofnations. American Economic Review, 90(5):1184–1208, 2000.
Eric A. Hanushek and Ludger Wossmann. Does education tracking affect performance andinequality? Differences-in-differences evidence across countries. The Economic Journal,2006.
S J Howie, C Combrinck, K Roux, M Tshele, G M Mokoena, and McLeod P N. PIRLSLiteracy 2016 : South African Highlights Report. Centre for Evaluation and Assessment,Faculty of Education, University of Pretoria, 2017.
Aart Kraay. Methodology for a world bank human capital index. World Bank Policy ResearchWorking Paper, (8593), 2018.
David Lagakos, Benjamin Moll, Tommaso Porzio, Nancy Qian, and Todd Schoellman. Lifecycle wage growth across countries. Journal of Political Economy, 126(2):797–849, 2018.
N. G. Mankiw, D. Romer, and D. N. Weil. A Contribution to the Empirics of EconomicGrowth. The Quarterly Journal of Economics, 107(2):407–437, may 1992.
Karthik Muralidharan, Abhijeet Singh, and Alejandro J Ganimian. Disrupting education?Experimental evidence on technology-aided instruction in India. American Economic Re-view, 109(4):1426–60, 2019.
Mari Oye, Lant Pritchett, and Justin Sandefur. Girls schooling is good, girls schoolingwith learning is better. Background Paper for The Learning Generation. The EducationCommission, 2016.
Dev Patel and Justin Sandefur. A Rosetta Stone for Human Capital. Center for GlobalDevelopment Working Paper 550, 2020.
29

Lant Pritchett. The Rebirth of Education Why Schooling in Developing Countries is Flail-ing; How the Developed World is Complicit; and What to do Next. Center for GlobalDevelopment, 2013.
Stephanie R. Psaki, Erica Soler-Hampejsek, Jyotirmoy Saha, Barbara S. Mensch, and SajedaAmin. The Effects of Adolescent Childbearing on Literacy and Numeracy in Bangladesh,Malawi, and Zambia. Demography, 56(5):1899–1929, oct 2019.
Sara J Ruto and John K Mugo. Free primary education in Kenya . The elusive EFA dream- about to be reached ? Zeitschrift fur internationale Bildungsforschung und Entwick-lungspadagogik 28 (2005) 1, S. 21-23, 28, 2005.
Pasi Sahlberg. Education policies for raising student learning: The Finnish approach. Journalof Education Policy, 22(2):147–171, 2007.
Todd Schoellman. Education quality and development accounting. Review of EconomicStudies, 79(1):388–417, 2012.
Abhijeet Singh. Learning More with Every Year: School Year Productivity and InternationalLearning Divergence. Journal of the European Economic Association, 2019.
Erica Soler-Hampejsek, Barbara S. Mensch, Stephanie R. Psaki, Monica J. Grant, Chris-tine A. Kelly, and Paul C. Hewett. Reading and numeracy skills after school leaving insouthern Malawi: A longitudinal analysis. International Journal of Educational Develop-ment, 59:86–99, mar 2018.
Isabella Sulis, Francesca Giambona, and Mariano Porcu. Adjusted indicators of quality andequity for monitoring the education systems over time. Insights on EU15 countries fromPISA surveys, 2020.
Stephen Taylor and Nicholas Spaull. The effects of rapidly expanding primary school accesson effective learning: The case of Southern and Eastern Africa since 2000. StellenboschEconomic Working Papers: 1/13, 2013.
Katarina Tomasevski. The State of the Right to Education Worldwide. Fee or Free: 2006Global Report. 2006. URL http://www.katarinatomasevski.com/images/Global_Report.pdf.
UNESCO. The global learning crisis: Why every child deserves a quality education. Technicalreport, 2013.
30

Jan Van Damme and Kim Bellens. Countries Strive Towards More Quality and Equity inEducation: Do They Show Success or Failure? Evidence from TIMSS 2003 and 2011, forGrade 4. 2017.
B. M. Ware, E. O., Kornu, D. D. K., & Adusei. Enhancing the entrepreneurial skills amongGhanaian students, the bedrock of job creation (entrepreneurship education). Journal ofEmerging Trends in Economics and Management Sciences, 9(3):169–179, 2018.
World Bank. Learning: To Realize Education’s Promise. World Bank, 2018.
Ludger Wossmann and Eric Hanushek. The Role of Education Quality in Economic GrowthThe Role of School Improvement in Economic Development. World Bank Policy ResearchWorking Paper 4122, pages 1–94, 2007.
Yue Yin. Reflection on the Quality and Equity of Chinese Basic Education — From PISA2018 Results : Where All Students Can Succeed. Journal of Contemporary EducationalResearch, 4, 2018.
31

Figure 1: Cross-sectional validation of education quality measure
(a) Education quality and harmonized learning outcomes
GIN
TGO
GINTCD
TGONER
GTMGTMIDN
PER
ZMB
GHA
0
.25
.5
.75
1
Expe
cted
lite
racy
at g
rade
5
250 300 350 400 450
Harmonized Learning Outcome
PASECLLECEPISASACMEQTIMSS/PIRLS
Source of data: World Bank for Harmonized learning outcome
(b) Education quality, GDP per capita, and education spending
AFG
AGO
ALB
BDI
BEN
BFA
BGD
BIH
BLZ
BOL
BTN
CAF
CIV
CMR
CODCOG
COM
CRI
DOM
DZA
EGY
ETH
GAB
GHA
GIN
GMB
GNB
GTM
GUY
HND
HTI
IDN
IND
IRQ
JOR
KEN
KHM
LAO
LBR
LSO
MAR
MDG
MDVMEX
MKD
MLI
MMR
MNE
MNG
MOZ
MRTMWI NAM
NER
NGA
NIC
NPL
PAK
PANPER
PHL
PNG
PRY
RWA
SDN
SEN
SLE
SLV
SRBSTP SURSWZ
TCD
TGO
THA
TJK
TLS
TTO
TUNTZA
UGA
URY
VNM
ZAF
ZMB
ZWE
.2
.4
.6
.8
1
Expe
cted
lite
racy
at g
rade
5
1000 2000 4000 8000 16000GDP per capita (Log scale, 2017 )
Source: World Bank data for GDP per capitaAverages for 1990 to latest date availableExpected literacy estimates are matched with year individuals were 10 year-old
BDI
BEN
BFA
BGD
BLZ
CAF
CIV
CMR
COM
CRI
DOM
DZA
ETH
GHA
GIN
GMB
GTM
GUYIND
JOR
KEN
KHM
LAO
LSO
MDG
MDVMEX
MLI
MNG
MOZ
MRTMWI NAM
NPL
PANPER
PHL
PRY
RWA
SEN
SLV
SRBSWZ
TCD
TGO
THA
TUNTZA
UGA
URY
ZAF
ZMB
.2
.4
.6
.8
1
Expe
cted
lite
racy
at g
rade
5
50 200 800 3200Spending per primary student (Log scale, 2017 )
Source: World Bank data for education spendingAverages for 1990 to latest date availableExpected literacy estimates are matched with year individuals were 10 year-old
Note:
32

Figure 2: Literacy rates of women with four to six years of schooling (selected countries)
2005
2015
.2
.4
.6
.8
1
1960 1970 1980 1990 2000
India2002 2007 2012 2017
.2
.4
.6
.8
1
1950 1960 1970 1980 1990 2000
Indonesia
200320072008201020112013201520162018.2
.4
.6
.8
1
1950 1960 1970 1980 1990 2000
Nigeria
20062007 20112013
201420172019
.2
.4
.6
.8
1
1960 1970 1980 1990 2000
Bangladesh
20002005
20112016
2019
.2
.4
.6
.8
1
1950 1960 1970 1980 1990 2000
Ethiopia
2000200320052008 2014
.2
.4
.6
.8
1
1950 1960 1970 1980 1990
Egypt, Arab Rep
2004
2009
20152017
.2
.4
.6
.8
1
1960 1970 1980 1990 2000
Tanzania
2003 2008 20142015
.2
.4
.6
.8
1
1950 1960 1970 1980 1990
Kenya
The vertical axis represents literacy rates 5-year moving average for literacy rates
33
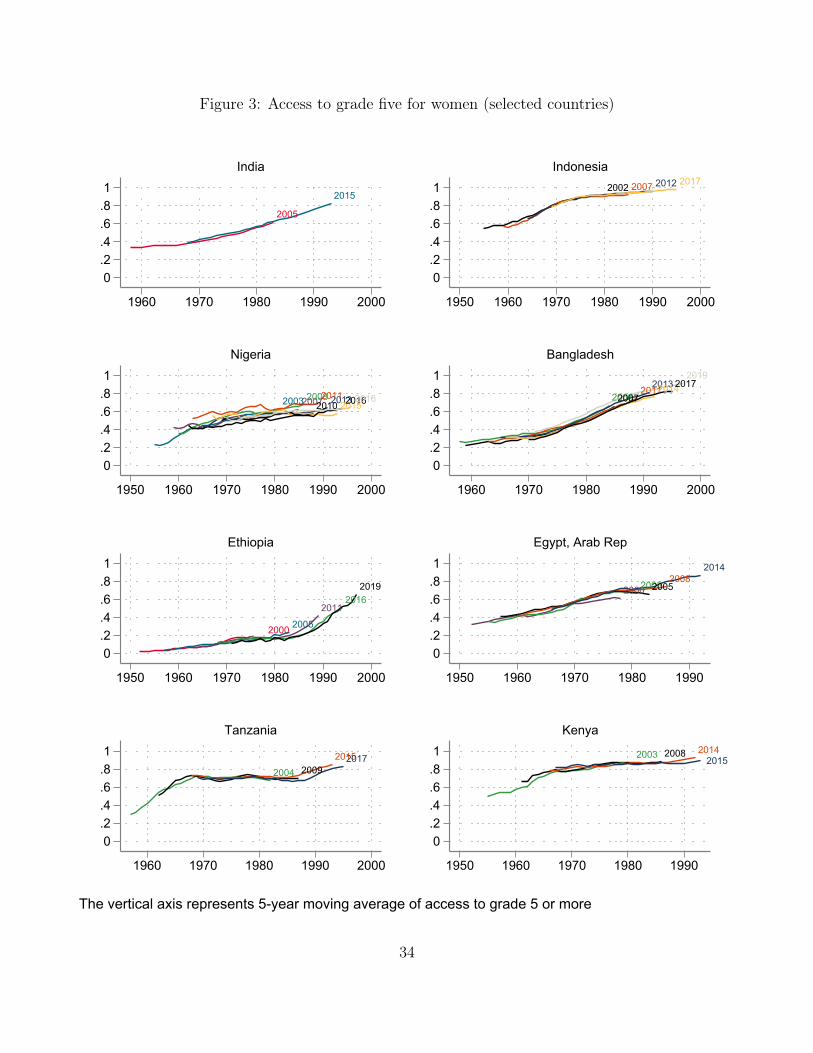
Figure 3: Access to grade five for women (selected countries)
2005
2015
0.2.4.6.81
1960 1970 1980 1990 2000
India2002 2007 2012 2017
0.2.4.6.81
1950 1960 1970 1980 1990 2000
Indonesia
200320072008201020112013201520162018
0.2.4.6.81
1950 1960 1970 1980 1990 2000
Nigeria
200620072011201320142017
2019
0.2.4.6.81
1960 1970 1980 1990 2000
Bangladesh
2000 2005
20112016
2019
0.2.4.6.81
1950 1960 1970 1980 1990 2000
Ethiopia
2000200320052008
2014
0.2.4.6.81
1950 1960 1970 1980 1990
Egypt, Arab Rep
2004 200920152017
0.2.4.6.81
1960 1970 1980 1990 2000
Tanzania
2003 2008 20142015
0.2.4.6.81
1950 1960 1970 1980 1990
Kenya
The vertical axis represents 5-year moving average of access to grade 5 or more
34

Figure 4: Estimated age, period and cohort effects in education quality (selected countries-women)
.2
.4
.6
.8
1
Expe
cted
lite
racy
20 30 40 50
Age
.2
.4
.6
.8
1
Period
India
.2
.4
.6
.8
1
1960 1970 1980 1990 2000
Cohort
.2
.4
.6
.8
1
Expe
cted
lite
racy
20 30 40 50
Age
.2
.4
.6
.8
1
2000 2005 2010 2015 2020
Period
Indonesia
.2
.4
.6
.8
1
1950 1960 1970 1980 1990 2000
Cohort
.2
.4
.6
.8
1
Expe
cted
lite
racy
20 30 40 50
Age
.2
.4
.6
.8
1
2000 2005 2010 2015 2020
Period
Nigeria
.2
.4
.6
.8
1
1950 1960 1970 1980 1990 2000
Cohort
.2
.4
.6
.8
1
Expe
cted
lite
racy
20 30 40 50
Age
.2
.4
.6
.8
1
2005 2010 2015 2020
Period
Bangladesh
.2
.4
.6
.8
1
1960 1970 1980 1990 2000
Cohort
.2
.4
.6
.8
1
Expe
cted
lite
racy
20 30 40 50
Age
.2
.4
.6
.8
1
2000 2005 2010 2015 2020
Period
Ethiopia
.2
.4
.6
.8
1
1950 1960 1970 1980 1990 2000
Cohort
.2
.4
.6
.8
1
Expe
cted
lite
racy
20 30 40 50
Age
.2
.4
.6
.8
1
2000 2005 2010 2015
Period
Egypt, Arab Rep
.2
.4
.6
.8
1
1950 1960 1970 1980 1990
Cohort
.2
.4
.6
.8
1
Expe
cted
lite
racy
20 30 40 50
Age
.2
.4
.6
.8
1
2005 2010 2015 2020
Period
Tanzania
.2
.4
.6
.8
1
1960 1970 1980 1990 2000
Cohort
.2
.4
.6
.8
1
Expe
cted
lite
racy
20 30 40 50
Age
.2
.4
.6
.8
1
2000 2005 2010 2015
Period
Kenya
.2
.4
.6
.8
1
1950 1960 1970 1980 1990 2000
Cohort
Outcome in all graphs is education quality, i.e. literacy conditional on five yearsof schooling. Age effects estimated at grade 5 for cohort born in 1975 and noperiod effect. Period effects estimated at age 20, grade 5 and 1975 cohort. Cohorteffects estimated at age 20, grade 5 and no period effect.
35

Figure 5: National and regional trends in literacy and education quality
East AsiaEast Asia
Latin AmericaLatin AmericaLatin AmericaLatin AmericaLatin AmericaLatin AmericaLatin AmericaLatin AmericaLatin AmericaLatin AmericaLatin AmericaLatin AmericaLatin AmericaLatin AmericaLatin AmericaLatin America
Middle EastMiddle EastMiddle East
South AsiaSouth AsiaSouth AsiaSouth AsiaSouth AsiaSouth AsiaSouth Asia
Sub-Saharan AfricaSub-Saharan AfricaSub-Saharan AfricaSub-Saharan AfricaSub-Saharan AfricaSub-Saharan AfricaSub-Saharan AfricaSub-Saharan AfricaSub-Saharan AfricaSub-Saharan AfricaSub-Saharan AfricaSub-Saharan AfricaSub-Saharan AfricaSub-Saharan Africa
0
.2
.4
.6
.8
1
Unc
ondi
tiona
l lite
racy
rate
1955 1965 1975 1985 1995
Unconditional literacy rate
East AsiaEast AsiaLatin AmericaLatin AmericaLatin AmericaLatin AmericaLatin AmericaLatin AmericaLatin AmericaLatin AmericaLatin AmericaLatin AmericaLatin AmericaLatin AmericaLatin AmericaLatin AmericaLatin AmericaLatin America
Middle EastMiddle EastMiddle East
South AsiaSouth AsiaSouth AsiaSouth AsiaSouth AsiaSouth AsiaSouth Asia
Sub-Saharan AfricaSub-Saharan AfricaSub-Saharan AfricaSub-Saharan AfricaSub-Saharan AfricaSub-Saharan AfricaSub-Saharan AfricaSub-Saharan AfricaSub-Saharan AfricaSub-Saharan AfricaSub-Saharan AfricaSub-Saharan AfricaSub-Saharan AfricaSub-Saharan Africa
0
.2
.4
.6
.8
1
Exp
ecte
d lit
erac
y at
gra
de 5
1955 1965 1975 1985 1995
Expected literacy at grade 5
Women
East AsiaEast Asia
South AsiaSouth AsiaSouth AsiaSouth AsiaSouth AsiaSouth AsiaSub-Saharan AfricaSub-Saharan AfricaSub-Saharan AfricaSub-Saharan AfricaSub-Saharan AfricaSub-Saharan AfricaSub-Saharan AfricaSub-Saharan AfricaSub-Saharan AfricaSub-Saharan AfricaSub-Saharan Africa
0
.2
.4
.6
.8
1
Unc
ondi
tiona
l lite
racy
rate
1955 1965 1975 1985 1995
Unconditional literacy rate
East AsiaEast Asia
South AsiaSouth AsiaSouth AsiaSouth AsiaSouth AsiaSouth AsiaSub-Saharan AfricaSub-Saharan AfricaSub-Saharan AfricaSub-Saharan AfricaSub-Saharan AfricaSub-Saharan AfricaSub-Saharan AfricaSub-Saharan AfricaSub-Saharan AfricaSub-Saharan AfricaSub-Saharan Africa
0
.2
.4
.6
.8
1
Exp
ecte
d lit
erac
y at
gra
de 5
1955 1965 1975 1985 1995
Expected literacy at grade 5
Men
Note: Light gray lines show national estimates. To ensure regional trends reflect a consistentsample of countries, in cases of missing data for specific country-birth cohorts, nationaleducation quality estimates have been extrapolated backward and forward using the average,country-specific rate of change over the whole period.
36

Figure 6: Education quality for the 1960’s cohort and 1990’s cohort (women)
AFG
AGO
BDI
BEN
BFA
BGD
BIHBLZ
BOL
BTN
CAF
CIV
CMR
COD
COG
COM
CRI
DJI
DOM
DZA
EGY
ETHGAB
GHA
GIN
GMB
GNB
GTM
GUY
HND
HTI
IDN
IND
IRQ
JOR
KEN
KHM
LAO
LBR
LSO
MAR
MDG
MDV
MEXMKD
MLI
MMR
MNE
MNG
MOZ
MRT
MWI
NAM
NER
NGA
NIC
NPL
PAK PANPER PHL
PNG
PRY
PSE
RWA
SDN
SEN
SLE
SLV
SOM
SRB
STP
SURSWZ
SYR
TCD
TGO
THA
TLS
TTOTUNTZA
UGA
VNM
YEM
ZAF
ZMB
0
.2
.4
.6
.8
1
Scho
ol q
ualit
y of
199
0's
coho
rt
0 .2 .4 .6 .8 1
School quality of 1960's cohortNote: 1980's cohort instead of 1990's for BIH, BOL, CAF, DJI, MAR, MKD, NIC, PHL, SOM and SYR.
37
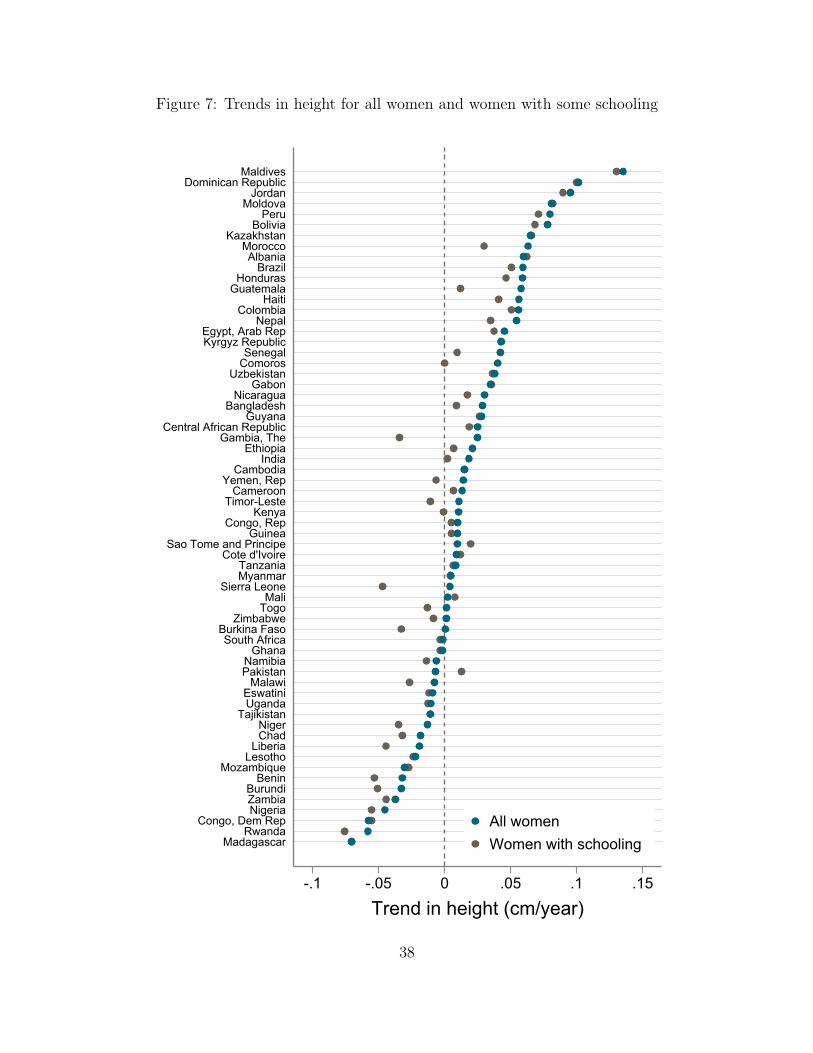
Figure 7: Trends in height for all women and women with some schooling
-.1 -.05 0 .05 .1 .15
Trend in height (cm/year)
MadagascarRwanda
Congo, Dem RepNigeriaZambiaBurundi
BeninMozambique
LesothoLiberia
ChadNiger
TajikistanUgandaEswatini
MalawiPakistanNamibia
GhanaSouth Africa
Burkina FasoZimbabwe
TogoMali
Sierra LeoneMyanmarTanzania
Cote d'IvoireSao Tome and Principe
GuineaCongo, Rep
KenyaTimor-Leste
CameroonYemen, Rep
CambodiaIndia
EthiopiaGambia, The
Central African RepublicGuyana
BangladeshNicaragua
GabonUzbekistan
ComorosSenegal
Kyrgyz RepublicEgypt, Arab Rep
NepalColombia
HaitiGuatemalaHonduras
BrazilAlbania
MoroccoKazakhstan
BoliviaPeru
MoldovaJordan
Dominican RepublicMaldives
All womenWomen with schooling
38

Figure 8: Trends in schooling and education quality before and after free primary education(FPE) reforms
(a) Ethiopia, women
0
.2
.4
.6
Sha
re w
ith 5
+ ye
ars
of s
choo
ling
-20 -10 0 10
Birthyear, 0 = youngest fully treated cohort
Share with 5+ years of schooling
.6
.7
.8
.9
1
Lite
racy
giv
en 5
yea
rs o
f sch
oolin
g
-20 -10 0 10
Birthyear, 0 = youngest fully treated cohort
Literacy given 5 years of schooling
(b) Madagascar, women
.3
.4
.5
.6
.7
Sha
re w
ith 5
+ ye
ars
of s
choo
ling
-20 -10 0 10 20
Birthyear, 0 = youngest fully treated cohort
Share with 5+ years of schooling
.8
.85
.9
.95
1
Lite
racy
giv
en 5
yea
rs o
f sch
oolin
g
-20 -10 0 10 20
Birthyear, 0 = youngest fully treated cohort
Literacy given 5 years of schooling
(c) Mali, women
.1
.2
.3
.4
.5
Sha
re w
ith 5
+ ye
ars
of s
choo
ling
-20 -10 0 10 20
Birthyear, 0 = youngest fully treated cohort
Share with 5+ years of schooling
.3
.35
.4
.45
.5
.55
Lite
racy
giv
en 5
yea
rs o
f sch
oolin
g
-20 -10 0 10 20
Birthyear, 0 = youngest fully treated cohort
Literacy given 5 years of schooling
Note: The figure shows the cohort effects for schooling (share of women with five ormore years of schooling) and education quality (literacy conditional on five years of school-ing) from the model in equation (2). Vertical dashed lines mark the first cohort enteringschool after the abolition of fees. The three countries shown were selected on the basisof showing the largest trend breaks in women’s schooling (rather than education quality).
39

Figure 9: Changes in education quality trends after free primary education (FPE) reforms
Montenegro_1992Uganda_1997
Thailand_1999Vietnam_1980Thailand_1997
Ghana_1996Mali_1992
Nigeria_1976Philippines_1987Honduras_1982
Syrian Arab Republic_1981Vietnam_1992
Bangladesh_1990Nepal_1975
Indonesia_1994Nepal_1981
Suriname_1987Madagascar_1992
Serbia_1990Malawi_1994
Namibia_1990Mexico_1993Kenya_1979
Senegal_1991Cambodia_1993
Nepal_1992Lao PDR_1996Mongolia_1992Ethiopia_1994
South Africa_1996Togo_1992
-10 -5 0 5 10
Change in trend after FPE (pp/year)
School quality-WomenNigeria_1976
Mali_1992
Indonesia_1994
Bangladesh_1990
Senegal_1991
Nepal_1975
Malawi_1994
Nepal_1981
Madagascar_1992
Nepal_1992
Ethiopia_1994
Kenya_1979
Lao PDR_1996
Thailand_1999
Ghana_1996
Cambodia_1993
Thailand_1997
Namibia_1990
Togo_1992
Mongolia_1992
-8 -6 -4 -2 0 2
Change in trend after FPE (pp/year)
School quality-Men
40

Table 1: Geographic coverage of survey data
Surveys Countries Countrieswith > 1survey
Pop.share∗
Sample
WomenEast Asia and Pacific† 27 10 8 .91 498,559Europe and Central Asia 8 4 2 .03 39,137Latin America and Caribbean 37 16 10 .41 520,634Middle East and North Africa 18 10 4 .75 389,544South Asia 22 7 5 .99 1246,963Sub-Saharan Africa 167 40 36 .97 1,942,746Total 279 87 65 .81 4,637,583
MenEast Asia and Pacific† 16 9 5 .77 120,530Europe and Central Asia 2 1 1 .01 7,505Latin America and Caribbean 15 7 3 .1 96,277Middle East and North Africa 0 0 0 0 0South Asia 12 6 4 .99 213121Sub-Saharan Africa 107 35 32 .86 519,795Total 152 58 45 .67 957,228
∗Population share excludes high-income countries except Panama and Trinidad and Tobago.†East Asia and Pacific excludes China.
41

Table 2: Literacy, share with at least five years of schooling, and education quality
Women
1950s 1960s 1970s 1980s 1990s
LiteracyEast Asia and Pacific 77.9 81.3 89.2 92.1 94.1
(0.03) (0.02) (0.01) (0.01) (0.02)Latin America and Caribbean 72.1 85.7 90.1 94.0 96.5
(0.10) (0.04) (0.03) (0.02) (0.01)Middle East and North Africa 36.5 50.6 64.9 73.4 83.8
(0.08) (0.05) (0.03) (0.03) (0.03)South Asia 33.6 36.0 46.5 62.3 75.4
(0.02) (0.01) (0.01) (0.00) (0.01)Sub Saharan Africa 29.8 42.4 48.1 53.4 62.7
(0.07) (0.03) (0.02) (0.01) (0.02)
Share with S ≥ 5East Asia and Pacific 58.7 66.9 83.0 87.9 92.2
(0.04) (0.02) (0.02) (0.02) (0.02)Latin America and Caribbean 56.3 76.5 81.9 89.1 94.6
(0.12) (0.05) (0.04) (0.03) (0.02)Middle East and North Africa 34.0 48.1 62.2 70.5 83.3
(0.08) (0.05) (0.03) (0.03) (0.03)South Asia 30.2 34.1 45.5 62.3 76.2
(0.01) (0.01) (0.01) (0.01) (0.01)Sub Saharan Africa 26.5 41.5 48.8 54.6 66.0
(0.07) (0.03) (0.02) (0.01) (0.02)
Education qualityEast Asia and Pacific 86.5 86.9 89.7 89.1 89.1
(0.04) (0.03) (0.03) (0.03) (0.03)Latin America and Caribbean 84.4 89.4 90.7 90.5 86.2
(0.04) (0.02) (0.01) (0.01) (0.01)Middle East and North Africa 62.2 69.7 67.8 66.4 59.4
(0.00) (0.01) (0.01) (0.01) (0.00)South Asia 91.9 87.1 76.5 65.7 56.1
(0.00) (0.00) (0.00) (0.00) (0.00)Sub Saharan Africa 71.2 67.8 61.8 54.1 43.6
(0.00) (0.00) (0.00) (0.00) (0.00)
CountriesEast Asia and Pacific 7 10 10 10 9Latin America and Caribbean 9 16 16 16 14Middle East and North Africa 5 10 10 10 7South Asia 4 7 7 7 7Sub Saharan Africa 35 40 40 40 38
42

Table 3: Literacy, share with at least five years of schooling, and education quality
Men
1950s 1960s 1970s 1980s 1990s
LiteracyEast Asia and Pacific 86.5 88.2 91.9 93.4 93.9
(0.05) (0.03) (0.02) (0.02) (0.04)South Asia 69.9 64.8 72.4 78.4 82.2
(0.02) (0.02) (0.01) (0.01) (0.02)Sub Saharan Africa 60.6 64.9 66.3 70.3 76.4
(0.12) (0.06) (0.03) (0.03) (0.03)
Share with S ≥ 5East Asia and Pacific 74.1 78.0 86.1 89.4 90.4
(0.07) (0.04) (0.03) (0.03) (0.05)South Asia 63.8 59.1 69.0 76.7 81.8
(0.02) (0.02) (0.01) (0.02) (0.03)Sub Saharan Africa 52.8 59.5 63.4 68.6 76.6
(0.13) (0.06) (0.03) (0.03) (0.03)
Education qualityEast Asia and Pacific 90.2 90.4 90.1 87.6 88.4
(0.00) (0.09) (0.08) (0.06) (0.05)South Asia 95.6 89.7 79.2 68.9 55.6
(0.00) (0.00) (0.00) (0.00) (0.00)Sub Saharan Africa 83.4 76.9 70.3 62.0 52.4
(0.00) (0.00) (0.00) (0.00) (0.00)
CountriesEast Asia and Pacific 2 9 9 9 8South Asia 3 6 6 6 6Sub Saharan Africa 25 35 35 35 35
43
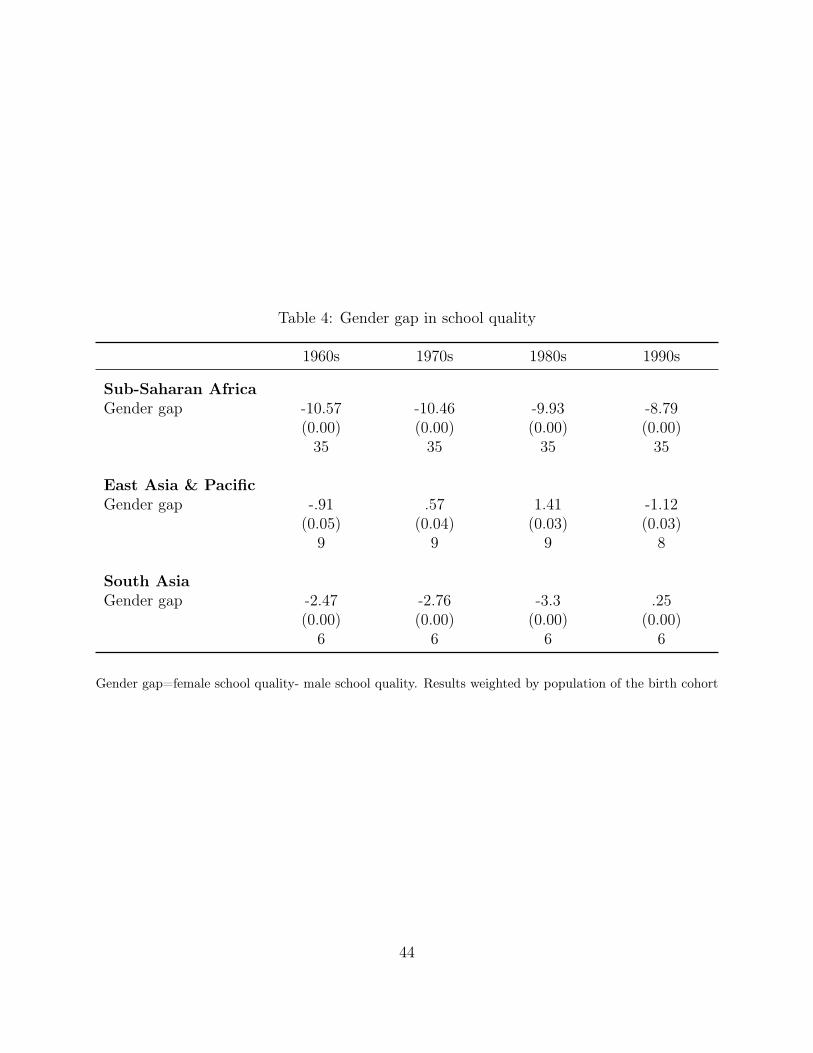
Table 4: Gender gap in school quality
1960s 1970s 1980s 1990s
Sub-Saharan AfricaGender gap -10.57 -10.46 -9.93 -8.79
(0.00) (0.00) (0.00) (0.00)35 35 35 35
East Asia & PacificGender gap -.91 .57 1.41 -1.12
(0.05) (0.04) (0.03) (0.03)9 9 9 8
South AsiaGender gap -2.47 -2.76 -3.3 .25
(0.00) (0.00) (0.00) (0.00)6 6 6 6
Gender gap=female school quality- male school quality. Results weighted by population of the birth cohort
44

Table 5: Education quality and economic growth
(1) (2) (3) (4) (5) (6)VARIABLES 1990 1990 2000 2000 2010 2010
School quality 0.0245*** 0.0157** 0.0301*** 0.0220** 0.0383** 0.0289**(0.00786) (0.00741) (0.0108) (0.00926) (0.0149) (0.0129)
Years of schooling 0.00474*** 0.00430*** 0.00330(0.00111) (0.00130) (0.00228)
Share accessing grade 5 0.0346*** 0.0312** 0.0294*(0.0106) (0.0124) (0.0165)
Log of initial GDP pc (WB) -0.0121*** -0.0108*** -0.0123*** -0.0106*** -0.00945* -0.00936**(0.00343) (0.00325) (0.00353) (0.00357) (0.00493) (0.00414)
Constant 0.0582*** 0.0670*** 0.0604*** 0.0672*** 0.0416 0.0520**(0.0206) (0.0199) (0.0194) (0.0200) (0.0272) (0.0245)
Observations 62 74 65 81 66 83R-squared 0.311 0.234 0.274 0.196 0.128 0.117
Note: The dependent variable is real economic growth per capita in constant USD from the initial year to 2019, as reported by the
World Bank, World Development Indicators. Education in single years for adults is taken from Barro and Lee (2018). Education
quality and share accessing grade five are the averages at initial year for the population aged 20 to 40 (or the highest available age)
weighted by cohort population. Robust standard errors are reported in parentheses. *** p<0.01, ** p<0.05, * p<0.1.
45

Table 6: Education quality and enrollment
(1) (2) (3) (4)
WomenBirth Year -0.465∗∗∗ -0.292∗∗∗ -0.317∗∗∗ -0.357∗∗∗
(0.0242) (0.0588) (0.0473) (0.0459)Share with schooling -10.67∗∗∗ -11.83∗∗∗ -0.418
(3.427) (3.972) (4.305)Share with secondary schooling -8.423∗∗ -6.104∗ -11.92∗∗∗
(3.928) (3.521) (4.030)Repetition 11.53∗∗∗ 7.611∗∗∗
(1.418) (1.314)Height w/ schooling 0.966∗∗∗
(0.287)N 3231 3231 2186 1401R2 0.788 0.790 0.875 0.915
MenBirth Year -0.603∗∗∗ -0.574∗∗∗ -0.647∗∗∗
(0.0283) (0.0471) (0.0482)Share with schooling 7.748 5.879
(6.249) (6.690)Share with secondary schooling -7.933∗
(4.548)Repetition 6.385∗∗∗
(1.416)N 2124 2124 1510R2 0.727 0.727 0.768
Note: Each column presents a separate regression, estimated separately for men and women, ofpredicted literacy at grade 5 on the covariates shown in the left column. The unit of observationis a country-birth cohort. All estimates control for country fixed effects.* for p < 0.05, ** for p < 0.01, and *** for p < 0.001.
46

A Appendix
A.1 APC decomposition of literacy for individuals with no school-
ing
Figure 10: Age and cohort effects of literacy for individuals with no schooling. Deaton-Paxson normalization.
-.004
-.002
0
.002
.004
.006
Line
ar tr
end
in li
tera
cy p
er y
ear
excludes outside values
AgeCohort
A.2 Age and cohort trends estimated with OLS and Tobit estima-
tors
Results are summarized by looking at the linear trends of the age and cohorts as seen in andshow OLS and Tobit estimates for equations 2 and 4. Period effects trends are not shown asthey are zero by construction.
47

Figure 11: Comparison of age and cohort trends for OLS and Tobit estimates with age fixedeffects and age and age squared
-.02
-.01
0
.01
.02
Line
ar tr
end
in li
tera
cy p
er y
ear
OLS Tobitexcludes outside values
Age fixed effects
AgeCohort -.02
-.01
0
.01
.02
Line
ar tr
end
in li
tera
cy p
er y
ear
OLS Tobitexcludes outside values
Age and age squared
AgeCohort
The different specifications show similar results. Age and cohort effects tend to be smalland negative with about three quarters of estimated age and cohort trends being negative.Thus, both age and cohort effects tend to show that in the majority of cases individualstend to lose literacy as they age and that more recent cohorts have lower rate of literacyafter five years of schooling. In 12 cases, OLS and Tobit estimates using age fixed effectshave estimation issues with parameters being omitted because of multicollinearity. Exceptfor these 12 cases, age and cohort trends are almost identical when controlling for age fixedeffects or age and age squared with a correlation of 0.99 for cohort effects and 0.9 for ageeffects for OLS and Tobit estimates. In order to keep a maximum number of cases, wetherefore use the specification with age and age squared.
Compared to OLS estimates, Tobit estimates tend to have trends closer to 0 with a medianage effect trend of -0.3 percentage points per year, or 9 percentage points over 30 years,while the median trend for age effect is -0.4 percentage points per year with OLS estimates.Similarly, median trends of cohort effects are -0.5 and -0.6 percentage points per year with
48

Tobit and OLS estimates respectively. The main difference lies in the trimming of largenegative cohort effects. With Tobit estimates, there are 10 cases with cohort effects largerthan -1 percentage point per year while there are 20 cases with OLS estimates. Interestingly,maximum values for positive cohort or age effects are similar with OLS or Tobit estimates.The trimming of large cohort effects makes results more plausible. For instance, for Ethiopianwomen OLS estimates predict a very large drop in school quality but this is due to the factthat expected literacy at grade five of 20 year old is 1.3 for the first cohorts and then decreaseto about 0.7 for the last cohorts, whereas Tobit estimates predict a more realistic drop from1 to 0.7. For this reason, we use Tobit estimates in our main discussion.
A.3 Comparison of APC, AC and C models
Figure 12: Comparison of APC, AC and C models by number of available surveys
-.03
-.02
-.01
0
.01
Line
ar tr
end
in li
tera
cy p
er y
ear
APC 3+ surveys AC 3+ surveys C 3+ surveys AC 2 surveys C 1 surveyexcludes outside values
AgeCohort
For cases with at least three available surveys, dropping the normalized period effects (ACmodel) gives very similar results to the APC model estimated with DP normalization. Me-dian trends in cohort and age effects are almost identical, which is not surprising given the
49

DP normalization assumes no trend in period effects. For comparison, age and cohort ef-fects of AC estimates for country/sex cases with two surveys are shown in figure 12. Theytend to show similar median trends than country/cases with more more than two surveysavailable but a wider distribution of effects. Finally, estimating a C model (with no controlsfor age or period) on country/sex cases with at least three available surveys shows that, asexpected, the median cohort effects tend to be biased upwards (median cohort effects of -0.3pp instead of -0.5 pp with the full APC decomposition), which is consistent with age effectsbeing negative. Thus, for country/sex cases with only one available surveys we cannot ruleout that the small negative median cohort trend (-0.1 pp) might be due to the absence ofcontrols for age effects.
A.4 Country results
Table 7: Cohort-based estimates of trends: Women
Birth Literacy Share LiteracyCohort Rate with S ≥ 5 @ S = 5
First Last First Last ∆% First Last ∆% First Last ∆%
p.a. p.a. p.a.
Afghanistan+ 1963 1995 6.7 17.5 .5 6 16.4 .5 87.2 55.4 -1.4(.4) (.3) (.4) (.3) (0) (0)
Algeria+ 1965 1999 66.5 95 1.2 64.6 94.6 1.3 87.1 77 -.4(.4) (.2) (.5) (.2) (0) (0)
Angola 1958 1995 45.8 60.1 .5 35.6 60.1 .9 92.3 55.8 -1.4(1.8) (.5) (1.9) (.5) (0) (0)
Bangladesh 1958 1999 29.5 83.8 1.8 28.5 84.3 1.8 87.3 73.8 -.4(.3) (.2) (.3) (.2) (0) (0)
Belize 1958 1995 86.8 95.1 .3 83.2 92.7 .4 36.7 79.7 1.6(1.2) (.4) (1.3) (.5) (4.2) (1.4)
Benin 1953 1997 14.5 38.1 .7 14.5 39.4 .7 63.1 43.3 -.6(.8) (.5) (.9) (.5) (0) (0)
Bhutan* 1962 1990 14.4 49.9 2 8.4 41.4 1.8 72.2 70.1 -.1(.6) (.6) (.5) (.7) (0) (0)
Bolivia+ 1955 1988 77.5 96 .8 51 85.7 1.5 100 100 0
50

Survey Literacy Share LiteracyYear Rate with S ≥ 5 @ S = 5
First Last First Last ∆% First Last ∆% First Last ∆%
p.a. p.a. p.a.
(.6) (.2) (.7) (.4) (0) (0)Bosnia* 1958 1986 97.6 99.4 .1 88.5 98 .5 93.1 90 -.2
(.4) (.1) (1) (.3) (1.9) (2.4)Burkina Faso 1955 1997 6.4 27.3 .7 7 27.8 .6 46.2 58.6 .4
(.4) (.7) (.4) (.7) (0) (0)Burundi 1957 1996 33.4 63.8 1 11.7 45 1.1 88.3 96 .3
(1) (.5) (.8) (.5) (0) (0)CAR+ 1958 1986 22.9 31.6 .5 24.1 36.2 .7 90.7 47.5 -2.4
(.9) (.7) (1) (.7) (0) (0)Cambodia 1952 1994 47.4 73.8 .8 16.3 68.1 1.6 97.6 77.3 -.6
(.6) (.4) (.6) (.5) (0) (0)Cameroon 1956 1998 53.5 69.6 .5 56.3 74.3 .6 71.8 49.9 -.7
(.8) (.5) (.9) (.5) (0) (0)Chad 1956 1994 7.8 21.4 .5 6.2 25.4 .7 82.4 28.8 -1.9
(.6) (.5) (.6) (.5) (0) (0)Comoros* 1964 1992 34.8 65 1.7 34.8 66.8 1.8 46.6 43.7 -.2
(1.7) (1.1) (1.8) (1.1) (0) (0)Congo, Dem Rep+ 1959 1993 44.7 58.1 .6 45.2 64.7 .8 72.8 37.4 -1.5
(1) (.5) (1.1) (.5) (0) (0)Congo, Rep+ 1957 1991 69 77.1 .3 72.7 85.1 .5 33.3 28.8 -.2
(1.3) (.6) (1.3) (.5) (0) (0)Costa Rica+ 1963 1998 95.4 99.4 .2 89.4 97.6 .3 91.9 93.6 .1
(.6) (.1) (.8) (.3) (1.6) (1.2)Cote d’Ivoire 1958 1996 23.4 41.2 .6 24.2 41.3 .6 81.9 60.8 -.8
(.8) (.6) (.8) (.7) (0) (0)Djibouti* 1958 1986 17.5 44.9 1.5 21.1 52.4 1.7 34.5 36.9 .1
(1.3) (1) (1.6) (1) (2.9) (2.3)Dominican Rep. 1954 1994 79.8 95.2 .5 65.7 95 1 95.6 73.1 -.7
51

Survey Literacy Share LiteracyYear Rate with S ≥ 5 @ S = 5
First Last First Last ∆% First Last ∆% First Last ∆%
p.a. p.a. p.a.
(.5) (.2) (.6) (.2) (0) (0)Egypt, Arab Rep 1952 1994 36.8 80.3 1.4 39.6 80.1 1.3 35.1 40.1 .2
(.5) (.4) (.5) (.4) (0) (0)El Salvador* 1966 1994 83.2 95.3 .7 59.3 87.2 1.5 96.4 94.8 -.1
(.7) (.3) (1) (.5) (0) (0)Eswatini 1958 1994 81.8 95 .5 72.4 92.7 .8 83.9 85.9 .1
(1) (.3) (1.3) (.4) (0) (0)Ethiopia 1952 1996 7.6 44.9 1.1 4 41.6 1.1 97.5 68.2 -.9
(.4) (.5) (.3) (.6) (0) (0)Gabon* 1964 1992 82.3 90 .4 84.2 91.6 .4 64.5 60.9 -.2
(.9) (.5) (.9) (.5) (0) (0)Ghana 1955 1999 46.9 76 .9 53 82.6 .9 5.1 13.2 .2
(1.1) (.5) (1.1) (.5) (0) (0)Guatemala* 1967 1994 64.3 84.5 1.2 39.6 67.3 1.6 95.5 95.3 0
(.6) (.4) (.7) (.5) (0) (0)Guinea 1957 1998 8.7 31.9 .7 9.6 37.2 .9 26 19.4 -.2
(.6) (.6) (.7) (.6) (0) (0)Guinea-Bissau 1958 1998 17.4 51.9 1.2 13.8 51.8 1.3 88.8 58.8 -1
(1) (.7) (1) (.7) (0) (0)Guyana 1961 1994 91.2 96.3 .2 83.3 95 .5 95.7 66.4 -1.3
(.6) (.3) (.9) (.4) (0) (0)Haiti 1952 1996 28.4 82.5 1.6 20.7 81.8 1.8 87.5 72.6 -.4
(.8) (.4) (.7) (.4) (0) (0)Honduras+ 1958 1991 82.4 94.3 .5 54.1 81.1 1.2 100 100 0
(.5) (.2) (.7) (.4) (0) (0)India+ 1958 1995 38 75.8 1.4 36.6 77.3 1.5 89.8 51.4 -1.4
(.3) (.1) (.3) (.1) (0) (0)Indonesia 1954 1997 68 97.7 .9 58.5 96.6 1.2 83.9 91.7 .2
52

Survey Literacy Share LiteracyYear Rate with S ≥ 5 @ S = 5
First Last First Last ∆% First Last ∆% First Last ∆%
p.a. p.a. p.a.
(.4) (.1) (.4) (.1) (0) (0)Iraq 1958 1998 56.9 75.9 .6 52.8 73 .7 87.1 77.6 -.3
(.6) (.3) (.6) (.4) (0) (0)Jordan* 1969 1997 94.5 96.8 .1 94.7 96.6 .1 64.2 67.6 .2
(.3) (.3) (.3) (.3) (0) (0)Kenya 1955 1995 56.3 85.5 1 61.3 89.8 1 66.5 61.4 -.2
(1.1) (.3) (1.2) (.3) (0) (0)Lao PDR+ 1958 1997 55.2 73.3 .6 38.5 73.5 1.2 99.4 79 -.7
(1.2) (.5) (1.2) (.5) (0) (0)Lesotho 1956 1994 87.6 95.2 .3 80.7 96.2 .6 98.2 83 -.5
(.7) (.3) (1) (.3) (0) (0)Liberia 1959 1996 24.7 56.2 1.2 26.7 61.7 1.3 48.8 37.9 -.4
(.8) (.8) (.8) (.9) (0) (0)Madagascar 1956 1998 65.7 68.3 .1 38.5 54.5 .5 99.5 87.6 -.4
(.8) (.4) (.9) (.5) (0) (0)Malawi 1952 1997 35 71.9 1.1 25.8 71.5 1.3 82.5 64.6 -.5
(.8) (.5) (.7) (.5) (0) (0)Maldives* 1968 1996 90.8 99.6 .5 72.8 99.1 1.5 89.8 92.7 .2
(.5) (.1) (1.1) (.2) (0) (0)Mali 1953 1998 9.4 28.2 .5 9.2 29.2 .6 57.1 33.9 -.7
(.5) (.5) (.5) (.5) (0) (0)Mauritania 1959 1995 36.2 56.3 .8 18.7 48.8 1.2 74.9 68.4 -.2
(.8) (.5) (.6) (.6) (0) (0)Mexico* 1967 1995 94 98.3 .2 88.5 97.8 .5 91.1 87.6 -.2
(.4) (.2) (.6) (.2) (0) (0)Mongolia 1958 1998 95.2 98.2 .1 90.2 96 .2 84 80.7 -.1
(.5) (.2) (.8) (.3) (0) (0)Montenegro+ 1957 1993 97.9 99.2 0 96 99 .1 70.9 53.7 -.7
53

Survey Literacy Share LiteracyYear Rate with S ≥ 5 @ S = 5
First Last First Last ∆% First Last ∆% First Last ∆%
p.a. p.a. p.a.
(.6) (.2) (.9) (.3) (3.7) (4.3)Morocco* 1955 1983 29.4 52.9 1.3 19.2 40.9 1.2 94 94.6 0
(.7) (.7) (.7) (.7) (0) (0)Mozambique 1955 1998 20.9 51.1 .9 12.2 61.4 1.5 99.8 41.9 -1.8
(.7) (.8) (.5) (.8) (0) (0)Myanmar* 1968 1995 77.5 85.2 .5 52.3 74.4 1.3 92.2 93.9 .1
(.6) (.5) (.8) (.7) (0) (0)Namibia 1952 1993 74.7 93.5 .6 63.5 93.3 1 51 64.6 .4
(1.1) (.3) (1.3) (.4) (0) (0)Nepal 1952 1998 17.9 80.7 1.7 5.4 76.5 2 99.5 82.8 -.5
(.7) (.3) (.4) (.4) (0) (0)Nicaragua* 1953 1981 74 85.1 .6 47.6 69.5 1.2 98.6 97.3 -.1
(.9) (.5) (1) (.7) (0) (0)Niger+ 1958 1992 5.8 11.8 .3 6.3 14.6 .3 54.3 36 -.8
(.5) (.5) (.5) (.5) (0) (0)Nigeria 1955 1998 33.9 57 .7 40.9 62.4 .7 52.3 21.2 -.9
(.8) (.3) (.8) (.3) (0) (0)North Macedonia* 1957 1985 93.3 96.3 .2 84.2 93.5 .5 90.5 91.3 0
(.6) (.3) (1) (.4) (0) (0)Pakistan 1958 1997 26 52.3 .9 22.4 48.9 .9 68.9 85.9 .6
(.7) (.7) (.7) (.7) (0) (0)Panama* 1965 1993 95.1 96.9 .1 91.6 95.9 .2 96 91 -.3
(.4) (.3) (.6) (.4) (0) (0)Pap. N. Guinea* 1969 1996 48.5 60.8 .7 56.2 65.7 .6 54.8 51.8 -.2
(.8) (.6) (.9) (.7) (0) (0)Paraguay* 1968 1996 90.4 96.8 .4 83.5 94.9 .6 88.2 88.1 0
(.7) (.3) (1) (.4) (0) (0)Peru 1952 1992 82.3 96 .5 71.7 93.7 .7 69.4 84.9 .5
54

Survey Literacy Share LiteracyYear Rate with S ≥ 5 @ S = 5
First Last First Last ∆% First Last ∆% First Last ∆%
p.a. p.a. p.a.
(.4) (.1) (.5) (.1) (0) (0)Philippines+ 1955 1988 92.2 96.7 .2 88.4 95.7 .3 92.4 83.8 -.4
(.4) (.2) (.5) (.3) (0) (0)Rwanda 1952 1997 40.2 81.9 1.2 23 61.5 1.1 97.4 97 0
(.9) (.5) (.8) (.7) (0) (0)Sao Tome 1960 1999 65.1 88.7 .8 40.6 83.8 1.5 96.1 79 -.6
(1.7) (.8) (1.9) (1) (0) (0)Senegal 1957 1998 21.5 47.8 .8 21.4 49.6 .9 75 55.9 -.6
(.5) (.4) (.5) (.4) (0) (0)Serbia 1957 1999 98.6 99.1 0 96.6 98.9 .1 91.8 82.5 -.3
(.2) (.2) (.4) (.3) (2.1) (4.8)Sierra Leone 1957 1999 14.6 53.2 1.2 16.6 59.4 1.3 40.8 16.3 -.8
(.8) (.4) (.9) (.4) (0) (0)Somalia* 1958 1986 15.8 23 .4 9.2 10.6 .1 85.9 89.2 .2
(1.3) (.8) (1) (.6) (0) (0)South Africa* 1968 1996 91.5 97.3 .3 89.2 98.9 .5 71.4 47.9 -1.3
(.6) (.3) (.7) (.2) (0) (0)Sudan+ 1962 1994 37.7 54.4 .8 34.4 54.8 .9 78.7 60 -.8
(.8) (.5) (.9) (.5) (0) (0)Suriname 1958 1998 88 95.7 .3 83.6 94.9 .4 99 88 -.4
(.7) (.4) (.8) (.4) (0) (0)Syria* 1958 1986 63.3 88.1 1.4 60 87.3 1.5 74.9 63.7 -.6
(.7) (.3) (.8) (.4) (0) (0)Tanzania 1956 1997 53.8 76.6 .7 49 79.4 1 77.4 65 -.4
(1) (.5) (1) (.5) (0) (0)Thailand 1958 1999 87.7 96.4 .3 44.1 96.9 1.7 100 74.8 -.8
(.3) (.2) (.4) (.2) (1.8) (1.9)The Gambia 1958 1998 11.6 57.4 1.5 13.3 62.5 1.6 39.7 16.1 -.8
55

Survey Literacy Share LiteracyYear Rate with S ≥ 5 @ S = 5
First Last First Last ∆% First Last ∆% First Last ∆%
p.a. p.a. p.a.
(.8) (.6) (.8) (.6) (0) (0)Timor-Leste+ 1961 1996 36 79.5 1.7 31.8 79 1.9 96.9 64.8 -1.3
(.8) (.5) (.8) (.6) (0) (0)Togo 1958 1997 29.5 57.2 1 32 64.4 1.1 74.9 42.6 -1.1
(1.1) (.6) (1.2) (.6) (0) (0)Trini. and Toba.+ 1958 1991 96.2 98.7 .1 95.8 98.8 .1 99.8 90.2 -.4
(.4) (.2) (.5) (.2) (0) (0)Tunisia+ 1964 1998 66.5 95.1 1.2 65.1 95.9 1.3 98.8 67.4 -1.3
(.8) (.3) (.8) (.3) (0) (0)Uganda 1952 1998 41.4 68.3 .7 32 80.7 1.4 85.1 45.1 -1.1
(1.4) (.5) (1.3) (.4) (0) (0)Vietnam 1958 1994 90.1 93.5 .1 76.7 88.7 .5 72 94.1 .8
(.4) (.5) (.7) (.6) (0) (0)West Bank* 1966 1994 91.3 99.1 .4 93.3 99.5 .3 58.9 26.9 -1.8
(.5) (.1) (.5) (.1) (0) (0)Yemen, Rep* 1965 1993 20 52.4 1.8 16.1 49 1.8 68.3 70 .1
(.7) (.5) (.7) (.5) (0) (0)Zambia 1954 1998 56.4 70.8 .4 58.4 85.4 .8 61.2 22.6 -1.1
(1.2) (.5) (1.2) (.4) (0) (0)
Table 8: Cohort-based estimates of trends: Men
Birth Literacy Share LiteracyCohort Rate with S ≥ 5 @ S = 5
First Last First Last ∆% First Last ∆% First Last ∆%
p.a. p.a. p.a.
56

Survey Literacy Share LiteracyYear Rate with S ≥ 5 @ S = 5
First Last First Last ∆% First Last ∆% First Last ∆%
p.a. p.a. p.a.
Afghanistan* 1967 1995 36.9 48.1 .6 31.4 46.9 .9 55.8 51.7 -.2(.9) (.9) (.9) (.9) (0) (0)
Albania+ 1961 1997 96.6 96.9 0 98.3 96.9 -.1 48.7 75.1 1(.5) (.4) (.3) (.4) (5.2) (2.7)
Angola* 1967 1995 81.3 83.2 .1 69.1 81.7 .7 81 66.4 -.8(1.2) (.8) (1.6) (.9) (0) (0)
Bangladesh+ 1959 1991 50.1 61 .5 41.7 53.6 .5 97.2 82.2 -.7(1.1) (1.7) (1.2) (1.9) (0) (0)
Belize* 1967 1995 86.4 94.1 .4 79.6 93.3 .8 81.6 84.1 .1(1.2) (.6) (1.6) (.7) (0) (0)
Benin 1953 1997 37.4 58.4 .6 34.6 58.9 .7 79.7 51.5 -.8(1.7) (.8) (1.8) (.9) (0) (0)
Bolivia+ 1955 1988 95.5 99.1 .2 75.1 94.7 .9 93.8 94.5 0(.5) (.2) (1.1) (.4) (1.4) (1)
Burkina Faso+ 1955 1990 18.5 39.5 .8 14.9 37.6 .9 25.8 54.1 1.1(1.3) (1) (1.3) (1) (0) (0)
Burundi+ 1962 1996 65.7 78.2 .5 29.1 60.9 1.3 99.8 97 -.1(1.5) (.7) (1.5) (.9) (0) (0)
Cambodia+ 1962 1994 69.9 77.8 .4 56.2 76.7 .9 73.6 61.6 -.5(.8) (.7) (1) (.8) (0) (0)
Cameroon 1956 1998 72 84.6 .4 71.3 87.1 .5 66.4 59.7 -.2(1.3) (.6) (1.4) (.5) (0) (0)
Chad+ 1956 1994 25.6 55.8 1.1 22.3 57.8 1.3 81.6 35.2 -1.7(2.7) (1.3) (2.8) (1.4) (0) (0)
Congo, Dem Rep+ 1959 1993 83 85.9 .1 82.5 87 .2 91.9 61.4 -1.3(1) (.6) (1.2) (.6) (0) (0)
Congo, Rep+ 1957 1991 92.5 86.9 -.2 93.1 90.4 -.1 58 46.6 -.5(1) (.8) (1) (.7) (0) (0)
57

Survey Literacy Share LiteracyYear Rate with S ≥ 5 @ S = 5
First Last First Last ∆% First Last ∆% First Last ∆%
p.a. p.a. p.a.
Cote d’Ivoire+ 1964 1996 52.9 62.1 .4 49.1 60.9 .5 95.3 60.6 -1.6(1.4) (1) (1.4) (1) (0) (0)
Dominican Rep. 1954 1993 78 88.9 .4 68.5 88 .7 97.8 74.2 -.8(1.2) (.4) (1.5) (.4) (0) (0)
Eswatini 1958 1994 79.7 92.1 .5 72.7 87.8 .6 68.3 78.9 .4(1.3) (.7) (1.6) (.9) (0) (0)
Ethiopia 1952 1996 39.5 69.7 .9 18.6 59.7 1.2 97.2 82.8 -.4(1.6) (.6) (1.2) (.7) (0) (0)
Gabon* 1964 1992 87.4 90.5 .2 86.9 90.8 .2 65.2 55.6 -.5(.9) (.7) (1) (.8) (0) (0)
Ghana 1955 1997 68.7 86.2 .5 70.9 89.5 .6 33.9 23.9 -.3(1.3) (.6) (1.3) (.6) (0) (0)
Guatemala* 1967 1994 80.2 91.1 .6 52 77.6 1.5 96.3 95.1 -.1(.8) (.5) (1.2) (.8) (0) (0)
Guinea 1957 1998 30.6 63.9 1.1 30.1 66.1 1.2 54.5 45 -.3(1.8) (1.3) (1.8) (1.4) (0) (0)
Guinea-Bissau+ 1966 1998 57 77.7 .9 46.4 74 1.3 99.9 86.5 -.6(1.6) (1) (1.7) (1.1) (0) (0)
Guyana* 1961 1989 86.3 91.8 .3 81 92 .6 62.8 46.3 -.9(1.1) (.9) (1.3) (.9) (0) (0)
Haiti 1952 1996 45 85.2 1.2 33.9 84.4 1.5 92.1 73 -.6(1.6) (.5) (1.6) (.5) (0) (0)
Honduras* 1964 1991 85.5 91.6 .4 58.8 79.1 1.2 97.4 93.3 -.2(1) (.6) (1.4) (.9) (.5) (.6)
India+ 1958 1995 66.7 88 .8 61.2 87.9 1 91.5 56.2 -1.3(.4) (.2) (.4) (.2) (0) (0)
Indonesia 1954 1997 84.5 96.8 .4 71.1 93.9 .7 91.8 90.8 0(.5) (.6) (.7) (.9) (0) (0)
58

Survey Literacy Share LiteracyYear Rate with S ≥ 5 @ S = 5
First Last First Last ∆% First Last ∆% First Last ∆%
p.a. p.a. p.a.
Kenya 1955 1994 81.8 89.7 .3 79.8 93.4 .5 89.8 60.5 -1(1.5) (.4) (1.7) (.4) (0) (0)
Lao PDR* 1969 1997 77 83.8 .4 70.8 82.2 .6 83.3 75.9 -.4(.7) (.6) (.9) (.6) (0) (0)
Lesotho 1956 1994 64.1 81.2 .6 49.3 77.7 1 92.8 75.7 -.6(2) (.9) (2.1) (1.1) (0) (0)
Liberia+ 1959 1993 68.3 76 .3 68.8 77.9 .4 97.6 66.4 -1.3(1.2) (1) (1.2) (1) (0) (0)
Madagascar 1956 1998 73.1 73.8 0 43.6 62.3 .6 96.3 90.1 -.2(1.3) (.8) (1.6) (1) (0) (0)
Malawi 1952 1995 72.1 79.9 .2 55.2 79 .7 93.5 67.8 -.8(1.7) (.5) (1.9) (.6) (0) (0)
Maldives* 1969 1996 90.5 98.9 .5 84.1 99.1 .9 84.5 69.8 -.9(.8) (.2) (1.2) (.2) (2) (5.5)
Mali 1953 1998 26.1 50.8 .7 22.7 50.8 .8 56.5 38.4 -.5(1.4) (1) (1.5) (1) (0) (0)
Mauritania* 1967 1995 54.8 70.9 .9 38.3 57.6 1.1 82.3 76.3 -.3(1.6) (1.1) (1.7) (1.3) (0) (0)
Mongolia+ 1965 1998 92.7 96 .1 85.9 90.7 .2 87.4 64.3 -1(.8) (.4) (1.2) (.8) (0) (0)
Mozambique+ 1955 1991 63.3 70.3 .3 44.5 67.8 .9 99.9 76.4 -.9(2.1) (1.2) (2.2) (1.3) (0) (0)
Myanmar* 1968 1995 84.2 86.7 .1 60.5 76.1 .9 93.4 85.1 -.5(.9) (.8) (1.4) (1.1) (0) (0)
Namibia 1952 1993 74 88.3 .5 59.8 88 .9 88.7 67.2 -.7(1.6) (.7) (2.1) (.8) (0) (0)
Nepal 1952 1996 61.1 91.8 .9 35.6 85.6 1.5 98.8 91.1 -.2(1.7) (.6) (1.7) (.9) (0) (0)
59

Survey Literacy Share LiteracyYear Rate with S ≥ 5 @ S = 5
First Last First Last ∆% First Last ∆% First Last ∆%
p.a. p.a. p.a.
Niger+ 1958 1992 20.5 37 .7 15.2 36.9 .9 41 45.7 .2(1.2) (1.4) (1.2) (1.5) (0) (0)
Nigeria 1955 1998 62.6 76.9 .4 66.4 80.2 .4 71.6 31.2 -1.2(1.7) (.5) (1.8) (.4) (0) (0)
Pakistan+ 1964 1997 57.6 64.8 .3 56.7 62.6 .3 74.2 68.9 -.2(1.2) (1.6) (1.3) (1.8) (0) (0)
Pap. N. Guinea* 1969 1996 66.7 75.7 .5 69.7 78.9 .5 64.5 58.1 -.4(1.1) (.8) (1.2) (.9) (0) (0)
Philippines* 1955 1983 90.5 94.6 .2 83 91.5 .5 84.8 83.8 -.1(.8) (.5) (1.3) (.8) (0) (0)
Rwanda 1952 1994 65.5 80.6 .5 39.8 57.3 .5 98.4 96.5 -.1(1.7) (.6) (1.8) (.9) (0) (0)
Sao Tome 1960 1999 90.1 89.6 0 67.3 83.9 .6 98.3 78.8 -.7(1.3) (.9) (2.2) (1.3) (0) (0)
Senegal 1957 1998 40.9 60.4 .6 34.8 59 .8 76.8 61.4 -.5(1.6) (.7) (1.6) (.7) (0) (0)
Sierra Leone 1960 1999 36 75.1 1.3 39.2 78.7 1.4 42.1 26.7 -.5(1.4) (.6) (1.5) (.6) (0) (0)
Tanzania 1956 1995 82.8 80.8 -.1 77.5 82.3 .2 76 64.5 -.4(1.5) (1) (1.9) (1) (0) (0)
Thailand+ 1967 1999 93.7 95.4 .1 91.2 95.9 .2 100 84 -.7(.2) (.3) (.3) (.2) (4.2) (2.4)
The Gambia+ 1965 1998 54.4 72 .8 51.3 72.8 .9 65.8 30.3 -1.5(1.6) (.9) (1.7) (1) (0) (0)
Timor-Leste+ 1961 1996 61.9 81.7 .8 53.1 77.5 1 94.4 71 -.9(1.5) (1) (1.6) (1.1) (0) (0)
Togo+ 1966 1997 67.5 79.7 .6 67.7 83.3 .7 100 64.5 -1.7(1.4) (1) (1.5) (.9) (0) (0)
60

Survey Literacy Share LiteracyYear Rate with S ≥ 5 @ S = 5
First Last First Last ∆% First Last ∆% First Last ∆%
p.a. p.a. p.a.
Uganda 1952 1996 72.4 73.8 0 59.7 84.7 .7 93.2 46.6 -1.4(2.2) (.9) (2.6) (.8) (0) (0)
Zambia 1954 1998 81.6 83.7 .1 81.3 91.8 .3 74.5 36.1 -1.1(1.4) (.5) (1.6) (.4) (0) (0)
61

A.5 The case of India
In this section, we explore further the case of India. India makes up 33 percent of the countrypopulation of the female sample but Indian estimates are only based on two surveys. Wefind a large drop in school quality in India but this might be due to the fact that we areunable to estimate age and period/survey effects simultaneously.
To understand why the trend in school quality is negative in India, it is useful to look atthe raw data. Figure 13 shows the literacy rate of women and men with four to five yearsof primary of schooling by years of birth for the surveys 2005/06 and 2015/16. For women,literacy rates are seem to be flat within each survey but there is a drop of literacy of morethan 10 percentage points between data collected in 2005/06 and data collected in 2015/16for women born the same year. The picture is similar for men although literacy rates arealso declining within each survey.
Figure 13: Literacy rates for women and men with 4 to 5 years of education in India bysurvey
2005
2015
.4
.5
.6
.7
.8
Lite
racy
rate
1960 1970 1980 1990 2000
Women
2005
2015
.4
.5
.6
.7
.8
1960 1970 1980 1990 2000
Men
As we control for cohort fixed effects and age and age squared, the gap in literacy forwomen or men born the same year but interviewed at different dates is entirely attributed
62

to age effects. Estimates age effects are relatively large with women expected to lose 25percentage points of literacy between age 20 and 40 and men 20 percentage points. Sincepredictions of literacy at grade 5 are estimated for individuals at age 20, the model pre-dicts that a steep downward trend in school quality between the first and the last cohorts.However, with only two available surveys it is hard to know if the systematic difference inliteracy rates we observe between individuals interviewed in different surveys is due to ageeffects, as our model assumes, or period/survey effects.
To test the sensitivity of our results to this modelling assumption, we estimated the samemodel without age effects but controlling for period/survey effects and predicted the literacyat grade five by year of birth. Results can been seen in figure 14 for women and men. Inboth cases, the trend in school quality is steeper when estimated with a model controllingfor age effects. In this case, it is predicted that Indian women and men born in the 1960’shad an expected literacy at grade five greater than 0.9 but that it declined to less than 0.5for the cohort born in the 1990’s. However, when the model only includes a survey effect,trends in school quality are flatter as the expected literacy at grade five of first cohorts isonly 0.6 for women and around 0.7 for men.
Figure 14: Trends in school quality with different model specifications for women and men.
.4
.6
.8
1
Expe
cted
lite
racy
at g
rade
5
1960 1970 1980 1990 2000
Women
.4
.6
.8
1
Expe
cted
lite
racy
at g
rade
5
1960 1970 1980 1990 2000
Men
Control for age effects Control for period effects
63
The two models presented in figure 14 can be thought as two extreme modelling assump-tions: either attributing all systematic differences between the two surveys to age effects orattributing it fully to period/survey effects. In both cases, school quality is declining but themagnitude of this decrease is really different, especially for women and without additionaldata, it is not possible to know what modelling assumption is the most appropriate. How-ever, there are reasons to think that our original modelling assumption controlling for ageeffects best fits the data.
In the model with survey effects, the coefficient associated with survey effect is 13 per-centage points for women and 9.7 for men. That is a very large effect; for comparison thelargest absolute survey effects for country/sex cases with at least three surveys is 22 per-centage points and there are only seven survey effects out of 313 that are larger than 13(and 15 greater than 9.7). What could explain such a large period/survey effect? First, wedo not believe that there can be large period effect for adult literacy in a relatively shortperiod of time. We find unlikely that the Indian context would have changed so drasticallyin 10 years that millions of adults would have become illiterate. A change in participationin literacy program could be a factor but only 3.3 percent of women said they ever took partto a literacy program in the 2005/06 survey (the question was not asked in 2015/16), whichis too low to impact adult literacy rates.
Therefore, the difference should come from survey effects, such as differences in samplingor data collection methods. Both surveys are designed to be nationally representative andsampling design is identical. However, the sampling frame has changed between the twosurveys as there has been a new census in 2011. Could this change explain the systematicdifference between the two surveys? We think it is unlikely. First, similar differences betweenthe two surveys are found within urban and rural areas. Moreover, analysis by Indian stateshows that a negative school quality trend and negative age effects are found in most states(see figure 15), showing that the difference in literacy rates between the two surveys is notdriven by composition effects. We can also see in figure 16 that the average number of yearsof schooling for men and women is identical across the two surveys for individuals born thesame year, suggesting that there has not been systematic differences in sampling betweenthe two surveys.
64

Figure 15: Trends in school quality by Indian state for women
Tamil Nadu
West Bengal
Bihar/Jharkhand
Rajasthan
Andhra Pradesh
Madhya Pradesh
MaharashtraUttar Pradesh
IndiaIndiaIndiaIndiaIndiaIndiaIndiaIndiaIndiaIndiaIndiaIndiaIndiaIndiaIndiaIndiaIndiaIndiaIndiaIndiaIndiaIndiaIndiaIndia
0
.2
.4
.6
.8
1Ex
pect
ed li
tera
cy a
t gra
de 5
1960 1970 1980 1990
Year of birth
65

Figure 16: Years of schooling by survey for women and men.
2005
2015
2
4
6
8
10
Year
s of
sch
oolin
g
1960 1970 1980 1990 2000
Year of birth
Women
2005
2015
2
4
6
8
10
Year
s of
sch
oolin
g
1960 1970 1980 1990 2000
Year of birth
Men
Another possible source of survey effect could be a change in the way literacy is measured.In both surveys, individuals have to read a sentence and are graded on a 0-1-2 scale. Theway interviewers grade literacy could have changed but results remain the same if peoplewho are graded as 1 are classified as literate or illiterate. Also, differences in literacy ratesare not due to differences in response rates that are high (>99 percent) and identical betweenthe two surveys.
Estimated age effects for India are large but, as can be seen in figure 17, they are notoutliers. Actually, they are close to estimated age effects for Bangladesh that have beenestimated with seven surveys and also close to age effects for Nepalese women estimatedwith six surveys. Thus, it seems likely that there are indeed large age effects in India andthat our estimates of a large drop in school quality are genuine.
66

Figure 17: Age effects for women (red) and men (blue)
Bangladesh
Pakistan
Bangladesh
Pakistan
NepalNepal
Bangladesh
Nepal
Bangladesh
Pakistan
Nepal
IndiaIndia
Nepal
IndiaIndiaIndiaIndia
Bangladesh
PakistanPakistan
Nepal
IndiaIndiaIndia
Pakistan
Nepal
PakistanPakistan
NepalNepal
IndiaIndia
Nepal
Bangladesh
Nepal
India
NepalNepal
Bangladesh
IndiaIndia
Nepal
India
Nepal
BangladeshBangladesh
IndiaIndia
Pakistan
India
Pakistan
Nepal
BangladeshBangladeshBangladesh
NepalNepal
Pakistan
IndiaIndia
Pakistan
IndiaIndia
BangladeshBangladeshBangladeshBangladeshBangladesh
NepalNepal
India
Nepal
Pakistan
BangladeshBangladeshBangladeshBangladeshBangladesh
Pakistan
BangladeshBangladeshBangladeshBangladesh
PakistanPakistan
Bangladesh
India
Bangladesh
Nepal
India
PakistanPakistanPakistanPakistanPakistan
Nepal
Bangladesh
Pakistan
Bangladesh
Pakistan
NepalNepal
PakistanPakistan
Bangladesh
Pakistan
India
Pakistan
India
Pakistan
NepalNepal
PakistanPakistanPakistan
NepalNepal
Bangladesh
Nepal
Bangladesh
NepalNepal
India
NepalNepalNepal
Bangladesh
Pakistan
Nepal
India
Bangladesh
India
Nepal
PakistanPakistan
Bangladesh
Nepal
BangladeshBangladesh
NepalNepal
Bangladesh
Pakistan
IndiaIndiaIndia
Pakistan
Nepal
Bangladesh
Nepal
India
Nepal
Pakistan
Nepal
Bangladesh
Nepal
India
Nepal
India
Pakistan
Nepal
PakistanPakistan
India
Bangladesh
India
Nepal
Bangladesh
India
Pakistan
India
Bangladesh
India
Pakistan
IndiaIndiaIndia
PakistanNepal
Bangladesh
NepalPakistanNepal
BangladeshBangladeshBangladesh
NepalPakistanNepal
India
Bangladesh
NepalNepal
Bangladesh
India
Nepal
India
Pakistan
India
Nepal
BangladeshBangladesh
IndiaIndia
Bangladesh
IndiaIndia
PakistanNepal
India
Nepal
Bangladesh
Nepal
Bangladesh
PakistanNepal
IndiaIndia
NepalPakistan
IndiaIndiaIndia
Pakistan
India
Pakistan
India
Nepal
Bangladesh
India
Nepal
India
BangladeshBangladesh
India
BangladeshBangladeshBangladesh
India
PakistanNepalPakistan
India
Nepal
India
NepalPakistanNepalNepal
BangladeshBangladesh
NepalNepalPakistanNepalNepal
BangladeshBangladesh
Nepal
India
NepalNepal
India
Bangladesh
PakistanNepalPakistanPakistanPakistanNepalPakistanPakistanPakistan
India
Bangladesh
NepalPakistan
Bangladesh
PakistanPakistanNepalPakistan
IndiaIndia
NepalPakistanNepalNepalPakistan
Bangladesh
Pakistan
Bangladesh
Pakistan
Bangladesh
Nepal
Bangladesh
PakistanNepal
India
NepalNepalNepalNepalPakistan
Bangladesh
NepalPakistan
Bangladesh
Nepal
IndiaIndia
NepalPakistan
India
Bangladesh
India
-.5
-.25
0
.25
.5Li
tera
cy a
t gra
de 5
rela
tive
to a
ge 2
0
20 30 40 50
Age
67