SEO-Effekt: Working Paper - OSF
76
HOCHSCHULE FÜR ANGEWANDTE WISSENSCHAFTEN HAMBURG Hamburg University of Applied Sciences A representative online survey among German search engine users with a focus on questions regarding search engine optimization (SEO): a study within the SEO Effect project SEO-Effekt Working Paper 2 January 2021, Version 1.2 Sebastian Schultheiß searchstudies.org/seo-effekt
-
Upload
khangminh22 -
Category
Documents
-
view
5 -
download
0
Transcript of SEO-Effekt: Working Paper - OSF

HOCHSCHULE FÜR ANGEWANDTE
WISSENSCHAFTEN HAMBURG
Hamburg University of Applied Sciences
A representative online survey among German search
engine users with a focus on questions regarding search
engine optimization (SEO): a study within the SEO Effect
project
SEO-Effekt Working Paper 2
January 2021, Version 1.2
Sebastian Schultheiß
searchstudies.org/seo-effekt

Abstract 1
Abstract
This working paper describes the representative online survey within the research
project SEO-Effekt. To incorporate the perspective of search engine users, we conducted
a representative online survey with N=2,012 German internet users. The survey focused
on search engine optimization (SEO), but also included questions about paid search
marketing (PSM), usage behaviour, self-assessment, trust in search engines, and
personalization. We found that SEO is much less known to Internet users than PSM and
that the level of knowledge and the opinions about SEO are correlated with the user’s
education and their affinity to SEO topics. Furthermore, the users expressed a high self-
assessment of their search engine literacy, a slightly positive view on the trustworthiness
of search engines and a rather negative attitude towards personalization. Future
research is promising in (1) an annual repetition of the online survey and (2) in a
realization of the survey in other (European) countries.
Author: Sebastian Schultheiß
Institution: Hamburg University of Applied Sciences (HAW)
Faculty of Design, Media, Information
Department of Information
Finkenau 35
22081 Hamburg
E-Mail: [email protected]
https://searchstudies.org/seo-effekt/

Table of Contents 2
Table of Contents
Abstract _________________________________________________________ 1
Table of Contents __________________________________________________ 2
Figures __________________________________________________________ 4
Tables ___________________________________________________________ 5
1 Introduction ___________________________________________________ 6
2 Literature review _______________________________________________ 8
2.1 Perception and selection of search results ___________________________ 8
2.2 Trust in search engines ___________________________________________ 9
2.3 Information literacy of search engine users _________________________ 10
3 Research questions and hypotheses _______________________________ 12
4 Methods _____________________________________________________ 14
4.1 Sampling _____________________________________________________ 14
4.2 Questionnaire development _____________________________________ 15
4.2.1 Questionnaire in total ________________________________________________ 15
4.2.2 Questionnaire elements ______________________________________________ 23
4.2.2.1 Information part “SEO” and “PSM” __________________________________ 23
4.2.2.2 Marking tasks ___________________________________________________ 23
4.2.2.3 Flow chart ______________________________________________________ 25
4.2.2.4 Survey introduction and closing ____________________________________ 27
4.3 Pre-test ______________________________________________________ 27
4.4 Quality criteria ________________________________________________ 27
4.5 Research data _________________________________________________ 28
5 Analysis _____________________________________________________ 29
5.1 Coding and grouping ___________________________________________ 29
5.2 Success rates for marking tasks ___________________________________ 30
6 Results ______________________________________________________ 32
6.1 Participant characteristics _______________________________________ 32
6.2 Usage behaviour _______________________________________________ 34

Table of Contents 3
6.3 Self-assessment _______________________________________________ 39
6.4 Trust in search engines __________________________________________ 39
6.5 Personalization ________________________________________________ 41
6.6 Distinguishing between ads and organic results ______________________ 42
6.6.1 Mean success rates __________________________________________________ 43
6.6.2 Identification of text ads and shopping ads _______________________________ 44
6.6.3 Correlation between success rate and self-assessment ______________________ 45
6.7 Search result influences _________________________________________ 45
6.8 PSM _________________________________________________________ 46
6.9 SEO _________________________________________________________ 49
6.9.1 Knowledge _________________________________________________________ 49
6.9.2 Assessments ________________________________________________________ 52
6.9.3 Opinions ___________________________________________________________ 53
7 Discussion ___________________________________________________ 57
8 Conclusion ___________________________________________________ 62
9 Acknowledgements ____________________________________________ 63
10 References _________________________________________________ 64
Appendix 1: Questionnaire (German) __________________________________ A

Figures 4
Figures
Figure 1: Interplay of the study components __________________________________________________________7
Figure 2: Flow chart of the survey _________________________________________________________________ 26
Figure 3: Question no. 1.1: age ___________________________________________________________________ 32
Figure 4: Question no. 1.3: state __________________________________________________________________ 32
Figure 5: Question no. 11.3: main activity __________________________________________________________ 33
Figure 6: Question no. 11.4: topics (job) ____________________________________________________________ 33
Figure 7: Question no. 11.5: topics (training/studies) _________________________________________________ 33
Figure 8: Question no. 11.6: educational level _______________________________________________________ 34
Figure 9: Question no. 2.1: Internet usage __________________________________________________________ 34
Figure 10: Question no. 2.2: search engine usage ____________________________________________________ 35
Figure 11: Question no. 2.3: most often used search engines ___________________________________________ 35
Figure 12: Ecosia as most used search engine by age group ____________________________________________ 36
Figure 13: Question no. 2.4: Distribution of use Intensity by device ______________________________________ 37
Figure 14: Question no. 2.5: Reasons for search engine use ____________________________________________ 37
Figure 15: Question no. 2.6: queries per week _______________________________________________________ 38
Figure 16: Question no. 11.1: search by text input or by voice __________________________________________ 38
Figure 17: Question no. 11.2: Internet usage (hours per week) _________________________________________ 38
Figure 18: Question no. 3.1: self-assessment of search skills ___________________________________________ 39
Figure 19: Question no. 3.2: self-assessment of search success _________________________________________ 39
Figure 20: Questions no. 4.1 and 4.2: Trust in search engines and Google: fair and unbiased sources ___________ 40
Figure 21: Questions no. 4.1 and 4.2: Trust in search engines and Google: correct and trustworthy information __ 40
Figure 22: Questions no. 4b.1 and 4b.2: Trust in search engines and Google: match between query and results __ 41
Figure 23: Question no. 10.1: opinions on personalization _____________________________________________ 41
Figure 24: Question no. 10.2: measures to limit personalization ________________________________________ 42
Figure 25: Questions no. 8.1-8.4: Success rates (large screen) __________________________________________ 43
Figure 26: Questions no. 8.1-8.4: Success rates (small screen) __________________________________________ 44
Figure 27: Questions no. 8.1-8.4: Success rates for text ads and shopping ads _____________________________ 45
Figure 28: Question no. 5.1: Assumptions on search result influences ____________________________________ 46
Figure 29: Question no. 6.1: Google’s main revenue source ____________________________________________ 47
Figure 30: Question no. 6.2: payment option for placement (group differences) ___________________________ 48
Figure 31: Questions no. 6.2 to 6.4: Distinguishability of ads and organic results ___________________________ 49
Figure 32: Question no. 7.1: possibility for better placement without payment (group differences) ____________ 50
Figure 33: Question no. 7.2: familiarity with the term “SEO” ___________________________________________ 51
Figure 34: Question no. 7.3: familiarity with SEO techniques ___________________________________________ 52
Figure 35: Question no. 9.1: strength of SEO influence ________________________________________________ 53
Figure 36: Question no. 9.1: (very) strong SEO influence (group differences) ______________________________ 53
Figure 37: Question no. 9.2: positive and negative effect sizes of SEO ____________________________________ 54
Figure 38: Question no. 9.2: (very) large positive and negative effects of SEO (group differences) _____________ 54
Figure 39: (very) large positive and negative effects of SEO (multiple responses) ___________________________ 55
Figure 40: Question no. 9.3: positive effects of SEO___________________________________________________ 55
Figure 41: Question no. 9.4: negative effects of SEO __________________________________________________ 56

Tables 5
Tables
Table 1: Questionnaire _________________________________________________________________ 16
Table 2: Information part “SEO” and “PSM” ________________________________________________ 23
Table 3: Marking tasks: queries and elements of SERPs _______________________________________ 24
Table 4: Coding of open questions _______________________________________________________ 29
Table 5: Affinity to SEO topics (grouping) __________________________________________________ 30
Table 6: Marking tasks: results to be marked _______________________________________________ 31
Table 7: Multiple use of devices for search engine usage _____________________________________ 36
Table 8: Opinion on personalization by personalization measures ______________________________ 42

1 Introduction 6
1 Introduction
Within the research project SEO-Effekt1 we aim to describe the external influence
on the search engine results through SEO from the perspective of the participating
stakeholder groups. According to Röhle (2010, p. 80), these are search engine providers,
users, content providers, and search engine optimizers.
Search Engine Optimization (SEO) is “the practice of optimizing web pages in a way
that improves their ranking in the organic search results” (Kai Li et al., 2014, p. 3110).
SEO is therefore a kind of reverse engineering of the search engine’s ranking algorithms
with the aim of exploiting knowledge about ranking functions for the benefit of one’s
own information objects. SEO is part of Search Engine Marketing (SEM). Besides SEO,
SEM also includes Paid Search Marketing (PSM), which refers to keyword-related
advertisements (Kai Li et al., 2014). SEO has become a standard method of online
marketing (Griesbaum, 2013). For the year 2020, a total turnover of 80 billion dollars is
predicted for search engine optimization in the US alone (McCue, 2018).
Thus, besides the search engines and content providers, SEO is a highly
professionalised stakeholder group which is opposed by search engine users, whose
information literacy can be regarded as quite low (see Lewandowski, 2016b; Stark,
Magin, & Jürgens, 2014). Moreover, users usually trust the search engines’ results
without further checking or questioning them (Purcell et al., 2012; Tremel, 2010) and
have little and often incorrect knowledge of the business models of search engines
(Lewandowski et al., 2018).
The knowledge, assessments and opinions that search engine users have
regarding SEO have not yet been investigated. The present study aims to close this
research gap. For this purpose, we conducted a representative online survey with
N=2,012 German internet users. The main objective of the online survey is to understand
the users’ perspectives regarding the influence of search engine optimization (SEO) on
search results. For this purpose, the users’ knowledge of SEO, their assessments of the
influence of SEO and their opinions of this influence are collected. We also ask questions
that go beyond SEO and include search engine use, self-assessments regarding search
skills, understanding of PSM, trust in search engines, personalization, as well as
demographics.
1 https://searchstudies.org/seo-effekt/

1 Introduction 7
Figure 1 shows the representative online survey within the overall context of the
project.
Figure 1: Interplay of the study components
The rest of the working paper is structured as follows. First, we present literature
on perception and selection of search results, on users’ trust in search engines, and on
the self-assessed and measured information literacy of search engine users. Then, we
describe the research questions and hypotheses, followed by a description of the
methodology of the online survey. After that, we provide the results in nine sections:
participant characteristics, usage behaviour, self-assessment, trust in search engines,
personalization, distinguishing between ads and organic results, search result
influences, PSM, and SEO. Finally, we discuss the results, provide ideas for further
research, and give a summary.

2 Literature review 8
2 Literature review
2.1 Perception and selection of search results
Search engines are used by the majority of the German population (76%) at least
once a week. This puts them in second place, close behind messenger services (80%)
and ahead of reading or writing e-mails (65%) (Beisch & Schäfer, 2020). The search
engine market is dominated by Google, which holds a market share of 88% in the United
States (StatCounter, 2020c), 93% in Europe (StatCounter, 2020a), and 92% in Germany
(StatCounter, 2020b) across all platforms, as of November 2020. The major effect that
search engine optimization can have, in addition to the almost exclusive use of Google
and the associated aggregation of user clicks on this search engine, results from the
selection behaviour on the SERPs, which can be described by the following
characteristics:
1. Position effect: Users preferentially view the first results; an overwhelming part
of the clicks occurs on these results. The effect has been proven by numerous
studies (including Bar-Ilan, Keenoy, Levene, & Yaari, 2009; Craswell, Zoeter,
Taylor, & Ramsey, 2008; Joachims, Granka, Pan, Hembrooke, & Gay, 2005;
Keane, O’Brien, & Smyth, 2008; Yue, Patel, & Roehrig, 2010). In addition, a study
by Yahoo Research (Goel et al., 2010) is particularly interesting, for which 2.6
billion search queries were evaluated. It showed that about 80 percent of all
clicked results in the web search are attributed to only 10,000 websites (p. 203).
This underlines not only the importance of the results position, but also the
rather limited number of sources at these positions (under the plausible
assumption that these results hold true for other search engines as well).
2. Focus on the visible area: Users prefer to focus on the immediately visible area
of the SERP, i.e. the area that is visible without scrolling (Höchstötter &
Lewandowski, 2009). Results are preferably selected from this area (Kelly &
Azzopardi, 2015). The size of the visible area depends on the device used, the
screen resolution, and the window size.
3. Layout of search results: Results that occupy more space on the SERP are
perceived with a higher probability and thus selected with a higher likelihood.
Graphically more attractive results are viewed more frequently and therefore
clicked more often (attraction bias; Liu et al., 2015).

2 Literature review 9
2.2 Trust in search engines
Users have a high level of trust in search engines and Google in particular. This has
been proven by studies on user behaviour and by online surveys.
Studies on user behaviour show that users choose top results even if they were
less relevant (Pan et al., 2007; Schultheiß et al., 2018) or less reliable (Tremel, 2010) due
to experimental manipulation. Unkel & Haas (2017) confirmed these findings. They
manipulated the credibility cues reputation, neutrality, and social recommendations of
the results and showed that only the reputation had an influence on the selection
behaviour. However, this influence was again surpassed by the effect of the results
position. Thus, search engine users follow Google’s results ranking more than their own
assessments or other influencing factors.
In addition to the findings from studies on user behaviour, users also explicitly
stated in surveys that they trust information found through search engines. In a
representative survey in the United States, three quarters of respondents said they
trusted the information they found on search engines. 28% do so for all or almost all,
45% for most information (Purcell et al., 2012). These rates are higher than in an earlier
non-representative survey by Klein et al. (2009). About 40% of their respondents
assessed the information found by search engines as mostly reliable. However, only
about 5% considered them to be “always reliable”. With these values, the search engines
ranked between the libraries and databases, which were considered reliable, and the
communities, forums, blogs and podcasts, which were considered unreliable. In a survey
with n=386 college students, Taylor & Dalal (2017) found evidence of gender differences
in the assessment of trustworthiness. The survey results indicate that men were more
likely than women in trusting the search engine to provide objective results.
A study with representative samples from European, American, and Asia-Pacific
countries as well as South Africa examined the trust in information found in search
engines in the context of news. 33% of the participants stated that they mostly trust
news they find through search engines. The rate for news found through social media is
23%. It should be noted, however, that only 42% of all respondents said they trust news
in general and that there are strong differences between the surveyed countries (trust
in news: Finland 59%, France 24%) (Newman, Fletcher, Kalogeropoulos, & Nielsen, 2019,
p. 20).
Furthermore, an online survey by Westerwick (2013) revealed that a high results
ranking increases sponsor credibility, which in turn affects the credibility of the message.

2 Literature review 10
Thus, the users’ trust in search engines influences how they perceive the credibility of
the displayed search results.
2.3 Information literacy of search engine users
A representative survey of Internet users in the United States has shown that
search engine users stated they usually find what they are looking for and thus consider
their own research skills to be good (Purcell et al., 2012, p. 3). A further representative
study within the EU came to similar results. In this survey, 92% of European internet and
online platform users said they usually find what they are looking for. 6% of respondents
indicated that they did not, and 2% answered with “don’t know”2. In addition, 69% of
users said that it is clear which search results are sponsored, while 24% said it’s not and
7% said “don’t know”3 (European Commission, 2016). In practice, however, a different
picture emerges, as numerous user studies show.
In a representative survey carried out in 2003, Schweiger found that users had
very little knowledge of search engines. The fact that search engines finance themselves
through advertising was only known to a very small number of respondents. In the
survey already mentioned in section Trust in search engines, Taylor & Dalal (2017) found
not only gender differences regarding users trust in search engines, but also regarding
their information literacy. The female subjects seemed to be more demanding in the
evaluation of search results. More often than the male participants, they stated that
they would consider a number of important evaluation criteria, such as the topicality,
comprehensibility, and verifiability of the results. However, it is questionable whether
the behaviour expressed in the survey would also correspond to the actual search
behaviour. The subjects of the study by Stark et al. (2014) had problems formulating
precise queries and insufficient knowledge of the ranking criteria of search engines. A
study by Singer, Norbisrath, & Lewandowski (2012) showed that search engine users had
difficulties especially when solving complex search tasks. The subjects estimated their
success rates in solving these tasks to be much higher than they actually were.
This contradiction between self-assessed and actual information literacy was also
noted by Lewandowski et al. (2018). The survey asked what knowledge users had of
Google’s business model and thus its advertisements and how users would assess their
2 The values for Germany only are identical (92% agree, 6% disagree, 2% “don’t know”). 3 Germany: 68% agree, 24% disagree, 8% “don’t know”.

2 Literature review 11
own research skills. It was shown that search engine users often have little or no
knowledge of how search engines generate their revenues. They mostly did not know
that Google finances itself largely through advertising and could not distinguish the ads
from organic results. At the same time, however, most users reported that they had
good or even very good research skills. The results show the need to support users in
training their information literacy regarding search engines.
A representative survey of Kozyreva et al. (2020) yielded findings on the
knowledge of the German population regarding the use of AI application by search
engines. The authors define AI technologies as self-learning computer programs that
analyse people’s personal data in order to customize their online experience (e.g.,
personalized search). 59% were aware that search engines employ AI applications, and
63% found the personalized search to be somewhat or very acceptable.
In addition, the study revealed two discrepancies in terms of personalization and
privacy. On the one hand, most subjects found personalized services more acceptable
than the use of personal information and data that is required to provide such
personalization. On the other hand, 82% said they were either very or somewhat
concerned about their privacy on the Internet. However, less than half of users have
engaged with Google’s privacy settings (39%) and even fever have used search engines
that protect the users’ privacy (16%) within the last year. The authors refer to the
difference between the acceptance of personalized online services and the acceptance
of the collection and use of data and information as “acceptability gap” (Kozyreva,
Lorenz-spreen, et al., 2020).

3 Research questions and hypotheses 12
3 Research questions and hypotheses
The research questions arose partly from the project objectives and partly from
previous research:
➢ Research questions regarding SEO:
The research questions regarding SEO (RQ7-RQ10) were derived from the
objectives of the project. The hypotheses on these research questions (H1-H5)
are based on the results of the expert interviews conducted in the context of the
SEO Effect project (Schultheiß & Lewandowski, 2020b).
➢ Further research questions:
The other research questions (RQ1-RQ6) were derived from earlier studies. Their
survey questions were considered relevant and were therefore included in our
survey (see section 4.2.1 for the questionnaire and the references of its
questions).
• RQ1: How do German Internet users use search engines?
• RQ2: How do German Internet users rate their abilities to use search engines?
• RQ3: How much do German Internet users trust search engines and the
information they find through them?
• RQ4: How do German Internet users think and act with regard to search engine
personalization methods?
• RQ5: Are German Internet users able to distinguish between organic results and
ads on Google’s search engine results pages?
• RQ6: What knowledge do German Internet users have of Paid Search Marketing
(PSM)?
• RQ7: What knowledge do German Internet users have of search engine
optimization (SEO)?
o H1: German search engine users have little knowledge that SEO can have
an influence on search results.
o H2: German search engine users who are confronted with SEO related
topics (e.g., digitalization, Internet) in their job, training, or studies, have

3 Research questions and hypotheses 13
a higher level of knowledge of SEO than users to whom this does not
apply.
o H3: German search engine users with a high level of education have a
higher level of knowledge of SEO than users with lower levels of
education.
• RQ8: How do German Internet users assess the impact of SEO on search results?
o H4: German search engine users are highly divided about the impact that
SEO can have on search results (very strong influence vs. no influence).
• RQ9: What opinions do German Internet users have about the influence that SEO
can have on search results?
o H5: German search engine users who are confronted with SEO related
topics (e.g., digitalization, Internet) in their job, training, or studies, have
a more positive opinion about SEO influencing search results than users
to whom this does not apply.
• RQ10: Which sociodemographic factors influence the perspectives (knowledge,
assessments, opinions) of German Internet users regarding search engine
optimization?

4 Methods 14
4 Methods
We conducted a representative online survey with N=2,012 German internet
users. The survey was carried out together with the market research company Fittkau &
Maaß Consulting4 (hereinafter abbreviated by F&M) between March and April 2020.
F&M performed the following services, all in consultation with the project team:
• programming of the survey (January-February 2020)
• conducting of the survey (March-April 2020)
• data analysis and reporting (April 2020)
The subjects were recruited by the online panel provider respondi5, which is in
cooperation with F&M. An online panel is a sample database with a large number of
people (often one million or more). These people have agreed to be available as
potential respondents in surveys, as long as they meet the selection criteria for the
particular study (Callegaro et al., 2014, p. 2-3). In the next section, the sample is
discussed in detail.
4.1 Sampling
We intended a sample size of N=2,000 subjects and achieved a sample size of
N=2,012 subjects. We used a sample that is representative of the German online
population, as according to the criteria applied by “Arbeitsgemeinschaft
Onlineforschung” (working group online research; AGOF)6. For sampling, the
characteristics age, gender, and state were used. The population includes German
Internet users from the age of 16 to 69 years.
From the total sample of N=2,012 subjects, two sub-samples of N=999 subjects
(large screen) and N=1,013 subjects (small screen) were formed, which meet the same
requirements regarding representativeness described above. Sample 1 attended the
survey with a large screen (e.g., desktop PC, laptop, tablet; group “large screen”), sample
2 with a small screen (smartphones; group “small screen”).
To assign the subjects to one of the two groups, the panel provider checked the
user agent string to determine which device and browser the potential subject was using
4 https://www.fittkaumaass.de/ 5 https://www.respondi.com/EN/ 6 https://www.agof.de/en/

4 Methods 15
and assigned the participants accordingly. The correct assignment of the test persons
was subsequently checked by F&M. The subjects were invited to the survey by e-mail.
Each participant received 0.75 Euro for a complete participation.
4.2 Questionnaire development
First, we developed a catalogue of questions. We derived questions for the survey
from the research questions related to SEO and from findings of the expert interviews
(see section Research questions and hypotheses). In addition, we have adopted
questions from studies described in section Information literacy of search engine users.
We did not consider all questions from the studies mentioned above. Questions
remained unconsidered for three reasons: Topicality of the question, measurability, and
focus of the survey as a whole. In terms of topicality, some questions no longer seemed
up to date. These included questions about the location of Internet access and whether
search engines are used at all (Schweiger, 2003). Questions on user behaviour, for
example on the consideration of certain SERP elements (Schweiger, 2003) or the
interaction with the results lists (Stark et al., 2014) were excluded from the survey. In
this case, instead of asking questions about the behaviour, its actual investigation in a
laboratory appears to be more effective. Such a laboratory study will be conducted later
in the project. Furthermore, no questions were asked that would make the online survey
too long and thus unfocussed, for example on the filtering of problematic content by
search engines (Schweiger, 2003) and on targeted advertising (Purcell et al., 2012).
After preparing the questions, we sent them to the market research company
(F&M). F&M made recommendations regarding the sequence and formulation of the
questions. They also made suggestions for new questions, which we included. In several
feedback rounds, we jointly created the final version of the questionnaire, which is
shown in Table 1 in the next section.
4.2.1 Questionnaire in total
The subjects completed 12 sections within the survey: Screening, usage behaviour,
self-assessment, trust, query match, knowledge on search result influences, knowledge
on ads, knowledge on SEO, ability to distinguish ads from organic results, assessments
and opinions regarding SEO, personalization, and user profile.
4 Methods 16
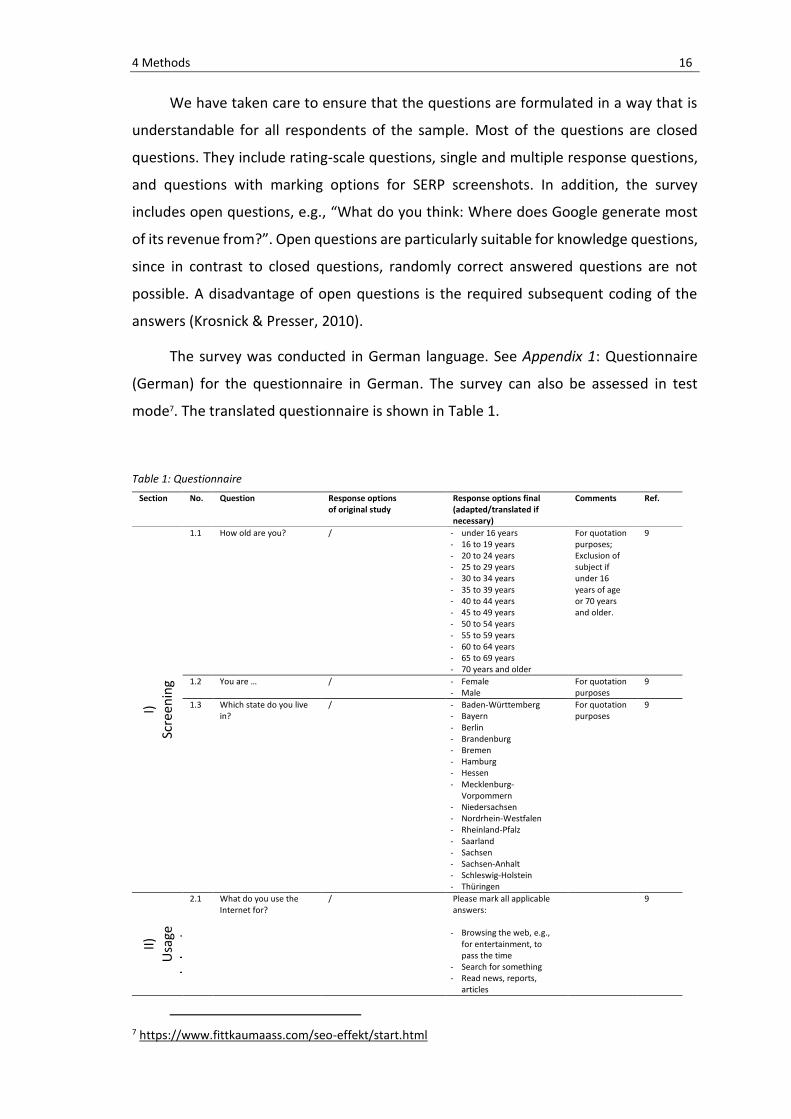
We have taken care to ensure that the questions are formulated in a way that is
understandable for all respondents of the sample. Most of the questions are closed
questions. They include rating-scale questions, single and multiple response questions,
and questions with marking options for SERP screenshots. In addition, the survey
includes open questions, e.g., “What do you think: Where does Google generate most
of its revenue from?”. Open questions are particularly suitable for knowledge questions,
since in contrast to closed questions, randomly correct answered questions are not
possible. A disadvantage of open questions is the required subsequent coding of the
answers (Krosnick & Presser, 2010).
The survey was conducted in German language. See Appendix 1: Questionnaire
(German) for the questionnaire in German. The survey can also be assessed in test
mode7. The translated questionnaire is shown in Table 1.
Table 1: Questionnaire
Section No. Question Response options of original study
Response options final (adapted/translated if necessary)
Comments Ref.
I)
Scre
enin
g
1.1 How old are you? / - under 16 years - 16 to 19 years - 20 to 24 years - 25 to 29 years - 30 to 34 years - 35 to 39 years - 40 to 44 years - 45 to 49 years - 50 to 54 years - 55 to 59 years - 60 to 64 years - 65 to 69 years - 70 years and older
For quotation purposes; Exclusion of subject if under 16 years of age or 70 years and older.
9
1.2 You are … / - Female - Male
For quotation purposes
9
1.3 Which state do you live in?
/ - Baden-Württemberg - Bayern - Berlin - Brandenburg - Bremen - Hamburg - Hessen - Mecklenburg-
Vorpommern - Niedersachsen - Nordrhein-Westfalen - Rheinland-Pfalz - Saarland - Sachsen - Sachsen-Anhalt - Schleswig-Holstein - Thüringen
For quotation purposes
9
II)
Usa
ge
beh
avio
ur
2.1 What do you use the Internet for?
/ Please mark all applicable answers:
- Browsing the web, e.g., for entertainment, to pass the time
- Search for something - Read news, reports,
articles
9
7 https://www.fittkaumaass.com/seo-effekt/start.html

4 Methods 17
Section No. Question Response options of original study
Response options final (adapted/translated if necessary)
Comments Ref.
- Use social networks, communities, e.g., Instagram, Facebook
- Communicate via e-mail, messenger
- Online shopping/ordering/ booking
- Online banking/broking - Watch movies, videos - Listen to and download
music - Gaming - Other
2.2 If you are searching for something online: Which search engine(s) do you usually use?
Please mark all applicable answers: - Bing - Ecosia - DuckDuckGo - Google - Web.de - Yahoo! - Others, namely… (free
input) - None
Exclusion of respondent if no search engines are used
8, adjustments by: 9
2.3 Which search engine do you use most often?
- Google - Yahoo Search - Bing - AOL - Ask - Lycos - MyWebSearch - Dogpile - WebCrawler - Other (SPECIFY) - None/Don’t use any
regularly - Don’t know - Refused
- Bing - Ecosia - DuckDuckGo - Google - Web.de - Yahoo! - Another - I don’t know/not
specified
Only used search engines (according to previous question) are displayed. Question omitted if only one search engine is used.
6, adjustments by: 9
2.4 Which devices do you use search engines with?
Multiple Choice: - Desktop PC/Laptop - Smartphone - Tablet
Please mark the appropriate answer in each case:
- via desktop computer, PC - via laptop - via tablet - via smartphone - via smart speaker (e.g.,
Amazon Echo, Alexa, Google Home)
- frequently - occasionally - rarely - never - I don‘t know
8, adjustments by: 9
2.5 Why is [search engine] the search engine you use most often? Please mark up to 5 answers.
I use [search engine] most because … - it is easy to use - it is fast - the results list is clearly
arranged - it seems objective to me - the most important results
are always at the top of the results list
- I always find what I’m looking for
- I’ve always used it - I think it covers most of the
Internet - it provides helpful
information on the individual results
- it does not show any dubious results
- I know exactly how it works - it sometimes shows
surprising results
I use [search engine] most because … - the results list is clearly
arranged - I like the layout and colors
of the search engine result page
- it is easy to use - it is fast - it seems objective to me - I always find what I’m
looking for - I know exactly how it
works - I think it covers most of the
Internet - the most important results
are always at the top of the results list
- it provides helpful information on the individual results
The name of the most frequently used search engine is shown
5, adjustments by: 9

4 Methods 18
Section No. Question Response options of original study
Response options final (adapted/translated if necessary)
Comments Ref.
- it offers the possibility to fade out dubious results
- my friends and colleagues also use it
- I like the layout and colors of the search engine page
- Scale from 1= not
applicable to 4= fully applicable
- it sometimes shows surprising results
- it does not show dubious hits or these can be hidden
- I’ve always used it - my friends and colleagues
also use it - I do not know any other
search engines - it is the default setting in
the browser - no particular reason - Other reason, namely...
(free input)
2.6 Can you estimate how many queries you submit to search engines in a regular week?
- several times a day - about once a day - 3 to 5 days a week - 1 to 2 days a week - once every few weeks - less often - never - don’t know - refused
- more than 100 per week - over 50 to 100 per week - over 20 to 50 per week - over 10 to 20 per week - 6 to 10 per week - 1 to 5 per week - less than 1 per week - I don’t know
6, adjustments by: 9
III)
Self
-ass
essm
ent
3.1 When it comes to finding something on the Internet using search engines: How do you assess your own abilities in this respect?
- German school grades (1-6) My skills in search engine usage are...
- perfect - excellent - good - fair - bad - I don’t know
Check for correlation between self-assessment and actual knowledge
3, adjustments by: 9
3.2 And how often do you think you find what you are looking for using search engines?
- always - most of the time - only some of the time - hardly ever - don’t know - refused
I find what I’m looking for...
- always - most of the time - sometimes - rarely - never - I don’t know
6, adjustments by: 9
IV)
Tru
st
4.1 If you think of search engines in general: To what extent do you think the following statements apply to search engines?
a) “In general, do you think Internet search engines are a fair and unbiased source of information, or do you think search engines are NOT a fair and unbiased source?”: - Yes, they are a fair and unbiased source of information - No, they are NOT a fair and unbiased source of information - Depends - Don’t know - Refused b) “In general, how much of the information you find using search engines do you think is accurate or trustworthy? Would you say...”: - All or almost all - Most - Some - Very little - None at all - Don’t know - Refused
Please mark the appropriate answer in each case:
- Search engines are fair and unbiased sources of information
- The information I find through search engines is correct and trustworthy
- absolutely correct - correct - neutral - rather not true - doesn’t apply at all - I don’t know
6, major adjustments regarding the question structure and responses by: 9
4.2 And if you think especially of Google: To what extent do you think the following statements apply to Google?
a) “In general, do you think Internet search engines are a fair and unbiased source of information, or do you think search engines are NOT a fair and unbiased source?”: - Yes, they are a fair and unbiased source of information
Please mark the appropriate answer in each case:
- Google is a fair and unbiased source of information
- The information I find through Google is correct and trustworthy
6, major adjustments regarding the question structur

4 Methods 19
Section No. Question Response options of original study
Response options final (adapted/translated if necessary)
Comments Ref.
- No, they are NOT a fair and unbiased source of information - Depends - Don’t know - Refused b) “In general, how much of the information you find using search engines do you think is accurate or trustworthy? Would you say...”: - All or almost all - Most - Some - Very little - None at all - Don’t know - Refused
- absolutely correct - correct - neutral - rather not true - doesn‘t apply at all - I don’t know
e and responses by: 9
IVb
) Q
uer
y m
atch
4b.1
If you think of search engines in general: To what extent do you think the following statement applies to search engines?
- The results displayed in search engines match my queries perfectly
- absolutely correct - correct - neutral - rather not true - doesn‘t apply at all - I don’t know
Questions 4b1 and 4b2 follow on from the previous questions on trust and were added to the questionnaire in consultation with F&M.
9
4b.2
To what extent do you think the following statement applies to Google?
- The results displayed in Google match my queries perfectly
- absolutely correct - correct - neutral - rather not true - doesn‘t apply at all - I don’t know
9
V)
Kn
ow
led
ge o
n
sear
ch r
esu
lt
infl
uen
ces
5.1 When it comes to the search results displayed on Google: What do you think influences the ranking of search results on Google?
- The Google search results and their ranking depend on... (free input)
- I don’t know
9
VI)
Kn
ow
led
ge o
n a
ds
6.1 What do you think: Where does Google generate most of its revenue from?
- Google generates revenue primarily through... (free input)
- I don’t know
3
6.2 Do website operators or companies have the opportunity to pay for their results to appear high up on Google’s search results page?
- Yes, this is possible - No, that possibility does
not exist - I don‘t know
3
6.3 Do such paid search results differ from the other search results?
- Yes, you can recognize them and distinguish them from the other search results
- No, they cannot be identified
- I don’t know
[If “Yes” on previous question]
3
6.4 And how do the paid search results on Google differ from the other results that have not been paid for?
- The paid search results on Google can be recognized by... (free input)
- I don‘t know
[If “Yes” on previous question]
3
VII
)
Kn
ow
led
ge
on
SEO
7.1 Do website operators or companies have the ability or influence to appear higher in the Google results list for certain queries without paying any money to Google?
- Yes, this is possible - No, that possibility does
not exist - I don‘t know
1

4 Methods 20
Section No. Question Response options of original study
Response options final (adapted/translated if necessary)
Comments Ref.
7.2 Do you know what term is used to describe these measures to improve the ranking in the Google search results list (without payment to Google)?
- Yes, this is called... (free input)
- I don‘t know
[If “Yes” on previous question]
1
7.3 And by what means can a website be designed or programmed so that it is ranked higher in the Google search results lists?
Please enter all possibilities/measures that you know: - With the help of the
following measures: ... (free input)
- I don’t know
[If “Yes” on question 7.1] Serves for further differentiation of SEO knowledge levels
1
Information part “SEO/PSM“ (see section 4.2.2.1) 10, adjustments by: 9
VII
I)
Ab
ility
to
dis
tin
guis
h a
ds
fro
m o
rgan
ic r
esu
lts
8.1 You will now see a Google results page. Are there any search results on this page that can be influenced by the website operator paying Google?
- No, there are no search results on this page that can be influenced by payments to Google
- Yes, the following search results can be influenced by paying money to Google: Please click on the corresponding search results
SERP screenshot from block I (A or B) to mark all ads
3
8.2 One more question about this search results page: Are there any search results on this page that can be influenced by search engine optimization?
- No, there are no search results on this site that can be influenced by search engine optimization
- Yes, the following search results can be influenced by search engine optimization: Please click on the corresponding search results
SERP screenshot from block I (A or B) to mark all organic results
1
8.3 You will now see another Google results page. Are there any search results on this page that can be influenced by the website operator paying Google?
- No, there are no search results on this page that can be influenced by payments to Google
- Yes, the following search results can be influenced by paying money to Google: Please click on the corresponding search results
SERP screenshot from block II (C or D) to mark all ads
3
8.4 One more question about this search results page: Are there any search results on this page that can be influenced by search engine optimization?
- No, there are no search results on this site that can be influenced by search engine optimization
- Yes, the following search results can be influenced by search engine optimization: Please click on the corresponding search results
SERP screenshot from block II (C or D) to mark all organic results
1
IX)
Ass
essm
ents
an
d
op
inio
ns
rega
rdin
g SE
O 9.1 Now please think again
about search engine optimization. In your opinion, how strong is the influence of search engine optimization on the ranking of the search results in Google?
Influence of search engine optimization on the order of search results in Google:
- very strong influence - major influence - medium influence - little influence - no influence - I don’t know
1

4 Methods 21
Section No. Question Response options of original study
Response options final (adapted/translated if necessary)
Comments Ref.
9.2 How big are the positive and negative effects of search engine optimization on the Google search results from your perspective?
Please mark the appropriate answer in each case: - I perceive the positive
effects of search engine optimization as ...
- I perceive the negative effects of search engine optimization as ...
- very large - large - medium - low - non-existent - I don’t know
1
9.3 Which positive effects does search engine optimization have in your opinion?
- I assess the following effects of search engine optimization as positive: ... (free input)
- I can‘t say
Question to Internet users who see high or very high positive SEO effects
9
9.4 Which negative effects does search engine optimization have in your opinion?
- I assess the following effects of search engine optimization as negative: ... (free input)
- I can‘t say
Question to Internet users who see high or very high negative SEO effects
9
X)
Per
son
aliz
atio
n
10.1
If a search engine records your search queries and uses this information to customize search results for you in the future: What do you think about that?
- It’s a bad thing if a search engine collected information about your searches and then used it to rank your future search results, A: because it may limit the information you get online and what search results you see B: because you feel it is an invasion of privacy - It’s a good thing if a search engine collected information about your searches and then used it to rank your future search results, A: because it gives you results that are more relevant to you B: even if it means they are gathering information about you - Neither of these - Don’t know - Refused
- I think that's a positive thing
- neutral - I think that's a negative
thing - I don’t know/not
specified
6, adjustments by: 9
10.2
And have you ever taken measures to limit the amount of data that search engines collect about you? If so, which ones?
- Changed your browser settings - Deleted your web history - Used the privacy settings of websites - Yes - No - Don’t know - Refused
Please mark all applicable answers:
- Deleted past activities (for example, search history)
- Disabled storage of future activities (e.g., search queries)
- Disabled determination of my location
- Deactivated delivery of personalized advertising
- Other measures - No, not yet - but I was
aware that it is possible - No - I was not aware
that this was possible
6, adjustments by: 9
XI)
Use
r p
rofi
le 11.
1 In what way do you use search engines?
Please mark the appropriate answer in each case:
- By typing in my search query
10

4 Methods 22
Section No. Question Response options of original study
Response options final (adapted/translated if necessary)
Comments Ref.
- By submitting my search query by voice
- frequently - occasionally - rarely - never - I don’t know
11.2
In a regular week, for how long do you use the Internet approximately?
Scale from 1-7 (days per week)
Please indicate the average number of hours per week:
- less than 3 hours per week
- 3 to under 6 hours per week
- 6 to under 10 hours per week
- 10 to under 20 hours per week
- 20 to under 30 hours per week
- 30 to under 40 hours per week
- 40 and more hours per week
- I don‘t know
4, adjustments by: 9
11.3
Which of the following activities do you mainly pursue?
- in training or studies - working - unemployed or no longer
employed
- employee or public official
- self-employed person, freelancer, entrepreneur
- student - trainee, apprentice - pupil - housewife/houseman - occasionally employed - not or no longer
employed - other
7, adjustments by: 9
11.4
Which of the following topics play a role in your professional activity?
Please mark all applicable answers:
- purchasing, procurement, logistics
- finance, controlling - marketing, sales,
distribution - IT - digitalization, Internet - e-commerce, online
trading - online marketing, social
media - production,
manufacturing - law - none of them
Question for employed Internet users. Examine whether people with “SEO-related” professions (e.g., e-commerce) have a different perspective on SEO.
2
11.5
Which of the following topics belong to your training/studies?
Please mark all applicable answers:
- business studies or economics
- Informatics, business informatics
- engineering, electrical engineering
- digitalization, Internet - e-commerce, online
trading - online marketing, social
media - law - pedagogy - social sciences - none of them
Question to Internet users who are still in training. Check whether people with “SEO-related” topics in training/studies (e.g., e-commerce) have a different perspective on SEO.
2
11.6
What is your highest educational level?
- None - Certificate of Secondary
Education
- Certificate of Secondary Education without completed apprenticeship
7,

4 Methods 23
Section No. Question Response options of original study
Response options final (adapted/translated if necessary)
Comments Ref.
- General Certificate of Secondary Education
- A-levels - University degree
- Certificate of Secondary Education with completed apprenticeship
- General Certificate of Secondary Education
- A-levels - University degree - None - (Still) without school-
leaving certificate (e.g., student)
- Other
adjustments by: 9
References of the questions: 1: Project proposal, 2: Expert interviews, 3: (Lewandowski, 2017), 4: (Stark et al., 2014), 5: (Schweiger, 2003), 6: (Purcell et al., 2012), 7: (Lewandowski & Sünkler, 2013), 8: (Schultheiß & Lewandowski, 2020a) 9: Market research company “Fittkau & Maaß”, 10: Project staff
4.2.2 Questionnaire elements
4.2.2.1 Information part “SEO” and “PSM”
Before question 8.1, we integrated a short explanation of SEO and PSM to ensure
that all respondents could understand the marking tasks following in the survey. Of
course, we did not mention the labelling of the ads at this point:
Table 2: Information part “SEO” and “PSM”
Information part (German) Information part (English)
Website-Betreiber haben verschiedene Möglichkeiten darauf hinzuwirken, dass ihre Webseiten bei bestimmten Google-Suchanfragen weiter oben auf der Seite erscheinen, und zwar:
- Bezahlung: Sie zahlen dafür Geld an Google - Suchmaschinenoptimierung: Sie gestalten/
programmieren ihre Webseiten entsprechend, z.B. durch die Verwendung bestimmter Begriffe, schnelle Ladezeiten, sinnvolle Bildbeschriftungen.
Wir zeigen Ihnen gleich zwei verschiedene Google-Ergebnisseiten und würden gern von Ihnen erfahren, ob bzw. welche der dort gezeigten Suchergebnisse durch Bezahlung an Google und/oder Suchmaschinenoptimierung beeinflussbar sind.
Website operators have several ways to ensure that their web pages appear at the top of the Google results page for a specific query, namely:
- Payment: They pay money to Google - Search engine optimization: They design their
websites accordingly, e.g., by using certain keywords, quick page speed, and appropriate image titles and descriptions.
Next, we will show you two different Google result pages and would like to ask you whether or which results can be influenced by payment to Google and/or search engine optimization.
4.2.2.2 Marking tasks
We created eight SERP screenshots for the marking tasks A-D (each task in variants
“large screen” and “small screen”). SERPs A and B were assigned to block I (simple),
SERPs C and D to block II (difficult). Two blocks were created to address a variety of SERP
elements and to differentiate between basic and complex SERPs. The structure of the
two SERPs per block is identical in terms of the elements on the SERP.

4 Methods 24
Each participant received two tasks, one from block I and one from block II, as
shown in Table 3. The SERP of each task was shown two times. First, all ads were to be
marked and second, all organic results.
Table 3: Marking tasks: queries and elements of SERPs
Block Task Query English (German)
Elements on SERP
block I (simple)
A tax return help (steuererklärung hilfe)
- Organic results (10*) - Text ads, top (2*) - Text ads, bottom (2*)
B legal advice (rechtsberatung)
- Organic results (10*) - Text ads, top (2*) - Text ads, bottom (2*)
block II (difficult)
C apple iphone - Organic results (6*) - Text ads, top (2*) - Shopping ads (large screen: 8*, small screen: 2*) - News (large screen: 3*, small screen: 2*) - Knowledge Graph
D samsung galaxy - Organic results (6*) - Text ads, top (2*) - Shopping ads (large screen: 8*, small screen: 2*) - News (large screen: 3*, small screen: 2*) - Knowledge Graph
The screenshots were created using the desktop version of the Chrome browser:
1. User Agent: A browser extension was used to simulate the smartphone
(group “small screen”) within the desktop browser (group “large screen”)
(Google.com, 2019):
a. Large screen: default
b. Small screen: Android
2. Window size and page zoom: To create screenshots with high resolution,
we used the following settings:
a. Large screen: Full screen with 400% browser zoom resulted in
screenshots with a width of 4436 pixels (px).
b. Small screen: A browser zoom of 300% resulted in screenshots
with a width of 984 px, where the horizontally displayed results
(e.g., shopping results) were not cut off / cut in half.
i. Both zoom settings (400%/300%) were also the highest
possible settings for the screenshot tool to capture the
entire SERPs.
3. Screenshot: An add-on was used to capture full-page SERP screenshots as
PNG files (gofullpage.com, 2020). For each query, the first three SERPs

4 Methods 25
were saved in order to be able to exchange results during later image
processing.
4. Image processing: We used GIMP version 2.10.14 (gimp.org, 2020) to
reduce the SERPs to the elements we wanted to investigate (see Table 3).
We also matched the small screen SERPs with the large screen SERPs in
terms of results and their positions. Otherwise, different selection
behaviour in the survey might not have been due to the SERP layout (large
vs. small screen), but to partially different results (positions):
a. Large screen:
i. The large screen SERPs were reduced to the elements
required in the survey, i.e. without “related searches”,
“people also ask”.
ii. Due to the specifications of F&M, the final large screen
SERPs were reduced to a width of 800 px.
b. Small screen:
i. The results of the small screen SERPs as well as their
positions were aligned with the large screen SERPs.
Consequently, the large and small screen SERPs for a query
only differed in terms of layout, but not in terms of results
and their positions.
ii. Due to the specifications of F&M, the final large screen
SERPs were reduced to a width of 360 px.
4.2.2.3 Flow chart
Figure 2 shows the flow chart of the online survey.

4 Methods 26
Figure 2: Flow chart of the survey

4 Methods 27
4.2.2.4 Survey introduction and closing
In the introduction to the survey, we first welcomed the respondent and thanked
him/her for participating. We also pointed out that the questionnaire is used exclusively
for research purposes and that by participating, the respondent agrees to the attached
privacy policy of F&M.
In order to give the subjects the opportunity to obtain background information on
the survey and to be able to contact the project team, e.g., for feedback purposes, we
provided a link to our website at the end of the survey.
4.3 Pre-test
Before the survey was conducted, pre-tests were carried out by the members and
student assistants of the research group and by the panel provider. This enabled us to
test whether problems arise, e.g., regarding comprehensibility, and to eliminate them
beforehand. In the pre-test, problems arose regarding the plausibility of the
questionnaire which could be fixed before launching the survey. The panel provider
checked the survey internally with colleagues to ensure that it was coherent and
comprehensible. Then the soft launch started, and the survey was sent to the first
subjects while their responses were carefully analysed. Since the soft launch was
successful, the survey could start as planned and the data of the soft launch subjects
could also be included in the analysis. The duration of the survey was also checked. The
maximum duration of 15 minutes as recommended by F&M was met in the pre-tests.
Further suggestions of the pre-test subjects were also made. These concerned some
minor aspects, such as the optical highlighting of relevant parts of a question (e.g., “Are
there any search results on this page that can be influenced by search engine
optimization?”). These recommendations were also implemented.
4.4 Quality criteria
In the following, we discuss the crucial quality criteria of quantitative research,
namely internal validity, external validity, and reliability.
According to Winter (2000, p. 9), internal validity describes whether the results
refer to the phenomena investigated and were not caused by other influences. In this
context, the SERPs of the marking tasks are to be mentioned. We have reduced the

4 Methods 28
SERPs to the decisive components and have exactly matched the two variants (large and
small screen). Thus, the SERPs only differed in terms of the different layouts, but not in
terms of other factors such as different result rankings. Differences in the results of the
marking tasks between screen sizes can thus be attributed to the differences in layout.
The external validity describes whether the results can be generalised and thus
applied to other populations (Winter, 2000, p. 9). Since we used a representative
sample, the results can be generalized to German Internet users between the ages of 16
to 69 years.
A study whose results are replicable can be considered reliable (Winter, 2000, p.
3). On the one hand, we ensure the replicability of the results by means of a detailed
method description. On the other hand, we make the research data available (see
section 4.5), which facilitates the transparency of the results and enables them to be
compared with future studies.
4.5 Research data
For making our research data available, we use the data repository osf.io. The data
of our project can be found by DOI 10.17605/OSF.IO/JYV9R8. The survey can also be
accessed in test mode9.
8 https://dx.doi.org/10.17605/OSF.IO/JYV9R 9 https://www.fittkaumaass.com/seo-effekt/start.html
5 Analysis 29
5 Analysis
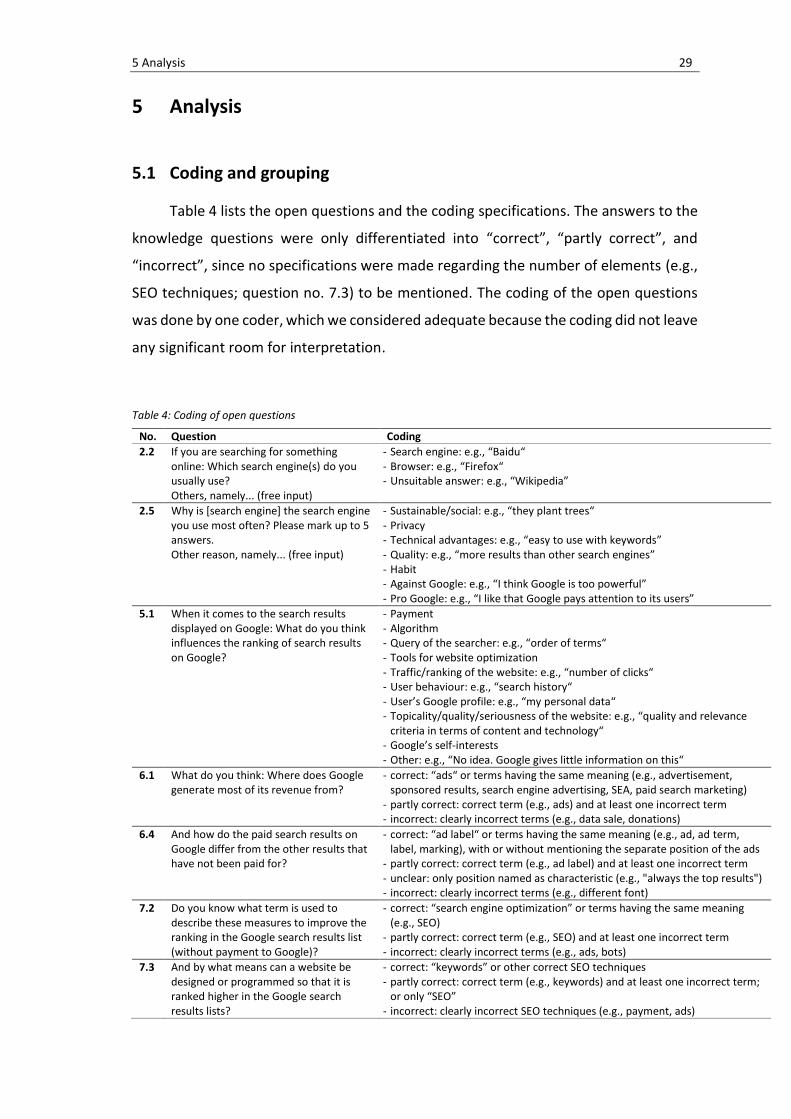
5.1 Coding and grouping
Table 4 lists the open questions and the coding specifications. The answers to the
knowledge questions were only differentiated into “correct”, “partly correct”, and
“incorrect”, since no specifications were made regarding the number of elements (e.g.,
SEO techniques; question no. 7.3) to be mentioned. The coding of the open questions
was done by one coder, which we considered adequate because the coding did not leave
any significant room for interpretation.
Table 4: Coding of open questions
No. Question Coding
2.2 If you are searching for something online: Which search engine(s) do you usually use? Others, namely... (free input)
- Search engine: e.g., “Baidu“ - Browser: e.g., “Firefox“ - Unsuitable answer: e.g., “Wikipedia”
2.5 Why is [search engine] the search engine you use most often? Please mark up to 5 answers. Other reason, namely... (free input)
- Sustainable/social: e.g., “they plant trees“ - Privacy - Technical advantages: e.g., “easy to use with keywords” - Quality: e.g., “more results than other search engines” - Habit - Against Google: e.g., “I think Google is too powerful” - Pro Google: e.g., “I like that Google pays attention to its users”
5.1 When it comes to the search results displayed on Google: What do you think influences the ranking of search results on Google?
- Payment - Algorithm - Query of the searcher: e.g., “order of terms“ - Tools for website optimization - Traffic/ranking of the website: e.g., “number of clicks“ - User behaviour: e.g., “search history“ - User’s Google profile: e.g., “my personal data“ - Topicality/quality/seriousness of the website: e.g., “quality and relevance
criteria in terms of content and technology“ - Google’s self-interests - Other: e.g., “No idea. Google gives little information on this“
6.1 What do you think: Where does Google generate most of its revenue from?
- correct: “ads“ or terms having the same meaning (e.g., advertisement, sponsored results, search engine advertising, SEA, paid search marketing)
- partly correct: correct term (e.g., ads) and at least one incorrect term - incorrect: clearly incorrect terms (e.g., data sale, donations)
6.4 And how do the paid search results on Google differ from the other results that have not been paid for?
- correct: “ad label“ or terms having the same meaning (e.g., ad, ad term, label, marking), with or without mentioning the separate position of the ads
- partly correct: correct term (e.g., ad label) and at least one incorrect term - unclear: only position named as characteristic (e.g., "always the top results") - incorrect: clearly incorrect terms (e.g., different font)
7.2 Do you know what term is used to describe these measures to improve the ranking in the Google search results list (without payment to Google)?
- correct: “search engine optimization” or terms having the same meaning (e.g., SEO)
- partly correct: correct term (e.g., SEO) and at least one incorrect term - incorrect: clearly incorrect terms (e.g., ads, bots)
7.3 And by what means can a website be designed or programmed so that it is ranked higher in the Google search results lists?
- correct: “keywords” or other correct SEO techniques - partly correct: correct term (e.g., keywords) and at least one incorrect term;
or only “SEO” - incorrect: clearly incorrect SEO techniques (e.g., payment, ads)

5 Analysis 30
9.3 Which positive effects does search engine optimization have in your opinion?
- Better/more relevant results: e.g., “best result on position 1” - Quicker retrieval: e.g., “you find what you’re looking for faster” - Advantages for the searcher such as individualization, filters: e.g., “the
search engine knows me” - Advantages for website operators: e.g., “optimized pages receive more
clicks” - Other: e.g., “correction of spelling mistakes”
9.4 Which negative effects does search engine optimization have in your opinion?
- Negative influence on results quality: e.g., “first result not always the best” - (Conscious) influence, manipulation of the results with negative background:
e.g., “no objective results” - Displacement of the actually searched, desired, suitable search results: e.g.,
“commerce and profit comes before truth” - Discrimination against smaller websites/providers: e.g., “distortion of
information in favor of solvent website providers” - Other: e.g., “you have to pay attention”
Table 5 shows how the topics from professional activity, training, and studies have
been grouped in terms of SEO affinity (low, average, high).
Table 5: Affinity to SEO topics (grouping)
Response options Affinity to SEO
Question no. 11.4: Which of the following topics play a role in your professional activity?
purchasing, procurement, logistics low
finance, controlling low
marketing, sales, distribution average
IT average
digitalization, Internet high
e-commerce, online trading high
online marketing, social media high
production, manufacturing low
law low
purchasing, procurement, logistics low
Question no. 11.5: Which of the following topics belong to your training/studies?
business studies or economics low
Informatics, business informatics average
engineering, electrical engineering low
digitalization, Internet high
e-commerce, online trading high
online marketing, social media high
law low
pedagogy low
social sciences low
business studies or economics low
5.2 Success rates for marking tasks
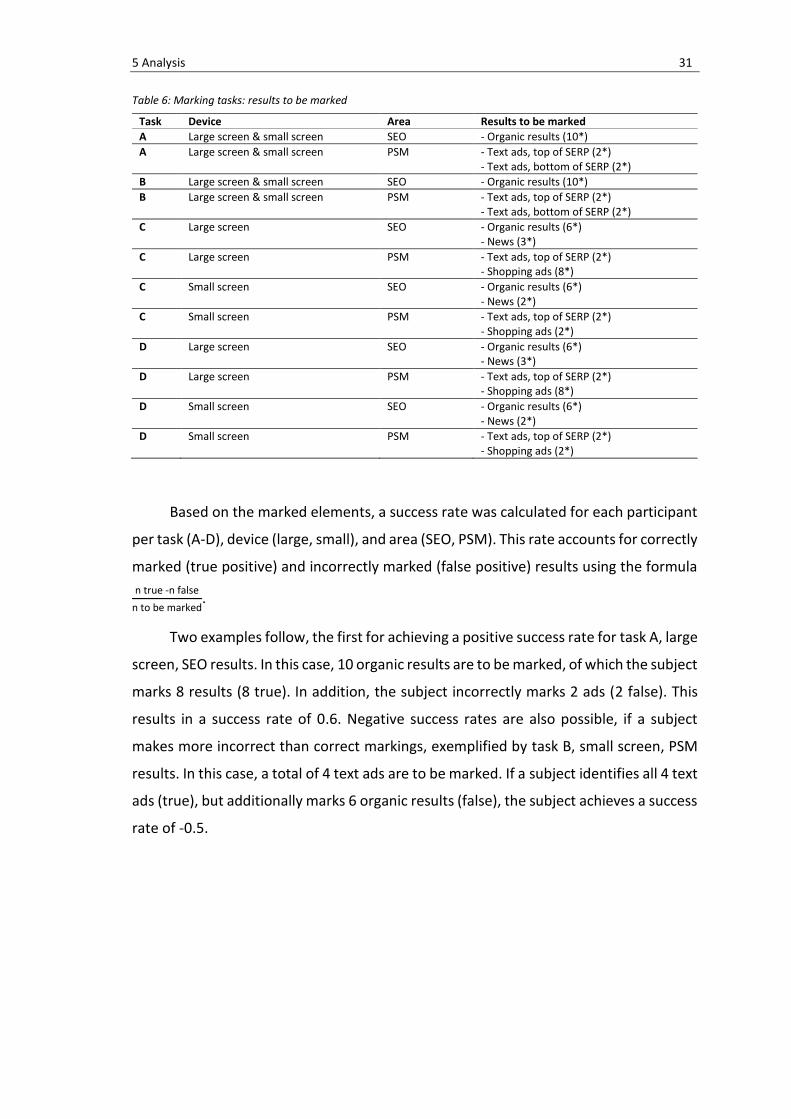
Table 6 shows the search results to be marked on the SERPs according to the task,
device, and area (SEO or PSM).
5 Analysis 31
Table 6: Marking tasks: results to be marked
Task Device Area Results to be marked
A Large screen & small screen SEO - Organic results (10*)
A Large screen & small screen PSM - Text ads, top of SERP (2*) - Text ads, bottom of SERP (2*)
B Large screen & small screen SEO - Organic results (10*)
B Large screen & small screen PSM - Text ads, top of SERP (2*) - Text ads, bottom of SERP (2*)
C Large screen SEO - Organic results (6*) - News (3*)
C Large screen PSM - Text ads, top of SERP (2*) - Shopping ads (8*)
C Small screen SEO - Organic results (6*) - News (2*)
C Small screen PSM - Text ads, top of SERP (2*) - Shopping ads (2*)
D Large screen SEO - Organic results (6*) - News (3*)
D Large screen PSM - Text ads, top of SERP (2*) - Shopping ads (8*)
D Small screen SEO - Organic results (6*) - News (2*)
D Small screen PSM - Text ads, top of SERP (2*) - Shopping ads (2*)
Based on the marked elements, a success rate was calculated for each participant
per task (A-D), device (large, small), and area (SEO, PSM). This rate accounts for correctly
marked (true positive) and incorrectly marked (false positive) results using the formula
n true -n false
n to be marked.
Two examples follow, the first for achieving a positive success rate for task A, large
screen, SEO results. In this case, 10 organic results are to be marked, of which the subject
marks 8 results (8 true). In addition, the subject incorrectly marks 2 ads (2 false). This
results in a success rate of 0.6. Negative success rates are also possible, if a subject
makes more incorrect than correct markings, exemplified by task B, small screen, PSM
results. In this case, a total of 4 text ads are to be marked. If a subject identifies all 4 text
ads (true), but additionally marks 6 organic results (false), the subject achieves a success
rate of -0.5.

6 Results 32
6 Results
6.1 Participant characteristics
In the following, the demographic characteristics of the participants are reported.
The corresponding questions come from questionnaire sections “I) Screening” and “XI)
User profile”.
No. 1.1 How old are you?
Figure 3: Question no. 1.1: age
No. 1.2 You are …
- Female: 48.4% (n=974)
- Male: 51.6% (n=1,038)
No. 1.3 Which state do you live in?
Figure 4: Question no. 1.3: state
No. 11.3 Which of the following activities do you mainly pursue?

6 Results 33
Figure 5: Question no. 11.3: main activity
No. 11.4 Which of the following topics play a role in your professional activity? No. 11.5 Which of the following topics belong to your training/studies?
Figure 6: Question no. 11.4: topics (job)
Figure 7: Question no. 11.5: topics (training/studies)
Figure 6 and Figure 7 show the topics of the professional role and training/studies
of the respondents. The extent to which the topics have been associated with SEO (see
section 5.1) was marked with *.
The group with SEO affinity “high” contains n=188 respondents. The group
“average” contains n=376 respondents, the group “low” n=1,325 respondents.
The groups with high or average SEO affinity are noticeably male-dominated. The
group “high” consists of 59.7% men, the group “average” of 62.6%. In contrast, the
group “low” consists of 51.8% men. Both groups (high/average) also have a high level of
education. 76.2% of the group “high” and 67.3% of the group “average” have an A-level
or university degree, whereas in the group “low” this is the case for 56.1% of users.

6 Results 34
No. 11.6 What is your highest educational level?
Figure 8: Question no. 11.6: educational level
6.2 Usage behaviour
In this section, the usage behaviour of the German internet users is presented. The
corresponding questions come from questionnaire sections “II) Usage behaviour” and
“XI) User profile”.
No. 2.1 What do you use the Internet for?
Figure 9: Question no. 2.1: Internet usage
As Figure 9 shows, search is clearly ahead in terms of the occasions of Internet
usage (97.2%). This is followed by online shopping/ordering/booking (84.9%) and
communication applications (81.2%).
No. 2.2 If you are searching for something online: Which search engine(s) do you usually use?

6 Results 35
Figure 10: Question no. 2.2: search engine usage
As expected, Google is the most used search engine (94.1%), followed by Bing. A
relatively high percentage of Internet users also use Ecosia (10.1%). Not everyone seems
to be aware of the separation between search engine and browser, which is indicated
by the 1.1% of users who mention a browser as their most used search engine. There
are no significant differences in browser mentions regarding age, educational level and
gender of the respondents.
No. 2.3 Which search engine do you use most often?
Figure 11: Question no. 2.3: most often used search engines
Looking at the mentions for the most-used search engine (Figure 11), Google is
again in first place (89.8%). Ecosia follows as a distant second and is used most often by
5.6% of Internet users. Figure 12 shows that in the case of Ecosia, there is a clear trend
among young users. Among 16-19-year olds, Ecosia was named the most used search
engine by 15.8%.

6 Results 36
Figure 12: Ecosia as most used search engine by age group
No. 2.4 Which devices do you use search engines with?
In Table 7 the usage frequencies of the devices are shown in column “Usage”.
“Usage” includes all subjects who have indicated that they use the respective device
frequently, occasionally, or rarely. The columns to the right show how many subjects
also use another device (again frequently, occasionally, or rarely).
For example, 94.9% of all Internet users use search engines via smartphone. Of the
smartphone users, 1.3% use the smartphone exclusively, while 82.4% also use a laptop.
Tablets and smart speakers are never used alone (column “no other device”) for search
engine use, with smart speaker users almost all (99.7%) also using smartphones.
Table 7: Multiple use of devices for search engine usage
Usage
Usage together with …
no other device
Smartphone Laptop Desktop computer, PC
Tablet Smart speaker
Smartphone 94.9% (n=1,910)
1.3% / 82.4% 65.3% 61.5% 18.7%
Laptop 81.9% (n=1,647)
2.1% 95.5% / 60.5% 61.9% 19.7%
Desktop computer, PC
65.1% (n=1,309)
1.8% 95.3% 76.2% / 62.7% 20.4%
Tablet 59.4% (n=1,195)
0.0% 98.2% 85.4% 68.7% / 24.3%
Smart speaker
17.8% (n=359)
0.0% 99.7% 90.5% 74.4% 80.8% /
The intensity of usage of the individual devices is discussed in more detail below.
For this purpose, the subjects that have indicated a use as described above (frequently,
occasionally, or rarely) are considered.
It is noticeable that the smartphone is not only used by the majority of subjects
for search engine use in general (94.9%) but is also the device that is used most

6 Results 37
intensively (‘frequently’: 70%). The intensity of use of the laptop and desktop
computer/PC are quite similar, with slight advantages for the laptop. As described
above, smart speakers are only used by 17.8% of all search engine users, and if so, then
usually only rarely or occasionally (88.5% in total).
Figure 13: Question no. 2.4: Distribution of use Intensity by device
No. 2.5 Why is [search engine] the search engine you use most often? Please mark up to 5 answers.
Figure 14: Question no. 2.5: Reasons for search engine use
Figure 14 shows the frequencies of the reasons for use, categorized by the most
frequently used search engines. The ease and speed of use of the search engine was
mentioned as the main reasons for use. The reason not to know any other search
engines was only mentioned by users who prefer Google. The aspect of sustainability
was exclusively associated with Ecosia. For privacy reasons, DuckDuckGo is used most.
No. 2.6 Can you estimate how many queries you submit to search engines in a regular week?

6 Results 38
Figure 15: Question no. 2.6: queries per week
The most common response in terms of search frequency is over 20 to 50 queries
per week from 30.6% of Internet users (Figure 15).
If we look at the medians of the ranges (e.g., “1 to 5 per week” = 3 queries), we
get an average number of 46.02 queries per week. Subjects indicating “I don’t know”
were not considered. For “less than 1 per week” we assigned the value 0.5 queries per
week, for “more than 100 per week” the value 150 queries per week.
No. 11.1 In what way do you use search engines?
Figure 16: Question no. 11.1: search by text input or by voice
The search engine use by voice is rarely or never used by the majority of Internet
users. These results match the respondents’ previous statements that smart speakers
are rarely or never used for search engines.
No. 11.2 In a regular week, for how long do you use the Internet approximately?
Figure 17: Question no. 11.2: Internet usage (hours per week)
About every fourth respondent (23.8%, most frequent mention) said they use the
Internet between 10 and 20 hours per week. There is also a relatively high proportion
using the Internet 40 or more hours per week (13.7%).

6 Results 39
6.3 Self-assessment
No. 3.1 When it comes to finding something on the Internet using search engines: How do you assess your own abilities in this respect?
Figure 18: Question no. 3.1: self-assessment of search skills
About half of all Internet users rate their search skills as “excellent” (52.4%),
followed by “perfect” (31.9%). Only 0.7% rate their search skills as “fair” or “bad”.
No. 3.2 And how often do you think you find what you are looking for using search engines?
Figure 19: Question no. 3.2: self-assessment of search success
About two third of all Internet users stated that they find what they are looking
for most of the time (73.1%), followed by “always” (22.4%).
6.4 Trust in search engines
In the following, the results for two very similar questions are presented together,
which refer to search engines in general and Google in particular. The questions are:
No. 4.1 If you think of search engines in general: To what extent do you think the following statements apply to search engines?
No. 4.2 And if you think especially of Google: To what extent do you think the following statements apply to Google?

6 Results 40
Figure 20: Questions no. 4.1 and 4.2: Trust in search engines and Google: fair and unbiased sources
When asked whether search engines or Google are fair and unbiased sources of
information, the option “neutral” is selected most often (search engines: 41.4%, Google:
38.4%), followed by “correct” (22.7%/25.5%) and “rather not true” (19.8%/17.1%).
Figure 21: Questions no. 4.1 and 4.2: Trust in search engines and Google: correct and trustworthy information
When asked whether the information found through search engines or Google is
correct and trustworthy, the option “neutral” is again selected most often (search
engines: 48.0%, Google: 44.3%), followed by “correct” (37.4%/37.0%) and “absolutely
correct” (6.8%/9.0%).
No. 4b.1 If you think of search engines in general: To what extent do you think the following statements apply to search engines?
No. 4b.2 And if you think especially of Google: To what extent do you think the following statements apply to Google?

6 Results 41
Figure 22: Questions no. 4b.1 and 4b.2: Trust in search engines and Google: match between query and results
The majority of respondents agreed with the statement (by “absolutely correct”
or “correct”) that the results displayed in search engines in general (77.0%) as well as in
Google in particular (77.3%) perfectly match the query.
6.5 Personalization
In the following we will present the results that relate to the two questions about
personalization of search results of section X).
10.1 If a search engine records your search queries and uses this information to customize search results for you in the future: What do you think about that?
Figure 23: Question no. 10.1: opinions on personalization
The most common response was a neutral attitude towards personalised search
results (43.9%). More than every third respondent (37.7%) has a negative attitude
towards personalization, 15.0% a positive attitude.
10.2 And have you ever taken measures to limit the amount of data that search engines collect about you? If so, which ones?

6 Results 42
Figure 24: Question no. 10.2: measures to limit personalization
Deleting past activities (60.4%) was cited as the most common measure to limit
personalization, followed by disabling location detection (52.8%).
In the following, we present the correlation between the opinion on
personalization and the measures taken to limit personalization. As Table 8 shows,
measures for limiting personalization were made most often by those who have a
negative attitude towards personalization (χ²(3) = 98.468, p < .001).
Table 8: Opinion on personalization by personalization measures
Measures taken to limit personalization
Sum
No Yes
Answer to “personalization regarded as…”
positive Count 106 188 294
% within answer 36.1% 63.9% 100.0%
neutral Count 268 619 887
% within answer 30.2% 69.8% 100.0%
negativ Count 144 621 765
% within answer 18.8% 81.2% 100.0%
I don’t know Count 46 21 67
% within answer 68.7% 31.3% 100.0%
Sum Count 564 1,449 2,013
% within answer 28.0% 72.0% 100.0%
6.6 Distinguishing between ads and organic results
In this section we will present the subjects’ ability to correctly label results
influenceable by payment (ads) or by SEO (organic search results) and thus distinguish
between both results types. The success rates were calculated as described in section
Success rates for marking tasks. The corresponding questions are:
No. 8.1 /8.3 You will now see a Google results page. Are there any search results on this page that can be influenced by the website operator paying Google? No. 8.2 /8.4 One more question about this search results page: Are there any search results on this page that can be influenced by search engine optimization?

6 Results 43
6.6.1 Mean success rates
First, the mean success rates for the large screen-SERPs are presented (Figure 25).
Figure 25: Questions no. 8.1-8.4: Success rates (large screen)
Within each bar, the average success rate is shown, for example for SERP A and
the marking of ads, 0.628. Above the bar, the number of participants to whom this
success rate refers is given. In the case of SERP A, ads, this means that 80.3% of those
who had to evaluate SERP A made markings while the rest (19.7%) indicated that there
were no ads on SERP A.
Ads were identified much better than organic results. In addition, both result types
(ads/organic) were identified better on the simply structured SERPs (A and B) than on
the more complex SERPs (C and D). The negative success rates of the complex SERPs (C
and D) for the organic results show that on average more false than correct markings
were made.
Moreover, it is noticeable that more subjects made markings for ads (up to 84.5%
of participants) than for organic results (up to 67.1% of participants).
Next, we present the mean success rates for the small screen-SERPs (Figure 26).
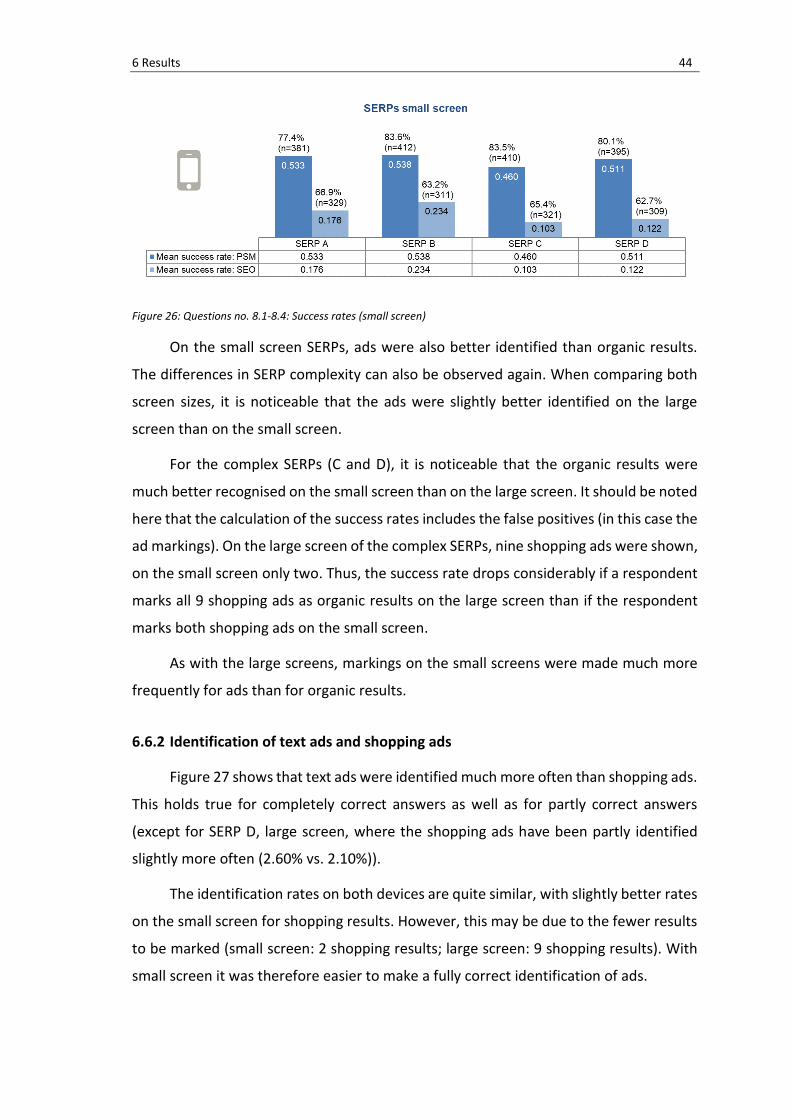
6 Results 44
Figure 26: Questions no. 8.1-8.4: Success rates (small screen)
On the small screen SERPs, ads were also better identified than organic results.
The differences in SERP complexity can also be observed again. When comparing both
screen sizes, it is noticeable that the ads were slightly better identified on the large
screen than on the small screen.
For the complex SERPs (C and D), it is noticeable that the organic results were
much better recognised on the small screen than on the large screen. It should be noted
here that the calculation of the success rates includes the false positives (in this case the
ad markings). On the large screen of the complex SERPs, nine shopping ads were shown,
on the small screen only two. Thus, the success rate drops considerably if a respondent
marks all 9 shopping ads as organic results on the large screen than if the respondent
marks both shopping ads on the small screen.
As with the large screens, markings on the small screens were made much more
frequently for ads than for organic results.
6.6.2 Identification of text ads and shopping ads
Figure 27 shows that text ads were identified much more often than shopping ads.
This holds true for completely correct answers as well as for partly correct answers
(except for SERP D, large screen, where the shopping ads have been partly identified
slightly more often (2.60% vs. 2.10%)).
The identification rates on both devices are quite similar, with slightly better rates
on the small screen for shopping results. However, this may be due to the fewer results
to be marked (small screen: 2 shopping results; large screen: 9 shopping results). With
small screen it was therefore easier to make a fully correct identification of ads.

6 Results 45
Background information on the case numbers: For the mean success rates (Figure
25 and Figure 26) described above, only those respondents were included who made
clicks and did not skip the task (e.g., SERP C, large screen, ads: n=424). By contrast, in
the comparison between text and shopping ads (Figure 27), all respondents were
considered, since those who indicated that there were no paid results on the SERP were
classified as “no ad identified” (e.g., SERP C, large screen, n=502).
Figure 27: Questions no. 8.1-8.4: Success rates for text ads and shopping ads
6.6.3 Correlation between success rate and self-assessment
In the following, we examine whether there is a correlation between the self-
assessment and the average success rates achieved in the marking tasks. We performed
Spearman’s rho analyses, as this is an appropriate method for variables that are not
normally distributed, which is the case with the data. We found a significant, but (very)
small negative correlation (ρ=-.049, p=.040). The higher (i.e. worse) the self-assessment,
the lower the average success rates.
6.7 Search result influences
No. 5.1 When it comes to the search results displayed on Google: What do you think influences the ranking of search results on Google?
Question 5.1 shows which aspects the respondents mentioned when it comes to
general influences on the search results. Among all open responses (n=1,241), payment
was mentioned most frequently, followed by the traffic of the website.

6 Results 46
Figure 28: Question no. 5.1: Assumptions on search result influences
6.8 PSM
No. 6.1 What do you think: Where does Google generate most of its revenue from?
Question 6.1 about Google’s main source of revenue is presented in three bars in
Figure 29. The top bar shows the subjects who indicated that they knew the correct
answer. The middle bar indicates which of the answers were completely or partially
correct. The bottom bar shows the percentage of respondents who gave the correct
answer (see also section Coding and grouping).
An at least partially correct answer was given by 68.4% of respondents. As a result,
31.6% do not know where Google generates its revenue from. A closer look at the open
responses to this question reveals that the sale of data was mentioned as a source of
revenue by 4.9% of all respondents (1.5% exclusively, 3.4% together with other
mentions). There are also large differences in the level of education and affinity to SEO
topics. The higher the level of education as well as the SEO affinity, the more the
respondents were aware of Google’s main source of income.

6 Results 47
Figure 29: Question no. 6.1: Google’s main revenue source
No. 6.2 Do website operators or companies have the opportunity to pay for their results to appear high up on Google’s search results page?
- Yes, this is possible: 79.1%
- No, this is not possible: 3.1%
- I don‘t know: 17.8%
The fact that a prominent placement can be achieved through payment to Google
is known by 79.1% of Internet users, and thus more than those who were able to name
Google’s source of income at least partially correctly (68.4%).
Figure 30 shows the respondents who correctly answered question 6.2 with “Yes,
this is possible”. Once again, differences in the level of education and SEO affinity can
be seen. In addition, it is noticeable that men as well as users under 30 are more likely
to know about the possibility of placement for payment than women or older users. This
also holds true for respondents who do not prefer Google as well as respondents who
have expressed a low level of trust in search engines.

6 Results 48
Figure 30: Question no. 6.2: payment option for placement (group differences)
No. 6.3 Do such paid search results differ from the other search results? No. 6.4 And how do the paid search results on Google differ from the other results that have not been paid for?
Questions 6.3 and 6.4 on the differentiability of ads and organic results are
presented together. For comparison purposes, the top bar again shows the shares of
those respondents who assume that placement against payment is possible (question
6.2). Underneath this is the bar for question 6.3, whether ads are distinguishable from
organic results. The lowest bar indicates how many respondents knew how to
distinguish advertisements from organic results.
It is noticeable that compared to the high percentages for question 6.2, the
percentages of correct answers for questions 6.3 and 6.4 are much lower. Thus, most
respondents (79.1% of Internet users) are aware of the possibility of paid placement,
but only 42.3% know that ads differ from organic results and 27.7% know how they
differ. As in the previous questions (5.1 and 6.1), the higher educated and SEO-affine
respondents performed better in questions 6.3 and 6.4.

6 Results 49
Figure 31: Questions no. 6.2 to 6.4: Distinguishability of ads and organic results
6.9 SEO
6.9.1 Knowledge
No. 7.1 Do website operators or companies have the ability or influence to appear higher in the Google results list for certain queries without paying any money to Google?
- Yes, this is possible: 43.4%
- No, this is not possible: 11.3%
- I don‘t know: 45.3%
Of all Internet users surveyed, 43.4% assume that improved ranking can be
achieved without paying money to Google. Consequently, more than half of the
respondents answered either wrong or with “I don’t know”.
Figure 32 shows the respondents in the group comparison who correctly answered
question 7.1 with “Yes, this is possible”. Men assumed this possibility more frequently
than women (50.5% vs. 35.9%). The same applies to younger, more highly educated,
SEO-affine, as well as to Internet users who do not prefer to use Google and who have
expressed little trust in search engines.

6 Results 50
Figure 32: Question no. 7.1: possibility for better placement without payment (group differences)
No. 7.2 Do you know what term is used to describe these measures to improve the ranking in the Google search results list (without payment to Google)?
The following shows how many respondents are familiar with the term “SEO”. Of
all Internet users, 13.7% said they knew the term, but only 8.1% gave the correct answer
(“Search Engine Optimization” or “SEO”). Unsurprisingly, SEO-affine respondents again
performed best.
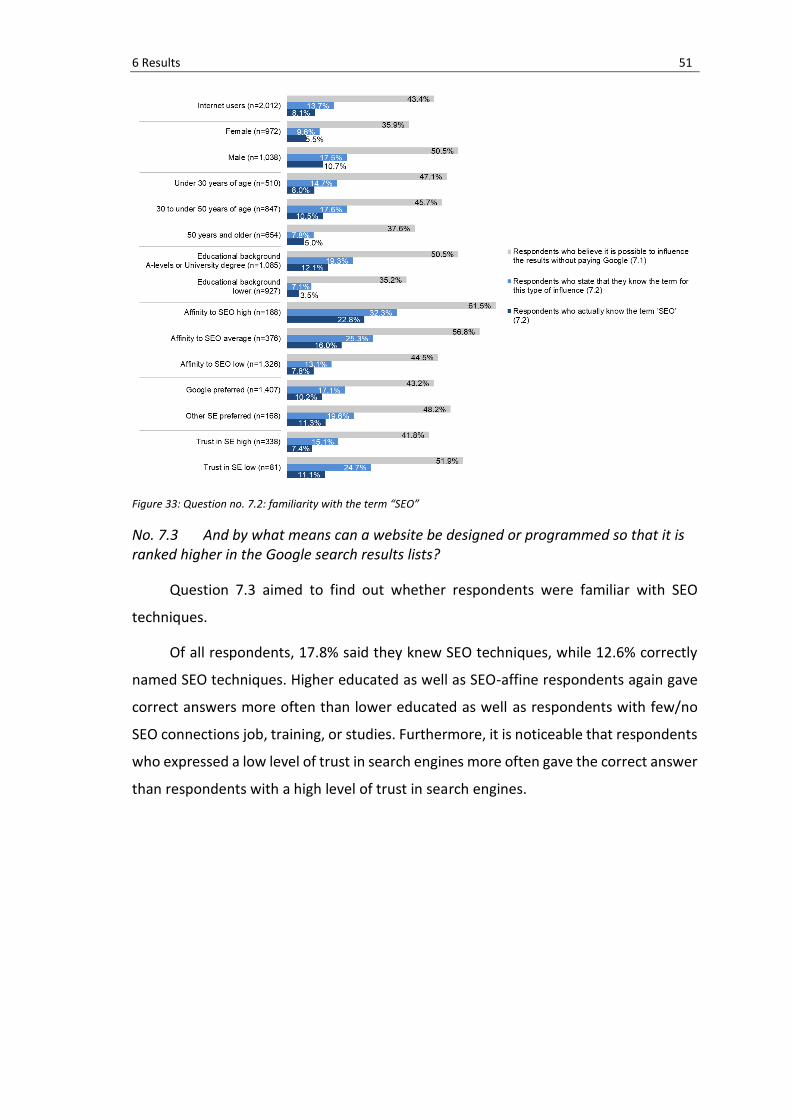
6 Results 51
Figure 33: Question no. 7.2: familiarity with the term “SEO”
No. 7.3 And by what means can a website be designed or programmed so that it is ranked higher in the Google search results lists?
Question 7.3 aimed to find out whether respondents were familiar with SEO
techniques.
Of all respondents, 17.8% said they knew SEO techniques, while 12.6% correctly
named SEO techniques. Higher educated as well as SEO-affine respondents again gave
correct answers more often than lower educated as well as respondents with few/no
SEO connections job, training, or studies. Furthermore, it is noticeable that respondents
who expressed a low level of trust in search engines more often gave the correct answer
than respondents with a high level of trust in search engines.

6 Results 52
Figure 34: Question no. 7.3: familiarity with SEO techniques
6.9.2 Assessments
No. 9.1 Now please think again about search engine optimization. In your opinion, how strong is the influence of search engine optimization on the ranking of the search results in Google?
Figure 35 shows that most Internet users assumed that SEO has a (very) strong
influence on the ranking (59.2% overall). Only a few respondents assumed little (3.1%)
or no influence (0.7%). Here it should be remembered that explanation about SEO was
provided in advance so that the subjects were able to understand the questions (see
Information part “SEO/PSM“, section 4.2.2.1).

6 Results 53
Figure 35: Question no. 9.1: strength of SEO influence
Figure 36 shows the user groups for those respondents who assume a strong or
very strong influence of SEO.
Higher educated, older, and SEO-affine users are more likely to assume a (very)
strong SEO influence than lower educated, younger and respondents with no or little
SEO reference in their activity. Internet users who have expressed a low level of trust in
search engines are more likely to assume a (very) strong SEO influence than Internet
users with a high level of trust in search engines.
Figure 36: Question no. 9.1: (very) strong SEO influence (group differences)
6.9.3 Opinions
No. 9.2 How big are the positive and negative effects of search engine optimization on the Google search results from your perspective?

6 Results 54
Internet users described the positive and negative effects of SEO as very similar
and mostly as medium in strength. More Internet users assume (very) strong positive
(30.4%) than (very) strong negative (26.7%) SEO effects (Figure 37).
Figure 37: Question no. 9.2: positive and negative effect sizes of SEO
As Figure 38 shows, men more often assume (very) strong negative effects of SEO
(30.2%) than women (22.9%). Younger users under the age of 30 tend to see (very)
strong positive (32.8%) rather than (very) strong negative (26.8%) SEO effects. The group
of respondents who expressed a low level of trust in search engines is again worth
noting. With 56.7%, this group stated the highest proportion of (very) large negative SEO
effects together with the lowest proportion of (very) large positive SEO effects (17.8%).
Figure 38: Question no. 9.2: (very) large positive and negative effects of SEO (group differences)
Looking at the data at the respondent level, n=956 participants reported either
(very) large positive or (very) large negative effects. Of all subjects, 21.0% reported
(very) large positive effects without simultaneously reporting (very) large negative

6 Results 55
effects. 17.2% of all subjects assumed (very) large negative effects without
simultaneously reporting (very) large positive effects. The remaining 9.3% of
respondents stated both (very) large positive and (very) large negative effects.
Figure 39: (very) large positive and negative effects of SEO (multiple responses)
No. 9.3 Which positive effects does search engine optimization have in your opinion?
As Figure 40 shows, the most frequent mention of positive SEO effects refers to
the fact that SEO leads to better/more relevant search result (40.9%). The respondents
also recognize the advantages that SEO has for website operators. This holds especially
true for SEO-affine Internet users (28.6%).
Figure 40: Question no. 9.3: positive effects of SEO
No. 9.4 Which negative effects does search engine optimization have in your opinion?
The most frequent mention (31.4%) of negative SEO effects was that a
manipulation of the results with negative intention (e.g., controlling of opinions) would

6 Results 56
occur (Figure 41). Especially those respondents who are not confronted with SEO-
related topics in their job, training or studies assume this.
Figure 41: Question no. 9.4: negative effects of SEO

7 Discussion 57
7 Discussion
In the following, we will present the central results based on the research
questions and hypotheses.
RQ1: How do German Internet users use search engines?
With 97.2%, searching for something is the most frequent reason for using the
Internet. Internet users state they mainly use search engines on mobile devices (via
smartphones) and via text input, while 60.8% have never used voice search before.
Google is by far the most frequently used search engine: 90% prefer to use Google;
further 4% use Google in addition to another search engine they prefer. These results
are in line with Google’s high market share described in the literature section. The usage
of Google is mainly justified to its ease of use, its speed, but also to the habits of the
users (“I’ve always used it”). Ecosia takes second place in the most-used search engines,
with its ecological attitude as the main reason for its use. Especially among young search
engine users Ecosia is very popular. On average, German Internet users submit 46 search
queries per week. This value is quite close to another representative survey of German
Internet users from 2010 reporting 50 queries per week (Verbaende.com, 2010).
According to our survey, 96% of German Internet users submit at least one search
query per week. In a survey of the German speaking population aged 14 years and older
(“ARD/ZDF-Onlinestudie 2020”), 76% stated that they use search engines at least once
a week. This lower proportion can possibly be explained by the sample that considered
the German population in general (surveyed by telephone), not just Internet users
(ARD/ZDF-Medienkommission, 2020; Beisch & Schäfer, 2020). In a representative survey
by the European Commission (2016, p. 8), 85% of German Internet and online platform
users stated that they use search engines at least once a week, while the sample also
includes 4% of respondents who stated that they never use search engines.
RQ2: How do German Internet users rate their abilities to use search engines?
Over 84% of Internet users rate their ability to find something on the Internet using
search engines as good or very good. In line with this self-confident assessment, over
95% say they always or almost always find what they were looking for. This is pretty
much in line with the results of a representative study by the European Commission
(2016, p. 19), in which 92% of German Internet and online platform users agreed with
the previously mentioned statement (“find what you were looking for”). However, it is
questionable how users can even evaluate whether they have found what they were

7 Discussion 58
looking for, at least for some information needs. Comparable high self-assessments
were already determined in a representative study by Lewandowski et al. (2018).
RQ3: How much do German Internet users trust search engines and the information they find through them?
In response to the questions whether search engines or Google are fair and
unbiased sources of information and whether the information found by the search
engines or Google is correct and trustworthy, most Internet users gave the answer
“neutral”. Agreeing answers (“absolutely correct” or “correct”) were given slightly more
often than disagreeing answers (“rather not true” or “doesn’t apply at all”). The answers
regarding the trustworthiness of search engines in general and Google in particular are
very similar and only differ in that the respondents stated more often that Google is a
fair and unbiased source of information than search engines in general. Thus, Internet
users tend to trust search engines and Google rather than distrust them. Compared to
the Purcell et al. (2012) study, where the majority of participants agreed with the
statements shown above (“SE as fair and unbiased source”; “correct and trustworthy
information via SE”), our survey presents a much more balanced picture and includes a
significantly higher proportion of respondents who disagree with the statements on
trustworthiness.
RQ4: How do German Internet users think and act with regard to search engine personalization methods?
Internet users who are not neutral towards personalized search results (43.9%)
are more likely to have a negative (37.7%) than a positive (15.0%) attitude towards
personalization. The tendency towards a negative attitude is also reflected in the
settings the users made. Most Internet users (60.4%) said they have deleted past
browsing activities, about one in two have disabled location detection. In contrast, 15%
of Internet users are not aware that they can make settings to limit the amount of data
that search engines collect about them. Settings to limit personalization were made
significantly more often by those users who have a negative attitude towards
personalization.
Similar but even more distinct results were obtained in the study by Purcell et al.
(2012). In their survey, 65% of Internet users regarded personalization as negative, 29%
as positive (remaining answers: neither of these/don’t know/refused). Similarly, in the
representative study by European Commission (2016, p. 65), Internet and online
platform users more often expressed a negative (EU: 55%, DE: 65%) than a positive (EU:

7 Discussion 59
40%, DE: 30%) attitude toward personalized search results. The survey of Kozyreva et al.
(2020) came to different results. Most German Internet users (63%) stated that they find
personalized search results somewhat or very acceptable.
RQ5: Are German Internet users able to distinguish between organic results and ads on Google’s search engine results pages?
Internet users can identify results influenceable by payment (ads) much better
than results influenceable by SEO (organic search results). Organic and paid search
results are better identified on simply structured SERPs than on more complex
structured SERPs. About one in three Internet users can reliably identify text ads, while
shopping ads are identified by only about one in four users. Thus, it becomes clear that
Internet users have a poor understanding of the structure or composition of SERPs,
especially if the SERPs are complex. In addition, ads on the large screen are better
identified than ads on the small screen. The reason for this could be the better
distinguishability of the result types on the large screen, since organic results on the
small screen are provided with icons, which could further complicate the differentiation
from the ads.
Comparing our results with those of the study by European Commission (2016, p.
25), in which most European Internet and online platform users stated that ads were
clearly labeled, it becomes clear that there is a mismatch between self-reported
knowledge and actual problems in identifying ads.
RQ6: What knowledge do German Internet users have of Paid Search Marketing (PSM)?
When asked how Google generates its revenue, an at least partially correct answer
was given by 68% of Internet users (Lewandowski et al., 2018: 81%). As a result, 32% do
not know where Google generates its revenue from. Most Internet users (79%) are
aware of the possibility of paid placement (Lewandowski et al., 2018: 73%), but only 42%
know that ads differ from organic results (Lewandowski et al., 2018: 43%) and 28% of
Internet users know how they differ (Lewandowski et al., 2018: 34%10). Consequently,
compared to the study by Lewandowski et al. (2018), a similar number of users know
that ads differ from organic results, but fewer Internet users know what Google
10 This value refers to those subjects who named some of the elements by which ads differed from organic
results at the time of the study.

7 Discussion 60
generates its revenue from and how ads differ from organic results, and more people
know that there is a paid placement option on SERPs.
RQ7: What knowledge do German Internet users have of search engine optimization (SEO)?
H1: German search engine users have little knowledge that SEO can have an influence on search results.
Hypothesis H1 can be confirmed. 79.1% of Internet users are aware of the
possibility of achieving a more prominent placement by paid results. In contrast, only
43.4% know that a better ranking can be achieved without a payment to Google. The
corresponding term “SEO” is known to 8.1% of Internet users, while 12.6% can name
SEO techniques.
In comparison with the questions on PSM (RQ6), these results show that SEO is
much less known to Internet users.
RQ8: How do German Internet users assess the impact of SEO on search results?
H4: German search engine users are highly divided about the impact that SEO can have on search results (very strong influence vs. no influence).
Hypothesis H4 cannot be confirmed. The SEO impact on search results is described
by most Internet users (59.2%) as large or very large. Only a few Internet users (3.8%)
assume little or no influence.
RQ9: What opinions do German Internet users have about the influence that SEO can have on search results?
More Internet users assume positive (30.4%) than negative (26.7%) SEO effects.
On the positive side, SEO is credited with producing better/more relevant search results.
On the negative side, it is considered that SEO could manipulate the search results (e.g.,
controlling opinions of users), without the users being aware of it.
RQ10: Which sociodemographic factors influence the perspectives (knowledge, assessments, opinions) of German Internet users regarding search engine optimization?
H2: German search engine users who are confronted with SEO related topics (e.g., digitalization, Internet) in their job, training, or studies, have a higher level of knowledge of SEO than users to whom this does not apply.
Hypothesis H2 can be confirmed. German search engine users who are confronted
with SEO related topics are more often aware of the possibility of influence without

7 Discussion 61
payment to Google, know the term “SEO” more often, and can correctly name SEO
techniques more often.
H3: German search engine users with a high level of education have a higher level of knowledge of SEO than users with lower levels of education.
Hypothesis H3 can be confirmed. German search engine users with a high level of
education are more often aware of the possibility of influence without payment to
Google, know the term “SEO” more often, and can correctly name SEO techniques more
often.
H5: German search engine users who are confronted with SEO related topics (e.g., digitalization, Internet) in their job, training, or studies, have a more positive opinion about SEO influencing search results than users to whom this does not apply.
Hypothesis H5 can be confirmed. German search engine users who are confronted
with SEO related topics indicate more often (very) strong positive SEO effects than users
with low affinity to SEO related topics (36.6% vs. 31.8%) and less often (very) strong
negative SEO effects (26.5% vs. 27.5%).

8 Conclusion 62
8 Conclusion
We conducted an online survey with n=2,012 participants representative of
German Internet users between the ages of 16 and 69. The survey focused on search
engine optimization (SEO).
We found that SEO is much less known to Internet users than PSM and that the
level of knowledge and the opinions about SEO are influenced by the user’s education
and his or her affinity to SEO topics. Other key results show a high self-assessment of
users regarding their own search engine literacy, a slightly positive view on the
trustworthiness of search engines and a rather negative attitude towards
personalization.
A strength of the study is the representative sample, which allows statements
about the German online population according to the AGOF criteria. Limitations are
mainly to be expected in the questionnaire design. It cannot be fully guaranteed that all
respondents have read and understood the explanatory texts on SEO and PSM.
Furthermore, the ready-made SERP screenshots do not represent a realistic usage
situation and may have made it difficult to identify the results to be marked.
Future research projects are particularly promising in two directions. On the one
hand, an annual repetition of the online survey would allow the search engine usage of
German Internet users to be surveyed and compared over several years, which to this
extent is currently not the case. On the other hand, a realization of the survey in other
countries would enable worthwhile comparisons.

9 Acknowledgements 63
9 Acknowledgements
The research project “SEO-Effekt” is funded by the German Research Foundation
(DFG – Deutsche Forschungsgemeinschaft) from 5/2019 until 7/2021.

10 References 64
10 References
ARD/ZDF-Medienkommission. (2020). Ergebnisse der ARD/ZDF-Onlinestudie 2020. https://www.ard-zdf-onlinestudie.de/files/2020/2020-10-12_Onlinestudie2020_Publikationscharts.pdf
Bar-Ilan, J., Keenoy, K., Levene, M., & Yaari, E. (2009). Presentation bias is significant in determining user preference for search results-A user study. Journal of the American Society for Information Science and Technology, 60(1), 135–149. https://doi.org/10.1002/asi.20941
Beisch, N., & Schäfer, C. (2020). Internetnutzung mit großer Dynamik: Medien, Kommunikation, Social Media. Media Perspektiven, 9, 462–481. https://www.ard-zdf-onlinestudie.de/files/2020/0920_Beisch_Schaefer.pdf
Callegaro, M., Baker, R., Bethlehem, J., Göritz, A. S., Krosnick, J. A., & Lavrakas, P. J. (2014). Online panel research. In Online Panel Research (1. ed., pp. 1–22). John Wiley & Sons, Ltd. https://doi.org/10.1002/9781118763520.ch1
Craswell, N., Zoeter, O., Taylor, M., & Ramsey, B. (2008). An experimental comparison of click position-bias models. Proceedings of the International Conference on Web Search and Web Data Mining, 87–94.
European Commission. (2016). Special Eurobarometer 447 – Online Platforms (Issue June). https://doi.org/10.2759/937517
gimp.org. (2020). GIMP - GNU Image Manipulation Program. https://www.gimp.org/
Goel, S., Broder, A., Gabrilovich, E., & Pang, B. (2010). Anatomy of the long tail. Proceedings of the Third ACM International Conference on Web Search and Data Mining - WSDM ’10, 201. https://doi.org/10.1145/1718487.1718513
gofullpage.com. (2020). GoFullPage – Full Page Screen Capture – Chrome Web Store. https://chrome.google.com/webstore/detail/full-page-screen-capture/fdpohaocaechififmbbbbbknoalclacl
Google.com. (2019). User-Agent Switcher for Chrome – Chrome Web Store. https://chrome.google.com/webstore/detail/user-agent-switcher-for-c/djflhoibgkdhkhhcedjiklpkjnoahfmg
Griesbaum, J. (2013). Online-Marketing. In R. Kuhlen, W. Semar, & D. Strauch (Eds.), Grundlagen der praktischen Information und Dokumentation (pp. 411–423). DE GRUYTER SAUR. https://doi.org/10.1515/9783110258264.411
Höchstötter, N., & Lewandowski, D. (2009). What users see – Structures in search engine results pages. Information Sciences, 179(12), 1796–1812. https://doi.org/10.1016/j.ins.2009.01.028
Joachims, T., Granka, L., Pan, B., Hembrooke, H., & Gay, G. (2005). Accurately interpreting clickthrough data as implicit feedback. Proceedings of the 28th Annual International ACM SIGIR Conference on Research and Development in Information Retrieval - SIGIR ’05, 154. https://doi.org/10.1145/1076034.1076063
Kai Li, Mei Lin, Zhangxi Lin, & Bo Xing. (2014). Running and Chasing -- The Competition between Paid Search Marketing and Search Engine Optimization. 2014 47th Hawaii International Conference on System Sciences, 3110–3119.

10 References 65
https://doi.org/10.1109/HICSS.2014.640
Keane, M. T., O’Brien, M., & Smyth, B. (2008). Are people biased in their use of search engines? Communications of the ACM, 51(2), 49–52. https://doi.org/10.1145/1314215.1314224
Kelly, D., & Azzopardi, L. (2015). How many results per page? Proceedings of the 38th International ACM SIGIR Conference on Research and Development in Information Retrieval - SIGIR ’15, 183–192. https://doi.org/10.1145/2766462.2767732
Klein, R. N., Beutelspacher, L., Hauk, K., Terp, C., Anuschewski, D., Zensen, C., Trkulja, V., & Weller, K. (2009). Informationskompetenz in Zeiten des Web 2.0: Chancen und Herausforderungen im Umgang mit Social Software. Information - Wissenschaft & Praxis, 60(3), 129–142. https://www.phil-fak.uni-duesseldorf.de/023/
Kozyreva, A., Herzog, S., Lorenz-spreen, P., Hertwig, R., & Lewandowsky, S. (2020). Artificial intelligence in online environments: Representative survey of public attitudes in Germany. https://doi.org/10.17617/2.3188061
Kozyreva, A., Lorenz-spreen, P., Hertwig, R., Lewandowsky, S., & Herzog, S. M. (2020). Public attitudes towards algorithmic personalization and use of personal data online: Evidence from Germany, Great Britain, and the US. PsyArXiv. https://doi.org/10.31234/osf.io/3q4mg
Krosnick, J. A., & Presser, S. (2010). Question and Questionnaire Design. In J. D. Wright & P. V. Marsden (Eds.), Handbook of Survey Research (2. ed., pp. 263–313). Elsevier. https://web.stanford.edu/dept/communication/faculty/krosnick/docs/2009/2009_handbook_krosnick.pdf
Lewandowski, D. (2016). Suchmaschinenkompetenz als Baustein der Informationskompetenz. In Handbuch Informationskompetenz (pp. 115–126). De Gruyter. https://doi.org/10.1515/9783110403367-013
Lewandowski, D. (2017). Users’ Understanding of Search Engine Advertisements. Journal of Information Science Theory and Practice, 5(4), 6–25. https://doi.org/10.1633/JISTaP.2017.5.4.1
Lewandowski, D., Kerkmann, F., Rümmele, S., & Sünkler, S. (2018). An empirical investigation on search engine ad disclosure. Journal of the Association for Information Science and Technology, 69(3), 420–437. https://doi.org/10.1002/asi.23963
Lewandowski, D., & Sünkler, S. (2013). Representative online study to evaluate the commitments proposed by Google as part of EU competition investigation AT. 39740-Google: Report for Germany. http://searchstudies.org/wp-content/uploads/2015/10/Google_Online_Survey_DE.pdf
Liu, Z., Liu, Y., Zhou, K., Zhang, M., & Ma, S. (2015). Influence of Vertical Result in Web Search Examination. In R. A. Baeza-Yates, M. Lalmas, A. Moffat, & B. A. Ribeiro-Neto (Eds.), Proceedings of the 38th International ACM SIGIR Conference on Research and Development in Information Retrieval - SIGIR ’15 (pp. 193–202). ACM Press. https://doi.org/10.1145/2766462.2767714
McCue, T. (2018). SEO Industry Approaching $80 Billion But All You Want Is More Web Traffic. Forbes.Com. https://www.forbes.com/sites/tjmccue/2018/07/30/seo-

10 References 66
industry-approaching-80-billion-but-all-you-want-is-more-web-traffic/
Newman, N., Fletcher, R., Kalogeropoulos, A., & Nielsen, R. K. (2019). Reuters Institute: Digital News Report 2019. https://reutersinstitute.politics.ox.ac.uk/sites/default/files/inline-files/DNR_2019_FINAL.pdf
Pan, B., Hembrooke, H., Joachims, T., Lorigo, L., Gay, G., & Granka, L. (2007). In Google We Trust: Users’ Decisions on Rank, Position, and Relevance. Journal of Computer-Mediated Communication, 12(3), 801–823. https://doi.org/10.1111/j.1083-6101.2007.00351.x
Purcell, K., Brenner, J., & Rainie, L. (2012). Search Engine Use 2012 (Issue March). https://www.eff.org/files/pew_2012_0.pdf
Röhle, T. (2010). Der Google-Komplex: Über Macht im Zeitalter des Internets. Transcript.
Schultheiß, S., & Lewandowski, D. (2020a). How users’ knowledge of advertisements influences their viewing and selection behaviour in search engines. Manuscript Submitted for Publication.
Schultheiß, S., & Lewandowski, D. (2020b). “Outside the industry, nobody knows what we do” SEO as seen by search engine optimizers and content providers. Journal of Documentation, ahead-of-p(ahead-of-print). https://doi.org/10.1108/JD-07-2020-0127
Schultheiß, S., Sünkler, S., & Lewandowski, D. (2018). We still trust in Google, but less than 10 years ago: an eye-tracking study. Information Research, 23(3), paper 799. http://www.informationr.net/ir/23-3/paper799.html
Schweiger, W. (2003). Suchmaschinen aus Nutzersicht. In M. Machill & C. Welp (Eds.), Wegweiser im Netz: Qualität und Nutzung von Suchmaschinen (pp. 133–208). Verlag Bertelsmann Stiftung. https://sfbs.tu-dortmund.de/handle/sfbs/141
Singer, G., Norbisrath, U., & Lewandowski, D. (2012). Ordinary search engine users assessing difficulty, effort, and outcome for simple and complex search tasks. Proceedings of the 4th Information Interaction in Context Symposium on - IIIX ’12, 110–119. https://doi.org/10.1145/2362724.2362746
Stark, B., Magin, M., & Jürgens, P. (2014). Navigieren im Netz Befunde einer qualitativen und quantitativen Nutzerbefragung. In B. Stark, D. Dörr, & S. Aufenanger (Eds.), Die Googleisierung der Informationssuche (pp. 20–74). DE GRUYTER. https://doi.org/10.1515/9783110338218.20
StatCounter. (2020a). Search Engine Market Share Europe | StatCounter Global Stats. https://gs.statcounter.com/search-engine-market-share/all/europe
StatCounter. (2020b). Search Engine Market Share Germany | StatCounter Global Stats. https://gs.statcounter.com/search-engine-market-share/all/germany
StatCounter. (2020c). Search Engine Market Share United States Of America | StatCounter Global Stats. https://gs.statcounter.com/search-engine-market-share/all/united-states-of-america
Taylor, A., & Dalal, H. A. (2017). Gender and Information Literacy: Evaluation of Gender Differences in a Student Survey of Information Sources. College & Research Libraries, 78(1), 90–113. https://doi.org/10.5860/crl.78.1.90

10 References 67
Tremel, A. (2010). Suchen, finden - glauben? Die Rolle der Glaubwurdigkeit von Suchergebnissen bei der Nutzung von Suchmaschinen [Ludwig-Maximilians-Universität (LMU) München]. https://edoc.ub.uni-muenchen.de/12418/1/Tremel_Andreas.pdf
Unkel, J., & Haas, A. (2017). The effects of credibility cues on the selection of search engine results. Journal of the Association for Information Science and Technology, 68(8), 1850–1862. https://doi.org/10.1002/asi.23820
Verbaende.com. (2010). Suchmaschinen im Boom / Etwa 50 Suchanfragen pro Woche / Männer recherchieren deutlich häufiger im Web als Frauen. https://www.verbaende.com/news.php/Suchmaschinen-im-Boom-Etwa-50-Suchanfragen-pro-Woche-Maenner-recherchieren-deutlich-haeufiger-im-Web-als-Frauen?m=72333
Westerwick, A. (2013). Effects of Sponsorship, Web Site Design, and Google Ranking on the Credibility of Online Information. Journal of Computer-Mediated Communication, 18(2), 80–97. https://doi.org/10.1111/jcc4.12006
Winter, G. (2000). A Comparative Discussion of the Notion of “Validity” in Qualitative and Quantitative Research. The Qualitative Report, 4(3), 1–14. https://nsuworks.nova.edu/tqr/vol4/iss3/4
Yue, Y., Patel, R., & Roehrig, H. (2010). Beyond position bias. Proceedings of the 19th International Conference on World Wide Web - WWW ’10, 1011. https://doi.org/10.1145/1772690.1772793

Appendix 1: Questionnaire (German) A
Appendix 1: Questionnaire (German) Ab-schnitt
Nr. Fragestellung Antwortmöglichkeiten Ursprungsstudie
Antwortmöglichkeiten final (ggf. angepasst/übersetzt)
Begründung/ Erläute-rungen
Ref.
I)
Scre
enin
g
1.1 Wie alt sind Sie? / Unter 16 Jahre 16 bis 19 Jahre 20 bis 24 Jahre 25 bis 29 Jahre 30 bis 34 Jahre 35 bis 39 Jahre 40 bis 44 Jahre 45 bis 49 Jahre 50 bis 54 Jahre 55 bis 59 Jahre 60 bis 64 Jahre 65 bis 69 Jahre 70 Jahre oder älter
Ausschluss des Probanden, falls unter 16 Jahre oder 70 Jahre oder älter
9
1.2 Sie sind ... / Weiblich Männlich
Zur Quotierung
9
1.3 In welchem Bundesland leben Sie?
/ Baden-Württemberg Bayern Berlin Brandenburg Bremen Hamburg Hessen Mecklenburg-Vorpommern Niedersachsen Nordrhein-Westfalen Rheinland-Pfalz Saarland Sachsen Sachsen-Anhalt Schleswig-Holstein Thüringen
Zur Quotierung
9
II)
Nu
tzu
ngs
verh
alte
n
2.1 Wozu nutzen Sie das Internet bzw. was tun Sie regelmäßig, wenn Sie online sind?
/ Bitte markieren Sie alle zutreffenden Antworten: Herumsurfen, z.B. zur Unterhaltung, zum Zeitvertreib Nach etwas suchen, recherchieren Nachrichten, Berichte, Artikel lesen Soziale Netzwerke, Communities nutzen, z.B. Instagram, Facebook Über E-Mail, Messenger kommunizieren Online einkaufen, bestellen, buchen Online-Banking, -Broking Filme, Videos sehen Musik hören, herunterladen Spielen Anderes
9
2.2 Wenn Sie im Internet etwas suchen: Welche Suchmaschine/n verwenden Sie hierfür üblicherweise?
Bitte markieren Sie alle zutreffenden Antworten: Bing Ecosia DuckDuckGo Google Web.de Yahoo! Andere, und zwar ... (offene Eingabe) Keine
Ausschluss des Probanden, falls keine Suchmaschinen genutzt werden
8, Anpassungen durch: 9
2.3 Und welche Suchmaschine nutzen Sie am häufigsten?
- Google - Yahoo Search - Bing - AOL - Ask - Lycos - MyWebSearch
Bing Ecosia DuckDuckGo Google Web.de Yahoo! Eine andere
Nur genutzte Suchmaschinen (Angaben aus vorheriger Frage) werden angezeigt,
6, Anpassungen durch: 9

Appendix 1: Questionnaire (German) B
Ab-schnitt
Nr. Fragestellung Antwortmöglichkeiten Ursprungsstudie
Antwortmöglichkeiten final (ggf. angepasst/übersetzt)
Begründung/ Erläute-rungen
Ref.
- Dogpile - WebCrawler - Other (SPECIFY) - None/Don’t use any regularly - Don’t know - Refused
Weiß ich nicht, keine Angabe
insofern nicht nur eine Suchmaschine angegeben wurde (dann entfällt Frage)
2.4 Mit welchen Geräten nutzen Sie Suchmaschinen?
Multiple Choice: - Desktop-PC/Laptop - Smartphone - Tablet
Bitte markieren Sie jeweils die zutreffende Antwort: Per Desktop-Computer, PC Per Laptop Per Tablet Per Smartphone Per SmartSpeaker (z.B. Amazon Echo/Alexa, Google Home) häufig gelegentlich selten nie weiß ich nicht
8, Anpassungen durch: 9
2.5 Warum ist [...Suchmaschine] die Suchmaschine, die Sie am häufigsten nutzen? Bitte markieren Sie bis zu 5 Antworten.
Benutze Hauptsuchmaschine, weil ... - sie einfach zu bedienen ist - sie schnell ist - die Trefferliste übersichtlich gestaltet ist - sie mir objektiv vorkommt - die wichtigsten Treffer in der Trefferliste immer oben stehen - ich damit immer finde, was ich suche - ich sie schon immer benutze - ich das Gefühl habe, dass sie fast das ganze Internet abdeckt - sie zu den einzelnen Treffern hilfreiche Informationen anzeigt - sie keine unseriösen Treffer anzeigt - ich genau weiß, nach welchen Kriterien sie funktioniert - sie auch mal überraschende Treffer findet - sie die Möglichkeit bietet, unseriöse Treffer auszublenden - meine Freunde und Bekannten sie auch benutzen - mir das Seiten-Layout und die Farben der Suchseite gefallen Skala von 1=trifft gar nicht zu bis 4=trifft voll und ganz zu
Ich nutze [...Suchmaschine] am häufigsten, weil ... ... die Trefferliste übersichtlich gestaltet ist ... mir Layout und Farben der Suchseite gefallen ... sie einfach zu bedienen ist ... sie schnell ist ... sie mir objektiv erscheint ... ich damit immer finde, was ich suche ... ich genau weiß, nach welchen Kriterien sie funktioniert ... ich das Gefühl habe, dass sie fast das ganze Internet abdeckt ... die wichtigsten Treffer in der Trefferliste immer oben stehen ... sie zu den einzelnen Treffern hilfreiche Informationen anzeigt ... sie auch mal überraschende Treffer anzeigt ... sie keine unseriösen Treffer anzeigt bzw. diese ausgeblendet werden können ... ich sie schon immer benutze, aus Gewohnheit ... meine Freunde und Bekannten sie auch benutzen ... ich keine anderen Suchmaschinen kenne ... sie im Browser voreingestellt ist … kein bestimmter Grund Anderer Grund, und zwar ... (offene Eingabe)
Der Name der meistgenutzten Suchmaschine wird angezeigt
5, Anpassungen durch: 9
2.6 Können Sie abschätzen, wie viele Suchanfragen Sie in einer normalen Woche insgesamt über Suchmaschinen tätigen?
- Several times a day - About once a day - 3 to 5 days a week - 1 to 2 days a week - Once every few weeks - Less often - Never - Don’t know - Refused
Mehr als 100 pro Woche über 50 bis 100 pro Woche über 20 bis 50 pro Woche über 10 bis 20 pro Woche 6 bis 10 pro Woche 1 bis 5 pro Woche Weniger als 1 pro Woche Weiß ich nicht
6, Anpassungen durch: 9

Appendix 1: Questionnaire (German) C
Ab-schnitt
Nr. Fragestellung Antwortmöglichkeiten Ursprungsstudie
Antwortmöglichkeiten final (ggf. angepasst/übersetzt)
Begründung/ Erläute-rungen
Ref.
III)
Selb
ste
insc
hät
zun
g
3.1 Wenn es darum geht, mit Hilfe von Suchmaschinen etwas im Internet zu finden: Wie schätzen Sie Ihre eigenen Fähigkeiten diesbezüglich ein?
- Schulnoten 1-6 Meine Fähigkeiten bei der Suchmaschinen-Nutzung sind ... sehr gut gut befriedigend eher schlecht sehr schlecht weiß ich nicht
Prüfung auf Zusammenhang zwischen Selbsteinschätzung und tatsächlicher Kenntnis
3, Anpassungen durch: 9
3.2 Und wie häufig finden Sie das Gesuchte mit Hilfe von Suchmaschinen Ihrer Einschätzung nach?
- Always - Most of the time - Only some of the time - Hardly ever - Don’t know - Refused
Ich finde das Gesuchte ... immer meistens manchmal selten nie weiß ich nicht
6, Anpassungen durch: 9
IV)
Ve
rtra
ue
n
4.1 Bitte denken Sie nun einmal an Suchmaschinen ganz allgemein: Inwieweit treffen die folgenden Aussagen Ihrer Ansicht nach auf Suchmaschinen zu?
Teilfrage a “In general, do you think Internet search engines are a fair and unbiased source of information, or do you think search engines are NOT a fair and unbiased source?”: - Yes, they are a fair and unbiased source of information - No, they are NOT a fair and unbiased source of information - Depends - Don’t know - Refused Teilfrage b “In general, how much of the information you find using search engines do you think is accurate or trustworthy? Would you say...”: - All or almost all - Most - Some - Very little - None at all - Don’t know - Refused
Bitte markieren Sie jeweils die zutreffende Antwort: a) Suchmaschinen sind faire und unvoreingenommene Informationsquellen b) Die Informationen, die ich über Suchmaschinen finde, sind korrekt und vertrauenswürdig trifft voll und ganz zu trifft zu neutral trifft eher nicht zu trifft gar nicht zu weiß nicht
6, Anpassungen durch: 9
4.2 Und wenn Sie insbesondere an Google denken: Wie sehr treffen die folgenden Aussagen Ihrer Meinung nach auf Google zu?
Bitte markieren Sie jeweils die zutreffende Antwort: Google ist eine faire und unvoreingenommene Informationsquelle Die Informationen, die ich über Google finde, sind korrekt und vertrauenswürdig trifft voll und ganz zu trifft zu neutral trifft eher nicht zu trifft gar nicht zu weiß nicht
6, Anpassungen durch: 9
IVb
) Q
uer
y m
atch
4b.1
Bitte denken Sie nun einmal an Suchmaschinen ganz allgemein: Inwieweit trifft die folgende Aussage Ihrer Ansicht nach auf Suchmaschinen zu?
Die in Suchmaschinen angezeigten Suchergebnisse passen optimal zu meinen Suchanfragen trifft voll und ganz zu trifft zu neutral trifft eher nicht zu trifft gar nicht zu weiß nicht
Die Fragen 4b.1 und 4b.2 schließen an die vorherigen Fragen zum Vertrauen an und wurden in Absprache mit F&M dem Fragebogen hinzugefügt
9
4b.2
Und wenn Sie insbesondere an Google denken:
Die in Google angezeigten Suchergebnisse passen
9

Appendix 1: Questionnaire (German) D
Ab-schnitt
Nr. Fragestellung Antwortmöglichkeiten Ursprungsstudie
Antwortmöglichkeiten final (ggf. angepasst/übersetzt)
Begründung/ Erläute-rungen
Ref.
Wie sehr trifft die folgende Aussage Ihrer Meinung nach auf Google zu?
optimal zu meinen Suchanfragen trifft voll und ganz zu trifft zu neutral trifft eher nicht zu trifft gar nicht zu weiß nicht
V)
Ken
ntn
isse
(Su
cher
geb
nis
-Ein
flü
sse)
5.1 Wenn es um die Suchergebnisse geht, die bei Google angezeigt werden: Was beeinflusst die Auswahl und Reihenfolge der Suchergebnisse auf Google Ihrer Kenntnis nach?
Die gezeigten Google-Suchergebnisse und ihre Reihenfolge hängen ab von ... (offene Eingabe) Weiß ich nicht
9
VI)
Ke
nn
tnis
se (
Ad
s)
6.1 Was denken Sie: Wodurch generiert Google den Großteil seiner Einnahmen?
Google erzielt Einnahmen vor allem durch ... (offene Eingabe: Anzeigen, Ads, Werbung, Sponsored Results, Suchmaschinenwerbung, Search Engine Advertising, SEA, Paid Search Marketing, PSM, ...) Weiß ich nicht
3
6.2 Haben Website-Betreiber bzw. Unternehmen Ihrer Kenntnis nach die Möglichkeit, dafür zu bezahlen, dass sie bzw. ihre Produkte auf der Suchergebnisseite von Google weit oben erscheinen?
Ja, diese Möglichkeit gibt es Nein, diese Möglichkeit gibt es nicht Weiß ich nicht
3
6.3 Sind die eben erwähnten bezahlten Suchergebnisse Ihrer Meinung nach von den übrigen Suchergebnissen zu unterscheiden?
Ja, man kann sie erkennen bzw. von den übrigen Suchergebnissen unterscheiden Nein, man kann sie nicht erkennen Weiß ich nicht
[Wenn „Ja“ bei vorheriger Frage]
3
6.4 Und wodurch unterscheiden sich die bezahlten Suchergebnisse auf Google von den übrigen Ergebnissen, für die nicht bezahlt worden ist?
Die bezahlten Suchergebnisse auf Google erkennt man an ... (offene Eingabe: Anzeige/n-Begriff, Ad/s-Begriff, Kennzeichnung, Label, Markierung, [sowie weitere „Kennzeichnung“-Synonyme]) Weiß ich nicht
[Wenn „Ja“ bei vorheriger Frage]
3
VII
)
Ken
ntn
isse
(SE
O)
7.1 Haben Website-Betreiber bzw. Unternehmen Ihrer Meinung nach Möglichkeiten bzw. Einfluss darauf, bei bestimmten Suchanfragen in der Google-Ergebnisliste weiter oben zu erscheinen, ohne dafür an Google Geld zu bezahlen?
Ja, solche Möglichkeiten gibt es Nein, solche Möglichkeiten gibt es nicht Weiß ich nicht
1
7.2 Wissen Sie, mit welchem Begriff diese Maßnahmen zur Verbesserung der Platzierung in der Google- Suchergebnisliste (ohne Bezahlung an Google) bezeichnet werden?
Ja, man nennt das: ... (offene Eingabe: SEO, Suchmaschinenoptimierung, Search Engine Optimization) Weiß ich nicht
[Wenn „Ja“ bei 7.1]
1

Appendix 1: Questionnaire (German) E
Ab-schnitt
Nr. Fragestellung Antwortmöglichkeiten Ursprungsstudie
Antwortmöglichkeiten final (ggf. angepasst/übersetzt)
Begründung/ Erläute-rungen
Ref.
7.3 Und mit welchen Maßnahmen kann eine Webseite so gestaltet bzw. programmiert werden, dass sie in den Google- Suchergebnislisten weiter oben aufgeführt wird?
Bitte tragen Sie hier alle Möglichkeiten/Maßnahmen ein, die Sie kennen: Mit Hilfe folgender Maßnahmen: ... (offene Eingabe) Weiß ich nicht
[Wenn „Ja“ bei 7.1] Dient zur weiteren Ausdifferenzierung der SEO-Kenntnisstände (SEO nur als Begriff bekannt vs. auch SEO-Maßnahmen bekannt)
1
Infoblock „SEO/PSM“ (siehe Abschnitt 4.2.2.1) 10, Anpassungen durch: 9
VII
I)
Ken
ntn
isse
(U
nte
rsch
eid
un
g b
ezah
lt/o
rgan
isch
)
8.1 Kommen wir nun zu der ersten Google-Ergebnisseite. Existieren auf dieser Seite Suchergebnisse, auf die Einfluss genommen werden kann, indem Google dafür vom Website-Betreiber bezahlt wird?
Nein, es gibt auf dieser Seite keine Suchergebnisse, die durch Zahlungen an Google beeinflusst werden können Ja, auf folgende Suchergebnisse kann Einfluss genommen werden, indem dafür Geld an Google gezahlt wird: Klicken Sie bitte auf die entsprechenden Suchergebnisse
SERP-Screenshot aus Block I (A oder B) zum Markieren aller Anzeigen
3
8.2 Noch eine weitere Frage zu dieser Suchergebnisseite: Gibt es hierauf auch Suchergebnisse, auf die mit Hilfe von Suchmaschinenoptimierung Einfluss genommen werden kann?
Nein, es gibt auf dieser Seite keine Suchergebnisse, die durch Suchmaschinenoptimierung beeinflusst werden können Ja, auf folgende Suchergebnisse kann durch Suchmaschinenoptimierung Einfluss genommen werden: Klicken Sie bitte auf die entsprechenden Suchergebnisse
SERP-Screenshot aus Block I (A oder B) zum Markieren aller organischen Ergebnisse
1
8.3 Kommen wir nun zu unseren Fragen zur zweiten (und letzten) Google-Ergebnisseite. Existieren auf dieser Seite Suchergebnisse, auf die Einfluss genommen werden kann, indem Google dafür vom Website-Betreiber bezahlt wird?
Nein, es gibt auf dieser Seite keine Suchergebnisse, die durch Zahlungen an Google beeinflusst werden können Ja, auf folgende Suchergebnisse kann Einfluss genommen werden, indem dafür Geld an Google gezahlt wird: Klicken Sie bitte auf die entsprechenden Suchergebnisse
SERP-Screenshot aus Block II (C oder D) zum Markieren aller Anzeigen
3
8.4 Noch eine weitere Frage zu dieser Suchergebnisseite: Gibt es hierauf auch Suchergebnisse, auf die mit Hilfe von Suchmaschinenoptimierung Einfluss genommen werden kann?
Nein, es gibt auf dieser Seite keine Suchergebnisse, die durch Suchmaschinenoptimierung beeinflusst werden können Ja, auf folgende Suchergebnisse kann durch Suchmaschinenoptimierung Einfluss genommen werden: Klicken Sie bitte auf die entsprechenden Suchergebnisse
SERP-Screenshot aus Block II (C oder D) zum Markieren aller organischen Ergebnisse
1

Appendix 1: Questionnaire (German) F
Ab-schnitt
Nr. Fragestellung Antwortmöglichkeiten Ursprungsstudie
Antwortmöglichkeiten final (ggf. angepasst/übersetzt)
Begründung/ Erläute-rungen
Ref.
IX)
Ein
sch
ätzu
ng
un
d M
ein
un
g (S
EO)
9.1 Bitte denken Sie nun noch einmal an die eben erwähnte Suchmaschinenoptimierung. Wie stark ist aus Ihrer Sicht der Einfluss von Suchmaschinenoptimierung auf die Reihenfolge der Suchergebnisse bei Google?
Einfluss der Suchmaschinenoptimierung auf die Reihenfolge der Suchergebnisse bei Google: sehr starker Einfluss starker Einfluss mittlerer Einfluss geringer Einfluss kein Einfluss weiß ich nicht
1
9.2 Wie groß sind die positiven und negativen Auswirkungen bzw. Folgen von Suchmaschinenoptimierung auf Google- Suchergebnisse aus Ihrer persönlichen Sicht?
Bitte markieren Sie jeweils die zutreffende Antwort: Die positiven Auswirkungen der Suchmaschinenoptimierung empfinde ich als ... Die negativen Auswirkungen der Suchmaschinenoptimierung empfinde ich als ... sehr groß groß mittel gering nicht vorhanden weiß ich nicht
1
9.3 Welche positiven Auswirkungen bzw. Effekte hat Suchmaschinenoptimierung Ihrer Meinung nach?
Folgende Auswirkungen der Suchmaschinenoptimierung bewerte ich als positiv: ... (offene Eingabe) Kann ich nicht genau sagen
Frage an Internet-Nutzer, die große oder sehr große positive SEO-Effekte sehen
9
9.4 Welche negativen Auswirkungen bzw. Folgen hat Suchmaschinenoptimierung aus Ihrer Sicht?
Folgende Auswirkungen der Suchmaschinenoptimierung bewerte ich kritisch/negativ: ... (offene Eingabe) Kann ich nicht genau sagen
Frage an Internet-Nutzer, die große oder sehr große negative SEO-Effekte sehen
9
X)
Pe
rso
nal
isie
run
g
10.1
Wenn eine Suchmaschine Ihre Suchanfragen speichert und diese Informationen dafür verwendet, zukünftig die Suchergebnisse auf Sie anzupassen: Was denken Sie darüber?
- It’s a bad thing if a search engine collected information about your searches and then used it to rank your future search results, A: because it may limit the information you get online and what search results you see B: because you feel it is an invasion of privacy - It’s a good thing if a search engine collected information about your searches and then used it to rank your future search results, A: because it gives you results that are more relevant to you B: even if it means they are gathering information about you - Neither of these - Don’t know - Refused
Das sehe ich eher positiv Neutral Das sehe ich eher negativ Weiß ich nicht, keine Angabe
6, Anpassungen durch: 9
10.2
Und haben Sie schon einmal Maßnahmen ergriffen, um die Menge der Daten zu begrenzen, die Suchmaschinen über Sie sammeln? Falls ja: Welche?
- Changed your browser settings - Deleted your web history - Used the privacy settings of websites - Yes - No - Don’t know
Bitte markieren Sie alle zutreffenden Antworten: Vergangene Aktivitäten gelöscht (z.B. Suchverläufe) Speicherung zukünftiger Aktivitäten deaktiviert (z.B. Suchanfragen)
6, Anpassungen durch: 9

Appendix 1: Questionnaire (German) G
Ab-schnitt
Nr. Fragestellung Antwortmöglichkeiten Ursprungsstudie
Antwortmöglichkeiten final (ggf. angepasst/übersetzt)
Begründung/ Erläute-rungen
Ref.
- Refused Ermittlung meines Standorts deaktiviert Auslieferung personalisierte Werbung deaktiviert Andere Maßnahmen Nein, noch nicht - es war mir aber bekannt, dass das möglich ist Nein - mir war bisher nicht bekannt, dass das möglich ist
XI)
Nu
tze
rpro
fil
11.1
Auf welche Weise nutzen Sie Suchmaschinen?
Bitte markieren Sie jeweils die zutreffende Antwort: Indem ich meine Suchanfrage eintippe Indem ich meine Suchanfrage per Spracheingabe übermittle häufig gelegentlich selten nie weiß ich nicht
10
11.2
Wie lange nutzen Sie das Internet in einer normalen Woche in etwa?
- Skala von 1-7 (Tagen pro Woche)
Bitte geben Sie die durchschnittliche Anzahl der Stunden pro Woche an: Bis unter 3 Stunden pro Woche 3 bis unter 6 Stunden pro Woche 6 bis unter 10 Stunden pro Woche 10 bis unter 20 Stunden pro Woche 20 bis unter 30 Stunden pro Woche 30 bis unter 40 Stunden pro Woche 40 und mehr Stunden pro Woche Weiß ich nicht
4, Anpassungen durch: 9
11.3
Welcher der folgenden Tätigkeiten gehen Sie hauptsächlich nach?
- in Ausbildung bzw. Studium - berufstätig - nicht oder nicht mehr berufstätig
Angestellte/r oder Beamte/r Selbstständige/r, Freiberufler/in, Unternehmer/in Schüler/in Auszubildende/r, Lehrling Studierende/r Hausfrau/-mann Gelegentlich berufstätig Nicht oder nicht mehr berufstätig Sonstiges
7, Anpassungen durch: 9
11.4
Welche der folgenden Bereiche spielen bei Ihrer beruflichen Tätigkeit eine Rolle?
Bitte markieren Sie alle zutreffenden Antworten: Einkauf, Beschaffung, Logistik Finanzen, Controlling Marketing, Verkauf, Vertrieb IT, EDV Digitalisierung, Internet E-Commerce, Online-Handel Online-Marketing, Social Media Produktion, Fertigung Recht Keine davon
Frage an berufstätige Internet-Nutzer. Prüfung, ob Personen mit „SEO-nahen“ Berufe andere Perspektive auf SEO haben.
2
11.5
Welche der folgenden Themen gehören zu Ihrer Ausbildung / Ihrem Studium?
Bitte markieren Sie alle zutreffenden Antworten:
Frage an Internet-Nutzer, die noch in
2

Appendix 1: Questionnaire (German) H
Ab-schnitt
Nr. Fragestellung Antwortmöglichkeiten Ursprungsstudie
Antwortmöglichkeiten final (ggf. angepasst/übersetzt)
Begründung/ Erläute-rungen
Ref.
Betriebs- oder Volkswirtschaftslehre Informatik, Wirtschaftsinformatik Technik, Elektrotechnik Digitalisierung, Internet E-Commerce, Online-Handel Online-Marketing, Social Media Recht Pädagogik Sozialwissenschaften Keine davon
der Ausbildung sind. Prüfung, ob Personen mit „SEO-nahen“ Themen in Ausbildung/Studium andere Perspektive auf SEO haben.
11.6
Und welchen höchsten Schul-/Bildungsabschluss haben Sie?
- kein - Hauptschulabschluss - mittlere Reife - Hochschulreife - Hochschulabschluss
Hauptschule/Volksschule ohne abgeschlossene Lehre Hauptschule/Volksschule mit abgeschlossener Lehre Mittel-/Real-/Fach-/Handelsschule ohne Abitur Abitur/Hochschulreife Abgeschlossenes Studium Ohne Schulabschluss (Noch) ohne Schulabschluss (z.B. Schüler) Anderen
7, Anpassungen durch: 9
Herkunft der Fragestellungen: 1: Projektantrag, 2: Experteninterviews, 3: (Lewandowski, 2017), 4: (Stark et al., 2014), 5: (Schweiger, 2003), 6: (Purcell et al., 2012), 7: (Lewandowski & Sünkler, 2013), 8: (Schultheiß & Lewandowski, 2020a), 9: Marktforschungsunternehmen Fittkau & Maaß, 10: Projektteam