RCAPS Working Paper Series
47
RWP-17003 How to conduct effective industrial policy: a comparison of automotive development in the Philippines and Indonesia October 23, 2017 John THOBURN School of International Development University of East Anglia, UK and Kaoru NATSUDA College of International Management Ritsumeikan Asia Pacific University, Japan RCAPS Working Paper Series Ritsumeikan Center for Asia Pacific Studies (RCAPS) Ritsumeikan Asia Pacific University (APU) URL: http://www.apu.ac.jp/rcaps/
-
Upload
khangminh22 -
Category
Documents
-
view
0 -
download
0
Transcript of RCAPS Working Paper Series

RWP-17003
How to conduct effective industrial policy:
a comparison of automotive development in the Philippines and
Indonesia
October 23, 2017
John THOBURN
School of International Development
University of East Anglia, UK
and
Kaoru NATSUDA
College of International Management
Ritsumeikan Asia Pacific University, Japan
RCAPS Working Paper Series
Ritsumeikan Center for Asia Pacific Studies (RCAPS)
Ritsumeikan Asia Pacific University (APU)
URL: http://www.apu.ac.jp/rcaps/

1
How to conduct effective industrial policy:
a comparison of automotive development in the Philippines and Indonesia
by
John THOBURN
School of International Development
University of East Anglia
Norwich NR4 7TJ, UK
and
Kaoru NATSUDA
College of International Management
Ritsumeikan Asia Pacific University
Beppu, Oita 874-8577, Japan

2
How to conduct effective industrial policy:
a comparison of automotive development in the Philippines and
Indonesia
ABSTRACT
Compared to the recent successes of Indonesia, Philippines vehicle production has faced
severe problems of lack of economies of scale and a weak domestic supply base, as well as
strong import competition, including from illegally imported used cars. Although at first sight
there have been many similarities in industrial policies towards the automotive industry in the
two countries, we identify various inconsistences and problems of implementation in the
Philippines, which, unlike Indonesia since the late 1990s –at the time considered a failure -
has not succeeded in developing vehicle exports. Although now the Philippines is starting to
see the sort of growth in vehicle ownership that is currently well underway in Indonesia, it will
have to struggle under its new CARS policy to stop the growth in the market simply being met
by more imports.
KEY WORDS: Philippines, Indonesia, motor industry, automotive, industrial policy
JEL CLASSIFICATION: F13, F23, L62, O25
1. Introduction
In the early years after the Second World War, active industrial policy – in the sense of
government intervention to promote dynamic structural change faster than market forces alone
would do (Rodrik 2004; UNIDO 2013, ch.7) - was widely accepted as necessary for national
3
economic development. Later, in the 1980s and 1990s, industrial policy fell out of favour
during the dominance of neoliberal ‘Washington consensus’ ideas of free market
fundamentalism. Industrial policy now is ‘back on the agenda’ (Weiss 2016), and was given a
boost by the need for policy interventions following the 2008-9 world recession (Stiglitz et al
2013), with debates about how far static comparative advantage should be defied in the interests
of long-run development (Chang 2013). The automotive industry has been widely regarded by
governments of developing countries as a desirable progression from more traditional, labour-
intensive industries such as textile production towards activities incorporating higher
technology and more advanced labour skills. In this sense it is an example of developing
countries following a pattern of structural change mapped out by already more developed
countries (Altenburg and Lütkenhorst 2015, 178). However, as Chang (2013: 40-42) has noted
with regard to the Korean and Japanese automotive industries, the success of industrial policy
may depend more on its detailed provisions than on the extent to which the promoted industry
deviates from the country’s comparative advantage.
To examine the impacts of industrial policy, we take the case of two countries who automotive
industries were seen to have serious problems in the 1990s, but where one (Indonesia) appears
to have surmounted many of its difficulties, whereas the other (the Philippines) has not,
although it has had some success in developing exports of components. Our focus here is on
‘hard’ industrial policies such as local content requirements as part of ISI, rather than ‘soft’
ones like those relating to science and technology or human capital development.1
The Philippines’ economy has been widely seen as less successful than those of neighbouring
countries like Malaysia and Thailand, as their per capita income statistics suggest (Table 1).
After several centuries of Spanish colonial rule, Philippines is sometimes perceived as an

4
‘honorary’ Latin American country that happens to be located in South East Asia. Fforde (2009,
161) has described the economy’s overall policy performance as ‘intention without success’;
although its recent growth rates have not been lagging behind its Southeast Asian neighbours’
(Table 1).
Indonesia has had its problems too: not only is its national income per capita broadly similar
to that of the Philippines, but also the Indonesian motor industry up to the late 1990s was
described in an influential paper as an example of ‘how not to industrialize’ (Aswicahyono,
Basri, and Hill 2000). Since the late 1990s, though, the Indonesian motor industry has been
expanding fast. Now (2016 figures), the physical total vehicle output of Indonesia is almost
nine times higher that of the Philippines, even though Indonesia’s total market size (in terms
of national income) is only 2.4 fold more than the Philippines’ (at market exchange rates) or
only three-fold more real purchasing power (national income at purchasing power parity
exchange rates) (Tables 1 and 2).
Yet back in the mid-1970s the Philippines had as large a vehicle output as Malaysia (each
around 51,000 vehicles), and larger than Thailand’s (31,981 in 1975). The Philippine’s output
was only two thirds that of Indonesia (75,570 in 1976), although that is unsurprising given
Indonesia’s much larger population.
Why has Indonesia’s automotive industry been so much more successful in recent years than
that of the Philippines? What have been the differences in industrial policies between the two
countries, both in design and implementation, and what can we learn of industrial policy
making from these experiences? What other circumstances have made the Indonesian
automotive industry grow faster and export more, while the Philippines has lost much of its

5
domestic market to imports? To answer these questions this paper will trace automotive
developments from their early phases of import-substituting industrialisation (ISI) to the later
liberalisations, both before and after the WTO’s (World Trade Organization) post-2000
restrictions on trade-related industrial policy measures. Like most developing countries except
the two with the largest potential domestic markets2 – India and China - both the Philippines
and Indonesia have automotive sectors dominated by transnational automotive assemblers.
These assemblers, in the case of both Indonesia and (to an only slightly lesser extent) the
Philippines, are now overwhelmingly Japanese. Industrial policy, then, has to work in a context
where a principal aim has to be to influence the activities of these multinational assemblers,
and also their major component suppliers, often themselves large multinationals.
This paper is based on fieldwork in Indonesia in 2013 and in the Philippines in 2014 and 2015,
supplemented and updated by a wide variety of sources both in English and in Japanese. The
comparison follows on from our country studies of Thailand (Natsuda and Thoburn 2013),
Malaysia (eg Natsuda et al 2013), Indonesia (Natsuda et al 2015) and the Philippines (Natsuda
and Thoburn forthcoming), and our comparison of policies in Thailand and Malaysia (Natsuda
and Thoburn 2014).
[Tables 1 and 2 about here]
2. Automotive industrialization policy issues
Changing policy frameworks

6
In the early post-war period, ISI policies typically were used to promote automotive production
in developing countries. Although as much a trade policy as an industrial policy, ISI policies
were seen as more effective than direct industrial intervention (eg by offering subsidies to
desirable activities) because they seemed easy to apply and generated tax revenue rather than
incurring governments expenditure (Thoburn 2016). Both the Philippines and Indonesia, like
most developing countries, started their automotive industrialisation with assembly, importing
kits of components (CKD – completely knocked down kits) and assembling these CKDs into
CBUs (completely built-up vehicles).
Starting with vehicle assembly while importing components avoids one of the main market
failures in developing countries – coordination failure - where the private sector finds it
difficult to set up many necessarily complementary activities simultaneously (Altenburg and
Lütkenhorst 2015, 6-7). It has the advantage too that countries gradually can substitute local
production of components in place of imports, and since vehicles typically have thousands of
individual parts, there is a wide choice of where to start. In this way, the local content (LC) of
production can be increased. ISI policies in the past often have been accompanied by explicit
LC requirements (LCRs), sometimes backed by policies of mandatory deletion (MD) - where
specified components must be deleted from imported CKD kits so that local production can
take the components’ place. In other words, vehicle assembly can be a rich source of backward
linkages, although such linkages, when promoted by policy, do not necessarily become
internationally competitive (Thoburn 1973). However, since the early 2000s, trade-related
investment measures (TRIMS) such as LCRs and MD provisions have been banned under
WTO rules, though some countries, such as Thailand, have found ways of legally
circumventing them to maintain some ‘policy space’ in which to operate (Natsuda and Thoburn
2014).

7
Component production may not necessarily be undertaken by local firms but by inward foreign
investors, often global ‘mega-suppliers’ (Humphrey and Memedovic 2003). These suppliers,
as originally in Japan (Thoburn and Takashima, 1992, ch.5), help to organize the production
of suppliers in the lower tiers, and nowadays supply modular parts (eg car seat assemblies
rather than just the seats), which increases their power over lower tiers. Particularly with
Japanese assemblers, there is a pattern of ‘follow sourcing’, whereby first tier suppliers follow
the assemblers to new locations. As Wad (2010, 5) notes, when large suppliers of components
move into a developing country, they may push such existing locally owned first tier suppliers
as there are down into lower tiers, or out of business altogether.
The Automotive Global Value Chain, and the position of ASEAN
Global value chains (GVCs) refer to the organization of an industry from production to final
consumption, with particular stress on who controls (exercises ‘governance’ over) them and
how that control is organised. GVCs are now a widely familiar concept – set out more fully in
several of our earlier papers on the automotive sector - but still very useful as the theoretical
background for our purposes. 3 In a recent contribution, indeed, Milberg et al (2014) argue that
‘managing’ the GVCs through which much of developing countries’ exporting takes place is
one of the major tasks of industrial policy, particularly with respect to the upgrading of local
firms.

8
In the automotive industry, the GVC is normally seen as ‘producer-driven’, with governance
coming from the giant multinational motor companies like Toyota or Volkswagen who
dominate the industry, although the multinational component mega-suppliers like Denso from
Japan or Bosch from Germany also exercise governance over lower tiers of suppliers, as
indicated above, in association with the needs of the multinational assemblers.
The other principal concern of GVC studies – the upgrading of products, processes and
functions – is of less interest in automotive assembly in the sense that the multinational motor
companies who dominate, and a high proportion of the first-tier suppliers, already embody
world best-practice. In practice their main concern is how to achieve economies of scale, the
main driver of costs in the industry.4 Assemblers and mega-suppliers do, however, need to
adapt to the environment of developing countries and grow their supply chains, helping
domestic lower-tier firms to upgrade, especially in the context of LC requirements and MD
policies.
Events in the automotive industries in the Philippines and Indonesia need to be viewed in the
context of changes in the automotive GVC, particularly as they affect ASEAN – the
Association of South East Asian Nations - and other Asian countries. The relocation of
automotive production from developed countries to developing and transitional economies can
be seen in Table 2, particularly the dramatic increases in output in China and India since 2000.
In ASEAN, production by Thailand rose almost five-fold and in Indonesia by four-fold.
Malaysia, ASEAN’s least successful automotive performer (Natsuda, Segawa and Thoburn
2013) besides the Philippines,5 still had an output in 2016 almost four times more than that of
the Philippines. Japan’s domestic output has stagnated, but production has been located to other
Asian countries, with foreign investment by Japanese companies being the principal driver of

9
ASEAN’s increased automotive output. In 2012 the production volume of Japanese
automotive companies operating overseas was about 1.5 times greater than their output within
Japan (Aoki 2015, 83).
Underlying the global relocation of vehicle production is the slow growth in demand in the
USA, Japan, and the richer parts of Western Europe resulting from the maturity of their markets,
where vehicle ownership per unit of population is already high (Table 3) and the main source
of sales is replacement purchases. Producers have sought to move production to countries
where demand is growing, and where lower wages are an added attraction. 6
[Table 3 about here]
3. Overview of relative automotive performance and structure in the Philippines and
Indonesia
Production and Sales
Figures 1 and 2 show the performance of the two countries in terms of output, with Indonesia’s
total output some fifteen times more in 2014. Falls in Indonesian automotive output and sales
in 2014-15 due to the ending of fuel subsidies and some general growth slowdown,7 while the
Philippines output was growing, reduced the difference to ten-fold in 2015.8 The excess of
Indonesian production over that of the Philippines is quite long-standing: by 1990 Indonesia’s
annual output had risen to over 200,000 vehicles, while that of the Philippines was below
150,000 even at its all-time peak in 1996.

10
[Figures 1 and 2 about here]
In the Philippines, Toyota alone accounts for nearly half of total output, and other assemblers
include Nissan, Mitsubishi and Honda. Ford used to produce in the Philippines but left in 2012
relocating to Thailand. In Indonesia, Toyota together with its associated company Daihatsu
holds over half of production (Figure 3).9
[Figure 3 about here]
In terms of sales in Indonesia, major Japanese brands account for around 90%, while in the
Philippines the Korean brand Hyundai and also Ford have significant minority shares (Figures
4 and 5).
[Figures 4 and 5 about here]
Import Penetration
A clearly observable feature of the Philippines performance in Figure 1 is the stagnation of
total vehicle production below 100,000 units on the graph from 1997, below its 1996 peak
before the 1997 Asian crisis, from which production never fully recovered. In contrast to
production, sales in the Philippines recovered fairly quickly after the crisis, and the growing
excess of vehicle sales over production indicates growing net imports. 10 In the case of
Indonesia (Figure 2), growth in sales is matched by growth in total production; this does not
mean, though, that all domestic production is consumed locally – rather that vehicle imports
and exports are balanced.

11
Export Performance
Figure 6 shows the Philippines’ exports since 1997. While passenger vehicle exports (HS 8703)
are very small, and commercial vehicle exports (HS 8704) are negligible, exports of parts and
accessories (HS 8708) in 2016 were about $1.3 billion, making up almost the whole of the
country’s total automotive exports (HS 87), though wiring harnesses (HS 854430) – classified
under electrical (HS85) rather than automotive (HS87) in the trade data - were an additional $2
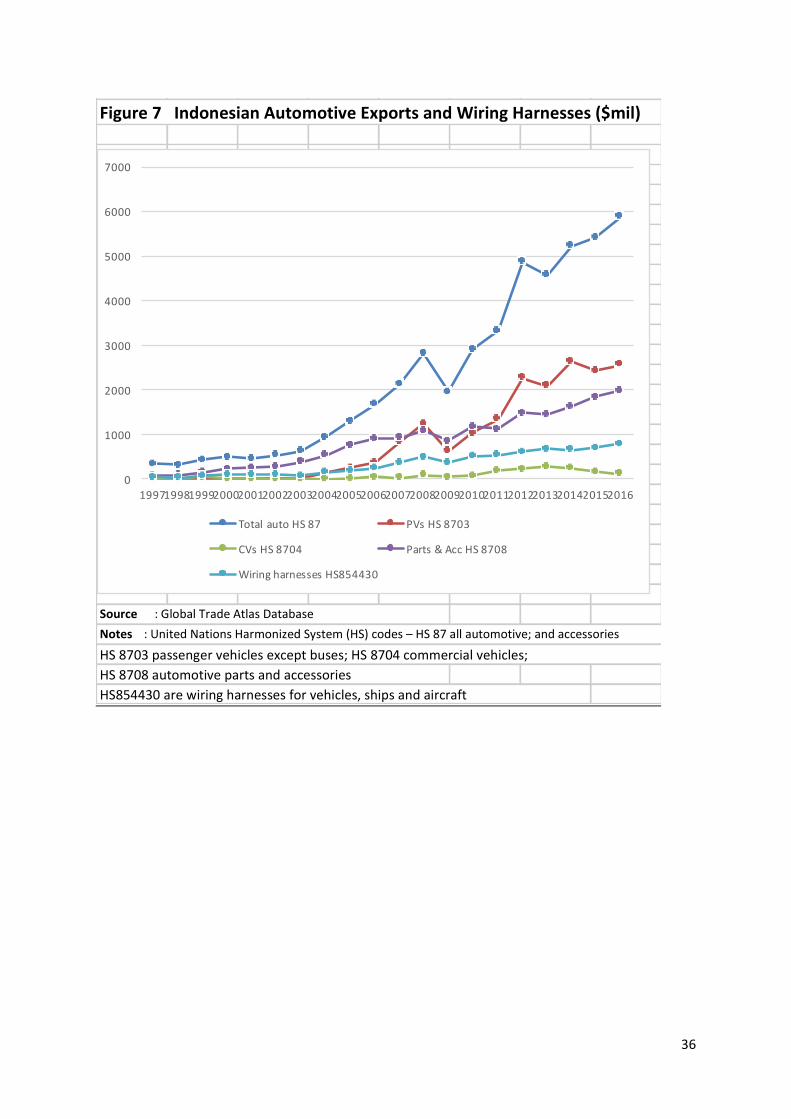
billion.11 The Indonesian export picture is rather different (Figure 7). In 2016 Indonesia’s
exports of parts and accessories (HS8708) of about $1.5 billion were a little larger as those of
the Philippines and it also had wiring harness exports of almost $0.8 billion, but its passenger
vehicle exports were even larger - generating total automotive exports (including wiring
harnesses) of nearly $7 billion
[Figures 6 and 7 about here]
Structure of the automotive industries
Table 4 shows the number of assemblers and parts suppliers, together with total employment.
While the number of assemblers in the Philippines12 is the same as Malaysia, and fewer than
Thailand, Indonesia or Vietnam, it is telling that the Philippines’s automotive output, as we
have seen, is so much lower than the other main producers in ASEAN (i.e. excluding Vietnam),
indicating the Philippines’ problems of achieving economies of scale in production.
Interestingly, although the Philippines has some successful exporters of parts and accessories,
the number of automotive suppliers is less than all of the other ASEAN automotive producers,
and strikingly less than Thailand’s. Also, one interviewee in Manila commented that the
structure of suppliers is unlike the pyramidal shape of the other main ASEAN producers (eg

12
Thailand’s – see Natsuda and Thoburn 2013, 418), in that the third tier of suppliers is relatively
underdeveloped.13
[Table 4 about here]
4. The origins of automotive industrialisation policies in the Philippines and Indonesia
This section traces the development of policies in the two countries using the 1997 Asian
financial crisis as a watershed, which had particularly severe effects in Indonesia. Significant
policy changes also occurred in both countries under the post-2000 new WTO policy regime,
covered in the next section.14
Drivers of policy change
While policies are partly driven by outside changes in development thinking – particularly the
later moves from ISI towards economic liberalisation – they also can be driven by local political
forces and special interests. Interestingly, both in the Philippines particularly under the Marcos
regime (1966 - 1986) and in Indonesia particularly under President Soeharto’s ‘New Order’
(1967-1998), an apparently disinterested group of technocrats was politically influential in
shaping policy, although subject to periodic opposition (Fforde 2009, ch.11; Hill 2000).
Different ministries too may have different policy agendas. Fforde (2009, ch.11) is of the
opinion that the policy agenda in the Philippines had little interaction with local politics, being
driven mainly from the outside, but that state capacity was weak and policy makers were unable
to learn pragmatically from mistakes. For Indonesia, Hill (2000, 98) argues that the
effectiveness of the state under Soeharto was considerable, not only in terms of fiscal authority

13
but in terms of regulatory reach. Corruption and nepotism in Indonesia, most particularly
among the Soeharto family, was a problem, as we shall see, affecting the automotive industry
in the failed national car project. There was also spectacular corruption and nepotism under
Marcos, but effects on the motor industry were less obvious.
Import substitution and partial liberalisation in the Philippines before the 1997 crisis 15
Like Malaysia and Thailand (Natsuda and Thoburn 2014), the automotive industry in the
Philippines was set up as part of ISI policies in the 1950s designed in part to save foreign
exchange. A ban on the commercial import of CBU vehicles was imposed.16 A variety of
assemblers, including some joint ventures between local firms and foreign multinationals,
established themselves. By 1968 there were 29 assemblers for a domestic market of only
around 10,000 vehicles, and some sixty models were being produced (Aldaba 1997, 3) - a
situation where it was virtually impossible for any assembler to achieve economies of scale.
The country’s first explicit, comprehensive policy relating to the automotive industry dates
from 1971 with the Progressive Car Manufacturing Programme (PCMP). This continued the
ban on CBU imports, and introduced LCRs hoping to achieve 60% local content by the mid-
1970s. To tackle the overcrowding in the industry, the right to import CKD kits was limited to
five assemblers. Programmes for the local manufacture of trucks and truck engines were also
initiated (Natsuda and Thoburn forthcoming). Interestingly, and importantly, the PCMP also
included requirements for assemblers to generate some of the foreign exchange necessary for
them to import CKD kits. This policy - later to be banned (along with LCRs) under WTO’s
TRIMS - saw the beginnings of the Philippines’ main automotive success, the exports of
vehicle components. Major assemblers in the Philippines including Toyota, Mitsubishi, Nissan
and Ford established component production, particularly of transmissions, for export on a

14
regional basis. This was a time when there was some degree of instability in other countries in
the region, including the war in Vietnam; the Philippines seemed relatively more attractive than
it does now.17
In terms of the encouragement of LC, Aldaba argues that the PCMP policy was a failure:
although LC rose from 34 % in 1978 to 43% in 1983, the indirect import content was extremely
high, much component production was undertaken in-house by the assemblers, and there were
few purchases from local component manufacturers (Aldaba 1997, 4). However, the number
of parts manufacturers did rise somewhat over the 1970s (Ofreneo 2008, 69).
Automotive policy in the early 1980s was sharply interrupted by recession associated with the
international debt crisis following the OPEC oil price rises in 1978-79, and severe shortages of
foreign exchange. The period 1983-86 also saw political upheaval in the Philippines,
culminating in the departure from power of President Ferdinand Marcos. Following the
assassination of the major political opposition figure Benigno Aquino in August 1983, widely
blamed on Marcos, it is said that several foreign motor companies took fright: Ford, GM and
Toyota left the Philippines, with only Mitsubishi and Nissan among the major manufacturers
remaining,18 though Toyota mothballed its plant (Ofreneo 2008, 70) but subsequently returned.
By the end of the recession local car annual production and sales has fallen to less than 4,000
units (Figure 1).
Under the new Aquino government, policy to boost the industry after the recession was set out
in the 1987 Car Development Programme (CDP). The ban on CBU imports was continued.
There was a limitation of the assemblers in the industry to only three – joint ventures involving
Mitsubishi, Nissan and Toyota. CDP also required participants to earn 50% of their own foreign

15
exchange needs for CKD imports, continuing the incentive to export components produced
under the country’s LCRs. LCRs and foreign exchange earning requirements were also a part
of the subsequent and short-lived People’s Car programme started in 1990, for production of
small, low-priced cars. CDP participants had to produce small cars before being allowed to
enter into the production of larger vehicles. Limitations on the number of assemblers were
lifted as part of the Foreign Investment Act of 1991 (Ofreneo 2008, 71).
Liberalisation of a sort started in the industry in the mid-1990s, when the ban on the commercial
importation of CBU vehicles was finally lifted in 1995. However, the tariff then applied on
CBUs was 40%, which, though the lowest tariff on vehicles in ASEAN (Aldaba 1997, 33),
when combined with a mere 3% on CKD imports, gave higher effective rates of protection
(protection on value added).19 Indeed, Aldaba’s (1997, 22-23) calculations of ERPs for four
major (unnamed) assemblers indicated that the value-added generated by local assembly was
negative when valued at world prices. That is, it cost more to import and assemble the
components than it would have cost to have imported the complete vehicle. For a sample of
car and commercial vehicles it was estimated that in 1995 the cost of locally produced
passenger cars and light commercial vehicles ranged from between 2.37 and 3.68 times more
than the same vehicle could be imported from Japan (Aldaba 1997, 24) – at such levels of cost,
even a nominal tariff of 40% would not have been effective at discouraging imports. Later
work by Aldaba (2008, 22) comparing costs in Philippines and Thailand, suggested that costs
(net of tariffs and taxes) in the Philippines were approximately 1.4 times higher than in
Thailand.
Underlying the Philippines’ low level of efficiency were two main factors: low scales of
production and the high cost of local inputs. Of the 11 assemblers in the mid-1990s, only four

16
had capacities of over 10,000 units annually. Local components included some produced by
multinational assemblers or their offshoots, and some other Japanese suppliers, but in the lower
tiers of production there were many small and medium enterprises (SMEs) with low levels of
technology and efficiency (Aldaba 2000,1; Aldaba 2007, 41).
In these circumstances, the government’s plan – before the 1997 financial crisis came on to the
horizon – was to implement in 2004 a uniform 4% tariff (in the event, 5%) on both CKD kits
and CBU vehicles under the ASEAN Free Trade Area (AFTA), which would greatly reduce
the assemblers’ effective protection. This was viewed by the industry with foreboding. There
was a sense that the major multinational assemblers might think it might be better to work
towards importing more of their vehicles to sell locally, not producing them in the Philippines
(Aldaba 1997, 27, 34).
Import substitution and partial liberalisation in Indonesia before the 1997 crisis
Notionally the assembly of vehicles in Indonesia dates back to long before the Second World
War, when US General Motors started production in 1928 assembling kits. However, the ‘kits’
simply were vehicles split into two parts, hardly ‘assembly’ in the normal sense of the word.
Annual output by GM in its 1928 venture was only 6,000 vehicles (Sato 1992), and proper
assembly of CKD kits did not start until after the Second World War (Witoelar 1983, 18).
After the Second World War, and political independence in 1949 under the nationalist
government of President Sukarno, the GM plant was taken over by a state company, with GM
leaving the country in 1955. Subsequently the GM plant was bought by a private company, but
in the 1960s production was only around 2,000 vehicles (Hansen 1971). Production expanded

17
after the military takeover in 1967 by General Soeharto, which opened the economy to foreign
investment. Local (often ethnic Chinese) businesses formed joint ventures with multinational
automotive companies, including Toyota (Doner 1991). Import substitution policies started
with a progressive ban on CBU imports, region by region, from 1969, which had become
nationwide by 1974 (Sato 1992, 340-341). In 1976, a MD policy was introduced to increase
LC for commercial vehicles (Aswicahyono et al 2000, 215). Japanese producers made
investments in local component production, such as engines, but the smaller number of
European and American producers found it more difficult to comply (Chalmers 1994).
As in the Philippines, some liberalisation occurred in the 1990s. The ban on importing CBUs
was lifted in 1993 as part of policy deregulation measures which also gave tax and import tariff
incentives for increased localisation of components. The MD programme was abandoned and,
instead, assemblers had choice about what to localise (Aswicahyono et al 2000).
The 1990s also saw Indonesia attempting to establish a short-lived and unsuccessful
programme to produce a national car, as a joint venture involving a company of a son of
President Soeharto and the Korean automotive producer Kia (Hale 2001). To start, the ‘national
car’ was imported from Kia in Korea, given a Timor brand name and, with its tax and tariff
exemptions, sold for about half of the price of a similar Toyota model. As a result, there were
protests to the WTO by Japan, the EU, and the US under TRIMs and SCMs (Subsidies and
Countervailing Measures) provisions (Nomura 2003, 47, 54–55). The national car company,
then ordered by the government to repay its tax and tariff exemptions, went bankrupt in 2001.
The 1997 and 2008 financial crises and the automotive industries of the Philippines and
Indonesia20

18
As shown in Figures 1 and 2, the 1997 Asian financial crisis hit both countries’ automotive
production very hard, especially Indonesia, as it also did in Thailand where the crisis originated
(Natsuda and Thoburn 2013). In the Philippines vehicle sales between 1996 and 1998 more
than halved, and vehicle production fell to less than a third. In Indonesia, both sales and
production in 1998 were less than a fifth of their 1996 level. In the Philippines sales recovered
gradually, not reaching the 1996 peak until the end of the 2000s, and production fluctuated
around only half of the country’s 1996 peak production as import penetration rose steeply in
the 2000s. What is also striking from the diagrams is that Indonesia’s production and sales had
both recovered by the early 2000s and then – apart from relatively small troughs in 2006 and
again after the 2008 financial crisis - grew rapidly in tandem, indicating no rise in net imports.
As Figure 6 shows, the Philippines’ automotive exports, consisting almost entirely of
components, rose steadily from around $500 million in 1997 to over $2 billion by 2008 at the
2008 world financial crisis. though with a substantial short-term dip thereafter. After a brief
recovery they were down to $1.3 billion in 2015-16. However, exports of wiring harnesses -
mainly for vehicles but classified in the trade data, as noted earlier, as electrical rather than
automotive products - rose through the 2010s reaching $2 billion.
Stimulated originally by the Philippines government’s requirements for assemblers to earn part
of their own foreign exchange for component imports, automotive component exports
continued to increase despite these requirements being outlawed by the WTO from the 2000s
(see next section). Exports of vehicles, though, remained negligible.
In Indonesia (Figure 7), in contrast, total automotive exports rise to about $1 billion for the first
time in 2004, and the total had reached the almost $6 billion level by 2016 (or not far below

19
7$ billion if wiring harnesses are included). Vehicle exports (mainly passenger cars) generated
nearly half the total automotive export earnings (excluding wiring harnesses). If wiring
harnesses are added, total vehicle component exports from the Philippines ($3.3 billion) were
a little larger than Indonesia’s ($2.8 billion), although ordinary automotive component exports
(HS 8708) from the Philippines have fallen somewhat in the 2010s.
While the Philippines automotive components exports (HS8708) rose steadily in the period
between the 1997 and 2008 crises, the exports of both components and vehicles from Indonesia
appear to grow only following the post-2004 implementation of AFTA tariff cutting in the
member countries. In Indonesia, despite a massive depreciation of the Indonesian rupiah during
the 1997 crisis, it is hard to see any sharp stimulus to exporting of the sort experienced in
Thailand when Thailand’s producers faced a depressed domestic market after 1997 (Natsuda
and Thoburn 2013, 427).
5. Trade liberalisation under the WTO and AFTA in the 2000s and beyond
In the Philippines, tariffs21 on passenger vehicles were reduced from 40% in the early 1990s to
30% in 2000, and were still at 30% in 2004 when the tariff applying to intra-ASEAN trade
under AFTA was reduced to 5%, and to zero in 2010. LCRs were abandoned in 2003 under
WTO-TRIMs (Aldaba 2008, 6) and foreign exchange balancing requirements – the
requirements in the Philippines for assemblers to earn part of their own foreign exchange to
import CKD kits – had also been abolished by then (Natsuda and Thoburn forthcoming). In
2002 the Philippines’ tariffs both on passenger cars, commercial vehicles and on their CKD
kits were already the lowest (with one minor exception)22 among the four main ASEAN
automotive producers (Ofreneo 2008, 73). Nevertheless, as Figure 1 clearly shows, the gap

20
between total sales and total production of vehicles - indicating net imports – only started to
widen sharply from 2004, when the tariff on intra-ASEAN trade was reduced to 5%, and to
widen still further once AFTA tariffs fell to zero in 2010.
Indonesia also reduced its import duties on imports from ASEAN to between zero and 5% in
2003-2004 (Natsuda et al 2015a, 65), whilst maintaining MFN tariffs of 45-80% on passenger
cars and 40- 45% on commercial vehicles (Ofreneo 2008, 73). However, unlike the Philippines
after the onset of the AFTA tariff reductions, net vehicle imports into Indonesia did not rise
and in most years were zero (with imports matching exports), while when domestic sales fell
in 2014, production rose to generate net exports (Figure 2). These differences in relative trade
performance do not appear to have been driven by any changes in the two countries’ relative
exchange rates.23 Under pressure from the International Monetary Fund (IMF) after borrowing
from them following the 1997 financial crisis, Indonesia abandoned its LCRs.
6. Escaping from difficulties
The difficulties
The widely-cited study by Aswicahyono et al (2000) of Indonesian automotive development
up to the late 1990s as an example of ‘how not to industrialize’ focuses on several features of
the industry. These included the large number of assemblers and models in relation to the then
size of the market, with the resulting failure to achieve economies of scale. They contrast this
with the country’s more efficient motorcycle industry based on a larger market and much
smaller number of assemblers. They also highlight the high levels of trade protection - Hill
(2000, 114) cites ERPs on motor vehicles in Indonesia in the late 1980s of between 499% and
600% - with its associated rent-seeking, political influence and corruption in the years up to
the 1997 crisis. They comment unfavourably that the industry has exhibited what they call

21
‘back to front’ industrialisation. That is, assemblers have set up in business using largely
imported components, whereas a better way, they say, would have been to develop component
production first and delay assembly until there was a better supplier base. Most of these
criticisms also could be applied to the Philippines – many assemblers and models in a small
market, high levels of protection at various stages in the industry’s development, and a ‘back
to front’ starting method.
With regard to the ‘back to front’ approach of both countries - and leaving aside that this is
how most developing countries have started their motor industries - a ‘components first’
approach has some problems. Although the local production of some components, such as tyres
or batteries, could be started for the replacement market for imported vehicles, most major
components are not usually replaced during a vehicle’s life. Some components, such as engines,
have even larger economies of scale than assembly (Natsuda et al 2015a, 48), and so must rely
on exports, although there are many components which are not subject to large economies of
scale (Rasiah 2007, 65). Both Indonesia and the Philippines have developed component exports.
In the Philippines case their output is far too large to be absorbed by the motor industry, whose
production has remained small. For example, the wiring harnesses produced by Yazaki-Torres,
founded in 1973, are said to be enough for nearly a million vehicles, and only about 5% of this
output is sold within the Philippines.24 Successful production of a limited range of components
is no guarantee of developing a successful automotive assembly industry. Thus, Taiwan, one
of the Asia’s most successful exporters of components, has small and stagnating vehicle
production (Table 2). In 2016 Taiwan exported components (HS 8708) of US$3.9 billion, but
passenger vehicles (HS 8703) of only $873 million and commercial vehicles (HS 8704) of only
$23 million. 25
22
In our interviews in the Philippines a striking feature was the widespread belief that the
Philippines had liberalized its trade regime prematurely, while other ASEAN countries had
maintained protection on their automotive sectors and resisted the degree of import penetration
experienced by the Philippines. This point also has been put forcibly with regard to the
Philippines economy as a whole by Ofreneo (2015). He argues that the Philippines switched
from ISI policies towards export oriented one during the period from the late 1970s to the 1990s
under pressure from the International Monetary Fund and from the World Bank’s structural
adjustment programmes (SAPs); though Fford (2009, 165) claims this was resisted in the late
1970s by the Filipino technocrats. Ofreneo also criticises the Philippines for opening its
economy without making serious attempts at industrial upgrading, although some authors
argue there has been little upgrading even in Thailand, ASEAN’s most successful automotive
exporter (Doner and Wad 2014; Lauridsen 2009).
What evidence is there that the Philippines opened its automotive economy prematurely to
imports? Ofreneo says that liberalisation began with the SAP in 1979-80 agreed with the World
Bank and the International Monetary Fund. Under SAP, automotive tariffs were reduced, with
car tariffs reduced to 70% (Ofreneo 2008, 71-72). However, since commercial imports of
CBUs were banned until 1995, these tariffs only applied to small numbers of personal
imports.26 Focussing on tariffs after the ban on imported vehicles was lifted in 1995, when
tariffs stood at 40%, there was an immediate but small surge in net imports, as Figure 1 shows.
This small gap between domestic sales and production continued but did not increase much
until intra-ASEAN tariffs fell to 5% in 2004 under AFTA. The smallness of the gap perhaps
reflects the fall in domestic costs implied by the difference between Aldaba’s 1997 estimate,
mentioned earlier, of a differential between local vehicles and imports from Japan of 2.37 to
3.68 fold, and her 2008 estimate of a 1.14 fold excess in cost of a Philippines-produced vehicle

23
compared to one imported from Thailand.27 But when the intra-ASEAN tariff fell to only 5%
in 2004 under the implementation of AFTA, a major and continually increasing surge in net
imports occurred, with domestic production actually falling to around 50,000 and thereafter
not increasing to much above its 2004 level.
The Philippines has had an additional kind of import competition too – from second hand
vehicles, principally from Japan and Korea.28 Such vehicles have been transferred illegally
from the countries Freeports, principally Subic Bay, into the domestic economy. Attempts by
the government to legislate against this problem encountered opposition from powerful
sectional interests (Ofreneo 2016) and such imports remained a problem – a clear example of
state failure - with perhaps some 20% of registered vehicles in the mid-2010s being illegally
imported.
Other policy issues
One major difference between the Philippines and more successful producers, particularly
Thailand but to some extent Indonesia, is that the Philippines has not tried to use tax policy
(particularly differential excise taxes) to promote local demand for locally popular kinds of
models like Thailand’s famous ‘product champions’, the one-ton pick-up truck and the eco-car
or Indonesia’s Low-Cost Green Car. Indonesia exempted its LCGC from luxury tax, although
it did not give incentives to investors in the way that Thailand did (Natsuda and Thoburn 2013;
Natsuda et al 2015a, 65); by 2016 five Japanese manufacturers were producing LCGCs taking
20% of vehicle sales in Indonesia and with high local content (Fourin 2017;63-65) This aspect
of automotive policy failure in the Philippines is not due to lack of opportunity. The
Commercial Vehicle Development Program in 1987 had as one of its aims to promote the so-

24
called Asian Utility Vehicle (AUV), a low cost, Philippines-designed light commercial vehicle
which could be used to transport passengers. Producers had to achieve a certain LC and to
generate a quarter of their own foreign exchange needs. In 1999 Toyota’s AUV was the best-
selling vehicle in the Philippines, with sales almost double that of its nearest rival, a Honda
passenger car. After initially exempting AUVs from excise tax, in 2003 the government
imposed an excise tax (Aldaba 2000, 3-4, 11, 21). In the view of two industry key informants
in Manila, the rise in excise duty on AUVs in the 2000s by a government short of revenue and
seeing the demand for AUVs was high, foolishly choked off demand for the AUV at the same
time as other ASEAN countries were developing similar vehicles, which also could be used as
taxis. Some manufacturers in the Philippines transferred production to Thailand. 29 The
problem of lack of incentives of the demand side continues in the new CARS policy. In this
regard the Philippines has failed to utilize the ‘policy space’ still available to automotive
producers under the post-2000 WTO trade regime.
The number of assemblers compared to the size of the market in the Philippines is a problem
that remains. In 2014 in discussions about a ‘roadmap’ for automotive development with the
government, a figure of 40,000 vehicles annually was mooted by the government as a
qualification for getting a $1,000 subsidy per vehicle (against estimated differences of $800 -
$2,000 in the cost of local models compared to imports). At that time the largest producer,
Toyota, was said to be producing annually two models totalling 30,000 together and working
at full capacity, although full-capacity operation did not characterise most of the other
assemblers. With 15,000 per model, it was thought difficult to expand production to 40,000
unless several models could be produced with a common platform.30 Low production volumes
also made it difficult for assemblers in the Philippines to encourage their Japanese component
suppliers to establish production in the country (JETRO, Manila, interview 5 February 2015).

25
The Philippines’ CARS Comprehensive Automotive Resurgence Strategy was announced in
2015 following the earlier government-industry ‘road map’ discussions. 1 Under this plan, by
2022 the aim is to reach annual domestic production of approximately 500,000 vehicles,
350,000 of which will be for the domestic market and about 150,000 for export. This would
raise the domestic market share of local production to 70% (Llanto and Ortiz 2015, Ofreneo
2016, Sturgeon et al 2016). CARS is confined to three models – with a range of fiscal incentives
and measures including regulatory reform and the streamlining of registration. 31 These
measures under CARS do not include Thai or Indonesian-style use of tax policy to stimulate
local demand. However, a senior official of the Department of Trade and Industry in Manila
indicated that their Ministry hopes to change the system for excise tax approval under CARS
away from the present need to secure Congressional permission to one where changes can be
made by Executive Order. 32 Clearly the likely success of CARS depends heavily on how the
existing assemblers in the Philippines, predominantly Japanese, respond in terms of their
division between production for the domestic market, importing their own models from
countries such as Thailand, or, ultimately, exporting. In this context, there are some signs of
the assemblers’ increasing commitments to the Philippines as a result of CARS (Natsuda and
Thoburn forthcoming), including by Mitsubishi’s production start in 2017, and Toyota’s new
production plan in 2018 (Fourin 2017: 104).
7. Conclusions
The Philippines automotive production has lagged behind Indonesia’ to an extent that cannot
be explained by differences in market size. Although Indonesian automotive policy in the
1990s was criticised as inappropriate (Aswicahyono et al 2000), by the end of the 1990s

26
Indonesia was developing vehicle exports – a key indicator of international competitiveness -
while the Philippines suffered from substantial net import penetration from the early 2000s.
Both countries, however, did develop substantial exports of automotive components.
What role did industrial policy, including trade-related industrial policy, play in these outcomes?
In terms of import protection, many industry sources we have interviewed in the Philippines
believe that the country opened its economy prematurely - automotive tariffs in the Philippines
in the 1990s and early 2000s were generally lower than in other ASEAN producers. Yet the
big surge in imports into the Philippines did not occur until the dropping of the intra-ASEAN
tariff to 5% in 2004 under AFTA (and to zero in 2010). Since the increase in (official) imports
from the end of the vehicle import ban in 1995 until 2004 was not large and did not continually
increase, it does not suggest that tariffs were dangerously low - although the problem of illegal
second hand car imports lurked in the background, aggravated by the Philippine’s weak state
capacity to implement its own policies.
What were the other differences in policy? The policies between the Philippines and Indonesia,
and indeed compared to other ASEAN producers, were broadly similar in the sense that the
industries started with import substitution backed by import bans, and later high effective rates
of tariff protection when bans were removed, together with LCRs and MD policies to
encourage local component production. In both countries there were attempts at liberalisation
in the 1990s, and by the 2000s LCRs and MD policies had been abandoned under pressure
from the WTO. 33 The Philippines’ foreign exchange earning requirements placed on
assemblers can be seen as one of the country’s few automotive policy successes, leading to
component exports, particularly of transmissions, which continued even after the requirements
were abandoned, along with LCRs, as TRIMs-non-compliant. Wiring harness exports from the

27
Philippines, though, seem less to do with those foreign exchange earning requirements and
more to do with basic labour-intensity and locally-available skills; and unlike the intra-regional
exports of transmissions, they are mainly to developed countries outside ASEAN. 34
Component exports (if wiring harnesses, an electrical item, are included), however, are only
slightly larger than Indonesia’s ($3.3 billion compared to $2.8 billion), while Indonesia also
exports vehicles in significant numbers, which the Philippines does not. The Philippines started
an Automotive Export Program in 2003 but Ford was the only participant, and Ford
subsequently quit the Philippines in 2012, shifting its production to Thailand.
Unlike Indonesia, the Philippines did not attempt to develop a national car, but Indonesia had
to abandon its attempt very quickly under international pressure. For neither country, then, has
a national car project been the sort of drag on automotive development that it has been in
Malaysia (Natsuda et al 2013). 35
Although, as Rasiah (2009, 152) notes, Indonesia in the 2000s ‘abandoned’ industrial policy in
the sense of trade-related investment measures under the WTO, other policy differences
affected automotive industrialisation. An important difference is that, unlike Indonesia with its
Low Cost Green Car (and certainly compared to Thailand’s ‘product champion’ policies for
one-ton pick-up trucks and eco-cars), the Philippines did not use demand-side (excise tax)
incentives to promote chosen classes of vehicles; incentives were confined to producers. Worse,
the Philippines in the early 2000s had the chance to use its Asian Utility Vehicle, selling well
domestically, as a local ‘product champion’ but instead chose to use it to raise additional tax
revenue, thus failing to use the ‘policy space’ still available under the WTO (Natsuda and
Thoburn 2014).

28
Differences in performance, though, cannot simply be traced to differences in industrial policy.
Interviews in Indonesia with Japanese automotive assemblers revealed that they see policy
incentives as less important than market size and market growth, although, of course, very
negative policies towards foreign assemblers – which they see in Malaysia in its attempts to
promote its national car Proton in relation to foreign vehicles – can be important as a
disincentive. However, and as we have observed, while recent market growth in Indonesia has
not been accompanied by significant rises in net imports, the Philippines shows a well-
established trend – perhaps now difficult to break - of market growth being met by imports.
Indeed, Indonesia has already started to export its LCGC models to the Philippines (Natsuda
et al 2015b), feeding the lower middle class market. Even these assemblers who argued that
market growth was more important than preferential policies in inducing them to expand, also
commented unfavourably on the lack of stability in the Philippines policy towards the
automotive industry, particularly if policies changed over the life of a new model (which is 6
– 8 years).
Nevertheless, the issue of policies vs market growth is an important caveat to the idea that
industrial policies, more coherently organized and more effectively implemented, can deliver
a measure of success. Fforde’s (2009) arguments that similar policies, even if consistently
applied, may have different effects in different countries according to their economic and social
inheritances – and that policy ‘blueprints’ are dangerous - are worth remembering too.

29
TABLES AND FIGURES
Table 1 Incomes per head, population, and growth in ASEAN Automotive Producers, 2016
Population 2015 2016US$ US$ (million) US$ US$ GDP growth GDP growth
(billion) (billion, PPP) (PPP) % per capita % per capita
Indonesia 889 2,929 261.1 3,400 11,220 3.5% 3.8%Philippines 370 971 103.3 3,580 9,400 4.3% 5.3%
Thailand 388 1,107 68.9 5,640 16,070 2.5% 2.9%Malaysia 307 839 31.2 9,850 26,900 3.5% 2.7%Vietnam 191 561 92.7 2,050 6,050 5.5% 5.1%
July 2017Source: wdi.worldbank.org/table/WV.1, accessed 14
Total GNI GNI per capita

30
Table 2 Total Vehicle Production, 2000 and 2016
2000 2016 2016/2000 2014-5 2015-6ratio growth growth
Indonesia 292,710 1,177,389 4.02 -15.4% 7.2%Philippines 41,840 135,840 3.25 5.2% 20.8%
ASEAN ComparatorsThailand 411,721 1,944,417 4.72 1.9% 1.8%Malaysia 282,830 513,445 1.82 3.3% -16.5%Vietnam 6,862 66,030 9.62 2.3% 32.1%
Other ComparatorsUK 1,813,894 1,816,622 1.00 5.2% 8.0%Germany 5,526,615 6,062,562 1.10 2.1% 0.5%USA 12,799,857 8,263,780 0.65 3.8% 0.8%Japan 10,140,796 9,204,590 0.91 -5.1% -0.8%South Korea 3,114,998 4,228,509 1.36 0.7% -7.2%Taiwan 372,613 309,531 0.83 -7.4% -11.8%India 801,360 4,488,965 5.60 7.3% 7.9%China 2,069,069 28,118,794 13.59 3.3% 14.5%World 58,374,162 94,976,569 1.63 1.1% 4.5%
Sources and Notes : OICA Production stats (except Philippines and Vietnam) fromhttp://www.oica.net/category/production-statistics/ ,Philippines and Vietnam from http://www.oica.net/wp-content/uploads//Total-2016.pdf,both accessed 15 July 2017 'World' statistics exclude some commercial vehicle production for a small number of non-reporting countries and a few makes of cars are excluded from the country statistics. Philippines 2014-5 growth rate is based on a 2014 output of 106,938 units; this figure is contentious, however. The OICA website also gives a figure of 77,628 units for 2014. There is also a figure for 2014 of 86,218 from Philippines Chamber of Automotive Manufacturers(interview 6 February 2015), and 86,218 is cited for 2014 by Fourin (2015)
numbers of vehicles

31
Table 3 Vehicle Ownership per 1000 Inhabitants, 2015
Indonesia 87Philippines 38
ASEAN ComparatorsThailand 228Malaysia 439Vietnam 23
Other ComparatorsUK 587Germany 593USA 821Japan 609South Korea 417Taiwan 373India 22China 118World 182
Source : http://www.oica.net/wp-content/uploads//total-inuse-2015.pdfaccessed 14 July 2017
Table 4 Assemblers, Parts Suppliers and Employment in ASEAN Automotive Producers, 2015
Number of assembly plants Number of parts suppliers Employment in Assembly and Parts
Indonesia 20 1550 445,000Philippines 11 (16) 256 66,800
ASEAN comparatorsThailand 16 2390 525,000Malaysia 11 550 250,000Vietnam 20 300+ n/a
Sources and Notes : from Fourin (2015) and CAMPI for the Philippines; Vietnam data from interviews, 2015According to the Department of Trade and Industry, Manila, interviewed 13 February 2015, there are 16 assemblers in terms of licencing but not all are activeFourin (2017) gives only comparable updated figures for Thailand , which increase assemblers numbers to 18,decrease parts suppliers to 1599 and leave employment the same. Fourin's (2017) figures for Malaysia includedmotor bicyles and are not comparabe

32
Figure 1 Vehicle Production and Sales, Philippines, 1975-2016
Source: data from Fourin (various years)Notes: PVP = passenger vehicles production; CVP = commercial vehicles production; TP = totalProduction; Sales = total domestic sales. Units are numbers of vehicles.Figures for 1976-9 missing, so we include 1975
0
50000
100000
150000
200000
250000
300000
350000
400000
45000019
7519
8019
8219
8319
8719
8819
8919
9019
9119
9319
9419
9519
9619
9719
9819
9920
0020
0120
0220
0320
0420
0520
0620
0720
0820
0920
1020
1120
1220
1320
1420
1520
16
PVP CVP TP Sales

33
Figure 2 Vehicle Production and Sales, Indonesia, 1976-2016
Source : Fourin (various years)Notes : PVP = passenger vehicles production; CVP = commercial vehicles production; TP = totalProduction; Sales = total domestic sales. Units are numbers of vehicles.
0
200000
400000
600000
800000
1000000
1200000
1400000
PVP CVP TP Sales

34
Figure 4 Production Shares of Major Assemblers, Indonesia, 2016
Source and Notes : data from Fourin (2017). Shares are in terms of numbers of vehicles
Daihatsu501831 42.6%
Toyota 21872018.6%
Honda 19509516.6%
Suzuki 1132439.6%
Mitsubishi67378 5.7%
Nissan 358433.0% Others 45279
3.8%
Figures 5 Sales Shares of Major Automotive Brands, Indonesia, 2016
Sources and Notes : data from Fourin (2017). Shares are of numbers of vehicles
Toyota 38157035.9%
Honda 19936418.8%
Daihatsu189683 17.9%
Suzuki 929508.8%
Mitsubishi66443 6.3%
Nissan 386363.6% Others 93089
8.8%

35
Figure 6 Philippines Automotive Exports and Wiring Harnesses ($mil)
Source : from Global Trade Atlas DatabaseNote s: United Nations Harmonized System (HS) codes – HS 87 all automotive;
HS 8703 passenger vehicles except buses; HS 8704 commercial vehicles; HS 8708 automotive parts and accessoriesHS 854430 are wiring harnesses for vehicles, ships and aircraft
0
500
1000
1500
2000
250019
97
1998
1999
2000
2001
2002
2003
2004
2005
2006
2007
2008
2009
2010
2011
2012
2013
2014
2015
2016
All Auto HS 87 PVs HS 8703
CVs HS 8704 Parts HS8708
Wiring Harnesses HS854430
36
Figure 7 Indonesian Automotive Exports and Wiring Harnesses ($mil)
Source : Global Trade Atlas DatabaseNotes : United Nations Harmonized System (HS) codes – HS 87 all automotive; and accessories
HS 8703 passenger vehicles except buses; HS 8704 commercial vehicles; HS 8708 automotive parts and accessoriesHS854430 are wiring harnesses for vehicles, ships and aircraft
0
1000
2000
3000
4000
5000
6000
7000
19971998199920002001200220032004200520062007200820092010201120122013201420152016
Total auto HS 87 PVs HS 8703
CVs HS 8704 Parts & Acc HS 8708
Wiring harnesses HS854430

37
1 It is worth noting here, though, that Rasiah (2007, 58-9) records that in 2001 the ‘embedded
infrastructure’ that forms a background to enhance domestic technological capacity was
slightly stronger in the Philippines than Indonesia in terms of basic technological infrastructure
(including literacy and telephone network density as proxies), and much stronger than
Indonesia’s (and almost as good as Thailand’s) in high-tech infrastructure (mainly R&D
activities and support). These factors do not appear to have had a strongly positive effect on
automotive development in the Philippines.
2 And also the special case of Malaysia (Natsuda et al 2013).
3 See, for example, Natsuda, Otsuka and Thoburn, (2015a, 49-51) and Natsuda and Thoburn,
(forthcoming); also Gereffi, (2014).
4 Economies of scale are associated with the minimum efficient size of plant. This can vary
according to the degree of vertical integration, though that now is usually very low, with
perhaps 30% of the value of a car represented by assembly. MES usually is thought to vary
from about 40,000 vehicles a year to 2-300,000, and is considerably larger for some
components like engines, see for example Natsuda et al (2015a, 48, 61); Wells (2015, 212);
and on car manufacturing processes more generally Nieuwenhuis (2015). The minimum size
of firm is much larger than that of an assembly plant because of the economies of scope
needed for the massive R&D costs of developing new models. Nolan( 2012, 25) puts it as
high as 5 million vehicles a year for a global mass market assembler.
5 A case could be made that Vietnam, in terms of its current output, is less successful than the
Philippines. However, Vietnam only started to reform its economy in the late 1980s and since
then it has expanded its automotive production very rapidly from a low base. See Hansen
2016) and Thoburn and Natsuda (2017).

38
6 Such relocations have also been motivated by a need to avoid trade disputes, eg past
Japanese relocations to the USA) and to get inside trade barriers, eg by companies to get
inside high tariff walls in ASEAN and China).
7 Jakarta Post, 14 July 2016 , http://www.thejakartapost.com/news/2016/01/27/indonesia-
see-limited-growth-car-sales-industry-association.html (accessed 14 July 2016), and
http://www.indonesia-investments.com/business/industries-sectors/automotive-
industry/item6047? (accessed 6 March 2017).
8 Remember, though, as indicated in the Notes to Table 2, that the 2014 output figures for the
Philippines are cited quite differently in different sources.
9 Although the data are available for Indonesia, production data by each assembler are not
available in Fourin (2015) for the Philippines, so a pie chart for the Philippines production
could not be made.
10 Since domestic sales = domestic production + imports – exports, then domestic sales –
domestic production = imports – exports (that is, net imports).
11 Exports of other HS 87 subcategories are negligible and are not shown on the diagram.
12 According to an interview with the Department of Trade and Industry in the Philippines, 13
February 2015), there are actually 16 assemblers licenced to operate, but a smaller number,
(11) actually do so, (see Table 4).
13 Interview with Philippines Chamber of Automotive Manufacturers of the Philippines,
(CAMPI), 22 February 2014
14 However, for expositional convenience, we discuss in this section the effects of the 2008
global financial crisis in comparison with the 1997 Asian crisis.
15 This subsection, and our later discussions of the Philippines’ automotive history, draw
heavily on four papers by Rafaelita Aldaba (1997, 2000, 2007, and 2008). Also very useful is
Ofreneo (2008).
39
16 It is worth commenting here on the apparently paradoxical fact that while the CBU import
ban was in force from 1950 to 1995 tariff rates on CBUs were still posted. This arose because
the ban was only on commercial imports of CBUs. Some special categories of personal
imports of vehicles – for example on behalf of Filipinos working overseas – were allowed,
and were liable for tariffs (Aldaba 1997, 18-19).
17 Interview with Motor Vehicle Parts Association of the Philippines (MVPMAP), 26
February 2014.
18 Interview with Motor Vehicle Parts Manufacturers Association of the Philippines
(MVPMAP), 26 February 2014
19 On ERP, see Greenaway and Milner (1993,79-80)
20 For more on the crises, see Doner and Wad (2014).
21 See Aldaba (2008, 6) for a table listing all the automotive tariffs, both MFN and AFTA
from 1988 to 2004.
22 With the one exception that the Malaysian tariff on commercial vehicle CKDs was zero
while the Philippines’ was 3%.
23 The real effective exchange rate of the Philippines appreciated from the early 2000s but
that of Indonesia appreciated more. See http://data.isdb.org/pxfdrcg/world-bank-
development-indicators-wdi-2017-idb-aggregates?tsId=1121020, accessed 21 July 2017
24 Interview with PACCI, 18 February 2014
25 For Taiwan trade statistics, which are not shown in the UN Comtrade data base, see
http://cus93.trade.gov.tw/.
26 Figures cited in Aldaba (1997, 19) show that total annual imports of passenger cars from
1990 to 1994 were only in the range of approximately 4,000 to 6,000 units.
27 A major Japanese motor manufacturer interviewed in the Philippines in February 2014
thought the cost of locally assembled vehicles was still about 10% higher than imports.

40
28 For more details, see Natsuda and Thoburn (forthcoming).
29 Interview with MVPMAP, 26 February 2014; with Philippines Automotive
Competitiveness Council (PACCI), 18 February 2014
30 Interview with CAMPI, 22 February 2014
31 For more details on CARS, see Natsuda and Thoburn (forthcoming).
32 Interview 13 February 2015.
33 Note, though, that since much of both countries’ automotive trade is within ASEAN, LC
rules have been reintroduced in the sense that trade preferences under AFTA are subject to
ASEAN rules of origin requirements, specifying a minimum ASEAN content of 40%,
(Ofreneo 2008, 78).
34 In 2016, 41% of exports of HS 854430 (mainly wiring harnesses) were to Japan, 44% to
North America, and only 5% to Thailand, the largest ASEAN destination.
(comtrade.un.org/db, accessed 26 July 2017).
35 Although there have been signs that Indonesia’s new president wants to try again (Natsuda
et al 2015b)
References

41
Aldaba, Rafaelita, 1997. Micro Studies: Philippine Car Assembly Sector, Discussion Paper
Series No.97-21, Philippine Institute for Development Studies.
Aldaba, Rafaelita, 2000. Increasing Globalization and AFTA in 2003: What are the
Prospects for the Philippine Automotive Industry?, Discussion Paper Series No.2000-42,
Philippine Institute for Development Studies.
Aldaba, Rafaelita, 2007. Assessing the Competitiveness of the Philippine Auto Parts Industry,
Discussion Paper Series No.2007-14, Philippine Institute for Development Studies.
Aldaba, Rafaelita, 2008. Globalization and the Need for Strategic Government-Industry
Cooperation in the Philippine Automotive Industry, Discussion Paper Series No.2008-21,
Philippine Institute for Development Studies.
Altenburg, Thomas, and Wilfried Lütkenhorst, 2015. Industrial Policy in Developing
Countries: Failing Markets, Weak States, London: Elgar
Aoki, Katsuki, 2015. ‘Labour Relations and HRM in the Automotive Industry: Japanese
Impacts’, in Paul Nieuwenhuis, and Peter Wells, eds), The Global Automotive Industry,
Chichester: Wiley 83-94
Aswicahyono, H, M.C. Basri, and Hal Hill, 2000. ‘How Not to Industrialise? Indonesia’s
Automotive Industry’, Bulletin of Indonesian Economic Studies, 36(1), 209-241.
Chalmers, Ian, 1994. ‘Domestic Capital in the Evolution of Nationalist Auto Development
Policy in Indonesia: From Instrumental to Structural Power’, Perth: Murdoch University
Press, Asia Research Centre Working Paper 30
Chang, Ha-Joon, 2013. ‘Comment on ‘Comparative Advantage: the Silver Bullet of Industrial
Policy’ ‘, in Stiglitz, Joseph E, and Justin Y. Lin (eds). The Industrial Policy Revolution 1:
The Role of Government Beyond Ideology, London: Palgrave Macmillan, 39-43

42
Doner, Richard, 1991. Driving a Bargain: Automobile Industrialization and Japanese Firms
in Southeast Asia. Berkeley, CA: University of California Press.
Doner, Richard, and Peter Wad, 2014. ‘Financial Crises and Automotive Industry
Development in Southeast Asia’, Journal of Contemporary Asia, 44(4), 664-687.
Fforde, Adam, 2009. Coping with Facts: A Skeptic’s Guide to the Problem of Development,
Sterling VA: Kumarian Press
Fourin, 1994, 1999, 2008, 2011. Ajia Jidosha Sangyo, Asian Automotive Industry. Nagoya:
Fourin.
Fourin, 2015, 2017. ASEAN Jidosha Sangyo, (ASEAN Automotive Industry), Nagoya:
Fourin.
Gereffi, G., 2014. ‘Global Value Chain Analysis in a Post-Washington Consensus World’,
Review of International Political Economy, 21(1), 9-37.
Greenaway, David and Chris Milner, 1993. Trade and Industrial Policy in Developing
Countries, London: Macmillan.
Hansen, Arve, 2016. ‘Driving Development? The Problems and Promises of the Car in
Vietnam’, Journal of Contemporary Asia ,46(4), 551-569.
Hansen, John R., 1971) ‘The Motor Vehicle Industry’, Bulletin of Indonesian Economic
Studies 7, 2), 38–69.
Hill, Hal, 2000) The Indonesian Economy, Cambridge: Cambridge University Press, second
ed..
Humphrey, John and Olga Memedovic, 2003. The Global Automotive Industry Value Chain:
What Prospects for Upgrading by Developing Countries, Vienna: United Nations Industrial

43
Development Organization
Lauridsen, Laurids S., 2009. ‘The Policies and Politics of Industrial Upgrading in Thailand
During the Thaksin Era, 2001–2006)’, Asian Politics and Policy, 1(3). 409–434.
Llanto, Gilberto and Ma Kristina Ortiz, 2015. Industrial Policies and Implementation:
Philippine Automotive Manufacturing as a Lens, Discussion Paper Series No.2015-39,
Philippine Institute for Development Studies.
Milberg, William, Xiao Jiang, and Gary Gereffi, 2014. ‘Industrial policy in the era of
vertically specialized industrialization’, in José M. Salazar-Xirinachs, Irmgard Nübler and
Richard Kozul-Wright (eds), Transforming economies: Making industrial policy work for
growth, jobs and development, Geneva: International Labour Office,151-178
Natsuda, Kaoru, and John Thoburn, 2013. ‘Industrial Policy and the Development of the
Automotive Industry in Thailand’, Journal of the Asia Pacific Economy, 18(3), 413-437.
Natsuda, Kaoru, and John Thoburn, 2014. ‘How Much Policy Space Still Exists Under the
WTO? A Comparative Study of the Automotive Industry in Thailand and Malaysia’, Review
of International Political Economy, 21(6), 1346-1377.
Natsuda, Kaoru, and John Thoburn, forthcoming. ‘Industrial Policy and the Development of
the Automotive Industry in the Philippines’, Canadian Journal of Development Studies
Natsuda, Kaoru, Kozo Otsuka and John Thoburn, 2015a. ‘Dawn of Industrialization: the
Indonesian Automotive Industry’, Bulletin of Indonesian Economic Studies, 51(1), 47-68.
Natsuda, Kaoru, Kozo Otsuka and John Thoburn, 2015b. ‘Indonesia’s Automotive Industry
Shifts up a Gear’, http://www.eastasiaforum.org, 22 May 2015.

44
Natsuda, Kaoru, Noriyuki Segawa and John Thoburn, 2013. ‘Liberalization, Industrial
Nationalism, and the Malaysian Automotive Industry’, Global Economic Review, 42(2), 113-
134.
Nieuwenhuis, Paul, 2015. ‘Car Manufacturing’, in Paul Nieuwenhuis and Peter Wells, (eds),
The Global Automotive Industry, Chichester: Wiley, 41-45
Nolan, Peter, 2012. Is China Buying the World? London: Polity Press
Nomura, Toshio, 2003. Indonesia Jidosha Sangyo no Kaihokatei, Liberalisation Process of
the Indonesian Automotive Industry), ShoKei Ronshu, 53, 1-64.
Ofreneo, Rene E., 2008. ‘Arrested Development: Multinationals, TRIMs and the Philippines’
Automotive Industry’, Asia Pacific Business Review, 14(1), 65-84.
Ofreneo, Rene E., 2015. ‘Growth and Employment in de-Industrializing Philippines’, Journal
of the Asia Pacific Economy, 20(1), 111-129.
Ofreneo, Rene, 2016. Auto and Car Parts Production: Can the Philippines Catch Up with
Asia?, Asia Pacific Business Review, 22(1), 48-64.
Rasiah, Rajah, 2007. ‘Export-orientation and Technological Intensities in Auto Parts Firms in
East and Southeast Asia: Does Ownership Matter?’ Asian Economic Papers 6 (2):55–76.
Rasiah, Rajah, 2009. ‘Technological capabilities of automotive firms in Indonesia and
Malaysia’, Asian Economic Papers, 8(1): 151168.
Rodrik, Dani, 2004. ‘Industrial Policy for the Twenty-First Century’, available
athttp://www.hks.harvard.edu/fs/drodrik/Research%20papers/UNIDOSep.pdf
Sato, Yuri, 1992. ‘The Automotive Industry’, in Indonesia no kogyoka [Industrialization in
Indonesia], edited by Norio Mihara and Yuri Sato, 336–61. Tokyo: Institute of Developing

45
Economies.
Stiglitz, Joseph E., Justin Y. Lin and Célestin Monga, 2013. ‘Introduction: the Rejuvenation
of Industrial Policy’, in Stiglitz, Joseph E, and Justin Y. Lin, (eds), The Industrial Policy
Revolution 1: The Role of Government Beyond Ideology, London: Palgrave Macmillan, 1-18
Sturgeon, Timothy, Jack Daly Stacey Frederick, Penny Barber and Gary Gereffi, 2016. The
Philippines in the Automotive Global Value Chain, Technical Report for USAID, final draft
for review), May, Duke University, USA,
http://dukespace.lib.duke.edu/dspace/bitstream/handle/10161/12484/2016-
05_Duke%20CGGC%20study_Philippines_Automotive%20GVC.pdf?sequence=1, accessed
8 July 2016
Thoburn, John T., 1973. ‘Exports and the Malaysian Engineering Industry: A Case Study of
Backward Linkage’, Oxford Bulletin of Economics and Statistics, 35(2), 91-117.
Thoburn, John T., 2016. ‘Trade and Industrial Policy for Development’, in Mustafa Erdoğdu
and Bryan Christiansen, eds), Comparative Economic Perspectives on Europe and the MENA
Region, Hershey, PA: IGI Global, 25-35.
Thoburn, John, and Kaoru Natsuda, 2017. ‘Comparative Policies for Automotive
Development in Southeast Asia’ in Arve Hansen and Kenneth Bo Nielsen, eds), Cars,
Automobility and Development in Asia: Wheels of Change, London: Routledge, 17-36
Thoburn, John T., and Makoto Takashima, 1992. Industrial Subcontracting in the United
Kingdom and Japan, Aldershot: Avebury.

46
UNIDO, 2013. Industrial Development Report 2013: Sustaining Employment Growth: the
Role of Manufacturing and Structural Change. Vienna: United Nations Industrial
Development Organization.
Wad, Peter, 2010. ‘Impact of the Global Economic and Financial Crisis over the Automotive
Industry in Developing Countries’, Vienna: United Nations Industrial Development
Organization, Research and Statistics Branch, Working Paper 16/2009,
http://www.unido.org//fileadmin/user_media/Publications/Research_and_statistics/Branch_p
ublications/Research_and_Policy/Files/Working_Papers/2009/WP%2016%20Impact%20of%
20the%20Global%20Economic%20and%20Financial%20Crisis%20over%20the%20Automo
tive%20Industry%20in%20Developing%20Countries.pdf
Weiss, John, 2016. ‘Industrial Policy: Back on the Agenda’, in John Weiss and Michael
Tribe, eds), Routledge Handbook of Industry and Development, London: Routledge, 135-150.
Wells, Peter, 2015. ‘New Business Models and the Automotive Industry’, in Paul
Nieuwenhuis and Peter Wells, eds), The Global Automotive Industry, Chichester: Wiley, 209-
217
Witoelar, Wirmar, 1983. ‘Ancillary Firm Development in the Motor Vehicle Industry in
Indonesia’, in Konosuke Odaka, ed) The Motor Vehicle Industry in Asia: A Study of Ancillary
Firm Development, Manila: Council of Asian Manpower Studies, 17–84.