NBER WORKING PAPER SERIES ADVANCING THE ...
40
NBER WORKING PAPER SERIES ADVANCING THE AGENCY OF ADOLESCENT GIRLS Eric V. Edmonds Benjamin Feigenberg Jessica Leight Working Paper 27513 http://www.nber.org/papers/w27513 NATIONAL BUREAU OF ECONOMIC RESEARCH 1050 Massachusetts Avenue Cambridge, MA 02138 July 2020 Funding is provided by the United States Department of Labor under cooperative agreement number IL-26700-14-75-K-25 to Williams College / American University.This material does not necessarily reflect the views or policies of the United States Department of Labor, nor does mention of trade names, commercial products, or organisations imply endorsement by the United States Government. 100 percent of the total costs of the project or program is financed with Federal funds, for a total of $1,304,957 dollars. We are grateful to Mohar Dey, Rakesh Pandey, and Amanda Sload for their research assistance and appreciate their input into this project. The views expressed herein are those of the authors and do not necessarily reflect the views of the National Bureau of Economic Research. NBER working papers are circulated for discussion and comment purposes. They have not been peer- reviewed or been subject to the review by the NBER Board of Directors that accompanies official NBER publications. © 2020 by Eric V. Edmonds, Benjamin Feigenberg, and Jessica Leight. All rights reserved. Short sections of text, not to exceed two paragraphs, may be quoted without explicit permission provided that full credit, including © notice, is given to the source.
-
Upload
khangminh22 -
Category
Documents
-
view
1 -
download
0
Transcript of NBER WORKING PAPER SERIES ADVANCING THE ...
NBER WORKING PAPER SERIES
ADVANCING THE AGENCY OF ADOLESCENT GIRLS
Eric V. EdmondsBenjamin Feigenberg
Jessica Leight
Working Paper 27513http://www.nber.org/papers/w27513
NATIONAL BUREAU OF ECONOMIC RESEARCH1050 Massachusetts Avenue
Cambridge, MA 02138July 2020
Funding is provided by the United States Department of Labor under cooperative agreement number IL-26700-14-75-K-25 to Williams College / American University.This material does not necessarily reflect the views or policies of the United States Department of Labor, nor does mention of trade names, commercial products, or organisations imply endorsement by the United States Government. 100 percent of the total costs of the project or program is financed with Federal funds, for a total of $1,304,957 dollars. We are grateful to Mohar Dey, Rakesh Pandey, and Amanda Sload for their research assistance and appreciate their input into this project. The views expressed herein are those of the authors and do not necessarily reflect the views of the National Bureau of Economic Research.
NBER working papers are circulated for discussion and comment purposes. They have not been peer-reviewed or been subject to the review by the NBER Board of Directors that accompanies official NBER publications.
© 2020 by Eric V. Edmonds, Benjamin Feigenberg, and Jessica Leight. All rights reserved. Short sections of text, not to exceed two paragraphs, may be quoted without explicit permission provided that full credit, including © notice, is given to the source.

Advancing the Agency of Adolescent GirlsEric V. Edmonds, Benjamin Feigenberg, and Jessica LeightNBER Working Paper No. 27513July 2020JEL No. I25,J16,O15
ABSTRACT
Can life skills be taught in early adolescence? Using a clustered randomized control trial, this study analyzes the impact of a school-based life skills intervention in grades six and seven within a sample of 2,459 girls in Rajasthan, India. Our evidence suggests that the intervention is successful in developing stronger life skills including increased agency, more equitable gender norms, and stronger socio-emotional support. Girls also drop out of school at a lower rate: we observe an approximately 25 percent decline in dropout that persists from seventh grade through the transition to high school.
Eric V. EdmondsDepartment of EconomicsDartmouth College6106 Rockefeller HallHanover, NH 03755and [email protected]
Benjamin FeigenbergDepartment of EconomicsUniversity of Illinois at ChicagoUniversity Hall room 706601 South Morgan StreetChicago, IL [email protected]
Jessica LeightInternational Food Policy Research Institute Washington, [email protected]
A data appendix is available at http://www.nber.org/data-appendix/w27513A randomized controlled trials registry entry is available at https://doi.org/10.1257/rct.1046-3.0 All Project Related Documents are available at https://sites.dartmouth.edu/eedmonds/gep/

1 Introduction
Throughout the developing world, women and girls face severe limitations on their ability to
exercise agency in important choice domains, including the pursuit of education and economic
self-sufficiency, the choice of when to marry and have children, and the choice of how to
interact with the wider world. Limitations on agency have remained stubbornly persistent
even as other dimensions of women’s and girls’ welfare have shown rapid improvement in
recent decades. For example, in this study’s location of Rajasthan, India, net primary school
enrollment rates for girls increased from 25 percent in 1983 to 85 percent in 2009.1 However,
baseline data collected for this evaluation documents that over 90 percent of adult women
in our respondents’ households state that a wife should always obey her husband, and, at
an average age of eleven, 17 percent of our subjects are married, suggestive of persistent and
severe limitations on female agency within the household.
This study explores whether it is possible to increase girls’ agency and stimulate the
development of more equitable gender norms in a setting of intense gender disadvantage
and, through these attitudinal changes, increase girls’ schooling attainment. We utilize a
randomized controlled trial to evaluate a life skills curriculum and mentoring program in a
sample of 2,459 adolescent girls in 119 schools in the Ajmer district of Rajasthan, India. The
intervention of interest is the Girls’ Education Program (GEP), a program encompassing
twice-monthly life skills classes conducted in school as well as group mentoring sessions
for girls.2 The program is delivered by social mobilizers, women from the area who have
completed secondary school and who are managed, trained and deployed by our partner
non-governmental organization, Room to Read (RtR). The stated objective of GEP is to
enhance girls’ life skills and increase secondary school completion; the intervention targets
girls beginning in grade six, and was newly rolled out to 60 randomly selected treatment
schools in 2016.
We examine the impact of GEP using an intent-to-treat empirical strategy. 96 percent
of girls offered treatment attended at least one life skills class, and 85 percent remained
1These represent the authors’ calculations of school attendance rate from the National Sample Survey forgirls in Rajasthan age 6 to 12 inclusive. 2009 is the most recently available NSS thick round.
2The program’s definition of mentoring is not what we expect most readers to have in mind. Mentoringsessions are small group discussions around topics covered in the life skills classes, principally led by students.
1
engaged through grade seven. The majority of our analyses are based on surveys conducted
with girls and their household members following grade seven, after two full years of program
exposure; at that point, we have data on 2,435 girls relative to the original sample of 2,459
randomized into treatment, an attrition rate of less than one percent.
Our empirical analysis demonstrates that random assignment to GEP generates a sig-
nificant enhancement in girls’ reported life skills six months following their final life skills
class in seventh grade. We document improvements in future planning, including reporting
concrete goals for the future, and effectively articulating plans to achieve those goals. We
see shifts in gender norms where girls express more desire for parity in the treatment of
children regardless of gender, and an increase in empowerment in which girls report direct
agency over important life decisions. There is also evidence of enhanced social-emotional
support: treatment girls have more friends to rely on, identify more ways in which they rely
on these friends, and spend 25 percent more time socializing. These experimental effects are
corroborated by assessments by parents and enumerators, suggesting that the shifts in life
skills were observable to adults interacting with girls exposed to GEP. Moreover, while it
is possible that the observed shift in life skills responses could partially reflect treated girls
learning the socially desirable answers (social desirability bias), we do not observe larger
treatment effects on average in girls prone to give socially desirable answers.
These shifts in non-cognitive skills are associated with a substantial reduction in school
dropout. In the endline survey conducted following seventh grade after two years of the
program, we document a 30 percent reduction in dropout (equivalent to a decline of four
percentage points) and a parallel increase in grade progression. We also utilize administrative
records from schools that extend through the initiation of grade nine and find that the
reduction in school dropout continues through the progression into high school, a frequent
dropout point, and is usually around 25 percent in magnitude. While a large literature
documents improvements in girls’ education from a variety of material transfers such as
uniforms (Duflo et al., 2015), bicycles (Muralidharan and Prakash, 2017), and cash (Dhaliwal
et al., 2013; Fizbein et al., 2009; Baird et al., 2013), our findings are consistent with Ashraf
et al. (2020) in highlighting that non-material interventions targeting underlying attitudinal
barriers can in fact shift girls’ enrollment in developing countries. This evidence contrasts
2
with research from the U.S. that generally does not find effects of adolescent life skills
programs on dropout (Cunha et al., 2006; Levitt et al., 2016; Lavecchia et al., 2016).3
While assignment to treatment is associated with enhanced expression of life skills and a
reduction in school dropout, there are many domains of the participating girls’ lives that do
not show any meaningful changes following exposure to GEP. The data do not reject the null
hypothesis of no shifts in girls’ attendance and time allocated to academic work, cognitive
skills as measured by ASER tests administered at home, the probability of marriage, and
engagement in labor inside or outside the home. Treatment and the resulting enhanced social
support, sense of agency, and school progression do not seem to overcome all dimensions of
disadvantage in these girls’ young lives.
This paper contributes to several related bodies of research. First, it adds to the nascent
literature on the feasibility of teaching life skills in poor country settings. Several studies
focus on teaching one aspect of life skills using a focused strategy, such as negotiation (Ashraf
et al., 2020) or gender attitudes (Dhar et al., 2018), or providing information on the value
of education (Nguyen, 2008; Jensen, 2010), with success in communicating those targeted
lessons. However, life skills are usually bundled when they are taught in school, as is common
in guidance curriculums in higher income settings, and the context of delivery could be
important in what students learn from the curriculum. Typically evaluations of multi-faceted
life skills interventions are bundled with complementary interventions such as health and
nutritional information or the provision of “safe spaces” (Buchmann et al., 2017; Bandiera
et al., 2019, 2020). We document success in communicating a broad set of life skills in a
school based program in a setting where it would be reasonable to be skeptical about teaching
these lessons to girls given the broader socioeconomic context.
Second, it contributes to the growing literature on the importance of non-cognitive skills.
In high income economies, there is a substantial body of evidence around the labor market
value of the attributes the GEP attempts to develop (Heckman et al., 2006; Deming, 2017).
There is some similar evidence from developing countries (e.g. Glewwe et al. (2017); Macours
and Laajaj (2019)), but without a clear source of variation in non-cognitive skills. Our finding
3One related study, Carrell and Hoekstra (2014), does identify improvements in test scores and reducedbehavioral problems among boys who receive access to school counselors in the US.
3
of a link between a life skills treatment and school enrollment is complementary to Ashraf et
al. (2020), who offer an adapted two week Harvard Business School course in negotiation to
eighth grade girls in Zambia and find sustained increases in enrollment. The GEP differs in its
focus on a wide variety of life skills delivered in a classroom setting and in our context where
the status of girls is such that it would be reasonable to question their ability to exercise
life skills taught in the classroom.4 Our findings on the reduction in dropout with a school
based life skills program contrast with Delavallade et al. (2017), evaluating an intervention
also implemented in Rajasthan that targeted out of school girls with little effect.
Third, the paper contributes to the vast literature on intrahousehold decision-making in
education. While that literature primarily focuses on spousal conflict over investments in
education (Strauss and Thomas, 1995), increasing attention is being placed on the child’s
agency in education. For example, Berry (2015) highlights the challenge parents face in
getting children to take testing seriously, and Bursztyn and Coffman (2012) and Bursztyn et
al. (2017) document that parents in Brazil face challenges in monitoring and incentivizing
school attendance. The enrollment / dropout question is typically modeled as outside of
the child’s sphere of control, but our results highlight that girls can influence choices around
school enrollment. Our finding of a reduction in dropout without other measured changes
in girls’ broader responsibilities in the household is consistent with the hypothesis that
there is scope for gains in schooling without needing to fundamentally affect the economic
organization of the household.
The paper proceeds as follows. Section 2 describes the setting and Section 3 describes
the evaluation design and empirical strategy. Section 4 presents the empirical findings and
Section 5 concludes.
4To highlight one metric, the World Economic Forum’s Gender Gap Index suggests that Zambia andAustralia are at roughly the same level with respect to gender equity, with India much lower (Forum, 2020),and our study area of Rajasthan is among the most gender disadvantaged states in India, as measured by theprevalence of crimes against women (Mukherjee et al., 2001) and the skewness of the sex ratio (Oldenburg,1992).
4

2 Background
2.1 Setting
This evaluation was conducted in Ajmer, Rajasthan in northwest India, a state that has
been a focus of RtR programming in part because of persistent gender enrollment gaps. The
programmatic rollout analyzed in this evaluation represented a substantial expansion; RtR
was active in only four schools in Ajmer prior to this evaluation, entailing expansion to an
additional sixty schools.
Data from the baseline survey (described in more detail in Section 3.1) can be used to
characterize the sample. In Table 1, we compare the characteristics of households in the
study sample to state- and country-level averages. In our sample, households include on
average seven members, of whom four are children and two are girls. 67% of the sampled
households are members of a caste group denoted as OBC, or Other Backward Class; 25% are
members of a scheduled caste or scheduled tribe, and the remainder are members of general
caste households. Mean land ownership is around six bighas, or approximately one hectare.
Study sample households are notably larger and are more likely to be from historically
disadvantaged castes/tribes compared to the average Rajasthani household, and their mean
land holdings are only 25% of the state-level mean.
This is also a context characterized by relatively low levels of female educational and
professional attainment. Among the mothers of the sampled girls, only about 20% reported
any post-primary education or engagement in wage employment. More than 90% agreed that
a wife should always obey her husband. Among girls in the study sample, 17% were already
married when first surveyed, and 84% of girls reported working for pay at that time. Thus,
girls in this setting appear to face a number of obstacles to future educational enrollment
and academic achievement.
Additional household characteristics, including patterns of income-generating activities,
are presented in Appendix Table A1.5 Among sample households, 53% reported primary de-
pendence on wage employment, 22% on self-employment in agriculture, 8% on self-employment
outside of agriculture, and 16% on casual labor outside of agriculture. Total household con-
5Appendix tables are available on the project website: https://sites.dartmouth.edu/eedmonds/gep/.
5

sumption in the last month averaged around 26,000 rupees or $400.
2.2 Intervention
2.2.1 GEP during evaluation period
The Girls’ Education Program (GEP) delivered by Room to Read (RtR) is a seven year
program that begins in grade six and continues through secondary school. It has two primary
goals: encouraging girls to successfully complete secondary school and developing life skills.
Since 2007, more than 95,000 girls in nine countries have been enrolled in GEP.
There are two differences between the intervention as analyzed in this evaluation and the
broader program. First, the primary data collection for this evaluation was conducted follow-
ing only two years of program implementation, when the target sampled girls had completed
grade seven rather than grade twelve. We will refer to this period (2016–2018) as the evalu-
ation period. Second, the evaluation focuses on a reduced intervention design including only
deployment of social mobilizers (“SMs”) who deliver life skills classes and mentoring. The
full program additionally includes material support and parent and community engagement,
but these components were not implemented in Ajmer during the evaluation period.
GEP life skills training is delivered in twice-a-month sessions conducted by SMs during
school hours, utilizing a curriculum developed by RtR. In each treatment school, 16 life
skills classes were conducted in both grades six and seven. The curriculum is grade-based
and emphasizes ten life skills: self-confidence, expressing and managing emotions, empathy,
self-control, critical thinking, decision-making, perseverance, communication, relationship
building, and creative problem solving. The intervention also focuses on applying these
skills to simulations involving time management, education, physical protection and rights,
health, and community involvement. It evolves as girls age and regularly revisits topics,
adapting to stay age appropriate and relevant. Figures A1 and A2 contain histograms of
the number of life skills classes attended by subjects in grade six and seven, respectively.
While there was a growth in children who attended no classes between sixth and seventh
grade, overall attendance patterns are similar across both grades with complete attendance
the mode in both years.
6

While attending life skills classes, girls may miss some lessons in the primary classroom,
though this varies by school. In some schools, the boys had recess while the girls attended
life skills classes; in some schools, instruction continued. Any class time lost to life skills ses-
sions would not be expected to significantly impact academic performance given the limited
number of annual GEP classes, each of only an hour’s duration, and existing evidence on the
low returns to instructional time in Indian schools (see, for instance, Banerjee et al., 2007).
In addition to life skills sessions, the intervention entails twice-a-month small group
mentoring sessions proctored by the SM. In practice, these mentoring sessions served as
student-led discussion sections for the life skills lessons taught by the SM. SMs were trained
for these mentoring sessions to assist girls in identifying more personal difficulties in their
lives related to the life skills lessons and to help them to develop more personalized strategies
to cope with these difficulties.6
40 SMs were employed full-time as a part of this intervention during the two-year evalua-
tion period, with a maximum of 33 employed at any one time.7 The typical SM is responsible
for two schools (mean of 1.95). GEP aims to have 50 girls per SM. All the SMs (33 years
old on average) had completed both secondary and post-secondary education, and all were
from Ajmer district; within the district, 58% were from urban areas. Prior to the launch of
the intervention, SMs received 14 days of training, and an additional eight days of training
are provided at the start of each subsequent school year. Every eight SMs are supervised
by a program assistant, and each SM was observed quarterly to assess the quality of her life
skills session and to provide her with support to improve session delivery.
2.2.2 GEP post-evaluation period
In the original design, our partner only had funding for the GEP through grade seven, and
thus the endline survey would correspond to the conclusion of the program. However, GEP
has always been designed as a project continuing from sixth to twelfth grade, and our partner
6Earlier GEP descriptions presented these mentoring sessions differently. The description presented hereis updated based on the authors’ experiences from talking with students and SMs in Ajmer about their actualexperiences in the mentoring sessions. We also note that SMs were referred to as “female role models” inprevious project documents, including our published analysis plan.
7Of the 40 SMs involved in this evaluation, seven left at some point over the two years and were replacedwithin three months. One was released for poor performance, and others left for personal reasons such asmarriage or migration.
7

was successful in attaining programmatic funding to continue the GEP in treated schools
beyond the period of study. They did not begin treating the control schools, and did not
extend the program to other, non-study cohorts within treated schools.
However, in 2019 after the evaluation period, RtR added financial support to the GEP
in Ajmer. A needs assessment was conducted in fall 2018, and 268 girls began receiving
material support in 2019. Material support consisted of in-kind transfers of school supplies,
valued at an estimated 500 rupees or approximately $7.8 The addition of material support is
not relevant for our primary outcome measures collected in the endline survey, as the survey
was conducted prior to the rollout of the material support and the delivery of any associated
information (students did not anticipate this future source of material support). However,
this change is relevant for supplementary analysis conducted using administrative data, as
we also analyze data available post-endline, for eighth and ninth grade.
2.3 Hypotheses
This evaluation examines the impact of GEP on two primary sets of outcomes, non-cognitive
skills and school dropout. We also explore additional effects on ancillary outcomes: atten-
dance and time allocation, academic achievement, child marriage and child labor. These
hypotheses were pre-specified in an analysis plan that also included detailed definitions of
all variables of interest.
1. Hypothesis 1: GEP has no effect on life skills.
The GEP directly aims to strengthen girls’ life skills, and relevant outcome measures
include survey-based measures posed to girls and parents, demonstrating tasks, and an
enumerator assessment. Broadly, the questions focus on future planning, gender norms,
aspirations, empowerment, self-esteem, freedom of movement, and socio-emotional sup-
port. We construct normalized indices for these domains. In general, previous literature
has argued that interventions targeting non-cognitive skills can generate significant ef-
fects in adolescence given an overall high level of malleability of non-cognitive skills
8Preparation for assessing need for financial support began after the completion of the endline survey forall respondents other than a small number who had migrated (and was conducted by Room to Read, notthe research team).
8

(Heckman et al., 2006), and evidence from India suggests an intervention focused on
reshaping gender attitudes for adolescents had a significant effect in increasing support
for gender equality (Dhar et al., 2018).
2. Hypothesis 2: GEP has no effect on school dropout and other academic outcomes.
Part of the purpose of teaching girls life skills is to encourage engagement with school,
and the key outcome measure relevant to this hypothesis is school dropout. Previous
literature suggests that interventions targeting non-cognitive skills, negotiating skills
or educational expectations can generate shifts in school enrollment (as well as atten-
dance and cognitive skills) (Ashraf et al., 2020; Nguyen, 2008; Jensen, 2010).9 It is
also important to note that the relationship between a skills-building intervention and
dropout is more plausible in this setting given that financial barriers to enrollment are
less salient; both at baseline and endline, the modal household pays no school fees for
their daughters’ attendance.
3. Hypothesis 3: GEP has no ancillary effects on other academic outcomes, child marriage
and child labor.
Life skills education may shift a range of secondary outcomes. The intervention itself
may directly induce girls or their families to attend school more, or change their choices
around child marriage or child labor; in addition, if there are shifts in non-cognitive
skills or school progression, these effects may generate additional indirect effects in
other dimensions. In general, the literature on effects of interventions of this form on
child marriage and labor is limited. One recent paper found an intervention targeting
equitable gender attitudes among adolescents shifted time allocation for boys, but not
for girls (Dhar et al., 2018). Ashraf et al. (2020) finds that teaching negotiation skills to
girls in Zambia led to enhanced human capital outcomes across a range of dimensions.
9By contrast, Holmlund and Silva (2014) find that an intervention targeting non-cognitive skills did notenhance cognitive skills.
9

3 Empirical Strategy
3.1 Evaluation Design
This evaluation is a clustered randomized trial with an allocation rate that was intended
to be 1:1, conducted in 119 schools in Ajmer district in Rajasthan between 2015 and 2019.
Given that GEP is delivered at the school level to all girls enrolled in the target grades of
interest, a cluster randomization is appropriate.
Implementation of GEP was initiated in July 2016 at the beginning of the school year.
At the time of design, RtR committed to running GEP in treated schools through the school
year ending in the spring of 2018, with the goal of continuing GEP in these schools past that
date if possible. Again, for the purposes of this analysis, we define the evaluation period
as 2016 to 2018, corresponding to grades six and seven. As noted above, GEP did in fact
continue post-2018 with the addition of material support, and accordingly we also report
additional results analyzing administrative data from this post-evaluation period. Figure 1
summarizes the evaluation timeline.
This evaluation draws on a pre-analysis plan registered prior to the baseline survey (Ed-
monds et al., 2016). A detailed final evaluation report (Edmonds et al., 2019) fully popu-
lated the pre-analysis plan without deviations, and is publicly available on-line.10 This paper
draws on this plan and also supplements it, noting where relevant that some analysis was
not pre-specified.
3.1.1 Randomization
The selection of schools eligible for inclusion in this evaluation was undertaken between
August and November 2015. A team of enumerators visited all schools in Ajmer that included
girls enrolled in the relevant grades (six through eight) and collected information about school
facilities, staffing, and enrollment. This information was also linked to administrative records
about school facilities and enrollment provided by state educational authorities.
The evaluation team and RtR then jointly identified criteria that would determine whether
or not a school was eligible for inclusion in the evaluation. These criteria included the re-
10The report can be found at https://sites.dartmouth.edu/eedmonds/gep/.
10

quirements that the schools enrolled girls in grades six through eight, did not have any other
non-governmental organizations providing life skills curricula to students, and had a class-
room in acceptable condition in which a life skills class could take place. The evaluation
team then identified the narrowest possible range of enrollments that would yield a sample
of schools enrolling 2500 girls in total; the objective was to have a relatively homogeneous
sample of schools in terms of size. This yielded the requirement that the school enrolled
between 16 and 32 girls in grade five.
Using information collected in the school survey, the research team created a normalized
school quality index, composed of measures of teacher experience, teachers’ educational
attainment, and classroom and school infrastructure quality. Schools above the median
of the index were included in the “high quality” stratum, with the remaining in the “low
quality” stratum. School assignment to treatment was conducted separately for the two
strata. Randomization was conducted in Stata by the research team.11
In order to identify the target sample of girls, a team of enumerators visited each school
between December 2015 and January 2016 to obtain a roster of all girls enrolled in grade
five. All female students who were currently enrolled in grade five in these schools as of
January 2016 (2,543 female students in total) were eligible for inclusion in the evaluation.
3.1.2 Data Collection and Processing
The selection of schools and randomization process was conducted in fall 2015. Baseline
data was collected between February and June 2016 prior to the launch of the intervention;
a household survey was administered to the child’s caregiver, and a direct interview of the
girl potentially eligible for treatment was conducted. All data collection was conducted
electronically in SurveyCTO. Details regarding data collection and consent processes are
provided in Section A.1 in the Appendix.
11Following the initiation of data collection, it was discovered that three of the schools selected to bein the sample in fact did not enroll girls past grade five; for the upper-level grades, these were single-sexschools including only boys. During the sample selection process, these schools were incorrectly designatedas including higher-grade girls as well. These three schools (two treatment and one control school) weredropped, and an additional three schools were selected to replace them, constituting an additional thirdstrata. The replacement process for these schools entailed identifying 12 schools that met the eligibilitycriteria if the enrollment window was slightly lowered to 15. Three schools were randomly chosen to join thesample among the 12, and of these, two were randomly assigned to the treatment group.
11
Following the baseline survey, the sample girls were revisited for tracking surveys in
December 2016 and December 2017. The endline survey was conducted between July 2018
and December 2018. Baseline and endline surveys included both a household module and a
child module for every girl in the sample, while only girls were surveyed for each of the two
shorter tracking surveys. Consent was obtained separately for each subsequent survey.
3.1.3 Administrative Data Collection
In addition, administrative records from schools and RtR were also collected throughout the
evaluation period and post-endline through July 2019. Administrative data from schools
include enrollment and reported grades. It should be noted that in the majority of cases,
our test score records are drawn from gradebooks where teachers hand copied student marks;
accordingly, the potential for measurement error is non-trivial, a challenge we explore further
in the results presented in Section 4.
Two points should be noted about the administrative data collection. First, given that
its availability was not foreseen ex ante, this analysis was not pre-specified. Second, given
the post-endline data collection, administrative data is available beyond the core evaluation
period: grades are available through the conclusion of grade eight, and dropout information
is available through early in grade nine.12
3.1.4 Evaluation Sample
At baseline, the survey team visited every one of the 2,543 girls on the enrollment lists
provided by sampled schools; the survey was conducted before students or their families
were informed about the life skills education program. Ultimately, any girl on the enrollment
lists with either a completed household or child survey is considered to be enrolled into the
evaluation. (In some cases, there are multiple sample girls in the same household.) Out of
the 2,543 female students on the grade five enrollment lists, a total of 2,459 girls from 2,382
households were enrolled into the evaluation sample. Thus the evaluation includes 97% of
12In addition, administrative data from RtR report girls’ participation in the intervention, including lifeskills sessions and mentoring. The research team also oversaw qualitative data collection at each phase ofthe evaluation, including in-depth interviews with girls in a subset of treatment schools as well as theircaregivers.
12

the girls in the sampled school rosters.
However, not every girl who was part of the evaluation sample was interviewed at baseline;
there were cases in which only the household survey was completed, as well as a smaller
number of cases in which only the girl survey was conducted.13 There were 2,353 household
surveys conducted at baseline, which provide parent-reported data for 2,427 girls, and 2,399
individual girl surveys conducted at baseline. A flow chart summarizing the sample of girls
surveyed and their inclusion in different evaluation phases can be found in Figure A3. There
were 84 children who were on the school enrollment lists but excluded from the evaluation
because of failure to complete any component of the baseline survey.14
Summary statistics for the child outcomes mapped out in the evaluation design plan are
provided in Appendix Tables A2 and A3. 3% of the sampled children had already dropped
out of school at baseline. However, conditional on enrollment, 89% attended school in the
past week, and girls attended 79% of the days the school was open. While the modal girl
in our study is at an appropriate age for grade 5 (age 10-11), approximately a third of
the sampled girls were older. 17% of the sampled girls were married at baseline. 87% of
respondents engaged in child labor during the twelve months before the baseline survey, and
64% of respondents engaged in hazardous child labor. On average, children were not working
full time.
Attrition The analysis sample includes all sampled girls represented in the endline survey,
conducted between July 2018 and December 2018. At endline, 2,387 child surveys and 2,358
household surveys were conducted. There were 48 girls (in 47 households) for whom a
13In addition, 16 girls living in 14 separate households from one primary school were omitted from thebaseline in error. A different set of students enrolled in an alternative, adjacent primary school that is outsidethe evaluation sample were surveyed in their place. Given that these girls were not intended for inclusion inthe sample, their data was subsequently dropped, and the correct set of girls were surveyed from the firsttracking survey forward. These girls are considered to be enrolled in the evaluation, though they were notsurveyed at baseline.
14Of these 84 cases, 34 were from households that had permanently migrated prior to the date on whichthe survey team visited the community — a fact reported by neighbors or other community informants —or simply could not be located. 33 were excluded because they did not provide consent. The reasons fornon-inclusion for the remaining girls varied but included illness or death of the child (4); parents who wereuniformly unavailable during survey hours and thus could not be surveyed or provide consent for the childto be surveyed (3); and cases in which the child was away from home and parents declined to participate inher absence (10).
13

household survey was conducted without a child survey.15 There was also one girl surveyed
whose household did not complete an endline survey. In addition, 24 girls in 23 different
households attrited fully at endline with no data collection completed.16 Attrition patterns
are summarized graphically in Figure A4. Within the sample of 2459 girls randomized, we
have some endline information for 2435 girls, generating an attrition rate below 1 percent.
Attrition does not appear to be a source of bias in our intent to treat analysis. Among
the 24 girls who fully attrited, 15 are from the control arm and 9 are from the treatment
arm, corresponding to attrition rates of 0.7% and 1.2% in the treatment and control groups,
respectively; the probability of full attrition is not significantly correlated with treatment,
conditional on strata fixed effects (β=-.004, p=.362). The girls’ survey is used in many of
the life skills indexes, and 72 girls did not complete it. 45 are from the control arm and 27
are from the treatment arm, corresponding to attrition rates of 3.6% and 2.2%, respectively;
this difference in attrition on the girls’ survey is significant at the 10 percent level (β=-
.014, p=.087). In the Appendix, we conduct a series of bounding exercises to evaluate the
sensitivity of our findings to attrition. Attrition does not substantively affect the empirical
results under reasonable assumptions regarding the distribution of missing values.
3.2 Statistical Model
To identify the impacts of assignment to treatment, we estimate the following pre-specified
regression. Each outcome Yist for child i in school s measured at time t is regressed on a
dummy for treatment assignment Ts and randomization strata fixed effects µs. The specifi-
cation also includes a vector of age dummies γi , a vector of dummies λi capturing the most
important type of employment in the household at baseline, the lagged (baseline) value of
the relevant outcome Yis,t−1, and additional controls for baseline variables where imbalance
was detected between the treatment and control households, reported in Tables A1 through
15In 14 cases, consent was declined for the girl survey. 19 girls had migrated away from their householdspermanently; two had migrated temporarily and had not returned by the point at which the survey concluded.Four child surveys were not completed due to the death of the child, and nine child surveys were not completeddue to child disability. In these nine cases, the child was similarly not surveyed at baseline, but a householdsurvey was completed at both baseline and endline.
16In 10 cases, the household had migrated and could not be reached for follow-up. Consent was declined in12 cases. In one case, a partial survey was completed but the household declined to continue due to limitedtime, and in one case, no information was available about the household’s whereabouts.
14
A3 and discussed in more detail below. These baseline variables are denoted ξis,t−1.17
Yist = β1Ts + β2Yis,t−1 + β3ξis,t−1 + µs + γi + λi + εist (1)
We also estimate two simpler specifications, similarly pre-specified, to evaluate the ro-
bustness of these results: one specification including only the treatment dummy and strata
fixed effects, and one specification including only the additional control variables γi, λi, and
Yis,t−1. These additional results are reported in the Appendix, but we focus on results from
equation (1) in order to maximize precision (we never reject the null hypothesis of no change
in treatment effects associated with the added controls).
In all specifications, standard errors are clustered at the school level, yielding 119 clusters.
Given that there are a large volume of hypotheses tested regarding life skills, false discoveries
(type 1 errors) are probable. Accordingly, for all life skill measures, we present false discovery
rate adjusted q-values computed across all life skill outcomes using the same specification
(Benjamini and Hochberg, 1995). For completeness, we also present false discovery rate
adjusted q-values computed separately for dropout and other academic outcomes as well as
for ancillary outcomes, although our original analysis plan only specified q-values for the life
skills questions.
3.2.1 Balance
We pre-specified tests for balance from randomization across a wide variety of variables, and
accordingly given 61 individual hypothesis tests, there is ample scope for type 1 errors. The
results are reported in Tables A1 through A3. In the column labeled “Difference”, we report
the coefficients from a simple regression in which the characteristics of interest are regressed
17For the family of outcomes corresponding to school dropout and other academic outcomes (Hypothesis2), age at enrollment and maternal education are additionally included as control variables in equation (1);this methodology was pre-specified in the analysis plan. If the baseline control variable is missing becauseeither the household or child survey was not conducted for a particular girl at baseline, the missing value iscoded as zero. Additional dummy variables equal to one for observations with missing values are includedfor each baseline covariate. For non-cognitive outcome measures added at endline (the Rotter locus ofcontrol, the perceived stress index, the Rosenberg self-esteem index), we control for lagged values of overalllife skills indices. For the ASER test scores added at endline, we control for baseline school dropout status,attendance, grade progression, time spent studying, hours spent on school and grades in grade five as reportedin administrative data. These methodologies for addressing missing baseline values were all pre-specified inthe evaluation design plan addendum.
15

on a treatment indicator and strata dummies, clustering standard errors at the school. False
discovery rate adjusted q-values using the same specification are reported in the final column
(Benjamini and Hochberg, 1995).
Under a true null of no difference between treatment and control, we expect six false
rejections at 10 percent, and observe eight such rejections; similarly, we expect three re-
jections of the null at the five percent level, and observe exactly three. The smallest false
discovery rate is 23 percent, and seven of the eight differences that are significant at the
ten percent level have false discovery rates above 50 percent. For the 19 household char-
acteristics reported, we also estimate a seemingly unrelated regression (SUR) specification
that tests the joint null hypothesis that the treatment coefficient is equal to zero across all
characteristics, and fail to reject the null (p = .138). That same SUR test applied to all
of the child characteristics rejects the null of no joint difference (p = .003). This rejection
is driven by the child work related variables; however, only the indicator for whether child
works has a p-value below 0.05 and a false discovery rate below 25 percent (it is 23 percent).
Given the high false discovery rates, we do not think baseline imbalance poses a significant
risk of bias, but our preferred specification controls for all of the variables with individual
differences significant at 10 percent. In practice, these controls add precision, and, as noted,
we never reject the null hypothesis of no change in treatment effects with the added controls.
4 Findings
4.1 Life Skills
The GEP program aims to promote the agency of girls by teaching them life skills, and even
in our setting with extreme gender disadvantage, we document substantial and statistically
significant enhancements in life skills for girls assigned to treatment. We fielded 259 indi-
vidual questions related to life skills measurement in the endline survey in addition to four
demonstration tasks.18 In our analysis plan, we pre-specified how these questions would be
combined into indices of life skills corresponding to our partner’s conceptualization of cat-
18The principal focus of the first year of this project was on piloting different ways to measure life skillsfor both our questionnaires and our partner’s internal global monitoring and evaluation efforts.
16

egories of life skills. The primary findings discussed here are based on estimating equation
(1) and summary findings are presented in graphical form in Figure 2, with the correspond-
ing complete coefficients presented in Tables 2 and 3.19 We also present some illustrative
regression results for individual sub-component questions of indices when useful, and these
results are reported in Tables A8 through A10 in the Appendix.
Girls assigned to treatment show improvements in future planning, as evident in Column
(1) of Panel A in Table 2. The future planning index is constructed around a series of ques-
tions that ask girls about concrete goals they have for the future as well as their motivation
for thinking about these goals and developing a plan to achieve them; treatment leads girls
to express these goals and the steps to achieving them more completely. We also observe
that treatment girls express more positive gender norms (Column (2)). The gender norms
index consists of a series of opinions offered on statements that reflect different treatment
of boys and girls. Relative to girls in the control group, treatment girls feel that boys and
girls should be treated more similarly. Interestingly, while girls show improvements in future
planning and articulated gender norms, they do not express greater aspirations about what
type of life or career they will have in the future relative to the control sample (Column (3)).
Curiously, treatment girls report more negative marriage expectations with treatment
(Column (4), Panel A of Table 2). The shift in the marital expectations index is driven
primarily by a shift downward in the top of the distribution of desired and expected marriage
ages. The GEP curriculum strongly emphasizes 18 as the appropriate minimum age of
marriage, and treatment girls are then more likely to report 18 as the desired age of marriage
relative to both younger and older desired ages.
Girls assigned to treatment articulate a stronger sense of empowerment (Column (5),
Panel A of Table 2). The empowerment index consists of questions about who makes deci-
sions in the girl’s life over a variety of different domains, and girls assigned to treatment feel
that they have more say in what happens in their lives. For example, girls exposed to treat-
ment report a 17 percent increase in the probability they feel they are the sole decision-maker
about whether to attend school, a 29 percent increase in the probability they feel they are
19Figure 2 presents primarily results from Table 2, in addition to three selected variables from Table 3.Additional specifications are presented for robustness in Tables A4 through A7 in the Appendix.
17

the sole decision-maker about whether to work, and a 32 percent increase in the probability
they feel that they can talk to their parents about marriage.20 However, despite this increase
in empowerment, treatment girls do not express more self-esteem or report greater freedom
of movement (Column (6), Panel A, and Column (1), Panel B of Table 2).
Treatment also increases girls’ sense of socio-emotional support (Column (2), Panel B of
Table 2). This index is composed of questions about friends and the support they offer, and
we observe improvements in all the index components. Preferring to be alone (as reported
by parents) declines by 14 percent, meeting friends outside of school increases by 7 percent,
reporting a place to meet friends increases by 13 percent, and reporting a place to stay
if needed increases by 4 percent.21 In addition, the amount of time reported devoted to
socialization (in minutes) increases by 25 percent, reports of phone use double, and total
time on the phone increases by more than 400 percent (for phone use, the mean is near zero
in the control arm). Even our school travel time measures are consistent with increases in
social engagement: conditional on attending school, treatment girls are not more likely to
change schools or report a shift in their physical distance from school. However, it seems to
take them 24 percent more time to travel to school post treatment.22
We measure life satisfaction with Cantril’s ladder and common measures of locus of
control, perceived stress, and self-esteem. Here, we cannot reject the null of no change in
these measures of life satisfaction (Columns (3) through (6), Panel B, Table 2). Confidence
intervals are large relative to coefficients on all of these measures, and it is not obvious that a
life skills intervention that builds awareness of challenges in adolescent life would be expected
to improve life satisfaction.
We supplement the self-reported responses around life skills with several additional
sources of data. We ask parents to assess the life skills of their daughters, and cannot
reject the null hypothesis of no treatment effect for parental perceptions of girls’ self-efficacy
and freedom of movement, as well as parental attitudes around gender norms, schooling and
20These results are reported in Appendix Table A8; the questions are all subcomponents of the empower-ment index.
21These results are reported in Columns (1) through (4) of Appendix Table A9. The parental-reportedvariable around the preference to be alone is not part of the socio-emotional support index.
22Results for time use are also reported in Appendix Table A9. The analysis of time allocated to social-ization was not pre-specified, and is not part of the socio-emotional support index.
18

marriage (Columns (2) through (7), Panel A of Table 3). We observe a decline in parents’
assessment of girls’ strengths, as reported in Column (1) of the same table; this primarily
reflects a perception by parents that girls are less considerate and less willing to help.23 This
finding is similar to that reported by Ashraf et al. (2020), who document that mothers view
their daughters more negatively following their engagement in a negotiating skills interven-
tion. In addition, we developed four demonstration tasks for life skills, including a scavenger
hunt that was designed to demonstrate life skills by having girls negotiate challenges in
finding common items. We find no effects of treatment on any of the demonstration tasks
(Columns (1) through (4), Panel B of Table 3). Though these demonstration tasks did well
in pre-testing, in fielding substantial implementation challenges arose that complicate the
interpretation of these failures to reject.24
Improvements in life skills are also apparent to enumerators who are blind to the child’s
treatment status. We ask enumerators to directly assess girls based on their focus in the
interview, attentiveness, responsiveness, and articulateness. Here, we find a statistically
significant improvement in enumerator assessment of the girl’s demonstration of these life
skills in the interview, equal to approximately 0.1 standard deviation (Column (5), Panel B
of Table 3).
Dhar et al. (2018) highlights that measures of life skills are vulnerable to parroting back
the lessons taught in life skills classes as well as social desirability bias if the intervention
builds awareness in subjects about the “right” answers. For example, future planning ac-
tivities are a part of the GEP curriculum, and thus we cannot differentiate whether the
enhanced future planning expression comes from in-program activities or broader impacts
on how girls think about their futures. Similarly, questions about equitable gender norms
are closely related to the content of many GEP classes, and thus these responses could reflect
a parroting of class lessons (although these surveys are conducted in private at home, where
if anything social pressure might run against an expression of the more progressive values
23These results are reported in Columns (1) and (2) of Appendix Table A10.24Specifically, we observed that girls’ efforts on the mirror drawing task varied based on the particular
environment in which they were surveyed. The within-girl correlation between baseline and endline measuresis only 0.06. For the scavenger hunt, variation in the time between the two required surveyor visits (one tointroduce the scavenger hunt and one to assess scavenger hunt success), in addition to overall delays in thetiming of surveyor re-visits, seems to have limited the signal value of the associated measures.
19

implied by class content).
On this parroting concern, our findings that parents and enumerators both report changes
in treatment children are relevant. Also, it is important to bear in mind that the timing of
our survey is such that most subjects are interviewed at endline approximately six months
following the final life skills class.25 In our view, the parroting that we might be capturing
after six months reflects a degree of internalization of information that is a goal of the
intervention, and is very different than asking girls questions shortly after a class ends. That
said, we evaluate parroting / social desirability bias using two robustness checks.26
First, to assess parroting, we classify 90 individual life skills questions posed in the
endline survey based on whether they are explicitly addressed in the grade six or grade
seven curriculum or addressed only indirectly. This distinction is based on whether we could
identify an exact curricular match to the question; all of the life skills that we classify as
not explicitly addressed may be indirectly addressed in the program. We then construct
separate indices characterizing responses to explicitly versus indirectly addressed questions,
and estimate the treatment effects for these indices. We find a treatment effect of 0.056
SD for the explicitly addressed questions index (standard error of 0.018) and an effect of
0.016 SD for the indirectly addressed questions index (standard error of 0.019). However, we
know that the marital expectations questions show an effect in the opposite direction of that
hypothesized, and many marital expectations questions are in the indirect questions index.
If we exclude the five questions related to marriage age that are included in the marital
expectations index, the treatment effect for the indirectly addressed questions index rises to
0.040 SD (standard error of 0.020), and we cannot reject the hypothesis that the treatment
effects for indirect and direct questions are equal in magnitude.27
Second, to assess social desirability bias, we use the baseline data to gauge the extent
to which a child is inclined to provide socially desirable answers. Specifically, in Appendix
Tables A11 and A12, we employ a social desirability index that is constructed based on three
25Our surveys are largely collected in July and August; classes ended in February before seventh gradeexams and eighth grade life skills classes did not resume until October.
26This analysis was not pre-specified.27Complete regression results for every non-cognitive question posed in the survey, categorized as directly
or indirectly addressed, are available in Table 13 of the final evaluation report (Edmonds et al., 2019). Thereport can be found on-line at https://sites.dartmouth.edu/eedmonds/gep/.
20

component responses from the baseline child survey: (1) an indicator for whether the girl
reports that she wants to become a “Teacher/School head/Educator” when she grows up,
(2) an indicator for whether she reports that she is currently living “the best possible life,”
and (3) an indicator for whether the surveyor recorded that the girl paid close attention
“the whole time” when receiving instructions during the survey. We view these three survey
measures as the baseline questions that best capture girls’ proclivity to offer responses or
to engage in behaviors that would be perceived as socially desirable (and most analogous to
how Dhar et al. (2018) execute a similar test). We analyze heterogeneous treatment effects
based on whether a child is above the median value of this social desirability index. Above-
median index values are highly predictive of more positive expression of life skills in both
control and treatment groups. We do not reject the null that treatment effects are the same
regardless of whether the child is above or below the median social desirability index.
In sum, six months after the conclusion of the second year of life skills classes, we see
enhancements in future planning, attitudes towards gender norms, empowerment, and socio-
emotional support. Enumerators similarly document these improvements in girls, and par-
ents, whose attitudes do not seem to change measurably with daughter’s engagement in
treatment, report treatment girls acting more in their own self interest. We do not see evi-
dence consistent with these findings being driven by parroting or an attempt by treated girls
to give more socially desirable answers. In the next section, we see that treatment is also
associated with a reduction in school dropout.
4.2 Education
The program evaluated here is called the Girls Education Program, because its primary
purpose is to advance the education of girls. Following two years of treatment, the endline
survey conducted at the end of seventh grade documents that GEP is generating a decline
in dropout and an increase in grade progression, as captured graphically in Figure 3. Again,
Figure 3 is based on estimating equation (1), and the corresponding regression results are
provided in Table 4.28 Treatment girls are four percentage points less likely to have dropped
out at endline (after 7th grade), corresponding to a 31 percent reduction relative to the
28Additional specifications are reported in Appendix Tables A13 through A16 in the Appendix.
21

control group dropout rate of 13.2 percent. We similarly observe a four percentage point
increase in progression to grade seven, suggesting that treatment girls remain with their
same cohort as they progress through school (Columns (1) and (2) of Table 4).
The impact of treatment on dropout seems persistent. A year after endline, we compiled
school administrative records on dropout and test scores as of the start of grade nine; this
analysis was not pre-specified, as we did not anticipate access to this data, but it allows us
to identify the effect of the treatment on dropout in grades six through eight and at the
transition into high school in grade nine, a frequent point of dropout for girls. The results
suggest that the treatment effect on dropout increases from endline through grade eight
and grade nine, and remains statistically significant (Columns (3) through (6), Table 4).29
Because the grade nine records were collected at the start of the school year in late July
2019, they differ from other records based on attendance throughout the school year; data
is available only about how many days the child attended school in the last seven days, and
how many days the school was open in that period. Hence, defining dropout based on this
measure will have substantive measurement error if there is any irregularity in attendance,
and the evidence suggests irregularity is non-trivial. Accordingly, the findings for grade
nine are estimated using a modified version of specification (1) that also controls directly
for the number of days the school was reported open. Without controlling for this form of
measurement error from days open, we find a noisy zero effect of treatment on dropout in
grade nine (not presented).
In addition, we pool the dropout measures into an index in order to address multiple
hypothesis testing concerns; including grade six where there is no treatment effect, we observe
a statistically significant decline in dropout overall in the administrative records (t-statistic
of 2.6, Column (7) of Table 4). While in percentage terms, the largest effect is observed
in grade seven, the magnitude of the treatment effects is relatively consistent (around 25
percent). If we conduct a bounding exercise in the administrative records where we assume
29In the administrative records, we observe a slightly smaller impact of treatment on dropout in gradeseven compared to the household survey. This discrepancy might reflect that a girl is in the administrativerecords for grade seven if she attended school at all during the grade seven school year, while the endlinesurvey response reflects whether she views herself as a dropout after the conclusion of grade seven. Inaddition, in interpreting these results, it is important to note that grades eight and nine correspond to thepost-evaluation period during which some limited material support was rolled out.
22

all girls with missing records have dropped out or all girls with missing records have attended,
we observe no substantive change in estimates of treatment effects (reported in Table A17 in
the Appendix) as selection into the administrative records is not correlated with treatment.
Despite these substantial effects on dropout in treatment schools, however, we do not
observe any significant shift in other academic outcomes. There is no increase in attendance
conditional on enrollment in grade seven (self-reported in the endline survey) as reported in
Columns (1) and (2), Panel A of Table 5. However, reported attendance is extremely high:
the mean reported past-week attendance rate for control girls was 92%, suggesting limited
power to detect any effects.30 We also do not observe any significant shift in girls’ reported
time spent studying, as reported in Columns (3) and (4) of the same panel.
In addition, we do not observe any meaningful improvements in girls’ measured cognitive
skills. We administered ASER tests in the endline survey (at the conclusion of grade seven)
and cannot reject the null of no treatment effect, as reported in Columns (1) through (3),
Panel B of Table 5.31 We similarly observe no positive effect on administratively reported
test scores in grades six, seven or eight for enrolled girls, based on records compiled from
evaluation schools (Columns (4) through (6) of the same panel).32 Further exploration of
the effects on school test scores, including analysis of any potential bias induced by selection
into test attendance, is reported in Appendix Tables A18 and A19.33
The growth in social engagement documented in the previous section provides an interest-
30These attendance results are based on the endline survey. We also examine effects on attendance usingadministrative data reported by the schools, and similarly observe a null effect; these results are not reported,given that we conjecture measurement error is substantial.
31In Table 5, controls for baseline outcome values cannot be included for cognitive test measures sincecognitive tests were not conducted at baseline; specification (1) instead includes controls for baseline schooldropout status, attendance, grade progression, time spent studying, hours spent on school, and grades asreported in grade five.
32Analysis of school administrative records was not pre-specified, but we follow the same analytical strategyas in the pre-specified analysis. There is heterogeneity within schools across years and across schools in howyear-end exams are scored, and thus for comparability purposes, we have computed an average GPA acrossthe three tests based on the letter grades associated with the numerical test scores. One obvious concernmight be that negative selection in students who do not drop out is masking the gain in test scores forhigher-achieving students. While dropouts are indeed negatively selected, we similarly do not see positiveeffects on test scores among students who were higher-achieving at baseline.
33A negative and significant effect of treatment on grade six grades is in fact observed in Column (4),Panel B in Table 5. This effect is unlikely to reflect differential selection in school continuity as treatmentis only associated with an eight tenths of one percent reduction in dropout in this grade; alternatively, thismay be an artifact of the volume of hypothesis tests. The false discovery rate associated with this test is 36percent.
23

ing explanation for why we might see a reduction in dropout without a rise in attendance or
academic performance. In our qualitative fieldwork, one particularly insightful head teacher
remarked that the GEP program was effective in inducing girls to stay in school to be with
their friends without any improvements in their performance, and our results are consistent
with her experience. An increase in social support may make it easier to miss school, as
friends can assist to make up any missed material, counterbalancing any increased desire to
attend. For academic performance, additional social engagement may offset whatever gains
might otherwise result from increased future planning and growth in motivation. We also
observe that treatment leads to a decline in private tutoring; this is presumably replaced by
group-based social activities, as we do not observe any change in time spent studying.
Enhanced social support may also help girls to overcome salient socioemotional chal-
lenges: for example, in our qualitative work, we heard frequently that teasing is a significant
challenge that increases dropout. While girls learn in one life skills class to ignore teasing, a
collective response to teasing may be more effective than an individual response, suggesting
that strengthened friendship networks may serve to amplify direct effects of treatment in
addition to independently influencing dropout propensity.
An alternate interpretation of the observed effects on dropout is that the intervention
develops girls’ agency, and they use this agency to negotiate with their parents to remain
in school. There is ample evidence in our findings to suggest that treatment improves girls’
ability to advocate for themselves. However, it is not clear that girls’ preference for more
education significantly diverges from parental preferences. In the control sample at endline,
two-thirds of parents report that they expect their daughters will complete at least senior
secondary school, and 71 percent expect their daughters will complete at least five more
years of schooling (beyond grade seven). Moreover, 54 percent of parents think that being
well-educated is an important characteristic for a potential daughter-in-law, and 74 percent
believe that girls need to pursue higher education. As such, it is not obvious that parents are
less enthusiastic about their daughters’ schooling than the girls themselves; while girls do
seem to be more empowered, and this may be an important broader channel for intervention
effects, they may not be required to deploy this sense of empowerment vis-a-vis their parents
24

in order to remain in school.34
Treatment could also reduce dropout if it changed parents’ or girls’ perception of the
returns to education. We have already documented above that we did not observe a mean-
ingful change in parental attitudes, and for girls themselves, we do not see any evidence of
greater aspirations, including a shift in the desire to work for wages, a desire to work in an
occupation that requires secondary schooling, or how much education girls hope to complete
(as reported in Columns (3) through (5), Table A10). For this last outcome, 93 percent of
girls in the control arm report wanting to complete secondary schooling, and the confidence
interval on the treatment effect ranges between -2.5 and 2.6 percentage points.
4.3 Ancillary Analysis
In our pre-analysis plan, we specified an analysis of intervention effects on child marriage,
child labor and child time allocation. In general, as shown in Appendix Table A20, the
effects of treatment on ancillary outcomes are insignificant and inconsistent in sign. In Ap-
pendices A.2 and A.3, we further explore the robustness of the primary results to alternative
assumptions about attrition, and find that the primary effects remain generally consistent
in magnitude and significance. In Appendix A.4, we examine heterogeneous effects with
respect to a number of pre-specified baseline covariates, and find no evidence of meaningful
heterogeneity.
5 Conclusion
In this paper, we analyze evidence around an intervention aimed at improving the life skills
of adolescent girls. The target population for the intervention was girls attending fifth grade
in government schools in Ajmer, Rajasthan, India, and the intervention provided girls with
twice-monthly life skills classes during sixth and seventh grade, taught in school by trained
social mobilizers delivering a curriculum developed by our partner organization. The modal
treatment girl attended all the life skill classes offered.
34These patterns are also consistent with Bursztyn and Coffman (2012), who find that parents valuetheir children’s attendance at school, and accordingly value conditionality in cash transfers as a strategy tomanipulate child school attendance.
25

Treatment is associated with improvements in life skills around future planning, em-
powerment and socio-emotional support. Girls expressed improved gender norms and felt
improvements in socio-emotional support, evident in a range of dimensions including a 25 per-
cent increase in time spent socializing with friends. We also observed a 30 percent reduction
in school dropout by grade seven with a corresponding improvement in school progression.
Subsequent to endline, we were able to revisit study schools, and found that the reduction
in dropout persisted at around 25 percent through the transition to high school.
While random assignment to life skills classes led to a reduction in dropout and improved
expressions in life skills, there are a host of adolescent life outcomes that do not seem to
have been impacted by treatment: test scores, child labor, and marriage being among the
most important. The finding of a lack of improvement in test scores is consistent with
many other studies in the life skills space (e.g. Holmlund and Silva, 2014; Delavallade et
al., 2017). In our context of reduced dropout, this naturally raises the question of whether
continued school enrollment is valuable in itself. It is possible to have financial returns to
education that are not proxied by test scores. Moreover, even if school performance does not
change differentially with treatment, eighth graders still know more than seventh graders,
and treatment improves school progression. Continued enrollment may also facilitate delayed
fertility, and this may be especially relevant in our setting with pervasive child marriage. The
literature on returns to female education further highlights the value of remaining in school
for the life skills, experiences, and social relationships that education can help foster. Given
that we observe a direct treatment effect on socio-emotional support, treatment can be
valuable even it does not promote test-measured learning.
Room to Read’s Girls Education Program usually includes outreach and financial sup-
port that was not delivered in the study area. While we are able to evaluate the impact
of the life skills component of the program in isolation, our study is nonetheless related to
recent research evaluating multifaceted interventions that combine life skills training with
other social services such as Save the Children’s Safe Spaces (Buchmann et al., 2017) and
BRAC’s Empowerment and Livelihood for Adolescents (ELA) program (Bandiera et al.,
2019, 2020). While both Safe Spaces and ELA target older girls than our study, they both
document improvements in schooling. Our finding that life skills training (separate from the
26

other components of ELA or Safe Spaces) increases education while building social relation-
ships highlights the potential importance of that specific component of these multifaceted
programs. Relatedly, our finding that life skills alone is not sufficient to influence some of the
important life decisions that ELA impacts also highlights the additional value of other com-
ponents of the multifaceted approach, despite the non-experimental evidence in Bandiera et
al. (2020) that emphasizes the contribution of life skills training in particular.
Our study delivery method also highlights the tradeoffs inherent in targeting decisions
related to life skills programs. Both ELA and Safe Spaces use time and space outside of
schools. This allows them to reach more marginalized girls not associated with a school
absent the program. However, they face much lower take-up than our school based inter-
vention. While 85 percent of our subjects are still engaged after two years, Safe Spaces
only induced 56 percent of girls to attend one class, and ELA take-up in Uganda was below
25 percent. In our context, not only is it easy to reach girls within school, but the girls
already have within-school social relationships that can be leveraged. To the extent that
the reinforcement and deepening of those social relationships are important in our dropout
results, such dynamics might not be present in an intervention targeting out of school girls.
Better understanding how social relationships can be leveraged to improve schooling seems
a promising area for future research.
6 References
Ashraf, Nava, Natalie Bau, Corinne Low, and Kathleen McGinn, “Negotiatinga better future: How interpersonal skills facilitate inter-generational investment,” TheQuarterly Journal of Economics, 2020, 135, 1095–1151.
Baird, Sarah J, Ephraim Chirwa, Jacobus De Hoop, and Berk Ozler, “Girl power:cash transfers and adolescent welfare. Evidence from a cluster-randomized experiment inMalawi,” Technical Report, National Bureau of Economic Research 2013.
Bandiera, Oriana, Niklas Buehren, Markus P Goldstein, Imran Rasul, and An-drea Smurra, The Economic Lives of Young Women in the Time of Ebola: Lessons froman Empowerment Program, The World Bank, 2019.
, , Robin Burgess, Markus Goldstein, Selim Gulesci, Imran Rasul, and Mun-shi Sulaiman, “Women’s empowerment in action: evidence from a randomized controltrial in Africa,” American Economic Journal: Applied Economics, 2020, 12 (1), 210–259.
27
Banerjee, Abhijit, Shawn Cole, Esther Duflo, and Leigh Linden, “Remedying Ed-ucation: Evidence from Two Randomized Experiments in India,” Quarterly Journal ofEconomics, 2007, 122 (7), 1235–1264.
Benjamini, Yoav and Yosef Hochberg, “Controlling the false discovery rate: A practicaland powerful approach to multiple testing,” Journal of Human Capital, 1995, 57, 289–300.
Berry, James, “Child Control in Education Decisions An Evaluation of Targeted Incentivesto Learn in India,” Journal of Human Resources, 2015, 50 (4), 1051–1080.
Buchmann, Nina, Erica Field, Rachel Glennerster, Shahana Nazneen, SvetlanaPimkina, and Iman Sen, “Power vs money: Alternative approaches to reducing childmarriage in Bangladesh, a randomized control trial,” Unpublished Manuscript, 2017.
Bursztyn, Leonardo and Lucas C Coffman, “The schooling decision: Family prefer-ences, intergenerational conflict, and moral hazard in the Brazilian favelas,” Journal ofPolitical Economy, 2012, 120 (3), 359–397.
, Georgy Egorov, and Robert Jensen, “Cool to be smart or smart to be cool? Un-derstanding peer pressure in education,” 2017.
Carrell, Scott E and Mark Hoekstra, “Are school counselors an effective educationinput?,” Economics Letters, 2014, 125 (1), 66–69.
Cunha, Flavio, James J Heckman, Lance Lochner, and Dimitriy V Masterov,“Interpreting the evidence on life cycle skill formation,” Handbook of the Economics ofEducation, 2006, 1, 697–812.
DeJaeghere, Joan and Aditi Arur, “Girls’ Education Program in Rajasthan, India,”2019. Qualitative Endline Report.
Delavallade, Clara, Alan Griffith, Gaurav Shukla, and Rebecca Thornton, “Par-ticipation, learning, and equity in education: Can we have it all?,” 2017.
Deming, David J, “The growing importance of social skills in the labor market,” TheQuarterly Journal of Economics, 2017, 132 (4), 1593–1640.
Dhaliwal, Iqbal, Esther Duflo, Rachel Glennerster, and Caitlin Tulloch, “Com-parative cost-effectiveness analysis to inform policy in developing countries: A generalframework with applications for education,” in Paul Glewwe, ed., Education Policy inDeveloping Countries, Chicago: University of Chicago Press, 2013, pp. 285–338.
Dhar, Diva, Tarun Jain, and Seema Jayachandran, “Reshaping Adolescents’ GenderAttitudes: Evidence from a School-Based Experiment in India,” 2018.
Duflo, Esther, Pascaline Dupas, and Michael Kremer, “Education, HIV, and earlyfertility: Experimental evidence from Kenya,” American Economic Review, 2015, 105 (9),2757–97.
28

Edmonds, Eric, Benjamin Feigenberg, and Jessica Leight, “The impact of mentoringand life skills on secondary school progression and child labor among girls: A randomizedcontrolled trial in Rajasthan, India,” AEA RCT Registry. February 2016.
, , and , “The impact of mentoring and life skills training on secondary schoolprogression and child labor among girls: A randomized controlled trial in Rajasthan,”2019. Final evaluation report.
Fizbein, Ariel, Norbert Schady, Francisco H.G. Ferreira, Margaret Grosh, NiallKeleher, Pedro Olinto, and Emmanuel Skoufias, Conditional Cash Transfers: Re-ducing Present and Future Poverty, World Bank, 2009.
Forum, World Economic, “The global gender gap report,” in “in” World Economic ForumGeneva 2020.
Glewwe, Paul, Qiuqiong Huang, and Albert Park, “Cognitive skills, noncognitiveskills, and school–to–work transitions in rural China,” Journal of Economic Behavior andOrganizations, 2017, 134, 141–164.
Heckman, J., J. Stixrud, and S. Urzua, “The effects of cognitive and noncognitiveabilities on labor market outcomes and social behavior,” Journal of Labor Economics,2006, 24 (3), 411–482.
Holmlund, Helena and Olmo Silva, “Targeting noncognitive skills to improve cognitiveoutcomes: evidence from a remedial education intervention,” Journal of Human Capital,2014, 8 (2), 126–160.
Jensen, Robert, “The (Perceived) Returns to Education and the Demand for Schooling,”The Quarterly Journal of Economics, 2010, 125 (2), 515–548.
Lavecchia, Adam M, Heidi Liu, and Philip Oreopoulos, “Behavioral economics ofeducation: Progress and possibilities,” in “Handbook of the Economics of Education,”Vol. 5, Elsevier, 2016, pp. 1–74.
Levitt, Steven D, John A List, Susanne Neckermann, and Sally Sadoff, “Thebehavioralist goes to school: Leveraging behavioral economics to improve educationalperformance,” American Economic Journal: Economic Policy, 2016, 8 (4), 183–219.
Macours, Karen and Rachid Laajaj, “Measuring skills in developing countries,” 2019.Forthcoming, Journal of Human Resources.
Mukherjee, Chandan, Preet Rustagi, and N Krishnaji, “Crimes against women inIndia: Analysis of official statistics,” Economic and Political Weekly, 2001, pp. 4070–4080.
Muralidharan, Karthik and Nishith Prakash, “Cycling to school: Increasing secondaryschool enrollment for girls in India,” American Economic Journal: Applied Economics,2017, 9 (3), 321–350.
29

Nguyen, Trang, “Information, Role Models and Perceived Returns to Education: Experi-mental Evidence from Madagascar,” 2008.
Oldenburg, Philip, “Sex ratio, son preference and violence in India: A research note,”Economic and Political Weekly, 1992, pp. 2657–2662.
Strauss, John and Duncan Thomas, “Human resources: Empirical modeling of house-hold and family decisions,” Handbook of development economics, 1995, 3, 1883–2023.
30
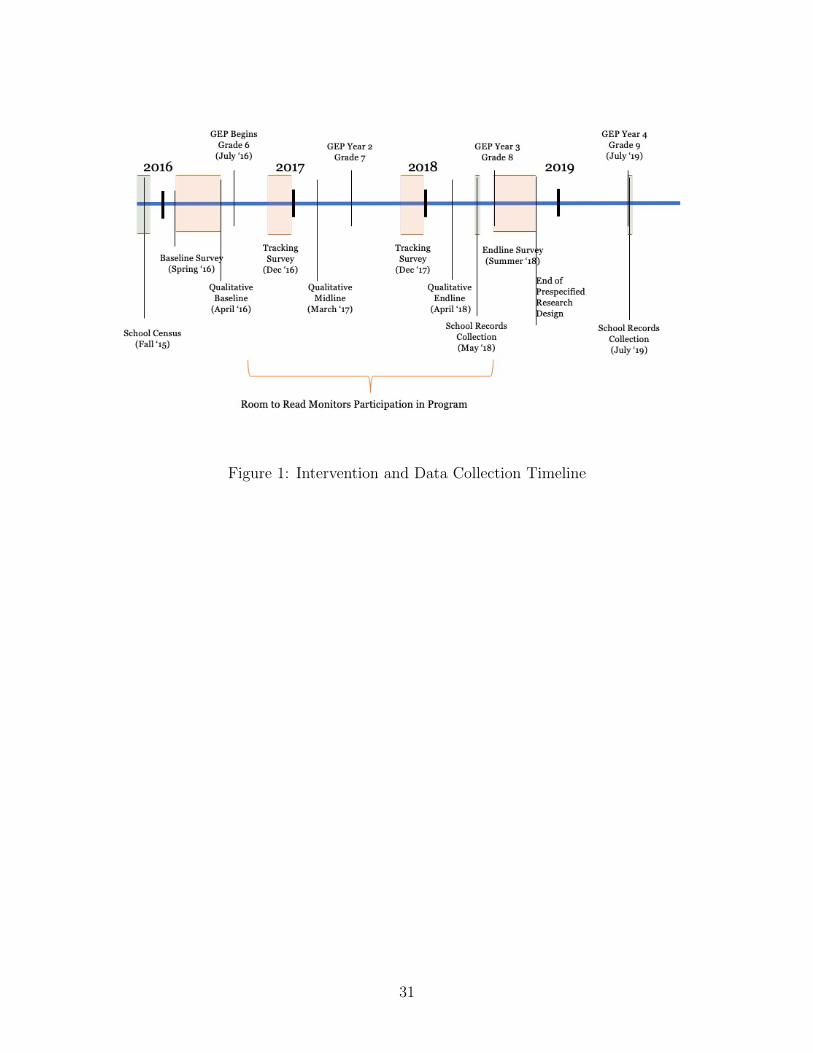
Figure 1: Intervention and Data Collection Timeline
31

Figure 2: Treatment Effects on Non-Cognitive Skills
Notes: This figure reports the estimated treatment effects on indexes for noncognitive skills or Cantril’sladder, controlling for stratum, baseline value, age effects, type of employment in the household, andimbalanced variables. Baseline and endline data are from the respective surveys. 95 percent confidenceintervals are pictured. Standard errors are clustered by school.
32
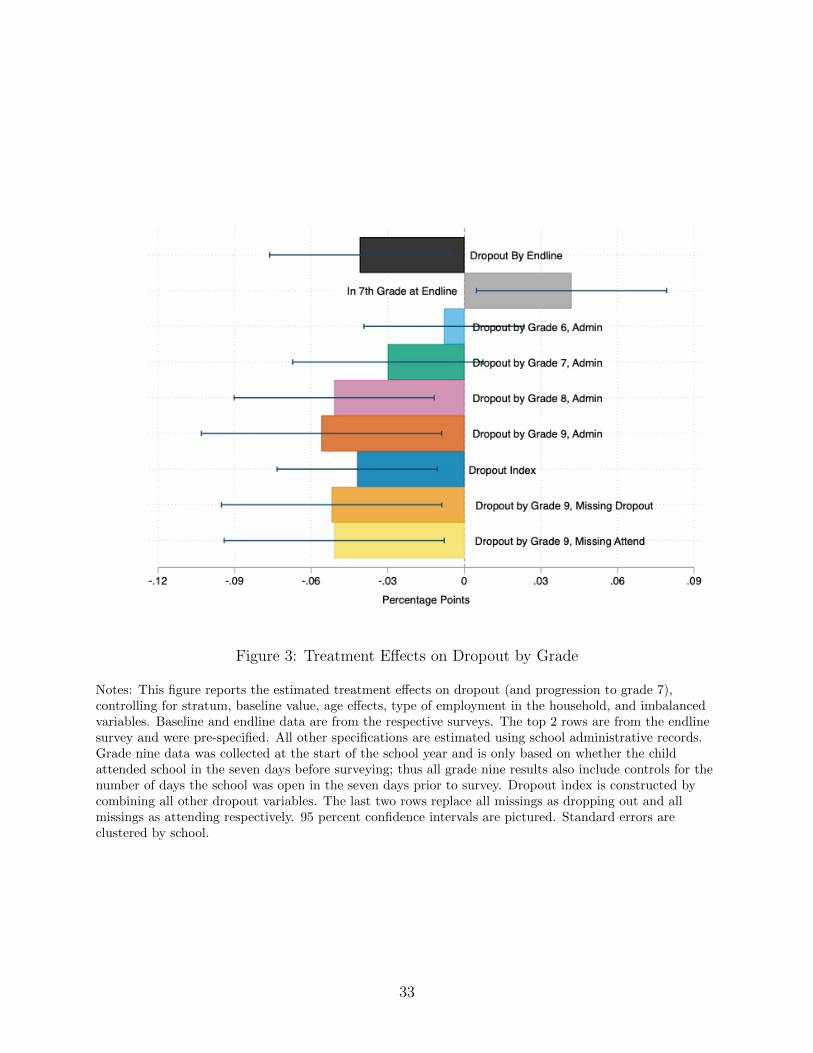
Figure 3: Treatment Effects on Dropout by Grade
Notes: This figure reports the estimated treatment effects on dropout (and progression to grade 7),controlling for stratum, baseline value, age effects, type of employment in the household, and imbalancedvariables. Baseline and endline data are from the respective surveys. The top 2 rows are from the endlinesurvey and were pre-specified. All other specifications are estimated using school administrative records.Grade nine data was collected at the start of the school year and is only based on whether the childattended school in the seven days before surveying; thus all grade nine results also include controls for thenumber of days the school was open in the seven days prior to survey. Dropout index is constructed bycombining all other dropout variables. The last two rows replace all missings as dropping out and allmissings as attending respectively. 95 percent confidence intervals are pictured. Standard errors areclustered by school.
33

Table 1: Summary Statistics for Sampled Households
(1) (2) (3)
Sample Mean Rajasthan Mean India Mean
Number of household members 6.838 5.091 4.692Number of boys in household (under 18) 1.379 1.005 0.834Number of girls in household (under 18) 2.438 0.898 0.775Enrollment: girls 10-11 97.5 92.8 95.5Enrollment: boys 10-11 97.7 95.9 95.6Enrollment: girls 12-14 92.0 84.0 90.2Enrollment: boys 12-14 92.4 92.8 91.4Marriage rate: girls 13-14 0.1095 0.0166 0.0162Muslim 0.214 0.080 0.125Other Backward Class 0.674 0.459 0.442Scheduled Caste/Scheduled Tribe 0.250 0.337 0.312Land owned (bighas) 6.283 23.924 10.664
Notes: Column (1) presents mean values averaged over all households in the study sample. Households withmultiple study subjects occur as multiple observations. 16 study subjects completed a baseline child surveybut no baseline household survey and thus are not represented in these summary statistics. Columns (2) and(3) present household-level mean values for respondents to the 2015-2016 Indian Demographic and HealthSurvey. Enrollment measures take on values from 0 to 100. Marriage rate takes on values from 0 to 1, andMuslim, Other Backward Class, and Scheduled Caste/Scheduled Tribe are all indicator variables.
34

Table 2: Non-cognitive Skills: Child Survey Measures
(1) (2) (3) (4) (5) (6)
Panel A
Future Gender Educ. / emp. Marital Empowerment Self-planning norms aspirations expectations index esteem
index index index index index
Treatment .072∗∗ .093∗∗∗ .016 -.174∗∗ .102∗∗∗ .037(.030) (.033) (.039) (.082) (.028) (.023)
Obs. 2380 2380 2380 2380 2380 2380R2 .034 .036 .206 .308 .032 .059Q-statistic 0.103 0.065 0.820 0.122 0.008 0.357
Mean Control Group -0.016 0.000 0.000 -0.606 -0.002 -0.001
Panel B
Freedom of Socio- Cantril’s Locus of Perceived Rosenbergmovement emotional ladder control stress self-esteem
index index index index index
Treatment .021 .062∗∗∗ .028 -.026 -.025 .021(.023) (.023) (.131) (.046) (.046) (.030)
Obs. 2380 2380 2380 2380 2380 2380R2 .018 .034 .02 .028 .013 .042Q-statistic 0.707 0.065 0.867 0.795 0.795 0.755Mean Control Group 0.000 0.000 4.513 0.000 0.000 0.000
Notes: Table contains results from regressing the outcome variable indicated by the column header on anindicator for treatment (reported), stratification fixed effects, age fixed effects, baseline value of the outcome,a vector of dummies for the most important type of employment in the household at baseline, and controlsfor variables that appear imbalanced in the balance tables. For Columns (4) through (6) of Panel B reportingmeasures added at endline, we control for lagged values of overall life skills indices.
For all included indices, we calculate the normalized difference between treatment and control for eachcomponent question, and average over all components, ensuring that the interpretation is consistent (i.e.higher values of empowerment index components all correspond to higher levels of empowerment). Maritalexpectations index is not mean 0 because married girls are assigned the minimum value calculated fornon-married girls. Detailed definitions of all referenced indices can be found in the analysis plan.
Standard errors, clustered by school, in parenthesis. * significant at 10 percent level; ** significant at 5percent level; *** significant at 1 percent level. Q-statistics are False Discovery Rate corrected q-valuesbased on Benjamini and Hochberg (1995). These are computed by pooling all specifications included inTables 2 through 3.
35

Tab
le3:
Non
-cog
nit
ive
Skills
:P
aren
tal
Rep
orts
,D
emon
stra
tion
Tas
ks,
and
Enum
erat
orA
sses
smen
t
(1)
(2)
(3)
(4)
(5)
(6)
(7)
Pan
el
A:
Pare
nta
lR
ep
ort
s
Par
enta
lP
aren
tal
Par
enta
lP
aren
tP
aren
tal
Par
enta
lP
are
nta
lp
erce
pti
onp
erce
pti
onp
erce
pti
ond
augh
ter
gend
ersc
hool
ing
marr
iage
ofgi
rl’s
ofgi
rl’s
offr
eed
omco
mm
un
icat
ion
atti
tud
esat
titu
des
att
itu
des
stre
ngt
hs
self
-effi
cacy
ofm
ovem
ent
Tre
atm
ent
-.04
0∗∗
.010
.031
-.00
9.0
10.0
43.0
22
(.018)
(.029)
(.028)
(.029)
(.026)
(.037)
(.031)
Ob
s.24
3424
3024
3424
3424
3424
342434
R2
.021
.03
.017
.027
.045
.127
.037
Q-s
tati
stic
0.12
20.
820
0.60
40.
820
0.82
00.
592
0.7
55
Mea
nC
ontr
olG
rou
p0.
000
-0.0
020.
000
0.00
00.
000
0.00
1-0
.004
Pan
el
B:
Dem
on
stra
tion
Task
san
dE
nu
mera
tor
Ass
ess
ment
Del
ayC
om
ple
ted
Mir
ror
Sca
ven
ger
Enu
mer
ator
dis
cou
nti
ng
mir
ror
dra
win
gshu
nt
asse
ssm
ent
dra
win
gs(s
econ
ds)
ind
exin
dex
Tre
atm
ent
.003
.072
2.72
0-.
065
.100
∗∗
(.032)
(.082)
(4.559)
(.055)
(.047)
Ob
s.23
8023
8723
1723
8023
80R
2.0
21.0
27.0
22.0
64.0
52Q
-sta
tist
ic0.
914
0.70
70.
795
0.59
20.
122
Mea
nC
ontr
olG
rou
p0.
331
3.26
911
9.5
0.00
00.
000
Not
es:
Tab
leco
nta
ins
resu
lts
from
regre
ssin
gth
eou
tcom
eva
riab
lein
dic
ated
by
the
colu
mn
hea
der
onan
ind
icat
orfo
rtr
eatm
ent
(rep
orte
d),
stra
tifi
-ca
tion
fixed
effec
ts,
age
fixed
effec
ts,
bas
elin
eva
lue
ofth
eou
tcom
e,a
vect
orof
du
mm
ies
for
the
mos
tim
por
tant
typ
eof
emp
loym
ent
inth
eh
ou
seh
old
atb
asel
ine,
and
contr
ols
for
vari
able
sth
atap
pea
rim
bal
ance
din
the
bal
ance
tab
les.
For
all
incl
ud
edin
dic
es,
we
calc
ula
teth
en
orm
aliz
edd
iffer
ence
bet
wee
ntr
eatm
ent
and
contr
olfo
rea
chco
mp
onen
tqu
esti
on,
and
aver
age
over
all
com
pon
ents
,en
suri
ng
that
the
inte
rpre
tati
onis
con
sist
ent
(i.e
.h
igh
erva
lues
ofem
pow
erm
ent
ind
exco
mp
onen
tsal
lco
rres
pon
dto
hig
her
leve
lsof
emp
ower
men
t).
Det
ail
edd
efin
itio
ns
of
all
refe
ren
ced
ind
ices
can
be
fou
nd
inth
ean
alysi
sp
lan
.F
our
obse
rvat
ion
sar
em
issi
ng
for
par
enta
lp
erce
pti
on
ofgi
rl’s
self
-effi
cacy
,as
the
par
ent
answ
ered
“D
on’t
kn
ow”
toal
lqu
esti
ons.
Sev
enob
serv
atio
ns
are
mis
sin
gfr
omth
ean
alysi
sfo
rb
oth
the
futu
red
isco
unti
ng
and
scav
enger
hu
nt
mea
sure
s,co
rres
pon
din
gto
the
seve
nca
ses
inw
hic
hth
ere
spon
den
tre
spon
ded
only
toth
efi
rst
sect
ion
of
the
chil
dsu
rvey
.70
obse
rvat
ion
sar
em
issi
ng
for
tim
esp
ent
onm
irro
rd
raw
ing
mea
sure
,co
rres
pon
din
gto
the
70re
spon
den
tsw
ho
did
not
atte
mp
tany
dra
win
gs.
Del
ayd
isco
unti
ng
isan
ind
icat
orfo
rw
het
her
the
resp
ond
ent
wou
ldp
refe
r60
Rs.
inon
ew
eek
over
30R
s.n
ow.
Com
ple
ted
mir
ror
dra
win
gs
takes
onva
lues
from
zero
tofo
ur
and
Mir
ror
dra
win
gs(s
econ
ds)
mea
sure
sth
eto
tal
nu
mb
erof
seco
nd
ssp
ent
onm
irro
rd
raw
ings
,co
nd
itio
nal
on
hav
ing
atte
mp
ted
atle
ast
one
dra
win
g.
Sta
nd
ard
erro
rs,
clu
ster
edby
sch
ool
,in
par
enth
esis
.*
sign
ifica
nt
at10
per
cent
level
;**
sign
ifica
nt
at5
per
cent
leve
l;**
*si
gnifi
cant
at1
per
cent
leve
l.Q
-sta
tist
ics
are
Fal
seD
isco
very
Rat
eco
rrec
ted
q-v
alu
esb
ased
onB
enja
min
ian
dH
och
ber
g(1
995)
.T
hes
ear
eco
mp
ute
dby
pool
ing
all
spec
ifica
tion
sin
clu
ded
inT
able
s2
thro
ugh
3.
36

Tab
le4:
Sch
ool
Dro
pou
t
(1)
(2)
(3)
(4)
(5)
(6)
(7)
Su
rvey
dat
aA
dm
inis
trat
ive
dat
a
Wh
eth
erch
ild
has
Wh
eth
erch
ild
pro
gres
sed
Dro
pou
tD
rop
out
Dro
pou
tD
rop
out
Dro
pou
td
rop
ped
out
to7t
hgr
ade
Gra
de
6G
rad
e7
Gra
de
8G
rad
e9
Ind
ex
Tre
atm
ent
-.04
1∗∗
.042
∗∗-.
008
-.03
0-.
051∗
∗∗-.
056∗
∗-.
042∗∗
∗
(.018)
(.019)
(.016)
(.019)
(.020)
(.024)
(.016)
Ob
s.24
3323
8723
7423
1924
5522
282458
R2
.152
.144
.111
.122
.114
.438
.223
Q-s
tati
stic
0.04
10.
041
0.60
00.
138
0.04
10.
041
Mea
nC
ontr
olG
rou
p0.
132
0.86
50.
075
0.14
20.
192
0.29
00.1
69
Not
es:
Tab
leco
nta
ins
resu
lts
from
regre
ssin
gth
eou
tcom
eva
riab
lein
dic
ated
by
the
colu
mn
hea
der
onan
ind
icat
orfo
rtr
eatm
ent
(rep
orte
d),
stra
tifi
-ca
tion
fixed
effec
ts,
age
fixed
effec
ts,
bas
elin
eva
lue
ofth
eou
tcom
e,a
vect
orof
du
mm
ies
for
the
mos
tim
por
tant
typ
eof
emp
loym
ent
inth
eh
ou
seh
old
atb
asel
ine,
and
contr
ols
for
vari
able
sth
atap
pea
rim
bal
ance
din
the
bal
ance
tab
les.
Col
um
n(1
)u
ses
chil
dan
dh
ouse
hol
den
dli
ne
surv
eyd
ata.
Col
um
n(2
)u
ses
chil
den
dli
ne
surv
eyon
ly(a
llch
ild
ren
enro
lled
ingr
ade
five
at
base
lin
e).
Col
um
ns
(3)
thro
ugh
(6)
rely
onad
min
istr
ativ
ed
ata.
InC
olu
mn
s(3
)th
rou
gh(5
),d
rop
out
ism
easu
red
bas
edon
wh
eth
era
chil
dat
ten
ded
sch
ool
atth
eco
ncl
usi
onof
the
refe
ren
ced
sch
ool
year
.In
Col
um
n(6
),d
rop
out
ism
easu
red
bas
edon
wh
eth
era
chil
dat
ten
ded
sch
ool
du
rin
gth
ep
ast
wee
k(c
ond
itio
nal
onth
esc
hool
bei
ng
open
).T
he
Colu
mn
(7)
dro
pou
tin
dex
isco
nst
ruct
edas
the
aver
age
ofth
eou
tcom
eva
riab
les
incl
ud
edin
Colu
mn
s(1
),(3
),(4
),(5
),an
d(6
).C
olu
mn
s(6
)th
rou
gh(7
)in
clu
de
ase
tof
fixed
effec
tsfo
rth
enu
mb
erof
day
sth
atth
esc
hool
was
open
inth
ew
eek
bef
ore
adm
inis
trat
ive
dat
aco
llec
tion
ingr
ade
nin
e.
Sta
nd
ard
erro
rs,
clu
ster
edby
sch
ool
,in
par
enth
esis
.*
sign
ifica
nt
at10
per
cent
leve
l;**
sign
ifica
nt
at5
per
cent
leve
l;**
*si
gnifi
cant
at
1p
erce
nt
leve
l.Q
-sta
tist
ics
are
Fal
seD
isco
very
Rate
corr
ecte
dq-v
alu
esb
ased
onB
enja
min
ian
dH
och
ber
g(1
995)
.
37

Table 5: Attendance, Time Allocation, and Test Scores
(1) (2) (3) (4) (5) (6)
Panel A: Attendance (Past Week) and Time Allocation (Typical Day in Past Week)
Attendance Any Hours HoursRate Attendance studying spent
at home at school
Treatment .002 .003 -.043 .164(.009) (.006) (.075) (.188)
Obs. 2089 2089 2386 2386R2 .027 .019 .052 0.1Q-statistic 0.841 0.841 0.841 0.841Mean Control Group 0.918 0.982 1.541 7.166
Panel B: Test Scores
ASER ASER ASER GPA GPA GPAMathematics Hindi English Grade 6 Grade 7 Grade 8
Treatment -.014 .022 -.068 -.150∗∗ -.145 -.026(.070) (.089) (.084) (.074) (.096) (.087)
Obs. 2380 2380 2380 2178 1976 1912R2 .078 .085 .096 .334 .216 .207Q-statistic 0.841 0.841 0.841 0.451 0.665 0.841Mean Control Group 2.353 3.025 2.369 2.259 2.404 2.890
Notes: Table contains results from regressing the outcome variable indicated by the column header on anindicator for treatment (reported), stratification fixed effects, age fixed effects, baseline value of the outcome,a vector of dummies for the most important type of employment in the household at baseline, and controlsfor variables that appear imbalanced in the balance tables.
Columns (1) and (2) of Panel A use child endline survey data and are conditional on school being openand child not having dropped out of school. Attendance rate in Column (1) is the fraction of school daysattended in the week prior to being surveyed and the Attendance dummy in Column (2) is an indicatorfor having attended any days in the past week. 298 observations are missing for these measures because oftemporary school closures. Time use outcomes in Columns (3) and (4) of Panel A are defined based on timeuse patterns recorded for “a typical day in the past week.” In Panel B, baseline cognitive test values werenot collected, and accordingly Columns (1) through (3) instead include controls for baseline school dropoutstatus, attendance, grade progression, time spent studying, hours spent on school, and grades as reported ingrade five.
Standard errors, clustered by school, in parenthesis. * significant at 10 percent level; ** significant at 5percent level; *** significant at 1 percent level. Q-statistics are False Discovery Rate corrected q-valuesbased on Benjamini and Hochberg (1995).
38