Sharma by her litigation representative Sister Marie Brigid ...
Upload
independentCategory
view
2download
0
MicrobialEcology
Microcystins Induce Morphological and Physiological Changesin Selected Representative Phytoplanktons
Bojan Sedmak and Tina Elersek
National Institute of Biology, Vecna pot 111, SI-1001 Ljubljana, Slovenia
Received: 22 September 2004 / Accepted: 28 January 2005 / Online publication: 15 October 2005
Abstract
Dissolved microcystins (MC) are regularly present inwater dominated by microcystin-producing, bloom-forming cyanobacteria. In vitro experiments with envi-ronmentally feasible concentrations (5 � 10j7 M) ofthe three most common microcystins, MC-LR, -RR,and -YR, revealed that they influence the metabolism ofdifferent representative phytoplanktons. At light inten-sities close to the cyanobacterial bloom environment(50 mmol mj2 sj1), they produce morphological andphysiological changes in both microcystin-producing andnonproducing Microcystis aeruginosa strains, and alsohave similar effects on the green alga Scenedesmusquadricauda that is frequently present in cyanobacterialblooms. All three microcystin variants tested induce cellaggregation, increase in cell volume, and overproductionof photosynthetic pigments. All three effects appear to berelated to each other, but are not necessarily caused bythe same mechanism. The biological activity of micro-cystins toward the light-harvesting complex of photo-bionts can be interpreted as a signal announcing theworsening of light conditions due to the massiveproliferation of cyanobacteria. Although the function ofmicrocystins is still unknown, it is evident that they havenumerous effects on phytoplankton organisms in nature.These effects depend on the individual organism as wellas on the various intracellular and extracellular signalingpathways. The fact that dissolved microcystins alsoinfluence the physiology of microcystin-producing cya-nobacteria leads us to the conclusion that the role ofmicrocystins in the producing cells differs from their rolein the water environment.
Introduction
The dominant goal of photoautotrophic microorganismsin the water environment is to remain in the photic zonelong enough to absorb sufficient light energy to grow andmultiply. To achieve and maintain such a position,phytoplankton organisms are equipped with a broadarray of specific morphological and physiological adap-tations. By definition, plankton depends almost entirelyon the movement of water masses, and its settlingproperties are determined by size, density, and formresistance. Another very important element that wasdescribed by Reynolds [24] as Bvital regulation^ has notyet been sufficiently elucidated. It was demonstrated inthe mid-1960s that dead or even living senescent diatomcells sink significantly faster than viable ones, withoutexhibiting visible alteration in shape, size, or form-resistant structures [32]. It is therefore evident that everychange in morphology or physiology in planktonorganisms could jeopardize their life through reducedpersistence in suspension. In the presence of bloom-forming cyanobacteria, the situation for other planktonspecies is additionally aggravated because of the poorlight environment, different allelopathic interactions, andthe presence of large amounts of various biologicallyactive substances [7, 27, 28, 36].
Microcystins (MC) are the best known and themost frequently occurring of the biologically activesubstances produced by bloom-forming cyanobacteria.Although they are mainly confined to the interior ofthe producing cells for most of their lifetime, they canbe detected in the environment even in the early stagesof cyanobacterial bloom formation. Evidently someleakage or cyanobacterial cell lysis occurs continually[11] and is independent of the presence of the micro-organisms associated with cyanobacteria [31]. The majorCorrespondence to: Bojan Sedmak; E-mail: [email protected]
DOI: 10.1007/s00248-004-0189-1 & Volume 0, 1–8 (2005) & * Springer Science+Business Media, Inc. 2005 1
release and the highest concentrations have been detectedduring senescence and decomposition of microcystin-producing blooms [22].
It has been suggested that microcystin-producingcyanobacteria gain substantial ecological advantage byusing these heptapeptides to eliminate their phytoplank-ton competitors from the environment [30]. Isolatedmicrocystins induce noxious effects on higher plants [1],and inhibitory effects on the proliferation of specificphytoplankton organisms have also been observed [27, 28].However, there are also other allelochemicals producedby cyanobacteria that influence the growth and prolifer-ation of phytoplankton species more strongly. Anexample of this is fisherellin A, whose allelopathic effectsare directed against cyanobacteria and other photo-autotrophs through the inhibition of photosystem II(PS II) [8]. Another type of allelopathic interaction iswhen Microcystis inhibits photosynthetic ability byabolishing internal carbonic anhydrase activity in Peri-dinium [33]. Nevertheless, some species, such as thegreen alga Scenedesmus quadricauda (Breb.), coexist oreven flourish in the presence of cyanobacteria and theirmicrocystins [27] during, and especially after, the declineof cyanobacterial blooms (e.g., [19]).
In the present study we have concentrated on thosemorphological and physiological changes induced bymicrocystins that could have ecological relevance. Wehave performed several in vitro experiments to examinethe different aspects of microcystin influence on produc-ing and nonproducing cyanobacterial strains as well ason the green alga Scenedesmus quadricauda. The effectshave been studied at microcystin concentrations thathave already been proven to influence the proliferation ofphytoplanktonts [27] and that are, in our opinion,feasible in cyanobacterial bloom conditions, especiallyduring regular surface bloom appearances. This particu-lar green alga has been chosen for its ability to coexist ineither microcystin-producing or microcystin nonproduc-ing cyanobacterial blooms.
Methods
Strains and Cultivation. Several nonaxenic cell linesisolated and maintained under sterile conditions in ourlaboratory were used in the experiments. The green algaS. quadricauda (Sq-NIB) and four unicellular Microcystisaeruginosa Kuetz strains were used – two microcystinnonproducing (Ma2-NIB, Ma6-NIB) and two micro-cystin producing strains (Ma1-NIB, Ma4-NIB). The cya-nobacterial strains were tested for toxicity in mice andanalyzed by high-performance liquid chromatography(HPLC) as described [26]. The strains Ma2-NIB andMa6-NIB were nontoxic on i.p. injection of 1500 mglyophilized cyanobacterial cells/kg mice (NMRI-LEK),with no increase in liver weight. All species were main-tained and cultivated in Jaworski’s medium [34]. Everyexperiment was performed at least three times and everymeasurement on sampling day was done on three par-allel samples.
All organisms were grown in 100-mL flasks and/oron MultiDish 24 (Nunc, Denmark) culture plates at 20-Cunder two types of mixed fluorescent lamps – whiteOsram L 18 W/72 Biolux and Sylvania Gro-Lux F 18 W/GRO-T8 – at a light intensity of 50 mmol mj2 sj1 with alight–dark period of 16 and 8 h. Data presented in Table1 were obtained at a light intensity of 20 mmol mj2 sj1.Incident illumination was measured outside the vessels witha Delta-T Logger (Delta-T Devices Ltd., UK), equipped witha QS Quantum sensor.
Microcystins and Concentrations Used. Themicrocystins used, MC-LR, MC-RR, and MC-YR, wereisolated as described [26, 27]. Experimental results wereconfirmed using commercial microcystins (MC-LR fromSigma; MC-RR and MC-YR from Calbiochem). Our goalwas to simulate the environment occurring in a surfacecyanobacterial bloom, where the cells can reachconcentrations as high as 1011 cells/L. Assuming amicrocystin cell productivity of 0.5 � 10j12 g/cell, an
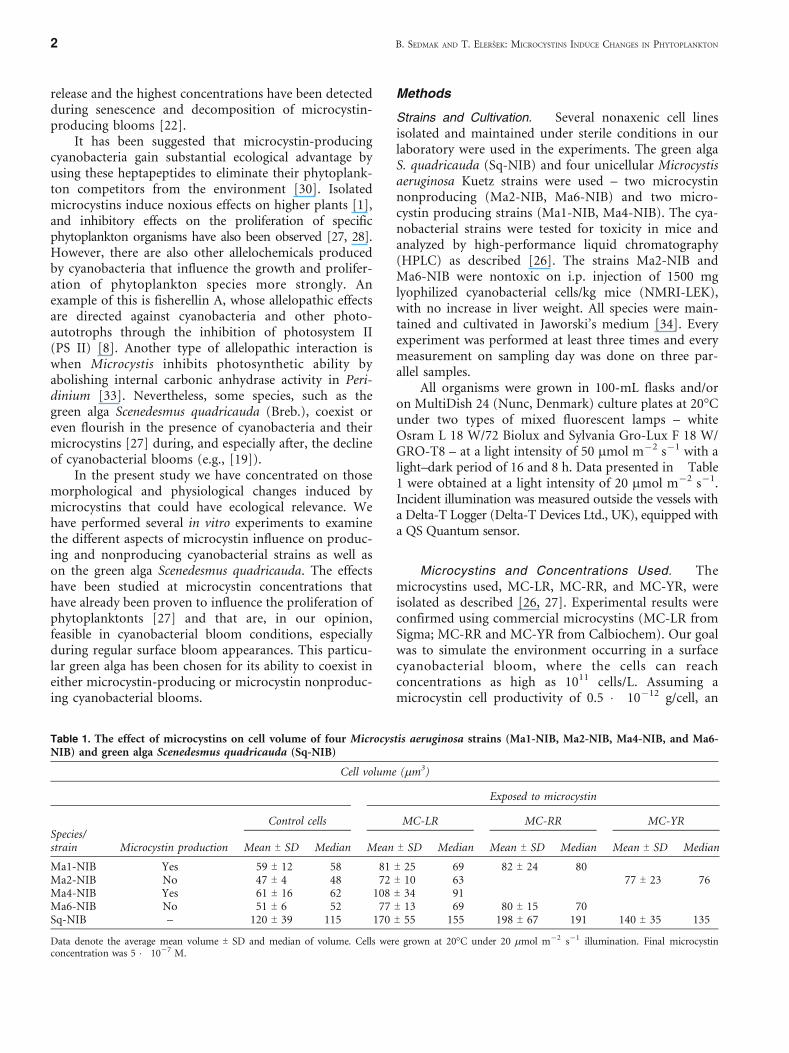
Table 1. The effect of microcystins on cell volume of four Microcystis aeruginosa strains (Ma1-NIB, Ma2-NIB, Ma4-NIB, and Ma6-NIB) and green alga Scenedesmus quadricauda (Sq-NIB)
Cell volume (mm3)
Exposed to microcystin
Species/strain Microcystin production
Control cells MC-LR MC-RR MC-YR
Mean T SD Median Mean T SD Median Mean T SD Median Mean T SD Median
Ma1-NIB Yes 59 T 12 58 81 T 25 69 82 T 24 80Ma2-NIB No 47 T 4 48 72 T 10 63 77 T 23 76Ma4-NIB Yes 61 T 16 62 108 T 34 91Ma6-NIB No 51 T 6 52 77 T 13 69 80 T 15 70Sq-NIB – 120 T 39 115 170 T 55 155 198 T 67 191 140 T 35 135
Data denote the average mean volume T SD and median of volume. Cells were grown at 20-C under 20 mmol mj2 sj1 illumination. Final microcystinconcentration was 5 � 10j7 M.
2 B. SEDMAK AND T. ELERSEK: MICROCYSTINS INDUCE CHANGES IN PHYTOPLANKTON

average microcystin MW of 1000 Da, and an averagerelease of 1% [35] leads to a concentration of 5 � 10j7
M MC, the concentration used in previous experiments.Lower concentrations (down to 10j7 M MC) producedsimilar, but not such pronounced effects on theorganisms tested (data not shown). MC was added atthe beginning of every experiment (day 0), except in theexperiments shown in Fig. 3, where arrows indicate theaddition of MC.
Determination of Pigments. For chlorophyll adetermination, cells were centrifuged, supernatants werereplaced with methanol, and pigment was estimatedspectrophotometrically according to the method ofVollenweider [37]. Phycocyanins were extracted fromcyanobacteria, collected on Whatman GF/C glassmicrofiber filter, ground in 0.1 M phosphate buffer (pH6.8), and determined spectrophotometrically accordingto the method described by Lee and co-workers [18].Pigment concentration was measured in triplicate eachsampling day.
Cell Morphology and Fluorescence Induction.
Phytoplankton cells were grown in flasks and on
MultiDish 24 culture plates with a flat bottom. Afterthe addition of microcystins, the plates were inspecteddaily under an inverted fluorescent microscope (NikonEclipse TE300 with Super High Pressure Mercury LampPower Supply HB-10103AF). The autofluorescence ofphotosynthetic pigments was recorded using a B-2A filterwith excitation in the blue light region (450–490 nm). Cellvolumes were calculated according to Wetzel and Likens[40]. At least 100 randomly selected cells were measuredeach sampling day. Volumes presented in Table 1 wereselected on the day when the difference between thecontrol and treated cells was at its highest level. Cellmeasurements were done with Lucia (System for ImageProcessing and Analysis LUCIA 4.60, Laboratory ImagingLtd.).
Statistical Analyses. Cell volume measurementsof green algae were analyzed via descriptive statistics withquartiles (box plot, Fig. 5) and tested with Mann–Whitney test. Box charts were drawn with softwareMicrocal Origin 5.0 (Microcal Software, Inc.). Each Ycolumn of data (volume of the cells) is represented as aseparate box. The horizontal lines in the box denote the25th, 50th, and 75th percentile values. The error barsdenote the 5th and 95th percentile values. The two
Figure 2. (A) Settling of the control group Scenedesmusquadricauda (Sq-NIB). The green algae were dispersed in ahomogeneous monolayer at the bottom of the vessel. Day 6at 50 mmol mj2 sj1 illumination, temperature 20-C, originalmagnification 600� and 100� in the upper right corner.(B) S. quadricauda (Sq-NIB) exposed to 5 � 10j7 M MC-LR.The cenobia were grouped lump wise at the bottom of the vessel.
Figure 1. (A) Settling of control group of the microcystinnonproducing unicellular strain of Microcystis aeruginosa 2 (Ma2-NIB). Cells were randomly dispersed in the vessel. Day 8 at 50 mEmj2 sj1 illumination, original magnification 600�. (B) Settlingof M. aeruginosa 2 (Ma2-NIB) treated with 5� 10j7 M MC-LR onthe eighth day of exposure. Cells are tightly packed together andconcentrated mostly in the center of the flat-bottomed vessel.Growth conditions as in (A).
B. SEDMAK AND T. ELERSEK: MICROCYSTINS INDUCE CHANGES IN PHYTOPLANKTON 3

symbols below the 5th percentile error bar denote the 0thand the 1st percentile values. The two symbols above the95th percentile error bar denote the 99th and the 100thpercentiles. The square symbol in the box denotes themean of the column of data.
Data obtained from chlorophyll (Fig. 7) and phyco-cyanin (Fig. 8) measurements of cyanobacteria wereanalyzed with t-test to test the difference between controland microcystin-treated cells. We add a short statisticaldescription in the caption of every figure where thedifference is statistically significant (PG 0.05). All statis-tical analyses were carried out with Statistical SoftwareMinitab\ Release 14.12.0 (Minitab Inc.).
Results
Cell Aggregation. When the microcystin nonpro-ducing unicellular strain M. aeruginosa (Ma2-NIB) wasexposed to MC-LR, -RR, or -YR at 1–5 � 10j7 Mconcentration, a tendency to aggregate was observed. Thesame effect was observed with the microcystin-producingunicellular strain M. aeruginosa (Ma1-NIB). Microcystin-exposed cells exhibited a tendency to form pseudo-colonies – large aggregates of cells that were tightly
Figure 3. Increase in cell volume after repeated addition ofMC-LR to the nontoxic M. aeruginosa 2 strain (Ma2-NIB).The addition of microcystin-LR to a final concentration of5 � 10j7 M was repeated twice, on days 1 and 11 of growth,as marked by arrows. Illumination 50 mmol mj2 sj1, temperature20-C. Points represent means and error bars represent SD(x = 200, n = 3).
Figure 4. The influence of microcystin MC-LR on the size ofS. quadricauda (Sq-NIB) cenobia on the sixth day of cultivation,original magnification 600�. (A) Control cells. (B) Cellsexposed to 5 � 10j7 M MC-LR. The algae were grown at20-C and 50 mmol mj2 sj1 illumination.
Figure 5. Box chart showing the influence of MC-LR on thevolume of S. quadricauda (Sq-NIB) cells. (A) Control cells.(B) Cells exposed to 5 � 10j7 M MC-LR. The algae were grownat 20-C and 50 mmol mj2 sj1 illumination. Differences at days 2and 4 were statistically significant (Mann–Whitney test, P G 0.05).
4 B. SEDMAK AND T. ELERSEK: MICROCYSTINS INDUCE CHANGES IN PHYTOPLANKTON

packed together (Fig. 1B) – whereas cells in the controlgroup were more evenly dispersed (Fig. 1A). Moreover,while the control group of green alga S. quadricaudasettled down in a perfect monolayer (Fig. 2A), the
cenobia (mostly four-celled S. quadricauda) showed adistinct tendency to aggregate when exposed tomicrocystins (Fig. 2B). This effect was present throughalmost the entire period of the experiment, and becamemore evident when the organisms reached higher cellconcentrations.
Cell Volume. Cell volume was observed toincrease after exposure to all three microcystins, MC-LR, -RR and -YR, with only minor variations (Table 1).The increase in cell volume of nonproducing Ma2-NIBstrain was significant on the third day of incubation withmicrocystins and lasted for 8 days (Fig. 3). Uponrepeated addition of microcystins to the media after thecell volume decreased and reached their normal volume,we again observed the same effect. At the beginning ofthe incubation with microcystins, variability in cellvolume of exposed cells increased, indicating an influenceon the dividing rate. The green alga S. quadricauda alsoincreased in volume when exposed to MC-LR (Figs. 4 and5). Variability in the volume of cells as well as of entirecenobia was evident.
Autofluorescence of Photosynthetic Pigments.
From the third day of incubation with each of the threemicrocystins, the S. quadricauda cells showed markedlyincreased autofluorescence when excited with light in therange 450–490 nm (Figs. 6A, B). From Fig. 5B it is clearthat the increase in cell volume was not restricted only tothe cells themselves, but their chloroplasts grew bigger aswell. Increased fluorescence was also observed inmicrocystin-producing (Ma1-NIB) and nonproducing(Ma2-NIB) cyanobacterial strains.
Figure 6. Autofluorescence of cenobia of S. quadricauda (Sq-NIB)showing the influence of microcystin MC-LR on the volumeand fluorescence intensity of photosynthetic pigment, originalmagnification 600�. (A) Control cenobia. (B) Cenobia exposedto 5 � 10j7 M MC-LR, grown at 20-C and 50 mmol mj2 sj1
illumination.
Figure 7. Content of chlorophyll a per unit cell volume ofS. quadricauda (Sq-NIB) exposed to 5 � 10j7 M microcystinMC-LR, grown at 20-C and 50 mmol mj2 sj1 illumination.Points represent means and error bars represent SD (n = 3). Atdays 2, 4, 6, and 8 there was a significant difference (t-test,P G 0.05) between MC-treated and control cells. Asterisk denotesthe statistical significance.
Figure 8. Increase in phycocyanin concentration per cell ofmicrocystin nonproducing strain M. aeruginosa 2 (Ma2-NIB)treated with 5 � 10j7 M MC-LR, grown at 20-C and 50 mmolmj2 sj1 illumination. Points represent means and error barsrepresent SD (n = 3). At days 2, 4, and 6 there was a significantdifference (t-test, P G 0.05) between MC-treated and control cells.Asterisk denotes the statistical significance.
B. SEDMAK AND T. ELERSEK: MICROCYSTINS INDUCE CHANGES IN PHYTOPLANKTON 5

Photosynthetic Pigments. Microcystins also hadan influence on the photosynthetic system of both thegreen algae (Sq-NIB) and cyanobacteria (Ma1-NIB, Ma2-NIB), producing more photosynthetic pigments. In greenalgae chlorophyll was overproduced (Fig. 7), and incyanobacteria, phycocyanin (Fig. 8). The chlorophyllcontent of cyanobacteria was not significantly influencedby the presence of microcystins.
Discussion
Cell Aggregation. Unicellular M. aeruginosa strainsaggregate in the presence of microcystins. Although inthe control group the cells are loosely spread in thegrowing chamber, cells exposed to microcystin are moretightly packed in larger patches and concentrated in thecenter of the chamber (Fig. 1). A comparable phe-nomenon is regularly observed in old cultures of ourmicrocystin-producing unicellular M. aeruginosa strains.When the cells reach plateau densities, they start tocombine into colony-like aggregates. A similar effecthas been observed in natural blooms, where a strongpositive correlation was found between the amount oftotal microcystins and the cyanobacterial cell concen-tration in the bloom [29]. The fact that cyanobacte-rial cells in microcystin nonproducing blooms usuallydo not reach concentrations as high as in microcystinproducing blooms [29] indicates that microcystin netproduction actually causes the concentration, and henceaggregation, of cells to increase. Other field studies havereported the dependence of cell aggregation on micro-cystin production [16]. We can infer from the in vitroas well from field observations that not only the in-tracellular, but also the extracellular microcystins con-tribute to a denser formation of cyanobacterial blooms.Aggregation resulting from exposure to microcystins isalso observed in the case of the green alga S. quadricauda(Fig. 2).
Cell and Colony Volume. An environmentcontaining dissolved microcystins influences the growthof both microcystin-producing and nonproducing M.aeruginosa cells, and also the green alga S. quadricauda(Table 1; Figs. 3 and 5). There are several reports relatingthe dimensions of cyanobacterial cells and colonies tomicrocystin production [12, 13, 16, 39]. The strongestevidence was provided by a genetic experiment, wherethe abolition of microcystin synthesis resulted inmicrocystin nonproducing cells with reduced diameter[4]. In general, small size is advantageous for prolongedsuspension. However, increased dimensions are notnecessarily counterproductive in the case of cyanobac-teria. Larger biomass offers the advantage of fastervertical migration in organisms benefiting from a buoy-ancy regulation mechanism [23, 38]. Thus, microcystin-
producing cyanobacteria are capable, due to their largerbiomass, of faster and more efficient positioning inthe water column [15]. Not only endogenous, but alsoexogenous microcystins influence the volume of cells.As a result of this effect, microcystin nonproducingMicrocystis cells can also benefit from the advantage oflarger biomass induced by microcystins in the waterenvironment.
In the cyanobacterial bloom-forming process, therates at which plankton is lost to sedimentation and tograzers are very important for the population dynamics[25]. Both modes of loss are influenced by the presenceof microcystins in the water. In contrast to buoyantcyanobacteria, the sinking rates of other species areaugmented if they flocculate. The presence of micro-cystins can thus, by inducing aggregation, additionallyimpoverish the biodiversity [29]. There can also beexceptions, such as the obstinate presence of Scenedesmusspecies. Sinking rates are more important in deepwaterbodies than in shallow ones. On the other hand, largerplankton aggregates are poorly accessible to predators,grazers, and filtrators [6, 9].
Cyanobacterial cells exposed to microcystins clearlyshow additional increases in volume on repeated addi-tions of microcystins to the medium (Fig. 3). Increase incell volume induced by the presence of microcystins isalso observed in the green alga S. quadricauda. Thepeculiar dividing process of these mostly four-celledcenobia introduces a further complication. The influenceof microcystin on cell volume is evident at first sight(Fig. 4), but the variability of the volumes was so greatthat a special type of presentation was necessary (box-plot, Fig. 5).
Cell Pigmentation. Increased cell volume is notjust a consequence of cell swelling due to the changes incell permeability. Larger chloroplasts, higher concentrationsof chlorophyll in algae, and higher concentration ofphycocyanin in cyanobacteria all testify to highermetabolism. Exposure to microcystins results in higherpigment formation, not only per cell but also per unit ofthe cell volume, as can be observed in vitro (Figs. 7 and 8).Further evidence confirms the involvement of micro-cystins in intracellular processes. The mcyBj mutant ofM. aeruginosa PCC 7806, which is deficient in micro-cystin biosynthesis, produces less pigment that the wild-type strain [10].
The main source of in vivo fluorescence is thepigment–protein complex PS II, which is present ingreen algae as well as in cyanobacteria [21]. Cyanobac-teria additionally possess phycobilisomes that containphycocyanin as the major light-harvesting pigment.Addition of microcystins to the medium considerablyamplifies the autofluorescence of photoautotrophs(Fig. 6). It is widely accepted that such increased
6 B. SEDMAK AND T. ELERSEK: MICROCYSTINS INDUCE CHANGES IN PHYTOPLANKTON

fluorescence of photosynthetic pigments in vivo corre-lates inversely with the rate of photosynthesis (e.g., [14])and is an indicator of stress in plants. However, higherfluorescence can also be attributed to other factors, suchas higher pigment concentration [3], the lack of func-tional connection to the active center, and the presenceof different nonactive forms (for review, see [17]). All ofthese are reasonable explanations for the increasedfluorescence in the presence of microcystins. The lattercan be the cause of a stress reaction, but also the triggerfor additional production of photosynthetic pigmentsnot yet functionally connected to the reaction centers.
There have been several unsuccessful attempts torelate microcystins and their protein phosphatase inhi-bition activity to their role in the metabolism of cyano-bacteria [20]. However, the reversible phosphorylation ofthe PS II core, which is one of the most common tools ofmetabolic regulation in plants and is regulated by lightconditions, is still a relatively unexplored area [5]. Phos-phorylation of different components of the light-harvestingcomplex is thought to control the distribution of ex-citation energy between PS I and II, as part of a mechanismto maximize the efficiency of photon utilization [2].
Conclusions
Although the individual effects resulting from thepresence of microcystins appear to be of minor impor-tance, their sum leads to the extensive impact thatmicrocystin-producing cyanobacteria may impose intheir environment. Microcystins are involved in bloomformation by their influence on growth, aggregation,photosynthesis, and biodiversity. The susceptibility ofmicrocystin-producing cyanobacteria to the action ofdissolved microcystins leads us to the conclusion that therole of microcystins in the producing cells differs fromtheir role in the water environment. Cyanobacteria cantake advantage of most of the effects produced bymicrocystins, while other species can be handicapped.
Acknowledgments
The authors are thankful to Professor Roger Pain forreading the revised manuscript, to Dr. Andrej Blejec forhelping us with statistical analyses and to Karmen Stanicfor technical support. This work was supported by grantP-508 BEcotoxinology and Ecotoxicology^ from theMinistry of Education, Science and Sport of Slovenia.
References
1. Abe, T, Lawson, T, Weyers, JDB, Codd, GA (1996) Microcystin-LRinhibits photosynthesis of Phaseolus vulgaris primary leaves:implications for current spray irrigation practice. New Phytol133: 651–658
2. Allen, JF (1992) Protein phosphorylation in the regulation ofphotosynthesis. Biochim Biophys Acta 1098: 275–335
3. Campbell, D, Hurry, V, Clarke, AK, Gustafsson, P, Oquist, G(1998) Chlorophyll fluorescence analysis of cyanobacterial photo-synthesis and acclimation. Microbiol Mol Biol Rev 62: 667–683
4. Dittmann, E, Neilan, BA, Erhard, M, von Dohren, H, Borner, T(1997) Insertional mutagenesis of a peptide synthetase gene that isresponsible for hepatotoxin production in the cyanobacteriumMicrocystis aeruginosa PCC 7806. Mol Microbiol 26: 779–787
5. Giardi, MT, Cona, A, Geiken, B (1995) Photosystem II core phos-phorylation heterogeneity and the regulation of electron transferin higher plants: a review. Bioelectrochem Bioenerg 38: 67–75
6. Gliwicz, ZM (1990) Why do cladocerans fail to control algal blooms?Hydrobiology 200/201: 83–97
7. Grach-Pogrebinsky, O, Sedmak, B, Carmeli, S (2003) Protease in-hibitors from a Slovenian Lake Bled toxic waterbloom of the cyano-bacterium Planktothrix rubescens. Tetrahedron 59: 8329–8336
8. Hagmann, L, Juttner, F (1996) Fischerellin A, a novel photosys-tem-II-inhibiting allelochemical of the cyanobacterium Fischerellamuscicola with antifungal and herbicidal activity. Tetrahedron Lett37: 6539–6542
9. Haney, JF (1987) Field studies on zooplankton–cyanobacteriainteractions. N Z J Mar Freshw Res 21: 467–475
10. Hesse, K, Dittmann, E, Borner, T (2001) Consequences ofimpaired microcystin production for light-dependent growth andpigmentation of Microcystis aeruginosa PCC 7806. FEMS Micro-biol Ecol 37: 39–43
11. Hughes, EO, Gorham, PR, Zehnder, A (1958) Toxicity of an uni-algal culture of Microcystis aeruginosa. Can J Microbiol 4: 225–236
12. Jungmann, D, Ludwichowski, KU, Faltin, V, Benndorf, J (1996) Afield study to investigate environmental factors that could effectmicrocystin synthesis of a Microcystis population in the Bautzenreservoir. Int Rev Ges Hydrobiol 81: 493–501
13. Kato, T, Watanabe, MF, Watanabe, M (1991) Alloenzymedivergence in Microcystis (Cyanophyceaea) and its taxonomicand phylogenetic inference. In: Hickel, B, Anagnostidis, K,Komarek, J (Eds.) Proc. 11th Symp. of IAC, Plon, FRG, 1989,Cyanophyta/Cyanobacteria – Morphology, Taxonomy, Ecology.Arch Hydrobiol Suppl 92 Algol Stud 64: 129–140
14. Kolber, Z, Wyman, KD, Falkowski, PG (1990) Natural variabilityin photosynthetic energy conversion efficiency: a field study in theGulf of Maine. Limnol Oceanogr 35: 72–79
15. Kromkamp, JC, Walsby, AE (1990) A computer model of buoy-ancy and vertical distributions in populations of Microcystis in twoshallow lakes. J Plankton Res 13: 419–436
16. Kurmayer, R, Christiansen, G, Chorus, I (2003) The abundanceof microcystin-producing genotypes correlates positively withcolony size in Microcystis sp. and determines its microcystin netproduction in Lake Wannsee. Appl Environ Microbiol 69(2):787–795
17. Lazar, D (1999) Review – Chlorophyll a fluorescence induction.Biochim Biophys Acta 1421: 1–28
18. Lee, T, Tsuzuki, M, Takeuchi, T, Yokoyama, K, Karube, I (1994)In vivo fluorimetric method for early detection of cyanobacterialwaterblooms. J Appl Phycol 6: 489–495
19. Lin, CG (1972) Phytoplankton succession in Lake Valencia,Venezuela. Hydrobiologia 138: 189–203
20. MacKintosh, C, Beattie, KA, Klumpp, S, Cohen, P, Codd, GA(1990) Cyanobacterial microcystin-LR is a potent and specificinhibitor of protein phosphatases 1 and 2A from both mammalianand higher plants. FEBS 264: 187–192
21. Papageorgiou, GC (1996) The photosynthesis of cyanobacteria(blue bacteria) from the perspective of signal analysis of chloro-phyll a fluorescence. J Sci Ind Res 55: 596–617
22. Park, HD, Iwami, C, Watanabe, MF, Harada, KI, Okino, T,
B. SEDMAK AND T. ELERSEK: MICROCYSTINS INDUCE CHANGES IN PHYTOPLANKTON 7

Likens, GE (1998) Temporal variabilities of the concentrations ofintra- and extracellular microcystin and toxic Microcystis species ina hypertrophic lake, Lake Suwa, Japan (1991–1994). EnvironToxicol Water Qual 13: 61–72
23. Reynolds, CS (1975) Interrelations of photosynthetic behaviourand buoyancy regulation in a natural population of a blue-greenalga. Freshw Biol 5: 323–338
24. Reynolds, CS (1984) The Ecology of Freshwater Phytoplankton,Cambridge University Press, Cambridge, pp 384
25. Reynolds, CS, Thompson, JM, Ferguson, AJD, Wiseman, SW(1982) Loss processes in the population dynamics of phytoplank-ton maintained in closed systems. J Plankton Res 4: 561–600
26. Sedmak, B, Kosi, G (1997) Microcystins in Slovene freshwaters(Central Europe) – first report. Nat Toxins 5: 64–73
27. Sedmak, B, Kosi, G (1998) The role of microcystins in heavycyanobacterial bloom formation. J Plankton Res 20: 691–708
28. Sedmak, B, Kosi, G (1998) Erratum. The role of microcystins inheavy cyanobacterial bloom formation. J Plankton Res 20: 1421
29. Sedmak, B, Kosi, G (2002) Harmful cyanobacterial blooms inSlovenia – bloom types and microcystin producers. Acta Biol Slov45: 17–30
30. Singh, DP, Tyagi, MB, Kumar, A, Thakur, JK, Kumar, A (2001)Antialgal activity of a hepatotoxin-producing cyanobacteriumMicrocystis aeruginosa. World J Microbiol Biotechnol 17: 15–22
31. Sivonen, K (1990) Effects of light, temperature, nitrate, ortho-phosphate, and bacteria on growth of and hepatotoxin productionby Oscillatoria agardhii strains. Appl Environ Microbiol 56: 2658–2666
32. Smayda, TJ, Boleyn, BJ (1965) Experimental observations on the
flotation of marine diatoms: I. Thalasiosira cf. nana, Thalassiosirarotula and Nitzschia seriata. Limnol Oceanogr 10: 499–509
33. Sukenik, A, Eshkol, R, Livne, A, Hadas, O, Kaplan, A, Tcernov, D,Vardi, A, Rom, M (2002) Inhibition of growth and photosynthesisof the dinoflagellate Peridinium gatunense by Microcystis sp.(cyanobacteria): a novel allelopathic mechanism. Limnol Oceanogr47: 1656–1663
34. Thompson, AS, Rhodes, JC, Pettman, I (1988) Culture Collectionof Algae and Protozoa – Catalogue of Strains, 5th ed. NaturalEnvironment Research Council, Titus Wilson and Son, Kendal,Ambleside, UK, pp 22
35. Tsuchiya, Y, Watanabe, M (1997) Disk type solid-phase extractionof microcystin in environmental water. Jpn J Toxicol EnvironHealth 43: 190–196
36. Vardi, A, Schatz, D, Beeri, K, Motro, U, Sukenik, A, Levine, A,Kaplan, A (2002) Dinoflagellate–cyanobacterium communicationmay determine the composition of phytoplankton assemblage in amesotrophic lake. Curr Biol 12: 1767–1772
37. Vollenweider, RA (1969) Primary Production in Aquatic Environ-ments. Internal Biology Program Handbook 12, Blackwell Scien-tific Publications, Burgess and Son, Oxford, UK, pp 213
38. Walsby, AE (1994) Gas vesicles. Microbiol Rev 58: 94–14439. Watanabe, MF, Watanabe, M, Kato, T, Harada, KI, Suzuki, M
(1991) Composition of cyclic peptide toxins among strains ofMicrocystis aeruginosa (blue-green algae, cyanobacteria). Bot MagTokyo 104: 49–57
40. Wetzel, RG, Likens, GE (1991) Composition and biomass ofphytoplankton. In: Limnological Analyses, 2nd ed. Springer, NewYork, pp 139–165
8 B. SEDMAK AND T. ELERSEK: MICROCYSTINS INDUCE CHANGES IN PHYTOPLANKTON
Copyright © 2022 FDOKUMEN