General and Regional Representative for Asia and the Pacific
41
1 st SRII Asia Summit 2013 16- 18 September, 2013, Bangkok, Thailand Hiroyuki Konuma FAO Assistant Director- General and Regional Representative for Asia and the Pacific
-
Upload
khangminh22 -
Category
Documents
-
view
0 -
download
0
Transcript of General and Regional Representative for Asia and the Pacific

1st SRII Asia Summit 2013 16- 18 September, 2013, Bangkok, Thailand
Hiroyuki Konuma
FAO Assistant Director- General and Regional Representative for Asia and the Pacific

2
World population is growing
Source: UN, 2011
0.00
0.50
1.00
1.50
2.00
2.50
0
2000
4000
6000
8000
10000
12000
19
50
19
55
19
60
19
65
19
70
19
75
19
80
19
85
19
90
19
95
20
00
20
05
20
10
20
15
20
20
20
25
20
30
20
35
20
40
20
45
20
50
20
55
20
60
20
65
20
70
20
75
20
80
20
85
20
90
20
95
21
00
developed Sub-Saharan Africa
NothAfrica and the Middle East Latin America and Caribb
South Asia Eastern Asia
percentage annual growth rate (right scale)
millions
3
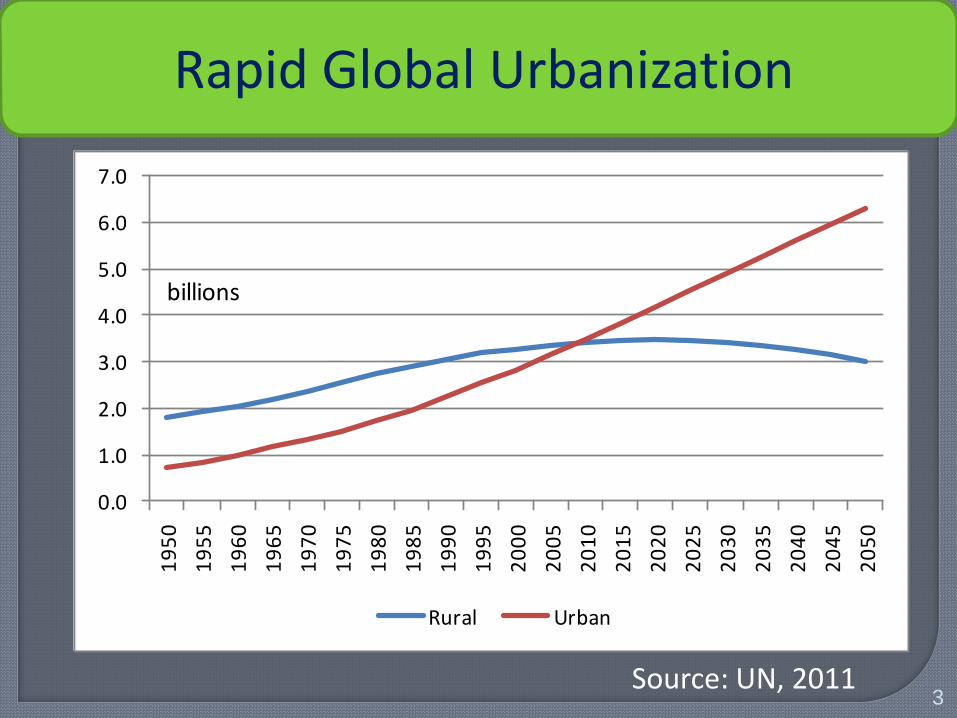
Rapid Global Urbanization
Source: UN, 2011
0.0
1.0
2.0
3.0
4.0
5.0
6.0
7.01
95
0
19
55
19
60
19
65
19
70
19
75
19
80
19
85
19
90
19
95
20
00
20
05
20
10
20
15
20
20
20
25
20
30
20
35
20
40
20
45
20
50
Rural Urban
billions

4
Food Consumption Trends
Source: Alexandratos, 2011
1500
2000
2500
3000
3500
1969/71 1979/81 1990/92 2005-07 2030 2050
Industrial countries Sub-Saharan Africa
Near East-North Africa Latin America & Caribbean
South Asia East Asia
Kcal/person/day


Can we produce sufficient
food to meet the demand of the
growing future population which
would reach 9.2 billion by 2050?
6
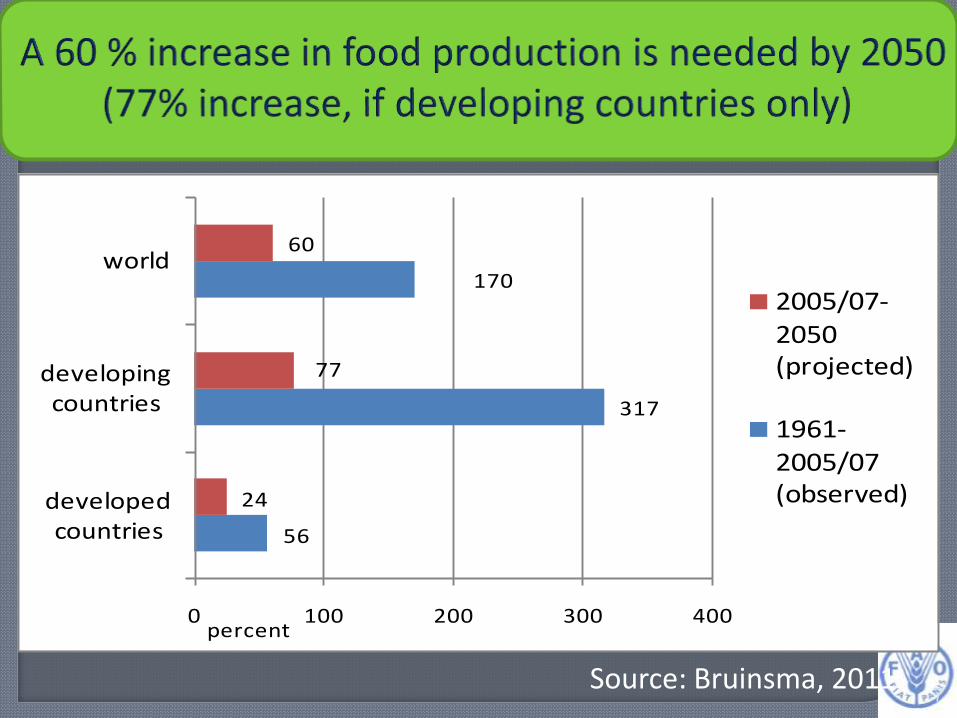
Food Security Outlook Towards Year 2050
7
56
317
170
24
77
60
0 100 200 300 400
developed countries
developing countries
world
percent
2005/07-
2050 (projected)
1961-2005/07 (observed)
Source: Bruinsma, 2011

8
Sources of Production Growth (91% is expected to come from yield increase)
Source: Bruinsma, 2011
-20.0
0.0
20.0
40.0
60.0
80.0
100.0
120.0
world developing developed
(percent)
Yields increases between 2005/07 and 2050
Crop intensity increases between 2005/07 and 2050
Area increase between 2005/07 and 2050

Stagnation of expansion of arable land Increasing scarcity of water resources Decline of productivity growth affected by lack of
investment in agriculture in recent decades Increasing post-harvest losses and table waste Various uncertainties such as future crude oil
prices, food price hike and volatilities, negative impact of climate changes and natural disasters, and bio-fuel development.
9
10
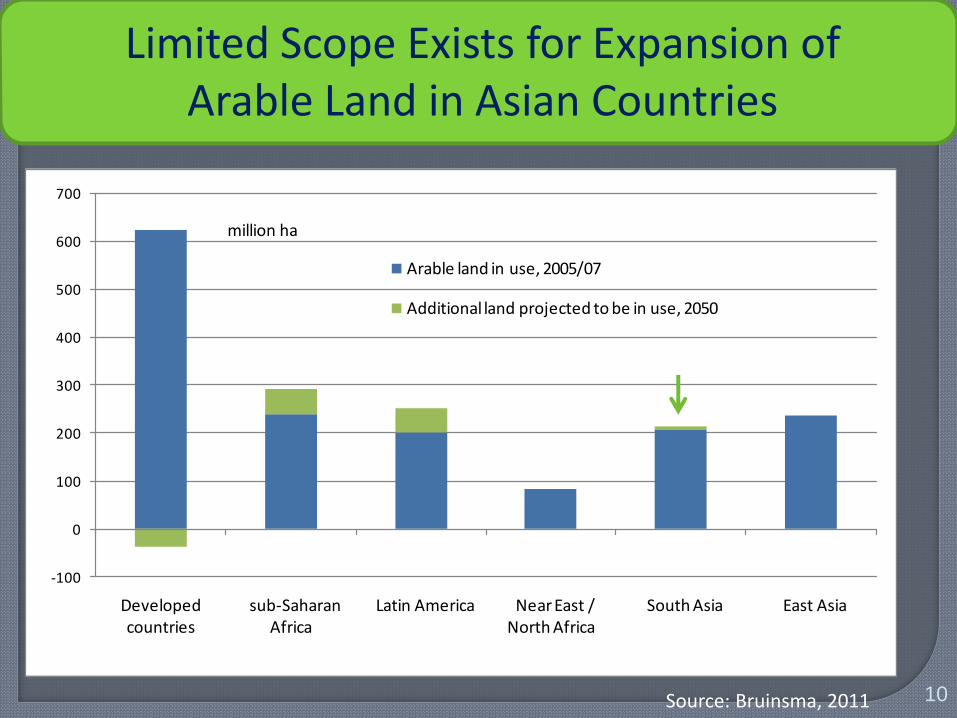
Limited Scope Exists for Expansion of Arable Land in Asian Countries
-100
0
100
200
300
400
500
600
700
Developed countries
sub-Saharan Africa
Latin America Near East / North Africa
South Asia East Asia
Arable land in use, 2005/07
Additional land projected to be in use, 2050
million ha
Source: Bruinsma, 2011

11
10th New Ag International Conference and Exhibition,
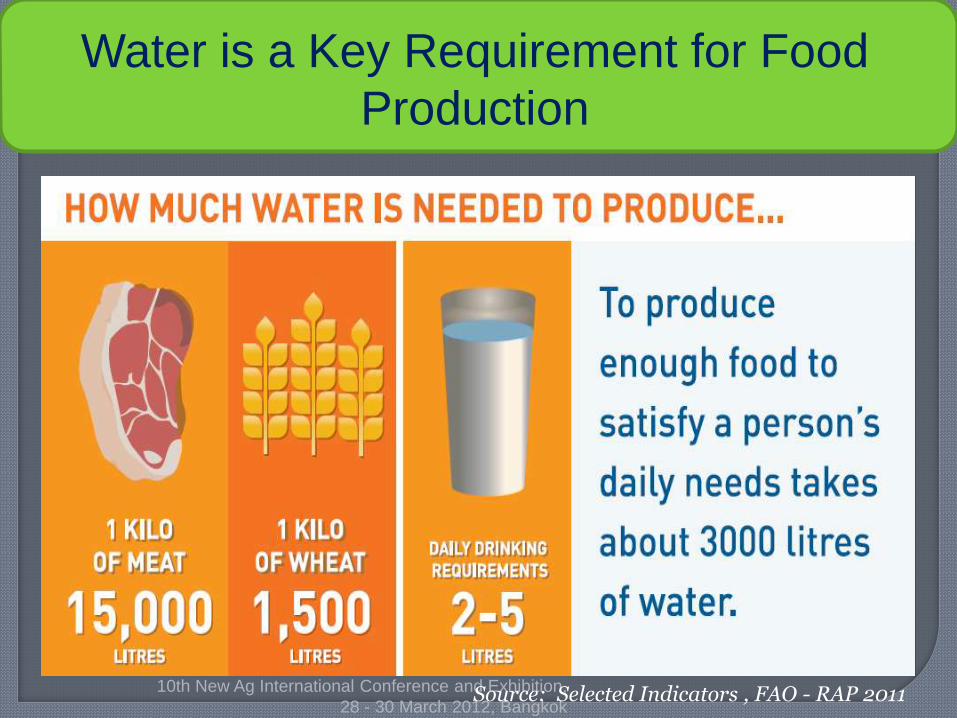
28 - 30 March 2012, Bangkok Source: Selected Indicators , FAO - RAP 2011
Water is a Key Requirement for Food
Production

0.0
0.5
1.0
1.5
2.0
2.5
3.0
3.5
Wheat Rice (paddy) Maize Total cereals
1961-2007
2005-2050
Growth rate, percent per year
Source: Bruinsma 2011

Global Food Losses
0%
10%
20%
30%
40%
50%
60%
cereals roots &
tubers
oilseeds &
pulses
fruits &
vegetables
meat fish &
seafood
dairy
products
Consumption
Distribution
Processing
Postharvest
Agriculture

8-Oct-2012 15
Wastage in Cereals Across Different Regions of
the Globe

Crude Oil Prices Increased By Over 500%
Since 1999
Download full dataset:
Excel, CSV | For more information contact us.
18
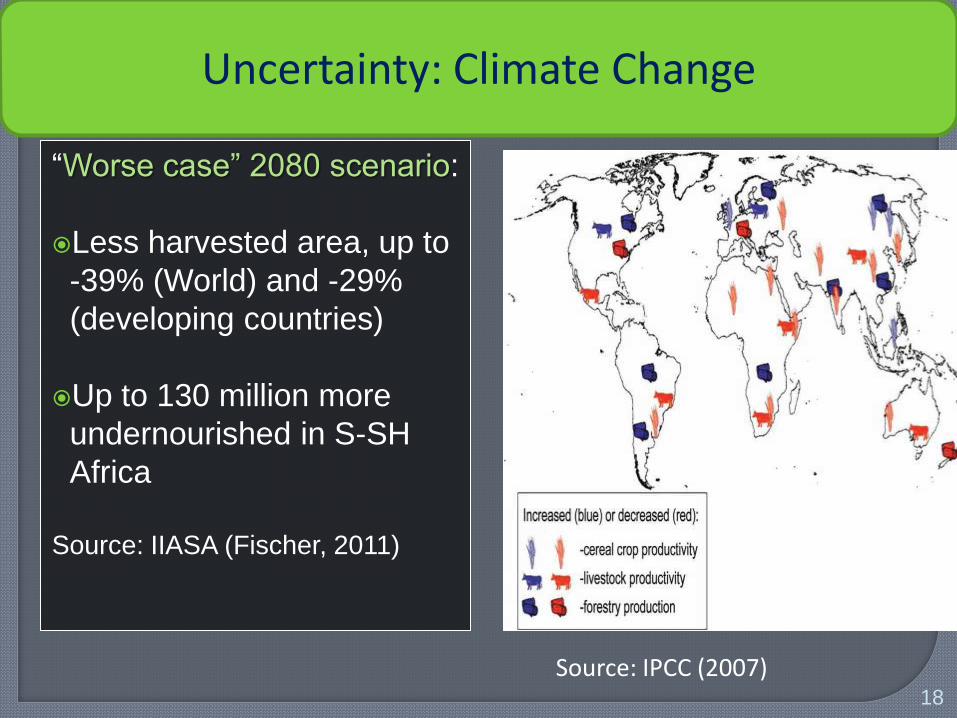
“Worse case” 2080 scenario:
Less harvested area, up to
-39% (World) and -29%
(developing countries)
Up to 130 million more
undernourished in S-SH
Africa
Source: IIASA (Fischer, 2011)
Source: IPCC (2007)
Uncertainty: Climate Change

The number of natural disasters occurring worldwide has increased
0
50
100
150
200
250
300
350
400
19
80
19
82
19
84
19
86
19
88
19
90
19
92
19
94
19
96
19
98
20
00
20
02
20
04
20
06
20
08
Africa Asia-Pacific Caribbean Europe Latin America North America
Number of Disasters
Source: ESCAP and ISDR, The Asia-Pacific Disaster Report 2010.

20
0
200
400
600
800
1000
1200
1400
1600
1800
2000
2005-07 2030 2005-07 2030 2005-07 2030 2005-07 2030
mill
ion
tons
other uses bio-fuel
cereals
excl ricesugar oilcrops starchy roots
Source: Alexandratos, 2011

World Bio-ethanol and Bio-diesel Production is Projected to Double in 20 years between 2009 and 2018

“Worldwide demand for liquid biofuel will
rise significantly to 1.6 million barrels per
day by 2015 and to 2.7 million barrels in
2030, thus meeting 5 percent of
total world road transport energy demand
(Tubiello and van der Velde (2010).
Global Demand for Liquid Biofuel is Expected to Continue to Show an Increasing Trend

Biofuel Production and Consumption Shows A
Rapid Growth Trend Across the Asian Region
Source: FAO BEFS
Asia-Pacific Biofuel Production and Consumption

40th Session of the Committee on World Food Security (CFS) held in October 2013 in Rome (attended by 121 countries and 37 Ministers/Vice Ministers) agreed that: Biofuel development encompasses both
opportunities and risks Food security should be priority concerns
of biofuel development which should not compromise food security.
Biofuel development should especially consider women and smallholders

Bio-fuel policies are coherent with food
security to minimize the risks of
competition and maximize opportunities of
biofuels in relation to food security.
Promote coordination of food security and
biofuel development strategies, and
sustainable management of natural
resources.

The High-Level Panel of Expert (HLPE) report issued in October 2013 recommended more clearly that:
Government should adopt the principle that biofuel shall not compromise food security
The Governments should adopt a coordinated food security and energy security strategy, which would require articulation around the following five axes/dimensions:

1. Adapt to the global, market –driven dinamics
2. Address the land, water and resource
implications of biofuel policies
3. Foster the transition from biofuels to
complehensive food-energy policy
4. Promote research and development
5. Develop methods and guidelines for
coordinated food,biofuels, bio-energy
policies at national and international levels

Food security, smallholder and gender
concerns should be integrated in bio-fuel
research and development.
Promote R&D in improving biofuel efficiency in
both resources and processes.
Exploring new technology including 2nd and 3rd
generations.
Promote international cooperation, SSC and
public-private sector partnership

Research should examine if and how both first- and
second-generation biofuels could contribute to restoring
degraded land and to the better management of
watersheds.
R&D resources should be dedicated to accelerating the
commercial feasibility of more advanced renewable
energy pathways.
In order to better inform decision-making, governments,
FAO, research and associated institutions should
promote and facilitate exchange of information and
cooperation for food security and biofuels assessments
and projections, including by providing transparent
information on assumptions, methods, tools and data
used.

Indonesia and Malaysia lead in production and export of biodiesel from palm oil.
Thailand produces ethanol and biodiesel.
Philippines producing and using biodiesel from coconut oil and jathropa
Viet Nam producing ethanol and biodiesel from non-conventional feedstocks including cellulosic seaweed and fish oil
Myanmar, Laos and Cambodia – Biodiesel production from jatropha
Source: Bhandhubanyong (2008)

0
500
1000
1500
2000
2500
Indonesia Malaysia
Philippines Thailand
Viet Nam
2008-2010
2020
(mil
lio
n lit
res)
Selected Indicators Indicators , FAO - RAP 2011

Food security
Society
Environment
Economy
Risks and Trade Offs to be Confronted
If managed properly the bio-energy sector can present a range of opportunities to develop clean domestic energy sources

Negative Impacts Positive Impacts Food insecurity for the poor, and particularly the urban poor could increase if bio-fuel production pushed aside food production and prices for agricultural products increased.
Contributes to generating new stimuli in the agricultural sector, that offer new opportunities and increased income earnings for rural communities.
Achieving a balance necessitates the development of innovative food security policies that support the integration of bio-energy crop production with food production.

Production of second-generation biofuels • Fuels produced from a wide array of different feedstock,
ranging from lignocellulosic feedstocks (from crop residues, grasses and wood) to municipal solid wastes.
Production of third generation biofuels • Fuels produced from algal biomass which has a very
distinctive growth yield as compared with classical lignocellulosic biomass.
• Production of biofuels from algae is reliant on the lipid content of these organisms
Production of third generation biofuels
• Fuels produced from algal biomass which has a
very distinctive growth yield as compared with
classical lignocellulosic biomass.
• Production of biofuels from algae is reliant on the
lipid content of these organisms

Secretariat of CFS and HLPE
http://www.fao.org/docrep/meeting/029/MI3
41e.pdf
http://www.fao.org/docrep/meeting/029/mi7
44e.pdf
http://www.fao.org/docrep/meeting/029/mi0
32e.pdf

Agro Ecological Zoaning (GAEZ) http://www.fao.org/nr/gaez/en/
FAO TCP programme with ASEAN for the
harmonization of bioenergy and food security policy
http://www.fao.org/energy/befs/en/
http://www.fao.org/docrep/013/i1968e/i1968e00.htm


The bio-energy sector would present both risks on food security , and a range of opportunities for developing clean, domestic energy sources with additional benefits for rural development.
Achieving energy and food security simultaneously will necessitate that decision-makers, consider broader influences and trade-offs.

• R&D is important in improving the efficiency of biofuels regarding both resources and processes.
• Exploring new technologies including biofuels of the second and third generations is a key for future break though.
• Research partners are encouraged to devise solutions adapted to the needs of all stakeholders, especially those in least-developed countries and of women and smallholders who are most in need of access to modern energy services.

Requirement (Billion USD)
%
Primary crop production 1,684 57 Downstream support services
• Cold and dry storage
• Rural and wholesale markets
• First stage processing
1266 305 280 682
42.9 24
22.2 58.8
Cumulative Investment Requirements for East Asia - 2005/07 to 20501
1Source: Capital Requirements for Agriculture in Developing Countries to 2050. FAO Rome (2009) (All numbers are in 2009 US$ values)
Thank you