DESIGN OF A PROTEUS LATTICE REPRESENTATIVE ... - CiteSeerX
12
PHYSOR 2012 – Advances in Reactor Physics – Linking Research, Industry, and Education Knoxville, Tennessee, USA, April 15-20, 2012, on CD-ROM, American Nuclear Society, LaGrange Park, IL (2012) DESIGN OF A PROTEUS LATTICE REPRESENTATIVE OF A BURNT AND FRESH FUEL INTERFACE AT POWER CONDITIONS IN LIGHT WATER REACTORS Mathieu Hursin * * * * and Gregory Perret Paul Scherrer Institut (PSI) 5232 Villigen, Switzerland [email protected]; [email protected] ABSTRACT The research program LIFE (Large-scale Irradiated Fuel Experiment) between PSI and swissnuclear has been started in 2006 to study the interaction between large sets of burnt and fresh fuel pins in conditions representative of power light water reactors. Reactor physics parameters such as flux ratios and reaction rate distributions ( 235 U and 238 U fissions and 238 U capture) are calculated to estimate an appropriate arrangement of burnt and fresh fuel pins within the central element of the test zone of the zero-power research reactor PROTEUS. The arrangement should minimize the number of burnt fuel pins to ease fuel handling and reduce costs, whilst guaranteeing that the neutron spectrum in both burnt and fresh fuel regions and at their interface is representative of a large uniform array of burnt and fresh pins in the same moderation conditions. First results are encouraging, showing that the burnt/fresh fuel interface is well represented with a 6×6 bundle of burnt pins. The second part of the project involves the use of TSUNAMI, CASMO-4E and DAKOTA to perform parametric and optimization studies on the PROTEUS lattice by varying its pitch (P) and fraction of D 2 O in moderator (F D2O ) to be as representative as possible of a power light water reactor core at hot full power conditions at beginning of cycle (BOC). The parameters P and F D2O that best represent a PWR at BOC are 1.36 cm and 5% respectively. Key Words: Integral Index, Spectral Indices, Experiment Representativity, Research Reactor. 1. INTRODUCTION An important area for research in nuclear power reactor technology is driven by the demand for improved operational safety assessments, more efficient fuel cycle strategies and greater operational flexibility of current and future light water reactors (LWRs). Concrete examples are given by utility projects aiming at increasing average discharge burnup, extending plant life, up-rating the thermal power and/or increasing cycle lengths. Regarding the extended-burnup, one issue is related to the very heterogeneous core configurations at beginning of cycle, with mixing of highly-depleted old assemblies and highlyreactive new assemblies. This increased core heterogeneity produces very strong neutron flux gradients and neutron spectrum changes, especially at the interfaces between highly-enriched and highly-burnt fuel pins. These gradients are difficult to predict with the current nodal core simulators leading to increased discrepancies between in-core measured and predicted instrumentation, typically by 2-4% [1]. The research program LIFE@PROTEUS [1] (Large-scale Irradiated Fuel Experiment) between PSI and swissnuclear has been started in 2006 to study the interaction between large sets of burnt and fresh fuel pins in conditions representative of power light water reactors in the zero power reactor facility PROTEUS. The project was planned to first study interfaces between fresh and burnt UO 2 fuel pins typical of Pressurized Water Reactors (PWR). To be representative of today’s enrichment norms, the enrichment of the fresh pins was set to 5 wt. %. Two batches of burnt fuel pins were to be studied in turn with initial 235 U enrichments of about 4%, 10 years cooling time and average * Corresponding Author
-
Upload
khangminh22 -
Category
Documents
-
view
1 -
download
0
Transcript of DESIGN OF A PROTEUS LATTICE REPRESENTATIVE ... - CiteSeerX

PHYSOR 2012 – Advances in Reactor Physics – Linking Research, Industry, and Education Knoxville, Tennessee, USA, April 15-20, 2012, on CD-ROM, American Nuclear Society, LaGrange Park, IL (2012)
DESIGN OF A PROTEUS LATTICE REPRESENTATIVE OF A BURNT AND FRESH FUEL INTERFACE AT POWER
CONDITIONS IN LIGHT WATER REACTORS
Mathieu Hursin ∗∗∗∗ and Gregory Perret Paul Scherrer Institut (PSI) 5232 Villigen, Switzerland
[email protected]; [email protected]
ABSTRACT
The research program LIFE (Large-scale Irradiated Fuel Experiment) between PSI and swissnuclear has been started in 2006 to study the interaction between large sets of burnt and fresh fuel pins in conditions representative of power light water reactors. Reactor physics parameters such as flux ratios and reaction rate distributions (235U and 238U fissions and 238U capture) are calculated to estimate an appropriate arrangement of burnt and fresh fuel pins within the central element of the test zone of the zero-power research reactor PROTEUS. The arrangement should minimize the number of burnt fuel pins to ease fuel handling and reduce costs, whilst guaranteeing that the neutron spectrum in both burnt and fresh fuel regions and at their interface is representative of a large uniform array of burnt and fresh pins in the same moderation conditions. First results are encouraging, showing that the burnt/fresh fuel interface is well represented with a 6×6 bundle of burnt pins. The second part of the project involves the use of TSUNAMI, CASMO-4E and DAKOTA to perform parametric and optimization studies on the PROTEUS lattice by varying its pitch (P) and fraction of D2O in moderator (FD2O) to be as representative as possible of a power light water reactor core at hot full power conditions at beginning of cycle (BOC). The parameters P and FD2O that best represent a PWR at BOC are 1.36 cm and 5% respectively. Key Words: Integral Index, Spectral Indices, Experiment Representativity, Research Reactor.
1. INTRODUCTION An important area for research in nuclear power reactor technology is driven by the demand for improved operational safety assessments, more efficient fuel cycle strategies and greater operational flexibility of current and future light water reactors (LWRs). Concrete examples are given by utility projects aiming at increasing average discharge burnup, extending plant life, up-rating the thermal power and/or increasing cycle lengths. Regarding the extended-burnup, one issue is related to the very heterogeneous core configurations at beginning of cycle, with mixing of highly-depleted old assemblies and highlyreactive new assemblies. This increased core heterogeneity produces very strong neutron flux gradients and neutron spectrum changes, especially at the interfaces between highly-enriched and highly-burnt fuel pins. These gradients are difficult to predict with the current nodal core simulators leading to increased discrepancies between in-core measured and predicted instrumentation, typically by 2-4% [1]. The research program LIFE@PROTEUS [1] (Large-scale Irradiated Fuel Experiment) between PSI and swissnuclear has been started in 2006 to study the interaction between large sets of burnt and fresh fuel pins in conditions representative of power light water reactors in the zero power reactor facility PROTEUS. The project was planned to first study interfaces between fresh and burnt UO2 fuel pins typical of Pressurized Water Reactors (PWR). To be representative of today’s enrichment norms, the enrichment of the fresh pins was set to 5 wt. %. Two batches of burnt fuel pins were to be studied in turn with initial 235U enrichments of about 4%, 10 years cooling time and average
∗ Corresponding Author

Mathieu Hursin and Gregory Perret
2012 Advances in Reactor Physics – Linking Research, Industry, and Education (PHYSOR 2012), Knoxville, Tennessee, USA April 15-20, 2012
2/12
burnups of about 40 and 60 GWd/t, respectively. The envisaged burnup range is characteristic of the evolution of the average burnup in spent assemblies used in PWRs during the last decade and in the near future.
a) Cut-away view of the LWR-PROTEUS facility b) Lattice arrangement of the
test zone Figure 1. Schematics of the LWR-PROTEUS Facility
The test-zone configuration for the LWR-PROTEUS program is illustrated in Figure 1 and is composed of an annular buffer-zone, located between the central test-zone and the outer driver-regions. The buffer-zone decouples the neutron spectrum in the test zone from that of the thermal driver zones. The net influence of the outer reactor regions on the neutron spectrum at the centre of the test zone is therefore usually minimal. The buffer-region consists of tightly packed natural uranium rods in air. The D2O moderated driver-zone, located outside of the buffer zone, serves both as a driver region and as a neutron bridge acting to maintain sufficient thermal flux in the graphite driver, which in turn guarantees sufficient worth for the safety/shutdown rods. It is fuelled with 5% enriched UO2 fuel. The D2O-zone is surrounded by a graphite driver/reflector-region. This zone contains additional driver fuel, safety, shutdown and control rods and the nuclear instrumentation. The fuel in this zone is identical to the fuel in the D2O-driver. With the exception of the test zone, the fuel height in the various zones varies between 93 and 150 cm. Preliminary design of the PROTEUS core loadings for the LIFE program were assessed in 2009 using a whole-reactor MCNPX model to calculate 235U, 238U and 239Pu fission, power and 238U capture distributions across the burnt/fresh fuel pin interface contained in PROTEUS test zone. Results were reported in [1]. The design involved nine 10×10 pins sub-assemblies to ease handling the full-length PWR burnt fuel pins. The configuration chosen to study the interface between 60 GWd/t burnt and fresh fuel pins featured a 6×6 square bundle of spent fuel pins. However, the LIFE project has been significantly modified during the second half of 2010 and ended up in the form of a new project named RISE (Re-Irradiated Spent-fuel Experiments), which introduces the use of overcladded spent fuel segments in place of full-length PWR rods. RISE helps significantly reducing the costs and improving the safety of the experiments. The introduction of overclad around the spent fuel pins significantly changes the fuel to moderator ratio as compared to a PWR and the representativity of the experimental lattice needs to be reevaluated. The objectives of the present work are two folds. The first objective is to characterize the burnt/fresh fuel interface, which uses 6×6 overcladded burnt fuel segments, and to decide if the spectrum conditions at the interface and in the burnt fuel area are representative of those observed with large bundle of burnt and fresh pins. The second part of the work is to optimize the parameters of the RISE lattice (pitch and moderator composition) to represent as well as possible the burnt/fresh fuel interface observed under PWR operating conditions. The present paper is divided as follows. Section 2 describes the methods to assess the representativity of an experiment. Section 3 is dedicated to the characterization of the initial RISE setup. Section 4 presents the optimization of the RISE lattice to improve the representation of PWR operating conditions. Finally, Section 5 summarizes the paper and discusses future activities.

Design of a PROTEUS lattice representative of a burnt and fresh fuel interface at power conditions for LWRs.
2012 Advances in Reactor Physics – Linking Research, Industry, and Education (PHYSOR 2012), Knoxville, Tennessee, USA April 15-20, 2012
3/12
2. REPRESENTATIVITY OF AN EXPERIMENT
Before presenting the methods to quantify the representativity of an experiment, a few concepts need to be defined. In the rest of the paper, an “application” refers to a real system, for example a burnt/fresh fuel interface at PWR power conditions, which one wants to study with an “experiment”. An “experiment” refers to a system supposed to represent the application conditions, for example a certain design of the RISE lattice in PROTEUS. Traditional methods for criticality analysis validation include choosing experiments with characteristics that are similar to those of the application being validated. Such characteristics typically include fissile elements, fissile concentration, moderator type, geometrical configuration, hydrogen to fissile atom ratio, average neutron-energy causing fission, etc. Recently, there have been investigations to produce quantitative methods to measure the similarity between experiments and applications. Part of these methods is presented in the next section. 2.1. Integral Indices As an alternative to the traditional system-averaged trending parameters, Oakridge National Laboratory has utilized sensitivity techniques to provide a quantifiable physics-based measure of the similarity of an application and an experiment. The objective was to produce a single integral index that quantifies the similarity between two systems. The Tools for Sensitivity and Uncertainty Analysis Methodology Implementation (TSUNAMI) [2] has been developed for this specific purpose. In the present work, the older version of TSUNAMI-5 in the SCALE-5 [2] package is used. The basis of the TSUNAMI analysis technique is that an experiment is considered representative of an application if the neutron multiplication factors of both systems exhibit similar sensitivities to perturbations in the neutron cross-section data – on an energy-dependant and nuclide-reaction specific level. In the literature several integral indices have been defined, all with some limitations [4]. In this work, however, only the integral index ck is considered. It is a correlation coefficient that couples the sensitivity data with tabulated cross-section covariance data to give a measure of the shared variance between an application and an experiment. For the sake of completeness, a brief description of the derivation of ck is given below; for more details see [3]. Assuming that M is the number of nuclide-reaction pairs times the number of neutron energy groups and that two systems are considered (the application and the experiment), the law of error propagation is expressed as:
SVSV inT
out = (1) where Vin is the M×M input covariance matrix on the nuclide and energy dependent cross-sections, S is the 2×M matrix of sensitivity coefficients and Vout is the 2×2 output covariance matrix on the k-eff of the two systems. The Vout matrix consists of the relative variance values on the k-eff of each system under consideration (σi, diagonal term), i.e. the application and the experiment, as well as the relative covariance between the two systems (σi,, off-diagonal term). ck is the correlation coefficient between the systems i and j and is expressed by:
( )ji
ijkc
σσσ 2
= (2)
A value of 1.0 for ck represents full correlation between the two systems. In criticality safety analysis, an experiment can be used to validate a code for a certain application if the value of the correlation coefficient ck between the experiment and the application is higher than 0.8. This criterion indicates that 80% of the variance in k-eff due to the cross-section data is common to the

Mathieu Hursin and Gregory Perret
2012 Advances in Reactor Physics – Linking Research, Industry, and Education (PHYSOR 2012), Knoxville, Tennessee, USA April 15-20, 2012
4/12
two systems. This criterion is somewhat arbitrary but was accepted by the regulatory body in the USA [5]. Beside the evaluation of the cut-off limit for ck, another issue with the integral index ck is the fact that it quantifies the shared variance between an application and an experiment for k-eff, a global parameter. Since the main purpose of the presented work is to investigate the interface between fresh and burnt fuel, i.e. some local behavior, ck may not be the best indices to quantify the similarity between the RISE experiments and the conditions in a PWR. Nevertheless, this index will be tested in Section 4. 2.2. Spectral Indices and Flux Ratios Another approach has been used to judge how representative were the previous PROTEUS experimental campaigns from the spectral conditions of the application to be studied. The approach consists in comparing spectral indices of the experiment and the application, and has the advantage to be verifiable a posteriori during the experiments by measuring the spectral indices. A few examples of typical spectral indices considered for UOX systems are the 238U fission to total fission ratio (F8/FTOT) and the 238U capture to total fission ratio (C8/FTOT). Each spectral index is representative of a certain part of the neutron spectrum. C8/FTOT is a measure of the epithermal-to-thermal flux ratio and F8/FTOT of the fast-to-thermal flux part of the spectrum. In addition, the thermal to fast flux ratio Φth/Φfast (the limit for thermal neutrons is set to 0.625 eV) is generally calculated. An experiment with similar spectral indices than an application is deemed representative. Since the spectral indices can be determined at the fuel rod level, the spectral indices can be used to represent local conditions, e.g. burnt/fresh fuel interfaces.
3. RISE INITIAL SETUP In the RISE program, the spent fuel pins are cut and overcladded in 40-cm long segments. The handling of overcladded fuel segments is significantly eased in comparison to that of full length PWR pins. However, the introduction of overclads around the spent fuel significantly changes the moderation ratio as compared to a PWR and the representativity of the experimental lattice need to be reevaluated. In order to investigate the burnt/fresh fuel interface, the MCNPX1 code is used and the F8/FTOT and C8/FTOT spectral indices as well as the Φth/Φfast flux ratio (0.625eV threshold) are calculated. In the next sections, the MCNPX model used to characterize the initial RISE lattice design, which features a burnt/fresh fuel interface with a 6×6 bundle of overcladded burnt fuel segments, is presented. The calculated spectral indices are compared to those obtained in a model featuring an asymptotically large bundle of overclad spent fuel in the same moderation conditions. Then the initial RISE set-up is compared to an asymptotically large bundle of spent fuel without overclad to test the impact of the overclad on the spectral conditions. 3.1. RISE MCNPX model The MCNPX model for the initial RISE lattice design is a pseudo 2D assembly model composed of 11×11 fuel segments with reflective boundary conditions in the radial (x,y) directions and void conditions in the axial direction (z). The elevation of the model is adjusted to reach criticality. The model comprises a 3×3 bundle of overcladded spent fuel segments, which correspond to a 6×6 bundle with the boundary conditions, surrounded by fresh UO2 5 wt. % fuel. Geometrical characteristics of the fresh and overcladded burnt fuel segments are provided in Table 1. The composition of the spent fuel was generated by CASMO-4E calculations using an equivalent pin- 1 Provided by Los Alamos National Lab.
Design of a PROTEUS lattice representative of a burnt and fresh fuel interface at power conditions for LWRs.
2012 Advances in Reactor Physics – Linking Research, Industry, and Education (PHYSOR 2012), Knoxville, Tennessee, USA April 15-20, 2012
5/12
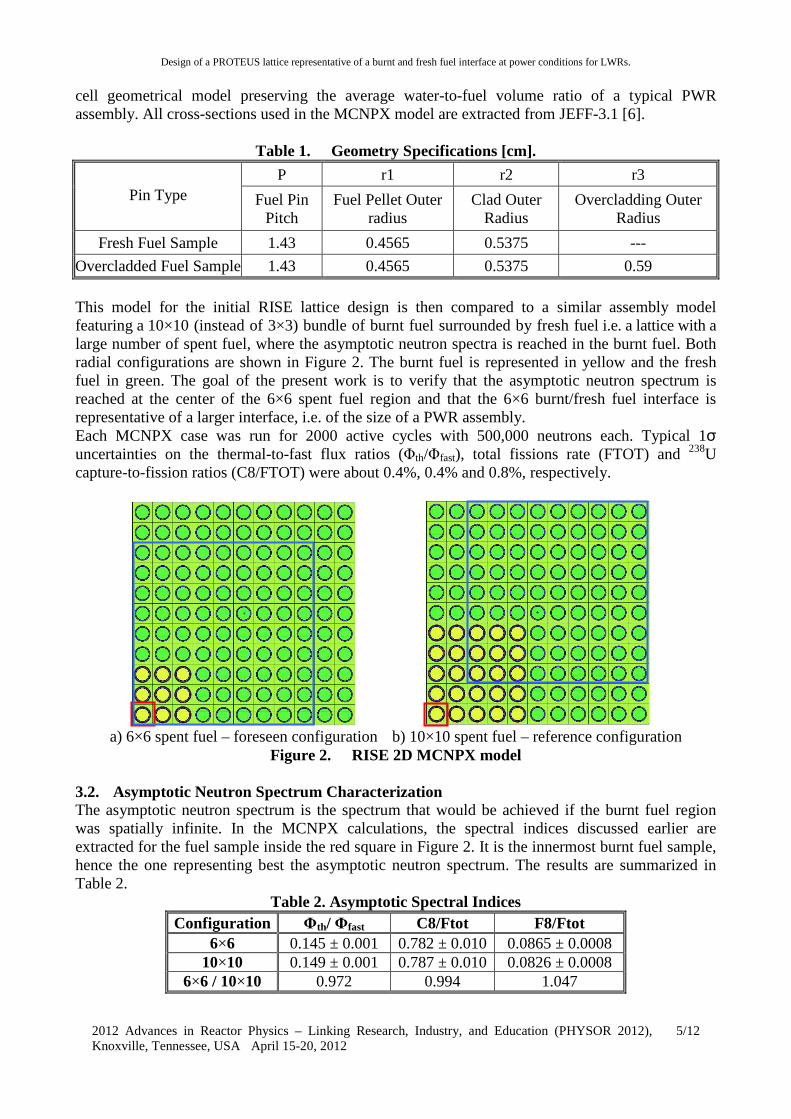
cell geometrical model preserving the average water-to-fuel volume ratio of a typical PWR assembly. All cross-sections used in the MCNPX model are extracted from JEFF-3.1 [6].
Table 1. Geometry Specifications [cm].
P r1 r2 r3 Pin Type Fuel Pin
Pitch Fuel Pellet Outer
radius Clad Outer
Radius Overcladding Outer
Radius
Fresh Fuel Sample 1.43 0.4565 0.5375 ---
Overcladded Fuel Sample 1.43 0.4565 0.5375 0.59
This model for the initial RISE lattice design is then compared to a similar assembly model featuring a 10×10 (instead of 3×3) bundle of burnt fuel surrounded by fresh fuel i.e. a lattice with a large number of spent fuel, where the asymptotic neutron spectra is reached in the burnt fuel. Both radial configurations are shown in Figure 2. The burnt fuel is represented in yellow and the fresh fuel in green. The goal of the present work is to verify that the asymptotic neutron spectrum is reached at the center of the 6×6 spent fuel region and that the 6×6 burnt/fresh fuel interface is representative of a larger interface, i.e. of the size of a PWR assembly. Each MCNPX case was run for 2000 active cycles with 500,000 neutrons each. Typical 1σ uncertainties on the thermal-to-fast flux ratios (Φth/Φfast), total fissions rate (FTOT) and 238U capture-to-fission ratios (C8/FTOT) were about 0.4%, 0.4% and 0.8%, respectively.
a) 6×6 spent fuel – foreseen configuration b) 10×10 spent fuel – reference configuration
Figure 2. RISE 2D MCNPX model 3.2. Asymptotic Neutron Spectrum Characterization The asymptotic neutron spectrum is the spectrum that would be achieved if the burnt fuel region was spatially infinite. In the MCNPX calculations, the spectral indices discussed earlier are extracted for the fuel sample inside the red square in Figure 2. It is the innermost burnt fuel sample, hence the one representing best the asymptotic neutron spectrum. The results are summarized in Table 2.
Table 2. Asymptotic Spectral Indices Configuration Φth/ Φfast C8/Ftot F8/Ftot
6×6 0.145 ± 0.001 0.782 ± 0.010 0.0865 ± 0.0008 10×10 0.149 ± 0.001 0.787 ± 0.010 0.0826 ± 0.0008
6×6 / 10×10 0.972 0.994 1.047

Mathieu Hursin and Gregory Perret
2012 Advances in Reactor Physics – Linking Research, Industry, and Education (PHYSOR 2012), Knoxville, Tennessee, USA April 15-20, 2012
6/12
The overall agreement for the spectral indices corresponding to the asymptotic spectrum conditions is good between the 6×6 and 10×10 burnt fuel sample arrangement. The thermal-to-fast flux ratio and the F8/FTOT spectral indices show bigger differences, up to about 5% for the F8/FTOT index. This shows that the asymptotic spectrum is not fully reached if a 6×6 burnt fuel sample assembly is used, especially in the high-energy part of the spectrum, which is expected since the mean free path of the concerned neutron is much longer. However, a 5% discrepancy is a small and acceptable penalty to take compared to the gains, both in terms of safety and cost, of using an as small as possible number of a burnt fuel segments. The spectral indices at the interface between burned and fresh fuel are investigated in the next section. 3.3. Burnt/Fresh Fuel Interface Characterization In order to characterize the burnt/fresh fuel interface, the spectral indices F8/FTOT, C8/FTOT and the flux ratio Φth/ Φfast are extracted for each of the fuel sample within the blue square of both the 6×6 and 10×10 models as shown in the Figure 2. The ratio between the Φth/ Φfast indices, calculated for each fuel sample of the 6×6 and 10×10 burnt fuel configurations, is shown in the Figure 3.
0.998 0.996 0.995 1.014 1.004 0.993 0.996 0.993 1.013 1 0.99 1.01 1.003 1.004 1.004 0.995 0.984 1.003
1.005 1.008 0.999 0.997 1.001 0.993 1 0.993 1.003
0.983 1 1.006 1.01 1.017 1.001 0.99 1.01 1.006
0.979 1.003 0.997 1.007 0.998 1.005 1.001 1.009 1.003 0.997 0.995 0.994 0.985 1.006 1 1.006 1.002 0.994 0.989 1.022 0.999 0.986 0.998 0.993 0.993 1.013 1 0.984 1.003 0.999 1.008 0.984 0.994 0.983 1.003 0.994 0.995 0.994 1 1.013 1.006 1.003 0.986 0.998 1.007
Figure 3. Pin-by-Pin thermal-to-fast flux index ratio between 6×6 and 10×10 configuration A ratio equal to 1 means that the Φth/Φfast index is the same if a 6×6 or 10×10 configuration is considered. The biggest deviation from unity at the interface between fresh and burnt fuel is a little above 1%, on the fresh fuel side of the interface (red square in Figure 3). Since the foreseen measurement techniques [1] have a precision of a couple of percents, the representativity of the Φth/Φfast index for the 6×6 burnt fuel arrangements is acceptable. For the sake of conciseness, only the Φth/ Φfast indices results are presented here. However, the conclusions drawn with Φth/Φfast are applicable to both C8/FTOT and F8/FTOT. 3.4. Effect of the Fuel Overcladding The next effect that needs to be assessed is the effect of the overclad around the burnt fuel segments. In order to do so, a more realistic model of the RISE lattice, including overclad, interassembly casing and water gap is made with MCNPX and compared to the 10×10 burnt fuel sample arrangements used earlier (Figure 2b)) where the overclad of the burnt fuel sample has been removed. Both arrangements are shown in Figure 4. The blue square represents the fuel segments considered for the spectral indices comparison. In Figure 4a), the corner rods are made of stainless steel and are used to strengthen the assembly. The burnt fuel is red and the fresh one is light green. In Figure 4b), the burnt fuel is yellow and the fresh one is green.

Design of a PROTEUS lattice representative of a burnt and fresh fuel interface at power conditions for LWRs.
2012 Advances in Reactor Physics – Linking Research, Industry, and Education (PHYSOR 2012), Knoxville, Tennessee, USA April 15-20, 2012
7/12
a) RISE 6×6 spent fuel overcladded
in 10×10 assembly b) 10×10 spent fuel – reference configuration,
Without overclad Figure 4. RISE 2D advanced model
The presence of overclad tends to reduce the moderation in the burnt fuel sample, hence hardening the spectrum. The Φth/Φfast flux ratio is a good indicator of such a phenomenon. For each of the fuel sample within the blue square of both models shown in Figure 4, Φth/Φfast is recorded and the ratio of the spectral index for the overcladded model divided by the non-overcladded model is shown in Figure 5.
0.936 0.883 0.869 0.880 0.920 1.000 1.044 1.108 1.224 0.889 0.865 0.866 0.870 0.912 0.978 1.027 1.060 1.128 0.877 0.865 0.862 0.871 0.912 0.970 1.011 1.041 1.081 0.883 0.871 0.871 0.887 0.909 0.981 1.012 1.032 1.076 0.924 0.910 0.904 0.903 0.928 0.976 1.002 1.041 1.085 1.002 0.984 0.979 0.977 0.983 1.008 1.020 1.050 1.097 1.042 1.030 1.015 1.008 1.015 1.026 1.046 1.069 1.126 1.105 1.061 1.034 1.026 1.036 1.052 1.069 1.120 1.229 1.227 1.128 1.086 1.079 1.083 1.095 1.118 1.222 --
Figure 5. Pin-by-Pin thermal-to-fast flux index ratio between overcladded and non-overcladded fuel configuration
As expected, strong deviation from unity are observed in the burnt fuel segments, where overclads are present only in one model. The Φth/Φfast index is about 10% lower in the overcladded fuel suggesting a hardening of the neutron spectrum due to the reduction of the amount of moderator. With regards the representativity of the 6×6 configuration as compared to real PWR conditions, several limitations are to be taken into account: the change of moderation conditions due to the insertion of overclad and the room temperature of the moderator (as shown above), but also the absence of Maxwell peak shifts due to the low temperature of the fuel, and the absence of dissolved boron as during most of the PWR cycle. Preliminary MCNPX studies in which fresh pins have been modeled with and without overclads and where the density of the moderator has been varied showed that the C8/FTOT and F8/FTOT spectral indices and the thermal-to-fast flux ratios cannot be all made to match the Beginning Of Cycle (BOC) conditions within 2-3%. However, the pitch and the moderator composition of the RISE initial lattice design were varied systematically to find the best possible representation of PWR at power conditions using the methods introduced in Section 2. These studies are the subject of the next section of this paper.
Mathieu Hursin and Gregory Perret
2012 Advances in Reactor Physics – Linking Research, Industry, and Education (PHYSOR 2012), Knoxville, Tennessee, USA April 15-20, 2012
8/12
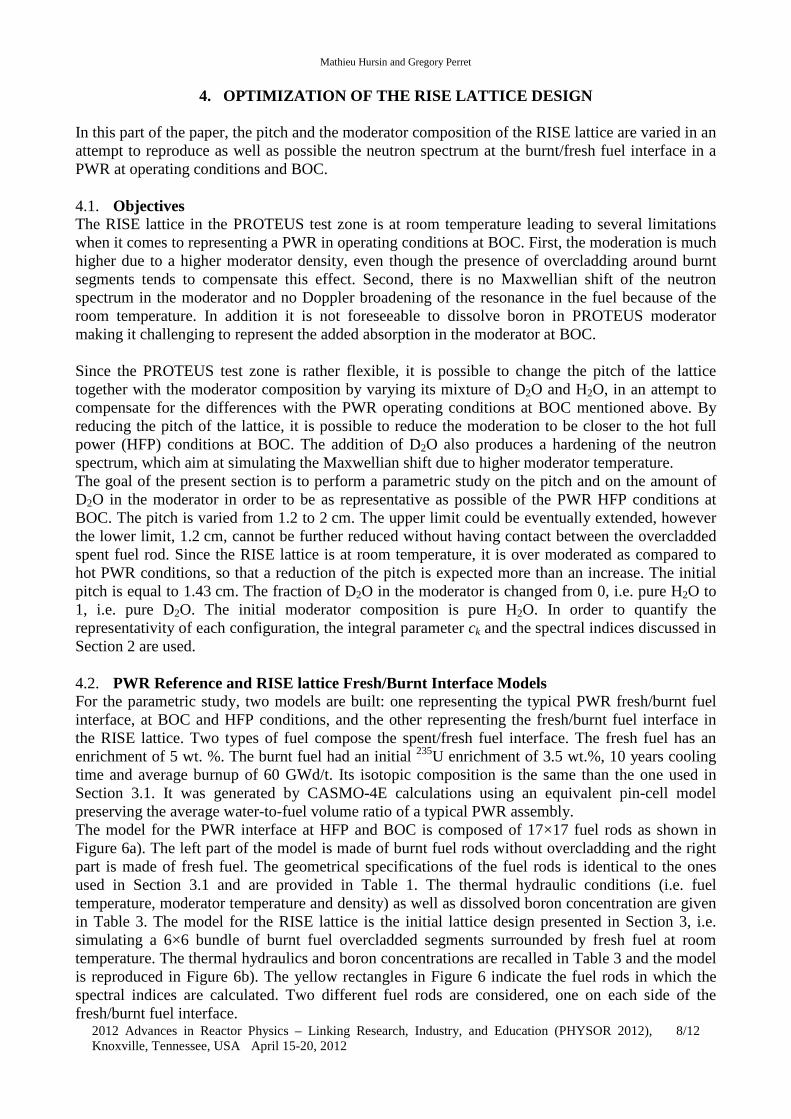
4. OPTIMIZATION OF THE RISE LATTICE DESIGN In this part of the paper, the pitch and the moderator composition of the RISE lattice are varied in an attempt to reproduce as well as possible the neutron spectrum at the burnt/fresh fuel interface in a PWR at operating conditions and BOC. 4.1. Objectives The RISE lattice in the PROTEUS test zone is at room temperature leading to several limitations when it comes to representing a PWR in operating conditions at BOC. First, the moderation is much higher due to a higher moderator density, even though the presence of overcladding around burnt segments tends to compensate this effect. Second, there is no Maxwellian shift of the neutron spectrum in the moderator and no Doppler broadening of the resonance in the fuel because of the room temperature. In addition it is not foreseeable to dissolve boron in PROTEUS moderator making it challenging to represent the added absorption in the moderator at BOC. Since the PROTEUS test zone is rather flexible, it is possible to change the pitch of the lattice together with the moderator composition by varying its mixture of D2O and H2O, in an attempt to compensate for the differences with the PWR operating conditions at BOC mentioned above. By reducing the pitch of the lattice, it is possible to reduce the moderation to be closer to the hot full power (HFP) conditions at BOC. The addition of D2O also produces a hardening of the neutron spectrum, which aim at simulating the Maxwellian shift due to higher moderator temperature. The goal of the present section is to perform a parametric study on the pitch and on the amount of D2O in the moderator in order to be as representative as possible of the PWR HFP conditions at BOC. The pitch is varied from 1.2 to 2 cm. The upper limit could be eventually extended, however the lower limit, 1.2 cm, cannot be further reduced without having contact between the overcladded spent fuel rod. Since the RISE lattice is at room temperature, it is over moderated as compared to hot PWR conditions, so that a reduction of the pitch is expected more than an increase. The initial pitch is equal to 1.43 cm. The fraction of D2O in the moderator is changed from 0, i.e. pure H2O to 1, i.e. pure D2O. The initial moderator composition is pure H2O. In order to quantify the representativity of each configuration, the integral parameter ck and the spectral indices discussed in Section 2 are used. 4.2. PWR Reference and RISE lattice Fresh/Burnt Interface Models For the parametric study, two models are built: one representing the typical PWR fresh/burnt fuel interface, at BOC and HFP conditions, and the other representing the fresh/burnt fuel interface in the RISE lattice. Two types of fuel compose the spent/fresh fuel interface. The fresh fuel has an enrichment of 5 wt. %. The burnt fuel had an initial 235U enrichment of 3.5 wt.%, 10 years cooling time and average burnup of 60 GWd/t. Its isotopic composition is the same than the one used in Section 3.1. It was generated by CASMO-4E calculations using an equivalent pin-cell model preserving the average water-to-fuel volume ratio of a typical PWR assembly. The model for the PWR interface at HFP and BOC is composed of 17×17 fuel rods as shown in Figure 6a). The left part of the model is made of burnt fuel rods without overcladding and the right part is made of fresh fuel. The geometrical specifications of the fuel rods is identical to the ones used in Section 3.1 and are provided in Table 1. The thermal hydraulic conditions (i.e. fuel temperature, moderator temperature and density) as well as dissolved boron concentration are given in Table 3. The model for the RISE lattice is the initial lattice design presented in Section 3, i.e. simulating a 6×6 bundle of burnt fuel overcladded segments surrounded by fresh fuel at room temperature. The thermal hydraulics and boron concentrations are recalled in Table 3 and the model is reproduced in Figure 6b). The yellow rectangles in Figure 6 indicate the fuel rods in which the spectral indices are calculated. Two different fuel rods are considered, one on each side of the fresh/burnt fuel interface.

Design of a PROTEUS lattice representative of a burnt and fresh fuel interface at power conditions for LWRs.
2012 Advances in Reactor Physics – Linking Research, Industry, and Education (PHYSOR 2012), Knoxville, Tennessee, USA April 15-20, 2012
9/12
Table 3. Thermal Hydraulic Condition for the Application and the Experiment Fresh/Burnt Fuel Interface Models
T/H Conditions PWR HFP BOC RISE Fuel Temperature [K] 900 293.6
Moderator Temperature [K] 600 293.6 Moderator Density [g.cm-3] 0.66 0.997
Boron Content [ppm] 1000 0
a) Typical PWR fresh/burnt fuel interface at HFP and BOC
b) RISE fresh/burnt fuel interface
Figure 6. Models used by TSUNAMI and CASMO-4E for the Parametric Study 4.3. Computer codes The work performed in this section is separated in two parts. In the first part, the TSUNAMI code is used to compute the integral index ck (see Section 2.1) for each considered pitch and moderator composition configuration. For each TSUNAMI run, the application is represented by the PWR model (see Figure 6a)) and the experiment is represented by a realization of the RISE lattice (see Figure 6b)) corresponding to the chosen pitch and moderator composition. Each parameter space (pitch and moderator) is divided in 19 segments representing a total of 400 TSUNAMI calculations. The TSUNAMI models are pseudo 2D models. The boundary conditions are reflective in the radial (x,y) directions and void in the axial direction (z). The geometry in the axial direction is homogeneous and the height is adjusted to have a critical system, hence a critical neutron spectrum. The second part of the work is a parametric and optimization study based on the comparison of spectral indices. The code CASMO-4E2 is used for the neutron transport calculation, and DAKOTA 3 for the optimization/parametric calculation. DAKOTA is used as a driver for CASMO-4E, providing CASMO-4E with input data and extracting from the CASMO-4E output the spectral indices of the considered fuel rods. The DAKOTA code optimization uses derivative-free methods, more precisely the Asynchronous Parallel Pattern Search (APPS) method. It is beyond the scope of this paper to provide details about the APPS, but more information can be found in [7]. Six 2 Provided by Studsvik Scandpower, Inc 3 Provided by Sandia National Laboratory
Burned Fuel (60 GWd/MTU)
Burned Fuel (60 GWd/MTU) with over clad
Fresh Fuel (5w%)
Burned Fuel (60 GWd/MTU) Fresh Fuel (5w%)
Mathieu Hursin and Gregory Perret
2012 Advances in Reactor Physics – Linking Research, Industry, and Education (PHYSOR 2012), Knoxville, Tennessee, USA April 15-20, 2012
10/12
functions are being considered for the optimization process, 3 spectral indices per fuel rod. For both the fresh and burnt fuel rods highlighted in Figure 6, C8/FTOT, F8/FTOT and Φth/Φfast are computed with CASMO-4E. An equal importance weight is assigned to each function. The parameter space for both the pitch and the moderator composition is divided in 79 segments representing a total of 6400 CASMO-4E calculations. The CASMO-4E models are 2D models. The boundary conditions are reflective. The fundamental mode calculation is used in CASMO-4E to model a critical spectrum. 4.4. Results The parametric studies are performed with TSUNAMI and CASMO-4E and the optimization calculations are performed with CASMO-4E/DAKOTA. The results are discussed below.
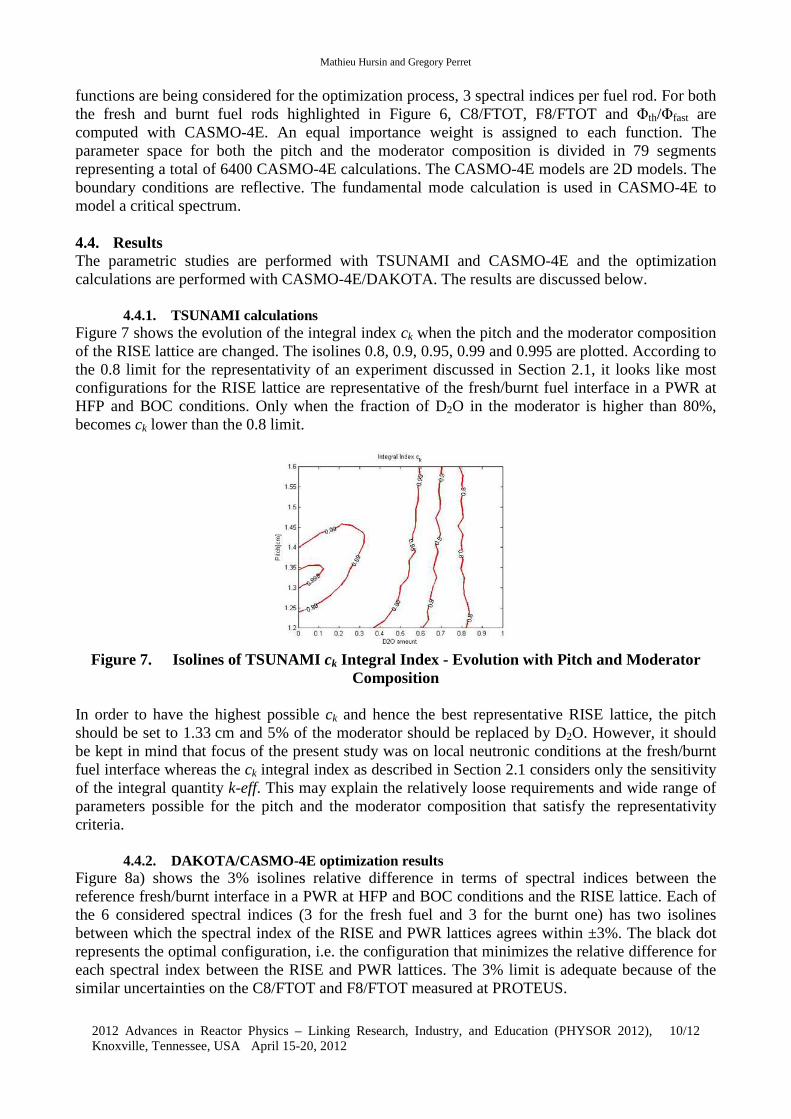
4.4.1. TSUNAMI calculations Figure 7 shows the evolution of the integral index ck when the pitch and the moderator composition of the RISE lattice are changed. The isolines 0.8, 0.9, 0.95, 0.99 and 0.995 are plotted. According to the 0.8 limit for the representativity of an experiment discussed in Section 2.1, it looks like most configurations for the RISE lattice are representative of the fresh/burnt fuel interface in a PWR at HFP and BOC conditions. Only when the fraction of D2O in the moderator is higher than 80%, becomes ck lower than the 0.8 limit.
Figure 7. Isolines of TSUNAMI ck Integral Index - Evolution with Pitch and Moderator
Composition In order to have the highest possible ck and hence the best representative RISE lattice, the pitch should be set to 1.33 cm and 5% of the moderator should be replaced by D2O. However, it should be kept in mind that focus of the present study was on local neutronic conditions at the fresh/burnt fuel interface whereas the ck integral index as described in Section 2.1 considers only the sensitivity of the integral quantity k-eff. This may explain the relatively loose requirements and wide range of parameters possible for the pitch and the moderator composition that satisfy the representativity criteria.
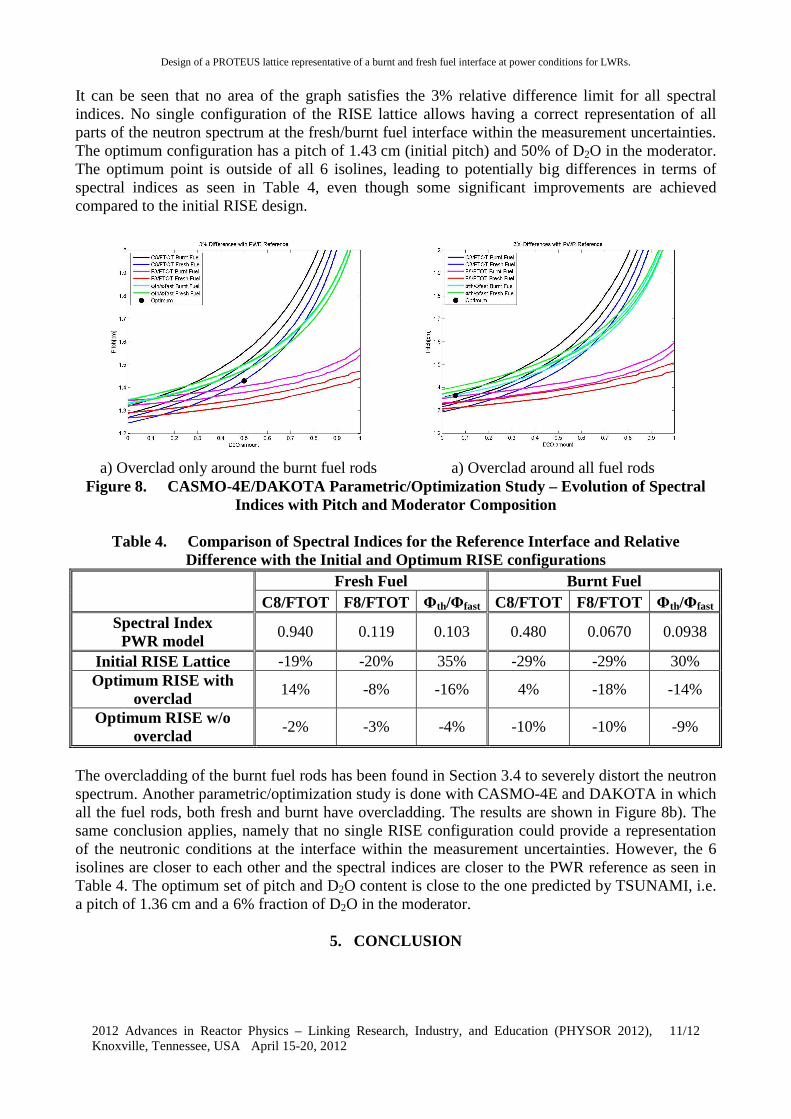
4.4.2. DAKOTA/CASMO-4E optimization results Figure 8a) shows the 3% isolines relative difference in terms of spectral indices between the reference fresh/burnt interface in a PWR at HFP and BOC conditions and the RISE lattice. Each of the 6 considered spectral indices (3 for the fresh fuel and 3 for the burnt one) has two isolines between which the spectral index of the RISE and PWR lattices agrees within ±3%. The black dot represents the optimal configuration, i.e. the configuration that minimizes the relative difference for each spectral index between the RISE and PWR lattices. The 3% limit is adequate because of the similar uncertainties on the C8/FTOT and F8/FTOT measured at PROTEUS.
Design of a PROTEUS lattice representative of a burnt and fresh fuel interface at power conditions for LWRs.
2012 Advances in Reactor Physics – Linking Research, Industry, and Education (PHYSOR 2012), Knoxville, Tennessee, USA April 15-20, 2012
11/12
It can be seen that no area of the graph satisfies the 3% relative difference limit for all spectral indices. No single configuration of the RISE lattice allows having a correct representation of all parts of the neutron spectrum at the fresh/burnt fuel interface within the measurement uncertainties. The optimum configuration has a pitch of 1.43 cm (initial pitch) and 50% of D2O in the moderator. The optimum point is outside of all 6 isolines, leading to potentially big differences in terms of spectral indices as seen in Table 4, even though some significant improvements are achieved compared to the initial RISE design.
a) Overclad only around the burnt fuel rods a) Overclad around all fuel rods
Figure 8. CASMO-4E/DAKOTA Parametric/Optimization Study – Evolution of Spectral Indices with Pitch and Moderator Composition
Table 4. Comparison of Spectral Indices for the Reference Interface and Relative
Difference with the Initial and Optimum RISE configurations Fresh Fuel Burnt Fuel
C8/FTOT F8/FTOT Φth/Φfast C8/FTOT F8/FTOT Φth/Φfast Spectral Index PWR model
0.940 0.119 0.103 0.480 0.0670 0.0938
Initial RISE Lattice -19% -20% 35% -29% -29% 30% Optimum RISE with
overclad 14% -8% -16% 4% -18% -14%
Optimum RISE w/o overclad
-2% -3% -4% -10% -10% -9%
The overcladding of the burnt fuel rods has been found in Section 3.4 to severely distort the neutron spectrum. Another parametric/optimization study is done with CASMO-4E and DAKOTA in which all the fuel rods, both fresh and burnt have overcladding. The results are shown in Figure 8b). The same conclusion applies, namely that no single RISE configuration could provide a representation of the neutronic conditions at the interface within the measurement uncertainties. However, the 6 isolines are closer to each other and the spectral indices are closer to the PWR reference as seen in Table 4. The optimum set of pitch and D2O content is close to the one predicted by TSUNAMI, i.e. a pitch of 1.36 cm and a 6% fraction of D2O in the moderator.
5. CONCLUSION

Mathieu Hursin and Gregory Perret
2012 Advances in Reactor Physics – Linking Research, Industry, and Education (PHYSOR 2012), Knoxville, Tennessee, USA April 15-20, 2012
12/12
The integral index ck and a few spectral indices used to characterize how representative an experiment is of an actual reactor application were reviewed. Their respective relevance to the optimization of the RISE lattice for the PROTEUS facility was discussed. The initial RISE lattice design including 6×6 overcladded burnt fuel sample was presented and characterized. It was shown that 36 burnt fuel segments are enough to properly represent a large fresh/burnt fuel interface in the same moderation and temperature conditions. However, the asymptotic neutron spectrum was not fully reached in the burnt fuel area. The presence of overcladding around the burnt fuel segments allows reducing the cost and improving the overall safety of the experiments. However, it causes a distortion in the neutron spectrum responsible of a 10% difference in term of Φth/Φfast flux ratio between burnt segments with and without overclad.. To optimize the RISE lattice to represent as well as possible the conditions of a PWR fresh/burnt fuel interface at HFP and BOC conditions, TSUNAMI and CASMO-4E/DAKOTA were used to perform parametric studies on the pitch and the moderator composition of the RISE lattice. It was found that all fuel segments should be overcladded, the pitch set to 1.36 cm and the fraction of D2O in the moderator should be of 5%. The representativity limit of 0.8 for the integral index ck was found to be not restrictive enough. This is certainly due to the fact that the focus of the present study was on local neutronic conditions at the fresh/burnt fuel interface whereas the TSUNAMI methodology considers only the sensitivity of the integral quantity k-eff. New developments in the TSUNAMI methodology available in SCALE-6 should allow looking at the sensitivity / uncertainty of local quantities such as pinpower in the future.
ACKNOWLEDGMENTS LIFE@PROTEUS is a joint research program between PSI and swissnuclear. The authors thank J.-M. Cavedon and M. Zimmermann (PSI), J. Krouthén (Axpo AG), F. Jatuff and W.Sauser (Kernkraftwerke Gösgen), U. Georg (Kernkraftwerke Mülhleberg), H.-D.Berger (AREVA-NP), and U. Bergmann (Westinghouse Electric Sweden) for their support of the program. Special thanks are also due to M. Fassbind, M.W. Zimmermann, and A. Stephan for their excellent maintenance and operation of the reactor.
REFERENCE 1. M. Murphy, G. Perret , O. Köberl, K. Jordan, P. Grimm, H. Kröhnert, M. A. Zimmermann,
“Large-Scale Irradiated Fuel Experiments at PROTEUS: Research Program”, PHYSOR 2010, Pittsburgh, USA, May (2010).
2. “SCALE: A Modular Code System for Performing Standardized Computer Analysis for Licensing and Evaluations,” NUREG/CR-2000, Rev. 6 (ORNL/NUREG/CSD-2R6), Vols. I, II and III, Oak Ridge National Laboratory (May 2000).
3. B. Broadhead et al., “Sensitivity- and Uncertainty-Based Criticality Safety Validation Techniques,” Nuclear Science and Engineering, 146, pp. 340-366 (2004).
4. B. Broadhead et al., “Criticality Safety Applications of S/U Validation Methods,” Trans. Am. Nucl. Soc., 83, 107(2000).
5. Rearden B. T. et al., “Use of sensitivity and uncertainty analysis in the design of reactor physics and criticality benchmark experiments for advanced nuclear fuel”, Nuclear Technology, 151, pp133-158(2005).
6. A. Koning et al., “The JEFF-3.1 Nuclear Data Library”, in JEFF Report 21, NEA No.6190, ISBN 92-64-02314-3(2006).
7. “DAKOTA version 5.1 manual”, http://dakota.sandia.gov/licensing/release/html-dev/index.html