Universality of citation distributions for academic institutions and journals
Upload
khangminh22Category
view
3download
0
African Journal of
Microbiology Research
Volume 9 Number 16, 22 April, 2015
ISSN 1996-0808
ABOUT AJMR
The African Journal of Microbiology Research (AJMR) (ISSN 1996-0808) is published Weekly (one volume per year) by Academic Journals.
African Journal of Microbiology Research (AJMR) provides rapid publication (weekly) of articles in all areas of Microbiology such as: Environmental Microbiology, Clinical Microbiology, Immunology, Virology, Bacteriology, Phycology, Mycology and Parasitology, Protozoology, Microbial Ecology, Probiotics and Prebiotics, Molecular Microbiology, Biotechnology, Food Microbiology, Industrial Microbiology, Cell Physiology, Environmental Biotechnology, Genetics, Enzymology, Molecular and Cellular Biology, Plant Pathology, Entomology, Biomedical Sciences, Botany and Plant Sciences, Soil and Environmental Sciences, Zoology, Endocrinology, Toxicology. The Journal welcomes the submission of manuscripts that meet the general criteria of significance and scientific excellence. Papers will be published shortly after acceptance. All articles are peer-reviewed.
Submission of Manuscript
Please read the Instructions for Authors before submitting your manuscript. The manuscript files should be given the last name of the first author Click here to Submit manuscripts online If you have any difficulty using the online submission system, kindly submit via this email [email protected]. With questions or concerns, please contact the Editorial Office at [email protected].

Editors Prof. Dr. Stefan Schmidt, Applied and Environmental Microbiology School of Biochemistry, Genetics and Microbiology University of KwaZulu-Natal Private Bag X01 Scottsville, Pietermaritzburg 3209 South Africa. Prof. Fukai Bao Department of Microbiology and Immunology Kunming Medical University Kunming 650031, China Dr. Jianfeng Wu Dept. of Environmental Health Sciences, School of Public Health, University of Michigan USA Dr. Ahmet Yilmaz Coban OMU Medical School, Department of Medical Microbiology, Samsun, Turkey Dr. Seyed Davar Siadat Pasteur Institute of Iran, Pasteur Square, Pasteur Avenue, Tehran, Iran. Dr. J. Stefan Rokem The Hebrew University of Jerusalem Department of Microbiology and Molecular Genetics, P.O.B. 12272, IL-91120 Jerusalem, Israel Prof. Long-Liu Lin National Chiayi University 300 Syuefu Road, Chiayi, Taiwan N. John Tonukari, Ph.D Department of Biochemistry Delta State University PMB 1 Abraka, Nigeria
Dr. Thaddeus Ezeji Assistant Professor Fermentation and Biotechnology Unit Department of Animal Sciences The Ohio State University 1680 Madison Avenue USA.
Associate Editors Dr. Mamadou Gueye MIRCEN/ Laboratoire commun de microbiologie IRD-ISRA-UCAD, BP 1386, DAKAR, Senegal. Dr. Caroline Mary Knox Department of Biochemistry, Microbiology and Biotechnology Rhodes University Grahamstown 6140 South Africa. Dr. Hesham Elsayed Mostafa Genetic Engineering and Biotechnology Research Institute (GEBRI) Mubarak City For Scientific Research, Research Area, New Borg El-Arab City, Post Code 21934, Alexandria, Egypt. Dr. Wael Abbas El-Naggar Head of Microbiology Department, Faculty of Pharmacy, Mansoura University, Mansoura 35516, Egypt. Dr. Abdel Nasser A. El-Moghazy Microbiology, Molecular Biology, Genetics Engineering and Biotechnology Dept of Microbiology and Immunology Faculty of Pharmacy Al-Azhar University Nasr city, Cairo, Egypt

Dr. Barakat S.M. Mahmoud Food Safety/Microbiology Experimental Seafood Processing Laboratory Costal Research and Extension Center Mississippi State University 3411 Frederic Street Pascagoula, MS 39567 USA Prof. Mohamed Mahrous Amer Poultry Disease (Viral Diseases of poultry) Faculty of Veterinary Medicine, Department of Poultry Diseases Cairo university Giza, Egypt Dr. Xiaohui Zhou Molecular Microbiology, Industrial Microbiology, Environmental Microbiology, Pathogenesis, Antibiotic resistance, Microbial Ecology Washington State University Bustad Hall 402 Department of Veterinary Microbiology and Pathology, Pullman, USA Dr. R. Balaji Raja Department of Biotechnology, School of Bioengineering, SRM University, Chennai India Dr. Aly E Abo-Amer Division of Microbiology, Botany Department, Faculty of Science, Sohag University. Egypt.
Editorial Board
Dr. Haoyu Mao Department of Molecular Genetics and Microbiology College of Medicine University of Florida Florida, Gainesville USA. Dr. Rachna Chandra Environmental Impact Assessment Division Environmental Sciences Sálim Ali Center for Ornithology and Natural History (SACON), Anaikatty (PO), Coimbatore-641108, India Dr. Yongxu Sun Department of Medicinal Chemistry and Biomacromolecules Qiqihar Medical University, Qiqihar 161006 Heilongjiang Province P.R. China Dr. Ramesh Chand Kasana Institute of Himalayan Bioresource Technology Palampur, Distt. Kangra (HP), India Dr. S. Meena Kumari Department of Biosciences Faculty of Science University of Mauritius Reduit Dr. T. Ramesh Assistant Professor Marine Microbiology CAS in Marine Biology Faculty of Marine Sciences Annamalai University Parangipettai - 608 502 Cuddalore Dist. Tamilnadu, India Dr. Pagano Marcela Claudia Post doctoral fellowship at Department of Biology, Federal University of Ceará - UFC, Brazil.

Dr. EL-Sayed E. Habib Associate Professor, Dept. of Microbiology, Faculty of Pharmacy, Mansoura University, Egypt. Dr. Pongsak Rattanachaikunsopon Department of Biological Science, Faculty of Science, Ubon Ratchathani University, Warin Chamrap, Ubon Ratchathani 34190, Thailand Dr. Gokul Shankar Sabesan Microbiology Unit, Faculty of Medicine, AIMST University Jalan Bedong, Semeling 08100, Kedah, Malaysia Dr. Kwang Young Song Department of Biological Engineering, School of Biological and Chemical Engineering, Yanbian Universityof Science and Technology, Yanji, China. Dr. Kamel Belhamel Faculty of Technology, University of Bejaia Algeria Dr. Sladjana Jevremovic Institute for Biological Research Sinisa Stankovic, Belgrade, Serbia Dr. Tamer Edirne Dept. of Family Medicine, Univ. of Pamukkale Turkey Dr. R. Balaji Raja M.Tech (Ph.D) Assistant Professor, Department of Biotechnology, School of Bioengineering, SRM University, Chennai. India Dr. Minglei Wang University of Illinois at Urbana-Champaign,USA
Dr. Mohd Fuat ABD Razak Institute for Medical Research Malaysia Dr. Davide Pacifico Istituto di Virologia Vegetale – CNR Italy Prof. Dr. Akrum Hamdy Faculty of Agriculture, Minia University, Egypt Egypt Dr. Ntobeko A. B. Ntusi Cardiac Clinic, Department of Medicine, University of Cape Town and Department of Cardiovascular Medicine, University of Oxford South Africa and United Kingdom Prof. N. S. Alzoreky Food Science & Nutrition Department, College of Agricultural Sciences & Food, King Faisal University, Saudi Arabia Dr. Chen Ding College of Material Science and Engineering, Hunan University, China Dr Svetlana Nikolić Faculty of Technology and Metallurgy, University of Belgrade, Serbia Dr. Sivakumar Swaminathan Department of Agronomy, College of Agriculture and Life Sciences, Iowa State University, Ames, Iowa 50011 USA Dr. Alfredo J. Anceno School of Environment, Resources and Development (SERD), Asian Institute of Technology, Thailand Dr. Iqbal Ahmad Aligarh Muslim University, Aligrah India

Dr. Josephine Nketsia-Tabiri Ghana Atomic Energy Commission Ghana Dr. Juliane Elisa Welke UFRGS – Universidade Federal do Rio Grande do Sul Brazil Dr. Mohammad Nazrul Islam NIMR; IPH-Bangalore & NIUM Bangladesh Dr. Okonko, Iheanyi Omezuruike Department of Virology, Faculty of Basic Medical Sciences, College of Medicine, University of Ibadan, University College Hospital, Ibadan, Nigeria Dr. Giuliana Noratto Texas A&M University USA Dr. Phanikanth Venkata Turlapati Washington State University USA Dr. Khaleel I. Z. Jawasreh National Centre for Agricultural Research and Extension, NCARE Jordan Dr. Babak Mostafazadeh, MD Shaheed Beheshty University of Medical Sciences Iran Dr. S. Meena Kumari Department of Biosciences Faculty of Science University of Mauritius Reduit Mauritius Dr. S. Anju Department of Biotechnology, SRM University, Chennai-603203 India Dr. Mustafa Maroufpor Iran
Prof. Dong Zhichun Professor, Department of Animal Sciences and Veterinary Medicine, Yunnan Agriculture University, China Dr. Mehdi Azami Parasitology & Mycology Dept, Baghaeei Lab., Shams Abadi St. Isfahan Iran Dr. Anderson de Souza Sant’Ana University of São Paulo. Brazil. Dr. Juliane Elisa Welke UFRGS – Universidade Federal do Rio Grande do Sul Brazil Dr. Paul Shapshak USF Health, Depts. Medicine (Div. Infect. Disease & Internat Med) and Psychiatry & Beh Med. USA Dr. Jorge Reinheimer Universidad Nacional del Litoral (Santa Fe) Argentina Dr. Qin Liu East China University of Science and Technology China Dr. Xiao-Qing Hu State Key Lab of Food Science and Technology Jiangnan University P. R. China Prof. Branislava Kocic Specaialist of Microbiology and Parasitology University of Nis, School of Medicine Institute for Public Health Nis, Bul. Z. Djindjica 50, 18000 Nis Serbia Dr. Rafel Socias CITA de Aragón, Spain

Prof. Kamal I. Mohamed State University of New York at Oswego USA Dr. Adriano Cruz Faculty of Food Engineering-FEA University of Campinas (UNICAMP) Brazil Dr. Mike Agenbag (Michael Hermanus Albertus) Manager Municipal Health Services, Joe Gqabi District Municipality South Africa Dr. D. V. L. Sarada Department of Biotechnology, SRM University, Chennai-603203 India. Dr. Samuel K Ameyaw Civista Medical Center United States of America Prof. Huaizhi Wang Institute of Hepatopancreatobiliary Surgery of PLA Southwest Hospital, Third Military Medical University Chongqing400038 P. R. China Prof. Bakhiet AO College of Veterinary Medicine, Sudan University of Science and Technology Sudan Dr. Saba F. Hussain Community, Orthodontics and Peadiatric Dentistry Department Faculty of Dentistry Universiti Teknologi MARA 40450 Shah Alam, Selangor Malaysia Prof. Dr. Zohair I.F.Rahemo State Key Lab of Food Science and Technology Jiangnan University P. R. China Dr. Afework Kassu University of Gondar Ethiopia
Prof. Isidro A. T. Savillo ISCOF Philippines Dr. How-Yee Lai Taylor’s University College Malaysia Dr. Nidheesh Dadheech MS. University of Baroda, Vadodara, Gujarat, India. India Dr. Omitoyin Siyanbola Bowen University, Iwo Nigeria Dr. Franco Mutinelli Istituto Zooprofilattico Sperimentale delle Venezie Italy Dr. Chanpen Chanchao Department of Biology, Faculty of Science, Chulalongkorn University Thailand Dr. Tsuyoshi Kasama Division of Rheumatology, Showa University Japan Dr. Kuender D. Yang, MD. Chang Gung Memorial Hospital Taiwan Dr. Liane Raluca Stan University Politehnica of Bucharest, Department of Organic Chemistry “C.Nenitzescu” Romania Dr. Muhamed Osman Senior Lecturer of Pathology & Consultant Immunopathologist Department of Pathology, Faculty of Medicine, Universiti Teknologi MARA, 40450 Shah Alam, Selangor Malaysia Dr. Mohammad Feizabadi Tehran University of medical Sciences Iran

Prof. Ahmed H Mitwalli State Key Lab of Food Science and Technology Jiangnan University P. R. China Dr. Mazyar Yazdani Department of Biology, University of Oslo, Blindern, Oslo, Norway Dr. Ms. Jemimah Gesare Onsare Ministry of Higher, Education Science and Technology Kenya Dr. Babak Khalili Hadad Department of Biological Sciences, Roudehen Branch, Islamic Azad University, Roudehen Iran Dr. Ehsan Sari Department of Plan Pathology, Iranian Research Institute of Plant Protection, Tehran, Iran. Dr. Snjezana Zidovec Lepej University Hospital for Infectious Diseases Zagreb, Croatia Dr. Dilshad Ahmad King Saud University Saudi Arabia Dr. Adriano Gomes da Cruz University of Campinas (UNICAMP) Brazil Dr. Hsin-Mei Ku Agronomy Dept. NCHU 250 Kuo Kuang Rd, Taichung, Taiwan Dr. Fereshteh Naderi Physical chemist, Islamic Azad University, Shahre Ghods Branch Iran
Dr. Adibe Maxwell Ogochukwu Department of Clinical Pharmacy and Pharmacy Management, University of Nigeria, Nsukka. Nigeria Dr. William M. Shafer Emory University School of Medicine USA Dr. Michelle Bull CSIRO Food and Nutritional Sciences Australia Prof. Dr. Márcio Garcia Ribeiro (DVM, PhD) School of Veterinary Medicine and Animal Science- UNESP, Dept. Veterinary Hygiene and Public Health, State of Sao Paulo Brazil Prof. Dr. Sheila Nathan National University of Malaysia (UKM) Malaysia Prof. Ebiamadon Andi Brisibe University of Calabar, Calabar, Nigeria Dr. Julie Wang Burnet Institute Australia Dr. Jean-Marc Chobert INRA- BIA, FIPL France Dr. Zhilong Yang, PhD Laboratory of Viral Diseases National Institute of Allergy and Infectious Diseases, National Institutes of Health Dr. Dele Raheem University of Helsinki Finland Dr. Li Sun PLA Centre for the treatment of infectious diseases, Tangdu Hospital, Fourth Military Medical University China

Dr. Biljana Miljkovic-Selimovic School of Medicine, University in Nis, Serbia; Referent laboratory for Campylobacter and Helicobacter, Center for Microbiology, Institute for Public Health, Nis Serbia Dr. Xinan Jiao Yangzhou University China Dr. Endang Sri Lestari, MD. Department of Clinical Microbiology, Medical Faculty, Diponegoro University/Dr. Kariadi Teaching Hospital, Semarang Indonesia Dr. Hojin Shin Pusan National University Hospital South Korea Dr. Yi Wang Center for Vector Biology, 180 Jones Avenue Rutgers University, New Brunswick, NJ 08901-8536 USA Dr. Heping Zhang The Key Laboratory of Dairy Biotechnology and Engineering, Ministry of Education, Inner Mongolia Agricultural University. China Prof. Natasha Potgieter University of Venda South Africa Dr. Alemzadeh Sharif University Iran Dr. Sonia Arriaga Instituto Potosino de Investigación Científicay Tecnológica/División de Ciencias Ambientales Mexico Dr. Armando Gonzalez-Sanchez Universidad Autonoma Metropolitana Cuajimalpa Mexico
Dr. Pradeep Parihar Lovely Professional University, Phagwara, Punjab. India Dr. William H Roldán Department of Medical Microbiology, Faculty of Medicine, Peru Dr. Kanzaki, L I B Laboratory of Bioprospection. University of Brasilia Brazil Prof. Philippe Dorchies Laboratory of Bioprospection. University of Brasilia Brazil Dr. C. Ganesh Kumar Indian Institute of Chemical Technology, Hyderabad India Dr. Farid Che Ghazali Universiti Sains Malaysia (USM) Malaysia Dr. Samira Bouhdid Abdelmalek Essaadi University, Tetouan, Morocco Dr. Zainab Z. Ismail Department of Environmental Engineering, University of Baghdad. Iraq Dr. Ary Fernandes Junior Universidade Estadual Paulista (UNESP) Brasil Dr. Papaevangelou Vassiliki Athens University Medical School Greece Dr. Fangyou Yu The first Affiliated Hospital of Wenzhou Medical College China Dr. Galba Maria de Campos Takaki Catholic University of Pernambuco Brazil

Dr. Kwabena Ofori-Kwakye Department of Pharmaceutics, Kwame Nkrumah University of Science & Technology, KUMASI Ghana Prof. Dr. Liesel Brenda Gende Arthropods Laboratory, School of Natural and Exact Sciences, National University of Mar del Plata Buenos Aires, Argentina. Dr. Adeshina Gbonjubola Ahmadu Bello University, Zaria. Nigeria Prof. Dr. Stylianos Chatzipanagiotou University of Athens – Medical School Greec Dr. Dongqing BAI Department of Fishery Science, Tianjin Agricultural College, Tianjin 300384 P. R. China Dr. Dingqiang Lu Nanjing University of Technology P.R. China Dr. L. B. Sukla Scientist –G & Head, Biominerals Department, IMMT, Bhubaneswar India Dr. Hakan Parlakpinar MD. Inonu University, Medical Faculty, Department of Pharmacology, Malatya Turkey Dr Pak-Lam Yu Massey University New Zealand Dr Percy Chimwamurombe University of Namibia Namibia Dr. Euclésio Simionatto State University of Mato Grosso do Sul-UEMS Brazil
Dr. Hans-Jürg Monstein Clinical Microbiology, Molecular Biology Laboratory, University Hospital, Faculty of Health Sciences, S-581 85 Linköping Sweden Dr. Ajith, T. A Associate Professor Biochemistry, Amala Institute of Medical Sciences, Amala Nagar, Thrissur, Kerala-680 555 India Dr. Feng-Chia Hsieh Biopesticides Division, Taiwan Agricultural Chemicals and Toxic Substances Research Institute, Council of Agriculture Taiwan Prof. Dra. Suzan Pantaroto de Vasconcellos Universidade Federal de São Paulo Rua Prof. Artur Riedel, 275 Jd. Eldorado, Diadema, SP CEP 09972-270 Brasil Dr. Maria Leonor Ribeiro Casimiro Lopes Assad Universidade Federal de São Carlos - Centro de Ciências Agrárias - CCA/UFSCar Departamento de Recursos Naturais e Proteção Ambiental Rodovia Anhanguera, km 174 - SP-330 Araras - São Paulo Brasil Dr. Pierangeli G. Vital Institute of Biology, College of Science, University of the Philippines Philippines Prof. Roland Ndip University of Fort Hare, Alice South Africa Dr. Shawn Carraher University of Fort Hare, Alice South Africa Dr. José Eduardo Marques Pessanha Observatório de Saúde Urbana de Belo Horizonte/Faculdade de Medicina da Universidade Federal de Minas Gerais Brasil

Dr. Yuanshu Qian Department of Pharmacology, Shantou University Medical College China Dr. Helen Treichel URI-Campus de Erechim Brazil Dr. Xiao-Qing Hu State Key Lab of Food Science and Technology Jiangnan University P. R. China Dr. Olli H. Tuovinen Ohio State University, Columbus, Ohio USA Prof. Stoyan Groudev University of Mining and Geology “Saint Ivan Rilski” Sofia Bulgaria Dr. G. Thirumurugan Research lab, GIET School of Pharmacy, NH-5, Chaitanya nagar, Rajahmundry-533294. India Dr. Charu Gomber Thapar University India Dr. Jan Kuever Bremen Institute for Materials Testing, Department of Microbiology, Paul-Feller-Str. 1, 28199 Bremen Germany Dr. Nicola S. Flanagan Universidad Javeriana, Cali Colombia Dr. André Luiz C. M. de A. Santiago Universidade Federal Rural de Pernambuco Brazil Dr. Dhruva Kumar Jha Microbial Ecology Laboratory, Department of Botany, Gauhati University, Guwahati 781 014, Assam India
Dr. N Saleem Basha M. Pharm (Pharmaceutical Biotechnology) Eritrea (North East Africa) Prof. Dr. João Lúcio de Azevedo Dept. Genetics-University of São Paulo-Faculty of Agriculture- Piracicaba, 13400-970 Brasil Dr. Julia Inés Fariña PROIMI-CONICET Argentina Dr. Yutaka Ito Kyoto University Japan Dr. Cheruiyot K. Ronald Biomedical Laboratory Technologist Kenya Prof. Dr. Ata Akcil S. D. University Turkey Dr. Adhar Manna The University of South Dakota USA Dr. Cícero Flávio Soares Aragão Federal University of Rio Grande do Norte Brazil Dr. Gunnar Dahlen Institute of odontology, Sahlgrenska Academy at University of Gothenburg Sweden Dr. Pankaj Kumar Mishra Vivekananda Institute of Hill Agriculture, (I.C.A.R.), ALMORA-263601, Uttarakhand India Dr. Benjamas W. Thanomsub Srinakharinwirot University Thailand Dr. Maria José Borrego National Institute of Health – Department of Infectious Diseases Portugal

Dr. Catherine Carrillo Health Canada, Bureau of Microbial Hazards Canada Dr. Marcotty Tanguy Institute of Tropical Medicine Belgium Dr. Han-Bo Zhang Laboratory of Conservation and Utilization for Bio-resources Key Laboratory for Microbial Resources of the Ministry of Education, Yunnan University, Kunming 650091. School of Life Science, Yunnan University, Kunming, Yunnan Province 650091. China Dr. Ali Mohammed Somily King Saud University Saudi Arabia Dr. Nicole Wolter National Institute for Communicable Diseases and University of the Witwatersrand, Johannesburg South Africa Dr. Marco Antonio Nogueira Universidade Estadual de Londrina CCB/Depto. De microbiologia Laboratório de Microbiologia Ambiental Caixa Postal 6001 86051-980 Londrina. Brazil Dr. Bruno Pavoni Department of Environmental Sciences University of Venice Italy Dr. Shih-Chieh Lee Da-Yeh University Taiwan Dr. Satoru Shimizu Horonobe Research Institute for the Subsurface Environment, Northern Advancement Center for Science & Technology Japan
Dr. Tang Ming College of Forestry, Northwest A&F University, Yangling China Dr. Olga Gortzi Department of Food Technology, T.E.I. of Larissa Greece Dr. Mark Tarnopolsky Mcmaster University Canada Dr. Sami A. Zabin Al Baha University Saudi Arabia Dr. Julia W. Pridgeon Aquatic Animal Health Research Unit, USDA, ARS USA Dr. Lim Yau Yan Monash University Sunway Campus Malaysia Prof. Rosemeire C. L. R. Pietro Faculdade de Ciências Farmacêuticas de Araraquara, Univ Estadual Paulista, UNESP Brazil Dr. Nazime Mercan Dogan PAU Faculty of Arts and Science, Denizli Turkey Dr Ian Edwin Cock Biomolecular and Physical Sciences Griffith University Australia Prof. N K Dubey Banaras Hindu University India Dr. S. Hemalatha Department of Pharmaceutics, Institute of Technology, Banaras Hindu University, Varanasi. 221005 India Dr. J. Santos Garcia A. Universidad A. de Nuevo Leon Mexico India

Dr. Somboon Tanasupawat Department of Biochemistry and Microbiology, Faculty of Pharmaceutical Sciences, Chulalongkorn University, Bangkok 10330 Thailand Dr. Vivekananda Mandal Post Graduate Department of Botany, Darjeeling Government College, Darjeeling – 734101. India Dr. Shihua Wang College of Life Sciences, Fujian Agriculture and Forestry University China Dr. Victor Manuel Fernandes Galhano CITAB-Centre for Research and Technology of Agro-Environment and Biological Sciences, Integrative Biology and Quality Research Group, University of Trás-os-Montes and Alto Douro, Apartado 1013, 5001-801 Vila Real Portugal Dr. Maria Cristina Maldonado Instituto de Biotecnologia. Universidad Nacional de Tucuman Argentina Dr. Alex Soltermann Institute for Surgical Pathology, University Hospital Zürich Switzerland Dr. Dagmara Sirova Department of Ecosystem Biology, Faculty Of Science, University of South Bohemia, Branisovska 37, Ceske Budejovice, 37001 Czech Republic Dr. E. O Igbinosa Department of Microbiology, Ambrose Alli University, Ekpoma, Edo State, Nigeria. Dr. Hodaka Suzuki National Institute of Health Sciences Japan
Dr. Mick Bosilevac US Meat Animal Research Center USA Dr. Nora Lía Padola Imunoquímica y Biotecnología- Fac Cs Vet-UNCPBA Argentina Dr. Maria Madalena Vieira-Pinto Universidade de Trás-os-Montes e Alto Douro Portugal Dr. Stefano Morandi CNR-Istituto di Scienze delle Produzioni Alimentari (ISPA), Sez. Milano Italy Dr Line Thorsen Copenhagen University, Faculty of Life Sciences Denmark Dr. Ana Lucia Falavigna-Guilherme Universidade Estadual de Maringá Brazil Dr. Baoqiang Liao Dept. of Chem. Eng., Lakehead University, 955 Oliver Road, Thunder Bay, Ontario Canada Dr. Ouyang Jinping Patho-Physiology department, Faculty of Medicine of Wuhan University China Dr. John Sorensen University of Manitoba Canada Dr. Andrew Williams University of Oxford United Kingdom Dr. Chi-Chiang Yang Chung Shan Medical University Taiwan, R.O.C. Dr. Quanming Zou Department of Clinical Microbiology and Immunology, College of Medical Laboratory, Third Military Medical University China

Prof. Ashok Kumar School of Biotechnology, Banaras Hindu University, Varanasi India Dr. Chung-Ming Chen Department of Pediatrics, Taipei Medical University Hospital, Taipei Taiwan Dr. Jennifer Furin Harvard Medical School USA Dr. Julia W. Pridgeon Aquatic Animal Health Research Unit, USDA, ARS USA Dr Alireza Seidavi Islamic Azad University, Rasht Branch Iran Dr. Thore Rohwerder Helmholtz Centre for Environmental Research UFZ Germany Dr. Daniela Billi University of Rome Tor Vergat Italy Dr. Ivana Karabegovic Faculty of Technology, Leskovac, University of Nis Serbia Dr. Flaviana Andrade Faria IBILCE/UNESP Brazil Prof. Margareth Linde Athayde Federal University of Santa Maria Brazil Dr. Guadalupe Virginia Nevarez Moorillon Universidad Autonoma de Chihuahua Mexico Dr. Tatiana de Sousa Fiuza Federal University of Goias Brazil Dr. Indrani B. Das Sarma Jhulelal Institute of Technology, Nagpur India
Dr. Guanghua Wang Northeast Institute of Geography and Agroecology, Chinese Academy of Sciences China Dr. Renata Vadkertiova Institute of Chemistry, Slovak Academy of Science Slovakia Dr. Charles Hocart The Australian National University Australia Dr. Guoqiang Zhu University of Yangzhou College of Veterinary Medicine China Dr. Guilherme Augusto Marietto Gonçalves São Paulo State University Brazil Dr. Mohammad Ali Faramarzi Tehran University of Medical Sciences Iran Dr. Suppasil Maneerat Department of Industrial Biotechnology, Faculty of Agro-Industry, Prince of Songkla University, Hat Yai 90112 Thailand Dr. Francisco Javier Las heras Vazquez Almeria University Spain Dr. Cheng-Hsun Chiu Chang Gung memorial Hospital, Chang Gung University Taiwan Dr. Ajay Singh DDU Gorakhpur University, Gorakhpur-273009 (U.P.) India Dr. Karabo Shale Central University of Technology, Free State South Africa Dr. Lourdes Zélia Zanoni Department of Pediatrics, School of Medicine, Federal University of Mato Grosso do Sul, Campo Grande, Mato Grosso do Sul Brazil

Dr. Tulin Askun Balikesir University Turkey Dr. Marija Stankovic Institute of Molecular Genetics and Genetic Engineering Republic of Serbia Dr. Scott Weese University of Guelph Dept of Pathobiology, Ontario Veterinary College, University of Guelph, Guelph, Ontario, N1G2W1, Canada Dr. Sabiha Essack School of Health Sciences South African Committee of Health Sciences University of KwaZulu-Natal Private Bag X54001 Durban 4000 South Africa Dr. Hare Krishna Central Institute for Arid Horticulture, Beechwal, Bikaner-334 006, Rajasthan, India Dr. Anna Mensuali Dept. of Life Science, Scuola Superiore Sant’Anna Dr. Ghada Sameh Hafez Hassan Pharmaceutical Chemistry Department, Faculty of Pharmacy, Mansoura University, Egypt Dr. Kátia Flávia Fernandes Biochemistry and Molecular Biology Universidade Federal de Goiás Brasil Dr. Abdel-Hady El-Gilany Public Health & Community Medicine Faculty of Medicine, Mansoura University Egypt
Dr. Hongxiong Guo STD and HIV/AIDS Control and Prevention, Jiangsu provincial CDC, China Dr. Konstantina Tsaousi Life and Health Sciences, School of Biomedical Sciences, University of Ulster Dr. Bhavnaben Gowan Gordhan DST/NRF Centre of Excellence for Biomedical TB Research University of the Witwatersrand and National Health Laboratory Service P.O. Box 1038, Johannesburg 2000, South Africa Dr. Ernest Kuchar Pediatric Infectious Diseases, Wroclaw Medical University, Wroclaw Teaching Hospital, Poland Dr. Hongxiong Guo STD and HIV/AIDS Control and Prevention, Jiangsu provincial CDC, China Dr. Mar Rodriguez Jovita Food Hygiene and Safety, Faculty of Veterinary Science. University of Extremadura, Spain Dr. Jes Gitz Holler Hospital Pharmacy, Aalesund. Central Norway Pharmaceutical Trust Professor Brochs gt. 6. 7030 Trondheim, Norway Prof. Chengxiang FANG College of Life Sciences, Wuhan University Wuhan 430072, P.R.China Dr. Anchalee Tungtrongchitr Siriraj Dust Mite Center for Services and Research Department of Parasitology, Faculty of Medicine Siriraj Hospital, Mahidol University 2 Prannok Road, Bangkok Noi, Bangkok, 10700, Thailand
Instructions for Author
Electronic submission of manuscripts is strongly encouraged, provided that the text, tables, and figures are included in a single Microsoft Word file (preferably in Arial font).
The cover letter should include the corresponding author's full address and telephone/fax numbers and should be in an e-mail message sent to the Editor, with the file, whose name should begin with the first author's surname, as an attachment.
Article Types Three types of manuscripts may be submitted:
Regular articles: These should describe new and carefully confirmed findings, and experimental procedures should be given in sufficient detail for others to verify the work. The length of a full paper should be the minimum required to describe and interpret the work clearly. Short Communications: A Short Communication is suitable for recording the results of complete small investigations or giving details of new models or hypotheses, innovative methods, techniques or apparatus. The style of main sections need not conform to that of full-length papers. Short communications are 2 to 4 printed pages (about 6 to 12 manuscript pages) in length.
Reviews: Submissions of reviews and perspectives covering topics of current interest are welcome and encouraged. Reviews should be concise and no longer than 4-6 printed pages (about 12 to 18 manuscript pages). Reviews are also peer-reviewed.
Review Process
All manuscripts are reviewed by an editor and members of the Editorial Board or qualified outside reviewers. Authors cannot nominate reviewers. Only reviewers randomly selected from our database with specialization in the subject area will be contacted to evaluate the manuscripts. The process will be blind review. Decisions will be made as rapidly as possible, and the Journal strives to return reviewers’ comments to authors as fast as possible. The editorial board will re-review manuscripts that are accepted pending revision. It is the goal of the AJMR to publish manuscripts within weeks after submission.
Regular articles
All portions of the manuscript must be typed double- spaced and all pages numbered starting from the title page.
The Title should be a brief phrase describing the contents of the paper. The Title Page should include the authors' full names and affiliations, the name of the corresponding author along with phone, fax and E-mail information. Present addresses of authors should appear as a footnote.
The Abstract should be informative and completely self- explanatory, briefly present the topic, state the scope of the experiments, indicate significant data, and point out major findings and conclusions. The Abstract should be 100 to 200 words in length.. Complete sentences, active verbs, and the third person should be used, and the abstract should be written in the past tense. Standard nomenclature should be used and abbreviations should be avoided. No literature should be cited. Following the abstract, about 3 to 10 key words that will provide indexing references should be listed.
A list of non-standard Abbreviations should be added. In general, non-standard abbreviations should be used only when the full term is very long and used often. Each abbreviation should be spelled out and introduced in parentheses the first time it is used in the text. Only recommended SI units should be used. Authors should use the solidus presentation (mg/ml). Standard abbreviations (such as ATP and DNA) need not be defined.
The Introduction should provide a clear statement of the problem, the relevant literature on the subject, and the proposed approach or solution. It should be understandable to colleagues from a broad range of scientific disciplines.
Materials and methods should be complete enough to
allow experiments to be reproduced. However, only truly new procedures should be described in detail; previously published procedures should be cited, and important modifications of published procedures should be mentioned briefly. Capitalize trade names and include the manufacturer's name and address. Subheadings should be used. Methods in general use need not be described in detail.
Results should be presented with clarity and precision. The results should be written in the past tense when describing findings in the authors' experiments. Previously published findings should be written in the present tense. Results should be explained, but largely without referring to the literature. Discussion, speculation and detailed interpretation of data should not be included in the Results but should be put into the Discussion section.
The Discussion should interpret the findings in view of the results obtained in this and in past studies on this topic. State the conclusions in a few sentences at the end of the paper. The Results and Discussion sections can include subheadings, and when appropriate, both sections can be combined.
The Acknowledgments of people, grants, funds, etc should be brief.
Tables should be kept to a minimum and be designed to be as simple as possible. Tables are to be typed double- spaced throughout, including headings and footnotes. Each table should be on a separate page, numbered consecutively in Arabic numerals and supplied with a heading and a legend. Tables should be self-explanatory without reference to the text. The details of the methods used in the experiments should preferably be described in the legend instead of in the text. The same data should not be presented in both table and graph form or repeated in the text.
Figure legends should be typed in numerical order on a separate sheet. Graphics should be prepared using applications capable of generating high resolution GIF, TIFF, JPEG or Powerpoint before pasting in the Microsoft Word manuscript file. Tables should be prepared in Microsoft Word. Use Arabic numerals to designate figures and upper case letters for their parts (Figure 1). Begin each legend with a title and include sufficient description so that the figure is understandable without reading the text of the manuscript. Information given in legends should not be repeated in the text.
References: In the text, a reference identified by means of an author‘s name should be followed by the date of the reference in parentheses. When there are more than two authors, only the first author‘s name should be mentioned, followed by ’et al‘. In the event that an author cited has had two or more works published during the same year, the reference, both in the text and in the reference list, should be identified by a lower case letter like ’a‘ and ’b‘ after the date to distinguish the works.
Examples:
Abayomi (2000), Agindotan et al. (2003), (Kelebeni, 1983), (Usman and Smith, 1992), (Chege, 1998;
1987a,b; Tijani, 1993,1995), (Kumasi et al., 2001) References should be listed at the end of the paper in alphabetical order. Articles in preparation or articles submitted for publication, unpublished observations, personal communications, etc. should not be included in the reference list but should only be mentioned in the article text (e.g., A. Kingori, University of Nairobi, Kenya, personal communication). Journal names are abbreviated according to Chemical Abstracts. Authors are fully responsible for the accuracy of the references.
Examples:
Chikere CB, Omoni VT and Chikere BO (2008). Distribution of potential nosocomial pathogens in a hospital environment. Afr. J. Biotechnol. 7: 3535-3539.
Moran GJ, Amii RN, Abrahamian FM, Talan DA (2005). Methicillinresistant Staphylococcus aureus in community-acquired skin infections. Emerg. Infect. Dis. 11: 928-930.
Pitout JDD, Church DL, Gregson DB, Chow BL, McCracken M, Mulvey M, Laupland KB (2007). Molecular epidemiology of CTXM-producing Escherichia coli in the Calgary Health Region: emergence of CTX-M-15-producing isolates. Antimicrob. Agents Chemother. 51: 1281-1286.
Pelczar JR, Harley JP, Klein DA (1993). Microbiology: Concepts and Applications. McGraw-Hill Inc., New York, pp. 591-603.
Short Communications
Short Communications are limited to a maximum of two figures and one table. They should present a complete study that is more limited in scope than is found in full-length papers. The items of manuscript preparation listed above apply to Short Communications with the following differences: (1) Abstracts are limited to 100 words; (2) instead of a separate Materials and Methods section, experimental procedures may be incorporated into Figure Legends and Table footnotes; (3) Results and Discussion should be combined into a single section. Proofs and Reprints: Electronic proofs will be sent (e- mail attachment) to the corresponding author as a PDF file. Page proofs are considered to be the final version of the manuscript. With the exception of typographical or minor clerical errors, no changes will be made in the manuscript at the proof stage.
Fees and Charges: Authors are required to pay a $550 handling fee. Publication of an article in the African Journal of Microbiology Research is not contingent upon the author's ability to pay the charges. Neither is acceptance to pay the handling fee a guarantee that the paper will be accepted for publication. Authors may still request (in advance) that the editorial office waive some of the handling fee under special circumstances
Copyright: © 2015, Academic Journals. All rights Reserved. In accessing this journal, you agree that you will access the contents for your own personal use but not for any commercial use. Any use and or copies of this Journal in whole or in part must include the customary bibliographic citation, including author attribution, date and article title.
Submission of a manuscript implies: that the work described has not been published before (except in the form of an abstract or as part of a published lecture, or thesis) that it is not under consideration for publication elsewhere; that if and when the manuscript is accepted for publication, the authors agree to automatic transfer of the copyright to the publisher.
Disclaimer of Warranties
In no event shall Academic Journals be liable for any special, incidental, indirect, or consequential damages of any kind arising out of or in connection with the use of the articles or other material derived from the AJMR, whether or not advised of the possibility of damage, and on any theory of liability. This publication is provided "as is" without warranty of any kind, either expressed or implied, including, but not limited to, the implied warranties of merchantability, fitness for a particular purpose, or non-infringement. Descriptions of, or references to, products or publications does not imply endorsement of that product or publication. While every effort is made by Academic Journals to see that no inaccurate or misleading data, opinion or statements appear in this publication, they wish to make it clear that the data and opinions appearing in the articles and advertisements herein are the responsibility of the contributor or advertiser concerned. Academic Journals makes no warranty of any kind, either express or implied, regarding the quality, accuracy, availability, or validity of the data or information in this publication or of any other publication to which it may be linked.
International Journal of Medicine and Medical Sciences
African Journal of Microbiology Research
Table of Content: Volume 9 Number 16, 22 April, 2015
ARTICLES
Control of psychrophilic microbiota in shrimp (Litopenaeus vannamei) by Lactobacillus reuteri Helen Silvestre da Silva, Marília Miotto, Karin de Medeiros and Cleide Rosana Werneck Vieira Antibacterial activity of Andrographis paniculata Nees against selective human pathogens V. Baby Shalini and J. Sriman Narayanan Evaluation of rice landraces against rice root-knot nematode, Meloidogyne graminicola H. Ravindra, Mukesh Sehgal, H. B. Narasimhamurthy, H. S. Imran Khan and S. A. Shruthi Performance evaluation of laboratory professionals on tuberculosis microscopy at Hawassa Town, Southern Ethiopia Mengistu Hailemariam, Abebe Minuta, Gezahegn Bewoket, Tadesse Alehegn, Yismake Worku and Moges Desta Biosynthesis of indole-3-acetic acid by plant growth promoting rhizobacteria, Klebsiella pneumonia, Bacillus amyloliquefaciens and Bacillus subtilis Vijendra Kumar Mishra and Ashok Kumar Assessment of phenol biodegradation capacity of indigenous bacteria isolated from sewage treatment plant N. R. Das and N. Kumar Resistance of heavy metals on some pathogenic bacterial species Aditi Singh, Maitreyi Mishra, Parul Tripathi and Shweta Sachan
Vol. 9(16), pp. 1118-1121, 22 April, 2015
DOI: 10.5897/AJMR2014.7167
Article Number: 6893CE752653
ISSN 1996-0808
Copyright © 2015
Author(s) retain the copyright of this article
http://www.academicjournals.org/AJMR
African Journal of Microbiology Research
Full Length Research Paper
Control of psychrophilic microbiota in shrimp (Litopenaeus vannamei) by Lactobacillus reuteri
Helen Silvestre da Silva*, Marília Miotto, Karin de Medeiros and Cleide Rosana Werneck Vieira
Department of Food Science and Technology, Federal University of Santa Catarina (UFSC), Av. Admar Gonzaga, 1346,
Itacorubi, 88034-001 Florianopolis SC, Brazil.
Received 2 October, 2014; Accepted 13 April, 2015
As an alternative to traditional methods for controlling microorganisms in food, bioprotection using lactic acid bacteria is promising. Lactobacillus reuteri exhibits an ability to produce reuterin, an antimicrobial substance presenting effects against Gram-positive and Gram-negative bacteria, as well as molds, yeasts and protozoa. In the present study, the activity of L. reuteri culture and extract over psychrophilic microbiota of Litopenaeus vannamei shrimp kept under refrigeration was evaluated. Sterile extract of L. reuteri was able to reduce the counts of psychrophiles in 2 log cycles, while L. reuteri culture kept the initial count during the whole storage period. L. reuteri was efficient in controlling psychrophiles in shrimp suggesting its use as a food bioprotector. Key words: Lactobacillus reuteri, reuterin, antimicrobial activity.
INTRODUCTION Cultivation of marine shrimps is a new practice in Brazil. It is fast growing because of technical and economic factors in an appropriate price environment and demand for national and international markets besides internal stimulus to the development of this activity. This sector has a strong development potential and became one of the most important agropecuary activity for Brazilian economy, mainly in the Northeastern region (BRDE, 2004).
Processing techniques in the national carciniculture, generally, are not specialized. The operation starts after finishing the shrimp collection (when shrimps are removed from fattening tanks) and before commer-cialization. The product is processed in order to be proper for buyer demand and, according to specialists, include a simple procedure without aggregating much value
(BRDE, 2004). Because of fish products are very perishable they must
be properly stored in order to keep sensorial quality and shelf life. The decreasing in freshness of fish products depends on several factors such as collection, slaughtering and processing conditions.
Food industry always searches for alternative tech-niques for replacing the traditional methods of microorga-nisms control in food such as acidification, freezing, drying, salting or using of chemical agents. Bioconser-vation can increase shelf life and food safety by using a natural or controlled microbiota, mainly lactic acid bacteria (LAB) (Hugas et al., 1995).
Reuterin is produced by Lactobacillus reuteri, a heterofermentative species inhibiting the GI tract of humans and animals. It is formed during the anaerobic
*Corresponding author. E-mail: [email protected]. Tel: 55 47 88414749. Author(s) agree that this article remain permanently open access under the terms of the Creative Commons Attribution License 4.0 International License
growth of L. reuteri by the action of glycerol dehydratase which catalyzes the conversion of glycerol into reuterin. Reuterin has been chemically identified to be 3-hydroxy propanol (β-hydroxyl propionaldehyde) a highly soluble, pH- neutral compound which is in equilibrium with its hydrated monomeric and cyclic dimeric forms. Reuterin exhibits a broad spectrum of antimicrobial activity against certain Gram-positive and Gramnegative bacteria, yeast, fungi and protozoa. Spoilage organisms sensitive to reuterin include species of Salmonella, Shigella, Clostridium, Staphylocaccus, Listeria, Candida and Trypanosoma (Mayur and Madhukar, 2014). Reuterin is a hydrosoluble, active in a wide pH range and resistant to proteolytic and lipolytic anzymes (El-ziney and Debevere, 1998). The mode of action is not fully understood, but recent studies have demonstrated that the aldehyde group of 3-HPA is mainly responsible for the antimicrobial activity. Reuterin reacts with sulfhydryl groups of proteins and small molecules inducing oxidative stress responses (Montiel et al., 2014). The aim of present study was to evaluate the control of psychrophilic microbiota from Litopenaeus vannamei shrimp kept under refrigeration conditions by Lactobacillus reuteri and its sterile extract. MATERIALS AND METHODS
Microrganisms and growth conditions
L. reuteri ATCC 1428 was kept in MRS Broth with 20% glycerol at -20ºC. For the microorganism reactivation, 1 mL of stock culture was transferred to 10 mL MRS broth and incubated at 37ºC for 24 h. The strain had its antimicrobial activity characterized in a previous study (Silva et al., 2010).
Production of L. reuteri cell free supernatant
Production of the cell free supernatant was carried out according to Cleusix et al. (2008) with some modifications. One milliliter of the reactivated culture was transferred to a new tube containing 10 mL of MRS broth and incubated at 37ºC for 6 h. After incubation, the whole volume was added to a flask containing 50 mL of MRS broth and incubated at 37ºC for 12 h. Later, the 61 mL of culture was added to a new flask containing 500 mL of MRS broth and incubated at 37ºC for 24 h. Cells were, then, collected by centrifugation (1500 x g, 10 min, 20ºC), washed in potassium phosphate buffer (0.1 M, pH 7.0), resuspended in 300 mL of a sterile aqueous solution containing glycerol (200 mm) and incubated at 37°C for 3 h under anaerobic conditions (Anaerogen®). Cells were collected by centrifugation (8000 x g, 10 min) and 150 mL of the supernatant were sterilized by membrane
filtration (0.22 µm, Millipore®, Merck, USA).
Evaluation of reuterin production
A fresh culture of reuterin-producing L. reuteri ATCC 1428 was inoculated at 1% in 1 L of MRS broth and incubated anaerobically at 37°C overnight. After growth, cells were harvested by centrifugation (4500 × g, 5 min) and gently washed in sterile
aqueous solution of glycerol (100 mM). In order to produce reuterin from glycerol, the obtained cell biomass was resuspended into 250 ml sterile aqueous solution of glycerol (100 mM), and resting cells
da Silva et al. 1119 were incubated under anaerobic conditions at 37°C for 3 h. After centrifugation (6600 × g, 5 min), the resulting supernatant was collected, filter-sterilized (0.22 μm) and maintained at −40°C for subsequent experiments. The concentration of reuterin in the
supernatant was determined by a colorimetric method as described by Lüthi-Peng et al. (2002). Acrolein (Fluka; Sigma-Aldrich Quimica SA, Madrid, Spain) was used for obtaining the standard curve, since 3-hydroxypropionaldehyde dehydrates in equimolar concen-trations to acrolein. Standards were made diluting acrolein in distilled water. Supernatants containing reuterin were diluted with distilled water if necessary before the colorimetric reaction. All determinations were carried out in triplicate.
Sample of shrimp
Samples of 1000 g of fresh and deshelled pacific white shrimp were bought in the Public Market of Florianopolis, Brazil. Samples were placed in isothermal boxes containing ice and took to the Food Microbiology Laboratory (Florianopolis, Brazil) for analysis.
Treatment of samples with L. reuteri
Each sample was divided in portions of 300 g and each portion was labeled according to the treatment: Treatment 1: portion added with 0.1 mL/g of L. reuteri culture; Treatment 2: portion added with 0.1 mL/g of L. reuteri cell free supernatant; Control: portion added with 0.1 mL/g of sterile distilled water. Each sample was analyzed in relation to psychrotrophic count and further L. reuteri count for T1
samples: right after treatment (T0), 3 h after treatment (T3 h), 6 h after treatment (T6 h), 24 h after treatment (T24 h) and 48 h after treatment (T48 h). Samples were kept under refrigeration (±7ºC) until analysis. All analyses were carried out in triplicate.
Microbiological determinations
Representative shrimp samples (25 g) were homogenized with 250
mL of sterile 0.1% (w/v) peptone solution in a Stomacher 400 (A. J. Seward Ltd, London, UK). Decimal dilutions of shrimp homogenates were prepared in sterile 0.1% (w/v) peptone solution. L. reuteri counts were determined on duplicate plates of Rogosa agar (Difco) and incubated at 37°C for 48 h under anaerobic conditions, and psychrotrophic counts on Plate Count agar (Oxoid) for five days at 7°C. Psychrotrophic counts in the T1 samples were expressed as the difference between the total count of psychrotrophic and Lactobacillus reuteri counts. Statistical analysis Results of psychrotrophic counts were submitted to analysis of variance (ANOVA) and averages of treatments were analyzed by Tukey’s test in order to verify differences among the treatments. Confidence level was of 95%. Tests were performed using
STATISTICA 9.0 software (StaSoft). RESULTS AND DISCUSSION
Standard count carried out at zero time showed that samples present an initial contamination of about 10
6
CFU/g. According to Vanderzant et al. (1971), shrimp collected in tropical waters contains counts ranging from 10
6 to 10
7 CFU/g. This result was confirmed by
1120 Afr. J. Microbiol. Res.
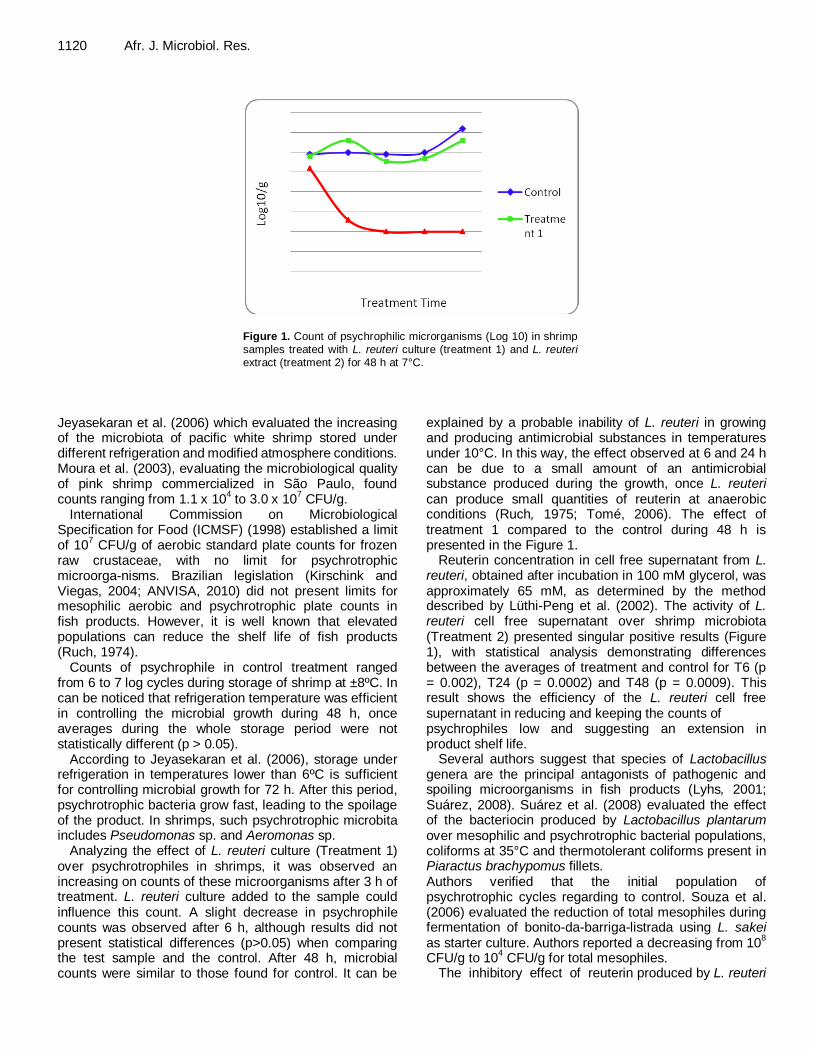
Figure 1. Count of psychrophilic microrganisms (Log 10) in shrimp samples treated with L. reuteri culture (treatment 1) and L. reuteri extract (treatment 2) for 48 h at 7°C.
Jeyasekaran et al. (2006) which evaluated the increasing of the microbiota of pacific white shrimp stored under different refrigeration and modified atmosphere conditions. Moura et al. (2003), evaluating the microbiological quality of pink shrimp commercialized in São Paulo, found counts ranging from 1.1 x 10
4 to 3.0 x 10
7 CFU/g.
International Commission on Microbiological Specification for Food (ICMSF) (1998) established a limit of 10
7 CFU/g of aerobic standard plate counts for frozen
raw crustaceae, with no limit for psychrotrophic microorga-nisms. Brazilian legislation (Kirschink and Viegas, 2004; ANVISA, 2010) did not present limits for mesophilic aerobic and psychrotrophic plate counts in fish products. However, it is well known that elevated populations can reduce the shelf life of fish products (Ruch, 1974).
Counts of psychrophile in control treatment ranged from 6 to 7 log cycles during storage of shrimp at ±8ºC. In can be noticed that refrigeration temperature was efficient in controlling the microbial growth during 48 h, once averages during the whole storage period were not statistically different (p > 0.05).
According to Jeyasekaran et al. (2006), storage under refrigeration in temperatures lower than 6ºC is sufficient for controlling microbial growth for 72 h. After this period, psychrotrophic bacteria grow fast, leading to the spoilage of the product. In shrimps, such psychrotrophic microbita includes Pseudomonas sp. and Aeromonas sp.
Analyzing the effect of L. reuteri culture (Treatment 1) over psychrotrophiles in shrimps, it was observed an increasing on counts of these microorganisms after 3 h of treatment. L. reuteri culture added to the sample could influence this count. A slight decrease in psychrophile counts was observed after 6 h, although results did not present statistical differences (p>0.05) when comparing the test sample and the control. After 48 h, microbial counts were similar to those found for control. It can be
explained by a probable inability of L. reuteri in growing and producing antimicrobial substances in temperatures under 10°C. In this way, the effect observed at 6 and 24 h can be due to a small amount of an antimicrobial substance produced during the growth, once L. reuteri can produce small quantities of reuterin at anaerobic conditions (Ruch, 1975; Tomé, 2006). The effect of treatment 1 compared to the control during 48 h is presented in the Figure 1.
Reuterin concentration in cell free supernatant from L. reuteri, obtained after incubation in 100 mM glycerol, was approximately 65 mM, as determined by the method described by Lüthi-Peng et al. (2002). The activity of L. reuteri cell free supernatant over shrimp microbiota (Treatment 2) presented singular positive results (Figure 1), with statistical analysis demonstrating differences between the averages of treatment and control for T6 (p = 0.002), T24 (p = 0.0002) and T48 (p = 0.0009). This result shows the efficiency of the L. reuteri cell free supernatant in reducing and keeping the counts of psychrophiles low and suggesting an extension in product shelf life.
Several authors suggest that species of Lactobacillus genera are the principal antagonists of pathogenic and spoiling microorganisms in fish products (Lyhs, 2001; Suárez, 2008). Suárez et al. (2008) evaluated the effect of the bacteriocin produced by Lactobacillus plantarum over mesophilic and psychrotrophic bacterial populations, coliforms at 35°C and thermotolerant coliforms present in Piaractus brachypomus fillets. Authors verified that the initial population of psychrotrophic cycles regarding to control. Souza et al. (2006) evaluated the reduction of total mesophiles during fermentation of bonito-da-barriga-listrada using L. sakei as starter culture. Authors reported a decreasing from 10
8
CFU/g to 104 CFU/g for total mesophiles.
The inhibitory effect of reuterin produced by L. reuteri
has been investigated in several in vitro studies. Also, studies applying this antimicrobial substance in food have been reported. El-ziney and Debevere (1998) reported the inhibitory effect of reuterin against Listeria monocytogenes and Escherichia coli O157:H7 in milk and cottage cheese artificially contaminated.
Arques et al. (2004) reported that reuterin added to milk at 8 UA/mL exhibited a bacteriostatic effect on L. monocytogenes in treated milk at 37°C with no regrowth of the pathogen, fact already observed in a previous study. L. monocytogenes was completely inactivated within five days at ±7°C in milk with reuterin at 150 UA/mL (5). According to these authors, the inactivation rate depends on the concentration of reuterin.
Arques et al. (2007) reported that the presence of reuterin in milk leads to a decreasing in S. enteric and Y. enterocolitica counts after 12 days while C. jejuni and A. hydrophila were completely inactivated after 76 and 12 days, respectively. In this work, authors suggest that reuterin is very effective when applied to foodstuffs stored under refrigeration.
According to Spinler et al. (2008), reuterin is produced during fermentation of glycerol. In this way, it can be suggested that the inhibitory action of the L. reuteri extract produced through glycerol fermentation (treatment 2) is due to the presence of reuterin.
The use of reuterin in food can be more explored considering its efficiency and the safety for human health, once L. reuteri is an autochthon bacterium from gastroin-testinal tract and known a safe for ingestion as probiotic (Spinler et al. (2008).
Conclusions
L. reuteri exhibited the ability to reduce psychrotrophic microbiota in pacific white shrimp stored under refrigeration and can be used as a bioprotector in food.
ACKNOWLEDGEMENT
The National Counsel of Technological and Scientific Development (CNPq) for financial support during this assignment.
Conflict of interest
The authors did not declare any conflict of interest.
REFERENCES
Arques JL Fernandez J, Gaya P, Nunez M, Rodriguez E, Medina M (2004). Antimicrobial activity of reuterin in combination with nisin
against food-borne pathogens. Int. J. Food Microbiol. 95(2):225-229. Arques JL, Nunez M, Rodriguez E, Medina M (2007). Antimicrobial
Activity of Nisin, Reuterin, and the Lactoperoxidase System on Listeria monocytogenes and Staphylococcus aureus in Cuajada, a
Semisolid Dairy Product Manufactured in Spain. J. Dairy Sci. 91:70-75.
da Silva et al. 1121 Cleusix V, Lacroix C, Vollenweider S, Le Blay G (2008). Glycerol
induces reuterin production and decreases Escherichia coli
population in na in vitro model of colonic fermentation with
immobilized human feces. FEMS Microbiol. Ecol. 63:56-64. El-Ziney MG, Debevere JM (1998). The effect of reuterin on Listeria
monocytogenes and Escherichia coli O157:H7 in milk and cottage
cheese. J. Food. Protect. 61:1275-1280. Hugas M, Garriga M, Aymerich MT, Monfort JM (1995). Inhibition of
Listeria in dry fermented sausages by the bacteriocinogenic
Lactobacillus sakei CTC494. J. Appl. Microbiol. 79(3):322-330.
ICMSF (1998). Pescados y productos derivados. In: Microorganismos de los alimentos. Ecología microbiana de los productos alimentares.
Zaragoza: Acribia, 121-66. Jeyasekaran G, Ganesan P, Jeya SR, Maheswari K, Sukumar D
(2006). Quantitative and qualitative studies on the bacteriological quality of Indian white shrimp (Penaeus indicus) stored in dry ice. Int.
J. Food Microbiol. 23:526-533. Kirschink PG, Viegas EMM (2004). Changes in quality of freshwater
prawn Macrobrachium rosembergii during storage in ice. Ciencia
Tecnol. Alime. 24(3):p. 407-412. Lüthi-Peng Q, Schärer S, Puhan Z (2002). Production and stability of 3-
hydroxypropionaldehyde in Lactobacillus reuteri. Appl. Microbiol. Biot. 60p.
Lyhs U, Lahtinen J, Fredriksson-Ahomaa M, Hyytia-Trees E, Elfing K,
Korkeala H (2001). Microbiological quality and shelf-life of vacuum-packaged gravad rainbow trout stored at 3 and 8°C. Int. J. Food Microbiol. 70:221-230.
Mayur S, Dinesh RM, Madhukar S (2014). Role of Lactic Acid Bacteria as Probiotics in Health and Disease. Prensa Med. Argent. 100:4.
Montiel R, Martín-Cabrejas I, Langa S, El Aouad, N, Arqués JL, Reyes
F, Medina M (2014). Antimicrobial activity of reuterin produced by Lactobacillus reuteri on Listeria monocytogenes in cold-smoked salmon, Food Microbiol. p. 44.
Moura AFP, Mayer MD, Landgraf M, Tenuta AF (2003). Qualidade química e microbiológica de camarão-rosa comercializado em São Paulo. Braz. J. Pharm. Sci. 39:203-208.
Regional Development Bank of the Extreme South-BRDE (2004). Agency of Florianopolis. Management Planning. Shrimp farming in Santa Catarina: overview, reproduction and larval rearing.
Florianópolis: BRDE. 101 p. Ruch FE, Lengeler J, Lin ECC (1975). Independent constitutive
expression of the aerobic and anaerobic pathways of glycerol catabolism in Klebsiella aerogenes. J. Bacteriol. 124:348-352.
Ruch FE, Lengeler J, Lin ECC (1974). Regulation of glycerol catabolism in Klebsiella aerogenes. J. Bacteriol. 119:50-56.
Silva HS, Ramos RJ, Miotto M, Cirolini A, Vieira CRW (2010). Atividade antimicrobiana de Lactobacillus reuteri contra bactérias de interesse
alimentar. Rev. Inst. Adolfo Lutz, [S.l.], 69(4): 584-587. ISSN 1983-3814.
Souza J, Rodrigues LGG, Gonzalez PNM, Tortato R, Carbonea N, Espírito Santo MLP (2006). Atividade antimicrobiana do Lactobacillus sakei na fermentação do bonito-de-barriga-listrada (Euthynnus
pelamis). VETOR. 16:25-36.
Spinler JK, Taweechotipatr M, Rognerud CIL, Ching NO, Tumwasorn S, Versalovic J (2008). Human-derived probiotic Lactobacillus reuteri
demonstrate antimicrobial activities targeting diverse enteric bacterial pathogens. Anaerobe 14:166-171.
Suárez HM, Francisco A, Beirão LH (2008). Influencia de bacteriocinas producidas por Lactobacillus plantarum LPBM10 sobre la vida útil de filetes del híbrido de cachama Piaractus brachypomus x Colossoma macropomum empacado al vacío. VITAE-COLUMBIA 15: 32-40.
Tomé E, Teixeira P, Gibbs PA (2006). Anti-listerial inhibitory lactic acid bacteria isolated from commercial cold smoked salmon. Int. J. Food Microbiol. 23:399-405.
Vanderzant C, Cobb BF, Thompson CA, Parker JC (1971). Microbial flora, chemical characteristics and shelf life of four species of pond reared shrimp. J. Milk Food Technol. 36:443-449.
Vol. 9(16), pp. 1122-1127, 22 April, 2015
DOI: 10.5897/AJMR2015.7515
Article Number: 7EAC54352655
ISSN 1996-0808 Copyright © 2015
Author(s) retain the copyright of this article
http://www.academicjournals.org/AJMR
African Journal of Microbiology Research
Full Length Research Paper
Antibacterial activity of Andrographis paniculata Nees against selective human pathogens
V. Baby Shalini* and J. Sriman Narayanan
Department of Microbiology, Faculty of Science, Annamalai University, Annamalainagar- 608002, Cuddalore District, Tamil Nadu, India.
Received 6 January, 2015; Accepted 13 April, 2015
The present study was conducted to investigate the antibacterial effect of Andrographis paniculata against selective human pathogens. The plant parts of A. paniculata such as leaf, stem and root were studied for its antibacterial activity. Different solvents were used to extract the active components from the plant parts. The antibacterial activity was studied against selective human pathogens viz., Staphylococcus sp., Escherichia coli, Salmonella sp. and Pseudomonas sp. Among the different solvents, methanol extract showed greater antibacterial activity against E. coli (32.8 mm) followed by Salmonella Typhi (24.7 mm), Pseudomonas sp. (24.2 mm) and Staphylococcus sp. (18.4 mm). So the future investigation was carried out for leaf extract using methanol as solvent to find out the minimum inhibitory concentration for selective human pathogens. The results reveal that 75 µl was optimum for all the test cultures. It shows more activity in E. coli (32.3 mm) followed by S. Typhi (28.1 mm), Staphylococcus sp. (14.1 mm) and Pseudomonas sp. (13.4 mm). Key words: Andrographis paniculata, Antibacterial, Andrographolide, minimum inhibitory concentration.
INTRODUCTION Medicinal plants have grown enormously from the use of herbal products as natural cosmetics and as self-medication by the general public scientific for their beneficial effects (Sharma and Joshi, 2011). In olden ages, antibiotics were produced mostly from the leaves and roots of medicinal plants. The extracts of many plant species have become popular in recent years and attempts have taken to characterize their bioactive principles which gained scope for various pharmaceutical food processing and medical application. Andrographis paniculata is an herbaceous plant in the family Acenthaceae, native to India and Srilanka. In North-
Eastern India the plant is known as Maha-tita literally “King of bitters”, known as various vermicular names (Abhishek et al., 2010). The Tamil has been using Nilavembu-as it is called in Tamil – for centuries.
In Siddha medicine A. paniculata used widely to treat fever like ckikunguny, swine –flu, typhoid, snake bite and common cold etc. (Dhiman et al., 2012). It is an annual herb. The leaves are used traditionally in Asian traditional medicine and particularly in Ayurveda for treatment of various diseases and illness. The plant is cultivated in many areas, as well. It grows well in a sunny location. The seeds are sown during May and June.
*Corresponding author. E-mail: [email protected]. Tel: 9025958726. Author(s) agree that this article remain permanently open access under the terms of the Creative Commons Attribution License 4.0 International License
The seedlings are transplanted at a distance of 30 × 60 cm. The seeds are small and remain dormant for 5-6 months. If possible seedlings should be raised in shade to protect them from heat (Seema et al., 2002). It is distributed in tropical Asian countries, often in isolated patches. It can be found in a variety of habitats, such as plains, hillsides, coastlines, roadsides, farms, and wastelands (Prajapati et al., 2003). Approximately, 28 species of are known and indigenous to Asia. The species also found in Hong Kong, Thailand, Brunei, Singapore, and other parts of Asia, where it may or may not be native. It is widely cultivated in southern and South Eastern Asia to treat infections and some diseases. A. paniculata grows erect to a height of 30 - 110 cm in moist, shady places. The slender stem is dark green. The lance-shaped leaves have hairless blades measuring 8 cm long by 2.5 wide. The small flowers are borne in spreading racemes. The fruit is a capsule around 2 cm long and a few millimeters wide. It contains many yellow-brown seeds.
A. paniculata is also used for other medical purpose; for example, digestive problems, blood cleanser, fever, sore throat (Sharma and Joshi, 2011). A. paniculata is used to cure fever and cold (Koul and Kapil, 1994). It is one of the best anti-malarial agent compared to the commercial product of quinine (Parvataneni et al., 2010). The herb has shown an ability to reduce inflammation (heat) and fight viral infections and is used as a principal ingredient in traditional Chinese medicinal formulas for lung support from colds (Sheeja et al., 2006). A. paniculata is a blood purifier, so it is used to cure turbid liver, jaundice, dermatological diseases, dyspepsia, febrifuge and anhelhemic. A. paniculata acts to dispel heat and remove toxin. Andrographaloid was found to be more potent and a standard hepato protective agent (Visen et al., 1993). The whole plant of A. paniculata is used extensively as an anti-inflammatory and antipyretic drug for the treatment of laryngitis, diarrhea. The juice of fresh leaves generally contains andrographolide. It is used as a domestic remedy in the treatment of colic pain, loss of appetite, irregular stools and diarrhea (Mishra et al., 2007). Since ancient times, A. paniculata has been known in traditional Asian medicine as an immune system booster, to treat infections in the gastrointestinal tract and upper respiratory tract, harps, sore throat and a variety of other chronic infectious diseases (Wangboonskul et al., 2006). Nowadays microbes are resistance to various antibiotics. The resistant of microbes is due to indiscriminate utilization of commercial antimicrobial medicines supported by many scientists investigation for modern antimicrobial substances from several medicinal plants (Alagesaboopathi and Kalaiselvi, 2012). Most of the researchers concentrate on screening and minimum inhibitory concentration (MIC) of extracts of plants rather than identifying compounds with activity. In this attempt, we isolated active constituents of the plant
Shalini and Narayanan 1123 and screened for antimicrobial activity which can be used further in research to develop antimicrobial compounds with the isolated compounds or their synthetic analogues reported by Mohamed et al. (2013). The present investigation was carried out to study the antibacterial potential of extract of A. paniculata against selective human pathogens. MATERIALS AND METHODS
Collection of plant material
The whole plant of A. paniculata was collected from the trial plots at campus of Faculty of Agriculture, and verified by Dr. Manivannan Professor and Head, Department of Horticulture Annamalai University, Annamalai Nagar, Chidambaram, Tamil Nadu.
Fresh and healthy leaf, stem, and root were used to extract bioactive fractions of A. paniculata. The parts of plants which were
used for the extract were washed with water to remove soil and dust particles. Then they were dried under shaded place. Dried materials were blended to form a fine powder and store in airtight bottles (Mneenusarma and Sumanjoshi, 2011).
Test organisms
The human pathogens viz., Staphylococcus sp., E. coli, S. Typhi and Pseudomonas sp., were collected from Jayasekaran hospital, Nagarcoil, Tamil Nadu, India. The test culture was maintained in
Nutrient agar slant at 4C for further studies. Preparation of plant extract
The shade dried coarse powder of the leaf stem and root of A. paniculata were extracted using 250 ml solvent of ethanol, acetone, methanol and water with the help of soxhlet apparatus. The extracts were auto-calved to determine the stability of the crude extracts at
the temperature of 121C for 15 min and then the extracts were
stored at 4C for further use (Daniyan and Mohammed, 2008).
Assay of antibacterial activity using the agar well diffusion
method
An agar-well diffusion method was employed for determination of antibacterial activities. The freeze- dried extract samples of spices and herbs were dissolved in phosphate buffered saline (PSB, pH 7.0 to 7.2) to the final concentration of 100 mg/ml and sterilized by filtration through 0.22 µm sterilized Millipore express filter. All bacteria were suspended in sterile water and diluted to 10
-6
CFU/ml. The suspension (100 µl) was spread onto the surface of
NA medium. Agar wells (4.6 mm in diameter) were cut from the agar with a sterile borer and 60 µl extract solutions were delivered
into them. The inoculated plates were incubated at 37C for 24 h. Antibacterial activity was evaluated by measuring the diameter of inhibition zone of the tested bacteria.
RESULT
The antibacterial activity of different plant parts of A. paniculata viz., root, stem and leaf were investigated
1124 Afr. J. Microbiol. Res.
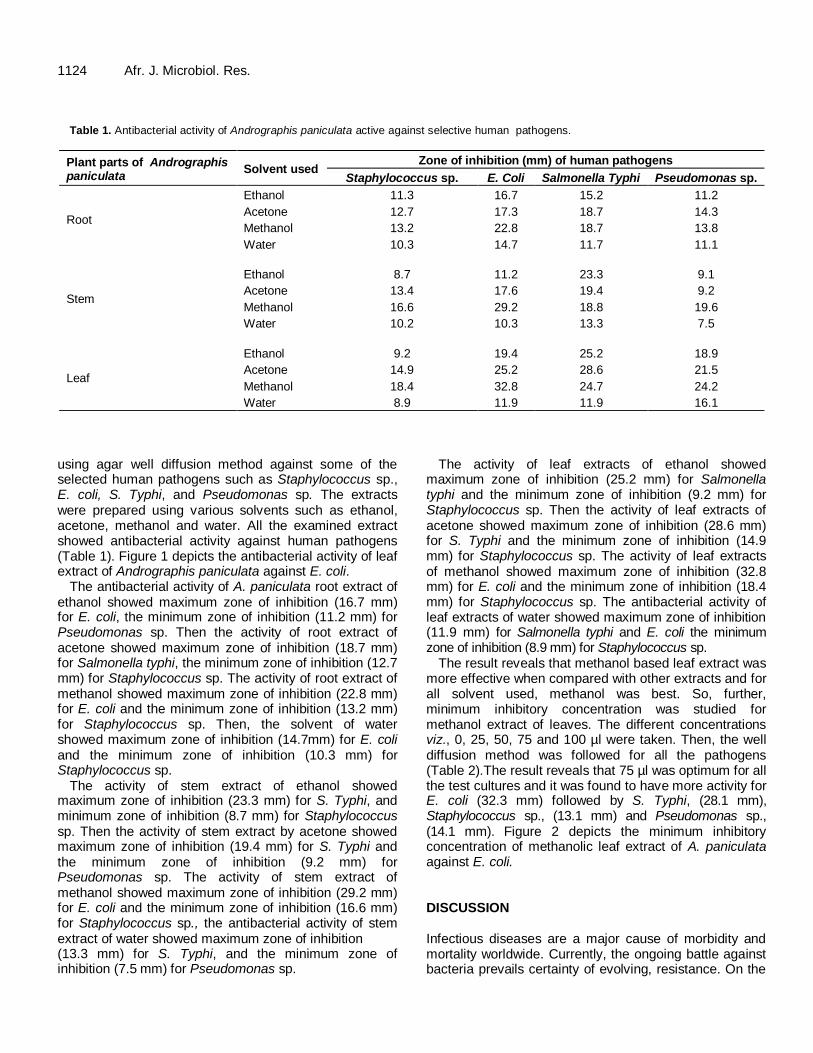
Table 1. Antibacterial activity of Andrographis paniculata active against selective human pathogens.
Plant parts of Andrographis paniculata
Solvent used Zone of inhibition (mm) of human pathogens
Staphylococcus sp. E. Coli Salmonella Typhi Pseudomonas sp.
Root
Ethanol 11.3 16.7 15.2 11.2
Acetone 12.7 17.3 18.7 14.3
Methanol 13.2 22.8 18.7 13.8
Water 10.3 14.7 11.7 11.1
Stem
Ethanol 8.7 11.2 23.3 9.1
Acetone 13.4 17.6 19.4 9.2
Methanol 16.6 29.2 18.8 19.6
Water 10.2 10.3 13.3 7.5
Leaf
Ethanol 9.2 19.4 25.2 18.9
Acetone 14.9 25.2 28.6 21.5
Methanol 18.4 32.8 24.7 24.2
Water 8.9 11.9 11.9 16.1
using agar well diffusion method against some of the selected human pathogens such as Staphylococcus sp., E. coli, S. Typhi, and Pseudomonas sp. The extracts were prepared using various solvents such as ethanol, acetone, methanol and water. All the examined extract showed antibacterial activity against human pathogens (Table 1). Figure 1 depicts the antibacterial activity of leaf extract of Andrographis paniculata against E. coli.
The antibacterial activity of A. paniculata root extract of ethanol showed maximum zone of inhibition (16.7 mm) for E. coli, the minimum zone of inhibition (11.2 mm) for Pseudomonas sp. Then the activity of root extract of acetone showed maximum zone of inhibition (18.7 mm) for Salmonella typhi, the minimum zone of inhibition (12.7 mm) for Staphylococcus sp. The activity of root extract of methanol showed maximum zone of inhibition (22.8 mm) for E. coli and the minimum zone of inhibition (13.2 mm) for Staphylococcus sp. Then, the solvent of water showed maximum zone of inhibition (14.7mm) for E. coli and the minimum zone of inhibition (10.3 mm) for Staphylococcus sp.
The activity of stem extract of ethanol showed maximum zone of inhibition (23.3 mm) for S. Typhi, and minimum zone of inhibition (8.7 mm) for Staphylococcus sp. Then the activity of stem extract by acetone showed maximum zone of inhibition (19.4 mm) for S. Typhi and the minimum zone of inhibition (9.2 mm) for Pseudomonas sp. The activity of stem extract of methanol showed maximum zone of inhibition (29.2 mm) for E. coli and the minimum zone of inhibition (16.6 mm) for Staphylococcus sp., the antibacterial activity of stem extract of water showed maximum zone of inhibition (13.3 mm) for S. Typhi, and the minimum zone of inhibition (7.5 mm) for Pseudomonas sp.
The activity of leaf extracts of ethanol showed maximum zone of inhibition (25.2 mm) for Salmonella typhi and the minimum zone of inhibition (9.2 mm) for Staphylococcus sp. Then the activity of leaf extracts of acetone showed maximum zone of inhibition (28.6 mm) for S. Typhi and the minimum zone of inhibition (14.9 mm) for Staphylococcus sp. The activity of leaf extracts of methanol showed maximum zone of inhibition (32.8 mm) for E. coli and the minimum zone of inhibition (18.4 mm) for Staphylococcus sp. The antibacterial activity of leaf extracts of water showed maximum zone of inhibition (11.9 mm) for Salmonella typhi and E. coli the minimum zone of inhibition (8.9 mm) for Staphylococcus sp.
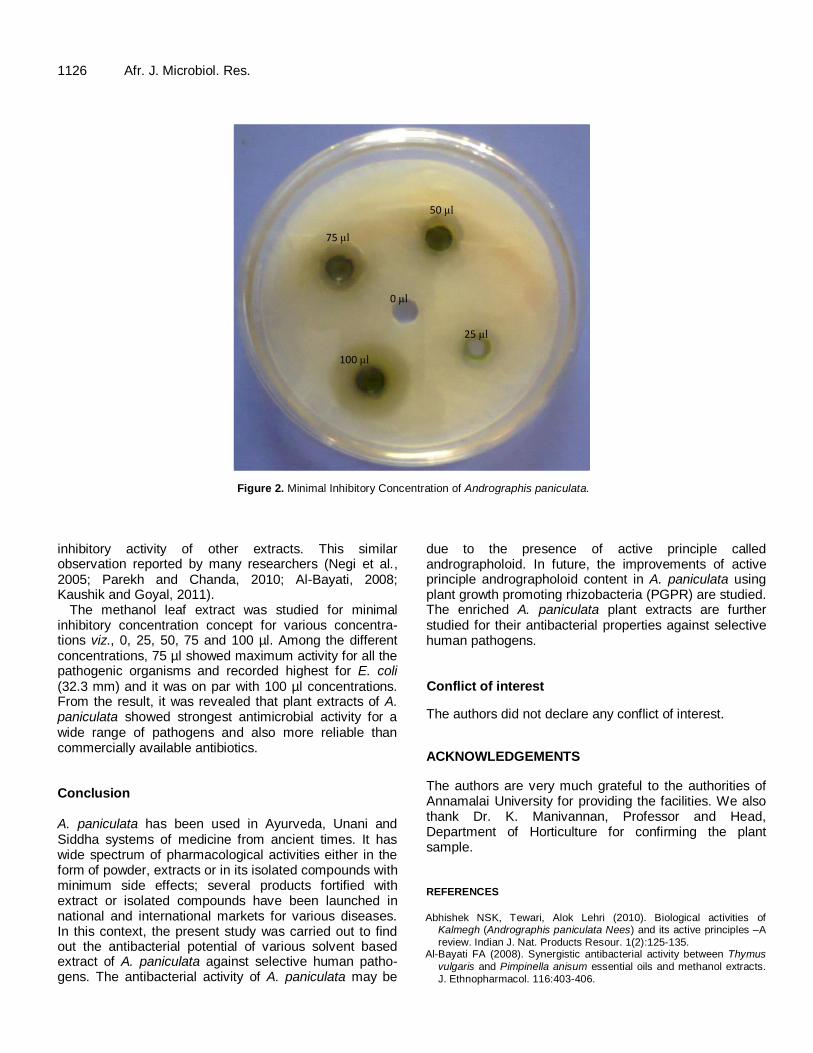
The result reveals that methanol based leaf extract was more effective when compared with other extracts and for all solvent used, methanol was best. So, further, minimum inhibitory concentration was studied for methanol extract of leaves. The different concentrations viz., 0, 25, 50, 75 and 100 µl were taken. Then, the well diffusion method was followed for all the pathogens (Table 2).The result reveals that 75 µl was optimum for all the test cultures and it was found to have more activity for E. coli (32.3 mm) followed by S. Typhi, (28.1 mm), Staphylococcus sp., (13.1 mm) and Pseudomonas sp., (14.1 mm). Figure 2 depicts the minimum inhibitory concentration of methanolic leaf extract of A. paniculata against E. coli. DISCUSSION Infectious diseases are a major cause of morbidity and mortality worldwide. Currently, the ongoing battle against bacteria prevails certainty of evolving, resistance. On the

Shalini and Narayanan 1125
Acetone
Methanol
Ethanol
Water
Control
Figure 1. Antibacterial activity of Andrographis paniculata active against
selective human pathogens of E.coli.
Table 2. Minimal Inhibitory Concentration of Andrographis paniculata.
Methanol (µl) Zone of inhibition of the human pathogen
Staphylococcus sp. E. coli Salmonella sp. Pseudomonas sp.
0 10.0 25.3 23.7 11.3
25 11.1 26.0 25.3 12.3
50 12.0 26.8 25.6 13.0
75 14.1 32.3 28.1 13.4
100 13.3 32.5 28.8 14.5
other hand, advancement in medical field results in more patients being in critical and immune suppressed states, thus creating a perpetual need for new antibiotics. As a result, it is the right time to discover new antibiotics (Mahesh and Satish, 2008). A. paniculata has a several water soluble lactone andrographoloidic properties. Medicinal plants are more important in field of pharmaceutical industries for new drug preparation (Sule et al., 2010).
Maximum zone of inhibition was recorded with 75 µl methanol extract against S. aureus, in accordance with the previous studies reporting that 75 µl methanol is better than other solvent for antibacterial activity (Pushpendra Kumar Mishra et al., 2013). Therefore, only the 75 µl of methanol extract of A. paniculata leaves were used for
further experiments. The present study mainly focused on assaying the efficiency of different plant parts viz., root, stem and leaf of Andrograpish paniculata using various solvent extraction procedures against the selected human pathogens.
In the preliminary screening of antibacterial activity of methanol leaf extract of Andrographis paniculata exhibited maximum activity when compared with other plant parts and also from different solvent extracts (Monoharan and Monoharan, 2013). The maximum activity was observed for the pathogens E. coli followed by Salmonella typhi, Staphylococcus sp. and Pseudomonas sp.
The methanolic extracts of Andrographis paniculata at the highest concentration showed the strongest bacterial
1126 Afr. J. Microbiol. Res.
75 μl
0 μl
50 μl
25 μl
100 μl
Figure 2. Minimal Inhibitory Concentration of Andrographis paniculata.
inhibitory activity of other extracts. This similar observation reported by many researchers (Negi et al., 2005; Parekh and Chanda, 2010; Al-Bayati, 2008; Kaushik and Goyal, 2011).
The methanol leaf extract was studied for minimal inhibitory concentration concept for various concentra-tions viz., 0, 25, 50, 75 and 100 µl. Among the different concentrations, 75 µl showed maximum activity for all the pathogenic organisms and recorded highest for E. coli (32.3 mm) and it was on par with 100 µl concentrations. From the result, it was revealed that plant extracts of A. paniculata showed strongest antimicrobial activity for a wide range of pathogens and also more reliable than commercially available antibiotics. Conclusion A. paniculata has been used in Ayurveda, Unani and Siddha systems of medicine from ancient times. It has wide spectrum of pharmacological activities either in the form of powder, extracts or in its isolated compounds with minimum side effects; several products fortified with extract or isolated compounds have been launched in national and international markets for various diseases. In this context, the present study was carried out to find out the antibacterial potential of various solvent based extract of A. paniculata against selective human patho-gens. The antibacterial activity of A. paniculata may be
due to the presence of active principle called andrographoloid. In future, the improvements of active principle andrographoloid content in A. paniculata using plant growth promoting rhizobacteria (PGPR) are studied. The enriched A. paniculata plant extracts are further studied for their antibacterial properties against selective human pathogens. Conflict of interest
The authors did not declare any conflict of interest.
ACKNOWLEDGEMENTS
The authors are very much grateful to the authorities of Annamalai University for providing the facilities. We also thank Dr. K. Manivannan, Professor and Head, Department of Horticulture for confirming the plant sample. REFERENCES
Abhishek NSK, Tewari, Alok Lehri (2010). Biological activities of
Kalmegh (Andrographis paniculata Nees) and its active principles –A
review. Indian J. Nat. Products Resour. 1(2):125-135. Al-Bayati FA (2008). Synergistic antibacterial activity between Thymus
vulgaris and Pimpinella anisum essential oils and methanol extracts.
J. Ethnopharmacol. 116:403-406.
Alagesaboopathi C, Kalaiselvi N (2012). Antimicrobial activities of the
root, stem and leaf extracts of Argemone mexicana L. Int. J.
Biosci.2(5):61-68.
Daniyan SY, Muhammad HB (2008). Evaluation of the antimicrobial activities and phytochemical properties of extracts of Tamaridus indica against some diseases causing bacteria. Afr. J. Biotechnol.
7(14):2451-2453. Dhiman A, Goyal J, Sharma KA, Dhiman S (2012). A Review on
Medicinal Prospectives of Andrographis paniculata Nees. JPSI. pp.
1-4. Kaushik P, Goyal P (2011). “Evaluation of various crude extracts of
Zingiber officinale rhizome for potential antibacterial acitivity: a study
in vitro. Advance Microbiol. 1:7-12. Koul IB, Kapil A (1994). Effect of diterpenes from Andrographis
paniculata on anti-oxidant defence system and lipid peroxidation. Ind.
J. Pharmacol. 26:296-300. Mahesh B, Sathis S (2008). Antimicrobial activity of some important
medicinal plants against plant and human pathogens. World J. Agric.
Sci. 4:839-843. Mishra SK, Sangwan NS, Sangwan RS (2007). Andrographis paniculata
(Kalmegh): A Rev. Pharmacog. Rev. 1(2):283-298. Monoharan S, Monoharan E (2013). Medicinal and pharmacological
properties of Andrographis paniculata Int. J. Bio. Mol. Biomed. 3(2):1-
12. Negi PS, Chauhan AS, Sadia GA, Rohinishree YS, Ramteke RS (2005).
Antioxidant and antibacterial activities of various seabuckthorn (Hippophaerhamnoides L.) seed extracts. Food Chemistry 92:119-
124.
Parekh J, Chanda S (2010). Antibacterial and phytochemical studies on twelve species of Indian medicinal plants. Afr. J. Biomed. Res. 10:175-181.
Parvataneni R, Koduru RL (2010). Antimicrobial activity of the chloroform extracts of the root and the stem Andrographis paniculata
Nees. Int. Res. J. Microbiol. 1(2):37-39.
Prajapati ND, Purohit SS, Sharma AK, Kumar TA (2003). Handbook of medicinal plants, A complete source book, Agrobios. Jodhpur. India. pp. 45-46.
Pushpendra KM, Rahul KS, Anamika G, Adya C, Rahul P, Shree PT, Tribhuban Mohan M (2013). Antibacterial activity of Andrographis paniculata (Burn.f.) Wall ex Nees leaves against clinical pathogens.
JPR. pp. 459-462.
Shalini and Narayanan 1127 Seema N, Mohod NB, Wankhade SG, Paturde JT (2002). Effect of
plantanig and harvesting dates on yield and quality of kalmegh (Andrographis paniculata). JMAPS. 25:981-983.
Sharma M, Joshi S (2011). Comparison of anti-oxidant of Andrographis paniculata and Tinosporacordifolia leaves. J. Curr. Chem. Pharm. Sc.
1(1):1-8.
Sheeja K, Shihab PK, Kuttan G (2006). Antioxidant and anti-inflammatory activities of the plant Andrographis paniculata Nees.
Immunopharmacol. Immunotoxicol. 28:129-140.
Sule A, Ahmed QU, Samah OA, Omar MN (2010). Screening for Antibacterial Activity of Andrographis paniculata Used in Malaysian
Folkloric Medicine: “A Possible Alternative for the Treatment of Skin Infections”. Ethnobotanical Leaflets 14:445-56.
Visen PK, Shukla B, Patnaik GK, Dhawan BN (1993). Andrographolide protects rat hepatocytes against paracetamol induced damage. J.
Ethanopharmacol. 40 (2):131-136. Wangboonskul J, Daodee S, Jarukamjorn K (2006). Study of
Andrographis paniculata tabulates in healthy thaimale volunteers.
Thai Pharm Health. Sci. J. 1(3):209-218.
Vol. 9(16), pp. 1128-1131, 22 April, 2015
DOI: 10.5897/AJMR2014.7257
Article Number: 59A896652657
ISSN 1996-0808 Copyright © 2015
Author(s) retain the copyright of this article
http://www.academicjournals.org/AJMR
African Journal of Microbiology Research
Full Length Research Paper
Evaluation of rice landraces against rice root-knot nematode, Meloidogyne graminicola
H. Ravindra1*, Mukesh Sehgal2, H. B. Narasimhamurthy1, H. S. Imran Khan1 and S. A. Shruthi1
1Zonal Agricultural and Horticultural Research station, University of Agricultural and Horticultural sciences, Shimoga,
577225, Karnataka, India. 2Natinal Centre for Integrated Pest Management, LBS Building Pusa Campus, New Delhi, -110012, India.
Received 7 July, 2014; Accepted 13 April, 2015
Of late, rice root-knot nematode Meloidogyne graminicola has become a serious menace in all type of rice situations in India. A field study was under taken during kharif-2013 to evaluate 135 landraces (local cultivars) collected and maintained at Organic Farming Research centre of ZAHRS, Navile, Shimoga against Meloidogyne graminicola. The result reveals that the varieties show varying degrees of responses. Out of 135 cultivars, 32 cultivars were found to be highly resistant, while, 45 varieties read were resistant. However, 40 varieties were evaluated to be moderately resistant and nine varieties susceptible. The remaining nine cultivars were learnt to be highly susceptible. Key word: Rice, root-knot nematode.
INTRODUCTION Rice is an important cereal crop of India and is the second most staple food crop of the world next to wheat and staple food for two thirds of world’s population (Abodolereza and Racionzer, 2009). More than 90% of the world’s rice area is in Asia, which is the home for more than half of the world’s poor, and more than half of the world’s rice cultivators (Rao et al., 2010). Meloidogyne graminicola is known to infect and cause serious damage to cereals, especially rice, in many countries (Port and Matias, 1995; Padgham et al., 2004). In India, M. graminicola has been found in Assam, Andhra Pradesh, Karnataka, West Bengal, Orissa, Kerala, Tripura and Madhya Pradesh (Prasad et al., 1987). It is not only a serious problem in nurseries and upland rice but also found to be widespread in the
deepwater and irrigated rice in many states of India (Prasad et al., 1985; MacGowan, 1989; Jairajpuri and Baqri, 1991). Yield loss up to 50% might be incurred due to severe infestation of M. graminicola in upland, rainfed and direct seeded rice (Lorenzana et al., 1998). The use of resistant cultivars is a low cost and sustainable option for the control of nematodes in the long term which does not impose unwanted changes in traditional agronomic practices (Amoussou et al., 2004).
Rice root-knot nematode appeared in devastating form in parts of major rice growing areas of Shimoga during 2001, which was a first report from Karnataka and subsequently, reported from Mandya district of the state (Krishnappa et al., 2001). Severe outbreak of M. graminicola is also observed in Shimoga, Karnataka
*Corresponding author. E-mail: [email protected]. Author(s) agree that this article remain permanently open access under the terms of the Creative Commons Attribution License 4.0 International License
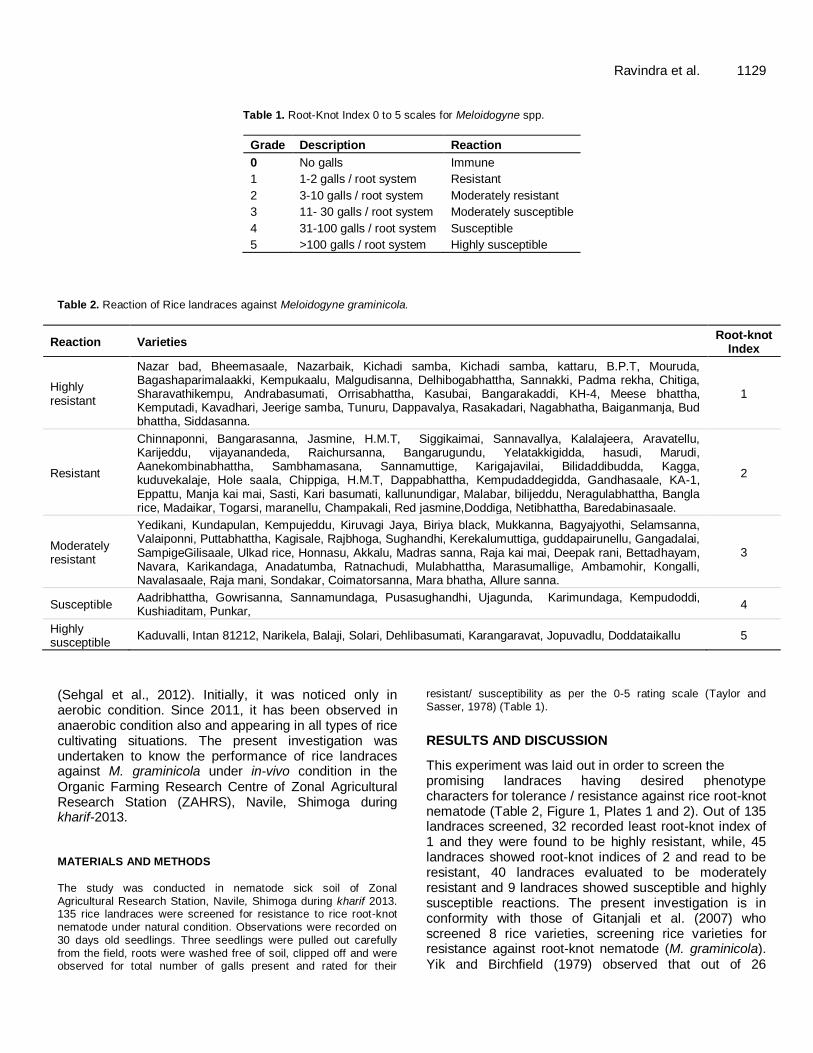
Ravindra et al. 1129
Table 1. Root-Knot Index 0 to 5 scales for Meloidogyne spp.
Grade Description Reaction
0 No galls Immune
1 1-2 galls / root system Resistant
2 3-10 galls / root system Moderately resistant
3 11- 30 galls / root system Moderately susceptible
4 31-100 galls / root system Susceptible
5 >100 galls / root system Highly susceptible
Table 2. Reaction of Rice landraces against Meloidogyne graminicola.
Reaction Varieties Root-knot
Index
Highly resistant
Nazar bad, Bheemasaale, Nazarbaik, Kichadi samba, Kichadi samba, kattaru, B.P.T, Mouruda, Bagashaparimalaakki, Kempukaalu, Malgudisanna, Delhibogabhattha, Sannakki, Padma rekha, Chitiga, Sharavathikempu, Andrabasumati, Orrisabhattha, Kasubai, Bangarakaddi, KH-4, Meese bhattha, Kemputadi, Kavadhari, Jeerige samba, Tunuru, Dappavalya, Rasakadari, Nagabhatha, Baiganmanja, Bud bhattha, Siddasanna.
1
Resistant
Chinnaponni, Bangarasanna, Jasmine, H.M.T, Siggikaimai, Sannavallya, Kalalajeera, Aravatellu, Karijeddu, vijayanandeda, Raichursanna, Bangarugundu, Yelatakkigidda, hasudi, Marudi, Aanekombinabhattha, Sambhamasana, Sannamuttige, Karigajavilai, Bilidaddibudda, Kagga, kuduvekalaje, Hole saala, Chippiga, H.M.T, Dappabhattha, Kempudaddegidda, Gandhasaale, KA-1, Eppattu, Manja kai mai, Sasti, Kari basumati, kallunundigar, Malabar, bilijeddu, Neragulabhattha, Bangla rice, Madaikar, Togarsi, maranellu, Champakali, Red jasmine,Doddiga, Netibhattha, Baredabinasaale.
2
Moderately resistant
Yedikani, Kundapulan, Kempujeddu, Kiruvagi Jaya, Biriya black, Mukkanna, Bagyajyothi, Selamsanna, Valaiponni, Puttabhattha, Kagisale, Rajbhoga, Sughandhi, Kerekalumuttiga, guddapairunellu, Gangadalai, SampigeGilisaale, Ulkad rice, Honnasu, Akkalu, Madras sanna, Raja kai mai, Deepak rani, Bettadhayam, Navara, Karikandaga, Anadatumba, Ratnachudi, Mulabhattha, Marasumallige, Ambamohir, Kongalli, Navalasaale, Raja mani, Sondakar, Coimatorsanna, Mara bhatha, Allure sanna.
3
Susceptible Aadribhattha, Gowrisanna, Sannamundaga, Pusasughandhi, Ujagunda, Karimundaga, Kempudoddi, Kushiaditam, Punkar,
4
Highly susceptible
Kaduvalli, Intan 81212, Narikela, Balaji, Solari, Dehlibasumati, Karangaravat, Jopuvadlu, Doddataikallu 5
(Sehgal et al., 2012). Initially, it was noticed only in aerobic condition. Since 2011, it has been observed in anaerobic condition also and appearing in all types of rice cultivating situations. The present investigation was undertaken to know the performance of rice landraces against M. graminicola under in-vivo condition in the Organic Farming Research Centre of Zonal Agricultural Research Station (ZAHRS), Navile, Shimoga during kharif-2013. MATERIALS AND METHODS
The study was conducted in nematode sick soil of Zonal Agricultural Research Station, Navile, Shimoga during kharif 2013. 135 rice landraces were screened for resistance to rice root-knot nematode under natural condition. Observations were recorded on 30 days old seedlings. Three seedlings were pulled out carefully
from the field, roots were washed free of soil, clipped off and were observed for total number of galls present and rated for their
resistant/ susceptibility as per the 0-5 rating scale (Taylor and Sasser, 1978) (Table 1).
RESULTS AND DISCUSSION
This experiment was laid out in order to screen the promising landraces having desired phenotype characters for tolerance / resistance against rice root-knot nematode (Table 2, Figure 1, Plates 1 and 2). Out of 135 landraces screened, 32 recorded least root-knot index of 1 and they were found to be highly resistant, while, 45 landraces showed root-knot indices of 2 and read to be resistant, 40 landraces evaluated to be moderately resistant and 9 landraces showed susceptible and highly susceptible reactions. The present investigation is in conformity with those of Gitanjali et al. (2007) who screened 8 rice varieties, screening rice varieties for resistance against root-knot nematode (M. graminicola). Yik and Birchfield (1979) observed that out of 26
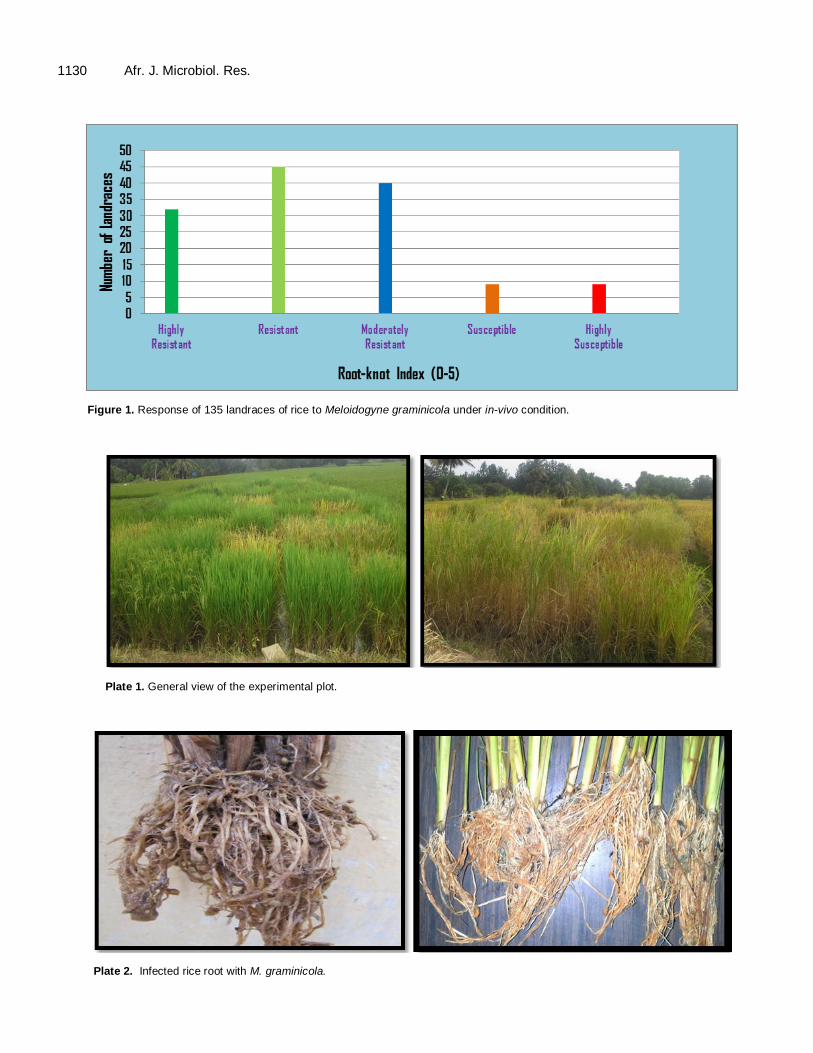
1130 Afr. J. Microbiol. Res.
Figure 1. Response of 135 landraces of rice to Meloidogyne graminicola under in-vivo condition.
Plate 1. General view of the experimental plot.
Plate 2. Infected rice root with M. graminicola.
cultivars, 21 cultivars showed resistance to the rice root-knot nematode. Simon (2009) evaluated the susceptibility of 53 rice genotypes to M. graminicola in field and pot experiments and observed that 13 cultivars were highly resistant to this nematode. Evaluation of advanced backcross populations developed for water stress environment revealed that Teqing and the donarscvc Type 3, Zihui 100, ShweThwe Yin Hyv were resistant to the nematode (Prasad et al., 2006). Das et al. (2011) reported that O. glaberrima accessions CG 14 and TOG 5674, traditional cultivars WAB 638-1 and IRAT 216 and aerobic rice genotype IR 81426-B-B-186-4 and IR81449-B-B-51-4 were resistant to M. graminicola. Conflict of interest The authors did not declare any conflict of interest. REFERENCES Abodolereza A, Racionzer P (2009). Food outlook: Global market
analysis. pp. 23-27. Amoussou PL, Ashurt J, Green J, Jones M, Koyama M, Snape JTW,
Atkinson H (2004). broadly based resistance to nematodes in the rice
and potato crops of subsistence farmers. DFID Plant Sciences ResearchProgramme Annual Report, pp. 9-14.
Das K, Zhao D, Waele DD, Tiwari RKS, Shrivastava DK, Arvinda K
(2011). Reaction of traditional upland and aerobic rice genotypes to rice root-knot nematode (Meloidogyne graminicola). J. Plant Breed.
Crop Sci. 3:131-137.
Gitanjali Devi NS, Azad T (2007). Screening of Rice Germplasm/Varieties for resistance against root-knot nematode (Meloidogyne graminicola). Ind. J. Nematol. 37:1
Jairajpuri MS, Baqri QH (1991). Nematode pests of rice, Oxford and IBH publisher, New Delhi, India, p. 66.
Krishnappa K, Reddy BMR, Ravichandra NG, Ravindra H (2001).
Incidence of root-knot nematode on rice in Karnataka in: National congress on Centenary of Nematology in India appraisal and future plans. pp. 85.
Lorenzana OJ, Matamis PP, Mallinin CB, Jose OL, De-leon DS (1998). Cultural management practices to control rice root knot nematode. Philippine Council for Agriculture, Forestry and Natural Resources
Research and Development, Los Banos, Laguna (Philippines). 120 p. Macgowan JB (1989). Rice root-knot nematode Meloidogyne
graminicola Golden and Birchfield 1965. Fla. Dept. of Agric. And
consumer Serv. Div. Plant Ind., Nematology Circular No. 166, June, 1989.
Padgham JL, Duxbury JM, Mazid AM, Abawi GS, Hossain M (2004). Yield loss caused by Meloidogyne graminicola on low land rainfed
rice in Bangladesh. J. Nematol. 36:42-48. Port JC, Matias DM (1995). Effect of water regime on the distribution of
Meloidogyne graminicola. And other root-parasitic nematodes in a rice field toposequence and pathogenicity ofM. graminicola on rice on
rice cultivar UPLR 15. Nematol. 41:219-228.
Ravindra et al. 1131 Prasad JS, Panwar MS, Rao YS (1985). Occurance of root-knot
nematode, Meloidogyne graminicola in semi-deep water rice. Curr.
Sci. 54:387-388.
Prasad JS, Panwar MS, Rao YS (1986). Screening of some rice cultivars against the root-knot nematode Meloidogyne graminicola,
Ind. J. Nematol. 16:112-113.
Prasad JS, Panwar MS, Rao YS (1987). Nematode problems of rice in india. Int. J. T. Pest Manag.33:127-136
Prasad JS, Vijayakumar CHM, Sankar M, Varaprasad KS, Srinivasa
PM, Kondala RY (2006). Root-knot nematode resistance in advanced back cross populations of rice developed for water stress conditions. Nematol. Medit. 34:3-8.
Rao KV, Singh SP, Sureka K, Muthuraman P (2010). Site specific integrated nutrient management in rice and rice based cropping system. Indian Agric. Res. Directorate Rice Res. pp. 1-2.
Simon LSD (2009). Screening of rice germplasm against root knot nematode Meloidogynegraminicola. Ind. Phytopathol. 62: 131-132.
Taylor AL, Sasser JN (1978). Biology, identification and control of root-knot nematodes (Meloidogyne spp.). Corporative publication,
Department of Plant Pathology, NC5U and U5AID, Raleigh, North Carolina, p. 111.
Yik CP, Birchfield W (1979). Host studies and reaction of rice cultivars to Meloidogyne graminicola. Phytopathology 49:497-499.

Vol. 9(16), pp. 1132-1138, 22 April, 2015
DOI: 10.5897/AJMR2015.7402
Article Number: A08C05252659
ISSN 1996-0808
Copyright © 2015
Author(s) retain the copyright of this article http://www.academicjournals.org/AJMR
African Journal of Microbiology Research
Full Length Research Paper
Performance evaluation of laboratory professionals on tuberculosis microscopy at Hawassa Town,
Southern Ethiopia
Mengistu Hailemariam*, Abebe Minuta, Gezahegn Bewoket, Tadesse Alehegn, Yismake Worku and Moges Desta
Department of Medical Laboratory Sciences, College of Medicine and Health Sciences, Hawassa University, Ethiopia.
Received 28 January, 2015; Accepted 13 April, 2015
Microscopic diagnosis of Ziehl-Neelsen stained sputum by microscopists has remained the best routine laboratory method for the diagnosis of tuberculosis (TB). However, detection and identification of TB require skilled laboratory personnel. The aim of the study was to assess the performance of laboratory professionals in detecting TB bacilli at Hawassa town health institutions. A cross-sectional study design was employed among a total of 81 laboratory professionals working in public and private health facilities. A standardized pre-validated slide panel and questionnaires were distributed to laboratory professionals. Agreement in detection of TB bacilli sensitivity, specificity and predictive values of readings were assessed using SPSS version 16.0. Among the 81 participant, 11(13.6%) correctly reported all panel slides, 70 (86.4%) missed at least one slides. A total of 29.75% (241/810) error was reported that include major errors of 2.22% (13 HFN; 5 HFP) and minor errors of 27.5% (25 LFN; 60 LFP and138 QE). The sensitivity and specificity of participants in detecting TB bacilli as compared to the reference reading were 91.97, 80.00, 87.30 and 86.92%, respectively. Overall agreement of participants with the reference reading on TB detection was 95.18% (Kappa = 0.73). Agreement of the participants with reference reading in the detection of TB bacilli was good. Even though the study revealed only 2.22% major error, the laboratory professionals need continuous supervision and remedial actions on time for successful TB control programs. Key words: Tuberculosis microscopy, performance test, laboratory professionals, southern Ethiopia.
INTRODUCTION According to WHO tuberculosis (TB) report 2011, Ethiopia ranks 7
th in the list of the world‟s 22 high burden
countries for TB with incidence estimated at 379/100,000 for all forms of TB and 168/100,000 for smear positive tuberculosis (Boulahbal et al., 1976). Direct sputum
smear microscopy remains the most cost effective tool for diagnosing patients with infectious tuberculosis and for monitoring progress of treatment although the limited diagnostic capacity for TB in the country remains a challenge to improving case detection rate (World Health
*Corresponding author. E-mail:[email protected]. Tel: +251-913-641103. Fax: +251-462-205421. Author(s) agree that this article remains permanently open access under the terms of the Creative Commons Attribution License 4.0 International License
Organization, 2011; Ethiopian Health and Nutrition Research Institute, 2008).
Case detection through quality assured laboratories is an essential element of the WHO STOP TB Strategy (Ethiopian Health and Nutrition Research Institute, 2008; World Health Organization, 2006). The WHO for tuberculosis control (DOTS) relies on a network of laboratories that provide acid fast bacilli (AFB) sputum smear microscopy. But, if the laboratory diagnosis is unreliable, all other activities will be affected. It is known that microscopy errors are likely to result in failure to detect persons with infectious TB who will then continue to spread infection in the community, or unnecessary treatment for non-cases. On the other hand, errors in reading follow up smears can result in patients being placed on prolonged treatment, or in treatment discontinued prematurely. Therefore, quality assurance of AFB sputum smear microscopy is essential to reduce such type of problems (Ethiopian Health and Nutrition Research Institute, 2009; World Health Organization, 2011).
Quality of AFB smear microscopy is dependent on national programs that monitor and perform proficiency testing of individual laboratories (Jakes and Joyce, 2001). Proficiency testing is a system in which „reference material‟ of known but undisclosed content are introduced into the laboratory and examined by the staff using the same procedures as would normally be used to examine patients‟ specimen of the same type (Ethiopian Health and Nutrition Research Institute, 2008; Jakes and Joyce, 2001).
This study intends to assess the proficiency level in detecting Mycobacterium tuberculosis from sputum smears by the microscopists at Hawassa health institution laboratories. MATERIALS AND METHODS
A prospective cross-sectional study was conducted to evaluate the quality of TB smear microscopic examination from April 23 to June 26 2012. The study was conducted at Hawassa City: two
governmental hospital, two private hospital, two governmental health center and one non-governmental health institution laboratories. The study involves 81 laboratory professionals, all laboratories were provided TB microscopy on daily basis. The professionals were selected based on convenient availability at time of data collection.
Panel slide preparation and distribution
Experts who have been qualified and certified on TB microscopy at the Hawassa regional laboratory had prepared and validated the panel slides. Both TB positive and TB negative sputum were used. Further concentration as well as dilution of bacilli was done after bleach concentration techniques. Experts interpreted the prepared AFB smears using investigative criteria for the presence or absence of TB bacilli and also quantification of bacilli number.
For this study, ten slides per set, covering the full range from negative to strongly positive were used according to WHO manual for preparation of proficiency test slides. The composition of test
Hailemariam et al. 1133 panels standardized according to WHO manual and Ethiopian Health & Nutrition Research Institutes guide line (National Tuberculosis and Leprosy Control Programme, 1999; Ethiopian Health and Nutrition Research Institute, 2009). Each panel of slides include four with negative slide and six with different bacterial density (3 with 1-9 AFB/100 fields (trace), one with 1
+, one with 2
+
and one with 3+). The total number of slides per panel was ten.
Groups of standardized panels with respect to the characteristics of the positive (mycobacterium and level of bacteria) as well as negative slides were used so that the results of the assessment by different laboratories could be compared. Next to preparation and validation, the slides were arranged in ten sets and then packed for distribution to the participant. The
reporting formats and orders of how to perform the tests were packed separately.
A structured questionnaire including information on the participating facilities and professionals was distributed. The questionnaire includes the socio-demographic characteristics, educational background and service of the professionals.
The result of TB diagnosis reported by the participants was evaluated using different parameter. Sensitivity was determined as the ability of participants to diagnose positive TB slides whereas;
specificity was calculated for their ability to diagnose negative TB slides. Inter-rater agreement is the degree of agreement between participants and expertise reader. It is calculated by computing the sum of true positives and true negatives and then divided by the total.
“Major error” was defined as incorrect diagnosis of TB, that is, reporting “negative” in the case of a sample with TB bacilli (HFN); and falsely reporting “positive” in the absence of TB bacilli in the sample (HFP). “Minor error” was defined as quantification error(QE)
and reporting negative with the correct report was 1-9AFB/100 fields and vice versa (Table 1). The distinction between a minor and a major error was based on the effect the error could potentially have on the patient's diagnosis and clinical management (2, 6 Ethiopian Health and Nutrition Research Institute, 2008 and 2009).
Regarding the score, in a set of 10 panel testing slides, each slide carries 10 points, total possible score of 100. Committing major error (HFP and HFN) result in a score of 0 where as minor
error (LFP, LFN and QE (QE = 2 grades difference)) result in scores of 5 points. In general, assessment of performance was based on Table 1. Passing score was 80 points and poor performance was <80%. Interpretation of results was done based on International Union against Tuberculosis and Lung Disease (IUATLD) WHO recommended grading of sputum smear microscopy results using World Health Organization (2002).
The laboratory personals in the selected laboratory reported the results of examined panel slides along with the principal investigator as compared to the results against the expertise reading. Data was entered and analyzed using SPSS statistical soft ware version 16.0 at a statistical significance of p < 0.05 and 95% confidence intervals. Error rates of par t ic ipants were statistically tested using logistic regression analysis. The level of agreement among various diagnostic levels was measured using Kappa.
The study was presented to the research committee of the department of Medical Laboratory Science and endorsed by the department commission then ethically cleared by the College Research and publication committee. Official letter was written to the participating facilities. In addition, participants had the right not to participate or to withdraw from the study at any time.
RESULTS
A total of 81 laboratory professionals responded to the questionnaires with a response rate of 100%. Forty eight
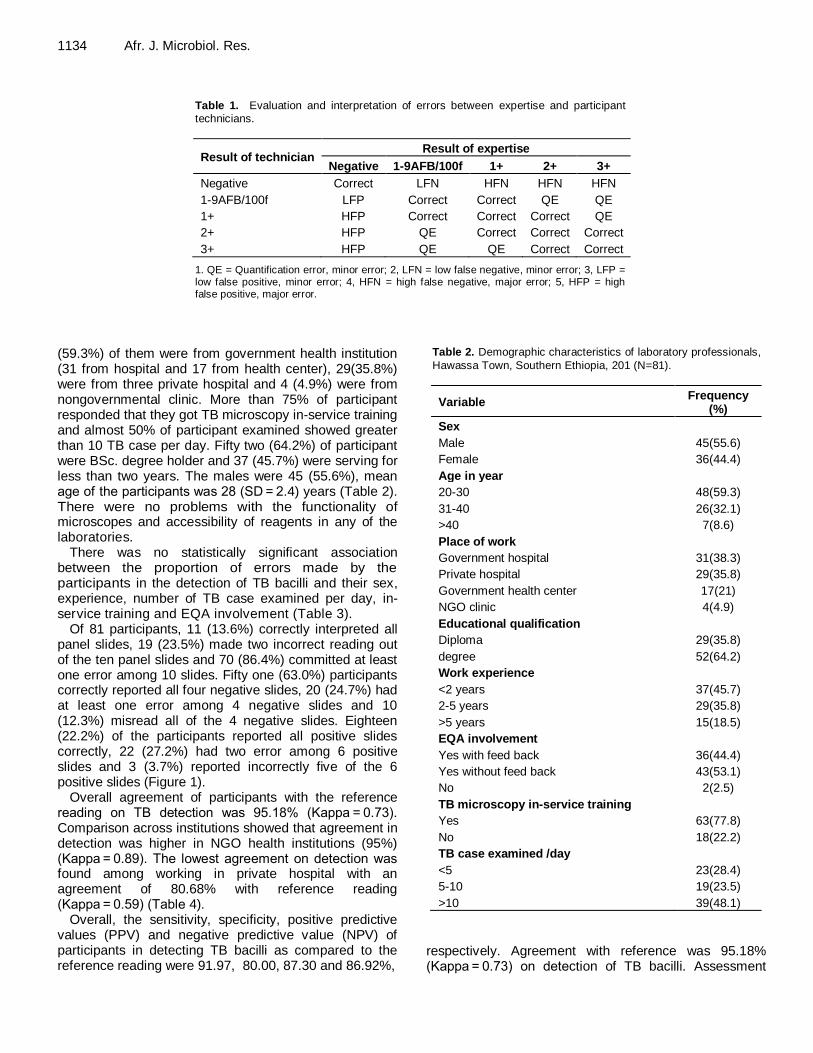
1134 Afr. J. Microbiol. Res.
Table 1. Evaluation and interpretation of errors between expertise and participant technicians.
Result of technician Result of expertise
Negative 1-9AFB/100f 1+ 2+ 3+
Negative Correct LFN HFN HFN HFN
1-9AFB/100f LFP Correct Correct QE QE
1+ HFP Correct Correct Correct QE
2+ HFP QE Correct Correct Correct
3+ HFP QE QE Correct Correct
1. QE = Quantification error, minor error; 2, LFN = low false negative, minor error; 3, LFP = low false positive, minor error; 4, HFN = high false negative, major error; 5, HFP = high false positive, major error.
(59.3%) of them were from government health institution (31 from hospital and 17 from health center), 29(35.8%) were from three private hospital and 4 (4.9%) were from nongovernmental clinic. More than 75% of participant responded that they got TB microscopy in-service training and almost 50% of participant examined showed greater than 10 TB case per day. Fifty two (64.2%) of participant were BSc. degree holder and 37 (45.7%) were serving for less than two years. The males were 45 (55.6%), mean age of the participants was 28 (SD = 2.4) years (Table 2). There were no problems with the functionality of microscopes and accessibility of reagents in any of the laboratories.
There was no statistically significant association between the proportion of errors made by the participants in the detection of TB bacilli and their sex, experience, number of TB case examined per day, in-service training and EQA involvement (Table 3).
Of 81 participants, 11 (13.6%) correctly interpreted all panel slides, 19 (23.5%) made two incorrect reading out of the ten panel slides and 70 (86.4%) committed at least one error among 10 slides. Fifty one (63.0%) participants correctly reported all four negative slides, 20 (24.7%) had at least one error among 4 negative slides and 10 (12.3%) misread all of the 4 negative slides. Eighteen (22.2%) of the participants reported all positive slides correctly, 22 (27.2%) had two error among 6 positive slides and 3 (3.7%) reported incorrectly five of the 6 positive slides (Figure 1).
Overall agreement of participants with the reference reading on TB detection was 95.18% (Kappa = 0.73). Comparison across institutions showed that agreement in detection was higher in NGO health institutions (95%) (Kappa = 0.89). The lowest agreement on detection was found among working in private hospital with an agreement of 80.68% with reference reading (Kappa = 0.59) (Table 4).
Overall, the sensitivity, specificity, positive predictive values (PPV) and negative predictive value (NPV) of participants in detecting TB bacilli as compared to the reference reading were 91.97, 80.00, 87.30 and 86.92%,
Table 2. Demographic characteristics of laboratory professionals,
Hawassa Town, Southern Ethiopia, 201 (N=81).
Variable Frequency
(%)
Sex
Male 45(55.6)
Female 36(44.4)
Age in year
20-30 48(59.3)
31-40 26(32.1)
>40 7(8.6)
Place of work
Government hospital 31(38.3)
Private hospital 29(35.8)
Government health center 17(21)
NGO clinic 4(4.9)
Educational qualification
Diploma 29(35.8)
degree 52(64.2)
Work experience
<2 years 37(45.7)
2-5 years 29(35.8)
>5 years 15(18.5)
EQA involvement
Yes with feed back 36(44.4)
Yes without feed back 43(53.1)
No 2(2.5)
TB microscopy in-service training
Yes 63(77.8)
No 18(22.2)
TB case examined /day
<5 23(28.4)
5-10 19(23.5)
>10 39(48.1)
respectively. Agreement with reference was 95.18% (Kappa = 0.73) on detection of TB bacilli. Assessment
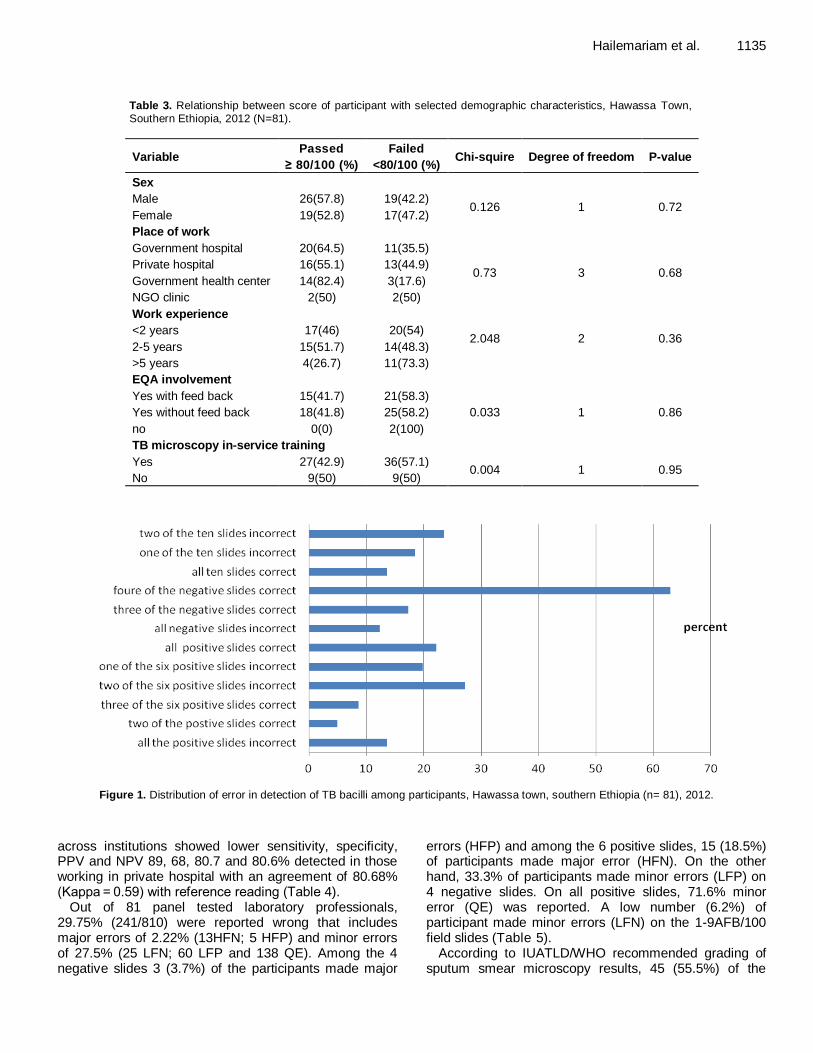
Hailemariam et al. 1135
Table 3. Relationship between score of participant with selected demographic characteristics, Hawassa Town, Southern Ethiopia, 2012 (N=81).
Variable Passed
≥ 80/100 (%)
Failed
<80/100 (%) Chi-squire Degree of freedom P-value
Sex
0.126
1
0.72 Male 26(57.8) 19(42.2)
Female 19(52.8) 17(47.2)
Place of work
0.73
3
0.68
Government hospital 20(64.5) 11(35.5)
Private hospital 16(55.1) 13(44.9)
Government health center 14(82.4) 3(17.6)
NGO clinic 2(50) 2(50)
Work experience
2.048 2 0.36 <2 years 17(46) 20(54)
2-5 years 15(51.7) 14(48.3)
>5 years 4(26.7) 11(73.3)
EQA involvement
0.033
1
0.86
Yes with feed back 15(41.7) 21(58.3)
Yes without feed back 18(41.8) 25(58.2)
no 0(0) 2(100)
TB microscopy in-service training
0.004
1
0.95 Yes 27(42.9) 36(57.1)
No 9(50) 9(50)
Figure 1. Distribution of error in detection of TB bacilli among participants, Hawassa town, southern Ethiopia (n= 81), 2012.
across institutions showed lower sensitivity, specificity, PPV and NPV 89, 68, 80.7 and 80.6% detected in those working in private hospital with an agreement of 80.68% (Kappa = 0.59) with reference reading (Table 4).
Out of 81 panel tested laboratory professionals, 29.75% (241/810) were reported wrong that includes major errors of 2.22% (13HFN; 5 HFP) and minor errors of 27.5% (25 LFN; 60 LFP and 138 QE). Among the 4 negative slides 3 (3.7%) of the participants made major
errors (HFP) and among the 6 positive slides, 15 (18.5%) of participants made major error (HFN). On the other hand, 33.3% of participants made minor errors (LFP) on 4 negative slides. On all positive slides, 71.6% minor error (QE) was reported. A low number (6.2%) of participant made minor errors (LFN) on the 1-9AFB/100 field slides (Table 5).
According to IUATLD/WHO recommended grading of sputum smear microscopy results, 45 (55.5%) of the
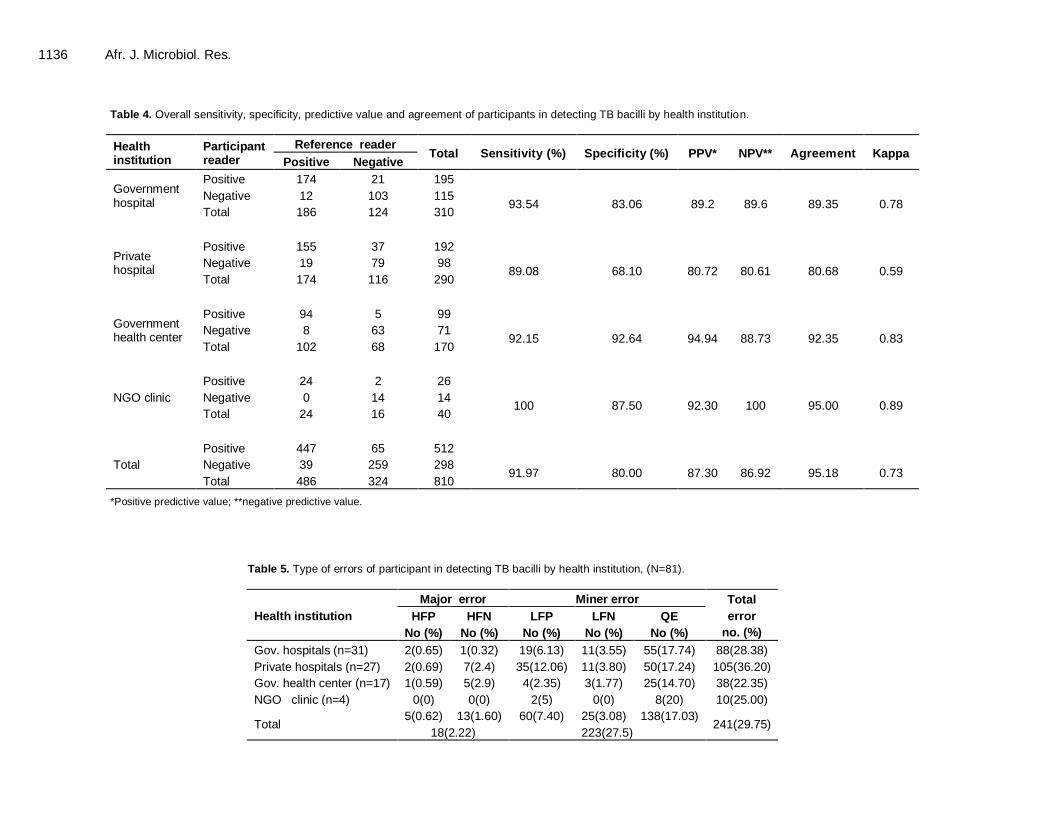
1136 Afr. J. Microbiol. Res.
Table 4. Overall sensitivity, specificity, predictive value and agreement of participants in detecting TB bacilli by health institution.
Health institution
Participant reader
Reference reader Total Sensitivity (%) Specificity (%) PPV* NPV** Agreement Kappa
Positive Negative
Government hospital
Positive 174 21 195
93.54
83.06
89.2
89.6
89.35
0.78 Negative 12 103 115
Total 186 124 310
Private hospital
Positive 155 37 192
89.08
68.10
80.72
80.61
80.68
0.59 Negative 19 79 98
Total 174 116 290
Government health center
Positive 94 5 99
92.15
92.64
94.94
88.73
92.35
0.83 Negative 8 63 71
Total 102 68 170
NGO clinic
Positive 24 2 26
100
87.50
92.30
100
95.00
0.89 Negative 0 14 14
Total 24 16 40
Total
Positive 447 65 512
91.97
80.00
87.30
86.92
95.18
0.73 Negative 39 259 298
Total 486 324 810
*Positive predictive value; **negative predictive value.
Table 5. Type of errors of participant in detecting TB bacilli by health institution, (N=81).
Health institution
Major error Miner error Total
error
no. (%)
HFP
No (%)
HFN
No (%)
LFP
No (%)
LFN
No (%)
QE
No (%)
Gov. hospitals (n=31) 2(0.65) 1(0.32) 19(6.13) 11(3.55) 55(17.74) 88(28.38)
Private hospitals (n=27) 2(0.69) 7(2.4) 35(12.06) 11(3.80) 50(17.24) 105(36.20)
Gov. health center (n=17) 1(0.59) 5(2.9) 4(2.35) 3(1.77) 25(14.70) 38(22.35)
NGO clinic (n=4) 0(0) 0(0) 2(5) 0(0) 8(20) 10(25.00)
Total 5(0.62) 13(1.60) 60(7.40) 25(3.08) 138(17.03)
241(29.75) 18(2.22) 223(27.5)
participants were rated as passed, 36 (44.5%) failed. Among 31 participants who worked at government hospital, 20 (64.8%) passed, 11 (35.5%) failed. Among participants who had TB microscopy in-service training, 27 (42.9%) passed, 36(57.1%) failed. However, there was no statistically significant difference in level of agreement based on training (Table 3). DISCUSSION Sputum smear examination is the most important test to diagnose a person infected with pulmonary TB. Although new diagnostic technologies were available, still microscopic examination of sputum smear was used in Ethiopia. Therefore, the skill of laboratory personals on AFB examination, seriously affect the case management of TB. Consequently, proficiency testing in sputum smear microscopy was essential for a successful TB control program (Ethiopian Health and Nutrition Research Institute, 2009).
Quality of AFB microscopy relies on national programs that support, train and monitor the testing performance of individual laboratories. It is well known that grave deficiencies can occur in the laboratory when insufficient attention is given to the quality of the work product. Many countries including Ethiopia, however, have no complete laboratory EQA program or do not provide sufficient administrative support and attention (John, 2002).
In this study, the overall sensitivity, specificity, PPV and NPV of participants in detecting TB bacilli were 91.97, 80.00, 87.30 and 86.92%, respectively. These findings were in agreement with a study conducted in northern Ethiopia, and elsewhere in the world (Mekete et al., 2011; Mundy et al., 2002; Rieder et al., 1997; Nguyen et al., 1999; Boulahbal et al., 1976; Selvakumar et al., 2005; Fadizilah et al., 2010). Low specificity in detection of TB bacilli indicates that there were many false positive results, that is, false diagnoses of uninfected individual. This can lead to exposure and wastage of treatment, unnecessary care as well as financial lose.
Our finding of an overall agreement on detection of TB bacilli with expertise reading was 95.18% (kappa = 0.73) which is defined as good agreement based on the Kappa index interpretation (Landis and Koch, 1977). It is known that sputum microscopy never reach 100% agreement in reading smear even among expertise (World Health Organization, 1998). The overall agreement in the current study was almost similar with findings with external quality assessment of national public health laboratories in Africa 2002–2009 (Mundy et al., 2002) also with study in Ethiopia (Mekete et al., 2011; Estifanos et al., 2005), 98% (Kappa = 0.85) and 88.2% in Malaysia (Fadzilah et al., 2013).
In the present study, major error were reported by 18 (2.22%) of participants, among these, 5 (0.62 %) were HFP. Even though the reading is lower than the national
Hailemariam et al. 1137 critical cut-off point of 2% set by the NTLCP (National Tuberculosis and Leprosy Control Programme,1999), the possible reason could be due to lack of knowledge in identifying AFB, work overload and carelessness of technicians in reading of smears. Similar finding was also reported from different study (Estifanos et al., 2005; Nguyen et al., 1999). On the other hand, HFN 13 (1.6%) result was also below the national threshold for corrective action (1.6 vs. 5%) (National Tuberculosis and Leprosy Control Programme, 1999). HFN indicate misclassi-fications that fundamentally change the disease classify-cation and management of a patient. The main drive of an EQA programme is to identify HFN which suggests that patients with TB case were not treated on time because of diagnosis error. HFN result in suffering due to the disease; further spread of TB and elevated transmitted rate in general population, in addition, patients may lose confidence in the health services or a particular laboratory. This finding was similar with Malaysia (Fadzilah et al., 2013). Even though the major error in relative term was little, but it does not mean the finding was insignificant; as the problem was major public health important in the area, further attention need to be paid (World Health Organization, 2002). Especially, HFN results were serious because positive persons went to the community without treatment so that it will increase the transmission of the disease drastically.
In this study, 27.5% minor error (LFP 7.4%, LFN 3.08% and QE 17.03%) rates were reported. This suggested that microscopist fail to detect slides with low AFB count (Trace and 1+ slide). Because of this, the dominant errors committed among technicians were QE and LFP. Even though quantification errors are minor importance, it does not influence case management. But this type of error can distinguish performances of laboratory personals. The possible reason for miss might be the laboratory personals not performing reading in all parts of the fields. On the other hand, as one of the minor error, QE of 17% in this study indicates possibility of microscopists not following the standard procedure for reading the smears. In the case of LFN, under-reading of number of AFB can give indication of problem areas in the diagnostic process. As a result, patients with bacillary disease may perhaps be misdiagnosed as negative results in AFB microscopy. In additions such type of error led to failures of WHOs strategy, so patients will not receive treatment on time, resulting in further community spread and failure in diagnosis of pulmonary TB. The consequence of LFP results in the beginning of treatment is unnecessary, also anti-tuberculosis drugs are wasted (John et al., 2012).
The limitation of this study is that we only used proficiency testing of slide reading using known panels to evaluate the skill of laboratory professionals under optimal conditions, rather than routine or day to day performance in the diagnosis of TB. Besides, we did not evaluate the performance of the laboratory personnel with regards to smearing, staining qualities and the post

1138 Afr. J. Microbiol. Res. analytical prospects like documentation of data. Findings and interpretations from this study were only applicable to the microscopists in the study area. Conclusion Even though the study revealed only 2.22% major error, the overall 29.75% error made due to minor errors are a great concern for countries like Ethiopia where most of the suspected TB cases may have miss diagnosed at the onset of disease. The country now have improved health facilities and better awareness for patients with suspected TB to look for treatment early, however it might not be identified by sputum smear microscopy if such errors are not solved on time. Conflict of interests The authors did not declare any conflict of interest. REFERENCES Boulahbal F, Mazouni L, Chaulet P (1976). Prospective study of the
organization and supervision of the bacteriologic diagnosis of pulmonary tuberculosis in a case finding network in Algeria. Bull. Int. Union Tuberc. 51: 313–321.
Estifanos B, Mohammed A, Bernt L (2005). Quality control of sputum microscopic examinations for acid fast bacilli in Southern Ethiopia. Ethiop. J. Health Dev. 19 (2):104-108.
Ethiopian Health & Nutrition Research Institute (EHNRI) (2009). Laboratory Network Guidelines for Quality Assurance of Smear Microscopy for Tuberculosis Diagnosis. Addis Ababa, Ethiopia.
Ethiopian Health and Nutrition Research Institute and Ministry Of Health (2008). Ethiopian Guideline of quality assurance of smear microscopy for TB diagnosis. Addis Ababa, Ethiopia.
Fadzilah K, Ganeswrie R, Loe YK, Teh CH, Suzana H (2013). The Proficiency Level of Microscopists Detecting Mycobacterium tuberculosis at Government Health Clinics in Three Selected States
of Malaysia, 2009-2010. OSIR 6(3):11-17. Jakes R, Joyce M (2001). Guideline for Implementing Proficiency
testing for TB smear microscopy in the Northern province, South
Africa;ISBN:1-919743-62-6;October 2001, available at www.hst.org.za
John F, Olga P, Vivian F et al. (2012). External quality assessment of
national public health laboratories in Africa, 2002–2009. Bull World Health Organ 2012; 90:191–199A | doi:10.2471/BLT.11.091876
John R (2002). Public Health Practice Program Office Centers for
Disease Control and Prevention EQA for AFB smear microscopy. Landis GR, Koch GG (1977). A one way component of variance model
for categorical data. Biometrics 33:671-679.
Mekete M, Kassu D, Getachew B, Ibrahim A (2011). Quality
performance Evaluation of Laboratories on AFB smears Microscopy in Eastern Amhara Region, Ethiopia. Addis Ababa University
Libraries Electronic Thesis and Dissertations: AAU-ETD. Mundy C, Harries A, Banerjee A, Salaniponi F, Gilks C, Squire S
(2002). Quality assessment of sputum transportation, smear
preparation and AFB microscopy in a rural district in Malawi. Int. J. Tuberc. Lung Dis. 6 (1):47-54.
National Tuberculosis and Leprosy Control Programme (1999). Manual
for Laboratory Technicians. NTLCP, Addis Ababa, Ethiopia. Nguyen TNL, Wells CD, Binkin NJ, Pham DL, Nguyen VC (1999).The
importance of quality control of sputum smear microscopy: the effect
of reading errors on treatment decisions and outcomes. Int. J. Tuberc. Lung Dis. 3: 483-487.
Rieder H, Arnadottir T, Tardencilla Guttierrez A (1997). Evaluation of a
standardized recording tool for sputum smear microscopy for acid-fast bacilli under routine conditions in low income countries. Int. J. Tuberc. Lung Dis. 1:339-345.
Selvakumar N, Vanaja K, Gopi Sivagamasundari PGS, Prabhakaran E, Samuel V, Narayanan PR (2005). Proficiency to read sputum AFB smears by senior tuberculosis laboratory supervisors under training
at a reference laboratory in India. Indian J. Tuberc. 52:11-14 World Health Organization (1998). Laboratoty service in tuberculosis
control part 1; organization and management.
http://whqlibdoc.who.int/hq/1998/8.258_(part1).pdf World Health Organization (2006). Strategic approach for strengthening
of laboratory services for tuberculosis control, 2006-2009. Geneva,
Switzerland: World Health organization. World Health Organization (2011). Global tuberculosis control report.
WHO report 2011. Geneva, Switzerland: WHO.
WHO/HTM/TB/201116. World Health Organization (WHO) (2002). Association of Public Health
Laboratory(APHL), Center for Disease Control (CDC), international
union Against Tuberculosis and Lung Disease: External quality assessment for AFB smear microscopy Washington DC: association of Public health laboratories.
World Health Organization: Stop TB strategy: building on and enhancing DOTS to meet the TB -related millenium development goals. Geneva, Switzerland: World Health organization; 2006.
Vol. 9(16), pp. 1139-1149, 22 April, 2015
DOI: 10.5897/AJMR2015.7456
Article Number: 7E820E052661
ISSN 1996-0808
Copyright © 2015
Author(s) retain the copyright of this article http://www.academicjournals.org/AJMR
African Journal of Microbiology Research
Full Length Research Paper
Biosynthesis of indole-3-acetic acid by plant growth promoting rhizobacteria, Klebsiella pneumonia, Bacillus amyloliquefaciens and Bacillus subtilis
Vijendra Kumar Mishra* and Ashok Kumar
Microbial Biotechnology Unit, School of Biotechnology, Faculty of Science, Banaras Hindu University, Varanasi-221005, (U.P), India.
Received 28 February, 2015; Accepted 13 April, 2015
Indole-3-acetic acid biosynthetic activity of Klebsiella pneumonia, strain MR-M1, Bacillus amyloliquefaciens strain MR-AI, four Bacillus sp. strain MR-SP, RR-R2, WR-W2 and MR-Z1 were investigated. Here, the authors demonstrated the effect of carbon sources, amino acids, vitamins and abiotic stress on the indole-3-acetic acid (IAA) production level under in vitro condition by the six strains. The culture medium was exogenously supplemented with L-tryptophan (200 μg/ml) and incubated for 96 h. IAA biosynthesis was further confirmed by indole-3-pyruvate decarboxylase encoding ipdc gene amplification. Succinate followed by acetate followed by malate was observed as the most preferred carbon source for IAA production. Stimulation of IAA production at pH 6.0, 0.1% salinity and 32°C temperature after 96 h of growth in presence of L-tryptophan was observed. The highest amount of IAA production was observed in strain MR-M1 followed by WR-W2. Decreasing trend of IAA levels was observed in the presence of vitamins and amino acids as compared to the control. The amplicon of 250 bp was observed in all the six rhizospheric strains. Taken together, the result shows that L-tryptophan stimulates IAA production and strain MR-M1 was observed as the most efficient IAA producing rhizospheric bacteria. Key words: L-tryptophan, indole-3-acetic acid, plant growth promoting rhizobacteria, indole pyruvate decarboxylase.
INTRODUCTION Rhizospheric colonization of cereal crop plants and plant growth promoting activity involving indole-3-acetic acid (IAA) production by Klebsiella sp. and Bacillus sp. has been well documented (El-khawas and Adachi, 1999; Mishra and Kumar, 2012; Saharan and Nehra, 2011). Phytohormone, especially auxin indole-3-acetic acid plays important role in the plant growth regulation as cell
enlargement, cell division, cell elongation and root initiation by tryptophan dependent and independent pathways (Woodward and Bartel, 2005). Rhizosphere is a site with complex interactions between the root and associated microorganisms with high microbial diversity (Saharan and Nehra, 2011). Microbial population in rhizospheric soil is physiologically more active, as
*Corresponding author. E-mail: [email protected]. Tel: +91- 0542-2368331/6701593. Fax: +91- 0542-2368693/236817. Author(s) agree that this article remains permanently open access under the terms of the Creative Commons Attribution License 4.0 International License
1140 Afr. J. Microbiol. Res. the nutritional substance is released by the root and its surfaces. Rhizospheric microorganisms are considered as labile source of nutrients such as B-vitamins, amino acids, tryptamine, soluble root exudates, carbon sources and organic matter (Saharan and Nehra, 2011; Sainio et al., 1996; Ahemad et al., 2013; Barraquio et al., 2000). The role and metabolism of IAA in Gram-negative bacteria is well documented, but little is known about IAA biosynthesis and regulation in Gram-positive bacteria (Saharan and Nehra, 2011; Sainio et al., 1996; Ahemad et al., 2013,). L-tryptophan serves as a physiological precursor for biosynthesis of IAA in plants and in microbes (Woodward and Bartel, 2005).
IAA is a
secondary metabolite produced in early stationary phase of growth. Synthesis of IAA depends on environmental conditions, availability, uptake and rate of deamination of precursor, the types of soil nutrients, metabolites released and the preferred pathways involved (Spaepen et al., 2007; Woodward and Bartel, 2005). Soil pH, temperature and salinity condition are crucial for attachment and spread of the microbes (Strzelczyk et al., 1994; Dobbereinere et al., 2001). Moreover, L-tryptophan dependent biosynthesis of IAA involving ipdc, indole-3-acetamide (iam) and indole-3-acetonitrile (ian) gene has been well documented in plant growth promoting rhizobacteria (PGPR) (Duca et al., 2014). Although, the complete mechanism involved in the biosynthesis of IAA is poorly understood.
Reports suggest that most plant associated microorga-nism might have cellulase activity for adoption or establishment of a plant microbe interaction. Cellulase activities have seen in many N2 fixing bacteria such as Bacillus spharricus, Bacillus circulans, Paenibacillus azotofixans and Azospirillum (Emtiazi et al., 2007). Moreover, recent study reveals cellulase production by the Bacillus subtilis (Femi-Ola and Aderibigbe, 2008). Indole pyruvate decarboxylase encoding ipdc gene acts as key modulator for IAA production, which catalyses formation of indole-3-acetaldehyde from indole-3-pyruvic acid in Klebsiella pneumonia and Bacillus sp. (El-khawas and Adachi, 1999; Idris et al., 2002). The 16S rRNA gene (1.5 Kb) sequence involves identification of bacteria upto genus level on the basis of highly conserved sequences (Elgaml et al., 2013).
Literature showed that the
hypervariable regions V2 and V3 contain the maximum degree of nucleotide heterogeneity and the maximum discriminatory power for the bacterial species identification (Baker et al., 2003; Chakravorty et al., 2007).
After thorough review of literature, it appears that
the rhizospheric bacteria are of great relevance in terms of agricultural productivity. The present study was aimed to demonstrate IAA production capability of most efficient isolates under various physiological conditions. To replace costlier and hazardous chemically synthesized fertilizers, application of efficient PGPR as biofertilizer can bridge the gap. Many workers have acknowledged the role of PGPR and significant advancements have
been made in this interesting area of research but there are still gaps left especially on molecular aspect, which needs further study.
MATERIALS AND METHODS
Sample collection, culture media and incubation condition
To isolate most efficient IAA producing PGPR, soil samples were collected from rice, (RR-R2) wheat (WR-W2) and maize (MR-M1, MR-SP, MR-MZ and MR-AI) agricultural field of Banaras Hindu University, Varanasi, Uttar Pradesh, India. 1 kg rhizospheric soil sample were brought to the laboratory in the sterile polythene bags.
Isolation of bacteria from rhizospheric soil was performed, following the standard microbiological methods of Barraquio et al. (2000). One gram of rhizospheric soil of each sample were suspended in 10 ml sterilized double distilled water (DDW) separately and serially diluted in 50 ml Borosil glass tubes, up to 10 dilutions with three replicates. The soil suspension obtained was used to pour onto dextrose, yeast, glutamate medium (DYGS), agar-agar solid plate containing dextrose 1.0 g/L, yeast extract 2.0 g/L, glutamate 1.5 g/L, peptone 1.5 g/L, K2HPO4 0.5 g/L, MgSO4.7H2O 0.5 g/L, pH 6.0 (Kirchhof et al., 2001). 100 μl inoculums were taken from 10
-1 to 10
-
10 dilutions and plated onto both solid culture plates in duplicate set,
incubated at 32°C for 24 h. Pure culture was isolated from rice, wheat and maize soil samples by streaking three to four times repeated subculture on the fresh slightly modified Johanna Nitrogen fixing bacteria (JNFb) agar-agar medium containing malic acid 5.0 g/L, K2HPO4 0.60 g/L, KH2PO4 1.80 g/L, MgSO47H2O 0.20 g/L, NaCl 0.10 g/L, CaCl2.2H2O 0.20G g/L, Na2MoO4.2H2O 0.002 g/L, KOH
4.5 g/L, Fe.-EDTA (1.4%) 4.0 ml and NH4Cl, 2.5 mM at pH 5.8 (Dobereiner, 1995). pH was maintained at 5.8 with the help of KOH and HCl by cyberscan ph ion 510 bench pH/ion/mv emter (Eutech instruments Pvt Ltd, Singapore). Six most efficient IAA producing rhizospheric bacteria were selected for plant growth promoting activity study namely MR-M1, MR-SP, MR-Z1, MR-AI, WR-W2 and RR-R2. All the selected strains were repeatedly subcultured and maintained onto JNFb solid plate.
Quantitative estimation of IAA
Quantitative estimation of IAA was performed according to the colorimetric assay of Gordon and Weber (1951). Culture was grown in JNFb liquid medium additionally supplemented with tryptophan (200 µg/ml). Equal volume of inoculation was made (1/10th) in inoculums coming from the same medium grown culture and
incubated in shaking conditions at 100 rev/min for 72-96 h. 1.5 ml culture was harvested via centrifugation at 8000 rpm for 5 min. 1.0 ml supernatant were collected and added with 2 ml IAA test reagent, that is, Salkowski reagent containing 1.0 ml of 0.5 M of FeCl3 in 50 ml of 35% HClO4 (Yamada et al., 1990). Appearance of pink color indicates presence of IAA and absorbance was recorded at 530 nm in UV spectrophotometer. Culture medium without tryptophan was maintained as control for each isolate. The concentration of IAA produced was estimated using a standard prepared separately with pure IAA (Loba, India). Estimation of IAA was carried out after the incubation of 96 h at 32°C in triplicate set. Effect of carbon sources on IAA production
Estimation of IAA production was checked in JNFb medium, where
malate was replaced by eleven different carbon source such as ribose (0.1%), mannitol (1%), malate (0.5%), sucrose (0.5%),
glucose (0.5%), succinate (0.5%), sorbitol (1.0%), maltose (0.5%), fructose (1.0%), sodium acetate (0.5%), dextrose (0.5%) exoge-
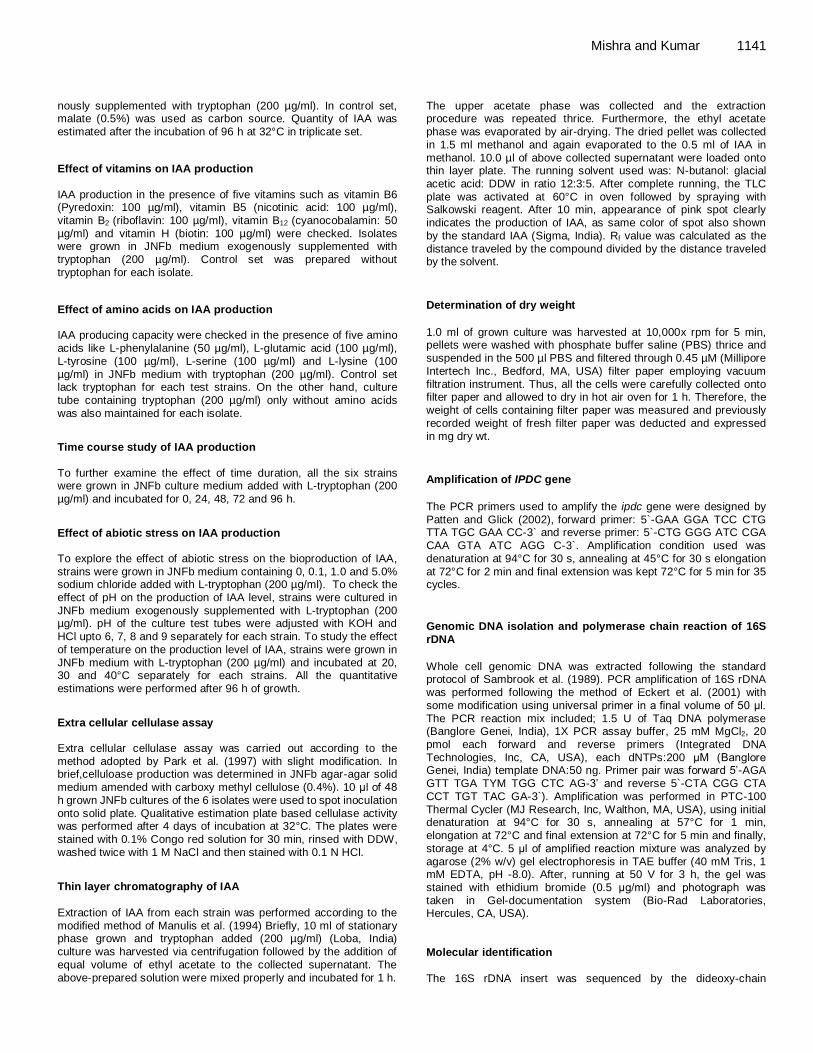
nously supplemented with tryptophan (200 µg/ml). In control set, malate (0.5%) was used as carbon source. Quantity of IAA was estimated after the incubation of 96 h at 32°C in triplicate set. Effect of vitamins on IAA production
IAA production in the presence of five vitamins such as vitamin B6 (Pyredoxin: 100 µg/ml), vitamin B5 (nicotinic acid: 100 µg/ml), vitamin B2 (riboflavin: 100 µg/ml), vitamin B12 (cyanocobalamin: 50 µg/ml) and vitamin H (biotin: 100 µg/ml) were checked. Isolates were grown in JNFb medium exogenously supplemented with tryptophan (200 µg/ml). Control set was prepared without tryptophan for each isolate. Effect of amino acids on IAA production
IAA producing capacity were checked in the presence of five amino acids like L-phenylalanine (50 µg/ml), L-glutamic acid (100 µg/ml), L-tyrosine (100 µg/ml), L-serine (100 µg/ml) and L-lysine (100 µg/ml) in JNFb medium with tryptophan (200 µg/ml). Control set lack tryptophan for each test strains. On the other hand, culture tube containing tryptophan (200 µg/ml) only without amino acids was also maintained for each isolate.
Time course study of IAA production
To further examine the effect of time duration, all the six strains were grown in JNFb culture medium added with L-tryptophan (200
µg/ml) and incubated for 0, 24, 48, 72 and 96 h.
Effect of abiotic stress on IAA production
To explore the effect of abiotic stress on the bioproduction of IAA, strains were grown in JNFb medium containing 0, 0.1, 1.0 and 5.0% sodium chloride added with L-tryptophan (200 µg/ml). To check the effect of pH on the production of IAA level, strains were cultured in
JNFb medium exogenously supplemented with L-tryptophan (200 µg/ml). pH of the culture test tubes were adjusted with KOH and HCl upto 6, 7, 8 and 9 separately for each strain. To study the effect of temperature on the production level of IAA, strains were grown in JNFb medium with L-tryptophan (200 µg/ml) and incubated at 20, 30 and 40°C separately for each strains. All the quantitative estimations were performed after 96 h of growth.
Extra cellular cellulase assay
Extra cellular cellulase assay was carried out according to the method adopted by Park et al. (1997) with slight modification. In brief,celluloase production was determined in JNFb agar-agar solid medium amended with carboxy methyl cellulose (0.4%). 10 μl of 48 h grown JNFb cultures of the 6 isolates were used to spot inoculation onto solid plate. Qualitative estimation plate based cellulase activity was performed after 4 days of incubation at 32°C. The plates were
stained with 0.1% Congo red solution for 30 min, rinsed with DDW, washed twice with 1 M NaCl and then stained with 0.1 N HCl.
Thin layer chromatography of IAA Extraction of IAA from each strain was performed according to the modified method of Manulis et al. (1994) Briefly, 10 ml of stationary phase grown and tryptophan added (200 µg/ml) (Loba, India)
culture was harvested via centrifugation followed by the addition of equal volume of ethyl acetate to the collected supernatant. The above-prepared solution were mixed properly and incubated for 1 h.
Mishra and Kumar 1141 The upper acetate phase was collected and the extraction procedure was repeated thrice. Furthermore, the ethyl acetate phase was evaporated by air-drying. The dried pellet was collected in 1.5 ml methanol and again evaporated to the 0.5 ml of IAA in methanol. 10.0 µl of above collected supernatant were loaded onto thin layer plate. The running solvent used was: N-butanol: glacial acetic acid: DDW in ratio 12:3:5. After complete running, the TLC plate was activated at 60°C in oven followed by spraying with
Salkowski reagent. After 10 min, appearance of pink spot clearly indicates the production of IAA, as same color of spot also shown by the standard IAA (Sigma, India). Rf value was calculated as the distance traveled by the compound divided by the distance traveled by the solvent.
Determination of dry weight
1.0 ml of grown culture was harvested at 10,000x rpm for 5 min, pellets were washed with phosphate buffer saline (PBS) thrice and suspended in the 500 µl PBS and filtered through 0.45 µM (Millipore Intertech Inc., Bedford, MA, USA) filter paper employing vacuum filtration instrument. Thus, all the cells were carefully collected onto filter paper and allowed to dry in hot air oven for 1 h. Therefore, the weight of cells containing filter paper was measured and previously recorded weight of fresh filter paper was deducted and expressed in mg dry wt.
Amplification of IPDC gene
The PCR primers used to amplify the ipdc gene were designed by Patten and Glick (2002),
forward primer: 5`-GAA GGA TCC CTG
TTA TGC GAA CC-3` and reverse primer: 5`-CTG GGG ATC CGA CAA GTA ATC AGG C-3`. Amplification condition used was denaturation at 94°C for 30 s, annealing at 45°C for 30 s elongation at 72°C for 2 min and final extension was kept 72°C for 5 min for 35 cycles.
Genomic DNA isolation and polymerase chain reaction of 16S
rDNA
Whole cell genomic DNA was extracted following the standard protocol of Sambrook et al. (1989). PCR amplification of 16S rDNA was performed following the method of Eckert et al. (2001) with some modification using universal primer in a final volume of 50 μl. The PCR reaction mix included; 1.5 U of Taq DNA polymerase (Banglore Genei, India), 1X PCR assay buffer, 25 mM MgCl2, 20 pmol each forward and reverse primers (Integrated DNA Technologies, Inc, CA, USA), each dNTPs:200 μM (Banglore Genei, India) template DNA:50 ng. Primer pair was forward 5’-AGA GTT TGA TYM TGG CTC AG-3’ and reverse 5`-CTA CGG CTA CCT TGT TAC GA-3`). Amplification was performed in PTC-100 Thermal Cycler (MJ Research, Inc, Walthon, MA, USA), using initial denaturation at 94°C for 30 s, annealing at 57°C for 1 min,
elongation at 72°C and final extension at 72°C for 5 min and finally, storage at 4°C. 5 μl of amplified reaction mixture was analyzed by agarose (2% w/v) gel electrophoresis in TAE buffer (40 mM Tris, 1 mM EDTA, pH -8.0). After, running at 50 V for 3 h, the gel was stained with ethidium bromide (0.5 μg/ml) and photograph was taken in Gel-documentation system (Bio-Rad Laboratories, Hercules, CA, USA). Molecular identification The 16S rDNA insert was sequenced by the dideoxy-chain
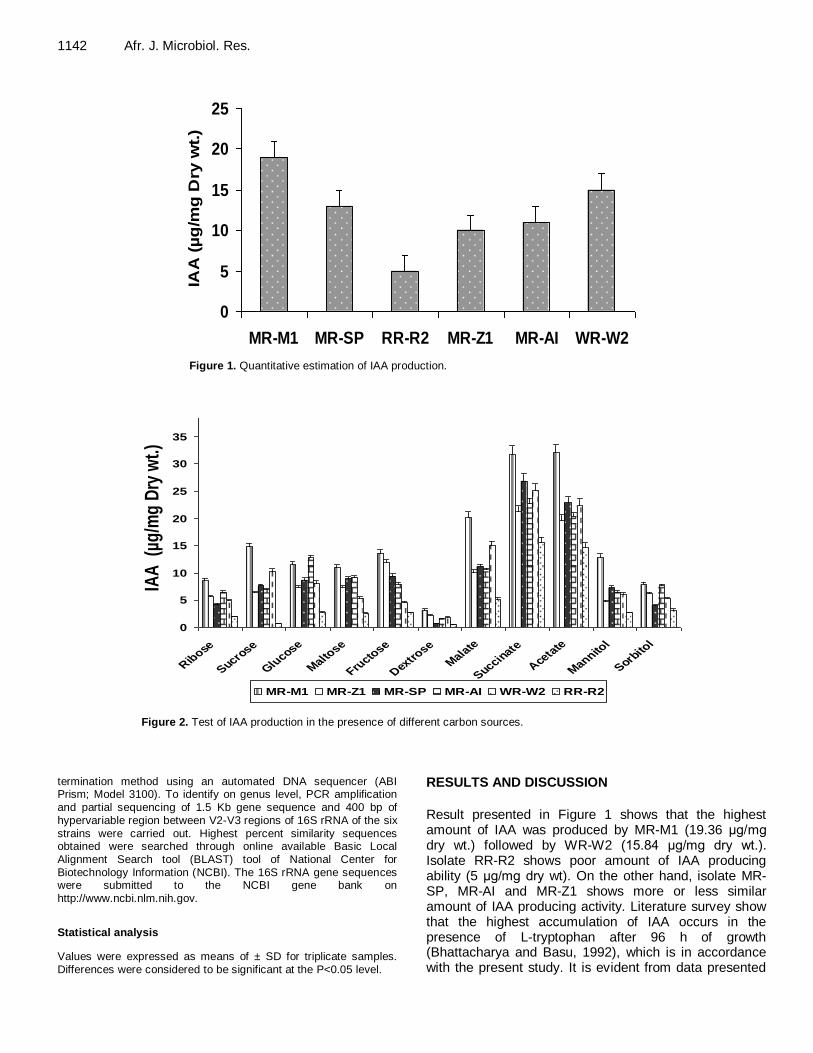
1142 Afr. J. Microbiol. Res.
Figure 1. Quantitative estimation of IAA production.
Figure 2. Test of IAA production in the presence of different carbon sources.
termination method using an automated DNA sequencer (ABI Prism; Model 3100). To identify on genus level, PCR amplification and partial sequencing of 1.5 Kb gene sequence and 400 bp of hypervariable region between V2-V3 regions of 16S rRNA of the six
strains were carried out. Highest percent similarity sequences obtained were searched through online available Basic Local Alignment Search tool (BLAST) tool of National Center for Biotechnology Information (NCBI). The 16S rRNA gene sequences were submitted to the NCBI gene bank on http://www.ncbi.nlm.nih.gov.
Statistical analysis
Values were expressed as means of ± SD for triplicate samples. Differences were considered to be significant at the P<0.05 level.
RESULTS AND DISCUSSION
Result presented in Figure 1 shows that the highest amount of IAA was produced by MR-M1 (19.36 μg/mg dry wt.) followed by WR-W2 (15.84 μg/mg dry wt.). Isolate RR-R2 shows poor amount of IAA producing ability (5 μg/mg dry wt). On the other hand, isolate MR-SP, MR-AI and MR-Z1 shows more or less similar amount of IAA producing activity. Literature survey show that the highest accumulation of IAA occurs in the presence of L-tryptophan after 96 h of growth (Bhattacharya and Basu, 1992), which is in accordance with the present study. It is evident from data presented
0
5
10
15
20
25
MR-M1 MR-SP RR-R2 MR-Z1 MR-AI WR-W2
IAA
(µ
g/m
g D
ry w
t.)
0
5
10
15
20
25
30
35
40
Ribose
Sucrose
Glucose
Malto
se
Fructo
se
Dextro
se
Mala
te
Succinate
Aceta
te
Mannito
l
Sorbito
l
IAA
(µg
/mg
Dry
wt.
)
MR-M1 MR-Z1 MR-SP MR-AI WR-W2 RR-R2
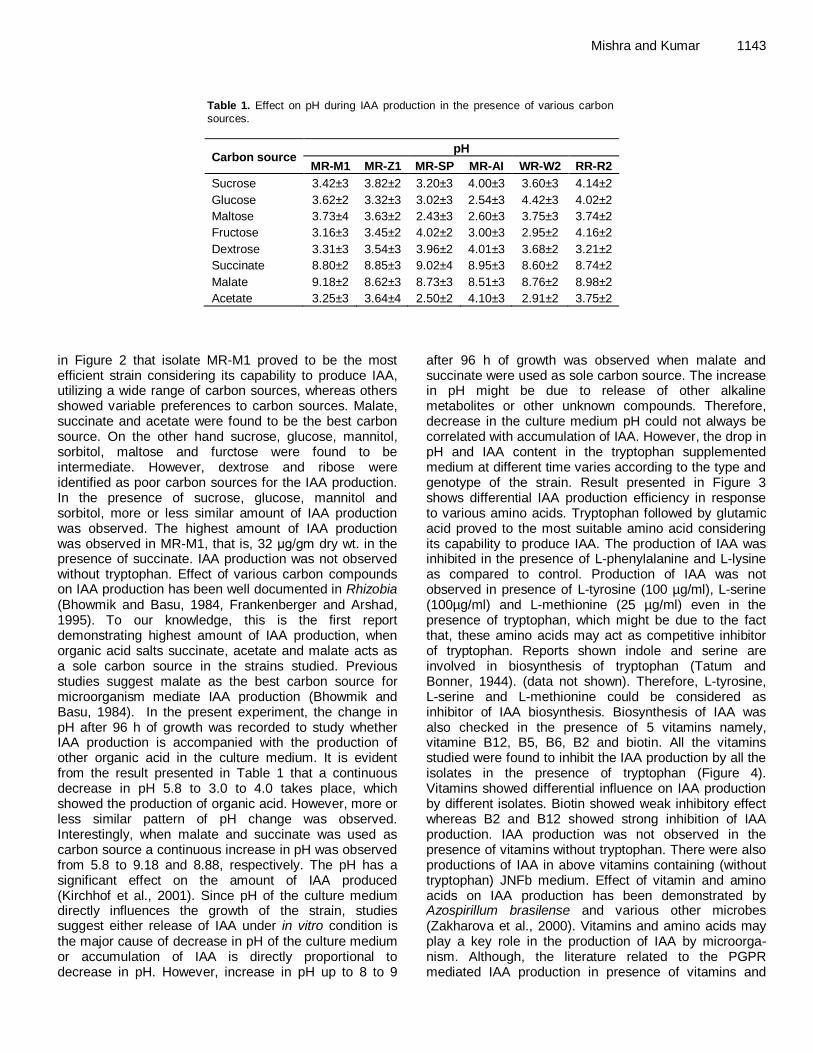
Mishra and Kumar 1143
Table 1. Effect on pH during IAA production in the presence of various carbon sources.
Carbon source pH
MR-M1 MR-Z1 MR-SP MR-AI WR-W2 RR-R2
Sucrose 3.42±3 3.82±2 3.20±3 4.00±3 3.60±3 4.14±2
Glucose 3.62±2 3.32±3 3.02±3 2.54±3 4.42±3 4.02±2
Maltose 3.73±4 3.63±2 2.43±3 2.60±3 3.75±3 3.74±2
Fructose 3.16±3 3.45±2 4.02±2 3.00±3 2.95±2 4.16±2
Dextrose 3.31±3 3.54±3 3.96±2 4.01±3 3.68±2 3.21±2
Succinate 8.80±2 8.85±3 9.02±4 8.95±3 8.60±2 8.74±2
Malate 9.18±2 8.62±3 8.73±3 8.51±3 8.76±2 8.98±2
Acetate 3.25±3 3.64±4 2.50±2 4.10±3 2.91±2 3.75±2
in Figure 2 that isolate MR-M1 proved to be the most efficient strain considering its capability to produce IAA, utilizing a wide range of carbon sources, whereas others showed variable preferences to carbon sources. Malate, succinate and acetate were found to be the best carbon source. On the other hand sucrose, glucose, mannitol, sorbitol, maltose and furctose were found to be intermediate. However, dextrose and ribose were identified as poor carbon sources for the IAA production. In the presence of sucrose, glucose, mannitol and sorbitol, more or less similar amount of IAA production was observed. The highest amount of IAA production was observed in MR-M1, that is, 32 μg/gm dry wt. in the presence of succinate. IAA production was not observed without tryptophan. Effect of various carbon compounds on IAA production has been well documented in Rhizobia (Bhowmik and Basu, 1984, Frankenberger and Arshad, 1995).
To our knowledge, this is the first report
demonstrating highest amount of IAA production, when organic acid salts succinate, acetate and malate acts as a sole carbon source in the strains studied. Previous studies suggest malate as the best carbon source for microorganism mediate IAA production (Bhowmik and Basu, 1984). In the present experiment, the change in pH after 96 h of growth was recorded to study whether IAA production is accompanied with the production of other organic acid in the culture medium. It is evident from the result presented in Table 1 that a continuous decrease in pH 5.8 to 3.0 to 4.0 takes place, which showed the production of organic acid. However, more or less similar pattern of pH change was observed. Interestingly, when malate and succinate was used as carbon source a continuous increase in pH was observed from 5.8 to 9.18 and 8.88, respectively. The pH has a significant effect on the amount of IAA produced (Kirchhof et al., 2001). Since pH of the culture medium directly influences the growth of the strain, studies suggest either release of IAA under in vitro condition is the major cause of decrease in pH of the culture medium or accumulation of IAA is directly proportional to decrease in pH. However, increase in pH up to 8 to 9
after 96 h of growth was observed when malate and succinate were used as sole carbon source. The increase in pH might be due to release of other alkaline metabolites or other unknown compounds. Therefore, decrease in the culture medium pH could not always be correlated with accumulation of IAA. However, the drop in pH and IAA content in the tryptophan supplemented medium at different time varies according to the type and genotype of the strain. Result presented in Figure 3 shows differential IAA production efficiency in response to various amino acids. Tryptophan followed by glutamic acid proved to the most suitable amino acid considering its capability to produce IAA. The production of IAA was inhibited in the presence of L-phenylalanine and L-lysine as compared to control. Production of IAA was not observed in presence of L-tyrosine (100 µg/ml), L-serine (100µg/ml) and L-methionine (25 µg/ml) even in the presence of tryptophan, which might be due to the fact that, these amino acids may act as competitive inhibitor of tryptophan. Reports shown indole and serine are involved in biosynthesis of tryptophan (Tatum and Bonner, 1944). (data not shown). Therefore, L-tyrosine, L-serine and L-methionine could be considered as inhibitor of IAA biosynthesis. Biosynthesis of IAA was also checked in the presence of 5 vitamins namely, vitamine B12, B5, B6, B2 and biotin. All the vitamins studied were found to inhibit the IAA production by all the isolates in the presence of tryptophan (Figure 4). Vitamins showed differential influence on IAA production by different isolates. Biotin showed weak inhibitory effect whereas B2 and B12 showed strong inhibition of IAA production. IAA production was not observed in the presence of vitamins without tryptophan. There were also productions of IAA in above vitamins containing (without tryptophan) JNFb medium. Effect of vitamin and amino acids on IAA production has been demonstrated by Azospirillum brasilense and various other microbes (Zakharova et al., 2000). Vitamins and amino acids may play a key role in the production of IAA by microorga-nism. Although, the literature related to the PGPR mediated IAA production in presence of vitamins and
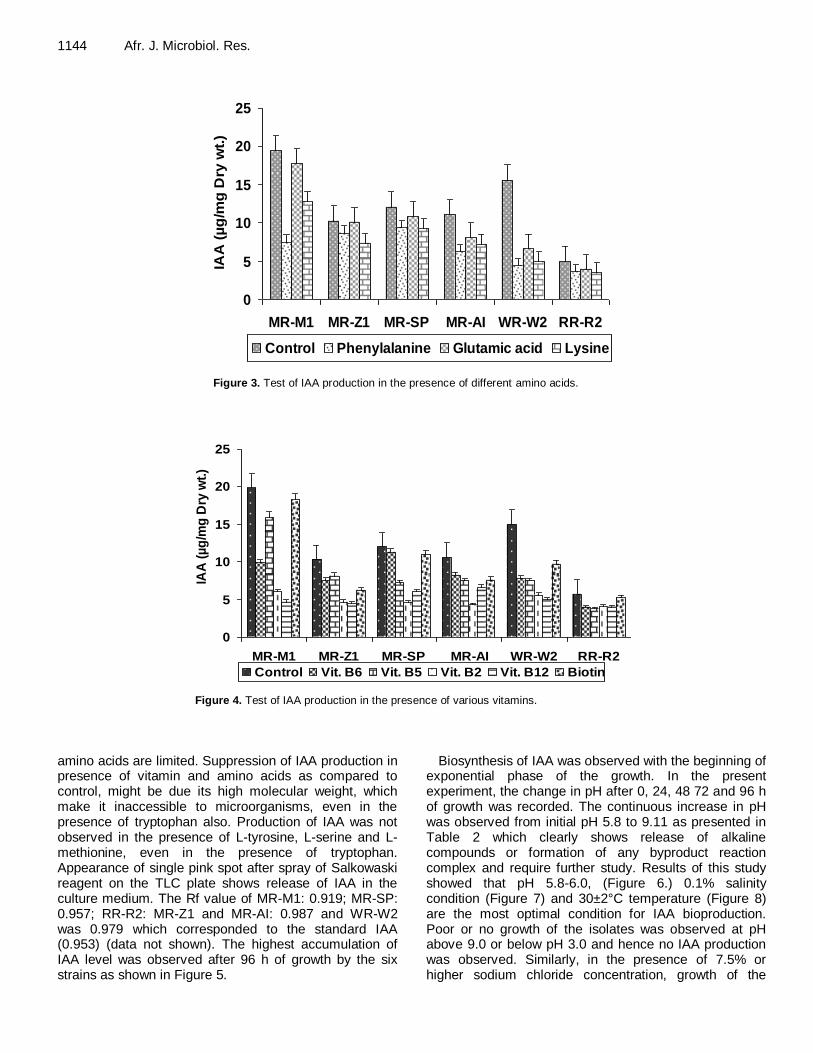
1144 Afr. J. Microbiol. Res.
Figure 3. Test of IAA production in the presence of different amino acids.
Figure 4. Test of IAA production in the presence of various vitamins.
amino acids are limited. Suppression of IAA production in presence of vitamin and amino acids as compared to control, might be due its high molecular weight, which make it inaccessible to microorganisms, even in the presence of tryptophan also. Production of IAA was not observed in the presence of L-tyrosine, L-serine and L-methionine, even in the presence of tryptophan. Appearance of single pink spot after spray of Salkowaski reagent on the TLC plate shows release of IAA in the culture medium. The Rf value of MR-M1: 0.919; MR-SP: 0.957; RR-R2: MR-Z1 and MR-AI: 0.987 and WR-W2 was 0.979 which corresponded to the standard IAA (0.953) (data not shown). The highest accumulation of IAA level was observed after 96 h of growth by the six strains as shown in Figure 5.
Biosynthesis of IAA was observed with the beginning of exponential phase of the growth. In the present experiment, the change in pH after 0, 24, 48 72 and 96 h of growth was recorded. The continuous increase in pH was observed from initial pH 5.8 to 9.11 as presented in Table 2 which clearly shows release of alkaline compounds or formation of any byproduct reaction complex and require further study. Results of this study showed that pH 5.8-6.0, (Figure 6.) 0.1% salinity condition (Figure 7) and 30±2°C temperature (Figure 8) are the most optimal condition for IAA bioproduction. Poor or no growth of the isolates was observed at pH above 9.0 or below pH 3.0 and hence no IAA production was observed. Similarly, in the presence of 7.5% or higher sodium chloride concentration, growth of the
0
5
10
15
20
25
MR-M1 MR-Z1 MR-SP MR-AI WR-W2 RR-R2
IAA
(µ
g/m
g D
ry w
t.)
Control Phenylalanine Glutamic acid Lysine
0
5
10
15
20
25
MR-M1 MR-Z1 MR-SP MR-AI WR-W2 RR-R2
IAA
(µ
g/m
g D
ry w
t.)
Control Vit. B6 Vit. B5 Vit. B2 Vit. B12 Biotin
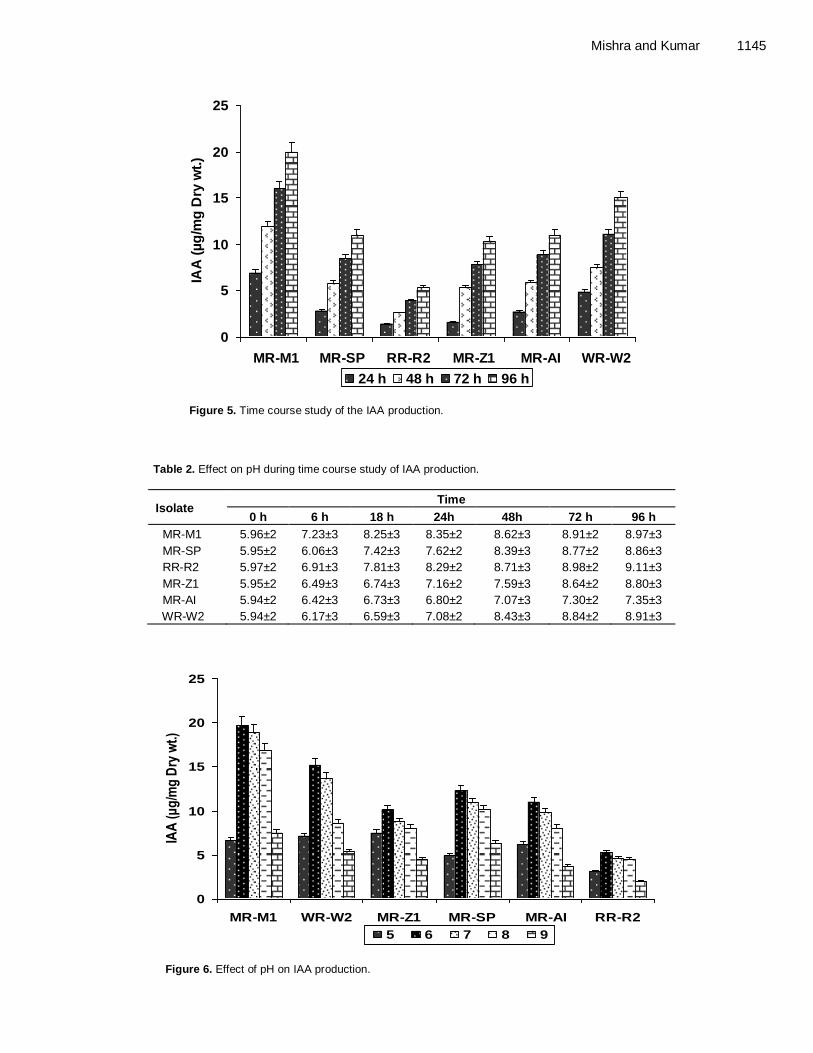
Mishra and Kumar 1145
Figure 5. Time course study of the IAA production.
Table 2. Effect on pH during time course study of IAA production.
Isolate Time
0 h 6 h 18 h 24h 48h 72 h 96 h
MR-M1 5.96±2 7.23±3 8.25±3 8.35±2 8.62±3 8.91±2 8.97±3
MR-SP 5.95±2 6.06±3 7.42±3 7.62±2 8.39±3 8.77±2 8.86±3
RR-R2 5.97±2 6.91±3 7.81±3 8.29±2 8.71±3 8.98±2 9.11±3
MR-Z1 5.95±2 6.49±3 6.74±3 7.16±2 7.59±3 8.64±2 8.80±3
MR-AI 5.94±2 6.42±3 6.73±3 6.80±2 7.07±3 7.30±2 7.35±3
WR-W2 5.94±2 6.17±3 6.59±3 7.08±2 8.43±3 8.84±2 8.91±3
Figure 6. Effect of pH on IAA production.
0
5
10
15
20
25
MR-M1 MR-SP RR-R2 MR-Z1 MR-AI WR-W2
IAA
(µ
g/m
g D
ry w
t.)
24 h 48 h 72 h 96 h
0
5
10
15
20
25
MR-M1 WR-W2 MR-Z1 MR-SP MR-AI RR-R2
IAA
(μg
/mg
Dry
wt.)
5 6 7 8 9
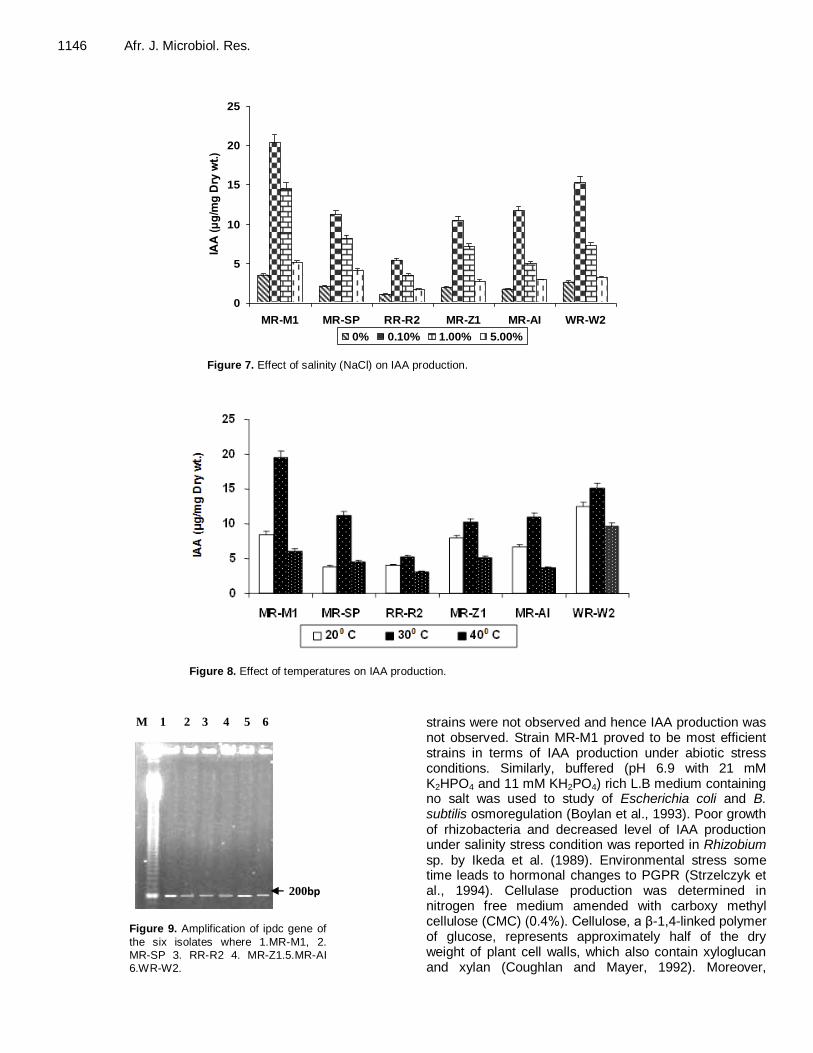
1146 Afr. J. Microbiol. Res.
Figure 7. Effect of salinity (NaCl) on IAA production.
Figure 8. Effect of temperatures on IAA production.
Figure 9. Amplification of ipdc gene of
the six isolates where 1.MR-M1, 2.
MR-SP 3. RR-R2 4. MR-Z1.5.MR-AI 6.WR-W2.
strains were not observed and hence IAA production was not observed. Strain MR-M1 proved to be most efficient strains in terms of IAA production under abiotic stress conditions. Similarly, buffered (pH 6.9 with 21 mM K2HPO4 and 11 mM KH2PO4) rich L.B medium containing no salt was used to study of Escherichia coli and B. subtilis osmoregulation (Boylan et al., 1993). Poor growth of rhizobacteria and decreased level of IAA production under salinity stress condition was reported in Rhizobium sp. by Ikeda et al. (1989). Environmental stress some time leads to hormonal changes to PGPR (Strzelczyk et al., 1994). Cellulase production was determined in nitrogen free medium amended with carboxy methyl cellulose (CMC) (0.4%). Cellulose, a β-1,4-linked polymer of glucose, represents approximately half of the dry weight of plant cell walls, which also contain xyloglucan and xylan (Coughlan and Mayer, 1992). Moreover,
0
5
10
15
20
25
MR-M1 MR-SP RR-R2 MR-Z1 MR-AI WR-W2
IAA
(μ
g/m
g D
ry w
t.)
0% 0.10% 1.00% 5.00%
added.
200bp
M 1 2 3 4 5 6
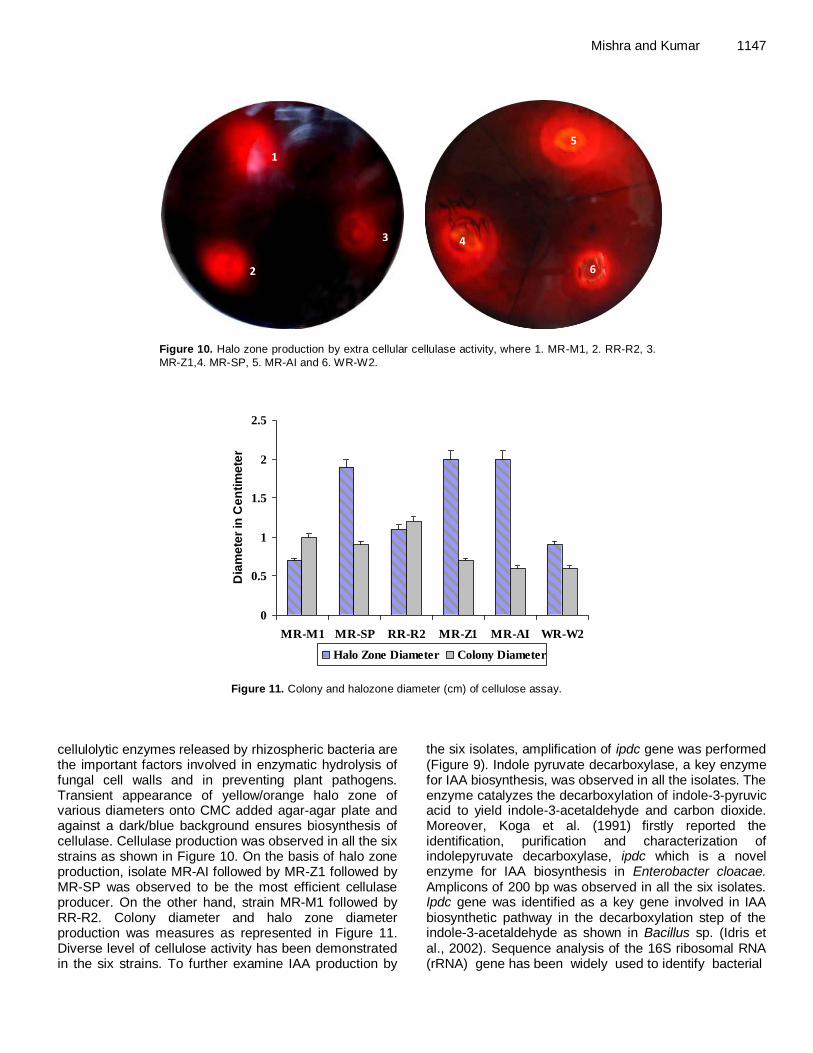
Mishra and Kumar 1147
Figure 10. Halo zone production by extra cellular cellulase activity, where 1. MR-M1, 2. RR-R2, 3.
MR-Z1,4. MR-SP, 5. MR-AI and 6. WR-W2.
Figure 11. Colony and halozone diameter (cm) of cellulose assay.
cellulolytic enzymes released by rhizospheric bacteria are the important factors involved in enzymatic hydrolysis of fungal cell walls and in preventing plant pathogens. Transient appearance of yellow/orange halo zone of various diameters onto CMC added agar-agar plate and against a dark/blue background ensures biosynthesis of cellulase. Cellulase production was observed in all the six strains as shown in Figure 10. On the basis of halo zone production, isolate MR-AI followed by MR-Z1 followed by MR-SP was observed to be the most efficient cellulase producer. On the other hand, strain MR-M1 followed by RR-R2. Colony diameter and halo zone diameter production was measures as represented in Figure 11. Diverse level of cellulose activity has been demonstrated in the six strains. To further examine IAA production by
the six isolates, amplification of ipdc gene was performed (Figure 9). Indole pyruvate decarboxylase, a key enzyme for IAA biosynthesis, was observed in all the isolates. The enzyme catalyzes the decarboxylation of indole-3-pyruvic acid to yield indole-3-acetaldehyde and carbon dioxide. Moreover, Koga et al. (1991)
firstly reported the
identification, purification and characterization of indolepyruvate decarboxylase, ipdc which is a novel enzyme for IAA biosynthesis in Enterobacter cloacae. Amplicons of 200 bp was observed in all the six isolates. Ipdc gene was identified as a key gene involved in IAA biosynthetic pathway in the decarboxylation step of the indole-3-acetaldehyde as shown in Bacillus sp. (Idris et al., 2002). Sequence analysis of the 16S ribosomal RNA (rRNA) gene has been widely used to identify bacterial
Figure. 9. Amplification of ipdc gene of the six isolates where 1.MR-M1, 2. MR-SP 3. RR-R2 4. MR-
Z1.5.MR-AI 6.WR-W2
Figure.10. Halo zone production by extra cellular cellulase activity, where 1.MR-M1, 2.RR-R2, 3.MR-
Z1,4.MR-SP, 5.MR-AI, 6.WR-W2
4
6
5
3
2
1
0
0.5
1
1.5
2
2.5
MR-M1 MR-SP RR-R2 MR-Z1 MR-AI WR-W2
Dia
me
ter
in C
en
tim
ete
r
Halo Zone Diameter Colony Diameter
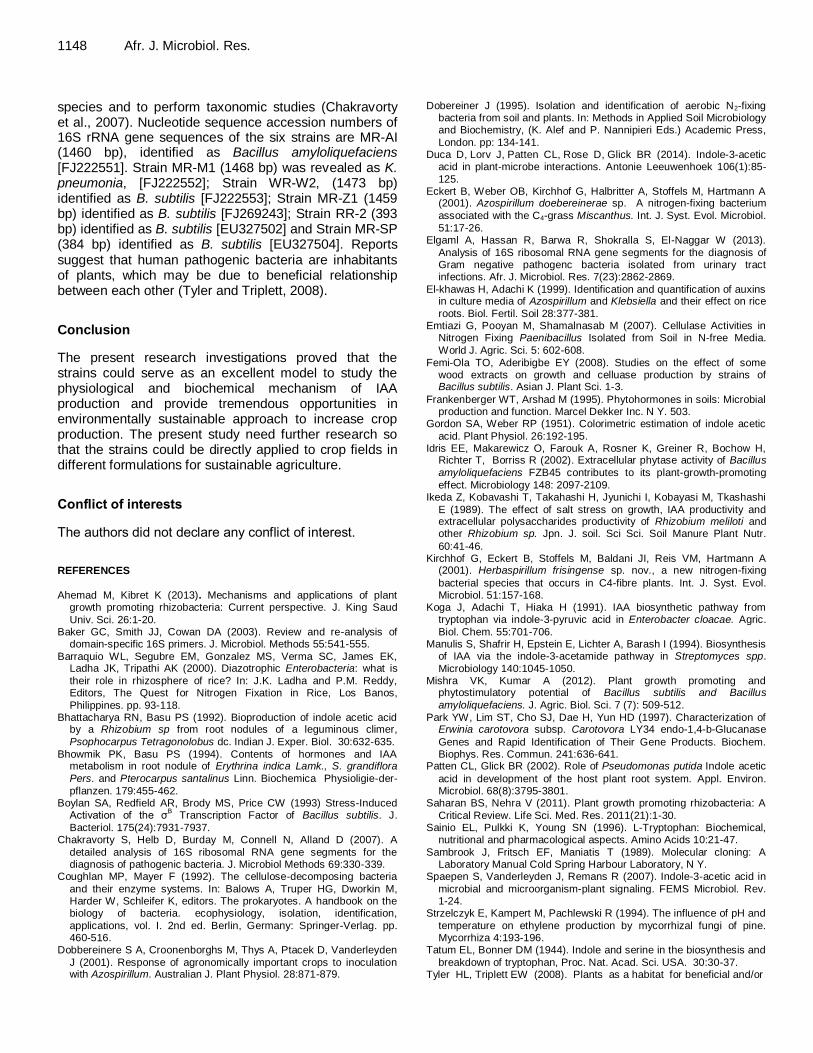
1148 Afr. J. Microbiol. Res. species and to perform taxonomic studies (Chakravorty et al., 2007). Nucleotide sequence accession numbers of 16S rRNA gene sequences of the six strains are MR-AI (1460 bp), identified as Bacillus amyloliquefaciens [FJ222551]. Strain MR-M1 (1468 bp) was revealed as K. pneumonia, [FJ222552]; Strain WR-W2, (1473 bp) identified as B. subtilis [FJ222553]; Strain MR-Z1 (1459 bp) identified as B. subtilis [FJ269243]; Strain RR-2 (393 bp) identified as B. subtilis [EU327502] and Strain MR-SP (384 bp) identified as B. subtilis [EU327504]. Reports suggest that human pathogenic bacteria are inhabitants of plants, which may be due to beneficial relationship between each other (Tyler and Triplett, 2008).
Conclusion
The present research investigations proved that the strains could serve as an excellent model to study the physiological and biochemical mechanism of IAA production and provide tremendous opportunities in environmentally sustainable approach to increase crop production. The present study need further research so that the strains could be directly applied to crop fields in different formulations for sustainable agriculture.
Conflict of interests
The authors did not declare any conflict of interest. REFERENCES
Ahemad M, Kibret K (2013). Mechanisms and applications of plant
growth promoting rhizobacteria: Current perspective. J. King Saud
Univ. Sci. 26:1-20. Baker GC, Smith JJ, Cowan DA (2003). Review and re-analysis of
domain-specific 16S primers. J. Microbiol. Methods 55:541-555.
Barraquio WL, Segubre EM, Gonzalez MS, Verma SC, James EK, Ladha JK, Tripathi AK (2000). Diazotrophic Enterobacteria: what is
their role in rhizosphere of rice? In: J.K. Ladha and P.M. Reddy, Editors, The Quest for Nitrogen Fixation in Rice, Los Banos,
Philippines. pp. 93-118. Bhattacharya RN, Basu PS (1992). Bioproduction of indole acetic acid
by a Rhizobium sp from root nodules of a leguminous climer,
Psophocarpus Tetragonolobus dc. Indian J. Exper. Biol. 30:632-635.
Bhowmik PK, Basu PS (1994). Contents of hormones and IAA metabolism in root nodule of Erythrina indica Lamk., S. grandiflora
Pers. and Pterocarpus santalinus Linn. Biochemica Physioligie-der-
pflanzen. 179:455-462. Boylan SA, Redfield AR, Brody MS, Price CW (1993) Stress-Induced
Activation of the σB Transcription Factor of Bacillus subtilis. J.
Bacteriol. 175(24):7931-7937. Chakravorty S, Helb D, Burday M, Connell N, Alland D (2007). A
detailed analysis of 16S ribosomal RNA gene segments for the diagnosis of pathogenic bacteria. J. Microbiol Methods 69:330-339.
Coughlan MP, Mayer F (1992). The cellulose-decomposing bacteria
and their enzyme systems. In: Balows A, Truper HG, Dworkin M, Harder W, Schleifer K, editors. The prokaryotes. A handbook on the biology of bacteria. ecophysiology, isolation, identification,
applications, vol. I. 2nd ed. Berlin, Germany: Springer-Verlag. pp. 460-516.
Dobbereinere S A, Croonenborghs M, Thys A, Ptacek D, Vanderleyden
J (2001). Response of agronomically important crops to inoculation with Azospirillum. Australian J. Plant Physiol. 28:871-879.
Dobereiner J (1995). Isolation and identification of aerobic N2-fixing
bacteria from soil and plants. In: Methods in Applied Soil Microbiology and Biochemistry, (K. Alef and P. Nannipieri Eds.) Academic Press,
London. pp: 134-141. Duca D, Lorv J, Patten CL, Rose D, Glick BR (2014). Indole-3-acetic
acid in plant-microbe interactions. Antonie Leeuwenhoek 106(1):85-
125. Eckert B, Weber OB, Kirchhof G, Halbritter A, Stoffels M, Hartmann A
(2001). Azospirillum doebereinerae sp. A nitrogen-fixing bacterium
associated with the C4-grass Miscanthus. Int. J. Syst. Evol. Microbiol.
51:17-26. Elgaml A, Hassan R, Barwa R, Shokralla S, El-Naggar W (2013).
Analysis of 16S ribosomal RNA gene segments for the diagnosis of Gram negative pathogenc bacteria isolated from urinary tract infections. Afr. J. Microbiol. Res. 7(23):2862-2869.
El-khawas H, Adachi K (1999). Identification and quantification of auxins in culture media of Azospirillum and Klebsiella and their effect on rice
roots. Biol. Fertil. Soil 28:377-381. Emtiazi G, Pooyan M, Shamalnasab M (2007). Cellulase Activities in
Nitrogen Fixing Paenibacillus Isolated from Soil in N-free Media.
World J. Agric. Sci. 5: 602-608.
Femi-Ola TO, Aderibigbe EY (2008). Studies on the effect of some wood extracts on growth and celluase production by strains of Bacillus subtilis. Asian J. Plant Sci. 1-3.
Frankenberger WT, Arshad M (1995). Phytohormones in soils: Microbial production and function. Marcel Dekker Inc. N Y. 503.
Gordon SA, Weber RP (1951). Colorimetric estimation of indole acetic
acid. Plant Physiol. 26:192-195. Idris EE, Makarewicz O, Farouk A, Rosner K, Greiner R, Bochow H,
Richter T, Borriss R (2002). Extracellular phytase activity of Bacillus
amyloliquefaciens FZB45 contributes to its plant-growth-promoting
effect. Microbiology 148: 2097-2109. Ikeda Z, Kobavashi T, Takahashi H, Jyunichi I, Kobayasi M, Tkashashi
E (1989). The effect of salt stress on growth, IAA productivity and extracellular polysaccharides productivity of Rhizobium meliloti and other Rhizobium sp. Jpn. J. soil. Sci Sci. Soil Manure Plant Nutr.
60:41-46. Kirchhof G, Eckert B, Stoffels M, Baldani JI, Reis VM, Hartmann A
(2001). Herbaspirillum frisingense sp. nov., a new nitrogen-fixing
bacterial species that occurs in C4-fibre plants. Int. J. Syst. Evol. Microbiol. 51:157-168.
Koga J, Adachi T, Hiaka H (1991). IAA biosynthetic pathway from tryptophan via indole-3-pyruvic acid in Enterobacter cloacae. Agric.
Biol. Chem. 55:701-706. Manulis S, Shafrir H, Epstein E, Lichter A, Barash I (1994). Biosynthesis
of IAA via the indole-3-acetamide pathway in Streptomyces spp.
Microbiology 140:1045-1050. Mishra VK, Kumar A (2012). Plant growth promoting and
phytostimulatory potential of Bacillus subtilis and Bacillus
amyloliquefaciens. J. Agric. Biol. Sci. 7 (7): 509-512.
Park YW, Lim ST, Cho SJ, Dae H, Yun HD (1997). Characterization of Erwinia carotovora subsp. Carotovora LY34 endo-1,4-b-Glucanase
Genes and Rapid Identification of Their Gene Products. Biochem. Biophys. Res. Commun. 241:636-641.
Patten CL, Glick BR (2002). Role of Pseudomonas putida Indole acetic
acid in development of the host plant root system. Appl. Environ. Microbiol. 68(8):3795-3801.
Saharan BS, Nehra V (2011). Plant growth promoting rhizobacteria: A
Critical Review. Life Sci. Med. Res. 2011(21):1-30. Sainio EL, Pulkki K, Young SN (1996). L-Tryptophan: Biochemical,
nutritional and pharmacological aspects. Amino Acids 10:21-47.
Sambrook J, Fritsch EF, Maniatis T (1989). Molecular cloning: A Laboratory Manual Cold Spring Harbour Laboratory, N Y.
Spaepen S, Vanderleyden J, Remans R (2007). Indole-3-acetic acid in
microbial and microorganism-plant signaling. FEMS Microbiol. Rev. 1-24.
Strzelczyk E, Kampert M, Pachlewski R (1994). The influence of pH and
temperature on ethylene production by mycorrhizal fungi of pine. Mycorrhiza 4:193-196.
Tatum EL, Bonner DM (1944). Indole and serine in the biosynthesis and
breakdown of tryptophan, Proc. Nat. Acad. Sci. USA. 30:30-37. Tyler HL, Triplett EW (2008). Plants as a habitat for beneficial and/or

human pathogenic bacteria. Ann. Rev. Phytopathol. 46: 53-73. Woodward AW, Bartel B (2005). Auxin: Regulation, Action, and
Interaction. Ann. Bot. (Lond) 95:707-735.
Yamada T, Tsukamopto H, Shrraishi T, Nomura T, Oku H (1990). Detection of IAA biosynthesis in some species of taphrina causing hyperplasic diseases in plants. Ann. Phytopathol. Soc. Jpn. 56:532-
540.
Mishra and Kumar 1149 Zakharova EA, Iosipenko AD, Ignatov VV (2000). Effect of water-soluble
vitamins on the production of indole-3-acetic acid by Azospirillum brasilense. Microbiol. Res. 155:209-214.
Vol. 9(16), pp. 1150-1161, 22 April, 2015 DOI: 10.5897/AJMR2013.5909
Article Number: 7D46FAD52663
ISSN 1996-0808
Copyright © 2015
Author(s) retain the copyright of this article
http://www.academicjournals.org/AJMR
African Journal of Microbiology Research
Full Length Research Paper
Assessment of phenol biodegradation capacity of indigenous bacteria isolated from sewage
treatment plant
N. R. Das1* and N. Kumar2
1Centre for Environment Science and Climate Resilient Agriculture (CESCRA), Indian Agricultural Research Institute
(IARI), Pusa, New Delhi,110012, India. 2Centre for Environmental Science, School of Earth, Biological and Life Sciences, Central University of Bihar, Patna,
Bihar, 800014, India.
Received 30 April, 2013; Accepted 25 March, 2015
Among different xenobiotics, phenol is a man made as well as a naturally occurring aromatic compound and an important intermediate in the biodegradation of natural and industrial aromatic compounds. The investigation was undertaken to isolate, characterize and exploit phenol degrading bacteria from sewage treatment plant (STP) (artificial ecosystem having diverse group of bacteria which are adapted to different aromatic pollutant and capable to degrade xenobiotic aromatic organic pollutants). Out of five different phenol degrading bacteria, one potent strain (IS-3) was identified as Citrobacter freundii with maximum degradation capacity of 1000 ppm phenol in three days under in vitro studies. Phenol degradation performance was greatly influenced by different physical factors like incubation temperature, supplemented glucose, nitrogen source, NaCl and pH of the growth medium. The maximum phenol degradation was observed at incubation temperature of 33°C, 7.5 pH of the medium, 0.1 gl
-1 of NaCl, 0.25 gl
-1 of glucose and 0.25 gl
-1 of ammonium sulphate. We report in this study that the
identified potential strain (IS-3) can be used for treatment of phenol contaminated waste water maintaining above the mentioned optimum factors for faster degradation of the phenol contaminated industrial effluents. Key words: Xenobiotics, phenol, bio-degradation.
INTRODUCTION With the advent of modern technology and industrialization, contamination of the natural resources by chemicals has become a serious concern. A huge quantity of xenobiotic compounds especially phenolic
compounds are introduced into the ecosystem every day due to the production of agricultural, industrial and pharmaceuticals products. These phenolic compounds are often found in waste water from coal-gasification,
*Corresponding author. E-mail: [email protected]/[email protected]. Tel: +91-9711375220. Author(s) agree that this article remain permanently open access under the terms of the Creative Commons Attribution License 4.0 International License
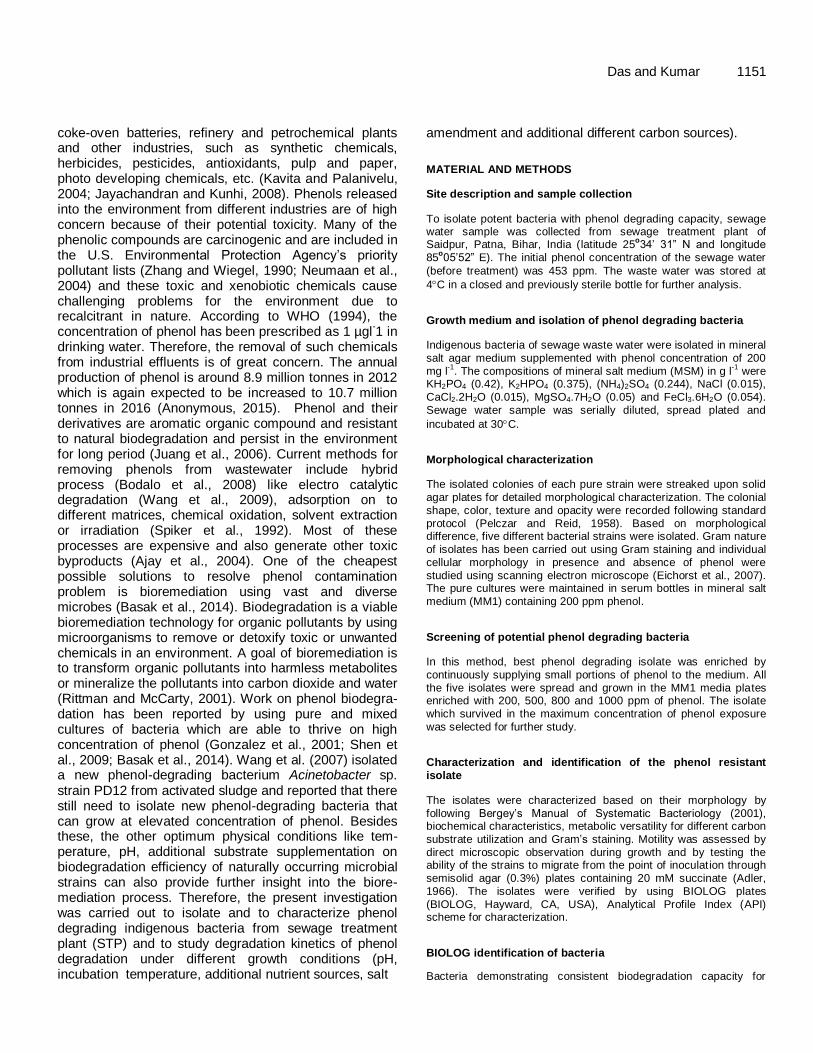
coke-oven batteries, refinery and petrochemical plants and other industries, such as synthetic chemicals, herbicides, pesticides, antioxidants, pulp and paper, photo developing chemicals, etc. (Kavita and Palanivelu, 2004; Jayachandran and Kunhi, 2008). Phenols released into the environment from different industries are of high concern because of their potential toxicity. Many of the phenolic compounds are carcinogenic and are included in the U.S. Environmental Protection Agency’s priority pollutant lists (Zhang and Wiegel, 1990; Neumaan et al., 2004) and these toxic and xenobiotic chemicals cause challenging problems for the environment due to recalcitrant in nature. According to WHO (1994), the concentration of phenol has been prescribed as 1 µgl
-1 in
drinking water. Therefore, the removal of such chemicals from industrial effluents is of great concern. The annual production of phenol is around 8.9 million tonnes in 2012 which is again expected to be increased to 10.7 million tonnes in 2016 (Anonymous, 2015). Phenol and their derivatives are aromatic organic compound and resistant to natural biodegradation and persist in the environment for long period (Juang et al., 2006). Current methods for removing phenols from wastewater include hybrid process (Bodalo et al., 2008) like electro catalytic degradation (Wang et al., 2009), adsorption on to different matrices, chemical oxidation, solvent extraction or irradiation (Spiker et al., 1992). Most of these processes are expensive and also generate other toxic byproducts (Ajay et al., 2004). One of the cheapest possible solutions to resolve phenol contamination problem is bioremediation using vast and diverse microbes (Basak et al., 2014). Biodegradation is a viable bioremediation technology for organic pollutants by using microorganisms to remove or detoxify toxic or unwanted chemicals in an environment. A goal of bioremediation is to transform organic pollutants into harmless metabolites or mineralize the pollutants into carbon dioxide and water (Rittman and McCarty, 2001). Work on phenol biodegra-dation has been reported by using pure and mixed cultures of bacteria which are able to thrive on high concentration of phenol (Gonzalez et al., 2001; Shen et al., 2009; Basak et al., 2014). Wang et al. (2007) isolated a new phenol-degrading bacterium Acinetobacter sp. strain PD12 from activated sludge and reported that there still need to isolate new phenol-degrading bacteria that can grow at elevated concentration of phenol. Besides these, the other optimum physical conditions like tem-perature, pH, additional substrate supplementation on biodegradation efficiency of naturally occurring microbial strains can also provide further insight into the biore-mediation process. Therefore, the present investigation was carried out to isolate and to characterize phenol degrading indigenous bacteria from sewage treatment plant (STP) and to study degradation kinetics of phenol degradation under different growth conditions (pH, incubation temperature, additional nutrient sources, salt
Das and Kumar 1151 amendment and additional different carbon sources).
MATERIAL AND METHODS
Site description and sample collection
To isolate potent bacteria with phenol degrading capacity, sewage water sample was collected from sewage treatment plant of Saidpur, Patna, Bihar, India (latitude 25
o34’ 31” N and longitude
85o05’52” E). The initial phenol concentration of the sewage water
(before treatment) was 453 ppm. The waste water was stored at
4C in a closed and previously sterile bottle for further analysis.
Growth medium and isolation of phenol degrading bacteria
Indigenous bacteria of sewage waste water were isolated in mineral salt agar medium supplemented with phenol concentration of 200 mg l
-1. The compositions of mineral salt medium (MSM) in g l
-1 were
KH2PO4 (0.42), K2HPO4 (0.375), (NH4)2SO4 (0.244), NaCl (0.015),
CaCl2.2H2O (0.015), MgSO4.7H2O (0.05) and FeCl3.6H2O (0.054). Sewage water sample was serially diluted, spread plated and
incubated at 30C.
Morphological characterization
The isolated colonies of each pure strain were streaked upon solid
agar plates for detailed morphological characterization. The colonial shape, color, texture and opacity were recorded following standard protocol (Pelczar and Reid, 1958). Based on morphological difference, five different bacterial strains were isolated. Gram nature of isolates has been carried out using Gram staining and individual cellular morphology in presence and absence of phenol were studied using scanning electron microscope (Eichorst et al., 2007). The pure cultures were maintained in serum bottles in mineral salt medium (MM1) containing 200 ppm phenol.
Screening of potential phenol degrading bacteria
In this method, best phenol degrading isolate was enriched by continuously supplying small portions of phenol to the medium. All the five isolates were spread and grown in the MM1 media plates enriched with 200, 500, 800 and 1000 ppm of phenol. The isolate which survived in the maximum concentration of phenol exposure
was selected for further study.
Characterization and identification of the phenol resistant isolate
The isolates were characterized based on their morphology by following Bergey’s Manual of Systematic Bacteriology (2001), biochemical characteristics, metabolic versatility for different carbon
substrate utilization and Gram’s staining. Motility was assessed by direct microscopic observation during growth and by testing the ability of the strains to migrate from the point of inoculation through semisolid agar (0.3%) plates containing 20 mM succinate (Adler, 1966). The isolates were verified by using BIOLOG plates (BIOLOG, Hayward, CA, USA), Analytical Profile Index (API) scheme for characterization.
BIOLOG identification of bacteria
Bacteria demonstrating consistent biodegradation capacity for
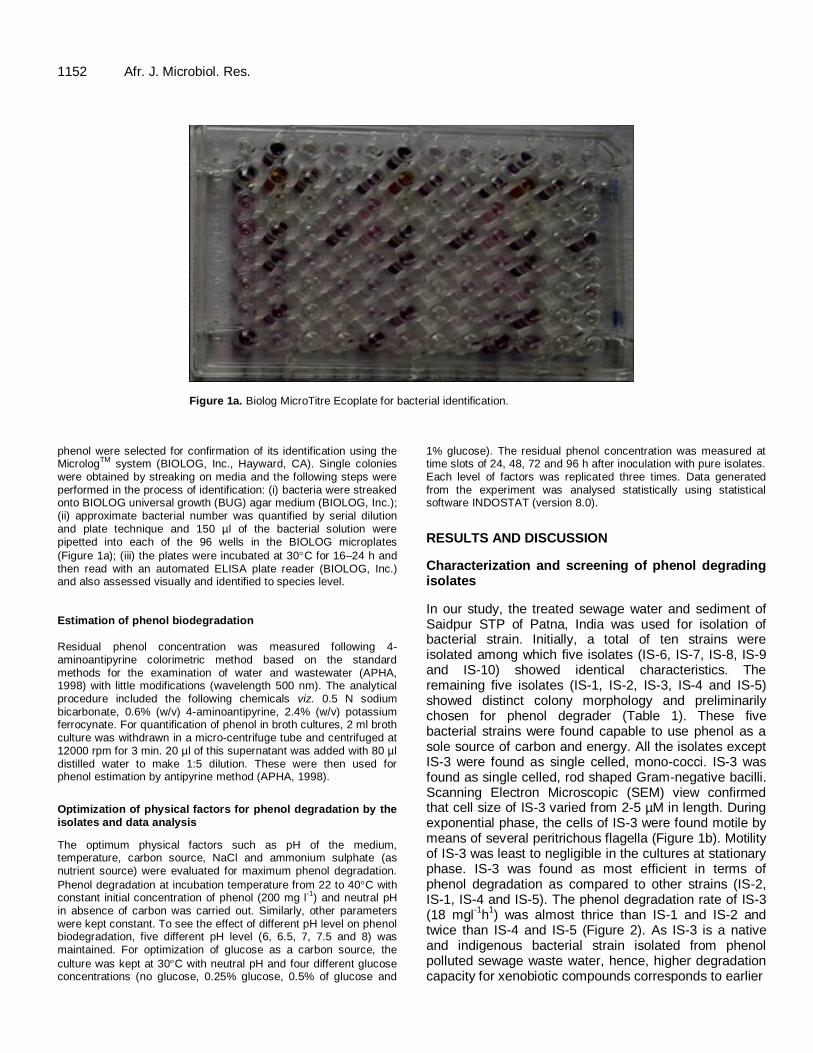
1152 Afr. J. Microbiol. Res.
Figure 1a. Biolog MicroTitre Ecoplate for bacterial identification.
phenol were selected for confirmation of its identification using the Microlog
TM system (BIOLOG, Inc., Hayward, CA). Single colonies
were obtained by streaking on media and the following steps were performed in the process of identification: (i) bacteria were streaked onto BIOLOG universal growth (BUG) agar medium (BIOLOG, Inc.); (ii) approximate bacterial number was quantified by serial dilution and plate technique and 150 µl of the bacterial solution were pipetted into each of the 96 wells in the BIOLOG microplates
(Figure 1a); (iii) the plates were incubated at 30C for 16–24 h and then read with an automated ELISA plate reader (BIOLOG, Inc.) and also assessed visually and identified to species level.
Estimation of phenol biodegradation Residual phenol concentration was measured following 4-aminoantipyrine colorimetric method based on the standard methods for the examination of water and wastewater (APHA, 1998) with little modifications (wavelength 500 nm). The analytical procedure included the following chemicals viz. 0.5 N sodium bicarbonate, 0.6% (w/v) 4-aminoantipyrine, 2.4% (w/v) potassium ferrocynate. For quantification of phenol in broth cultures, 2 ml broth culture was withdrawn in a micro-centrifuge tube and centrifuged at 12000 rpm for 3 min. 20 µl of this supernatant was added with 80 µl distilled water to make 1:5 dilution. These were then used for phenol estimation by antipyrine method (APHA, 1998).
Optimization of physical factors for phenol degradation by the isolates and data analysis
The optimum physical factors such as pH of the medium, temperature, carbon source, NaCl and ammonium sulphate (as nutrient source) were evaluated for maximum phenol degradation.
Phenol degradation at incubation temperature from 22 to 40C with constant initial concentration of phenol (200 mg l
-1) and neutral pH
in absence of carbon was carried out. Similarly, other parameters were kept constant. To see the effect of different pH level on phenol biodegradation, five different pH level (6, 6.5, 7, 7.5 and 8) was
maintained. For optimization of glucose as a carbon source, the
culture was kept at 30C with neutral pH and four different glucose concentrations (no glucose, 0.25% glucose, 0.5% of glucose and
1% glucose). The residual phenol concentration was measured at time slots of 24, 48, 72 and 96 h after inoculation with pure isolates. Each level of factors was replicated three times. Data generated from the experiment was analysed statistically using statistical software INDOSTAT (version 8.0).
RESULTS AND DISCUSSION
Characterization and screening of phenol degrading isolates
In our study, the treated sewage water and sediment of Saidpur STP of Patna, India was used for isolation of bacterial strain. Initially, a total of ten strains were isolated among which five isolates (IS-6, IS-7, IS-8, IS-9 and IS-10) showed identical characteristics. The remaining five isolates (IS-1, IS-2, IS-3, IS-4 and IS-5) showed distinct colony morphology and preliminarily chosen for phenol degrader (Table 1). These five bacterial strains were found capable to use phenol as a sole source of carbon and energy. All the isolates except IS-3 were found as single celled, mono-cocci. IS-3 was found as single celled, rod shaped Gram-negative bacilli. Scanning Electron Microscopic (SEM) view confirmed that cell size of IS-3 varied from 2-5 µM in length. During exponential phase, the cells of IS-3 were found motile by means of several peritrichous flagella (Figure 1b). Motility of IS-3 was least to negligible in the cultures at stationary phase. IS-3 was found as most efficient in terms of phenol degradation as compared to other strains (IS-2, IS-1, IS-4 and IS-5). The phenol degradation rate of IS-3 (18 mgl
-1h
1) was almost thrice than IS-1 and IS-2 and
twice than IS-4 and IS-5 (Figure 2). As IS-3 is a native and indigenous bacterial strain isolated from phenol polluted sewage waste water, hence, higher degradation capacity for xenobiotic compounds corresponds to earlier

Das and Kumar 1153
Table 1. Characterization of phenol degrading isolates of sewage treatment plant waste water (Saidpur, Patna, Bihar, India).
Strain Colony morphology (in MM1 media)
Cell morphology
Flagella Optimum
pH Phenol tolerance
(ppm) Generation time
(h)
IS-1 Orangish, circular Mono-cocci polar 6.5 1000 12
IS-2 Light creemish, circular, transperaent
Mono-cocci Polar 7.0 1000 12
IS-3 Dirty creemish, circular, transparent
Rod Peritrichus 7.5 1800 9.5
IS-4 White, circular, wrinkled, opaque
Mono-cocci Peritrichus 7.0 1200 11
IS-5 Light orangish, small circular, opaque
Mono-cocci Polar 7.0 1500 12
Figure 1b. Scanning electron microscopic (SEM) view of IS-3 (Citrobacter freundii).
Figure 2. Degradation kinetics of phenol (initial enrichment of 200 ppm) by five
different isolates (All the results are average of 3 replications).
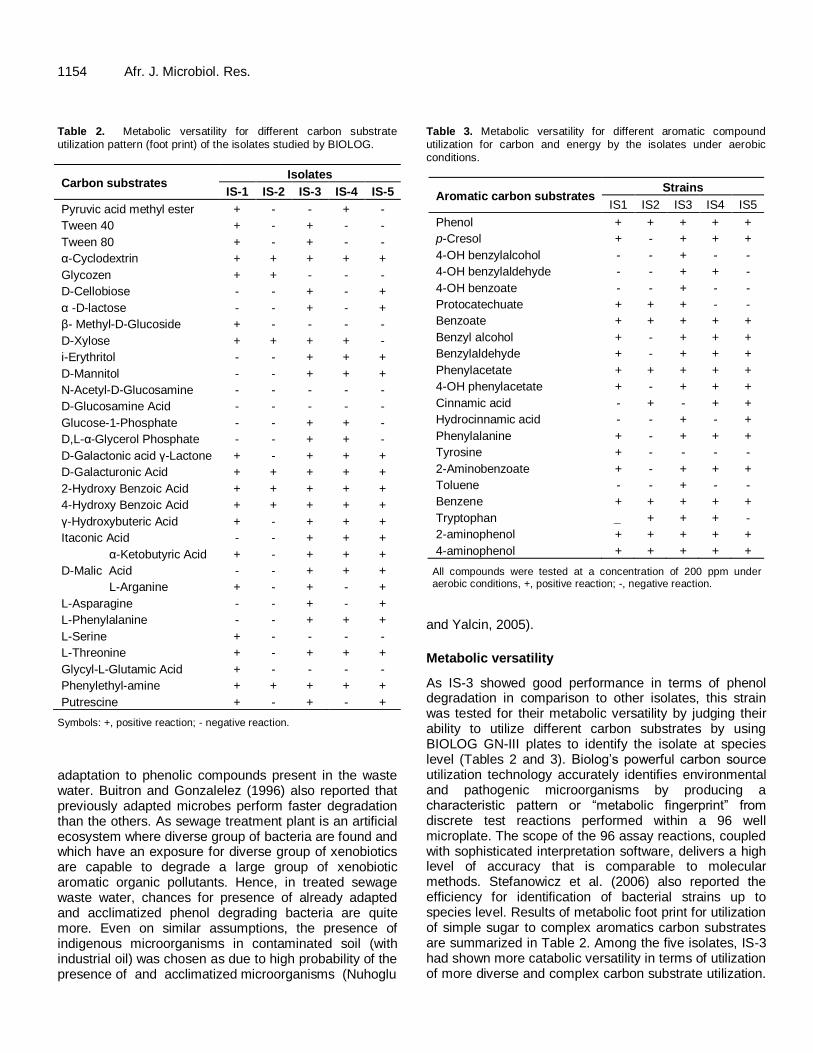
1154 Afr. J. Microbiol. Res. Table 2. Metabolic versatility for different carbon substrate utilization pattern (foot print) of the isolates studied by BIOLOG.
Carbon substrates Isolates
IS-1 IS-2 IS-3 IS-4 IS-5
Pyruvic acid methyl ester + - - + -
Tween 40 + - + - -
Tween 80 + - + - -
α-Cyclodextrin + + + + +
Glycozen + + - - -
D-Cellobiose - - + - +
α -D-lactose - - + - +
β- Methyl-D-Glucoside + - - - -
D-Xylose + + + + -
i-Erythritol - - + + +
D-Mannitol - - + + +
N-Acetyl-D-Glucosamine - - - - -
D-Glucosamine Acid - - - - -
Glucose-1-Phosphate - - + + -
D,L-α-Glycerol Phosphate - - + + -
D-Galactonic acid γ-Lactone + - + + +
D-Galacturonic Acid + + + + +
2-Hydroxy Benzoic Acid + + + + +
4-Hydroxy Benzoic Acid + + + + +
γ-Hydroxybuteric Acid + - + + +
Itaconic Acid - - + + +
α-Ketobutyric Acid + - + + +
D-Malic Acid - - + + +
L-Arganine + - + - +
L-Asparagine - - + - +
L-Phenylalanine - - + + +
L-Serine + - - - -
L-Threonine + - + + +
Glycyl-L-Glutamic Acid + - - - -
Phenylethyl-amine + + + + +
Putrescine + - + - +
Symbols: +, positive reaction; - negative reaction.
adaptation to phenolic compounds present in the waste water. Buitron and Gonzalelez (1996) also reported that previously adapted microbes perform faster degradation than the others. As sewage treatment plant is an artificial ecosystem where diverse group of bacteria are found and which have an exposure for diverse group of xenobiotics are capable to degrade a large group of xenobiotic aromatic organic pollutants. Hence, in treated sewage waste water, chances for presence of already adapted and acclimatized phenol degrading bacteria are quite more. Even on similar assumptions, the presence of indigenous microorganisms in contaminated soil (with industrial oil) was chosen as due to high probability of the presence of and acclimatized microorganisms (Nuhoglu
Table 3. Metabolic versatility for different aromatic compound utilization for carbon and energy by the isolates under aerobic conditions.
Aromatic carbon substrates Strains
IS1 IS2 IS3 IS4 IS5
Phenol + + + + +
p-Cresol + - + + +
4-OH benzylalcohol - - + - -
4-OH benzylaldehyde - - + + -
4-OH benzoate - - + - -
Protocatechuate + + + - -
Benzoate + + + + +
Benzyl alcohol + - + + +
Benzylaldehyde + - + + +
Phenylacetate + + + + +
4-OH phenylacetate + - + + +
Cinnamic acid - + - + +
Hydrocinnamic acid - - + - +
Phenylalanine + - + + +
Tyrosine + - - - -
2-Aminobenzoate + - + + +
Toluene - - + - -
Benzene + + + + +
Tryptophan _ + + + -
2-aminophenol + + + + +
4-aminophenol + + + + +
All compounds were tested at a concentration of 200 ppm under aerobic conditions, +, positive reaction; -, negative reaction.
and Yalcin, 2005).
Metabolic versatility
As IS-3 showed good performance in terms of phenol degradation in comparison to other isolates, this strain was tested for their metabolic versatility by judging their ability to utilize different carbon substrates by using BIOLOG GN-III plates to identify the isolate at species level (Tables 2 and 3). Biolog’s powerful carbon source utilization technology accurately identifies environmental and pathogenic microorganisms by producing a characteristic pattern or “metabolic fingerprint” from discrete test reactions performed within a 96 well microplate. The scope of the 96 assay reactions, coupled with sophisticated interpretation software, delivers a high level of accuracy that is comparable to molecular methods. Stefanowicz et al. (2006) also reported the efficiency for identification of bacterial strains up to species level. Results of metabolic foot print for utilization of simple sugar to complex aromatics carbon substrates are summarized in Table 2. Among the five isolates, IS-3 had shown more catabolic versatility in terms of utilization of more diverse and complex carbon substrate utilization.
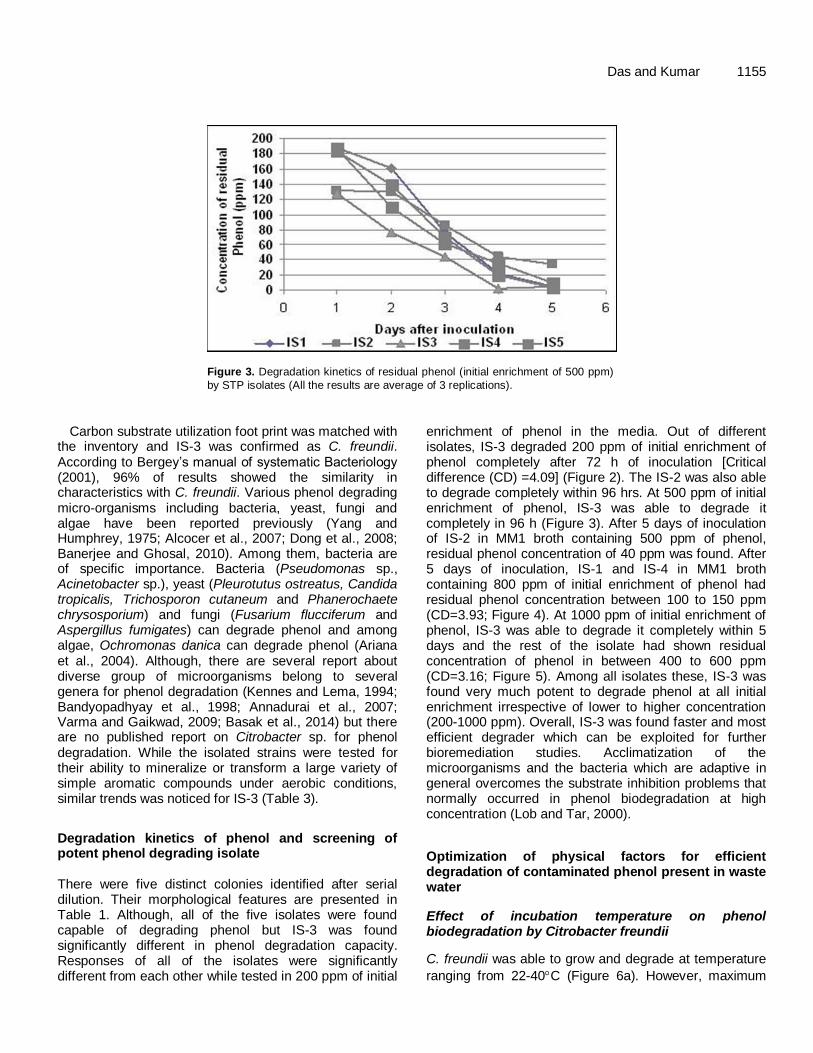
Das and Kumar 1155
Figure 3. Degradation kinetics of residual phenol (initial enrichment of 500 ppm)
by STP isolates (All the results are average of 3 replications).
Carbon substrate utilization foot print was matched with the inventory and IS-3 was confirmed as C. freundii. According to Bergey’s manual of systematic Bacteriology (2001), 96% of results showed the similarity in characteristics with C. freundii. Various phenol degrading micro-organisms including bacteria, yeast, fungi and algae have been reported previously (Yang and Humphrey, 1975; Alcocer et al., 2007; Dong et al., 2008; Banerjee and Ghosal, 2010). Among them, bacteria are of specific importance. Bacteria (Pseudomonas sp., Acinetobacter sp.), yeast (Pleurotutus ostreatus, Candida tropicalis, Trichosporon cutaneum and Phanerochaete chrysosporium) and fungi (Fusarium flucciferum and Aspergillus fumigates) can degrade phenol and among algae, Ochromonas danica can degrade phenol (Ariana et al., 2004). Although, there are several report about diverse group of microorganisms belong to several genera for phenol degradation (Kennes and Lema, 1994; Bandyopadhyay et al., 1998; Annadurai et al., 2007; Varma and Gaikwad, 2009; Basak et al., 2014) but there are no published report on Citrobacter sp. for phenol degradation. While the isolated strains were tested for their ability to mineralize or transform a large variety of simple aromatic compounds under aerobic conditions, similar trends was noticed for IS-3 (Table 3).
Degradation kinetics of phenol and screening of potent phenol degrading isolate There were five distinct colonies identified after serial dilution. Their morphological features are presented in Table 1. Although, all of the five isolates were found capable of degrading phenol but IS-3 was found significantly different in phenol degradation capacity. Responses of all of the isolates were significantly different from each other while tested in 200 ppm of initial
enrichment of phenol in the media. Out of different isolates, IS-3 degraded 200 ppm of initial enrichment of phenol completely after 72 h of inoculation [Critical difference (CD) =4.09] (Figure 2). The IS-2 was also able to degrade completely within 96 hrs. At 500 ppm of initial enrichment of phenol, IS-3 was able to degrade it completely in 96 h (Figure 3). After 5 days of inoculation of IS-2 in MM1 broth containing 500 ppm of phenol, residual phenol concentration of 40 ppm was found. After 5 days of inoculation, IS-1 and IS-4 in MM1 broth containing 800 ppm of initial enrichment of phenol had residual phenol concentration between 100 to 150 ppm (CD=3.93; Figure 4). At 1000 ppm of initial enrichment of phenol, IS-3 was able to degrade it completely within 5 days and the rest of the isolate had shown residual concentration of phenol in between 400 to 600 ppm (CD=3.16; Figure 5). Among all isolates these, IS-3 was found very much potent to degrade phenol at all initial enrichment irrespective of lower to higher concentration (200-1000 ppm). Overall, IS-3 was found faster and most efficient degrader which can be exploited for further bioremediation studies. Acclimatization of the microorganisms and the bacteria which are adaptive in general overcomes the substrate inhibition problems that normally occurred in phenol biodegradation at high concentration (Lob and Tar, 2000).
Optimization of physical factors for efficient degradation of contaminated phenol present in waste water
Effect of incubation temperature on phenol biodegradation by Citrobacter freundii
C. freundii was able to grow and degrade at temperature
ranging from 22-40C (Figure 6a). However, maximum
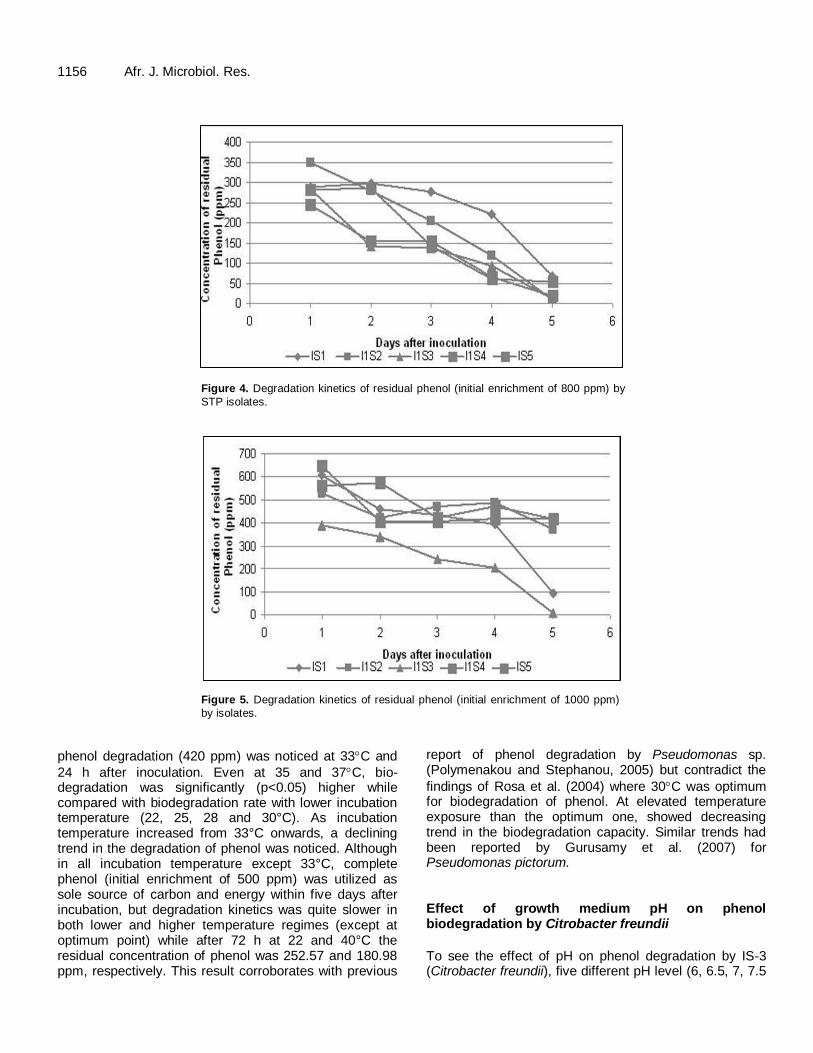
1156 Afr. J. Microbiol. Res.
Figure 4. Degradation kinetics of residual phenol (initial enrichment of 800 ppm) by
STP isolates.
Figure 5. Degradation kinetics of residual phenol (initial enrichment of 1000 ppm)
by isolates.
phenol degradation (420 ppm) was noticed at 33C and
24 h after inoculation. Even at 35 and 37C, bio-degradation was significantly (p<0.05) higher while compared with biodegradation rate with lower incubation temperature (22, 25, 28 and 30°C). As incubation temperature increased from 33°C onwards, a declining trend in the degradation of phenol was noticed. Although in all incubation temperature except 33°C, complete phenol (initial enrichment of 500 ppm) was utilized as sole source of carbon and energy within five days after incubation, but degradation kinetics was quite slower in both lower and higher temperature regimes (except at optimum point) while after 72 h at 22 and 40°C the residual concentration of phenol was 252.57 and 180.98 ppm, respectively. This result corroborates with previous
report of phenol degradation by Pseudomonas sp. (Polymenakou and Stephanou, 2005) but contradict the
findings of Rosa et al. (2004) where 30C was optimum for biodegradation of phenol. At elevated temperature exposure than the optimum one, showed decreasing trend in the biodegradation capacity. Similar trends had been reported by Gurusamy et al. (2007) for Pseudomonas pictorum. Effect of growth medium pH on phenol biodegradation by Citrobacter freundii
To see the effect of pH on phenol degradation by IS-3 (Citrobacter freundii), five different pH level (6, 6.5, 7, 7.5
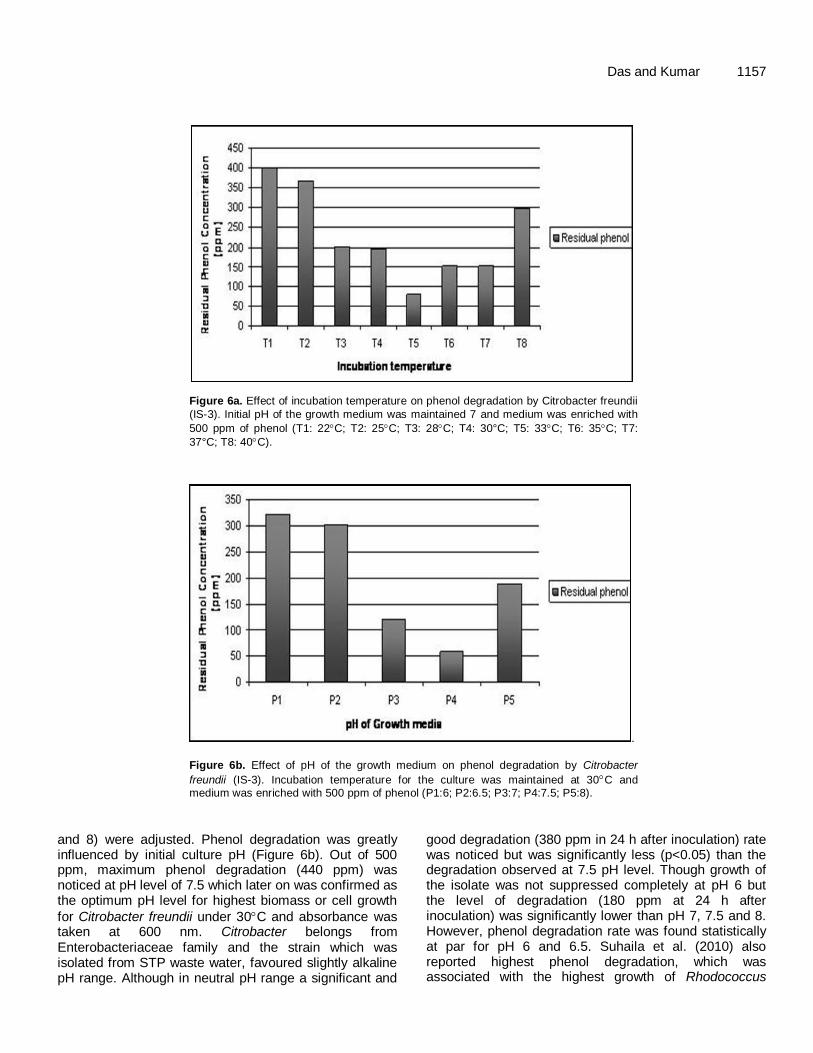
Das and Kumar 1157
Figure 6a. Effect of incubation temperature on phenol degradation by Citrobacter freundii
(IS-3). Initial pH of the growth medium was maintained 7 and medium was enriched with
500 ppm of phenol (T1: 22C; T2: 25C; T3: 28C; T4: 30°C; T5: 33C; T6: 35C; T7:
37°C; T8: 40C).
. Figure 6b. Effect of pH of the growth medium on phenol degradation by Citrobacter
freundii (IS-3). Incubation temperature for the culture was maintained at 30C and medium was enriched with 500 ppm of phenol (P1:6; P2:6.5; P3:7; P4:7.5; P5:8).
and 8) were adjusted. Phenol degradation was greatly influenced by initial culture pH (Figure 6b). Out of 500 ppm, maximum phenol degradation (440 ppm) was noticed at pH level of 7.5 which later on was confirmed as the optimum pH level for highest biomass or cell growth
for Citrobacter freundii under 30C and absorbance was taken at 600 nm. Citrobacter belongs from Enterobacteriaceae family and the strain which was isolated from STP waste water, favoured slightly alkaline pH range. Although in neutral pH range a significant and
good degradation (380 ppm in 24 h after inoculation) rate was noticed but was significantly less (p<0.05) than the degradation observed at 7.5 pH level. Though growth of the isolate was not suppressed completely at pH 6 but the level of degradation (180 ppm at 24 h after inoculation) was significantly lower than pH 7, 7.5 and 8. However, phenol degradation rate was found statistically at par for pH 6 and 6.5. Suhaila et al. (2010) also reported highest phenol degradation, which was associated with the highest growth of Rhodococcus
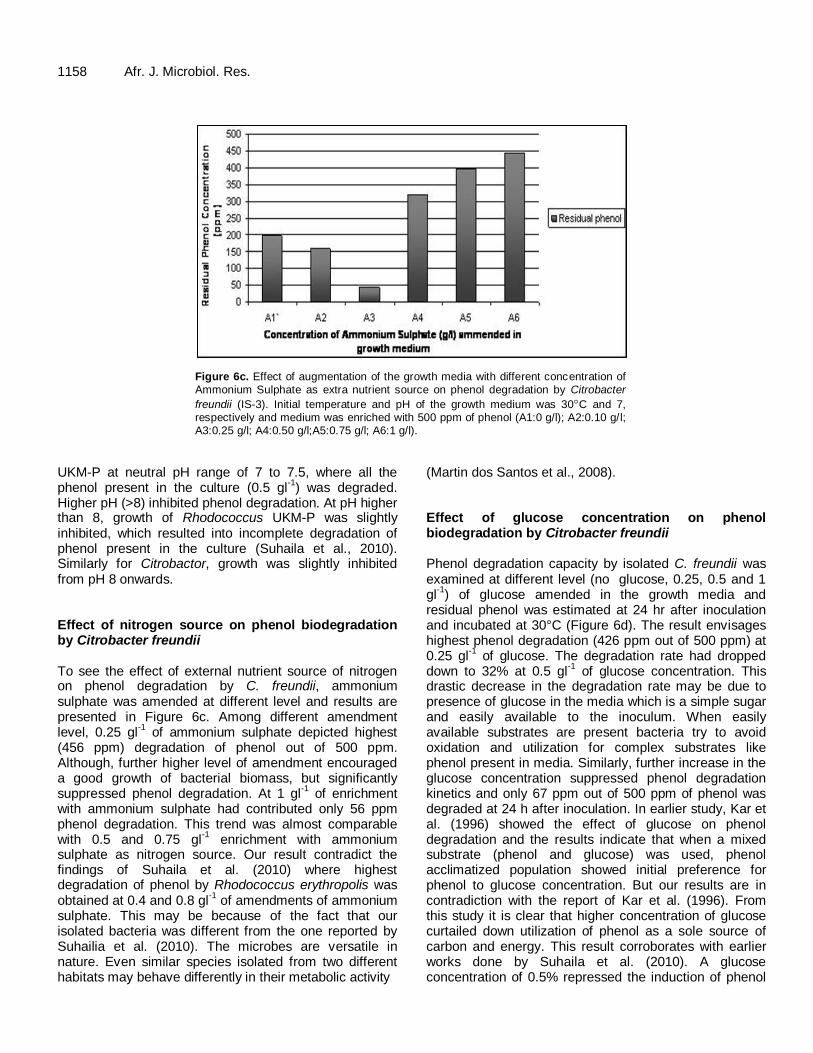
1158 Afr. J. Microbiol. Res.
Figure 6c. Effect of augmentation of the growth media with different concentration of
Ammonium Sulphate as extra nutrient source on phenol degradation by Citrobacter
freundii (IS-3). Initial temperature and pH of the growth medium was 30C and 7, respectively and medium was enriched with 500 ppm of phenol (A1:0 g/l); A2:0.10 g/l; A3:0.25 g/l; A4:0.50 g/l;A5:0.75 g/l; A6:1 g/l).
UKM-P at neutral pH range of 7 to 7.5, where all the phenol present in the culture (0.5 gl
-1) was degraded.
Higher pH (>8) inhibited phenol degradation. At pH higher than 8, growth of Rhodococcus UKM-P was slightly inhibited, which resulted into incomplete degradation of phenol present in the culture (Suhaila et al., 2010). Similarly for Citrobactor, growth was slightly inhibited from pH 8 onwards. Effect of nitrogen source on phenol biodegradation by Citrobacter freundii To see the effect of external nutrient source of nitrogen on phenol degradation by C. freundii, ammonium sulphate was amended at different level and results are presented in Figure 6c. Among different amendment level, 0.25 gl
-1 of ammonium sulphate depicted highest
(456 ppm) degradation of phenol out of 500 ppm. Although, further higher level of amendment encouraged a good growth of bacterial biomass, but significantly suppressed phenol degradation. At 1 gl
-1 of enrichment
with ammonium sulphate had contributed only 56 ppm phenol degradation. This trend was almost comparable with 0.5 and 0.75 gl
-1 enrichment with ammonium
sulphate as nitrogen source. Our result contradict the findings of Suhaila et al. (2010) where highest degradation of phenol by Rhodococcus erythropolis was obtained at 0.4 and 0.8 gl
-1 of amendments of ammonium
sulphate. This may be because of the fact that our isolated bacteria was different from the one reported by Suhailia et al. (2010). The microbes are versatile in nature. Even similar species isolated from two different habitats may behave differently in their metabolic activity
(Martin dos Santos et al., 2008). Effect of glucose concentration on phenol biodegradation by Citrobacter freundii Phenol degradation capacity by isolated C. freundii was examined at different level (no glucose, 0.25, 0.5 and 1 gl
-1) of glucose amended in the growth media and
residual phenol was estimated at 24 hr after inoculation and incubated at 30°C (Figure 6d). The result envisages highest phenol degradation (426 ppm out of 500 ppm) at 0.25 gl
-1 of glucose. The degradation rate had dropped
down to 32% at 0.5 gl-1
of glucose concentration. This drastic decrease in the degradation rate may be due to presence of glucose in the media which is a simple sugar and easily available to the inoculum. When easily available substrates are present bacteria try to avoid oxidation and utilization for complex substrates like phenol present in media. Similarly, further increase in the glucose concentration suppressed phenol degradation kinetics and only 67 ppm out of 500 ppm of phenol was degraded at 24 h after inoculation. In earlier study, Kar et al. (1996) showed the effect of glucose on phenol degradation and the results indicate that when a mixed substrate (phenol and glucose) was used, phenol acclimatized population showed initial preference for phenol to glucose concentration. But our results are in contradiction with the report of Kar et al. (1996). From this study it is clear that higher concentration of glucose curtailed down utilization of phenol as a sole source of carbon and energy. This result corroborates with earlier works done by Suhaila et al. (2010). A glucose concentration of 0.5% repressed the induction of phenol
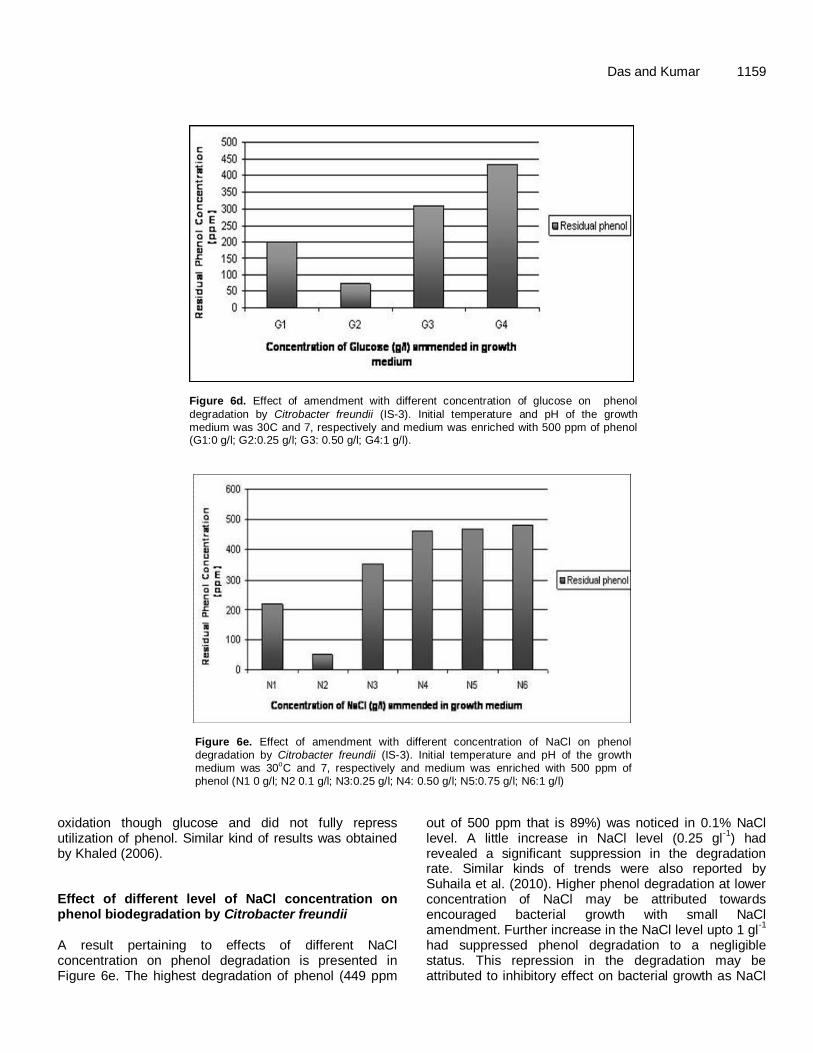
Das and Kumar 1159
Figure 6d. Effect of amendment with different concentration of glucose on phenol
degradation by Citrobacter freundii (IS-3). Initial temperature and pH of the growth medium was 30C and 7, respectively and medium was enriched with 500 ppm of phenol (G1:0 g/l; G2:0.25 g/l; G3: 0.50 g/l; G4:1 g/l).
Figure 6e. Effect of amendment with different concentration of NaCl on phenol degradation by Citrobacter freundii (IS-3). Initial temperature and pH of the growth medium was 30
oC and 7, respectively and medium was enriched with 500 ppm of
phenol (N1 0 g/l; N2 0.1 g/l; N3:0.25 g/l; N4: 0.50 g/l; N5:0.75 g/l; N6:1 g/l)
oxidation though glucose and did not fully repress utilization of phenol. Similar kind of results was obtained by Khaled (2006). Effect of different level of NaCl concentration on phenol biodegradation by Citrobacter freundii A result pertaining to effects of different NaCl concentration on phenol degradation is presented in Figure 6e. The highest degradation of phenol (449 ppm
out of 500 ppm that is 89%) was noticed in 0.1% NaCl level. A little increase in NaCl level (0.25 gl
-1) had
revealed a significant suppression in the degradation rate. Similar kinds of trends were also reported by Suhaila et al. (2010). Higher phenol degradation at lower concentration of NaCl may be attributed towards encouraged bacterial growth with small NaCl amendment. Further increase in the NaCl level upto 1 gl
-1
had suppressed phenol degradation to a negligible status. This repression in the degradation may be attributed to inhibitory effect on bacterial growth as NaCl
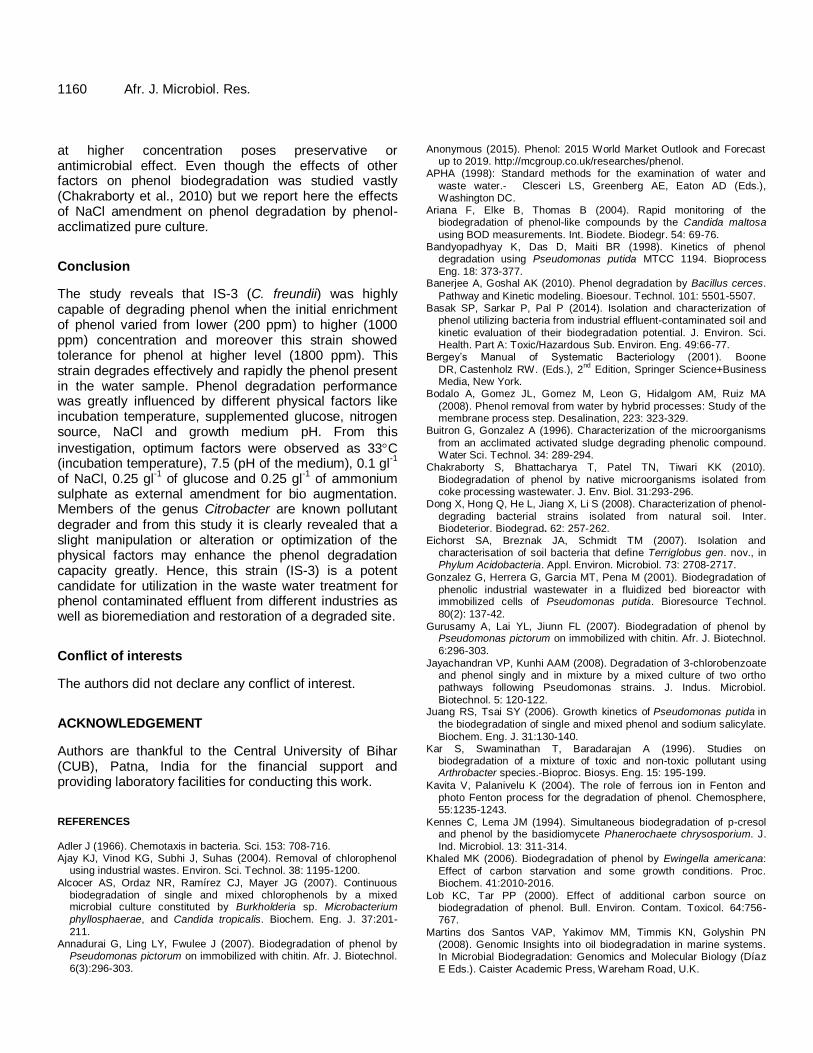
1160 Afr. J. Microbiol. Res. at higher concentration poses preservative or antimicrobial effect. Even though the effects of other factors on phenol biodegradation was studied vastly (Chakraborty et al., 2010) but we report here the effects of NaCl amendment on phenol degradation by phenol-acclimatized pure culture.
Conclusion
The study reveals that IS-3 (C. freundii) was highly capable of degrading phenol when the initial enrichment of phenol varied from lower (200 ppm) to higher (1000 ppm) concentration and moreover this strain showed tolerance for phenol at higher level (1800 ppm). This strain degrades effectively and rapidly the phenol present in the water sample. Phenol degradation performance was greatly influenced by different physical factors like incubation temperature, supplemented glucose, nitrogen source, NaCl and growth medium pH. From this
investigation, optimum factors were observed as 33C (incubation temperature), 7.5 (pH of the medium), 0.1 gl
-1
of NaCl, 0.25 gl-1
of glucose and 0.25 gl-1
of ammonium sulphate as external amendment for bio augmentation. Members of the genus Citrobacter are known pollutant degrader and from this study it is clearly revealed that a slight manipulation or alteration or optimization of the physical factors may enhance the phenol degradation capacity greatly. Hence, this strain (IS-3) is a potent candidate for utilization in the waste water treatment for phenol contaminated effluent from different industries as well as bioremediation and restoration of a degraded site.
Conflict of interests
The authors did not declare any conflict of interest.
ACKNOWLEDGEMENT
Authors are thankful to the Central University of Bihar (CUB), Patna, India for the financial support and providing laboratory facilities for conducting this work. REFERENCES
Adler J (1966). Chemotaxis in bacteria. Sci. 153: 708-716. Ajay KJ, Vinod KG, Subhi J, Suhas (2004). Removal of chlorophenol
using industrial wastes. Environ. Sci. Technol. 38: 1195-1200.
Alcocer AS, Ordaz NR, Ramírez CJ, Mayer JG (2007). Continuous biodegradation of single and mixed chlorophenols by a mixed microbial culture constituted by Burkholderia sp. Microbacterium
phyllosphaerae, and Candida tropicalis. Biochem. Eng. J. 37:201-
211. Annadurai G, Ling LY, Fwulee J (2007). Biodegradation of phenol by
Pseudomonas pictorum on immobilized with chitin. Afr. J. Biotechnol.
6(3):296-303.
Anonymous (2015). Phenol: 2015 World Market Outlook and Forecast
up to 2019. http://mcgroup.co.uk/researches/phenol. APHA (1998): Standard methods for the examination of water and
waste water.- Clesceri LS, Greenberg AE, Eaton AD (Eds.), Washington DC.
Ariana F, Elke B, Thomas B (2004). Rapid monitoring of the biodegradation of phenol-like compounds by the Candida maltosa
using BOD measurements. Int. Biodete. Biodegr. 54: 69-76. Bandyopadhyay K, Das D, Maiti BR (1998). Kinetics of phenol
degradation using Pseudomonas putida MTCC 1194. Bioprocess
Eng. 18: 373-377. Banerjee A, Goshal AK (2010). Phenol degradation by Bacillus cerces.
Pathway and Kinetic modeling. Bioesour. Technol. 101: 5501-5507. Basak SP, Sarkar P, Pal P (2014). Isolation and characterization of
phenol utilizing bacteria from industrial effluent-contaminated soil and
kinetic evaluation of their biodegradation potential. J. Environ. Sci. Health. Part A: Toxic/Hazardous Sub. Environ. Eng. 49:66-77.
Bergey’s Manual of Systematic Bacteriology (2001). Boone
DR, Castenholz RW. (Eds.), 2nd
Edition, Springer Science+Business Media, New York.
Bodalo A, Gomez JL, Gomez M, Leon G, Hidalgom AM, Ruiz MA
(2008). Phenol removal from water by hybrid processes: Study of the membrane process step. Desalination, 223: 323-329.
Buitron G, Gonzalez A (1996). Characterization of the microorganisms
from an acclimated activated sludge degrading phenolic compound. Water Sci. Technol. 34: 289-294.
Chakraborty S, Bhattacharya T, Patel TN, Tiwari KK (2010).
Biodegradation of phenol by native microorganisms isolated from coke processing wastewater. J. Env. Biol. 31:293-296.
Dong X, Hong Q, He L, Jiang X, Li S (2008). Characterization of phenol-
degrading bacterial strains isolated from natural soil. Inter. Biodeterior. Biodegrad. 62: 257-262.
Eichorst SA, Breznak JA, Schmidt TM (2007). Isolation and characterisation of soil bacteria that define Terriglobus gen. nov., in Phylum Acidobacteria. Appl. Environ. Microbiol. 73: 2708-2717.
Gonzalez G, Herrera G, Garcia MT, Pena M (2001). Biodegradation of
phenolic industrial wastewater in a fluidized bed bioreactor with immobilized cells of Pseudomonas putida. Bioresource Technol.
80(2): 137-42.
Gurusamy A, Lai YL, Jiunn FL (2007). Biodegradation of phenol by Pseudomonas pictorum on immobilized with chitin. Afr. J. Biotechnol.
6:296-303.
Jayachandran VP, Kunhi AAM (2008). Degradation of 3-chlorobenzoate and phenol singly and in mixture by a mixed culture of two ortho pathways following Pseudomonas strains. J. Indus. Microbiol.
Biotechnol. 5: 120-122. Juang RS, Tsai SY (2006). Growth kinetics of Pseudomonas putida in
the biodegradation of single and mixed phenol and sodium salicylate.
Biochem. Eng. J. 31:130-140. Kar S, Swaminathan T, Baradarajan A (1996). Studies on
biodegradation of a mixture of toxic and non-toxic pollutant using Arthrobacter species.-Bioproc. Biosys. Eng. 15: 195-199.
Kavita V, Palanivelu K (2004). The role of ferrous ion in Fenton and photo Fenton process for the degradation of phenol. Chemosphere, 55:1235-1243.
Kennes C, Lema JM (1994). Simultaneous biodegradation of p-cresol and phenol by the basidiomycete Phanerochaete chrysosporium. J.
Ind. Microbiol. 13: 311-314. Khaled MK (2006). Biodegradation of phenol by Ewingella americana:
Effect of carbon starvation and some growth conditions. Proc. Biochem. 41:2010-2016.
Lob KC, Tar PP (2000). Effect of additional carbon source on biodegradation of phenol. Bull. Environ. Contam. Toxicol. 64:756-767.
Martins dos Santos VAP, Yakimov MM, Timmis KN, Golyshin PN (2008). Genomic Insights into oil biodegradation in marine systems. In Microbial Biodegradation: Genomics and Molecular Biology (Díaz
E Eds.). Caister Academic Press, Wareham Road, U.K.
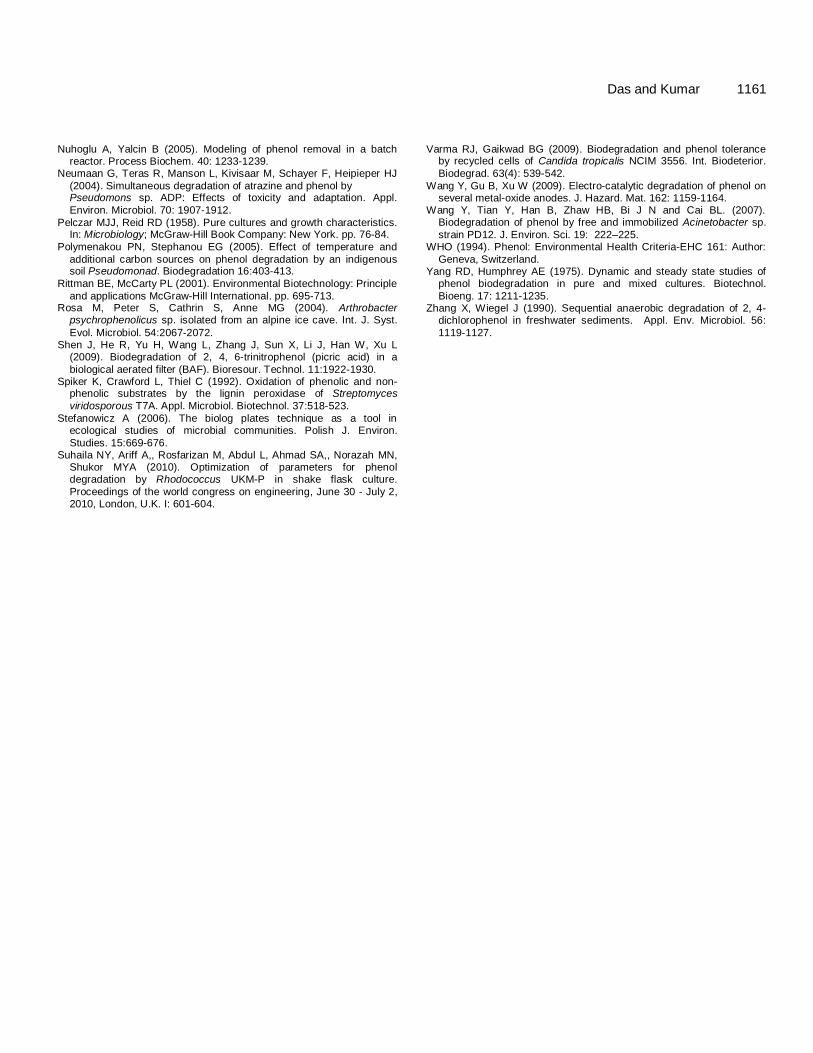
Nuhoglu A, Yalcin B (2005). Modeling of phenol removal in a batch
reactor. Process Biochem. 40: 1233-1239. Neumaan G, Teras R, Manson L, Kivisaar M, Schayer F, Heipieper HJ
(2004). Simultaneous degradation of atrazine and phenol by Pseudomons sp. ADP: Effects of toxicity and adaptation. Appl.
Environ. Microbiol. 70: 1907-1912.
Pelczar MJJ, Reid RD (1958). Pure cultures and growth characteristics. In: Microbiology; McGraw-Hill Book Company: New York. pp. 76-84.
Polymenakou PN, Stephanou EG (2005). Effect of temperature and
additional carbon sources on phenol degradation by an indigenous soil Pseudomonad. Biodegradation 16:403-413.
Rittman BE, McCarty PL (2001). Environmental Biotechnology: Principle
and applications McGraw-Hill International. pp. 695-713. Rosa M, Peter S, Cathrin S, Anne MG (2004). Arthrobacter
psychrophenolicus sp. isolated from an alpine ice cave. Int. J. Syst.
Evol. Microbiol. 54:2067-2072. Shen J, He R, Yu H, Wang L, Zhang J, Sun X, Li J, Han W, Xu L
(2009). Biodegradation of 2, 4, 6-trinitrophenol (picric acid) in a
biological aerated filter (BAF). Bioresour. Technol. 11:1922-1930. Spiker K, Crawford L, Thiel C (1992). Oxidation of phenolic and non-
phenolic substrates by the lignin peroxidase of Streptomyces
viridosporous T7A. Appl. Microbiol. Biotechnol. 37:518-523.
Stefanowicz A (2006). The biolog plates technique as a tool in ecological studies of microbial communities. Polish J. Environ.
Studies. 15:669-676. Suhaila NY, Ariff A,, Rosfarizan M, Abdul L, Ahmad SA,, Norazah MN,
Shukor MYA (2010). Optimization of parameters for phenol degradation by Rhodococcus UKM-P in shake flask culture.
Proceedings of the world congress on engineering, June 30 - July 2, 2010, London, U.K. I: 601-604.
Das and Kumar 1161 Varma RJ, Gaikwad BG (2009). Biodegradation and phenol tolerance
by recycled cells of Candida tropicalis NCIM 3556. Int. Biodeterior.
Biodegrad. 63(4): 539-542.
Wang Y, Gu B, Xu W (2009). Electro-catalytic degradation of phenol on several metal-oxide anodes. J. Hazard. Mat. 162: 1159-1164.
Wang Y, Tian Y, Han B, Zhaw HB, Bi J N and Cai BL. (2007). Biodegradation of phenol by free and immobilized Acinetobacter sp.
strain PD12. J. Environ. Sci. 19: 222–225. WHO (1994). Phenol: Environmental Health Criteria-EHC 161: Author:
Geneva, Switzerland. Yang RD, Humphrey AE (1975). Dynamic and steady state studies of
phenol biodegradation in pure and mixed cultures. Biotechnol.
Bioeng. 17: 1211-1235. Zhang X, Wiegel J (1990). Sequential anaerobic degradation of 2, 4-
dichlorophenol in freshwater sediments. Appl. Env. Microbiol. 56:
1119-1127.

Vol. 9(16), pp. 1162-1164, 22 April, 2015
DOI: 10.5897/AJMR2014.7344
Article Number: 16C978552665
ISSN 1996-0808
Copyright © 2015
Author(s) retain the copyright of this article http://www.academicjournals.org/AJMR
African Journal of Microbiology Research
Short Communication
Resistance of heavy metals on some pathogenic bacterial species
Aditi Singh*, Maitreyi Mishra, Parul Tripathi and Shweta Sachan
Amity Institute of Biotechnology, Amity University Uttar Pradesh, Lucknow Campus, Malhaur, Gomti Nagar Extension, Lucknow- 226028, India.
Received 19 December, 2014; Accepted 20 March, 2015
Microorganisms are known to be highly sensitive to the presence of heavy metals and some of the early attempts to control microorganisms had used copper sulphate as plant fungicide and mercury salts for some infectious diseases; but, the order of toxicity varies among different organisms and in general mercury and silver are more toxic than manganese and zinc. It has been seen that responses of organisms to heavy metal occur at concentration considerably below those at which they response to alkali and alkaline earth metal occur. Here an attempt has been made to study the susceptibility and resistance pattern of three common pathogenic bacteria, Klebsiella pneumonia, Escherichia coli and Staphylococcus aureus against heavy metals. The inhibitory effect of different concentrations of five metal salts, namely chromium, nickel, iron, cobalt and zinc on microbial growth were studied using gel diffusion method. Results show that all three study organisms were completely resistant for all concentrations of chromium and iron salts. E. coli and S. aureus were most susceptible for zinc and nickel salts as compared to K. pneumonia. In all salts, zones of inhibition were increased along with increasing concentrations of salts and maximum inhibition was seen at 150 mM concentration. All the three microbes were highly susceptible for zinc. Key words: Chromium, iron, metal salts, resistant.
INTRODUCTION Microorganisms are ubiquitous in nature and involved in almost all biological processes of life. Heavy metals have been found in increasing proportions in microbial habitats because of rapid urbanization and natural processes (Issazadeh et al., 2013). Metals like nickel, copper (Clausen, 2000), cobalt and zinc have been playing a major role both directly or indirectly in almost all metabolic processes, growth and development of microorganisms (Tamer et al., 2013). However,
increasing concentrations of metals beyond tolerance levels have forced these organisms to adapt to various biological mechanisms to cope with this condition (Nikaido, 2009). Some mechanisms like metal efflux systems, complexation, reduction of metal ions or utilization of the metal as a terminal electron acceptor in anaerobic respiration helps microbes to tolerate heavy metal accumulation (Nageswaran et al., 2012). Bacteria that is resistant to such heavy metals
*Corresponding author. E-mail: [email protected]. Tel +91 9839009661; +91 522 2399553. Author(s) agree that this article remains permanently open access under the terms of the Creative Commons Attribution License 4.0 International License
Singh et al. 1163
Figure 1. Inhibition of test organisms by metal salts at 10mM concentration. The X-axis represents the
test organisms and the Y-axis represents the diameter of Zone of inhibition, measured in mm. Total resistance of organisms towards chromium and ferrous was observed, whereas only Klebsiella was inhibited by 10 mM CoCl2).
(Narasimhulu et al., 2010) and have the ability to grow in high concentrations of these metals play an important role in their biological cycling which has great potential in bioremediation of poorly cultivable soil high in heavy metal content (Nyamboya et al., 2013). The present study is formulated to evaluate the effect of increasing metal salt concentration on growth of bacteria. Five metals such as cobalt chloride, zinc sulphate, chromium oxide, ferric chloride and nickel sulphate were used for metal tolerance tests against three strains (K. pneumonia, E. coli and S. aureus) in which K. pneumonia and E. coli are Gram negative whereas S.aureus is Gram positive. MATERIALS AND METHODS
Test organisms
Three common organisms S. aureus (ATCC25923), E. coli
(ATCC25922) and K. pneumonia (ATCC700603) were included in the study. The organisms were made as stock by mixing 100 µl of suspension in 10 ml of sterile nutrient broth and grown overnight. The organisms were maintained by subculturing them on nutrient agar at regular intervals and used throughout the study.
Preparation of metal salts Five metal salts such as cobalt chloride, zinc sulphate, chromium oxide, ferric chloride and nickel sulphate were used in this study. One molar stock solution of metal salts was prepared, from which dilutions of different molarities (10, 50, 100 and 150 mM) were prepared.
Testing of microbial susceptibility to metal salts
The microbial susceptibility test was done by gel diffusion method.
After preparing Nutrient Agar plates, four wells of 0.5 mm width and 0.5 mm depth were made at equal distance on each plate aseptically. Separate plates were inoculated with 50 µl of E. coli, K.
pneumonia and S. aureus. For each test organism, 50 µl of salt solutions of different molarities was put in the wells and plates were
incubated at 37C for 24 and 48 h. Antimicrobial activity was expressed in terms of zone of inhibition (mm). Each experiment was repeated thrice and average was taken.
RESULTS AND DISCUSSION Though many metals are essential for growth, some can be harmful for living organisms (Reilly, 1991). This is mainly due to the fact that heavy metals form complexes with protein molecules and inactivate them (Shanker et al., 2004). Three different microbes were taken in this study and their susceptibility patterns were studied against heavy metal salts. The organisms responded in a variety of patterns. Zones of inhibition were observed at different concentrations of salts and the results are demonstrated in Figure 1.
For cobalt chloride, K. pneumonia was found to be more susceptible than the other two. Figure 1 shows that CoCl2 at 10 mM concentration was highly susceptible for K. pneumonia strain while the other microbes have demonstrated resistance against the provided concen-tration of metals. At increasing concentrations, all three organisms were inhibited and showed no resistance.
There was no inhibition on growth for any of the test organisms with CrO2 and FeSO4 salt solution and all microbes showed complete resistance till the highest concentration used; that is, 150 mM.
The results for nickel sulphate (NiSO4) demonstrated that S. aureus and E. coli had a high susceptibility and
1164 Afr. J. Microbiol. Res. less resistance to the metal. K. pneumonia was resistant at the lowest used concentration; that is, 10 mM; however it was inhibited by increasing the concentration of NiSO4. E. coli has shown largest zone of inhibition at all concentrations of NiSO4, indicating more susceptibility for the salt when compared with the other two.
All the test organisms showed a strong susceptibility towards the ZnSO4 salt and growth was inhibited for all the test bacteria with K. pneumonia being least affected.
A number of studies have shown that microorganisms have the capacity to resist antibiotics and heavy metals, which may be extremely harmful to human being and animals (Samanta et al., 2012; Monchy et al., 2003; Silver, 1996). The current study also demonstrates effective inhibition of growth of the microbes by salts. In future, the work can be extended to some other salts, some other strains of bacteria and at lesser and higher concentrations. Much more studies in this regard are required to be done. The metal tolerant nature of bacteria has tremendous potential in the bioremediation of heavy metal accumulation in soil and water (Karthikeyan and Kulakow, 2003) and also in the treatment of sewage and toxic wastes (McIntyre, 2003). Conflict of interests The authors did not declare any conflict of interest. REFERENCES
Clausen CA (2000). Isolating metal-tolerant bacteria capable of removing copper, chromium, and arsenic from treated wood. Waste Manag. Res. 18:264-268.
Issazadeh K, Jahanpour N, Pourghorbanali F, Raeisi G, Faekhondeh J (2013). Heavy metals resistance by bacterial strains. Ann. Biol. Res. 4(2):60-63.
Karthikeyan R, Kulakow PA (2003). Soil plant microbe interactions in phytoremediation. Adv. Biochem. Eng. Biotechnol. 78:51-74.
McIntyre T (2003). Phytoremediation of heavy metals from soils. Adv.
Biochem. Eng. Biotechnol. 78:97-123.
Monchy S, Benotmane A, Janssen P, Vallaeys T, Taghavi S, van der
Lelie D, Mergeay M (2003). Ralstonia metallidurans, a bacterium
specifically adapted to toxic metals: towards a catalogue of metal
resistance genes. FEMS Microbiol. Rev. 27(2-3):385-410. Nageswaran N, Ramteke PW, Verma OP, Pande A (2012). Antibiotic
susceptibility and heavy metal tolerance pattern of serratia
marcescens isolated from soil and water. J. Bioremediation Biodegrad. 3:158.
Narasimhulu K, Sreenivasa Rao PS, Vinod AV (2010). Isolation and
identification of bacterial strains and study of their resistance to heavy metals and antibiotics. J. Microb. Biochem. Technol. 2:74-76.
Nikaido H (2009). Multidrug resistance in Bacteria. Annu. Rev.
Biochem. 78:119-146. Nyamboya RA, Okemo PO, Ombori O (2013). Heavy metal and
associated antibiotic resistance of fecal coliforms, fecal streptococci
and pathogens isolated from wastewaters of abattoirs in Nairobi, Kenya. J. Appl. Biosci. 64:4858-4866.
Reilly C (1991). Metal Contamination of Food. London and New York:
Elsevier Science Publishers Ltd. 2nd ed. Samanta A, Bera P, Khatun M, Sinha C, Pal P, Lalee A, Mandal A
(2012). An investigation on heavy metal tolerance and antibiotic resistance properties of bacterial strain Bacillus sp. isolated from
municipal waste. J. Microbiol. Biotechnol. Res. 2(1):178-189. Shanker AK, Djanaguiraman M, Sudhagar R, Jayaram R,
Pathmanabhan G (2004). Expression of metallothionein 3 (MT3) like protein mRNA in Sorghum cultivars under chromium stress. Curr. Sci. 86:901-902.
Silver S (1996). Bacterial resistance to toxic metal ions – a review. Gene 179:9-19.
Tamer A, Aysenur K, Sadik D (2013). Antibiotic levels and heavy metal
resistance in Gram-negative bacteria isolated from sea water Iskenderun Organized Industrial zone. J. Appl. Biol. Biosci. 7(1):10-14.

African Journal of
Microbiology Research
Related Journals Published by Academic Journals African Journal of Biotechnology African Journal of Biochemistry Research Journal of Bacteriology Research Journal of Evolutionary Biology Research Journal of Yeast and Fungal Research Journal of Brewing and Distilling
Copyright © 2022 FDOKUMEN