Michele Larcher Ph.D. Thesis - Unitn-eprints.PhD
187
Monographs of the School of Doctoral Studies in Environmental Engineering DOCTORAL SCHOOL IN CIVIL, ENVIRONMENTAL AND MECHANICAL ENGINEERING Spatial planning to integrate climate change adaptation at local level Parveen Kumar 2015
-
Upload
khangminh22 -
Category
Documents
-
view
0 -
download
0
Transcript of Michele Larcher Ph.D. Thesis - Unitn-eprints.PhD
Monographs of the School of Doctoral Studies in Environmental Engineering DOCTORAL SCHOOL IN CIVIL, ENVIRONMENTAL AND MECHANICAL ENGINEERING
Spatial planning to integrate climate change adaptation at local level
Parveen Kumar
2015


Doctoral thesis in Environmental Engineering, XXVII Cycle Faculty of Engineering, University of Trento Academic year 2014/2015 Supervisor: Dr. Davide Geneletti (University of Trento) University of Trento Trento, Italy 2015


“Only within the moment of time represented by the present century has one species -- man --
acquired significant power to alter the nature of the world.”
(Rachel Carson, Silent Spring, 1962)

I

II
Acknowledgement
The three years of my PhD has been an incredible and life changing learning experience which has culminated into this piece of research work. Like a journey of a thousand miles it started with a single step; a step towards answering my curiosity, a single question to solve one small problem. I cannot say that this journey was easy, but numerous people have helped me see it through with their support and encouragement. Before you read the details about the destination of this journey in the chapters of the thesis, I will like to recount the details of the journey itself in this acknowledgement with fond memories and heartfelt gratefulness to all those who have accompanied me as my supervisors, research collaborators, family, friends or critiques.
First of all I would like to express my heartfelt and deepest gratitude to my supervisor Dr. Davide Geneletti, who has been a constant source of support, encouragement and who has shown complete faith in me. I thank him for giving me my personal space and freedom to explore different ideas, precise guidance and at the same time key critiques of this work. He helped me find my way around a relatively new area of expertise with patience and I am thankful to him for inspiring me to write this piece academic work.
This research work would not be possible without the help of Professor Kamal Bawa (University of Massachusetts, Boston, USA) and Professor Harini Nagendra (Azim Premji University, Bangalore, India). I sincerely acknowledge Dr. Bawa’s efforts in introducing me to the wonderful research organisation of Ashoka Trust for Research in Ecology and the Environment (ATREE) and hosting me for my fieldwork. His insightful thoughts, suggestions and discussion on environmental issues and concerns in Darjeeling region helped me develop the case study on Eastern Himalaya, Darjeeling District.
This research work was greatly shaped by Dr. Nagendra and her work on Bangalore urban area. I have come to deeply respect and admire her work, engagement in environmental campaigns as well as her work ethics and promptness in reviewing my work. This research work was benefitted by her collaboration and supervision for developing the Bangalore case study. I am also thankful to her for helping me out with data collection, introducing me to key sources and funding some of the data under USAID PEER grant to ATREE.
I also take this opportunity to sincerely acknowledge the Department of civil, environmental and mechanical engineering, University of Trento, for providing the research funding for this Ph.D. research and to the department staff for their daily administrative help.
I would like to gratefully acknowledge field assistant and translator Manjunath and Hita

III
Unnikrishnan from ATREE, Bangalore, India for their tremendous help in conducting the interviews and helping in data collection for Bangalore urban area. Also I would like to thank ATREE, Bangalore staff for making my stay comfortable and helping with field work logistics. I thank Dr. Ganesan Balachander, (Director), Dr. Veena Srinivasan (Fellow), Ameya Gode (Research Associate), Madhvi, Hemalatha G, N. Ramesh from (Staff ) ATREE for administrative and technical help. I expand my thanks to fellow ATREE colleagues Sandeep Sen, Paramesh M, Aniruddha Marathe, Vidyadhar Atkore, Venkat ramanujam, Shweta Basnett, Yangchenla Bhutia, Urbashi Pradhan and many more for their love and support.
I am grateful to Dr Sarala Khaling (Regional Director), Samuel Thomas, Michelle Gurung, Rinchen Angmu, Anand Gazmer, Tenzing Sherpa, Arjun Rai, Prakash Tamang and Rajen Chettri from ATREE, Darjeeling office. Without their help it would not be impossible to find my way around Darjeeling district. I thank them for linking me to the network of local organisations and government official for my research work. I am grateful to the local government organisation District Magistrate office, Darjeeling Gorkha Hill council, West Bengal forest department and Tea Board of India based in Darjeeling and Kurseong. I am deeply grateful to Anugyalaya Darjeeling Diocese Social Service Society specially Arpan Emmanuel Rai, Robert Lepcha, Christofer Lepcha and his family for hosting my stay during my field work. I would also like to thank other organisation likes Save the Hills, Chai, Darjeeling Municipality, FOSEP, West Bengal Regional Planning Department/Siliguri Jalpaiguri Development Authority, District health office, PRERNA for their insightful discussion and observation. I would like to thank Mrs. Hashi Roy, from Census of India, Delhi office, for proving and helping me with the census data.
I am grateful to all the people that I met in Trento during the last three years. I would like to particularly thank our research group: Paolo, Francesco, Elena, Marika, Lidya, Cristina, Carlos, Linda and Blal as well as colleagues from 27 Cycle for their support and invaluable advice. I would also like to acknowledge the Indian community in Trento: Dhaval, Raju, Prashant, Pramod, Kiran, Pradanesh, Tinku, Jinu, Sajid, Meera, Prasanta, Aridam and many more. At the same time also thank our landlord Antonella Righi, Conotter Renzo, Chiara and Nicolo for integrating us into their your family and making us feel at home away from home.
I would also like to thank some of my friends and family from SPA, New Delhi and University of Twente, Netherlands, namely, Chaki (long hours of English editing), Arun, Suru, Ravi, Mota, KKV, Arnab, Namita, Parvesh, Madhushree, Daljeet, Chotu, Yamini, Gaurav, Rishi, Tanmoy, Shukhad and Mitava.
My special thanks to my parents, Prem Lal and Kamala as well as my brother Nishu for supporting me at every step that I have taken; starting from a small village in Himachal to my PhD studies in

IV
Italy, not knowing where life would take me next. I am grateful to my In-laws Samir, Krishna, Kunal and Sandhya for their support and encouragement and for letting me marry their daughter when I was doing my PhD without knowing what the future hold for me.
Finally I am grateful to my wife Maitreyi for her motivation, patience, constructive criticism and long hours of English and scientific editing. Words are not enough to express my deep emotions and love. This thesis would not be possible without your help. I might be thought behind this work but shape of this work is only possible because of you.
(Parveen Kumar)

V

VI
Contents
CONTENTS .............................................................................................................................................................. VI
LIST OF FIGURES .................................................................................................................................................... X
LIST OF TABLES ................................................................................................................................................... XII
SUMMARY ............................................................................................................................................................ XIV
CHAPTER 1 ................................................................................................................................................................. 1
1 INTRODUCTION .............................................................................................................................................. 2
1.1 BACKGROUND .................................................................................................................................................. 2 1.2 ROLE OF SPATIAL PLANNING TO MANAGE CLIMATE CHANGE ISSUES ................................................................. 5 1.3 KEY GAPS ......................................................................................................................................................... 7
1.3.1 Translation of climate science knowledge to spatial plans at various spatial scales ............................ 7 1.3.2 Lack of understanding of the core issues ............................................................................................... 8 1.3.3 Lack of tools and methods at various spatial scales .............................................................................. 8 1.3.4 Policies and decision interplay .............................................................................................................. 9
1.4 RESEARCH OBJECTIVES AND UNDERLYING QUESTIONS ................................................................................... 10 1.5 THESIS OUTLINE ............................................................................................................................................. 10
CHAPTER 2 ............................................................................................................................................................... 13
2 HOW IS CLIMATE CHANGE ISSUES INTEGRATED INTO SPATIAL PLANS? ................................ 14
2.1 INTRODUCTION .............................................................................................................................................. 14 2.2 STUDY CONTEXT ............................................................................................................................................ 15
2.2.1 Emerging patterns of urbanization in India and effects of climate change .......................................... 15 2.2.2 Climate change discourse in India and international standing ........................................................... 17 2.2.3 The policy context: Indian planning policy process ............................................................................. 18
2.3 METHODS ....................................................................................................................................................... 19 2.3.1 Developing the review framework ....................................................................................................... 19 2.3.2 Scoring spatial plans against the evaluation criteria .......................................................................... 22 2.3.3 Selection of the sample of spatial plans ............................................................................................... 23 2.3.4 Data analysis ....................................................................................................................................... 24
2.4 RESULTS ......................................................................................................................................................... 25 2.4.1 Overall performance of spatial plans .................................................................................................. 25 2.4.2 Performance by components ................................................................................................................ 25 2.4.3 Performance by the criterion under each component .......................................................................... 27 2.4.4 Performance of cities across India ...................................................................................................... 30
2.5 DISCUSSION ................................................................................................................................................... 30
CHAPTER 3 ............................................................................................................................................................... 35
3 INTRODUCTION TO THE CASE STUDIES .............................................................................................. 36
3.1 BANGALORE CITY PROFILE ............................................................................................................................. 36

VII
3.1.1 Introduction ......................................................................................................................................... 36 3.1.2 Geography ........................................................................................................................................... 37 3.1.3 Demography and economy .................................................................................................................. 38 3.1.4 Urbanization and Environmental Issues .............................................................................................. 38 3.1.5 Governance and planning in Bangalore .............................................................................................. 39
3.2 SECOND CASE STUDY: DARJEELING DISTRICT PROFILE .................................................................................. 40 3.2.1 Introduction ......................................................................................................................................... 40 3.2.2 Geography ........................................................................................................................................... 40 3.2.3 Climate ................................................................................................................................................. 41 3.2.4 Demography and economy .................................................................................................................. 41 3.2.5 Environmental issues ........................................................................................................................... 42 3.2.6 Governance .......................................................................................................................................... 43
CHAPTER 4 ............................................................................................................................................................... 45
4 SPATIAL ASSESSMENT OF CLIMATE CHANGE VULNERABILITY AT LOCAL LEVEL: AN OVERVIEW OF AN INDIAN CITY, BANGALORE ............................................................................................ 46
4.1 INTRODUCTION .............................................................................................................................................. 46 4.2 STUDY AREA .................................................................................................................................................. 48 4.3 METHOD ........................................................................................................................................................ 49
4.3.1 Exposure .............................................................................................................................................. 49 4.3.2 Sensitivity ............................................................................................................................................. 50 4.3.3 Impact .................................................................................................................................................. 52 4.3.4 Adaptive capacity ................................................................................................................................. 53 4.3.5 Assessing potential vulnerability pattern ............................................................................................. 54 4.3.6 Cluster analysis ................................................................................................................................... 55
4.4 RESULTS ......................................................................................................................................................... 55 4.4.1 Exposure .............................................................................................................................................. 55 4.4.2 Sensitivity ............................................................................................................................................. 57 4.4.3 Impact .................................................................................................................................................. 57 4.4.4 Adaptive capacity ................................................................................................................................. 59 4.4.5 Overall vulnerability ............................................................................................................................ 60 4.4.6 Potential vulnerability profiling ........................................................................................................... 60
4.5 DISCUSSION ................................................................................................................................................... 64
CHAPTER 5 ............................................................................................................................................................... 67
5 SPATIAL VULNERABILITY ASSESSMENT AND PERCEPTION OF PEOPLE TO CLIMATE CHANGE IN DARJEELING HIMALAYA ............................................................................................................ 68
5.1 INTRODUCTION .............................................................................................................................................. 68 5.2 DATA AND METHOD ........................................................................................................................................ 70
5.2.1 Study Area ............................................................................................................................................ 70 5.2.2 Method and Data ................................................................................................................................. 71 5.2.3 Secondary data .................................................................................................................................... 73 5.2.4 Primary Data ....................................................................................................................................... 74
5.3 RESULTS ......................................................................................................................................................... 76

VIII
5.3.1 Spatial vulnerability pattern of climate change at Block level ............................................................ 76 5.3.2 Overall vulnerability pattern of climate change in Darjeeling district ................................................ 79
5.4 SPATIAL VULNERABILITY PATTERN OF CLIMATE CHANGE AT SITE LEVEL FROM PERCEPTION OF PEOPLE .......... 82 5.4.2 Perception of people and overall vulnerability at site level ................................................................. 84
5.5 DISCUSSION ................................................................................................................................................... 85
CHAPTER 6 ............................................................................................................................................................... 91
6 ASSESSING THE EFFECT OF ECOSYSTEM BASED POLICIES FOR ADAPTATION TO CLIMATE CHANGE IN DARJEELING HIMALAYA ............................................................................................................ 92
6.1 INTRODUCTION .............................................................................................................................................. 92 6.2 CASE STUDY AND METHOD ............................................................................................................................ 94
6.2.1 Case Study ........................................................................................................................................... 94 6.2.2 Method ................................................................................................................................................. 95
6.3 RESULTS ....................................................................................................................................................... 100 6.3.1 Land use change analysis .................................................................................................................. 100 6.3.2 Ecosystem services and scenario analysis ......................................................................................... 101 6.3.3 Socio-economic modelling ................................................................................................................. 103
6.4 DISCUSSION ................................................................................................................................................. 108
CHAPTER 7 ............................................................................................................................................................. 111
7 SYNTHESIS ................................................................................................................................................... 112
7.1 OBJECTIVE 1 ................................................................................................................................................ 112 7.1.1 Main findings ..................................................................................................................................... 112 7.1.2 Strength and weakness ....................................................................................................................... 113 7.1.3 Future research .................................................................................................................................. 114
7.2 OBJECTIVE 2 ................................................................................................................................................ 114 7.2.1 Main findings ..................................................................................................................................... 114 7.2.2 Strengths and weaknesses .................................................................................................................. 115
7.3 OBJECTIVE 3 ................................................................................................................................................ 116 7.3.1 Main findings ..................................................................................................................................... 116 7.3.2 Strength and weakness ....................................................................................................................... 117 7.3.3 Future research .................................................................................................................................. 117
7.4 POLICY IMPLICATION .................................................................................................................................... 117 7.5 REQUIRED REFORMS IN ORGANIZATIONAL AND PLANNING PRACTICES ......................................................... 118 7.6 CONCLUSION ................................................................................................................................................ 119
BIBLIOGRAPHY .................................................................................................................................................... 121
APPENDIX 1. THE SCORING FRAMEWORK TO ASSESS THE INFORMATION WITHIN THE CRITERIA ............................................................................................................................................................... 141
APPENDIX 2. SPATIAL PLANS FROM VARIOUS CITIES IN INDIA ........................................................... 147
APPENDIX 3. PERFORMANCE OF SPATIAL PLANS FOR VARIOUS CITIES ACROSS INDIA ............ 149
APPENDIX 4. DATA SOURCE AND DATA PREPARATION ........................................................................... 151
APPENDIX 5. WARD WISE VULNERABILITY ASSESSMENT FOR CLIMATE CHANGE OF

IX
BANGALORE CITY (OUTCOME VALUES ARE SCALED ON 0-1 RANGE) ............................................... 159
APPENDIX 6. HOUSE HOLD SURVEY .............................................................................................................. 164

X
List of Figures
FIGURE 1-1: RELATIONSHIP BETWEEN VULNERABILITY, IMPACTS AND POLICY RESPONSE (IPCC 2001) ......................... 5 FIGURE 1-2: MAIN STAGES OF CITY BASED CLIMATE CHANGE ADAPTATION. BASED ON (GAGNON-LEBRUN AND
AGRAWALA, 2006) ................................................................................................................................................ 9 FIGURE 1-3: INTERRELATIONSHIP OF THE AIM, OBJECTIVES OF THE THESIS WITH POLICIES .......................................... 12 FIGURE 2-1: LEVELS OF URBANIZATION IN INDIA (2011) .............................................................................................. 16 FIGURE 2-2: THE POPULATION DENSITY MAP OF INDIA SHOWING SELECTED CITIES FOR WHICH SPATIAL PLANS WERE
EVALUATED. ........................................................................................................................................................ 24 FIGURE 2-3: FREQUENCY DISTRIBUTION OF EVALUATION SCORES FOR INDIVIDUAL SPATIAL PLAN. ............................... 26 FIGURE 2-4: PERFORMANCE OF SPATIAL PLANS BY COMPONENTS, 3A) AWARENESS COMPONENTS, 3B) ANALYSIS
COMPONENT AND 3C) ACTION COMPONENT. ....................................................................................................... 26 FIGURE 2-5: CRITERIA PERFORMANCE OF AWARENESS COMPONENT OF SPATIAL PLANS. ............................................... 28 FIGURE 2-6: CRITERIA PERFORMANCE OF ANALYSIS COMPONENT OF SPATIAL PLANS. ................................................... 28 FIGURE 2-7: CRITERIA PERFORMANCE OF ACTION COMPONENT OF SPATIAL PLANS. ...................................................... 29 FIGURE 3-1: GROWTH OF BANGALORE FROM 1537 TO 2007 (SOURCE: ADAPTED FROM H.S SUDHIRA AND H. NAGENDRA
(2013) ................................................................................................................................................................. 37 FIGURE 4-1: THE STUDY AREA BANGALORE METROPOLITAN CITY, INDIA AND LAND COVER MAP 2014, DEVELOPED
FROM LANDSAT 8 IMAGE FROM HTTP://LANDSAT.USGS.GOV/ FOR JUNE 2014. ..................................................... 48 FIGURE 4-2: SCHEMATIC OVERVIEW OF SPATIAL MULTI-CRITERIA EVALUATION (SMCE) FOR CLIMATE CHANGE
VULNERABILITY ASSESSMENT ............................................................................................................................. 54 FIGURE 4-3: SPATIAL DISTRIBUTION OF THE EXPOSURE COMPONENTS OF CLIMATE CHANGE VULNERABILITY AND
ASPECTS OF EXPOSURE COMPONENT A)EXPOSURE, A1) NUMBER OF DAYS OF TEMPERATURE ABOVE 30OC, A2)
MEAN TEMPERATURE, A3) RAINFALL GREATER THAN 830 MM AND A4) NUMBER OF DAYS ABOVE 30 MM RAIN. . 56 FIGURE 4-4: SPATIAL DISTRIBUTION OF SENSITIVITY COMPONENT OF CLIMATE CHANGE VULNERABILITY AND ASPECTS OF
SENSITIVITY COMPONENT B) SENSITIVITY, B1) PHYSICAL AND ECONOMIC ASPECT, B2) SOCIAL ASPECT AND B3)
ENVIRONMENTAL ASPECTS. ................................................................................................................................. 58 FIGURE 4-5: SPATIAL DISTRIBUTION OF CLIMATE CHANGE IMPACTS AND ASPECTS OF IMPACT C) SENSITIVITY, C1)
PHYSICAL AND ECONOMIC ASPECT, C2) SOCIAL ASPECT AND C3) ENVIRONMENTAL ASPECT. .............................. 59 FIGURE 4-6: SPATIAL DISTRIBUTION OF ADAPTIVE CAPACITY COMPONENT CLIMATE CHANGE VULNERABILITY AND
ASPECTS OF ADAPTIVE CAPACITY COMPONENT D) ADAPTIVE CAPACITY, D1) SOCIAL ASPECT, D2) BASIC
FACILITIES ASPECT AND D3) ECOLOGICAL ASPECT. .............................................................................................. 61 FIGURE 4-7: SPATIAL DISTRIBUTION OF OVERALL VULNERABILITY AND FIGURE 4-8: POTENTIAL VULNERABILITY
PROFILES. ............................................................................................................................................................ 62 FIGURE 4-9: FRAIMAN MEASURE FOR COMPONENTS OF VULNERABILITY ASSESSMENT (REMARK: THE SMALLER THE
VALUE, THE LARGER THE INFLUENCE OF A PARTICULAR COMPONENT IN THE RESULTING OUTPUT) ...................... 62 FIGURE 4-10: FRAIMAN MEASURE OF ALL THE ASPECTS OF VULNERABILITY ASSESSMENT ........................................... 63 FIGURE 4-11: FRAIMAN MEASURE OF ALL THE INDICATORS OF VULNERABILITY ASSESSMENT ..................................... 63 FIGURE 5-1: THE STUDY AREA DARJEELING DISTRICT, INDIA AND LAND COVER MAP 2014, AND LOCATION OF SELECTED
SITE FOR DETAILED ANALYSIS.............................................................................................................................. 71 FIGURE 5-2: SPATIAL DISTRIBUTION OF THE EXPOSURE COMPONENTS OF CLIMATE CHANGE VULNERABILITY AND
ASPECTS OF EXPOSURE COMPONENT. A) EXPOSURE A1) MEAN TEMPERATURE A2) RAINFALL A3) NUMBER OF DAYS
> 50 MM RAIN. .................................................................................................................................................... 78

XI
FIGURE 5-3: SPATIAL DISTRIBUTION OF SENSITIVITY COMPONENT OF CLIMATE CHANGE VULNERABILITY AND ASPECTS OF
SENSITIVITY COMPONENT B) SENSITIVITY B1) PHYSICAL ASPECT B2) SOCIO-ECONOMIC ASPECT B3)
ENVIRONMENTAL. ............................................................................................................................................... 80 FIGURE 5-4 : SPATIAL DISTRIBUTION OF ADAPTIVE CAPACITY COMPONENT CLIMATE CHANGE VULNERABILITY AND
ASPECTS OF ADAPTIVE CAPACITY COMPONENT C) ADAPTIVE CAPACITY C1) BASIC FACILITIES ASPECT C2)
ECONOMIC ASPECT AND C3) SOCIAL ASPECT. ...................................................................................................... 81 FIGURE 5-5: SPATIAL DISTRIBUTION OF VULNERABILITY PATTERN TO CLIMATE CHANGE IN DARJEELING DISTRICT ...... 82 FIGURE 5-6: SITE WISE EXPOSURE COMPONENT ASSESSMENT AND PERCEPTION OF LOCAL PEOPLE ON KEY SENSITIVITY
INDICATORS ......................................................................................................................................................... 83 FIGURE 5-7: SITE WISE SENSITIVITY COMPONENT ASSESSMENT AND PERCEPTION OF LOCAL PEOPLE ON KEY SENSITIVITY
INDICATORS ......................................................................................................................................................... 84 FIGURE 5-8: SITE WISE ADAPTIVE CAPACITY COMPONENT ASSESSMENT AND PERCEPTION OF LOCAL PEOPLE ON KEY
ADAPTIVE CAPACITY INDICATORS ........................................................................................................................ 85 FIGURE 5-9: SITE WISE SPATIAL VULNERABILITY PATTERN TO CLIMATE CHANGE AMONG COMMUNITIES IN DARJEELING
DISTRICT ............................................................................................................................................................. 86 FIGURE 5-10: SITE WISE VULNERABILITY ASSESSMENT BY LOCAL PEOPLE PERCEPTION ................................................ 86 FIGURE 6-1: THE STUDY AREA GHIS AND LEIS WATERSHEDS, DARJEELING DISTRICT AND LAND COVER MAP 2014. ...... 95 FIGURE 6-2: LAND USE FOR 2001, 2014, 2030 ........................................................................................................... 101 FIGURE 6-3: RESULTS OF ECOSYSTEM SERVICES FOR FOOD PRODUCTION FOR CURRENT AND FUTURE LAND USE
SCENARIOS. ....................................................................................................................................................... 104 FIGURE 6-4: RESULTS OF ECOSYSTEM SERVICES FOR TIMBER PRODUCTION FOR CURRENT AND FUTURE LAND USE
SCENARIOS. ....................................................................................................................................................... 104 FIGURE 6-5: RESULTS OF ECOSYSTEM SERVICES FOR CARBON SEQUESTRATION FOR CURRENT AND FUTURE LAND USE
SCENARIOS. ....................................................................................................................................................... 104 FIGURE 6-6: RESULTS OF ECOSYSTEM SERVICES FOR SOIL RETENTION FOR CURRENT AND FUTURE LAND USE SCENARIOS.
......................................................................................................................................................................... 104 FIGURE 6-7: RESULTS OF ECOSYSTEM SERVICES FOR WATER YIELD FOR CURRENT AND FUTURE LAND USE SCENARIOS.
......................................................................................................................................................................... 105 FIGURE 6-8: DESCRIPTIVE COMPARISON AMONG VILLAGES A) SOCIAL GROUP, B) YEARLY HOUSEHOLD INCOME AND C)
FOOD SECURITY. ............................................................................................................................................... 105 FIGURE 6-9: CLIMATE CHANGE IMPACTS ACCORDING TO INFORMANT FROM VARIOUS VILLAGES, A) DIRECT IMPACTS AND
B) INDIRECT IMPACTS. ....................................................................................................................................... 105 FIGURE 6-10: LAND USE CHANGE COMPARISON ......................................................................................................... 107

XII
List of Tables
TABLE 2-1: TRENDS IN URBANIZATION IN INDIA (1961-2011) ...................................................................................... 15 TABLE 2-2: THE REVIEW FRAMEWORK DEVELOPED FOR THIS STUDY. .......................................................................... 21 TABLE 2-3: DESCRIPTIVE STATISTICS OF OVERALL PERFORMANCE AND VARIOUS COMPONENTS ACROSS ALL SPATIAL
PLANS. ................................................................................................................................................................ 27 TABLE 2-4: CORRELATION MATRIX FOR THE THREE COMPONENTS OF CLIMATE CHANGE ISSUE. .................................... 27 TABLE 3-1: CHANGES IN NUMBER OF WATER BODIES DURING 1973 TO 2007 ................................................................ 38 TABLE 3-2: DARJEELING DISTRICT GENERAL INFORMATION. ........................................................................................ 40 TABLE 3-3: CLIMATE CHANGE CONCERNS IN DARJEELING DISTRICT ............................................................................ 42 TABLE 4-1: INDICATORS USED TO MEASURE THE EXPOSURE COMPONENT. .................................................................... 49 TABLE 4-2: INDICATORS USED TO MEASURE THE SENSITIVITY COMPONENT. ................................................................. 50 TABLE 4-3: INDICATORS USED TO MEASURE THE ADAPTIVE CAPACITY COMPONENT. .................................................... 52 TABLE 5-1: SOCIO-DEMOGRAPHIC PROfiLE OF SELECTED SITES IN THE STUDY AREA ..................................................... 72 TABLE 5-2: INDICATORS USED TO MEASURE CLIMATE CHANGE VULNERABILITY. ......................................................... 75 TABLE 6-1: POTENTIAL ECOSYSTEM SERVICES IDENTIFIED IN THE STUDY AREA AND THOSE ANALYSED ARE IN BOLD .. 97 TABLE 6-2: SOCIO-DEMOGRAPHIC PROfiLE OF THE VILLAGES IN THE STUDY AREA ..................................................... 100 TABLE 6-3: LIVELIHOOD SOURCE AND AGRICULTURE ASSET....................................................................................... 106 TABLE 6-4: SUMMARY OF BENEFICIARIES, INDICATORS AND POLICIES FOR SCENARIOS FOR DIFFERENT ECOSYSTEM
SERVICES ........................................................................................................................................................... 107

XIII

XIV
Summary
Climate change is directly or indirectly affecting cities, regions or even nations in multiple ways. Impacts are exponential and repetitive with increased instability of climate pattern, socio-ecological systems, increased inequalities and distribution of resources. It is therefore necessary that social and economic hubs and potential resource rich region should become the catalyst that encourages the focus on climate change policies. Despite having various international and national climate change frameworks and forums it is unclear how international, national and even local governments develop response actions to climate concerns and integrate them into different spatial scales. Developing and mainstreaming effective response actions to climate change into numerous sectors, cross-sectoral policies is a complex issue which has plagued policy makers at different spatial scales and on different policy arenas.
In order to efficiently integrate and sensitizing society towards climate change issues, decision makers and different stakeholders have to develop insightful information bases, share awareness of climate change risks, vulnerability patterns and finally develop response actions at all level of policy preparation through policy integration, implementation or structural reforms.
This study contributes towards understanding climate change risks and perception within spatial planning policies at local level. This has been undertaken by investigating, testing or developing real spatial planning policies, vulnerability assessment frameworks and decision support systems that aim to improve current spatial planning tools intended at building climate resilient living spaces. This study was divided into three main stages 1) To develop and test an assessment framework to track integration of climate change issues into spatial planning, 2) To identify hot spots of climate change at urban/regional levels by applying spatial vulnerability assessment tools and 3) To apply eco-system based adaption responses to climate change in an urban region and identifying barriers.
Drawing the case study from India, in the first stage, an attempt was made to understand how spatial plans in India are incorporating climate change issues and identifying potential gaps. Spatial plans across various cities in India were examined with the help of a review framework that was developed upon Moser and Loer’s (2008) work on ''Managing climate risks''. The second stage presents a climate change vulnerability assessment framework and its working methodology at local spatial scale, considering three main components: exposure, sensitivity and adaptive capacity. The vulnerability assessment framework was applied to an urban area in India, namely, Bangalore and a hill district of Eastern Himalaya namely Darjeeling. In the final stage of this study, ecosystem services based adaptation responses within spatial planning was studies to

XV
understand how it can increase adaptive capacity and address climate changes issues.
The results of this study identified key concerns to climate change issues and its integration in India. The policy analysis shows that the role of spatial plans to integrate climate change issues at local levels like urban areas and regions in India are still limited. Local policies and spatial plans shows low level of awareness, moderate level of analytical capability and limited action responses to integrate climate change issues at local level. Spatial policies in India are still limited to physical and economic issues and undermine the issues of climate change. The application of vulnerability assessment framework demonstrated that it successfully provided a spatial assessment of climate change vulnerability patterns. The spatial pattern of vulnerability identifies areas requiring urgent attention to adaptation action, enabling policy intervention and prioritizing action. At the same time an analysis of the perception of people also confirmed the results of vulnerability assessment at local level. Finally the results showed how ecosystem services based response actions when applied within spatial planning can play an important role to mitigate the effects of climate change and adapt to local climate concerns with least negative repercussions.
The findings of this study creates a platform for discussion on decision making process and the potential aspects where climate change issues can become a part of spatial planning policy. Climate change mitigation and adaptation for short terms may fulfill objectives for current climate scenarios but may impose externalities in future. So, policy makers and local development organization need to carefully narrate future climate resilient scenarios. This study is the reflection of the interrelationship between the existing information bases, knowledge gaps, policy preparation practices, analytical capability, participation and technological innovation in climate change integration at local spatial scale.

1
Chapter 1

2
1 Introduction
1.1 Background
It is predicted that cities will account for 60% of the world population by 2030 and increase by 70% by 2050 (UN habitat, 2015). As the world population is transitioning from rural to urban regions, these areas are becoming hubs of human induced changes fuelled by development and in turn affecting the environment around it. With fast paced urbanization as well as aging and inadequate infrastructure, cities are likely to struggle in the coming decade to cope with the stress of water, sewage, transportation and other basic infrastructure. This will be further exasperated by the changing climate and exposure to extreme climate events such as hurricanes, typhoons, droughts and floods. Climate change is and will continue to critically impact the socio-economic fabric of the urban system (Rosenzweig et al., 2011). A range of impacts will be observed in the form of increased urban system instability, declines in socio-economic productivity and increased inequities and distribution of resources. It is therefore necessary that urban areas become centre of climate change policies rather than just national scale initiatives. The discourse on climate change initiatives at urban level is only recently gaining momentum. Year 2014 was a landmark in these initiatives with mayors from 40 cities pledging to fight climate change by committing to reduce GHG emissions and account for their progress annually. The key partners of this global compact were C40 Cities Climate Leadership Group (C40), ICLEI – Local Governments for Sustainability (ICLEI) and the United Cities and Local Governments (UCLG) and additionally supported by the UN-Habitat. This initiative is expected to help policy makers in cities and financial institutions that aid in infrastructural development to improve their understanding on the potential impacts of climate change at city level, where support can offered and funding directed. With the global community acknowledging the importance of climate change initiatives at city level, it is becoming apparent that urban areas, small or big, could be one of the key catalysts to engage in mitigation actions to climate change as well implementation of adaptation measures.
Increased variability and instability of climate stimuli have adverse impacts on the operation of urban systems and its hinterlands (Field, 2012; Field et al., 2014). The consequences range from loss of agricultural production, increased dry spell and water shortages, loss of lives and livelihood during the extreme events like floods, heat waves, droughts to second order impacts of climate change in the form of loss of local ecosystem, increased number of health problems, economic inequalities etc. (Rannow et al., 2010; Rosenzweig et al., 2011). The vulnerability of cities to climate change is also closely linked to its geography and its latitudinal location. While the latitudinal location determines the energy usage of the cities in the form air conditioning, heating systems and maintenance of artificial temperatures in buildings and housings, the

3
geography of the urban areas determines its proximity to specific eco-zones and the issues inherently appended to it. For example, historically a large number of cities have been developed close to lakes, river and seas where the problem of flooding is becoming a frequent issue due to impermeable surfaces, lack of green spaces for absorption and ominous drainage conditions. In addition to these two factors, people in developing nations facing poverty, disparity, health risks and political and economic instability are more severely impacted by climate change (Baker et al., 2012a; Satterthwaite, 2007). For example, slums in big cities are high-risk sites , improper housing on floodplains or steep slopes will be the first to be affected during floods, landslide and other extreme weather conditions (Revi, 2008; Satterthwaite, 2007). Changes in climate variables not only affects physical assets of people or urban area but also affects livelihood, capacity stock to local institution and social network of urban systems (Habitat, 2011a). All these factors result on a low baseline resilience of urban systems to climate change and show that urban regions are the spatial regions where vulnerability are most visible and apparent (Field et al., 2014; Habitat, 2011a; Satterthwaite, 2007). Altogether, these critical issues of climate change in the urban system pose the question on how to develop effectively or integrate climate change adaptation response actions within local policies of urban regions.
The early impacts of climate change focused on ecosystems and agriculture and scientist all but ignored the effects on cities which were thought to be inherently adaptable (Comment, Nature 2010). It is only in the past decade that various organizations, government bodies and scientists have begun to assess the first and second order impacts of climate change at city level to develop complex models at small scales that can factor in the urban stressors such as heat islands, air pollution and urban design (Rosenzweig et al., 2011). Even then, majority of studies and assessment reports on the emerging effects of climate change have been climate science-driven (Preston et al., 2011; Rannow et al., 2010). There has been an urgency to act on the scientific assessments of climate change on cities and integrate the know how into policy making (Field et al., 2014). This is easier said than done, given the lack of consensus on methods and financial or human resource disparity among different nations, making climate change a difficult entity to integrate into policies (Satterthwaite, 2007). For example many fast growing developing countries in Asia, Africa and South America are facing severe impacts of climate change but lack the necessary financial and natural resources to act on climate change issues (Field et al., 2014; Habitat, 2011a; Revi, 2008). On the other hand, majority of developed countries of the world although being the key green house gas emitter stress that the developing countries need to take actions without giving them the financial support necessary to undertake such initiatives (Corfee-Morlot et al., 2009; Habitat, 2011a; Urwin and Jordan, 2008).
Integrating climate change issues into general planning policy to specific action plans has become a “wicked problem” for decision makers across the world (Baker et al., 2012a; Brooks et al., 2009;

4
Field et al., 2014; Urwin and Jordan, 2008). Today most international research organizations are investigating and developing frameworks to integrate climate change at all levels of policy processes that will support mitigation, adaption and sustainable development (Lim et al., 2005). Climate change issues have started emerging in mainstream focus areas in general policy making process across the world (Brooks et al., 2009; Field, 2012) and a number of authors have addressed how climate change can be integrated into the planning process (Lim et al., 2005; Urwin and Jordan, 2008; Wilson and Piper, 2010; Yohe and Tol, 2002).
In order to effectively integrate and sensitizing society towards climate change issues, decision makers have to share awareness, recognize changing climatic variable and possible impacts on socio-ecological system of the region (Snover et al., 2007). To integrate climate changes issues into policies at various spatial scales and preparing the society to plan for the possible impacts of climate change, policy makers and decision maker need to recognize key concerns, viz. awareness of climate change drivers and impacts, analysis of effects in the form risk and vulnerability and finally response action at all level of policy preparation through policy integration, implementation or structural reforms at local level (Baker et al., 2012a; Moser and Luers, 2008). These three components are defined as follows: Components to integrate climate change into spatial policies Awareness Comprehensive awareness of the key drivers of changing climate variables and its consequences in
needed in order to make an informed decision (Lindseth, 2004). Analysis Involves assessment of risk, impacts at various spatial scales by integrating, quantifying, and
synthesizing available information (Füssel and Klein, 2006; Snover et al., 2007). Action Attempts to use analysis to develop target policies and plans to address locally identified climate
change risks and steps that the local government plan to employ to reduce climate change vulnerability (Biesbroek et al., 2010; Biesbroek et al., 2009; Tompkins et al., 2010).
Definitions: Climate change impacts and responses Climate change Impacts The effects of climate change on natural and human systems
Potential impacts All impacts that may occur given a projected change in climate, without considering adaptation
Residual impacts The impacts of climate change that remain after adaptation measures have been taken
Mitigation Intervention (by government, institutions, companies etc.) to reduce emissions of greenhouse gases to the atmosphere; it includes strategies to reduce greenhouse gas sources and emissions and enhancing greenhouse gas sinks (It is also referred to as reducing the anthropogenic forcing of the climate system)
Adaptation The adjustment in natural or human systems in response to actual or expected climates and weathers, or their effects, in order to moderate harm or exploit beneficial opportunities. Distinct types of adaptation: anticipatory,

5
autonomous and planned adaptation Vulnerability
Vulnerability is the degree to which a system is susceptible to, and unable to cope with, adverse effects of climate change, including climate variability and extremes. Vulnerability is a function of the character, magnitude, and rate of climate change and variation to which a system is exposed, its sensitivity, and its adaptive capacity.
Source: IPCC, 2007c: Appendix- Glossary
Figure 1-1: Relationship between vulnerability, impacts and policy response (IPCC 2001)
1.2 Role of spatial planning to manage climate change issues
Spatial planning has been seen as an instrument and a framework that plays a critical role for sustainable development at various scales. The modern planning practices emerged after the European Industrial Revolution. Since then spatial planning practices have been changing as problems arise from rapid urbanization. In the past few decades spatial planning policies and processes have been undergoing a more widespread change to its policy structure and objectives. Initially, spatial planning practices concentrated on protecting health and well-being. Under the basic planning provisions stressors included developing sewerage, control of sprawl, location of industry and the creation of pleasing aesthetic spaces. Recently, spatial planning has been updated to include environmental protection, public participation and the imperative sustainable development in a ‘broad sense’ (Bruff and Wood, 2000; Bulkeley and Betsill, 2005; Owens, 2004; Owens and Cowell, 2011). In 2002, the world summit on sustainable development emphasized on to importance of specific aspects of climate change assessment and implementation. In most developed and developing countries spatial planning policies for climate change issues are not

6
seen as potential policy instrument. Indeed, many of the principles that had begun to creep into land use and transport planning during the 1990s was limited to reduction of emissions of greenhouse gases (Kumar and Geneletti, 2015).
The potential scope of spatial planning to combat climate change is huge because it is not just an environmental problem but deals with a myriad of issues spanning distribution and access to all shared resources such as water, atmosphere, land and energy. Therefore, different authors and researchers have been debating on the most effective ways in achieving sustainable development and address the problems of climate change. For example, the IPCC insists that the effectual way to combat climate change is by influencing land use regulations, infrastructure planning and managing building plans (IPCC 2007). The Stern report on the other hand argues that the real operational measures should include taxation, trading, carbon pricing and technology innovation (Stern 2007. In contrast the European union’s White Papers on adapting climate change has a more holistic view articulated as “A more strategic and long term approach to spatial planning will be necessary, both on land and on the marine areas, including transport, regional development, industry, tourism and energy policies” (CEC, 2009a).
At national level some countries like the United Kingdom, Netherlands and Canada have placed emphasis on the role of spatial planning in delivering emission reduction, increasing adaptive capacity and decreasing vulnerability to various climate change events (Wilson and Piper, 2010). For example, the UK Climate Change Programme, Integration of water board and spatial planning in Netherlands and Canadian Municipalities has placed emphasis on the role of integrating spatial planning and environment issues into strategic planning documents or development control decisions. Some individual local governments across the UK like Leicester, Newcastle and Kirklees, are also developing climate change strategies to integrate climate change concern into land-use planning policies and decisions (Bruff and Wood, 2000; Wilson and Piper, 2010).
Currently different national and local governments see the need for precise definition of climate change risk (Field et al., 2014; Habitat, 2011a) and mostly need to formulate their policies that encourage environmental and climate-sensitive development instead of just advocating no development. Local governments, being the key centres of policy implementation, have several ways of influencing climate change impacts through mitigation or adaptation like control the conversion of energy to non-carbon sources, influence resident and local business behaviour through education, tax, and fee policy and other economic incentives or disincentives (Condon et al., 2009; Corfee-Morlot et al., 2009; Lindseth, 2004; Revi, 2008). However, most significant influence that the local governments can make are through decisions on urban form, primarily through urban planning and land use regulation (Condon et al., 2009; Tompkins et al., 2010; Urwin and Jordan, 2008). Local planning guide infrastructure investment and development control, that

7
have advance mitigation impact on climate change issues (Wilson and Piper, 2010). Policy makers, regulators political constituents and stakeholders at different spatial scale require clear understanding and decision support tools that illustrate climate change drivers, concern and impacts so they can make sound, locally relevant climate change strategies in form of mitigation or adaptation action response (Tompkins et al., 2010; Urwin and Jordan, 2008). Currently wide range of tools exists, a few of which have the capacity to work simultaneously at both the regional and local scale, or to capture the multiple consequences of regulatory decisions (Condon et al., 2009). However, they lack the ability to model real-time information and policy process implications. The integration of climate change issues into spatial planning requires an in depth research at not only a theoretical level, but also a practical level dependent on geography and spatial scale.
1.3 Key gaps
Developing effective climate change policies and mainstreaming them into various sectoral, cross-sectoral policies is a complex issue (Biesbroek et al., 2009). Having said that local level spatial systems have the potential role to act effectively on climate change issues in a number of ways (Biesbroek et al., 2009; Hurlimann and March, 2012). At local-level spatial plans are the basic policy framework that shapes social, economic and physical development of cities and at the same time interaction of these aspects become the main drivers of climate change issues at various scales (Wilson and Piper, 2010). Hence spatial planning has a bigger role to play at the local level to climate change issues as it specifies the interrelations and the effects of policy measures on spatial development and it can possibly act as an effective instrument for climate change adaptation response at local level (Wilson, 2006; Wilson and Piper, 2010). However recognising the spatial context and focus of this study there are a number of key challenges to formulating and integrate climate change adaptation solutions at local level. We are highlighting a few of these key challenges in a developing nation like India.
1.3.1 Translation of climate science knowledge to spatial plans at various spatial scales
Majority of cities in developing nations are still lacking the appropriate scientific information and knowledge to integrate climate change issues into current spatial or general policies (Biesbroek et al., 2009; Hurlimann and March, 2012). Majority of information and data available to the government, research organisations at international or national levels are at broad spatial scales and the way information is developed and produced by climate scientists limits its use to make decisions at local level (Opdam et al., 2009; Rannow et al., 2010). The scientific community and planning bodies at local level follow different philosophies (Bulkeley et al., 2009; Rosenzweig et al., 2011). While the scientific community adopts an evidence base, cause and effect chain approach, exploring historic and present data on climate stimuli, the planning community is
8
focused on generating integrated solutions that cover all issues addressed by spatial development (Pyke et al., 2007; Rosenzweig et al., 2011). Hence, there is a need for communication between scientists and decision-making that bridges the gap to formulate knowledge based decision support systems for developing climate change action at local level (Pyke et al., 2007).
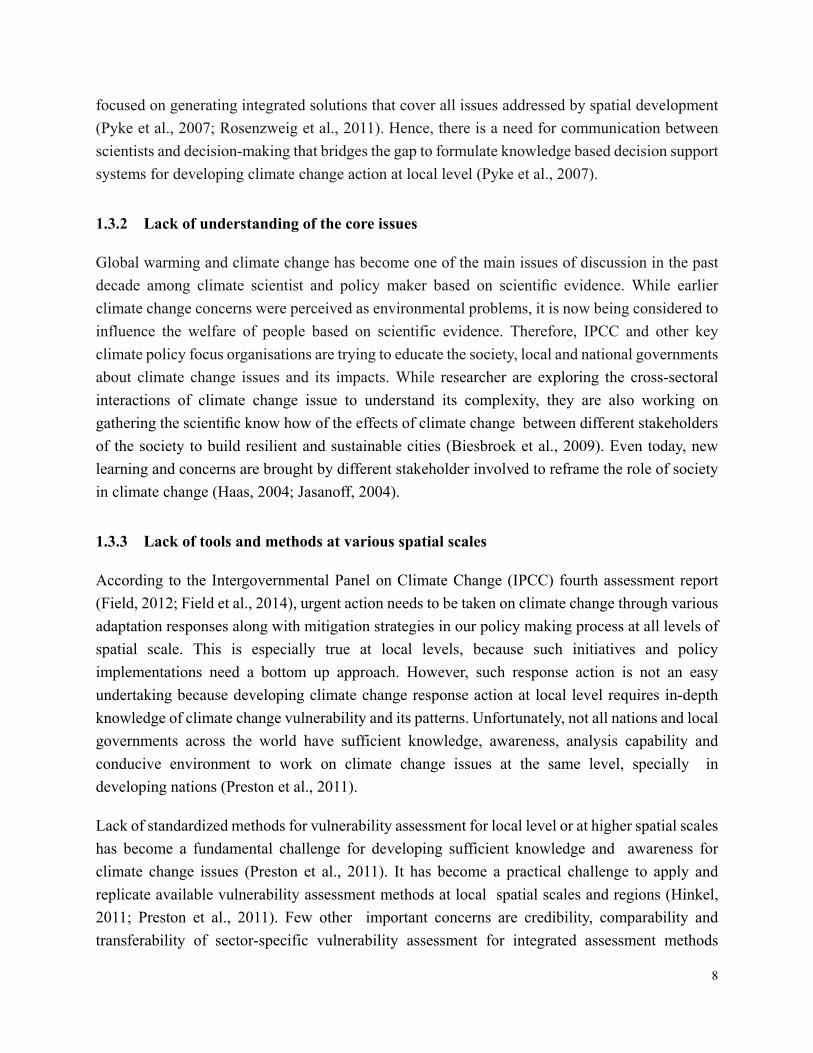
1.3.2 Lack of understanding of the core issues
Global warming and climate change has become one of the main issues of discussion in the past decade among climate scientist and policy maker based on scientific evidence. While earlier climate change concerns were perceived as environmental problems, it is now being considered to influence the welfare of people based on scientific evidence. Therefore, IPCC and other key climate policy focus organisations are trying to educate the society, local and national governments about climate change issues and its impacts. While researcher are exploring the cross-sectoral interactions of climate change issue to understand its complexity, they are also working on gathering the scientific know how of the effects of climate change between different stakeholders of the society to build resilient and sustainable cities (Biesbroek et al., 2009). Even today, new learning and concerns are brought by different stakeholder involved to reframe the role of society in climate change (Haas, 2004; Jasanoff, 2004).
1.3.3 Lack of tools and methods at various spatial scales
According to the Intergovernmental Panel on Climate Change (IPCC) fourth assessment report (Field, 2012; Field et al., 2014), urgent action needs to be taken on climate change through various adaptation responses along with mitigation strategies in our policy making process at all levels of spatial scale. This is especially true at local levels, because such initiatives and policy implementations need a bottom up approach. However, such response action is not an easy undertaking because developing climate change response action at local level requires in-depth knowledge of climate change vulnerability and its patterns. Unfortunately, not all nations and local governments across the world have sufficient knowledge, awareness, analysis capability and conducive environment to work on climate change issues at the same level, specially in developing nations (Preston et al., 2011).
Lack of standardized methods for vulnerability assessment for local level or at higher spatial scales has become a fundamental challenge for developing sufficient knowledge and awareness for climate change issues (Preston et al., 2011). It has become a practical challenge to apply and replicate available vulnerability assessment methods at local spatial scales and regions (Hinkel, 2011; Preston et al., 2011). Few other important concerns are credibility, comparability and transferability of sector-specific vulnerability assessment for integrated assessment methods

9
(Hofmann et al., 2011). In addition, vulnerability assessment methods defined for higher spatial scales are difficult to implement at local levels (Holsten and Kropp, 2012; Kumar et al., 2013; Rannow et al., 2010). This is evident from the fact that the few comprehensive vulnerability assessment studies at regional spatial scales are very general and at the same time demonstrate the difficulty in translating output and knowledge into policies given that they do not define degree and magnitude of the results (Füssel and Klein, 2006; Laukkonen et al., 2009; Tol and Yohe, 2007). The absence of a standardised vulnerability assessment framework, to identify extent and magnitude of impacts of climate change for the decision support system for planning policy at local level, is crucial.
1.3.4 Policies and decision interplay
Including different perspective and developing collective conviction to integrate and formulate adaptation response action is the key challenge to spatial planning practices. Planning is exercised within and through government, and is subject to influence from various stakeholders, and it become a matter of trade-off, (Forester, 1999; Hurlimann and March, 2012). Planning decision relies on a range of actors, spatial context, market and collective choice. Wrong choices and decisions lead to policy failures at multiple scales and face severe repercussion (Hurlimann and March, 2012). Even having sufficient information, decision are based on politics and market interests (Roaf et al., 2009), institutional path dependency (Bulkeley et al., 2009), convenience of decisions (Howard and Monbiot, 2009), functional responsibilities and capacity through which climate change concepts can be transferred from policy principles into practice (Bulkeley, 2006; Wilson and Piper, 2010). Addressing these barriers will be critical for planning if it is to effectively facilitate adaptation actions to climate change at local level.
Figure 1-2: Main stages of city based climate change adaptation. Based on (Gagnon-Lebrun and Agrawala, 2006)
10
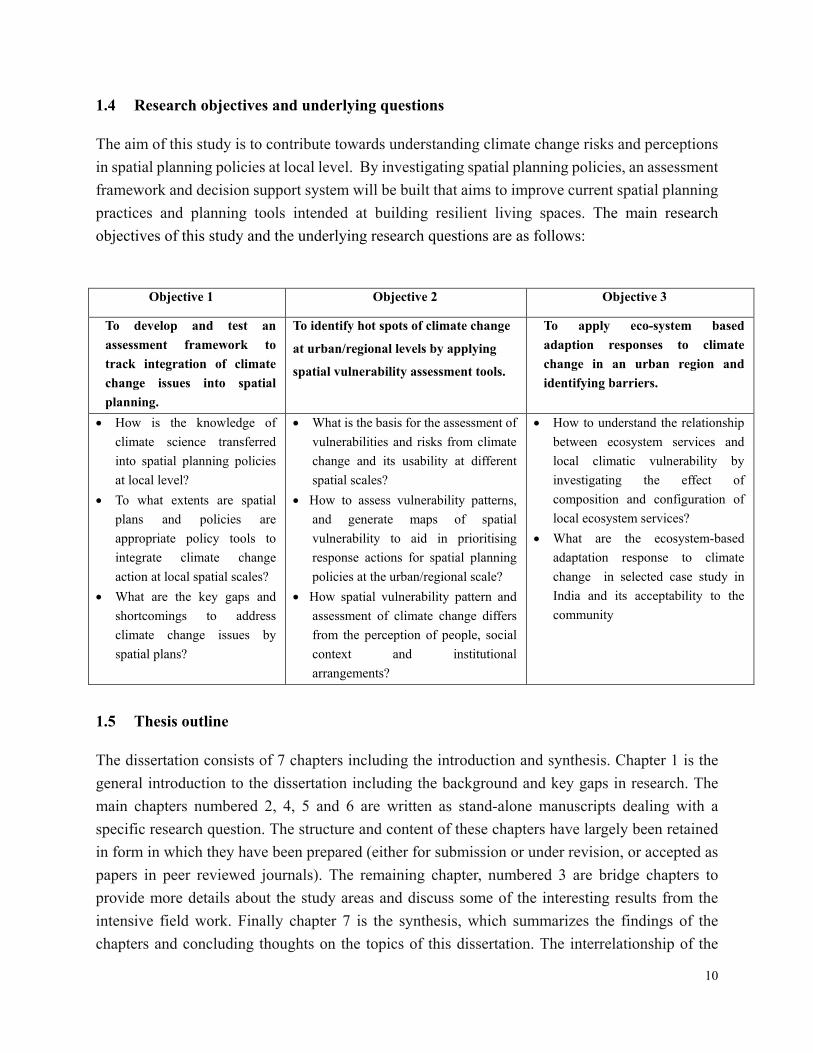
1.4 Research objectives and underlying questions
The aim of this study is to contribute towards understanding climate change risks and perceptions in spatial planning policies at local level. By investigating spatial planning policies, an assessment framework and decision support system will be built that aims to improve current spatial planning practices and planning tools intended at building resilient living spaces. The main research objectives of this study and the underlying research questions are as follows:
Objective 1 Objective 2 Objective 3
To develop and test an assessment framework to track integration of climate change issues into spatial planning.
To identify hot spots of climate change
at urban/regional levels by applying
spatial vulnerability assessment tools.
To apply eco-system based adaption responses to climate change in an urban region and identifying barriers.
• How is the knowledge of climate science transferred into spatial planning policies at local level?
• To what extents are spatial plans and policies are appropriate policy tools to integrate climate change action at local spatial scales?
• What are the key gaps and shortcomings to address climate change issues by spatial plans?
• What is the basis for the assessment of vulnerabilities and risks from climate change and its usability at different spatial scales?
• How to assess vulnerability patterns, and generate maps of spatial vulnerability to aid in prioritising response actions for spatial planning policies at the urban/regional scale?
• How spatial vulnerability pattern and assessment of climate change differs from the perception of people, social context and institutional arrangements?
• How to understand the relationship between ecosystem services and local climatic vulnerability by investigating the effect of composition and configuration of local ecosystem services?
• What are the ecosystem-based adaptation response to climate change in selected case study in India and its acceptability to the community
1.5 Thesis outline
The dissertation consists of 7 chapters including the introduction and synthesis. Chapter 1 is the general introduction to the dissertation including the background and key gaps in research. The main chapters numbered 2, 4, 5 and 6 are written as stand-alone manuscripts dealing with a specific research question. The structure and content of these chapters have largely been retained in form in which they have been prepared (either for submission or under revision, or accepted as papers in peer reviewed journals). The remaining chapter, numbered 3 are bridge chapters to provide more details about the study areas and discuss some of the interesting results from the intensive field work. Finally chapter 7 is the synthesis, which summarizes the findings of the chapters and concluding thoughts on the topics of this dissertation. The interrelationship of the

11
main aim, objectives of the thesis with chapters is also illustrated in Figure 1-3.
The title of the chapters is as follows:
Chapter 1: Introduction
Chapter 2: How are climate change concerns addressed by spatial plans?
Chapter 3: Introduction to the case studies
Chapter 4: Spatial assessment of climate change vulnerability at the city scale: an overview of Indian city Bangalore
Chapter 5: Spatial assessment and perception of people to climate change in Darjeeling Himalaya
Chapter 6: Assessing importance of ecosystem based policies for adaptation to climate change in Darjeeling Himalaya
Chapter 7: Synthesis

12
Figure 1-3: Interrelationship of the aim, objectives of the thesis with policies

13
Chapter 2 This chapter is based on: Kumar, P., Geneletti, D., (2015). How are climate change concerns addressed by spatial plans? An evaluation framework and an application to Indian cities. Land Use Policy 42, 210-226.

14
2 How is climate change issues integrated into spatial plans?
2.1 Introduction
Addressing climate change issues requires different response actions at various spatial scales (Preston et al., 2011; Neil Adger et al., 2005). So far these responses have been in the form of international agreements, policy instruments, mitigation and adaptation policies focused especially on the global and national scale (Field et al., 2012; Parry, 2007). However, it has been observed the majority of policies and action response developed at global and national scale are unfit to act on climate change issues driven and experienced at local scale (Measham, 2011 ; Neil Adger, 2005 ). Climate change is a global concern but the drivers and effects are felt at regional and local scales. The goals pursued at the higher scales often clash with the problem faced at local scale (Rannow, 2010; Urwin, 2008). Therefore the issues of climate change should also be analysed and addressed at the local level.
A few studies from the United Kingdom and European Union show that developing effective response actions for climate change at local level may be beyond the capacity of local governments (Wilson, 2006). These observations emphasize the fact that there is a lack of awareness and knowledge on addressing climate change issues at the local scale (Moser, 2008; Neil Adger, 2005), information gap and technical expertise (Wilson, 2006), low level of political support and financial resources (Urwin, 2008; Moser, 2008) and significant disagreement among various stakeholders on climate change issues (Hulme, 2009). According to Wilson (2006) to incorporate climate change response actions at local level, development authorities require detailed information about climate change issues, climate change vulnerability, financial resources, technical expertise and political as well as public participation.
Developing effective climate change policies and mainstreaming them into various sectoral, cross sectoral policies is a complex issue (Biesbroek et al., 2009). Having said that at local scale, spatial policies have the potential role to effectively act on climate change issues in a number of ways (Biesbroek et al., 2009; Hurlimann and March, 2012). Spatial planning deals with two core aspects. First is to foster the community and institutional vision for future socio-ecological development under legal endorsements. The second is to control land use change and spatial development of the local area through allocation of space for various activities (Hurlimann and March, 2012). For example, spatial plans directly control the physical development of the city through urban design policies by giving permission for various infrastructures like transportation, industries, housing and resource allocations for social and public amenities. It also provides guidance for land use change that affects ecological aspects in the form of land fragmentation,

15
ecosystem, biodiversity and other natural resources. Thus local-level spatial plans are the basic policy framework that shapes social, economic and physical development of cities and at the same time interaction of these aspects become the main drivers of climate change issues at various scales (Wilson and Piper, 2010).
Hence spatial planning has a bigger role to play at the local level to climate change issues as it effects of policy measures on spatial development and it possibly has the potential to act as an effective instrument for climate change adaptation response at local level (Wilson, 2006; Wilson and Piper, 2010).
The goal of this paper is to critically review the incorporation of climate change issues in spatial plans across cities in India, and identify significant gaps and shortcomings. This study can potentially aid local governments to identify key areas where innovative response actions are required to foster a better planning practice in the future.
2.2 Study context
2.2.1 Emerging patterns of urbanization in India and effects of climate change
India is among the fastest growing economies of the world and has a target of 9 to 10% growth is GDP. The Planning commission 2008 categorically stated that this rate of growth depended on a vibrant urban sector which contributed to as much as 62% of the GDP. The current Five Year Plan (2012-2017) therefore considers this urban transition as a significant challenge requiring massive growth in infrastructural and services (Bhagat, 2011). In terms of demographics, urban growth refers to the increase in the percentage of population living in the urban areas. There has been a steady increase in the population in urban areas in different states in India (Table 2-1 and Figure 2-1).
Table 2-1: Trends in Urbanization in India (1961-2011)
Census Year Urban Population (in millions) Percentage Urban 1961 1971 1981 1991 2001 2011
78.94 109.11 159.46 217.18 286.12 377.10
17.97 19.91 23.34 25.72 27.86 31.10
Source: Adapted from (Bhagat, 2011) and census of India (various years)

16
Figure 2-1: Levels of Urbanization in India (2011)
The reason that the level of urbanization is important in the discourse in climate change is that, they can both catalyse climate change by encouraging growth, emissions and consumption and also be affected by climate change by encouraging population migration through droughts, floods and climate induced extreme weather events. Since cities have a characteristic of being locked in terms of changes in emissions and spatial characteristics that require at least decades to show any significant affects on climate change; developing countries like India have the power to change the way cities are build or expanded so that they can be sustainable and adapted to the effects of climate change. Big cities in India such as the metropolitan areas of Delhi, Kolkata and Mumbai may be beyond any type of mitigation action and the populations therein will have to adapt to the effects of climate change. But India can benefit from the new age sustainability revolution by incorporating international knowledge in planning smaller and middle sized urban areas in terms of being energy efficient, using renewable energy, waste water recycling, green infrastructure etc.

17
Risks in Indian cities due to climate change induced vulnerabilities • Loss of Livelihood due to disruption of work, displacement and health reasons. Indirect losses include loss
of financial assets, land rights, house or household rights and inadequate identification for rural migrants • Disruption of community safety and support due to displacement and forced migration • Less resilient population to potential climate distress due to repeated risk exposure, negative net income and
loss of assets • Low access to public services in overpopulated urban areas or urban hinterlands leading to high expenditure
for basic needs such as water, electricity and health
• Greater vulnerability due to unsound debt system, economic inequality, political patronage and organized crime which might increase in times of crisis.
Source: Adapted from Mukhopadhyay and Revi, 2009
2.2.2 Climate change discourse in India and international standing
India is the third largest emitter of Green House gases in the world and it is predicted that its emission will increase by 3.4 % per year and India will account for 10% of CO2 emission by 2035 (IEA, 2013) . International pressure is therefore mounting on India to sign treaties that legally binds it to reduce emissions. Scholars in India have however maintained that international agreements should be based on historic and per capita emissions with the developed countries not only reducing their emissions first but also providing financial remunerations for mitigation and adaptation actions in developing countries (Thaker and Leiserowitz, 2014). This stand among Indian climate change advocates has been prevalent since the late 1980’s when the Indian government was pushing for a market oriented economy to accelerate growth. In spite of this strong position, scholars do recognise that India is among the most vulnerable countries in the world (Cruz, 2007) with at least half the population dependent on agriculture or other climate sensitive sectors (statistics, 2010). Moreover, the current urbanization model in India is unsustainable and unless alternative models are put into place, urban centres in India will significantly affect the vulnerable and also be responsible for the increase in massive amounts of GHG emissions (Mukhopadhyay and Revi, 2009). Therefore International scholars are now noting two significant changes in the climate change discourse in India: 1) There is a shift in the position of the government in international and domestic forums on India’s responsibility to reduce emissions by efforts such as constituting a Council on Climate Change and mandated eight national missions to address energy security among other vulnerabilities as part of Nation Action Plan on Climate Change (NAPCC 2008) (Thaker and Leiserowitz, 2014). 2) The current climate change discourse in India is trickling down from the elite group of scholars, NGOs and foreign policy experts to government bodies and policy makers in the Centre, state and city level.

18
2.2.3 The policy context: Indian planning policy process
The Central, State and Local governments are responsible for preparing and implementing various policies pertaining to poverty reduction, population control, providing and improving socio- economic facilities and environmental protection across India. In India, the Central Government lays down policies and priorities of development work with the help of the Planning Commission (Policy preparation institution of the Government of India) and allocates central funds to states for various developmental activities (Commission, 2008, 2011). Then the State and Local government prepare development plans for various developmental activities under the purview of 73rd and 74th Amendments of the Indian Constitution (Ansari, 2004). There are two types of plans that are prepared by local governments: spatial plans and city development plans. In India, spatial plans are referred to comprehensive, cross-sectoral, co-ordinating spatially oriented planning in the public sector. These are long-term policy plans (20-25 years) focussing on spatial-economic development for settlements and cities and it optimise the spatial distribution of land uses. Whereas the City development plans are short-term plan (7 years) aimed at encouraging reforms for fast track planned development of urban infrastructure, service delivery mechanisms and community participation in the cities. Policy documents differ in terms of content and approach. Spatial plans have a legal support and guides development of cities through regulatory framework such as bylaws and standards for various activities. City development plans on the other hand are seen as a priority action plans for various infrastructure activities and instrument to finance these activities.
In India, historical evidence of spatial planning dates back to the first intensively developed settlements of early civilizations, known as the Indus Valley Civilisation (Khan and Lemmen, 2013). It was well-planned space with organic growth. The modern planning practices emerged after the European Industrial Revolution. Since then spatial planning practices have been changing with problems emerging from rapid urbanization. Modern planning practices in India find its roots in the British rule in the Indian subcontinent between 1858 and 1947 (Mukherjee, 2011). They initiated basic planning practices to seek and protect health and well-being. Under the basic planning provision, they developed sewerage, control of sprawl, location of industry and the creation of pleasing aesthetic spaces. Recently, policy maker have included environmental protection, public participation and the imperative sustainable development into the spatial planning practices. Current planning practices are influenced by concepts form Europe, UK and USA, like Ebenezer Howard’s Garden City concept, Patrick Geddes’ concept of Survey-Analysis-Plan etc. The planning practice in India are changing gradually to add new layers of approaches and frameworks like Advocacy planning influenced from Neo-Marxist planners and neo liberal approaches derived from global and free market systems(Nath, 2007). Not all these new concepts and layers of approaches are integrated perfectly into the planning practices in

19
India. In the current state of social-ecological interaction due to internal and external forces becoming complex, challenges for the current spatial planning are addressing issues like multiple deprivation, sustainability, resource distribution and climate change etc.
2.3 Methods
2.3.1 Developing the review framework
Several authors have addressed the question of how climate change can be integrated into the various policy agendas by proposing different frameworks (Brooks et al., 2011; Lim et al., 2005; UNISDR, 2012; Urwin and Jordan, 2008). These frameworks have been widely used at different spatial scales by various international and national research organizations. Most of these assessment frameworks are outcome or sector oriented (Tang et al., 2010), and are used to understand the key gaps and issues related to the climate concerns into policies (Preston et al., 2011; Urwin and Jordan, 2008; Wilson, 2006). The experiences of these frameworks were adapted and used as a reference to develop the review framework for this study, which focuses on the process and potential outcome of spatial plans in future.
Preparing cities to the adverse impact of climate changes, local development authorities require capacity building for climate change adaptation (Moser and Luers, 2008). UKCIP (2003) and Moser and Luers (2008) broadly identify three main components to build adaptive capacity to cope with climate change issues, namely awareness, analysis and action (also known as the 3A’s). This study adapted the core concept of UKCIP (2003) and Moser and Luers (2008) of the 3A’s to understand the integration of climate change issues at local level in various cities in India. However, the usability of the 3A approach at various cities in India or other developing countries has its limitation. For example, in the case of India, most spatial plans are in different stages of application and potential impacts of various sectoral policies under spatial plans are unknown. It could be hard to apply 3A approach directly as it is unable to capture the essence of comprehensive development on climate change issues. Majority of cities in India are still struggling with basic issues like physical development, poverty and environment in general and ways to integrate climate change issues along with these basic issues is a big question. Using the 3A components to review spatial plans in India requires the development of a set of criteria under each component that reflect the range of activities that might be expected in the spatial plan and planning process. Thus, the framework defined earlier was adapted to synchronise with Indian spatial planning policies, to form the new review framework. To do this, a pilot analysis was conducted to identify various issues covered under each spatial plan in different cities in India. Results of the pilot analysis showed that the key areas dealt within the spatial plan are issues like awareness, participation, physical development, public services and socioeconomic problems.

20
Based on previous studies on climate change, we identified the main issues that should be represented in spatial plans and correlated them to the ones already mentioned in the pilot study (Baker, 2012; Brooks, 2011; Wilson, 2010; Adger, 2007; Füssel, 2007). The final selection of criteria from the literature and initial analysis of the spatial plans aided in adapting the review framework. Identification of significant criteria in each component was a crucial step for this study to measure the ability of local authorities to address and plan for climate change issues. The majority of research study on climate change action response used multiple and complex variables to identify the impacts of climate change at various spatial scales (Neil Adger et al., 2005; Stern, 2006; UNISDR, 2012; Wilson and Piper, 2010). The criteria selected for this study from various climate change literature influence the geographic, political, social and economic settings of the region and are usually affected by many internal and external factors like decision-makers’ values and experiences, information base, participation, technical exposure and awareness of alternatives. Forty criteria were identified for this study depending upon the spatial scale and relevance. 4, 15 and 21 criteria were selected under awareness, analysis and action component of the review framework (Table 2-2). The number of criteria varies across the entire three components because of their relevance and cross-interaction across all the three components. The majority of these criteria under each component were chosen due to their primary focus on adaptation to climate change in planning policy at local level and while targeting either a single sector or, more broadly, any organization that is undertaking adaptation.
The awareness component aims at assessing to what extent the plan shows an understanding of the key drivers of climate change and its impacts at the local level (Baker et al., 2012; Lindseth, 2004). For instance, it includes criteria related to awareness of levels of greenhouse gas emissions (GHG) and their impacts on climate variables. Majority of cities in India conducts a basic inventory of GHG, but awareness about the impacts of GHG is lacking. The analysis component looks at the extent to which the spatial plan shows a capacity to analyse, quantify and synthesize the available information on climate change in a useful form to support planning decisions (Baumert et al., 2005; Brooks et al., 2011). Although the spatial plans deals with the driving factor of climate change issues and key forces to build adaptive capacity locally, like building infrastructures, land use policy, resource distribution, social and physical structures, the lack of understanding of the basic issues results in inefficient adaptation policies. A better understanding of cross interaction and impact between various factors can help to develop efficient response action for climate change adaptation. Finally, the action component assesses if and how the spatial plan contains specific responses to cope with climate change. These responses may include for example regulations related to physical, social development, but also actions aimed at reducing the vulnerability of the population (Biesbroek et al., 2010; Füssel, 2007; Tompkins et al., 2010).

21
Table 2-2: The review framework developed for this study. Component Criteria References Awareness Concept of climate change or global warming (Jabareen, 2013, Tang et al., 2010,
Parry, 2007) Prediction of the impacts of climate change on the biophysical/social/economic context of the planning area
(Hallegatte et al., 2011, Füssel, 2007, S. Agrawala, 2009)
Long term goals and targets for changing climate variability and its impacts
(Hallegatte et al., 2011, S. Agrawala, 2009, Neil Adger et al., 2005)
Guidance and standards for the implementation of adaptation and mitigation measures in planning area
(Hurlimann and March, 2012, Carter, 2011, Hallegatte et al., 2011)
Analysis
Base year assessment of GHG emission
(Hoornweg et al., 2011, Baumert et al., 2005)
Categorization of GHG emission type and source (Dodman, 2009, Baumert et al., 2005)
Future emission trends forecast (Hoornweg et al., 2011) GHG emission scenario development (Hoornweg et al., 2011, Moss et al.,
2010) Assessment of the physical development (Handmer, 2012, Habitat, 2011) Assessment of the transportation system in relation to climate change issues
(Habitat, 2011, Koetse and Rietveld, 2009)
Assessment of water and sanitation situation in relation to climate condition issues
(Handmer, 2012, Biesbroek et al., 2010, Bogner, 2007)
Assessment of energy demand and supply (Mitigation, 2011, R.E.H. Sims, 2007)
Assessment of land use change in relation to climate change.
(Ostle et al., 2009, Rounsevell and Reay, 2009)
Assessment of the consequence of the changing climate on natural and protected area.
(Naumann et al., 2010, Heller and Zavaleta, 2009)
Assessment of the consequence of the changing climate poverty distribution pattern
(Habitat, 2011, Eriksen et al., 2007)
Displacement and forced migration cause of changing climate variables
(Raleigh et al., 2008)
Assessment of the employment and livelihood structure (Barnett and Adger, 2007) Assessment of the sectoral economy of the planning area (Bernstein, 2007) Cost estimation of the physical asset disaster (Stern, 2006, Agency, 2012,
Weitzman, 2009, Heltberg et al., 2009)
Cost estimation for GHG emission reduction (Stern, 2006) Assessment of the organization and political support to have the capacity to act on climate change issues
(Urwin and Jordan, 2008, Lim et al., 2005)
Engagement of relevant stakeholders
(Held and Hervey, 2011a, Lim et al., 2005)
Definition of roles and responsibilities (Held and Hervey, 2011b,

22
Corfee-Morlot et al., 2009a) Exploitation of synergies with other climate change policies
(Held and Hervey, 2011a, Corfee-Morlot et al., 2009a)
Action
Disaster-resistant land use and building code (Habitat, 2011, Tang et al., 2010, Hallegatte, 2009)
Conservation of parks, forest and natural and protected area
(Naumann et al., 2010)
Infill development and reuse of remediated brown field sites
(Habitat, 2011, Tang et al., 2010)
Green building and green infrastructure standards. (Tang et al., 2010, Hallegatte, 2009) Low-impact design for impervious surface (Tang et al., 2010, Grimm et al.,
2008) Pedestrian and bicycle-friendly, transit-oriented community design
(Tang et al., 2010, Kahn Ribeiro, 2007)
Multimodal transportation strategies (Kahn Ribeiro, 2007) Climate proofing of transport infrastructure (Habitat, 2011, Kahn Ribeiro, 2007) Renewable energy and solar energy
(Tang et al., 2010, Rice, 2007, R.E.H. Sims, 2007)
Energy efficiency and energy stars
(Tang et al., 2010, Rice, 2007, R.E.H. Sims, 2007)
Waste management and GHG mitigation technologies (Bogner et al., 2008, Dechezleprêtre et al., 2008)
Waste water control and treatment (Semadeni-Davies et al., 2008) Policies to provide health facilities , insurance , food security and education
(Eriksen et al., 2007, Sperling, 2003, McGuigan et al., 2002)
Financial / budget commitment
(Neil Adger et al., 2005, McGuigan et al., 2002)
Identify role and responsibility among sectors and stakeholders
(Held and Hervey, 2011b, Corfee-Morlot et al., 2009b, Neil Adger et al., 2005)
Public awareness and education about the climate change issues
(Corfee-Morlot et al., 2009b, Neil Adger et al., 2005)
2.3.2 Scoring spatial plans against the evaluation criteria
These 3A components, each with sub criteria, provide a framework to review climate change integration across various spatial plans. In order to give a quantitative score to each criterion in the review framework, a set of rules was developed (appendix 1).
The evaluation of the individual spatial plan was conducted by scoring them against a criterion on a three-point scale (0, 1 or 2) following the analytical approach of previous studies on plan quality (Baker et al., 2012; Preston et al., 2011; Tang et al., 2010). The criterion was given a score 0 if

23
there was no evidence of the criterion throughout the spatial plan. A score of 1 was given if the criterion was acknowledged in the spatial plan, but lacked further details. Lastly, a score of 2 was given if the criterion was acknowledged and significant information and analysis was addressed in the spatial plan. The specific requirements associated with each possible score varied among different criterion, but generally followed a consistent system. The assigned scores were cross checked twice across the range of criterion for robustness. The scoring system is best illustrated with an example. Considering the criterion ‘Base year assessment of GHG emission’, a particular spatial plan is to receive a score of 0 if GHG emission is completely overlooked in spatial plans. Spatial plans to receive score 1 if the spatial plan has briefly mentioned about the overall picture of the GHG emission for the base year but no further information provided in the spatial plan. For a score of 2, the criteria have to provide the details on the amount of GHG emission and significant information about the sources of the emission within the spatial plan.
2.3.3 Selection of the sample of spatial plans
The selection of spatial plans was based upon few independent variables like population, special character of the region, capacity of the urban local body and availability of these documents in the public domain in India prior to 1 February 2013. During the selection of the spatial plan, first 54 cities from 24 states and 4 urban territories of India were identified as per the 1 million population criteria. After considering other criteria like special characters of the cities, financial capacity, risk /stress variable and finally accessibility of spatial plans and policies to the public, 46 cities were selected across India. Some of these cities have two categories of planning policies as mentioned in chapter 1.
This study considered both categories of policy documents, the first being spatial plans and the second city development plans. Of all the spatial plans available in the public domain at the time of study, the selected spatial plans were a convenience sample based on access to these documents, while new spatial plans continue to emerge. The selected spatial plans represent a broad range of geopolitical situations from various cities in India; include samples of traditional planning policies like master plans and new generation plans like city development plans (Figure 2-2). They have been prepared by local governments or under the governmental vision framework. Some spatial plans were developed by a single organization while others were prepared through cross-governmental working groups or committee (appendix 2).

24
Figure 2-2: The population density map of India showing selected cities for which spatial plans were evaluated.
2.3.4 Data analysis
The data analysis was conducted in three stages. In the first stage, the overall performance of the 59 spatial plans against 40 criteria was examined based upon the sum of the original scores (no standardization) for review framework. The second stage looked into the extent of integration of different components of climate change (awareness, analysis and action) into spatial plans. The sum of the original scores for each component was standardized on a 0-1 scale. Descriptive statistics was then used to assess the performance and interrelationship among the components. In the third stage, the performance of each criterion in all the spatial plans was evaluated using the performance analysis. The criterion performance analysis was performed based upon the work of Tang et al., (2010) on the depth and breadth scores in the climate change action plans. His depth and breadth percentage score analysis was an appropriate method to analyse the criterion performance on both aspects of relevance and extent of involvement in spatial plans that was not possible with the descriptive statistical analysis. The depth percentage score measures how much importance is given for each criterion in the spatial plan meaning how a criterion was addressed in the spatial plan (Equation 1). Whereas breadth analysis was used to measure the extent to which each criteria were addressed across all the spatial plans (Equation 2).

25
Breadth score(BS) 𝑗 = (𝑃𝑗 𝑁) ∗ 100⁄ (1)
Depth score(DS) 𝑗 = (∑ 𝐼𝑗𝑃𝑗𝑗=1 2𝑃𝑗) ∗ 100� (2)
Equation (1) and (2) represent the criterion breadth score and a depth score of jth criterion on the scale of 0-100 % and where, Pj is number of plans that address the jth indicator. N is the total number of spatial plans in the study and Ij is the jth indicator receiving scores on the scale of 0-2.
2.4 Results
2.4.1 Overall performance of spatial plans
Consistent with the evaluation framework adopted, the overall performance of the spatial plans is expressed by a score in the 0-80 range. This is because each criterion can have a maximum score of 2 and for 40 criteria; each spatial plan can have a maximum score of 80. Figure 2-3 show that none of the spatial plan provides comprehensive coverage of all the criteria under each component. It was observed that across all the evaluated spatial plans only 5.1% of the spatial plans ranged between 41-60 (50-75%), 76.3% of spatial plans between 21-40 (26-50%) and 18.6% of spatial plans fall under 1-20 (below 25%) score range. None of the spatial plan scored above 60 (above 75%). According to the descriptive statistics (Figure 2-3), the total mean score for overall performance of the spatial plans is 26.88 which is 33.5% of the total possible score on a scale of 0-80. The maximum and minimum score for a spatial plan was 50 (62%) and 14 (17.5%).
2.4.2 Performance by components
As shown in Table 2-3, the mean score for the awareness component was 0.09, analysis component was 0.23 and action component was 0.20. Figure 2-4 shows that only few spatial plans have significant awareness about climate change issues (about 3% of spatial plans) and only 10% of the spatial plans have relevant analysis and action strategies on climate change issues. 75% of the spatial plans do not demonstrate awareness, analysis and action response related to climate change issues in various cities of India. Table 2-3 reveals that the awareness towards climate change policies was considerably low across all spatial plans. An analysis component of the review framework performed better than action and awareness components during the assessment of spatial plans. In addition to this, Table 2-4 shows the correlation amongst the three components and indicates that the relationship between analysis and action components are significantly correlated (p< 0.01).

26
Figure 2-3: Frequency distribution of evaluation scores for individual spatial plan.
3a) 3b)
3c) Figure 2-4: Performance of spatial plans by components, 3a) Awareness components, 3b) Analysis component and 3c)
Action component.

27
Table 2-3: Descriptive statistics of overall performance and various components across all spatial plans. Variables Awareness Analysis Action Mean 0.09 0.23 0.20 Std. Deviation 0.16 0.12 0.12 Minimum 0.00 0.00 0.04 Maximum 0.88 0.55 0.65
Notes: The maximum score for each component of awareness, analysis and action is 1 and minimum 0 (after standardization).
Table 2-4: Correlation matrix for the three components of climate change issue.
Component Awareness Analysis Action
Awareness 1 Analysis .321* 1 Action .417** .758** 1 ** Significance at the 0.01 level (2-tailed).
2.4.3 Performance by the criterion under each component
2.4.3.1 Criteria performance of awareness components in spatial plans
It is evident from Figure 2-4 that few cities recognized the need to have long term goals to deal with the climate change issues. These include the awareness related to prediction of impacts of climate change on biophysical, social and economic spheres (23.7% breadth and 57.1% depth) and long term goals and impact of changing climate variables (23.7% breadth and 53.6% depth). Awareness about climate change issues is essentially the fundamental and foremost steps that need to be integrated into spatial plans and other sectoral policies. According to Tang et al., (2010) ''the low awareness about climate change issues in the policies are among the main reason of under performance of analysis and action components''. The relative depth score of the awareness component indicates that only few spatial plans included the different awareness criteria and most of them show low depth score when it comes to the awareness at local scales.
2.4.3.2 Criteria performance for analysis components in spatial plans
Majority of the spatial plans had conducted a moderate level of analysis for physical development, environment, and economics, social and organizational aspects of the broader level in the planning region. For example, this study indicates that all spatial plans conduct physical assessment of the planning region, assessment of the transportation system, water, sanitation and economic condition in cities and most of them have reasonable depth details. However, it was observed that the majority of these plans did not consider criteria such as cost estimation for GHG emission reduction and future emission trend forecasts. Less than 10% of the spatial plans consider GHG emission scenario and cost estimation of the physical asset disaster. Figure 2-6 shows the breadth

28
and depth scores for various criteria under the analysis component of climate change issues from sample of cities in India.
Figure 2-5: Criteria performance of awareness component of spatial plans.
Figure 2-6: Criteria performance of analysis component of spatial plans.
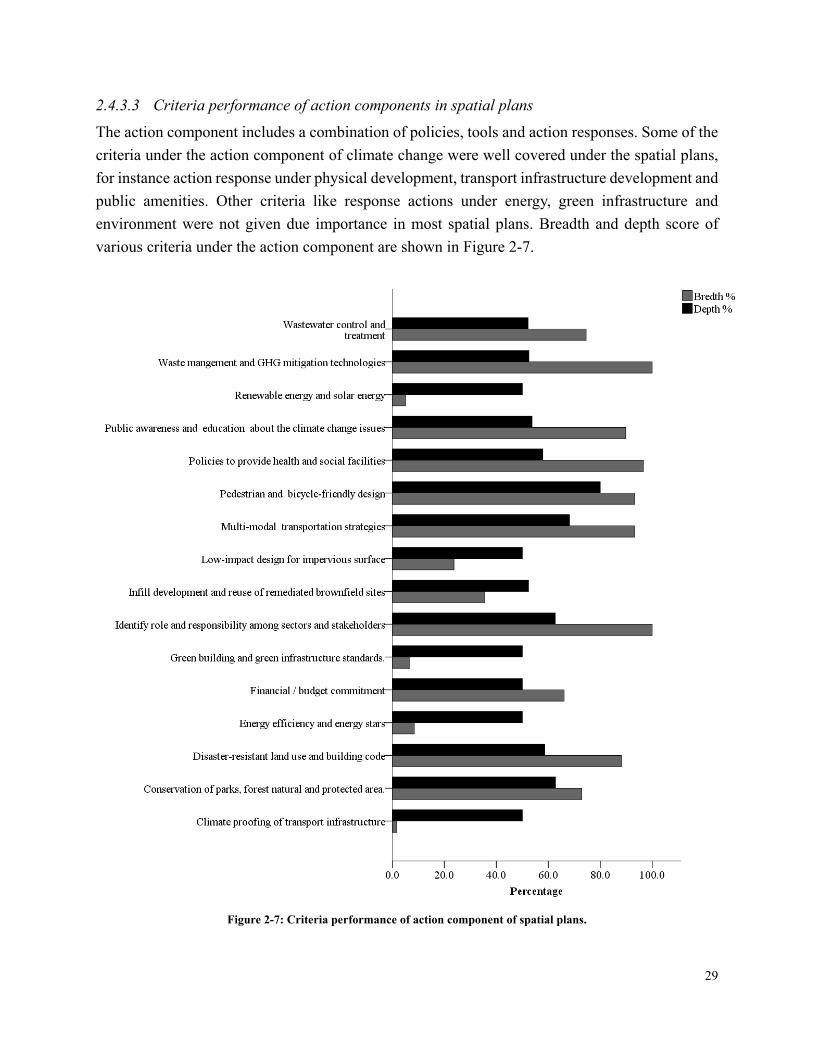
29
2.4.3.3 Criteria performance of action components in spatial plans
The action component includes a combination of policies, tools and action responses. Some of the criteria under the action component of climate change were well covered under the spatial plans, for instance action response under physical development, transport infrastructure development and public amenities. Other criteria like response actions under energy, green infrastructure and environment were not given due importance in most spatial plans. Breadth and depth score of various criteria under the action component are shown in Figure 2-7.
Figure 2-7: Criteria performance of action component of spatial plans.
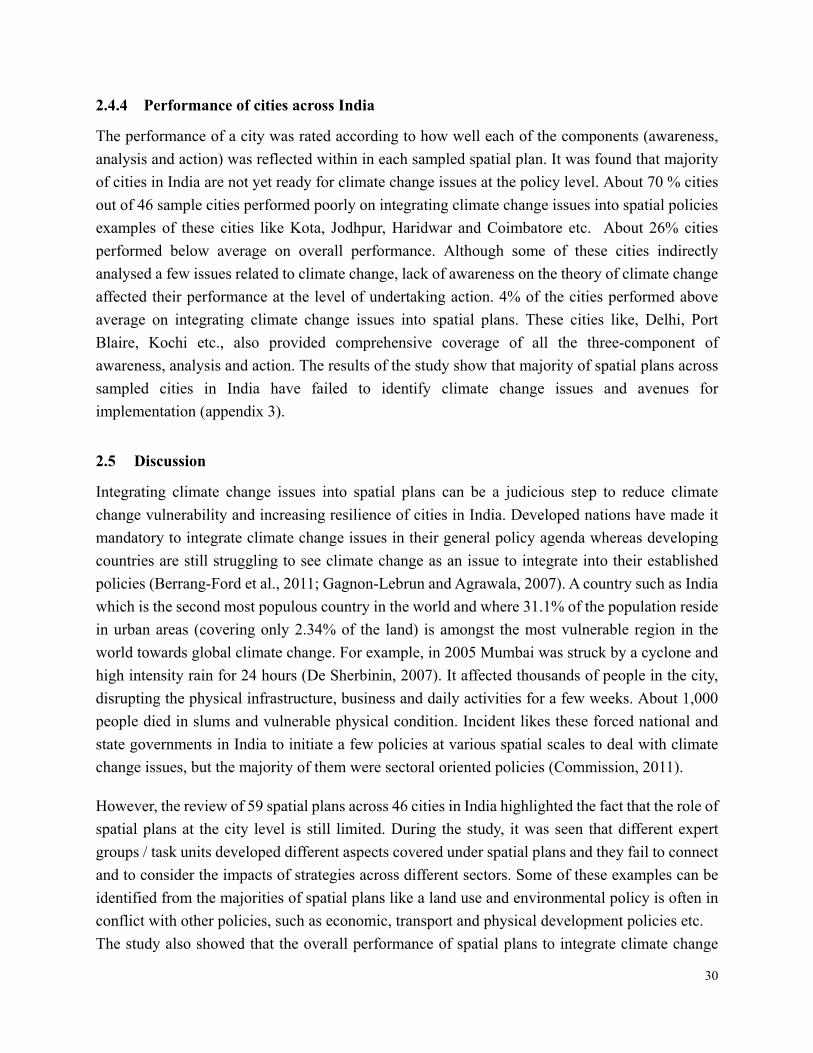
30
2.4.4 Performance of cities across India
The performance of a city was rated according to how well each of the components (awareness, analysis and action) was reflected within in each sampled spatial plan. It was found that majority of cities in India are not yet ready for climate change issues at the policy level. About 70 % cities out of 46 sample cities performed poorly on integrating climate change issues into spatial policies examples of these cities like Kota, Jodhpur, Haridwar and Coimbatore etc. About 26% cities performed below average on overall performance. Although some of these cities indirectly analysed a few issues related to climate change, lack of awareness on the theory of climate change affected their performance at the level of undertaking action. 4% of the cities performed above average on integrating climate change issues into spatial plans. These cities like, Delhi, Port Blaire, Kochi etc., also provided comprehensive coverage of all the three-component of awareness, analysis and action. The results of the study show that majority of spatial plans across sampled cities in India have failed to identify climate change issues and avenues for implementation (appendix 3).
2.5 Discussion
Integrating climate change issues into spatial plans can be a judicious step to reduce climate change vulnerability and increasing resilience of cities in India. Developed nations have made it mandatory to integrate climate change issues in their general policy agenda whereas developing countries are still struggling to see climate change as an issue to integrate into their established policies (Berrang-Ford et al., 2011; Gagnon-Lebrun and Agrawala, 2007). A country such as India which is the second most populous country in the world and where 31.1% of the population reside in urban areas (covering only 2.34% of the land) is amongst the most vulnerable region in the world towards global climate change. For example, in 2005 Mumbai was struck by a cyclone and high intensity rain for 24 hours (De Sherbinin, 2007). It affected thousands of people in the city, disrupting the physical infrastructure, business and daily activities for a few weeks. About 1,000 people died in slums and vulnerable physical condition. Incident likes these forced national and state governments in India to initiate a few policies at various spatial scales to deal with climate change issues, but the majority of them were sectoral oriented policies (Commission, 2011).
However, the review of 59 spatial plans across 46 cities in India highlighted the fact that the role of spatial plans at the city level is still limited. During the study, it was seen that different expert groups / task units developed different aspects covered under spatial plans and they fail to connect and to consider the impacts of strategies across different sectors. Some of these examples can be identified from the majorities of spatial plans like a land use and environmental policy is often in conflict with other policies, such as economic, transport and physical development policies etc. The study also showed that the overall performance of spatial plans to integrate climate change

31
issues varies across cities. There are many potential reasons why and how different cities in India have a different performance score to integrating climate change issues into spatial plans. This study shows that lack of awareness, participation, technical skill and action response are the prime reasons for the weak performance of spatial plans. These reasons are strongly correlated with the performance of the spatial plans in integrating climate change issues amongst various cities in India. Cities such as Delhi, Kochi, Mumbai and Port Blair demonstrated an established integration of climate change issues into their spatial planning process. It was also observed that these are also among the cities that face regular climate change issues and have been preparing themselves for the same. However there are many other cities in India, that are under regular threat of climate change issues but do not have any kind of safeguard in their local policies. Cities like Coimbatore, Vishakhapatnam, Panji, Imphal, Aizawal, Gurgoan and Hyderabad etc., are located in extremely delicate environmentally prone regions.
A crucial issue identified during the evaluation of spatial plans was the lack of awareness about the climate change issues amongst various stakeholders and their participation in it. Public participation and awareness are vital aspects of effective climate change policy preparation and implementation (Smit and Wandel, 2006). Awareness about the climate change issues can be a driving force to local governments and people to build trust and commit themselves to act on the relevant action response (Hjerpe and Glaas, 2012; Tompkins et al., 2010; Neil Adger et al., 2005). However, environmental and climate change issues were given the least priority in majority of the sampled spatial plans. Equipped with the strength of media and social networking, state and local governments in India could have promoted the impacts of past and current events of changing climate variability.
The other major issue after awareness was the moderate level of analytical capability of local governments to see climate change as an issue and its impacts. Few urban bodies like Delhi, Mumbai and Kochi have analysed the impact of climate change and have been able to integrate climate change aspects in the spatial plans. At the same time, these cities have the resource capacity in term of technical skills, physical resources, financial capability and involvement of various stakeholders to act on various climate change issues. Most cities in India have been seen to follow a mix of chaotic growth development, which leads to inefficient management of resources (Nath, 2007). Sampled cities for this study are extremely populated as well as being most vulnerable to climate change impacts and have already experienced disaster like flooding, Tsunami, sea level rise and changes in seasonal patterns etc. in the past.
Local government and policy makers have made physical development and economic growth prosperity as the basis to formulate policies in various cities in India (Nath, 2007). The focus of most spatial plans is primarily in a few key sectors such as physical development (built

32
environment, transportation, water infrastructure and industrial development etc.) and socioeconomic well-being. This approach overlooks the issues related to environmental prone impacts to society, human well-being and sustainability of the region as a whole. The roots of such neglect can be easily identified as limited resources and potential to see the future uncertainties related to climate change issues.
The other major issue identified was related to action responses included in the spatial plans. Action responses in the sampled spatial plans predominately focus on land use change policies, build environment and few environmental norms. Whereas the city development plans sampled for this study revealed the focus on building local economy, public infrastructure, and poverty alleviation without considering global climate change. Although local governments have made relevant policies on these issues, which are amongst the main drivers of climate change vulnerability, they are not moulded to into instruments to reduce the climate change impact and vulnerability. An innovative integration of climate change issues in projected action under various spatial plans could have a significant influence in dealing with climate change impacts. For example, strategies like green infrastructure and energy efficiency in physical development, climate proofing of long lasting infrastructure like transport system in the cities, accounting of GHG emission from various sectors, carbon taxing on heavy industries etc. can be easily improvised into current action responses (Agency, 2012b; Carter, 2011; Habitat, 2011; Corfee-Morlot et al., 2009).
73rd and 74th Amendments of the Indian Constitution vests enormous power with the Local governments to plan and implement action responses. Therefore, these local governments can plan for sustainable development of the cities to become resilient towards various impacts of climate change. Various studies show that local governments around the world are introducing policies like green infrastructure, carbon taxing, local GHG emission inventories and scenario development and ecosystem based adaptation policies at various spatial scales (Biesbroek et al., 2010; Field et al., 2012; Naumann et al., 2010). Local governments and policy maker in India can learn from such initiatives and adopt innovative policies which best fit into their local environment. Recently many international and national organizations initiated climate change mitigation and adaptation learning programs like Global Environment Fund (GEF) Trust Fund , Strategic Priority on Adaptation (SPA), Special Climate Change Fund (SCCF), Adaptation Fund and Least developed countries fund (LDC Fund) under which any local government across developing world can participate to reduce the climate change vulnerability (Mace, 2005). Local authorities in various cities in India can take advantage of these policies and become part of the learning program.
The study of sampled spatial plans from various cities in India presented opportunities to learn

33
about the policy changes taking place and gaps in the Indian public policy arena. The developed review framework is a robust instrument to understand the stance of various cities in India and its spatial policies on climate change issues. The review framework was able to reveal key weaknesses and strength of spatial plans on integrating climate change issues. The review framework could be applied to another region by adjusting the criteria that suites the need and context of the region while keeping the main skeleton of review framework. The selected criteria and weight for this study were based upon the spatial policies of India and information available under spatial plans that are universal across India.

34

35
Chapter 3

36
3 Introduction to the case studies
3.1 Bangalore city profile
3.1.1 Introduction
The historical accounts of the city of Bangalore indicate that it was a small agrarian village in the 12th century AD (Sudhira and Nagendra, 2013). The strategic location of this small village and the all year favourable climate was recognized by Kempe Gowde, a descendent of the Yalanhanka line of chiefs, in 1537, who constructed four pillars indicating the boundaries for potential growth in the heart of present day Bangalore (Sudhira and Nagendra, 2013). The City has now expanded well beyond these anticipated limits into the 5th largest metropolitan city in India. It is one of the fastest growing cities of the world with a tag of the ‘Silicon valley of India’, for spearheading the Information Technology based industries in the country. Bangalore has placed itself in the global Information Technology map with The Human development report 2001 (UNDP, 2001 ) placing it in the 4th place in terms of the most advanced technological hubs of the world, attaining a high Technological achievement index (TAI) of 13 (Lema and Hesbjerg, 2003) . However the same report also states that “Development and Technology shares an uneasy relationship”, to highlight the new risks that inevitably accompany technological growth. The economic development of the city due to its technological hub has resulted in rapid growth in population mainly owing to migration, simultaneous urban sprawl, deteriorating impact on the cities ecosystem, encroachment on green spaces, pollution of lakes and felling of trees to make way for urban infrastructure. In addition to these inherent problems, like most developed and developing cities, it is likely that the city will be further exasperated by the effects of climate change (Rosenzweig et al., 2010). The importance of tackling climate change at the city level was recognized at the World Mayors Council on Climate Change (WMCCC) in December 2005, following its entry into force of the Kyoto Protocol (Rosenzweig et al., 2010). It was recognized that compared to national politicians, city leaders and governing bodies have a better understanding and willingness to take action against the changing effects of climate change. Thus Bangalore represents an ideal case study to initiate an in-depth study on the potential vulnerability of an urban city to climate change and how to initiate effective policies to combat such changes. This chapter thus details the profile of the city, which provides a base for understanding the spatial assessment of vulnerability of Bangalore city as detailed in chapter 4.

37
Figure 3-1: Growth of Bangalore from 1537 to 2007 (Source: Adapted from H.S Sudhira and H. Nagendra (2013)
3.1.2 Geography
Bangalore is the principle administrative capital of the State of Karnataka, and lies equidistant from the eastern and western coasts of Southern peninsula of India. Geographically it is located between latitudes of 12o 39' N and 13o 18' N and longitudes of 77o 22' E and 77o 52' E and covers an area of 741 km2. It is situated in the middle of the Mysore plateau with an average elevation between 700 to 900 m over the ridges of four watersheds namely, Hebbal, Koramangala, Challaghatta and Vrishabhavathi. The terrain being undulating was suitable for creation of tanks to provide water for drinking, irrigation and fishing. Once abundant with these water bodies, with as many as 262 even in 1961, high real estate prices has resulted in the fast decline of the lakes. Although the official figures still state that the number of tanks is 171, most of these are only seasonal and remote sensing images clearly indicate only 33 existing lakes with another 15 only showing contours of former existence. Rapid growth including congested roads networks and residential centres has also reduced the green spaces in the city and number of trees in the city. Two prominent green spaces, the Lalbagh and Cubbon Park, are located right in the centre of the city.

38
Table 3-1: Changes in number of water bodies during 1973 to 2007
Year/ region Bangalore City Greater Bangalore Number of Water bodies Area (in ha) Number of Water bodies Area (in ha)
SOI 58 406 207 2342 1973 51 321 159 2003 1992 38 207 147 1582 2002 25 135 107 1083 2007 17 87 93 918 Source: Adapted from (Ramachandra and Mujumdar, 2009)
3.1.3 Demography and economy
Bangalore is the capital of the state of Karnataka with Kannada as the official language. The city has a high literacy rate of 75% (Census of India, 2011), of a population of 5.7 million people. About one third of the populations according to the last census are migrants from the neighbouring rural areas and other states. The significant increase in the population of the city in the 1970’s was a result of establishment of numerous public sector and defence establishments. Subsequently there was increase in population during the 1990’s due to immigration for the IT industries. Apart from the cities well developed IT hub, it also nurtures several educational and research centers such as the Indian Institute of Science (IISc), National Institute of Advanced Studies (NIAS), Tata Institute for Fundamental Research (TIFR), Jawaharlal Nehru Centre for Advanced Scientific Research (JNCASR), Indian Space Research Organisation (ISRO), National Aerospace Laboratories (NAL), Defence Research and Development Organisation (DRDO), Indian Institute of Management (IIM), Institute for Social and Economic Change (ISEC), Indian Institute of Information Technology (IIIT) and several professional engineering and medical colleges. Bangalore’s economic growth although attributed to its Information and communication technology (ICT), is highly diverse with industries likes textile, automobile, machine tools, aviation, space, defence and biotechnology constituting its economic fabric. Although the city boasts a high per capita income of Rs 39,420, socio-economic inequality remains high with 25 % of the population under the prevailing poverty limits (Census of India, 2011)
3.1.4 Urbanization and Environmental Issues
The change in the economic, social and demographic fabric of the city in the last three decades has resulted in a drastic transformation in the landscape of the city. The cities once rich historic parks, open spaces and large water bodies have been encroached upon to give way to infrastructural development, housing areas and commercial establishments. With minimal governance in the spatial development of the city, the urbanization has been mostly irregular, spreading to the

39
periphery of the city, accelerating landscape fragmentation in these areas (Schneider and Woodcock, 2008; Taubenböck et al., 2009). High prices of property in the city centre have resulted in minimum urbanization in the core and new developments being located in the peripheral areas of the city resulting in the modification of the ecosystems in the agricultural hinterland. The core of the city therefore still supports large green spaces managed by individual public institutions such as military campuses, educational institutes and historic cemeteries. There has been re-greening efforts in the periphery of the city in the form of avenue plantations, but the species used for such efforts have short life spans, low canopy cover and are water hungry exotic species such as Acacia and Eucalyptus. The loss of vegetation and lakes in the city of Bangalore is likely to intensify periods of droughts as well as flooding in the city. The rapid urbanization of the city also poses challenges in the water dynamics. Within the city, the piped water supply is sourced from at least a distance of 100 km resulting in high costs payable to energy usage for pumping of water. The high costs of piped water and inadequate availability in some areas of the city has resulted in the use of ground water via bore-wells and supplied by private tankers. The impervious urban infrastructure and soaring water demands has considerably reduced the levels of ground water. Another major problem due to rapid urbanization and increase in the working class population has been the multiplication of the vehicular pollution. According to the Regional Transport Authority 2012, the number of number of vehicles accounted for mounts to 3.8 million, mostly due to lack of proper public transport. It has been predicted that the total emissions of Co2 for 2012 to 2017 will amount to 3.03 to 4.06 MT (Greenhouse Gas inventory Karnataka 2007). Initiatives are being taken to improve public transport by construction of a network of metro lines and cycling lanes, but such initiatives have been slow and not effective to the pressing problems of increase in vehicular population.
3.1.5 Governance and planning in Bangalore
The city level governance of Bangalore and its peripheral areas is theoretically in the hands of the Greater Bangalore City Corporation (Bruhat Bengalooru Mahanagara Palike), a body of locally elected representatives. However much of the planning such as land use zoning, housing initiatives and regulations are decided by a separate body established by the state government called the Bangalore development authority. Other sectors such as water supply, energy and law and order are also administered by state run organizations instead of the locally elected corporation. The result is that different organizations have administrative rights over different sectors as well as geographical areas leading to decentralized and chaotic governance. The main environmental management and data collecting bodies in the city are the Karnataka State Pollution Control Board (KSPCB) and the Lake Development authority (LDA). The KSPCB monitors the several forms of pollution including air pollution, noise pollution, hazardous waste disposal, solid waste

40
management and also micro manage projects in the region by evaluating Environmental Impact Assessment notifications. The LDA on the other hand is specifically dedicated to the management of lakes and water bodies. Apart from these governing bodies, civil societies and community participation plays a vibrant role in the urban developmental issues in Bangalore.
3.2 Second Case Study: Darjeeling district profile
3.2.1 Introduction
If one needs unquestionable empirical evidence of climate change, the Himalayan region seem to be one the best case studies. Numerous scientific studies are now confirming that the effects of climate change are having rapid and confounding effects on the biodiversity, ecosystem services and human well being (Chaudhary and Bawa, 2011). With an aim to assess our methods in the Himalayan context, we chose the district Darjeeling situated in the lower Himalayas as a case study, which has seen rapid urbanization and land use change in the last century. This area was first recognized for development in the 19th century when the British administration set up a sanatorium and a military depot (WBGov, 2012). Since then the region has seen immense development due to extensive tea plantation in the region. Darjeeling tea known worldwide for its unique flavour, completely changed the revenue pattern in the district with the socio economic condition of the people largely being dependent tea plantation (WBGov). The region is also known for its beautiful hill stations and the unique Darjeeling narrow gauge railway line which is listed as a world heritage site.
Table 3-2: Darjeeling district general information. Variables Darjeeling
Area 3,149 Square km Location 26˚31ʹ N to 27˚13ʹN Lat and 87˚59ʹ E to 88˚53ʹE Long Altitude 200 m to more than 2,000 m above sea level
Density 584 persons per square km Literacy 79.92%
Temperature 1˚ C to 11˚C with a maximum of 20˚C Rainfall Average annual rainfall ranging from 2500 mm to 3500 mm
Source: Darjeeling District profile (on http://darjeeling.gov.in)
3.2.2 Geography
Darjeeling is the northern most districts in the state of West Bengal in India. The district has an undulating topology with the northern part comprising of the steep terrains and southern part of the district lying mostly in the plains. There are numerous streams and rivers that flow down from the hills into the valley following the contours of the upland ridges. Rivers originating from the region

41
contribute toward making the state of West Bengal being a well watered state for agriculture. Sharing parts of its borders with Bhutan in the east and Nepal in the west, it also enjoys a strategic location in terms of international neighbours. The four most important cities in the district are Darjeeling, Kalimpong, Kurseong and Siliguri (O'Malley, 1989). The hills of Darjeeling district are part of the Lesser and Sub-Himalayan belts of Eastern Himalayas and comprised of recent rock formations that results in a large number of landslides (WBGov).
3.2.3 Climate
Darjeeling has Temperate climate, (Köppen Cwb, Suptropical Highland Climate) with heavy rains during the monsoon season (Sinha, 2013). Due to great variations in heights above sea level, the variation in temperature is huge. The annual mean maximum temperature is 15.98 °C while the mean minimum temperature is 8.9 °C. The region gets a high amount of rainfall from July to September due to the monsoon winds with an average of 126 days of rain in a year (WBGov, 2012). Observed trends in climate in Darjeeling district • The temperatures is the district has been observed to be rising especially in the Darjeeling hill area where in the
last 100 years it has risen by 4˚C
• The rainfall in the district has become irregular in quantity and timing with the number of rainy days decreasing
form 165-140 days to 155-35 days in the last few decades.
• Relative humidity has risen considerably
• The amount of sunshine has increased in the Terai hill region
• The amount of snowfall has also become erratic in the hills.
• The frequency of landslides and flash floods has increased
Source: Based on discussions with locals and findings of Dr. Subir Sarkar, Head, Deptt. of Geography, North Bengal University as published in the West Bengal State Action Plan for Climate Change.
3.2.4 Demography and economy
The population of the Darjeeling is about 1.8 million with 33 % living in the four largest cities (Datta, 2004). The racial mix of the district is distinct with a large proportion of the population of the district belonging to the Gorkha clans, followed by the Sherpas (mostly involved in mountaineering activities ), Denzongpas (Bhutias), Tibetians (migrants from Tibet since the 1950’s) and the Adivasis (Tribals from Chotanagpur and Santhal Parganas). Although the official language of the state is Bengali, 50% of the population speaks Nepali (Mor, 2013; O'Malley, 1989; WBGov).
The Economy of the region is mostly driven by tourism and tea manufacturing (WBGov). The

42
tourism industry is seasonal peaking in summers and autumn. The frequency of landslides during the monsoon seasons, drastically effects tourism. Tea manufacturing is therefore the predominant form of revenue in the region engaging about 50% of the population in its 78 tea Estates which produce Darjeeling tea as accredited by the Tea board of India. The total area under tea production is 17, 500 hectares and annually the production is averages 90 million kg of tea (Datta, 2004; WBGov). The Darjeeling Tea industry not only provides direct employment and salary benefits but also provides other benefits such as housing, education, statutory benefits, medical facilities etc.
In addition, 38% of the district is under forest cover which produces superior quality timber and NFTPS. Also the hydropower generated from the region contributes towards the energy supply in the state (WBGov, 2012).
3.2.5 Environmental issues
District Darjeeling and its fragile mountain ecosystem is suffering from the burgeoning population, high density of urban growth, increase in area under subsistence farming and livestock farming in the region (WBGov, 2012). These factors are putting unprecedented pressures on the forests of the district due to encroachments for fossil fuel, fodder etc. (WBGov, 2012). Dense and moderate dense forests are changing into open forests at a rapid rate. The high rainfall in the region also causes massive damages resulting from soil erosions and landslides that damage agricultural lands, infrastructure, housing and living spaces in general (Mor, 2013). In addition there is high runoff in these areas due to which very little water is stored to be available in the lean periods. Additionally the urbanization of the region is further exasperating the effects on these existing problems by putting pressure on available recourses such as water, housing and sanitation. Planned development in this region has been slow. Therefore random and rapid growth together with the effects of climate change is likely to cause some major concerns for planners in the future. These concerns are summarized in the table below.
Table 3-3: Climate Change concerns in Darjeeling district Sector Concerns Water
• Concerns of water availability in lean period due to heavy run off • Heavier soil erosion and landslides with increased rainfall periods • Impact on hydropower due to melting glaciers • Adverse problems on human settlements with increase in frequency of rainfall • Damages due to extreme climate conditions like cyclones
43
Agriculture and horticulture
• Shifting of agriculture production centres to higher altitudes • Lower produce of Darjeeling tea as the climate creating its special aroma changes • Impact on horticulture produce such as the Darjeeling Mandarin • Increase in pests and diseases, and emergence of new ones
Biodiversity and forest
• Degradation of forests areas due to landslides population growth around forest areas
• Species migration due to changing weather conditions • Adverse impact on natural population of orchids • Impact on forests and its biodiversity, NTFPs including medicinal plants • Frequency of forest fires during the dry season
Health and social structure
• Impacts on human health as vectors move to higher altitudes and people are • subjected to heat stress , which they have never encountered • Impact on low income housing with increase in extreme weather events • Economic concerns for agriculture dependent communities
Urban habitats and infrastructure
• Lack of clean water in urban areas. • Increase in road traffic with extreme rainfall events resulting in increase in
frequency of landslides • More erosion due to spread urban growth and infrastructure development
Source: West Bengal State Action Plan for Climate Change
3.2.6 Governance
The hill region of Darjeeling comes under the administration of the Darjeeling Gorkha Hill council and the plains or Terai region, including Siliguri, comes under the Darjeeling district administration of the Government of West Bengal. These two administrative centres are responsible for all socio-economic and infrastructural facilities like health, education, roads, housing and energy as well as environmental health of the district (WBGov).

44

45
Chapter 4
This chapter is based on: Kumar, P., Geneletti, D., Nagendra, H., (under review). Spatial
assessment of climate change vulnerability at city scale (Submitted to Environmental Impact
Assessment Review).

46
4 Spatial assessment of climate change vulnerability at local level: an overview of an Indian city, Bangalore
4.1 Introduction
Climate change is anticipated to be a significant factor that will effect physical and social changes in urban areas in the future (Field et al., 2014; IPCC, 2007; Rannow et al., 2010; Stern, 2006b). Climate change causes stress to cities by increasing the frequency of heat waves, affecting the health of the population and disrupting water conditions by drought or flooding. Most nations and urban regions of the world are already facing adverse impacts of climate change, which are expected to worsen in the coming decade (Parry, 2007c). Urgent action needs to be taken on climate change through various adaptation responses along with mitigation strategies in our policy making process at all levels of spatial scale (Field et al., 2014). This is especially true at local levels, because such initiatives and policy implementations demand a bottom-up approach for design and implementation. However, in order to develop appropriate response actions to adapt to undesirable impacts of climate change, policy makers should understand the significance of the climate change issue, and be able to utilize information on the drivers of climate change and patterns of vulnerability at local spatial scales (Kumar and Geneletti, 2015).
Unfortunately, the information required to develop response actions to climate change impacts at local spatial scale are hard to find, especially in developing nations where vulnerability is high, and there is a critical need for informed action (Field, 2012; Rosenzweig et al., 2011). Most accessible information is available at higher spatial scales including the global, national and regional level. It is difficult to downscale existing datasets to provide reliable climate risk information required for city development strategies (Biesbroek et al., 2009).
Mainstream vulnerability assessment is an important component of the policy making process, aiming to inform action responses that can reduce the associated impacts of climate change (Füssel and Klein, 2006; McCarthy, 2001). The concept of vulnerability has been debated, discussed and used in many fields such as social sciences, disaster management and ecology over the past three decades (Füssel and Klein, 2006). Its variation in use across different disciplines generates problems for its definition, description, operationalization and consistent use across locations (Hinkel, 2011; Preston et al., 2009). Although there are many vulnerability assessment measures of climate change, in practice, these either target long-term mitigation strategies (EEA, 2008; Preston et al., 2011), assess vulnerable sectors or locations for the impel design of adaptation measures (Lung et al., 2013). In addition, a majority of them are developed at coarser spatial scales (Field et al., 2014; Rannow et al., 2010).

47
Vulnerability assessment frameworks and methods defined at coarser spatial scale are difficult to implement at local levels (Holsten and Kropp, 2012; Kumar et al., 2013; Rannow et al., 2010). This is evident by the fact that the few comprehensive vulnerability assessment studies at regional spatial scale are very general, demonstrating the difficulty in translating output and knowledge into policies given that they do not define the degree and magnitude of the results. One of the fundamental challenges in formulating vulnerability assessment frameworks at local levels is that there is no standardization of methods (Preston et al., 2011). A review of the presently available assessment methods demonstrates a lack of clarity and consistency in the selection of indicators, aggregation of different indicators, and comparison across indicators (Eriksen and Kelly, 2007; Rannow et al., 2010). It has become a practical challenge to apply and replicate available vulnerability assessment methods at local spatial scales (Hinkel, 2011; Hofmann et al., 2011; Preston et al., 2011).
According to Preston, et al.(2011) to operationalise vulnerability assessment, it is important to understand the spatial context of the assessment. Internationally, emphasis is being placed on the need for detailed studies of climate change vulnerability, resilience of space, mitigation and adaptation measures at the local scale, at specific locations (Baumert et al., 2005; Hunt and Watkiss, 2007; Metz and Davidson, 2007; Rosenzweig et al., 2011). The majority of studies at the local scale highlight issues of climate change impacts on developed nations, especially on coastal regions where impacts due to sea level rise and natural disasters are more apparent (Castán Broto and Bulkeley, 2013; Hunt and Watkiss, 2011). However there is a strong need to study climate change issue of cities in non-coastal regions as well, especially from developing nation, where variance and magnitude of climate change issues is extreme and understudied (Hanson et al., 2011; Rosenzweig et al., 2011). Also, urban systems need to be better conceptualized as a coupled socio-economic and ecological unit (Daron et al., 2014; Engle, 2011; Forman, 2014). Socio-economic aspects of the city include the urban fabric, wealth, and demography, institutional and physical components. The ecological aspects include the environment, ecosystems and natural resources. Each aspect of the urban system has its characteristics that generate sensitive and carrying capacity through interactions with other components (Plummer, 2010; Walker et al., 2006). This is particularly important for cities in semi-arid locations, where water stresses due to climate change are becoming increasingly apparent, constituting “wicked” problems for climate change adaptation (Churchman, 1967; Toman, 2014).
This study presents a methodological framework to assess vulnerability patterns to climate change at local level. The framework will help to assess vulnerability patterns, and generate maps of spatial vulnerability to aid in prioritising response actions for spatial planning policies at the city scale. The application of vulnerability assessment framework is demonstrated using as a case study an urban system in a semi-arid inland city in a developing nation: the city of Bangalore,

48
India.
4.2 Study area
The city of Bangalore lies at 12059ʹ north latitude and 77057ʹ east longitudes with an area of 741 sq km and a population of 10.1 million (Figure 4-1). It is now one of the fastest growing cities in the world due to a burgeoning Information Technology hub, massive commercial industries and numerous educational institutions (Sudhira et al., 2007). Being situated central from the eastern and western coast of the south Indian peninsula, the city has a pleasant climate throughout the year (Sudhira et al., 2007). The temperatures during the summer months fall between 180C to 350C, while the winter temperature ranges from 120C to 250C. The mean annual rainfall in the city is about 830 mm with about 60 days of rainfall per year (Sudhira et al., 2007). In recent years, Bangalore urban city is facing undesirable impacts of climate change (Parikh et al., 2013; Satterthwaite, 2009). Future consequences could be observed in the economic performance, physical and social stability of the city. Bangalore has already started facing severe climate change impacts like urban heat islands, seasonal flooding and increased summer temperature (Gupta and Nair, 2011; Ramachandra and Kumar, 2010). We have chosen Bangalore city as a case study because of its climate dependency, spatial and urban developmental perspective and as a fast growing city far beyond its physical and economic limits.
Figure 4-1: The study area Bangalore Metropolitan city, India and land cover map 2014, developed from Landsat 8 image
from http://landsat.usgs.gov/ for June 2014.

49
4.3 Method
For this study, the formal definition of vulnerability was adopted from the work of McCarthy (2001) ''the degree to which a system is susceptible to and unable to cope with, adverse effects of climate change, including climate variability and extremes''. According to Füssel et al. and McCarthy (2006; 2001) vulnerability is the result of three key components: exposure, sensitivity and adaptive capacity. Vulnerability represents the current state of the system and describes the potential to experience harm from external and internal exposure due to the system’s sensitivity and adaptive capacity. As per Füssel and Klein (2006), exposure describes the ''magnitude to which a system is exposed to significant climatic related events'' and sensitivity is the ''extent to which a system is affected, either adversely or beneficially, by climate-related stimuli and the effect may be direct or indirect''. Adaptive capacity is the capacity of a system to organize itself to the external and internal stresses and respond to them (Smit and Pilifosova, 2003). According to Adger et al. (2005) ''adaptive capacity of any system is mostly determined by a local set of resources and conditions that limit or support the system to adapt successfully to climate changes''. Interaction between exposure and sensitivity also defines the impact of climate stressors on the socio-ecological system (Holsten and Kropp, 2012). Hence, to understand the pattern of vulnerability to any system, it is a prerequisite to have comprehensive information about its key components i.e. exposures, sensitivity, and adaptive capacities: as well as impact elements, i.e. a combination of exposures and sensitivity.
4.3.1 Exposure
This study addresses exposures under the category of extreme events. Extreme events are direct physical events generated from weather and climate variables like temperature (Hübler et al., 2008), precipitation (Lung et al., 2013) and wind (Field, 2012; Vose et al., 2013).These extreme events have varied impacts at urban level depending upon the interaction with the urban system in terms of time, duration and magnitude, as well as the spatial extent and characteristics of the system. Based on past events and the nature of the current physical and environmental stress within the study area, indicators were selected for extreme event. Table 4-1 presents the indicators selected for this study to describe the exposure components.
Table 4-1: Indicators used to measure the exposure component.
Exposure Indicators Description Reference Longer and more intense hot days
1. Hot days/year (Tmax>30º C)
2. Mean temperature Increase
Changes in temperature (summer maximum and winter minimum temperatures) will result in heat and cold waves, threaten human health, lives, industries and jobs. It has also sever consequence on food security
(Hübler et al., 2008)

50
4.3.2 Sensitivity
Selected sensitivity indicators were based upon the understanding of the socio-economic and ecological aspects of the urban system. Detailed study of various spatial plans, sectoral policies, primary and secondary survey of socio-ecological aspects and findings of earlier studies of the selected case study helped to identify sensitivity indicators (Ramachandra and Kumar, 2010). Sensitivity to various aspects of the urban system was analysed from the data collected from public databases like Census of India, local municipal authorities and state development department as detailed in appendix 4. Socio-ecological data from various stakeholders were also collected through field work conducted in Bangalore city during the month of February to April 2014. Selected indicators of various aspects of sensitivity components were also observed in other studies, for example, infrastructure sensitivity to climate change (Eisenack et al., 2012; Suarez et al., 2005), high density (De Sherbinin et al., 2007; Wilby, 2007), the vulnerability of slums to climate change (Banks et al., 2011; Kovats and Akhtar, 2008) , land use change (de Noblet-Ducoudré et al., 2012; Kulakowski et al., 2011; Metzger et al., 2006), the vulnerability of children and the elderly to climate extreme events (Bartlett, 2008; Han and Foltz, 2013; Huang et al., 2011; McMichael et al.) and risk to natural resources from climate change (Beniston et al., 2007; Herrera-Pantoja and Hiscock, 2008; Muller, 2007; O’Hara and Georgakakos, 2008; Sun and Chen, 2012; Wilby, 2007). The selected sensitivity indicators are presented in Table 4-2.
Table 4-2: Indicators used to measure the sensitivity component. Broad aspects Sensitivity Indicators Description Reference Physical and economic
Infrastructure Area covered by road
Mobility of the people and other urban services are strongly dependent on weather conditions. Extreme climate events can have high social and economic costs.
(Szendrő et al., 2014)
Poor living and built conditions
1. High-density area
Urban form: in particular, poorly built and managed areas: have a wide variety of implications for the
(De Sherbinin et al., 2007)
like agricultural production, fresh water supplies and the health of native species and ecosystem.
Increase in precipitation intensity and number of days of increased precipitation
1. Rain range (>830 mm/year)
2. Number of days/year
with heavy rain (RR >30mm)
Changes in seasons and precipitation pattern will result in frequent events of erratic precipitation to create situations of flash floods during rainy season or drought conditions during summer season.
(Rannow et al., 2010)

51
2. Number of slums
city including increased greenhouse gas emissions, resource requirements and vulnerability to climate change impacts.
Future natural resources
Land use change Land being used for the development of the new settlement, building and other public amenities that directly influence the local environment, food security and climate regulation
(Pielke et al., 2011)
Social People at risk Percentage of people younger than 6 years (Due to lack of data on elderly people percentage of children younger than 6 years was used as an indicator)
A combination of factor like extreme temperature, flooding are the primary stressor for children and elderly people with regard to health and development. The percentage of children and elderly population is one of the key aspects of the system's sensitive to various climate change events
(Bartlett, 2008; Han and Foltz, 2013)
Asset sensitivity
Percentage of liveable houses
Access to safe living conditions, especially housing, is vital to build the resilience of people.
(De Sherbinin et al., 2007)
Environmental
Basic natural resources
Increased fluctuation of groundwater levels
Changes in seasonal precipitation and its magnitude can cause fluctuations of groundwater levels. This process could increase or decrease the ground water level and create situations like drought or flooding.
(Rannow et al., 2010)
Ecosystem and biodiversity
Loss of lakes and wetland area
Changes in climate variable like temperature and precipitation has multiple impacts on biodiversity or local ecosystem like change in habitat conditions, loss of ecosystem services and biodiversity patterns.
(Mundoli et al., 2014)

52
4.3.3 Impact
Interactions between exposure and sensitivity components within a spatial context determine the potential impacts of climate change (Holsten et al., 2011; Parry, 2007a; Rannow et al., 2010). Thus, impacts focus on the effect of extreme events of climate change on the urban system without considering its coping capacity. For this study, Impacts were determined by aggregating final output values of exposure components and each aspect of sensitivity. After calculating the individual impacts of physical and economic, social and environmental factors, the overall impact on the urban system due to all these aspects was determined by giving weight to each impact and aggregating.
Table 4-3: Indicators used to measure the adaptive capacity component.
Aspects Adaptive capacity
Indicators Description Reference
Socio-economic
Micro-finance Percentage of household having banking facilities
Better economic state and accessibility to financial services to t people, are necessary to build adaptive capacity. A large proportion of people do not have access to proper banking services that cause economic deprivation.
(Lung et al., 2013)
Social structural context
• Percentage of households having housing ownership
• Percentage of
households having all kind asset ownership
Ownership of physical assets is vital for building the resilience of people. Accumulation and allocation of assets is related to their livelihood strategy and provides financial returns to asset portfolios, as well as coping capacity to various shocks.
(De Sherbinin et al., 2007; Dodman and Satterthwaite, 2008)
Livelihoods and awareness
Percentage of people who are literate
Education is a crucial aspect for climate change awareness as well as for means of livelihoods. Education helps to promote and facilitate the development and implementation of various response actions to climate change.
(Holsten and Kropp, 2012)
Provision of basic facilities
Basic amenities
• Percentage of households having drinking water connection
• Percentage of households having waste water drainage connection
• Percentage of households connected to efficient cooking fuel
Local governments play a key role by ensuring equal distribution of local resources, facilities and opportunities to people. Lack of basic amities can lead to an area being vulnerable to climate change impacts and may later impose additional costs on deprived people.
(Banks et al., 2011; De Sherbinin et al., 2007)
Public Percentage of areas Inaccessibility to public infrastructure (Szendrő et al.,

53
infrastructure having road access can lead to stranded people during extreme events as well as hampering the capacity to provide distress relief
2014)
Ecological
Green infrastructure
• Green space/ per person
• Percentage of area under lakes
Urban green spaces and restored water bodies have been shown to provide a number of environmental and social benefits like local climate stabilization, energy use. it is particularly important for eco-system based adaptation response to climate change like urban heat island effects, increase carbon storage, water and purification. Social benefits include mental and physical health and food products like fish from lakes.
(Mundoli et al., 2014; Vailshery et al., 2013)
4.3.4 Adaptive capacity
Adaptive capacity is a reflection of the strength of the socio-ecological system. The measure of how an urban system has implemented adaptation measures in the past and how socio-economic and ecological aspects have been prepared to various exposures in the current and the future scenarios is the adaptive capacity (Adger et al., 2005a). Based on the literature review and availability of the data, three aspects of the urban system were chosen for measuring the adaptive capacity for this study as shown in Table 4-3. With the help of socio-economic aspect of adaptive capacity we try to understand the socio-economic condition of the people in the urban system like housing ownership and assets (Berman et al., 2012; Dodman and Satterthwaite, 2008; Sen, 1983), banking and loan facilities (Holsten and Kropp, 2012; Lung et al., 2013), education level (Engle and Lemos, 2010; Field, 2012) etc. The provision of basic facilities is related to the accessibility of people to essential services provided by the local governmental institution like access to potable drinking water (Eakin et al., 2010; Pahl-Wostl, 2007), houses connected to waste water drainage (Ashley et al., 2007; Dodman and Satterthwaite, 2008; Eakin et al., 2010), access to road and energy (Dodman and Satterthwaite, 2008) etc. In addition to above, accessibility of people and local communities to the healthy and clean environmental is also essential. This is because green spaces and water bodies in an urban areas provides local microclimate mitigation for example through the shade provided by tree or gardens (Breuste et al., 2013; Vailshery et al., 2013), reduce overall energy consumption by reducing the temperature (Jim and Chen, 2008; Kabisch and Haase, 2014), and reduce noise and increase carbon storage etc. (Strohbach and Haase, 2012).Water bodies in cities maintain underground water table, provide water, food and recreational space to the people as well as home to some of the endangered biodiversity hotspots (Mundoli et al., 2014). The building of a comprehensive adaptive capacity for any system depends upon the spatial extent of the local system and coping strategies of the local government.

54
4.3.5 Assessing potential vulnerability pattern
Potential vulnerability pattern was analysed spatially and results were compared at the city and ward (administrative sub-unit within the city) level. Vulnerability components and indicators were combined by means of Spatial Multi-Criteria Evaluation (SMCE) method (Geneletti, 2010; Uribe et al., 2014). The theoretical background for the multi-criteria evaluation was adapted from Frigerio & van Westen (2010)’s conceptual framework of risk, hazard and vulnerability. The first step of the SMCE method was to define the problem in the form of a 'criteria tree' consisting of all spatial and non-spatial indicators identified as components of the vulnerability assessment framework. Once the criteria tree was prepared, standardisation of each indicator was carried out based on the critical range (see Supplementary Material, SM). Standardisation converts original values of the indicator into a 0 to 1 scale to compare and aggregate the results of all the indicators. After standardisation, weighting of components and indicator under each component was carried out. The weighting and standardisation process was based on field work experience, knowledge gained from primary survey, stakeholder interviews and results from earlier studies. At each level of the hierarchy, there is an option for weighting the indicator and components based on its contribution, performance to the overall goal and critical breakpoint within the system when it changes its structure from stable to unstable based on literature (Greene et al., 2011; Malczewski, 1999, 2006) as shown in Figure 4-2. The final results are presented in the form of maps that depict the spatial pattern of vulnerability to climate change.
Figure 4-2: Schematic overview of spatial multi-criteria evaluation (SMCE) for climate change vulnerability assessment

55
4.3.6 Cluster analysis
This study uses cluster analysis as one of the tools to understand the vulnerability profile of the Bangalore city. Cluster analysis categorizes the data into groups or clusters that share similar characteristics. The objective of this step was to explore the clustering/scattering pattern of the overall vulnerability at the component level, providing a detailed profile of the most vulnerable hotspots in the study area. Clustering analysis is a standard approach used in a vast array of environmental studies (Holsten et al., 2011; Janssen et al., 2012; Kok et al., 2010). The vulnerability profiles were categorised into three classes namely, very high, high and medium based on a scale of 0 to 1. The range of 0.5 to 0.6 was considered medium, 0.6 to 0.7 was considered as high vulnerability and above 0.7 was considered as very high vulnerability.
In addition to this, the Fraiman measure was applied at three levels, namely at the component, aspect and indicator levels of the vulnerability assessment. The Fraiman measure represents the importance of a variable in the resulting output and is defined as ‘smaller the Fraiman measure of a variable, larger the influence of that variable on the resulting output’(Kok et al., 2010).
4.4 Results
4.4.1 Exposure
The majority of the area of Bangalore city was found under high exposure from different climate stimuli. About 38% of the total area was seen to be facing severe exposure. The spatial distribution of the exposures showed stronger effects in the north and north-eastern region and some wards in the southern region of Bangalore city as shown in Figure 4-3. Increased number of days with intense rain (RR > 30mm) and hot day (Temp>30oC) were the key indicators that influence the exposure component. Even after conducting sensitivity analysis by changing the weights of different indicators, the same areas were seen to facing severe impacts from climate stimuli. The entire eastern to the southern region of the city was seen to be facing increased number of hot days (Temp>30oC) compared to the other part of the city. However, it was also observed that there is an increase in mean temperature in all the wards ranging from 0.37 oC to 0.48 oC for the past ten years. Trends in mean temperature for the last decade showed that there is a persistent increase in temperature for most regions in Bangalore city with the northern and eastern regions showing higher ranges. Some of the reasons for this change are extensive land use change and urban development. In the case of precipitation, majority of area in the city was seen to be facing increased number of days of high-intensity rain (>30mm) that makes Bangalore city vulnerable to extreme events like flooding in low-lying areas like the periphery area of western and eastern regions. While, variation in annual average rainfall was extensive in the northern regions of the city, facing an increase in above average rainfall, a few wards in the eastern and southern

56
regions showed decrease in annual average rainfall. However, there is a possibility that in the future the eastern regions could face drier conditions and drought periods during the summer months of the year because of increasing difference in pre-monsoon and after monsoon rainfall and stressed condition of ground water level. High degree of land use change due to urbanisation, hazardous growth of urban fringes, poor living conditions and lack of basic facilities make the city more vulnerable to climate stimuli.
Figure 4-3: Spatial distribution of the exposure components of climate change vulnerability and aspects of exposure
component a)Exposure, a1) Number of days of temperature above 30oC, a2) Mean temperature, a3) Rainfall greater than 830 mm and a4) Number of days above 30 mm rain.
57
4.4.2 Sensitivity
The magnitude of the sensitivity component of Bangalore city was found to have an average range as shown in Figure 4-4. Spatial distribution of sensitivity component showed that the central region and the periphery of the western to the southern region of the city were more sensitive to different climate stimuli than other regions. Most regions of Bangalore city was seen to be sensitive to changes in social and environmental aspects and least to physical and economic aspects. Social and environmental aspects of sensitivity component contributed to a high degree in the overall sensitivity of Bangalore city. According to physical and economic aspects of sensitivity component, central region of Bangalore city is sensitive to climate events. Spatial distribution of social aspect of sensitivity showed that approximately 5% of the total area, mainly in the central region, was highly sensitive and about 55% of total area of Bangalore city in the southern, northern to western and eastern region of Bangalore city were at high level of risk to climate change impacts. Lastly, the environmental aspect of sensitivity was seen to be highly sensitive and contributed the most to the overall sensitivity of Bangalore city. About 32% of total areas of Bangalore city were seen to be sensitive to climate stimuli and human intervention. The overall sensitivity analysis showed that the periphery of the western to southern, eastern regions of Bangalore city and a few pockets in the central region were observed to be vulnerable. Mainly because these regions are either socially vulnerable in term of people lacking in awareness, basic facilities, accessibility and multiple deprivation and at the same time these are also region that are undergoing rapid urbanisation that has lead to unplanned periphery areas and deteriorated natural environment etc.
4.4.3 Impact
The high impact areas of climate change are predominantly distributed towards the periphery of the north, east and southern region of the city as shown in Figure 4-5. The percentage of area facing the magnitude of impact above 0.5 was found to be 90.1% of the total area of the city. About 12.5% of the total area is facing severe impact of climate change (above magnitude 0.7). It was found that Bangalore city has limited physical impacts from climate events. About 1% of the total area showed high sensitivity to various climate phenomena. Some of these areas were poorly built with slums pockets and low-lying area and faced severe impact from rain in the form of flash flooding every year. The climate impact on social structure of Bangalore city showed that about 35% of the total area was facing impacts of climate change in the magnitude of above 0.5. In addition, 6% of the total area was seen to be suffering severe impact of climate change at a social level (above 0.7). These severely at-risk social areas were dominant in the eastern, northern and a few pockets in the central regions of the city. The impacts of extreme climate events and changes in climate variables have affected the environment the most with most of the natural areas in the

58
city being highly sensitive. Environmental and social aspects of sensitivity were among the primary predictor for the overall impacts of different climate stimuli.
Figure 4-4: Spatial distribution of sensitivity component of climate change vulnerability and aspects of sensitivity
component b) sensitivity, b1) Physical and economic aspect, b2) Social aspect and b3) Environmental aspects.

59
Figure 4-5: Spatial distribution of climate change impacts and aspects of impact c) sensitivity, c1) Physical and economic
aspect, c2) Social aspect and c3) Environmental aspect.
4.4.4 Adaptive capacity
Figure 4-6 shows the spatial distribution of adaptive capacity. The overall adaptive capacity of Bangalore city was of a medium magnitude ranging from 0.4 to .6. It was found that the central region of Bangalore city had higher adaptive capacity than other parts of the city. Adaptive capacity was also found to be higher in those regions that had active economic activities, high density of institutional areas and well-developed basic infrastructures. However, most of the

60
periphery areas with small villages and new developmental areas had low adaptive capacity. The reason for this is likely to be poor condition in term of basic infrastructural services, little economic activity and low awareness. About 20% of the total area of the Bangalore city had a high adaptive capacity with magnitudes above 0.6. Considering the socio-economic aspect of adaptive capacity, it was observed that the social adaptive capacity was high in the central region of the city and low at the periphery of the western, southern and some pocket in the central region of the city. Adaptive capacity measured in terms of provision of basic facilities was moderate, with only 7% of the total area with high accessibility to basic facilities, 50% with moderate level and approximately 40% with low-level accessibility to necessary services. As for the environmental aspect of adaptive capacity, about 35% of total Bangalore city had sufficient access to green infrastructure like green open spaces, gardens, lakes and wetland areas. About 60 % of the total area of Bangalore showed below minimum access to green infrastructure.
4.4.5 Overall vulnerability
The overall vulnerability pattern of Bangalore city to climate change is presented in Figure 4-7. The distribution closely resembles the results of the impacts of climate change in Bangalore city. Northern, eastern and southern region of Bangalore city, seen to be high-impact regions in Figure 4-7, were even more predominant in the overall vulnerability assessment results. These results are because of the high influence of the sensitivity and exposure components in these areas. However, it is also observed that the regions having high overall vulnerability to climate change also seem to have low adaptive capacity (comparing with Figure 4-6). Ward-wise result of vulnerability assessment is also presented in the appendix 5.
4.4.6 Potential vulnerability profiling
Cluster analysis helped to profile the potential vulnerability to climate change as per the severity into medium, high and very high vulnerability. These overall vulnerability profiles are presented in Figure 4-8. The vulnerability profile shows the severity of vulnerability and areas that need urgent response action across Bangalore city. Areas of high vulnerability profile were seen to be sensitive to most climate stimuli and at the same time showed frequent occurrence of severe climate events. A comparative study of the vulnerability assessment maps revealed that these regions showed low levels of sensitivity, medium level adaptive capacity and high level of influence from various exposures. The spatial distribution of the very high vulnerability profile could be observed on the periphery of the northern, eastern and southern regions of Bangalore city with a spatial coverage of about 4% of the total area. Approximately 91% of the total area was calculated as having high degree of vulnerability. These regions had medium adaptive capacity and low sensitivity to various climate exposures. However, it is likely that in the future these regions will shift to the high

61
vulnerability profile because of the increase in extreme weather events, decrease in sensitivity and decrease in adaptive capacity. 5 % of the total area of Bangalore city falls under medium magnitude of vulnerability. These regions are located in a few pockets in the central area and western region of Bangalore city. These regions have a high level of adaptive capacity and low level of sensitivity and exposure.
Figure 4-6: Spatial distribution of adaptive capacity component climate change vulnerability and aspects of Adaptive
capacity component d) Adaptive capacity, d1) Social aspect, d2) Basic facilities aspect and d3) Ecological aspect.
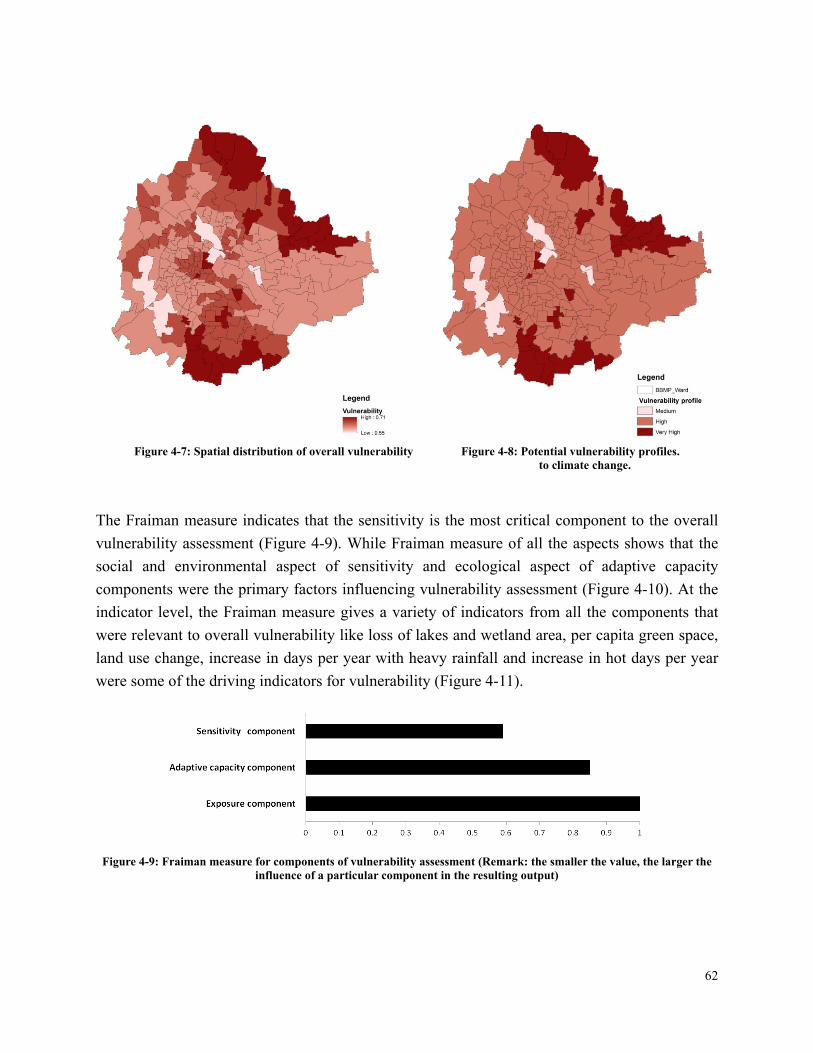
62
Figure 4-7: Spatial distribution of overall vulnerability Figure 4-8: Potential vulnerability profiles.
to climate change.
The Fraiman measure indicates that the sensitivity is the most critical component to the overall vulnerability assessment (Figure 4-9). While Fraiman measure of all the aspects shows that the social and environmental aspect of sensitivity and ecological aspect of adaptive capacity components were the primary factors influencing vulnerability assessment (Figure 4-10). At the indicator level, the Fraiman measure gives a variety of indicators from all the components that were relevant to overall vulnerability like loss of lakes and wetland area, per capita green space, land use change, increase in days per year with heavy rainfall and increase in hot days per year were some of the driving indicators for vulnerability (Figure 4-11).
Figure 4-9: Fraiman measure for components of vulnerability assessment (Remark: the smaller the value, the larger the
influence of a particular component in the resulting output)

63
Figure 4-10: Fraiman measure of all the aspects of vulnerability assessment
Figure 4-11: Fraiman measure of all the indicators of vulnerability assessment

64
4.5 Discussion
This study presents a vulnerability assessment framework to climate change that allows the evaluation of vulnerability patterns of the urban system to different climate change issues and also provides a spatial profile of these vulnerabilities.
Despite the mutual agreement concerning the concept of climate change vulnerability and its key components within the scientific and policy-making communities, there is still a severe lack of standardized vulnerability assessment methods procedures for application at the local scale (Costa and Kropp, 2013; Füssel, 2007; Holsten and Kropp, 2012; Preston et al., 2011). This lack of standardisation has led to the flourishing of subjective assessment methods that may not be sufficient for developing action responses at the local scale (Preston et al., 2011; Rannow et al., 2010). Outputs and knowledge derived from such methods are very general and difficult to translating for the development of the response action to climate change.
Currently, majority of cities in developing countries lack the necessary information on climate change impacts to produce response actions in different sectors (Measham et al., 2011; Tribbia and Moser, 2008). Most cities in developing countries, especially in India are still evolving and struggling to deal with fundamental issues like provision of necessary facilities, basic infrastructure, poverty alleviation, population growth and social disparities. Additionally climate change impacts prove to be a heavy exertion on institutional and financial capabilities.
In this study, we try to adapt the local issues and concern related to climate change within the spatial planning practices that can potentially help in developing action responses for different sectors. For example, the analysis of the exposure component represents the effects of extreme weather conditions and probability of drought or flood conditions in different regions. This information can be used to implement action responses to deal with water and wastewater related issues such as modifying ground and surface water sources to address supply vulnerabilities during flood and drought conditions, encouraging innovation local supply techniques such as rainwater harvesting and water reuse, exercise demand management of water through pricing policies, leak detection ad unauthorized use and better toilet and shower codes.
In addition, an important feature of this study is that we have tried to assess all possible components, aspects and indicators at same spatial scale. Therefore, it is also significant that all the results presented at same scale and is consistent with the scale at which spatial planning and sectoral policies are developed at a local level.
To target mitigation and adaptation action response at local level comprehensive information at the same scale were derived from the application of vulnerability assessment framework. The

65
framework presented provides inclusive information at ward level and helps to prioritising action response to climate change through policy interventions within the spatial planning process. For example, vulnerability profiling of the urban area contributes to identifying the area that needs urgent attention in the form of adaptation response. Based upon the magnitude of the impacts collective or individuation response action could be developed. Results of vulnerability assessment showed that the periphery of the northern, eastern and southern regions of Bangalore city showed high vulnerability to the climate change impacts. The analysis also showed that these are also the same regions that are facing higher magnitude of exposures ranging from 0.9 to 1 in the form of increased number of hot days/year, increase in annual mean temperature and increased number of days/year with heavy rain (RR > 30mm). These regions also seem to have show high sensitivity to physical, social and environmental aspects with values ranging from 0.5 to .7. With such high exposure and sensitivity to climate change issues, these regions require a higher adaptive capacity.
For example, the results of the adaptive capacity showed that most wards that are highly vulnerable have low levels of adaptive capacity. It was observed that two key aspects of adaptive capacity, namely, ecological and basic services, were extremely poor in these wards while social integration aspects was seen to be relatively better. In this situation the local government, with the help of the local community can developing short term solutions like planning trees, green roofing, restoration of lakes from encroachment and awareness and controlled land use change that can contribute to reduce physical impacts of climate change. Over the long term, policymakers can focus on reducing the structural processes of inequalities in distribution and providing access to basic infrastructures, health services, improved living environment, in addition to addressing the economic and social marginalization of individual wards and regions that limit opportunities to enhance well-being and enable adaptation to various impacts of climate change (Romero Lankao and Qin, 2011)
Outputs of vulnerability assessment framework have also identified different sectors for example loss of lakes and wetland area, per capita green space, land use change, accessibility of necessary infrastructure to people and location of highly vulnerable social groups such as children and slum residents that required urgent attention and integration within local level policies in Bangalore city. This could occur through spatial planning policies.
The framework presented in this study provides comprehensive information at ward level and will be useful in prioritising action response to climate change through policy interventions within the spatial planning or general policy processes. Presently spatial planning practice, or even general policies in different cities in India are based upon biased and unjustified conclusions, very basic quantitative analyses makes public decisions difficult and does not allow for fair trade-offs
66
between priority and non-priority issues (Reckien, 2014; Roy, 2009; Wilson and Piper, 2010). This study tries to resolve these issues by identifying the contribution of each indicator to a comprehensive assessment. Furthermore, ranking of the priorities spatially and at sector level allows a comparative analysis to apply various small interventions rather than a single dominant intervention.
This study presents a rational and simple vulnerability assessment framework to be operational at any local level that can help to prioritize response action either independently or in the spatial planning process. However, selection of indicators under each vulnerability component should be adapted with relevance to a specific region. This step is crucial as it has a larger influence on the overall outcome of the assessment. For the application of the framework in the selected case study, one of the key issues was the availability of critical data and detailed information required by the vulnerability assessment framework. A large number of urban regions in developing countries do not maintain historical records on a different aspect of the urban system and climate variables (Laukkonen et al., 2009). Available databases are unstructured and sometimes irrelevant. It is also difficult to assess the quality and source of databases because of the presence of multiple organizations within in a region. In India, for example sometimes government institutions are not aware of data availability within and other government or private organizations. These issues can lead to biases and uncertainties in the assessment method. Also, lack of coordination and partnership among various groups and stakeholder during the planning process and decision making at local level create problems in implementation of actual response actions to climate change issues. For example, in the case of Bangalore allowing private developer to build commercial and residential building on green space and seasonal dried lakes of city not only create environmental issues but also affects the social fabric of city without considering the consensus of local people.
The study also provides information on potential difficulties and gaps to conduct climate change vulnerability assessment at a local level. A few limitations of the assessment framework lie in the subjectivity linked to the selection of indicators, standardization and giving weights. That can be easily solved if all the major stakeholders involved in the conceptualization and problem development stage of the climate change vulnerability assessment.

67
Chapter 5 This chapter is based on: Kumar, P., Geneletti, Bawa, K. (in preparation) Spatial assessment and perception of people to climate change in Darjeeling Himalaya.

68
5 Spatial vulnerability assessment and perception of people to climate change in Darjeeling Himalaya
5.1 Introduction
Mountains account for about 24% of the total terrestrial area of the world with 26% of total world population living in or on the foothills of mountains. Approximately 40% of the total world population directly or indirectly are dependent on its ecosystem services (Beniston, 2003; Meybeck et al., 2001). It is therefore ominous that mountains are one of the most fragile socio-ecological systems of the world being extremely sensitive to the effects of climate change (Schild, 2008). However, mountains also have distinct characteristics that make detection and assessment of climate related issues easier making them interesting subjects and live laboratory for many research organisations for studying climate change impacts (Beniston, 2003; Kullman, 2004; Salick et al., 2009).
Significant events of climate change across mountain regions of the world are visible through glacial recession, warming of mountain, extreme precipitation events, natural hazards, loss of human life and extinction of biodiversity (Du et al., 2004; Jianchu et al., 2009; Maraseni, 2012). As mountains are rich in biodiversity which show sharp transition zones (ecotones), immediate and first impacts of climate change are more evident in the form of early plant blooming, extinction and shifting of plant species and migration of animals from low to higher altitudes (Byg and Salick, 2009; Myers et al., 2000). The reason for these conspicuous effects of climate change in mountain regions is that as temperature changes rapidly with height in these regions, it affects the biodiversity and hydrology in its wake (Beniston, 2003; Whiteman, 2000). Changes such as these consequently effects the diverse ecosystem services that mountains provide for the populations living in these regions and the adjacent lowlands causing distress to the social, economic and political fabric (Macchi et al., 2011). Sharp differences in terrain and complex socio-ecological system makes climate studies demanding in these regions and raise significant concerns to adaptation, especially in developing nations in south East Asia and Africa (Beniston, 2003; Velma I. Grover et al., 2014).
During the United Nations Conference on Environment and Development (UNCED) in Rio in 1992 concerns of climate change on mountains was addressed by policy makers with a special chapter in Agenda 2 which was followed by the UN General assembly marking 2002 as the ‘Year of the Mountain’ at the Global Mountain Summit and World Summit on Sustainable Development in 2002 (Schild, 2008). While awareness and evidence about climate change concerns in mountains is progressively increasing, there is still inadequate research and work in terms of policy response. International and national developmental agendas like poverty reduction,

69
urbanisation and economic development issues are marginalizing the importance of safeguarding mountain ecosystems specially in developing nations like India, Nepal and Bhutan (Aryal et al., 2014; Barua et al., 2014; Maraseni, 2012).
In the case of India, spatial and sectoral policies at all spatial scales largely focus on building national or local economies and infrastructural development, with only a modest focus on social concerns. Majority of these policies fails to integrate concerns and location-specific issues of mountain regions and communities. In India, mountain communities in particular have historically experienced social, economical, political and cultural exclusion and empowerment. Adding the effects of climate change, communities in mountain regions have been and will continue to face drastic effects on their livelihood. For example, indigenous populations in the Himalayas depending on subsistence farming are facing problems due to climate change related changes in temperature and precipitation as well as those that depend on rapidly changing alpine habitats for medicinal plants, alpine grazing lands and forest products. It is therefore essential to design effective and location-specific policies in order to adapt to climate change in these regions, which should also include local knowledge and communities' perception to cope with climate vulnerabilities (Gippner et al. 2012; Picketts et al. 2013).
With the largest concentration of glaciers outside the polar region and feeding nine major rivers systems in Asia, the Hindu-Kush Himalayan range is one of the most important eco-regions of the world (Bajracharya et al., 2007). The Eastern region of Hindu Kush Himalaya is particularly important in view of climate change impacts because it is one of the most diverse temperate regions of the world with distinct eco-regions, biodiversity hotspots, grass lands and home to diverse socio-economic and ethnic communities (Salick et al., 2014; Schild, 2008). Livelihood of inhabited communities in these regions is largely dependent on different agricultural practices and surrounding natural resources. Consistent increase in overall warming, changes in seasonal patterns and decrease in annual precipitation has become a serious concern for rural and agriculture based communities in the Eastern Himalayan regions (Macchi et al., 2011). These mountain regions, like other eco-sensitive regions such as wetlands and coastal zones, have very distinct and unique problems due to climate change and therefore cannot be tackled with global or country level policy initiatives, but require independent assessment frameworks and action responses.
However, assessing climate change impacts in the Himalayan region has been challenging due to lack of significant historic data and crude assessment from current climate models that oversimplify the climate concern in these regions (Beniston, 2003; Schild, 2008). Researcher and international organisation are therefore focusing on improving methods of analysing climate concern of mountain regions and trying to explore impacts at finer spatial scales. Technological

70
advancements such as availability of high resolution remotely sensing data has to some extent allowed improvement in understanding local climate and ecological processes in mountain region (Byg and Salick, 2009). However, knowledge about impacts on socio-ecological system is still ambiguous which makes mapping climate change vulnerability a difficult task.
We therefore base our studies in the district Darjeeling in the Eastern Himalayas which is facing severe problem due climate change and land use changes. Land use practices play a significant role in the livelihood of the people and also in determining the stability of the region with respect to landslide hazards. A significant portion of Darjeeling district is under forest cover while the lower ridges hilly ridges have been cleared for the cultivation of world famous tea plantations. Changes in land use patterns due to socio-economic factors are resulting in decrease in forest area, increase in agricultural activities related of tea and medicinal plantations and expansion of urban areas along the slope. Concurrently the changing climate is further exasperating the effects on land use patterns and deteriorate the fragile ecosystem of the region. The frequency of landslide, flooding and droughts has increased and the average annual temperature in the last 100 years has increased by 4˚C in the Darjeeling Hill areas (WBGov, 2012). The number of rainy days has increased from 155-135 to 160-140 days (WBGov, 2012). The soil and terrain of the region cause heavy runoff and erosion during the monsoon and water scarcity during the non monsoon season. In addition to these ecological problems, economic marginalisation, lack of basic facilities and unstable local government has made sustainable and planned development of the region very complex.
Therefore, in this study, an effort is made to explore the spatial vulnerability of climate change in selected sites in the Darjeeling District of the Eastern Himalaya, India. We also analyse the perception of people on climate change in the region and how it varies in extent and magnitude.
5.2 Data and method
5.2.1 Study Area
The study was conducted in the Darjeeling district of the state of West Bengal, India with special emphasis in six different sites for detailed analysis (mix of urban and rural areas at different altitudes) as shown in figure 5-1. Geographically, Darjeeling district of West Bengal is situated between 26° 31’ and 27° 13’ north latitude and between 87° 59’ and 88° 53’ east longitude with a total area of about 3149 sq. km. The area is bounded by Nepal on the west, Sikkim on the north, Bhutan on the north-east, Purnea district of Bihar abutting on the south and district Jalpaiguri of West Bengal on the south-east. The southern foothills are demarcated by a highly dissipated platform of terrace deposits extending along the east west axis. The elevation of Darjeeling district varies between 800 m to 3660 m above sea level with numerous high ridges and low-laying valleys

71
(Chaudhary et al., 2011). The annual rainfall fluctuates from 2000-2500 mm in the plains to 4000-6000 mm at the mountain region. There were distinct patterns of seasonal distribution of rain in the region. However, recently the amount and distribution of rainfall has been erratic which plays a very important role in the instability of slopes. The Darjeeling Hill area has been witnessing increase in number of days of high intensity rainfall within a short span of time resulting in increased number of landslides at different locations (Ghosh et al., 2012). According to the 2011 census, Darjeeling district has a population density of 585 inhabitants per square kilometre (1,520 /sq. mi.) with 60% of total population residing in urban areas. Its population growth rate over the decade 2001 to 2011 was 14.47%.
Figure 5-1: The study area Darjeeling district, India and land cover map 2014, and location of selected site for detailed
analysis.
5.2.2 Method and Data
In this study we investigate two key concerns of climate change a) spatial patterns of climate change vulnerability and b) Perception of people to climate change impacts. To fulfil these objectives, secondary data was collected from government organizations, local NGO’s and community social groups and primary data was collected from field work carried out between April to June 2014. It is to be noted that the vulnerability assessment is based upon the framework and methodological approach of chapter 4. The difference lies in the indicators used in the framework, which depends on the spatial setting of the study area.

72
Table 5-1: Socio-demographic profile of selected sites in the study area Sites Site 1 Site 2 Site 3 Site 4 Site 5 Site 6 Site 7
Darjeeling Siliguri Kalimpong Kurseong Senchal Wildlife Sanctuary
Singalila National Park
Ghis and Leis watershed region of Kalimpong
Type(Urban /Rural)
Urban Urban Urban Urban Rural ( Forest Villages)
Rural (Forest Villages)
Rural (Villages in interior region of Kalimpong block)
Number of town/Villages
Municipal town Municipal town Block level town Municipal town 5 Forest villages 3 Forest villages 6 Villages
Elevation (m) 2,045.2 m 644 m 1,247 m 1,500 m 1067–1600 m 2400–3660 m 1,247- 2,200 m
Local climate Temperature varies from 8˚C to 15˚C from winter to summer season. Summers are wet due to the monsoon rains from June to September
Chilled winds with a mean of 9˚C in winters and hot in summer with 35˚C mean temperature. Heavy rains during the monsoon season from June to September
Temperature varies from 8˚C to 30˚C from winter to summer season. Monsoons are severe, often causing landslides
Kurseong is warm and temperate, with temperatures varying from 10˚C to 21˚C winter to summer.
The temperature varies from 1.7˚C to 8.4˚C through the year. Frost is very common from December till March in areas above 2000 m. In the high ridges, some snowfall
Mean temperature varies between -20˚C to 15˚C. Average relative humidity varies from 83% to 96%.
Humid and subtropical with temperature varying from 4˚C to 27˚C. Average annual rainfall is 2030 mm.
Economic activities ( Livelihood activities )
Tourism, small entrepreneurship, tea and spice plantations.
Small entrepreneurship, daily wage activities and tourism
Small entrepreneurship, daily wage activities and tourism
Small entrepreneurship, daily wage activities and tourism
Tourism, timber production and small or marginal farmers
Tourism, timber production and small or marginal farmers
Small or marginal farmers, tea and spice plantations
Socio structure Majority of people with Nepali ethnic background with several sub groups. These groups have their own dialects and community based organization

5.2.3 Secondary data
In order to investigate the climate change vulnerability, the vulnerability assessment
framework proposed by Füssel and Klein (2006) is used in this study as in chapter 4.
According to Füssel and Klein (2006), vulnerability is the result of three key components:
exposure, sensitivity and adaptive capacity. In this study, vulnerability represents the current
state of the socio-ecological system of this mountain region and describes the potential to
experience harm from external and internal exposure due to the system’s sensitivity and
adaptive capacity.
As per Füssel and Klein (2006), exposure describes the nature and degree to which a system
is exposed to significant climatic variations. In this study three indicators were selected to
represent exposure component o f vulnerability assessment i.e. mean temperature change,
change in average rain fall and number of rainy days. Data were collected from local
metrological station source and secondary sources.
Sensitivity is the extent to which a system is affected, either adversely or beneficially by
climate exposure and the effect may be direct or indirect. To assess sensitivity of the selected
case study three main aspects were identified, namely, environmental, physical and
socio-economic factors. Further under each aspect, indicators were selected using expert
knowledge from discussions with local government organisation, NGO and semi-structured
interview and discussion with different stakeholders (Table 5-2).
Adaptive capacity is the ''ability of a system to prepare for stresses and changes in advance or
adjust and respond to the effects caused by the stresses” (Engle, 2011; Smit and Pilifosova,
2003). The Adaptive capacity component were measured based upon three key aspects,
namely, basic facilities, economy and social structure of the region. Each aspect of adaptive
capacity components were further divided into indicators detailed in Table 5-2.
The assessment method was applied at two levels; one at blocks level (District subdivision)
that is smallest administrative unit of local government and second at a household level from
the interviews (as detailed above) in Darjeeling district. To evaluate vulnerability in either

74
level, standardisation was conducted to convert original values of the indicator into a 0 to 1
scale to compare and aggregate the results of all the indicators. Indicators, aspects and
components of the vulnerability assessment were combined by means of Spatial
Multi-Criteria Evaluation (SMCE) method to understand spatial pattern of vulnerability. The
final results of spatial pattern of vulnerability of climate change are presented in the form of
maps that depict the spatial pattern of vulnerability to climate change ranging between 0-1.
5.2.4 Primary Data
We used semi structured interview and detailed questionnaire surveys at household level to
understand the perception of people from selected sites (Appendix 6). In each site, focus
group discussions and selected interview were conducted. The questionnaire were designed
according to the study area and the vulnerability assessment framework based on (Füssel and
Klein, 2006). It covered questions related to the three key components of the vulnerability
assessment framework, namely, exposure, sensitive and adaptive capacity. For this study
only people above 25 years of age were included in the survey to capture the perception of
two generations. A total of 170 respondents were interviewed. Interviews were conducted in
Hindi, English and Nepali with the help of an interpreter for the local area. Field work and
household interviews helped to gain insight of the socio-ecological problems that the
communities are facing and played a significant role to understand climate change
vulnerability. People gave household information based on their daily experience, historic
behaviour about the climate pattern and impacts on physical, social and economic sectors.
People were asked about their perceptions of climate change on the different indicators
tabulated in table 5-2 and the answers were recorded either as qualitative descriptive
responses, as yes - no responses or as values on a scale of 1 to 5. Responses from the primary
survey were categorized into exposure, sensitivity and adaptive capacity followed by
standardization on a scale of 0 to 1 for statistical analysis. This information was used to
assess the vulnerability (V) of each respondent at each location as Equation 1 (Metzger and
Schröter, 2006)
𝑉 = 𝑓{(𝐸𝐸𝐸𝐸𝐸𝐸𝐸𝐸), (𝑆𝐸𝑆𝐸𝑆𝑆𝑆𝑆𝑆𝑆𝑆)(𝐴𝐴𝐴𝐸𝑆𝑆𝑆𝐸 𝐶𝐴𝐸𝐴𝐶𝑆𝑆𝑆)} (1)

75
This is the same method of calculating vulnerability as used in chapter 4. Later on this
information was structured to develop a vulnerability pattern of climate change within
households and communities with the help of descriptive analysis. Table 5-2: Indicators used to measure climate change vulnerability.
Vulnerability Aspects Indicator Source (Ref)
Exposure Climate variables Increase in summer and winter temperature
(Hübler et al., 2008)
Changes in pre-monsoon and after monsoon
(Rannow et al., 2010)
Increase in days/year with heavy rain (RR >30mm)
(Rannow et al., 2010)
Sensitivity
Environmental Land use change (Pielke et al., 2011) Area under forest or wild life protected area
(Pielke et al., 2011) (Mundoli et al., 2014)
Soil type and slope (Mondal et al., 2014)
Source of drinking water and quality
(Delpla et al., 2009; Meuleman et al., 2007)
Distance to the water source
(Meuleman et al., 2007)
Physical Road condition and accessibility
(Szendrő et al., 2014)
Type of housing material (Habitat, 2011b)
Type of basic services available
(Barua et al., 2014; Habitat, 2011b)
Landslide zone and frequency of landslide
(Huggel et al., 2012)
Socio-economic Accessibility of public health centre
(Frumkin et al., 2008)
Type and time of migration
(Baca et al., 2014; Black et al., 2008)
Children younger then 6 year
(Bartlett, 2008; Han and Foltz, 2013)
Bank accounts (Lung et al., 2013)
No of fair price shop (Habitat, 2011b)
Adaptive Capacity Basic facilities Clean drinking water connection
(Banks et al., 2011; De Sherbinin et al., 2007)
Efficient cooking fuel (Mitigation, 2011) Accessibility to pubic transport
(Banister, 2011; Szendrő et al., 2014)
Economic Housing ownership (De Sherbinin et al., 2007; Dodman and Satterthwaite, 2008)
Asset ownership (De Sherbinin et al.,

76
2007; Dodman and Satterthwaite, 2008)
Local government or communities based organisation
(Agrawal, 2010)
Awareness and knowledge of different policies and scheme run by local government
(Baca et al., 2014)
Social
Level of education (Holsten and Kropp, 2012)
Quality of technical assistance
(Holsten and Kropp, 2012)
Accessibility of media (Sampei and Aoyagi-Usui, 2009)
5.3 Results
The results of the spatial assessment of climate change vulnerability for the Darjeeling
Himalaya are first presented under the components exposure, sensitivity, adaptive capacity
and overall vulnerability at block level. In addition to it perception of people were used to
evaluate site wise potential vulnerability. The results of vulnerability assessment application
are presented below.
5.3.1 Spatial vulnerability pattern of climate change at Block level
5.3.1.1 Exposure
According to this study the majority of the blocks in Darjeeling district were found under
very high exposure from different climate stimuli. About 57% of the total area was seen to be
facing severe exposure. The results of the exposure component were based on climate stimuli
like mean temperature change, extreme events of precipitation and annual precipitation
change. The result of exposures showed stronger effects in the north and north-western
region and central region of Darjeeling district as shown in figure 5-2. Increased number of
days with intense precipitation (RR > 50mm) and change in mean temperature were the key
indicators that influenced the exposure component. It was also observed that there was
persistent increase in mean temperature in entire Darjeeling district from .5 oC to 1.5 oC for

77
the last fifteen years especially in the blocks located in the northern, western to southern
region of Darjeeling district. Some of the reasons for this change are extensive land use
change in term of deforestation, intensive agriculture farming and physical development.
Majority of block of Darjeeling district were observed to be facing increased number of days
of high intensity precipitation (>50mm) that is likely to make the district more vulnerable to
extreme events like landslide in the higher elevation, sink zones and flooding in the plains.
Blocks in the central and eastern region were severely affected by intensive rain in the past
decades. These regions are also more prone to landslide because of soil type, sink zones, fault
line and extreme climate events (Mondal and Maiti; WBGov, 2012). While, there was overall
increase in annual average rainfall, the northern and central block of Darjeeling district
showed decrease in annual average rainfall. Fast runoff during the monsoons, together with
lack of rainfall in the non monsoon seasons results in drought conditions in large parts of
Darjeeling district. As a result during the lean season between January to May, there is
scarcity of clean water, which is exasperated by skewed distribution services and losses from
dilapidated old British water supply system (WBGov, 2012).
5.3.1.2 Sensitivity
Analysis of the indicators of the sensitivity component showed that about 50% of the total
area of Darjeeling district was sensitive to the effects of climate change. Spatial distribution
of sensitivity component (Figure 5-3) showed that the Blocks in eastern to northern region of
Darjeeling district were more sensitive to different climate stimuli than the southern regions.
Most of the blocks were observed to be more sensitive to changes in social and physical
aspects than to natural aspects. The overall sensitivity of the district was largely determined
by the social and physical aspects. The social and physical sensitivity to climate change was
maximum in the eastern regions like Kalimpong I, II and Gorubathan blocks. Results of
social and physical aspects were based on indicators such as health, infrastructure, people at
risk, banking facilities, road infrastructure, housing quality and risk zones. Spatial
distribution of social aspect of sensitivity showed that approximately 45% of the total area,
mainly in the eastern region, was highly affected by social factors. About 33% of total area of
Darjeeling district showed high levels of risk due to physical factors. About 50% of total

78
areas was found to show medium levels of sensitivity due to natural factors such as climate
stimuli and human intervention. The overall sensitivity analyses showed that mountain
region of Darjeeling district are more sensitive to the effects of climate change than plains.
Mainly because in these regions people are either socially vulnerable in term of lack of basic
facilities, accessibility, physical infrastructure and poverty, or because their livelihood
depends on natural ecosystem and agriculture.
Figure 5-2: Spatial distribution of the exposure components of climate change vulnerability and aspects of exposure
component. a) Exposure a1) Mean temperature a2) Rainfall a3) Number of days > 50 mm rain.

79
5.3.1.3 Adaptive capacity
The adaptive capacity for different blocks of Darjeeling district were measured based on
three key aspects mainly basic facilities, economics and social aspects. Figure 5-4 shows the
block wise spatial distribution of adaptive capacity. The overall adaptive capacity of
Darjeeling district was observed in a low to medium range from 0.2 to 0.55. It was found that
southern and eastern blocks of Darjeeling district had very low adaptive capacity compare.
Adaptive capacity was also found higher in those regions that had active economic activities
like tea production, cash crop production, better social infrastructure or social integration like
awareness, participation and higher education levels. Most blocks in the district seem to
require urgent attention to drastically improve the basic facilities and economic activities.
Most rural areas were observed to have very low accessibility by roads. In addition decrease
in agriculture and tea production because of erratic climate changes has resulted in loss of
jobs opportunity and livelihood option, forcing people to migrate to towns and cities.
5.3.2 Overall vulnerability pattern of climate change in Darjeeling district
The overall spatial pattern of vulnerability of Darjeeling district to climate change is
presented in figure 5-5. Blocks of northern and eastern region of Darjeeling district were
observed to be facing high magnitude of vulnerability to climate change. These results are
because of the high influence of the exposure and sensitivity components in these blocks.
However, it was also observed that the overall adaptive capacity was low for the entire
district. About 35% of total areas of Darjeeling district need urgent attention in term of
adaptation response to climate change. Most blocks at high altitude, like Kalimpong I and II,
Darjeeling Pulbazar and Rangli Rangliot were observed to be most vulnerable to climate
change.

80
Figure 5-3: Spatial distribution of sensitivity component of climate change vulnerability and aspects of sensitivity
component b) sensitivity b1) Physical aspect b2) Socio-economic aspect b3) Environmental.

81
Figure 5-4 : Spatial distribution of adaptive capacity component climate change vulnerability and aspects of
adaptive capacity component c) Adaptive capacity c1) Basic facilities aspect c2) Economic aspect and c3) Social
aspect.

82
Figure 5-5: Spatial distribution of vulnerability pattern to climate change in Darjeeling District
5.4 Spatial vulnerability pattern of climate change at site level from perception of
people
5.4.1.1 Exposure
The results from the interviews showed some interesting results. The perception of people
towards indicators in the exposure component like average temperature change, total
number of high intensity rain days and average annual rainfall change showed an increase in
all most all blocks in the Darjeeling district. Historic and meteorological data from the
selected sites confirmed that there were changes in the trend of climate variables (IMD,
2015). Group discussions and questionnaires revealed that the people of the region observed
significant changes in recent climate pattern for example changes in seasons, erratic climate
events, drought in summers seasons as well as decrease in annual precipitation and increase
in intense rainfall days.
The survey results showed sites 5, 6 and 7 people perceived high exposure to climate
indictors as compare to the other sites (Figure 5-6). These sites were located mostly in
medium to high altitudes with most of the area under forest and agricultural land use.

83
Livelihoods of the people of these sites are dependant on agriculture. Considerable change in
climate variables like temperature and rainfall were having high impacts on the production of
agriculture commodities and local ecosystem services. Landowner and farmers were
experiencing significant loss in tea, cardamom and local agriculture production and change
in agricultural productivity in the past decade. However people living in or near urban areas
perceived less exposure to direct climatic changes. They perceived changes as second order
impacts of climate change like change in seasons that impacted local tourism, availability of
water in summer season and observed landslides events during high intense rain days.
Figure 5-6: Site wise exposure component assessment and perception of local people on key sensitivity indicators
5.4.1.2 Sensitivity
About 70% of total respondents were observed to be highly sensitive to climate exposure.
100% sampled interview from site 5, 6 and 7 fell into the high sensitivity grade (Figure 5-7).
These are also those sites that were observed to have a high exposure to climate variables. It
was observed that site 2 was least sensitive to climate exposure. This site was located at a low
altitude and foothill of Darjeeling district. The highly sensitive sites according to the
perception of people were those that lacked accessibility to health and basic facilities,
showed drying of water source, incurred migration because of climate change, showed major
land use changes, high unemployment, and low physical infrastructure. Site located in or near
urban areas were found to show medium sensitivity and observed to have better accessibility
to physical, social, basic infrastructure and market opportunities.

84
Figure 5-7: Site wise sensitivity component assessment and perception of local people on key sensitivity indicators
5.4.1.3 Adaptive capacity
The adaptive capacity for different selected sites were measured based upon three aspects
namely, economy, basic facilities and social aspects. Household from site 6, 7 and 5 were
perceived to have the lowest adaptive capacity (Figure 5-8). About 50% of the total sampled
household showed low to medium adaptive capacity. Some of reason for having low adaptive
capacity to these regions was the local government. Currently local governments and
institutions are undergoing major transformation to provide basic facilities and infrastructure
to the sites located in rural areas. Due to the political instability in the region, government
institutions at rural level have ceased to obtain financial as well as administrative assistance
from the district and state level. Sites in the foothills like Siliguri, Kurseong were found to
having better adaptive capacity than other regions due to urban development and livelihood
opportunities.
5.4.2 Perception of people and overall vulnerability at site level
The result of the overall vulnerability indicates that about 61% of the total sampled
households were highly vulnerable (Figure 5-9 and 5-10). Exposure was the key component
of high climate change vulnerability values in most sites. People living in the higher altitudes
seem to be facing increased number of hot days, mean temperature change, increased number
of intense rain days. Communities at the foothills of Darjeeling hills noted increase in the dry
season, fluctuation of pre-monsoon and after-monsoon rains and increase in mean
temperature. High vulnerable site also perceived greater sensitivity to climatic changes

85
resulting in loss of agriculture production and ecosystem services causing negative
repercussion on the development of communities. These sites had showed low levels of
adaptive capacity because majority of households had low level of awareness, lack of
employment opportunities and most importantly lack of participation at any stage of policy
preparation or even in local government.
Figure 5-8: Site wise adaptive capacity component assessment and perception of local people on key adaptive
capacity indicators
5.5 Discussion
Himalaya is one of the most complex socio-ecological systems of the world. It is among the
youngest mountains of the world and home to key biodiversity hotspots and critical
eco-zones of the world (Chaudhary et al., 2011; Myers et al., 2000). Even small disruption
and disturbance from external sources and climate variables has a drastic consequence on the
entire socio-ecological fabric. Intuitively it is conceivable that the district Darjeeling, as one
of the most disturbed and degraded parts of the Himalayas, is likely to be affected by climate
change. Also local communities have already started observing detectable changes in the
patterns of climate variables and its impact on agricultural production. However the
geographical and demographical characteristics of the district, with poor accessible
landscapes, difficult terrains, scattered villages and poor infrastructure, makes scientific
research with adequate data a near impossibility (Mukherjee, 2013). In this research we
therefore attempts to integrate the two most informative sources of information in the form of

86
remote sensing data and knowledge from local communities to understand the vulnerability
of the region and their repercussion on local livelihood and well-being.
Figure 5-9: Site wise spatial vulnerability pattern to climate change among communities in Darjeeling District
Figure 5-10: Site wise vulnerability assessment by local people perception
87
The remote sensing data as well as detailed data from government organization were used to
assess vulnerability pattern of climate change at block level, using scientific frameworks to
evaluate exposure, sensitivity and adaptive capacity of the region. The research conducted is
highly suitable for this type of terrain and is potentially an improvement on other frameworks
of research because the study effectively integrates empirical evidence of social as well as
ecological nature.
Darjeeling district is constituted of about 73% area under hills and 27% area under plains.
Geography, elevation and climatic variables play an important role in social and ecological
aspect in Darjeeling district. Findings of this study show that majority of Darjeeling
subdivision ( Block) are experiencing high vulnerability to climate change especially is the
hilly regions of the district namely, Kalimpong I and II, Darjeeling Pulbazar and Rangli
Rangliot block of Darjeeling district. These are the blocks that have high sensitivity to
physical, social and ecological aspects. The population explosion and floating tourist influx
in the region has dramatically increased the per capita resource demand. This has resulted in
over exploitation of natural resources such as forests, water and land for agriculture resulting
in hydrological imbalance, soil erosion and socio ecological disparity. This provokes micro
climatic changes, devastating effects in the event of extreme climatic conditions as well as
poor adaptation capacity due to economic backwardness. About 35% of total areas of
Darjeeling district needs urgent attention in term of adaptation response to climate change,
majority of which lies in high altitudes, rural and marginalised communities. The Blocks
Kalimpong I and II, Rangli-Rangliot, Kurseong, Bijanbari and Gorubathan are particularly
susceptible to landslides. In these blocks large areas of land have been cleared for
commercial agriculture (rather than the traditional subsistence farming) to grow root
vegetables like potatoes, ginger, onion and cardamom. The crops are harvested just after the
monsoons, affecting soil cohesiveness. Large bursts of rainfall during the off monsoon
seasons, due to changing climatic conditions, makes these areas prone to erosions and
landslides. Blocks lying in the foothills such Matigara, Naxalbari, Phansidewa, Kharibari are
less prone to climate vulnerability partly because they are less exposed to extreme climate
changes and have low sensitivity to climate stimuli and partly because the economic
development in the region makes them more resistant. In the absence of proper policies for

88
development, physical growth in the district has been very erratic, with high density housing
on acute slopes, some high rise building and slums in urban areas (Mukherjee, 2013). As this
region lies in the seismic zone IV, the buildings are in great danger to earthquakes as well as
climate related events such as cyclones, landslides, cloud bursts and glacial lake outburst
flooding (GLOF) (Chhetri and Tamang, 2013).
One of the key approaches of this study was to integrate knowledge and perception of
indigenous people and communities on climate concerns which have been lacking in earlier
studies on climate change research in mountain region for developing policies (IPCC, 2001;
Parry, 2007b; Salick and Ross, 2009). Local communities amass knowledge on the changing
climate and the means to cope with them (Chaudhary and Bawa, 2011). This information
when integrated with scientific knowhow and other databases can be used to device socially
acceptable mitigation and adaptation policies. Perception of people and communities
analysed in the study showed large percentage of communities in the district are experiencing
high vulnerability to climate change albeit in different measures and as different stressors.
The information from selected sites confirmed that phenomenon’s such as changes in
duration of season, less snowfall on the mountain, rise in temperature in winters and hot
summers were occurring, and that these were already acknowledged in previous studies
(Chaudhary et al., 2011; Patra et al., 2013). Communities located in Kalimpong I and II
blocks also confirmed extreme events of climate change like cyclones, unpredictable rainfall
and its impact in the form of landslides, loss of physical asset, human life, unaccountable
ecosystem services and biodiversity (Kumar, 2012). Unlike the results from the block level
analysis, communities in the foothills also affirmed to be experiencing climate exposures
like altered patterns of rainfall, increase in annual rainfall, increase in number of hot days,
dry spell in summer season and flooding in the monsoon season. At sites located in rural and
ecological sensitive regions like Singalila National Park, Senchal Wildlife Sanctuary and
Kalimpong regions and blocks lying in the high altitudes seemed most effected by climate
change. Economic and social activities in these sites are mostly agriculture and ecosystem
based which makes even minute changes in the climatic condition as reason for concern. For
example, large parts of this region have an economic base in production of tea, spices and
vegetables. Good quality of tea and spices account for a very good value in the national and

89
international market and in the last decade the production has been severely hampered.
According to the evaluation of the perception people as well as views of local experts from
tea research board in Darjeeling, the production and quality of tea has gone down. Large
areas of land under spice production is not suitable anymore and had to be abandoned
because of degradation of tree plantation which provide the shade and soil cohesion required
for spice plantation (Patra et al., 2013).
The interviews also revealed that for the communities in the rural sites protecting their
immediate physical and ecological space is most important for their livelihood and day to day
survival. However for people in urban areas the needs were indirectly related to the effects of
climate change in the form of tourism, tea production and infrastructure. Communities did
confirm that livelihood was linked to agricultural production with the weather patterns but
most people failed to associate it to the effects of global climate change. People also
described how changes in local climate were having impacts on the health. People have
become more vulnerable to heat waves, mosquitoes, flies and pests which have increased in
the high altitudes of Darjeeling district. Number of cases of malaria is increasing in the hills,
that used to be predominant only in the plains (Chaudhary and Bawa, 2011; Sharma et al.,
2009).
Results of this study show that non climatic factors also have significant effects on the
evaluation of climate change vulnerability. Social, physical and cultural structure of the
communities in the mountain were found to be linked the vulnerability of particular gender,
people and communities than other (Adger et al., 2013; Thwaites et al., 2014). People and
communities from high attitude and rural setting are marginalised in nature and experience
interlocking between internal and external stresses like population migration, environmental
degradation, market failure, decreased agriculture production and political insatiability
making them more vulnerable (Morton, 2007). However communities located in the urban
areas are facing issues like shortages of water in summer season, flooding during monsoon
seasons which have significant impacts on tourism. At the same time urban areas are
becoming dense and expanding. Urbanisation is forcing hazard due to land use change that in
turn impact the local climate (Chhetri and Tamang, 2013; Mell and Sturzaker, 2014).

90
The adaptive capacity of the district is greatly affected by physical infrastructure like roads,
electricity and water. People have low accessibility to market, education institution,
awareness and government institution. Decision making and local government institution are
weak or missing completely. People and communities from different sites are coping with
climate concern within their capacity or with the help of local self help groups which have
only limited impacts. Development of effective adaptation response and its implementation
by local institution needs a revival.
In India the National Mission for Sustaining Himalayan Ecosystem (NMSHEs) is
responsible for research and development of climate change impacts and is one of the
missions of India’s National Action Plan on Climate Change. The district Darjeeling also
comes under the purview of this mission, which is responsible for conducting extensive
research, evolve suitable management and policy guidelines and work with different
stakeholders to implement these guidelines. The results of this study highlights the potential
of understanding the spatial mapping of vulnerability assessment by integrating social,
economic and ecological aspects of the selected case study. These results can then be utilised
to identify critical areas of concern and devise adaptation policies such as expanding current
developmental policies to include climate change concerns, build institutional capacity of
governing bodies and local communities and spreading awareness. Most studies on climate
change in the Himalayas focus on snow, vegetation, tree line, soil and fauna which are
conducted under very broad scales, ignoring the cultural and social dimension of the
mountain communities. There is serious urgency for interdisciplinary studies such as this that
integrates climate science knowledge and perception of communities; the results of which
can be accessed by local institutions and government bodies for climate change mitigation
and adaptation response.

91
Chapter 6 This chapter is based on: Kumar, P., Geneletti, D. (in preparation). Assessing the effect of
ecosystem based policies for adaptation to climate change in Darjeeling Himalaya.

92
6 Assessing the effect of ecosystem based policies for adaptation
to climate change in Darjeeling Himalaya
6.1 Introduction
Climate change is inextricably linked to the ecosystem and livelihood of communities living in
mountain regions (Kotru et al., 2014). With extreme climatic condition, varying topography,
changing ecological zones and related microclimates, even slight change in temperature or
precipitation patterns in the region drastically effects the fragile balance of the ecosystem and the
communities dependent on them (Grêt-Regamey et al., 2012; Kotru et al., 2014; Schröter et al.,
2005). In addition, mountains are biodiversity hotspots and provide key natural resources such as
fresh water, forests products and minerals for people living in the region or outside it (MEA,
2005; Ten Brink, 2011). Such is the case also in the Indian Hindu Kush Mountains, where
communities have historically been backward with excessive dependence on agriculture,
pasturelands and forests. The changing climate in the region is already affecting their livelihood
and they have started facing impacts of rising temperature, shifting seasons, water availability,
shift in tree line to higher altitude etc. (Beniston, 2003; Chaudhary et al., 2011; Salick et al.,
2014). Thus livelihood practices in the region are closely related to the availability and health of
ecosystem services like water, energy, forest products, crops, habitat quality and tourism.
It is therefore ironic that the increase in per capita resource demands are resulting in degradation
and over exploitation of the natural environment, leading to extensive loss of ecological habitat
and ecosystem services (MEA, 2005; Willemen et al., 2013). This initiates a vicious cycle where
communities degrade the natural environment and as a result further exasperate the affects of
climate change vulnerability (Field and Van Aalst, 2014; UNISDR, 2011; Welle et al., 2012).
Land use conversion and forest and soil degradation are among the most important factors
affecting vulnerability to climate change in the region (Rao and Pant, 2001; Semwal et al., 2004;
Upadhyay et al., 2005; Xu et al., 2009). Large parts of the region are in transition stages adopting
new technology, urbanization and foregoing self subsistence living for open economies
(Upadhyay et al., 2005). Increase in agricultural population in the region in resulting in
conversion of forest and waste land for agriculture and is also putting undue pressure on forests

93
for fodder, fuel wood and timber (Bajracharya, 1983; Silwal, 1995). It is therefore urgent that
appropriate measures in the form planning mechanisms are put into place that regulates and
monitors land use change in the region. Spatial planning is the main policy instrument that can
affect the conversion and conservation of ecosystem services of a region (Geneletti, 2013). If
such measures are not implemented now, the effects on this fragile ecosystem could be
irreversible and far reaching.
To understand these dynamics between climate change vulnerability, ecosystem services and
planning policies, we base our studies in the eastern part of the Hindu Kush Himalayas. The study
area is located in two small watersheds, namely, Ghis and Leis, within the interior of Kalimpong
subdivision, in the district of Darjeeling, where changes in land use and forest degradation has
been emphatic and the consequent affects of climate change confirmed (Mor, 2013; Mukherjee,
2013). The district Darjeeling is under the environmental jurisdiction of the state of West Bengal
in India. The West Bengal State action plan on Climate change (under the National Action Plan
on Climate Change, India) designates the Darjeeling district as a priority area and one of the two
most vulnerable regions of the state. A somewhat detailed plan does exists at the state level on
how to make adaptive strategies, however there are two main problem with these plans: 1) Plans
made at national and state level does not seem to be implemented at district/city/village level.
The unstable government in the region as well as lack of proper funding has resulted in a defunct
plan that cannot be availed by the local people. 2) Plans for conservation of the region are still
based on meeting high demand of agricultural products (such as tea and spices) to cater the global
demand, are engineering based adaptations strategies (such as building reservoirs and fortifying
land slide prone areas) that will further change the ecosystem and are high cost measures. It is
therefore required that alternative effort are implemented that will include scientific vulnerability
assessment, environmental management and land use planning policies to safe guard the
ecosystem of the region. In this respect ecosystem based response actions are becoming one of
the most effective alternative policy responses to climate change among international and
national policy makers (Colls et al., 2009; Langridge et al., 2014). Ecosystem based response
action to climate change focus on restoration of natural resources and ecosystem to increase the
adaptive capacity of communities and decrease the sensitivity to climate exposure with an aim to
achieve resilient development (Estrella and Saalismaa, 2013; Langridge et al., 2014).

94
In this study we try to understand how ecosystem services based adaptation responses through
spatial planning practices can increase adaptive capacity of mountain communities and address
climate changes issues. We analyse a bundle of ecosystem services in two future land use
scenarios. Scenario analysis to compare the results of conceptual planning practices is common
in ecosystem based studies and has been made popular by the Millennium ecosystem assessment
(Geneletti, 2013; MA, 2005). Scenarios are developed by proposing alternative policies (to the
current status) regarding land use zoning , forestry practices, agricultural practices, economic and
physical development (Geneletti, 2013; Polasky et al., 2011). The main objectives of the study
are 1) Analysing if the existence/non existence of policies based on ecosystem services effects
land use change in the study area 2) Evaluating how the existence/non existence of policies will
effect specific ecosystem services through scenario analysis 3) Analysing and discussing how
specific ecosystem based policies aid adaptation to climate change and how they can be included
in current planning practices.
6.2 Case study and Method
6.2.1 Case Study
The study area is located in two small watersheds namely, Ghis and Leis, within the interior of
Kalimpong subdivision, in the district of Darjeeling with detailed study of 6 villages (Figure 6-1).
A socio demographic profile of each village is presented in the Table 6-2. Ghis and Leis
watershed comprises of an approximate area of 11400 hectares which is governed by gram
panchayats (local level governing body), the forest department and tea boards. The highest point
of the watershed is in Lava (2138 metres) located at north-eastern part and the lowest point is in
Patharjora (165 metres). Climatic condition varies from tropical to temperate. The major second
order streams within the watershed are Geet Khola, Chamong Khola, Dewrali Khola, Dabling
Khola, Reon Khola and Nimbong Khola. The upper ridgeline starting from Lava till Lolaygoan
is an evergreen forest with exotic pine vegetation. Besides, there are several patches of forest
scattered within the watershed subject to rapid deterioration due to several anthropocentric
pressures. Most of the established and emerging towns are located on the ridgelines. Besides the
forests at upper and the lower ends, vegetation coverage in the middle areas are almost nil,

95
making the place very unsuitable for habitation. Most of the villages are remote and located near
the bottom of the valley. Majority of the population is tribal and depends mostly on agriculture,
cattle rearing and forest products. Villages are scattered and remote with many of them lacking
basic infrastructures like roads, electricity, water supply, health centres, banks and schools. Due
to highly scattered habitation and rough topography, only a few civil societies have reached out to
these communities. In the last few years this area has been experiencing the impact of climate
change on agricultural production and extreme events like landslide, flooding and seasonal
drought. Pressure from national and international market to grow species and tea has brought
changes in land use and land cover of the study area resulting number of environmental issues
like water scarcity, habitat loss, soil erosion and agriculture production.
Figure 6-1: The study area Ghis and Leis watersheds, Darjeeling district and land cover map 2014.
6.2.2 Method
The method and results in this study are divided into three main sections. First, we used remote
sensing data to map the land use patterns and based on scenario analysis we mapped predictions
for change. Second, ecosystem services were evaluated considering different future land use
scenarios. Thirdly, we conducted a detailed questionnaire survey to understand the
socio-economic condition of the communities in the region, their land use practices and effects of
climate change.

96
6.2.2.1 Land use change and scenario analysis
Land use change for past and current year was analysed through geo-spatial modelling in remote
sensing and GIS. To prepare the basic inputs for the land use scenarios development, the base
used were Landsat satellite images (2001 and 2014) from the official website of US Geological
Survey (USGS). Map Projection of the collected satellite images is Universal Transverse
Mercator (UTM) within Zone 46 N–Datum World Geodetic System (WGS) 84 and the pixel size
is 30 m. Five land cover types were identified namely forest, agriculture, water, waste land and
built-up to understand land use change pattern.
Future land use scenarios were mapped using Land Change Modeler (LCM) tool implemented in
the software package IDRISI TERRSET (Eastman, 2009; Geneletti, 2013). The package allows
the input of constrains and incentives of land use transitions as well as input of specific local
policies on forest, agriculture and physical development. Two scenarios were envisaged
considering two different approaches in land use policies:
1) Business as usual (LU-2030B): This scenario was motivated by the existing but limited land
use policies gathered from national, state and district level and downscaled for regional level.
These policies are mostly related to forest conservation, change in agriculture practices,
infrastructure development and those related to the issues of waste land. It promotes plantation of
new species of trees which may not be indigenous in nature, and thus changes the biodiversity
and wilderness of the region. Although forests are being conserved, they are changing in
structure from dense to open type resulting in more human-wildlife conflicts. Agricultural
policies concentrate on increasing tea and spice production by clearing land from forests. Also
use in intensive agricultural practices using pesticides and fertilizers are promoted.
2) Land use change with climate change adaptation and conservation policies in play
(LU-2030C): This policy scenario was designed with the intension of conserving the indigenous
forests, reduce soil degradation, increase water yield and changes in agricultural practices like
multiple cropping, organic farming, alternative source of energy etc. We also included physical
and social infrastructure in areas which were not eco-sensitive in nature. We employed a
recognised method of scenario development (Huber et al., 2014), using expert judgement with
quantitative indicators recommended in the Land Use Model (Eastman, 2015).

97
For each transition, a mathematical sub-model was developed. Sub-models are based on the
combination of user-selected explanatory variables, using regression and Maximum Likelihood
method (Clark and Hosking, 1986; Geneletti, 2013). Finally, sub-models were generated
including variable like built-up, roads, elevation that showed high association with different land
use classes (Eastman, 2009). Next, the year of prediction of future land use change or transitions
was set. Finally land use scenarios for 2030 were generated for two future scenarios.
6.2.2.2 Ecosystem modelling
Different ecosystem services were identified during field work (Table 6-1). However, only a few
ecosystem services were further analysed for this study because of limited data availability. The
selected ecosystem services were modelled across the two land-use scenarios described above as
well as for 2014 land-use, which formed the basic temporal and spatial unit for comparison.
Ecosystem services modelling were performed through GIS-based models on IDRISI (Eastman,
2015; Sharp, 2014). Outputs were presented at pixel level. An overview of the modelled eco
system services like carbon sequestration, water yield, soil retention, timber production and food
production are as follows.
Table 6-1: Potential ecosystem services identified in the study area and those analysed are in bold
Category Sub-Category Example Provisioning Agriculture Tea, Cardamom, tomato, wheat and fruits
Livestock Sheep, Got, Poultry , Pigs Forest products Pine wood, honey Fresh water Agriculture and human use
Regulating Air quality Air purification Climate regulation CO2 sequestration Habitat maintaining Biodiversity and Natural protected areas Water regulation Riparian vegetation, water in-filtration Erosion control Terraces, deforestation Soil fertility Water courses and riversides
Cultural Spiritual value Home to spiritual tribes Nature tourism Hiking, mountain activities and home stay
Carbon sequestration
The carbon sequestration was based on the amount of carbon accumulated in aboveground
biomass, belowground biomass, soil organic matter ,dead organic matter and forest harvest wood

98
products (Houghton et al., 2012; Sharp, 2014). From the land use classification, each land-use
type quantified carbon storage level. Changes in carbon storage were based upon the transition
from one land-use type to another over a period of time. Data on carbon stored in different carbon
pools and every land-use class were taken from IPCC Guidelines for National Greenhouse Gas
Inventories (Eggleston et al., 2006). Integrating this data for the selected site and using the
Carbon Storage Model in software IDRISI, results were obtained that showed the amount of
carbon stored for current land use and future scenarios.
Soil conservation
Soil conservation has become a key concern in mountain regions. Change in climate patterns and
unexpected high intensity rains has severe impacts on soil conditions which further effects
agriculture production on slopes, water retaliation and landslide events. Therefore for this study
soil conservation is one of the key factors affecting adaptation response to climate change. Soil
conservation as an ecosystem service refers to the capacity of natural vegetation to keep soil in
place. Soil conservation service was modelled by including erosion rate on the selected case
study with the change of vegetation and non vegetation land. Erosion rates were predicted using
the Universal Soil Loss Equation (Wischmeier and Smith, 1978) with the help of GIS tool
(Eastman, 2015) that consider variables like land use, soil type, precipitation and DEM.
Timber production
Timber is an important product for the local people in the selected and a source of income to the
local government. In this study timber production was considered as an ecosystem service
provided by forests and was estimated by using the forest land use based on the work by
Geneletti (Geneletti, 2013; Nelson et al., 2009). The timber production was analysed using data
on harvest level and harvest cycle for the forest area. The data for selected case study were
collected from local and district forest departments. The analysis was based upon timber
productive capacity of the forest area (Haynes, 2003).
Food production
Food production is an important source of livelihood for the communities in the selected area.

99
The region is known for good quality of Darjeeling tea, spices, flowers, fruits and vegetables. In
the last decade the region has been facing impact of climate change and human interventions on
food production. The changes in food production in relation to changes in agricultural practices
were assessed for current and future land use scenarios based on Huber et al. (2014) and Briner et
al.(2012) . Recent production data were not available with the local government department.
Therefore past production data and the extracted agricultural land use class for 2001 and 2014
was used to quantify food production ecosystem service.
Water yield
The provision of fresh water for human and agricultural use is a basic but essential ecosystem
service. The people in the selected area have started facing water stresses during dry seasons as
well as the monsoon season. For this study conservation of water at local level and watershed
level has become a dire urgency for social and agriculture activities. Based upon the current land
use class, soil depth, plant available water content, annual precipitation, water runoff at the
watershed and sub watershed level water yield was used as input data to evaluate water yield for
the current year and future land use scenarios. Water conservation policies in the district inspired
the future scenario analysis. Working analysis methodology was based upon the work of Briner et
al. (2012) and Eastman (2015).
6.2.2.3 Socio economic analysis
For this purpose expert interview and meeting were held with government and community based
organisations to select a suitable study site. We used semi-structured interview, group discussion
and detailed questionnaire surveys at household level to understand the socio-economic structure
and concerns of climate change for different villages in the selected site. The survey was
conducted during the month of April – May, 2014, by the Darjeeling based civil body named
Anugyalaya Darjeeling Diocese Social Service Society. The survey covered six villages in
Kalimpong Block I and II of Darjeeling districts (Table 6-2). A total of 969 people were covered
living in 187 households in 6 target villages. Of the 969 people, 53% are males and 47% are
females. 29.21% of the population constituted of children below the age of 18 years of which 146
are males and 135 females. Using the data we conducted descriptive analysis.

100
Table 6-2: Socio-demographic profile of the villages in the study area
Variables / Village Gitkolbong Passabong Pakang Mahajan Dara
Paila Line
Munshi Dhura
Population Total Household
30 40 30 30 36 21
Total population
147 180 171 185 162 116
% Female 51.7 45.56 53.80 47.03 41.98 36.42 % Male 48.3 54.44 46.20 52.97 58.02 35.19
Age (%) < 16 25.1 32.22 26.32 33.51 30.25 18.52 > 16 74.9 67.78 73.68 66.49 69.75 53.09
Social group (%)
General 10 0.00 3.33 0.00 22.22 4.76 SC 0 0.00 0.00 0.00 0.00 9.52 ST 30 37.00 26.67 40.00 36.11 61.90 BC/OBC 20 3.00 70.00 60.00 41.67 23.81
Employment (%)
Primary Sector
73.3 62.00 93.33 93.33 97.22 76.19
Secondary sector
20.7 29.00 3.33 6.67 2.78 4.76
Tertiary Sector
6 9.00 3.33 0.00 0.00 19.05
Family Income (%)
< 40 K 46.6 23.00 26.67 10.00 97.22 28.57 40 K - 60 K 26.6 10.00 50.00 80.00 0.00 66.67 60 K - 80 K 6.6 6.00 16.67 10.00 0.00 4.76 > 80 K 20 1.00 6.67 0.00 0.00 0.00
Food Security (%)
<3 Months 63.3 21.00 73.33 66.67 97.22 47.62 3 Months 23.3 13.00 26.67 33.33 2.78 47.62 6 Months 13.3 6.00 0.00 0.00 0.00 4.76 9 Months 0 0.00 0.00 0.00 0.00 0.00 >12 Months 0 0.00 0.00 0.00 0.00 0.00
Source: Primary survey conducted with the help of local organisation (Anugyalaya Darjeeling Diocese Social
Service Society)
6.3 Results
6.3.1 Land use change analysis
The results of land use change analysis showed that major changes were occurring in the form of
conversion of forest and agricultural land to waste land as well as increase in built-up area from
2001 to 2014. Increase of waste land was 14.80%, built up area by 7.35%. Increase of agriculture
land use was 8.61 % of which are transitions area from forest and other land use classes (Figure
6-4). Changes of land use class forest and agriculture to waste land in likely to be the result of

101
extreme climate impacts like landslide and loss of soil fertility because of extreme rain fall.
Increase in agriculture land use seems to be the result of new forest villages and new agricultural
activities. The rate of change in land use between 2001 and 2030 was used to forecast the land
use pattern for 2030.
The results of land use scenarios from Land use modelling for 2030 are presented in figure
(6-10). Two scenarios were developed for 2030 based on business as usual and conservation
policies including ecosystem services approach. The 2030 scenario shows that, there was an
increase in land fragmentation in business as usual scenario with significant loss of forest and
agricultural land and increase in waste land. Whereas, in the conservation scenario for 2030,
there is recovery and increase of forest land use from waste land. Also conservation scenario for
2030 shows less land fragmentation and improved agriculture pattern.
Figure 6-2: Land Use for 2001, 2014, 2030
6.3.2 Ecosystem services and scenario analysis
The results of ecosystem services provision for 2030 for two different scenarios are presented for

102
following ecosystem services food production, timber harvest, carbon sequestration, soil
retention and water yield (Table 6-1).
Food production
The overall food production for the study area under business as usual land use is likely to
increase compared to land use under conservation scenario ( 19052 Kg for LU-2030 B and 17642
Kg for LU-2030 C) because of additional land being cultivated. However the food production
measured as kg/ hectare will increase for land use under conservation (1850 Kg /Ha for LU-2030
B and 2900 Kg /Ha for LU-2030 C) due to changes in agriculture practices, increase in soil
fertility and multiple crop practices (Figure 6-3).
Timber harvest
Observation from the land use analysis shows severe impacts of climate change on forest area in
the form of landslide and conversion of forest areas to waste lands (Figure 6-4). The selected site
also faces issues of water scarcity and soil retention capacity that has negative impacts on timber
production. Timber production modelling shows decline in timber production under LU-2030 B
scenario. There are two reasons for this decline; first is conversion of forest area to waste lands
and second is an anthropogenic activity including agriculture activities. There is likely to be
increase in timber production under LU-2030 conversion scenario because of decline in loss of
forest area, conversion of waste land to forest area, plantation of more climate adaptive species of
tree and stewardship by local communities towards conservation of biodiversity and forest area.
Carbon sequestration
Figure 6-5 reveals that results of carbon sequestration will differ significantly across both land
use scenarios. Increase in agricultural production and decrease forest land cover for LU-2030 B
scenario will result in lower carbon sequestration. There will be increase of built-up area that will
result in energy use and increase in greenhouse gas emission. Whereas LU-2030 C scenario is
likely to result in higher carbon sequestration because of substantial increase in forest area,
availability of good quality timber per square area of forest, conversion of forest and agriculture
land from waste land area.
103
Soil retention
Soil retention analysis shows decline in both the land use scenarios for 2030 (Figure 6-6). While,
land use-2030 B show greater decline then Land Use-2030 C. Some of reasons for decline in soil
retention will be changes in rain pattern, increase in high intensity rainy days, changes in
topography, soil structure and agricultural practices in the study area.
Water Yield
Results of water yield analysis for the study area showed that majority of area will have decline in
water yield for both the future scenarios compared to the current land use in 2014 (Figure 6-7). It
was observed from the meteorological date for the study region that there will be a decline in
annual rain for future with increased number of high intensity rainy days. Both of the scenarios
will not be in favour of hydro power projects, but at the same time increase in number of
landslide.
6.3.3 Socio-economic modelling
The socio-economic pattern and climate concerns of 6 villages in the study area showed that
about 56% of total households belonged to local indigenous tribes and 37% from backward
classes. Livelihood of 85% people depended on primary sectors like agriculture, tea production
and forests and only 15 % of the total population were working in secondary or tertiary sector.
The wages in this region are very less with about 50% household earning less the 650 USD per
annum and about 40% households earning income ranging from 650 USD - 950 USD in a year.
Household income has direct repercussions on food security for example about 70% of total
household has food security for less than three months (Figure 6-8).
Households were asked to explain the major climate risks faced by them in the past years and its
impacts. Most people confirmed that climate risks like increase in summer and winter
temperatures, changes in rainfall pattern, erratic rain and shift in the seasons. They also identified
second order risks like landslides, water scarcity and drought in pre and post monsoon seasons.
These climate risks seemed to have direct impacts on livelihood and social structure of the
selected villages like decrease in agriculture production, food security, pests in crops and health
issues from changing climate variables (Figure 6-9).

104
Figure 6-3: Results of ecosystem services for food production for current and future land use scenarios.
Figure 6-4: Results of ecosystem services for timber production for current and future land use scenarios.
Figure 6-5: Results of ecosystem services for Carbon sequestration for current and future land use scenarios.
Figure 6-6: Results of ecosystem services for Soil retention for current and future land use scenarios.

105
Figure 6-7: Results of ecosystem services for water yield for current and future land use scenarios.
Figure 6-8: Descriptive comparison among villages a) Social group, b) Yearly household income and c) Food
security.
Figure 6-9: Climate change impacts according to informant from various villages, a) Direct impacts and b) Indirect
impacts.

106
Informants were also asked to explain their social and economic asset like type of land and
quantity of land owned by households, major cultivation and non-farm based activities.
Descriptive analysis by villages is tabulated below (Table 6-3).
Table 6-3: Livelihood source and agriculture asset
Variables / Village Gitkolbong
Passabong
Pakang
Mahajan Dara
Paila Line
Munshi Dhura
Land Holding of the Family (%)
Farm land (>5 Acre)
0.0 2.5 0.0 3.3 0.0 4.8
Farm Land (<5 Acre)
83.3 80.0 66.7 93.3 100.0 85.7
Leased land 13.3 7.5 10.0 3.3 0.0 9.5 Forest land 3.3 0.0 0.0 0.0 0.0 0.0 Kitchen Garden 0.0 7.5 10.0 0.0 0.0 0.0 Other 0.0 0.0 0.0 0.0 0.0 0.0 N.A 0.0 2.5 13.3 0.0 0.0 0.0
Type of Land Owned by the family (%)
Irrigated Land 36.7 50.0 0.0 0.0 38.7 61.9 Un Irrigated Land 63.3 50.0 0.0 0.0 58.1 28.6 Waste Land 0.0 0.0 0.0 0.0 3.2 4.8 Multiple Type Land 0.0 0.0 100.0 100.0 0.0 4.8 N.A 0.0 0.0 0.0 0.0 0.0 0.0
Major Cultivation in Agricultural Land (%)
Grains 0.0 0.0 0.0 0.0 48.4 0.0 Cereals 0.0 0.0 0.0 0.0 0.0 42.9 Vegetables 40.0 50.0 0.0 3.3 22.6 19.0 Fruits 0.0 0.0 0.0 0.0 0.0 38.1 Flowers 3.3 2.5 0.0 0.0 0.0 0.0 Medicinal/ Aromatic Plants
0.0 0.0 0.0 0.0 0.0 0.0
Multiple Crop 6.7 35.0 103.3 96.7 29.0 0.0 Other Cash crop 50.0 5.0 0.0 0.0 0.0 0.0 N.A 0.0 7.5 0.0 0.0 0.0 0.0
Irrigation (%) Perennial 36.7 50.0 96.7 86.7 0.0 100.0 Seasonal 63.3 50.0 6.7 13.3 100.0 0.0
Non Farm based activities practiced (%)
Poultry 20.0 10.0 0.0 20.0 3.2 0.0 Beekeeping 0.0 0.0 0.0 0.0 0.0 0.0 Piggery 16.7 10.0 0.0 0.0 0.0 4.8 Fishery 0.0 0.0 0.0 0.0 0.0 0.0 Diary 63.3 75.0 0.0 0.0 16.1 4.8 Other 0.0 0.0 0.0 0.0 0.0 4.8 Multiple 0.0 0.0 103.3 76.7 67.7 81.0 N.A 0.0 5.0 0.0 3.3 12.9 4.8
Type of seeds do you use in your agriculture land
Traditional Seeds 16.7 22.5 33.3 36.7 100.0 23.8 Hybrid Seeds 83.3 77.5 70.0 63.3 0.0 76.2 High Yield seeds 0.0 0.0 0.0 0.0 0.0 0.0

107
(%) GM Seeds 0.0 0.0 0.0 0.0 0.0 0.0 Agriculture production (%)
Decrease 93.3 87.5 76.7 90.0 96.8 71.4 Increase 0.0 5.0 3.3 0.0 0.0 9.5 Normal 6.7 7.5 20.0 10.0 3.2 19.0
Source: Primary survey conducted with the help of local organisation (Anugyalaya DSSS, Darjeeling)
Figure 6-10: Land Use change comparison
Table 6-4: Summary of beneficiaries, indicators and policies for scenarios for different ecosystem services
Ecosystem service
Beneficiaries Spatial indicators used to evaluate
Context specific policies in scenario for conservation (2030 C)
Food production
Direct: local subsistence farming for villagers Indirect: Tea, spices and other commercial crops for national and international market
• Land use cover • Agricultural
production per hectare
• Multiple cropping practices • Promoting indigenous
crops • Soil conservation, anti
erosion and land slide reduction measures by plantations
• Integrated management for pest and diseases
Timber harvest
Direct: Villagers and communities for timber, fodder, fuelwood and forest products like honey. Indirect: source of income for local government, international community for carbon sequestration
• Managed forest area • Proportion of
harvest area • Biomass harvested
per hectare • Harvest frequency • Maintenance and
operation cost
• Monitoring invasive species and planting native species.
• Reduce open forest, improve quality of medium forest and protect dense forests.
• Prevent forest

108
• Market value of harvested wood
fragmentation • Empower communities to
protect biodiversity and forest
• Reclaim waste land into forests
Carbon sequestration
Direct: Local, state and international community’s by reducing GHG Indirect: Impacting microclimate of the region
• Current and future land use
• Current and future storage carbon
• Biomass conversion expansion factors for different land use classes
• Carbon density and harvest frequency
• Conserve indigenous forest species
• Planned harvesting of forest and yearly cycle monitoring
• Changing dependence on forest fuel
• Changing patterns of energy use
Soil retention Direct: Villagers and agricultural communities that depend on the soil for production. Also reduce flooding and landslide hazards for people living downstream Indirect: Improve soil quality, food production, water purification, water availability.
• Watershed area • Land use classes • DEM • Rainfall erosivity • Soil erodibility • Sediment threshold • Soil type and depth
• Increase plantation and soil binding species
• Plan agriculture of root vegetables and their harvest
• Planning of proper drainage patterns
• Control mining activities that effect top soil
Water yield Direct: Villagers and communities for drinking water, irrigation and hydropower Indirect: local and state economics and infrastructure in the form of water and power
• Watershed area • Land cover • Annual
precipitation • Evapotranspiration • Plant available
water content data
• Local water storage practices and rain water harvesting
• Plantations to increase water retention by soil
• Water management and distribution planning
6.4 Discussion
The main aim of this study was to identify land use practices in the study area and alternative
policy practices that will ensure safeguarding key ecosystem services that are subject to climate
and land use changes. According to Cowling et al. (2008), ecosystem services based policies can
be an effective model for good governance and resilient socio economic system when
implemented in three stages: assessment, planning and management. This study covers the first
two stages, wherein we assess how specific ecosystem services are affected by different scenarios

109
of policies with regard to mountain communities. This type of studies will help in comparing the
feedback of current policy scenario with alternative scenarios to help make informed decision by
governing bodies.
The results of the study can be summarised in three points. First, the socio-ecological survey was
a necessity in this analysis to understand the beneficiaries of the ecosystem services of the region
and the perception of the people on how they were being affected by present land use practices
and climate change. It is worrying that without any knowledge about climate change as a
scientific factor, people still perceive noticeable changes in the climatic conditions of the region
and significant decrease in crop patterns due to climatic variables. The socio ecological study
also shows how changes in ecosystem services of a region not only affect the direct beneficiaries
like the villagers and communities of the region but also indirect beneficiaries namely stewards
and intermediaries. Stewards are people whose actions result in modification of the ecosystem
services such as government and local planning bodies, and intermediaries are those who mange
interaction among beneficiaries, stewards and ecosystem services (Willemen et al., 2013). In
these remote areas of the Himalayas, the role of government bodies and stewards is often
minimal. It is then that intermediaries such as civil societies and self-help groups that can initiate
ecosystem based conservation practices among the locals to improve socio-economic condition
and adaptive capacity.
Secondly, rapid land use change is evident even at this small scale of mountain ecosystem and
shows dependence on the rate of climate change and magnitude of socio economic development.
The first factor that is affecting the changes in land use is increase in population of the region. As
a result, there is extension of agricultural land into forests and restricted landscapes, to cope with
local and global demand. The second factor for land use change is increase in wastelands owing
to frequently occurring lands slides. Landslides are increasing in the region because of
anthropogenic causes such as deforestation, illegal mining, unplanned transportation and big
dam constructions (Mukherjee, 2013).
Thirdly, in order to conserve the region as well as cater to the growing population, it is necessary
that resources are used in a planned and sustainable manner. The results from the scenario
analysis of ecosystem services of the region shows that given the nature of the existing regional

110
plans that concentrates on economic and social issues, the ecological conservation of the region
will be completely neglected. Individuals or groups that are interested in ecological conservation
are often not embedded into the planning and implementation mechanism (Ingold et al., 2010)
and therefore are not capable of executing change. Therefore traditional and informal processes
are likely to be most beneficial in the preservation of ecosystem services with a minor support
from governing bodies in the form of broad ecosystem based planning mechanisms. An example
of protecting water yield as an ecosystem service with traditional methods is mentioned in
Mukherjee (2013), where he reports how people in the Himalayas have been for years
traditionally practicing rain water harvesting, constructing channels for water distribution,
regulating water distribution and drawing fresh water as community practices. Their source of
fresh water are the innumerable natural springs in the watersheds (called dhara, pandhera etc)
which are carried to homes by using natural pipes made by bamboo poles. Another example of
loss of ecosystem services due to changes in land use patterns is evident by the decrease in soil
retention and desertification due to over cultivation, excessive grazing, deforestation and flawed
irrigation practices. It is estimated that in the Darjeeling district of the Himalayas, soil erosion is
10 times more than the natural amount of soil formation (Mukherjee, 2008). Local agricultural
research organization such as Uttar Banga Krishi Viswavidyalaya has now influenced farmers to
start practicing conservation tillage by leaving a portion of the crop residue to increase soil
retention and water capacity.
Therefore, climate change and land use change will have significant impacts on the local
economy and social structure of the mountain communities. Increasing erratic rain fall events
with high slope terrain will increase the frequency of landslide, decline soil retention and impact
on agricultural production. Engineering approaches like building concrete protection walls is
expensive and a logistical hassle for economical poor regions and over natural barriers.
Ecosystem based climate responses can thus play an important role to mitigate global and local
climate concern with least negative repercussions (Millennium Ecosystem Assessment, 2005;
Barbier et al., 2008; Everard et al., 2010; Gedan et al., 2010; Shepard et al., 2011; Pinsky et al.,
2013). Although ecosystem based adaptation responses to climate change is underexplored with
the spatial planning policies by decision makers, it can be taken up informally by the
communities with only a small guidance from the local government.

111
Chapter 7

112
7 Synthesis
The main aim of this study was to contribute towards understanding climate change risks and
perception in spatial planning policies at local level. By investigating spatial planning policies,
an assessment framework and decision support system was built that aimed to improve current
spatial planning practices and planning tools intended at building resilient living spaces. In this
chapter, I try to summarise the strengths and weaknesses of the key objectives, methods and
findings described in the earlier chapters. At the same time, I try to understand the theoretical and
policy implication of this study.
7.1 Objective 1
(Chapters 1 and 2): To develop and test an assessment framework to track integration of
climate change issues into spatial planning.
7.1.1 Main findings
The objective of this study was the first step towards identifying the key gaps and potential areas
of focus, to integrate climate change issues at urban/regional level in India. The literature review
on the kay gaps was done in chapter 1. Spatial plans across various cities in India were examined.
The skeleton of the review framework was developed based on Moser and Loers (2008) work on
''Managing climate risks''. The results of this study show that the role of spatial plans to integrate
climate change issues at the city level in India are still limited. The detailed study of the planning
practices in India brought to light the gaps in the system and identified that local governments
and development organizations require technical skills, financial capabilities and planning
instruments to analyse the impacts of changing climate variability and act upon them. Local
government failed to consider climate change as an issue while preparing spatial policies and to
take advantage of international and national climate change policies and knowledge base.
Spatial policy making practices in India have considerable differences in different regions and
spatial scales. Consequently, there is a need for a national and at the same time region specific
integrated frameworks to include climate change that can guide policy makers. Climate change
issues in the spatial planning process requires significant changes in the way spatial policies are
113
prepared at various scales in India. More powers to local governments to take independent
decisions and action concerning to climate change issues are required for development of the
region or local level. There is a National Climate Change Action Plan and a few state level plans,
which cover broad schemes and does not reach the level of detail required for urban and regional
implementation. It can be hoped that states will be able to better manage their funding for policy
actions, with the current government announcing in 2015, that 10% more central government
funds will be released to the state for region specific development. Effective climate change
policies must take into account climate change related beliefs, attitudes and behaviour of the
native people, which play a vital role in the success or failure of these strategies through their
decisions as citizens, consumers and as a community. Awareness of climate change issues and its
impacts on socioeconomic and biophysical aspects should be spread across all the stakeholders.
Media, Non-governmental organizations (NGOs) and environmental agencies can play an
important role to make people aware about various climate change issues and its impacts.
7.1.2 Strength and weakness
7.1.2.1 Strength in the method
This study is unique in being one of the few studies that attempts to scientifically and
systematically assess the integration of climate change policies at local level especially in urban
areas in India. Several authors have addressed the question of how climate change can be
integrated into the various policy agendas by proposing different frameworks (Brooks et al.,
2011; Lim et al., 2005; UNISDR, 2012; Urwin and Jordan, 2008). However most of these
assessment frameworks are outcome or sector oriented (Tang et al., 2010), and are used to
understand the key gaps and issues related to the climate concerns in policies (Preston et al.,
2011; Urwin and Jordan, 2008; Wilson, 2006). While the review framework that was developed
in this study focuses on planning processes and potential outcome of spatial plans in future. The
review framework has potential to assess key components like awareness among policy makers
of the key drivers of climate change and its impacts at the local level (Baker et al., 2012;
Lindseth, 2004). In addition, the framework was able to review the key gaps in the extent to
which the spatial plan shows a capacity to analyse, quantify and synthesize the available
information on climate change in a useful form to support planning decisions (Baumert et al.,

114
2005; Brooks et al., 2011). Developed review framework is robust policy analysis tool and can be
applied to evaluate policies at local spatial scales in other geographical areas keeping in mind the
spatial and contextual subjectivity.
7.1.2.2 Weakness
The key weakness of this undertaking this objective was not including adequate perception of
policy makers and different stakeholders involved in spatial planning policies. Perception and
knowledge gained from policy maker could help to understand their limitation in terms of
awareness and key concerns for integration of climate change into spatial plans in terms of
economics, facilities and political agendas.
7.1.3 Future research
Further research on the topic in required and could focus on the following issues:
• How climate policies at higher spatial scales can be integrated into local policies,
streamlining response actions on ground and implementation structure.
• The current study was only limited to spatial plan documents and it will be interesting to see
how sectoral policies benefit spatial plans on climate change issues and its impact on the ground.
• One of the key limitations of this study was evaluating the effectiveness of spatial plans on
the ground. Future study will use one of the key sectors from the spatial plans (example land use,
ecosystem, resource management, physical development, etc.) to further identify the integration
of climate changes issues and action taken by local government to reduce the vulnerability.
7.2 Objective 2
Chapter 3, 4 and 5: To identify hot spots of climate change at urban/regional levels by
applying spatial vulnerability assessment tools.
7.2.1 Main findings
In fulfilling Objective 2 an attempt was made to sort the growing concern among scientists as
well as from policy makers over the large number of assessment framework for climate change
and its usability at local level. Each assessment method has its strength and weakness to guide

115
policy makers to deconstruct the complexity of climate change issues and to develop response
action to climate change. However majority of them are useful at coarse scale and lacks the
standardized working methods (Preston et al., 2011). At the same time these assessment
framework lacks the ability to demonstrate clarity and consistency in the selection of indicators,
aggregation of indicators, and comparison across different indicators (Eriksen and Kelly, 2007;
Rannow et al., 2010). In chapter 4 and 5 an attempt is made to understand the weakness of
available assessment methods and build working methodology and its application for local
spatial scale. An effort is made to understand the practical challenges in applying and replicating
available vulnerability assessment methods at local spatial scales.
According to Preston, et al.(2011) to operationalise vulnerability assessment, it is important to
understand the spatial context of the assessment. Majority of studies highlight climate concern
from biophysical perspective and from developed nations, especially on coastal regions where
impacts due to sea level rise and natural disasters are more apparent (Castán Broto and Bulkeley,
2013; Hunt and Watkiss, 2011). The framework used in this chapter attempts to understand the
climate change concern from non-coastal regions impacts on socio-economic and ecological
aspects of the local area (Daron et al., 2014; Engle, 2011; Forman, 2014).
7.2.2 Strengths and weaknesses
7.2.2.1 Strengths in method
The proposed vulnerability assessment framework for climate change was among the first
attempts to adopt and integrate different aspects of spatial planning for local level. For example
selections of indicators accounted for the key issues in spatial plans for the selected case study.
The results of the vulnerability assessment show potential to support decision within the spatial
planning preview to integrate climate concern into current and future policies. The overall results
of the vulnerability assessment helps to understand the pattern and magnitude of climate change
impacts as well as priorities of action spatially and by sector. The comparative analysis among
indicators helps to make trade-off decisions and small interventions rather than a single dominant
intervention. Presents vulnerability assessment framework can be operational at any local level
that can help to prioritize response action either independently or in the spatial planning process.

116
This study also shows how simple open source technological tools can help policy maker at local
level to develop decision support system to generate knowledge bases for developing response
action.
7.2.2.2 Weakness
The key weakness in this chapter was not including the projection of exposure component of
vulnerability assessment for the selected case study and limitation of critical data and detailed
information required by the vulnerability assessment framework. A large number of urban
regions in developing countries do not maintain historical records on a different aspect of the
urban system and climate variables (Laukkonen et al., 2009). For the selected case study
available databases were unstructured and sometimes irrelevant. It is also difficult to assess the
quality and source of databases because of the presence of multiple organizations in a region. The
other limitations of the assessment framework lies in the subjectivity linked to the selection of
indicators, standardization and giving weights. This concern could be resolve by understanding
the spatial planning and general policy framework and integrating knowledge of key stakeholder
during the spatial plan preparation.
7.3 Objective 3
Chapter 6: To apply eco-system-based adaption responses to climate change in an urban
region and identifying barriers.
7.3.1 Main findings
Under objective three, we tried to understand the ecosystem based adaptation response at local
level through a case study in the Eastern Himalayan district of Darjeeling. Social and economic
structure of this community is dependent on natural resources and ecosystem services provided
by the natural resources. In the past few years, the region has been experiencing shift in climate
variables that have multiple impacts that directly and indirectly affect the socio-ecological fabric
of the mountain region. Lack of efficient policies intervention by local government made local
mountain communities in this region to experiment and adapt to indigenous ecosystem
approaches to reduce climate change impacts. In this chapter, we try to understand the effect of

117
ecosystem based adaption policies and undertake a scenario analysis to evaluate its effectiveness.
Perceptions of local communities, and existing policies were analysed to develop future land use
scenarios.
7.3.2 Strength and weakness
7.3.2.1 Strength
Scenario analysis of ecosystem services based policies is an effective way to spatially visualise
the effectiveness of different policies. It shows that there is need for integrating ecosystem
services with forestry and biodiversity conservation policies or creating effective market
incentives for sustainable land use practices.
7.3.2.2 Weakness
Lack of sectoral policies and data for current years has an effect on future scenarios development.
In addition only a bundle of ecosystem service was analysed which may not give a holistic
picture for an integrated planning process.
7.3.3 Future research
This study was developed on two future scenarios; further studies should focus on developing
more scenarios and quantifying the effectiveness of each scenario for comparison and informed
decision-making. Further study could also focus on benefits and drawback of ecosystem based
and engineering based solution to climate change at different spatial scale and landscape.
7.4 Policy implication
In this section, we discuss the policies that should be considered to strengthen planning and
decision making at local level to integrate climate change based on our analysis. Policy makers at
the local spatial scale need to address both short and long-term vision of development and its
interrelation to be able to integrate climate change responses into policies. Climate change
adaptation for short terms may fulfil objective for current climate scenarios but may impose
externalities in future (Adger et al., 2005b). So policy makers and local development
organization need to carefully narrate climate resilient scenarios of socio-economic, ecological,

118
physical development and land-use change along with resource demands (Tompkins and Adger,
2005).
The study indicates that policy preparation at local level in various cities in India still follows a
top-down process. Various studies on climate change literature suggests that governments at top
level have greater potential and power to develop plans to deal with climate changes issues
(Hallegatte et al., 2011; Neil Adger et al., 2005; Stern, 2006a). In India new initiative have been
started at national and state levels but once these plans and policies trickle down to regional or
city levels, the climate change issues are absent. Despite having support from national and state
governments, the impacts of mitigation and adaption response cannot be seen at local plans and
its get devaluated with other development issues. Results of awareness and analysis components
also show that there were many limitations and deficiencies in plans, resulting from spatial scale
issues, inappropriate skills to see the environmental issues, financial resources, multiplicity of the
organizations, political interferences, ignorance and degree of trade-offs with other issues.
Developing future scenarios for local spatial scales requires information from every stakeholder
to include the perspectives each of them (Few et al., 2006). Sometimes this process is time
consuming and beyond formal governmental structures but is crucial for ensuring knowledge,
awareness, innovation and support and easy implementation of plans on ground (Tompkins and
Adger, 2005).
7.5 Required reforms in organizational and planning practices
Learning from experience of national and international institutions, it appears that there is need to
change the planning practices. There is a need for rapid institutional and social learning which
should contribute eventually to effective adaptation that reduces vulnerability (Adger et al., 2007;
Baker et al., 2012b; Hjerpe and Glaas, 2012). Considering climate change issues in the planning
process requires significant changes in the way spatial policies are prepared at various scales. It
involves cascading decision across different scale and stakeholder. Also to understand the
climate change issues requires close collaboration of climate scientists, sectoral practitioners,
spatial planners, administrator, politician and other stakeholders (Campbell, 2006). It also
requires changes in organizational structure of authority or organization; which is also one of the

119
limitations that emerge from the study (Adger et al., 2007).
Local development authorities and executive authorities in various cities in India are engaged in a
broad range of activities such as implementing building standards, collection of garbage,
community development, economic growth, and natural resource management (Pini et al., 2007).
Meanwhile state governments devolve an increasing number of responsibilities to local
governments. This poses challenges for the local governments because of lack of enough revenue
to run its functions efficiently and start new ventures (Ivey et al., 2004; Pini et al., 2007). They
are reluctant to take on additional responsibilities (River, 2006). This results in national, state and
local government to hire private organization under public private partnership to develop city
development plan for the major cities in India. Despite this, private organizations are unable to
consider climate change issue in to spatial plans. Surprisingly the barriers identified in this study,
such as lack of technical skills, knowledge base, and resources are almost same as it is identified
in relation to other issues like urban poor, slums, physical development and natural resource
management by local governments (Keen et al., 1994).
In terms of policy reforms, green infrastructure is particularly important for small- and
medium-sized urban centres or regions. Decision to consider mitigation and adaptation solutions
in the form of green infrastructure are cost effective and climate-sensitive than engineering based
physical infrastructure.
In order to achieve more effective policies, local governments need to expand the scope,
accountability and effectiveness of participating NGOs, community and grassroots self help
groups, academicians, the private sector and leaders. This will help to develop innovative
options, as well as both scientific and locally relevant knowledge.
7.6 Conclusion
This thesis integrates a variety of concepts in climate change policies at urban and regional
levels with an aim to plan for a climate resilient future. With sustainable development as the
ultimate aim, it assesses current policies that are effective or mute in considering mitigation
as a way to reduce climate change impacts rather than increase them. It considers the
effectiveness of adaptation strategies to cope with situations where impacts of climate change
120
cannot be avoided. And it considers different response actions in the form of policies and
their capacity to ease the threats of climate change that threatens the stability of India. Results
of this study reveal that there is broad understanding and interplay among national, state
levels policies for climate change issues. However, these policies and response actions are
not sufficient to avoid impacts of climate change that are deteriorating conditions at an
alarming rate. There is a strong likelihood that majority of socio-economic hubs, natural
resource regions and concerned communities in India will fall behind to integrate climate
change response action towards resource shortage, direct and indirect climate impacts and
socio economic stability. One response that will emerge will be quick geo-engineering fixes
that will further exasperate the problem (Denton, 2014). In order to avoid such a situation,
research such as this is extremely important, that strengthens the knowledge base to
essentially act as a foundation over which climate change policies can be built for sustainable
development of the country.

121
Bibliography
Adger, N., Arnell, N.W., Tompkins, E.L., 2005a. Successful adaptation to climate change across scales. Global Environmental Change 15, 77-86.
Adger, W.N., Agrawala, S., Mirza, M.M.Q., Conde, C., O’Brien, K., Pulhin, J., Pulwarty, R., Smit, B., Takahashi, K., 2007. Assessment of adaptation practices, options, constraints and capacity. Climate change, 717-743.
Adger, W.N., Arnell, N.W., Tompkins, E.L., 2005b. Successful adaptation to climate change across scales. Global environmental change 15, 77-86.
Adger, W.N., Barnett, J., Brown, K., Marshall, N., O'Brien, K., 2013. Cultural dimensions of climate change impacts and adaptation. Nature Climate Change 3, 112-117.
Agrawal, A., 2010. Local institutions and adaptation to climate change. Social dimensions of climate change: Equity and vulnerability in a warming world, 173-198.
Aryal, S., Cockfield, G., Maraseni, T.N., 2014. Vulnerability of Himalayan transhumant communities to climate change. Climatic change 125, 193-208.
Ashley, R., Blanksby, J., Cashman, A., Jack, L., Wright, G., Packman, J., Fewtrell, L., Poole, T., Maksimovic, C., 2007. Adaptable urban drainage: addressing change in intensity, occurrence and uncertainty of stormwater (AUDACIOUS). Built Environment (1978-), 70-84.
Baca, M., Läderach, P., Haggar, J., Schroth, G., Ovalle, O., 2014. An integrated framework for assessing vulnerability to climate change and developing adaptation strategies for coffee growing families in Mesoamerica. PloS one 9, e88463.
Bajracharya, D., 1983. Fuel, food or forest? Dilemmas in a Nepali village. World Development 11, 1057-1074.
Bajracharya, S.R., Mool, P.K., Shrestha, B.R., 2007. Impact of climate change on Himalayan glaciers and glacial lakes: Case studies on GLOF and associated hazards in Nepal and Bhutan. International Centre for Integrated Mountain Development Kathmandu.
Baker, I., Peterson, A., Brown, G., McAlpine, C., 2012a. Local government response to the impacts of climate change: An evaluation of local climate adaptation plans. Landscape and urban planning 107, 127-136.
Baker, I., Peterson, A., Brown, G., McAlpine, C., 2012b. Local government response to the impacts of climate change: An evaluation of local climate adaptation plans. Landscape and Urban Planning.
Banister, D., 2011. Cities, mobility and climate change. Journal of Transport Geography 19, 1538-1546.
Banks, N., Roy, M., Hulme, D., 2011. Neglecting the urban poor in Bangladesh: research,

122
policy and action in the context of climate change. Environment and Urbanization 23, 487-502.
Bartlett, S., 2008. Climate Change and Urban Children: Impacts and implications for adaptation in low-and middle-income countries. Environment and Urbanization 20, 501-519.
Barua, A., Katyaini, S., Mili, B., Gooch, P., 2014. Climate change and poverty: building resilience of rural mountain communities in South Sikkim, Eastern Himalaya, India. Regional Environmental Change 14, 267-280.
Baumert, K.A., Herzog, T., Pershing, J., 2005. Navigating the numbers: Greenhouse gas data and international climate policy. World Resources Inst.
Beniston, M., 2003. Climatic change in mountain regions: a review of possible impacts, Climate Variability and Change in High Elevation Regions: Past, Present & Future. Springer, pp. 5-31.
Beniston, M., Stephenson, D.B., Christensen, O.B., Ferro, C.A., Frei, C., Goyette, S., Halsnaes, K., Holt, T., Jylhä, K., Koffi, B., 2007. Future extreme events in European climate: an exploration of regional climate model projections. Climatic Change 81, 71-95.
Berman, R., Quinn, C., Paavola, J., 2012. The role of institutions in the transformation of coping capacity to sustainable adaptive capacity. Environmental Development 2, 86-100.
Bhagat, R., 2011. Emerging pattern of urbanisation in India. Economic and political weekly, 10-12.
Biesbroek, G.R., Swart, R.J., Carter, T.R., Cowan, C., Henrichs, T., Mela, H., Morecroft, M.D., Rey, D., 2010. Europe adapts to climate change: comparing national adaptation strategies. Global Environmental Change 20, 440-450.
Biesbroek, G.R., Swart, R.J., Van der Knaap, W.G., 2009. The mitigation–adaptation dichotomy and the role of spatial planning. Habitat international 33, 230-237.
Black, R., Kniveton, D., Skeldon, R., Coppard, D., Murata, A., Schmidt-Verkerk, K., 2008. Demographics and climate change: Future trends and their policy implications for migration. Development Research Centre on Migration, Globalisation and Poverty. Brighton: University of Sussex.
Breuste, J., Haase, D., Elmqvist, T., 2013. Urban landscapes and ecosystem services. Ecosystem services in agricultural and urban landscapes, 83-104.
Briner, S., Elkin, C., Huber, R., Grêt-Regamey, A., 2012. Assessing the impacts of economic and climate changes on land-use in mountain regions: a spatial dynamic modeling approach. Agriculture, Ecosystems & Environment 149, 50-63.
Brooks, N., Grist, N., Brown, K., 2009. Development futures in the context of climate change: Challenging the present and learning from the past. Development Policy

123
Review 27, 741-765. Bruff, G.E., Wood, A.P., 2000. Local sustainable development: land-use planning's
contribution to modern local government. Journal of Environmental Planning and Management 43, 519-539.
Bulkeley, H., 2006. A changing climate for spatial planning. Planning Theory and Practice 7, 203-214.
Bulkeley, H., Betsill, M., 2005. Rethinking sustainable cities: multilevel governance and the'urban'politics of climate change. Environmental politics 14, 42-63.
Bulkeley, H., Schroeder, H., Janda, K., Zhao, J., Armstrong, A., Chu, S.Y., Ghosh, S., 2009. Cities and Climate Change: The role of institutions, governance and urban planning. Change 28, 30.
Byg, A., Salick, J., 2009. Local perspectives on a global phenomenon—Climate change in Eastern Tibetan villages. Global Environmental Change 19, 156-166.
Campbell, H., 2006. Is the issue of climate change too big for spatial planning? Castán Broto, V., Bulkeley, H., 2013. A survey of urban climate change experiments in 100
cities. Global Environmental Change 23, 92-102. Chaudhary, P., Bawa, K.S., 2011. Local perceptions of climate change validated by scientific
evidence in the Himalayas. Biology Letters, rsbl20110269. Chaudhary, P., Rai, S., Wangdi, S., Mao, A., Rehman, N., Chettri, S., Bawa, K.S., 2011.
Consistency of local perceptions of climate change in the Kangchenjunga Himalaya landscape. Current Science 101, 504-513.
Chhetri, B., Tamang, L., 2013. Population Growth and Associated Problems: A Case Study Of Darjeeling Town.
Churchman, C.W., 1967. Guest editorial: Wicked problems. JSTOR. Clark, W.A., Hosking, P.L., 1986. Statistical methods for geographers. Wiley New York. Colls, A., Ash, N., Ikkala, N., Conservancy, N., 2009. Ecosystem-based Adaptation: a natural
response to climate change. IUCN (International Union for Conservation of Nature). Condon, P.M., Cavens, D., Miller, N., 2009. Urban planning tools for climate change
mitigation. Lincoln Institute of Land Policy Cambridge, MA. Corfee-Morlot, J., Kamal-Chaoui, L., Donovan, M., Cochran, I., Robert, A., Teasdale, P.-J.,
2009. Cities, climate change and multilevel governance. OECD publishing Paris. Costa, L., Kropp, J., 2013. Linking components of vulnerability in theoretic frameworks and
case studies. Sustainability Science 8, 1-9. Cowling, R.M., Egoh, B., Knight, A.T., O'Farrell, P.J., Reyers, B., Rouget, M., Roux, D.J.,
Welz, A., Wilhelm-Rechman, A., 2008. An operational model for mainstreaming ecosystem services for implementation. Proceedings of the National Academy of Sciences 105, 9483-9488.
Cruz, R.V., H. Harasawa, M. Lal, S. Wu, Y. Anokhin, B. Punsalmaa, Y. Honda, M. Jafari, C.

124
Li and N. Huu Ninh, 2007. Asia. Climate Change 2007: Impacts, Adaptation and Vulnerability. Contribution of Working Group II to the Fourth Assessment Report of the Intergovernmental Panel on Climate Change. Cambridge University Press, Cambridge, UK, pp. 469-506.
Daron, J.D., Sutherland, K., Jack, C., Hewitson, B.C., 2014. The role of regional climate projections in managing complex socio-ecological systems. Regional Environmental Change, 1-12.
Datta, T.K., 2004. Advantages, Constraints and Key Success Factors in Establishing Origin and Tradition-Linked Quality Signs: The Case of Darjeeling Tea, India. Indian Institute of Management Calcutta.
de Noblet-Ducoudré, N., Boisier, J.-P., Pitman, A., Bonan, G., Brovkin, V., Cruz, F., Delire, C., Gayler, V., van den Hurk, B., Lawrence, P., 2012. Determining robust impacts of land-use-induced land cover changes on surface climate over North America and Eurasia: results from the first set of LUCID experiments. Journal of Climate 25, 3261-3281.
De Sherbinin, A., Schiller, A., Pulsipher, A., 2007. The vulnerability of global cities to climate hazards. Environment and Urbanization 19, 39-64.
Delpla, I., Jung, A.-V., Baures, E., Clement, M., Thomas, O., 2009. Impacts of climate change on surface water quality in relation to drinking water production. Environment International 35, 1225-1233.
Denton, F., T.J. Wilbanks, A.C. Abeysinghe, I. Burton, Q. Gao, M.C. Lemos, T. Masui, K.L. O’Brien, and K. Warner,, 2014. Climate-Resilient Pathways:Adaptation, Mitigation, and Sustainable Development In: Climate Change
2014: Impacts, Adaptation, and Vulnerability. Part A: Global and Sectoral Aspects. Contribution of Working Group II to the Fifth Assessment Report of the Intergovernmental Panel on Climate Change Cambridge, United Kingdom and New York, NY, USA, , pp. 1101-1131. Dodman, D., Satterthwaite, D., 2008. Institutional Capacity, Climate Change Adaptation and
the Urban Poor. IDS Bulletin 39, 67-74. Du, M., Kawashima, S., Yonemura, S., Zhang, X., Chen, S., 2004. Mutual influence between
human activities and climate change in the Tibetan Plateau during recent years. Global and Planetary Change 41, 241-249.
Eakin, H., Lerner, A.M., Murtinho, F., 2010. Adaptive capacity in evolving peri-urban spaces: Responses to flood risk in the Upper Lerma River Valley, Mexico. Global Environmental Change 20, 14-22.
Eastman, J.R., 2009. IDRISI Taiga guide to GIS and image processing. Clark Labs Clark University, Worcester, MA.
Eastman, J.R., 2015. TerrSet Manual. Clark Labs, Clark University

125
EEA, 2008. Impacts of Europe's changing climate–2008 indicator based assessment. EEA Brussele (EEA Report 4/2008).
Eggleston, H., Buendia, L., Miwa, K., Ngara, T., Tanabe, K., 2006. IPCC guidelines for national greenhouse gas inventories. Institute for Global Environmental Strategies, Hayama, Japan.
Eisenack, K., Stecker, R., Reckien, D., Hoffmann, E., 2012. Adaptation to climate change in the transport sector: a review of actions and actors. Mitig Adapt Strateg Glob Change 17, 451-469.
Engle, N.L., 2011. Adaptive capacity and its assessment. Global Environmental Change 21, 647-656.
Engle, N.L., Lemos, M.C., 2010. Unpacking governance: Building adaptive capacity to climate change of river basins in Brazil. Global Environmental Change 20, 4-13.
Eriksen, S., Kelly, P.M., 2007. Developing credible vulnerability indicators for climate adaptation policy assessment. Mitig Adapt Strateg Glob Change 12, 495-524.
Estrella, M., Saalismaa, N., 2013. reduction (Eco-DRR): An overview. The Role of Ecosystems in Disaster Risk Reduction, 26.
Few, R., Brown, K., Tompkins, E.L., 2006. Public participation and climate change adaptation. Tyndall Centre for Climate Change Research Working Paper 95.
Field, C., Van Aalst, M., 2014. Climate change 2014: impacts, adaptation, and vulnerability. IPCC.
Field, C.B., 2012. Managing the risks of extreme events and disasters to advance climate change adaptation: Special report of the intergovernmental panel on climate change. Cambridge University Press.
Field, C.B., Barros, V.R., Mach, K., Mastrandrea, M., 2014. Climate change 2014: impacts, adaptation, and vulnerability. Contribution of Working Group II to the Fifth Assessment Report of the Intergovernmental Panel on Climate Change.
Forester, J., 1999. The deliberative practitioner: Encouraging participatory planning processes. Mit Press.
Forman, R.T., 2014. Urban ecology: science of cities. Cambridge University Press. Frigerio, S., van Westen, C.J., 2010. RiskCity and WebRiskCity: Data Collection, Display,
and Dissemination in a Multi-Risk Training Package. Cartography and geographic information science 37, 119-135.
Frumkin, H., Hess, J., Luber, G., Malilay, J., McGeehin, M., 2008. Climate change: the public health response. American Journal of Public Health 98, 435.
Füssel, H.-M., 2007. Vulnerability: A generally applicable conceptual framework for climate change research. Global Environmental Change 17, 155-167.
Füssel, H.-M., Klein, R.J., 2006. Climate change vulnerability assessments: an evolution of conceptual thinking. Climatic change 75, 301-329.

126
Gagnon-Lebrun, F., Agrawala, S., 2006. Progress on Adaptation to Climate Change in Developed Countries. Paris: OECD.
Geneletti, D., 2010. Combining stakeholder analysis and spatial multicriteria evaluation to select and rank inert landfill sites. Waste Management 30, 328-337.
Geneletti, D., 2013. Assessing the impact of alternative land-use zoning policies on future ecosystem services. Environmental Impact Assessment Review 40, 25-35.
Ghosh, S., van Westen, C.J., Carranza, E.J.M., Jetten, V.G., 2012. Integrating spatial, temporal, and magnitude probabilities for medium-scale landslide risk analysis in Darjeeling Himalayas, India. Landslides 9, 371-384.
Greene, R., Devillers, R., Luther, J.E., Eddy, B.G., 2011. GIS-Based Multiple-Criteria Decision Analysis. Geography Compass 5, 412-432.
Grêt-Regamey, A., Brunner, S.H., Kienast, F., 2012. Mountain ecosystem services: who cares? Mountain Research and Development 32, S23-S34.
Gupta, A.K., Nair, S.S., 2011. Urban floods in Bangalore and Chennai: risk management challenges and lessons for sustainable urban ecology. Current Science(Bangalore) 100, 1638-1645.
Haas, P., 2004. When does power listen to truth? A constructivist approach to the policy process. Journal of European public policy 11, 569-592.
Habitat, U., 2011a. Cities and Climate Change: Global Report on Human Settlements 2011. London: Earthscan.
Habitat, U., 2011b. Global report on human settlements 2011: Cities and Climate Change. United Nations Human Settlements Program, Earthscan.
Hallegatte, S., Henriet, F., Corfee-Morlot, J., 2011. The economics of climate change impacts and policy benefits at city scale: a conceptual framework. Climatic Change 104, 51-87.
Han, P., Foltz, J., 2013. The Impacts of Climate Shocks on Child Mortality in Mali, 2013 Annual Meeting, August 4-6, 2013, Washington, DC. Agricultural and Applied Economics Association.
Hanson, S., Nicholls, R., Ranger, N., Hallegatte, S., Corfee-Morlot, J., Herweijer, C., Chateau, J., 2011. A global ranking of port cities with high exposure to climate extremes. Climatic Change 104, 89-111.
Herrera-Pantoja, M., Hiscock, K., 2008. The effects of climate change on potential groundwater recharge in Great Britain. Hydrological Processes 22, 73-86.
Hinkel, J., 2011. “Indicators of vulnerability and adaptive capacity”: Towards a clarification of the science–policy interface. Global environmental change 21, 198-208.
Hjerpe, M., Glaas, E., 2012. Evolving local climate adaptation strategies: incorporating influences of socio–economic stress. Mitigation and Adaptation Strategies for Global Change, 1-16.

127
Hofmann, M.E., Hinkel, J., Wrobel, M., 2011. Classifying knowledge on climate change impacts, adaptation, and vulnerability in Europe for informing adaptation research and decision-making: A conceptual meta-analysis. Global environmental change 21, 1106-1116.
Holsten, A., Kropp, J., Walther, C., Lissner, T., Roithmeier, O., M.Klaus, 2011. ESPON Climate. Climate Change and Territorial Effects on Regions and Local Economies. Applied Research Project 2013/1/4. Final Report. Annex 3. ESPON-PIK, p. 94.
Holsten, A., Kropp, J.P., 2012. An integrated and transferable climate change vulnerability assessment for regional application. Natural hazards 64, 1977-1999.
Houghton, R., House, J., Pongratz, J., Van Der Werf, G., DeFries, R., Hansen, M., Quéré, C.L., Ramankutty, N., 2012. Carbon emissions from land use and land-cover change. Biogeosciences 9, 5125-5142.
Howard, J., Monbiot, G., 2009. A Critical Perspective on the Adaptation Turn in Urban Climate Planning. Planning for Climate Change: Strategies for Mitigation and Adaptation for Spatial Planners, 19.
Huang, C., Barnett, A.G., Wang, X., Vaneckova, P., FitzGerald, G., Tong, S., 2011. Projecting future heat-related mortality under climate change scenarios: a systematic review. Environmental health perspectives.
Huber, R., Briner, S., Bugmann, H., Elkin, C., Hirschi, C., Seidl, R., Snell, R., Rigling, A., 2014. Inter-and transdisciplinary perspective on the integration of ecological processes into ecosystem services analysis in a mountain region. Ecological Processes 3, 9.
Hübler, M., Klepper, G., Peterson, S., 2008. Costs of climate change: the effects of rising temperatures on health and productivity in Germany. Ecological Economics 68, 381-393.
Huggel, C., Clague, J.J., Korup, O., 2012. Is climate change responsible for changing landslide activity in high mountains? Earth Surface Processes and Landforms 37, 77-91.
Hunt, A., Watkiss, P., 2007. Literature review on climate change impacts on urban city centres: Initial findings. Organisation for Economic Co-operation and Development (OECD), Paris.
Hunt, A., Watkiss, P., 2011. Climate change impacts and adaptation in cities: a review of the literature. Climatic Change 104, 13-49.
Hurlimann, A.C., March, A.P., 2012. The role of spatial planning in adapting to climate change. Wiley Interdisciplinary Reviews: Climate Change 3, 477-488.
IEA, 2013. CO2 Emissions from Fuel Combustion Highlights 2013 (www.iea.org). IMD, 2015. http://www.imd.gov.in/ Indian Meteorological Department. Ingold, K., Balsiger, J., Hirschi, C., 2010. Climate change in mountain regions: how local

128
communities adapt to extreme events. Local Environment 15, 651-661. IPCC, 2001. Mitigation. Contribution of Working Group III to the Third Assessment Report
of the Intergovernmental Panel on Climate Change. Cambridge University Press, Cambridge, UK (2001) ISBN 0 521, 2.
IPCC, 2007. Fourth Assessment Report: Climate Change 2007: Synthesis Report. Intergovernmental Panel on Climate Change.
Ivey, J.L., Smithers, J., de Loë, R.C., Kreutzwiser, R.D., 2004. Community capacity for adaptation to climate-induced water shortages: linking institutional complexity and local actors. Environmental Management 33, 36-47.
Janssen, P., Walther, C., Lüdeke, M.K.B., 2012. Cluster Analysis to Understand Socio-Ecological Systems: A Guideline. Potsdam : Potsdam-Institut für Klimafolgenforschung, p. 90.
Jasanoff, S., 2004. Science and citizenship: a new synergy. Science and public policy 31, 90-94.
Jianchu, X., Shrestha, A., Eriksson, M., 2009. Climate change and its impacts on glaciers and water resource management in the Himalayan Region. Assessment of snow, glacier and water resources in Asia, 44-54.
Jim, C.Y., Chen, W.Y., 2008. Assessing the ecosystem service of air pollutant removal by urban trees in Guangzhou (China). Journal of Environmental Management 88, 665-676.
Kabisch, N., Haase, D., 2014. Green justice or just green? Provision of urban green spaces in Berlin, Germany. Landscape and Urban Planning 122, 129-139.
Keen, M., Mercer, D., Woodfull, J., 1994. Approaches to environmental management at the Australian local government level: initiatives and limitations. Environmental Politics 3, 43-67.
Kok, M., Lüdeke, M., Sterzel, T., Lucas, P., Walter, C., Janssen, P., Soysa, I.d., 2010. Quantitative analysis of patterns of vulnerability to global environmental change. Quantitative analysis of patterns of vulnerability to global environmental change.
Kotru, R., Choudhary, D., Fleiner, R., Khadka, M., Pradhan, N., Dhakal, M., 2014. Adapting to climate change for sustainable agribusiness in high mountain watersheds: A case study from Nepal. ICIMOD Kathmandu.
Kovats, S., Akhtar, R., 2008. Climate, climate change and human health in Asian cities. Environment and Urbanization 20, 165-175.
Kulakowski, D., Bebi, P., Rixen, C., 2011. The interacting effects of land use change, climate change and suppression of natural disturbances on landscape forest structure in the Swiss Alps. Oikos 120, 216-225.
Kullman, L., 2004. The changing face of the alpine world. Global Change Newsletter 57, 12-14.

129
Kumar, B.S., 2012. Landslide disaster perception of the AILA cyclone in the Darjeeling town, West Bengal, India. International Journal of Geomatics and Geosciences 3, 13-29.
Kumar, P., Geneletti, D., 2015. How are climate change concerns addressed by spatial plans? An evaluation framework, and an application to Indian cities. Land Use Policy 42, 210-226.
Kumar, P., Wiltshire, A., Mathison, C., Asharaf, S., Ahrens, B., Lucas-Picher, P., Christensen, J.H., Gobiet, A., Saeed, F., Hagemann, S., 2013. Downscaled climate change projections with uncertainty assessment over India using a high resolution multi-model approach. Science of the Total Environment 468, S18-S30.
Langridge, S.M., Hartge, E.H., Clark, R., Arkema, K., Verutes, G.M., Prahler, E.E., Stoner-Duncan, S., Revell, D.L., Caldwell, M.R., Guerry, A.D., 2014. Key lessons for incorporating natural infrastructure into regional climate adaptation planning. Ocean & Coastal Management 95, 189-197.
Laukkonen, J., Blanco, P.K., Lenhart, J., Keiner, M., Cavric, B., Kinuthia-Njenga, C., 2009. Combining climate change adaptation and mitigation measures at the local level. Habitat international 33, 287-292.
Lema, R., Hesbjerg, B., 2003. The virtual extension: a search for collective efficiency in the software cluster in Bangalore. Roskilde University.
Lim, B., Burton, I., Nations, D.P.U., 2005. Adaptation policy frameworks for climate change: developing strategies, policies and measures. Cambridge University Press Cambridge.
Lindseth, G., 2004. The Cities for Climate Protection Campaign (CCPC) and the framing of local climate policy. Local environment 9, 325-336.
Lung, T., Lavalle, C., Hiederer, R., Dosio, A., Bouwer, L.M., 2013. A multi-hazard regional level impact assessment for Europe combining indicators of climatic and non-climatic change. Global Environmental Change.
MA, 2005. Ecosystems and human well-being. Island Press Washington, DC. Macchi, M., Gurung, A.M., Hoermann, B., Choudhury, D., 2011. Climate variability and
change in the Himalayas: community perceptions and responses. International Centre for Integrated Mountain Development (ICIMOD).
Malczewski, J., 1999. GIS and multicriteria decision analysis. John Wiley & Sons. Malczewski, J., 2006. GIS-based multicriteria decision analysis: a survey of the literature.
International Journal of Geographical Information Science 20, 703-726. Maraseni, T.N., 2012. Climate change, poverty and livelihoods: adaptation practices by rural
mountain communities in Nepal. Environmental Science & Policy 21, 24-34. McCarthy, J.J., 2001. Climate change 2001: impacts, adaptation, and vulnerability:
contribution of Working Group II to the third assessment report of the

130
Intergovernmental Panel on Climate Change. Cambridge University Press. McMichael, A.J., Woodruff, R.E., Hales, S., Climate change and human health: present and
future risks. The Lancet 367, 859-869. MEA, M.E.A., 2005. Ecosystems and human well-being: synthesis. Island, Washington, DC. Measham, T., Preston, B., Smith, T., Brooke, C., Gorddard, R., Withycombe, G., Morrison,
C., 2011. Adapting to climate change through local municipal planning: barriers and challenges. Mitig Adapt Strateg Glob Change 16, 889-909.
Mell, I.C., Sturzaker, J., 2014. Sustainable urban development in tightly constrained areas: a case study of Darjeeling, India.
Metz, B., Davidson, O.R., 2007. Climate change 2007: Mitigation: Contribution of working group iii to the fourth assessment report of the intergovernmental panel on climate change. Intergovernmental Panel on Climate Change.
Metzger, M., Rounsevell, M., Acosta-Michlik, L., Leemans, R., Schröter, D., 2006. The vulnerability of ecosystem services to land use change. Agriculture, Ecosystems & Environment 114, 69-85.
Metzger, M.J., Schröter, D., 2006. Towards a spatially explicit and quantitative vulnerability assessment of environmental change in Europe. Regional Environmental Change 6, 201-216.
Meuleman, A., Cirkel, G., Zwolsman, G., 2007. When climate change is a fact! Adaptive strategies for drinking water production in a changing natural environment. Water Science & Technology 56, 137-144.
Meybeck, M., Green, P., Vörösmarty, C., 2001. A new typology for mountains and other relief classes: an application to global continental water resources and population distribution. Mountain Research and Development 21, 34-45.
Mitigation, C.C., 2011. IPCC special report on renewable energy sources and climate change mitigation.
Mondal, A., Khare, D., Kundu, S., Meena, P.K., Mishra, P., Shukla, R., 2014. Impact of Climate Change on Future Soil Erosion in Different Slope, Land Use, and Soil-Type Conditions in a Part of the Narmada River Basin, India. Journal of Hydrologic Engineering.
Mondal, S., Maiti, R., Application of 1-d slope stability model in landslide susceptibility mapping of shivkhola watershed darjiling himalaya.
Mor, S., 2013. Critical Ecosystem Modeling and Analysis of Darjeeling district, West bengal, India using Geospatial Techniques Forest and Ecology Department. Indian Institute of Remote Sensing, ISRO, Dehradun.
Morton, J.F., 2007. The impact of climate change on smallholder and subsistence agriculture. Proceedings of the national academy of sciences 104, 19680-19685.
Moser, S.C., Luers, A.L., 2008. Managing climate risks in California: the need to engage

131
resource managers for successful adaptation to change. Climatic change 87, 309-322.
Mukherjee, D., 2008. Effect of tillage practices and fertility levels on the performance of wheat (Triticum aestivum) under mid hill condition of West Bengal. Indian J. Agric. Sci. 78, 1038-1041.
Mukherjee, D., 2013. Critical analysis of challenges of Darjeeling Himalaya: water, natural resources, hazards, and the implications of climate change. International Journal of Agriculture Innovations and Research 2, 13-22.
Mukherjee, M., 2011. Urban growth and spatial transformation of Kolkata metropolis: a continuation of colonial legacy. ARPN Journal of Science and Technology 2.
Mukhopadhyay, P., Revi, A., 2009. Keeping India's Economic Engine Going: Climate Change and the Urbanisation Question. Economic and political weekly, 59-70.
Muller, M., 2007. Adapting to climate change water management for urban resilience. Environment and Urbanization 19, 99-113.
Mundoli, S., Manjunath, B., Nagendra, H., 2014. Effects of urbanisation on the use of lakes as commons in the peri-urban interface of Bengaluru, India. International Journal of Urban Sustainable Development, 1-20.
Myers, N., Mittermeier, R.A., Mittermeier, C.G., Da Fonseca, G.A., Kent, J., 2000. Biodiversity hotspots for conservation priorities. Nature 403, 853-858.
Nath, V., 2007. Urbanization, urban development, and metropolitan cities in India. Concept Publishing Company.
Neil Adger, W., Arnell, N.W., Tompkins, E.L., 2005. Successful adaptation to climate change across scales. Global Environmental Change 15, 77-86.
Nelson, E., Mendoza, G., Regetz, J., Polasky, S., Tallis, H., Cameron, D., Chan, K.M., Daily, G.C., Goldstein, J., Kareiva, P.M., 2009. Modeling multiple ecosystem services, biodiversity conservation, commodity production, and tradeoffs at landscape scales. Frontiers in Ecology and the Environment 7, 4-11.
O'Malley, L.S.S., 1989. Bengal District Gazetteers: Darjeeling. Logos Press. O’Hara, J., Georgakakos, K., 2008. Quantifying the Urban Water Supply Impacts of Climate
Change. Water Resour Manage 22, 1477-1497. Opdam, P., Luque, S., Jones, K.B., 2009. Changing landscapes to accommodate for climate
change impacts: a call for landscape ecology. Landscape Ecology 24, 715-721. Owens, S., 2004. Siting, sustainable development and social priorities. Journal of Risk
Research 7, 101-114. Owens, S., Cowell, R., 2011. Land and limits: interpreting sustainability in the planning
process. Routledge. Pahl-Wostl, C., 2007. Transitions towards adaptive management of water facing climate and
global change. Water Resour Manage 21, 49-62.

132
Parikh, J., Jindal, P., Sandal, G., 2013. Climate resilient urban development, vulnerability profiles of 20 Indian Cities. COE-IRADEe.
Parry, M.L., 2007a. Climate Change 2007: impacts, adaptation and vulnerability: contribution of Working Group II to the fourth assessment report of the Intergovernmental Panel on Climate Change. Cambridge University Press.
Parry, M.L., 2007b. Climate Change 2007: Impacts, Adaptation and Vulnerability: Summary for Policymakers, a Report of Working Group II of the Intergovernmental Panel on Climate Change and Technical Summary, a Report Accepted by Working Group II of the IPCC But Not Yet Approved in Detail: Part of the Working Group II Contribution to the Fourth Assessment Report of the Intergovernmental Panel on Climate Change. Cambridge University Press.
Parry, M.L., 2007c. Climate Change 2007: Impacts, Adaptation and Vulnerability: Working Group II Contribution to the Fourth Assessment Report of the IPCC Intergovernmental Panel on Climate Change. Cambridge University Press.
Patra, P., Bisen, J., Kumar, R., Choubey, M., Mazumdar, A.B., Singh, M., Bera, B., 2013. Effect of climate change on production of darjeeling tea: a case study in darjeeling tea research & development centre, tea board, kurseong.
Pielke, R.A., Pitman, A., Niyogi, D., Mahmood, R., McAlpine, C., Hossain, F., Goldewijk, K.K., Nair, U., Betts, R., Fall, S., 2011. Land use/land cover changes and climate: modeling analysis and observational evidence. Wiley Interdisciplinary Reviews: Climate Change 2, 828-850.
Pini, B., River, S.W., McKenzie, F.M.H., 2007. Factors inhibiting local government engagement in environmental sustainability: case studies from rural Australia. Australian Geographer 38, 161-175.
Plummer, R., 2010. Social–ecological resilience and environmental education: Synopsis, application, implications. Environmental Education Research 16, 493-509.
Polasky, S., Nelson, E., Pennington, D., Johnson, K.A., 2011. The impact of land-use change on ecosystem services, biodiversity and returns to landowners: A case study in the State of Minnesota. Environmental and Resource Economics 48, 219-242.
Preston, B.L., Stafford-Smith, M., Flagship, C.A., 2009. Framing vulnerability and adaptive capacity assessment: Discussion paper. CSIRO Climate Adaptation National Research Flagship.
Preston, B.L., Yuen, E.J., Westaway, R.M., 2011. Putting vulnerability to climate change on the map: a review of approaches, benefits, and risks. Sustainability Science 6, 177-202.
Pyke, C.R., Bierwagen, B.G., Furlow, J., Gamble, J., Johnson, T., Julius, S., West, J., 2007. A decision inventory approach for improving decision support for climate change impact assessment and adaptation. environmental science & policy 10, 610-621.

133
Ramachandra, T., Kumar, U., 2010. Greater Bangalore: Emerging urban heat island. GIS Development 14, 86-104.
Ramachandra, T.V., Mujumdar, P., 2009. Urban Floods: Case Study of Bangalore Journal of the National Institute of Disaster Management Vol. 3, 1 – 98.
Rannow, S., Loibl, W., Greiving, S., Gruehn, D., Meyer, B.C., 2010. Potential impacts of climate change in Germany—identifying regional priorities for adaptation activities in spatial planning. Landscape and urban planning 98, 160-171.
Rao, K., Pant, R., 2001. Land use dynamics and landscape change pattern in a typical micro watershed in the mid elevation zone of central Himalaya, India. Agriculture, ecosystems & environment 86, 113-124.
Reckien, D., 2014. Weather extremes and street life in India—Implications of Fuzzy Cognitive Mapping as a new tool for semi-quantitative impact assessment and ranking of adaptation measures. Global Environmental Change 26, 1-13.
Revi, A., 2008. Climate change risk: an adaptation and mitigation agenda for Indian cities. Environment and Urbanization 20, 207-229.
River, S.W., 2006. Australian local government attempts to deliver beneficial environmental outcomes. Local Environment 11, 719-732.
Roaf, S., Crichton, D., Nicol, F., 2009. Adapting buildings and cities for climate change: a 21st century survival guide. Routledge.
Romero Lankao, P., Qin, H., 2011. Conceptualizing urban vulnerability to global climate and environmental change. Current Opinion in Environmental Sustainability 3, 142-149.
Rosenzweig, C., Solecki, W., Hammer, S.A., Mehrotra, S., 2010. Cities lead the way in climate-change action. Nature 467, 909-911.
Rosenzweig, C., Solecki, W.D., Hammer, S.A., Mehrotra, S., 2011. Climate change and cities: first assessment report of the Urban Climate Change Research Network. Cambridge University Press.
Roy, A., 2009. Why India cannot plan its cities: informality, insurgence and the idiom of urbanization. Planning theory 8, 76-87.
Salick, J., Fang, Z., Byg, A., 2009. Eastern Himalayan alpine plant ecology, Tibetan ethnobotany, and climate change. Global Environmental Change 19, 147-155.
Salick, J., Ghimire, S.K., Fang, Z., Dema, S., Konchar, K.M., 2014. Himalayan Alpine Vegetation, Climate Change and Mitigation. Journal of Ethnobiology 34, 276-293.
Salick, J., Ross, N., 2009. Traditional peoples and climate change. Global Environmental Change 19, 137-139.
Sampei, Y., Aoyagi-Usui, M., 2009. Mass-media coverage, its influence on public awareness of climate-change issues, and implications for Japan’s national campaign to reduce greenhouse gas emissions. Global Environmental Change 19, 203-212.

134
Satterthwaite, D., 2007. Adapting to climate change in urban areas: the possibilities and constraints in low-and middle-income nations. Iied.
Satterthwaite, D., 2009. The implications of population growth and urbanization for climate change. Environment and Urbanization 21, 545-567.
Schild, A., 2008. ICIMOD's position on climate change and mountain systems: the case of the Hindu Kush-Himalayas. Mountain Research and Development 28, 328-331.
Schneider, A., Woodcock, C.E., 2008. Compact, dispersed, fragmented, extensive? A comparison of urban growth in twenty-five global cities using remotely sensed data, pattern metrics and census information. Urban Studies 45, 659-692.
Schröter, D., Cramer, W., Leemans, R., Prentice, I.C., Araújo, M.B., Arnell, N.W., Bondeau, A., Bugmann, H., Carter, T.R., Gracia, C.A., 2005. Ecosystem service supply and vulnerability to global change in Europe. Science 310, 1333-1337.
Semwal, R.L., Nautiyal, S., Sen, K., Rana, U., Maikhuri, R., Rao, K., Saxena, K., 2004. Patterns and ecological implications of agricultural land-use changes: a case study from central Himalaya, India. Agriculture, ecosystems & environment 102, 81-92.
Sen, A., 1983. Poverty and famines: an essay on entitlement and deprivation. Oxford University Press.
Sharma, P.K., Ramakrishnan, R., Hutin, Y.J., Gupte, M., 2009. Increasing incidence of malaria in Kurseong, Darjeeling District, West Bengal, India, 2000–2004. Transactions of the Royal Society of Tropical Medicine and Hygiene 103, 691-697.
Sharp, R., 2014. InVEST 3.0. 1 user guide. The Natural Capital Project. Stanford, CA. Available from http://ncp-dev. stanford. edu/~ dataportal/invest-releases/documentation/current_release/(accessed August 2014).
Silwal, U.K., 1995. Population growth and agricultural change in Nepal. Vikas Publication House.
Sinha, S., 2013. Modeling Potential Ecological Niche for Selected Endemic species in Darjeeling Hills, Department of Space. Indian Institute of Remote Sensing Dehradun.
Smit, B., Pilifosova, O., 2003. Adaptation to climate change in the context of sustainable development and equity. Sustainable Development 8, 9.
Snover, A., Binder, L., Kay, J., Sims, R., Lopez, J., Willmott, E., Wyman, M., Hen, M., Strickler, A., 2007. Preparing for climate change: a guidebook for local, regional, and state governments. Environmental health perspectives 117, 617-623.
statistics, B.o.L., 2010. Report on employment & unemployment survey (2009–10). , in: of, B., Labour Statistics, G.o.I. (Eds.).
Stern, N., 2006a. The economics of climate change. United Kingdom. Stern, N.H., 2006b. Stern Review: The economics of climate change. HM treasury London. Strohbach, M.W., Haase, D., 2012. Above-ground carbon storage by urban trees in Leipzig,

135
Germany: Analysis of patterns in a European city. Landscape and Urban Planning 104, 95-104.
Suarez, P., Anderson, W., Mahal, V., Lakshmanan, T., 2005. Impacts of flooding and climate change on urban transportation: a systemwide performance assessment of the Boston Metro Area. Transportation Research Part D: transport and environment 10, 231-244.
Sudhira, H., Nagendra, H., 2013. Local Assessment of Bangalore: Graying and Greening in Bangalore–Impacts of Urbanization on Ecosystems, Ecosystem Services and Biodiversity, Urbanization, Biodiversity and Ecosystem Services: Challenges and Opportunities. Springer, pp. 75-91.
Sudhira, H., Ramachandra, T., Subrahmanya, M., 2007. Bangalore. Cities 24, 379-390. Sun, R., Chen, L., 2012. How can urban water bodies be designed for climate adaptation?
Landscape and Urban Planning 105, 27-33. Szendrő, G., Csete, M., Török, Á., 2014. The Sectoral Adaptive Capacity Index of Hungarian
Road Transport. Social and Management Sciences 22. Taubenböck, H., Wegmann, M., Roth, A., Mehl, H., Dech, S., 2009. Urbanization in India–
Spatiotemporal analysis using remote sensing data. Computers, Environment and Urban Systems 33, 179-188.
Ten Brink, P., 2011. The economics of ecosystems and biodiversity in national and international policy making. Routledge.
Thaker, J., Leiserowitz, A., 2014. Shifting discourses of climate change in India. Clim. Change 123, 107-119.
Thwaites, R., Race, D., Alexander, K., 2014. Differential impacts of climate change on communities in the middle hills region of Nepal. Natural Hazards 74, 815-836.
Tol, R.S., Yohe, G.W., 2007. The weakest link hypothesis for adaptive capacity: an empirical test. Global environmental change 17, 218-227.
Toman, M., 2014. The need for multiple types of information to inform climate change assessment. World Bank Policy Research Working Paper.
Tompkins, E.L., Adger, W.N., 2005. Defining response capacity to enhance climate change policy. Environmental Science & Policy 8, 562-571.
Tompkins, E.L., Adger, W.N., Boyd, E., Nicholson-Cole, S., Weatherhead, K., Arnell, N., 2010. Observed adaptation to climate change: UK evidence of transition to a well-adapting society. Global Environmental Change 20, 627-635.
Tribbia, J., Moser, S.C., 2008. More than information: what coastal managers need to plan for climate change. Environmental Science & Policy 11, 315-328.
UNISDR, 2011. Global Assessment Report on Disaster Risk Reduction. Upadhyay, T., Sankhayan, P.L., Solberg, B., 2005. A review of carbon sequestration
dynamics in the Himalayan region as a function of land-use change and forest/soil

136
degradation with special reference to Nepal. Agriculture, ecosystems & environment 105, 449-465.
Uribe, D., Geneletti, D., del Castillo, R.F., Orsi, F., 2014. Integrating Stakeholder Preferences and GIS-Based Multicriteria Analysis to Identify Forest Landscape Restoration Priorities. Sustainability 6, 935-951.
Urwin, K., Jordan, A., 2008. Does public policy support or undermine climate change adaptation? Exploring policy interplay across different scales of governance. Global environmental change 18, 180-191.
Vailshery, L.S., Jaganmohan, M., Nagendra, H., 2013. Effect of street trees on microclimate and air pollution in a tropical city. Urban Forestry & Urban Greening 12, 408-415.
Velma I. Grover, Axel Borsdorf, Jürgen Breuste, Prakash Chandra Tiwari, Frangetto, F.W., 2014. Impact of Global Changes on Mountains: Responses and Adaptation. CRC Press 528 pp.
Vose, R.S., Applequist, S., Bourassa, M.A., Pryor, S.C., Barthelmie, R.J., Blanton, B., Bromirski, P.D., Brooks, H.E., DeGaetano, A.T., Dole, R.M., Easterling, D.R., Jensen, R.E., Karl, T.R., Katz, R.W., Klink, K., Kruk, M.C., Kunkel, K.E., MacCracken, M.C., Peterson, T.C., Shein, K., Thomas, B.R., Walsh, J.E., Wang, X.L., Wehner, M.F., Wuebbles, D.J., Young, R.S., 2013. Monitoring and Understanding Changes in Extremes: Extratropical Storms, Winds, and Waves. Bulletin of the American Meteorological Society 95, 377-386.
Walker, B.H., Anderies, J.M., Kinzig, A.P., Ryan, P., 2006. Exploring resilience in social-ecological systems through comparative studies and theory development: introduction to the special issue. Ecology and Society 11, 12.
WBGov, Darjeeling District Profile http://darjeeling.gov.in/, Darjeeling. WBGov, 2012. West Bengal State Action Plan on Climate Change, in: Environment, D.o.
(Ed.). Government of West Bengal, Kolkata. Welle, T., Birkmann, J., Rhyner, J., Witting, M., Wolfertz, J., 2012. World risk index 2012:
Concept, updating and results. World risk report 2012, 11-26. Whiteman, C.D., 2000. Mountain meteorology: fundamentals and applications. Pacific
Northwest National Laboratory, Richland, WA (US). Wilby, R.L., 2007. A review of climate change impacts on the built environment. Built
Environment 33, 31-45. Willemen, L., Drakou, E.G., Dunbar, M.B., Mayaux, P., Egoh, B.N., 2013. Safeguarding
ecosystem services and livelihoods: understanding the impact of conservation strategies on benefit flows to society. Ecosystem Services 4, 95-103.
Wilson, E., 2006. Adapting to climate change at the local level: the spatial planning response. Local environment 11, 609-625.
Wilson, E., Piper, J., 2010. Spatial planning and climate change. Routledge London.

137
Wischmeier, W.H., Smith, D.D., 1978. Predicting rainfall erosion losses-A guide to conservation planning. Predicting rainfall erosion losses-A guide to conservation planning.
Xu, J., Grumbine, R.E., Shrestha, A., Eriksson, M., Yang, X., Wang, Y.U.N., Wilkes, A., 2009. The Melting Himalayas: Cascading Effects of Climate Change on Water, Biodiversity, and Livelihoods
Las Himalaya Se Derriten: Efectos en Cascada del Cambio Climático sobre el Agua, la Biodiversidad y los Medios de Vida. Conserv. Biol. 23, 520-530. Yohe, G., Tol, R.S., 2002. Indicators for social and economic coping capacity—moving
toward a working definition of adaptive capacity. Global environmental change 12, 25-40.


Appendix 1. The scoring framework to assess the
information within the criteria Criteria Score 1 Score 2
Concept of climate change or global warming
The broad concept of climate change or global warming has been stated and minor discussion of specific concept with some consideration of policy response.
There is clear vision about the concept of climate change and how it has an impact at various spatial scales and locality. Goals and objectives to be recognized and response priorities have been identified with explanation or justification.
Prediction of the impacts of climate change on the biophysical/social/economic context of the planning area
Basic evidence or acknowledgment of climate change impacts and climate change issues on biophysical /social /economic context of the planning area.
Climate change vulnerability at various scale and sector wise has been assessed.
Long term goals and targets for changing climate variability and its impacts
The broad climate change strategies have been stated, as well as some discussion of specific objectives, with some consideration of adaptation priorities on various climate related issues but has not been explained on how to implement it on ground.
There is a clear vision about the goals of the action response for climate change and how it supports wider goals or targets in spatial plan, objectives that allow progress towards the goals to be recognized and adaptation priorities have been identified with some explanation or justification.
Guidance and standards for the implementation of adaptation and mitigation measures in planning area
A range of policies and action plans to acknowledged the need of guidelines and standards on issues like GHG emission , energy , water etc.
Spatial plan included guidelines and standards for climate changes concerns like energy, water, pollution and environmental protection etc.
Base year assessment of GHG emission
Spatial plan provides base year assessment of GHG emission at various spatial scales and location.
GHG emission have been assessed in term of historical trends, current variability and projected future changes
Categorization of GHG emission type and source
The relevant source if GHG emission have been identified or are planned to be assessed
The relevant source if GHG emissions have been assessed in term of historical trend and current variability.
Future emission trends forecast Based upon historical and current GHG emission, development policy goal for future emission have been
Based upon historical and current GHG emission, development policy goals for future emission are forecasted and have
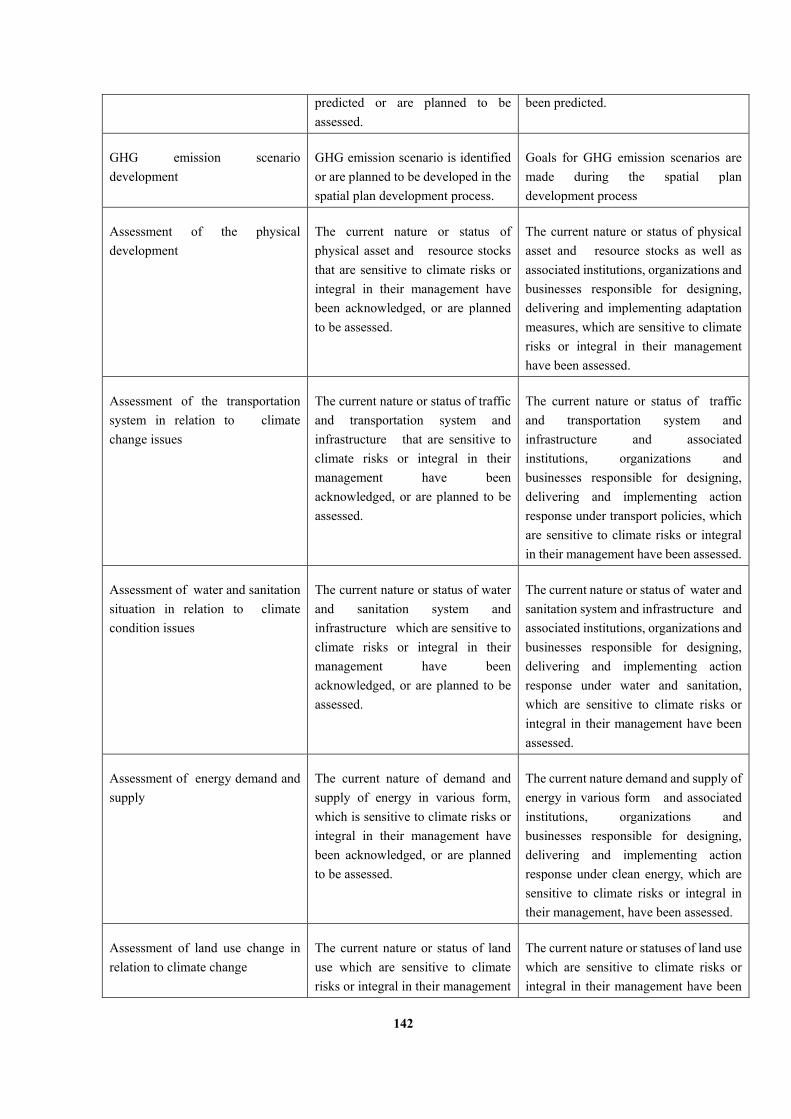
142
predicted or are planned to be assessed.
been predicted.
GHG emission scenario development
GHG emission scenario is identified or are planned to be developed in the spatial plan development process.
Goals for GHG emission scenarios are made during the spatial plan development process
Assessment of the physical development
The current nature or status of physical asset and resource stocks that are sensitive to climate risks or integral in their management have been acknowledged, or are planned to be assessed.
The current nature or status of physical asset and resource stocks as well as associated institutions, organizations and businesses responsible for designing, delivering and implementing adaptation measures, which are sensitive to climate risks or integral in their management have been assessed.
Assessment of the transportation system in relation to climate change issues
The current nature or status of traffic and transportation system and infrastructure that are sensitive to climate risks or integral in their management have been acknowledged, or are planned to be assessed.
The current nature or status of traffic and transportation system and infrastructure and associated institutions, organizations and businesses responsible for designing, delivering and implementing action response under transport policies, which are sensitive to climate risks or integral in their management have been assessed.
Assessment of water and sanitation situation in relation to climate condition issues
The current nature or status of water and sanitation system and infrastructure which are sensitive to climate risks or integral in their management have been acknowledged, or are planned to be assessed.
The current nature or status of water and sanitation system and infrastructure and associated institutions, organizations and businesses responsible for designing, delivering and implementing action response under water and sanitation, which are sensitive to climate risks or integral in their management have been assessed.
Assessment of energy demand and supply
The current nature of demand and supply of energy in various form, which is sensitive to climate risks or integral in their management have been acknowledged, or are planned to be assessed.
The current nature demand and supply of energy in various form and associated institutions, organizations and businesses responsible for designing, delivering and implementing action response under clean energy, which are sensitive to climate risks or integral in their management, have been assessed.
Assessment of land use change in relation to climate change
The current nature or status of land use which are sensitive to climate risks or integral in their management
The current nature or statuses of land use which are sensitive to climate risks or integral in their management have been

143
have been acknowledged, or are planned to be assessed.
assessed.
Assessment of the consequence of the changing climate on natural and protected area
The current nature or status of natural resource stocks and environmental services which are sensitive to climate risks or integral in their management have been acknowledged, or are planned to be assessed.
The existing nature or status of natural resource stocks and environmental services and associated institutions, organizations and businesses responsible for designing, delivering and implementing adaptation measures on natural and protected area, which are sensitive to climate risks or integral in their management have been assessed.
Assessment of the consequence of the changing climate poverty distribution pattern
The current statuses of poverty, deprivation distribution and spatial location which are sensitive to climate risks or integral in their management have been acknowledged, or are planned to be assessed.
The existing nature or status of poverty , deprivation distribution , resource with the poor community and associated with those institutions, organizations and businesses responsible for designing, delivering and implementing adaptation measures for poverty , which are sensitive to climate risks or integral in their management have been assessed.
Displacement and forced migration cause of changing climate variables
Existing nature of forced migration and experience of individuals of various impacts of climate change and forced to move to other region have been acknowledged or are planned to be assessed.
Existing nature of forced migration and experience of individuals of various impacts of climate change and forced to move to other region and associated institutions, organizations and businesses responsible for designing, delivering and implementing adaptation measures which are sensitive to climate risks or integral in their management have been assessed.
Assessment of the employment and livelihood structure
Existing human skills, nature of employment and source of livelihood and experience of individuals responsible for adaptation planning and implementation have been acknowledged, or are planned to be assessed.
The existing human skills, source of livelihood and experience of individuals responsible for adaptation planning and implementation have been assessed.
Assessment of the sectoral economy of the planning area
Existing stocks, flows of financial resources and economic region and obligations associated with those institutions, organizations and businesses responsible for designing, delivering and implementing
Existing stocks ,flows of financial resources and economic region, associated with those institutions, organizations and businesses responsible for designing, delivering and implementing adaptation measures,
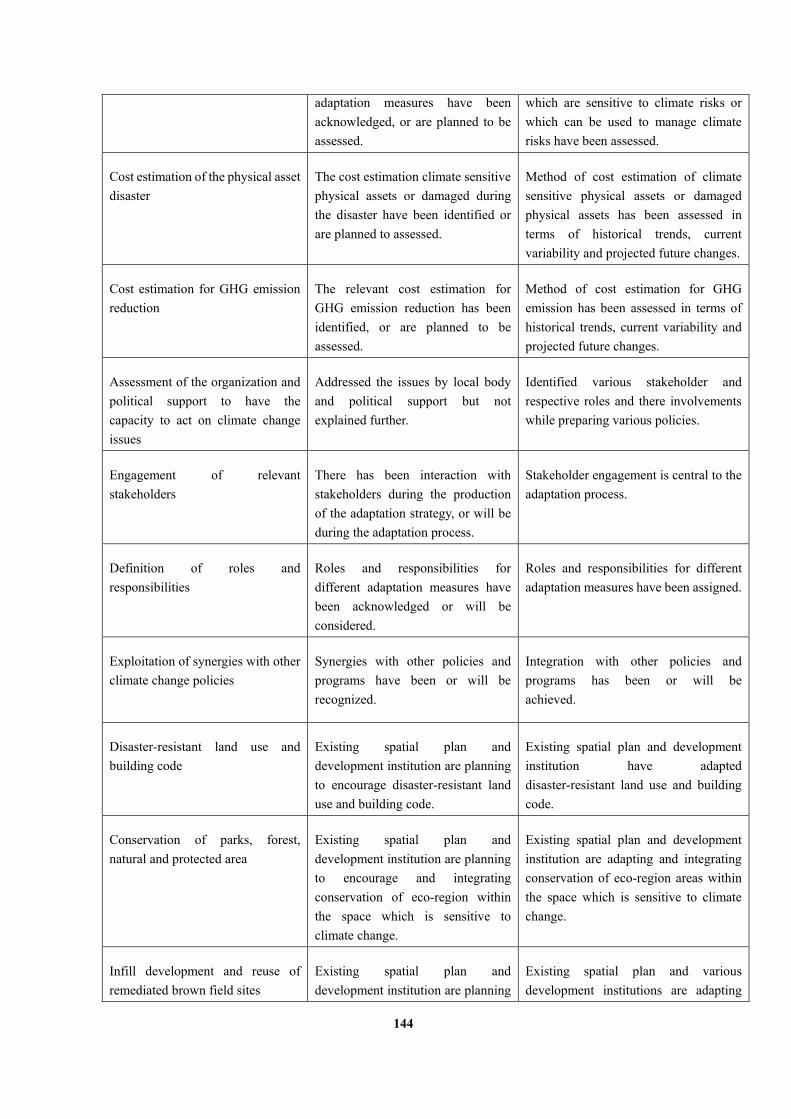
144
adaptation measures have been acknowledged, or are planned to be assessed.
which are sensitive to climate risks or which can be used to manage climate risks have been assessed.
Cost estimation of the physical asset disaster
The cost estimation climate sensitive physical assets or damaged during the disaster have been identified or are planned to assessed.
Method of cost estimation of climate sensitive physical assets or damaged physical assets has been assessed in terms of historical trends, current variability and projected future changes.
Cost estimation for GHG emission reduction
The relevant cost estimation for GHG emission reduction has been identified, or are planned to be assessed.
Method of cost estimation for GHG emission has been assessed in terms of historical trends, current variability and projected future changes.
Assessment of the organization and political support to have the capacity to act on climate change issues
Addressed the issues by local body and political support but not explained further.
Identified various stakeholder and respective roles and there involvements while preparing various policies.
Engagement of relevant stakeholders
There has been interaction with stakeholders during the production of the adaptation strategy, or will be during the adaptation process.
Stakeholder engagement is central to the adaptation process.
Definition of roles and responsibilities
Roles and responsibilities for different adaptation measures have been acknowledged or will be considered.
Roles and responsibilities for different adaptation measures have been assigned.
Exploitation of synergies with other climate change policies
Synergies with other policies and programs have been or will be recognized.
Integration with other policies and programs has been or will be achieved.
Disaster-resistant land use and building code
Existing spatial plan and development institution are planning to encourage disaster-resistant land use and building code.
Existing spatial plan and development institution have adapted disaster-resistant land use and building code.
Conservation of parks, forest, natural and protected area
Existing spatial plan and development institution are planning to encourage and integrating conservation of eco-region within the space which is sensitive to climate change.
Existing spatial plan and development institution are adapting and integrating conservation of eco-region areas within the space which is sensitive to climate change.
Infill development and reuse of remediated brown field sites
Existing spatial plan and development institution are planning
Existing spatial plan and various development institutions are adapting

145
to encourage Infill development and reuse of remediated brown field sites.
and using brown field sites for new development.
Green building and green infrastructure standards
Existing spatial plan and various development institutions are planning to encourage policies or guidelines to integrate green building and green infrastructure.
Existing spatial plan and development institution are adapting policies and guidelines to integrate green building and green infrastructure.
Low-impact design for impervious surface
Existing spatial plan and development institution are planning to encourage building design and standards for low impact design.
Existing spatial plan and various institutions have adapted building design and standards for low impact design.
Pedestrian and bicycle-friendly, transit-oriented community design
A range of policies and action plans to include and encourage public transport and pedestrian facilities to the region.
A range of policies and action plans to include like public transport and pedestrian facilities to the region have been implemented.
Multimodal transportation strategies
A current status of transport system and range of policies like multimode transport system and transport oriented development have been planned to be considered or identified.
A current status of transport system and range of policies like multimode transport system and transport oriented development have been developed or planned to developed.
Climate proofing of transport infrastructure
Policies like climate proofing or sensitivity to transport infrastructure have been acknowledged or are planned to be assessed.
Policies like climate proofing or sensitivity to transport infrastructure have been assessed.
Renewable energy and solar energy
Alternative options to conventional energy like renewal or solar energy are planned to be considered or to identify in the spatial plan.
Alternative options to conventional energy like renewal or solar energy have been planned or identified in the spatial plan.
Energy efficiency and energy stars
A range of policies and technological instruments are planned, considered or acknowledged to increase the energy efficiency.
A range of policies and technological instruments are considered and acknowledged to increase the energy efficiency.
Waste management and GHG mitigation technologies
Existing infrastructure for waste management and GHG mitigation technologies which are sensitive to climate risks or integral in their management have been acknowledged or are planned to be assessed.
Existing infrastructure for waste management and GHG mitigation technologies which are sensitive to climate risks or integral in their management have been assessed.
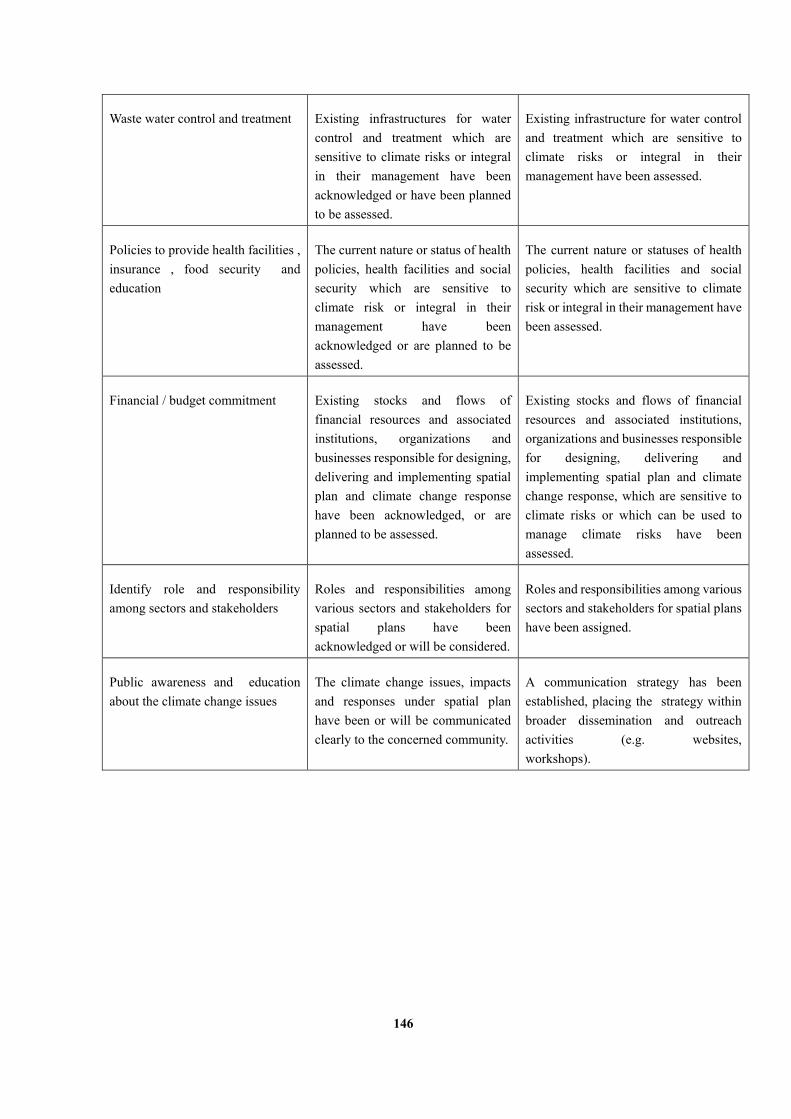
146
Waste water control and treatment
Existing infrastructures for water control and treatment which are sensitive to climate risks or integral in their management have been acknowledged or have been planned to be assessed.
Existing infrastructure for water control and treatment which are sensitive to climate risks or integral in their management have been assessed.
Policies to provide health facilities , insurance , food security and education
The current nature or status of health policies, health facilities and social security which are sensitive to climate risk or integral in their management have been acknowledged or are planned to be assessed.
The current nature or statuses of health policies, health facilities and social security which are sensitive to climate risk or integral in their management have been assessed.
Financial / budget commitment
Existing stocks and flows of financial resources and associated institutions, organizations and businesses responsible for designing, delivering and implementing spatial plan and climate change response have been acknowledged, or are planned to be assessed.
Existing stocks and flows of financial resources and associated institutions, organizations and businesses responsible for designing, delivering and implementing spatial plan and climate change response, which are sensitive to climate risks or which can be used to manage climate risks have been assessed.
Identify role and responsibility among sectors and stakeholders
Roles and responsibilities among various sectors and stakeholders for spatial plans have been acknowledged or will be considered.
Roles and responsibilities among various sectors and stakeholders for spatial plans have been assigned.
Public awareness and education about the climate change issues
The climate change issues, impacts and responses under spatial plan have been or will be communicated clearly to the concerned community.
A communication strategy has been established, placing the strategy within broader dissemination and outreach activities (e.g. websites, workshops).

147
Appendix 2. Spatial plans from various cities in
India Sate /Union territory
Name of the City /State
Type of the Plan Spatial scale
Language Organizational structure
Jammu and Kashmir
Jammu Master Plan City level English Development Authority
Shri Nagar City Development Plan City level English Development Authority
Shri Nagar Master Plan City level English Private organization Punjab Amritsar Master Plan City level English Private organization
Amritsar City Development Plan City level English Private organization Ludhiana Master Plan City level English Private organization
Chandigarh Chandigarh City Development Plan City level English Private organization Uttarakhand Dehradun Master Plan City level Hindi Development
Authority Dehradun City Development Plan City level English Private organization Haridwar City Development Plan City level English Private organization
Haryana Faridabad City Development Plan City level Hindi Private organization Gurgoan Master Plan City level English Development
Authority Delhi Delhi Master Plan City level English Development
Authority Delhi City Development Plan City level Hindi Private organization
Delhi, Haryana , UP and Rajasthan
National capital Region
Regional Plan NCR English Development Authority
Rajasthan Jaipur Master Plan City level English Development Authority
Jaipur City Development Plan City level English Private organization Jodhpur Master Plan City level English Development
Authority Kota Master Plan City level English Development
Authority Uttar Pradesh Lucknow Master Plan City level English Development
Authority Lucknow City Development Plan City level English Private organization Kanpur City Development Plan City level English Private organization Agra City Development Plan City level English Private organization
Bihar Patna City Development Plan City level English Private organization Patna Master Plan City level English Private organization Bodhgaya City Development Plan City level English Private organization
Manipur Imphal City Development Plan City level English Private organization

148
Aizawal City Development Plan City level English Private organization Tripura Agartala City Development Plan City level English Private organization Meghalaya Shillong City Development Plan City level English Private organization Assam Guwahati Master Plan City level English Private organization
Guwahati City Development Plan City level English Private organization West Bengal Kolkata City Development Plan City level English Private organization Jharkhand Jamshedpur City Development Plan City level English Private organization
Dhanbad City Development Plan City level English Private organization Ranchi City Development Plan City level English Private organization
Orissa Bhubaneswar City Development Plan City level English Private organization Chhattisgarh Raipur City Development Plan City level English Private organization
Raipur Development Plan City level English Private organization Madhya Pradesh
Indore Master Plan City level English Development Authority
Bhopal Master Plan City level English Development Authority
Bhopal City Development Plan City level English Private organization Himachal Pradesh
Shimla City Development Plan City level English Private organization Shimla Master Plan City level English Development
Authority Gujarat Ahmedabad City Development Plan City level English Private and
Development Authority
Surat City Development Plan City level English Private and Development Authority
Maharashtra Mumbai Master Plan City level English Development Authority
Mumbai City Development Plan City level English Private organization Nagpur City Development Plan City level English Private organization
Andhra Pradesh
Hyderabad City Development Plan City level English Private organization Vishakhapatnam
City Development Plan City level English Private organization
Karnataka Bangalore City Development Plan City level English Private organization Goa Panji City Development Plan City level English Private organization Kerala Kochi Development Plan City level English Development
Authority Thiruvananthapuram
City Development Plan City level English Private organization
Tamil Nadu Chennai Master Plan City level English Development Authority
Chennai City Development Plan City level English Private organization Coimbatore City Development Plan City level English Private organization Madurai City Development Plan City level English Private organization
Andaman Islands
Port Blair Master Plan City level English Development Authority

149
Appendix 3. Performance of spatial plans for
various cities across India City Type of spatial plan Overall plan
performance Awareness Analysis Action
Jammu Master Plan 0.06 0.00 0.09 0.08 Shri Nagar City Development Plan 0.23 0.13 0.33 0.15 Amritsar Master Plan 0.20 0.00 0.24 0.23 Ludhiana Master Plan 0.21 0.25 0.24 0.19 Chandigarh City Development Plan 0.15 0.25 0.12 0.19 Shimla Master Plan 0.26 0.88 0.18 0.19 Dehradun Master Plan 0.11 0.13 0.15 0.08 Haridwar City Development Plan 0.05 0.00 0.03 0.12 Faridabad City Development Plan 0.08 0.00 0.15 0.04 Gurgoan Master Plan 0.09 0.00 0.09 0.15 Delhi Master Plan 0.55 0.25 0.55 0.65 Jaipur Master Plan 0.27 0.13 0.42 0.15 Jodhpur Master Plan 0.00 0.00 0.00 0.04 Kota Master Plan 0.00 0.00 0.00 0.04 Lucknow City Development Plan 0.17 0.00 0.18 0.23 Kanpur City Development Plan 0.29 0.13 0.39 0.23 Agra City Development Plan 0.11 0.00 0.15 0.12 Patna City Development Plan 0.23 0.00 0.30 0.23 Bodhgaya City Development Plan 0.20 0.00 0.21 0.27 Imphal City Development Plan 0.12 0.00 0.15 0.15 Aizawal City Development Plan 0.14 0.00 0.15 0.19 Agartala City Development Plan 0.21 0.00 0.30 0.19 Shillong City Development Plan 0.20 0.00 0.27 0.19 Guwahati Master Plan 0.29 0.25 0.27 0.35 Kolkata City Development Plan 0.30 0.00 0.39 0.31 Jamshedpur City Development Plan 0.14 0.13 0.15 0.15 Dhanbad City Development Plan 0.24 0.00 0.33 0.23 Ranchi City Development Plan 0.18 0.00 0.27 0.15 Bhubaneswar City Development Plan 0.23 0.00 0.33 0.19 Raipur Master Plan 0.26 0.00 0.36 0.23 Indore Master Plan 0.09 0.00 0.09 0.15 Bhopal Master Plan 0.30 0.38 0.30 0.31 Ahmedabad City Development Plan 0.23 0.13 0.24 0.27 Surat City Development Plan 0.27 0.13 0.33 0.27 Mumbai Master Plan 0.42 0.25 0.45 0.46 Nagpur City Development Plan 0.26 0.13 0.30 0.27 Hyderabad City Development Plan 0.23 0.00 0.30 0.23 Vishakhapatnam City Development Plan 0.12 0.00 0.18 0.12

150
Bangalore City Development Plan 0.21 0.00 0.21 0.31 Panji City Development Plan 0.15 0.00 0.21 0.15 Kochi Master Plan 0.50 0.25 0.52 0.58 Thiruvananthapuram
City Development Plan 0.14
0.00 0.18 0.15
Chennai Master Plan 0.30 0.25 0.33 0.31 Coimbatore City Development Plan 0.02 0.00 0.06 0.00 Madurai City Development Plan 0.11 0.00 0.09 0.19 Port Blair Master Plan 0.38 0.63 0.30 0.42
Notes: The maximum score for each component of awareness, analysis and action is 1. The maximum
performance score for any spatial plan (after standardization) is 1.

151
Appendix 4. Data source and data preparation Component's aspects
Indicators Data source Data type Data Preparation Step Critical range for standardization
Exposure Temperature
• Hot days/year (Tmax>30º C)
• Mean temperature Increase
• Indian meteorological department, Bangalore and Pune, India.
• Directorate of Economics and Statistics (DES), Bangalore, Karnataka, India.
• Museum of Vertebrate Zoology, University of California, Berkeley, USA.
• Monthly mean maximum, minimum and average temperature data for one station (1901-2000)
• High resolution gridded daily temperature data for Mesoscale Meteorological Studies(1971-2005)
• Monthly mean maximum, minimum and average temperature data for four stations ( 2000-2014)
• World Climate Data
• Temperature data were selected for those stations having more than 80% of data availability while 1901-2014 and others were rejected.
• For a number of hot days/year indicator focus was given for the past five-year data for the four stations.
• Change of mean maximum temperature, mean minimum temperature, and yearly mean temperature for four stations were analysed.
• Spatial interpolation of annual mean temperature, numbers of hot days/year data were analysed with the help of ordinary kriging tool under the spatial analyst extension of ArcMap 10 based upon number of points and maximum distance variables.
• With the help of math algebra and zonal tool under spatial analyst extension of ArcMap 10 ward wise information extracted from the results of kriging output.
<.250C 25-.500C >.500C <30 days 30-45 days >45 days
precipitation
• Rain range (>830 mm/year)
• Number of days/year with
• Indian meteorological department, Bangalore and Pune, India.
• Directorat
• Monthly and yearly average rainfall (mm) and rainy days from 6 stations (1901-205)
• High resolution gridded daily rainfall data for
• Monthly rainfall data were selected for those stations having more than 80% of data availability while 1901-2014 and others were rejected.
• For a number of heavy rainfall days/ year indicators focus was given for the past five-year data for 17 out of 20 stations.
<830 mm 830-950 mm >950 mm <3 days 3-5 days >6 days

152
heavy rain (RR >30mm)
e of Economics and Statistics (DES), Bangalore, Karnataka, India.
• Museum of Vertebrate Zoology, University of California, Berkeley, USA.
Mesoscale Meteorological Studies (1971-2005)
• Monthly rainfall (mm) and rainy days for 20 (2010-2014)
• Kriging were also applied to these 4 points
• World Climate Data
• Spatial interpolation of annual and monthly rainfall, numbers days with heavy rainfall/year data were analysed with the help of ordinary kriging tool of spatial analyst extension of ArcMap 10 based upon number of points and maximum distance variables.
• With the help of math algebra and zonal tool under spatial analyst extension of ArcMap 10 ward wise information extracted from the results of kriging output.
Sensitivity Physical and economic
Area covered by road
• Bangalore development authority, Bangalore.
• Bruhat Bengaluru Mahanagara Palike, Bangalore.
• Bangalore Metropolitan Transport Corporation, Bangalore.
• Karnataka urban infrastructure development and Finance Corporation.
• Road Network Characteristics
• Distribution of Roads with Carriageway Widths (Rail Network, Airport)
• Vehicle Growth and Composition
• Urban land use structure
• Based on land use change analysis, total area identified under road infrastructure.
• Accessibility analysis with the help of Flowmap 7.4 and ArcMap 10.
• Projection of trip distribution on the main roads and zones in Bangalore based on the 2011 modal split data from Rites.
• With the help of math algebra and zonal tool under spatial analyst extension of ArcMap 10 ward wise road infrastructure information was extracted.
<10 % 10-25% >25 %
High-density area
• Census of India, Bangalore and Delhi, India.
• Bangalore
Population at ward level
• Spatial distribution of population according to the census data.
• Population density for each ward was calculated with the help of math and zonal tool
<15000 25000 >25000

153
development Authority, Bangalore, India.
• The Bruhat Bengaluru Mahanagara Palike, Bangalore, India.
under spatial analyst extension of ArcMap 10.
Number of slums
• Census of India, Bangalore and Delhi, India.
• Bangalore development Authority, Bangalore, India.
• The Bruhat Bengaluru Mahanagara Palike, Bangalore, India.
Number of slums, slum population, the gender split at ward level
• Based on municipal data on slums, location of slums was identified.
• With the help of zonal tool under spatial analyst extension of ArcMap 10 ward wise pattern of slums and information was extracted.
0 1-5 >5
Land use change
• Bangalore development Authority, Bangalore, India.
• Global Land Cover Facility (GLCF – http://www.landcover.org/), and from the U.S. Geological Survey (USGS) and NASA’s Landsat mission website.
Landsat ETM+ and Landsat 8 images for Nov 2000 and June 2014
• With the help of un- supervised classification under spatial analyst extension of Arch Map 10 for both images land cover analysed.
• With the help of ground control points and data collected from field digital classification of significant land cover / land use were done and categorized into four principal classes of land cover/ land use with for each time period – vegetation, water , built area and open areas.
• Change detection analysis for every land use category were conducted
• With the help of math algebra and zonal tool under spatial analyst extension of ArcMap 10 ward wise land use / land cover
<10% 10-25% >25%

154
information was extracted.
Percentage of people younger than six years
Census of India, Bangalore and Delhi, India.
People younger than six years at ward level
• Spatial distribution of people younger than six years according to the census data.
• Percentage of people younger than six years information for each ward was calculated with the help of zonal tool under spatial analyst extension of ArcMap 10.
<10% 10-15% >15%
Percentage of liveable houses
Census of India, Bangalore and Delhi , India.
Percentage of liveable houses at ward level
• Spatial distribution of percentage of liveable houses according to the census data.
• Percentage of liveable houses information for each ward was calculated with the help of zonal tool under spatial analyst extension of ArcMap 10.
<75% 75-90% >90%
Environmental
Increased fluctuation of the groundwater level
• Central ground water board, Government of India, India
• Census of India, Bangalore and Delhi, India.
• Bangalore Urban Metabolism
• Monthly and yearly average rainfall (mm) and rainy days from different stations (1901-2014)
• High resolution gridded daily rainfall data for Mesoscale Meteorological Studies (1971-2005)
• Monthly rainfall data were selected for those stations having more than 80% of data availability while 1901-2014 (Focus was for the last ten years), and others were rejected.
• Monthly rate of change of rainfall was analysed
• Difference of rainfall between pre-monsoon and after monsoon was analysed for past ten years
• Spatial interpolation of difference of rainfall between pre-monsoon and after monsoon
<-100 mm -100-200 mm >-200 mm

155
Project (BUMP), Indian institute of Management, Bangalore, India.
• Monthly rainfall (mm) and rainy days from 20 stations (2010-2014)
data was done with the help of ordinary kriging tool under spatial analyst extension of ArcMap 10 based upon the number of points and maximum distance variables.
• With the help of math algebra and zonal tool under spatial analyst extension of ArcMap 10 ward wise difference of rainfall between pre-monsoon and after monsoon data information extracted.
Loss of lakes and wetland area
• The Bruhat Bengaluru Mahanagara Palike, Bangalore, India.
• Bangalore development Authority, Bangalore, India.
• Lake development Authority Bangalore, India.
• Primary survey.
Landsat ETM+ image of Nov 2000 and Landsat 8 image of June 2014
• Based on land use change analysis, total area identified under lakes and wetland area.
• Rate of change of area under lakes and wetland area were analysed
• With the help of math algebra and zonal tool under spatial analyst extension of ArcMap 10 ward wise loss of lakes and wetland area information was extracted
<20% 20-30% >30%
Adaptive Capacity Socio-economic
Percentage of household having banking facilities
• Census of India, Bangalore and Delhi, India.
• National Sample Survey Office Bangalore, India.
• Bangalore development authority, Bangalore, India.
Percentage of households having banking facilities at ward level
• Spatial distribution of percentage of households having banking facilities according to the census data.
• Percentage of households having banking facilities information for each ward was calculated with the help of zonal tool under spatial analyst extension of ArcMap 10.
<50% 50-75% >75%
Percentage of household
• Census of India, Bangalore and Delhi , India.
Percentage of households having housing
• Spatial distribution of percentage of households having housing ownership
<50% 50-75% >75%

156
having housing ownership
• National Sample Survey Office Bangalore, India.
• Bangalore development authority, Bangalore, India.
ownership at ward level
according to the census data. • Percentage of households
having housing ownership information for each ward was calculated with the help of zonal tool under spatial analyst extension of ArcMap 10.
Percentage of household having all kind asset ownership
• Census of India, Bangalore and Delhi , India.
• National Sample Survey Office Bangalore, India.
• Bangalore development authority, Bangalore, India.
Percentage of households having all kind asset ownership at ward level
• Spatial distribution of percentage of households having all kind asset ownership according to the census data.
• Percentage of households having all kind asset ownership information for each ward was calculated with the help of zonal tool under spatial analyst extension of ArcMap 10.
<50% 50-75% >75%
Percentage of people who are literate
• Census of India, Bangalore and Delhi , India.
• National Sample Survey Office Bangalore, India.
• Bangalore development authority, Bangalore, India.
Percentage of people who are literate at ward level
• Spatial distribution of percentage of people who are literate according to the census data.
• Percentage of people who are literate information for each ward was calculated with the help of zonal tool under spatial analyst extension of ArcMap 10.
<75% 75-90% >90%
Provision of basic facilities
Percentage of household having drinking water connection
• Census of India, Bangalore and Delhi , India.
• National Sample Survey Office Bangalore, India.
• Bangalore development authority, Bangalore, India.
Percentage of households having drinking water connection at ward level
• Spatial distribution of percentage of households having drinking water connection according to the census data.
• Percentage of households having drinking water connection information for each ward was calculated with the help of zonal tool under spatial analyst extension of ArcMap 10.
<75% 75-90% >90%
Percentage of
• Census of India, Bangalore and
Percentage of households
• Spatial distribution percentage of households having waste
<75% 75-90%

157
household having waste water drainage connection
Delhi , India. • National Sample
Survey Office Bangalore, India.
• Bangalore development authority, Bangalore, India.
having waste water drainage connection at ward level
water drainage connection according to the census data.
• Percentage of households having waste water drainage connection information for each ward was calculated with the help of zonal tool under spatial analyst extension of ArcMap 10.
>90%
Percentage of household connected to efficient cooking fuel
• Census of India, Bangalore and Delhi, India.
• National Sample Survey Office Bangalore, India.
• Bangalore development authority, Bangalore, India.
Percentage of households connected to efficient cooking fuel at ward level
• Spatial distribution percentage of households connected to efficient cooking fuel according to the census data.
• Percentage of households connected to efficient cooking fuel information for each ward was calculated with the help of zonal tool under spatial analyst extension of ArcMap 10.
<75% 75-90% >90%
Percentage of area having access to road
• Census of India, Bangalore and Delhi, India
• National Sample Survey Office Bangalore, India
• Bangalore development authority, Bangalore, India
Roads networks Land use change, 2009 to 2014
• Based on land use change analysis, total area identified under road infrastructure.
• With the help of zonal tool under spatial analyst extension of ArcMap 10 ward wise percentage of area having access to road information was extracted
<5% 5-10% >10%
Ecological
Green space/ per person
• Census of India, Bangalore and Delhi, India
• Bangalore development Authority, Bangalore, India.
• Global Land Cover Facility (GLCF – http://www.landcover.org/), and from the U.S. Geological Survey (USGS)
Land use change, 2009 - 2014 Population at ward level
• Based on land use change analysis, total area identified under vegetation land use category.
• With the help of zonal tool under spatial analyst extension of ArcMap 10 ward wise area vegetation land use information was extracted
• People having green space information for each ward was calculated with the help of zonal tool under spatial analyst extension of ArcMap 10.
<10 sq/m 10-20 sq/m >20 sq/m
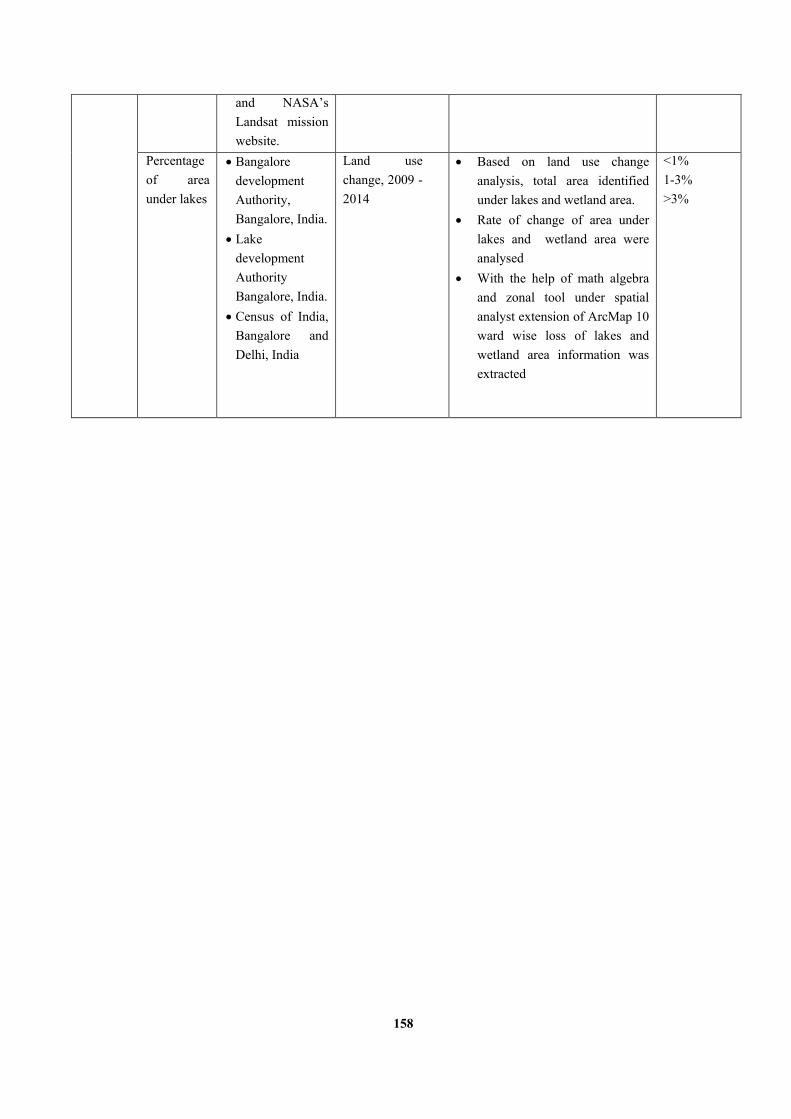
158
and NASA’s Landsat mission website.
Percentage of area under lakes
• Bangalore development Authority, Bangalore, India.
• Lake development Authority Bangalore, India.
• Census of India, Bangalore and Delhi, India
Land use change, 2009 - 2014
• Based on land use change analysis, total area identified under lakes and wetland area.
• Rate of change of area under lakes and wetland area were analysed
• With the help of math algebra and zonal tool under spatial analyst extension of ArcMap 10 ward wise loss of lakes and wetland area information was extracted
<1% 1-3% >3%

159
Appendix 5. Ward wise vulnerability assessment for
climate change of Bangalore city (Outcome values are
scaled on 0-1 range) Ward No.
Ward name Vulnerability Exposure Sensitivity Impact Adaptive capacity
1 Kempegowda 0.71 1.00 0.47 0.71 0.54 2 Chowdeswari 0.71 1.00 0.47 0.71 0.49 3 Atturu 0.66 0.91 0.47 0.66 0.44 4 Yelahanka Satellite Town 0.66 0.91 0.50 0.66 0.54 5 Jakkuru 0.71 1.00 0.47 0.75 0.49 6 Thanisandra 0.66 0.81 0.44 0.62 0.44 7 Byatarayanapura 0.66 0.81 0.44 0.57 0.49 8 Kodigehalli 0.66 0.81 0.44 0.62 0.44 9 Vidyaranyapura 0.61 0.81 0.41 0.57 0.54
10 Dodda Bommasandra 0.61 0.81 0.41 0.57 0.54 11 Kuvempu Nagar 0.66 0.81 0.47 0.66 0.49 12 Shettihalli 0.61 0.81 0.44 0.57 0.49 13 Mallasandra 0.66 0.81 0.44 0.62 0.44 14 Bagalakunte 0.66 0.81 0.47 0.62 0.44 15 T Dasarahalli 0.61 0.81 0.41 0.52 0.49 16 Jalahalli 0.61 0.81 0.44 0.57 0.54 17 J P Park 0.61 0.81 0.41 0.52 0.49 18 Radhakrishna Temple 0.61 0.81 0.41 0.52 0.44 19 Sanjaya Nagar 0.61 0.68 0.41 0.52 0.44 20 Ganga Nagar 0.61 0.68 0.44 0.57 0.44 21 Hebbala 0.61 0.68 0.44 0.57 0.44 22 Vishwanath Nagenahalli 0.61 0.81 0.44 0.57 0.49 23 Nagavara 0.66 0.81 0.44 0.62 0.44 24 HBR Layout 0.71 0.81 0.54 0.66 0.49 25 Horamavu 0.66 0.91 0.47 0.62 0.44 26 Ramamurthy Nagar 0.71 0.91 0.47 0.57 0.44 27 Banasavadi 0.61 0.68 0.47 0.52 0.44 28 Kammanahalli 0.61 0.68 0.44 0.48 0.44 29 Kacharkanahalli 0.61 0.68 0.50 0.52 0.44 30 Kadugondanahalli 0.66 0.68 0.54 0.62 0.49 31 Kushal Nagar 0.61 0.68 0.57 0.71 0.49 32 Kaval Bairasandra 0.61 0.68 0.44 0.48 0.49 33 Manorayanapalya 0.61 0.68 0.41 0.52 0.49 34 Gangenahalli 0.61 0.68 0.41 0.52 0.44 35 Aramane Nagara 0.55 0.68 0.41 0.52 0.59 36 Mattikere 0.66 0.81 0.47 0.57 0.44

160
37 Yeshwanthpura 0.66 0.81 0.47 0.66 0.49 38 HMT Ward 0.61 0.68 0.47 0.62 0.44 39 Chokkasandra 0.66 0.81 0.47 0.62 0.44 40 Dodda Bidarakallu 0.61 0.68 0.47 0.62 0.49 41 Peenya Industrial Area 0.61 0.68 0.41 0.52 0.44 42 Lakshmi Devi Nagar 0.66 0.68 0.50 0.66 0.49 43 Nandini Layout 0.61 0.68 0.44 0.57 0.44 44 Marappana Palya 0.66 0.81 0.54 0.75 0.44 45 Malleswaram 0.66 0.81 0.57 0.57 0.44 46 Jayachamarajendra Nagar 0.61 0.68 0.44 0.57 0.44 47 Devara Jeevanahalli 0.66 0.68 0.54 0.66 0.44 48 Muneshwara Nagar 0.66 0.68 0.57 0.71 0.49 49 Lingarajapura 0.66 0.68 0.50 0.57 0.49 50 Benniganahalli 0.61 0.68 0.47 0.52 0.49 51 Vijnanapura 0.71 0.91 0.50 0.57 0.44 52 K R Puram 0.71 1.00 0.47 0.62 0.49 53 Basavanapura 0.71 0.91 0.47 0.66 0.44 54 Hudi 0.71 1.00 0.47 0.75 0.49 55 Devasandra 0.71 0.91 0.57 0.66 0.44 56 A Narayanapura 0.71 0.91 0.50 0.57 0.44 57 C V Raman Nagar 0.61 0.81 0.47 0.57 0.49 58 New Tippasandara 0.61 0.91 0.41 0.57 0.44 59 Maruthi Seva Nagar 0.61 0.68 0.57 0.66 0.49 60 Sagayarapuram 0.66 0.68 0.50 0.57 0.49 61 S K Garden 0.61 0.68 0.47 0.52 0.49 62 Ramaswamy Palya 0.66 0.68 0.50 0.62 0.49 63 Jayamahal 0.66 0.68 0.70 0.66 0.49 64 Rajamahal Guttahalli 0.61 0.68 0.47 0.52 0.44 65 Kadu Malleshwar 0.61 0.68 0.44 0.52 0.44 66 Subramanya Nagar 0.61 0.68 0.44 0.48 0.44 67 Nagapura 0.61 0.68 0.41 0.48 0.44 68 Mahalakshimpuram 0.61 0.68 0.41 0.52 0.44 69 Laggere 0.66 0.68 0.47 0.62 0.44 70 Rajagopal Nagar 0.66 0.68 0.60 0.62 0.44 71 Hegganahalli 0.66 0.68 0.44 0.57 0.44 72 Herohalli 0.66 0.68 0.47 0.62 0.44 73 Kottegepalya 0.61 0.68 0.60 0.62 0.44 74 Shakthi Ganapathi Nagar 0.61 0.68 0.47 0.57 0.44 75 Shankar Matt 0.61 0.68 0.44 0.52 0.44 76 Gayithri Nagar 0.61 0.68 0.50 0.57 0.44 77 Dattatreya Temple 0.61 0.68 0.47 0.52 0.44 78 Pulikeshinagar 0.61 0.68 0.70 0.52 0.44 79 Sarvagna Nagar 0.61 0.68 0.54 0.62 0.49 80 Hoysala Nagar 0.61 0.68 0.44 0.52 0.44 81 Vijnana Nagar 0.61 0.91 0.47 0.57 0.44 82 Garudachar Playa 0.61 0.91 0.44 0.66 0.44
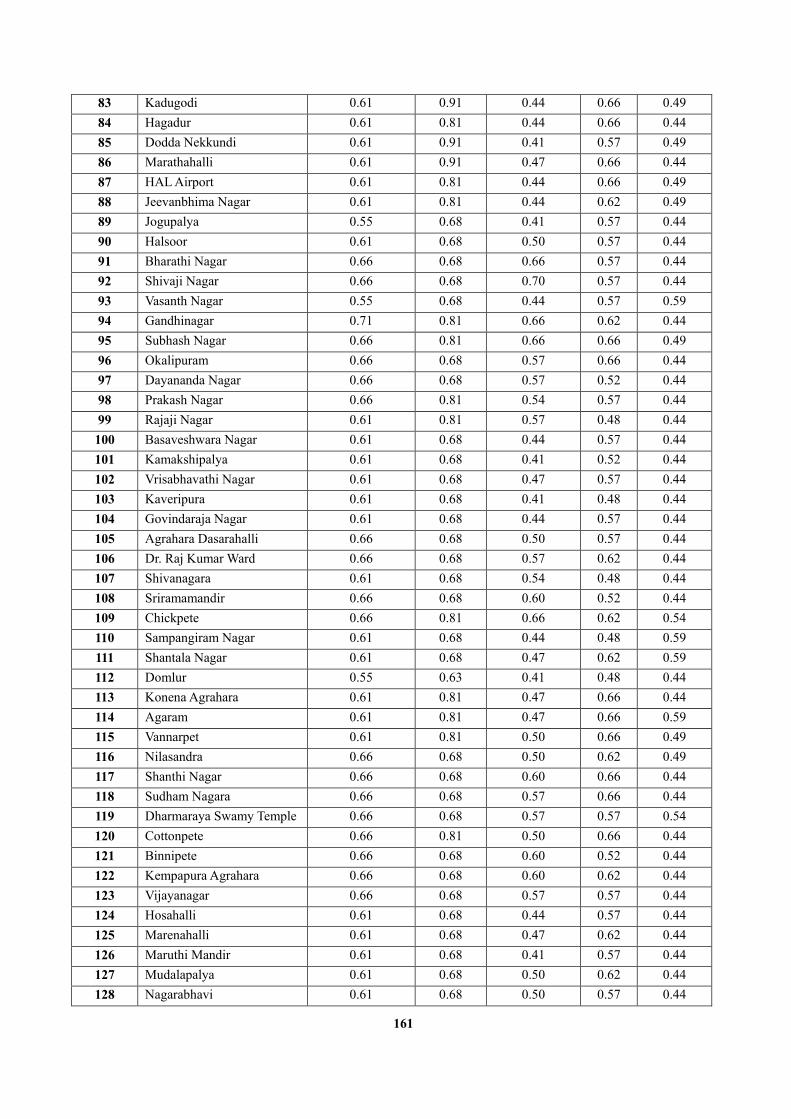
161
83 Kadugodi 0.61 0.91 0.44 0.66 0.49 84 Hagadur 0.61 0.81 0.44 0.66 0.44 85 Dodda Nekkundi 0.61 0.91 0.41 0.57 0.49 86 Marathahalli 0.61 0.91 0.47 0.66 0.44 87 HAL Airport 0.61 0.81 0.44 0.66 0.49 88 Jeevanbhima Nagar 0.61 0.81 0.44 0.62 0.49 89 Jogupalya 0.55 0.68 0.41 0.57 0.44 90 Halsoor 0.61 0.68 0.50 0.57 0.44 91 Bharathi Nagar 0.66 0.68 0.66 0.57 0.44 92 Shivaji Nagar 0.66 0.68 0.70 0.57 0.44 93 Vasanth Nagar 0.55 0.68 0.44 0.57 0.59 94 Gandhinagar 0.71 0.81 0.66 0.62 0.44 95 Subhash Nagar 0.66 0.81 0.66 0.66 0.49 96 Okalipuram 0.66 0.68 0.57 0.66 0.44 97 Dayananda Nagar 0.66 0.68 0.57 0.52 0.44 98 Prakash Nagar 0.66 0.81 0.54 0.57 0.44 99 Rajaji Nagar 0.61 0.81 0.57 0.48 0.44 100 Basaveshwara Nagar 0.61 0.68 0.44 0.57 0.44 101 Kamakshipalya 0.61 0.68 0.41 0.52 0.44 102 Vrisabhavathi Nagar 0.61 0.68 0.47 0.57 0.44 103 Kaveripura 0.61 0.68 0.41 0.48 0.44 104 Govindaraja Nagar 0.61 0.68 0.44 0.57 0.44 105 Agrahara Dasarahalli 0.66 0.68 0.50 0.57 0.44 106 Dr. Raj Kumar Ward 0.66 0.68 0.57 0.62 0.44 107 Shivanagara 0.61 0.68 0.54 0.48 0.44 108 Sriramamandir 0.66 0.68 0.60 0.52 0.44 109 Chickpete 0.66 0.81 0.66 0.62 0.54 110 Sampangiram Nagar 0.61 0.68 0.44 0.48 0.59 111 Shantala Nagar 0.61 0.68 0.47 0.62 0.59 112 Domlur 0.55 0.63 0.41 0.48 0.44 113 Konena Agrahara 0.61 0.81 0.47 0.66 0.44 114 Agaram 0.61 0.81 0.47 0.66 0.59 115 Vannarpet 0.61 0.81 0.50 0.66 0.49 116 Nilasandra 0.66 0.68 0.50 0.62 0.49 117 Shanthi Nagar 0.66 0.68 0.60 0.66 0.44 118 Sudham Nagara 0.66 0.68 0.57 0.66 0.44 119 Dharmaraya Swamy Temple 0.66 0.68 0.57 0.57 0.54 120 Cottonpete 0.66 0.81 0.50 0.66 0.44 121 Binnipete 0.66 0.68 0.60 0.52 0.44 122 Kempapura Agrahara 0.66 0.68 0.60 0.62 0.44 123 Vijayanagar 0.66 0.68 0.57 0.57 0.44 124 Hosahalli 0.61 0.68 0.44 0.57 0.44 125 Marenahalli 0.61 0.68 0.47 0.62 0.44 126 Maruthi Mandir 0.61 0.68 0.41 0.57 0.44 127 Mudalapalya 0.61 0.68 0.50 0.62 0.44 128 Nagarabhavi 0.61 0.68 0.50 0.57 0.44
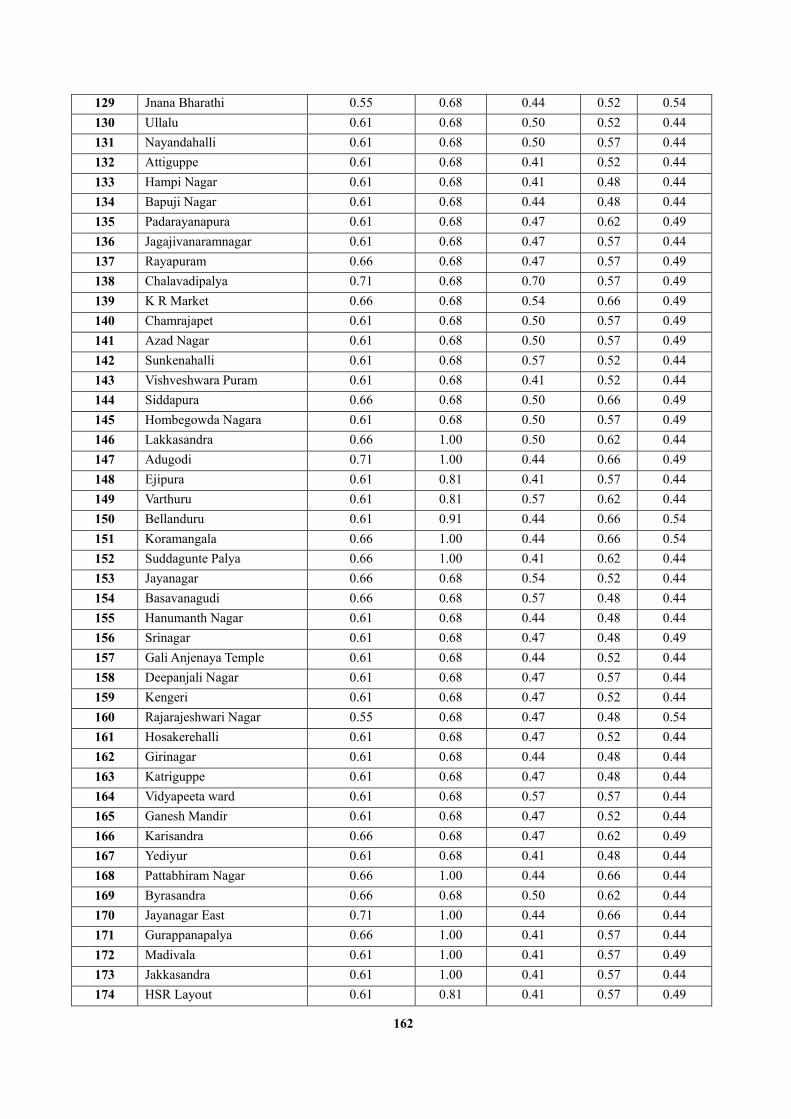
162
129 Jnana Bharathi 0.55 0.68 0.44 0.52 0.54 130 Ullalu 0.61 0.68 0.50 0.52 0.44 131 Nayandahalli 0.61 0.68 0.50 0.57 0.44 132 Attiguppe 0.61 0.68 0.41 0.52 0.44 133 Hampi Nagar 0.61 0.68 0.41 0.48 0.44 134 Bapuji Nagar 0.61 0.68 0.44 0.48 0.44 135 Padarayanapura 0.61 0.68 0.47 0.62 0.49 136 Jagajivanaramnagar 0.61 0.68 0.47 0.57 0.44 137 Rayapuram 0.66 0.68 0.47 0.57 0.49 138 Chalavadipalya 0.71 0.68 0.70 0.57 0.49 139 K R Market 0.66 0.68 0.54 0.66 0.49 140 Chamrajapet 0.61 0.68 0.50 0.57 0.49 141 Azad Nagar 0.61 0.68 0.50 0.57 0.49 142 Sunkenahalli 0.61 0.68 0.57 0.52 0.44 143 Vishveshwara Puram 0.61 0.68 0.41 0.52 0.44 144 Siddapura 0.66 0.68 0.50 0.66 0.49 145 Hombegowda Nagara 0.61 0.68 0.50 0.57 0.49 146 Lakkasandra 0.66 1.00 0.50 0.62 0.44 147 Adugodi 0.71 1.00 0.44 0.66 0.49 148 Ejipura 0.61 0.81 0.41 0.57 0.44 149 Varthuru 0.61 0.81 0.57 0.62 0.44 150 Bellanduru 0.61 0.91 0.44 0.66 0.54 151 Koramangala 0.66 1.00 0.44 0.66 0.54 152 Suddagunte Palya 0.66 1.00 0.41 0.62 0.44 153 Jayanagar 0.66 0.68 0.54 0.52 0.44 154 Basavanagudi 0.66 0.68 0.57 0.48 0.44 155 Hanumanth Nagar 0.61 0.68 0.44 0.48 0.44 156 Srinagar 0.61 0.68 0.47 0.48 0.49 157 Gali Anjenaya Temple 0.61 0.68 0.44 0.52 0.44 158 Deepanjali Nagar 0.61 0.68 0.47 0.57 0.44 159 Kengeri 0.61 0.68 0.47 0.52 0.44 160 Rajarajeshwari Nagar 0.55 0.68 0.47 0.48 0.54 161 Hosakerehalli 0.61 0.68 0.47 0.52 0.44 162 Girinagar 0.61 0.68 0.44 0.48 0.44 163 Katriguppe 0.61 0.68 0.47 0.48 0.44 164 Vidyapeeta ward 0.61 0.68 0.57 0.57 0.44 165 Ganesh Mandir 0.61 0.68 0.47 0.52 0.44 166 Karisandra 0.66 0.68 0.47 0.62 0.49 167 Yediyur 0.61 0.68 0.41 0.48 0.44 168 Pattabhiram Nagar 0.66 1.00 0.44 0.66 0.44 169 Byrasandra 0.66 0.68 0.50 0.62 0.44 170 Jayanagar East 0.71 1.00 0.44 0.66 0.44 171 Gurappanapalya 0.66 1.00 0.41 0.57 0.44 172 Madivala 0.61 1.00 0.41 0.57 0.49 173 Jakkasandra 0.61 1.00 0.41 0.57 0.44 174 HSR Layout 0.61 0.81 0.41 0.57 0.49

163
175 Bommanahalli 0.66 0.91 0.44 0.66 0.49 176 BTM Layout 0.66 1.00 0.41 0.57 0.49 177 J P Nagar 0.71 1.00 0.44 0.62 0.49 178 Sarakki 0.66 1.00 0.41 0.62 0.44 179 Shakambari Nagar 0.66 1.00 0.44 0.66 0.49 180 Banashankari Temple 0.66 1.00 0.50 0.66 0.49 181 Kumaraswamy Layout 0.61 1.00 0.41 0.48 0.44 182 Padmanabha Nagar 0.61 0.68 0.41 0.52 0.44 183 Chikkalsandra 0.61 0.68 0.47 0.52 0.44 184 Uttarahalli 0.66 0.68 0.60 0.52 0.44 185 Yelchenahalli 0.71 1.00 0.44 0.66 0.49 186 Jaraganahalli 0.66 1.00 0.41 0.62 0.44 187 Puttenahalli 0.66 0.91 0.41 0.57 0.49 188 Bilekhalli 0.66 0.91 0.41 0.57 0.49 189 Hongasandra 0.66 0.91 0.44 0.62 0.49 190 Mangammanapalya 0.66 0.81 0.44 0.62 0.44 191 Singasandra 0.66 0.81 0.50 0.62 0.44 192 Begur 0.71 0.91 0.60 0.80 0.44 193 Arakere 0.66 0.91 0.47 0.57 0.49 194 Gottigere 0.71 0.91 0.57 0.75 0.44 195 Konankunte 0.66 0.91 0.41 0.57 0.49 196 Anjanapura 0.71 0.91 0.54 0.71 0.44 197 Vasanthpura 0.71 1.00 0.50 0.66 0.49 198 Hemmigepura 0.61 0.68 0.50 0.52 0.54

Appendix 6. House Hold Survey
House Hold Survey
Name : Area /Village: Sex 1- F, 2 -M
Age 1- <16, 2 ->16
Education Occupation 1 – Farmer, 2- Agriculture labour, 3- Business, 4- Daily Wage Labour, 5- Service and 6- Others
Social group 1- General, 2- SC 3- ST, 4-BC/OBC
Religion 1- Hindu, 2- Buddhist 3- Christian and 4- Other
Family income 1-<40K, 2- 40K - 60K, 3- 60K - 80K, and 4- > 80K
No of Households Sex Age Occupation Family Member involved in migration/seasonal Labour 1 2 n
Key aspects and criteria
Aspects Criteria Questions 1 2 3 4 5 Remarks Housing condition
Housing Ownership
Do you own a house? No Yes
House location Where is your house located? slums Near main road Near industry
Village Good residential
area
Overcrowding How many people are staying in one room?
> 3 2 1
Durable structure Housing characteristics/ structure shack Traditional stick house/temporary
Semi permanent structure
Improved house permanent structure
permanent structure

165
Housing facilities
Access to water What is the source of drinking water?
Well/lake Water tanker Piped water Piped water + water purifier
at home
Type of sanitation facility?
What type of toilet you use? No toilet Govt developed public facilities
pit toilet Flush toilet
Bathing facilities? What type of bathing facilities do you have?
Unprotected well and lake
Protected well Street vendors
Piped water in the community/plot
Piped water inside the
house
What is the distance to the nearest water source?
<50m 50-100m 100-500m 500-1000m >1000m
Kitchen Do you have kitchen within the housing unit?
No Yes
Energy for cooking
What is the main source of cooking at your house?
firewood dung Bottled Gas/LPG Electricity
Electricity Do you have electricity connection at you home?
No Coal and paraffin
Electricity connection
Solar and wind
House hold facilities
Mobility Do you have car or two- wheeler? No cycle Scooter Bike Car Networking Do you have telephone or mobile? No Yes Awareness Do you receive the newspaper or
have a television? No Yes
Do you know local schemes, policies and development work?
Material Do you have a refrigerator? No Yes Do you have a washing machine? No Yes Do you have AC? No Yes
Economics structure
Banking facilities Do you have bank or post office account?
No Yes
Do you have access to credit (loan)?
No Yes
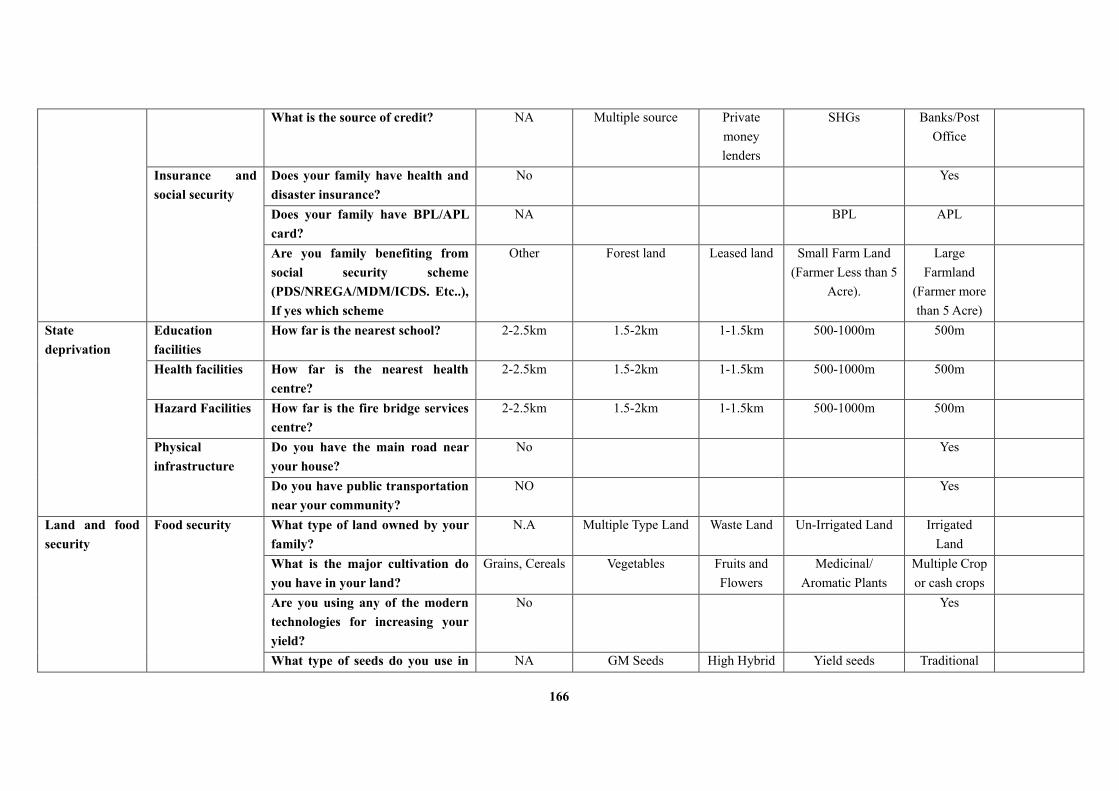
166
What is the source of credit? NA Multiple source Private money lenders
SHGs Banks/Post Office
Insurance and social security
Does your family have health and disaster insurance?
No Yes
Does your family have BPL/APL card?
NA BPL APL
Are you family benefiting from social security scheme (PDS/NREGA/MDM/ICDS. Etc..), If yes which scheme
Other Forest land Leased land Small Farm Land (Farmer Less than 5
Acre).
Large Farmland
(Farmer more than 5 Acre)
State deprivation
Education facilities
How far is the nearest school? 2-2.5km 1.5-2km 1-1.5km 500-1000m 500m
Health facilities How far is the nearest health centre?
2-2.5km 1.5-2km 1-1.5km 500-1000m 500m
Hazard Facilities How far is the fire bridge services centre?
2-2.5km 1.5-2km 1-1.5km 500-1000m 500m
Physical infrastructure
Do you have the main road near your house?
No Yes
Do you have public transportation near your community?
NO Yes
Land and food security
Food security What type of land owned by your family?
N.A Multiple Type Land Waste Land Un-Irrigated Land Irrigated Land
What is the major cultivation do you have in your land?
Grains, Cereals Vegetables Fruits and Flowers
Medicinal/ Aromatic Plants
Multiple Crop or cash crops
Are you using any of the modern technologies for increasing your yield?
No Yes
What type of seeds do you use in NA GM Seeds High Hybrid Yield seeds Traditional

167
your agriculture land
Seeds Seeds
What are the non-farm based activities do you family practice ( LIVESTOCK)
NA Beekeeping and Fishery
Piggery and Poultry
Dairy Multiple
Is any member of the House Hold received any training In agriculture practices?
No Yes
For how many month you have food security?
Less than 3 Months, 6 Months 9 Months 12 Months
Environment and nature
Land use change and
Do you observe any land use change in your surrounding environment?
Major changes Some No change
What are the services you gain from you surrounding environment and nature?
Have you observed any wildlife conflict?
Yes Some time No
Climate Variables
Exposure and impacts
Have you observed change in climate and weather pattern? If yes what?
No Some time Yes
What are the major impacts of climate change?
Seasonal change
Forest fire Drought, flooding and
landslides
Loss of agriculture production
Loss of life and physical
asset
What are the local government organization and communities’ intervention before and post-disaster events?
Key observations: