The Dao of Wikipedia - iris@unitn
198
UNIVERSITÀ DEGLI STUDI DI TRENTO Department Of Information Engineering And Computer Science ICT International Doctoral School CYCLE XXX The Dao of Wikipedia Extracting Knowledge from the Structure of Wikilinks cristian consonni Advisor: Alberto Montresor University of Trento, Trento Co-advisor: Yannis Velegrakis University of Trento, Trento 2019
-
Upload
khangminh22 -
Category
Documents
-
view
2 -
download
0
Transcript of The Dao of Wikipedia - iris@unitn

UNIVERSITÀ DEGLI STUDI DI TRENTO
Department Of Information Engineering And Computer ScienceICT International Doctoral School
CYCLE XXX
The Dao of WikipediaExtracting Knowledge from the Structure of
Wikilinks
cristian consonni
Advisor:Alberto MontresorUniversity of Trento, Trento
Co-advisor:Yannis VelegrakisUniversity of Trento, Trento
2019

Cristian Consonni: The Dao of Wikipedia, Extracting Knowledge fromthe Structure of Wikilinks,
© 2019– Creative Commons Attribution-ShareAlike Licence 4.0 (CCBY-SA 4.0)
The copyright of this thesis rests with the author. Unless otherwise indi-cated, its contents are licensed under a Creative Commons Attribution-ShareAlike 4.0 International (CC BY-SA 4.0).
Under this licence, you may copy and redistribute the material in anymedium or format for both commercial and non-commercial purposes.You may also create and distribute modified versions of the work. Thison the condition that: you credit the author and share any derivativeworks under the same licence.
When reusing or sharing this work, ensure you make the licence termsclear to others by naming the licence and linking to the licence text.Where a work has been adapted, you should indicate that the work hasbeen changed and describe those changes.
Please seek permission from the copyright holder for uses of this workthat are not included in this licence or permitted under Copyright Law.
For more information read the CC BY-SA 4.0 deed. For the full textof the license visit CC BY-SA 4.0 legal code.

A Virginia, per essermi stata vicina.


A B S T R AC T
Wikipedia is a multilingual encyclopedia written collaboratively by vol-unteers online, and it is now the largest, most visited encyclopedia inexistence. Wikipedia has arisen through the self-organized collabora-tion of contributors, and since its launch in January 2001, its potentialas a research resource has become apparent to scientists, its appeal lyingin the fact that it strikes a middle ground between accurate, manuallycreated, limited-coverage resources, and noisy knowledge mined fromthe web. For this reason, Wikipedia’s content has been exploited for avariety of applications: to build knowledge bases, to study interactionsbetween users on the Internet, and to investigate social and culturalissues such as gender bias in history, or the spreading of information.
Similarly to what happened for the Web at large, a structure hasemerged from the collaborative creation of Wikipedia: its articles con-tain hundreds of millions of links. In Wikipedia parlance, these internallinks are called wikilinks. These connections explain the topics beingcovered in articles and provide a way to navigate between differentsubjects, contextualizing the information, and making additional infor-mation available.
In this thesis, we argue that the information contained in the link struc-ture of Wikipedia can be harnessed to gain useful insights by extractingit with dedicated algorithms. More prosaically, in this thesis, we explorethe link structure of Wikipedia with new methods.
In the first part, we discuss in depth the characteristics of Wikipedia,and we describe the process and challenges we have faced to extractthe network of links. Since Wikipedia is available in several languageeditions and its entire edition history is publicly available, we haveextracted the wikilink network at various points in time, and we haveperformed data integration to improve its quality.
In the second part, we show that the wikilink network can be effectivelyused to find the most relevant pages related to an article providedby the user. We introduce a novel algorithm, called CycleRank, thattakes advantage of the link structure of Wikipedia considering cyclesof links, thus giving weight to both incoming and outgoing connections,to produce a ranking of articles with respect to an article chosen bythe user.
In the last part, we explore applications of CycleRank. First, we de-scribe the Engineroom EU project, where we faced the challenge to
v

find which were the most relevant Wikipedia pages connected to theWikipedia article about the Internet. Finally, we present another contri-bution using Wikipedia article accesses to estimate how the informationabout diseases propagates.
In conclusion, with this thesis, we wanted to show that browsing Wi-kipedia’s wikilinks is not only fascinating and serendipitous1, but itis an effective way to extract useful information that is latent in theuser-generated encyclopedia.
1 https://xkcd.com/214/
vi

P U B L I C AT I O N S
This thesis is based on the following papers:
[1] Cristian Consonni, David Laniado, and Alberto Montresor. Wiki-linkgraphs: A complete, longitudinal and multi-language dataset ofthe wikipedia link networks. In Proceedings of the InternationalAAAI Conference on Web and Social Media, volume 13, pages 598–607, 2019.
[2] Cristian Consonni, David Laniado, and Alberto Montresor. Discov-ering Topical Contexts from Links in Wikipedia. 2019.
[3] Cristian Consonni, David Laniado, and Alberto Montresor. Cycle-Rank, or There and Back Again: personalized relevance scores fromcyclic paths on graphs. Submitted to VLDB 2020, 2020.
[4] Paolo Bosetti, Piero Poletti, Cristian Consonni, Bruno Lepri, DavidLazer, Stefano Merler, and Alessandro Vespignani. Disentangling so-cial contagion and media drivers in the emergence of health threatsawareness. Science Advances, 2019. Under review at Science Ad-vances.
This Ph.D. was instrumental to study other topics, which I chose notto include in this manuscript:
[5] Cristian Consonni, Paolo Sottovia, Alberto Montresor, and YannisVelegrakis. Discovering Order Dependencies through Order Com-patibility. In International Conference on Extending Database Tech-nology, 2019.
[6] Riccardo Pasi, Cristian Consonni, and Maurizio Napolitano. OpenCommunity Data & Official Public Data in flood risk management:a comparison based on InaSAFE. In FOSS4G-Europe 2015, the2nd European Conference for for Free and Open Source Softwarefor Geospatial, 2015.
[7] Marco Cè, Cristian Consonni, Georg P. Engel, and Leonardo Giusti.Non-Gaussianities in the topological charge distribution of theSU(3) Yang-Mills theory. Physical Review D, 92(7):074502, 2015.
vii


C O N T E N T S
1 introduction 1
i graphs from wikipedia 52 wikilinkgraphs: a complete, longitudinal
and multi-language dataset of the wikipedialink networks 72.1 The WikiLinkGraphs Dataset . . . . . . . . . . . . . . 10
2.1.1 Data Processing . . . . . . . . . . . . . . . . . . 102.1.2 Dataset Description . . . . . . . . . . . . . . . . 15
2.2 Analysis and Use Cases . . . . . . . . . . . . . . . . . . 202.2.1 Comparison with Wikimedia’s pagelinks Data-
base Dump. . . . . . . . . . . . . . . . . . . . . . 212.2.2 Cross-language Comparison of Pagerank Scores . 22
2.3 Research Opportunities using the WikiLinkGraphsDataset . . . . . . . . . . . . . . . . . . . . . . . . . . . 252.3.1 Graph Streaming. . . . . . . . . . . . . . . . . . 252.3.2 Link Recommendation. . . . . . . . . . . . . . . 252.3.3 Link Addition and Link Removal. . . . . . . . . . 252.3.4 Anomaly Detection. . . . . . . . . . . . . . . . . 262.3.5 Controversy mapping. . . . . . . . . . . . . . . . 262.3.6 Cross-cultural studies. . . . . . . . . . . . . . . . 26
2.4 Conclusions . . . . . . . . . . . . . . . . . . . . . . . . . 27
ii relevance on a graph 293 cyclerank, or there and back again: person-
alized relevance scores from cyclic paths ondirected graphs 313.1 Problem Statement . . . . . . . . . . . . . . . . . . . . . 323.2 Background . . . . . . . . . . . . . . . . . . . . . . . . . 333.3 Related Work . . . . . . . . . . . . . . . . . . . . . . . . 343.4 The CycleRank Algorithm . . . . . . . . . . . . . . . . . 36
3.4.1 Preliminary filtering . . . . . . . . . . . . . . . . 373.4.2 Cycle enumeration . . . . . . . . . . . . . . . . . 393.4.3 Score computation . . . . . . . . . . . . . . . . . 40
3.5 Experimental Evaluation . . . . . . . . . . . . . . . . . . 423.5.1 Dataset Description . . . . . . . . . . . . . . . . 423.5.2 Alternative Approaches . . . . . . . . . . . . . . 433.5.3 Implementation and Reproducibility . . . . . . . 463.5.4 Qualitative Comparison . . . . . . . . . . . . . . 483.5.5 Quantitative Comparison . . . . . . . . . . . . . 573.5.6 Performance Analysis . . . . . . . . . . . . . . . 68
ix

3.6 Conclusions . . . . . . . . . . . . . . . . . . . . . . . . . 69
iii applications 734 next generation internet - engineroom 75
4.1 Keyword Selection . . . . . . . . . . . . . . . . . . . . . 764.2 Cross-language keyword mapping . . . . . . . . . . . . . 774.3 Network visualization . . . . . . . . . . . . . . . . . . . 794.4 Internet governance . . . . . . . . . . . . . . . . . . . . . 80
4.4.1 Longitudinal analysis . . . . . . . . . . . . . . . . 814.4.2 Cross-language analysis . . . . . . . . . . . . . . 81
4.5 Conclusions . . . . . . . . . . . . . . . . . . . . . . . . . 825 disentangling social contagion and media
drivers in the emergence of health threatsawareness 875.1 Results and Discussion . . . . . . . . . . . . . . . . . . . 895.2 Conclusions . . . . . . . . . . . . . . . . . . . . . . . . . 935.3 Material and Methods . . . . . . . . . . . . . . . . . . . 955.4 Tables and figures . . . . . . . . . . . . . . . . . . . . . 98
6 conclusions 103
iv appendix 107a the engineroom eu project 109
a.1 Algorithmic bias . . . . . . . . . . . . . . . . . . . . . . 109a.2 Cyberbullying . . . . . . . . . . . . . . . . . . . . . . . . 110
a.2.1 Longitudinal analysis . . . . . . . . . . . . . . . . 111a.2.2 Cross-language analysis . . . . . . . . . . . . . . 112
a.3 Computer security . . . . . . . . . . . . . . . . . . . . . 116a.3.1 Longitudinal analysis . . . . . . . . . . . . . . . . 116a.3.2 Cross-language analysis . . . . . . . . . . . . . . 117
a.4 Green computing . . . . . . . . . . . . . . . . . . . . . . 121a.4.1 Longitudinal analysis . . . . . . . . . . . . . . . . 121a.4.2 Cross-language analysis . . . . . . . . . . . . . . 122
a.5 Internet privacy . . . . . . . . . . . . . . . . . . . . . . . 123a.5.1 Longitudinal analysis . . . . . . . . . . . . . . . . 124a.5.2 Cross-language analysis . . . . . . . . . . . . . . 128
a.6 Net neutrality . . . . . . . . . . . . . . . . . . . . . . . . 128a.6.1 Longitudinal analysis . . . . . . . . . . . . . . . . 132a.6.2 Cross-language analysis . . . . . . . . . . . . . . 133
a.7 Online identity . . . . . . . . . . . . . . . . . . . . . . . 134a.7.1 Longitudinal analysis . . . . . . . . . . . . . . . . 138a.7.2 Cross-language analysis . . . . . . . . . . . . . . 138
a.8 Open-source model . . . . . . . . . . . . . . . . . . . . . 139a.8.1 Longitudinal analysis . . . . . . . . . . . . . . . . 144a.8.2 Cross-language analysis . . . . . . . . . . . . . . 144
a.9 Right to be forgotten . . . . . . . . . . . . . . . . . . . . 145a.9.1 Longitudinal analysis . . . . . . . . . . . . . . . . 149a.9.2 Cross-language analysis . . . . . . . . . . . . . . 149
x

a.10 General Data Protection Regulation (GDPR) . . . . . . 149a.10.1 Longitudinal analysis . . . . . . . . . . . . . . . . 152a.10.2 Cross-language analysis . . . . . . . . . . . . . . 153
bibliography 175
xi


1I N T RO D U C T I O N
At a first look, the brain, a knowledge base, and the Garden of Eden donot seem to have anything in common. However, it can be argued thatin all these metaphorical places, knowledge is encoded in the structureof a graph. A graph is a structure composed by a set of objects inwhich some pairs of objects possess some given property. The objectscorrespond to abstractions called nodes, vertices or points; and each ofthe related pairs of vertices is called an edge, arc, or line.
For the brain, the concept of neural network is well-known since the lateXIXth century, and it is used as a practical tool in computer sciencesince the 1980’s [5]. In this model, individual neurons are the nodes ofthe graph, and the synapses are the edges. In this context, the abilityof the brain of modifying the connections between neurons, called neu-roplasticity, offers the insight that the structure of the connections ina graph are fundamental for the encoding of knowledge in the graphstructure.
A knowledge base is a technology used to store information. Followingthe Resource Description Framework (RDF) paradigm, a knowledgebase is a collection of statements of the form subject—predicate—object,also known as triples. Nodes are resources in the knowledge base - eithersubjects or objects - while edges encode the predicates.
Finally, in the Garden of Eden, the idea is literally present in the formof Tree of the knowledge of good and evil, besides the fascination of thefact that a tree is, in fact, a special and simple type of graph, moreprofoundly the Tree can be described as an axis mundi, is that is thepoint of connection between the divine and the mortals.
The idea that knowledge is contained or encoded in the relations amongentities, or in paths connecting nodes, is very ancient as well. In the Chi-nese tradition of Taoism, the Tao or Dao - literally the “way”, “path”,“route”, or “road” - encodes the natural order of the universe whosecharacter one0s human intuition must discern in order to realize thepotential for individual wisdom. This intuitive knowing of life cannotbe grasped as a concept; it is known through actual living experienceof one’s everyday being. In Buddhism, the Noble Eightfold Path is aof Buddhist practices leading to nirvana and the liberation from fromsuffering and ignorance.
1

In this thesis, we start from the grand idea that paths in graphs encodesome knowledge about the entities they connect and we present analgorithm that we have devised to highlight these emergent truths. Inparticular, we will use Wikipedia, the collaborative, web-based, freeencyclopedia as a general network of concept and we will show that itis possible to extract new knowledge from this graph using dedicatedalgorithms.
In the following, we will briefly introduce the main subjects of ourinvestigation namely: graphs and Wikipedia. We will also focus on thePagerank algorithm [6] as a prime example of an algorithm that canextract knowledge, in particular in the form of scores, from the pathsin a graph.
Graphs are fundamental structures that can capture many real-worldphenomena. Graphs, also called networks, offer the foundation for mod-eling a variety of situations in diverse domains such as describing re-lations among individuals in social networks, organizational networks,semantic relations among concepts in knowledge bases, food webs andmany others. The opportunity to investigate these domains is relatedto the availability of data.
Several trends in the last decade have contributed new sources of datain digital form: Web 2.0 and user-generated content, social media and,more recently, Big Data and the Internet of Things (IoT). Data gen-erated by users - e.g. in Wikipedia and in online social networks - areusually augmented by the availability of metadata that are created com-pletely automatically by sensors or without user interaction, such as thestream of the web pages visited by a user. These data present challengesrelated to their volume, the size of the datasets; velocity, the frequencyof update; and variety, the diversity of their sources and scope. Thisphenomenon has been called the data deluge [7, 8]. To respond to thisnew context, computer scientists have developed new tools specificallydesigned to manage these new datasets.
Heterogeneous information networks are ubiquitous and form a criticalcomponent of modern information infrastructure. Despite their preva-lence in our world, researchers have only recently recognized the im-portance of studying information networks as a whole. Hidden in thesenetworks are the answers to important questions. For example, is therea collaborated plot behind a network intrusion, and how can a sourcein communication networks be identified? How can a company derive acomplete view of its products at the retail level from interlinked socialcommunities? These questions are highly relevant to a new class of ana-lytical applications that query and mine massive information networksfor pattern and knowledge discovery, data and information integration,veracity analysis and deep understanding of the principles of informa-tion networks.
2

From the beginning of the years 2000’s graphs have been extensivelyemployed to tackle new problems and explore new opportunities thatrequire the ability to process massive graphs. In this context manymodern applications use graphs as a data structure to provide ser-vices such as suggesting friends on social networks, answer queries onknowledge bases or modeling biological phenomena such as gene co-activations. Since they describe real-world phenomena, these systemsand the graphs that model them can change over time.
Searching for information and knowledge inside networks, particularlylarge networks with thousands of nodes is a complex and time-consuming task. Unfortunately, the lack of a general analytical andaccess platform makes sensible navigation and human comprehensionvirtually impossible in large-scale networks. Fortunately, informationnetworks contains massive nodes and links associated with variouskinds of information. Knowledge about such networks is often hiddenin massive links in heterogeneous information networks but can beuncovered by the development of sophisticated knowledge discoverymechanisms.
3


Part I
G R A P H S F RO M W I K I P E D I A
Wikipedia articles contain multiple links connecting a sub-ject to other pages of the encyclopedia. In Wikipedia par-lance, these links are called internal links or wikilinks. Wepresent a complete dataset of the network of internal Wiki-pedia links for the 9 largest language editions. The datasetcontains yearly snapshots of the network and spans 17 years,from the creation of Wikipedia in 2001 to March 1st, 2018.While previous work has mostly focused on the completehyperlink graph which includes also links automatically gen-erated by templates, we parsed each revision of each articleto track links appearing in the main text. In this way we ob-tained a cleaner network, discarding more than half of thelinks and representing all and only the links intentionallyadded by editors. We describe in detail how the Wikipediadumps have been processed and the challenges we have en-countered, including the need to handle special pages suchas redirects, i.e., alternative article titles. We present de-scriptive statistics of several snapshots of this network. Fi-nally, we propose several research opportunities that can beexplored using this new dataset.


2W I K I L I N KG R A P H S : A C O M P L E T E ,L O N G I T U D I N A L A N DM U LT I - L A N G U AG E DATA S E T O FT H E W I K I P E D I A L I N KN E T WO R K S
Wikipedia1 is probably the largest existing information repository,built by thousands of volunteers who edit its articles from all aroundthe globe. As of March 2019, it is the fifth most visited website inthe world [9]. Almost 300k active users per month contribute to theproject [10], and more than 2.5 billion edits have been made. TheEnglish version alone has more than 5.7 million articles and 46 millionpages and is edited on average by more than 128k active users everymonth [11]. Wikipedia is usually a top search-result from searchengines [12] and research has shown that it is a first-stop source forinformation of all kinds, including information about science [13, 14],and medicine [15].
The value of Wikipedia does not only reside in its articles as separatedpieces of knowledge, but also in the links between them, which representconnections between concepts and result in a huge conceptual network.According to Wikipedia policies2 [16], when a concept is relevant withinan article, the article should include a link to the page correspondingto such concept [17]. Therefore, the network between articles may beseen as a giant mind map, emerging from the links established by thecommunity. Such graph is not static but is continuously growing andevolving, reflecting the endless collaborative process behind it.
The English Wikipedia includes over 163 million connections betweenits articles. This huge graph has been exploited for many purposes,from natural language processing [18] to artificial intelligence [19], fromSemantic Web technologies and knowledge bases [20] to complex net-works [21], from controversy mapping [22] to human way-finding ininformation networks [23].
1 https://www.wikipedia.org2 In what follows, we will refer to the policies in force on the English-language editionof Wikipedia; we will point out differences with local policies whenever they arerelevant.
7

This paper presents a new dataset, WikiLinkGraphs, that makes thenetworks of internal links in the nine largest editions of Wikipedia avail-able to researchers and editors, opening new opportunities for research.
Most previous work on the Wikipedia link graph relies on wikilinkdata made accessible through the Wikipedia API3 and through data-base dumps4 These data include also all transcluded links, i.e. linksautomatically generated by templates defined in another page; tem-plates typically add all possible links within a given group of articles,producing big cliques and inflating the density of connections.
Inserting a template in Wikipedia merely amounts to writing a smallsnippet of code, which in the final article is rendered as a collectionof links. Figure 1 shows a rendering of the navigation template{{Computer science}}5 from English Wikipedia, which producesa table with 146 links to other articles within the encyclopedia.Navigation templates are very general by design serve to group linksto multiple related articles. They are not specific to a given page: infact, the content of a template can be changed independently fromediting the pages where it is included.
We argue that considering only the links explicitly added by editors inthe text of the articles may provide a more trustful representation ofsemantic relations between concepts, and result in a cleaner graph byavoiding the cliques and other potential anomalous patterns generatedby transcluded links.
The aim of this work is to build a dataset of the graph of the specificlink between Wikipedia articles added by the editors. The WikiLink-Graphs dataset was created by parsing each article to extract its links,leaving only the links intentionally added by editors; in this way, we dis-carded over half of the overall links appearing in the rendered versionof the Wikipedia page.
Furthermore, we tracked the complete history of each article and ofeach link within it, and generated a dynamic graph representing theevolution of the network. Whilst the dataset we are presenting in thispaper consists of yearly snapshots, we have generated several support-ing dataset as well, such as a large collection tracking the timestampin which each occurrence of a link was created or removed.
Redirects, i.e. special pages representing an alternative title for an ar-ticle, are a known issue that was shown to affect previous research [24].In our dataset, we tracked the redirects over time, and resolved all ofthem according to the corresponding timestamp. The complete historyof all redirects is made available as well.
3 Hyperlinks in the current version of Wikipedia are available through the "Link"property in the Wikipedia API: https://www.mediawiki.org/wiki/API
4 https://meta.wikimedia.org/wiki/Data_dumps5 https://en.wikipedia.org/wiki/Template:Computer_science
8

Figu
re1:
Apo
rtionof
thena
vigatio
naltem
plate
{{Co
mput
ersc
ienc
e}}from
English
Wikipedia
asof
revisio
nno
878025472of
12Ja
nuary2019,1
4:12.
The
dashed
lineindicatesthat
apo
rtionof
templateha
sbe
enstrip
pedforreason
sof
space.
9

The code used to generate the dataset is also entirely made availableon GitHub, so that anybody can replicate the process and compute thewikilink graphs for other language editions and for future versions ofWikipedia.
2.1 the wikilinkgraphs dataset
This section describes how we processed the Wikipedia dumps of thecomplete edit history to obtain the dataset.
2.1.1 data processing
The WikiLinkGraphs dataset was created from the full Wikipediarevision history data dumps of March 1, 20186, as published by theWikimedia Foundation, and hence includes all entire months from Jan-uary 2001 to February 2018.
These XML dumps contain the full content of each Wikipedia pagefor a given language edition, including encyclopedia articles, talk pagesand help pages. Pages are divided in different namespaces, that canbe recognized by the prefix appearing in the title of the page. Theencyclopedia articles are in the main namespace, also called namespace0 or ns0. The content of the pages in Wikipedia is formatted withWikitext [25], a simplified syntax that is then rendered as HTML bythe MediaWiki software7. For each edit a new revision is created: thedump contains all revisions for all pages that were not deleted.
Table 1 presents the compressed sizes for the XML dumps that havebeen downloaded and the number of pages and revisions that havebeen processed. We extracted all the article pages. This resulted in40M articles being analyzed. In total, more than 1B revisions havebeen processed to produce the WikiLinkGraphs dataset.
2.1.1.1 Link Extraction
Wikipedia articles have revisions, which represent versions of the Wiki-text of the article at a specific time. Each modification of the page
6 All files under "All pages with complete edit history (.7z)" at https://dumps.wikimedia.org/enwiki/20180301/. Wikipedia dumps are available up to 3 monthsprior to the current date, so those specific dumps are not available anymore. How-ever, any dump contains the whole Wikipedia history dating from 2001 onwards. Soour results can be replicated with any dump taken later than March 1st, 2018.
7 https://www.mediawiki.org
10

lang size(GB) files pages revisions
de 33.0 109 3,601,030 113,836,228en 138.0 520 13,750,758 543,746,894es 27.0 68 3,064,393 77,498,219fr 26.0 95 3,445,121 99,434,840it† 91.0 61 2,141,524 68,567,721nl 7.4 34 2,627,328 38,226,053pl 15.0 34 1,685,796 38,906,341ru 24.0 56 3,362,946 63,974,775sv 9.0 1 6,139,194 35,035,976
Table 1: Statistics about the processed Wikipedia dumps: size of thedowloaded files and number of processed pages and revisions for eachdump. (†) the Italian Wikipedia dumps were downloaded in .bz2 for-mat.
(an edit in Wikipedia parlance) generates a new revision. Edits can bemade by anonymous or registered users.
A revision contains the wikitext of the article, which can have sections,i.e. header titles. Sections are internally numbered by the MediaWikisoftware from 0, the incipit section, onwards. As for HTML headers,several section levels are available (sections, subsections, etc.); sectionnumbering does not distinguish between the different levels.
While a new visual, WYSIWYG editor has been made available in mostWikipedia editions starting since June 2013 [26], the text of Wikipediapages is saved as Wikitext. In this simplified markup language, inter-nal Wikipedia links have the following format [[title|anchor]]; forexample,
[[New York City|The Big Apple]]
This wikitext is visualized as the words The Big Apple that gets trans-lated into HTML as:
<a href="/wiki/New_York_City"title="New York City">The Big Apple</a>
pointing to the Wikipedia article New York City. If the page exists,as in this example, the link will be blue-colored, otherwise it will becolored in red, indicating that the linked-to page does not exist [27].The anchor is optional and, if it was omitted, then the page title, inthis case New York City, would have been visualized.
11

For each revision of each page in the Wikipedia dump, we used thefollowing regular expression in Python8 to extract wilinks:
1 \[\[2 (?P<link>3 [^\n\|\]\[\<\>\{\}]{0,256}4 )5 (?:6 \|7 (?P<anchor>8 [^\[]*?9 )
10 )?11 \]\]
Line 1 matches two open brackets; then, Lines 2–4 capture the followingcharacters in a named group called link. Lines 5–10 match the optionalanchor: Line 5 matches a pipe character, then Lines 6–8 match non-greedily any valid character for an anchor saving them in a namedgroup called anchor. Finally, Line 10 matches two closed brackets. Thecase of links pointing to a section of the article is handled a posteriori,after the regular expression has captured its contents. When linking toa section, the link text will contain a pound sign (#); given that thissymbol is not allowed in page titles, we can separate the title of thelinked page from the section.
The RawWikilinks Dataset.
The link extraction process produces a dataset with the following in-formation:
• page_id: an integer, the page identifier used by MediaWiki. Thisidentifier is not necessarily progressive, there may be gaps in theenumeration;
• page_title: a string, the title of the Wikipedia article;
• revision_id: an integer, the identifier of a revision of the article,also called a permanent id, because it can be used to link to thatspecific revision of a Wikipedia article;
• revision_parent_id: an integer, the identifier of the parent re-vision. In general, each revision as a unique parent; going backin time before 2002, however, we can see that the oldest arti-cles present non-linear edit histories. This is a consequence ofthe import process from the software previously used to powerWikipedia, MoinMoin, to MediaWiki;
8 https://github.com/WikiLinkGraphs/wikidump/blob/70b0c7f929fa9d66a220caf11c9e31691543d73f/wikidump/extractors/misc.py#L203
12

• revision_timestamp: date and time of the edit that generatedthe revision under consideration;
• user_type: a string ("registered" or "anonymous"), specifyingwhether the user making the revision was logged-in or not;
• user_username: a string, the username of the user that made theedit that generated the revision under consideration;
• user_id: an integer, the identifier of the user that made the editthat generated the revision under consideration;
• revision_minor: a boolean flag, with value 1 if the edit thatgenerated the current revision was marked as minor by the user,0 otherwise;
• wikilink.link: a string, the page linked by thewikilink;
• wikilink.tosection: a string, the name of the section if the linkpoints to a section;
• wikilink.anchor: a string, the anchor text of the wikilink;
• wikilink.section_name: the name of the section wherein thewikilink appears;
• wikilink.section_level: the level of the section wherein thewikilink appears;
• wikilink.section_number: the number of the section whereinthe wikilink appears.
2.1.1.2 Redirects and Link Resolution
A redirect in MediaWiki is a page that automatically sends users toanother page. For example, when clicking on a wikilink[[NYC]], theuser is taken to the article New York City with a note at the top ofthe page saying: "(Redirected from NYC)". The page NYC 9 containsspecial Wikitext: #REDIRECT [[New York City]]which defines it as aredirect page and indicates the target article. It is also possible to redi-rect to a specific section of the target page. Different language editionsof Wikipedia use different words10, which are listed in Table 2.
In general, a redirect page can point to another redirect page creatinga chain of multiple redirects11. These pages should only be temporary
9 https://en.wikipedia.org/w/index.php?title=NYC&redirect=no10 https://github.com/WikiLinkGraphs/wikidump/blob/70b0c7f929fa9d66a220caf11c9e31691543d73f/
wikidump/extractors/redirect.py#L1411 For example, a live list of pages creating chains of redirect on English Wikipedia is
available at https://en.wikipedia.org/wiki/Special:DoubleRedirects.
13

lang words
de #WEITERLEITUNG
en #REDIRECT
es #REDIRECCIÓN, #REDIRECCION
fr #REDIRECTION
it #RINVIA, #RINVIO, #RIMANDO
nl #DOORVERWIJZING
pl #PATRZ, #PRZEKIERUJ, #TAM
ru‡ #Perenapravlenie, #perenapr
sv #OMDIRIGERING
Table 2: Words creating a redirect in MediaWiki for different languages.#REDIRECT is valid on all languages. (‡) For Russian Wikipedia, wepresent the transliterated words.
and they are actively eliminated by Wikipedia volunteers manually andusing automatic scripts.
Despite the name, redirects are served as regular pages by the Medi-aWiki software so requesting a redirect page, for example by visitingthe link https://en.wikipedia.org/wiki/NYC, returns an HTTP statuscode of 200.
2.1.1.3 Resolving Redirects
We have extracted one snapshot per year on March, 1st from theRawWikilinks dataset. The creation of a snapshot for a given yearentails the following process:
1. we list all revisions with their timestamps from the dumps;
2. we filter the list of revisions keeping only those that existed onMarch 1st, i.e. the last revision for each page created before March1st;
3. we resolve the redirects by comparing each page with the list ofredirects obtained as described above;
At the end of this process, we obtain a list of the pages that existedin Wikipedia on March, 1st of each year, together with their target, ifthey are redirects. We call this dataset ResolvedRedirects.
It should be noted that even if we resolve redirects, we do not eliminatethe corresponding pages: in fact, redirects are still valid pages belongingto the namespace 0 and thus they still appear in our snapshots as nodeswith one outgoing link, and no incoming links.
14
2.1.1.4 Link Snapshots
We then process the RawWikilinks dataset and we are able, for eachrevision of each page, to establish whether a wikilink in a page waspointing to an existing page or not. We add this characteristics to theRawWikilinks dataset in the field wikilink.is_active: a booleanrepresenting whether the page pointed to by the link was existing inthat moment or not. Revisions are then filtered so to obtain the lists oflinks existing in each page at the moment of interest; we call this newdataset WikiLinkSnapshots.
2.1.1.5 Graph Snapshots (WikiLinkGraphs)
Armed with the WikiLinkSnapshots and the ResolvedRedirectsdataset we can extract the WikiLinkGraphs as a list of records withthe following fields:
• page_id_from: an integer, the identifier of the source article.
• page_title_from: a string, the title of the source article;
• page_id_to: an integer, the identifier of the target article;
• page_title_to: a string, the title of the target article;
If a page contains a link to the same page multiple times, this wouldappear as multiple rows in the WikiLinkSnapshots dataset. Whentransforming this data to graph format we eliminate these multipleoccurrences, because we are only interested in the fact that the twopages are linked. Wikipedia policies about linking [16] state that ingeneral a link should appear only once in an article and discouragecontributors to put multiple links to the same destination. One clearexample is the page New York City where, for example, the expression“United States” is used to link to the corresponding article only once,at the first occurrence. For these reasons, we do not think it is justifiedto assign any special meaning to the fact that two page have multipledirect connections between them.
Figure 2 summarizes the steps followed to produce the WikiLink-Graphs from the Wikipedia dumps with the intermediate datasetsproduced.
2.1.2 dataset description
The WikiLinkGraphs dataset comprises data from 9 Wikipedia lan-guage editions: German (de), English (en), Spanish (es), French (fr),Italian (it), Dutch (nl), Polish (pl), Russian (ru), and Swedish (sv).
15

Figure2:T
heprocess
toproduce
theW
ikiLinkGraphs
datasetfrom
theW
ikipediadum
ps.Inbold
anditalics
thenam
eofthe
intermediate
datasetsproduced.
16

date
deen
esfr
it
NE
NE
NE
NE
NE
2001-03-01
00
3731
00
00
00
2002-03-01
900
1,913
27,654
223,705
1,230
2,664
5553
00
2003-03-01
14,545
126,711
118,946
1,318,655
2,786
13,988
6,694
58,027
1,036
9,695
2004-03-01
63,739
794,561
248,193
3,170,614
17,075
162,219
28,798
338,108
6,466
97,721
2005-03-01
244,110
3,659,389
624,287
8,505,195
43,114
457,032
96,676
1,238,756
32,834
355,197
2006-03-01
474,553
7,785,292
1,342,642
18,847,709
112,388
1,351,111
283,831
3,926,485
149,935
1,434,869
2007-03-01
775,104
11,946,193
2,425,283
34,219,970
253,569
3,327,609
555,471
7,900,561
302,276
3,960,767
2008-03-01
1,063,222
15,598,850
3,676,126
50,270,571
452,333
6,292,452
1,113,622
12,546,302
507,465
7,239,521
2009-03-01
1,335,157
19,607,930
4,848,297
61,318,980
762,234
9,504,039
1,369,619
16,546,043
693,445
10,713,417
2010-03-01
1,603,256
23,834,140
5,937,618
71,024,045
1,159,567
12,844,652
1,632,118
21,064,666
877,089
14,120,469
2011-03-01
1,879,381
28,457,497
7,027,853
82,944,163
1,693,815
17,454,997
1,890,614
25,704,865
1,043,648
17,496,901
2012-03-01
2,163,719
33,036,436
7,922,426
93,924,479
1,944,529
21,167,388
2,137,209
30,422,158
1,213,961
21,069,750
2013-03-01
2,461,158
37,861,651
8,837,308
105,052,706
2,198,429
24,314,571
2,369,365
34,791,331
1,377,144
24,694,404
2014-03-01
2,712,984
42,153,240
9,719,211
116,317,952
2,409,026
27,090,659
2,594,282
39,257,288
1,511,827
26,821,204
2015-03-01
2,933,459
46,574,886
10,568,011
127,653,091
2,561,516
29,529,035
2,809,572
43,831,574
1,643,387
29,867,490
2016-03-01
3,155,927
50,904,750
11,453,255
139,194,105
2,728,713
32,633,513
3,037,908
48,659,900
1,802,952
32,521,188
2017-03-01
3,372,406
55,184,610
12,420,400
150,743,638
2,881,220
35,546,330
3,239,160
53,126,118
1,917,410
35,158,350
2018-03-01
3,588,883
59,535,864
13,685,337
163,380,007
3,034,113
38,348,163
3,443,206
57,823,305
2,117,022
37,814,105
Table3:
Num
berof
nodesN
andedgesE
foreach
grap
hsnap
shot
ofW
ikiL
inkG
raph
sda
tasetob
tained
fortheEn
glish
(en),G
erman
(de),S
panish
(es),F
rench(fr),a
ndItalian(it
)W
ikipedia
edition
s.
17

datenl
plru
sv
NE
NE
NE
NE
2001-03-010
00
00
00
02002-03-01
368728
6981,478
00
122184
2003-03-015,182
41,8758,799
68,720108
2396,708
33,4732004-03-01
23,059225,429
24,356299,583
1,6003,927
22,218171,486
2005-03-0162,601
669,17361,378
779,84311,158
63,44066,673
651,6712006-03-01
169,1931,850,260
234,5062,218,720
64,359422,903
163,9881,605,526
2007-03-01338,354
3,746,141395,723
4,575,510246,494
1,849,540269,599
2,627,9012008-03-01
523,9856,037,117
546,2367,151,435
459,8633,762,487
370,5693,746,860
2009-03-01667,311
7,900,852690,887
9,663,964703,316
6,395,215452,132
4,841,8612010-03-01
764,2779,467,588
822,86811,776,724
962,6809,881,672
542,9005,856,848
2011-03-01879,062
11,120,219953,620
13,959,4311,295,284
13,955,827712,129
6,922,1002012-03-01
1,358,16214,255,313
1,091,81615,813,952
1,562,82117,882,908
800,7767,945,812
2013-03-011,550,027
16,241,2601,208,355
17,405,3071,862,035
21,724,3801,424,006
16,812,4472014-03-01
2,332,47719,940,218
1,322,70119,244,972
2,098,07125,100,193
2,422,97226,497,619
2015-03-012,424,624
21,638,9601,414,645
20,838,5082,350,262
28,242,8783,218,352
33,025,2192016-03-01
2,500,88023,252,874
1,513,23922,445,122
2,782,15531,467,831
4,470,34538,864,469
2017-03-012,569,547
24,691,5721,597,694
24,238,5293,094,419
34,441,6036,062,996
51,975,1152018-03-01
2,626,52725,834,057
1,684,60625,901,789
3,360,53137,394,229
6,131,73652,426,633
Table4:N
umber
ofnodesN
andedges
Efor
eachgraph
snapshotof
WikiLinkG
raphsdataset
obtainedfor
theDutch
(nl),Polish(pl),R
ussian(ru),
andSw
edish(sv)
Wikipedia
editions.
18

These editions are the top-9 largest editions per number of articles,which also had more than 1, 000 active users [10]. We excluded Ce-buano Wikipedia, because notwithstanding being at the moment thesecond-largest Wikipedia, its disproportionate growth with respect tothe number of its active users has recently been fueled by massive au-tomatic imports of articles. For fairness, we note that also the growthof Swedish Wikipedia has been led in part by automatic imports ofdata [10], but we have decided to keep it in given it has a reasonablylarge active user-base.
The WikiLinkGraphs dataset comprises 172 files for a total of 142GB; the average size is 244 MB and the largest file is 2.4 GB. Foreach of the 9 languages, 18 files are available with the snapshots of thewikilink graph taken on March, 1st from 2001 to 2018. As specified inSection 2.1.1.5, these are CSV files that are later compressed in thestandard gzip format. The remaining 10 files contain the hash-sums toverify the integrity of files and a README.
2.1.2.1 Where to Find the WikiLinkGraphs Dataset and Its Sup-porting Material
The WikiLinkGraphs dataset is published on Zenodo at https://zenodo.org/record/2539424 and can be referenced with the DOInumber 10.5281/zenodo.2539424. All other supporing datasetsare available at https://cricca.disi.unitn.it/datasets/. The codeused for data processing has been written in Python 3 and itis available on GitHub under the WikiLinkGraph organizationhttps://github.com/WikiLinkGraphs.
All the datasets presented in this paper are released under the CreativeCommons - Attribution - 4.0 International (CC-NY 4.0) license12; thecode is released under the GNU General Public License version 3 orlater13.
2.1.2.2 Basic statistics
Tables 3 and 4 present the number of nodes (N) and edges (E) foreach snapshot included in the WikiLinkGraphs dataset. The numberof nodes is much larger that the number of “content articles” presentedin the main pages of each Wikipedia version. For reference, in March,2018 English Wikipedia had 5.6M articles [28], however in our snapshotthere are more than 13.6M nodes. This is due to the fact that we haveleft in the graph redirected nodes, as described above, whilst we haveresolved the links pointing to them; redirects remain as orphan nodes
12 https://creativecommons.org/licenses/by/4.0/13 https://www.gnu.org/licenses/gpl-3.0.en.html
19

in the network, receiving no links from other nodes, and having oneoutgoing link.
Figure 3 shows a plot of the growth over time of the number of linksin the WikiLinkGraphs of each language we have processed. Theplot is drawn in linear scale to give a better sense of the relative abso-lute proportions among the different languages. After the first years alllanguage editions exhibit a mostly stable growth pattern with the ex-ception of Swedish, that experienced anomalous growth peaks probablydue to massive bot activity.
2001
-03-
01
2002
-03-
01
2003
-03-
01
2004
-03-
01
2005
-03-
01
2006
-03-
01
2007
-03-
01
2008
-03-
01
2009
-03-
01
2010
-03-
01
2011
-03-
01
2012
-03-
01
2013
-03-
01
2014
-03-
01
2015
-03-
01
2016
-03-
01
2017
-03-
01
2018
-03-
01
0.0
0.2
0.4
0.6
0.8
1.0
1.2
1.4
1.6
×108 Number of links for each snapshot
Language
de
en
es
fr
it
nl
pl
ru
sv
Figure 3: Overview of the growth over time of the number of links in eachsnapshot in the WikiLinkGraphs dataset.
2.2 analysis and use cases
In this Section we analyse the WikiLinkGraphs dataset to providesome useful insights in the data that will help to demonstrate the op-portunities opened by this new dataset.
20

2.2.1 comparison with wikimedia’s pagelinksdatabase dump.
To start, we compare our dataset with an existing one provided by theWikimedia Foundation: the pagelinks table dump.14 This table tracksall the internal links in a wiki [29], whether they are links in non-articlespages, link pages across different namespaces, or if they are transcludedin a page with a template15. The table presents information about thesource page identifier and namespace, and the linked-to article title andnamespace. There are no duplicates of the same combination of sourcepage id, source page namespace and target title. For this reason, onlydistinct links in a page are recorded in the table. When updating thistable, MediaWiki does not check if the target page exists or not.
lang pagelinks all pagelinks ns0 WLG
de 156,770,699 106,488,110 59,535,864en 1,117,233,757 476,959,671 163,380,007es 88,895,487 51,579,346 38,348,163fr 270,129,151 144,469,298 57,823,305it 187,013,995 118,435,117 37,814,105nl 88,996,775 66,606,188 25,834,057pl 131,890,972 79,809,667 25,901,789ru 152,819,755 108,919,722 37,394,229sv 133,447,975 111,129,467 52,426,633
Table 5: Comparison of the number of links between articles in the ns0as they result from Wikimedia’s pagelinks database table dump(pagelinks ns0) and from the WikiLinkGraphs dataset (WLG).The total number of rows, counting links between other namespacesis given in (pagelinks all).
Table 5 present a comparison of the number of links extracted from thepagelinks table and the WikiLinkGraphs.
Links in WikiLinkGraphs are much less because links transcludedfrom templates are not considered. Given the specific research question
14 For the latest versions of the database dumps, all Wikipedia hyperlinks are availablein the "pagelinks" files at https://dumps.wikimedia.org/.
15 We take the occasion to point out that throughout this paper we refer to "internallinks" or wikilinks only as links between articles of the encyclopedia, however Wiki-pedia guidelines use the term more interchangeably to refer both to "links betweenarticles" and "all the links that stay within the project", i.e. including links in othernamespaces or that go across namespaces. Whilst it seems that the same confusionexists among the contributors of the encyclopedia, we have decided here to adoptthe view for which the proper wikilinks are only the links between articles of theencyclopedia.
21

or application under consideration, it may be more suitable to includeor exclude the links that were added to the page by templates; forexample, to reconstruct navigational patterns it may be useful not onlyto consider links from templates, but also links in the navigationalinterface of MediaWiki.
In this sense, WikiLinkGraphs provides a new facet of the links inWikipedia that was not readily available before. These two dataset canbe used in conjunction, also taking advantage of the vast amount ofmetadata available accompanying the WikiLinkGraphs dataset, suchas the RawWikilinks and ResolvedRedirects datasets.
2.2.2 cross-language comparison ofpagerank scores
A simple, yet powerful application that can exploit the WikiLink-Graphs dataset is computing the general Pagerank score over thelatest snapshot available [6]. Pagerank borrows from bibliometrics thefundamental idea that being linked-to is a sign of relevance [30]. Thisidea is also valid on Wikipedia, whose guidelines on linking state that:
“Appropriate links provide instant pathways to locationswithin and outside the project that are likely to increasereaders’ understanding of the topic at hand.” [16]
In particular, articles should link to articles with relevant information,for example to explain technical terms.
Tables 6 and 7 presents the Pagerank scores obtained by running theimplementation of the Pagerank algorithm from the igraph library16.
Across 7 out of the 9 languages analysed, the Wikipedia article aboutthe United States occupies a prominent position being either the highestor the second-highest ranked article in direct competition with articlesabout countries were the language is spoken. In general, we see acrossthe board that high scores are gained by articles about countries andcities that are culturally relevant for the language of the Wikipediaedition under consideration.
Remarkably, Dutch and Swedish Wikipedia present very different typesof articles in the top-10 positions: they are mainly about the field ofbiology. A detailed investigation of the results and the causes for thesedifferences is beyond the scope of this paper, but we can hypothesizedifferences in the guidelines about linking that produce such differentoutcomes.
16 https://igraph.org/c/doc/igraph-Structural.html#igraph_pagerank
22

#de
enes
frit
arti
cle
score
(×10
−3)
arti
cle
score
(×10
−3)
arti
cle
score
(×10
−3)
arti
cle
score
(×10
−3)
arti
cle
score
(×10
−3)
1Ve
reinigte
Staaten
1.646
UnitedStates
1.414
Estad
osUnido
s2.301
Fran
ce2.370
StatiU
niti
d’America
3.076
2Deu
tschland
1.391
World
War
II0.654
Españ
a2.095
États-U
nis
2.217
Italia
1.688
3Fran
kreich
1.020
UnitedKingd
om0.618
Fran
cia
1.281
Paris
1.228
Com
unid
ella
Fran
cia
1.303
4Zw
eiterWeltkrie
g0.969
German
y0.557
Idiomainglés
1.073
Alle
magne
0.977
Fran
cia
1.292
5Berlin
0.699
The
New
York
Tim
es0.527
Argentin
a0.955
Italie
0.812
German
ia1.257
6Österreich
0.697
Associatio
nfootba
ll0.525
Aleman
ia0.909
Royau
me-Uni
0.773
Ling
uainglese
1.228
7Schw
eiz
0.691
List
ofsovereignstates
0.523
Latín
0.867
Ang
lais
0.764
Rom
a0.961
8Eng
lischeSp
rache
0.620
Racean
dethn
icity
intheUnitedStates
Cen
sus
0.500
Animalia
0.866
Fran
çais
0.748
Centrocam
pista
0.861
9Italien
0.614
India
0.491
México
0.853
Espèce
0.731
Europ
a0.805
10La
tein
0.599
Can
ada
0.468
Reino
Unido
0.820
Can
ada
0.710
2004
0.778
Table6:
Top-10
artic
leswith
thehigh
estPa
gerank
scorecompu
tedover
themostrecent
snap
host
ofthe
Wik
iLin
kGra
phsda
taset(2018-03-01).
23

#nl
plru
sv
articlescore(×
10 −3)
articlescore(×
10 −3)
article‡
score(×
10 −3)
articlescore(×
10 −3)
1Kevers
3.787Stany
Zjednoczone2.763
SoedinjonnyeShtaty
Ameriki
3.290Fam
ilj(biologi)5.489
2Vlinders
3.668Polska
2.686Sojuz
SovetskihSocialisticheskih
Respublik
2.889Släkte
5.1843
Dierenrijk
3.294Francja
2.360Rossija
2.233Nederbörd
4.6964
Vliesvleugeligen
3.084Język
angielski2.110
Francija1.190
Grad
Celsius
4.1445
Insecten2.164
Łacina1.914
Moskva
1.135Djur
4.1146
Geslacht
(biologie)2.101
Niem
cy1.698
Germ
anija1.080
Catalogue
ofLife3.952
7Soort
1.954W
łochy1.229
Sankt-Peterburg0.881
Årsm
edeltemperatur
3.8788
Frankrijk1.932
Wielka
Brytania
1.124Ukraina
0.873Årsnederbörd
3.3669
VerenigdeStaten
1.868W
ieś1.095
Velikobritanija0.811
Växt
2.81010
Familie
(biologie)1.838
Warszaw
a1.083
Italija0.763
Leddjur2.641
Table7:Top-10
articleswith
thehighest
Pagerankscore
computed
overthe
most
recentsnaphost
ofthe
WikiLinkG
raphsdataset
(2018-03-01).( ‡)
Russian
Wikipedia
articletitles
aretransliterated.
24

2.3 research opportunities usingthe wikilinkgraphs dataset
The WikiLinkGraphs dataset and its supporting dataset can be use-ful for research in a variety of contexts. Without pretending to be ex-haustive, we present here a few examples.
2.3.1 graph streaming.
Stream data processing has gained particular consideration in recentyears since it is well-suited for a wide range of applications, and stream-ing sources of data are commonplace in the big data era [31]. TheWikiLinkGraphs dataset, together with the RawWikilinks dataset,can be represented as a graph stream, i.e. a collection of events such asnode and link additions and removals. Whilst other datasets are alreadyavailable for these kind of problems, such as data from social networks,WikiLinkGraphs, being open, can facilitate the reproducibility of anyresearch in this area and can be used as a benchmark.
2.3.2 link recommendation.
West, Paranjape, Ashwin and Leskovec [32] have studied the problemof identifying missing links in Wikipedia using web logs. More recently,Wulczyn, West, Zia, and Leskovec [33] have demonstrated that it ispossible to produce personalized article recommendations to translateWikipedia articles across language editions. The WikiLinkGraphsdataset could be used in place of the web logs for a similar study onrecommending the addition of links in a Wikipedia language editionbased on the fact that some links exist between the same articles inother Wikipedia language editions.
2.3.3 link addition and link removal.
The problem of predicting the appearance of links in time-evolving net-works has received significant attention [34]; the problem of predictingtheir disappearance, on the other hand, is less studied. Preusse and col-laborators [35] investigated the structural patterns of the evolution oflinks in dynamic knowledge networks. To do so, they adapt some indica-tors from sociology and identify four classes to indicate growth, decay,stability and instability of links. Starting from these indicators, they
25

identify the underlying reasons for individual additions and removals ofknowledge links. Armada et al. [36] investigated the link-removal pre-diction problem, which they call the unlink prediction. Representing theever-evolving nature of Wikipedia links, the WikiLinkGraphs datasetand the RawWikilinks datasets are a natural venue for studying thedynamics of link addition and link removal in graphs.
2.3.4 anomaly detection.
A related problem is the identification of spurious links, i.e., links thathave been erroneously observed [37, 38]. An example of the applicationof this approach is the detection of links to spam pages on the Web [39].Similarly, the disconnection of nodes has been predicted in mobile ad-hoc networks [40].
2.3.5 controversy mapping.
Given the encyclopedic nature of Wikipedia, the network of articles rep-resents an emerging map of the connections between the correspondingconcepts. Previous work by Markusson and collaborators [22] has shownhow a subportion of this network can be leveraged to investigate publicdebate around a given topic, observing its framing and boundaries asemerging from the grouping of concepts in the graph. The availabil-ity of the WikiLinkGraphs dataset can foster controversy mappingapproaches to study any topical subpart of the network, with the ad-vantage of adding a temporal and a cross-cultural dimension.
2.3.6 cross-cultural studies.
More than 300 language editions of Wikipedia have being created sinceits inception in 2001 [41], of which 291 are actively maintained. De-spite the strict neutral point of view policy which is a pillar of theproject [42, 43], different linguistic communities will unavoidably havea different coverage and different representations for the same topic,putting stronger focus on certain entities, and or certain connectionsbetween entities. As an example, the articles about bullfighting in dif-ferent languages may have a stronger connection to concepts from art,literature, and historical figures, or to concepts such as cruelty and ani-mal rights [44]. Likewise, the networks from different language versionsgive prominence to different influential historical characters [45, 46].The WikiLinkGraphs dataset allows to compare the networks of 9editions of Wikipedia, which are not only big editions, but have a fairly
26

large base of contributors. In this paper, we have presented a simplecomparison across the 9 languages represented, and we have found anindicator of the prominence of the United States and the local culturealmost across the board. Many more research questions could be ad-dressed with the WikiLinkGraphs dataset.
2.4 conclusions
The dataset we have presented, WikiLinkGraphs, makes available thecomplete graph of links between Wikipedia articles in the nine largestlanguage editions.
An important aspect is that the dataset contains only links appearingin the text of an article, i.e. links intentionally added by the articleeditors. While the Wikimedia APIs and dumps provide access to thecurrently existing wikilinks, such data represent instead all hyperlinksbetween pages, including links automatically generated by templates.Such links tend to create cliques, introducing noise and altering thestructural properties of the network. We demonstrated that this is notan anecdotal issue and may have strongly affected previous research,as with our method we obtain less than the half of the links containedin the corresponding Wikimedia pagelinks dump.
Another limitation of the Wikimedia dumps is that data are availableonly for the current version of Wikipedia or for a recent snapshot; theWikiLinkGraphs dataset instead provides complete longitudinal data,allowing for the study of the evolution of the graph over time. Weprovided both yearly snapshots and the raw dataset containing thecomplete history of every single link within the encyclopedia.
The WikiLinkGraphs dataset is currently made available for the ninelargest Wikipedia language editions, however we plan to extend it toother language editions. As the code of all steps is made available, otherresearchers can also extend the dataset by including more languages ora finer temporal granularity.
Beyond the opportunities for future research presented above, we be-lieve that also research in other contexts can benefit from this dataset,such as Semantic Web technologies and knowledge bases, artificial in-telligence and natural language processing.
27


Part II
R E L E VA N C E O N A G R A P H
Surfing the links between Wikipedia articles constitutes avaluable way to acquire new knowledge related to a topic.The density of connections in Wikipedia makes that, start-ing from a single page, it is possible to reach virtually anyother topic on the encyclopedia. This abundance highlightsthe need for dedicated algorithms to identify the topics thatare more relevant to a given concept. In this sense, a well-known option is Personalized PageRank; its performance,however, is hindered by pages with high indegree that func-tion as hubs and obtain high scores regardless of the start-ing point. In this work, we present CycleRank, a novel al-gorithm based on cyclic paths aimed at finding the mostrelevant nodes related to a topic. We compare the results ofCycleRank with those of Personalized PageRank and otheralgorithms derived from it, both with qualitative examplesand with an extensive quantitative evaluation. We performdifferent experiments based on ground truths such as thenumber of clicks that links receive from visitors and the setof related articles highlighted by editors in the “See also”section of each article. We find that CycleRank tends toidentify pages that are more relevant to the selected topic.Finally, we show that computing CycleRank is two ordersof magnitude faster than computing the other baselines.


3C Y C L E R A N K , O R T H E R E A N DB AC K AG A I N : P E R S O N A L I Z E DR E L E VA N C E S C O R E S F RO MC Y C L I C PAT H S O N D I R E C T E DG R A P H S
Wikipedia is one of the biggest and most used sources of knowledge onthe Web. As of this writing, it is the fifth most visited website in theworld [9]. Wikipedia exists in more than 290 active different languageeditions [10], and its pages have been edited over 2.5 billion times.
Wikipedia is not only a huge repository and collaborative effort; it isalso a giant hypertext in which each article has links to the conceptsthat are deemed relevant to it by the editors [17].
Such vast network emerging from the collaborative process provides arich representation of the connections between concepts, entities andpieces of content, aimed at encompassing "the sum of all human knowl-edge" [47]. This huge graph has been leveraged for different purposesin a variety of fields including natural language processing [18], se-mantic networks [19], cross-cultural studies [45, 46], complex networksmodelling [21], automatic and human navigation of information net-works [23, 48].
While one cannot assume that a single article completely encapsulatesa concept [49], the link network can be useful in defining the contextof an article. Previous research in controversy mapping has shown howthis network can be leveraged to analyze the dominating definition ofa topic, such as “Geoengineering” [22], shedding light on its boundary,context and internal structure. Furthermore, each linguistic communityin Wikipedia produces a different network, which allows for comparingthe emerging definition of a topic across different language editions [44].
The connections between Wikipedia articles are valuable, but they arealso very abundant. The English version has more than 160 million linksbetween its 5.7 million articles [1]. How can one find guidance withinthis wealth of data? In particular, how can we analyze the networkaround a specific topic, to characterize its definition as emerging fromthe collaborative process?
31

The contribution of this work is a novel approach to make sense of theWikipedia link network, capable to answer queries like “Which are theconcepts that are more relevant with respect to a given topic?”
Such inquiries can be translated into a graph problem. The topic we areinterested in can be represented by one article, i.e. a node in the graphcalled reference node. Given a reference node r, we want to assign ascore to every other node in the graph that captures its relevance tor, based on the link structure. The final output is a ranking of nodes,such that the more relevant nodes are ranked higher.
One established algorithm to answer this question is Personalized Page-Rank: a variant of PageRank where the user can specify one or morenodes as queries (seeds) and obtain a score for all the other nodes in thegraph that measures the relatedness with respect to the seeds. However,we have found that, when applied in the context of Wikipedia, this al-gorithm does not produce satisfactory results since it usually includesvery general articles in top positions.
To overcome these limitations, we have developed a novel algorithm tofind the most relevant nodes in the Wikipedia link network related to atopic. The technique, called CycleRank, takes advantage of the cyclesthat exist between the links and produces a ranking of the differentarticles related to one chosen by a user. In this way, this techniqueaccounts for links in both directions, and it can provide results thatare more accurate than those produced by the well-known PersonalizedPageRank algorithm.
The Chapter is organized as follows. We first formalize the problemwe want to solve in Section 3.1. We provide insights on why Person-alized PageRank is not a good choice in Section 3.2 and we discussrelated work in Section 3.3. We describe CycleRank in Section 3.4 andwe evaluate its performance in Section 3.5. Conclusions are drawn inSection 3.6.
3.1 problem statement
Given a graph G = (V ,E), where V is a finite set containing n nodes(articles) and E ⊆ V × V is a set containing m directed edges (linksbetween articles), we are seeking to build a ranking, i.e. an order re-lationship between nodes based on their relevance with respect to areference node r.
In order to achieve this goal, we build a ranking function rf r thatassigns a non-negative score to every node v ∈ V :
rf r : V 7→ [0,+∞)
32

The ranking νr = [v1, v2, . . . , vn] is thus given by the total order ofscores: if rf r(vi) > rf r(vj), then node vi should appear before node vj(i.e., i < j). Note that we assume that there are no ex-aequo in anygiven ranking; this can by achieved by breaking ties randomly.
3.2 background
The PageRank algorithm represents an established relevance measurefor directed networks [50]; its variant Personalized PageRank may beused to measure relevance within a certain context. PageRank is a mea-sure based on incoming connections, where connections from relevantnodes are given a higher weight. Intuitively, the PageRank score of anode represents the probability that, following a random path in thenetwork, one will reach that node. It is computed in an iterative pro-cess, as the PageRank score of a node depends on the PageRank scoresof the nodes that link to it. There are however efficient algorithms tocompute it. The idea behind PageRank is that of simulating a stochas-tic process in which a user follows random paths in a hyperlink graph.At each round, the user either keeps surfing the graph following thelink network with probability α, or is teleported to a random page inthe graph with probability 1− α. The parameter α is called dampingfactor and is generally assumed to be 0.85 [51, 52]. During the surfingprocess, the algorithm assumes equal probability of following any hy-perlink included in a page; similarly, when teleported, every other nodein graph can be selected with equal probability.
Personalized PageRank is a variant of the original PageRank algorithm,where the user provides a set of seed nodes. In Personalized PageRank,teleporting is not directed to some random node taken from the entiregraph, but to one taken from the seed set. In this way, the algorithmmodels the relevance of nodes around the selected nodes, as the proba-bility of reaching each of them, when following random walks startingfrom a node in the seed set.
Limitations of PageRank. At first look, Personalized PageRankseems to be suitable for our use case, as it can be used to representa measure of relevance of Wikipedia articles strongly linked (directlyor indirectly) to the seed.
However, we found unsatisfactory results when applying this algorithm.Very often, pages that are found to be very central in the overall net-work, such as “United States” or “The New York Times,” are includedin the top results of completely unrelated queries.
Such central articles act as hubs in the graph; they have such a strongrelevance overall that, even starting from a seed article which is not
33

specially related to them, one is very likely to end up reaching themwhile exploring the graph.
We argue that this is due to different factors. First, paths of any lengthcan be followed; therefore, in a densely connected graph many pathswill tend to converge towards the most relevant nodes. This aspect canbe limited only partially by lowering the value of the damping factor.
Second, PageRank only accounts for inlinks, not for outlinks. This isreasonable for web search and other contexts where inlinks are a goodproxy for relevance, as they represent somehow the value attributed toa node by the other nodes of the graph. In such cases, outlinks havebasically no value: it is very easy to add into one’s web page manyoutlinks to other pages. In the context of Wikipedia, instead, linksfrom an article to other articles may be subject to being inserted andaccepted by the editors’ community as much as incoming links fromother articles. So, both outgoing and incoming links can be consideredas indicators of relevance.
In particular, outlinks to other pages from an article can be a veryvaluable indicator that these pages are actually related to the topic.For example, if an article contains links to “Computer Science,” thenwe can assume that its content is related to “Computer Science;” onthe other hand, we can expect the article “United States” to have onlya few links to articles related to “Computer Science,” as it is not themain subject of the article.
3.3 related work
We discuss here relevant related studies used to establish the foundationof our work.
Identifying related content in Wikipedia. Schwarzer et al. [53]have studied the problem of recommending relevant Wikipedia articles,starting from a given article: they used citation-based document sim-ilarity measures, such as Co-Citation (CoCit), and Co-Citation Prox-imity Analysis (CPA). They compared the performance of these twomeasures against a more general test-based measure implemented inthe MoreLikeThis function provided by Apache Lucene. They evalu-ate the effectiveness of these measures using two datasets as groundtruth: the See-Also dataset, consisting of a list of links added as re-lated resources to a Wikipedia article; and the ClickStream dataset,consisting of a list of links in an article ordered by the number of clicksthat they have received from Wikipedia readers. The authors show thatMLT finds articles with similar structure that use similar words, whilecitation-based measures are better able to find topically-related infor-
34

mation, with CPA consistently outperforming CoCit. With respect totheir work, the main difference of our approach is that we focus on theproblem of finding relevant related nodes on a graph, and we do notuse the text of Wikipedia articles. Our approach has not only the ad-vantage of being completely language-independent, but it is applicableto a much broader set of problems.
Link Structure in Wikipedia. The foundation of this work is basedon the idea that inlink and outlinks in Wikipedia have a similar role toestablish relevance. Kamps and Koolen [54] performed a comparativeanalysis of the link structure of Wikipedia and a selection of the Web- built from .gov websites - and found that traditional informationretrieval algorithms such as HITS do not work well on Wikipedia. Theroot case of this problem, as they observe, is that in Wikipedia inlinksand outlinks are good indicators of relevance, contrasting the generalbehavior of the web where only the former provide this indication.
PageRank and variations. Boldi et al. [52] studied the behavior ofPersonalized PageRank as a function of the damping factor α. Whilethey acknowledge that a popular choice of α is 0.85 – following thesuggestion of the authors of PageRank itself [50] – they discuss boththe possibility of choosing smaller value of α as well as values close to1, finding the latter to be a choice with several theoretical and compu-tational shortcomings.
Gleich et al. [51] studied the problem of determining the empiricalvalue for α from the visitor logs of a collection of websites, includingWikipedia. They found Wikipedia visitors do not tend to teleport, andestimated the distribution of the values of α for Wikipedia to a β
distribution with maximum at α = 0.30. In our experiments, we haveconsidered α = 0.30, and α = 0.85 as values for the damping parameterwhen executing PageRank.
We focus on the variations of PageRank that use reverse links or takeinto account both the existence of inlinks and outlinks. In 2010, Che-pelianskii [55] introduced the idea of calculating the pagerank scoreof nodes on the transposed graph – called CheiRank – as well as onthe original graph and performed a study of the correlation betweenthe two scores on a collaboration network. Later, Zhirov [56] combinedCheiRank and PageRank to produce a single two-dimensional rankingof Wikipedia articles, 2DRank. This method does not assign a scoreto each node, but just produces a ranking. It was used together withPageRank to rank biographies across different language editions [46].
Cycles in Non-Directed Graphs. Finally, we present related workabout cycles in undirected graphs. This area of work is interesting be-cause it provides a broader context in which to insert our algorithm andit could be used as a guide to extend our algorithm to undirected graphs.
35

However, we consider this line of work to be very different in scope andpurpose from our current work. It has been shown recently that graphswith different structure can be distinguished from one another using ameasure defined with non-backtracking cycles, i. e. a closed walk thatdoes not retrace any edge immediately after traversing them [57]. Thismethod is tied to the idea of using the length spectrum of a graphfrom its Laplacian matrix. Graph spectra are extensively covered inliterature [58].
3.4 the cyclerank algorithm
We propose a more general approach to the problem, defining a newmeasure of the relevance with respect to a given node in a directednetwork, that accounts for both incoming and outgoing links. We callthis measure CycleRank, as it is based on the idea of circular randomwalks.
Starting from the observation that PageRank is not suitable for ourcontext because random walks may easily lead to paths that are notrelated to the topic under consideration, we thought of the idea of onlyconsidering random walks coming back to the starting point within amaximum of K steps. In this way, we guarantee that we only touchpages that are, at least indirectly, both linked from and linking to thereference article. Furthermore, we do not need a damping factor, as wecan assume that all walks just start from the reference node and comeback.
Intuitively, a node that is linked from the reference article but does notlink to it is likely to be a concept that is not related to that subject,even if it is important to its definition. Specularly, a node that links tothe reference article but is not linked from it is likely to be related toit, but not relevant. Nodes that are linked both from and to a referencenode are the ones that we expect to be relevant.
Extending this principle, we want then to be able to quantify the rele-vance of a node with respect to a given reference node, accounting alsofor the indirect links, i.e. for the amount of paths that can be foundlinking it from and to the reference node.
We do this by counting the cycles involving the reference node that passthrough a given other node. As short distances represent a strongerrelationship, shorter cycles should get higher weights.
We define the CycleRank score CRr(i) of a node i with respect to areference node r as follows:
CRr(i) =K∑k=2
`kr (i) · σ(k) (1)
36

Algorithm 1 CycleRankInput: G: a directed graph G = (V ,E)Input: r: the refence nodeInput: K: threshold parameter, K ∈N+
Output: score: a vector of CycleRank scores for each v ∈ V1: function CycleRank(G, r,K)2: r ← FilterGraph(G, r,K)
3: score ← ComputeScore(G, r, k)4: return score5: end function
where `kr (i) is the number of simple cycles of length k that includeboth node i and r, K is a parameter representing the maximum lengthconsidered for cycles, and σ(·) is a scoring function giving differentweights to cycles of different length.
In this way, given a reference node r, the CycleRank of a node i rep-resents the number of cycles including both r and node i, weighted bythe scoring function, which depends on the length of the cycle.
The reference node is also considered in this computation, and it getsthe maximum CycleRank score as by definition it is included in all thecycles considered.
The threshold K is a parameter whose value can be specified accordingto the context. It can be set to infinite, but it will never exceed thenumber of nodes n. It can be typically set to a much lower value for twomain reasons: to reduce the computational load and to avoid potentialnoise deriving from long cycles that include popular nodes far from thereference node. For both reasons, and after manually inspecting theresults for different values of K, we chose to apply thresholds K = 3and K = 4, which produce good results with a limited computationaleffort.
The main CycleRank algorithm is shown in Algorithm 1. In order to op-timize the score computation, we first filter the graph G through func-tion FilterGraph(G, r,K), removing those nodes that could neverappear in cycles including the reference node r with length limitedby K. We then compute the score on this network using functionComputeScore().
3.4.1 preliminary filtering
To reduce the size of the network, Algorithm 2 employs two breadth-fist searches to compute the distance from and to the reference node r,
37

and discards all the nodes whose cumulative distance (back and forth)is larger than K:
1. We compute the distance df [v] of each node v from the ref-erence node by performing a breadth-first visit of the graph,early-terminating the visit when we reach distance K (AlgorithmETBFS – Early-Terminated Breadth-First Search, Line 6);
2. We discard all nodes for which df [i] > K − 1 (Line 7), includ-ing those unreachable from r whose distance is +∞. The func-tion removeNodes(G, key=cond) eliminates all nodes in G thatdo not satisfy the condition expressed by the boolean expressioncond;
3. We compute the distance dt[v] on the transposed network, i.e. thedistance from each node v to the reference node (Line 9);
4. We compute the length df [v] + dt[v] of the minimum cycle includ-ing v and the reference node and we discard all nodes for whichdf [v] + dt[v] > K (Line 10);
Algorithm 2 FilterGraphInput: G: a directed graph G = (V ,E)Input: r: the refence nodeInput: K: threshold parameter, K ∈N+
Output: r: the reference node in the filtered graph1: function FilterGraph(G, r,K)2: for v ∈ V do3: df [v]← +∞ . Distance from the reference node r4: dt[v]← +∞ . Distance from the reference node r5: end for6: ETBFS(G, r,K, df) . Step 17: removeNodes(G, key=(df [v] > K − 1))8: r ← remapNodes(G, r)9: ETBFS(GT , r,K, dt) . Step 2
10: removeNodes(G, key=(df [v] + dt[v] > K))
11: r ← remapNodes(G, r)12: return r
13: end function
In this way we discard all the nodes that are not reached by any cycleof length lower than K. We remap node indexes at each step (Lines 8and 11) so we effectively work with smaller networks. It should be notedthat, in case of K ≥ n, only nodes unreachable from r will be removed,as the length of simple cycles is bounded by the number of nodes n.The removed nodes will all receive a score of zero.
38

3.4.2 cycle enumeration
Algorithm 3 ComputeScoreInput: G: a directed graph G = (V ,E)Input: r: the refence nodeInput: K: threshold parameter, K ∈N+
Output: score: a vector of CycleRank scores for each v ∈ V1: function ComputeScore(G, r,K)2: for v ∈ V do3: score[v]← 0 . CycleRank score4: blocked [v]← false5: B[v]← List()6: end for7: S ← Stack()8: circuit(G, r, r,K,S)9: return score
10: end function
We then proceed to enumerate all simple cycles in the reduced graph.Our algorithm is based on Johnson’s algorithm [59], limited to thequery node r and early-terminated. Algorithm 3 presents the details.Each node in our algorithm is associated with the following values:
• score[v], the CycleRank score of node v
• blocked [v], a boolean indicating whether v cannot be further vis-ited when searching for a cycle because we already went throughit. The purpose of this vector is to avoid going through the samenode more than once, since we are only interested in simple cycles.
• B[v], a list of nodes that can be unblocked when node v is un-blocked.
These variables are then considered global in the rest of the algorithms,to avoid long signatures.
Cycle discovery is performed through a recursive backtrack visit (Al-gorithm 4). In function circuit(G, r, v,K,S), G is the graph, r is thereference node, v is the current visited node, K is the threshold and Sis a stack of nodes that have been visited so far.
We useK to early-terminate the search for a cycle when we arrive at themaximum length: in Line 3, we check that current whether the currentsize of the stack is smaller than K, in which case we can proceed inexploring the graph; otherwise, the function returns immediately.
The Circuit() function works by recursively visiting the nodes on thegraph; when we visit a node v we add it to the stack S and mark it asblocked, then we visit its neighbors by looping over the adjacent nodes
39

v.adj. If the neighbor w we are visiting is the target node, r in ourcase, then we have found a cyclic path: the score is updated by callingfunction UpdateScore() and the unblocking flag flag is set to true.Otherwise, we check if w is unblocked, if so it can be visited and wecall circuit recursively.
After visiting all the neighbors of v, we check if the current node can beunblocked. Unblocking happens when v is part of a path that formed acycle. The unblock(G, v) function at Line 17 is the same as the onedefined by Johnson [59] and we omit here for reasons of space. If weunblock a node v, we unblock all the parent nodes that could lead tov, stored in B[v]. In this way, we are able to explore alternative pathsthat form a cycle.
3.4.3 score computation
Function UpdateScore(score,S) updates the score of the nodesrecorded in a stack S of length k, by adding σ(k) to the score of everynode v ∈ S. Several scoring functions σ can be used; in general, ascoring function should capture the idea that longer cycles contributeless.
We use an exponentially decaying function σexp(k) = e−k where thelength of the cycle is k.
We have chosen the denominator to be exponential in the number ofnodes. We will present some data to support this choice in the Exper-imental Evaluation Section where we show that the number of cyclesincreases more than exponentially with cycle length for our dataset.Intuitively, an exponentially-dacaying scoring function limits the possi-bility that short cycles become neglectable compared to long cycles inthe computation of CycleRank, especially for higher values of K. Otherscoring function can be considered, based on the problem at hand andaccording to structural properties of the network.
40

Algorithm 4 CircuitInput: G: a directed graph G(V ,E)Input: v: a node v ∈ VInput: r: the reference node r ∈ VInput: K: a positive integer, K ∈N+
Input: S: a stack of nodesOutput: flag: a boolean1: function Circuit(G, v, r,K,S)2: flag ← false3: if S.size() < K then4: S.push(v)5: blocked[v]← true6: for each w ∈ v.adj() do7: if w = r then8: UpdateScore(score,S)9: flag ← true
10: else if ¬w.blocked then11: if Circuit(G,w, r,K,S) then12: flag ← true13: end if14: end if15: end for16: if flag then17: unblock(G, v)18: else19: for each w ∈ v.adj() do20: if v 6∈ w.B then21: w.B.push_back(v)22: end if23: end for24: end if25: S.pop()26: end if27: return flag
28: end function
Algorithm 5 UpdateScoreInput: score: a stack representing a cycleInput: S: a stack representing a cycle1: function UpdateScore(score,S)2: `← len(S)3: for each v ∈ S do4: score[v] = score[v] + σ(`)
5: end for6: end function
41

3.5 experimental evaluation
This section is organized as follows: in Section 3.5.1 we describe thedataset that we have used for our experimental evaluation; Section 3.5.2describes alternative approaches that we will use to compare to ourproposed approach in addition to Personalized PageRank; and in Sec-tion 3.5.3 we provide some details about the implementation of eachalgorithm. Section 3.5.4 provides some example results and their qual-itative description for each algorithm and in Section 3.5.5, we providea detailed quantitative evaluation with three different evaluation mea-sures based on different ground truth data. Finally, in Section 3.5.6we compare the execution time of our proposed approach against thealternatives.
3.5.1 dataset description
For our analysis, we used the WikiLinkGraphs dataset, consisting ofthe network of internal Wikipedia links for the 9 largest language edi-tions [1]. The dataset has been developed by us and it is publicly avail-able on Zenodo.1 The graphs have been built by parsing each revision ofeach article to track links appearing in the main text, discarding linksthat were automatically inserted by templates. The dataset containsyearly snapshots of the network and spans 17 years, from the creationof Wikipedia in 2001 to March 1st, 2018. For the experiments in thisChapter we focused on the WikiLinkGraphs snapshot from EnglishWikipedia taken on March, 1st 2018. This graph has N = 13, 685, 337nodes and E = 163, 380, 007 edges.2
Figure 4 presents the number of cycles by length for a sample of 100nodes chosen randomly from our dataset. For each page we plot a tripletof points corresponding to the number of simple cycles of length k = 2,3, and 4 respectively, that go through that node. We shift this triplet ofpoints by a random offset along the horizontal axis for ease of reading.
Table 8 presents the top-10 pages by indegree and outdegree in thegraph. We can see from the table that indegree dominates outdegree byseveral orders of magnitude. This implies that ranking the top pages bydegree (undirected) is de facto equivalent to ranking them by indegree.
1 https://zenodo.org/record/2539424 – DOI: 10.5281/zenodo.2539424.2 Wikipedia contains also special pages known as redirects, i.e. alternative articlestitles. These pages appear in the graph as nodes with a single outgoing edge andtypically no incoming edges. Our dataset consolidates alternative titles in a singlenode; for this reason, the count of nodes in our graph differs from official count ofthe English Wikipedia.
42

1 2 3 4 5
Length of cycle (k)
100
101
102
103
104
Num
ber
ofcy
cles
Figure 4: Number of cycles (log scale) by length for a sample of 100 randomnodes. For each node in the sample, we have computed the numberof cycles of length k = 2, 3, 4. Points representing the values for asingle page are shifted on the x-axis by a random offset and coloredwith the same color. The color gradient depends on the value atk = 4.
The difference between the top-1000 pages by indegree and the top-1000pages by degree is of just 34 pages.
Table 9 presents the top-10 results by global PageRank score. GlobalPageRank and in-degree are highly correlated, regardless of the valueof the damping parameter. When α = 0.85 the two rankings havea Kendall correlation coefficient of τ = 0.60 (over all pages with in-degree greater than zero, n = 8, 305, 031); if we limit the two rankingsto the top 1,000 articles, they are still highly correlated with τ = 0.56.
3.5.2 alternative approaches
We describe briefly some alternative approaches that we will compareCycleRank with: beyond Personalized PageRank, we will consider thepersonalized versions of CheiRank and 2DRank, which are all based onPersonalized PageRank. Given that we will only consider personalizedversions from now on, for the sake of brevity we drop the specifier“personalized” when mentioning the algorithms.
3.5.2.1 CheiRank
CheiRank3 is a ranking algorithm first proposed by Chepelianskii [55],that consists in applying the PageRank algorithm on the transposed
3 This algorithm was named later named CheiRank by Zhirov, Zhirov, and Shepelyan-sky [56] for its assonance which the name of the original author and because thename CheiRank in Russian sound similar to a phrase which translates to "whoserank".
43

Table8:Top-10
pagesby
indegreeand
outdegreeover
themost
recentsnapshot
oftheW
ikiLinkGraphs
dataset(2018-03-01)
#indegree
outdegree
articledegree
articledegree
1United
States332,557
Listofcurrent
U.S.state
legislators8,019
2Anim
al164,549
Listofleast
concernbirds
7,9073
Association
football146,836
Listofpeople
fromIllinois
7,8274
India126,107
Listofbirds
oftheworld
6,8495
World
War
II124,806
Listofstage
names
6,6776
Arthropod
122,742List
ofcities,towns
andvillages
inKerm
anProvince
5,8397
Germ
any121,705
Listoffilm
directorand
actorcollaborations
5,8048
Insect118,628
IndexofTelangana-related
articles5,747
9Canada
115,779Index
ofAndhra
Pradesh-related
articles5,684
10New
York
City
107,831List
ofmunicipalities
ofBrazil
5,585
44

Table9:
Top-10
pagesby
(globa
l)Pa
geRan
kover
themostrecent
snap
shot
ofthe
Wik
iLin
kGra
phsda
taset(2018-03-01)
#PageR
ank,
α=
0.30
PageR
ank,
α=
0.85
article
score
(×10
−4)
article
score
(×10
−4)
1UnitedStates
4.64
UnitedStates
14.1
42
Animal
3.13
World
War
II6.
543
Arthrop
od2.
49UnitedKingd
om6.
184
Association
footba
ll2.
45German
y5.
575
Insect
2.42
The
New
YorkTim
es5.
276
German
y2.
16Association
footba
ll5.
257
List
ofsovereignstates
2.11
List
ofsovereignstates
5.23
8India
2.03
Racean
dethn
icity
intheUnitedStates
Census
5.00
9Moth
1.85
India
4.91
10Nationa
lRegisterof
HistoricPlaces
1.66
Can
ada
4.68
45

graphGT , i. e. all link directions are inverted. This corresponds to trans-posing the adjacency matrix when computing PageRank and results incomputing the conjugated Google matrix G∗.
CheiRank is analogous to PageRank, but it assigns a higher score tonodes with higher outdegree. In the Wikipedia dataset that we areusing there are list articles that have several thousands outgoing links,as shown in Table 8. As expected, the articles with the highest globalCheiRank score are list articles having high outdegree: out of the top100 results by global CheiRank with α = 0.30, 87 have the word List,Lists, or Index in the title. In the following, we are not showing resultsfor CheiRank since it suffers from analogous limitations as PageRank,and it never resulted on-par with the most performing algorithms inour experiments.
3.5.2.2 2DRank
2DRank combines CheiRank and PageRank [56]; it ranks all nodes ina graph, but it does not produce a score as PageRank or CheiRank do.Instead, given the rankings ν(PR) and ν(ChR) produced by PageRankand CheiRank respectively, 2DRank takes the minimum position inwhich a given node appears in both ranking and builds a new ranking.This process can be visualized in the two-dimensional cartesian plane:xOy, we build a series of squares with one vertex in the origin, two sidesformed by the cartesian axes and the other two drawn at integer values.Thus, the first square is identified by (0; 0), (0; 1), (1; 1), and (1; 0); thesecond by (0; 0), (0; 2), (2; 2), and (2; 0), and so on. By interpreting theposition of an item in the PageRank (p) and CheiRank rankings (p∗)as the coordinates of a point P (p, p∗), this point will fall on one of theedges of the squares drawn before. The position of a node in 2DRank isgiven by assigning a progressive number to each item, starting from thepoints that lay on inner squares; if two points lay on the same squarethe algorithm chooses the one closest to either axis first.
Figure 5 shows the computation of 2DRank for a toy graph of 7 nodes.
3.5.3 implementation and reproducibil-ity
We implemented CycleRank in C++. For PageRank and CheiRank weused the igraph library,4 2DRank was computed directly from Page-Rank and CheiRank using a Python script. All code is available underan open-source license at: https://github.com/CycleRank/cyclerank.
4 https://igraph.org/c/
46

0 1 2 3 4 5 6 7 80
1
2
3
4
5
6
7
8
a
b
c
d
e
f
g
Figure 5: Toy example of the computation of 2Drank for a graph with7 nodes ranked respectively: νP = [a, d, c, b, e, f , g] and νC =[a, b, d, e, c, f , g]. The final ranking is ν2D = [a, b, c, d, e, f , g].
47

3.5.4 qualitative comparison
We first present the results of a comparison between Personalized Page-Rank and CycleRank directed over a variety of terms. Then, we focuson the article “Fake news” and we explore the capabilities of CycleRankmore in-depth by performing directed a longitudinal analysis over twosnapshots of the Wikipedia link graph at a distance of one year, and across-language analysis over 8 languages.
3.5.4.1 Comparison of CycleRank and PageRank
Tables 10 and 11 present a comparison between the top-10 results withthe highest scores obtained with the Personalized PageRank and Cycle-Rank, computed with different reference nodes over the wikilink graphof the English Wikipedia taken as of March 1st, 2018. These resultshighlight the limitation of Personalized PageRank that we have de-scribed in Section 3.2: in the top positions we see articles such as“United States” , “The New York Times” , “World War II” and “Ger-many” ; these articles act as attractors for the unconstrained randomwalk of Personalized PageRank since they have a very high in-degreeand have among the highest values of the PageRank score in the over-all network. Indeed, they are respectively in 1st (“United States”), 5th(“The New York Times”), 2nd (“World War II”) and 4th position(“Germany”) in the overall PageRank ranking for that network.
However, there are much fewer paths that connect these articles backto the reference nodes. As a result, these articles appear in much lowerpositions in the ranking produced by the CycleRank algorithm: forexample, using as a reference node r = “Fake news” they appear re-spectively in 15th (“United States”), 8th (“The New York Times”),147th (“World War II”), and 100th (“Germany”) position; with r =
“Right to be forgotten” only “The New York Times” appears in 29thposition; with r = “Online identity” only “United States” appears in54th position; finally with r = “Internet privacy” “United States” and“The New York Times” appear respectively in 185th and 179th posi-tion.
In all the other cases these articles receive a CycleRank score of zeroand do not appear in the rankings. In this way, CycleRank leaves spaceto articles whose content is more strongly associated with the referencetopic to appear at higher positions in the ranking.
3.5.4.2 Case Study: “Fake news”
This section illustrates the results of longitudinal and cross-languageanalyses obtained with the CycleRank algorithm taking “Fake news”
48

as a starting point. We have performed this analysis for all the topicspertaining to the scope of the Engineroom EU project, but here wepresent just the results for “Fake news” for reasons of space.
Network visualization.
Figure ?? shows a visualization of the network centered around thearticle “Fake news”, where node size reflects the CycleRank score sothat bigger nodes (and labels) represent concepts that are more relevantto the reference node. The reduced network, obtained as explained inSection 3.4, is used for this purpose: all the concepts which do not shareany loop shorter than K = 4 are removed so that only concepts havinga CycleRank score greater than 0 are included in the visualization.For readability reasons, node label is shown only for articles having aCycleRank score of at least 20.
Figure 6: Graph induced by the nodes with non-zero CycleRank score withreference node r = “Fake news” and K = 4 on English Wikipedia.over the snapshot of March 1st, 2018. The network is visualizedafter applying the ForceAtlas2 algorithm. Colors represents clusterscalculated with the Louvain algorithm. The dimension of the nodesand their labels depends on the CycleRank score; labels are onlyshown for CycleRank values of at least 20.
49

A spatialization algorithm is used to this aim to place the nodes ina way that minimizes the distance between nodes that are connectedto each other. For this, we rely on the GEPHI software5 [60], and onthe ForceAtlas2 algorithm for placing nodes. The algorithm simulates aphysical system with forces attracting and repelling nodes. A repulsiveforce drives nodes apart, while connections introduce an attractive forcethat brings nodes closer to each other [61]. In this way, the positionof each node in the resulting visualization reflects its connections tothe other nodes, and clusters of nodes well connected with each otheremerge visually in the network.
Edges, representing hyperlinks between articles, are depicted in clock-wise direction according to an established convention. Colors repre-sent clusters of densely connected articles, identified with the Louvainmethod [62].
Longitudinal analysis.
Table 12 presents the CycleRank scores calculated over the snapshotsof the wikilink graph taken on March 1st, 2017 and March 1st, 2018.We analyze only two years because the article exists with its currentmeaning since January 15th, 20176. On one hand, we see a kind ofincreasing politicization of the debate around fake news, with a risingimportance of topics related to the US elections won by Donald Trump.On the other hand, we observe the rise of Facebook up to the thirdposition on 2018, indicating the rapid increase in the importance of thecompany, in 2017 the article about the company was ranked in 17thposition.
Cross-language analysis.
Tables 13 and 14 present the CycleRank ranking produced by consider-ing the article “Fake news” in English Wikipedia and the correspond-ing articles in other 7 languages available in the WikiLinkGraphsdataset.7
First, we point out that CycleRank is able to find results that arepertaining to the local Wikipedia edition, for example, results from
5 https://gephi.org/6 Prior to that date, the article had a more general meaning which has been movedto the page “Fake news (disambiguation)” . The page “Fake news” was originallycreated on April 21st, 2005 and it was used initially as a redirect to “News propa-ganda” and then as a «half-article, half-disambiguation page» - as an editor notedat the time - which described the origin of the term and the then-current concurrentmeaning of satirical news with reference to television programs such as “SaturdayNight Live” and “The Daily Show” (https://en.wikipedia.org/w/index.php?title=Fake_news_(disambiguation)&oldid=25951928).
7 Results from Spanish Wikipedia are omitted because the article about “Fake news”was created on January, 2nd 2018 and only one article - besides “Fake news” itself- received a CycleRank score greater than zero.
50

German Wikipedia include “Tagesschau.de,” and “Der Freitag” ,two local news outlets; from French Wikipedia “Emmanuel Macron”(France’s Prime Minister), from Polish Wikipedia we find in the top-10“Związek Socjalistycznych Republik Radzieckich” (URRS), “Kryzyskrymski” (Crimea Crisis), and “NATO” ; and the results from RussianWikipedia include “Vrag naroda” (“Enemy of the people”).
To compare results across languages, we have tagged related results ineach table with coloured markers; the color-coding of each group ofconcepts mirrors the colors of the clusters calculated on the networksas shown in Figure ??:
1. (purple) groups terms related to disinformation (“Desinforma-tion,” “Propaganda,” “Désinformation,” , “Disinformazione,”“Dezinformacja”), hoaxes and rumors (“Hoax,” “Rumeur,”“Bufala”), and clickbait (“Clickbait,” “Klikbejt,” “Klickbete”);
2. (green) groups terms related to news outlets and publications(“Der Freitag,” “CNN,” “The New York Times,” “Izvestija,”“The Insider,” etc.) and to journalism in general (“Journalistiek” ,“Nieuws,” “Tabloid,” “Zhjoltaja pressa,” “Gula pressen,” etc.);
3. (cyan) indicates articles about “Facebook,” and “Social media” ;
4. (orange) indicates articles about “Donald Trump,” “United Statespresidential election 2016,” and “Donald Trump presidential cam-paign 2016” ;
These groups span across languages as these are common elements thatcharacterize the context of the topic “Fake news” across all the culturesexpressed by the languages that we have examined.
Finally, we point out how certain aspects of “Fake news” are espe-cially relevant in some languages without being specifically related tothe corresponding culture, such as “Verifica dei fatti” (fact checking),“Debunker,” and “Spin doctor” in Italian Wikipedia; “Framing” inDutch Wikipedia; and “Källkritik” (source criticism), and “Psykologiskkrigföring” (psychological warfare) in Swedish Wikipedia.
3.5.4.3 Comparison of CycleRank and 2DRank
Tables 15 and 16 present a comparison between the top-10 results withthe highest scores obtained by CycleRank, PageRank and 2DRank,computed on the WikiLinkGraphs snapshot of the English Wikipediaof March 1st, 2018 with reference nodes “Computer science” and “Fred-die Mercury” , respectively.
These results highlight the limitations of PageRank that we have de-scribed in Section 3.2: in the top positions in the rankings producedwith α = 0.85, we see articles such as “United States” and “World War
51

pageFake
news
Right
tobe
forgottenOnline
identity
#CycleR
ankPageR
ankCycleR
ankPageR
ankCycleR
ankPageR
ank
1Fake
news
Fakenew
sRight
tobe
forgottenRight
tobe
forgottenOnline
identityOnline
identity
2CNN
United
StatesFreedom
ofspeechThe
New
YorkTim
esTransgender
Socialnetworking
service
3Facebook
The
New
YorkTim
esRight
toprivacy
Freedomofspeech
Identity(socialscience)
Identity(socialscience)
4United
Statespresidentialelection,2016
World
War
IIInternet
privacyGoogle
SpainvAEPD
andMario
Costeja
González
Socialnetworking
serviceReputation
5Socialm
ediaThe
Washington
PostPrivacy
lawInternationalhum
anrights
lawAvatar
(computing)
Identitytheft
6Propaganda
The
Guardian
EuropeanUnion
Online
chatFacebook
7Donald
Trump
presidentialcam
paign,2016
Presidentofthe
United
StatesGeneralD
ataProtection
Regulation
The
Guardian
Digitalidentity
8The
New
YorkTim
esGerm
anyInternet
EuropeanCom
mission
Online
identitymanagem
entTw
itter
9Fake
newswebsite
Washington,D
.C.
Censorship
Data
ProtectionDirective
Socialsoftware
Blog
10Pope
FrancisHuffPost
Information
privacyUnited
StatesReputation
Authentication
Table10:Top-10
articleswith
thehighestC
ycleRank
andPageR
ankscorescom
putedfrom
thearticles“Fake
news,”“R
ighttobe
forgotten,”and
“Online
identity”on
EnglishW
ikipedia,overthe
most
recentsnapshot
oftheW
ikiLinkGraphs
dataset(2018-03-01).
52

page
Algorithm
icbias
Internet
privacy
Gen
eral
DataProtectionRegulation
#CycleRan
kPageR
ank
CycleRan
kPageR
ank
CycleRan
kPageR
ank
1Algorith
mic
bias
Algorith
mic
bias
Internet
privacy
Internet
privacy
General
Data
Protectio
nRegulation
General
Data
Protectio
nRegulation
2Machine
learning
Europe
anUnion
Goo
gle
IPad
dress
DataPr
otectio
nDire
ctive
DataPr
otectio
nDire
ctive
3Artificial
intelligence
Machine
learning
Facebo
okFirefox
Inform
ationprivacy
ePriv
acyRegulation
(Europ
eanUnion
)
4Et
hics
ofartifi
cial
intelligence
Artificial
intelligence
Tor
(ano
nymity
netw
ork)
The
New
York
Tim
esRight
tobe
forgotten
Europe
anUnion
5Goo
gle
Cam
bridge,
Massachusetts
Privacy
Social
netw
orking
service
Person
ally
identifi
able
inform
ation
Europe
anCom
miss
ion
6Internet
ofthings
Datab
ase
Internet
censorship
Ixqu
ick
Nationa
ldata
protectio
nau
thority
Europe
anPa
rliam
ent
7Algorith
mHarvard
University
Press
HTTP
cook
ieZo
mbiecook
iePr
ivacy
Dire
ctive
(Europ
eanUnion
)
8Fa
cebo
okGoo
gle
Internet
Goo
gleStreet
View
JanPh
ilipp
Albrecht
Regulation
(Europ
eanUnion
)
9Cyb
ernetic
sFa
cebo
okPr
oxyserver
Internet
Privacylaw
Cou
ncilof
the
Europe
anUnion
10Com
plex
system
DataPr
otectio
nDire
ctive
Com
putersecurit
yTo
r(ano
nymity
netw
ork)
Privacyby
desig
nEI
DAS
Table11:T
op-10artic
leswith
thehigh
estCycleRan
kan
dPa
geRan
kscores
compu
ted
from
theartic
les“A
lgorith
mic
bias,”
“Internetprivacy,”
and
“General
DataPr
otectio
nRe
gulatio
n”on
English
Wikipedia,o
verthemostrecent
snap
shot
ofthe
Wik
iLin
kGra
phsda
taset(2018-03-01).
53

# 2017 2018
1 Fake news Fake news2 Social media CNN3 Satire Facebook
4 Fake news website United States presidentialelection, 2016
5 Yellow journalism Social media6 Mainstream media Propaganda
7 News satire Donald Trump presidentialcampaign, 2016
8 Phishing The New York Times9 CNN Fake news website10 Donald Trump Pope Francis
Table 12: Top-10 articles with the highest CycleRank score computed fromthe page “Fake news”, over two snapshot from March, 1st 2017 andMarch 1st, 2018. The article with its current meaning exists sinceJanuary 15th, 2017.
54

#de
enfr
it
1Fa
keNew
sFa
kenews
Fake
news
Fake
news
2BarackOba
ma
2CNN
3Don
aldTr
ump
1Disinformazione
32
Tagesschau
.de
4Fa
cebo
okÉlectio
nprésidentie
llefran
çaise
de2017
Post-verità
43
Don
aldTr
ump
3UnitedStates
presidentia
lelectio
n,2016
4Fa
cebo
ok1
Bufala
51
Desinform
ation
Social
media
Èrepo
st-vérité
Debun
ker
63
Don
aldTr
umps
Präsidentschafts-
wah
lkam
pf2015/16
1Pr
opagan
daEm
man
uelM
acron
1Man
ipolazione
dell’inform
azione
72
Der
Freitag
3Don
aldTr
ump
presidentia
lcampa
ign,
2016
Guerrecivile
syrie
nne
Verifi
cadeifatti
83
Präsidentschaftswah
lin
denVe
reinigten
Staaten2016
2The
New
York
Tim
es1
Désinform
ation
1Clickb
ait
9Po
stfaktisc
hePo
litik
Fake
newswebsit
e1
Rum
eur
Spin
doctor
10HillaryClin
ton
Pope
Fran
cis
2Con
spira
cyWatch
2Can
dido
(rivist
a)
Table13:T
op-10artic
leswith
thehigh
estCycleRan
kscorecompu
tedfrom
thepa
ge“F
akenews
”or
equivalent
inthegivenlang
uage,over
themost
recent
snap
shot
ofthe
Wik
iLin
kGra
phsda
taset(
2018-03-01),forG
erman
(de),E
nglish(e
n),F
rench(f
r),a
ndItalian(i
t)W
ikipedia.C
ircled
numbe
rsmirr
ortheclusters
presentedin
Figu
re??
:(1,
purple)term
srelatedto
disin
form
ation;
(2,g
reen)term
srelatedto
newsou
tlets
and
publications;(3,
cyan
)termsr
elated
toFa
cebo
okan
dsocial
media
(4,o
rang
e)term
srelated
toDon
aldTr
umpan
dthe2016
presidentia
lelection
intheUnitedStates.
55

#nl
plru‡
sv
1Nepnieuw
sFake
news
Fal’shivyenovosti
Fejknyheter
24
Facebook1
Propaganda1
Klikbejt
1Klickbete
32
Journalistiek1
Dezinform
acja2
Zhjoltajapressa
Sensationalism
44
Socialemedia
Związek
SocjalistycznychRepublik
Radzieckich
Piccagejt2
Gula
pressen
53
Donald
Trump
Kryzys
krymski
Vragnaroda
Källkritik
61
Desinform
atie4
Media
społecznościowe
Respublikanskaja
partija(SShA
)1
Hoax
71
Hoax
2Środkim
asowego
przekazu2
TabloidPsykologiskkrigföring
83
Amerikaanse
presidentsverkiezingen2016
2Dziennikarz
2CNN
Andra
världskriget
9Fram
ing2
Informacja
2Izvestija
102
Nieuw
sNAT
O2
The
Insider2
JosephPulitzer
Table14:Top-10
articleswith
thehighest
CycleR
ankscore
computed
fromthe
page“Fake
news”or
equivalentin
thegiven
language,over
themost
recentsnapshotoftheW
ikiLinkGraphs
dataset(2018-03-01),forDutch
(nl),Polish(pl),R
ussian(ru),and
Swedish
(sv)Wikipedia.C
irclednum
bersmirror
theclusters
presentedin
Figure??:(1,purple)
termsrelated
todisinform
ation;(2,green)term
srelated
tonew
soutlets
andpublications;(3,cyan)term
srelatedto
Facebookand
socialmedia
(4,orange)termsrelated
toDonald
Trumpand
the2016
presidentialelectionin
theUnited
States.( ‡)Russian
Wikipedia
articletitles
aretransliterated.
56

II” ; these articles act as attractors for the unconstrained random walksof PageRank since they have a very high in-degree and have among thehighest values of the PageRank score in the overall network, as shownin Tables 8 and 9. Indeed, they are respectively in 1st (“United States”)and 2nd (“World War II”) position in the overall PageRank rankingfor the network. This problem is only partially mitigated by loweringthe damping factor to α = 0.30
However, there are much fewer paths that connect these articles backto the reference nodes. As a result, these articles appear in much lowerpositions in the ranking produced by the CycleRank algorithm: forexample, for “Computer science” they appear respectively in 400th(“United States”), and 172th (“World War II”) position. In this way,CycleRank leaves space to articles whose content is more strongly as-sociated with the reference topic to appear at higher positions in theranking.
Similarly, the PageRank results for “Freddie Mercury” suffer from thesame problem: “United States” , “London” (17th position in the globalranking), “United Kingdom” (3rd position in the global ranking) and“BBC” (53rd position in the global ranking) all appear in the top-10results for the PageRank with α = 0.85. This bias is only partiallyresolved by lowering the damping factor.
2DRank seems to mostly solve this particular issue, but still includesspurius results such as “Charles Messina” and “Panchgani” , that areonly partially related to “Freddy Mercury” .
3.5.5 quantitative comparison
To compare our proposed approach against existing algorithms, we needa way to evaluate how good a ranking is with respect to some groundtruth. In general, we cannot directly compare the ranking functions rf r,because they may vary wildly in absolute values; furthermore, somealgorithms we will compare to do not define a ranking function butjust produce the final ranking.
We provide three different comparison strategies that we encapsulate inthree different measures. Each measure is based on a suitable datasetthat we use as a ground truth against which we evaluate the perfor-mance of each algorithm. At high level, we want to evaluate the follow-ing three facets of each ranking algorithm:
1. to what extent it is able to maintain the relative ranking of most-clicked links from a given article (ClickStream evaluation);
2. to what extent it is able to rank in the top positions articles high-lighted by editors in the “See Also” section (See-Also evaluation).
57

Com
puterscience
#CycleR
ank,K
=3
CycleR
ank,K
=4
PageR
ank,α=
0.30PageR
ank,α=
0.852D
Rank,
α=
0.302D
Rank,
α=
0.85
articlescore
articlescore
articlescore(×
10 −4)
articlescore(×
10 −4)
articlearticle
1List
ofcomputer
sci-entists
13.78List
ofcomputer
sci-entists
175.08Com
puting12.48
Mathem
atics15.57
Association
forCom
putingMachin-
ery
Association
forCom
putingMachin-
ery1
Algorithm
6.36Algorithm
158.78Com
putationalsci-
ence12.07
Com
puter14.42
Program
ming
lan-guage
Program
ming
lan-guage
3Artificialintelligence
5.96Artificialintelligence
154.30Gottfried
Wilhelm
Leibniz12.00
Com
puting12.71
Theoretical
com-
puterscience
Edsger
W.D
ijkstra
4Theoretical
com-
puterscience
5.36Mathem
atics134.13
Mathem
atics10.92
Association
forCom
putingMachin-
ery
11.77Artificialintelligence
Artificialintelligence
5Mathem
atics4.37
Program
ming
lan-guage
108.42Association
forCom
putingMachin-
ery
10.91Gottfried
Wilhelm
Leibniz11.71
Algorithm
Machine
learning
6Program
ming
lan-guage
4.32Theoretical
com-
puterscience
100.13Algorithm
10.58Com
putationalsci-
ence11.30
Program
ming
lan-guage
theoryAlgorithm
7List
ofpioneers
incom
puterscience
4.08List
ofpioneers
incom
puterscience
88.08Artificialintelligence
9.97Algorithm
11.21Edsger
W.D
ijkstraProgram
ming
lan-guage
theory8
Listof
important
publicationsin
com-
puterscience
4.02Alan
Turing79.11
IBM
9.93United
States10.23
Listofcom
putersci-
entistsCom
piler
9Edsger
W.D
ijkstra3.82
Logic75.90
Com
putationalcom-
plexitytheory
9.91World
War
II10.04
Data
scienceTheoretical
com-
puterscience
10Alan
Turing3.67
Outline
ofsoftw
areengineering
73.35Logic
9.84IB
M9.60
Machine
learningList
ofpioneers
incom
puterscience
Table15:Top-10
articlesas
rankedby
CycleR
ank,PageRank,and
2DRank
with
“Com
puterscience”
asreference
node.The
article“C
omputer
science”,which
would
appearin
thefirst
positionby
definition,isom
itted.
58

FreddieMercury
#CycleRan
k,K
=3
CycleRan
k,K
=4
PageR
ank,
α=
0.30
PageR
ank,
α=
0.85
2DRan
k,α=
0.30
2DRan
k,α=
0.85
article
score
article
score
article
score
(×10
−4)
article
score
(×10
−4)
article
article
1Queen
(ban
d)13
.78
Queen
(ban
d)48
4.34
Queen
(ban
d)10
.79
Queen
(ban
d)13
.40
Queen
(ban
d)Queen
(ban
d)2
Brian
May
6.41
Brian
May
147.
90The
Freddie
Mer-
cury
Tribute
Con
-cert
8.92
Lond
on12
.07
Roger
Taylor
(Queen
drum
mer)
Brian
May
3Rog
erTa
ylor
(Queen
drum
mer)
4.72
Elton
John
97.4
8HIV
/AID
S8.
78UnitedStates
11.5
1Brian
May
Roger
Taylor
(Queen
drum
mer)
4Jo
hnDeacon
3.52
Rog
erTa
ylor
(Queen
drum
mer)
92.8
0Queen
II8.
65Rockmusic
8.99
Mad
ein
Heaven
Queen
II
5Mad
ein
Heaven
3.37
Micha
elJa
ckson
73.3
3Mercury
Pho
enix
Trust
8.52
HIV
/AID
S8.
99Queen
IIMad
ein
Heaven
6We
Will
Rock
You
(musical)
3.17
John
Deacon
64.7
3Middlesex
8.48
The
Freddie
Mer-
cury
Tribute
Con
-cert
8.73
John
Deacon
John
Deacon
7Elton
John
3.12
Live
Aid
61.5
1Parsi
8.45
Roger
Taylor
(Queen
drum
mer)
8.51
We
Will
Rock
You
(musical)
Boh
emianRha
psod
y
8The
Freddie
Mer-
cury
Tribute
Con
-cert
3.07
Boh
emianRha
psod
y60
.24
Zoroastrianism
8.39
UnitedKingd
om8.
30Boh
emianRha
psod
yWe
Will
Rock
You
(musical)
9Boh
emianRha
psod
y3.
02BritAwards
53.6
9Goo
dOld-Fashion
edLo
verBoy
8.35
BBC
8.24
Greatest
Hits
(Queen
albu
m)
Greatest
Hits
(Queen
albu
m)
10Greatest
Hits
(Queen
albu
m)
2.97
The
Freddie
Mer-
cury
Tribute
Con
-cert
48.5
0Millennium
stam
p8.
33Queen
II8.
07Pan
chgani
Cha
rles
Messina
Table16:T
op-10artic
lesas
rank
edby
CycleRan
k,Pe
rson
alized
PageRan
k,an
d2D
rank
with
“Freddie
Mercury”as
referenceno
de.T
heartic
le“F
reddie
Mercury”,
which
wou
ldap
pear
inthefirst
posit
ionby
defin
ition
,isom
itted.
59

−1.0 −0.5 0.0 0.5 1.0
PageRank-Clickstream τ
−1.0
−0.5
0.0
0.5
1.0
Cyc
leR
ank-
Clic
kstr
eamτ
Figure 7: Comparison of the Kendall τ correlation coefficients of the Click-Stream ranking with the rankings produced by PageRank (x co-ordinate) and CycleRank (y coordinate) over a sample of randomarticles. If for a given article y > x then the correlation between theCycleRank and ClickStream rankings is higher than the correlationbetween the PageRank and ClickStream rankings (green triangles),if y ≤ x is vice-versa (blue diamonds).
3. to what extent it tends to give prominence to global “superstars”,i. e. nodes which are very popular in the overall network as mea-sured by their high indegree (“Indegree” evaluation).
Our evaluation measures are based on the ones used in the informationretrieval literature. In particular, we follow in the footstep of Schwarzerand collaborators [53] who have also used ClickStream and See-Also forevaluating performance across a large set of topics.
In the following subsections, we describe in detail each measure, thedataset used as ground truth and the results of the experiments weperformed. We also present examples to illustrate qualitatively the re-sults.
3.5.5.1 ClickStream Evaluation
The idea of this measure is to test the ability of each algorithm tomaintain the relative relevance of a set of topics with respect to theClickStream dataset [63], which we use as a ground truth. In otherwords, interpreting clicks on links by Wikipedia readers as a measure
60

−1.0 −0.5 0.0 0.5 1.0
2Drank-Clickstream τ
−1.0
−0.5
0.0
0.5
1.0
Cyc
leR
ank-
Clic
kstr
eamτ
Figure 8: Comparison of the Kendall τ correlation coefficients of the Click-Stream ranking with the rankings produced by 2DRank (x coordi-nate) and CycleRank (y coordinate) over a sample of random arti-cles. If for a given article y > x then the correlation between theCycleRank and ClickStream rankings is higher than the correlationbetween the 2DRank and ClickStream rankings (green triangles), ify ≤ x is vice-versa (blue diamonds).
of the relative importance of each link in an article, we aim to measurewhether the algorithms are able to maintain this relative ranking.
We have chosen the February 2018 release 8 of the dataset because itis the closest in time to our WikiLinkGraphs snapshot. This datasetcontains counts of (source, target) article pairs extracted fromthe request logs made to Wikipedia’s servers over one month. Thisdata reflects the number of times a Wikipedia visitor has reached thetarget article from the source article. The fact that a given (source,target) pair appears in the clickstream implies the existence of alink in the source page pointing to the target page; these links mayappear as wikilinks in the article source or come from templates. Thecount is the cumulative number of times that users have navigatedfrom source to target via links. Note that (source, target)pairs with a count of 10 or fewer observations are not present in thedataset. In this way, this data provides an aggregated view on howWikipedia articles are reached by users and what links they click on,producing it gives a weighted network of articles, where each edge
8 https://dumps.wikimedia.org/other/clickstream/2018-02/
61

weight corresponds to how often people navigate from one page toanother.
The ClickStream dataset also contains special sources to represent, forexample, pages in other Wikimedia projects or external search engines;9we filter those out. The dataset in total comprises over 25M pairs, ofwhich over 15.4M are links between pages.10
From the ClickStream data we can derive an ordered list of articles,which we can consider as a ranking: our evaluation strategy consistsin computing Kendall’s rank correlation coefficient between the Click-Stream ranking and the ranking of the same pages produced by the al-gorithms under consideration. We formalize this evaluation strategy asfollows: let C be the ClickStream dataset, i.e. a set of triplets: (vs, vt, c)where vs, vt ∈ V are respectively the source and target articles andc ∈ N, c ≥ 10 is the count for the pair (vs, vt); we define Wr ⊆ V asthe set of nodes that appear in the ClickStream dataset with source r,i. e.
Wr = {w ∈ V |(r,w, c) ∈ C}.
for some count c.
We then use the counts in the ClickStream dataset to define a rf Cr overthe set Wr. Given a target w ∈Wr if the count for the pair (r,w) is c,i. e. if (r,w, c) ∈ C then:
rf Cr (w) = c
The ranking function defined above produces a ranking νCr =
[w1,w2, . . . ,wq] of the nodes in Wr. Ties are broken at random. Theranking will be the ground truth for evaluating the performance ofeach algorithm for node r.
Let νr be a ranking of the nodes in V produced by one of the al-gorithms under consideration when r is the reference node. We re-strict this ranking to only the pages that appear in the ClickStreamdata νr|Wr and then we build a list of q pairs from the rankings:[(v1,w1), (v2,w2), . . . , (vq,wq)].
Given two pairs (vi,wi) and (vj ,wj) where i < j, these pairs are said tobe concordant if the ranks for both elements agree: i. e., if both vi > vj
9 More precisely, the dataset contains the counts of (referer, resource) pairs ex-tracted from Wikipedia’s webserver logs. A referer is an HTTP header field thatidentifies the webpage that linked to the resource being requested, a resource is thetarget of the request.
10 Each pair is also accompanied by a type field that describes the pair: possible valuesfor type are link, if the referer and request are both articles and the referer links tothe request; external, if the referer host is not en(.m)?.wikipedia.org; other: ifthe referer and request are both articles but the referer does not link to the request.We are interested only in the pairs of type link.
62

Computer science
article (Wr) c νCr ν(CR)r ν
(PR)r ν
(2D)r
Computation 1371 1 56 65 77Algorithm 876 2 2 6 5Programming lan-guage theory
794 3 17 63 6
Computer graphics(computer science)
648 4 43 134 31
Computational com-plexity theory
647 5 33 9 108
Human–computer in-teraction
550 6 47 68 50
Computer scientist 480 7 59 20 62Outline of computerscience
452 8 204 298 173
Computer program-ming
451 9 62 18 160
Programming lan-guage
414 10 6 12 2
τ (νCr , νr) 0.3333 −0.0222 0.2444
Table 17: ClickStream data for the article “Computer science” (c is the clickcount, νCr is the ranking induced by the count) and rankings pro-duced by CycleRank withK = 3 (CR) and PageRank with α = 0.30(PR) after filtering. The Kendall correlation coefficients betweenClickStream and the rankings produced by the algorithms presentedin the table are computed only over the 10 items displayed.
and wi > wj , or analogously if vi < vj . If vi = vj or wi = wj two pairsare neither concordant nor discordant. Otherwise they are discordant.
The quality of the ranking νr, is then defined as Kendall’s rank corre-lation coefficient:
τ (νCr , νr) =π+ − π−
(q2)
where π+ and π− are the number of concordant and discordant pairs,respectively. We say that a ranking ν1
r is better than a ranking ν2r if its
rank correlation with the ClickStream ranking is higher: τ (ν1r ) > τ (ν2
r ).
Table 17 presents an example of how this evaluation metric works forthe article “Computer science” : the table shows the ClickStream dataand the induced ranking νCr , as well as the rankings produced by theCycleRank (ν(CR)r ), PageRank (ν(PR)r ), and 2DRank (ν(2D)
r ) algorithmsover the same articles. Regardless of the absolute position of thesearticles, we measure how these rankings agree with the one given by theClickStream data, a negative value means that the ranking is discordantwith the ClickStream ranking.
Figures 7 and 8 present the results of the ClickStream evaluation overa sample of 1,000 random articles. We have built this sample by se-
63

lecting random Wikipedia articles that have at least 5 entries in theClickStream data, i. e. they have at least 5 links to other Wikipediaarticles. In the figures, the (x, y) coordinates of each point are the val-ues of Kendall’s rank correlation coefficient with ClickStream data forPageRank and CycleRank (Figure 7); and for 2DRank and CycleRank(Figure 8). Thus, if points have their y coordinate greater than the xcoordinate, i.e. they are above the dashed axis Y = x in the figure, itmeans that CycleRank is outperforming the other approach for that ar-ticle. This is the case for CycleRank and Personalized Pagerank where68.8% of articles in Figure 7 are above the axis, as well for CycleRankand 2DRank where 50.2% of articles in Figure 7 are above the axis.
algorithm CycleRank
parameters K = 3 K = 4
PageRank α = 0.30 30.2/68.8 37.6/59.0α = 0.85 33.4/65.5 36.2/59.7
2Drank α = 0.30 48.2/50.2 58.4/37.4α = 0.85 48.2/50.4 56.9/37.7
Table 18: Results of the ClickStream evaluation over a sample of 1,000 randomarticles for CycleRank, PageRank, and 2DRank for different valuesof their parameters: maximum cycle length K for CycleRank anddamping factor α for PageRank and 2DRank.
Table 18 presents the results of the ClickStream evaluation for variousvalues of the parameters.
3.5.5.2 See-Also Evaluation
We measure the ability of an algorithm to identify relevant articles byusing links in the See-Also section of a Wikipedia article as a groundtruth. Following Wikipedia policies [64], the section See-Also containsa list of internal links to related Wikipedia articles. These lists maybe ordered logically, chronologically or alphabetically, and there is noguarantee that the same criterion is used across multiple pages. Forthis reason, we treat these lists as unordered, that is we do not treatthe pages listed in these sections as being ranked by relevance, but justas a set of related pages.
More formally, let Wr ⊆ V be a set of ground-truth nodes that arerelevant with respect to a reference node r, and let νr be a ranking ofthe nodes in V . The quality of the ranking νr is defined as
ξ(νr,Wr) =∑w∈W
ξ(νr,w)
64

−1.0 −0.8 −0.6 −0.4 −0.2 0.0 0.2 0.4 0.6 0.8 1.0
CycleRank-PageRank score difference for article ∆ξ(Wr)
0
20
40
60
80
100
120
Num
ber
ofar
ticl
es
Figure 9: Distribution of ∆ξ(Wr) between CycleRank and PageRank. Whenvalues are positive (solid green bars) CycleRank is able to find See-Also articles in a higher position than Personalized Pagerank for agiven article; when values are negative (blue bars with with whitehatch) is vice-versa.
−1.0 −0.8 −0.6 −0.4 −0.2 0.0 0.2 0.4 0.6 0.8 1.0
CycleRank-2Drank score difference for article ∆ξ(Wr)
0
50
100
150
200
250
300
Num
ber
ofar
ticl
es
Figure 10: Distribution of ∆ξ(Wr) between CycleRank and 2DRank. Whenvalues are positive (solid green bars), CycleRank is able to find See-Also articles in a higher position than 2DRank for a given article;when values are negative (orange bars with with black hatch) isvice-versa.
where
ξ(νr,w) =1i
if w = vi ∈ νr ∧w ∈W
65

We say that a ranking ν1r is better than a ranking ν2
r if ξ(ν1r ) > ξ(ν2
r ).
Computer science
article (Wr) ν(CR)r ν
(PR)r
∆ξCR-PR(×10−4) ν
(2D)r
∆ξCR-2D(×10−4)
Academic genealogy of computer sci-entists
13 220 723.8 26 384.6
Association for Computing Machin-ery
16 6 −1041.7 2 −4375.0
Computer Science Teachers Associa-tion
207 231 5.0 402 23.4
Engineering informatics 447 228 −21.5 399 −2.7Informatics 70 106 48.5 87 27.9List of academic computer sciencedepartments
74 232 92.0 7862 133.9
List of computer scientists 2 110 4909.1 9 3888.9List of important publications incomputer science
9 167 1051.2 18 555.6
List of pioneers in computer science 8 16 625.0 538 1231.4List of unsolved problems in com-puter science
92 148 41.1 41 −135.2
Outline of software engineering 12 217 787.3 25 433.3Technology transfer in computer sci-ence
206 223 3.7 380 22.2
Turing Award 14 49 510.2 17 12.6∑∆ξ(Wr) 7733.8 2314.4
Table 19: The first 10 articles appearing in the See-Also section of the “Com-puter science” article. We use them to compare CycleRank withK = 3 (CR), PageRank with α = 0.30 (PR), and 2DRank withα = 0.30 (2D). For each article, the table reports the position inwhich it appears in the ranking produced by each algorithm, and thecorresponding difference in scores ∆ξ. The
∑∆ξ(Wr) is calculated
only over the 10 items displayed.
Table 19 presents, as an example, the results of the See-Also evalu-ation for the article “Computer Science” in English Wikipedia: thefirst column lists the name of the articles appearing in the See-Alsosection of the article “Computer science” Wr; the second, third andfifth columns show the position of each article in the ranking producedby CycleRank, PageRank, and 2DRank respectively; the fourth andsixth columns show the difference in evaluation score for each articlebetween CycleRank and PageRank ∆ξ(CR−PR), and CycleRank and2DRank ∆ξ(CR − 2D). When CycleRank ranked a page in a higherposition than the other approach this difference is positive, otherwiseit is negative.
Figures 9 and 10 show the distribution of the differences in evalua-tion score over the same sample of 1,000 articles used above. Figure 9compares CycleRank and PageRank, i. e. the plot is the distribution
66
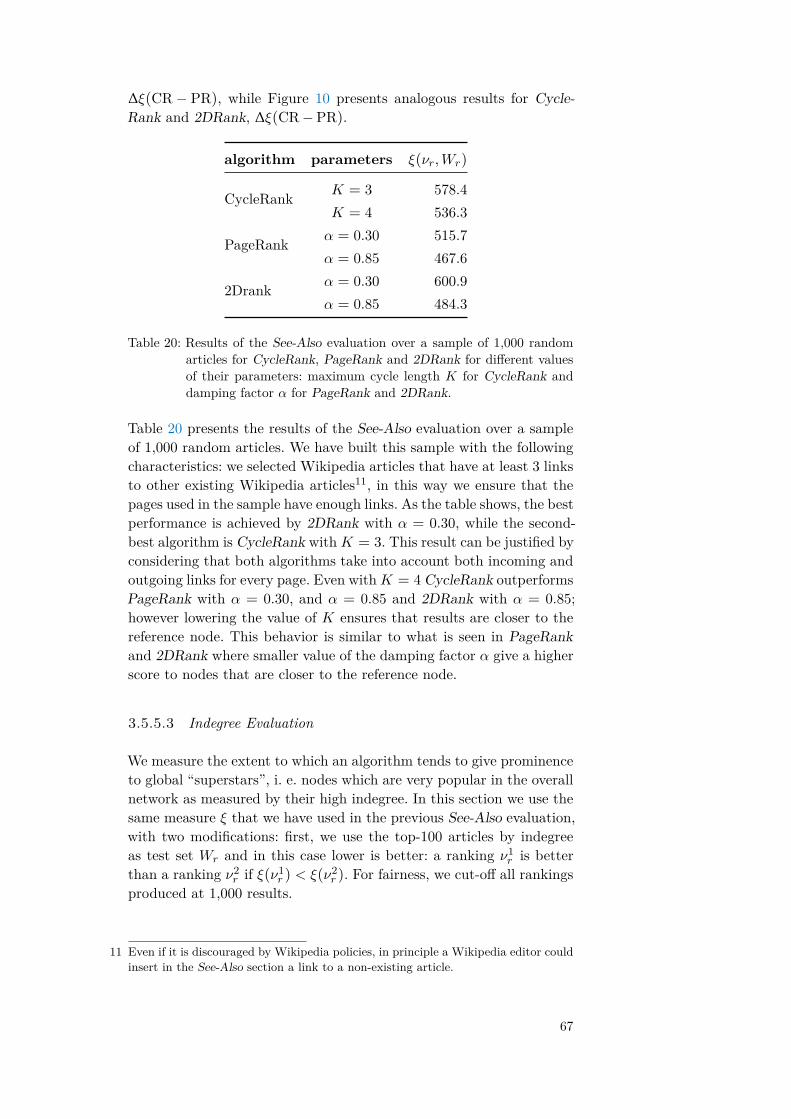
∆ξ(CR − PR), while Figure 10 presents analogous results for Cycle-Rank and 2DRank, ∆ξ(CR−PR).
algorithm parameters ξ(νr,Wr)
CycleRank K = 3 578.4K = 4 536.3
PageRank α = 0.30 515.7α = 0.85 467.6
2Drank α = 0.30 600.9α = 0.85 484.3
Table 20: Results of the See-Also evaluation over a sample of 1,000 randomarticles for CycleRank, PageRank and 2DRank for different valuesof their parameters: maximum cycle length K for CycleRank anddamping factor α for PageRank and 2DRank.
Table 20 presents the results of the See-Also evaluation over a sampleof 1,000 random articles. We have built this sample with the followingcharacteristics: we selected Wikipedia articles that have at least 3 linksto other existing Wikipedia articles11, in this way we ensure that thepages used in the sample have enough links. As the table shows, the bestperformance is achieved by 2DRank with α = 0.30, while the second-best algorithm is CycleRank withK = 3. This result can be justified byconsidering that both algorithms take into account both incoming andoutgoing links for every page. Even withK = 4 CycleRank outperformsPageRank with α = 0.30, and α = 0.85 and 2DRank with α = 0.85;however lowering the value of K ensures that results are closer to thereference node. This behavior is similar to what is seen in PageRankand 2DRank where smaller value of the damping factor α give a higherscore to nodes that are closer to the reference node.
3.5.5.3 Indegree Evaluation
We measure the extent to which an algorithm tends to give prominenceto global “superstars”, i. e. nodes which are very popular in the overallnetwork as measured by their high indegree. In this section we use thesame measure ξ that we have used in the previous See-Also evaluation,with two modifications: first, we use the top-100 articles by indegreeas test set Wr and in this case lower is better: a ranking ν1
r is betterthan a ranking ν2
r if ξ(ν1r ) < ξ(ν2
r ). For fairness, we cut-off all rankingsproduced at 1,000 results.
11 Even if it is discouraged by Wikipedia policies, in principle a Wikipedia editor couldinsert in the See-Also section a link to a non-existing article.
67

Computer science
νi CycleRank, K = 3
article ν(CR)r
ξ(ν(CR)r ,w)
(×10−4)
5 World War II 361 27.70∑ξ(ν
(CR)r ,Wr) 27.70
PageRank, α = 0.30
article ν(PR)r
ξ(ν(PR)r ,w)
(×10−4)
1 United States 258 38.764 India 678 14.755 World War II 24 416.677 Germany 451 22.1710 New York City 357 28.0111 United Kingdom 265 37.7412 England 322 31.0613 London 458 21.3714 Australia 715 13.9917 Italy 519 19.27∑
ξ(ν(PR)r ,Wr) 643.77
Table 21: Positions in which the top-100 articles by indegree appear in therankings produced by CycleRank (top), PageRank (bottom), with“Computer science” as reference node and their score ξ(νr,w). Re-sults for PageRank and 2DRank are limited to the top-1000 posi-tions. The
∑ξ(Wr) is calculated only over the 10 items displayed.
Table 21 presents the position in which the top-100 articles by indegreeappear in the top-1000 positions of the rankings produced PageRank(top), 2DRank (middle), and CycleRank (bottom) with “Computer sci-ence” as reference node.
Figure 11 shows the results of the indegree evaluation for PageRank,2DRank, and CycleRank. We see that CycleRank is able to obtain alower score meaning that it includes fewer pages with high indegree inhigh position in the rankings it produces.
3.5.6 performance analysis
Finally, Table 22 evaluates the performance of CycleRank with respectto the alternative approaches. Times are computed by averaging overthe sample of 1,000 articles used in the See-Also evaluation. Each jobwas executed on HPC cluster nodes equipped with 48 Xeon 5118 pro-cessors and 32 GB of RAM, using only one core and one processor.
68
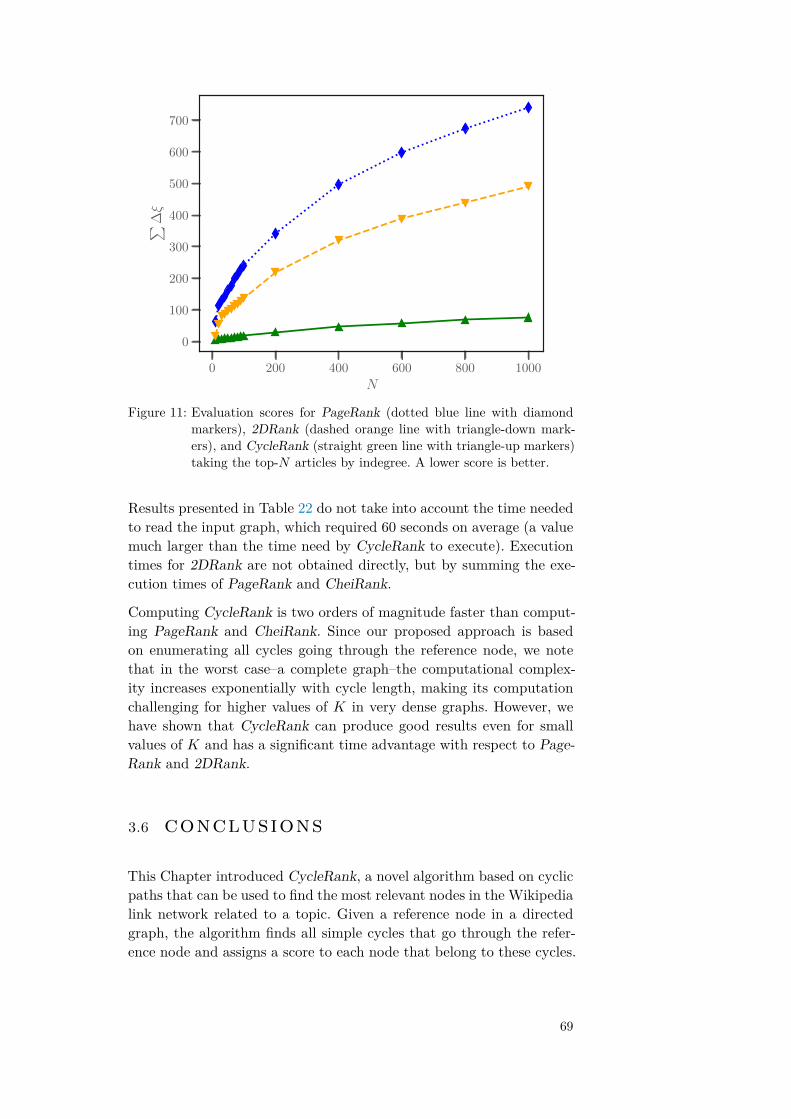
0 200 400 600 800 1000
N
0
100
200
300
400
500
600
700
∑∆ξ
Figure 11: Evaluation scores for PageRank (dotted blue line with diamondmarkers), 2DRank (dashed orange line with triangle-down mark-ers), and CycleRank (straight green line with triangle-up markers)taking the top-N articles by indegree. A lower score is better.
Results presented in Table 22 do not take into account the time neededto read the input graph, which required 60 seconds on average (a valuemuch larger than the time need by CycleRank to execute). Executiontimes for 2DRank are not obtained directly, but by summing the exe-cution times of PageRank and CheiRank.
Computing CycleRank is two orders of magnitude faster than comput-ing PageRank and CheiRank. Since our proposed approach is basedon enumerating all cycles going through the reference node, we notethat in the worst case–a complete graph–the computational complex-ity increases exponentially with cycle length, making its computationchallenging for higher values of K in very dense graphs. However, wehave shown that CycleRank can produce good results even for smallvalues of K and has a significant time advantage with respect to Page-Rank and 2DRank.
3.6 conclusions
This Chapter introduced CycleRank, a novel algorithm based on cyclicpaths that can be used to find the most relevant nodes in the Wikipedialink network related to a topic. Given a reference node in a directedgraph, the algorithm finds all simple cycles that go through the refer-ence node and assigns a score to each node that belong to these cycles.
69

algorithm parameter time (s)
CycleRank K = 3 4± 1K = 4 10± 16
PageRank α = 0.30 260± 13α = 0.85 928± 80
CheiRank α = 0.30 258± 20α = 0.85 374± 50
2DRank α = 0.30 > 518α = 0.85 > 1302
Table 22: Execution time comparison of CycleRank, PageRank, CheiRank,and 2DRank for different values of the parameters: maximum cyclelength K for CycleRank, and damping parameter α for PageRank,CheiRank, and 2DRank. All times are expressed in seconds.
The algorithm possesses one parameter which is the maximum cyclelength that we are interested to find.
An extensive comparison between CycleRank, PageRank, and its vari-ant 2DRank has been performed, based on three quantitative measues.First, we have used the ClickStream dataset to show that the rankingsproduced by CycleRank align better with readers’ behaviour. Second,we have used the See-Also links that appear in Wikipedia articles toshow that CycleRank is able to rank related articles in high position;only 2DRank with α = 0.30 obtains a better result for this test. Finally,we have shown that CycleRank is more robust to pages with high in-degree. Furthermore, we have shown that our algorithm is faster thanthe alternatives, offering order-of-magnitude speed-ups with respect tolibrary implementation of Personalized PageRank.
In other words, CycleRank is a viable alternative to PageRank, espe-cially in the case of graphs where the role of inlinks and outlinks iscomparable; we believe that it can be easily applied to similar contexts,such as knowledge bases.
The version of the algorithm presented in this work is based on a sim-ple exponentially-decaying scoring function; while we have empiricallyvalidated the results on our WikiLinkGraphs dataset for other typesof scoring functions, we have not presented these results here for reasonof space. However, many variations and extensions could be explored.
We have assumed that the starting point for the algorithm is a singlereference node. However, as in the case of Personalized PageRank, itwould be possible to take a group of articles as seed. Then, all cyclesaround each of the seed nodes could be considered. Alternatively, in-
70
stead of counting cycles, one could count all paths from any node inthe seed to any other node in the seed.
Another possible variant would be to specify two different nodes (orgroups of nodes) as source and target, and to consider all paths fromthe source to the target within K steps. In this way, the measure wouldnot only represent the relevance of other nodes with respect to a givenreference node, but the (directed) relationship between two nodes orgroups of nodes. This would help to answer questions such as: “Whichare the most relevant concepts connecting Artificial Intelligence andHuman rights, and which are the most relevant concepts on the otherway round”?
We think that CycleRank provides a foundation that could be furtherexplored to provide a family of algorithms adapted for different graphsand use cases. The suitability of different solutions could also be studiedfocusing on the structural properties of the network, such as its linkdensity or clustering coefficient.
71


Part III
A P P L I C AT I O N S
We explore applications of CycleRank. First, we describethe Engineroom EU project whose objective was identify-ing and evaluating the key enabling technologies and topicsthat will underpin the Next Generation Internet. The ideafor CycleRank emerged from this project when we faced thechallenge to find which were the most relevant Wikipediapages connected to the Wikipedia article about the Internet.Finally, we present another contribution using Wikipedia ar-ticle daily accesses to estimate how the information aboutdiseases propagates.


4N E X T G E N E R AT I O N I N T E R N E T -E N G I N E RO O M
In this chapter, we present our contribution to the Engineroom EUproject: this project focused on identifying and evaluating the key en-abling technologies and topics characterizing the Next Generation In-ternet. The goal of this project was to identify early signals of newtrends and technologies related to the internet and map the ecosystemsand networks surrounding these key topics, evaluating their social, le-gal, technological, ethical and economic contexts. The project revolvedaround “umbrella topics” that will be explored in the following.
Our contribution to the project was developed during our stay at Eu-recat - Centre Tecnòlogic de Catalunya in Barcelona (Spain) under thesupervision of Dr. David Laniado. The project was developed by a con-sortium of three partners comprising Nesta (London, United Kingdom),Eurecat, and DELab at the University of Warsaw (Warsaw, Poland)and it was supported by the European Union’s Horizon 2020 researchand innovation programme under the EU Engineroom project, withGrant Agreement no 780643.
In this chapter, we analyze NGI related issues by shifting our focus fromindividual concepts to the connections between them. This allows usto describe and determine the characteristics of the representations ofdifferent topics through their connections to one another and throughtheir context, that can mutate over time and across languages.
To reach this goal, we relied on the network of internal links, or wik-ilinks, between Wikipedia articles. The visual representation of suchconnections may be seen as a giant concept network emerging fromthe links established by Wikipedia’s user community. Such a graph isnot static, rather it is continuously growing and evolving, reflecting theendless collaborative processes behind it.
In order to study the framing of topics such as “Online privacy” , “On-line identity,” or “Right to be forgotten” over time and across languages,we looked at their contexts as they emerge from the Wikipedia linknetworks. We aimed to achieve a more fine-grained and accurate result,following a more robust approach and building networks around spe-cific topics. We selected 12 topics representing emerging social issuesrelated to the Next Generation Internet, covering the umbrella topics,and developed a novel methodology to determine the specific charac-
75

teristics of each of them based on the observation of the most relevantconcepts associated with them over time and across different languages.Our study was multilingual, we have used data from 9 Wikipedia edi-tions: German (de), English (en), Spanish (es), French (fr), Italian(it), Dutch (nl), Polish (pl), Russian (ru), and Swedish (sv)
Equipped with the complete graphs of internal links connecting Wiki-pedia articles, we can explore and analyze parts of the network aroundspecific topics to characterize their definition as emerging from the col-laborative process. For each of the 12 Wikipedia articles correspondingto the topics selected for this analysis we studied the network of re-lated concepts in Wikipedia as a mind map and used the CycleRankalgorithm to study their context as defined by the most relevant key-words. We studied how this context varies over time looking at yearlysnapshots of the network and across cultures comparing the networksderived from the nine largest editions of Wikipedia which also corre-spond to nine major European languages.
This chapter is organized as follows: in the next section, we describe themapping between the 12 umbrella topics defined by the EngineroomEU project and Wikipedia articles. Then we focus more in-depth onone of the topics: “Internet governance,” we present a visualization ofthe network around the corresponding Wikipedia article and a longi-tudinal and a cross-language analysis of its context. Additional resultsare presented in Appendix A. Finally, in the last section, we draw theconclusions of our work.
4.1 keyword selection
We started from the 10 umbrella topics defined in the EngineroomEU project and selected one Wikipedia article related to each topic.The criteria for choosing said articles were:
• the size of the articles, as they had to be reasonably large (atleast in the English Wikipedia);
• the lifespan of the articles, possibly existing since some years andin several of the nine selected languages;
• their structure, representing a well-defined and broad enough con-cept;
• their relevance for the considered topic as they had to presentemerging issues relevant for our analysis.
In addition to the topics defined previously in the project, we includetwo further ones that we deemed of particular relevance to the NGI
76

Topic Wikipedia article
Ethical AI/ML Algorithmic biasCybersecurity Computer securityCyber-Mobbing CyberbullyingFake News Fake newsGDPR General Data Protection RegulationSustainability Green computingDecentralisation Internet governanceOpt out Internet privacyAccessibility Net neutralityIdentity/trust Online identityData Sovereignty Open-source modelRight to be forgotten Right to be forgotten
Table 23: Selection of reference keywords/Wikipedia articles for the analysis,connected to the umbrella topics.
initiative and the European Commission: “GDPR” and “Right to beforgotten” .
Table 23 shows the correspondence between topics and Wikipedia arti-cles in the English Wikipedia.
4.2 cross-language keyword map-ping
Table 24 shows the correspondence between keywords and Wikipediaarticles for each of the nine selected language editions that we consid-ered. Correspondences were retrieved using interwiki links created bythe community and connecting the same concepts across languages1, forthese reason for languages other than English the correspondences arenot always complete. To overcome this, Hence, additional support wasprovided by members of the language communities as they were askedto revise the mapping with respect to the context of their Wikipedialanguage edition and to find corresponding articles when interwiki linkswere missing. Also, we have chosen the articles that best reflected themeaning and content of the English articles and for this reason, we haveexcluded articles from other languages that had a very different angle
1 Interwiki links are links to pages of Wikipedia in a different language,https://en.wikipedia.org/wiki/Interwiki_links.
77

deen
esfr
itnl
plru
sv
Algorithm
icbias
Sesgoalgorít-
mico
Biais
algorith-mique
Informations-
sicherheitCom
putersecu-
ritySeguridad
infor-mática
Sécuritédes
systèmes
d’information
Sicurezzainfor-
matica
Com
puterbeveiligingBezpieczeństwo
teleinformaty-
czne
Kom
p’juternajabezopasnost’
Datasäkerhet
Cyber-M
obbingCyberbullying
Ciberacoso
Cyberharcèlem
entCyberbullism
oCyberpesten
Cyberprzem
ocInternet-travlja
Nätm
obbningFake
New
sFake
news
Fakenew
sFake
news
Fakenew
sNepnieuw
sFake
news
Fal’shivyenovosti
Fejknyheter
Datenschutz-
Grundverord-
nung
General
Data
Protection
Regulation
Reglam
entoGeneral
deProtección
deDatos
Règlem
entgénéral
surla
protectiondes
données
Regolam
entogenerale
sullaprotezione
deidati
Algem
eneverordeninggegevens-bescherm
ing
Ogólne
roz-porządzenieo
ochroniedanych
Obshhij
reglament
pozashhite
dannyh
Dataskydds-
förordningen
Green
ITGreen
comput-
ingGreen
comput-
ingInform
atiquedurable
Green
comput-
ingGrön
IT
InternetGover-
nanceInternet
gover-nance
Gobernanza
deInternet
Gouvernance
d’InternetInternet_
Governance
ZarządzanieIn-
ternetemUpravlenie
InternetomDatenschutz
imInternet
InternetprivacyPrivacidad
enInternet
Vie
privéeet
in-form
atiquePrivacy
Privatnost’v
In-ternete
Netzneutralität
Net
neutralityNeutralidad
dered
Neutralité
duréseau
Neutralità
dellarete
Netneutraliteit
Neutralność
sieciSetevoj
nej-tralitet
Nätneutralitet
Online
identityIdentidad
enlínea
Identiténum
ériqueIdentità
vir-tuale
Identiteit(eigenheid)
Tożsamość
internetowa
Setevajaiden-
tichnost’Användarnam
n
Open
SourceOpen-source
model
Código
abiertoOpen
sourceOpen
SourceOpen
sourceOtw
arteopro-
gramow
anieÖppen
källkod
Recht
aufVergessenw
er-den
Right
tobe
for-gotten
Derecho
alolvido
Droit
ál’oubli
Diritto
all’oblioRecht
omver-
getente
worden
Praw
odo
byciazapom
nianymPravo
nazabve-
nieRätten
attbli
glömd
Table24:Selection
ofthereference
Wikipedia
articlesfor
theanalysis,connected
tothe
umbrella
topics.
78

about a subject because this would have introduced spurious results inthe analysis.
The article “Algorithmic bias” exists only for Spanish and French, be-yond English and, at the time of data collection (March 1st, 2018), thearticle was still underdeveloped and poorly linked. So, there is no cross-language analysis provided for this article, but it was still kept in thislist as it was deemed a relevant emerging topic and the analysis wasperformed for English.
4.3 network visualization
For each keyword, we show a visualization of the network obtainedthrough on the CycleRank results. We have selected all the articleswith a non-zero CycleRank score running with K = 4. A spatializa-tion algorithm is used to place the nodes in a way that minimizesthe distance between nodes that are connected. For this, we rely onthe Gephi software2 [60], and on the ForceAtlas2 algorithm for placingnodes. The algorithm simulates a physical system with forces attract-ing and repelling nodes. A repulsive force drives nodes apart, whileconnections introduce an attractive force that brings nodes closer toeach other [61]. In this way, the position of each node in the resultingvisualization reflects its connections to the other nodes, and clusters ofnodes well connected with each other emerge visually in the network.
The convention for the visualizations is consistent for all networks:
• Nodes represent articles, with node size proportional to the Cycle-Rank score. To improve readability, in the static visualizationsnode labels are also represented with size proportional to theCycleRank score, and labels are not shown for low values of thescore.
• Edges represent hyperlinks between articles. The network is di-rected, and each edge represents a hyperlink in one of the twopossible directions; according to an established convention, edgesare represented in the clockwise direction. So, in case of a recip-rocal connection, there will be a loop between two articles.
• Colors represent clusters of densely connected articles, identifiedwith the Louvain method (Emmon et al, 2006). We expect thesegroups to represent thematic areas spontaneously emerging fromthe hyperlink network.
2 https://gephi.org/
79

Edges, representing hyperlinks between articles, are depicted in theclockwise direction according to an established convention. Colors rep-resent clusters of densely connected articles, identified with the Louvainmethod [62].
An interactive version of these network visualizations has also beenproduced and are available on GitHub.3 They can be explored zoomingin and out, selecting a node to see only the network of its connections(ego-network), or selecting a given group of nodes. They were createdwith Sigma.js, and the Sigma.js export plugin for Gephi.4
4.4 internet governance
In this section, we present the results obtained for the keyword “Inter-net governance” . Figure 12 represents the network of articles aroundthe article “Internet governance” with CycleRank score greater thanzero. We see that this network is characterized by 6 clusters:
1. (purple) is a cluster of concepts related digital rights: “Inter-net,” “Digital divide,” “Lawrence Lessig,” “Internet Censorship,”“Electronic Frontier Foundation” ;
2. (green) groups organizations, institutions and people involved inInternet governance: “Internet Society,” “ICANN,” “Vint Cerf,”“Internet Standard” ;
3. (cyan) groups organizations and technologies related to the Inter-net as a telecommunication network: “Internet Engineering TaskForce,” “IPv4,” “IPv6,” “Anycast” ;
4. (orange) is a cluster of concepts related to the internet from ahistorical, scientific and academic point of view: “History of theInternet,” “ARPANET,” “DARPA,” “Association for Comput-ing Machinery” ;
5. (dark green) groups technologies and protocols: “Internet protocolsuite,” “Port (computer networking),” “File Transfer Protocol,”“Internet Relay Chat” ;
6. (magenta) is a cluster of concepts related to domain names andtheir management: “Internet Assigned Numbers Authority,” “Do-main Name System,” “Domain name” .
3 https://github.com/NGI4eu/engineroom-networks.4 https://blogs.oii.ox.ac.uk/vis/2012/11/15/build-your-own-interactive-network/ .
80

Figure 12: Graph induced by the nodes with non-zero CycleRank score withreference node r = “Internet governance” and K = 4 on EnglishWikipedia, over the snapshot of March 1st, 2018. Colors representsclusters calculated with the Louvain algorithm. The dimension ofthe nodes and their labels depends on the CycleRank score.
4.4.1 longitudinal analysis
Tables 25 and 26 present the results for the longitudinal analysis forthe article “Internet governance” in English Wikipedia over the years2007-2018. Contrary to the case of “Fake news” this article did notsee particular changes in its context over the years and the results asa whole reflect the growth of Wikipedia in general. The context of“Internet governance” contains some expected articles like: “InternetSociety” , “Internet” , “ARPANET,” and “ICANN.” These pages ap-pear through the whole life o the article “Internet governance” , whichwas created on November 13th, 2005.5
4.4.2 cross-language analysis
Table 27 presents the results of the cross-language analysis for the ar-ticle “Internet governance” . Corresponding articles are present in 3other language editions besides English: German, French, and Russian.Across languages we find in the top-10 results organizations and insti-
5 https://en.wikipedia.org/w/index.php?title=Internet_governance&oldid=28236513.
81

tutions related to Internet governance: “Weltgipfel zur Informationsge-sellschaft” (“World summit on Information Society”), “Internet Gov-ernance Forum,” and “Internet Corporation for Assigned Names andNumbers” (“ICANN”) in German Wikipedia; “Sommet mondial surla socit́é de l’information” (“World summit on Information Society”)in French Wikipedia; and “Obshhestvo Interneta” (“Internet Society”),“Sovet po arhitekture Interneta” (“Internet Architecture Board”), “Kon-sorcium Vsemirnoj pautiny” (“World Wide Web Consortium”), and“ICANN” in Russian Wikipedia. All in all, the framing of Internet gov-ernance results to be quite stable, both over time and across languageeditions.
4.5 conclusions
In this chapter, we have presented a general approach to characterize atopic by inspecting its connections to other topics. For this purpose, weleveraged the network of links in Wikipedia, which we used a giant con-cept map to study the framing of different topics by looking at theircontext in the network. We created the WikiLinkGraphs dataset,representing the networks of articles for the top 9 language editionsof Wikipedia, and we developed a novel computational method, Cycle-Rank, to identify the most relevant concepts with respect to a giventopic (reference node), as the ones laying more often on circular pathsincluding the reference node.
Once we created the dataset and defined the methodology, we coulddive into the analysis of 12 topics representing key social issues relatedto the Next Generation Internet. For each topic, we presented a visu-alization of the network around it, induced by the CycleRank results,and the ranking of the top-10 articles having the highest CycleRankscores, comparing results along years and across languages.
The results obtained for the other umbrella topics are available in Ap-pendix A. All the results, including the whole ranking of the CycleRankscores obtained for all nodes, and the networks files and visualizationsin static and interactive version are also available on GitHub.6
We believe that the value of this work is manifold:
• The analysis of the 12 topics presented offers an in-depth inspec-tion of the framing of major NGI-related social issues, and of theirvariations over time and across cultures. Apart from the textualdescription in which we have highlighted some observations, fur-ther insights can be extracted by looking at the longitudinal and
6 https://github.com/NGI4eu/engineroom-networks.
82

rank
2007
2008
2009
2010
2011
2012
1Internet
governan
ceInternet
governan
ceInternet
governan
ceInternet
governan
ceInternet
governan
ceInternet
governan
ce2
World
Summiton
theIn-
form
ationSo
ciety
Internet
Society
Internet
Society
Internet
Society
Internet
Society
Internet
Society
3IC
ANN
World
Summiton
theIn-
form
ationSo
ciety
World
Summiton
theIn-
form
ationSo
ciety
Internet
Internet
Internet
4Working
Group
onInter-
netGoverna
nce
Internet
Internet
Governa
nceFo
-rum
World
Summiton
theIn-
form
ationSo
ciety
History
oftheInternet
History
oftheInternet
5Internet
Governa
nceFo
-rum
Internet
Governa
nceFo
-rum
Internet
History
oftheInternet
Cha
rles
Bab
bage
Insti-
tute
Cha
rles
Bab
bage
Insti-
tute
6Internationa
lTe
lecom-
mun
icationUnion
Working
Group
onInter-
netGoverna
nce
Working
Group
onInter-
netGoverna
nce
Internet
Governa
nceFo
-rum
World
Summiton
theIn-
form
ationSo
ciety
World
Summiton
theIn-
form
ationSo
ciety
7American
Registry
for
Internet
Num
bers
ICANN
ICANN
Working
Group
onInter-
netGoverna
nce
Internet
Governa
nceFo
-rum
Internet
Governa
nceFo
-rum
8Cou
ntry
code
top-level
domain
ARPA
NET
ScottBradn
erRegiona
lInternet
reg-
istry
Regiona
lInternet
reg-
istry
Regiona
lInternet
reg-
istry
9Gen
eva
Internationa
lTe
lecom-
mun
icationUnion
ARPA
NET
ICANN
ARPA
NET
ARPA
NET
10History
oftheInternet
History
oftheInternet
History
oftheInternet
JonPo
stel
ICANN
Working
Group
onInter-
netGoverna
nce
Table25:T
op10
mostr
elevan
tcon
ceptsb
yCycleRan
kscorew
ithrespectt
o“Internetg
overna
nce,”alon
gdiffe
rent
yearly
snap
shotso
fthe
WikiLinkG
raph
sda
taset(2007-2012).
83

rank2013
20142015
20162017
2018
1Internet
governanceInternet
governanceInternet
governanceInternet
governanceInternet
governanceInternet
governance2
InternetSociety
InternetSociety
InternetEngineering
TaskForce
InternetEngineering
TaskForce
InternetEngineering
TaskForce
InternetEngineering
TaskForce
3Internet
InternetGovernance
Fo-rum
InternetSociety
InternetAssigned
Num
-bers
Authority
InternetAssigned
Num
-bers
Authority
InternetAssigned
Num
-bers
Authority
4History
oftheInternet
InternetInternet
InternetSociety
InternetSociety
InternetSociety
5Internet
Governance
Fo-rum
World
Summiton
theIn-
formation
SocietyHistory
oftheInternet
InternetGovernance
Fo-rum
InternetGovernance
Fo-rum
Request
forCom
ments
6World
Summiton
theIn-
formation
SocietyHistory
oftheInternet
InternetGovernance
Fo-rum
ICANN
InternetInternet
7Charles
Babbage
Insti-tute
Regional
Internetreg-
istryIC
ANN
InternetIC
ANN
InternetGovernance
Fo-rum
8Regional
Internetreg-
istryIC
ANN
World
Summiton
theIn-
formation
SocietyHistory
oftheInternet
History
oftheInternet
History
oftheInternet
9IC
ANN
Charles
Babbage
Insti-tute
Regional
Internetreg-
istryWorld
Summiton
theIn-
formation
SocietyWorld
Summiton
theIn-
formation
SocietyIC
ANN
10Governance
Working
Group
onInter-
netGovernance
Charles
Babbage
Insti-tute
Regional
Internetreg-
istryRegional
Internetreg-
istryWorld
Summiton
theIn-
formation
Society
Table26:Top
10mostrelevantconceptsby
CycleR
ankscorew
ithrespectto
“Internetgovernance,”along
differentyearlysnapshotsoftheW
ikiLinkGraphs
dataset(2013-2018).
84

rank
deen
frru
1Internet
governan
ceInternet
governan
ceGou
vernan
ced’Internet
Uprav
lenieInternetom
2Weltgipfel
zur
Inform
ationsge-
sellschaft
Internet
Eng
ineerin
gTa
skFo
rce
Internet
Internet
3Working
Group
onInternet
Gover-
nance
Internet
Assigne
dNum
bers
Autho
r-ity
Révolutionnu
mérique
Obshh
estvoInterneta
4Internet
Governa
nceFo
rum
Internet
Society
Techno
logies
del’informationet
dela
commun
ication
Internet-provajder
5Wolfgan
gKleinwächter
Reque
stforCom
ments
Métad
onné
Setevo
jnejtralite
t6
Internet
Corpo
ratio
nforAssigne
dNam
esan
dNum
bers
Internet
Sommet
mon
dial
surla
sociétéde
l’information
Internet-cen
zura
7Inform
ationsgesellschaft
Internet
Governa
nceFo
rum
Techniqu
eIstorijaInterneta
8Internet
History
oftheInternet
Serveu
rinform
atique
Sovetpo
arhitektureInterneta
9Ju
gend
med
ienschutz
ICANN
Inno
vatio
nKon
sorcium
Vsem
irnoj
pautiny
10Cyb
erkrieg
World
Summit
ontheInform
ation
Society
Écono
mie
dusavoir
ICANN
Table27:T
op10
mostrelevant
concepts
byCycleRan
kscorewith
respectto
“Internetgovernan
ce,”
across
diffe
rent
Wikipedia
lang
uage
edition
s.
85

cross-cultural comparison of the top-most relevant concepts withrespect to each topic.
• The network visualizations produced, especially in their interac-tive version available on GitHub, can be explored for getting in-sights about specific issues and for answering specific questions,zooming in and out for moving the focus among different levelsof granularity.
• Finally, the full availability of all the data generated and of all thecode employed to obtain the results allows for easy replicabilityof the study for other topics beyond the ones shown in this work.
In summary, we believe that this work offers relevant insights on theframing of key social issues related to the Next Generation Internet, andat the same time it opens up to further research, either replicating theanalysis for other topics, or building on the datasets and code providedto extend our methods or develop new ones.
86

5D I S E N TA N G L I N G S O C I A LC O N TAG I O N A N D M E D I AD R I V E R S I N T H E E M E RG E N C E O FH E A LT H T H R E AT S AWA R E N E S S
In recent years, thanks to the increasing abundance of (near) real-time, high-quality data on populations; human mobility patterns; andpathogens’ biology; the use of data-driven computational models forthe study of epidemic outbreak response has gained considerable trac-tion in the public health community [65]. Novel digital data streams,such as search engine queries and social media, in combination withmachine learning, statistical and mechanistic disease models, have con-siderably advanced outbreak forecast science. In this context, predic-tive epidemic modeling is emerging as an inter-disciplinary field thathas been recently used in real time to support responses to recent out-breaks such as the 2009 H1N1 pandemic, the 2014 West Africa Ebolaoutbreak, the Zika epidemic in the Americas in 2016, and the HighlyPathogenic Avian influenza A(H7N9) in 2014 and 2015.
In view of the huge potential of predictive modeling, we must also beaware of the challenge inherent to the real-time modeling of the feed-back loop between the disease progression and the response of socialsystems. Recent examples (Ebola, MERS, etc. [66, 67]) have shownthat the spreading of infectious diseases strongly depends on the socialadaptive behavior that characterizes the reaction of the population tothe awareness and the perceived risk in the face of the epidemic [66,67, 68, 69]. In other words, the predictive power of mathematical andcomputational models heavily relies on our understanding of the pop-ulation awareness of the disease and the ensuing behavioral changessuch as social distancing, travel limitations, etc. [70, 71, 72, 73, 74].
Several mathematical and computational models of the feedback mech-anisms between disease spread and the effects due to the awarenessof the epidemic in the population has been put forward in the mod-eling community [73, 74, 75, 76, 77, 78, 79]. In particular, two mainmechanisms have been invoked in the spreading of awareness and fearof epidemics: i) the massive flow of news from mass media that pos-sibly acts as an exogenous force on the global population [77, 80, 81];and ii) the social contagion due to the word of mouth and peer influ-
87

ence [73, 74, 75, 76]. However, little is known about the relative con-tribution of the two mechanisms in shaping the spread of informationin the population [77, 82, 83], and to what extent individuals’ responseis affected by mechanisms of social reinforcement [84]. As a matterof fact, the richness of models and mathematical approaches has notyet been transferred to any operational forecasting framework; mostlydue to the lack of a quantitative data-driven characterization of thedifferent mechanisms affecting the spreading of the awareness in thepopulation [77, 85].
Here, we propose a modeling framework able to disentangle the con-tribution due to media drivers and the social contagion in the aware-ness building of infectious diseases. The developed model assumes thatindividuals become aware of an epidemic either by means of mediacommunications on different stories related to the ongoing epidemic(through newspapers, websites, broadcasts, etc.) or as a consequence ofconversations with other individuals. We test our modeling approachfor several major recent epidemics by accurately fitting a proxy of thelevel of awareness in the population; i.e. the time series of Wikipediapage views [86, 87] related to the disease originating the epidemic. Theunderlying assumption here is that among the individuals that developawareness, a fraction of them initiate an information-seeking behaviorusing Wikipedia to address this need. More precisely, we fit the proxysignal by using a non-linear, time-dependent mechanistic model; explic-itly accounting for the combination of temporal changes in the mediavolume, as recorded in the Google News platform [88] and treated asan exogenous factor of the system, and an endogenous contagion pro-cess driven by risk perception and spontaneous social interactions be-tween individuals. The proposed non-linear model is able to measurethe effect of the endogenous progression of awareness in the popula-tion and quantify its contribution relative to the news and the mediadrivers. We perform a thorough information theoretical model selectionanalysis [89] showing that the proposed model outperforms supervisedmachine learning approaches based only on the news volume, and non-linear models accounting only for the endogenous social contagion com-ponent. Our approach outperforms the other considered models also inout-of-sample predictive tests. Interestingly, the mechanistic modelingproposed here allows the estimate of specific parameters such as thedoubling time and transmissibility of the awareness through the differ-ent routes of information considered. Thus, this work has the potentialto open the path to the inclusion of the diffusion of awareness in awide range of biological and social contagion models, allowing the mea-surement of specific parameters of social contagion and the design ofoptimized awareness campaigns.
88

5.1 results and discussion
We consider as a proxy of the awareness of major infectious diseaseepidemics the time series of Wikipedia page views for several healththreats in the US and Italy. In particular, the 2014 Ebola Outbreak inWest Africa [66, 90] and the spread of the Zika virus in the Americasduring 2015 [91] are considered illustrative case studies to investigatethe impact of Public Health Emergencies of International Concerns onthe individuals’ awareness in both US and Italian populations. Menin-gitis in Italy and Influenza in US between 2016 and 2017 are consideredin order to investigate, respectively, the effect of local and persistingepidemiological threats [80, 92].
The level of media attention to the spreading of an infectious disease iscertainly contributing to the population awareness of the disease. Thiscan be readily observed by comparing the time series of the Wikipediaaccesses and the volume of news on the epidemic measured from theGoogle News platform, a quantitative proxy of the media attention overtime. As shown in Fig. 13 for the exemplary cases of the 2014 Ebola,the Wikipedia accesses and news volume time series have an extremelygood correlation when no or negligible time lag is considered betweenthe two signals (see the SI for a detailed analysis). A closer inspectionto the curves, however, shows that, generally, the awareness tends toincrease and decrease at a faster rate before and after the peak of thenews cycle, respectively. For instance, in the US, after a huge volumeof Wikipedia accesses and news about Ebola during week 42 of 2014,Wikipedia page views dropped by 64% in the following week, while me-dia coverage decreased by 22% only, remaining significantly high up tomid-November. Similar temporal patterns were observed when compar-ing news coverage on Zika and individuals’ online behavior in US (seeSI), Guatemala and Brazil [93]. These features are the fingerprint ofacceleration and saturation phenomena that can be ascribed to endoge-nous word of mouth processes. Here, as word of mouth processes, wecan consider all personal communications among individuals, includingboth real-world and on-line contacts.
In our model, we assume that the overall strength of media coverage ina given day is proportional to the overall amount of news in that day,which include the contribution of both more and less relevant commu-nications. In support of such assumption, it is worth noting that majorpeaks in the Google News time series associated with Ebola followsthe occurrence of some relevant events for the two considered coun-tries, as the detection and death of the first Ebola case within theUS borders, and the first transmission recorded in EU (Fig. 13A,B).In order to test the representativeness and appropriateness of GoogleNews data to model the media attention over time, we compared the
89

temporal dynamics of the number of Ebola related videos per day fromFox News and MSNBC [77] with the corresponding Google News signal(Fig. 13C). We found that the two signals are strongly correlated (Pear-son correlation coefficient 0.92, p-value < 0.001), therefore suggestingthat Google News represents a good proxy of the variation in strengthof media coverage over time.
In order to model mechanistically the awareness spreading in the pop-ulation we use a SIRS transmission mechanism [94]. In the transmis-sion model, susceptible individuals (S) represent people unconcernedor unaware about an epidemic threat that can get informed (I) ei-ther through the word of mouth, as a consequence of a social contagionbased on peer-to-peer individual interactions with informed individuals(I), or directly from the media (M). Potential development of immunity(R) against the exposure to new information and possible mechanism ofimmunity waning is fully considered with the SIRS model. The modelis calibrated by assuming that at each time stamp t, a fraction k ofindividuals becoming aware of the disease seeks further informationon Wikipedia, which is a proxy of awareness acquired through othermeans. At each time stamp, the model keeps track of all the newly be-come aware individuals INewt ; i.e. the number of individual transitionsS → I. The Wikipedia page views (Wt) at time t is then given by thefollowing relation
Wt = κINewt +W0
where W0 represents the number of Wikipedia page views in absenceof media attention. The number of individuals INewt who become awareof the epidemic threat at day t is determined by a dynamical processwhere the rate for the individual transition S → I into the aware stateis defined as λSNt = λSt + λNt , where the terms λSt and λNt represent thesocial and the news contributions to the force of contagion, respectively.The force of contagion is itself depending on the number of aware in-dividuals It and the volume of news Mt at time t. This social-newscontagion (SN) model is compartmental (i.e. individuals with the samecharacteristics are represented by a unique dynamic variable), and takesinto account also individuals not yet aware of the disease, and individu-als aware but not actively interested in seeking or spreading informationon the disease. Mechanisms of waning and re-emergence of the aware-ness are also considered in the model. For each epidemic, the model’sparameters are calibrated separately by using a Markov Chain MonteCarlo (MCMC) approach [95]. The explicit mathematical definition ofthe model, and the MCMC calibration are detailed in the Material andMethods section.
In Fig. 14, we report the results obtained by using the calibrated modelto fit the Wikipedia time series. Remarkably, the model is able to cap-
90

ture the large fluctuations induced by the media cycle and the quickrise and decay of attention more typical of the social contagion pro-cesses [96]. In order to evaluate the performance of the SN-model, wehave considered three other modeling approaches. The first one is aclassic regression based on a supervised machine learning approach (L)that models the Wikipedia signal by considering as explanatory vari-ables the news released during the preceding days (see details in theMaterial and Methods section). We then considered two alternativecontagion models, the S-model and the N-model, containing only theλSt and λNt force of contagion, respectively. A closer inspection of thesemodels (reported in the SI file) shows that each one of these alternativemodels has clear limitations. For instance, the N-model appears to notreproduce accurately the decay of interest because of saturation in theawareness process [93]. On the contrary, the S-model accounts for thequick rise of awareness but does not captures fluctuations that can betraced back to the media cycle. In order to put on rigorous ground thecomparison across models, we report in Table 28 the basic metrics de-scribing the goodness of fit of the various models (additional metrics inSI). We observe that the SN-model outperforms all other models on thebasic quantities such as the mean absolute percentage error (MAPE),the Pearson correlation coefficient, and the coefficient of determination(R2). In Fig. 15, we also report the relative error of each model as afunction of time for the case of Ebola in US and Italy, showing thatalong the entire time window the SN-model is consistently better per-forming than the other models. In addition, since we are comparingmodels with different numbers of parameters, we performed an infor-mation theoretic multi-model analysis [66, 89, 97] that clearly shows avery low likelihood that any models could better explain the data withrespect to the SN-model (see Table 28).
Finally, to assess the predictive power of different modeling approacheshere considered, model performances of the SN-model were comparedwith those obtained with the L-model, by using only the first 80%of data points (train set) for model calibration and by testing modelcompliance with the remaining 20% of data (test set). The goodness offit associated with the two models was compared in terms of MAPE,R2, and Pearson correlation coefficient, and also compared with thegoodness of fit in the last 20% of data points obtained when using100% of data for model calibration. The carried out analysis suggeststhat in all these cases, SN-model performs better than the supervisedmachine learning approach (L, see Table 2).
Our analysis shows that in order to model the spreading of awarenessin a population, both influence of media and social contagion are rele-vant mechanisms. A model accounting for both these routes to developawareness proves to better reproduce and forecast the dynamics of Wi-kipedia accesses over time. The model has the added benefit of being
91

mechanistic in describing the impact of media communications andpeer-to-peer contagion processes. This allows us to quantify the spe-cific contribution to the process from the two drivers considered and tomeasure some key features characterizing the spread of awareness in apopulation.
Our estimates show that, among the different epidemiological scenar-ios considered, the fraction of individuals that acquired awareness frommedia broadcast ranges from 30% to 60% (Fig. 4). This result stronglysuggests that both media and the word of mouth represent crucialcomponents of the awareness dynamics. Our results are compliant withrecent estimates showing that 20% of visits on Wikipedia are triggeredby conversations with other individuals and 30% by the media cover-age [82].
The estimated proportion of aware people who seek information on Wi-kipedia (Fig. 16) is expected to mirror the level of interest and concernraised during an epidemic. This proportion was found higher for epi-demics declared Public Health Emergencies of International Concernsby the World Health Organization, i.e. Ebola in 2014 (4.6% US, 1.4%Italy) and Zika virus in 2015 (0.9% US, 0.2% Italy), with respect towell known infections as Meningitis (0.08% in Italy between 2016 and2017) and Influenza (0.14% in US between 2016 and 2017). These esti-mates suggest that a higher concern is triggered by the emergence ofpathogens representing relatively new threats, associated with highermortality rates [81, 93]. Although the occurrence of severe cases inhigher proximity may increase the public attention to a specific disease,the estimated higher impact of Ebola and Zika in US with respect toItaly may be driven by the use of Wikipedia pages written in Englishby other countries (only 41% of access to Wikipedia pages in Englishare from US; 91% of access to Italian pages are from Italy [98]).
Model estimates of the media transmission rate during different epi-demic scenarios (Fig. 16) provide insights on the impact of media com-munications on different topics across countries. This quantity repre-sents the average number of individuals who get informed by the re-lease of one single news within 24 hours, in a completely uninformedpopulation. Average estimates of this quantity suggest that the impactof media in US might have been more intense (or effective) during theepidemics of Zika in 2015 and Ebola in 2014 with respect to what hasoccurred during the 2016-17 Influenza season (see Fig. 16) [80, 81, 93].In Italy, a higher media transmission rate was estimated for Ebola in2014 and Meningitis in 2016-17 with respect to what observed duringthe 2015 Zika epidemic. Interestingly, for all the scenarios consideredbut for Influenza in US, the accumulation of media communicationsover time resulted as an amplifier of the impact of news released af-terwards (see SI). The negligible effect of past media coverage on theeffectiveness of new media communications estimated for Influenza be-
92

tween 2016 and 2017 may be explained by the perceived lower severityof Influenza infection with respect to others and the occurrence of an-nual regular Influenza epidemics [80].
By comparing estimates of the doubling time characterizing the socialcontagion mechanism during different epidemics (Fig. 16; i.e., how fastthe number of individuals informed though the word of mouth doubles),we found that the spread of awareness through peer-to-peer individualinteractions was more than three times faster during 2014 Ebola inthe US and 2016-2017 Meningitis in Italy. These two events possiblyrepresent the two threats that have mostly changed the disease riskperception in the public [80, 81, 93, 92].
Finally, as for the Ebola awareness dynamics, the estimated averageduration of immunity against the exposure to new information; drivingpossible waning of individuals’ awareness; and representing the averagetime between two visits on a Wikipedia page by the same individual, re-sulted around 80 days for US and 110 days for Italy. Obtained estimatesroughly correspond to the period of time between the two major peaksin the Wikipedia and Google News signals and suggest that two domi-nant sets of Ebola stories impacted the population in the two countriesduring 2014. On the opposite, for Zika, and Influenza in US, the esti-mated duration of immunity exceeds the time frames considered in ouranalysis, suggesting that the awareness dynamics associated with thesetwo epidemics has been influenced by news stories that has occurredwithin a relatively narrow period of time. For Meningitis in Italy, theaverage duration of immunity was found around 50 days.
5.2 conclusions
The approach presented here provides a modeling framework for inves-tigating time-series related to the spread of awareness of health threatsin a population. Our proposed model goes beyond the usual statisticalanalysis with respect to dependent exogenous variables; indeed, we in-troduce a mechanistic modeling approach based on the idea that alongthe news and media drivers, peer-to-peer social contagion plays a majorrole in the emergence of awareness.
It is worth remarking a number of limitations for the presented ap-proach. First, the models considered for social contagion driven by theword of mouth assume a homogeneous mixing in the population. How-ever, the influence of individuals may be highly heterogeneous and sig-nificant different contributions of opinion leaders with respect to theones of less active individuals may affect the spread of awareness in apopulation [83, 99]. Clustering of opinions around a given topic withinspecific population groups or geographical areas is also likely to occur
93

in response to local events [74] or as a consequence of different culturalbackgrounds, social norms, and social reinforcement mechanisms [84].Second, the influence of media is here estimated by using only newsreleased by news websites. Although these are likely representative ofthe overall media attention, we did not consider the heterogeneous con-tribution of different mass media (e.g. television, radio, newspapers) inshaping the spread of awareness and the impact of news was consideredregardless the content of different communications and the reputationof who provides the information. More refined models may explicitlytake into account the heterogeneity in the infectiousness associated withdifferent peers (both for media communications and social interactions)instead of adopting a mean field approximation. All these aspects mayaffect the impact of media on the public, the persistence of concern gen-erated by news, and may also be relevant to explain the spread of fakenews and misperception [73, 80, 81, 92, 100, 101]. Furthermore, mediaattention is here considered as an exogenous factor of the considered dy-namics, taken as given regardless potential feedback responses betweenthe onset of new stories and people need of more information on a giventopic. Finally, our analysis does not provide any indication on whetherand how the public has changed their behavior in response to the per-ceived risk of infection [66, 69, 70, 71, 72, 73, 74, 79]. Further effortsare, therefore, required to better understand similar mechanisms.
This study, however, represents a first important attempt to qualita-tively and quantitatively describe the role played by the media and theword of mouth in influencing individual awareness and risk perceptionduring different epidemic threats. In particular, the proposed modelis able to disentangle the contribution of news influence and socialcontagion in driving Wikipedia page views in the case of six differentpublic health threats. Furthermore, it provides better explanatory andforecasting power than alternative models considering only one of thedriving mechanisms. Most importantly, the model allows the measure-ment of parameters defining the contagion process such as the fractionof aware people, and the relative contributions of the different conta-gion processes. The possibility of gathering quantitative informationon these parameters is a first step in the operationalization of epidemicmodels that include the spread of awareness to diseases and the ensuingbehavioral changes of the population. The proposed framework is fairygeneral and can be applied in other contexts related to the diffusion ofinformation and knowledge.
94

5.3 material and methods
data description
The daily numbers of visits to Wikipedia pages on specific diseaseswere obtained by publicly available data [86, 87] and used to modeltemporal changes in the number of individuals seeking information ona specific epidemic threat. Pages in Italian and English, accessed be-tween 2014 and 2017, were used for Italian and US users, respectively.Wikipedia data were preferred to other public available datasets (e.g.,Google Trends Data, etc.) for the following reasons: a) Wikipedia vis-its may better reflect the need to acquire in-depth information about adiseases, instead of capturing recurrent accesses to an updated sourceof information on what is occurring during an epidemic; and b) accessof individuals is provided in absolute numbers, therefore, allowing acomparison of time-series associated with different countries and dis-eases. Accesses during 2016 on any Wikipedia page in two languageswere considered to assess, separately for the two countries, potentialdifferences in the individual use of Wikipedia across different days ofthe week (e.g., weekdays/weekend). Deviations with respect to weeklymeans were used to remove spurious fluctuations in Wikipedia accesses(details can be found in SI). Temporal changes of media attention toa given epidemic were modeled by using Google News platform [88].Specifically, a proxy of daily media response to potential threats wasdefined by the amount of articles released by websites based in thecountry containing the name of the considered epidemic in its head-line. A cross-correlation at different time lags was performed to assesspotential synchrony in the two types of signals.
supervised machine learning approach
We conduct a multi-linear regression analysis (L) in order to testwhether the dynamics of Wikipedia accesses mirror changes of the me-dia attention to a given disease. We consider the number of Wikipediapage views at time t as the response variable and the amounts of newsreleased at different times prior t as potential explanatory variables.Specifically a set of linear models was defined as follows:
Wt =T∑i=0
αiMt−i +W0
95

where Wt represents the daily number of Wikipedia page views at timet, αi are the regression coefficients; Mt is the number of news releasedat time t, T defines the number of days before t, in which media com-munication can affect Wikipedia accesses; and W0 reflects accesses toWikipedia in the absence of media coverage on a given disease. Bestvalues for T were obtained as a result of a multi-model informationapproach, based on the Akaike information criterion [89]. Details arereported in the SI.
modeling awareness as a contagion pro-cess
Word of mouth and media communications are both considered as plau-sible routes of transmission. The spread of information through theword of mouth was modeled by assuming homogeneous-mixing in thepopulation and a force of infection λSt = βS
N It, where βS represents thetransmission rate for the social contagion associated with peer-to-peerconversations between individuals.
As for the rate at which individuals becomes aware thanks to mediacommunication, we assume that the impact of news released at timet can be inflated by news released in the previous days. The force ofinfection from media communications is, therefore, defined as follows:
λNt =βNNMt
t−1∏i=t0
1 +Mie−ρ(t−i)
where βN is the transmissibility potential related to media coverageat time t, while the term in parentheses defines the amplifying mecha-nism due to past media communications. Specifically, the contributionof past communications to the amplification of the strength of news re-leased afterwards is assumed to exponentially decay with time passedsince their release: smaller the value of ρ, longer the influence of pastcommunications. For large value of ρ, the model considers only me-dia communication released at time t, i.e. λNt = βN
N Mt. Alternativeamplification mechanisms are considered in the SI. The two routes oftransmission are considered alone (models S and N) or combined in anested model (SN).
96

Briefly, in the proposed models, transitions between classes can be de-scribed by the following system of ordinary differential equations:
dS
dt= −λ (t)S (t) + νR (t) ;
dI
dt= λ (t)S (t)− γI (t) ;
dR
dt= γI (t)− νR (t) ,
where λ (t) represents the force of contagion at time t; 1γ is the average
time period, in which an aware individual can spread the informationthrough word of mouth; 1
ν is the average duration of immunity againstthe exposure to new information. Such a period of time can be inter-preted as the average time between two visits on a Wikipedia page bythe same individual. The proposed SIRS model, for specific choices offree model parameters, can degenerate into a SIR model (no immunitywaning), and even into a SI model (no immunity).
model calibration and goodness of fit
Each model was calibrated separately. Free model parameters were es-timated by using a Markov Chain Monte Carlo approach [95] appliedto the negative binomial Likelihood of the observed Wikipedia pageviews for each scenario. Goodness of fit was assessed through a wideset of statistical measures including, among others, the Akaike and De-viance Information Criteria (AIC, DIC), the mean absolute percentageerror (MAPE) and the Pearson correlation coefficient (R2) [66, 89, 97].Details can be found in SI.
97
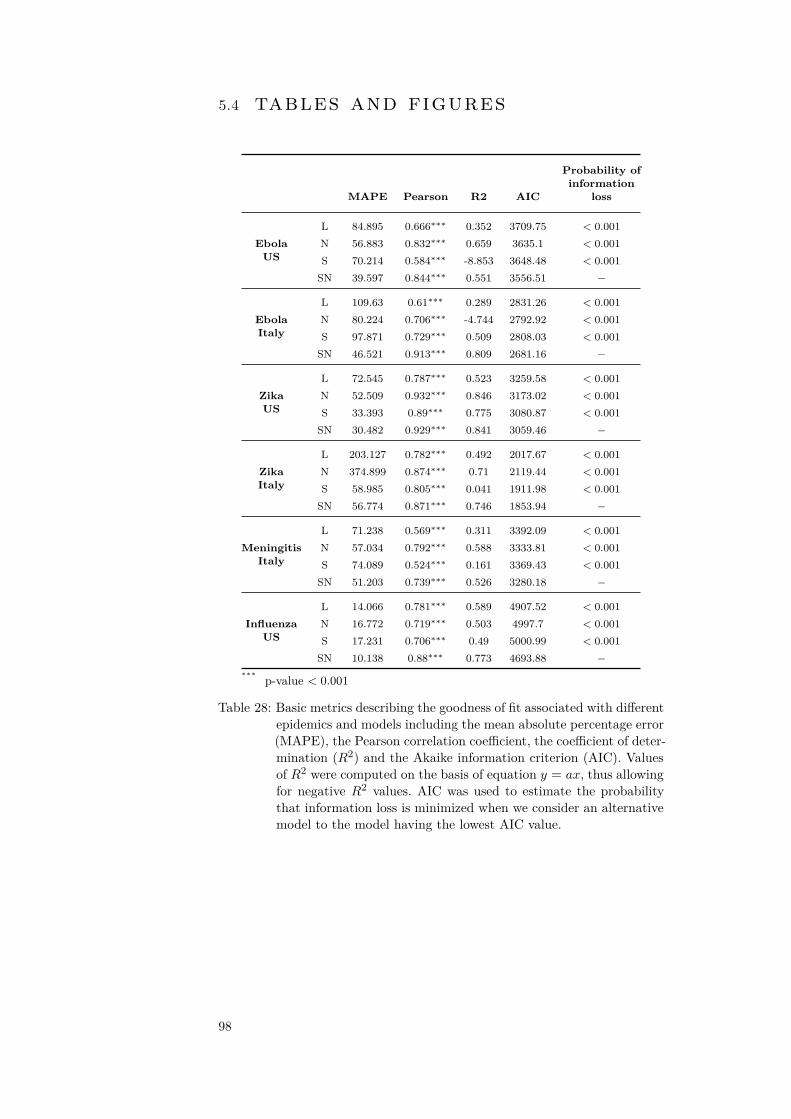
5.4 tables and figures
MAPE Pearson R2 AIC
Probability ofinformation
loss
EbolaUS
L 84.895 0.666∗∗∗ 0.352 3709.75 < 0.001N 56.883 0.832∗∗∗ 0.659 3635.1 < 0.001S 70.214 0.584∗∗∗ -8.853 3648.48 < 0.001SN 39.597 0.844∗∗∗ 0.551 3556.51 −
EbolaItaly
L 109.63 0.61∗∗∗ 0.289 2831.26 < 0.001N 80.224 0.706∗∗∗ -4.744 2792.92 < 0.001S 97.871 0.729∗∗∗ 0.509 2808.03 < 0.001SN 46.521 0.913∗∗∗ 0.809 2681.16 −
ZikaUS
L 72.545 0.787∗∗∗ 0.523 3259.58 < 0.001N 52.509 0.932∗∗∗ 0.846 3173.02 < 0.001S 33.393 0.89∗∗∗ 0.775 3080.87 < 0.001SN 30.482 0.929∗∗∗ 0.841 3059.46 −
ZikaItaly
L 203.127 0.782∗∗∗ 0.492 2017.67 < 0.001N 374.899 0.874∗∗∗ 0.71 2119.44 < 0.001S 58.985 0.805∗∗∗ 0.041 1911.98 < 0.001SN 56.774 0.871∗∗∗ 0.746 1853.94 −
MeningitisItaly
L 71.238 0.569∗∗∗ 0.311 3392.09 < 0.001N 57.034 0.792∗∗∗ 0.588 3333.81 < 0.001S 74.089 0.524∗∗∗ 0.161 3369.43 < 0.001SN 51.203 0.739∗∗∗ 0.526 3280.18 −
InfluenzaUS
L 14.066 0.781∗∗∗ 0.589 4907.52 < 0.001N 16.772 0.719∗∗∗ 0.503 4997.7 < 0.001S 17.231 0.706∗∗∗ 0.49 5000.99 < 0.001SN 10.138 0.88∗∗∗ 0.773 4693.88 −
∗∗∗p-value < 0.001
Table 28: Basic metrics describing the goodness of fit associated with differentepidemics and models including the mean absolute percentage error(MAPE), the Pearson correlation coefficient, the coefficient of deter-mination (R2) and the Akaike information criterion (AIC). Valuesof R2 were computed on the basis of equation y = ax, thus allowingfor negative R2 values. AIC was used to estimate the probabilitythat information loss is minimized when we consider an alternativemodel to the model having the lowest AIC value.
98

Figure 13: Proxies of health threat awareness and media attention for the il-lustrative case of Ebola epidemic. A) Red line represents the dailynumber of page views on Wikipedia articles related to Ebola infec-tion during 2014 from the English version of Wikipedia [86]. Greyline represents the daily number of news released on Ebola in theUS, as obtained from the Google News platform [88]. Dotted linesindicate noticeable events associated with the West Africa Ebolaepidemic. B) as A), but for the Italian version of Wikipedia andnews released in Italy. C) Comparison of two different proxies ofmedia attention to the Ebola epidemic. Grey line represents thedaily number of news released on Ebola in the US, as obtained fromthe Google News platform [88]. Blue line indicates the number ofEbola related videos per day, from Fox News and MSNBC [77].
Figure 14: SN-model estimates for Ebola (A), Zika (B), Influenza (C) in theUS and for Ebola (D), Zika (E), Meningitis (F) in Italy. In eachpanel, blue bars represent the daily number of Wikipedia pageviews over time for the considered infection. The blue lines andthe shaded areas refer to the average and the 95% CI of estimatesas obtained with the SN-model on the daily number of informedindividuals seeking information on Wikipedia. Bubble plots rep-resent the median incidences of informed individuals. Yellow andred bubbles refer to incidences of informed individuals by mediacommunications and through social contagion, respectively.
99

Figure 15: Percentage error between model estimates and data records on thenumber of Wikipedia page views over time, as obtained for differentmodels when considering the Ebola awareness epidemic in the US(A) and in Italy (B).
100

Figure 16: Posterior distribution (2.5%, 25%, 75%, and 97.5% quantiles andmean) of fraction of informed individuals using Wikipedia (A), thetransmissibility potential related to media communications (B),the doubling time associated with the social contagion mechanism(C), the fraction of informed individuals due to media communi-cations (D), as obtained for the different epidemic scenarios con-sidered with the SN-model.
101

Scenario Model MAPE
Pearsoncorrelationcoefficient R2
80/20 Baseline 80/20 Baseline 80/20 Baseline
EbolaUS
L 258.46 188.22 0.85∗∗∗ 0.85∗∗∗ -2.08 -0.53SN 46.3 31.93 0.91∗∗∗ 0.92∗∗∗ 0.7 0.83
EbolaItaly
L 382.95 291.96 0.77∗∗∗ 0.78∗∗∗ -3.74 -1.58SN 46.91 38.88 0.94∗∗∗ 0.94∗∗∗ 0.81 0.86
ZikaUS
L 122.38 35.01 0.50∗ 0.53∗ -17.06 -0.72SN 53.61 30.23 0.90∗∗∗ 0.87∗∗∗ -4.59 -1
ZikaItaly
L 121.08 47.77 0.57∗∗ 0.63∗∗ -1.59 0.34SN 42.38 40.64 0.90∗∗∗ 0.90∗∗∗ 0.27 0.64
MeningitisItaly
L 230.92 124.91 0.77∗∗∗ 0.77∗∗∗ -10.57 -1.99SN 69.77 41.53 0.49∗∗ 0.67∗∗∗ -0.27 0.4
InfluenzaUS
L 21.48 19.91 0.26∗∗ 0.27∗∗ -1.56 -1.22SN 16.92 13.75 0.48∗∗∗ 0.48∗∗∗ -0.29 0.09
∗p-value < 0.1
∗∗p-value < 0.05
∗∗∗p-value < 0.001
Table 29: Statistical measures on the performances of the SN-Model and thesupervised machine learning approach (L), as obtained for differentepidemic scenarios. Each measure was obtained for two distinct cal-ibration procedures. In the first one (labeled as 80/20 in the table),model parameters were calibrated using only 80% of data; in thesecond (baseline) model parameters were calibrated using 100% ofdata. In both cases, performances were assessed only in the last 20%data points.
102


6C O N C L U S I O N S
In this thesis we have explored the idea of extracting knowledge fromlinks in Wikipedia.
In the first chapter, we have laid the foundation of our work by buildinga dataset called WikiLinkGraphs, which makes available the com-plete graph of links between Wikipedia articles in the nine largest lan-guage editions.
This dataset overcomes the limitations of previous work by being moreclean, since we have removed templates and resolved redirects, andcomplete, since we have analyzed over 1 billion revisions to build atemporal graphs starting since the inception of Wikipedia. We providedboth yearly snapshots and the raw dataset containing the completehistory of every single link within the encyclopedia.
In the second chapter, we introduced CycleRank, a novel algorithmbased on cyclic paths that can be used to find the most relevant nodesin the Wikipedia link network related to a topic. Given a referencenode in a directed graph, the algorithm finds all simple cycles thatgo through the reference node and assigns a score to each node thatbelong to these cycles. The algorithm is simple yet flexible: it has onlyone parameter, K maximum cycle length that we are interested to find,but its behavior can be regulated also by changing the function used toassign scores to nodes. We believe that this flexibility can be leveragedwhen applying CycleRank to graphs with diverse characteristics.
We have carried out an extensive comparison between CycleRank, Page-Rank, and its variants such as CheiRank, and 2DRank. We presentedboth a qualitative analysis over several topics and a quantitative eval-uation based on three measures with corresponding ground truth data:ClickStream, See-Also and top-indegree pages. These measure encapsu-late respectively the ability of the algorithm to maintain the relativeimportance between articles, its ability to find related content, and theability to avoid incorporating in the results very popular topics that arenot well-tailored to the particular under consideration, we have shownthat CycleRank is more robust than other baselines with respect to thisproblem. Furthermore, we have shown that our algorithm is faster thanthe alternatives, offering order-of-magnitude speed-ups with respect toa library implementation of Personalized PageRank.
103

In other words, CycleRank is a viable alternative to PageRank, espe-cially in the case of graphs where the role of inlinks and outlinks iscomparable; we believe that it can be easily applied to similar contexts,such as knowledge bases.
In the third chapter we have show how to use CycleRank to characterizea topic through inspecting its connections to other topics. We believethat this work offers relevant insights on the framing of key social issuesrelated to the Next Generation Internet, and at the same time it opensup to further research, either replicating the analysis for other topics,or building on the datasets and code provided to extend our methodsor develop new ones.
Finally, in the last chapter we have show how to use other data fromthe Wikipedia ecosystem, namely visitors log, to understand human-behavior and phenomena like the spreading of diseases.
As future work we plan to show how CycleRank can be used to findthe most relevant input for a machine learning system. Confronted withthe task of estimating the level of influenza-like illness (ILI) in Europe,we select the most relevant articles concerning Influenza. Once selectedthe article we used a dataset with the number of accesses to Wikipediaarticles for each day between December 2007 and August 2017 and com-pared these data to official ILI activity levels provided by the EuropeanCentre for Disease Control and Prevention (ECDC). We aim to answerthe following question: “Do the pages found by CycleRank correlate tothe number of cases of ILI measured through the article views?”
As a final remark we would like to highlight that all the code written byus to produce the works presented in this thesis has been made publiclyavailable. This also applies to the dataset we have produced, not justthe WikiLinkGraphs dataset but all the supporting datasets as well.We think that this creates a number of research opportunities that welist hear in the hope that they will pick the interest of the broaderresearch community:
• the WikiLinkGraphs dataset is currently made available forthe nine largest Wikipedia language editions, however it can beextended to other language editions, or by creating snapshotswith a finer temporal granularity. Being a very large networkof concepts, the WikiLinkGraphs dataset can benefit severalcommunities such as the Semantic Web, the Artificial Intelligence,and natural language processing research communities.
• the version of CycleRank presented in this thesis is based ona simple exponentially-decaying scoring function, we have alsotested a linear-decaying scoring function; while we have empiri-cally validated the results, many variations and extensions couldbe explored.
104

• we have assumed that the starting point for CycleRank is a singlereference node. However, as in the case of Personalized PageRank,it would be possible to take a group of articles as seed. Then, allcycles around each of the seed nodes could be considered. Alterna-tively, instead of counting cycles, one could count all paths fromany node in the seed to any other node in the seed.
• another possible variant would be to specify two different nodes(or groups of nodes) as source and target, and to consider allpaths from the source to the target within K steps. In this way,the measure would not only represent the relevance of other nodeswith respect to a given reference node, but the (directed) relation-ship between two nodes or groups of nodes. This would help toanswer questions such as: “Which are the most relevant conceptsconnecting Artificial Intelligence and Human rights, and whichare the most relevant concepts on the other way round”?
• we think that CycleRank provides a foundation that could befurther explored to provide a family of algorithms adapted fordifferent graphs and use cases. The suitability of different solu-tions could also be studied focusing on the structural propertiesof the network, such as its link density or clustering coefficient.
We hope that future research will continue to be shared as openly aspossible and we hope to have provided with this thesis a good exampleof the benefits of Open access and Open Science.
105


Part IV
A P P E N D I X


AT H E E N G I N E R O O M E UP RO J E C T
In this Appendix, we present additional results from the EngineroomEU project, covered in Chapter 4. For each keyword we present: a lon-gitudinal analysis across several years on English Wikipedia, coveringfrom the creation on the article to 2018; and a cross-language analysisover the most recent data and all 9 languages available.
a.1 algorithmic bias
In the case of Algorithmic bias, the article was not existing (or not suffi-ciently developed as to have some loops) in English before March 2017,and in the other languages before March 2018. Therefore, we only showresults for the latest snapshot of the English Wikipedia in our dataset(March 2018), and do not perform cross-language or longitudinal anal-ysis for this topic.
On the other hand, we observe that in March 2018 the article wasalready well linked to and from relevant concepts, as it can be observedlooking at the network. This is an interesting indicator of the quicklygrowing attention around this topic.
Figure 17 shows the network of article with CycleRank score greaterthan zero. The main cluster (shown in magenta) containing the articleAlgorithmic bias itself includes as the most relevant concept Machinelearning, and then tech companies such as “Google,” “Facebook,” “Ap-ple Inc,” “Amazon,” and general concepts such as “Internet of Things”.It also contains the article about the “GDPR”. The second conceptfor importance after Machine learning is “Artificial intelligence,” atthe center of a cluster (shown in green) including concepts relatedto Ethics of artificial intelligence. A smaller cluster (shown in cyan)contains general concepts including “Algorithm,” “Computer science,”“Cybernetics,” “Complex systems,” “Social science”. Finally, a red clus-ter includes concepts with a low CycleRank score from the field ofstatistics; the most relevant concept in the cluster is “Credit score”.
109

Figure 17: Graph induced by the nodes with non-zero CycleRank score withreference node r = “Algorithmic bias” and K = 4 on EnglishWikipedia, over the snapshot of March 1st, 2018. Colors representsclusters calculated with the Louvain algorithm. The dimension ofthe nodes and their labels depends on the CycleRank score.
a.2 cyberbullying
Figure 18 represents the network of articles around the article “Cy-berbullying” with CycleRank score greater than zero. We see that thisnetwork is characterized by 5 clusters:
1. (purple) groups news media, public figures and what could bedefined the “mainstream”: “CNN,” “The New York Times,”“ABC News,” “The Guardian,” “Barack Obama,” and “Em-manuel Macron”, “Pope Francis”, but also “Arab Spring” and“First Amendment of the United States Constitution” ;
2. (green) is related to bullying and harassment: “Stalking,” “Misog-yny,” “Suicide of Jadin Bell,” “Suicide of Megan Meier,” “Sui-cide of Ryan Halligan,” “Suicide of Tyler Clementi” ;
3. (cyan) groups concepts related to the Internet: “World WideWeb,” “Google,” “Internet Service provider.” and “HTML” ;
4. (orange) is similar to the previous but it is specifically dedicatedto social media: “Facebook,” “Twitter,” “MySpace,” “4chan,”“Mashable,” “Blog,” “Internet meme” ;
5. (dark green) groups concepts related to online gaming andgames: “Gamergate controversy,” “Youtube,” “Video game
110

culture,” “Call of Duty,” “League of Legends,” and “Onlinegame”.
Figure 18: Graph induced by the nodes with non-zero CycleRank score withreference node r = “Cyberbullying” and K = 4 on English Wi-kipedia, over the snapshot of March 1st, 2018. Colors representsclusters calculated with the Louvain algorithm. The dimension ofthe nodes and their labels depends on the CycleRank score.
a.2.1 longitudinal analysis
Tables 36 and 37 show how the context for the concept of “Cyberbully-ing” has changed over time.
We see how the top-10 articles contain references to prominent eventsand people that led the public discourse about harassment online andcyberbullying:
• 2006: “Eric Harris and Dylan Klebold,” the shooters of theColumbine High School massacre;
111

• 2008: “Louise Burfitt-Dons,” a British writer and humanitarianmostly known for her work anti-bullying work and her charity“Act Against Bullying”, which appears in the terms of 2009 and2010;
• 2009: “Suicide of Megan Meier,” the case of a 13-year-old girlwho committed suicide in 2006. The suicide was attribute to cy-berbullying on MySpace and online harassment and the episodeled then to a court case that was adjudicated in 2009;
• 2010: “Suicide of Ryan Halligan,” the case of a 13-year-old boywho committed suicide in 200 after being bullied in person andonline. The case gained prominence in the following years as hisfather lobbied local politicians to introduce anti-bullying and sui-cide prevention laws;
• 2012: “Suicide of Tyler Clementi,” the case of a 18-years-old boywho committed suicide after an intimate video of him was di-vulged on Twitter without his consent.
Over time several social media appear in prominent positions: “MyS-pace” (2011), “Facebook” (2011, 2013-2017) and “Twitter” (2018),suggesting that although platform usage changed, and new platformsemerged during the years, the phenomenon persisted permeatingdifferent online spaces.
a.2.2 cross-language analysis
The cross-language analysis results are presented in Table 38. The page“Cyberbullying” was present in all the 9 language studied in the snap-shot from March 1st, 2018. The most frequent result in the top-10is “Facebook”, highlighting the prominence of the role that the socialnetwork is covering with regards to the topic of Cyberbullying. AlsoTwitter, WhatsApp and Wikipedia appear in the results along withthe more generic terms “SMS”, “chat”, and “blog”. Some language edi-tions such as English, German and Swedish seem to highlight more thetechnological aspects and terms related to the online context, whileother such as Spanish or French give more prominence to concepts re-lated to the phenomenon of bullying, such as suicide, intimidation ordifferent kinds of harassment.
112

rank
2006
2007
2008
2009
2010
2011
2012
1Cyb
erbu
llying
Cyb
erbu
llying
Cyb
erbu
llying
Cyb
erbu
llying
Cyb
erbu
llying
Cyb
erbu
llying
Cyb
erbu
llying
2Com
putercrim
eCyb
erstalking
Act
Against
Bul-
lying
Cyb
erstalking
Cyb
erstalking
Suicideof
Megan
Meier
Harassm
ent
3Cyb
erstalking
Harassm
ent
bycompu
ter
Cha
ppaq
ua,New
York
Cyb
ercrim
eCyb
ercrim
eCyb
erstalking
Suicideof
Megan
Meier
4Instan
tmessag-
ing
Harassm
ent
Louise
Burfitt-
Don
sSu
icideof
Megan
Meier
Suicideof
Megan
Meier
Harassm
ent
Cyb
erstalking
5Ta
lker
Com
putercrim
eBill
Clin
ton
Act
Against
Bul-
lying
Act
Against
Bul-
lying
Stalking
Stalking
6Cyb
erterrorism
Sexu
alha
rass-
ment
Hatespeech
Cyb
erterrorism
Suicide
ofRya
nHallig
anFa
cebo
okThreat
7Internet
Relay
Cha
tBullying
Janu
ary31
Stalking
Stalking
Myspa
ceAct
Against
Bul-
lying
8Onlinechat
Cyb
erterrorism
2007
Hatespeech
Onlinepred
ator
Suicide
ofRya
nHallig
anSu
icide
ofTyler
Clementi
9Eric
Harris
and
Dylan
Klebo
ldBullying
Cha
ppaq
ua,New
York
Cyb
erterrorism
Cyb
erstalking
legislation
Scho
olviolen
ce
10Bullying
Hategrou
pHarassm
ent
Ano
nymou
s(group
Social
softw
are
Bullying
Table30:To
p10
mostrelevant
concepts
byCycleRan
kscorewith
respectto
“Cyberbully
ing,”alon
gdiffe
rent
yearly
snap
shotsof
theW
ikiLinkG
raph
sda
taset(2006-2012).
113

rank2013
20142015
20162017
2018
1Cyberbullying
Cyberbullying
Cyberbullying
Cyberbullying
Cyberbullying
Cyberbullying
2World
Wide
Web
World
Wide
Web
InternetInternet
InternetInternet
3Socialnetw
orkingservice
Socialnetworking
serviceWorld
Wide
Web
World
Wide
Web
Socialmedia
Socialmedia
4Facebook
FacebookEmail
Socialnetworking
serviceWorld
Wide
Web
World
Wide
Web
5Cyberstalking
Facebook2010s
Blog
2010s6
Anonym
ous(group)
Cyberstalking
Socialnetworking
serviceFacebook
2010sBlog
7Suicide
ofMegan
Meier
Microsoft
Cyberstalking
Bullying
FacebookTw
itter
8Suicide
ofTyler
Clem
entiSuicide
ofMegan
Meier
Anonym
ous(group)
Socialnetworking
serviceBullying
9Microsoft
Online
game
Microsoft
Cyberstalking
Anonym
ous(group)
Socialnetworking
service10
AOL
Adolescence
Socialmedia
1990sBullying
Anonym
ous(group)
Table31:
Top10
most
relevantconcepts
byCycleR
ankscore
with
respectto
“Cyberbullying,”
alongdifferent
yearlysnapshots
oftheW
ikiLinkGraphs
dataset(2013-2018).
114

rank
deen
esfr
itnl
plru
sv
1Cyb
er-
Mob
bing
Cyb
erbu
llying
Ciberacoso
Cyb
erha
rcèlem
entCyb
erbu
llism
oCyb
erpe
sten
Cyb
erprzemoc
Internet-
travlja
Nätmob
bning
2Fa
cebo
okInternet
Acoso
escolar
Sexism
eInternet
SociaalnetwerksiteK
omun
ikator
internetow
yTr
avlja
Nätha
t
3So
ziales
Net-
zwerk
(Inter-
net)
Social
med
iaAcoso
sexu
alViolence
Cha
tFa
cebo
okInternet
Mob
bing
World
Wide
Web
4Mob
bing
World
Wide
Web
Acoso
psi-
cológico
Ado
lescen
ceMalware
Twitt
er1996
Bullin
gInternettroll
5Internet
2010s
Hostig
amiento
Pseud
onym
eFa
cebo
okSo
cialemed
iaGG
(ko-
mun
ikator
internetow
y)
Kibermob
bing
Netikett
6Online-
Com
mun
ityBlog
Acoso
labo
ral
Harcèlement
scolaire
Bullismo
Cyb
erba
iting
SMS
Person
al’nyj
komp’juter
Flashb
ack
Fo-
rum
7So
cial
Med
iaTw
itter
Abu
sosexu
alPa
trickBruel
Wha
tsApp
Pesten
(ged
rag)
Kom
unikator
Tlen.pl
Internet
E-post
8Cha
tBullying
Suicidio
Najat
Valla
ud-
Belka
cem
SMS
Bezem
enFa
cebo
okSa
mou
bijstvo
Mob
bning
9Mob
bing
inde
rSchu
leSo
cial
net-
working
service
Acoso
familiar
Intim
idation
Blog
Stalking
Filtr
rodzinny
Kom
p’juternaja
revolju
cija
Web
bplats
10Se
xting
Ano
nymou
s(group
)Acosado
rHarcèlement
moral
Suicidio
Wikiped
iaAno
nimow
ość
Massovo
eub
i-jstvo
vMjun-
hene
(2016)
Facebo
ok
Table32:To
p10
mostrelevant
concepts
byCycleRan
kscorewith
respectto
“Cyberbully
ing,”across
diffe
rent
Wikipedia
lang
uage
edition
s.
115
a.3 computer security
Figure 19 represents the network of articles around the article “Com-puter security” with CycleRank score greater than zero. We see thatthis network is characterized by 7 clusters:
1. (purple) groups concepts related to computer systems in generalsuch as: “IBM,” “Microsoft Windows,” “Operating system,” and“Linux distribution” ;
2. (green) covers the political side with concepts such as “Hack-tivism”, “Cyberwarfare” or “Cyberterrorism”, and relevantactors including people, companies, public agencies and states:“United States,” “Russia,” “Cyberwarfare in China,” “Wik-ileaks,” “Anonymous (group),” “Edward Snowden,” “VerizonCommunications,” “Facebook,” “LinkedIn,” “Federal Bureau ofInvestigation,” and “FBI–Apple encryption dispute” ;
3. (cyan) includes cybersecurity threats and related concepts suchas: “Trojan horse (computing),” “Phishing,” “Malware,” “Ran-somware,” “Denial of service attack,” “Botnet,” and “Antivirussoftware” ;
4. (orange) groups terms related to defense techniques and tech-nologies to protect against cybersecurity threats: “Encryption,”“Transport Layer Security,” “Password,” “Authentication,”“Smart card,” “One-time password,” and “RSA (cryptosystem)” ;
5. (maroon) comprises concepts related to telecommunications andnetworks: “Internet,” “Computer network,” “Firewall,” “MACaddress,” “Wi-Fi,” and “Proxy server” ;
6. (magenta) groups concepts related to consumer electronics, com-panies and consumer software like operating systems and Inter-net browsers: “Microsoft,” “Internet Explorer,” “Windows XP,”“Windows 7,” “Apple Inc.,” “Google,” and “Smartphone” ;
7. (dark green) groups universities, colleges, and other conceptsrelate to academia: “Massachusetts Institute of Technology,”“Carnegie Mellon University,” “Turing Award,” “Bell Labs,”and “Cornell University”.
a.3.1 longitudinal analysis
Tables 33 and ?? present the results of the longitudinal analysis over theyears from 2002 to 2018. The most remarkable result is that until 2007computer security was centered primarily around computer viruses and
116

Figure 19: Graph induced by the nodes with non-zero CycleRank score withreference node r = “Computer security” and K = 4 on EnglishWikipedia, over the snapshot of March 1st, 2018. Colors representsclusters calculated with the Louvain algorithm. The dimension ofthe nodes and their labels depends on the CycleRank score.
ways to contain them, such as “Trusted system”. Since 2008 onwardsthe most prominent topic connected to computer security was “Inter-net” reflecting how the internet as become the channel through whichcomputer threats are propagated. In the same sense, we highlight theappearance of Facebook in 2016 and 2017.
a.3.2 cross-language analysis
The article related to “Computer security” appears, albeit in differ-ent forms and with difference nuances, in all the 9 languages studied.The results of the cross-language analysis are presented in Tables ??and ??. The results cover a wide list of terms related to computer secu-rity, without any specific term appearing with higher frequency acrosslanguages.
We can see how different language editions give prominence to differentconcepts; for example, “Hacker” is prominent in Spanish, and in the 8thposition in Russian; “Cryptography” appears in German and Spanish,and has a prominent position in Polish; operating systems appear inprominent position in the Swedish Wikipedia, while the top elementsin the ranking for the French edition are mostly very generic concepts.
117

rank2002
20032004
20052006
20072008
20092010
1Com
puterse-
curityCom
puterse-
curityCom
puterse-
curityCom
puterse-
curityCom
puterse-
curityCom
puterse-
curityCom
puterse-
curityCom
puterse-
curityCom
puterse-
curity2
Com
putersci-
enceSecurity
engi-neering
Com
puterin-
securityCom
puterin-
securityInternet
1995Internet
Com
puterCom
puter
3Com
putingCom
puterin-
securitySecurity
engi-neering
Microsoft
Cryptography
Cryptography
Cryptography
InternetInternet
4Mathem
aticsSecure
crypto-processor
Com
putingCryptography
Microsoft
Window
sMicrosoft
Window
sCom
puterin-
securityCryptography
Operating
sys-tem
5Cracker
Cryptography
Com
putersci-
enceHacker
Com
puterin-
securityCom
puterin-
securityOperating
sys-tem
Microsoft
Window
sCom
puterin-
security6
Microsoft
Defensive
pro-gram
ming
Buffer
over-flow
Securityengi-
neeringCom
puterOperating
sys-tem
Com
puterOperating
sys-tem
Cryptography
7One-tim
epad
Trustedsys-
tem1995
Com
putingMicrosoft
Com
puterMicrosoft
Window
sCom
puterin-
securityInform
ationsecurity
8Bruce
SchneierMultics
1970s1995
Com
putingMicrosoft
Com
putingCom
putersci-
encePassw
ord
9Com
putersys-tem
Microsoft
FederalStan-
dard1037C
Buffer
over-flow
Buffer
over-flow
Com
putervirus
Com
putervirus
Com
putingCom
putersci-
ence10
Hacking
1970sSecurity
Com
putersci-
enceCom
putervirus
FreeBSD
Buffer
over-flow
Password
Buffer
over-flow
Table33:
Top10
mostrelevantconceptsby
CycleR
ankscore
with
respectto“C
omputer
security,”along
differentyearlysnapshotsofthe
WikiLinkG
raphsdataset
(2002-2010).
118
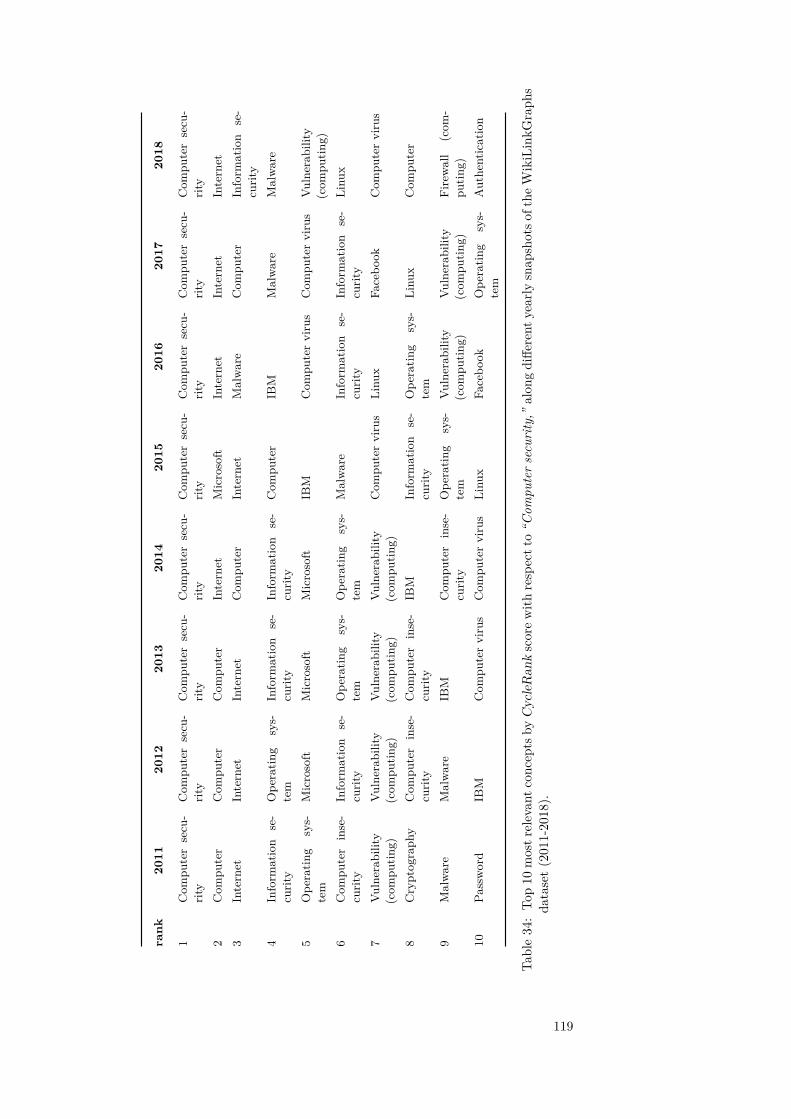
rank
2011
2012
2013
2014
2015
2016
2017
2018
1Com
putersecu-
rity
Com
putersecu-
rity
Com
putersecu-
rity
Com
putersecu-
rity
Com
putersecu-
rity
Com
putersecu-
rity
Com
putersecu-
rity
Com
putersecu-
rity
2Com
puter
Com
puter
Com
puter
Internet
Microsoft
Internet
Internet
Internet
3Internet
Internet
Internet
Com
puter
Internet
Malware
Com
puter
Inform
ation
se-
curit
y4
Inform
ation
se-
curit
yOpe
ratin
gsys-
tem
Inform
ation
se-
curit
yInform
ation
se-
curit
yCom
puter
IBM
Malware
Malware
5Ope
ratin
gsys-
tem
Microsoft
Microsoft
Microsoft
IBM
Com
putervirus
Com
putervirus
Vulnerab
ility
(com
putin
g)6
Com
puter
inse-
curit
yInform
ation
se-
curit
yOpe
ratin
gsys-
tem
Ope
ratin
gsys-
tem
Malware
Inform
ation
se-
curit
yInform
ation
se-
curit
yLinu
x
7Vu
lnerab
ility
(com
putin
g)Vu
lnerab
ility
(com
putin
g)Vu
lnerab
ility
(com
putin
g)Vu
lnerab
ility
(com
putin
g)Com
putervirus
Linu
xFa
cebo
okCom
putervirus
8Cryptograph
yCom
puter
inse-
curit
yCom
puter
inse-
curit
yIB
MInform
ation
se-
curit
yOpe
ratin
gsys-
tem
Linu
xCom
puter
9Malware
Malware
IBM
Com
puter
inse-
curit
yOpe
ratin
gsys-
tem
Vulnerab
ility
(com
putin
g)Vu
lnerab
ility
(com
putin
g)Firewall
(com
-pu
ting)
10Pa
ssword
IBM
Com
putervirus
Com
putervirus
Linu
xFa
cebo
okOpe
ratin
gsys-
tem
Authe
ntication
Table34:To
p10
mostr
elevan
tcon
ceptsb
yCycleRan
kscorewith
respectt
o“C
ompu
tersecurity,”
alon
gdiffe
rent
yearly
snap
shotso
fthe
WikiLinkG
raph
sda
taset(2011-2018).
119

rankde
enes
frit
nlpl
rusv
1Inform
ationssicherheitCom
puterse-
curitySeguridad
in-form
áticaSécurité
dessystèm
esd’inform
ation
Sicurezzainform
aticaCom
puterbeveiligingBezpieczeństw
oteleinform
aty-czne
Kom
p’juternajabezopasnost’
Datasäkerhet
2Com
puterInternet
Hacker
Sécuritédes
donnéesInternet
Com
putervirusInform
atykaInternet
InternetExplorer
3Datenschutz
Information
securityMalw
areLogiciel
Sistema
oper-ativo
Antim
alwaresoftw
areKryptologia
Sistemnyj
ad-ministrator
Window
sVista
4Netzw
erkprotokollMalware
Virus
infor-mático
SécuritéInform
aticaCom
puterkrakerZaporasieciow
aInform
acionnajabezopasnost’
Linux
5Com
puterwurm
Vulnerability(com
puting)Agujero
dese-
guridadSystèm
ed’inform
ationServer
Informatica
LinuxVsem
irnajapautina
Internet
6Schadprogram
mLinux
Software
libreFuited’inform
ationAntivirus
Antivirussoftw
areHaker
(bez-pieczeństw
okom
put-erow
e)
Window
sNT
Brandvägg
7Personal
Fire-wall
Com
putervirus
Criptografía
Politiquede
sécuritédu
système
d’information
Firewall
InternetExplorer
Adm
inistrator(inform
atyka)Celostnost’in-
formacii
Mac
OSX
8Kryptographie
Com
puterExploit
Sécuritéinfor-
matique
Malw
areMalw
areGSM
Haker
Datavetenskap
9W
irelessLocal
Area
Netw
ork
Firewall(com
-puting)
Cortafuegos
(informática)
Vulnérabilité(inform
a-tique)
Autenticazione
Informatiebeveiliging
FederalIn-
formation
Processing
Standard
Bezopasnost’
Antivirusprogram
10IT
-Sicherheitsaudit
Authentication
Unix
Capital
im-
matériel
Software
InternetPoczta
elek-troniczna
Dostupnost’
informacii
Dator
Table35:
Top10
most
relevantconcepts
byCycleR
ankscore
with
respectto
“Com
putersecurity,”
acrossdifferent
Wikipedia
languageeditions.
120

a.4 green computing
Figure 20 represents the network of articles around the article “Greencomputing” with CycleRank score greater than zero. We see that thisnetwork is characterized by 6 clusters:
1. (purple) groups concepts related to the environment and energyefficiency: “Green computing,” “Restriction of Hazardous Sub-stances Directive,” “Efficient energy use,” “Electronic waste,”“United States Environmental Protection Agency,” “Energy con-servation,” and “Sustainability” ;
2. (green) includes concepts related to consumer electronics andcompanies: “Desktop computer,” “Personal computer,” “Dell,”“Hewlett-Packard,” and “Hardware” ;
3. (cyan) groups concepts related to electronics manufacturer andcomponents: “Intel,” “Computer,” “Power management,” “Cen-tral Processing Unit,” “Graphics Processing Unit,” and “Low-power electronics” ;
4. (orange) includes concepts related to computer software, softwarecompanies and software aspects of power management: “Operat-ing system,” “Linux,” “Microsoft Windows,” “Sleep mode,” “Hi-bernation (computing),” “Sun Microsystem,” and “Microsoft” ;
5. (dark green) includes big hardware manufacturers and supercom-puters: “IBM,” “Supercomputer,” “Performance per watt,” and“Mainframe computer” ;
6. (magenta) groups concepts related to data centers, the Internetand business aspects related to green computing: “Server farm,”“Data center,” “Internet,” and “Business Intelligence”.
a.4.1 longitudinal analysis
Tables 36 and 37 present the results for the longitudinal analysis for thekeyword “Green computing” from 2006 to 2018. Over the course of theyears, the top-10 results with the highest CycleRank score are mostlyterms related to power consumption of personal computers (“Powermanagement”, “Energy Star”, “Sleep mode”, and “Standby power”). Wenote the appearance from 2012 onwards of the article “Supercomputer”and, at the same time, the presence of the chip-manufacturing company“Intel”.We attribute this change to the fact that the context of the topic“Green computing” has shifted from a personal computer setting to acloud infrastructure (“Software As A Service”), where the performanceand the environmental impact of servers providing cloud services has
121

Figure 20: Graph induced by the nodes with non-zero CycleRank score withreference node r = “Green computing” and K = 4 on EnglishWikipedia, over the snapshot of March 1st, 2018. Colors representsclusters calculated with the Louvain algorithm. The dimension ofthe nodes and their labels depends on the CycleRank score.
gained prominence. In fact, we note the appearance in 2018 of the page“Performance per watt”, which is a major issue in the discussion aboutcloud services and IoT devices.
a.4.2 cross-language analysis
The cross language comparison of results is presented in Table38. Onlythe German, English, French, Italian, and Spanish editions of Wiki-pedia have an article dedicated to “Green computing”. We see that inGerman, English, and Spanish Wikipedia the article about “Green com-puting” has strong ties with the context of cloud computing with severalpages related to it appearing in the top-10 results; in German: “Rechen-zentrum” (“Data center”), “Thin Client,” “Virtualisierung” (“Virtual-isation,”) “Server,” and “Cloud Computing;” in English: “Supercom-puter,” “Performance per watt,” and “Intel;” in Spanish: “Virtual-ización” (“Virtualisation,”) “Apple,” “Google,” and “Cliente liviano”(“Thin client”).
Italian Wikipedia has a decidedly more environmental focus withprominent articles being: “Ambientalismo” (“Environmentalism,”)“Rifiuti di apparecchiature elettriche ed elettroniche” (“Electronicwaste,”) “Riciclaggio dei rifiuti” (“Recycling,”) and “Normativacomunitaria RoHS” (“RoHS Directive”, a EU directive that restrictsthe use of six hazardous materials in the manufacture of various typesof electronic and electrical equipment).
122

French Wikipedia has, instead, a more general focus with “Développe-ment durable” (“Sustainable development,”) “Cloud computing,” “Loithe Moore” (“Moore’s Law,”) “Entreprise” (“Enterprise,”) and “Tech-nologies de l’information et de la communication” (“Information andCommunication Technologies”).
a.5 internet privacy
Figure 21 represents the network of articles around the article “Internetprivacy” with CycleRank score greater than zero. We see that thisnetwork is characterized by 7 clusters:
1. (purple) consists of social networking services and companies, to-gether with major mobile platforms (notably, Google is not inthis cluster): “Facebook,” “Twitter,” “Reddit,” “Youtube,” “Ap-ple Inc.,” “iPhone,” “Android (operating system),” and “iOS” ;
2. (green) groups concepts related to the WWW and its technolo-gies, and web browsers (notably, Microsoft is included in thiscluster): “World Wide Web,” “HTTP cookie,” “Web browser,”“Adobe Flash Player,” “HTML,” “Javascript,” “Google Chrome,”“Mozilla,” and “Firefox” ;
3. (cyan) includes terms related mostly to U.S. politics andinstitutions, with a major focus on former president BarackObama: “Barack Obama,” “Presidency of Barack Obama,”“Supreme Court of the United States,” and “United States SenateCommittee on the Judiciary” ;
4. (orange) groups technology for privacy protection on the Inter-net (the term Internet itself is included in this cluster): “Tor(anonymity network)”, “Anonymous P2P”, “Proxy server,” and“Internet censorship” ;
5. (maroon) collects Google and other web search engines: “Google,”“Web search engine,” “DuckDuckGo,” and “Bing” ;
6. (magenta) includes the concept of Internet privacy itself togetherwith surveillance, so it includes: “Privacy,” “Mass surveillance,”“PRISM (surveillance program),” “Edward Snowden,” and “Na-tional Security Agency” ;
7. (dark green) groups computer security topics and cybersecuritythreats: “Computer security,” “Malware,” “Trojan horse (com-puting),” “Password strength,” and “Spyware“;
123

Figure 21: Graph induced by the nodes with non-zero CycleRank score withreference node r = “Internet privacy” and K = 4 on English Wi-kipedia, over the snapshot of March 1st, 2018. Colors representsclusters calculated with the Louvain algorithm. The dimension ofthe nodes and their labels depends on the CycleRank score.
a.5.1 longitudinal analysis
The longitudinal analysis for the keyword “Internet privacy” is pre-sented in Tables 23 and 24. This is one of the articles whose evolutionover time most reflected the changes in perception towards the topicin the public discourse. We see that over time, from 2005 to 2018,some themes remain at the forefront of “Internet privacy” such as“Anonymity,” “Proxy server,” “HTTP cookie,” “Internet censorship,”and “Computer security” ; these topics are closely related to internetprivacy. The anonymity network “Tor”1 is also relevant though thewhole period under consideration, but we stress how the article roseto second position, i.e. the most relevant article with respect to “In-ternet privacy” in the period 2013-2016; we think that this could bein part due to coverage of the revelations of Edward Snowden aboutthe U.S: National Security Agency and the role that Tor played in al-lowing the safe transfer of leaked documents to journalists. However,
1 https://en.wikipedia.org/wiki/Tor_(anonymity_network)
124

rank
2006
2007
2008
2009
2010
2011
2012
1Green
compu
ting
Green
compu
ting
Green
compu
ting
Green
compu
ting
Green
compu
ting
Green
compu
ting
Green
compu
ting
2Sleepmod
ePo
wer
man
age-
ment
Power
man
age-
ment
Harddisk
drive
Harddisk
drive
Power
man
age-
ment
Supe
rcom
puter
3Po
wer
man
age-
ment
Electronicwaste
Restrictio
nof
Hazardo
usSu
b-stan
cesDire
ctive
Power
man
age-
ment
Desktop
com-
puter
Desktop
com-
puter
Harddisk
drive
4Green
chem
istry
Sleepmod
eAdv
anced
Con
-fig
uration
and
Power
Interface
Electronicwaste
Power
man
age-
ment
Harddisk
drive
Desktop
com-
puter
5Ene
rgyStar
Ene
rgyStar
Electronicwaste
Power
supp
lyun
it(com
puter)
Ene
rgyStar
Electronicwaste
Power
man
age-
ment
6Adv
anced
Con
-fig
uration
and
Power
Interface
Adv
anced
Con
-fig
uration
and
Power
Interface
Waste
Electric
alan
dElectronic
Equ
ipmentDire
c-tiv
e
Ene
rgyStar
Performan
cepe
rwatt
Restrictio
nof
Hazardo
usSu
b-stan
cesDire
ctive
Adv
anced
Con
-fig
uration
and
Power
Interface
7Adv
anced
Power
Man
agem
ent
Adv
anced
Power
Man
agem
ent
Thinclient
Adv
anced
Con
-fig
uration
and
Power
Interface
Adv
anced
Con
-fig
uration
and
Power
Interface
Cloud
compu
ting
8Restrictio
nof
Hazardo
usSu
b-stan
cesDire
ctive
Sleepmod
eStan
dbypo
wer
Power
supp
lyun
it(com
puter)
Power
supp
lyun
it(com
puter)
Electronicwaste
9Recyclin
gBIO
SNetbo
okStan
dbypo
wer
Performan
cepe
rwatt
Ene
rgyStar
10Green
chem
istry
PowerTOP
Adv
anced
Con
-fig
uration
and
Power
Interface
Dell
Ene
rgyStar
Intel
Table36:To
p10
mostr
elevan
tcon
ceptsb
yCycleRan
kscorewith
respectt
o“G
reen
compu
ting,”alon
gdiffe
rent
yearly
snap
shotso
fthe
WikiLinkG
raph
sda
taset(2006-2012).
125

rank2013
20142015
20162017
2018
1Green
computing
Green
computing
Green
computing
Green
computing
Green
computing
Green
computing
2Supercom
puterSupercom
puterSupercom
puterSupercom
puterDesktop
com-
puterDesktop
com-
puter3
Desktop
com-
puterDesktop
com-
puterDesktop
com-
puterDesktop
com-
puterSupercom
puterSupercom
puter
4Pow
ermanage-
ment
Cloud
computing
Power
manage-
ment
Power
manage-
ment
Power
manage-
ment
Power
manage-
ment
5Cloud
computing
Power
manage-
ment
Advanced
Con-
figurationand
Power
Interface
Advanced
Con-
figurationand
Power
Interface
Advanced
Con-
figurationand
Power
Interface
Energy
Star
6Energy
StarAdvanced
Con-
figurationand
Power
Interface
IntelIntel
Energy
StarAdvanced
Con-
figurationand
Power
Interface7
Advanced
Con-
figurationand
Power
Interface
IntelEnergy
StarEnergy
StarIntel
Performance
perwatt
8Perform
anceper
watt
Energy
StarPerform
anceper
watt
Performance
perwatt
Performance
perwatt
Intel
9Electronic
waste
Performance
perwatt
Electronic
waste
Sleepmode
Sleepmode
Sleepmode
10Standby
power
Electronic
waste
Sleepmode
Hibernation
(computing)
Hibernation
(computing)
Standbypow
er
Table37:
Top10
mostrelevantconceptsby
CycleR
ankscore
with
respectto“G
reencom
puting,”along
differentyearlysnapshotsofthe
WikiLinkG
raphsdataset
(2013-2018).
126

rank
deen
esfr
it
1Green
ITGreen
compu
ting
Green
compu
ting
Inform
atique
durable
Green
compu
ting
2Hardw
are
Desktop
compu
ter
FitPC
Dévelop
pement
durable
Ambientalismo
3Inform
ationstechnik
Supe
rcom
puter
Linu
top
Systèm
ed’inform
ation
Rifiuti
diap
parec-
chiature
elettriche
edelettron
iche
4Reche
nzentrum
Power
man
agem
ent
Virt
ualización
Inform
atique
2007
5Green
peace
Ene
rgyStar
App
leCloud
compu
ting
Ene
rgyStar
6ThinClie
ntAdv
anced
Con
figura-
tionan
dPo
wer
Inter-
face
Goo
gle
Loid
eMoo
reItalia
7Virt
ualisierung
(Informatik)
Performan
cepe
rwatt
LTSP
Gestio
nde
sdo
nnées
deréférence
Organ
izzazion
eno
na
scop
odi
lucro
8Erneu
erba
reEn-
ergien
Intel
Clie
nteliv
iano
Entreprise
Riciclaggio
deir
ifiuti
9Se
rver
Sleepmod
eMacBoo
kPro
Techno
logies
del’informationet
dela
commun
ication
Effe
tto
rimba
lzo
(econo
mia)
10Cloud
Com
putin
gStan
dbypo
wer
Fracture
numérique
(géograp
hiqu
e)Normativa
comun
i-taria
RoH
S
Table38:To
p10
mostrelevant
concepts
byCycleRan
kscorewith
respectto
“Green
compu
ting,”across
diffe
rent
Wikipedia
lang
uage
edition
s.
127

“Tor” the article has already a prominent position since 2009. Finally,we highlight the jump in relevance of the article about “Google” in 2017and 2018; the company did already appear in the top-10 in 2009-2011.Facebook appears in 3rd position in 2018. The latter company appearsconsistently in the top-20 since 2011 (included).
a.5.2 cross-language analysis
Table 25 presents the results of the cross-language analysis for the arti-cle “Internet privacy.” We see that the concept of internet privacy hasdifferent nuances across cultures, even if all the results are related evenamong languages. We see that in German Wikipedia, “Internet pri-vacy” is strongly related to data and information privacy with articlessuch as “Vorratsdatenspeicherung” (“Data retention,”) “Datenschutz”(“Information privacy”), and “Überwachung” (“Surveillance.”)
In Spanish Wikipedia, we see a novel rendition of the browser wars2with “Mozilla Firefox” gaining a more prominent position with respectto “Internet Explorer”, together with “Cookie.”
French Wikipedia features both locally-relevant articles such as “Com-mission nationale de l’informatique et des libertés (France)” (“Nationalcommission for Informatics and liberties,”)3 and “Fichage en France”(“Filing in France”, in the sense of the collection by public French au-thorities of data about French citizens usually in the context of law en-forcement), and global-focused articles such as “Révélations d’EdwardSnowden” (“Edward Snowden revelations,”) and “Surveillance glob-ale” (“Global surveillance.”) Finally, there are more general articleslike “Données personnelles” (“Personal data,”) “Smartphone,” “Fuited’information” (“Information leak,”) and “Tor.”
In Italian Wikipedia the context of “Internet privacy” is mostly ori-ented towards computer security with broad terms such as: “Malware,”“File,” “Antivirus,” and “Browser.”
a.6 net neutrality
Figure 22 represents the network of articles around the article “Netneutrality” with CycleRank score greater than zero. We see that thisnetwork is characterized by 4 main clusters:
2 https://en.wikipedia.org/wiki/Browser_wars3 The Commission is an independent administrative authority es-tablished in France in 1978 and charged with the oversightof technology and its impact on the rights of French citizens(https://fr.wikipedia.org/wiki/Commission_nationale_de_l%27informatique_et_des_libert%C3%A9s_(France)).
128

rank
2005
2006
2007
2008
2009
2010
2011
1Internet
privacy
Internet
privacy
Internet
privacy
Internet
privacy
Internet
privacy
Internet
privacy
Internet
privacy
2Ano
nymity
Internet
Internet
Internet
Internet
Internet
Proxy
server
3Proxy
server
Ano
nymity
Ano
nymity
Proxy
server
Proxy
server
Tor
(ano
nymity
netw
ork)
Priv
acy
4Internet
censor-
ship
Proxy
server
HTTP
cook
ieCom
puter
secu-
rity
Tor
(ano
nymity
netw
ork)
Proxy
server
Tor
(ano
nymity
netw
ork)
5Ano
nymou
sremailer
HTTP
cook
ieCom
puter
secu-
rity
HTTP
cook
ieHTTP
cook
iePriv
acy
HTTP
cook
ie
6Freene
tWorld
WideWeb
Yaho
o!Ano
nymity
Priv
acy
HTTP
cook
ieAno
nymity
7Friend
-to-friend
Freene
tSp
yware
Spyw
are
Com
puter
secu-
rity
Ano
nymity
Com
puter
secu-
rity
8Cyb
erspace
Tor
(ano
nymity
netw
ork)
Microsoft
Ope
ra(w
ebbrow
ser)
Ano
nymity
Com
puter
secu-
rity
Spyw
are
9Sp
amming
Spyw
are
World
WideWeb
Tor
(ano
nymity
netw
ork)
Goo
gle
Spyw
are
Goo
gle
10Pseud
onym
ityIP
address
AOL
Yaho
o!Sp
yware
Goo
gle
Firefox
Table39:To
p10
mostrelevant
concepts
byCycleRan
kscorewith
respectto
“Internetp
rivacy,”
alon
gdiffe
rent
yearly
snap
shotsof
theW
ikiLinkG
raph
sda
taset(2005-2011).
129

rank2012
20132014
20152016
20172018
1Internet
privacyInternet
privacyInternet
privacyInternet
privacyInternet
privacyInternet
privacyInternet
privacy2
FirefoxTor
(anonymity
network)
Tor(anonym
itynetw
ork)Tor
(anonymity
network)
Tor(anonym
itynetw
ork)Google
3Proxy
serverFirefox
Proxy
serverHTTP
cookieProxy
serverTor
(anonymity
network)
4HTTP
cookieHTTP
cookieHTTP
cookiePrivacy
HTTP
cookieNational
SecurityAgency
Tor(anonym
itynetw
ork)5
Tor(anonym
itynetw
ork)Proxy
serverPrivacy
Proxy
serverPrivacy
Privacy
Privacy
6Privacy
Privacy
Com
putersecu-
rityCom
putersecu-
rityInternet
censor-ship
HTTP
cookieInternet
censor-ship
7Com
putersecu-
rityAnonym
ityInternet
censor-ship
Internetcensor-
shipCom
putersecu-
rityProxy
serverHTTP
cookie
8Anonym
ityAnonym
ousP2P
Anonym
ityAnonym
ityAnonym
ousP2P
Internetcensor-
shipInternet
9Spyw
areInternet
censor-ship
Anonym
ousP2P
Anonym
ousP2P
Anonym
ityInternet
Proxy
server
10Internet
censor-ship
Com
putersecu-
rityAdobe
FlashPlayer
InternetInternet
Com
putersecu-
rityCom
putersecu-
rity
Table40:
Top10
most
relevantconcepts
byCycleR
ankscore
with
respectto
“Internetprivacy,”along
differentyearly
snapshotsofthe
WikiLinkG
raphsdataset
(2012-2018).
130

rank
deen
esfr
it
1Daten
schu
tzim
Internet
Internet
privacy
Priv
acidad
enInternet
Vie
privée
etinform
atique
Priv
acy
2Vo
rratsdaten
speicherun
gGoo
gle
Facebo
okDon
nées
person
nelle
sInternet
3Ano
nymitä
tim
Internet
Facebo
okMozillaFirefox
Com
mission
natio
nale
del’informatique
etde
slibertés
(France)
Ann
i1990
4Internet
Tor(ano
nymity
netw
ork)
Internet
Smartpho
neSicurezzainform
atica
5Daten
schu
tzPriv
acy
Internet
Exp
lorer
Révélations
d’Edw
ardSn
ow-
den
Malware
6Goo
gle
Internet
censorship
Coo
kie(in
form
ática)
Fuite
d’inform
ation
File
7RechtsfreierRau
mHTTP
cook
ieRed
essociales
enInternet
Sécurit
éde
sdo
nnées
Diritto
8Übe
rwachu
ngInternet
Priv
acidad
Fichageen
Fran
ceAntiviru
s9
Internetdien
stan
bieter
Proxy
server
Segu
ridad
inform
ática
Tor(réseau)
Browser
10Goo
gle-Kon
toCom
putersecurit
yNavegad
orweb
Surveilla
nceglob
ale
Postaelettron
ica
Table41:To
p10
mostrelevant
concepts
byCycleRan
kscorewith
respectto
“Internetprivacy,”across
diffe
rent
Wikipedia
lang
uage
edition
s.
131

1. (purple) groups concepts related to telecommunications and netneutrality as seen in the context of networks: “Net neutrality,”“Internet Service Provider,” “Internet access,” “Zero-rating,”“Telecommunications,” “Tom Wheeler,”4 “Ajit Pai,”5 “VerizonCommunications,” and “AT&T” ;
2. (green) groups concepts related to U.S. politic and otherprominent figures, and mainstream media: “Barack Obama,”“Presidency of Barack Obama,” “Peter Thiel,” “Chelsea Man-ning,” “Edward Snowden,” “United States Senate,” “The NewYork Times,” and “CNN” ;
3. (cyan) contains concepts mostly related to Internet and so-cial media with digital rights and Internet freedom, togetherwith prominent figures in this regard: “Internet,” “Socialmedia”, “World Wide Web,” “Facebook,” “Freedom of speech,”“World Wide Web,” “Stop Online Piracy Act,” “Aaron Swartz,”“Lawrence Lessig,” and “Tim Berners-Lee” ;
4. (orange) contains a collection of Internet video streaming servicesand related topics: “Netflix,” “Comcast,”6 “HBO Go,” “Xfinity,”“Last Week Tonight with John Oliver,” and “Hulu” ;
a.6.1 longitudinal analysis
Tables 42 and 43 present the results of the longitudinal analysis for thearticle “Net neutrality” in English Wikipedia. The most remarkablecharacteristic is that the results over the period 2015-2018 are verystable: at the top we find the former US president “Barack Obama”,and the “Federal Communications Commission” highlighting the promi-nence of the presidency of Barack Obama over the Net neutrality regu-lations in the US and the role of the FCC. We also point out the pres-ence of “Verizon Communications” and “Comcast”, two of the biggestInternet Service Providers in the United States. Finally, the presenceof “Tim Berners-Lee” stresses the extent to which the inventor of theWorld Wide Web has played a significant role in the public discourseabout Net neutrality.
4 Former Chairman of the Federal Communications Commission(https://en.wikipedia.org/wiki/Tom_Wheeler).
5 Current Chairman of the Federal Communications Commission(https://en.wikipedia.org/wiki/Ajit_Pai).
6 Comcast is a telecommunications company, it has ended in this cluster probablybecause of a well-covered feud with streaming service Netflix over Internet speedthrottling (https://en.wikipedia.org/wiki/Criticism_of_Comcast#Netflix).
132

Figure 22: Graph induced by the nodes with non-zero CycleRank score withreference node r = “Net neutrality” and K = 4 on English Wi-kipedia, over the snapshot of March 1st, 2018. Colors representsclusters calculated with the Louvain algorithm. The dimension ofthe nodes and their labels depends on the CycleRank score.
a.6.2 cross-language analysis
Tables ?? and ?? present the results of the cross-language analysis forthe article “Net neutrality”. The analysis shows that the debate aroundnet neutrality is dominated by the United States, in fact:
• “Barack Obama” appears 3 times;
• the “Federal Communications Commission” appear 2 times,
• US tech companies and services (“Google,” “Facebook,” “Ebay,”“Youtube,” and “Skype”) appear 7 times;
However, there are also local elements in the results, such as:
• In German Wikipedia, several telecommunications companiesand Internet service providers appear in the top-10 results:
133

“Deutsche Telekom,” “Telekom Deutschland,” “Vodafone KabelDeutschland,” and “Unitymedia” ;
• In FrenchWikipedia, different aspects of the net neutrality debateare touched:
– “Benjamin Bayart,”7 a French engineer, militant for digitalrights and president of French Data Network8, the olderstISPs in France still in business;
– “La Quadrature du Net,”9 a French association for the de-fense of citizens’ rights on the Internet, founded in 2008;
– “Orange,”10 a French telecommunications company;
• In Russian Wikipedia, we have “Meduza,”11 a Riga-based onlinenewspaper and news aggregator written in Russian;
a.7 online identity
Figure 23 represents the network of articles around the article “Onlineidentity” with CycleRank score greater than zero. We see that thisnetwork is characterized by 6 clusters:
1. (purple) groups generic terms about users in the context of on-line services together with some of these services, mostly socialnetworks: “User profile,” “Digital footprint,” “Tag (metadata),”“Online identity management,” ; and on the service side; “Face-book,” “Twitter,” “LinkedIn,” “Google+,” and “Snapchat” ;
2. (green) is centered around sexual and gender identity: “Trans-gender,” “Gender,” “Minority group,” “Gender identity,” and“Intersex” ;
3. (cyan) groups concepts related to the internet and privacy ingeneral: “Internet,” “Online chat,” “Privacy,” “Sockpuppet (In-ternet),” and “Computer security” ;
4. (orange) a cluster with a stronger focus on online participa-tion: “Avatar (computing),” “Internet forum,” “Anonymity,”“Pseudonymity,” and “Virtual community” ;
5. (maroon) contains specific terms related to digital identity suchas: “Online identity,” “Digital identity,” and “OpenId” ; notably,“Online dating service” is included in this cluster;
7 https://fr.wikipedia.org/wiki/Benjamin_Bayart8 https://fr.wikipedia.org/wiki/French_Data_Network9 https://fr.wikipedia.org/wiki/La_Quadrature_du_Net
10 https://fr.wikipedia.org/wiki/Orange_(entreprise)11 https://ru.wikipedia.org/wiki/Meduza
134

rank
2006
2007
2008
2009
2010
2011
2012
1Net
neutrality
Net
neutrality
Net
neutrality
Net
neutrality
Net
neutrality
Net
neutrality
Net
neutrality
2VintCerf
Internet
Internet
Virg
inMed
iaVirg
inMed
iaVirg
inMed
iaVirg
inMed
ia3
Internet
Microsoft
BarackOba
ma
BitT
orrent
Diann
eFe
instein
WNYC
WNYC
4DARPA
2002
UnitedStates
Diann
eFe
instein
Fibe
rto
thex
Micha
elF.
Doy
leCon
centratio
nof
med
iaow
nership
5History
oftheIn-
ternet
Goo
gle
2007
2008
WNYC
The
New
York
Tim
esCom
cast
Corp.
v.FC
C6
ICANN
Voiceover
IPYo
uTub
eFe
deral
Com
-mun
ications
Com
mission
Con
centratio
nof
med
iaow
nership
Cab
letelevision
Micha
elF.
Doy
le
7Ju
ne23
App
leInc.
Goo
gle
WNYC
Broad
band
Inter-
netaccess
Fede
ral
Com
-mun
ications
Com
mission
Ann
aEshoo
82002
Internet
protocol
suite
Wi-F
iNew
med
iaMicha
elF.
Doyle
Ann
aEshoo
Cliff
Stearns
9Pa
cket
switc
hing
Internet
Protocol
Yaho
o!Ja
ckLa
yton
Fede
ral
Com
-mun
ications
Com
mission
Edo
lphu
sTo
wns
Etis
alat
10Internet
Society
Wi-F
i2006
Con
centratio
nof
med
iaow
nership
Internet
service
provider
Con
centratio
nof
med
iaow
nership
Cab
letelevision
Table42:To
p10
mostrelevant
concepts
byCycleRan
kscorewith
respectto
“Net
neutrality,”alon
gdiffe
rent
yearly
snap
shotsof
theW
ikiLinkG
raph
sda
taset(2006-2012).
135

rank2013
20142015
20162017
2018
1Tim
Berners-Lee
Tim
Berners-Lee
FederalCom
-munications
Com
mission
FederalCom
-munications
Com
mission
FederalCom
-munications
Com
mission
FederalCom
-munications
Com
mission
2Law
renceLessig
Netw
orkneutral-
ityTelecom
munication
Telecommunication
Telecommunication
Internetservice
provider3
Net
neutralityin
theUnited
StatesInternet
Internetservice
providerInternet
serviceprovider
Internetservice
providerNet
neutralityin
theUnited
States4
Virgin
Media
FederalCom
-munications
Com
mission
Internetaccess
VerizonCom
mu-
nicationsVerizon
Com
mu-
nicationsTelecom
munication
5Anna
Eshoo
Net
neutralityin
theUnited
StatesVerizon
Com
mu-
nicationsCom
castCom
castCom
cast
6Julius
Gena-
chowski
Lawrence
LessigCom
castInternet
InternetSocialm
edia
7Bandw
idththrot-
tlingVirgin
Media
Net
neutralityin
theUnited
StatesSocialm
ediaSocialm
ediaInternet
8Federal
Com
-munications
Com
mission
PeeringUnited
StatesInternet
accessTim
Berners-Lee
Tim
Berners-Lee
9Tim
Berners-Lee
Tim
Berners-Lee
FederalCom
-munications
Com
mission
FederalCom
-munications
Com
mission
FederalCom
-munications
Com
mission
FederalCom
-munications
Com
mission
10Law
renceLessig
Netw
orkneutral-
ityTelecom
munication
Telecommunication
Telecommunication
Internetservice
provider
Table43:
Top10
most
relevantconcepts
byCycleR
ankscore
with
respectto
“Net
neutrality,”along
differentyearly
snapshotsofthe
WikiLinkG
raphsdataset
(2013-2018).
136

rank
deen
esfr
itnl
plru
sv
1Netzneu
tralitä
tNet
neutrality
Neu
tralidad
dered
Neu
tralité
duréseau
Neu
tralità
della
rete
Netne
utraliteit
Neu
tralno
śćsieci
Setevo
jne
j-tralite
tNätne
utralitet
2Internet
BarackOba
ma
Com
cast
Internet
Internet
Mob
ielinterne
tInternet
Internet
Dagen
sNyh
eter
3Deu
tsche
Teleko
mFe
deral
Com
-mun
ications
Com
mission
PartidoPira
taWorld
Wide
Web
BarackOba
ma
Facebo
okStan
yZjed
noc-
zone
Goo
gle
(kom
-pa
nija)
2000-talet
4Vo
dafone
Kab
elDeu
tschland
Internet
service
prov
ider
BarackOba
ma
Union
inter-
natio
nale
des
télécommun
ica-
tions
Ban
dalarga
Internet
Partia
Dem
okraty-
czna
(Stany
Zjed
noczon
e)
EBay
Fede
ral
Com
-mun
ications
Com
mission
5Vo
dafone
Net
neutrality
inthe
United
States
Neu
tralidad
dela
red
Histoire
d’Internet
Telecomun
icazione
Internetprovider
FTP
Eng
elska
6Unitymed
iaTe
lecommun
icationC
arta
abierta
Goo
gle
Wi-F
iInternetcensuu
rTe
legraf
Internet
7Te
lekom
Deu
tschland
Com
cast
Lawrence
Lessig
LaQua
drature
duNet
Voiceover
IPVo
IPviade
mo-
bieletelefoon
Med
uza
Pakistan
8IP
-Telefon
ieSo
cial
media
Peering
Ben
jamin
Bayart
YouT
ube
Voda
fone
Institu
tKaton
aUSA
9Pa
ketvermitt
lung
Internet
2017
Microsoft
Peer-to-pe
erYo
uTub
eCifrovye
prava
Bod
yof
Eu-
rope
anReg-
ulators
ofElectronicCom
-mun
ications
10Next
Gen
era-
tionNetwork
Tim
Berne
rs-
Lee
Derecho
sdigi-
tales
Orang
e(en-
trep
rise)
Skyp
e2008
San-Fran
cisko
Ajit
Pai
Table44:To
p10
mostrelevant
concepts
byCycleRan
kscorewith
respectto
“Net
neutrality,”across
diffe
rent
Wikipedia
lang
uage
edition
s.
137

6. (magenta) groups concepts related to identity in a social sense:“Reputation,” “Identity (social science),” “Impression manage-ment,” “Persona,” and “Identity (philosophy)”.
Figure 23: Graph induced by the nodes with non-zero CycleRank score withreference node r = “Online identity” and K = 4 on English Wi-kipedia, over the snapshot of March 1st, 2018. Colors representsclusters calculated with the Louvain algorithm. The dimension ofthe nodes and their labels depends on the CycleRank score.
a.7.1 longitudinal analysis
Tables 45 and 46 present the results of the longitudinal analysis forthe article “Online identity” in English Wikipedia. The article con-sistently mostly related over time - since 2016 to 2018 - to “Onlineidentity” is “Reputation” ; we also find articles such as “Identity,” and“Digital identity.” From 2010, the new area of “Online identity man-agement” emerges from the results. Another article that appears con-sistently in the top positions since 2009 is “Online chat”. Finally, wesee that “Pseudonymity” and “Anonymity” were present in the period2006-2008, but they both lost importance subsequently probably dueto the rise of social networks and services that discourage anonymityand pseudonymity in favor of users disclosing their real names. It isnotable the rise to the second position of “Transgender,” highlightingthe prominence of the debate about gender and sexual identity even inthe context of online identity.
a.7.2 cross-language analysis
Table 47 presents the result of the cross-language analysis for the arti-cle “Online identity.” In French Wikipedia, the topic of online identity
138

is rendered in the page “Idéntité numerique” (lit. “Digital identity”),which has a different nuance than “Online identity” ; in fact the resultsfrom French Wikipedia are closer to the ones obtained for “Internetprivacy” : we see “Vie privée et informatique,” (“Private life and infor-matics”), “Usurpation d’identité” (“Identity theft”), “Données person-nelles” (“Personal data”), “Commission nationale de l’informatique”(“National commission for Informatics and liberties,”)12 et des libertés(France)” and “Biométrie” (“Biometry”).
Finally, In Polish and Russian Wikipedia results are more orientedtowards the concept of identity and psychology with“Tożsamość”(“Identity”), “Tożsamość (psychologia)” (“Identity (psychology)”),“Tożsamość osobista” (“Personal identity”), and “Egosyntoniczność”(“Egosyntonic”13) in Polish; and “Internet-soobshhestvo” (“Onlinecommunity”), “Blogosfera” (“Blogosphere”), “Kiberpsihologija” (“Cy-berpsycology”), and “Vojskunskij, Aleksandr Evgen’evich” (“AlexanderEvgenievich Voyskunsky”, a prominent Russian psychologist scholarthat studied the impact of the Internet on the human psyche) inRussian.
a.8 open-source model
Figure 24 represents the network of articles around the article “Open-source model” with CycleRank score greater than zero. We see that thisnetwork is characterized by 6 clusters:
1. (purple) contains terms related to intellectual property: “Patent,”“Tim O’Reilly,” “Creative Commons,” and “Open content” ;
2. (green) groups terms related to operating systems and relatedconcepts: “Linux,” “Debian,” and “Unix” ;
3. (cyan) reflects the dichotomy between open licenses andproprietary software: “Open source,” “Proprietary software,”“Microsoft Windows,” “Free software,” “Bruce Perens,” and“Richard Stallman” ;
4. (orange) reflects the dichotomy between open standards and pro-prietary formats in end-user softwares: “Application software,”“Browser wars,” “Android (operating system),” “Apple Inc.,”“Vendor lock-in,” and “Open format” ;
5. (dark green) groups programming languages, formats and middle-ware: “Wordpress,” “JSON,” “Java (programming language),”
12 See the corresponding footnote in the cross-language analysis for “Internet privacy.”13 https://en.wikipedia.org/wiki/Egosyntonic_and_egodystonic
139

rank2006
20072008
20092010
20112012
1Online
identityOnline
identityOnline
identityOnline
identityOnline
identityOnline
identityOnline
identity2
Reputation
Reputation
Avatar(com
put-ing)
Avatar(com
put-ing)
Reputation
Reputation
Reputation
3Identity
Socialsoftware
Reputation
Online
chatOnline
chatOnline
andoffl
ineOnline
andoffl
ine4
Socialsoftware
Digitalidentity
Socialsoftware
Online
andoffl
ineOnline
andoffl
ineAvatar
(comput-
ing)Avatar
(comput-
ing)5
Anonym
ityVirtual
commu-
nityDigitalidentity
Reputation
Digitalidentity
Digitalidentity
Online
chat
6Pseudonym
ityReputation
man-
agement
Virtual
commu-
nityDigitalidentity
Avatar(com
put-ing)
Online
chatDigitalidentity
7Pseudonym
Anonym
ityInternet
forumSocialsoftw
areIdentity
(socialscience)
Identity(social
science)Identity
(socialscience)
8Friendster
Pseudonym
ityAnonym
ityEverQ
uestOnline
identitymanagem
entOnline
identitymanagem
entOnline
identitymanagem
ent9
Digitalidentity
Internetforum
World
ofWar-
craftVirtual
commu-
nitySocialw
ebSocialsoftw
areSocialsoftw
are
10Internet
trollOpenID
Reputation
man-
agement
Internetforum
Socialsoftware
Tag(m
etadata)Tag
(metadata)
Table45:
Top10
most
relevantconcepts
byCycleR
ankscore
with
respectto
“Online
identity,”along
differentyearly
snapshotsofthe
WikiLinkG
raphsdataset
(2006-2012).
140

rank
2013
2014
2015
2016
2017
2018
1Onlineidentit
yOnlineidentit
yOnlineidentit
yOnlineidentit
yOnlineidentit
yOnlineidentit
y2
Rep
utation
Rep
utation
Rep
utation
Rep
utation
Onlinechat
Tran
sgen
der
3Onlinechat
Onlinechat
Onlinechat
Onlinechat
Identit
y(social
science)
Identit
y(social
science)
4Onlinean
doffl
ine
Onlinean
doffl
ine
Onlinean
doffl
ine
Identit
y(social
science)
Social
netw
orking
service
Social
netw
orking
service
5Av
atar
(com
put-
ing)
Social
netw
orking
service
Identit
y(social
science)
Social
netw
orking
service
Digita
lide
ntity
Avatar
(com
put-
ing)
6Digita
lide
ntity
Social
softw
are
Social
netw
orking
service
Onlineda
tingser-
vice
Facebo
okOnlinechat
7Identit
y(social
science)
Avatar
(com
put-
ing)
Social
softw
are
Social
softw
are
Avatar
(com
put-
ing)
Digita
lide
ntity
8Ta
g(m
etad
ata)
Identit
y(social
science)
Digita
lide
ntity
Avatar
(com
put-
ing)
Onlineda
tingser-
vice
Online
identit
yman
agem
ent
9So
cial
softw
are
Tag(m
etad
ata)
Online
identit
yman
agem
ent
Online
identit
yman
agem
ent
Social
softw
are
Social
softw
are
10Online
identit
yman
agem
ent
Digita
lide
ntity
Tag(m
etad
ata)
Digita
lide
ntity
Userprofi
leRep
utation
Table46:To
p10
mostrelevant
concepts
byCycleRan
kscorewith
respectto
“Onlineidentity,”alon
gdiffe
rent
yearly
snap
shotsof
theW
ikiLinkG
raph
sda
taset(2013-2018).
141

ranken
frpl
ru
1Online
identityIdentité
numérique
Tożsamość
interne-tow
aSetevaja
identich-nost’
2Transgender
Vieprivée
etinforma-
tiqueTożsam
ośćInternet-soobshhestvo
3Identity
(socialsci-
ence)Usurpation
d’identitéPedofilia
Blogosfera
4Social
networking
serviceDonnées
personnellesTożsam
ość(psycholo-
gia)Vojskunskij,
Alek-
sandrEvgen’evich
5Avatar
(computing)
Sécuritédes
donnéesTożsam
ośćosobista
Kiberpsihologija
6Online
chatRadio-identification
Egosyntoniczność
7Digitalidentity
Virtuel
8Online
identityman-
agement
Authentification
forte9
Socialsoftware
Com
mission
nationalede
l’informatique
etdes
libertés(France)
10Reputation
Biom
étrie
Table47:
Top10
most
relevantconcepts
byCycleR
ankscore
with
respectto
“Online
identity,”across
differentW
ikipedialanguage
editions.
142

“C (programming language),” and “Python (programminglanguage)” ;
6. (magenta) contains concepts pertaining to open-source hardware:“Openmoko,” “Open-source hardware,” “Open-source robotics,”“Arduino,” “Open design,” and “3D printing” ;
Figure 24: Graph induced by the nodes with non-zero CycleRank score withreference node r = “Online identity” and K = 4 on English Wi-kipedia, over the snapshot of March 1st, 2018. Colors representsclusters calculated with the Louvain algorithm. The dimension ofthe nodes and their labels depends on the CycleRank score.
143

a.8.1 longitudinal analysis
“Open-source model” was one of the most difficult topics to map. Infact, there exists a whole galaxy of articles centered around “Opensource”14 - which is itself a separate article on English Wikipedia - andits related aspect as it is demonstrated by the existence of a disambigua-tion page15 called “Open source (disambiguation)”. As of this writing,the page “Open source (disambiguation)” lists 27 articles, on EnglishWikipedia alone, containing the keyword “Open source” in their title.Note that the aim of this list in not to include all the articles with“open source” in their name, in fact it does not include articles such as“Business models for open-source software,”16 whose topic and title iswell-separated from “open source” alone.
The article “Open-source model” was created originally on English Wi-kipedia on October 14th, 200117 with the title “Open source”. Since thistopic is very close to the hearth of the WIkipedian community and Wi-kipedia describes itself as an “open source” project it is not surprisingthat this article exists since 2001. The article acquired the current titlebeing moved from “Open source” to “Open-source model” in March,201618 and the article now-called “Open source” refers specifically tosoftware reuse and was created in November, 2018.19 Note that this ar-ticle is itself different from “Open-source software”20. For this reason,we limit the longitudinal analysis over the article “Open-source model”to the years 2017 and 2018, the results are presented in Table 48.
From the longitudinal analysis we find different results in the two yearsunder consideration, a sign of the dynamic nature of the links in this ar-ticle. The articles that are present on both years within the top ten are:“Linux,” “Android (operating system),”21 and “Open-source software.”
a.8.2 cross-language analysis
In selecting the articles corresponding to “Open-source model” in theother Wikipedia language editions we faced the same challenges thatwe encountered on English Wikipedia. Open source is a galaxy in all
14 https://en.wikipedia.org/wiki/Open_source15 A “disambiguation page” in Wikipedia is a page used as for resolving conflicts in
article titles that occur when a single term can be associated with more than onetopic, making that term likely to be the natural title for more than one article.(https://en.wikipedia.org/wiki/Help:Disambiguation)
16 https://en.wikipedia.org/wiki/Business_models_for_open-source_software17 https://en.wikipedia.org/w/index.php?title=Open-source_model&oldid=39893497318 https://en.wikipedia.org/w/index.php?title=Open-source_model&oldid=70948334519 https://en.wikipedia.org/w/index.php?title=Open_source&oldid=87004237320 https://en.wikipedia.org/wiki/Open-source_software21 The Linux-based operating system for smartphones developed by Google.
144

the Wikipedias, with multiple articles covering different aspects of thetopic. This is a known problem in Wikipedia [49]. With the help of localcommunity members we have chosen the most-fitting articles to pairwith “Open-source model”, in many cases the choice landed on the localversion of the article “Open source.” Table 49 presents the results of thecross-language analysis. Even though these articles are in principle notonly focused on software, and other more specific articles about “Opensource software” exist in some languages, we see that software tendsto be the main protagonist in all languages. An interesting outlier isthe presence of “Culture libre” (“Free culture”) within the top of theranking in the French Wikipedia.
a.9 right to be forgotten
Figure 25 represents the network of articles around the article “Rightto be forgotten” with CycleRank score greater than zero. We see thatthis network is characterized by 6 clusters:
1. (purple) groups terms related to internet services, which havein comment the fact that they are usually part of the debateabout the “Right to be forgotten” : “Wikipedia,” “Twitter,” “Elec-tronic Frontier Foundation,” “Streisand effect,” “Censorship byGoogle,” and “Google” ;
2. (green) this cluster is centered around the right to privacy in theUnited States with articles such as: “Right to privacy,” “UnitedStates Constitution,” “First Amendment to the United StatesConstitution,” and “Freedom of Speech” ;
3. (cyan) groups concepts related to privacy: “Privacy,” “Privacylaw,” “Data Protection Directive,” “General Data Protection Reg-ulation,” “Google Spain v AEPD and Mario Costeja González,”and “Internet privacy” ;
4. (orange) groups concepts related to the UK and the EuropeanUnion, together with media outlets: “Accountability,” “TheGuardian,” “The New York Times,” “Theresa May,” “GüntherOettinger,” and “Sabine Leutheusser-Schnarrenberger” ;
5. (dark green) groups concepts and states related to media censor-ship: “Media freedom in Russia,” “China,” “Digital rights,” “In-ternet censorship,” “Censorship,” “Reporters without borders,”“Internet access,” and “Virtual Private Network” ;
6. (magenta) groups concepts related to human rights: “Humanrights,” “Universal Declaration of Human Rights,” and “Funda-mental rights”.
145

Figure 25: Graph induced by the nodes with non-zero CycleRank score withreference node r = “Right to be forgotten” and K = 4 on EnglishWikipedia, over the snapshot of March 1st, 2018. Colors representsclusters calculated with the Louvain algorithm. The dimension ofthe nodes and their labels depends on the CycleRank score.
146
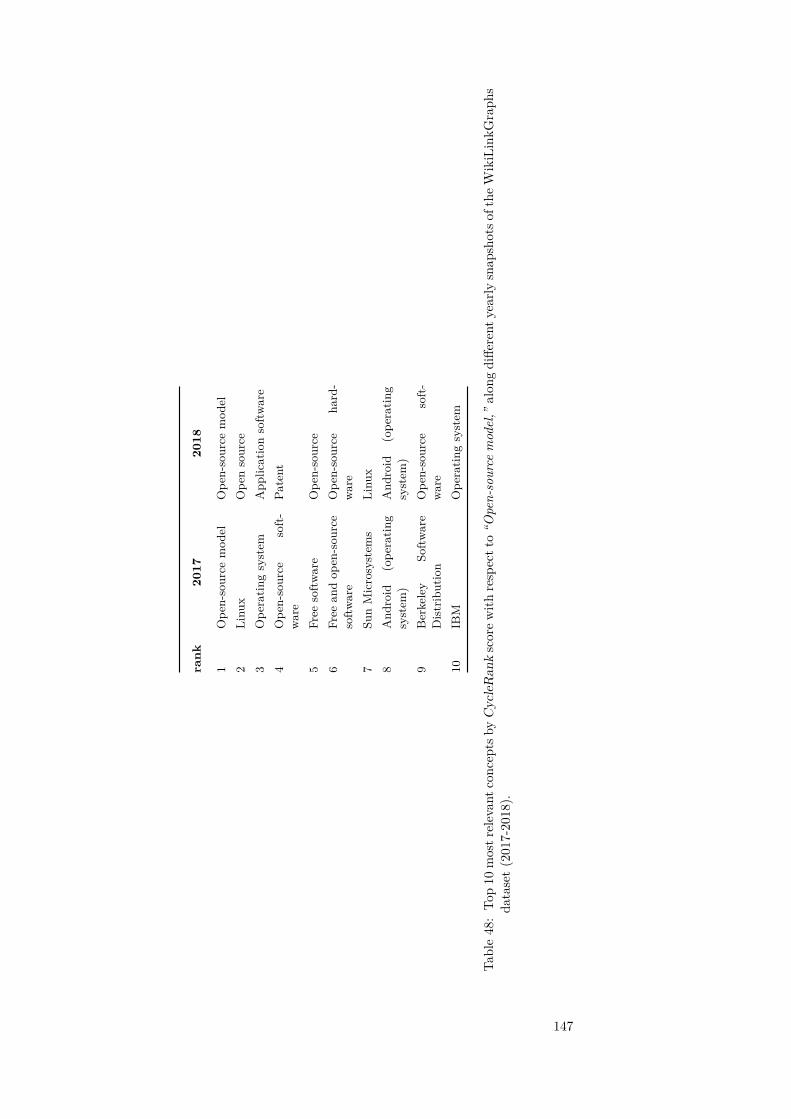
rank
2017
2018
1Ope
n-source
mod
elOpe
n-source
mod
el2
Linu
xOpe
nsource
3Ope
ratin
gsystem
App
licationsoftw
are
4Ope
n-source
soft-
ware
Patent
5Free
softw
are
Ope
n-source
6Free
andop
en-sou
rce
softw
are
Ope
n-source
hard-
ware
7Su
nMicrosystem
sLinu
x8
And
roid
(ope
ratin
gsystem
)And
roid
(ope
ratin
gsystem
)9
Berkeley
Softw
are
Distribution
Ope
n-source
soft-
ware
10IB
MOpe
ratin
gsystem
Table48:To
p10
mostr
elevan
tcon
ceptsb
yCycleRan
kscorew
ithrespectt
o“O
pen-source
model,”
alon
gdiffe
rent
yearly
snap
shotso
fthe
WikiLinkG
raph
sda
taset(2017-2018).
147

rankde
enes
frit
nlpl
sv
1Open
SourceOpen-source
model
Código
abiertoOpen
sourceOpen
sourceOpen
sourceOtw
arteopro-
gramow
anieÖppen
källkod
2Linux
Open
sourceSoftw
arelibre
LogiciellibreSoftw
arelibero
LinuxLinux
Linux3
FreieSoftw
areApplication
soft-ware
GNU/Linux
Culture
libreInform
aticaLijst
vanopen-
sourcesoftware
Microsoft
Win-
dows
Friprogramvara
4Microsoft
PatentUnix
Android
Unix
Vrijesoftw
areMicrosoft
Unix
5Ubuntu
Open-source
Ubuntu
Debian
Linux(kernel)
Opensourcesoftw
areFirefox
Operativsystem
6Fedora
(Linux-Distribution)
Open-source
hardware
Android
Brow
serUbuntu
(Lin-uxdistributie)
Wolne
opro-gram
owanie
Källkod
7LibreO
ffice
LinuxInternet
LinuxSoftw
areTechnologie
Unix
FreeBSD
8Linux
(Kernel)
Android
(operat-ing
system)
1998Systèm
ed’exploitation
Sistema
opera-tivo
Mozilla
FirefoxUbuntu
Mac
OSX
9Softw
areOpen-source
soft-ware
Richard
Stallman
LogicielAndroid
PHP
GNU
General
Public
LicenseMozilla
Firefox
10Open-Source-
Software
inöffentlichenEinrichtungen
Operating
systemIB
MApple
LinuxSoftw
areKod
źródłowy
Table49:
Top10
most
relevantconcepts
byCycleR
ankscore
with
respectto
“Open-source
model,”
acrossdifferent
Wikipedia
languageeditions.
148

a.9.1 longitudinal analysis
The article was created after March 2014. Since the beginning, in 2015,“Freedom of speech” is consistently the most relevant concept over years;while it is straightforward why “Freedom of speech” is mentioned in thearticle, given the concerns about how to conciliate it with the right tobe forgotten, it is interesting that a link existed also in the oppositedirection since 2014. Table 31 presents the results of the longitudinalanalysis over the article “Right to be forgotten” in English Wikipedia.
a.9.2 cross-language analysis
The cross language analysis of the article “Right to be forgotten” pro-duces two main results: in some languages - German, English, Dutchand Russian - the context of this article is mainly composed by articlesreferring to the Internet, to Google, to Wikipedia and other internet-related pages such as “Internet censorship”. Instead in Spanish, Italianand French Wikipedia the focus is more centered around privacy andlaws to protect privacy. Freedom of speech is a keyword that appearsacross several languages even if with different nuances: “Libertad deexpresión” in Spanish and “Libertà di manifestazione del pensiero” inItalian (“Freedom of expression”), “Svoboda informacii” and “Vrijheidvan informatie” (“Freedom of information”) in Russian and Dutch, re-spectively. References to the European “General Data Protection Regu-lation” appear across different languages. Finally, it is notable to pointout that the 10th most-related article in Russian Wikipedia related to“Right to be forgotten” is “Gomoseksual’nost”’ (“Homosexuality”).
a.10 general data protection reg-ulation (gdpr)
Figure 26 represents the network of articles around the article “GeneralData Protection Regulation” with CycleRank score greater than zero.We see that this network is characterized by 6 clusters:
1. (purple) groups articles related to privacy: “Data Protection Di-rective,” “Privacy law,” and “Privacy” ;
2. (green) includes articles related to the “Right to be forgotten” :“Right to be forgotten,” “Jan Philipp Albrecht” and “Google Spainv AEPD and Mario Costeja González” ; notably, the article “Masssurveillance” is also in this cluster;
149

rank2015
20162017
2018
1Right
tobe
forgottenRight
tobe
forgottenRight
tobe
forgottenRight
tobe
forgotten2
Freedomofspeech
Freedomofspeech
Freedomofspeech
Freedomofspeech
3First
Amendm
entto
theUnited
StatesConstitution
Internetprivacy
Internetprivacy
Right
toprivacy
4Freedom
ofspeechin
theUnited
StatesFirst
Amendm
entto
theUnited
StatesConstitution
Right
toprivacy
Internetprivacy
5Censorship
Censorship
Privacy
lawPrivacy
law6
Hum
anrights
Freedomofspeech
inthe
United
StatesFirst
Amendm
entto
theUnited
StatesConstitution
7United
StatesConsti-
tutionHum
anrights
Freedomofspeech
inthe
United
StatesGeneralD
ataProtec-
tionRegulation
8Criticism
ofGoogle
Privacy
lawCensorship
Internet9
Streisandeffect
Streisandeffect
InternetCensorship
10Internet
privacyInternet
Hum
anrights
Information
privacy
Table50:
Top10
most
relevantconcepts
byCycleR
ankscore
with
respectto
“Right
tobe
forgotten,”along
differentyearly
snapshotsofthe
WikiLink-
Graphs
dataset(2017-2018).
150

rank
deen
esfr
itnl
ru
1Recht
auf
Vergessenw
erde
nRight
tobe
forgot-
ten
Derecho
alolvido
Droitàl’o
ubli
Dirittoall’o
blio
Recht
omvergeten
teworde
nPravo
nazabv
enie
2JimmyWales
Freedo
mof
speech
Revista
Lati-
noam
erican
ade
Protección
deDatos
Person
ales
Don
nées
person
-ne
lles
Priv
acy
Internet
Nep
rikosno
venn
ost’
chastnoj
zhizni
3Sa
bine
Leuthe
usser-
Schn
arrenb
erger
Right
toprivacy
Derecho
sDire
ctive
95/46/CE
sur
laprotectio
nde
sdo
nnées
person
-ne
lles
Cha
tInternet
van
Atot
ZInternet-cen
zura
4W
ikiped
iaInternet
privacy
Unión
Europ
eaVie
privée
etinfor-
matique
Cod
ice
inmateria
diprotezione
dei
dati
person
ali
Goo
gle
Zashhita
per-
sona
l’nyh
dann
yh
5Goo
gle
Priv
acylaw
Protecciónde
datos
person
ales
Règlement
géné
ral
sur
laprotectio
nde
sdo
nnées
Garan
tepe
rla
pro-
tezion
ede
idatip
er-
sona
li
Priv
acy
Svob
odainform
acii
6EU-
Daten
schu
tzreform
Goo
gle
Dire
cción
Naciona
lde
Protección
deDatos
Person
ales
Vie
privée
Trattamento
dei
dati
person
ali
Vrijh
eid
van
infor-
matie
Internet
7W
ikim
edia
Foun
da-
tion
Gen
eral
Data
Pro-
tectionRegulation
Con
stitu
ción
G29
Internet
Cen
zura
8Daten
schu
tz-
Grund
verordnu
ngInternet
Libe
rtad
deexpre-
sión
Com
mission
natio
nale
del’informatique
etde
slib
ertés
(France)
Libe
rtàdi
man
ifes-
tazion
ede
lpen
siero
Svob
odaslova
9Lu
cian
oFloridi
Cen
sorship
Can
arias
Cha
rtes
dudroità
l’oub
linu
mérique
Dirittodi
cron
aca
Vikiped
ija
10Viktor
Mayer-
Schö
nberger
(Ju-
rist)
Inform
ation
pri-
vacy
Gob
ierno
Goo
gle
Regolam
ento
gene
rale
sulla
protezione
deid
ati
Gom
oseksual’nost’
Table51:To
p10
mostrelevant
concepts
byCycleRan
kscorewith
respectto
“Right
tobe
forgotten,”across
diffe
rent
Wikipedia
lang
uage
edition
s.
151

3. (cyan) groups articles related to the EU: “European Union,” “Eu-ropean Commission,” and “EU–US Privacy Shield” ;
4. (orange) groups articles about EU regulations: “Regulation (Eu-ropean Union),” “Directive (European Union),” and “EPrivacyRegulation (European Union)” ;
5. (dark green) groups general concepts about privacy and data: “In-formation privacy,” “Data protection,” and “National data pro-tection authority”.
Figure 26: Graph induced by the nodes with non-zero CycleRank scorewith reference node r = “General Data Protection Regulation” andK = 4 on English Wikipedia, over the snapshot of March 1st, 2018.Colors represents clusters calculated with the Louvain algorithm.The dimension of the nodes and their labels depends on the Cycle-Rank score.
a.10.1 longitudinal analysis
The article “General Data Protection Regulation” was created on Jan-uary, 3rd 2013. The top 10 results with highest CycleRank score overyears - presented in Table 52 - show that the context of the article “Gen-eral Data Protection Regulation” includes articles related to privacysuch as: “Privacy,” “Privacy law,” “Privacy by design” and “Privacypolicy” ; “Right to be forgotten” is also consistently present since 2015.Another prominent article is “Data Protection Directive” the directivethat regulated the processing of personal data within the European
152

Union before being superseded by the “General Data Protection Reg-ulation”. Interestingly, article “Mass surveillance” appears among thetop-10 in 2016 and 2017.
a.10.2 cross-language analysis
Tables 53 and 54 present the results of the cross-language analysis forthe article “General Data Protection Regulation”. We see that acrosslanguages recurring concepts are “Personal data” : “Données person-nelles” in French, “Persoonsgegevens” in Dutch, “Dane osobowe” inPolish. There are several references to laws, officers or institutions fordata protection either local or international:
• In German: “Richtlinie 95/46/EG (Datenschutzrichtlinie),”“Bundesbeauftragter für den Datenschutz und die Informations-freiheit,” “Datenschutzbeauftragter,” and “Bundesdatenschutzge-setz” ;
• In Spanish: “LOPD,” and “Ley Orgánica de Protección de Datosde Carácter Personal (España)” ;
• In French: "Délégué à la protection des données," and “Directive95/46/CE sur la protection des données personnelles” ;
• In Italian: “Trattamento dei dati personali,” “Codice in materiadi protezione dei dati personali,” and “Garante per la protezionedei dati personali” ;
• In Dutch: “Richtlijn 95/46/EG” ;
Furthermore, the keyword “Privacy” appears in 5 languages (en, es(“Privacidad”), fr (“Vie priveée”), it, and nl).
Finally, the “Right to be forgotten” appears in the top-10 results forEnglish and Italian Wikipedia (“Diritto all’oblio”).
153

rank2013
20142015
20162017
2018
1General
Data
Protec-
tionRegulation
General
Data
Protec-
tionRegulation
General
Data
Protec-
tionRegulation
General
Data
Protec-
tionRegulation
General
Data
Protec-
tionRegulation
General
Data
Protec-
tionRegulation
2Data
Protection
Direc-
tiveData
Protection
Direc-
tiveGoogle
SpainvAEPD
andMario
Costeja
González
SpainvAEPD
andMario
Costeja
González
Data
Protection
Direc-
tiveData
Protection
Direc-
tive
3Right
tobe
forgottenJan
Philipp
Albrecht
Right
tobe
forgottenInform
ationprivacy
4Data
Protection
Direc-
tiveData
Protection
Direc-
tiveEU-U
SPrivacy
ShieldRight
tobe
forgotten
5European
Parliament
Com
mittee
onCivil
Liberties,Justice
andHom
eAffairs
Right
tobe
forgottenPersonally
identifiableinform
ationPersonally
identifiableinform
ation
6Privacy
Personallyidentifiable
information
JanPhilipp
Albrecht
National
dataprotec-
tionauthority
7Inform
ationprivacy
Mass
surveillanceGoogle
SpainvAEPD
andMario
Costeja
González
Privacy
8Inform
ationsensitivity
Data
breachMass
surveillanceJan
Philipp
Albrecht
9Bodil
Lindqvistv
Åklagarkam
maren
iJönköping
Privacy
Privacy
Privacy
law
10Jan
Philipp
Albrecht
Information
sensitivityPrivacy
policyPrivacy
bydesign
Table52:
Top10
most
relevantconcepts
byCycleR
ankscore
with
respectto
“GeneralD
ataProtection
Regulation,”along
differentyearly
snapshotsof
theW
ikiLinkGraphs
dataset(2013-2018).
154

rank
deen
esfr
1Daten
schu
tz-
Grund
verordnu
ngGen
eral
DataProtection
Regulation
Reglamento
Gen
eral
deProtecciónde
Datos
Règlementgéné
ralsur
laprotectio
nde
sdo
nnés
2Daten
schu
tzData
Protection
Dire
c-tiv
ePriv
acidad
Vie
privée
etinform
a-tiq
ue3
Daten
schu
tzrecht
Inform
ationprivacy
LOPD
Dire
ctive95/46/CE
sur
laprotectio
nde
sdon
nées
person
nelle
s4
Bun
desdaten
schu
tzgesetz
Right
tobe
forgotten
LeyOrgán
icade
Protec-
ción
deDatos
deCarác-
terPe
rson
al(E
spañ
a)
Don
nées
person
nelle
s
5Richtlin
ie95/46/EG
(Daten
schu
tzric
htlin
ie)
Person
ally
identifi
able
inform
ation
Parla
mento
Europ
eoAssociatio
nfran
çaisede
scorrespo
ndan
tsàla
pro-
tectionde
sdon
nées
àcar-
actère
person
nel
6Ve
rordnu
ng(E
U)
Nationa
ldataprotectio
nau
thority
Seud
onim
ización
Vie
privée
7Daten
schu
tzbe
auftragter
Priv
acy
PartidoPira
tade
Alema-
nia
Journé
eeu
ropé
enne
dela
protectio
nde
sdon
nées
8Bun
desbeauftragter
für
denDaten
schu
tzun
ddie
Inform
ationsfreihe
it
JanPhilip
pAlbrecht
PartidoPira
taEurop
eoDire
ctive
du12
juillet
2002
sur
laprotectio
nde
lavieprivée
dans
lesecteu
rde
scommun
ica-
tions
électron
ique
s9
EU-D
aten
schu
tzreform
Priv
acylaw
Com
mission
natio
nalede
l’informatique
etde
slib
-ertés(France)
10Ja
nPhilip
pAlbrecht
Priv
acyby
design
Délégué
àla
protectio
nde
sdo
nnées
Table53:To
p10
mostrelevant
concepts
byCycleRan
kscorewith
respectto
“General
DataPr
otectio
nRe
gulatio
n,”across
diffe
rent
Wikipedia
lang
uage
edition
s(de,
en,e
s,fr).
155

rankit
nlpl
sv
1Regolam
entogenerale
sullaprotezione
deidatiAlgem
eneverordening
gegevensbescherming
Ogólne
rozporzadzenieo
ochroniedanych
Dataskyddsf̈rordningen
2Privacy
Wet
bescherming
per-soonsgegevens
Dane
wrażliw
eDataskyddsdirektivet
3Codice
inmateria
dipro-tezione
deidatipersonaliAutoriteit
Persoons-gegevens
Dane
osobowe
Personuppgiftslagen
4Diritto
all’oblioPrivacy
Ochrona
danychos-
obowych
5Cookie
PersoonsgegevensZbiór
danychosobow
ych6
Trattamento
deidatiper-sonali
Richtlijn
95/46/EG
7Diritto
dicronacaPrivacyw
et(B
elgië)8
Brow
serEuropees
Toezichthoudervoor
gegevensbescherming
9Garante
perla
pro-tezione
deidatipersonaliDatalek
10Cache
Uitvoeringsw
etAl-
gemene
verordeninggegevensbescherm
ing
Table54:
Top10
most
relevantconcepts
byCycleR
ankscore
with
respectto
“GeneralD
ataProtection
Regulation,”across
differentW
ikipedialanguage
editions(it,nl,pl,sv).
156

AC K N OW L E D G E M E N T S
I would like to thank Michele Bortolotti and the team of “GestioneSistemi” at the University of Trento for their support with the HPCcluster, this was expecially valuable for the work that consitutes Chap-ter 2 of this thesis.
I would also like to thank the following Wikipedians for their help withtheir local Wikipedia related to the work presented in Appendix A:Catrin Vimercati and Cornelius Kibelka (de); Patricio Lorente andEloy Caloca Lafont (es); Nicolas Belett Vigneron (fr); Luca Martinelli(it); Lodewijk Gelauff (nl); Dariusz Jemielniak (pl); Dmitry Rozhkov(ru); and Lennart Guldbrandsson (sv).
I would like to acknowledge the support from Microsoft in the form ofcomputing resources over the platform Microsoft Azure22 through the“Microsoft Azure for Research Award: Data Science” program, awardno CRM:0518942.
The work in Chapters 2–4 and in Appendix A has been supportedby the European Union’s Horizon 2020 research and innovation pro-gramme under the EU Engineroom project, with Grant Agreementno 780643.
22 https://azure.microsoft.com/
157


R I N G R A Z I A M E N T I
«We have seen that computer programming is an art,because it applies accumulated knowledge to the world,
because it requires skill and ingenuity, and especiallybecause it produces objects of beauty.»
— Donald E. Knuth [102]
159


L I S T O F F I G U R E S
Figure 1 A portion of the navigational template{{Computer science}} from English Wiki-pedia as of revision no 878025472 of 12 January2019, 14:12. The dashed line indicates thata portion of template has been stripped forreasons of space. . . . . . . . . . . . . . . . . . . 9
Figure 2 The process to produce the WikiLinkGraphsdataset from the Wikipedia dumps. In bold anditalics the name of the intermediate datasetsproduced. . . . . . . . . . . . . . . . . . . . . . 16
Figure 3 Overview of the growth over time of the num-ber of links in each snapshot in the WikiLink-Graphs dataset. . . . . . . . . . . . . . . . . . 20
Figure 4 Number of cycles (log scale) by length for a sam-ple of 100 random nodes. For each node in thesample, we have computed the number of cyclesof length k = 2, 3, 4. Points representing the val-ues for a single page are shifted on the x-axis bya random offset and colored with the same color.The color gradient depends on the value at k = 4. 43
Figure 5 Toy example of the computation of 2Drank fora graph with 7 nodes ranked respectively: νP =
[a, d, c, b, e, f , g] and νC = [a, b, d, e, c, f , g]. Thefinal ranking is ν2D = [a, b, c, d, e, f , g]. . . . . . 47
Figure 6 Graph induced by the nodes with non-zero CycleRank score with reference noder = “Fake news” and K = 4 on EnglishWikipedia. over the snapshot of March 1st,2018. The network is visualized after applyingthe ForceAtlas2 algorithm. Colors representsclusters calculated with the Louvain algorithm.The dimension of the nodes and their labelsdepends on the CycleRank score; labels areonly shown for CycleRank values of at least 20. 49
161

Figure 7 Comparison of the Kendall τ correlation coeffi-cients of the ClickStream ranking with the rank-ings produced by PageRank (x coordinate) andCycleRank (y coordinate) over a sample of ran-dom articles. If for a given article y > x then thecorrelation between the CycleRank and Click-Stream rankings is higher than the correlationbetween the PageRank and ClickStream rank-ings (green triangles), if y ≤ x is vice-versa (bluediamonds). . . . . . . . . . . . . . . . . . . . . . 60
Figure 8 Comparison of the Kendall τ correlation coeffi-cients of the ClickStream ranking with the rank-ings produced by 2DRank (x coordinate) andCycleRank (y coordinate) over a sample of ran-dom articles. If for a given article y > x then thecorrelation between the CycleRank and Click-Stream rankings is higher than the correlationbetween the 2DRank and ClickStream rankings(green triangles), if y ≤ x is vice-versa (bluediamonds). . . . . . . . . . . . . . . . . . . . . . 61
Figure 9 Distribution of ∆ξ(Wr) between CycleRank andPageRank. When values are positive (solid greenbars) CycleRank is able to find See-Also arti-cles in a higher position than Personalized Page-rank for a given article; when values are negative(blue bars with with white hatch) is vice-versa. 65
Figure 10 Distribution of ∆ξ(Wr) between CycleRank and2DRank. When values are positive (solid greenbars), CycleRank is able to find See-Also articlesin a higher position than 2DRank for a givenarticle; when values are negative (orange barswith with black hatch) is vice-versa. . . . . . . . 65
Figure 11 Evaluation scores for PageRank (dotted blueline with diamond markers), 2DRank (dashedorange line with triangle-down markers), andCycleRank (straight green line with triangle-upmarkers) taking the top-N articles by indegree.A lower score is better. . . . . . . . . . . . . . . 69
Figure 12 Graph induced by the nodes with non-zero CycleRank score with reference noder = “Internet governance” and K = 4 onEnglish Wikipedia, over the snapshot of March1st, 2018. Colors represents clusters calculatedwith the Louvain algorithm. The dimensionof the nodes and their labels depends on theCycleRank score. . . . . . . . . . . . . . . . . . 81
162

Figure 13 Proxies of health threat awareness and mediaattention for the illustrative case of Ebola epi-demic. A) Red line represents the daily num-ber of page views on Wikipedia articles relatedto Ebola infection during 2014 from the En-glish version of Wikipedia [86]. Grey line rep-resents the daily number of news released onEbola in the US, as obtained from the GoogleNews platform [88]. Dotted lines indicate no-ticeable events associated with the West AfricaEbola epidemic. B) as A), but for the Italianversion of Wikipedia and news released in Italy.C) Comparison of two different proxies of me-dia attention to the Ebola epidemic. Grey linerepresents the daily number of news released onEbola in the US, as obtained from the GoogleNews platform [88]. Blue line indicates the num-ber of Ebola related videos per day, from FoxNews and MSNBC [77]. . . . . . . . . . . . . . . 99
Figure 14 SN-model estimates for Ebola (A), Zika (B),Influenza (C) in the US and for Ebola (D), Zika(E), Meningitis (F) in Italy. In each panel, bluebars represent the daily number of Wikipediapage views over time for the considered infec-tion. The blue lines and the shaded areas refer tothe average and the 95% CI of estimates as ob-tained with the SN-model on the daily numberof informed individuals seeking information onWikipedia. Bubble plots represent the medianincidences of informed individuals. Yellow andred bubbles refer to incidences of informed indi-viduals by media communications and throughsocial contagion, respectively. . . . . . . . . . . 99
Figure 15 Percentage error between model estimates anddata records on the number of Wikipedia pageviews over time, as obtained for different modelswhen considering the Ebola awareness epidemicin the US (A) and in Italy (B). . . . . . . . . . 100
163

Figure 16 Posterior distribution (2.5%, 25%, 75%, and97.5% quantiles and mean) of fraction ofinformed individuals using Wikipedia (A),the transmissibility potential related to mediacommunications (B), the doubling time asso-ciated with the social contagion mechanism(C), the fraction of informed individuals dueto media communications (D), as obtained forthe different epidemic scenarios considered withthe SN-model. . . . . . . . . . . . . . . . . . . . 101
Figure 17 Graph induced by the nodes with non-zero CycleRank score with reference noder = “Algorithmic bias” and K = 4 on EnglishWikipedia, over the snapshot of March 1st,2018. Colors represents clusters calculatedwith the Louvain algorithm. The dimensionof the nodes and their labels depends on theCycleRank score. . . . . . . . . . . . . . . . . . 110
Figure 18 Graph induced by the nodes with non-zero CycleRank score with reference noder = “Cyberbullying” and K = 4 on EnglishWikipedia, over the snapshot of March 1st,2018. Colors represents clusters calculatedwith the Louvain algorithm. The dimensionof the nodes and their labels depends on theCycleRank score. . . . . . . . . . . . . . . . . . 111
Figure 19 Graph induced by the nodes with non-zero CycleRank score with reference noder = “Computer security” and K = 4 onEnglish Wikipedia, over the snapshot of March1st, 2018. Colors represents clusters calculatedwith the Louvain algorithm. The dimensionof the nodes and their labels depends on theCycleRank score. . . . . . . . . . . . . . . . . . 117
Figure 20 Graph induced by the nodes with non-zero CycleRank score with reference noder = “Green computing” and K = 4 on EnglishWikipedia, over the snapshot of March 1st,2018. Colors represents clusters calculatedwith the Louvain algorithm. The dimensionof the nodes and their labels depends on theCycleRank score. . . . . . . . . . . . . . . . . . 122
164

Figure 21 Graph induced by the nodes with non-zero CycleRank score with reference noder = “Internet privacy” and K = 4 on EnglishWikipedia, over the snapshot of March 1st,2018. Colors represents clusters calculatedwith the Louvain algorithm. The dimensionof the nodes and their labels depends on theCycleRank score. . . . . . . . . . . . . . . . . . 124
Figure 22 Graph induced by the nodes with non-zero CycleRank score with reference noder = “Net neutrality” and K = 4 on EnglishWikipedia, over the snapshot of March 1st,2018. Colors represents clusters calculatedwith the Louvain algorithm. The dimensionof the nodes and their labels depends on theCycleRank score. . . . . . . . . . . . . . . . . . 133
Figure 23 Graph induced by the nodes with non-zero CycleRank score with reference noder = “Online identity” and K = 4 on EnglishWikipedia, over the snapshot of March 1st,2018. Colors represents clusters calculatedwith the Louvain algorithm. The dimensionof the nodes and their labels depends on theCycleRank score. . . . . . . . . . . . . . . . . . 138
Figure 24 Graph induced by the nodes with non-zero CycleRank score with reference noder = “Online identity” and K = 4 on EnglishWikipedia, over the snapshot of March 1st,2018. Colors represents clusters calculatedwith the Louvain algorithm. The dimensionof the nodes and their labels depends on theCycleRank score. . . . . . . . . . . . . . . . . . 143
Figure 25 Graph induced by the nodes with non-zero CycleRank score with reference noder = “Right to be forgotten” and K = 4 onEnglish Wikipedia, over the snapshot of March1st, 2018. Colors represents clusters calculatedwith the Louvain algorithm. The dimensionof the nodes and their labels depends on theCycleRank score. . . . . . . . . . . . . . . . . . 146
165

Figure 26 Graph induced by the nodes with non-zero CycleRank score with reference noder = “General Data Protection Regulation” andK = 4 on English Wikipedia, over the snapshotof March 1st, 2018. Colors represents clusterscalculated with the Louvain algorithm. Thedimension of the nodes and their labels dependson the CycleRank score. . . . . . . . . . . . . . 152
166

L I S T O F TA B L E S
Table 1 Statistics about the processed Wikipediadumps: size of the dowloaded files and numberof processed pages and revisions for eachdump. (†) the Italian Wikipedia dumps weredownloaded in .bz2 format. . . . . . . . . . . . 11
Table 2 Words creating a redirect in MediaWiki for dif-ferent languages. #REDIRECT is valid on all lan-guages. (‡) For Russian Wikipedia, we presentthe transliterated words. . . . . . . . . . . . . . 14
Table 3 Number of nodes N and edges E for eachgraph snapshot of WikiLinkGraphs datasetobtained for the English (en), German (de),Spanish (es), French (fr), and Italian (it)Wikipedia editions. . . . . . . . . . . . . . . . . 17
Table 4 Number of nodes N and edges E for eachgraph snapshot of WikiLinkGraphs datasetobtained for the Dutch (nl), Polish (pl), Russian(ru), and Swedish (sv) Wikipedia editions. . . . 18
Table 5 Comparison of the number of links between ar-ticles in the ns0 as they result fromWikimedia’spagelinks database table dump (pagelinksns0) and from the WikiLinkGraphs dataset(WLG). The total number of rows, countinglinks between other namespaces is given in(pagelinks all). . . . . . . . . . . . . . . . . . . 21
Table 6 Top-10 articles with the highest Pagerank scorecomputed over the most recent snaphost of theWikiLinkGraphs dataset (2018-03-01). . . . . 23
Table 7 Top-10 articles with the highest Pagerank scorecomputed over the most recent snaphost of theWikiLinkGraphs dataset (2018-03-01). (‡)Russian Wikipedia article titles are transliterated. 24
Table 8 Top-10 pages by indegree and outdegree over themost recent snapshot of the WikiLinkGraphsdataset (2018-03-01) . . . . . . . . . . . . . . . 44
Table 9 Top-10 pages by (global) PageRank over themost recent snapshot of the WikiLinkGraphsdataset (2018-03-01) . . . . . . . . . . . . . . . 45
167

Table 10 Top-10 articles with the highest CycleRank andPageRank scores computed from the articles“Fake news,” “Right to be forgotten,” and “On-line identity” on English Wikipedia, over themost recent snapshot of the WikiLinkGraphsdataset (2018-03-01). . . . . . . . . . . . . . . . 52
Table 11 Top-10 articles with the highest CycleRank andPageRank scores computed from the articles“Algorithmic bias,” “Internet privacy,” and“General Data Protection Regulation” on En-glish Wikipedia, over the most recent snapshotof the WikiLinkGraphs dataset (2018-03-01). 53
Table 12 Top-10 articles with the highest CycleRankscore computed from the page “Fake news”,over two snapshot from March, 1st 2017 andMarch 1st, 2018. The article with its currentmeaning exists since January 15th, 2017. . . . . 54
Table 13 Top-10 articles with the highest CycleRankscore computed from the page “Fake news”or equivalent in the given language, over themost recent snapshot of the WikiLinkGraphsdataset (2018-03-01), for German (de), English(en), French (fr), and Italian (it) Wikipedia.Circled numbers mirror the clusters presentedin Figure ??: (1, purple) terms related todisinformation; (2, green) terms related to newsoutlets and publications; (3, cyan) terms re-lated to Facebook and social media (4, orange)terms related to Donald Trump and the 2016presidential election in the United States. . . . . 55
Table 14 Top-10 articles with the highest CycleRankscore computed from the page “Fake news”or equivalent in the given language, over themost recent snapshot of the WikiLinkGraphsdataset (2018-03-01), for Dutch (nl), Polish(pl), Russian (ru), and Swedish (sv) Wiki-pedia. Circled numbers mirror the clusterspresented in Figure ??: (1, purple) termsrelated to disinformation; (2, green) termsrelated to news outlets and publications; (3,cyan) terms related to Facebook and socialmedia (4, orange) terms related to DonaldTrump and the 2016 presidential election in theUnited States. (‡) Russian Wikipedia articletitles are transliterated. . . . . . . . . . . . . . . 56
168

Table 15 Top-10 articles as ranked by CycleRank, Page-Rank, and 2DRank with “Computer science” asreference node. The article “Computer science” ,which would appear in the first position by def-inition, is omitted. . . . . . . . . . . . . . . . . 58
Table 16 Top-10 articles as ranked by CycleRank, Per-sonalized PageRank, and 2Drank with “FreddieMercury” as reference node. The article “Fred-die Mercury” , which would appear in the firstposition by definition, is omitted. . . . . . . . . 59
Table 17 ClickStream data for the article “Computer sci-ence” (c is the click count, νCr is the rankinginduced by the count) and rankings producedby CycleRank with K = 3 (CR) and Page-Rank with α = 0.30 (PR) after filtering. TheKendall correlation coefficients between Click-Stream and the rankings produced by the algo-rithms presented in the table are computed onlyover the 10 items displayed. . . . . . . . . . . . 63
Table 18 Results of the ClickStream evaluation over asample of 1,000 random articles for CycleRank,PageRank, and 2DRank for different values oftheir parameters: maximum cycle length K forCycleRank and damping factor α for PageRankand 2DRank. . . . . . . . . . . . . . . . . . . . 64
Table 19 The first 10 articles appearing in the See-Alsosection of the “Computer science” article.We use them to compare CycleRank withK = 3 (CR), PageRank with α = 0.30 (PR),and 2DRank with α = 0.30 (2D). For eacharticle, the table reports the position in whichit appears in the ranking produced by eachalgorithm, and the corresponding difference inscores ∆ξ. The
∑∆ξ(Wr) is calculated only
over the 10 items displayed. . . . . . . . . . . . 66Table 20 Results of the See-Also evaluation over a sample
of 1,000 random articles for CycleRank, Page-Rank and 2DRank for different values of theirparameters: maximum cycle lengthK for Cycle-Rank and damping factor α for PageRank and2DRank. . . . . . . . . . . . . . . . . . . . . . . 67
169

Table 21 Positions in which the top-100 articles by inde-gree appear in the rankings produced by Cycle-Rank (top), PageRank (bottom), with “Com-puter science” as reference node and their scoreξ(νr,w). Results for PageRank and 2DRank arelimited to the top-1000 positions. The
∑ξ(Wr)
is calculated only over the 10 items displayed. . 68Table 22 Execution time comparison of CycleRank, Page-
Rank, CheiRank, and 2DRank for different val-ues of the parameters: maximum cycle length Kfor CycleRank, and damping parameter α forPageRank, CheiRank, and 2DRank. All timesare expressed in seconds. . . . . . . . . . . . . . 70
Table 23 Selection of reference keywords/Wikipedia arti-cles for the analysis, connected to the umbrellatopics. . . . . . . . . . . . . . . . . . . . . . . . 77
Table 24 Selection of the reference Wikipedia articles forthe analysis, connected to the umbrella topics. . 78
Table 25 Top 10 most relevant concepts by CycleRankscore with respect to “Internet governance,”along different yearly snapshots of the Wiki-LinkGraphs dataset (2007-2012). . . . . . . . . 83
Table 26 Top 10 most relevant concepts by CycleRankscore with respect to “Internet governance,”along different yearly snapshots of the Wiki-LinkGraphs dataset (2013-2018). . . . . . . . . 84
Table 27 Top 10 most relevant concepts by CycleRankscore with respect to “Internet governance,”across different Wikipedia language editions. . . 85
Table 28 Basic metrics describing the goodness of fitassociated with different epidemics and modelsincluding the mean absolute percentage error(MAPE), the Pearson correlation coefficient,the coefficient of determination (R2) and theAkaike information criterion (AIC). Values ofR2 were computed on the basis of equationy = ax, thus allowing for negative R2 values.AIC was used to estimate the probability thatinformation loss is minimized when we consideran alternative model to the model having thelowest AIC value. . . . . . . . . . . . . . . . . . 98
170

Table 29 Statistical measures on the performances of theSN-Model and the supervised machine learningapproach (L), as obtained for different epidemicscenarios. Each measure was obtained for twodistinct calibration procedures. In the first one(labeled as 80/20 in the table), model param-eters were calibrated using only 80% of data;in the second (baseline) model parameters werecalibrated using 100% of data. In both cases,performances were assessed only in the last 20%data points. . . . . . . . . . . . . . . . . . . . . 102
Table 30 Top 10 most relevant concepts by CycleRankscore with respect to “Cyberbullying,” along dif-ferent yearly snapshots of the WikiLinkGraphsdataset (2006-2012). . . . . . . . . . . . . . . . 113
Table 31 Top 10 most relevant concepts by CycleRankscore with respect to “Cyberbullying,” along dif-ferent yearly snapshots of the WikiLinkGraphsdataset (2013-2018). . . . . . . . . . . . . . . . 114
Table 32 Top 10 most relevant concepts by CycleRankscore with respect to “Cyberbullying,” acrossdifferent Wikipedia language editions. . . . . . . 115
Table 33 Top 10 most relevant concepts by CycleRankscore with respect to “Computer security,”along different yearly snapshots of the Wiki-LinkGraphs dataset (2002-2010). . . . . . . . . 118
Table 34 Top 10 most relevant concepts by CycleRankscore with respect to “Computer security,”along different yearly snapshots of the Wiki-LinkGraphs dataset (2011-2018). . . . . . . . . 119
Table 35 Top 10 most relevant concepts by CycleRankscore with respect to “Computer security,”across different Wikipedia language editions. . . 120
Table 36 Top 10 most relevant concepts by CycleRankscore with respect to “Green computing,” alongdifferent yearly snapshots of the WikiLink-Graphs dataset (2006-2012). . . . . . . . . . . . 125
Table 37 Top 10 most relevant concepts by CycleRankscore with respect to “Green computing,” alongdifferent yearly snapshots of the WikiLink-Graphs dataset (2013-2018). . . . . . . . . . . . 126
Table 38 Top 10 most relevant concepts by CycleRankscore with respect to “Green computing,” acrossdifferent Wikipedia language editions. . . . . . . 127
171

Table 39 Top 10 most relevant concepts by CycleRankscore with respect to “Internet privacy,” alongdifferent yearly snapshots of the WikiLink-Graphs dataset (2005-2011). . . . . . . . . . . . 129
Table 40 Top 10 most relevant concepts by CycleRankscore with respect to “Internet privacy,” alongdifferent yearly snapshots of the WikiLink-Graphs dataset (2012-2018). . . . . . . . . . . . 130
Table 41 Top 10 most relevant concepts by CycleRankscore with respect to “Internet privacy,” acrossdifferent Wikipedia language editions. . . . . . . 131
Table 42 Top 10 most relevant concepts by CycleRankscore with respect to “Net neutrality,” along dif-ferent yearly snapshots of the WikiLinkGraphsdataset (2006-2012). . . . . . . . . . . . . . . . 135
Table 43 Top 10 most relevant concepts by CycleRankscore with respect to “Net neutrality,” along dif-ferent yearly snapshots of the WikiLinkGraphsdataset (2013-2018). . . . . . . . . . . . . . . . 136
Table 44 Top 10 most relevant concepts by CycleRankscore with respect to “Net neutrality,” acrossdifferent Wikipedia language editions. . . . . . . 137
Table 45 Top 10 most relevant concepts by CycleRankscore with respect to “Online identity,” alongdifferent yearly snapshots of the WikiLink-Graphs dataset (2006-2012). . . . . . . . . . . . 140
Table 46 Top 10 most relevant concepts by CycleRankscore with respect to “Online identity,” alongdifferent yearly snapshots of the WikiLink-Graphs dataset (2013-2018). . . . . . . . . . . . 141
Table 47 Top 10 most relevant concepts by CycleRankscore with respect to “Online identity,” acrossdifferent Wikipedia language editions. . . . . . . 142
Table 48 Top 10 most relevant concepts by Cycle-Rank score with respect to “Open-sourcemodel,” along different yearly snapshots of theWikiLinkGraphs dataset (2017-2018). . . . . . . 147
Table 49 Top 10 most relevant concepts by CycleRankscore with respect to “Open-source model,”across different Wikipedia language editions. . . 148
Table 50 Top 10 most relevant concepts by CycleRankscore with respect to “Right to be forgotten,”along different yearly snapshots of the Wiki-LinkGraphs dataset (2017-2018). . . . . . . . . 150
172

Table 51 Top 10 most relevant concepts by CycleRankscore with respect to “Right to be forgotten,”across different Wikipedia language editions. . . 151
Table 52 Top 10 most relevant concepts by CycleRankscore with respect to “General Data ProtectionRegulation,” along different yearly snapshots ofthe WikiLinkGraphs dataset (2013-2018). . . . 154
Table 53 Top 10 most relevant concepts by CycleRankscore with respect to “General Data Protec-tion Regulation,” across different Wikipedialanguage editions (de, en, es, fr). . . . . . . . . . 155
Table 54 Top 10 most relevant concepts by CycleRankscore with respect to “General Data Protec-tion Regulation,” across different Wikipedialanguage editions (it, nl, pl, sv). . . . . . . . . . 156
173


B I B L I O G R A P H Y
[1] Cristian Consonni, David Laniado, and Alberto Montresor. Wi-kiLinkGraphs: A complete, longitudinal and multi-languagedataset of the Wikipedia link networks. In Proceedings of theInternational AAAI Conference on Web and Social Media, vol-ume 13, pages 598–607, 2019.
[2] Cristian Consonni, David Laniado, and Alberto Montresor. Cycle-Rank, or There and Back Again: personalized relevance scoresfrom cyclic paths on graphs. Submitted to VLDB 2020, 2020.
[3] Cristian Consonni, David Laniado, and Alberto Montresor. Dis-covering Topical Contexts from Links in Wikipedia. Part of TheWeb Conference 2019, 2019.
[4] Paolo Bosetti, Piero Poletti, Cristian Consonni, Bruno Lepri,David Lazer, Stefano Merler, and Alessandro Vespignani. Dis-entangling social contagion and media drivers in the emergenceof health threats awareness. Science Advances, 2019. Under re-view at Science Advances.
[5] J J Hopfield. Neural networks and physical systems with emer-gent collective computational abilities. Proceedings of the Na-tional Academy of Sciences, 79(8):2554–2558, 1982.
[6] Sergey Brin and Lawrence Page. The anatomy of a large-scalehypertextual web search engine. Computer networks and ISDNsystems, 30(1-7):107–117, 1998.
[7] Chris Woolston. A call to deal with the data deluge. Nature,525(7570), 2015.
[8] Economist editorial. The data deluge. The Economist, 2010.
[9] Alexa Internet, Inc. The top 500 sites on the web. https://www.alexa.com/topsites, 2019. [Online; accessed 13-March-2019].
[10] Wikipedia contributors. List of wikipedias — Wikipedia, thefree encyclopedia. https://en.wikipedia.org/w/index.php?title=List_of_Wikipedias&oldid=886713365, 2019. [Online; accessed13-March-2019].
[11] MediaWiki developers. English Wikipedia, Special:Statistics.https://en.wikipedia.org/wiki/Special:Statistics, 2018. [Online;accessed 28-December-2018].
175

[12] Dirk Lewandowski and Ulrike Spree. Ranking of wikipedia arti-cles in search engines revisited: Fair ranking for reasonable qual-ity? Journal of the American Society for Information Scienceand Technology, 62(1):117–132, 2011.
[13] Taha Yasseri, Anselm Spoerri, Mark Graham, and János Kertész.The most controversial topics in wikipedia: A multilingual andgeographical analysis. In P.Fichman and N. Hara, editors, GlobalWikipedia: International and Cross-Cultural Issues in Online Col-laboration. Scarecrow Press, 2014.
[14] Anselm Spoerri. What is popular on wikipedia and why? FirstMonday, 12(4), 2007.
[15] Michaël R Laurent and Tim J Vickers. Seeking health informationonline: does wikipedia matter? Journal of the American MedicalInformatics Association, 16(4):471–479, 2009.
[16] Wikipedia contributors. Wikipedia:manual of style/linking —Wikipedia, the free encyclopedia. https://en.wikipedia.org/w/index.php?title=Wikipedia:Manual_of_Style/Linking&oldid=875531776, 2018. [Online; accessed 28-December-2018].
[17] Erik Borra, Esther Weltevrede, Paolo Ciuccarelli, AndreasKaltenbrunner, David Laniado, Giovanni Magni, Michele Mauri,Richard Rogers, and Tommaso Venturini. Societal controversiesin wikipedia articles. In Bo Begole, Jinwoo Kim, Kori Inkpen,andWoontack Woo, editors, Proceedings of the 33rd Annual ACMConference on Human Factors in Computing Systems, CHI 2015,Seoul, Republic of Korea, April 18-23, 2015, pages 193–196. ACM,2015.
[18] Eric Yeh, Daniel Ramage, Christopher D Manning, Eneko Agirre,and Aitor Soroa. Wikiwalk: random walks on wikipedia for se-mantic relatedness. In Proceedings of the 2009 workshop on graph-based methods for natural language processing, pages 41–49. As-sociation for Computational Linguistics, 2009.
[19] Roberto Navigli and Simone Paolo Ponzetto. Babelnet: The auto-matic construction, evaluation and application of a wide-coveragemultilingual semantic network. Artificial Intelligence, 193:217–250, 2012.
[20] Valentina Presutti, Sergio Consoli, Andrea Giovanni Nuzzolese,Diego Reforgiato Recupero, Aldo Gangemi, Ines Bannour, andHaïfa Zargayouna. Uncovering the semantics of wikipediapagelinks. In International Conference on Knowledge Engineer-ing and Knowledge Management, pages 413–428. Springer, 2014.
[21] Andrea Capocci, Vito DP Servedio, Francesca Colaiori, Luciana SBuriol, Debora Donato, Stefano Leonardi, and Guido Caldarelli.
176

Preferential attachment in the growth of social networks: Theinternet encyclopedia wikipedia. Physical review E, 74(3):036116,2006.
[22] Nils Markusson, Tommaso Venturini, David Laniado, and An-dreas Kaltenbrunner. Contrasting medium and genre on Wi-kipedia to open up the dominating definition and classificationof geoengineering. Big Data & Society, 3(2):2053951716666102,2016.
[23] Robert West and Jure Leskovec. Human wayfinding in informa-tion networks. In Proceedings of the 21st international conferenceon World Wide Web, pages 619–628. ACM, 2012.
[24] Benjamin Mako Hill and Aaron Shaw. Consider the redirect: Amissing dimension of Wikipedia research. In Proceedings of TheInternational Symposium on Open Collaboration, page 28. ACM,2014.
[25] Wikipedia contributors. Help:wikitext — Wikipedia, thefree encyclopedia. https://en.wikipedia.org/w/index.php?title=Help:Wikitext&oldid=866759011, 2018. [Online; accessed 28-December-2018].
[26] Wikipedia contributors. Wikipedia:visualeditor — Wikipedia,the free encyclopedia. https://en.wikipedia.org/w/index.php?title=Wikipedia:VisualEditor&oldid=869507404, 2018. [Online;accessed 29-December-2018].
[27] Wikipedia contributors. Wikipedia:red link — Wikipedia, thefree encyclopedia. https://en.wikipedia.org/w/index.php?title=Wikipedia:Red_link&oldid=858691658, 2018. [Online; accessed29-December-2018].
[28] Erik Zachte. Wikimedia stats. [Online; accessed 30-December-2018].
[29] MediaWiki. Manual:pagelinks table — mediawiki, the free wikiengine, 2019. [Online; accessed 15-January-2019].
[30] Massimo Franceschet. Pagerank: Standing on the shoulders ofgiants. arXiv preprint arXiv:1002.2858, 2010.
[31] Jeyhun Karimov, Tilmann Rabl, Asterios Katsifodimos, Ro-man Samarev, Henri Heiskanen, and Volker Markl. Bench-marking distributed stream processing engines. arXiv preprintarXiv:1802.08496, 2018.
[32] Robert West, Ashwin Paranjape, and Jure Leskovec. Mining miss-ing hyperlinks from human navigation traces: A case study ofwikipedia. In Proceedings of the 24th international conference on
177

World Wide Web, pages 1242–1252. International World WideWeb Conferences Steering Committee, 2015.
[33] Ellery Wulczyn, Robert West, Leila Zia, and Jure Leskovec. Grow-ing wikipedia across languages via recommendation. In Proceed-ings of the 25th International Conference on World Wide Web,pages 975–985. International World Wide Web Conferences Steer-ing Committee, 2016.
[34] Linyuan Lü and Tao Zhou. Link prediction in complex networks:A survey. Physica A: statistical mechanics and its applications,390(6):1150–1170, 2011.
[35] Julia Preusse, Jérôme Kunegis, Matthias Thimm, Steffen Staab,and Thomas Gottron. Structural dynamics of knowledge net-works. In ICWSM, 2013.
[36] Marcius Armada de Oliveira, Kate Cerqueira Revoredo, andJose Eduardo Ochoa Luna. Semantic unlink prediction in evolv-ing social networks through probabilistic description logic. In In-telligent Systems (BRACIS), 2014 Brazilian Conference on, pages372–377. IEEE, 2014.
[37] Roger Guimerà and Marta Sales-Pardo. Missing and spurious in-teractions and the reconstruction of complex networks. Proceed-ings of the National Academy of Sciences, 106(52):22073–22078,2009.
[38] An Zeng and Giulio Cimini. Removing spurious interactions incomplex networks. Physical Review E, 85(3):036101, 2012.
[39] Andras A Benczur, Karoly Csalogany, Tamas Sarlos, and MateUher. Spamrank–fully automatic link spam detection work inprogress. In Proceedings of the first international workshop onadversarial information retrieval on the web, 2005.
[40] Fabio De Rosa, Alessio Malizia, and Massimo Mecella. Discon-nection prediction in mobile ad hoc networks for supporting co-operative work. Pervasive Computing, IEEE, 4(3):62–70, 2005.
[41] Wikipedia contributors. History of wikipedia — Wikipedia,the free encyclopedia. https://en.wikipedia.org/w/index.php?title=History_of_Wikipedia&oldid=875601169, 2018. [Online;accessed 28-December-2018].
[42] Wikipedia contributors. Wikipedia:five pillars — Wikipedia,the free encyclopedia. https://en.wikipedia.org/w/index.php?title=Wikipedia:Five_pillars&oldid=869228495, 2018. [Online;accessed 28-December-2018].
[43] Wikipedia contributors. Wikipedia:neutral point of view —Wikipedia, the free encyclopedia. https://en.wikipedia.org/
178

w/index.php?title=Wikipedia:Neutral_point_of_view&oldid=871557947, 2018. [Online; accessed 28-December-2018].
[44] Christian Pentzold, Esther Weltevrede, Michele Mauri, David La-niado, Andreas Kaltenbrunner, and Erik Borra. Digging Wiki-pedia: The Online Encyclopedia as a Digital Cultural HeritageGateway and Site. Journal on Computing and Cultural Heritage(JOCCH), 10(1):5, 2017.
[45] Pablo Aragon, David Laniado, Andreas Kaltenbrunner, and YanaVolkovich. Biographical social networks on Wikipedia: a cross-cultural study of links that made history. In Proceedings of theeighth annual international symposium on Wikis and open collab-oration, page 19. ACM, 2012.
[46] Young-Ho Eom, Pablo Aragón, David Laniado, AndreasKaltenbrunner, Sebastiano Vigna, and Dima L Shepelyansky. In-teractions of cultures and top people of Wikipedia from rankingof 24 language editions. PloS one, 10(3):e0114825, 2015.
[47] Mostafa Mesgari, Chitu Okoli, Mohamad Mehdi, Finn ÅrupNielsen, and Arto Lanamäki. “the sum of all human knowledge”:A systematic review of scholarly research on the content of wikipedia. Journal of the Association for Information Science andTechnology, 66(2):219–245, 2015.
[48] Robert West and Jure Leskovec. Automatic versus human nav-igation in information networks. In Sixth International AAAIConference on Weblogs and Social Media, 2012.
[49] Yilun Lin, Bowen Yu, Andrew Hall, and Brent Hecht. Prob-lematizing and addressing the article-as-concept assumption inwikipedia. In Proceedings of the 2017 ACM Conference on Com-puter Supported Cooperative Work and Social Computing, pages2052–2067. ACM, 2017.
[50] Lawrence Page, Sergey Brin, Rajeev Motwani, and Terry Wino-grad. The pagerank citation ranking: Bringing order to the web.Technical report, Stanford InfoLab, 1999.
[51] David F Gleich, Paul G Constantine, Abraham D Flaxman, andAsela Gunawardana. Tracking the random surfer: empiricallymeasured teleportation parameters in pagerank. In Proceedingsof the 19th international conference on World wide web, pages381–390. ACM, 2010.
[52] Paolo Boldi, Massimo Santini, and Sebastiano Vigna. Pagerankas a function of the damping factor. In Proceedings of the 14th in-ternational conference on World Wide Web, pages 557–566. ACM,2005.
179

[53] Malte Schwarzer, Moritz Schubotz, Norman Meuschke, CorinnaBreitinger, Volker Markl, and Bela Gipp. Evaluating link-basedrecommendations for wikipedia. In Proceedings of the 16thACM/IEEE-CS on Joint Conference on Digital Libraries, pages191–200. ACM, 2016.
[54] Jaap Kamps and Marijn Koolen. Is wikipedia link structure differ-ent? In Proceedings of the second ACM international conferenceon Web search and data mining, pages 232–241. ACM, 2009.
[55] Alexei D Chepelianskii. Towards physical laws for software archi-tecture. arXiv preprint arXiv:1003.5455, 2010.
[56] AO Zhirov, OV Zhirov, and DL Shepelyansky. Two-dimensionalranking of wikipedia articles. The European Physical Journal B,77(4):523–531, 2010.
[57] Leo Torres, Pablo Suárez-Serrato, and Tina Eliassi-Rad. Non-backtracking cycles: length spectrum theory and graph miningapplications. Applied Network Science, 4(1):41, 2019.
[58] Andries E Brouwer and Willem H Haemers. Spectra of graphs.Springer Science & Business Media, 2011.
[59] Donald B Johnson. Finding all the elementary circuits of a di-rected graph. SIAM Journal on Computing, 4(1):77–84, 1975.
[60] Mathieu Bastian, Sebastien Heymann, and Mathieu Jacomy.Gephi: An open source software for exploring and manipulatingnetworks. In Eytan Adar, Matthew Hurst, Tim Finin, Natalie S.Glance, Nicolas Nicolov, and Belle L. Tseng, editors, Proceedingsof the Third International Conference on Weblogs and Social Me-dia, ICWSM 2009, San Jose, California, USA, May 17-20, 2009.The AAAI Press, 2009.
[61] Mathieu Jacomy, Tommaso Venturini, Sebastien Heymann, andMathieu Bastian. Forceatlas2, a continuous graph layout algo-rithm for handy network visualization designed for the gephi soft-ware. PloS one, 9(6):e98679, 2014.
[62] Scott Emmons, Stephen Kobourov, Mike Gallant, and KatyBörner. Analysis of network clustering algorithms and clusterquality metrics at scale. PLOS ONE, 11:1–18, 07 2016.
[63] Ellery Wulczyn and Dario Taraborelli. Wikipedia clickstream,Feb 2017.
[64] Wikipedia contributors. Wikipedia:manual of style/layout —’see also’ section — Wikipedia, the free encyclopedia. https://en.wikipedia.org/w/index.php?title=Wikipedia:Manual_of_Style/Layout&oldid=906190242#%22See_also%22_section,2019. [Online; accessed 15-July-2019].
180

[65] National Science and Technology Council Pandemic Predictionand Forecasting Science and Technology Working Group. To-wards epidemic prediction: Federal efforts and opportunitiesin outbreak modeling. https://obamawhitehouse.archives.gov/sites/default/files/microsites/ostp/NSTC/towards_epidemic_prediction-federal_efforts_and_opportunities.pdf, 2016. [On-line; accessed January-2018].
[66] Cécile Viboud, Kaiyuan Sun, Robert Gaffey, Marco Ajelli, LauraFumanelli, Stefano Merler, Qian Zhang, Gerardo Chowell, LoneSimonsen, Alessandro Vespignani, et al. The rapidd ebola fore-casting challenge: Synthesis and lessons learnt. Epidemics, 22:13–21, 2018.
[67] Chiara Poletto, Pierre-Yves Boëlle, and Vittoria Colizza. Risk ofmers importation and onward transmission: a systematic reviewand analysis of cases reported to who. BMC infectious diseases,16(1):448, 2016.
[68] Neil Ferguson. Capturing human behaviour. Nature,446(7137):733, 2007.
[69] Chris T Bauch and Alison P Galvani. Social factors in epidemi-ology. Science, 342(6154):47–49, 2013.
[70] Gillian K SteelFisher, Robert J Blendon, Mark M Bekheit, andKeri Lubell. The public’s response to the 2009 h1n1 influenzapandemic. New England Journal of Medicine, 362(22):e65, 2010.
[71] Neil M Ferguson, Derek AT Cummings, Christophe Fraser,James C Cajka, Philip C Cooley, and Donald S Burke. Strate-gies for mitigating an influenza pandemic. Nature, 442(7101):448,2006.
[72] BJ Cowling, LM Ho, and GM Leung. Effectiveness of controlmeasures during the sars epidemic in beijing: a comparison ofthe r t curve and the epidemic curve. Epidemiology & Infection,136(4):562–566, 2008.
[73] Piero Poletti, Marco Ajelli, and Stefano Merler. The effect of riskperception on the 2009 h1n1 pandemic influenza dynamics. PloSone, 6(2):e16460, 2011.
[74] Sebastian Funk, Erez Gilad, Chris Watkins, and Vincent AAJansen. The spread of awareness and its impact on epidemicoutbreaks. Proceedings of the National Academy of Sciences,106(16):6872–6877, 2009.
[75] Nicola Perra, Duygu Balcan, Bruno Gonçalves, and AlessandroVespignani. Towards a characterization of behavior-disease mod-els. PloS one, 6(8):e23084, 2011.
181

[76] Piero Poletti, Bruno Caprile, Marco Ajelli, Andrea Pugliese, andStefano Merler. Spontaneous behavioural changes in response toepidemics. Journal of theoretical biology, 260(1):31–40, 2009.
[77] Sherry Towers, Shehzad Afzal, Gilbert Bernal, Nadya Bliss,Shala Brown, Baltazar Espinoza, Jasmine Jackson, Julia Judson-Garcia, Maryam Khan, Michael Lin, et al. Mass media andthe contagion of fear: the case of ebola in america. PloS one,10(6):e0129179, 2015.
[78] Eli P Fenichel, Carlos Castillo-Chavez, M Graziano Ceddia, Ger-ardo Chowell, Paula A Gonzalez Parra, Graham J Hickling,Garth Holloway, Richard Horan, Benjamin Morin, Charles Per-rings, et al. Adaptive human behavior in epidemiological models.Proceedings of the National Academy of Sciences, 108(15):6306–6311, 2011.
[79] A Demetri Pananos, Thomas M Bury, Clara Wang, Justin Schon-feld, Sharada P Mohanty, Brendan Nyhan, Marcel Salathé, andChris T Bauch. Critical dynamics in population vaccinating be-havior. Proceedings of the National Academy of Sciences, page201704093, 2017.
[80] Isaac Chun-Hai Fung, Zion Tsz Ho Tse, Chi-Ngai Cheung, Adri-ana S Miu, and King-Wa Fu. Ebola and the social media. TheLancet, 2014.
[81] Gillian K SteelFisher, Robert J Blendon, and Narayani Lasala-Blanco. Ebola in the united states—public reactions and implica-tions. New England Journal of Medicine, 373(9):789–791, 2015.
[82] Philipp Singer, Florian Lemmerich, Robert West, Leila Zia, ElleryWulczyn, Markus Strohmaier, and Jure Leskovec. Why we readwikipedia. In Proceedings of the 26th International Conferenceon World Wide Web, pages 1591–1600. International World WideWeb Conferences Steering Committee, 2017.
[83] Paul F. Lazarsfeld, Bernard Berelson, and Hazel Gaudet. ThePeople’s Choice. How the Voter Makes up his Mind in Presiden-tial Campaign. Columbia University Press, 1944.
[84] Damon Centola. The spread of behavior in an online social net-work experiment. science, 329(5996):1194–1197, 2010.
[85] Peter Sheridan Dodds and Duncan J Watts. Universal behav-ior in a generalized model of contagion. Physical review letters,92(21):218701, 2004.
[86] Wikimedia Foundation. Pagecounts-raw. https://wikitech.wikimedia.org/w/index.php?title=Analytics/Archive/Data/
182
https://wikitech.wikimedia.org/w/index.php?title=Analytics/Archive/Data/Pagecounts-raw&oldid=1757933
https://wikitech.wikimedia.org/w/index.php?title=Analytics/Archive/Data/Pagecounts-raw&oldid=1757933

Pagecounts-raw&oldid=1757933, 2018. [Online; accessedJanuary-2018].
[87] Wikimedia Foundation. Pageviews analysis. https://tools.wmflabs.org/pageviews/, 2018. [Online; accessed January-2018].
[88] Google, Inc. Google news. https://news.google.com/, 2018. [On-line; accessed January-2018].
[89] Kenneth P Burnham and David R Anderson. Model selection andmultimodel inference: a practical information-theoretic approach.Springer Science & Business Media, 2003.
[90] Marcelo FC Gomes, Ana Pastore y Piontti, Luca Rossi, DennisChao, Ira Longini, M Elizabeth Halloran, and Alessandro Vespig-nani. Assessing the international spreading risk associated withthe 2014 west african ebola outbreak. PLoS currents, 6, 2014.
[91] Qian Zhang, Kaiyuan Sun, Matteo Chinazzi, Ana Pastore y Pio-ntti, Natalie E Dean, Diana Patricia Rojas, Stefano Merler, DinaMistry, Piero Poletti, Luca Rossi, et al. Spread of zika virus inthe americas. Proceedings of the National Academy of Sciences,page 201620161, 2017.
[92] Istituto Superiore di Sanità. Meningite: l’epidemia èsolo mediatica. http://www.epicentro.iss.it/problemi/meningiti/EpidemiaMediatica.asp, 2018. [Online; accessed January-2018].
[93] Brian G Southwell, Suzanne Dolina, Karla Jimenez-Magdaleno,Linda B Squiers, and Bridget J Kelly. Zika virus–related news cov-erage and online behavior, united states, guatemala, and brazil.Emerging infectious diseases, 22(7):1320, 2016.
[94] Roy M Anderson and Robert M May. Infectious diseases of hu-mans: dynamics and control. Oxford university press, 1992.
[95] Walter R Gilks, Sylvia Richardson, and David Spiegelhalter.Markov chain Monte Carlo in practice. Chapman and Hall/CRC,1995.
[96] Cristian Candia, C Jara-Figueroa, Carlos Rodriguez-Sickert,Albert-László Barabási, and César A Hidalgo. The universaldecay of collective memory and attention. Nature Human Be-haviour, page 1, 2018.
[97] David J Spiegelhalter, Nicola G Best, Bradley P Carlin, and An-gelika Van Der Linde. Bayesian measures of model complexityand fit. Journal of the Royal Statistical Society: Series B (Statis-tical Methodology), 64(4):583–639, 2002.
[98] Wikimedia Foundation. Wikimedia traffic analysis re-port – page views per wikipedia language – break-
183
https://wikitech.wikimedia.org/w/index.php?title=Analytics/Archive/Data/Pagecounts-raw&oldid=1757933
https://wikitech.wikimedia.org/w/index.php?title=Analytics/Archive/Data/Pagecounts-raw&oldid=1757933

down. https://stats.wikimedia.org/wikimedia/squids/SquidReportPageViewsPerLanguageBreakdown.htm, 2018.[Online; accessed January-2018].
[99] Duncan J Watts and Peter Sheridan Dodds. Influentials, net-works, and public opinion formation. Journal of consumer re-search, 34(4):441–458, 2007.
[100] David MJ Lazer, Matthew A Baum, Yochai Benkler, Adam JBerinsky, Kelly M Greenhill, Filippo Menczer, Miriam J Metzger,Brendan Nyhan, Gordon Pennycook, David Rothschild, et al. Thescience of fake news. Science, 359(6380):1094–1096, 2018.
[101] Soroush Vosoughi, Deb Roy, and Sinan Aral. The spread of trueand false news online. Science, 359(6380):1146–1151, 2018.
[102] Donald E. Knuth. Computer Programming as an Art. Commu-nications of the ACM, 17(12):667–673, 1974.
184

colophon
This document was typeset using the typographical look-and-feelclassicthesis developed by André Miede. The style was inspiredby Robert Bringhurst’s seminal book on typography “The Elementsof Typographic Style”. classicthesis is available for both LATEX andLYX:
https://bitbucket.org/amiede/classicthesis/
Final Version as of October 14, 2019 (classicthesis version 2.0).