MG21000 Market Prioritisation Report and Opportunity Development
85
1 MG21000 Market Prioritisation and Opportunity Development Report MG21000 Mango Export Strategy April 2022
-
Upload
khangminh22 -
Category
Documents
-
view
0 -
download
0
Transcript of MG21000 Market Prioritisation Report and Opportunity Development

1
MG21000Market Prioritisation and Opportunity Development Report MG21000 Mango Export Strategy
April 2022

2
Mango Market Prioritisation Report
Table of Contents
Market Prioritisation and Opportunity Development Page
Executive summary 5
Australian Mango Industry Background 4
Project objectives and methodology 5
Market prioritisation process 7
Priority markets rationale 8
Phytosanitary matrix 9
Industry consultation insights 10
Priority markets export opportunities 11
Market insights and key opportunities 13
China 14
India 26
Japan 40
USA 51
Netherlands 62
Appendices 73
Appendix A - Initial Prioritisation Exercise 73
Appendix B - Phytosanitary Matrix 76
Appendix C - Industry Capability Assessment 82
Disclaimer: A significant portion of trade data included in this report is sourced from the United Nations Comtrade database.
The United Nations Commodity Trade Statistics Database (UN Comtrade) contains detailed imports and exports statistics reported by statistical authorities of close to 200 countries or areas. It concerns annual trade data from 1962 to the most recent year. UN Comtrade is considered the most comprehensive trade database available with more than 1 billion records. UN Comtrade is available to the general public and should be used with good knowledge of its limitations:
1. The values of the reported detailed commodity data do not necessarily sum up to the total trade value for a given country dataset. Due to confidentiality, countries may not report some of their detailed trade.
2. Countries (or areas) do not necessarily report their trade statistics for every year. This means that aggregations of data into groups of countries may involve countries with no reported data for a specific year. UN Comtrade does not contain estimates for missing data. Therefore, trade of a country group could be understated due to unavailability of some country data.
Note: all price per kilogram figures mentioned in this report are FOB prices listed in AUD, calculated using UN Comtrade data through a division of product value (AUD) over volume exported (kg), therefore prices do not account for additional costs incurred in exporting.

DRAFT
Executive Summary

4
Executive Summary
The Australian mango industry is in a unique position to drive future export growthThe Australian mango industry is at a stage of significant growth potential. Despite disruption over the past two years caused by the global COVID-19 pandemic and poor seasonal conditions, the industry has shown consistent year-on-year export growth over the past decade, increasing export volumes by 62%1 and following a 5 per cent annual growth rate, as shown below. As global economies slowly recover from the pandemic, the Australian mango industry finds itself in a unique position to recover recent export declines and maintain growth by capitalising on global demand for healthy, quality products such as mangoes.
Source: (1) UN Comtrade Database; (2) Australian mango season wraps up; (3) Australian Horticulture Statistics Handbook 2020/21
Growth in Australian mango exports3
CY2013-2021Tonnes, AUD $ million
The Australian mango industry has an ambitious goal to underpin future growth: increasing the share of production exported from 9 per cent in 2019-20 to 20 per cent.2
The key drivers of this ambition are dynamic and diverse, listed below.
Maintain competitiveness
Protect existing market share against low input-cost competing
export nations.
Recover from recent disruption
Make up for decline by identifying new
customers, channels, and market entry strategies.
Capitalise on Australian reputation for quality
Access untapped demand for premium
by leveraging Australian mangoes’
unique selling proposition.
Reduce pressure on domestic market
Diversify distribution
streams to mitigate risk of oversupply and unfavourable
pricing.2
To drive future this export growth, this updated Australian Mango Industry Export Strategy intends to enable the Australian mango industry to grow exports, ensure the ability to maintain and increase global market share, build export capacity and capability, and provide necessary support to relevant stakeholders across the export supply chain.
Australian mango production3
CY2013-2021Tonnes
4604 5275 7012 7006 7120 7694 8221 7707 4479 $- $5 $10 $15 $20 $25 $30 $35 $40
0100020003000400050006000700080009000
2013 2014 2015 2016 2017 2018 2019 2020 2021
Netweight (t) Trade Value (AUD$)
5% CAGR
57196 51069 66087 63791 61474 83314 74920 72022 515280
20000
40000
60000
80000
100000
2013 2014 2015 2016 2017 2018 2019 2020 2021
Mango Production (tonnes)

5
Executive Summary
This report seeks to uncover and prioritise key export opportunities for the Australian mango industryThe focus of this project is to uncover opportunities for continued growth, both in existing export markets and new destinations, while identifying the priority activities that the Australian mango industry should focus upon to achieved the four desired outcomes below. To do so, a five-stage methodology was applied to ensure the project scope is satisfied and the insights provided to industry are practical.
Select markets2
Perform high-level assessment of markets raised
by the Project Reference Group (PRG) at project
inception, and determine five markets for in-depth market
profiles to be developed.
5 priority markets from the long list of 16
Ob
ject
ive
Ou
tp-u
ts
Develop prioritisation criteria
1
With Hort Innovation and industry stakeholders, form
criteria to assess the 16 markets against. These are based on identified areas of interest and perspectives on
factors that indicate an attractive export opportunity.
A collaboratively formed criteria to assess 16 markets
Research market opportunities
3
Conduct targeted analysis of the priority markets based on
the interests raised by growers through desktop analysis and stakeholder
consultations. Outline key findings and recommended
next steps.
Detailed research on the 5 priority markets
Prioritise market opportunities
4
Develop five opportunities for each of the priority markets,
and through desktop research and stakeholder consultation map each opportunity based on ease of implementation
and the potential rise in market demand.
25 prioritised opportunities within a matrix
Develop export strategy
5
Informed by the market prioritisation report, develop
an export strategy for the Australian mango industry
that details the short, medium and long-term objectives and
recommends a series of practical activities to pursue desired industry outcomes.
An export strategy with practical recommendations
Stakeholder consultation with the PRG, industry and Hort Innovation throughout the project
Growth in export value, volume and countries and markets addressed
Increased activity and engagement in export market opportunities
Greater awareness and capacity for industry adoption
Practical, commercially-relevant direction for growers

6
We have taken producers and industry members on the journey with us in creating the strategy and market prioritisation report to ensure practicality and commercial relevance.
1. PRG Workshops
Select members of the industry SIAP and AMIA formed a project reference group at the inception of the project. The PRG was included in all phases throughout the project, and acted as an industry representative panel to test, validate, and share project findings to ensure relevance.
2. Regional Workshop
An industry workshop with regions and participants recommended by AMIA and Hort Innovation was conducted. In this session, we tested members’ existing knowledge/understanding of export requirements for each priority market. This helped us to form an assessment of industry capabilities, in order to ensure the strategy is tailored to current export capacities as well as future ambitions.
3. Hort Innovation
Hort Innovation were involved in each of the PRG workshops in a project management and governance capacity. We also hosted fortnightly update meetings with Hort Innovation to check in on project progression, share ongoing findings and to test draft deliverable formats as they were developed.
Executive Summary
Stakeholder consultation was at the core of the approach to ensure accuracy and practicality of recommendationsFor the recommendations and overall strategy to be practical and contain tangible insights, it is critical that stakeholder engagement was built into the methodology. There are three main ways in which industry has been engaged to gather insights and opinions on the current state of the Australian mango industry and what should be done to ensure long-term sustainable success.
12 industry members consulted in the industry workshop
5 members of the Project Reference Group, representing….
3 of the major Australian mango production regions
Industry was brought on every step of the journey to develop a refreshed 5-year export strategy and market prioritisation report.

7
Executive Summary
Initial analysis was conducted on 16 geographically dispersed markets throughout South East Asia, East Asia, the Middle East, North America and Oceania. The markets were assessed against a core criteria developed in collaboration with Australian mango growers and AMIA representatives. The assessment identified 5 priority markets which represent future export growth potential and/or meaningful business development opportunities for the next five years.
Form detailed market profilesDevelop prioritisation criteria Assess 16 markets Select 5 priority markets
At the beginning of the project, in collaboration with Hort Innovation and the PRG, the prioritisation criteria was formed. The criteria included:• Export volume;• Middle income population;• Whether it’s a protocol market; and• Industry Interest from the PRG.
The 16 markets below were assessed against the criteria, and discussed with the PRG to ensure industry is satisfied with the markets selected.
The full assessment and each market’s ranking can be found in Appendix A.
Through both quantitative and qualitative research and analysis, the assessment determined 5 priority markets for in-depth profiles to be developed, and the mango export strategy to focus on. The rationale for each of the 5 markets can be found on the following slide.
For each of the 5 priority markets, an in-depth market profile has been formed. These profiles include analysis on each market’s trade environment, consumer preferences, markets access, retail landscape and more. The market profiles can be found in the market insights and key opportunities section.
USA
Netherlands
Japan
China
India
Research and analysis of 16 markets identified 5 priority markets of focus

8
Executive Summary
Each export market presents valuable export opportunities for Australian mango exportThe Australian mango industry has the opportunity to pursue new and rapidly growing export markets as well as expand presence in markets where strong demand for Australian mangoes. already exists. The rationale for each market is detailed below, followed by the core themes of the 25 opportunities identified from within the 5 priority markets.
Japan USA India Netherlands China
• Opportunity to trial new varieties
• High income consumer groups who accustomed to premium Australian mangoes
• Large addressable market size
• Expanding market access negotiations underway
• Strong demand for mangoes and seasonality supply gap opportunities
• Current acceptance of irradiation treatments
• Addressable domestic demand, open market access
• Re-export opportunities across European Union
• Stable demand despite recent challenges
• Need to protect market share until opportunities to expand access arise
Enhance marketing and communications in marketsCommunicate to consumers, importers and retailers the safety of irradiation as a treatment pathway as well as the premium nature of Australian product varieties.
Optimise supply chainsExplore ways to potentially shorten lead times and increase the scale and consistency of export shipments.
Expand market accessPursue additional market access pathways for current and new markets, including for irradiation and in-transit cold treatment processes.
Maintain market access and qualityMaintain quality production to ensure ongoing reliable access to existing markets.
Build relationships with retailersPartner with premium retailers in-market to ensure trust and reliability in ongoing export transactions and increase visibility over supply chains.
Export opportunities identified in these markets revolve around five key themes, which are explored in the Mango Industry Export Strategy:

9
Access (Open / Closed)3
Protocol (restricted
access) Market?3
Phytosanitary Certificate Required?3
Import Permit Required?3
Free Trade Agreement
and Tariffs1,4Fumigation3 Cold2 Irradiation3 Heat (VHT) 3
China Yes Protocol Yes Yes YesChAFTA, RCEP – 0% Tariff
No No No
≥ 47 degrees celsius for 15min
OR ≥ 46 degrees celsius for
20min
Japan Yes Protocol Yes NoYes
JAEPA, RCEP, CPTPP –0% Tariff
No No No ≥ 47 degrees celsius for 15min (minimum)
India Closed No Yes No No Not a protocol market
USA Yes Protocol Yes Yes YesAUSFTA – 0%
No NoMinimum
absorbed dose of 300 gy
No
Netherlands Yes No Yes No Yes0% Tariff
Not a protocol market
Note: (1) All FTAs are in relation to mangoes (2) Fruit intended for in-transit cold treatment must be pre-cooled to, or below, the target treatment temperature before loadingSource: (3) Australian Government Department of Agriculture, Water and the Environment, Manual of Importing Country Requirements; (4) DFAT, FTA Portal
Overall Access Regulatory Requirements Treatments
The five prioritised markets have varied levels of access and treatment requirementsThe phytosanitary matrix below was formed to highlight three areas across the 5 priority markets, the assessment then informed export opportunities and business development activities for each priority market.
1. Overall access – whether the market is open or closed, and has a protocol.
2. Regulatory requirements – whether a phytosanitary certificate or import permit is required, and if there are applicable FTAs.
3. The different available treatments.
The matrix detail on the other 11 markets is available in Appendix B.
Executive Summary

10Source: (1) Stakeholder Consultations
The purpose of the industry workshop was to confirm the Australian mango industry’s broad export objectives, capacity for increasing or pursuing exports to prioritised markets, and agree on the key focus areas for future export opportunities, actions and investment. The areas below were the key themes identified throughout the session, which supplemented desktop research to act as the evidence base for opportunity identification.
Market access
– Achieving irradiation market access pathways was the top priority of industry, to preserve product quality.
– A lack of visibility over constantly changing market access regulations regarding inspections and treatments was flagged as a major pain point.
In-market communications
– A need for greater education of both consumers and governments on the safety of irradiation was flagged as a critical step to widen market access.
– More aggressive promotion of the high-quality nature of Australian mangoes in markets was also raised.
Product consistency
– Industry consistently noted that the key downfall in Australian mangoes’ competitiveness in market was a lack of ability to export consistent products at scale, on an ongoing basis.
– This was indicated as creating a more ad hoc, silo-based, opportunistic approach to exports.
Competition
– An unwavering disadvantage discussed was industry’s significantly high input costs compared to other mango exporters, worsened in geographically distant export markets.
– A need for greater visibility over the seasonality of every major competitor in every target market was flagged as a means of support this issue.
Executive Summary
The key themes extracted from the industry capability workshop centred on market access, consumer education and upskilling
The overarching conclusion around industry’s current and aspired capability for export in the areas discussed was that capability is largely based on current or past export experience of individual growers. All participants had a strong idea of current requirements for export, high-level demand in priority markets and respective operational
requirements, while more specialised knowledge of channel strategy, evolving market access arrangements, and local marketing were identified as capability areas in need of improvement. Funding, treatment options and high costs were raised as the largest barriers to export, which have been addressed in the opportunities identified in this report
where possible.

11
Japan USA India Netherlands China
1 Explore the potential of industry collaboration aggregating shipments to reduce transport costs.
Optimise supply chain processes to ensure consistency of quality upon arrival.
Start to establish relationships with retailers or importers in Tier 1 cities.
Conduct market access negotiations for irradiation at a member-state level.
Target importers and retailers with a presence across multiple city tiers, allowing a staged approach to growing exports across different populations.
2 Deliver an extensive and targeted marketing campaign to capture demand from gift giving Japan’s tradition.
Deliver in-market promotional campaign during July-August & November-December periods.
Focus advocacy on developing irradiation market access pathway, drawing on evidence of India’s existing use of the treatment.
Provide mango-specific insights to planned or ongoing horticulture-wide education campaigns for EU consumers on irradiated products.
Form local partnerships with processors and organisations to absorb volume-driven second-grade supply.
3 Improve omni-channel presence to communicate health benefits and Australia’s emphasis on food safety.
Increase range of varieties supplied during Australia’s peak seasonality.
Target in-market communications during India’s seasonal supply gap (October to December).
Invest in research and development in on-farm mechanism to increase consistency in supply and robustness of products through extended shipping times.
Promote the efficacy and safety of irradiation for market access in the long-term.
4 Explore distribution opportunities in different channels such as direct to consumer and food service.
Partner with e-commerce leaders such as Walmart and Target to capture demand of online grocery shopping.
Monitor progress of Australia-India bilateral trade agreement by participating in relevant working groups and providing evidence to support the inclusion of mangoes.
Consider consolidating exports to drive critical mass required by Netherlands import and re-export supply chains.
Bolster marketing efforts to support Australia’s competitive advantages around seasonality, fruit quality and food safety.
5 Negotiate at a government level the case for irradiation.
Review and negotiate MRLs to ensure they aren’t restricting trade growth.
Explore potential to partner with e-commerce in long term.
Continually monitor EU and target member-state evolving MRL frameworks to ease compliance with EU regulations.
Identify and leverage in-transit cold chain logistics providers for transport throughout China
Executive Summary
Export opportunities were identified for each prioritised market in line with current and future industry capability The insights from the industry workshop, accompanied by the findings from the phytosanitary matrix and other stakeholder consultations, were the foundation to forming the 25 opportunities across the priority markets. Each of the 25 opportunities are outlined at a high-level below, and are mapped on the following slide based on ease of implementation and the potential rise in market demand. The background research that informed each of these opportunities is provided in each market’s profile in the market insights and opportunities section.

12
25 export opportunities within the priority markets have been ranked to inform development of the Industry’s Export Strategy
Opportunities identified in each market were then mapped according to their respective ease ofimplementation and potential to generate market demand. Those mapped in the top rightquadrant of the graph have been identified as the priority for the industry’s export strategy,where industry should focus its resources in the near term.
– In mapping the opportunities identified for each market, a number of key themes weredemonstrated:
– Market access: As consistently emphasised by industry through both the PRG and theindustry workshop, achieving market access through irradiation pathways is a majorgoal for export to reduce input costs and preserve product quality. Before that isachieved, industry should focus on maintaining its current market access bycontinuing to produce and deliver high quality, biosecurity-compliant products tomarket.
– Irradiation education: As part of this irradiation agenda, industry has emphasised theneed to communicate to consumers in key markets, particularly Japan and theEuropean Union, that irradiated products are safe, sustainable and high-quality.
– Marketing and communications: There is capacity to strengthen messaging in exportmarkets on the premium quality of Australian mangoes compared to competitors,where funding allows.
– Building relationships: Particularly in China, India and the Netherlands, capitalising onboth current and future market access allowance will require strong partnerships withwholesale importers or retailers in markets to ensure trust, consistency, and secureexport transactions.
– Optimising supply chains: Finding means to shorten lead times to market was flaggedas critical to preserve product quality and increase cost competitiveness. Whether thisis achieved through achievement of in-transit treatment pathways or productionmeans which increase shelf-life, this is a key consideration for future exports to theNetherlands and USA particularly.
In light of these focus areas, the majority of opportunities have been included in the industry’sexport strategy, with particular emphasis on widening market access and building relationshipsin export markets.
Ease of Implementation
Market Demand Potential
High
HighLow
Low
1
2
3
4
5
1
2
3
4
5
Key: Netherlands India Japan China USA
1
2
3
4
51
2
3
4
5
1
2
3
4
5
Executive Summary

DRAFT
Market Insights & Key Opportunities

DRAFT
China

15
China’s cities are categorised by five tiers, hence the market is not homogenous and requires a targeted strategy
Source: (1) SCMP, China’s tiered city system; (2) Austrade, Market Insight – China; (3) World Population Review
Market Profile – China
Legend: Major Wholesale Markets Major Mango Production Provinces
Major Ports Top Air Freight Locations
China’s 662 cities are segmented into 5 different tiers.3
– China’s cities are categorised by three different attributes, each city ranks differently in each area so an average is used to determine their tier:4
– GDP: Each city is first classified by Gross Domestic Product. China’s cities range from USD $350 trillion to minor cities with GDP under USD $20 billion.1
– Politics: The second classification is the political administration of a city. China has four levels as well as two special regions, Hong Kong and Macau.
– Population: The core city and urban areas surrounding the main city are taken into account to define metropolitan areas.
– Tier systems are used to study consumer behaviour, income levels and local trends to tailor strategies to local conditions. For Australian exporters, the tiers will help to have more targeted marketing and promotional activities rather than treating China as a homogenous market.
China requires a nuanced strategy, considering the attributes of each city.
– Mangoes are of cultural significance in China meaning higher demand is expected for events such as Mid-Autumn Festival, New Year and Chinese New Year. This represents an opportunity for Australia to increase exports towards the end of the year and into January when Australia is in peak seasonality.
– Traditional retail, such as fruit shops, convenience stores and supermarkets, are highly concentrated in Tier 2 and 3 cities – accounting for 60 per cent of retail food sales across China.2 The growth of non-Tier 1 cities provides expansion opportunities for exporters with an existing presence in only Tier-1 cities or no presence at all.
Trade & Market Landscape Activities Overview

16
Despite recent political challenges, China remains a lucrative export market.
– Australian mango exports to China have seen progressive growth over a 10 year timeline, notably increasing 79 per cent YoY from 2019 to 2020.
– Despite such growth Australia is only 1.2 per cent of Chinese mango imports.
– The 10-year CAGR for Australian mango exports is positive at 26 per cent and roughly in line with the overall growth trend of Chinese mango imports from all sources over the same period.
– In 2019 the Cooperative Research Centre for Developing Northern Australia (CRCNA) announced an AUD $2.24 million project with Australia’s leading Calypso mango exporter Perfection Fresh, Queensland Department of Agriculture and Fisheries (DAF) and the University of Queensland to boost exports to China by 200 per cent in the next 5 years.
Rising income levels and expansion of Tier 2 and 3 cities is driving import growth of mangoes into China.
– Global imports of mangoes into China have a 15 per cent CAGR over the 10-year time period between 2011 and 2020, reaching almost 400,000 tonnes and approximately USD $800 million in trade value.
– Between 2011 and 2015, mango imports in China were largely stagnant between approximately 90,000 and 110,000 tonnes due to domestic production absorbing local demand. However, from 2016 to 2020 demand outweighed local production leading to the trade value of imported fresh mango increasing by 346 per cent over the 5-year time period.
– The recent increased demand is partly driven by the rising income levels in Tier 2 and 3 cities. With higher disposable income consumers have capacity to be more health conscious with their purchases leading to increased demand for mangoes.
Despite political challenges, China remains a highly lucrative export market for Australian growersMango exports from Australia to China1
FY2010 - 2020AUD $ million, tonnes
China mango imports by year1
FY2010 - 2020AUD $ 000s, tonnes
Note: Quoted figures have been converted from USD to AUD based on an exchange rate of 1.38. Source: (1) UN Comtrade Data; (2) PW Consulting, Analysis of the development of mango industry in China; (3) Fresh Plaza, The demand for imported mangoes in the Chinese market is still growing
Market Profile – China
15% CAGR
29 69 29 117 43 113 73 132 232 178 319$0
$500
$1,000
$1,500
$2,000
$2,500
0
50
100
150
200
250
300
350
2010 2011 2012 2013 2014 2015 2016 2017 2018 2019 2020
Netweight (t) Trade Value (AUD$)
26% CAGR
111878 129180 138433 89164 112921 69258 76937 170668 379792 378779 $-
$200,000,000
$400,000,000
$600,000,000
$800,000,000
$1,000,000,000
$1,200,000,000
0
100000
200000
300000
400000
2011 2012 2013 2014 2015 2016 2017 2018 2019 2020
Netweight (t) Trade Value (AUD$)
Trade & Market Landscape Activities Overview

17
Trade value of Chinese mango imports by source1
FY2020
Jan Feb Mar Apr May Jun Jul Aug Sep Oct Nov Dec
AUS
THAI
INDO
MAL
CHI
Source: (1) UN Comtrade; (2) KPMG Analysis; (3) Fresh Plaza, Exports of Thai fruits to China grew 39% in 2020; (4) World Bank, Thailand monthly trade data; (5) DFAT, FTA Portal
Consolidated seasonality mango varieties from leading exporters2
The Chinese market is dominated by Thai exports, though this may be due to significant re-exporting – similar to that of the Netherlands and broader Europe.
– Thailand holds 79 per cent share of the Chinese mango market, with Indonesia trailing at 11 per cent. This may however be a function of re-export with neighbouring countries such as Myanmar and Cambodia using Thailand as an export hub due to existing Thai-Chinese relationships and a credible reputation.1
– The China-Thailand trade relationship is strengthening with Thailand focusing on the quality and standards of fruit exports through traceability systems.3 This emphasises the opportunity for Australian exporters to integrate technologies such as blockchain and openly communicate the supply chain practices necessary to ensure high-quality produce.
– Marketing and promotional efforts are also high, with an omni-channel approach to holding Thailand Fruit Golden Month in 14 Chinese cities throughout 2021, relative to 11 in 2020. Substantiating the importance for Australian exporters to have a presence at events of cultural importance such as Chinese New Year.3
Market Profile – China
Thailand is the leading exporter to China however Australia competes at a higher price point with different peak seasonality
– Thailand has year round supply of mangoes due to its favourable climatic conditions for growing topical fruits. Additionally, for export to China (Second leading trade partner4), Thailand has a geographic proximity advantage relative to Australia and a developed logistics system with a variety of transport options such as by land, air and sea.
– Australia’s peak seasonality is between November and February, which aligns well with Chinese New Year being towards the end of January. Giving mangoes as gifts is of cultural importance in China, creating an opportunity for Australian exporters to promote and package appropriately to capture a portion of the premium gift giving market.
– Despite year round supply mangoes imported from Thailand are much cheaper than those from Australia. Thailand exports mangoes to China at an average price of USD $0.12 relative to USD $0.95 per kg from Australia.1 This suggests Thai and Australian exporters are not direct competitors as Australian mangoes attract a less price sensitive consumer.1
The Chinese market mostly imports from South East Asia though growth opportunities remain for Australian exporters
Trade & Market Landscape Activities Overview

18
Australian Exporters / Agents
Wholesalers
Consumers
Wet Markets
Grocery Stores
WeChat Retailers
Convenience Stores
New 020 Retailers
Factory Store
Retailers
Chain store retailers &
online
Supermarkets (Incl. high-end) Importers / Agents
Second-tier Wholesalers
Market Profile – China
Supply chain challenges exporting to China are not restricted to transport between the two markets
Key supply chain challenges & potential solutions:
1. Wholesalers in China often repackage imported Australian mangoes and grade them into different categories based on their quality. They keep the best and resell to second-tier wholesalers, however the repackaging process can damage mangoes. The damage from the repackaging process inadvertently damages the reputation of Australian growers as they fruit they receive isn’t the quality they expected.
– This could be avoided through building relationships with Chinese importers and first-tier wholesalers to understand their gradings and do such packaging in Australia, preventing the repackaging process and reducing risk of damage. Also packaging can be based on the duration of travel and destination to ensure boxes are designed to support temperature control (insultation) and prevent damage while in transit (padded boxes).
2. There is a lack of adequate temperature management when transporting Australian mangoes throughout China. A prolonged period where the mangoes are not at the necessary temperature impacts the quality of the mangoes and may cause chilling damage. This often occurs when in transit between temporary cold storage and the point of sale.
– R&D investment on the cold chain logistics landscape within China will provide Australian exporters with an understanding of the ambient temperature of the different locations mangoes are being sent to, the leading distribution and transport providers (that will ensure temperatures are managed effectively) and the available technology which will alert stakeholders when the quality will be or is being impacted.
When exporting to China growers must be aware of each stage of the supply chain from farm to point of sale to ensure both the mango quality and the reputation of Australian mangoes isn’t damaged. While mangoes face challenges with sea freight and VHT, there are a number of in-market challenges that must also be addressed.
Source: (1) Griffith University, Challenges and opportunities for meeting the requirements of Chinese mango markets (2) Department of Agriculture and Fisheries, Rules of thumb for export mango supply chains;
Trade & Market Landscape Activities Overview

19
Market Profile – China
VHT is the main constraint exporting to China though there are ways in which it can be improved in the short to medium term
Source: (1) CRCNA, Evaluation of the potential to expand horticultural industries in Northern Australia; (2) KPMG Analysis & industry stakeholder consultation
Developing Australia’s understanding of VHT may be the fastest avenue to growing two-way mango trade
– While VHT has proven to be problematic for Australian exporters, Chinese wholesalers have expressed interest in increasing exports if the shelf life of mangoes can be more predictable and controlled following treatment.1
– While efforts to allow irradiation are in motion, the timeline on when irradiation will become available is unclear, and so a focus on improving the current VHT situation is necessary to grow trade in the short to medium term.
Three recommendations to improve the current state of VHT in order to drive export growth to China:
1. Improve the existing VHT methods:
a) Develop practical and easy to understand guidelines from both Australian and international governments. Understanding changes and being up to date is said to be a challenge for industry.2 This would require collaboration between the Australian government and China’s quarantine authorities.
b) Throughout the pandemic, due to movement restrictions, international quarantine inspectors could not travel to Australia and relied on Australian officials to conduct inspections. If this were to be allowed post-pandemic, Australian officials may be more consistent in their inspection expectations and also be more flexible with pricing, making it easier to comply and potentially cheaper for growers.
2. Comprehensively understand China to segment demand and develop local relationships to absorb the supply of non-first graded fruit. Industry has expressed the risk of exporting mangoes post-VHT treatment as the volume of fruit accepted is an unknown due to the impact of VHT on fruit quality.2
3. Integrate technology to gain and leverage traceability information. This forces fruit to go through official channels, largely eliminating trade through unofficial channels, which is attractive for direct importers and wholesalers. Traceability information then helps to educate consumers on the high standard of food safety practices in Australia, which may not be as much of a focus for competing producers.
Australian VHT facilities
Trade & Market Landscape Activities Overview

20
Traditional grocery stores lead fresh food sales though emerging trends are impacting the dynamic between different channels
Supermarkets15%
Hypermarkets22%
Convenience stores
1%
Internet Retail2%
Traditional Grocery
With 56 different ethnic groups and 662 cities, China as a whole cannot be perceived as a homogenous market.
– China has a highly diverse retail structure with over 33,000 supermarkets and hypermarkets, and more than 112,000 specialty food stores.2
– The retail structure in China is highly competitive and based on 5 main channels: traditional grocery stores, supermarkets and hypermarkets, internet grocery shopping and convenience stores.
– Traditional grocery stores are the main point of purchase with over 60 per cent of fresh food retail sales.1
– High-end supermarkets are better suited for premium graded Australian mangoes as the price sensitivity of consumers tends to be lower relative to those in traditional grocery stores; exporters can then sell at higher prices. While supermarkets provide greater optionality allowing consumers to choose between products based on price, high-end supermarkets typically have consumers seeking quality rather than a certain price point.
Three key trends represent opportunity for continued growth in China; expanding to new cities, promoting Australian sustainability and preparing mangoes for customers.
– With income levels and living standards rising in Tier 2 and 3 cities, demand for imported fruits is growing and with a highly sophisticated distribution network, there is opportunity to expand operations of Australian exporters to new cities.
– The coronavirus pandemic accelerated a trend of increased interest in the origins and safety of food. There is however insufficient processes in current China export operations to verify and communicate such processes to consumers.3
– Perfection Fresh, the University of Queensland and the Queensland Department of Agriculture and Fisheries are conducting a AUD ~$2.3 million project set to be completed mid-2023 which will investigate supply chain monitoring tools and communication systems to track Australian mangoes from pre-harvest to final retail destinations in China.4
– As a means of increasing the economic value of fresh fruit, or utilising non-first grade mangoes, Chinese retailers are improving convenience by preparing mangoes in bite-size pieces. Given the high Brix measurement expected in Australian mangoes, taste sampling could be highly effective in educating Chinese consumers.
China Fresh food retail sales by channel1
Market Profile – China
Source: (1) Austrade, Market Insight – China; (2) ACIAR Mango Agribusiness Research program, Final Report; (3) ACIAR, Chinese mango market assessment ang segmentation; (4) CRCNA, Sustainable export supply chains for Calypso mango to China
Trade & Market Landscape Activities Overview

21
E-commerce penetration for fresh produce is estimated to reach 16% in 2024, with YoY grow of 5%.1,2
– The pandemic has had a drastic impact on how Chinese consumers choose to purchase and receive products. The table below highlights the leading purchase factor in Tier 1 and 2 cities is mango quality whereas in Tier 3 cities consumers are more price conscious given their relative lower disposable income.2
– Leading online retailers Alibaba, Pinduoduo and JCB collectively control approximately 80 per cent of China’s online retail expenditure and use a multi-layered approach to delivering groceries between a 6 to 18-hour timeframe for all locations.1
– Such layers include trends such as community group buying (CGB) which involves a community leader aggregating smaller orders from neighbours to reduce the high cost of the end of the delivery process; this is particularly popular in Tier 2 and 3 cities.
– E-commerce of imported fruit in China is uncommon due to import tariffs and taxes being assessed at the individual customer level. Instead, fresh fruit is typically imported through traditional channels and then e-commerce is utilised to distribute throughout China.
– The key advantage of e-commerce is the limitless number of products which can be listed and accompanied by product information. With such a large population in China, diverse preferences are expected and thus an e-commerce model can help to satisfy the interests of a broader customer base.
With China’s distribution network, e-commerce allows for rapid scalability and broader addressable market
1% 2% 2% 3% 4% 5% 6%8%
10% 11%13%
16%
0%
5%
10%
15%
20%
2013 2014 2015 2016 2017 2018 2019 2020E 2021E 2022E 2023E 2024E
Source: (1) Macquarie Research, Digitalising the distribution of fresh produce in China; (2) iResearch, 2021 China’s Fresh Food E-Commerce Industry Report; (3) Fresh Fruit E-Commerce in China
Fresh produce e-commerce penetration in China1
Fresh produce e-commerce penetration in China – Growth Rate2
4.90%4.60%
9.20%
4.90%
8.50%7.40%
5.80% 5%4.50%
0%
2%
4%
6%
8%
10%
2017 2018 2019 2020 2021E 2022E 2023E 2024E 2025E
Tier 1 and 2 Cities Tier 3 Cities
1. Quality and Freshness 1. Price
2. Price 2. Quality and Freshness
3. Delivery Speed 3. Delivery Speed
Fresh Produce Purchase Drivers across China’s city tiers2
Market Profile – China Trade & Market Landscape Activities Overview

22
China is one of the most developed e-commerce markets in the world, making a range of different business models available
Market Profile – China
Platform-Based Grocery Home Delivery
The platform-based model essentially uses e-commerce to purchase products while orders arefulfilled by brick-and-mortar stores. The advantagefor Australian growers is that they can leverage thereputation of well known brands as such JD.comand Dmall while having their stock remain on showin partner brick-and-mortar stores. As grocerydelivery is rising rapidly in popularity it is critical forAustralian mango growers to have an onlinepresence in China, though it is also important forpeople to see Australian mangoes in person wherethe difference in quality relative to competitors isnoticeable.
Online-to-Offline (O2O)
The O2O model uses brick-and-mortar stores aswarehouses to provide both online and in-personoptions to buy groceries. For Australian mangoes inChina this omni-channel experience isadvantageous as an abundance of productinformation can be provided while retailing thetouch and feel experience only possible in person.The key difference with the platform-based modelis that O2O stores are commonly managed by asingle organisation whereas platforms usehousehold e-commerce names (such as JD.com)while fulfilling orders from a range of different brickand mortar grocery stores.
Forward Warehouse Model
A model entirely reliant on online orders as it hasno traditional in-person store, forward warehousesare often small with a low variety of productsthough are high in volume to ensure quick deliveryfor densely populated urban areas. These areparticularly popular in Tier 1 Chinese cities wheresmaller stores reduce fixed costs and morelocations enables faster delivery. Businessesoperating with this model often becomeunprofitable due to limited economies of scale, sofor Australian businesses looking to expand quicklya different model may suit. This model mayhowever work with varieties of small volumelooking to grow their brand slowly and organicallythrough word of mouth.
E-commerce in China is predominantly composed of only a few large platforms however in the online grocery sector there is room for smaller players to manage their own operations and cater to a smaller market within delivery distance. For Australian businesses without a strong understanding of the market, partnering with well-known online retailers may be most effective way to scale operations.
There are various e-commerce business models to sell Australian mangoes in China, though detailed below are three which may suit different growers:
Trade & Market Landscape Activities Overview

23
Market Profile – China
China offers consumers a range of mango varieties by growing a large range domestically to sell alongside imports
Peak Seasonality
Name
Origin
Grown in Australia
November - February
R2E2
Australia
March - July
Narcissus
Thailand
April - May
Tainong No. 1
China
September - December
Arumanis
Indonesia
The varieties of mango sold in China largely come from Thailand or within China, however, there is still a diverse selection from Australia, Indonesia, Peru and an array of others. Given Thailand’s superior mango harvesting conditions, it is highly difficult for less tropical countries to similarly guarantee China of such a consistent import supply.
Chinese consumers do however have a good understanding of Australian products and see them as being natural and produced with the highest quality standards. As a result, Australian exporters can take advantage of this reputation through packaging and presentation that clearly illustrates the fruit’s Australian origin.
March - July
Nam Dok Mai
Thailand
December - March
Kent
Peru
Trade & Market Landscape Activities Overview

24
– Many young people who previously sought opportunities in Tier 1 cities have migrated to the country’s southwest, bringing with them a desire for an assortment of imported fresh produce that can be found in places like Shanghai, Beijing and Guangzhou.2
– A scan of JD’s e-commerce grocery site (leading Chinese online retailer) shows over 100 pages of options for mangoes, with numerous purchase options of weights and size which highlights the Chinese consumer’s desire for extensive variety.
– In addition to being consumed fresh, mangoes are often processed into juice, dried mango and other products to appeal to consumers’ preference for wide-reaching choice.4
– Mangoes are listed on retailers’ sites under their production region and variety name which gives Australian mangoes the opportunity to stand out in the Chinese market compared to other countries where origins are intentionally withheld.6
Assortment
– As the living standards and disposable incomes of China’s Tier 2 and 3 cities rise, consumers seek higher-quality imported fruits such as mangoes which were previously seen as only for the wealthy.2
– Consumers who spend well above the average on fresh produce can distinguish between premium quality and inferior products, presenting an opportunity for Australian mangoes to stand out due to their pristine appearance and high degree of sweetness.2
– Many wealthier Chinese consumers will mainly purchase imported foods due to concerns over the safety and quality of food produced in China. Allowing consumers to confidently purchase Australian mangoes as they adhere to strict phytosanitary regulations.3
– When selling mangoes through traditional e-commerce sites, exporters need to be aware of the handling and delivery process as there is a high chance for food spoilage.6
Product Quality
3 key preferences stand out as key purchase drivers across the majority of individuals. Product quality and food safety, assortment and online availability are the most exhibitedpreferences among consumers whilst ease of purchase, brand and flavour were also important.
Chinese consumers exhibit 3 key purchase preferences: assortment, product quality, and online availability
Market Profile – China
Source: (1) McKinsey and Company, What Chinese consumers want from fresh-food retailers; (2) Fresh Plaza, China: Top-quality domestic fruit is on the rise during Covid-19 period; (3) Australian Government Department of Agriculture, Fisheries and Forestry, Food Consumption Trends in China; (4) German Cooperation, Tropical Fresh Fruit Exporter’s Guide to China; (5) Austrade, Market Insight – China; (6) German Cooperation, Fresh Fruit E-Commerce in China
– Approximately 85 per cent of Chinese consumers purchase their fresh fruit and vegetables online.1
– Of this amount, 74 per cent live in either Tier 1 or 2 cities with just 10 cities accounting for more than half of the country’s e-commerce customers.6
– Total online sales in the fresh fruit sector are growing faster than the online average at 60 per cent YoY as consumers are lured by the convenience of buying online as well as the assortment available to them.5
– The level of assortment desired by Chinese consumers can be achieved by increasing the varieties supplied (if access is permitted) to the Chinese market to attract interest in different flavours, sizes and appearances of Australian mangoes.
– Some large e-commerce retailers such as Miss Fresh and Maicai sell very few or no imported mangoes meaning exporters must target commercial partnerships with those willing to sell international produce.6
Online Availability
Trade & Market Landscape Activities Overview

25
Activities to Drive Export Growth
Activity Description
1. Target importers and retailers with a presence across multiple city tiers, allowing a staged approach to growing exports across different populations
China is a highly complex market with varying consumer preferences across different cities. Developing local relationships and targeting importers and retailers across different city tiers will help to understand the nuances of each city and enable more effective marketing efforts. At the core of this opportunity is developing networks and channels in Tier 2 and 3 cities.
2. Form local partnerships with processors and organisations to absorb volume-driven second-grade supply.
Industry has expressed the key concern with exporting is the risk of a portion of the supply being rejected. Partnerships with businesses who process fruit or don’t require premium produce can help to absorb supply of second-grade mangoes, reduce the risk of fruit not being sold at all and improve sales volumes.
3. Promote the efficacy and safety of irradiation for market access in the long-term.
Irradiation is a proven method for phytosanitary treatment which doesn’t have as negative an impact on fruit quality as VHT does. This will require negotiation at the government level is more a long-term opportunity.
4. Bolster marketing efforts to support Australia’s competitive advantages around seasonality, food quality and safety.
Marketing throughout China can be improved to:1) Develop more of a presence during Chinese New Year; 2) Have a more targeted approach with appreciation of
differences across cities; and 3) Communicate the high food health and safety standards
that Australia adheres to.
5. Identify and leverage in-transit cold chain logistics for transport throughout China.
Fluctuation from the optimal temperature often occurs when the mangoes are moved between temporary transit storage and the retail store. Improving logistics to prevent this gap will help to retain mango quality and trade value once in China.
Market Profile – China
Significant opportunity remains in China as Tier 2 and 3 cities are expected to drive consumption growth in future
1
2
3
4
Ease of Implementation
Market Demand Potential
High
HighLow
High
5
Trade & Market Landscape Activities Overview

DRAFT
India

27Source: (1) Statista, Production volume of mango across India from financial year 2012 to 2020, with an estimate for 2021. (2) Tridge, Fresh Mango. (3) AgriXchange, Mango
Strong existing demand will allow Australian mangoes to compete through superior quality and seasonal advantages
Australia has not yet exported mangoes to India, however interest in the market is growing particularly given the recent achievement of an interim trade agreement. While Australian exports will not compete with domestic production, strong existing demand favours future Australian exports.
– In fiscal year 2021, the volume of mango production in India is estimated to have amounted to around 20.9 million metric tons. India is the largest producer of mangoes by volume globally.
– India is the 8th largest mango exporter globally exporting USD $137.4 million (AUD $188.9 million) in 2020.2 Indian mango exports have seen success exporting to South and South East Asia, and recently the EU and the Middle East.3
– Australian exporters will not compete directly with Indian domestic production given differences in variety, quality and therefore price. Australian exporters have an opportunity to offer different varietals in seasonal gaps.
16.2 18 18.43 18.52 18.64 19.51 21.82 21.38 20.32 20.90
5
10
15
20
25
2012 2013 2014 2015 2016 2017 2018 2019 2020 2021
Mango production volume in India1
FY2012 - 2021Million tonnes
Indian mango imports by year1
FY2012 - 2020 AUD $000, tonnes
Both the volume and value of mango exports to India are minimal due to strong domestic production, and fluctuate significantly likely due to poor conditions in certain seasons.
– Indian mango imports have been steadily declining since 2018, with only minor volumes of around 166 tonnes imported in 2020 and 465 tonnes in 2019. These typically come from low input-cost countries such as Malawi and Thailand.
– The aggregate value of imports, which does not reflect more specialist smaller imports of high-value mango varieties, also appears to be relatively volatile, with peak average prices per kg of AUD $3.92/kg in 2020 and AUD $1.91 in 2019/kg in 2019.
– The volume of mango imports appears to have followed a compound annual growth rate of -16% from 2012-2020, however, interest in the market remains due to increasing demand for the product.
– This interest is embedded in Indian consumers’ known preference for mangoes, rising income levels and the demand opportunities represented by gift giving and special occasions.
Market Profile – India
166
465
841
204
699
266
973
237
832
$- $100 $200 $300 $400 $500 $600 $700 $800 $900
$1,000
0
200
400
600
800
1000
1200
202020192018201720162015201420132012
Netweight (t) Trade value (AUD $000)
Trade & Market Landscape Activities Overview

28
Growth in fresh produce modern retail channels in India is encouraging, however represents a small portion of the market
Source: (1) AgriXchange, Mango. (2) In-market stakeholder consultation (3) Statista, Retail market size across India from 2011 to 2020, with estimates until 2026
Rising income levels in recent years have carved out a luxury grocery market within India’s Tier 1 cities, offering premium products for premium prices.
– Indian Supermarket chains are experiencing strong growth, although most modern retailers employ a low cost, low price, low margin strategy as they are restricted by the spending capacity of the general population.
– Reliance Retail continues to dominate the market with a 22% market share, followed by Aditya Birla Retail and Nilgiris Franchises (combined these make up about 45% of market share).2
“There is a lack of availability of high-end food products, and there’s a substantial number of people interested in paying for such products.” says Prashant Agarwal, Managing Director of retail consultancy Wazir Advisory.
While modern retail growth and the developing premium market is promising, the speed of adoption is somewhat limited.
– Further, the typical quality of fresh fruits and vegetables for sale in modern retail outlets has been reported as less than that of many Australian products, meaning there is still room for growth in the value proposition of modern retail for high-quality fresh imports.
– Australian exporters would be best placed to start to build partnerships in the retail sector, allowing time in the short term for the channel to continue to grow in sophistication and market access to evolve.
The retail market size in India was expected to amount to 1.7 trillion U.S. dollars by 2026, up from 883 billion dollars in 2020.
Historic and Forecasted growth in Indian retail market3
FY2012 - 2021AUD $ billion
Given mangoes are known as one of the most important fruits produced and consumed in India, colloquially the ‘King of fruits’1, the channels through which they are sold are rapidly evolving. While traditional fruit and vegetable stalls remain the dominant purchase forum for most Indian consumers, Australian exporters would be best placed to start to build relationships with retailers in the more modern channels to achieve more attractive price premiums.
$-
$500
$1,000
$1,500
$2,000
$2,500
$3,000
2011 2014 2016 2017 2018 2020 2021 2024 2026
Market Profile – India Trade & Market Landscape Activities Overview

29
Analysis of e-commerce and bricks and mortar premium Indian grocers indicated strong demand for mangoes yet low prices
Source: (1) Nature’s Basket; (2) Modern Bazaar; (3) FoodHall
The stores of these three premium brands span across seven cities, delivering grocery orders made online to more than 100 cities.
– Modern Bazaar has a clear focus on the northern India market, with all of its stores located in three northern cities, all within close proximity to each other.
– All Nature’s basket stores are located in southern India. The three cities in which Nature’s Basket operate are considerably geographically distanced.
– Foodhall grocery stores are distributed through both the north and south of India.
– Mumbai, Chennai and Cochin ports, all located in the South, offer optimal infrastructure for fresh food imports and cold chain logistics. Relationships with retailers such as Nature’s Basket or Foodhall should therefore be prioritised.
The value propositions of these retailers lie in their unique selling points of fresh, imported produce.
– The Nature’s Basket website draws attention to its organic range of produce displayed on the home page. Organic produce typically comes at a higher price point, something Nature’s Basket is leveraging to highlight its premium status.1
While irradiated mangoes do not classify as organic, this helps generate preference for high quality and willingness to pay a premium.
– Modern Bazaar advertises a selection of exotic fruits and vegetables such as blueberries from the US, kiwi fruit from Afghanistan and avocados from New Zealand.2
– Foodhall identifies itself as a premium supermarket, offering unique and rare ingredients from around the world. The brand puts a strong focus on its pursuit of fresh and high-quality products for its customers.3
While still hindered by unreliable last mile logistics processes in most cases, the e-commerce channels identified below may present potential partnership or Joint Venture opportunities for Australian mango exporters in the long term, upon achievement of widened market access. Industry would be best placed to remain aware of the market dynamics below, including network locations and value propositions of different players in order to act on this information when market access changes and infrastructure improvements materialise.
Nature’s Basket
Modern Bazaar
Foodhall
Market Profile – India Trade & Market Landscape Activities Overview

30
India is experiencing major growth in the e-commerce market, with online grocery sales increasing by 80% in 2020
Source: (1) Consultancy.in, India’s food & grocery market to reach $790 billion by 2024; (2) Fresh Plaza, Covid-19 accelerates growth of online grocery markets in India
0.3
2024F
2.3
2019
% of overall market
Indian e-commerce grocery market size1
FY2012 - 2021AUD $ billion
CAGR +57%
AUD $2.6B
AUD $24.7B
– It is predicted that the Indian online grocery market will be worth over AUD $24.7 billion by 2024, with 2.3% of overall market share.1
– Fruits and vegetables remain a relatively minor (~5%) portion of online retail sales, although there is high potential for growth given increasing consumption habits of consumers.
– The sub-sector’s strong growth has also attracted foreign investment interest, from major global retailers such as Walmart, Amazon, and 7-Eleven, a positive indication for the development of sophisticated e-commerce platforms.
E-commerce is a particularly valuable channel opportunity for fresh produce given products must be sold in packs, which helps to drive critical volume purchases. Capitalising on this opportunity will therefore require Australian mango exporters to prioritise product consistency and significant volumes.
Based on a scan of mangoes on Indian e-commerce platforms (see following page), it appears that Indian consumers’ preference for mangoes typically includes: - Medium-large size;- Sweet and juicy in flavour;- Green or yellow colour; - Utility in either fresh consumption or processing in
smoothies, juices, or other cooking;
Market Profile – India
– There appears to be a distinct emphasis on product origins displayed with each mango listing. All mangoes available appear to be grown domestically.
– Most e-commerce platforms do not disclose the specific variety of mango for sale, with products often listed as ‘Mango raw’. However, most products appear to be green mangoes, a known second-grade variety. This insinuates that mangoes available for sale online are typically homogenous in nature. The dominance of green mango varieties is a good indicator of quality expectations and also suggests a potential opportunity for Australian exporters to use India as a market for its second-grade green mangoes in the long term once market access is gained.
– Low average prices (typically around AUD $4 per kg) are not in line with the prices Australian exporters would demand for premium mangoes.
– Further, most e-commerce platforms included information on how to use the product, which for most mangoes listed was suggested as food processing in smoothies or juices. This reinforces the notion that even mangoes listed on premium e-commerce websites may not meet the needs of premium Australian mango exports, which would not likely be emphasised as ingredients.
– However, this does potentially suggest an opportunity for exporters to deliver second-grade products should they be in need of a customer in the event of poor harvests, particularly during India’s mango off-season.
The pandemic has shifted many consumers to perceive e-commerce as the most convenient and safe way to procure essential supplies.2
A scan of mangoes available for sale on a number of Indian’s top e-commerce platforms (see following page) revealed a number of key insights around consumer expectations and purchasing decisions.
Trade & Market Landscape Activities Overview

31
A scan of mangoes on Indian e-commerce platforms emphasised focus on product origins, health benefits and usage, at low prices
Source: (1) Nature’s Basket, Mango Raw; (2) Modern Bazaar, Raw Mango; (3) Spar, Mango Raw; (4) Bigbasket, Fresho Banganapalli Mango, 1 kg
E-commerce retailer Varieties sold Price point Image Note
Nature’s Basket1 Does not specify‘Mango Raw’
MRP ₹239 per 1KG
AUD ~$4.45
Available in 250g, 500g, or 1kg packages. Country of origin: India.
Modern Bazaar2 Does not specify‘Raw Mango’
MRP ₹190 per 1KG
AUD ~$3.50
Available in 250g, 500g, or 1kg packages. Country of origin: India.
Spar3 ‘Mango Totapuri’ or ‘Mango raw’
MRP ₹240 per 1KG
AUD ~$4.46
Extensive description detailing size (medium or large), colour (golden yellow), shape (oblong and pointed base).Noted as well that this is a known variety for processing due to the taste of pulp. Emphasises health benefits. Totapuri mango known as not entirely sweet, green on outside and pale yellow on inside.
Bigbasket4 ‘Banganapalli Mango’ MRP ₹229 per 1KG
AUD ~$4.25
Sourced from Andhra Pradesh (Southern India) ‘moderately juicy and aromatic with a maize-yellow colour’.Includes health benefits, product storage and usage (includes processing).
Market Profile – India Trade & Market Landscape Activities Overview

32
Groups of young, high income earners in India are driving increasing interest in the consumption of fresh food imports
69%
43%
15%
23%
33%
34%
7%
21%
44%
7%
2030(F)
1%
2005 2018
3%
Lower Middle IncomeHigh Income
Upper Middle Income Low Income
Growth of India’s income groups1
2005, 2018, 2030(F)India’s middle class is growing rapidly, with nearly 80% of households expected to reach middle-income levels by 2030.1
– Rapid urbanisation preceding COVID-19 and a young population (over 50% aged 18-30) with more disposable income are key drivers of premium fruit and vegetable demand in India.1
– Food imports have tripled in value over the last decade, with many reports that Indian consumers are becoming increasingly selective in the purchase of fresh fruits and vegetables, prioritising freshness, flavour and juiciness.3
– Indian fresh fruit importer, IG International notes that “The consumer is selecting fruit based on its condition, rather than its looks. The consumer is also becoming more selective about the origin of the product they buy.”2
India is experiencing massive growth in the number of ultra high net-worth individuals.
– The number of individuals with assets worth over AUD $41 million, is expected to grow by 63% over the next 5 years.4
– With such growth in the super-rich population, the luxury goods market in India is expected to grow from around AUD $41 billion to AUD $273 billion within this decade.5
– Willingness and interest in paying a premium for quality, imported fresh products is expected to be a part of this growth.
– This demographic growth indicates the need for Australian mango exporters to target these niche, outlier consumer segments with significant income levels, predominantly concentrated in Tier 1 cities. This aligns with the opportunity to export to high-value premium fruit and vegetable retailers such as Nature’s Basket or Foodhall.
– In the long term, the sophistication of e-commerce platforms will enable connection to high income consumer segments nation-wide. However in the interim, focused market entry in select areas, supported by in-market product communications, would position Australian exporters favourably for success.
Source: (1) World Economic Forum, How India will consume in 2030: 10 mega trends; (2) Fresh Plaza, IG International on imported fruits in India; (3) Department of Foreign Affairs and Trade, An India Economic Strategy to 2035, Agribusiness Sector; (4) The Economic Times, Indian millionaires count to grow 63% over next five years: Report; (5) Luxe Analytics, Unravelling the Indian luxury market in 2030: Report
Market Profile – India Trade & Market Landscape Activities Overview

33
India imports mangoes similar to some Australian varieties in October to December, conducive to Australian seasonality Indian man go imports by source1
FY2020
Source: (1) UN Comtrade Data; (2) Cooperative Research Centre for Developing Northern Australia, International Market Report – Japan; (3) KPMG Analysis (4) The Economic Times, India to begin mango imports from Malawi this week; (5) South China Morning Post, Indians know the Alphonso is the ‘king of mangoes’. If only they could buy some
India relies on mango imports from countries with low-input costs, however quality expectations remain high.1
– In FY2020 India imported 70 tonnes of mangoes from Thailand, 45 tonnes from Malawi and 32 tonnes from the United Arab Emirates.
– Low import volumes are reflective of India’s strong domestic mango production levels, only drawing on import for supplies during a local seasonal gap from October to December.
– In recent years Indian importers started receiving mangoes from Malawi to fill this supply gap. Most Malawi imports are near identical to India’s Alphonso mangoes, the most popular variety in India. These have been selling for about Rs1,500-1,800 (AUD ~$28) per dozen during this period, reflecting considerable price parity.4
– Alphonso mangoes are known for their rich quality and sweet taste, a positive sign for the quality demands and expectations of Indian consumers. However, Alphonso variety preferences cannot be taken as representative of all mango consumption, given the majority available for purchase appear to be more second-grade varieties sold in bulk at low price points.
– While exports from countries like Malawi with significantly lower input costs flood the import market, this helps generate demand for mangoes which Australian exports can capitalise on in an entirely different quality and price category.
From South to North, Indian mango season runs from January through August, creating a local supply gap for mangoes during the October-December period. This aligns with Australia’s mango season therefore indicates potential export opportunity.
– India’s ‘mango madness’ period, when a range of varieties come into season, runs from late March to July, reflecting a lack of export opportunity for Australia during this time.5
– Minor volumes of unique Indian mango varieties are available during this off-season, for example Ratnagiri mangoes are sold at AUD ~$37 per dozen.
– Overall India’s mango consumption patterns throughout the year indicate strong demand and some consumer segments’ willingness to pay a premium for select, niche varieties similar to those of Australian mangoes. Evident supply gaps however are minimal, limited to the October-December period.
Jan Feb Mar Apr May Jun Jul Aug Sep Oct Nov Dec
UAE
MAL
AUS
THA
IND
Consolidated seasonality mango varieties from leading exporters2,3
Market Profile – India Trade & Market Landscape Activities Overview

34
Alignment on acceptance of irradiation and in-transit cold treatment is a positive indicator of future market access
Source: (1) Stakeholder consultation; (2) International Tropical Fruits Network, INDIA: Country to export mangoes to US; import cherries ; (3) India Briefing, India-Australia FTA Progress: Interim Deal Expected in 30 Days; (4) Fresh Fruit Portal, India approves in-transit cold treatment for Australian fruits
While Australian mangoes do not currently have access to India, the country’s use of irradiation bodes well for potential future market access, as does the ongoing expansion ofaccess for other Australian horticulture products.
Consultation with the Department of Agriculture, Water and Environment indicated that India currently imports and exports irradiated product (as well as VHT), most commonly with South East Asian countries.
– If Australian mangoes are granted access via an irradiation pathway they could achieve significant cost savings and preservation of product quality.1
– In January 2022 India granted access to export irradiated mangoes to the US, a positive sign for Australian mango trade with both markets.2
– In 2020, Australian exports of table grapes, summer and pome fruit, apples and pears were granted access to India via in-transit cold treatment, a breakthrough to preserve product quality and reduce lead times. This could also serve as a potential pathway for mangoes should industry be interested, potentially as an alternative pathway until progress is made on irradiation.
– India’s small volumes of mangoes imported from Malawi via air freight during off-season undergo ‘hot water treatment’, an alternative heat disinfestation treatment for fruit fly to VHT – an additional option for treatment.
– In capitalising on these opportunities once access is gained, DAWE emphasised the importance of establishing partnerships with importers to navigate complexity of doing business in such a flooded market.
Key opportunities for Australian mango industry:
Continue to pursue market access pathways in irradiation, with in-transit cold treatment as an alternative option.
Industry applications for mango exports to India via irradiation, VHT, and conditional non-host status were rejected in recent years. Investigation into the reasons for this rejection would be a significant support for future market access advocacy.
Market Profile – India Trade & Market Landscape Activities Overview

35
Industry is well placed to capitalise on future market entry opportunities arising from progressing bilateral relations
Source: (1) Stakeholder consultation; (2) International Tropical Fruits Network, INDIA: Country to export mangoes to US; import cherries ; (3) India Briefing, India-Australia FTA Progress: Interim Deal Expected in 30 Days; (4) Fresh Fruit Portal, India approves in-transit cold treatment for Australian fruits
Australia and India are progressing trade negotiations at an above average rate. While mangoes are not specifically mentioned in the new Australia-India interim tradeagreement, ongoing implementation of new trade arrangements will increase ease of doing business in the country and widen opportunities in the medium-long term.
Australia and India’s recent signing of the Australia-India Economic Cooperation and Trade Agreement isa historical move and a positive sign for future access of Australian mangoes into the market.
– While horticultural products currently included in the trade agreement are predominantly focused onthose where India has limited current supply, therefore not including mangoes, progressive wideningof access to the market for Australian horticultural products will likely create opportunities forAustralian mango exports in time.2
– The pace of bilateral negotiations between the two countries has been faster than that of traditionaltimelines, a positive sign for the finalisation and expansion of the new agreement. As both countriespursue agendas of economic recovery in the post-pandemic era there is strong indication that accesswill continue to widen for various products.1
– Industry consultation also indicated a potential opportunity in India’s contracting of Australian farmersto grow Indian mango varieties. While not the first priority for many Australian growers, this doespresent a lucrative opportunity to engage in trade with India, generate further Indian consumerinterest in imported mangoes, and expand the economic partnership more broadly.3
Key opportunities for Australian mango industry:
Monitor progress of the finalisation of the Australia-India Economic Cooperation and Trade Agreement to identify opportunities for Australian mango exports as the agreement is expanded.
Recently announced trade arrangements with India include reduction or elimination of tariffs over seven years for a range of horticultural goods, as well as permanent annual quotas for others.
Market Profile – India Trade & Market Landscape Activities Overview

36
Average prices paid for Indian mangoes and received for mango exports appear to be relatively strong, depending on variety
Pricing structures for mangoes India appear to range significantly depending on mangovariety, however on average the price per kilogram is significantly lower than that expectedby premium Australian mangoes.
– A scan of mangoes for sale on Indian e-commerce websites indicated relatively low pricepoints for mangoes, typically around AUD $3.50-4.50 per kilogram.
– However, there have also been reports of unique, high-quality varieties of mangoes suchas Alphonso and Ratnagiri which sell at closer to AUD $28-$37 per dozen, a strongindication of purchasing power and expectations in some consumer segments.2
– India’s lockdowns in 2021 also caused the supply of some mango varieties like Alphonsoto contract due to challenges reaching markets, further driving price up and increasingthe need for imports. As pandemic restrictions continue to fluctuate, this may continue toserve as an opportunity for exports in the near term.
– In November 2021 there were reports of a price surge in Alphonso mangoes due toproduct scarcity, some sold for several hundred AUD per dozen. While this is an outlieroccurrence, these prices do indicate the propensity of Indian consumers to spend onquality mangoes when necessary.3
The price Indian customers are willing to pay for mango imports, most often needed duringthe off season, appears to be relatively strong.
– The highest price points received for imported mangoes in 2020, according to the UNComtrade database were AUD $4.79/kg for exports from Thailand and $18.53/kg for re-exports from Netherlands, a favourable indicator of price parity. While these prices werereceived for relatively low volumes of mango imports, they remain a positive sign ofconsumers’ willingness to pay a premium for mangoes.
– The favourable price received by large volume, typically low-quality exporters Thailandand Malawi indicates the risk of a reduction of product price with an increase in volume isrelatively low.
Trade value and price per kg of mangoes imported by India1
2020AUD $
Note: Quoted figures have been converted from USD to AUD based on an exchange rate of 1.38. Source: (1) UN Comtrade Data; (2) The Economic Times, India to begin mango imports from Malawi this week; (3) Outlook India, Shocking Mango Prices! Devgad Alphonso Being Sold At Rs 18K A DozenNote: All price per kilogram figures are FOB prices listed in AUD, calculated using UN Comtrade data through a division of product value (AUD) over volume exported (kg), therefore prices do not account for additional costs incurred in exporting.
The Alphonso mango varietyhas been yielding a uniquely high price point in recent years due to the impacts of the pandemic on supply chains and adverse weather.
$0 $50,000 $100,000 $150,000 $200,000 $250,000 $300,000 $350,000 $400,000
Thailand
Malawi
South Africa
United ArabEmirates
Netherlands
Egypt
Brazil $1.66/kg
$2.60/kg
$18.53/kg
$2.08/kg
$3.86/kg
$3.93/kg
$4.79/kg
Market Profile – India Trade & Market Landscape Activities Overview
By comparison, according to Comtrade data the average price per kilogram received for Australian mango exports in 2020 was AUD $4.88 per kilogram.

37
Delhi
Mumbai
BangaloreChennai
Hyderabad
Kolkata
Ahmedabad
Pune
Jaipur
Chandigarh
Kanpur
Vijayawada
Kozhikode
Nasik
India’s infrastructure growth is limited in accommodating high-value fresh imports such as mangoes to guarantee quality
Source: (1) Financial Express, Indian Railways undergoing dynamic growth with world-class advancements in both freight and passenger transportation: Mangal Dev, Hitachi India; (2) Kearney, Harnessing the opportunities in India’s transportation infrastructure
While major infrastructure investments have been a significant focus in the Indian economy over the last 5 years, particularly due to recent Union budgets, the reality is that growth is significantly hindered by the slow execution of investments as well as India’s overall historically lower infrastructure spending as a proportion of GDP compared to other developing nations.1 Given last mile logistics is a concern for many Australian exporters, the success of future mango exports will depend on the speed of these infrastructure developments to enable secure cold chain capabilities which will preserve product quality.
Infrastructure investments are largely concentrated in major metro cities New Delhi, Mumbai, Bengaluru and Hyderabad. These cities may present export opportunities in the long term in addition, while the ports of Mumbai, Chennai and Cochin have the most sophisticated cold chain infrastructure for mango imports in the short-medium term. However independent of ports, there are a number of factors limiting growth in the sophistication of domestic connecting infrastructure, including:
– Inadequate investment in roads in particular, which account for 65% of all freight movement. – Insufficient airport capacity to meet demand causes major regional connectivity challenges. – Major development delays due to the pandemic, with a shortage of workers and raw materials.
These factors will make it challenging for Australian mango exporters to target networks of cities and consumer groups beyond the ports or airports in which mangoes arrive, without the support of relationships with Indian importers where visibility over product quality beyond arrival cannot be guaranteed.
In the long term, however, major infrastructure investment projects will increase India’s potential to better accommodate high-value mango exports, though tangible change can not be expected for at least 5-10 years:
High-speed and semi-high-speed rail projects, dedicated rail freight corridors.
Flagship Sagarmalaport development program.
Modernisation of airports, including Mumbai and Delhi, also UDAN regional airport development project.
Golden Quadrilateral and BharatmalaPariyojanahighway Projects. Legend Tier 1 cities Tier 2 and 3 cities Target ports
Market Profile – India Trade & Market Landscape Activities Overview

38
The key risk mitigation factor in reducing the vulnerability of mango exports to cold chainchallenges will be for exporters to partner with trusted importers on-the-ground in India.
– Mumbai, Chennai and Cochin ports offer the most sophisticated cold chain infrastructureand provide strategic links to other Tier 1 cities where high-value trading opportunities areconcentrated.1
– However, in its current state, the cold storage market in India is very fragmented andunorganised. Facilities are set up on an ad-hoc basis by occupiers in food, grocery andhealthcare businesses.2 This will create considerable risk for Australian mango exports.
– Installation and operating costs for cold storage units in India are reported as double whatthey are in the West, reiterating the large proportion of products’ end cost as defined bylogistics (~18% versus ~7-9% in the UK and US).2 Given Australian mango exports’already existing high input costs, minimising the cost of logistics in-market will be criticalto products’ competitiveness in the Indian market.
The Indian cold chain sector is expected to grow at a 14% CAGR during 2021-2023, driven bya surge in grocery sales, demand for exotic fruits and vegetables, and a pressing need forvaccines and drugs storage.
– There have been wide calls for developers and third-party logistics players to invest indeveloping multi-purpose cold chains in India, with capacity anticipated to reach 40.7million metric tonnes by 2023.
– These growth projections for Indian cold storage capabilities represent a positive long-term sign for the preservation of product quality in future Australian mango exports to themarket.
Despite recent improvements, India’s current cold chain capacity cannot be guaranteed
57%
11%
22%
10%
Online Grocery
Food Processing Sector
Pharmaceuticals
Other
Cold Storage Growth Drivers1
2021 - 2023
Source: (1) Expert Stakeholder Consultation, Indian Railways undergoing dynamic growth with world-class advancements in both freight and passenger transportation: Mangal Dev, Hitachi India; (2) Collier, Opportunities in Indian Cold Chain Assets
Market Profile – India Trade & Market Landscape Activities Overview

39
Activities to Drive Export Growth
Activity Description
1. Start to establish relationships with retailers or importers in Tier 1 cities.
Target luxury retailers such as Nature’s Basket in Tier 1 cities where majority of high income groups reside, or fresh importers such as Aeden Fruits or NGK Trading. Strong relationships will mitigate supply chain risk and ensure security of both demand and supply.
2. Focus advocacy on developing irradiation market access pathway.
Continue to pursue market access pathways in irradiation, with in-transit cold treatment as an alternative option. India’s use of irradiation in domestic production as well as exports is a positive indicator of potential allowance for the import of Australian irradiated products in future.
3. Target in-market communications during India’s seasonal supply gap (October to December).
Promote communications in India’s only non-mango producing window, emphasising the high-quality, premium nature of Australian mangoes compared to competitors also capitalising on this supply gap. This includes Malawi and Thailand who receive a low average price point of around ~AUD $0.21 per kilogram, indicative of large quality disparity.
4. Monitor progress of Australia-India Economic Cooperation and Trade Agreement
Capitalise on evolving trade allowance as bilateral relations progress, with the goal of capturing first-in-market supplier relationships early in the agreement implementation process.
5. Explore potential to partner with e-commerce in long term.
Once market access is gained look to scope e-commerce market entry strategies with major players such as BigBasket, which will require consistent supply volumes. This is a long-term action to allow time for development in last mile logistics.
Market Profile – India
India offers strong growth potential should market access be granted, given high domestic demand for mangoes
1
2
3
4
5
Ease of Implementation
Market Demand Potential
High
HighLow
High
Trade & Market Landscape Activities Overview

DRAFT
Japan

41
Mango exports from Australia to Japan declined sharply after 2010 and has failedto regain such highs since.
– Japanese imports have collectively declined since 2010, imports of Australianmangoes in particular has fallen substantially. In 2010 Japan ranked 3rd inAustralian mango export destinations, 8th in 2015 and 14th in 2020.1
– In 2020, Japan accounted for less than 1% of Australia’s total mango exports.1
– Japan placed a temporary ban on Australian mangoes in 2020 due to live fruitlarvae being found2; this may have contributed to the sharp decline in 2011.
– Over a 10 year period, from 2010 to 2020, Japanese imports of Australianmangoes has seen a -16% CAGR. Substantiating an opportunity for futuregrowth, though also showing the dominance of the largest mango exportersglobally.1,3
Market Profile – Japan
Mango exports to Japan have been in decline since the 2010 peakMango exports from Australia to Japan1
FY2010 - 2020AUD $ million, tonnes
Note: Quoted figures have been converted from USD to AUD based on an exchange rate of 1.38. Source: (1) UN Comtrade Data; (2) ABC News, Japan bans Aussie mangoes; (3) KPMG Analysis; (4) ExpatGo, Behold the World’s most valuable mango
-16% CAGR
Total Japanese imports of mangoes has been in steady decline since 2010.
– With a -4% CAGR Japanese imports of all mangoes has fallen though also seenstability between 6,000 and 7,000 tonnes since 2016 and 2020.
– The fall in imports may be due to the strict phytosanitary requirements thatmust be met to export to Japan as exporters seek markets without the need forVHT.
– Despite the steady decline, demand for mangoes in Japan is still strong –particularly so for wealthier individuals and households who may gift high-quality mangoes at a premium price point.
– Domestic production of mangoes in Japan has also been on the rise.Particularly so for certain mango varieties such as Miyazaki mango which canbe sold for thousands of dollars at auction.4
Japanese mango imports by year1
FY2010 - 2020AUD $ million, tonnes
154
60 61 7056
8866
35 3750
22
$-
$200,000
$400,000
$600,000
$800,000
$1,000,000
$1,200,000
$1,400,000
0
50
100
150
200
2010 2011 2012 2013 2014 2015 2016 2017 2018 2019 2020
Netweight (t) Trade Value (AUD$)
10543 10235 9914 8742 7508 5964 6012 6690 7692 7535 6903 $-
$20,000,000
$40,000,000
$60,000,000
$80,000,000
0
2000
4000
6000
8000
10000
12000
2010 2011 2012 2013 2014 2015 2016 2017 2018 2019 2020
Netweight (t) Trade Value (AUD$)
-4% CAGR
Trade & Market Landscape Activities Overview

42
Exports of Australian mangoes to Japan for FY2020 is currently immaterial being only 0.2% of totalimport value.3
– Mexico is the primary source of mango imports for Japan with 51.1% in FY2020.1
– Competition exporting to the Japanese market is fierce with three of the top four largest mangoexporters globally being the top three sources of Japanese imports (Thailand – 1st, Mexico 2nd &Peru 4th).1
– Japanese local mango production remains steady and the seasonality of different varietiesprovides supply for approximately 6 months of the year.
– Mexico has a long standing relationship with Japan due to the reliability of satisfying the strictestof phytosanitary criteria; a key consideration for Japanese consumers.
– Being located just above the equator, Thailand’s hot climate allows for year round mangoproduction (as seen in the table below).3
– Strong local advertising by Thai mango producers has swayed consumer preferences to Thaivarieties (Mahachanok, Nam-Dorkmai etc.) during Australia’s prime season (Oct – Feb), making itdifficult for Australia to sell its seasonal advantage.2
– Thailand supplies unique varieties during this period, differing to those supplied betweenMarch and July, and developed a specific brand image for each variety to target Japaneseconsumers. The Khieo Sawoei Sampran variety is often marketed with an emphasis onbeing a dessert ingredient as at a hard green state it doesn’t have the starchy flavourexpected at that time of year.
Despite having a seasonal advantage in November to February, the Japanese consumer currentlyprefers the varieties grown in Mexico and Thailand.
– A local marketing campaign would be meaningful in educating Japanese consumers about thehigh-quality produce Australia offers and the benefits of Australian varieties that are not grownin existing imports markets such as Mexico and Thailand.
– The varieties used to illustrate seasonality in include: Japan – Keitt, Irwin; Mexico – Keitt, Kent,Tommy Atkins; Australia – Kensington Pride, Calypso, R2E2, Honey Gold and Thailand –Mahachanok, Nam-Dorkmai, Nang Klang Wan.
Australia faces tough competition in Japan though has a clear seasonality advantage between October and December
Japanese mango imports by source1
FY2020
Market Profile – Japan
Jan Feb Mar Apr May Jun Jul Aug Sep Oct Nov Dec
JAP
MEX
AUS
THA
Consolidated mango seasonality from leading exporters2,3
Note: Quoted figures have been converted from USD to AUD based on an exchange rate of 1.38. Source: (1) UN Comtrade Data; (2) Cooperative Research Centre for Developing Northern Australia, International Market Report – Japan; (3) KPMG Analysis
Trade & Market Landscape Activities Overview

43
Market Profile – Japan
Sales channels in Japan are evolving to capture demand from online grocery shopping The rapid growth of online grocery shopping in Japan due to the Pandemic has forced traditional grocery retailers to accelerate the development of online sales channels. While physical supermarkets remain dominant, the increase in strategic partnerships to offer omni-channel and strictly online experiences signifies retailers must adapt quickly to retain their position.
– Online retail:
The Pandemic has forced traditional retailers to developtheir logistics in order to capture rising demand inonline shopping. More partnerships are beingannounced and grocery stores are developing orimplementing omni-channel retail strategies.
Current State – Primary Sales Channels in Japan:
– Supermarkets:
Despite the rise of online retail and tradition of giftingfruit, fresh mangoes are generally purchased atsupermarkets for daily use. Product catalogues arelarger in supermarkets and thus the most common placeto find varieties that are imported in lower volumes.
– Department stores:
Commonly known as fruit gift stores throughout Japan,department stores are usually smaller in nature and holdstock such as packaged sweets and high-quality fruit.Mangoes are a common gift in Japanese culture asthey’re often enjoyed during dessert and enjoyed by allmembers of the family irrespective of age.
>
– Strategic e-commerce partnerships:
Leading retailers are partnering with reputable e-commerce brands from Westernmarkets to swiftly adapt and capture the rise in online grocery demand. Examplesinclude Rakuten & Seiyu (Walmart) to accelerate app-based shopping, as well asLawson & Uber Eats to ensure timely delivery of products.
– Direct to consumer/business (D2C/B):
The D2C/B model simplifies market entry and reduces costs by removingintermediaries and engaging directly with the end consumer or business. WhileD2C/B volume is small relative to the wholesale route, Australian brands can havemore stable sales expectations by developing long-term relationships withJapanese retailers to supply premium fruit. Australian exporters then have morecontrol over their brand positioning and can also sell at retail price rather than atwholesale.
– Omni-channel experiences:
The 2020 Supermarket Annual Statistics Survey Report, released by the NationalSupermarket Association of Japan (NSAJ), indicates 36% of participants would optto ‘increase the number of SKUs in the future’.1 Retailers are forming a competitiveedge through adapting their product catalogues and operating systems to satisfyconsumer expectations. This involves evolving fulfillment and distributionprocesses to compete on speed of service.
Future State – Emerging Sales Channel Trends in Japan:
Source: (1) 2020 Supermarket Annual Statistical Survey Report
Trade & Market Landscape Activities Overview

44
The Australian Mango industry requires targeted marketing strategies tailored to Japan in order to see success
Market Profile – Japan
Education through preparation ideas and recipes
• In order to introduce a new product or variety of fresh produce into Japan, it is a common strategy to educate consumers with information on how to prepare, eat and on what occasions to eat the fruit.
• Mango growers can employ this strategy as an opportunity to promote Australian mangoes through recipes that include Japanese ingredients, making sure they are easy to understand and written in Japanese.
Gift packaging for specific events
• It is common for individuals and corporations to purchase fresh produce as thank-you gifts in mid-August and at the end of the year, leading marketers to promote and package their products specifically targeted towards these purchases.
• Another example of marketing strategies employed for specific events is mangoes being gift wrapped and marketed as “Mother’s Day Gifts” with the option to ship them directly to recipient’s address.
• Japanese companies such as Asahi theme their packaging around seasonal ideas and presents marketers an opportunity to collaborate through promotional partnerships.2
Emphasising food quality and safety
• Approximately 80% of Japanese consumers prefer to purchase domestic over foreign products due to beliefs that they are of a higher quality and maintain higher food safety standards.
• Consequently, it is critical for mango exporters to win consumer loyalty through emphasising food quality and safety which can be achieved through guarantees from Japanese authorities; proved with reputation or disclosed on labels.
Pricing to reflect premium quality
• There is a collective belief in Japan that superior quality products do come with higher prices and has resulted in the emergence of a super premium food product sector.
• By pricing Australian mangoes at a premium, marketers are able to play to this Japanese belief and position their produce in a lucrative market segment.
• Mangoes cultivated in the Miyazaki prefecture are known to be the highest quality domestic mangoes, being priced between AUD $40-$90 per kg. Therefore, if Australian mangoes are to be perceived as having equal quality, they will need to be sold at a similar price point.
Note: (4) Pictured is a 22000 JAS ANZ, Food Safety Certificate; (5) Pictured is a Rakuten Seiyu, Mother’s Day MangoSource: (1) EU-Japan Centre, Promoting your products on the; (2) Asiance Insight, Seasonal Marketing in Japan (3) Cooperative Research Centre for Developing Northern Australia, International Market Report – Japan
Food Safety Certificate4
Mother’s Day Mango5
Trade & Market Landscape Activities Overview

45
The pursuit for convenience is driving the adoption of e-commerce as a sales channel
Market Profile – Japan
Note: (1) Households are categorised as having two or more members; (6) YoY is an abbreviation for Year on Year;Source: (2) SBJ, Survey of Household Economy; (3) Global Data, Japan e-commerce market to grow by 10.5% in 2021; (4) KPMG Analysis; (5) Statista, Trading volume of the online edible grocery market in Japan from 2015 to 2020
Being a well developed e-commerce market prior to the pandemic, Japan is expected to see a 5.9% CAGR in e-commerce sales between 2021 and 2025.3
– According to the Survey of Household Economy conducted by the Japanese Ministry of Internal Affairs and Communications, over 50% of households ordered goods and services through online grocery channels in July of 2021.1,2
– Many of the leading e-commerce sites such as Rakuten, Yahoo! Shopping and Amazon offer online grocery services, including delivery, to the majority of Japan – including rural areas. This is due to Japan’s high degree of mobile phone penetration.
– Online grocery services are often used to purchase high-value fruits, such as mangoes, that may be difficult to locate and buy in person at supermarkets. This is particularly common when expensive fruit is gifted, packaged nicely and delivered straight to the recipient.4
The Coronavirus Pandemic accelerated the adoption of online grocery shopping initially through the convenience of not needing to leave home and the option of cashless payment. However, e-commerce also provides opportunities to retailers through omni-channel marketing and increased catalogue sizes without the constraint of storage, amongst many others.
16
1819
20
22
27
0
5
10
15
20
25
30
2015 2016 2017 2018 2019 2020
Trading volume of Japan’s online grocery marketAUD $ billion
Japan’s online grocery market is seeing steady YoY6 growth with an 9% CAGR from 2015 to 2020.
– With leading Japanese supermarkets partnering with e-commerce leaders from the West such as Amazon and Uber Eats, the YoY growth depicted in above is expected to continue.
9% CAGR
Trade & Market Landscape Activities Overview

46
Market Profile – Japan
Japanese e-commerce retailers exhibit a focus on extensive variety and product tasteJapanese e-commerce sites provide an array of selling points such as product taste, promotional discounts, customer reviews, shipping options and loyalty rewards. However, the most noticeable difference compared to Australian online retailers is the never-ending options of variety, packaging, ripeness and weight amounts which signifies the Japanese consumer’s desire for assortment when making purchase decisions.
Source: (1) Rakuten Seiyu; (2) Amazon Japan; (3) Kakaku
– A search for mango on the Rakuten Seiyu site displays over 100 pages of results starting with fresh mangoes before moving to alternate mango products and products with mango flavouring which signifies strong demand for the product from Japanese customers.1
– There is a large focus on free shipping and shipping options before emphasising the sweetness of the mangoes which are a key feature of the Australian produce.
– Each product displays a points score next to it, highlighting the site’s customer loyalty efforts through Rakuten rewards and provides Australian growers with the opportunity to sell to repeat customers who consistently shop on the site.
– Event specific mangoes are listed such as “Mother’s Day Mango” to be purchased as gifts.
– Over 43,000 results appear for the search term “mango” on the Kakaku online store.2– Miyazaki is the featured mango variety displayed on the right, costing JPY ¥3,500 per kilo
which is approximately $40 AUD.– Ripeness is a key distinguishing factor emphasised between product options as a premium
is charged to those wanting to skip the wait time associated with unripe mangoes. – The top 21 mangoes are ranked with a clear label next to their listing, making it easier for
consumers to make a purchase decision when faced with an extremely large amount of options.
– Amazon Japan offers a far more modest selection of mangoes when compared to the other featured online Japanese retailers, offering only two varieties of Kent and green mangoes.3
– The first feature stated on the product listing is the country of origin, currently Brazil, Peru or Mexico, offering Australian produce a chance to join the selection of international mangoes sold on the site.
– Outlined in the description is the “rich sweet’ taste of the mango along with the list price of JPY ¥1000 per “ball”, approximately AUD $11.
Trade & Market Landscape Activities Overview

47
Australia is well positioned to supply mangoes that satisfy Japanese consumer preferences
Market Profile – Japan
Quality
Colour & Appearance
– The colour and appearance of mangoes is critical to the Japanese consumer. Mangoes must be clear of any blemishes or scratches to be given as gifts but also for general grocery shopping.
– Growers must consider processing and transportation methods to prevent mangoes being damaged and thus regarded as low quality.
Taste
– Mangoes are generally evaluated by sweetness and acidity levels in Japan, with sweetness being favourable.1 The sweetness can be measured by brix levels and is often used to identify mangoes for gifts and desserts.
– Australian exporters should emphasise the brix of their varieties in marketing efforts to differentiate from lower quality competition.
Size– For mangoes to be sold in supermarkets or department stores (where
mangoes are purchased as gifts) the size should be consistently around 300 – 400 grams per fruit.1
Health and Safety
– The Japanese are considered to be very health conscious and interested in the nutritional value and benefits of mangoes. Government bodies promote Good Agricultural Practices (GAP) such as environmental protection, trustworthy farm management and animal hygiene amongst other initiatives by the Japanese Gap Foundation.2
– Consultation with industry and government has indicated irradiation in Japan may be difficult to introduce due to the negative connotation with harmful radiation, regardless of evidence suggesting otherwise.3
– Packaging can be a way for Australian exporters to educate Japanese consumers and develop a favourable brand image.
– By promoting quality factors such as taste, nutritional value and health benefits, Australian businesses can advertise the unique qualities of Australian varieties and effectively justify the premium price point.
– An investment in the way the mangoes are packaged appeals to less price sensitive consumers seeking premium quality.
– Retailers often deliberately exclude the origin of production, this may instead be an area of emphasis for growers to promote the GAP practices in Australia.
Packaging & Labelling
The Japanese consumer is known to be highly attentive to the quality attributes of the mangoes they purchase with high expectations on appearance, horticultural practices and ultimately the taste. The high quality of Australian mangoes suits the demands of the Japanese consumer and has promising growth opportunities such as catering to the cultural significance of giving mangoes as gifts.3
Note: (4) Pictured are Taiyo no Tamago mangoes from the Miyazaki prefecture.Source: (1) Cooperative Research Centre for Developing Northern Australia International Market Report – Japan; (2) Japanese GAP Foundation, The need for GAP; (3) KPMG Analysis
Premium Mango Packaging4
Trade & Market Landscape Activities Overview

48
The retail premium price point of Australian mangoes is viable if quality is sufficient, though targeted distribution is necessary
Market Profile – Japan
Local production within Japan is gradually growing.
– With such cultural importance and thus long-term demand, Japan continues to expand production in subtropical locations such as Okinawa.
– Local production accounts for approximately 25% of total distribution volume within Japan.1
Japan has two varieties which are known to be bought at ultra-premium prices at auction.
– The Taiyo-no-Tamago mango, known as ‘the egg of the sun’, is of the Irwin variety and from the Miyazaki prefecture. They are globally known as the world’s most expensive mangoes and have sold for over AUD $6,200 at auction.2
– The reason for the price tag is in the way they’re grown. Japanese farmers carefully place netting around each mango to allow sunlight to make the mango uniformly red and to also let the mangoes fall when ready to ensure optimal ripeness.3
Australian mangoes are sold at a premium price point in Japan due to superior quality brand positioning
– Australian varieties sold in Japan are often distributed through channels such as department and fruit gift stores where the common consumer is less price sensitive and more inclined to favour quality over price.
– Australia has minimum quality standards that appeal to Japanese retailers/importers as there is increased confidence that Australian supply will satisfy the expectations of Japanese consumers.
– Mangoes are considered a luxury fruit in Japan, due to cultural significance, and are therefore able to command a premium price if the quality of the mango is comparable or superior to competitors.
– Mangoes from Australia are imported at AUD $14.70 per kg, substantiating the high production costs Australia is subject to.
– The primary issue however is the consistency of supply at high volume, which is substantiated by Australia ranking 7th in trade value amongst competing exporters though 9th in net weight and quantity.5
Japan Mango Import FOB Price5
2020, AUD $
Trade & Market Landscape Activities Overview
By comparison, according to Comtrade data the average price per kilogram received for Australian mango exports in 2020 was AUD $4.88 per kilogram.
Note: Quoted figures have been converted from USD to AUD based on an exchange rate of 1.38. Source: (1) KPMG Analysis, Stakeholder consultation with industry; (2) Nine Kitchen, Mangoes are 50 per cent cheaper than they were last year; (3) UN Comtrade; (4) Produce Business, Make the most of this year’s Mexican mangoesNote: All price per kilogram figures are FOB prices listed in AUD, calculated using UN Comtrade data through a division of product value (AUD) over volume exported (kg), therefore prices do not account for additional costs incurred in exporting.
$14.70
$7.67
$7.09
$5.91
$5.90
$4.33
$- $5.00 $10.00 $15.00 $20.00
Australia (#7 Exporter)
Thailand (#2 Exporter)
Vietnam (#5 Exporter)
Peru (#3 Exporter)
Pakistan (#4 Exporter)
Mexico (#1 Exporter)

49
Australian exporters predominantly use air freight to access the Japanese market due to the limited shelf life of mangoes
Market Profile – Japan
High-Level Japanese Mango Supply Chain Illustration:
Source: (1) Cooperative Research Centre for Developing Northern Australia International Market Report – Japan; (2) KPMG Analysis; (3) Export 2030, Delivering fresh food fast
Exporters are exposed to a range of supply chain costs, such as transportation and freight, which are absorbed by the consumer to create a super-premium. Australian mangoes can be sold at a higher prices due to the quality of the produce, though exporting to Japan brings additional costs resulting in a price even higher than what may be seen in non-protocol markets.
Transport Transport
Exporters
Retailers
• Fruit specialist stores
• Supermarkets• Department
stores• Convenience
stores• Online markets
Japanese Consumers
Wholesalers
Food Services
Farm gate VHTTreatment
Importers / Trading Firms /
Merchants
– The transition between wholesalers and retailers is largely through supermarkets suchas Seiyu Supermarket and AEON Supermarket, though also through fruit specialist andconvenience stores in lower volume.
– Supermarkets dominate the retail scene in Japan, which is the channel Australianexporters should be inclined to pursue due to the premium price point of Australianmangoes.2
– There are 53 wholesale markets for fruit in Japan, which is the primary route to retailfor Australian mangoes.
– The food services channel is effective for mangoes due to their premium price point;high-end dining and hospitality are inclined to purchase high-quality mangoes.
– Transactions between importers and exporters are primarily within the Tokyo, Osakaand Nagoya wholesale markets. This is due to them being the largest markets andbeing closely located to airports and ports.
– This is due to Japan’s Plant Protection Act rules which forces bulk imported fruit toonly be handled at certain locations which are capable of implementing sufficientdisease and pests protection measures, such as Narita and Haneda airports nearTokyo.
– There are currently only five Australian mango varieties which have permission to beexported into Japan, however there are efforts underway to increase varietal access.This presents an opportunity for Australia to grow varieties which appeal specificallyto the Japanese market.2
Trade & Market Landscape Activities Overview

50
Market Profile – Japan
Current operations in Japan are largely wholesale orientated, opportunities for growth involve new distribution channels
Activities to Drive Export Growth
Activity Description
1. Explore the potential of industry collaboration aggregating shipments to reduce transport costs.
In an attempt to reduce the one of the main barriers to entry, aggregating shipments between different Australian exporters can help to reduce the freight cost. This may inspire a collective effort to address different market segments and address damage during transit.
2. Deliver an extensive and targeted marketing campaign to capture demand from Japan’s gift giving tradition.
There is a significant opportunity for exporters to capture demand from annual events of cultural importance. Australian mangoes suit the appearance expectations and can deliver the necessary quality for mangoes to command a price premium and be given as gifts.
3. Improve omni-channel presence to communicate health benefits and Australia’s emphasis on food safety.
Work with retailers and e-commerce players in Japan to communicate the health benefits of mangoes and in particular Australia’s global reputation for strict on-farm sustainability and food safety standards.
4. Explore distribution opportunities in different channels such as food service.
While fresh mangoes in Japan are priced relatively high, exporters may see success entering the food service sector. Non-first grade fruit can be sold to schools, restaurants and the army at a discounted price; ensuring all supply is sold even if not initially accepted by the wholesaler or retailer.
5. Negotiate at a government level the need for irradiation.
There is a consumer acceptance issue that requires education and promotion of irradiation efficacy. Despite not being an immediate opportunity, VHT remains the primary barrier to exporting to Japan.
1
2
3
5
Ease of Implementation
Market Demand Potential
High
HighLow
High
4
Trade & Market Landscape Activities Overview

DRAFT
USA

52
Market Profile – USA
Both Australian and global imports of mangoes into the United States have seen recent increased growth
The US market in recent years has proven to provide future strong growthpotential.
– The first shipment of Australian mangoes were sent to the United Statesin February of 2015.2
– Despite supply chain challenges due to COVID-19 in 2020, Australianmangoes saw a 121% increase in exported volume.1
– The US retail market has strong interest in four Australian mangovarieties, including: Kensington Pride, R2E2, Calypso and Honey Gold.3
– Through stakeholder consultation, industry participants who export tothe US have indicated growth potential is strong and improving, thoughthe primary issue facing the market is continuity of supply.4
– After reaching AUD $759,092 in trade value in 2020, the 6 year CAGR from2015 to 2020 stands at 29% for Australian mango exports to the US.1
US imports of mangoes has progressively risen in the last 10 years.
– Import volumes of mangoes reached an all time high of 573,751 tonnes in 2020,totalling AUD $979,294,127 in trade value.1
– With steady growth over the last decade, US imports achieved a CAGR of 7%,substantiating the long-term growth potential in the US market for Australianexporters.4
– The data indicates the continued demand of a range of mango varieties insupermarkets, wholesale and direct to consumer sales channels. Additionally, thisobservation was validated by industry during stakeholder consultation.4
– Such varieties are largely sourced from Latin America, being the UnitedStates’ main provider from a regional perspective.5
– The main varieties imported include: Ataulfo, Madame Francis, Keitt, Kent andTommy Atkins.5
Mango exports from Australia to USA1
FY2014 - 2020AUD $ million, tonnes
US mango imports by year1
FY2010 - 2020AUD $ million, tonnes
Note: Quoted figures have been converted from USD to AUD based on an exchange rate of 1.38. Source: (1) UN Comtrade; (2) Australian Mangoes, Australian mangoes are on their way to the USA; (3) Australian Mangoes, Australian mangoes in the United States of America; (4) KPMG Analysis – stakeholder consultation; (5) Fresh Plaza, US mango imports show a steady increase year over year
332067379803
377408436108
385807405965
464793508635
500467518228
573751
$-
$200,000,000
$400,000,000
$600,000,000
$800,000,000
$1,000,000,000
$1,200,000,000
0100000200000300000400000500000600000700000
2010 2011 2012 2013 2014 2015 2016 2017 2018 2019 2020
Netweight (t) Trade Value (AUD$)
7% CAGR
019
130
6476
52
115
$-
$200,000
$400,000
$600,000
$800,000
$1,000,000
$1,200,000
020406080
100120140
2014 2015 2016 2017 2018 2019 2020
Netweight (t) Trade Value (AUD$)
29% CAGR
Trade & Market Landscape Activities Overview

53
While Mexico dominates the US market, there remains opportunity due to contrasting peak seasonality
Market Profile – USA
The United States primarily sources their mango imports from South and North America.
– The Australian mango industry faces tough competition exporting to the US with Mexico being the primary source of mango imports for the US with 54.4% in FY2020.1
– Geographically, the US’ top 5 import sources contain 3 South American markets (Peru, Ecuador, Brazil), 1 North American market (Brazil) and the Philippines from South East Asia; collectively accounting for 91% of all mango imports.1 Such geographic proximity to the US results in shorter supply chains and thus a higher likelihood of consistent quality across different batches of mangoes.
– In FY20 Australia was the 15th largest exporter of mangoes to the United States, accounting for 0.15% of total US imports.
US mango imports by source1
FY2020
Jan Feb Mar Apr May Jun Jul Aug Sep Oct Nov Dec
PERU
MEX
AUS
ECUA
Consolidated mango seasonality from leading exporters
Source: (1) UN Comtrade; (2) Producepay, Current situation of fresh mango market in the United States (3) Fresh Fruit Portal, Ecuador: Mango volumes surpass expectations
While Mexico has a strong grasp of the US market due to year round supply, though opportunities remain towards the end of the year when Australia is in peak seasonality.
– The United States has very limited commercial scale production of mangoes, making them somewhat reliable on imports.
– Australian mango industry consultation indicated that a key challenge with exporting to the US is the short window of opportunity towards the latter part of the year. The high expectations on fruit quality during the holiday season, coupled with a challenging freight environment, makes for a difficult market to break penetrate.
– Peru and Ecuador, given close proximity to each other, have similar seasonality windows and thus compete to be the second major supplier to the US.
– While Peru and Ecuador have similar counter-seasonality to Mexico, their supply is largely Peruvian Kent and Tommy Atkins; 70 per cent of Ecuador’s supply to the US is the Tommy Atkins variety. Providing an opportunity for Australian exporters to increase the varietal range supplied to the US during holiday season.3
Trade & Market Landscape Activities Overview

54
The US supermarket and grocery industry’s forecasted growth favours Australian mango expansion
Market Profile – USA
0
100000
200000
300000
400000
500000
600000
700000
800000
900000
2012 2013 2014 2015 2016 2017 2018 2019 2020 2021 2022
A strengthening US economy has largely benefitted the supermarkets and grocery industry, allowing Australian exporters to enter a flourishing market.
– Supermarket and grocery stores account for the largest share of store sales in the US at approximately 92%2, with supermarkets and grocery stores forecasted to reach USD $765.2 billion in 2022.1
– The US is the largest mango import market globally at approximately 570,000 tonnes in 20203, totalling AUD $1.06 trillion.
– Fresh fruit and vegetables are estimated to be 3.7% of all supermarket and grocery store sales in 2020, lead by The Kroger Company, Albertsons and Public Super Markets Inc with 19%, 9.4% and 7.1% of industry revenue respectively.
– One of the key economic drivers of growth within the supermarket and grocery industry is the 2.8% rise in per capita disposable income from 2015 to 2020. This has allowed for steady revenue growth of 0.6% between 2015 and 2020 to counter the rise in cost inflation over the same time period.
US Supermarkets & Grocery Stores – Market Size1
FY2012 - 2022USD $ billion
F
Source: (1) Ibisworld, Supermarkets & Grocery stores in the US Market Size; (2) Economic Research Service, Retail Trends; (3) UN Comtrade; (4) World Bank, Urban population (% of total population) - United States; (5) Ibisworld, Supermarkets & Grocery Stores
The US supermarkets and grocery industry has 3 key external growth drivers which may indirectly favour the performance of Australian mangoes in the US:
Per capita disposable income
With a 2.8% annual growth rate (2015-20) for per capita disposable income and expectations for growth to continue in the short-term, consumers will likely increase total grocery expenditure through purchasing more expensive substitute products (such as fresh fruit rather than frozen) and generally less affordable brands (e.g. branded products rather than white label).5
Urban population growth
The urban population in the US is currently sitting at approximately 82% of the US total population, rising at a 0.2% CAGR between 2000 and 2020. Consequently, an increase in urban population drives foot traffic to supermarkets and grocery stores thus creating a more favourable retail landscape for mango exports.
Healthy Eating Index
Consumers globally are becoming increasingly health conscious, particularly after the coronavirus pandemic. The Healthy Eating Index (HEI) rose 0.9% in 2020, signifying consumers are purchasing more fruits, vegetables, organic and all-natural products. This trend aligns with the steady increase in historic US mango imports.
Trade & Market Landscape Activities Overview

55
Market Profile – USA
An omni-channel experience is critical to succeeding in the US retail market
92.20%
4.50%3.30%
Grocery Stores
Convenience Stores (Excl. those with foodpumps)
US Supermarkets & Grocery Stores – Market Size1
FY2012 - 2022USD $ billion
Australian growers must ensure they have an omni-channel sales approach to capture the fast growing online demand.
– In 2020, e-commerce grocery sales accelerated due to the coronavirus pandemic, increasing 54 per cent from AUD $84.2 billion in 2019 to a forecasted AUD $183 billion in 2022.2 Australian exporters must either develop their own online presence or partner with existing e-commerce players to capture this demand.
– A retailer’s omni-channel experience, such as that of Amazon Fresh, is designed to improve three primary areas of grocery shopping: customer engagement, ease of purchase and availability of information. The benefit for Australian mango exporters, whether it be D2C or through online supermarkets, includes:
o Improved customer engagement: increased opportunity to capture customer feedback to tailor future experiences, implement data-driven marketing, provide customer loyalty programmes and provide order status and tracking.
o Ease of purchase: With improved market access for additional varieties, online retailers can display more SKUs without having to worry about shelf space, allowing for more mango varieties from Australia without compromising the current brands stocked.
o Access to information: Australian exporters will be able to share more product information around mango quality and the farmer heritage, detailing the sustainable and global best practices that Australia is a leader in.5
Brick and mortar stores provide a unique customer experience, one that is advantageous to mangoes.
– Despite the rapid success of e-commerce (incl. m-commerce3), brick and mortar stores will continue to play in important role in grocery shopping. This applies to mangoes where consumers are interested in the touch and feel of the product, particularly when deciding between different varieties and price points.
Note: (3) M-commerce, a segment of e-commerce, represents mobile-commerce – products or services purchased through a phone;Source: (1) Ibisworld, Supermarkets & Grocery stores in the US Market Size; (2) Statista, Online grocery shipping sales in the United States from 2019 to 2024; (4) Fruitnet, Manbulloo secures Walmart deal; (5) KPMG Analysis, Stakeholder consultation with industry
“Manbulloo has locked in a new deal with Walmart which will see more of its mangoes supplied to Sam’s Club stores in the US”
“Currently Manbulloo is exporting hundreds of tonnes of premium Australian mangoes into California, however they expect that number to increase into the
thousands in the coming years.”4
“ ”
Trade & Market Landscape Activities Overview

56
US e-commerce retailers have a clear emphasis on product information and customer engagement
Market Profile – USA
E-commerce Retailer Amazon Fresh Walmart Target Woolworths
Varieties Sold Unspecified Unspecified Unspecified All varieties specified
Price PointUSD $1.59 / count
AUD $2.19 / count
USD $0.98 / lb
AUD $1.35 / lb
USD $0.99 / count
AUD $1.36 / countAUD $2.80 / count
Image
Note
– Storage and preparation instructions available.
– High customer engagement with10,500 ratings provided and 6 general questions answered.
– Product details on nutritional benefits are provided alongside instructions on how to prepare the mango and different ways to eat it.
– Origin not specified, said to mentioned on the label.
– An abundance of prepared meal photos e.g. mango desserts.
– 140+ images and ratings provided, highlighting poor quality.
– Less photos and product information available Woolworths (same for Coles).
– No reviews, ratings or capability for customers to provide feedback.
E-commerce sites from the US often provide an abundance of information on nutritional benefits, storage and preparation guidance as well as potential recipes. A noticeable difference is the level of engagement, US Target for example allows customers to rate the product out of 5 on three different attributes: quality, taste and value. Additionally, photos of poor quality fruit are often uploaded signifying the importance of mango quality and the distribution processes which ensure the quality is retained.
The mango origin was often not specified online providing an opportunity to differentiate between competing varieties if marketers emphasise Australian origin in branding and marketing efforts.
Trade & Market Landscape Activities Overview

57
The US market imports a vast range of mango varieties, some of which are grown in Australia
Market Profile – USA
Peak Seasonality
Name
Origin
Grown in Australia
March – July
Honey (Ataulfo)
Mexico, Peru, Ecuador, Brazil
December – MarchMay – June
Francis
Haiti, Ecuador
March – May
Haden
Mexico, Ecuador, Peru
January – AprilAugust – September
Keitt
Mexico, Ecuador, Brazil, US
December – February
Kent
Mexico, Ecuador, Brazil
March – July
Tommy Atkins
Mexico, Ecuador, Brazil, Guatemala
The mango varieties in the US markets are predominantly from Mexico, Peru, Ecuador and Brazil, however there is some alignment with the varieties grown in Australia. The National Mango Board (US mango industry body) has mentioned that there is a focus on ensuring year round supply to drive consumption during off-peak periods, this represents an opportunity for Australian growers.
It is important to note however that consumers need to be educated on the differences between varieties to understand when they’re best to eat and that judging by colour shouldn’t be the main decision factor. Therefore, a focus on education through marketing should be a key focus for Australian exporters.
Trade & Market Landscape Activities Overview

58
Key purchasing drivers for mangoes in the US include demographics, fruit quality and the global health trend
Market Profile – USA
Source: (1) USDA, Dietary Guidelines for Americans 2020 – 2025; (2) The Packer, Fresh Trends 2020 Survey; (3) Fresh Plaza, Mango Consumption has almost doubled in 12 years (4) National Mango Board, Mango Attitude & Usage Study
Australian exporters should consider a targeted approach at a city level rather than addressing the entire US market as one. Demographics highlight which cities and which consumers would be most beneficial for Australian exporters to focus on.
There’s a meaningful opportunity for Australian growers to educate consumers on the substantial health benefits of mangoes. However, marketing efforts should be viewed as medium to long-term initiatives before results in sales come to fruition.
The data substantiates the fundamental importance of supply chain & logistics optimisation. Suboptimal processes impact the ability to provide consistently high-quality produce, affecting the attributes above, particularly retail price if discounted.
• Demographics are a key factor in understanding who is purchasing mangoes in the US, 15% of customers have said they’ve purchased mangoes within the last year:2
o 14% likelihood for males to purchase mangoes, relative to 16% for females;
o 29% of consumers are of Asian ethnicity, followed by Hispanic consumers at 28%;
o Those with a household income between AUD $66,594 – $133,189 are most likely to purchase (18%);
o 18-39 years of age is the most common age bracket (18%); and
o Consumers from the Western region have the highest likelihood of purchasing mangoes at 20%.
• The 2020-25 Dietary Guidelines for Americans encourages consumption of nutrient and vitamin dense foods such as mangoes; noting benefits such as Vitamin C, A and B.1
• Organic purchases rising with 13% of consumers saying they bought only organic, and 17% buying both organic and conventional mangoes.2
• The National Mango Board’s Director of Marketing has said that the global healthy food trend is an opportunity for growers and retailers to drive attraction by emphasise the health benefits abundant with mangoes.3
• Americans are increasingly focusing on health and wellbeing, allowing mangoes to play a unique role in diets by contributing to health without sacrificing flavour.
• US consumers pay close attention to the quality of mangoes. Quality factors such as ripeness, appearance and size are all purchase drivers and contribute to consumer decision making.4
Ripeness28%
Price24%
Freshness24%Overall Quality
20%
Appearance19%
Colour 13%
Size12%
Aroma8%• Ripeness is the most important
purchase driver for consumers, determined by the redness of the skin and softness of the fruit.
• Price plays a significant role in mango sales with a much lower price per piece charged when compared to Australian mangoes
• 20% of consumers desire high overall quality of their mangoes. Therefore it is vital that exporters take care in their transportation processes to . ensure minimal damage to the mango’s skin colour and texture.
Ethnicity & Demographics Health BenefitsMango Quality
Trade & Market Landscape Activities Overview

59
Growers should consider the long-term potential of exporting greater volume at the cost of forgoing higher prices domestically
Market Profile – USA
With Australian mangoes selling at a higher retail price domestically, relative to in the US,Australian growers need to consider the long-term vision of increasing revenue through highervolumes.
– An e-commerce scan of mangoes indicated prices in the US are approximately AUD $1.30 –$2.50 per count at retail, which is on average lower than those in Australia (prices in Australiarange from AUD $2 – $4).1
– Australian prices have however substantially decreased domestically YoY, in Decemberof 2020 the Calypso variety was sold at Woolworths for AUD $4 per count, similarly theR2E2 variety was approximately AUD $6 per mango.2
– The key consider for Australian growers is to continue supplying the domestic market at higherprices or to invest in increasing market share in the US with a focus on increasing volume YoYdespite receiving lower prices.
While price is a primary consideration to importers and wholesalers, other competitiveadvantages contribute to who supplies the US market.
– Mexico has a strong proximity advantage relative to Australia allowing for faster shipmentsand thus the ability to pick at a higher maturity.
– With quality being the prime concern for consumers, Mexico’s capacity to provide year roundsupply with consistent quality (due to a shorter supply chain) grants greater price flexibilitywhen in negotiation with importers and retailers.4
– Therefore, for Australia to capture part of Mexico’s 65% market share of the US, growers mustconsider international partnerships to establish highly efficient supply chains and ensureconsistency of quality.4
– Ecuador, the third largest supplier to the US market, has similar peak seasonality to Australiaand similar varieties grown. However given the size of the US market and the significantdemand during holiday season, opportunity remains for Australia to gain market share.
US Mango Import FOB Price3
2020, AUD $
Note: Quoted figures have been converted from USD to AUD based on an exchange rate of 1.38. Source: (1) KPMG Analysis, Stakeholder consultation with industry; (2) Nine Kitchen, Mangoes are 50 per cent cheaper than they were last year; (3) UN Comtrade; (4) Produce Business, Make the most of this year’s Mexican mangoesNote: All price per kilogram figures are FOB prices listed in AUD, calculated using UN Comtrade data through a division of product value (AUD) over volume exported (kg), therefore prices do not account for additional costs incurred in exporting.
Trade & Market Landscape Activities Overview
By comparison, according to Comtrade data the average price per kilogram received for Australian mango exports in 2020 was AUD $4.88 per kilogram.
$12.21
$1.77
$1.73
$1.57
$1.45
$- $2.00 $4.00 $6.00 $8.00 $10.00 $12.00 $14.00
Australia (#15 Exporter)
Peru (#2 Exporter)
Brazil (#4 Exporter)
Ecuador (#3 Exporter)
Mexico (#1 Exporter)

60
The primary challenge of exporting Australian mangoes to the US is the riskof not being able to control fruit quality throughout the supply chain,should this be addressed the US market holds significant potential forAustralian growers.
– Fruit quality is of the upmost importance for the US consumer so thevalue chain processes such as packing and transport must be monitoredclosely to ensure operations aren’t negatively impacting the quality ofshipments.
– It is estimated that 22% of Australian mangoes substantially failed tomeet importer specifications upon arrival, and thus had to be repackedand or discounted.1
– Failure to retain mango quality results in reduced sales and therefore abuild up of older stock, this has a direct impact on the confidence of USretailers to stock Australian produce.1
o A sophisticated approach to predicting retail sales demandthrough fruit quality can help to establish long-term retailrelationships.
– It can take from 8 to 22 days from packing for shipments to land in theUS, which is substantially longer than that of competitors. Mexico forexample has the capacity to land fruit within 24 hours of leaving thefarm.2
– Stakeholder consultation with industry has indicated internationalpartnerships to absorb mangoes considered lower grade than what canbe put into supermarkets will reduce the risk of exporting to the US.These partnerships may involve pivoting to juices, purees and otherprocessed foods.
Australia must establish an effective and efficient supply chain pathway to retain sufficient quality
Market Profile – USA
Source: (1) Hort Innovation, Monitoring mango fruit quality through the supply chain to the US; (2) International Tucson, Follow that mango: the journey produce takes from Mexico field to a U.S. kitchen;
R2E2 Australian variety appearance 21 days from harvest – poor quality with significant marks. Causes of such appearance are old age, low temperatures throughout distribution
chain and treatment amongst other stress factors such as freight congestion.
Impact of poor fruit quality
Reduced interest from retailers to merchandise and focus on Australian produce.
Retailers are forced to discount Australian mangoes and concede sales revenue.
Reduced confidence in the reliability of consistent Australian mango quality.
Damaged relationships with key retailers; less appetite to explore new suppliers (i.e. Australian exporters).
Trade & Market Landscape Activities Overview

61
Activities to Drive Export Growth
Activity Description
1. Optimise supply chain processes to ensure consistency of quality upon arrival.
Integrate technology and review processes to enable faster shipments whilst retaining quality. Australia can’t compete with South America on supply chain duration, so it is critical Australian mangoes are of the highest possible quality upon arrival.
2. Deliver in-market promotional campaign during holiday season to capitalise on counter-seasonality
Capitalise on counter peak seasonality with leading import source Mexico. Particularly during end of year where demand for tropical fruits are high for events such as Christmas and new year celebrations.
3. Increase the range of varieties supplied to the US market during October to February to compete with Ecuador and Peru.
Australia has counter seasonality to Mexico and similar peak seasonality to Peru and Ecuador. However, 70 per cent of Ecuadorian mango exports to US are Tommy Atkins.1 This provides an opportunity to grow demand for Australian varieties such as Kensington Pride and Calypso.
4. Partner with e-commerce leaders such as Walmart and Target to capture demand of online grocery shopping.
Leverage the vast distribution networks and strong customer bases of existing e-commerce players. Their websites offer an avenue for consumers to comment on fruit quality, taste and appearance; which Australia can excel in if issues around supply chains and VHT treatment can be addressed.
5. Review and negotiate MRLs at a government level to ensure they aren’t constraining trade growth while retaining necessary food safety.
Industry has expressed concern with US requirements involving MRLs and seed weevils. Negotiation at a government level to review the limits to determine if they’re unnecessarily strict and restricting trade growth would support industry in increasing YoY export volumes.
Market Profile – USA
1
2
4
Ease of Implementation
Market Demand Potential
High
HighLow
High
5
Source: (1) Fresh Fruit Portal, Ecuador: Mango volumes surpass expectations
3
Supply chain efficiency is fundamental to success in the USATrade & Market Landscape Activities Overview

DRAFT
Netherlands

63
Market Profile – Netherlands
There is only one reported shipment of mangoes from Australia to theNetherlands from 2017-2021 on the UN Comtrade database, consisting of 20tonnes sent in 2018 at AUD $4.21 per kilogram.
– This minor volume of exports is likely skewed by a lack of representativeexport data for this time period, given many industry members report ashaving sent mango exports to the Netherlands in the past. It is also possiblethat given a large share of Australian mango exports to the Netherlands arere-exported they are not consistently captured in trade reporting.
– Despite the significant competition the Netherlands’ open market accesscreates, Australia appears to receive a relatively favourable price point.
– A targeted re-export plan to select specific customer segments who arewilling to pay this level of price point will require a focus on educatingconsumers on the value of Australian mangoes.
Mango exports from Australia to the Netherlands1
FY2018 AUD $000, kilograms
Note: Quoted figures have been converted from USD to AUD based on an exchange rate of 1.38. Source: (1) UN Comtrade Data; (2) ABC News, Japan bans Aussie mangoes; (3) KPMG Analysis; (4) ExpatGo, Behold the World’s most valuable mango
Netherlands mango imports appear to be steadily increasing in both volume andvalue from 2013 to 2020.
– Import volumes of mangoes in the Netherlands reached an all time high of 251,101tonnes in 2019 , totalling AUD $393 million in trade value.1
– Both the volume and value of mango exports to the Netherlands appear to havebeen growing at a 5% compound annual growth rate, creating a positive trajectoryfor future export demand.
– Industry members flagged in the workshop that Netherlands importers findreliable product supply in strong volumes is a key pain point, which is reflected inlow average prices.
– The primary varieties imported by the Netherlands include Kent, Keitt, Palmer,Osteen (Spain), Tommy Atkins, Amelie (West Africa), Shelly (Israe) and KensingtonPride (Australia). Air freight mango imports are dominated by ataulfo (Mexico),Nam Dok Mai (South East Asia), Alphonso and Kesar (India).
Netherlands mango imports by year1
FY2013 - 2020 AUD $ million, tonnes
20270
$85,256
$-
$10,000
$20,000
$30,000
$40,000
$50,000
$60,000
$70,000
$80,000
$90,000
0
10000
20000
30000
40000
50000
60000
70000
80000
90000
Netweight (kg) Trade value AUD $M
The Netherlands pose increasing demand for mango imports however offer low average prices due to strong competition
242,131 251,101 240,710 217,356
197,491 173,349
155,285 157,778
-
50,000
100,000
150,000
200,000
250,000
300,000
$- $50 $100 $150 $200 $250 $300 $350 $400 $450
20202019201820172016201520142013
Netweight (t) Trade value AUD $M
Trade & Market Landscape Activities Overview

64
Brazil and Peru heavily dominate mango imports to the Netherlands, collectively accounting for 89% ofimports.
– Given the flooded nature of the market, mango imports see a relatively low average price point,sitting at around AUD $0.76 per kilogram received for imports from Brazil in 2020, and $0.67 for Peruaccording to the UN Comtrade database.
– However, the opportunity to re-export mangoes from the Netherlands on to additional customers inthe EU who are more willing to pay a price premium may expand trade opportunities.
– Due to the Netherlands’ competitive advantages in logistics it is likely that the market will remain theprimary mango import destination for the EU for some time.3
– Prices received for Brazilian imports are reported to be slowly increasing in line with favourableexchange rates, an indicator of customer purchasing power.2
– Brazil mango exporters report that total addressable size of then mango market in Europe is growingat around 10-15% per year, with large growth potential in per capita consumption.2
A lack of domestic mango production in Netherlands creates a need for year-round mango imports,making it more challenging for Australian exporters to capitalise on seasonal supply gaps.
– The Netherlands imports a wide selection of mango varieties year-round, even relying at times onexotic air-freighted varieties such as Nam Dok Mai (from Thailand) and Ataulfo (from Mexico).3
– Further, given the top exporters to the Netherlands (Brazil and Peru) are located in the southernhemisphere they are also counter-seasonal to Northern Hemisphere producers, with peak mangoexport season running from October to December in Brazil and December to March for Peru.2
– A number of central African countries supply the EU market through the Netherlands in May andJune, while Israel is a key source from July to mid-September. Due to low input costs these exportsare priced in line with generally lower quality, meaning Australian exporters would be best placed totarget niche, premium export or re-export customer groups.
The Netherlands is a highly competitive market due to its open access, with mango exports dominated by Brazil and PeruVolume share of top 10 mango importers to Netherlands1
FY2020
Market Profile – Netherlands
Jan Feb Mar Apr May Jun Jul Aug Sep Oct Nov Dec
IND
PER
AUS
BRA
Consolidated mango seasonality from leading exporters2,3
Note: Quoted figures have been converted from USD to AUD based on an exchange rate of 1.38. Source: (1) UN Comtrade Data; (2) Fresh Plaza, Mango price soars near peak of Brazilian season (3) CBI Ministry of Foreign Affairs, The European market potential for mangoes
Trade & Market Landscape Activities Overview

65
Exports to the Netherlands are hindered by MRL and VAT limitations however evolving trade relations are promising
Source: (1) DFAT, Australia-European Union Free Trade Agreement; (2) CBI, The European market potential for mangoes; (3) European Commission, Mercosur; (4) ABC, Australia's free trade deal with the EU could be in trouble after scrapping French submarines project; (5) Access2Markets, Guavas, mangoes and mangosteens
The Netherlands is a highly open market for Australian mangoes export and re-export however poses challenges in its rejection of irradiated imports and stringent MaximumResidue Limit impositions. Negotiations surrounding a free trade agreement with the EU are a positive sign for expansion of trade opportunities in future, however there havebeen limited updates as to when this may materialise.1
The Netherlands represents the centre of EU mango trade for redistribution to other member states, accounting for 33% of Europe’smango imports due to its open market access arrangement.
– Around 80% of mango imports in the Netherlands are re-exported to other European countries, enabling diverse tradeopportunities.1
– Despite the Netherlands’s membership of the EU trading Bloc mango exports are not subject to tariffs however exporters arecharged a Value Added Tax (VAT) of 9%.5
– The EU has set maximum residue levels (MRLs) for pesticides and other contaminants, e.g. heavy metals, in and on foodproducts, currently sitting at 0.01mg/kg. The Netherlands, however, enforces even stricter conditions as many Dutch supermarketsrequire MRLs to be 50% lower than the legal limit.2
– Australian mango exporters flagged in the industry workshop that constantly evolving MRL regulations make exporting to theNetherlands challenging. Greater visibility over these changes through consistent monitoring would be helpful to enable morediverse routes to market supported alternative supply chain arrangements to accommodate MRL allowances.
– The EU currently has trade agreements with some of the Netherlands‘ biggest mango import partners such as Brazil and Peru,who fall under the EU-Mercosur trade agreement. This arrangement as well as the typically large, consistent volumes of mangoessent to the Netherlands by these markets enables streamlined market access and optimised logistics processes.3
– Negotiations were launched in 2018 for the Australia-European Union Free Trade Agreement however there has been littleprogress as the COVID-19 pandemic has caused delays. Nonetheless, exporters should monitor for regular updates asnegotiations progress to ensure early access to an expansion of trade opportunities.4
Start to establishrelationships with keyDutch mango traders whore-export to the rest ofEurope.
Key opportunities for Australian mango industry:
Monitor progress of theproposed Australia-EUFTA for potentiallyimproved access andreduction to import taxes.
Market Profile – Netherlands Trade & Market Landscape Activities Overview

66
The Netherlands has a strict stance on irradiation however the EU has recently commissioned research on its safe use
Source: (1) DFAT, Australia-European Union Free Trade Agreement; (2) CBI, The European market potential for mangoes; (3) European Commission, Mercosur; (4) ABC, Australia's free trade deal with the EU could be in trouble after scrapping French submarines project; (5) European Commission, Evaluation of EU-legislation on food (6) European Commission, Report from the Commission to the European Parliament on food and ingredients treated with ionising radiation for the years 2018-2019 ; (7) Access2Markets, Guavas, mangoes and mangosteens
A report commissioned by the EU in 2019 which looked at irradiation use in the EU and the reasons for its decline found that the treatment serves as a viable alternative toharmful pesticides and post-harvest treatment, and has no significant impact on the nutritional quality of fruits
While irradiation facilities do exist in the Netherlands, the market does not allow irradiated imports. Irradiation is used on a numberof select products, a potentially positive indication of future reception of the treatment in the long term, however substantialeducation at both a government and consumer level will be needed to work toward acceptance of irradiated fruits and vegetables.
– Products such as frogs legs, herbs, and select poultry products currently undergo irradiation in the EU, according to an EUcommission in 2018 on the legislative framework around food irradiation. A move to approve other products was launched in 2000however opposed by food businesses and consumer organisations.
– This report indicated that while the trend for irradiating food products has been on the decline since 2010, a slight increase in use ofthe treatment within the FY has increased slightly since 2018.5 This study found that the main reason for decline in irradiation wasconsumers’ refusal to buy food labelled as irradiated, however the project could not substantiate this claim with empirical data. Thisresearch does indicate that a change in irradiation use has at least been considered in the region and that there are stakeholderswho enforce its value as a treatment for some products.
– While irradiation is known to be banned by the Netherlands and EU, research such as this report does provide evidence forirradiation market access advocacy in the medium to long term, particular as Australia-EU trade relations progress.
Key opportunities for Australian mango industry:
Continue to pursue marketaccess pathways inirradiation, negotiatingentry on a member-statelevel.
Market Profile – Netherlands Trade & Market Landscape Activities Overview

67
The two major retailers in the Netherlands, Albert Heijn and Jumbo dominate the market with a combinedmarket share of almost 58%, presenting an opportunity for growers to serve the majority of the customersby establishing relationships with these players.2
– Albert Heijn is considered a premium retailer with an emphasis on quality, while Jumbo is known to beless expensive and mostly located in residential neighbourhoods.4
– 80% of all food retail outlets are supermarkets, with the remaining 20% made up of convenience stores, afew wholesalers and superstores located in industrial parks.1 Given the majority of supermarkets andsuperstores sell imported fresh fruit which are obtained via specialised importers, this would be theoptimum channel for Australian exporters to target given the bulk, low value proposition of wholesalersand superstores.1
– Supermarkets account for 77% of all fresh fruit sold within the Netherlands.1 While supermarkets’dominance over the market creates diverse export opportunities, this can also lead to challenges insupermarkets’ complex standards and compliance landscape.5
Rapid growth in Dutch organic grocery store revenue suggests that consumers search for high-qualityproducts and are willing to pay more for them.3
– Specialty supermarkets such as Marqt and Ekoplaza are common, through which consumers are willing topay higher prices for sustainable, premium items.4
– While this focus creates an emphasis on high-quality products for which consumers are willing to pay apremium, irradiated mangoes do not classify as organic therefore will require an alternative channelmarket entry strategy. Preference for organic products does bode well for any potential futurecommunication and positioning regarding the sustainable, transparent production of Australian products.
Supermarkets and Superstores usually work with specialised importers to purchase globally-sourcedspecialty products.4
– These products are pre-packaged and ready for sale with most of the major importing companies locatednear wholesale markets in the south-west of the country.4 These channels will require large volumes ofimports with consistent quality.
– Dutch companies value direct relation with their suppliers, indicating the importance for Australianexporters to focus on developing strong relationships with key importing contacts.
Mangoes are generally sold in large volumes through supermarket chains and increasingly as value-added products
Market Profile – Netherlands
Source: (1) USDA, The Dutch Food Retail Report 2019; (2) Statista, Market share of the leading companies in food retail in the Netherlands in 2021; (3) Statista, Revenue of organic grocery stores in the Netherlands from 2013 to 2020; (4) CBI, Exporting fresh fruit and vegetables to the Netherlands; (4) Expatica, Dutch supermarkets and grocery stores; (5) CBI, Exporting fresh fruit and vegetables to the Netherlands
Albert Heijn36%
Jumbo22%
Lidl11%
Plus6%
Aldi5%
Coop4%
Dirk3%
Other13%
Netherlands Supermarkets & Grocery Stores – Market Share2
FY2021EUR €
Trade & Market Landscape Activities Overview

68
Mangoes available for sale on Dutch e-commerce platforms emphasise health benefits and product use at favourable prices
Market Profile – Netherlands
E-commerce platforms in the Netherlands vary in the focus of product descriptions, mostly aligning with the overall nature of each brand. Higher-priced mangoes available forsale on more premium platforms like Albert Heijn, stress the health benefits e.g. vitamin A and C content, whilst more everyday platforms such as Jumbo list mangoes at lowerprices. Overall there is a clear trend towards e-commerce prioritisation for groceries shopping and presents a valuable market entry strategy for Australian mangoes.
Note: $ = Budget, $$ = Mid-Range, $$$ = PremiumSource: (1) Albert Heijn, AH Mango; (2) PLUS, Mango; (3) Spar, Mango; (4) Future Grocery Shopping, State of the Online Grocery Market - the Netherlands; (5) NL Times, Jumbo cheapest supermarket in Netherlands; Albert Heijn most expensive
E-commerce Retailer
Varieties Sold Price Point Image Note
Albert Heijn1
$$$
Does not specify'AH Mango' 'Ready-to-Eat Mango''AH Box full of mango pieces''Mango sticks'
EUR €1.79 per piece2 for EUR €2.50
AUD ~$2.74AUD ~$3.82
– AH uses their 'Nutri-Score' to help customers quickly distinguish between "healthy and less healthy" products with mangoes given the highest rating.
– The description mainly focuses on the sweet taste of the mango and mentions how the skin says nothing about the mango's ripeness.
Plus2
$$
Does not specify‘Mango Raw’ 'Ready-to-Eat Mango'
EUR €1.59 per piece2 for EUR €2.89
AUD ~$2.42AUD ~$4.40
– The first heading outlines how prices are low and will stay low for most products.
– The ready to eat mangoes are picked two weeks later than usual so consumers don't have to wait for them to ripen.
– There is then a very detailed breakdown of the harvesting process, guaranteeing consumers that certain requirements have been met to ensure sustainability.
– Finally, there is a focus on the Vitamin C in mango.
Spar3
$$
Does not specify‘Mango Raw’ 'Ready-to-Eat Mango'
EUR €1.99 per piece2 for EUR €3.49
AUD ~$3.03AUD ~$5.82
– The description describes ways mangoes can be eaten, focusing on the taste and vitamins it contains.
– There is a Fairtrade sticker on the product page indicating a goal of selling sustainably sourced produce.
Picnic $$ (inaccessible outside the Netherlands) – Picnic is an online-only supermarket requiring the download of a mobile app
that offers customers free delivery on all orders over EUR €25.4
– 2.4% of all Dutch households have already signed up, with the platform’s growth accelerated by the pandemic.
4
Jumbo $ (inaccessible outside the Netherlands)- Jumbo is the second-largest supermarket in the Netherlands and is also the cheapest according to recent studies.
5
Trade & Market Landscape Activities Overview

69
Mango prices in the Netherlands are typically higher than the European average yet lower than most Northern nations
Due to open nature of the Netherlands market, strong competition can drive productprices down. However, if exports can distinguish themselves from the large volumes ofsecond-grade product that flood the market, price premium opportunities are widelyavailable.
– According to Eurostat, the price of fresh fruit and vegetables are 9% higher than theEuropean average, however they are typically generally lower than the Europeanaverage.2
– Analysis of UN Comtrade Netherlands mango import data revealed an average pricepoint amongst the top ten exporters of AUD $1.58 per kilogram. While this is a lowaverage, it is also possible that further profits are generated by then re-exportingproducts to other lucrative customer groups across the EU.
– The wholesale nature of these imports is also reflected in lower price points, while theend-prices identified in a scan of mangoes for sale on e-commerce platforms were morealigned with average Australian pricing (around AUD $3-4 per mango).
Mango prices across the EU have been increasing by an average annual rate of +2.4% from2013 to 2019.3
– The mango and mangosteen import price in the European Union stood at USD $1,936per tonne (AUD $2,632) in 2019, an increase of 3.2% from 2018.
– While the pandemic has impacted both supply and demand, prices remain favourableand are projected to continue to increase.
– Average prices varied vary amongst the EU’s major importing countries. In 2019, the UKrecorded an average price of around USD $2,202 per tonne (AUD $2,988), Germanyrecorded USD $2,164 per tonne (AUD $2,935), the Netherlands recorded USD $1,600 pertonne (AUD $2,171) and Belgium recorded USD $1,702 per tonne (AUD $2,308).
– Regarding demand, the countries with the highest volumes of mango and mangosteenconsumption in 2019 were Germany (82K tonnes), the UK (77K tonnes) and France (52Ktonnes), together comprising 63% of total consumption.
– Spain has emerged as the fastest-growing importer of mangoes in the European Union,with a CAGR of +12.4% from 2013-2019.3
Trade value and price per kilogram of mangoes imported to Netherlands (AUD)1
2020AUD $ million
Note: Quoted figures have been converted from USD to AUD based on an exchange rate of 1.38. Source: (1) UN Comtrade Data; (2) (5) CBI, Exporting fresh fruit and vegetables to the Netherlands; (3) Global Trade Mag, Spain and France Emerged as the Most Promising Markets for European Mango ImportersNote: All price per kilogram figures are FOB prices listed in AUD, calculated using UN Comtrade data through a division of product value (AUD) over volume exported (kg), therefore prices do not account for additional costs incurred in exporting.
0 20 40 60 80 100 120 140 160
Peru
Brazil
India
Belgium
Spain
France
Portugal
Senegal
Burkina Faso
Israel $1.88/kg
$1.19/kg
$0.95/kg
$1.57/kg
$2.49/kg
$2.25/kg
$2.24/kg
$1.20/kg
$0.95/kg
$1.08/kg
Market Profile – Netherlands Trade & Market Landscape Activities Overview
By comparison, according to Comtrade data the average price per kilogram received for Australian mango exports in 2020 was AUD $4.88 per kilogram.

70
Market Profile – Netherlands
The Dutch Food Retail Report and research conducted by the Centre for the Promotion of Imports from Developing countries (CBI) found that Dutch consumers have collectivelyexhibited a desire for healthy, organic and sustainable produce, and are also wary of the environmental and health consequences of their purchase decisions. There are alsoexpectations that purchases show value-for-money, high-quality and a level of convenience, presenting Australian exporters with an opportunity to emphasise the high-qualitynature of their products.
Note: Quoted figures have been converted from USD to AUD based on an exchange rate of 1.38. Source: (1) ) USDA, The Dutch Food Retail Report 2019; (2) CBI, Exporting fresh fruit and vegetables to the Netherlands; (3) Groenten & Fruit, Another drop in consumption of fresh fruit and vegetables; (4) Albert Heijn, AH Mango; (4) IDH, The Sustainability Initiative Fruit and Vegetables
Health and Wellbeing
– Dutch consumers are becoming increasingly concerned with the health and well-being impacts of their food consumption, driving a rise in demand for super fruits such as cranberries and pomegranates with the potential for mangoes to join this group.1
– As a result, customers are more willing to pay a premium for products that support a healthier lifestyle, in the case of mangoes seeking their high Vitamin A, C and antioxidant content.
– Albert Heijn implements a ‘Nutri-Score’ which rates products based on their levels of sugars, saturated fat and salt highlighting consumers’ desire to make healthy purchases.4
Sustainability
– Dutch consumers are increasingly aware of social and environmental issues that may relate to their purchase decisions with the sale of sustainable certified foods growing by 19% in 2017 to AUD $7.3 billion.1
– Given Australian mango production is amongst the most compliant industries globally, they hold an advantage over low input cost countries in this product category.2
– Dutch consumer awareness of sustainability extends across the entire supply chain, however the responsibility to demonstrate it through packaging and marketing usually falls on the retailer and therefore it is vital that Australian exporters communicate this to any trade partners.
Convenience
– Together with the UK, the Netherlands is one of the most developed nations for convenience foods with sales increasing by 30% in 2020, greatly accelerated by the COVID-19 pandemic.2
– It is estimated that 22% of all Dutch fresh fruit and vegetables have been pre-processed into alternative ready-to-consumer products such as seedless, freshly cut and snack products .3
– Australian mango growers can take advantage of this by producing value-added products, pre-export, such as dried mango or powders. This may also increase lead times and unlock alternative supply chain options.
Six trends shape Dutch consumer preferences for the fresh fruit and vegetables market, including health and convenience
Trade & Market Landscape Activities Overview

71
Exporters
Retailers
• Fruit specialist stores
• Supermarkets• Department
stores• Convenience
stores• Online markets
Dutch/European Consumers
The Netherlands offers sophisticated cold chain logistics infrastructure to preserve the product quality of imports
Market Profile – Netherlands
High-Level Netherlands Mango Supply Chain Illustration:
Source: (1) Cooperative Research Centre for Developing Northern Australia, International Market Report – Japan; (2) KPMG Analysis; (3) Holland International Distribution Council, The Netherlands – your main port to Europe
Australian mango exporters flagged in the industry workshop that the highlight sophisticated nature of Dutch import operations drives a need for Australian industry to optimise logistics efficiency and reduce supply chain costs in order to compete and establish trusting, reliable trade relationships. Importers typically require large, consistent product volumes to accommodate year-round import schedules. The Netherlands offers some of the best air, sea and digital port facilities in the world.
Wholesalers
Food Services
Farm gate VHTTreatment
Transport
Importers / Trading Firms /
Merchants
Transport
– Products re-exported throughout Europe are typically done so through the original portof arrival, which for Australian fruits would typically be Schipol Airport. Some productsmay be transferred to other hubs such as Rotterdam or Amsterdam port.
– While not often required for fresh fruit imports, Dutch port and airport facilities offergeneral and specialised warehousing facilities and some of the largest cooling andfreezing storage capacity in the EU. This could support imports of value-added, finishedproducts.
– For those products not re-exported, Dutch supermarkets or other retailers typicallysource their products from wholesalers based at the major ports or airports.Wholesalers transport shipments in bulk via the Netherlands’ interconnecting high-speed road network.
– Australian mangoes are treated via VHT in either Melbourne or Queensland beforethey are transported to respective airport facilities for export. In the case ofQueensland, exporters face a pain point in that the majority of production in the areaneeds to be transported to Brisbane therefore this route offers the lowest freightcosts, despite closer proximity of Cairns or other regional intermodal hubs.
– All mango exports to the Netherlands are transported by air freight, reducing costcompetitiveness.
– Compliance with MRLs is a high priority given the stringent nature of theNetherlands import agenda.
– Many fruit imports arrive via Amsterdam’s Schipol Airport, although distributionpathways through Rotterdam and Eindhoven are also available.
– Port and airports’ use of automating and augmenting technologies and market-leading software to optimise the speed of processes supports short lead times tomarket.3
– Major fruit import players include Bud Holland, Frescon Fruit Direct, RosaInternational and Fresh Wise.
Trade & Market Landscape Activities Overview

72Note: *According to research by US Global Trade Authority
Market Profile – Netherlands
Ease of Implementation
Market Demand Potential
High
HighLow
High
Activities Drive Export Growths
Activity Description
1. Support current or future negotiations for irradiation pathways at a member-state level.
Where possible access a wide re-export network by targeting negotiations toward Spain, France and Germany* who show the largest demand for imported mangoes. Draw on existing research such as the EU Commission’s 2019 report on the use of irradiation on food to advocate for the allowance of fresh irradiated imports.
2. Provide mango-specific insights for consumer education campaigns on irradiation, preferably through premium retailers.
Support ongoing or planned horticulture-wide consumer education campaigns on irradiation by providing mango-specific evidence. Suggest that these campaigns capitalise on consumer preferences for quality and leverage in-store or online installations promoting the safe and sustainable use of irradiation.
4. Consider consolidating exports to drive critical mass required by Netherlands import and re-export supply chains.
Upon improvements to production consistency in the medium-long term, identify means to internally and externally consolidate exports at treatment, distribution and shipment touchpoints. This would aim to drive input costs down and support secure, long-term contracts.
5. Continually monitor EU and target member-state evolving MRL frameworks to ease compliance with EU regulations
As new pathways to the EU based on changing regulations become available, leverage such means to ease compliance and reduce process complexity. This would aim to decrease input costs and reliance on air freight, by accommodating larger product volumes.
>
1
2
3
4
5
Accessing untapped demand to the EU via the Netherlands would be best supported by industry-wide collaboration
Trade & Market Landscape Activities Overview

DRAFT
Appendix A
Initial Prioritisation Exercise
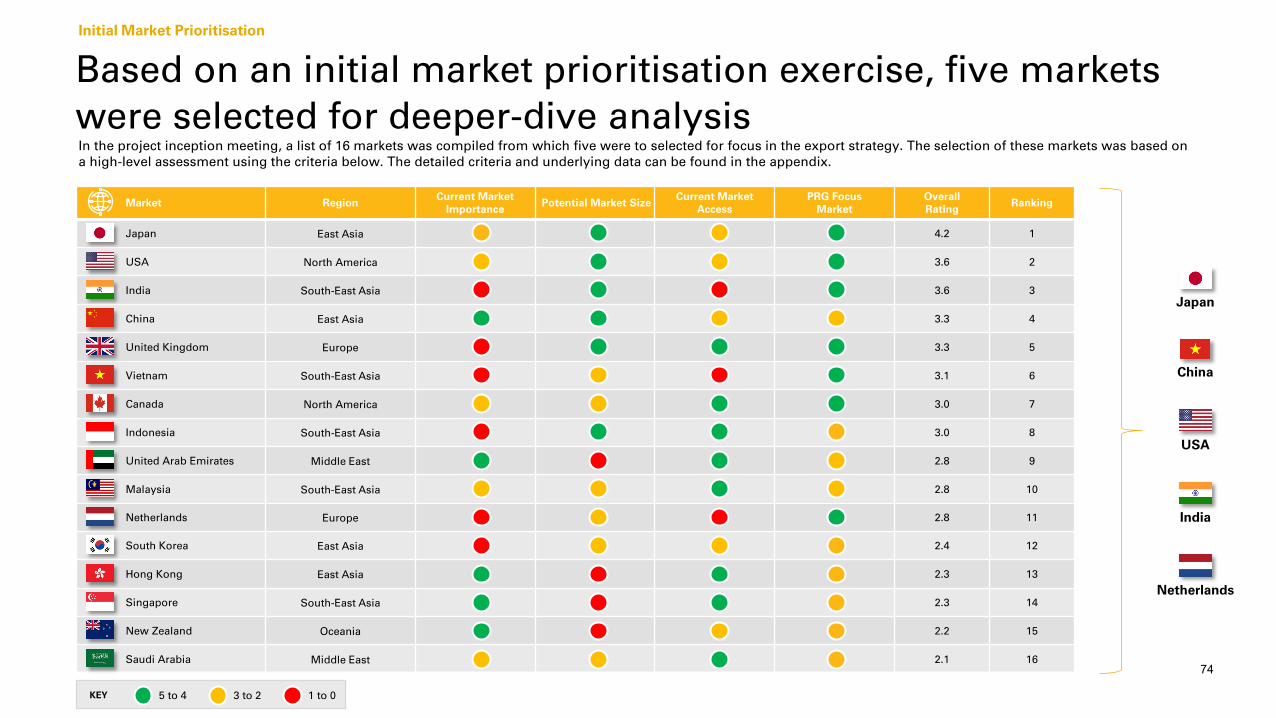
74
Initial Market Prioritisation
Based on an initial market prioritisation exercise, five markets were selected for deeper-dive analysis
Market Region Current Market Importance Potential Market Size Current Market
AccessPRG Focus
MarketOverall Rating Ranking
Japan East Asia 4.2 1
USA North America 3.6 2
India South-East Asia 3.6 3
China East Asia 3.3 4
United Kingdom Europe 3.3 5
Vietnam South-East Asia 3.1 6
Canada North America 3.0 7
Indonesia South-East Asia 3.0 8
United Arab Emirates Middle East 2.8 9
Malaysia South-East Asia 2.8 10
Netherlands Europe 2.8 11
South Korea East Asia 2.4 12
Hong Kong East Asia 2.3 13
Singapore South-East Asia 2.3 14
New Zealand Oceania 2.2 15
Saudi Arabia Middle East 2.1 16
Japan
USA
India
China
KEY 5 to 4 3 to 2 1 to 0
In the project inception meeting, a list of 16 markets was compiled from which five were to selected for focus in the export strategy. The selection of these markets was based on a high-level assessment using the criteria below. The detailed criteria and underlying data can be found in the appendix.
Netherlands

75
A combination of qualitative and quantitative research was applied to conduct the initial prioritisation exercise
Initial Market Prioritisation
StatusMarket
Importance1
Potential MarketSize2, 3
Market Access4
PRG Focus Market
Overall Rating Ranking
R.A.G(Red/Amber/
Green)
Export Volume
Total Middle-Income
Population
Protocol (restricted
access) market?
Discussion during kick-off
workshops
Average of previous columns
Order of markets based
on weighted average
1 – 5 ≥125m No Explicit focus
6 – 10 ≥ 35m YesIdentify opportu-
nities
11 – 16 ≤ 35m Inaccessible No interest
Initial Market Assessment Criteria: Underlying Initial Prioritisation Exercise Data
The underlying data highlights which markets may enable trade growth however a qualitative perspective must be applied to consider the likelihood of success and future export opportunities. India for example holds significant potential if market access is granted, while Netherlands ranks poorly with the chosen metrics though has broader Europe distribution capability through re-export.
Therefore, a weighted average was applied to form a ranking based on both a quantitative view of current market potential and a qualitative perspective on future growth opportunities. Additionally, regional diversification was considered as the UK and the Netherlands, for instance, are common markets though industry expressed greater interest in the Netherlands.
MarketExport Volume
(tonnes '20)
Market SizeMarket Access
Protocol?PRG Focus
Market Average
Weighted Average
RankingTotal Population Middle Class %
Middle Income Population
Protocol? Discussion?
Japan (East Asia)
16 125,584,838 66.80% 83,827,879 Yes 4.00 4.18 1
USA (NA) 115 334,805,269 41.80% 139,781,200 Yes 3.75 3.61 2
India (South Asia)
0 1,406,631,776 5.70% 80,600,001 Closed 2.50 3.58 3
China (East Asia)
319 1,448,471,400 50.80% 735,678,624 Yes 4.00 3.35 4
United Kingdom (EU) 0 68,497,907 60.60% 41,537,131 No 3.50 3.26 5
Vietnam (SE Asia) 0 98,953,541 39.20% 38,809,579 Closed 2.13 3.14 6
Canada (NA) 182 38,388,419 46.70% 17,942,747 No 3.38 2.98 7
Indonesia (SE Asia) 0 279,134,505 16.90% 47,089,991 No 3.38 2.98 8
United Arab Emirates (MENA)
844 10,081,785 43.10% 4,347,728 No 3.50 2.85 9
Malaysia (SE Asia) 2 33,181,072 73.60% 24,414,633 No 3.50 2.85 10
Netherlands (EU)
0 17,211,447 53.60% 9,228,778 Yes 1.63 2.84 11
South Korea (East Asia) 0 51,329,899 66.30% 34,006,058 Yes 2.50 2.45 12
Hong Kong (East Asia) 1020 7,604,299.00 61.30% 4,658,647 No 3.25 2.28 13
Singapore (SE Asia) 1059 5,943,546 56.00% 3,328,386 No 3.25 2.28 14
New Zealand (Oceania) 1123 4,898,203 50.80% 2,487,797 Yes 2.75 2.18 15
Saudi Arabia (MENA) 163 35,844,909 43.10% 15,457,968 No 3.00 2.13 16

DRAFT
Appendix B
Phytosanitary Matrix

77Source: (1) Post Harvest, Applied Horticultural Research and Hort Innovation, Postharvest management of vegetables, Quarantine treatments
Phytosanitary Matrix
Various treatment types are available to Australian mangoes
Treatment
Irradiation
Fumigation
Cold
Heat
Description1
Mangoes are exposed to a form of ionising radiation such as X-ray or gamma which sterilises bacteria and any pests in the shipment. Dose schedules and timings usually vary, and facilities require certification prior to acceptance.
Produce is exposed to a fumigant, which is often methyl bromide. The product is heated to a certain temperature with a specific concentration of the chemicals then added to the chamber.
There are usually specified maximum loads for the chamber, and this often requires some limited cold treatment following fumigation.
Mangoes are held in a controlled, cold temperature environment for a period of time. The main focus of this technique is to kill fruit fly varieties. Data is collected from temperature probes in specific parts of the shipment. The treatment can often be conducted in-transit, or pre-shipment.
Heat treatments are used to prevent fruit flies and are primarily used on high-value products such as mangoes. Applied through vapour, air or water, heat treatments are often expensive, difficult to apply, crop and pest specific and can potentially damage the product with different time and temperate combinations.
Insights
• Also acts as a devitalisation treatment – mango seeds may germinate though will not grow.
• Minimal impact on the potency of the mango’s minerals. • Fast and reliable treatment that leaves no residue on the fruit.
• Efficacy can be impacted by a range of factors, such as the temperature of the mango or the atmospheric temperature.
• Potential for failures and recalls as fumigation could damage the mango’s quality.
• Relatively fast treatment enables efficient treatment of large volumes. • VHT has a reputation amongst industry to damage fruit, impeding on quality of
exports.• Likely to be restricted in some export markets.
• Shortens lead times given on shore or in-transit nature of treatment, however can be damaging to fruit quality.
• Can be combined with other phytosanitary treatments such as fumigation to increase the likelihood mangoes are free from fruit flies.
• Can be applied to any shape or size mango.• Appropriate for mangoes as they are resistant to high moisture and not
vulnerable to drying out.
Australian mangoes have four main treatment pathways available across the selected destination markets. Vapour heat treatment is most common across current trading partners, however efforts are underway at a government level to promote the efficacy of irradiation.

78Source: (1) Australian Government Department of Agriculture, Water and the Environment, Approved Australian horticulture export protocol treatment facilities list; (2) Hort Innovation, Australian Horticulture Statistics Handbook 2019/20; (3) Department of Agriculture and Fisheries, Rules of thumb for export mango supply chains; (4) Average estimated capacity of treatment plant, data obtained through stakeholder consultation.
Approved horticulture export treatment facilities are primarily in Victoria despite production largely being in the NT and QLDWith 51% of production in the Northern Territory and 45% from Queensland, mango growers should consider the location of export treatment facilities when following the phytosanitary requirements of different markets. The transport between growing location and the treatment facility is a key variable in supply chain efficiency.
Approved Australian Horticulture Export Protocol Treatment Facilities1 National Locations of Major Mango Growers2
Phytosanitary Matrix
Treatment
Onshore Cold Treatment
Methyl Bromide Fumigation Irradiation Vapour Heat
Treatment (VHT)3
Num
ber o
f Fac
ilitie
s
VIC 15 11 1 0
NSW 2 4 0 0
QLD 1 4 1 4
WA 1 2 0 0
NT 0 0 0 1
Average Capacity of
Specific Treatment
Plant4
Rarely used as the preferred treatment in
Australia due to chill damage, capacity for mangoes is
limited.
Used for numerous crop
by 3PL and freight
forwarders, estimated
capacity 200-600 tonnes per day
per city.
Used for different crops,
locations in Melbourne and Brisbane, and has estimated 1000 tonnes of
capacity per day.
Used on mangoes only, is grower owned
and has estimated daily capacity of 100
tonnes. Major Mango Growers
Darwin
Katherine
Kununurra
Carnarvon
South QLD
Bowen
Mareeba

79
Access (Open or Closed)3
Protocol (restricted
access) Market?3
Phytosanitary Certificate Required?3
Import Permit Required?3
Free Trade Agreement
and Tariffs1,4Fumigation3 Cold2 Irradiation3 Heat (VHT) 3
UK Open No No No No Not a protocol market
Canada Open No Yes No YesCPTPP – 0% Tariff
Not a protocol market
Vietnam Closed No No No No Not a protocol market
Indonesia Open Protocol Yes NoYes
IACEPA – 20% TariffAANZFTA – 25% Tariff
64 grm/m3 at 21 degrees celsius for 2 hours
≤ 2 degrees celsius for 16 days or ≤ 3 degrees celsius
for 20 days 150 gy minimum 46 degrees
celsius for 30min
UAE Open No Yes No No Not a protocol market
Malaysia Open No Yes Yes YesMAFTA – 0% Tariff
Not a protocol market
South Korea Open Protocol Yes NoYes
RCEP – UKAFTA – 3% (0% -
01/01/23)
No No No 47 degrees celsius for 15min
Hong Kong Open No No No YesRCEP, CPTPP – 0% Tariff
Not a protocol market
Singapore Open No No No YesAHKFTA – 0% Tariff
Not a protocol market
New Zealand Open Protocol Yes NoYes
RCEP, CPTPP, PACER< AANZFTA, ANZCERTA –
0% Tariff
No No 289 gy / 400 gy / 500 gy No
Saudi Arabia Open No Yes No No Not a protocol market
The other considered markets are largely open to access, though all have unique export requirements
Phytosanitary Matrix
Note: (1) All FTAs are in relation to mangoes (2) Fruit intended for in-transit cold treatment must be pre-cooled to, or below, the target treatment temperature before loadingSource: (3) Australian Government Department of Agriculture, Water and the Environment, Manual of Importing Country Requirements; (4) DFAT, FTA Portal

80
Mango pulp weevil infested mango2
Quarantine Pest Scientific Name Description1 Treatment / Management
Inte
rnal
Mango seed weevil Sternochetus mangiferae The adult beetle lays eggs within the green mango skin, and the larvae migrate to either the seed or the pulp to develop to mature adults.
IrradiationMango pulp weevil Sternochetus frigidus
Mango malformation disease (MDD)
Fusarium mangiferaeCauses development abnormalities in shoots leading to misshaped buds, short internodes, dwarf & narrow leaves.
Sanitation, sprays, removal of infected flowers and branches
Red-banded mango caterpillar Deanolis sublimbalis
Adult moths lay eggs on the fruit stalk. Once the eggs hatch, the larvae tunnel into the fruit, where they develop to the pupal stage.
Certified systems approach combined with fruit cutting, irradiation
Fruit fliesBactrocera correcta, B. dorsalis, B. zonata, B. carambolae, B. occipitalis
Adult female flies lay eggs within the skin or flesh of the fruit and larvae develop within the fruit. HWT, VHT, irradiation
Ext
ern
al
Mealybugs Rastrococcus invadens, R. spinosus
The mealybug feeds on the tree leaving droppings which make the leaves black, sticky and lowers the tree’s yield.
Fumigation (Methyl bromide)
Scale insects Parlatoria crypta, P. pseudaspidiotus
Insects that suck the cell sap from leaves, twigs and fruits affecting photosynthesis, growth and the crop yield.
Orchard hygiene, quarantine inspection and remediation
Thrips Rhipiphorothrips cruntatusNymphs & the adult feed by rubbing & sucking the sap, dropping faeces onto the surface & leaving a dark rusty stain.
Petroleum Spray Oils (PSOs)
Mangoes being infested by fruit flies for fumigation3
Source: (1) Australian Centre for International Agricultural Research, Analysis of mango markets, trade and strategic research issues in the Asia-Pacific; (2) Lucid Central, Mango pulp weevil image; (3) AWE, Fruit fly infested mangoes
Australian mangoes are susceptible to a range of pests which may impact short and long-term market accessIt is critical for mango farmers in Australia to be prepared to manage the infestation of pests such as fruit flies and mealybugs. Growers must be aware of the potential implications of using different treatments, as certain methods may impact access to markets and sales yields.
Phytosanitary Matrix

81
This report can support industry to understand the technical market access advocacy process
Phytosanitary Matrix
1. Identify the need for a change or improvement in market access
2. Develop datasets and submit application
3. Application Review and Preliminary Assessment
4. Application is submitted to the International Market Access Assessment Panel (IMAAP)
5.Progression by Federal Government
6. Complete negotiations and market access is implemented
7. Maintain market access through protocol compliance
• Industry reviews current state export agenda and identifies opportunities for change
• Industry flags ambitions to penetrate a new export market or expand market share in an existing market
• AMIA accepts the request for consideration and discusses the need with Hort Innovation and/or DAWE
• AMIA gathers supporting production, phytosanitary, R&D, export and other necessary datasets and business case material to develop the application, including evidence as to why Australian mangoes should be granted the access in question.
• Develop and submit market access or market improvement request.
• Application undergoes preliminary assessment with Hort Innovation, who decides whether criteria is met (no prioritisation involved)
• Criteria include alignment with export strategy, business plan, relevant data requirements are met, evidence of industry support for application, and indication that DAWE is the appropriate partner to address the ambition
• Applications which meet criteria undergo significant review and discussion.
• Application is either rejected by the panel, endorsed by the panel, goes into the country pool, or;
• Application goes into a strategic pool where it is supported by the panel however unable to proceed due to technical or other barriers relating to trading partner policies
• Applications in country pool awaits prioritisation by DAWE using an internal process and set of principles and criteria for bilateral negotiation
• Applications may move from the strategic to country pool based on change in trading partner policy
• DAWE raises select applications in bilateral negotiations or may raise applications in bi- or multi-lateral forums with relevant trade Government Department in given export market
• Negotiation time is affected by multiple factors, including number of applications in the pool, phytosanitary measures, risk appetite and reciprocity, resource and expertise availability in both countries.
• Finalise specifics of protocol including treatment and inspection requirements, labelling, and timing of implementation
• Communicate to industry the date by which new allowance and regulations will be effective, and where relevant the staged change in allowance such as a progressive reduction in tariffs or increase in quotas over time.
• Industry deliver exports to market in strict compliance with new market access arrangements
• Industry• AMIA• Hort Innovation
• AMIA• Industry
• Hort Innovation • IMAAP • DAWE • DAWE• AMIA• Industry
• Industry• AMIA
6 months -1 year 6 months -1 year 1-2 months 1-2 months 2 years – 10 years Ongoing Ongoing
Ste
p
Pro
cess
Sta
keh
old
ers
Tim
ing

DRAFT
Appendix C
Industry Capability Assessment

83
Industry Capability Assessment
The capability assessment undertaken in an industry workshop indicated that knowledge varies depending on export experience
Source: (1) Industry workshop
Matrix Criteria Comments
Market Demand PotentialDo we understand the potential demand of key export markets?
• Understand market demand potential for high-quality product, issue is finding market for second grade, bulk product.• Depends on past experience with export – varies across the industry.• Understand demand is there, the problem is stable pricing, supply and quality – understand that importer can’t rely on
opportunist-based trading of products that vary in quality.
Market AccessTo what extent do we understand the processes to expanding new export markets?
• Market access is constantly being reviewed and updated, industry finds it hard to keep across.• Government makes it difficult to comply with current standards – very high margin for error. • Some views that regulations are not written from a practical, on-the ground viewpoint. • The top priority for most industry members is achieving market access via irradiation pathways.
Supply Chain CapabilityHow would you rate our supply chain capability in terms of efficiency and resiliency?
• Depends on respective export agenda/operations.• Due to supply chain disruption exporters are constantly forced to pivot supply chains/freight options all the time, hence
have to maintain a strong degree of resilience.• Do understand operational requirements, whether through support of professional or independently.
Local MarketingTo what degree have we pursued specific market advertising campaigns?
• Marketing campaigns are not often correlated with supply.• International funds for marketing are significantly higher than those of Australian industries, increasing the challenge to
compete.• Australian quality is mangoes’ unique selling point, needs to be emphasised more.• Intel and capability is typically there however ability to market locally at scale is limited by fund availability.
Channel StrategyTo what extent do we understand the different export channel options?
• Lack of industry-wide, collective channel strategy. • Industry needs more greater consistent, scaled production volumes to target select channels effectively, requiring
collaboration or partnerships to manage consistently graded fruit. • Most understand back end requirements of channel strategy however have little understanding on front end supply
chain requirements, particularly last mile logistics.
Consumer PreferenceTo what extent do we understand consumer preferences in export markets?
• Relatively strong understanding of consumer preferences for mangoes depending on market and export experience. • Interested to learn more about markets in which industry currently lacks access.
Seasonality AdvantageTo what degree do we understand our seasonality advantages against key competitors?
• Majority of industry understand the counter-seasonal nature of Australian production compared to the import agendas of most target markets. Industry flagged greater visibility over the seasonality of every major competitor in target markets would be helpful to understand Australia’s specific competitive advantages in a number of markets. .
Degree of CompetitionTo what extent do we understand the global competition landscape? (Who, where, when)
• Competition analysis is needed to inform market entry strategy, including seasonality, variety and pricing considerations.
54321
4
1
3
2
2
3
5
3
The insights below are the key takeaways from discussions of each criteria with industry members during the industry workshop. The below summarises the majority of industry’s views of their overall capabilities.
KEY 5All members are capable/ advantaged in this area
4Most members are capable/ advantaged in this area
3Some members are capable/ advantaged in this area
2Few members are capable/ advantaged in this area
1Close to no members are capable/ advantaged in this area

84
Achieving irradiation market access and establishing in-market relationships are future focus areas for export
Prioritised Markets Key Learnings
Japan
• Consumers have a negative connotation with irradiation, industry lacks awareness of insight into Government’s opinion on the treatment. • Irradiation would increase the security of trade by preserving product quality. • Food service channels for second grade products are underappreciated.• Australia’s stringent food safety regulations serves as a competitive advantage for mangoes.• There is research and development being conducted around hard mature green state protocol, this could expand market entry strategies in medium to long term. • Investment into local VHT facilities in-market is considered a back-up option to market access via irradiation.
USA• The primary issue in increasing exports is achieving continuity and consistency of supply; otherwise Australian mangoes are viewed favourably.• A very short seasonal window provides challenges, particularly logistically, with exporters having issues shortening lead times and preserving product quality. Exporting
Northern Territory varieties in the early season would increase the window of availability. • Industry is experiencing year-on-year growth however air freight channels creates high and in some cases unsustainable input costs.
India
• Acceptance of irradiated products and counter seasonality are valuable opportunities for Australian exports, given irradiates products domestically. • Leveraging effective supply chain channels with short lead times to preserve product quality is industry’s main concern, particularly regarding last-mile logistics. • Industry need a nuanced approach like China, according to the supply chain capabilities, demand and consumer preferences in different tiers of cities.• Doing business in the country is heavily relationship-based; mango exporters have opportunity to learn from other industries such as Queensland citrus.• The market has not yet been research sufficiently to understand mango export opportunities in depth.
Netherlands
• The Netherlands offers professional importers and re-exporters, requiring a targeted and prepared approach supported by sophisticated logistics strategies. • Industry is eager to explore re-export opportunities across the EU. • There is interest in exploring alternative supply channels, particularly the ability to pivot from air freight if new innovations and market access pathways enable shortened
lead times to the region.• Netherlands importers and re-exporters demand scale, continuity and consistency of supply, which will be a challenge for industry. • Retail/supermarkets are very sophisticated throughout the EU, industry needs further market intelligence on the sector. • Australian varieties are already found throughout EU, however awareness is limited on which varieties are grown where, and at what volumes.
China
• One of the highest margin markets available to Australian exporters, however there is a need to build the technical understanding of irradiation through negotiations with Government. While negotiations for improved market access in China are largely stalled, maintaining exporters’ current presence in market until progress is made is still a priority.
• The impact of VHT on product quality and the cost of air freight are the main concerns with current exports. • China importers are known to handle all export considerations according to their own preferences, with virtually no space for negotiations. This includes treatment of
shipments, copyright law, and data integrity. For this reason exporting to the market is relationship- based, requiring a significant degree of trust. • Increasing exports to the market via expanded market access channels remains a significant long-term opportunity.• China’s strong, consistent logistics network may enable potential Direct to Consumers export channels, though China also offers a sophisticated retail market.
Industry Capability Assessment
The workshop also facilitated discussions with industry members around future ambitions and current pain points experienced in exporting or pursuing export to priority markets. These takeaways were extracted from the workshop to represent industry’s collective view, which provides evidence for export opportunities and recommended activities.
Source: (1) Industry workshop

DRAFT
DisclaimerThis report forms part of Project MG21000 – Mango Export Strategy. The overall project is seeking to establish the new industry export strategy that will guide the Australian Mango industry on the ambitions for export growth in the coming years, and the market/activities that are available to achieve this.
This report has been created for Hort Innovation’s internal use to guide Hort Innovation on how to support the industry to achieve the objectives and activities outlined in the export strategy document. These recommendations are based upon insights gathered from the following sources:
• Publicly available data (desktop analysis)
• Stakeholder consultation (growers, a Project Reference Group, and value chain stakeholder perspectives)
A set methodology has been followed to achieve the intended outcomes in the strategy including selection of markets for investigation, research approach and prioritisation of markets.
International trade is an inherently risky operation given the exposure to geopolitical, logistics, customs, labour and climatic variables. The information provided in this report is current as of April 2022. Information has not been independently verified or cross-checked for accuracy. Reliance should not be placed upon data provided in this report, and individuals/organisations are accountable for any decisions made using the information provided.