F ICT F ICT F 1 ( 2552 ) F F F 80 5 2550 F ( 6) F F F 10210 F(02 ...

Naomi-‐Jane Scroggins
Page 1 of 30
International Market Opportunity Proposal Of Brazil and Chile
For
Fisher & Paykel Appliances Limited
Student: Naomi-Jane Scroggins

Naomi-‐Jane Scroggins
Page 2 of 30
Executive Summary
Fisher and Paykel are Australasia’s leading manufacturer of innovative major
appliance products. The company has global manufacturing facilities located in
Mexico, Italy, the US and Thailand.
International growth objectives for the company are directly focused towards
continued growth and protection of Australasian markets whilst also seeking
profitable growth within niche market segments across other countries. Their market
entry strategies include a low-cost entry approach to build niche positions through the
commercial segment in selected cities.
The global economic downturn left Fisher & Paykel seriously exposed with
significant debt after implementing a global manufacturing strategy. Financial goals
were not met for the year ending 2011 with total revenue for the company down by
$83 million.
Brazil and Chile have been identified as candidates for international market expansion
of the Fisher and Paykel Brand. GDP and population differences between both
countries indicate that Brazil has a stronger and larger economy that is 12 times larger
than that of Chile. Brazil and Chile are both politically stable however corruption
appears to be a problem within the existing Brazilian government.
The refrigeration market in Brazil far outweighs that of Chile with Brazil selling
US$6.4 billion worth of refrigeration products in 2011 compared to Chile’s US$255
million. Investment in premium products is expected to grow within Brazil’s
refrigeration sector as middle-class consumers and those in high-income segments
choose to replace their refrigeration appliances with more technologically advanced
products.
Competitive intensity within the Brazilian sector was high with appliance giants
Whirlpool, Brastemp and Consul brands holding 45%, 25% and 20% market share
respectively. Competitive intensity is again high within Chile with CTI, Fensa and
Naomi-‐Jane Scroggins
Page 3 of 30
Mademsa holding 36%, 19% and 17% market share respectively. Refrigeration
products are mainly sold in Brazil through durable goods retailers, hypermarkets and
department stores. In comparison most consumers within Chile purchase refrigeration
goods through department stores only. Both markets have seen an increase in Internet
trading for the purchase of white ware goods.
Imports to Brazil are subject to a number of heavily structured taxes and tariffs when
bringing goods in from overseas. Chile has a free trade agreement with New Zealand
with a flat tariff rate of only 1.9%. In addition, it is cheaper to ship goods to Chile
than to Brazil.
Cultural differences are apparent between New Zealand, Brazil and Chile.
Fisher and Paykel should investigate the possibility of licensing agreements with
Brazilian refrigerator manufacturers to avoid Brazil’s high export/trade barriers. In
order to maximise the highest growth market within Brazil it is suggested that Fisher
and Paykel target the growing middle-class segment. It is also suggested that in
order to penetrate the market effectively, Fisher and Paykel target the middle-class
segment with an affordable alternative such as the Haier brand, to establish a foothold
and grow market share. Customisation of products to adapt to the Brazilian market is
suggested and cultural differences should be considered when tailoring promotional
strategies. Distribution networks should include durable goods retailers,
hypermarkets, and department stores. Pricing strategies should be focused towards
2011’s market average of US$885 per unit.

Naomi-‐Jane Scroggins
Page 4 of 30
Table of Contents
1 Table of Contents 2 Introduction .................................................................................................................... 5 3 Country Analysis ........................................................................................................... 7 4 Macroeconomic Indicators .......................................................................................... 7
4.1 Population, GDP & Economic Landscape .................................................................... 7 4.2 Political Landscape ............................................................................................................ 9 4.3 Culture ............................................................................................................................... 10
5 Microeconomic Indicators ........................................................................................ 12 5.1 Market Sizes ..................................................................................................................... 12 5.2 Growth Potential .............................................................................................................. 14
5.2.1 Brazilian Market Growth Potential .................................................................................... 14 5.2.2 Chilean Market Growth Potential ....................................................................................... 14
5.3 Competitive Intensity ...................................................................................................... 15 5.3.1 Brazilian Competitive Intensity .......................................................................................... 15 5.3.2 Chilean Competitive Intensity ............................................................................................. 17
5.4 Marketing Infrastructure .............................................................................................. 18 5.4.1 Refrigerator Products & Pricing ......................................................................................... 18 5.4.2 Distribution ................................................................................................................................ 19 5.4.3 Buyer Behaviour ...................................................................................................................... 19
5.5 Trade Barriers .................................................................................................................. 20 5.5.1 Brazilian Trade Barriers ........................................................................................................ 20 5.5.2 Chilean Trade Barriers ........................................................................................................... 21
5.6 Transportation ................................................................................................................. 21 5.6.1 Exporting From Thailand ...................................................................................................... 22 5.6.2 Exporting From Mexico ........................................................................................................ 22 5.6.3 Exporting From USA .............................................................................................................. 23 5.6.4 Exporting From Italy .............................................................................................................. 23 5.6.5 Importing To Brazil ................................................................................................................. 24 5.6.6 Importing To Chile .................................................................................................................. 24
5.7 Premium Market Potential ............................................................................................ 25 5.7.1 Brazil Premium Potential ...................................................................................................... 25 5.7.2 Chile Premium Potential ........................................................................................................ 25
6 Brazil & Chile - Country Criteria and Score ....................................................... 26 7 Recommendations ...................................................................................................... 27
7.1 Market Entry Mode ........................................................................................................ 27 7.2 Target Market .................................................................................................................. 27 7.3 Positioning ......................................................................................................................... 28 7.4 Standardisation vs Customisation ............................................................................... 28
References ........................................................................................................................... 29

Naomi-‐Jane Scroggins
Page 5 of 30
2 Introduction
Established in 1934, Fisher and Paykel Appliances Holdings Limited (FPAH) are
New Zealand’s leading brand of major household appliances. The company is the
foremost manufacturer of state-of-the-art innovative household appliances within
Australasia’s refrigerator and cookware categories. The company employs 3,500 staff
worldwide and currently operates in 50 countries including New Zealand, Australia,
Thailand, Singapore, USA, Canada and the UK. Fisher & Paykel’s product lines
include major kitchen appliances such as dishwashers, refrigerators, freezers, ovens,
cooktops and range hoods; the company also specialises in laundry appliances such as
washing machines and clothes dryers (Fisher & Paykel New Zealand Limited, 2012).
The company has widespread global production capacity with manufacturing facilities
located in Mexico, Italy, the US and Thailand (Euromonitor International, 2010).
Current revenues for the year ended 31 March 2012 was $891 million, down 7.6%
compared to the previous year. Current Export earnings for the year ended 31 March
2012 were $715M including Australian, North American, European and other global
markets (Fisher & Paykel, 2012).
The acquision of US manufacturer Dynamic Cooking Systems in 2004 provided F&P
an entry point into the US market, where it has positioned itself as a premium major
appliances brand. In December 2009, the company also successfully launched its
products within Sears, a major US department store chain (Euromonitor International,
2010). F&P’s sale of a 20% stake to Haier effectively provided the company with a
zero-cost entry approach to the Chinese market (Euromonitor International, 2010).
The company has also commenced sales within the Indian sector. The market entry
strategy is to target the specifier, designer and architect community, starting with one
distributor in the Delhi region (Fisher & Paykel, 2012).
As outlined in their 2012 Annual Report (Fisher & Paykel, 2012) the company’s
international growth objectives are directly focused towards continued growth and
protection of their existing home markets in New Zealand and Australia whilst also

Naomi-‐Jane Scroggins
Page 6 of 30
seeking profitable growth within niche market segments across North America and
other countries. The company has identified Chinese and Indian markets as a long-
term growth strategy – with both countries expecting double-digit growth in
appliances sales over the next five years. Their market entry strategies include a low
cost entry approach to build niche positions throughout the commercial segment in
selected cities.
The global economic downturn left Fisher & Paykel seriously exposed with
significant debt after implementing a global manufacturing strategy to support their
international growth objectives. The rising cost of production, a weak NZ dollar and
a slump in demand for Major Appliances as disposable incomes fell, all hit sales.
Following these losses the company has committed to re-aligning it’s manufacturing
strategy firstly to locate production as close as possible to new markets it is seeking to
develop and secondly to relocate manufacturing plants in less expensive labour
markets (Euromonitor International, 2010).
In addition, figures obtained from the F&P Annual Report indicate financial goals
were not met for the year ended 2011, with total revenue for the company down by
$83 million to $1,038 million. More specifically Appliances’ revenue was down
7.6% from $965 million to $891 million (Fisher & Paykel, 2012).
The existing Fisher and Paykel product range is currently targeted towards the
premium niche market segments. In targeting these small high-end market segments
the company is severely limited to maximising growth in the larger “affordable”
appliances market.
In order to meet the company’s international growth objectives Fisher and Paykel has
requested this report to investigate possible growth opportunities within Latin
America, specifically Brazil and Chile. Both countries have been researched based on
their suitability to meet Fisher and Paykel’s international growth objectives whilst
taking into account the company’s constraints in expanding to either of these markets.
In depth analysis and comparison of each market is provided (including macro and
micro level indicators) with final recommendations given on what market is more
attractive and what marketing approach should be undertaken.

Naomi-‐Jane Scroggins
Page 7 of 30
3 Country Analysis
Brazil and Chile have been identified as candidates for international market expansion
for the Fisher and Paykel brand. Both countries are located in Latin America and
have been assessed comparatively based on Fisher and Paykel’s international
marketing objectives and existing operating constraints.
Table 1 Comparative Macro Environment Indicators
Indicators Brazil Chile Population 205.7 million 1 16.8 million 3 GDP (US$) $2.4 billion 2 $248 million 2 GDP (PPP$) $2.2 billion 2 $299 million 2 Inflation % 6.6 1 3.1 3 Unemployment rate % 6.2 1 7.2 3 Per capita annual disposable income $US
$6,789 4 $7,184 5
Political stability Stable 1 Stable 3 Source: 1. (Marketline International, 2012) 2. (Euromonitor International, 2012) 3. (Marketline International, 2012) 4. (Euromonitor International, 2011) 5. (Euromonitor International, 2011)
4 Macroeconomic Indicators
4.1 Population, GDP & Economic Landscape
As shown in Table 1, the GDP and population differences between both countries
indicate that Brazil has a stronger and larger economy. With a population of 205.7
million, Brazil’s economy is 12 times larger than that of Chile and GDP of $2.4
billion far exceeds Chiles $248 million. However, Brazil’s inflation rate of 6.6% is
double that of Chile’s rate at 3.1%.
Due to a tightly regulated economy, Brazil has not been as badly affected as other
countries following the global economic downturn. As shown in Figure 1 Brazil’s
growth rate declined in 2008 reaching 5.8% due to tighter credit conditions and a slow
down in demand for Brazilian exports. GDP contracted by 0.6% in 2009 as a result of
the global economic crisis, however the Brazilian economy recovered strongly and

Naomi-‐Jane Scroggins
Page 8 of 30
grew by 7.5% in 2010. Monetary policy tightening by the Brazilian Central Bank
(BCB) to prevent the economy overheating resulted in a drop in growth of 3.25% in
2011. The government introduced an increase of 14.3% in minimum wages in early
2012 to help boost consumption and stimulate the economy. The Brazilian
government is expected to focus on an expansionary fiscal policy in 2012, supported
by an easing monetary policy and increased lending by the banking system.
According to Marketline forecasts, GDP is expected to grow at a rate of 3.2%
annually in 2012. Fiscal spending ahead of the 2014 presidential elections, the 2014
FIFA World Cup, and the 2016 Summer Olympics may see growth within the
Brazilian economy accelerate at a much faster rate (Marketline International, 2012).
Figure 1 Evolution of the Brazilian economy, 1991 - 2011
Source: (Marketline International, 2012)

Naomi-‐Jane Scroggins
Page 9 of 30
Figure 2 Chile – historical GDP growth, 1991 - 2010
Source: (Marketline International, 2012) As shown in Figure 2 Chile’s GDP grew at an annual rate of about 7% throughout the
1990’s, however this slowed towards the end of the decade as a result of the Asian
financial crisis. In recent years Chile has returned to the high growth rates it saw in
the 1990’s with 2004 and 2005 GDP growing by 6% and 5.6% respectively. Higher
energy prices and lagging consumer demand slowed the Chilean economy in 2006 to
4.3% and high copper prices had a positive effect increasing GDP to 5.1% in 2007.
The impact of the global economic crisis greatly affected Chile with GDP growth
declining to 3.1% in 2008 and the county contracting by 1.7% in 2009. Thorough
economic policies by the Chilean government in 2010 saw the economy bounce back
and grow by over 5.2% (Marketline International, 2012).
4.2 Political Landscape
Brazil is a stable democracy with changeovers between elected governments
predominantly smooth since the end of military rule in 1985. Various corruption
scandals however, have damaged the reputation of some politicians though regulatory

Naomi-‐Jane Scroggins
Page 10 of 30
institutions still remain solid. Despite the number of parliamentary commissions that
have been undertaken to investigate these scandals, those involved have been rarely
punished for their offences. The existing government headed by President Dilma
Roussef has adopted a more pro-Western policy in trade relations, and thus bilateral
ties with the US have significantly improved. Potential instability is a concern within
the Roussef administration due to disagreements with awkward coalition partners,
hindering legislative reforms. The government’s reform agenda for the near future is
not overly ambitious and is predominantly focused towards socioeconomic and
infrastructure improvements (Marketline International, 2012).
Following the end of General Augusto Pinochet’s dictatorship in 1973, Chile is still
recovering politically from the economic and political aftermaths of Pinochet’s rule,
which still continue to haunt the country. In terms of the World Bank’s Worldwide
Governance Indicators, which include voice, accountability and political stability
parameters, Chile far outperforms that of Brazil (Marketline International, 2012).
4.3 Culture
Cultural comparisons between New Zealand, Brazil and Chile have been researched
using Geert Hofstede’s classification scheme to understand the similarities and
differences between these societies.
As discussed by Hofstede, power distance is used to determine the attitude of a
specific culture towards the inequalities amongst society (Hofstede, 2012). New
Zealand scores low on this dimension (22) compared with those of Brazil and Chile
indicating a low hierarchical structure. At 69, Brazil reflects a society that believes
hierarchies should be respected and inequalities amongst people are acceptable, thus
power holders have more benefits than the less powerful in society. Status symbols of
power are crucial in indicating social positions and “communicate” the respect that
should be shown. Chile however, shows a lower score at 63 indicating an
intermediate to high position on this dimension. A hierarchical social structure is
present with status symbols used to emphasise power differences within Chilean
society. Privileges for power holders are common (Hofstede, 2012).

Naomi-‐Jane Scroggins
Page 11 of 30
Figure 3 Hofstede’s Cultural Comparison: New Zealand, Brazil & Chile
Source: (Hofstede, 2012) Individualism is used to determine the degree of interdependence a society maintains
amongst its members (Hofstede, 2012). Individualist societies are focused towards
taking care of themselves or direct family only. Within collectivist societies people
belong to ‘in groups’ that take care each other in exchange for loyalty. New Zealand
with a score of 79 is an individualist culture. Comparatively Brazil and Chile are
collectivist societies with lower scores of 38 and 23 respectively. These scores
indicate that in these countries people from birth onwards are integrated into strong
interconnected groups (especially represented by extended family), which continues
protecting its members in exchange for loyalty (Hofstede, 2012).
Masculinity/Femininity is used to indicate what motivates people. A high score
(masculine) indicates that society is driven by competition, achievement and success.
A low score (feminine) indicates that central values within society are caring for
others and quality of life (Hofstede, 2012). New Zealand scores high on this
dimension at 58 indicating that as a masculine society behaviour in school, work and
play are based on the shared values that people should “strive to be the best they can
be” and that success is important. Brazil has an equidistant score of 49 indicating that
the softer aspects of culture such as levelling with others, consensus, and sympathy
22
79 58
49 69
38 49
76 63
23 23
86
0 10 20 30 40 50 60 70 80 90 100
Dimension Rating
Cultural Dimension
Hofstede's Cultural Comparison: New Zealand, Brazil & Chile
New Zealand
Brazil
Chile

Naomi-‐Jane Scroggins
Page 12 of 30
for the underdog are valued and encouraged. Chilean society scores 23 on MAS
revealing that Chilean men and women are of a feminine character showing a modest
behaviour or attitude to one another. Chileans feel a sense of belonging within their
social groups and place value on approval and warm interpersonal links amongst their
groups. Thus they are more supportive of each other within social networks
(Hofstede, 2012).
Uncertainty avoidance (UAI) is used to measure the extent to which members of a
culture feel threatened by unknown situations and thus have created attitudes and
customs that try to avoid these insecurities (Hofstede, 2012). New Zealand scores 49
on this dimension and is a fairly laid back culture in terms of uncertainty avoidance.
New Zealander’s do not show much emotion, are fairly relaxed and not averse to
taking risks. Subsequently, there is a larger degree of acceptance for new ideas,
innovative products and a willingness to try something new or different. Brazil scores
76 on UAI showing a strong need for rules and legal systems in order to structure
society. Brazilians strive for happy relaxing moments throughout life, especially
spending time with family and friends. Due to this high score Brazilians are very
passionate and emotions are easily shown throughout their body language. Chile
scores very high on UAI and again show a strong need for rules and legal systems in
order to structure society (Hofstede, 2012).
Whilst long-term orientation is the fifth dimension in Hofstede’s cultural analysis, no
comparative data is available for Chile so this has not been given.
5 Microeconomic Indicators
5.1 Market Sizes
As shown in Figure 4, the refrigeration market size in value for Brazil far outweighs
that of Chile with Brazil selling $6.4 billion worth of refrigeration products in 2011
compared to Chile’s $255 million. Refrigeration appliances for Brazil increased by
17% in current value terms and 7% in volume terms for 2011, reaching 7.2 million
units (Figure 5). Comparatively refrigeration appliances for Chile increased by 13%
in current value terms and 10% in volume terms for 2011 reaching 492 thousand units
(Figure 5) (Euromonitor International, 2012).

Naomi-‐Jane Scroggins
Page 13 of 30
Figure 4 Value sales of refrigeration appliances in Brazil & Chile
Source: (Euromonitor International, 2012) Figure 5 Volume sales of refrigeration appliances in Brazil & Chile
Source: Euromonitor International
$2,960 $3,607
$4,581 $4,588
$5,478
$6,418
$164 $171 $178 $170 $226 $255
$-‐
$1,000
$2,000
$3,000
$4,000
$5,000
$6,000
$7,000
2006 2007 2008 2009 2010 2011
Market Sizes Value US$ mn
Year
Sales of Refrigeration Appliances Value US$ mn -‐ 2006 -‐ 2011
Brazil
Chile
4,053 4,597
5,477 6,183
6,765 7,249
358 363 369 400 449 492
-‐
1,000
2,000
3,000
4,000
5,000
6,000
7,000
8,000
2006 2007 2008 2009 2010 2011
Market Sizes Volum
e '000 Units
Year
Sales of Refrigeration Appliances Volume 2006 -‐ 2007
Brazil
Chile

Naomi-‐Jane Scroggins
Page 14 of 30
5.2 Growth Potential
5.2.1 Brazilian Market Growth Potential
The Brazilian government announced a reduction in Industrialised Product Tax (IPI)
beginning December 2011 for some categories within the major appliances sector.
Refrigeration appliances fell into this category, which will benefit from the tax
reduction. Fridges, fridge-freezers and freezers had their IPI reduced from 15% to 5%
until March 2012. It is unknown whether this reduction will be extended into the
foreseeable future (Euromonitor International, 2012).
Investment in premium products is expected to grow in the near future as middle-class
consumers and those in high-income segments choose to replace their existing
refrigeration appliances with more technologically advanced products. This is
predominantly driven by purchasing power and the improvement in payment facilities
at durable goods retailers (Euromonitor International, 2012).
Refrigeration appliances are expected to increase by 41% in constant value terms
from 2011 to 2016. More specifically fridge-freezers are expected to show the
strongest increase, with a CAGR of 9% in constant value terms. This growth in the
purchase of fridge-freezers is expected to increase due to low-income consumers
replacing their old fridges with fridge-freezers (Euromonitor International, 2012).
The Brazilian government is investing in new housing programs such as Minha Casa,
Minha Vida (My House, My Life), which is estimated to build two million homes for
the population. These strategies are expected to have a large impact on the sales of
major appliances, in particular refrigeration appliances, as these are considered
essential for Brazilians when purchasing a new home (Euromonitor International,
2012).
5.2.2 Chilean Market Growth Potential
Refrigeration appliances within the Chilean sector showed a positive volume trend
over the last decade and is expected to see interesting growth over the next five years
Naomi-‐Jane Scroggins
Page 15 of 30
of 5% CAGR in volume terms and 7% CAGR in current value terms, due to price
increases and the sale of higher-priced products (Euromonitor International, 2012).
Chile’s economy is strengthening due to the fact that consumers now have higher
disposable incomes. Unit sales of frost-free and bottom fridge-freezers are expected
to increase due to the better functionalities they offer to the average Chilean consumer
(Euromonitor International, 2012).
Government initiatives to reduce energy consumption are expected to result in a rise
in energy-efficient refrigeration products. This is due to the energy crisis, which has
affected Chile, and consumers are now more responsive towards the positive impact
of investing in energy-efficient appliances. This is expected to be a permanent trend,
as energy shortages are a growing problem for Chile (Euromonitor International,
2012).
Sales of fridge-freezers and electric wine coolers/chillers are expected to show the
highest growth over the next year with volume CAGRs of 5% and 7% respectively.
This is due in part to Chilean consumers choosing to purchase products with higher
quality, profiles and functionality (Euromonitor International, 2012).
5.3 Competitive Intensity
5.3.1 Brazilian Competitive Intensity
According to the latest data from Euromonitor International (Table 1), competitive
intensity amongst the Brazilian refrigeration sector in 2011 was high amongst
appliance giants with Whirlpool holding the largest volume share of 45%. This is due
in part to the company successfully targeting separate segments of the market with its
Brastemp brand aimed at higher-income consumers (25% share) and the Consul brand
targeting the lower-income segment (20% share). Electrolux do Brasil and Mabe
Eletrodomésticos ranked second and third behind Whirlpool with 34% and 17%
volume share respectively (Euromonitor International, 2012).
Mabe Eletrodomésticos has adopted a similar penetration strategy to Whirlpool, by

Naomi-‐Jane Scroggins
Page 16 of 30
discontinuing its Mabe brand in 2011, and concentrating its efforts towards targeting
separate segments with its Dako, Contintental and GE brands. GE is positioned
towards high-income consumers, Continental targets mainly the middle-classes and
Dako is positioned to cater for low-income consumers (Euromonitor International,
2012).
Korean appliance giants LG & Samsung are expected to threaten the market
dominance of both Whirlpool and Electrolux in the near future with both companies
investing in US$115 million (LG) and US$300 million (Samsung) to open new
manufacturing facilities located in the city of Sao Paolo (Euromonitor International,
2012).
In order to differentiate from other competitors within the sector, manufacturers
appear to be investing in technological innovations such as energy-efficiency,
functionality and design (Euromonitor International, 2012).
Table 1 Brand Shares of Refrigeration Appliances 2008-2011 (Brazil) % retail volume Brand Company 2008 2009 2010 2011 Electrolux Electrolux do Brasil SA 30.5 32.4 33.2 33.6 Brastemp Whirlpool S/A 26.2 25.5 24.9 24.5 Consul Whirlpool S/A 20.6 19.8 19.9 20.1 Dako Mabe Eletrodomésticos SA 6.1 6.2 6.4 6.7 Continental Mabe Eletrodomésticos SA - 3.9 3.1 4.0 GE Mabe Eletrodomésticos SA 3.5 3.8 3.6 3.8 Mabe Mabe Eletrodomésticos SA 1.2 2.3 3.0 1.7 Dynasty Full-Fit Indústria Importação e Comércio Ltda 0.3 0.4 0.5 0.6 Tocave Klar Indústria e Comércio de Eletro
Eletrônicos Ltda 0.3 0.4 0.4 0.4
Bosch Mabe Eletrodomésticos SA - 0.8 0.6 0.3 LG LG Electronics de São Paulo Ltda - 0.1 0.1 0.1 Suggar Suggar Electrodomésticos SA - 0.1 0.1 0.1 Continental BSH Continental Eletrodomésticos Ltda 3.4 - - - Bosch BSH Continental Eletrodomésticos Ltda 0.9 - - - Springer Springer Carrier Ltda 0.4 0.3 0.1 - Metalfrio Metalfrio Solutions Ltda 0.2 0.1 - - Brastemp Multibrás SA Eletrodomésticos - - - - Consul Multibrás SA Eletrodomésticos - - - - GE GE Dako SA - - - - Others 6.4 4.0 4.0 4.1 Total 100.0 100.0 100.0 100.0 Source: (Euromonitor International, 2012)

Naomi-‐Jane Scroggins
Page 17 of 30
5.3.2 Chilean Competitive Intensity
As illustrated in Table 2 competitive intensity in 2011 was high amongst the Chilean
refrigeration sector with CTI Cía Tecno Industrial (CTI) holding the largest volume
share at 36% with its Fensa (19%) and Mademsa (17%) brands. This leadership was
followed closely by LG Electronics Chile and Daewoo Electronics Corp holding 17%
and 11% volume share respectively (Euromonitor International, 2012).
CTI’s market dominance was due in part to CTI’s positioning towards high quality at
affordable prices, and its strong presence in static fridge-freezers. In contrast Korean
brands such as LG and Daewoo have positioned themselves as innovative, energy-
efficient and reasonably priced alternatives within the market (Euromonitor
International, 2012).
Samsung showed the fastest growth in 2011 with an increase of 4% market share
following the opening of its own office located in Santiago. CIT, LG and Daewoo
also showed an increase in their shares due to concentrated marketing efforts within
the industry (Euromonitor International, 2012).
Haier entered the market in the second half of 2011 with its wide portfolio of products
offering affordable and innovative alternatives to standard products within the sector.
These interesting alternatives show promise for Haier to be able to compete and
position themselves against leading brands Samsung, Daewoo and LG (Euromonitor
International, 2012).
Although price is still a leading factor within the Chilean refrigerator market, other
aspects such as quality, energy-efficiency, functionality and design are all influencing
consumers’ decision-making. Brands are now observing this trend and are acting
accordingly within certain segments (Euromonitor International, 2012).

Naomi-‐Jane Scroggins
Page 18 of 30
Table 2 Brand Shares of Refrigeration Appliances 2008-2011 (Chile) % retail volume Brand Company 2008 2009 2010 2011 Fensa CTI Cía Tecno Industrial SA 21.7 21.8 19.1 19.4 LG LG Electronics Chile 11.4 16.0 16.5 16.8 Mademsa CTI Cía Tecno Industrial SA 20.7 18.8 16.9 16.5 Daewoo Daewoo Electronics Corp Chile SA 6.6 5.7 10.7 10.9 Samsung Samsung Electronics Chile Ltda - - 9.0 9.4 Mabe Comercial Mabe Chile Ltda 1.7 3.6 6.7 6.4 Whirlpool Whirlpool Chile Ltda 8.7 10.8 5.3 5.4 Frigidaire Electrolux Chile SA 5.4 1.8 5.1 5.2 GE General Electric de Chile SA 4.8 2.9 3.4 2.4 Electrolux Electrolux Chile SA 1.1 2.6 2.4 2.0 Haier Climo Chile SA - - - 1.1 Sindelen Sindelen SA 1.9 2.6 0.2 0.2 Consul Whirlpool Chile Ltda 5.9 8.4 1.2 0.2 Bosch Emasa SA 1.5 0.5 0.2 0.2 Samsung RCL Distribución Ltda 7.0 2.5 - - Albin Trotter Albin Trotter SA 0.1 - - - LG Coelsa SA - - - - Private Label Private Label 0.2 0.2 0.2 0.3 Others 1.2 1.9 2.9 3.7 Total 100.0 100.0 100.0 100.0 Source: (Euromonitor International, 2012)
5.4 Marketing Infrastructure
5.4.1 Refrigerator Products & Pricing Table 3 Market Sizes Retail Selling Price (Brazil & Chile US$)
Refrigeration Appliances 2006 2007 2008 2009 2010 2011 Brazil $730.2 $784.6 $836.3 $742.1 $809.8 $885.4 Chile $459.3 $471.8 $482.3 $426.4 $503.1 $517.0
Source: (Euromonitor International, 2012) Refrigeration products within the Brazilian market include built in refrigeration
appliances, freestanding refrigeration appliances, electric wine coolers/chillers,
freezers, fridge freezers and fridges. The average retail selling price of refrigeration
appliances within the Brazilian sector are provided in the table above. Prices are
given in $US for comparison (Euromonitor International, 2012).
Refrigeration products within the Chilean market include freestanding refrigeration
appliances, electric wine coolers/chillers, freezers, fridge freezers and fridges. The
average retail selling price of refrigeration appliances within the Chilean sector are

Naomi-‐Jane Scroggins
Page 19 of 30
provided in the table above. Prices are given in $US for comparison (Euromonitor
International, 2012).
5.4.2 Distribution
According to research obtained from Euromonitor International (2012), Refrigeration
products throughout Brazil are mainly sold through durable goods retailers, which
accounted for 37% volume share of sales in 2011, this was closely followed by
hypermarkets with 29% volume share and finally department stores with 23% share.
Consumers are also turning to Internet retailing due to the convenience of consumers
comparing prices and payment facilities (Euromonitor International, 2012).
Research obtained from Euromonitor International (2012), indicates that for the year
2011, the main distribution channel for refrigeration appliances throughout Chile was
department stores with almost three out of four purchases made through this channel.
This prevalence to purchase through department stores is due to increased access to
credit, allowing Chilean consumers to buy major appliances. In addition, DIY and
hardware stores are gaining traction within the market due to better pricing and
promotions. Internet trading has also seen major growth due to an increase in trust
and online trade (Euromonitor International, 2012).
5.4.3 Buyer Behaviour
Brazil is experiencing a period of prosperity, due to the decrease in the economic gap
between the rich and the poor. This expanding middle class is allowing more
Brazilians the opportunity to have a stable job and greater remuneration than in the
past. This new middle class is composed of about 94.9 million people and many are
choosing to invest in their homes, increasingly spending on more sophisticated
products including household appliances as many do not possess a microwave, a
decent refrigerator a functioning stove. This consumer has become and will continue
to be the main purchasing consumer in the near future (Euromonitor International,
2012).

Naomi-‐Jane Scroggins
Page 20 of 30
Chilean consumers are optimistic about their financial futures and the direction of
their economy, with consumer confidence at it’s highest in 2 years. Most Chileans
choose to shop in malls and 97% of big-ticket items are brought in retail stores. In
general, Chileans go to more than one store to compare prices and those consumers
who are computer savvy generally undertake Internet browsing. Online shopping has
seen a boom with per capita online spending increasing from CLP$7,400 to
CLP$23,000 in 2011. A study by the University of Chile undertaken in 2011 revealed
that 51% of Internet buyers choose to buy online because prices are more competitive
(Euromonitor International, 2012).
5.5 Trade Barriers
5.5.1 Brazilian Trade Barriers
Imports to Brazil are subject to a number of heavily structured taxes and tariffs when
bringing in goods from overseas. These fees, which are usually paid during customs
clearance and account for the bulk of import costs, include Import Duty (II),
Industrialised Product Tax (IPI) and Merchandise and Service Circulation Tax
(ICMS). There are also a number of smaller taxes and fees that should be accounted
for. The Import Duty (II) tax is required under government law and ranges from 10%
to 35%, levied on a CIF (Cost, Insurance and Freight) basis (New Zealand Trade &
Enterprise, 2011).
Brazil is included in the Mercosur partners trade agreement including Argentina,
Paraguay and Uruguay. The Mercosur Common External Tarrif (CET) maintains a
separate exemption list of items for tariffs, allowing free trade between member
countries (New Zealand Trade & Enterprise, 2011).
The Brazilian government however, announced a reduction in the Industrialised
Product Tax (IPI) following weak GDP in 2010. This reduction included specific
categories, including refrigeration products in the major appliances sector.
Refrigerators, fridge-freezers and freezers had their IPI reduced from 15% to 5% until
March 2012. It is unclear whether this initiative would be extended into the
foreseeable future (Euromonitor International, 2012).

Naomi-‐Jane Scroggins
Page 21 of 30
5.5.2 Chilean Trade Barriers
Exporting products to Chile are subject to relatively low import barriers and most
goods imported from New Zealand enter Chile duty free. The country utilises the
Harmonised System for tariffs and has a flat uniform rate of 6%, although New
Zealand has a free-trade agreement with Chile, lowering the effective rate to 1.9%
(New Zealand Trade & Enterprise, 2011).
In November, 2006 New Zealand, Singapore, Brunei and Chile signed the Trans-
Pacific Partnership Agreement (TPP). This multilateral free-trade agreement aims to
integrate the economies of the Asia-Pacific region. Five additional countries,
including Australia, Malaysia, Peru, United States and Vietnam, are currently
negotiating to join the group (New Zealand Trade & Enterprise, 2011).
The majority of imports can enter Chile free from controls, however there is a
document called the Informe de Importacion that is required for all goods entering the
country. An import registration tax of 3% applies based on the cost, insurance and
freight (CIF) value of imports and is paid at the issue of the Informe de Importacion.
The tax value is deducted from the import duty payment on the import of goods as
they enter the country (New Zealand Trade & Enterprise, 2011).
All imported goods are required to pay a Value Added Tax (VAT) rate of 19%
calculated on the CIF value of the good. It should be noted that importers can
generally recover taxes paid in imports and in some cases can defer payment of duties
and VAT for up to five years (New Zealand Trade & Enterprise, 2011).
5.6 Transportation
Fisher and Paykel Appliances Limited has numerous manufacturing facilities located
in Thailand, Mexico the US and Italy. The cost to export a standard container of
goods from these locations has been provided below in US$.

Naomi-‐Jane Scroggins
Page 22 of 30
5.6.1 Exporting From Thailand
Thailand ranks 17 in the ranking of 183 economies on the ease of trading across
borders globally. In order to export a standard 20-foot container of goods by ocean
from Thailand requires 5 documents including certificate of origin, customs export
declaration, commercial invoice, terminal handling receipts and bill of lading. Total
export clearance procedures takes 14 days and costs US$625 (The World Bank,
2012). These export procedure costs are broken down and provided in Table 4 below.
Table 4 Procedures & Costs – Exports from Thailand Procedures to Export Time (days) Cost (US$) Documents preparation 8 $290 Customs clearance and technical control 1 $50 Ports and terminal handling 3 $85 Inland transportation and handling 2 $200 Totals 14 $625 Source: (The World Bank, 2012)
5.6.2 Exporting From Mexico
Mexico ranks 59 in the ranking of 183 economies on the ease of trading across
borders globally. In order to export a standard 20-foot container of goods by ocean
from Mexico requires 5 documents including bill of lading, customs export
declaration, commercial invoice, certificate of origin and packing list. Total export
clearance procedures takes 12 days and costs $US1450 (The World Bank, 2012).
These export procedure costs are broken down and provided in Table 5 below.
Table 5 Procedures & Costs – Exports from Mexico Procedures to Export Time (days) Cost (US$) Documents preparation 6 $200 Customs clearance and technical control 2 $150 Ports and terminal handling 2 $200 Inland transportation and handling 2 $900 Totals 12 $1450 Source: (The World Bank, 2012)

Naomi-‐Jane Scroggins
Page 23 of 30
5.6.3 Exporting From USA
The United States ranks 20 in the ranking of 183 economies on the ease of trading
across borders globally. In order to export a standard 20-foot container of goods by
ocean from the United States requires 5 documents including bill of lading, certificate
of origin, commercial invoice and customs export declaration. Total export clearance
procedures takes 6 days and costs $US1050 (The World Bank, 2012). These export
procedure costs are broken down and provided in Table 6 below.
Table 6 Procedures & Costs – Exports from USA Procedures to Export Time (days) Cost (US$) Documents preparation 2 $190 Customs clearance and technical control 1 $60 Ports and terminal handling 2 $400 Inland transportation and handling 1 $400 Totals 6 $1050 Source: (The World Bank, 2012)
5.6.4 Exporting From Italy
Italy ranks 63 in the ranking of 183 economies on the ease of trading across borders
globally. In order to export a standard 20-foot container of goods by ocean from Italy
requires 4 documents including bill of lading, customs export declaration, commercial
invoice and technical standard/health certificate. Total export clearance procedures
takes 20 days and costs $US1245 (The World Bank, 2012). These export procedure
costs are broken down and provided in Table 7 below.
Table 7 Procedures & Costs – Exports from Italy Procedures to Export Time (days) Cost (US$) Documents preparation 10 $220 Customs clearance and technical control 3 $155 Ports and terminal handling 3 $345 Inland transportation and handling 4 $525 Totals 6 $1245 Source: (The World Bank, 2012)
Naomi-‐Jane Scroggins
Page 24 of 30
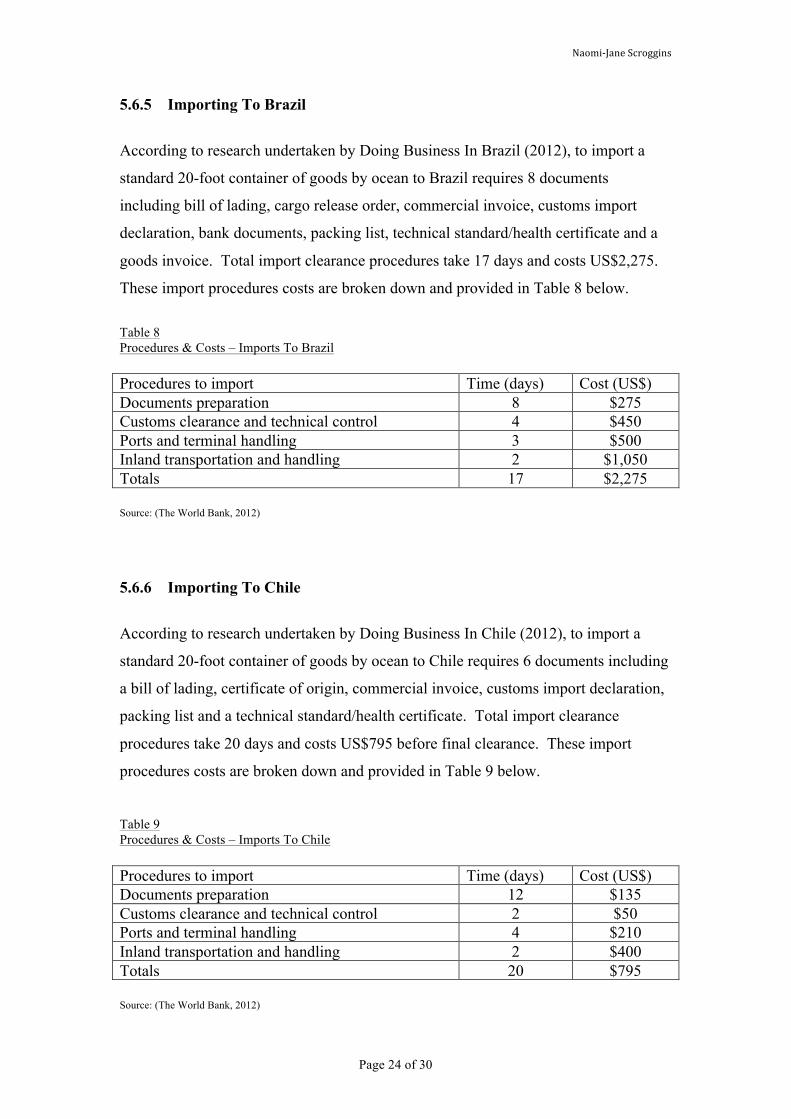
5.6.5 Importing To Brazil
According to research undertaken by Doing Business In Brazil (2012), to import a
standard 20-foot container of goods by ocean to Brazil requires 8 documents
including bill of lading, cargo release order, commercial invoice, customs import
declaration, bank documents, packing list, technical standard/health certificate and a
goods invoice. Total import clearance procedures take 17 days and costs US$2,275.
These import procedures costs are broken down and provided in Table 8 below.
Table 8 Procedures & Costs – Imports To Brazil Procedures to import Time (days) Cost (US$) Documents preparation 8 $275 Customs clearance and technical control 4 $450 Ports and terminal handling 3 $500 Inland transportation and handling 2 $1,050 Totals 17 $2,275 Source: (The World Bank, 2012)
5.6.6 Importing To Chile
According to research undertaken by Doing Business In Chile (2012), to import a
standard 20-foot container of goods by ocean to Chile requires 6 documents including
a bill of lading, certificate of origin, commercial invoice, customs import declaration,
packing list and a technical standard/health certificate. Total import clearance
procedures take 20 days and costs US$795 before final clearance. These import
procedures costs are broken down and provided in Table 9 below.
Table 9 Procedures & Costs – Imports To Chile Procedures to import Time (days) Cost (US$) Documents preparation 12 $135 Customs clearance and technical control 2 $50 Ports and terminal handling 4 $210 Inland transportation and handling 2 $400 Totals 20 $795 Source: (The World Bank, 2012)

Naomi-‐Jane Scroggins
Page 25 of 30
5.7 Premium Market Potential
5.7.1 Brazil Premium Potential
Due to increased purchasing power amongst Brazil’s middle-class, consumers are
now purchasing more value-added products within the refrigeration sector such as
stainless steel and personalised colours. The activities by Korean giants Samsung and
LG to open new manufacturing facilities in order to assemble more higher value
products, shows a significant growing trend towards this market. There is a growing
trend towards luxury products such as electric wine coolers/chillers fuelled by the
growing sales of wine in Brazil (Euromonitor International, 2012).
5.7.2 Chile Premium Potential
Data obtained from Euromonitor International suggests that more consumers are
beginning to demand premium products within the refrigeration sector. A study from
McCann Erickson shows that 54% of Chileans are wishing to choose energy-efficient
refrigeration products at a higher price than standard products within the market.
Although mid-priced double door fridge freezers currently hold 94% of the market,
they are slowly losing share to more expensive and innovative models. There is also a
growing trend towards the purchase of luxury refrigeration products such as electric
wine coolers/chillers (Euromonitor International, 2012).

Naomi-‐Jane Scroggins
Page 26 of 30
6 Brazil & Chile - Country Criteria and Score Table 10 Country Criteria and Score Analysis Brazil Chile Criteria Factor
Weight R A R A
Market Growth (10 = high growth potential)
20.00% 8.00 1.60 6.00 1.20
Hofstede’s Culture Score 5.00% 5.00 0.25 3.00 0.60 Distributors 10.00% 8.00 0.80 7.00 0.70 Market Size – GDP (1 = smallest)
20.00% 8.00 1.60 2.00 0.40
Competitive Intensity (1 = strong)
10.00% 1.00 0.10 4.00 0.40
Trade Barriers (1 = high)
20.00% 1.00 0.20 7.00 1.40
High-End Market Potential (10 = high niche potential)
15.00% 6.00 0.90 4.00 0.60
Total 100.00% 5.45 5.30

Naomi-‐Jane Scroggins
Page 27 of 30
7 Recommendations
Based on the research obtained and comparisons made against the export markets
discussed in this report; in order to meet Fisher & Paykel’s international growth
objectives it is suggested that the most appropriate country for market entry is Brazil.
Although weighted scores on the comparison table were relatively close, the Brazilian
market has been chosen due to its higher score, larger market, and its growth
opportunities.
7.1 Market Entry Mode
With Fisher and Paykel’s strategy towards a low cost entry approach it is suggested
that the company should investigate the possibility of licensing agreements with
Brazilian refrigerator manufacturers to avoid Brazil’s high trade barriers.
Alternatively, should Fisher and Paykel wish to import goods to Brazil from its
manufacturing facilities located overseas, it is suggested that these are shipped from
it’s Thai manufacturing facility due to the low export costs from this location.
However, there are limitations within this report, such as the ability to obtain full
shipping costs from each of these locations. It is advised that full costs are obtained
for comparison to confirm that shipping from Thailand is the most cost-effective
route. With the market growth potential available in Brazil, the costs to import are far
outweighed by this opportunity.
7.2 Target Market
In order to maximise the highest growth market within Brazil it is suggested that
Fisher and Paykel target the growing middle-class segment. This market has the
potential to demand more premium product availability as consumers within this
segment choose to invest in their homes.

Naomi-‐Jane Scroggins
Page 28 of 30
7.3 Positioning
Many consumers within the growing middle-class segment may still be demanding
premium products at an affordable price. It is suggested that in order to penetrate the
market, Fisher and Paykel target this segment with an affordable alternative such as
the Haier brand, to establish a foothold and grow market share. Future strategies
could involve the introduction of Fisher and Paykel branded products with value-
added innovative technology positioned towards the high-cost premium segment.
7.4 Standardisation vs Customisation
In order to penetrate the Brazilian market effectively it is suggested that further
research be undertaken to determine the exact requirements Brazilian consumers
demand, with regards to buying a refrigerator. Although there is a growing trend
towards premium products, value-added alternatives may differ in functionality and
design to those products that are already manufactured by the Fisher and Paykel
brand. Customisation of products to adapt to the Brazilian market is therefore
suggested.
Due to the cultural differences between New Zealand and Brazil it is suggested that
marketing programs are customised to suit the Brazilian market. Brazil is a
collectivist culture therefore products many not diffuse as quickly through the market
than programs adapted for New Zealand’s individualist society. To overcome
Brazil’s high uncertainty avoidance, Fisher and Paykel should offer tactics to
encourage Brazilians to try their products. This could include the use of opinion
leaders within Brazilian society and the use of extended warranty periods on the
purchase of Fisher and Paykel branded refrigerators.
It is advised that products are distributed through the use of durable goods retailers,
hypermarkets and department store channels. Internet retailing should also be
considered due to the growing trend towards this alternative. Pricing strategies should
be focused and targeted towards 2011’s average RSP of US$885.

Naomi-‐Jane Scroggins
Page 29 of 30
References Euromonitor International. (2010). Fisher & Paykel Industries Ltd in Consumer Appliances: World. London: Euromonitor International. Euromonitor International. (2011). Income & Expenditure: Brazil. London: Euromonitor International. Euromonitor International. (2011). Income & Expenditure: Chile. London: Euromonitor International. Euromonitor International. (2012). Market Sizes: Brazil & Chile. London: Euromonitor International. Euromonitor International. (2012). Refrigeration Appliances In Brazil. London: Euromonitor International. Euromonitor International. (2012). Refrigeration Appliances In Chile. London: Euromonitor 2012. Fisher & Paykel. (2012, March 31). Annual Reports. Retrieved August 6, 2012, from Fisher & Paykel: http://www.fisherpaykel.co.nz/global/investors/reports.cfm Fisher & Paykel New Zealand Limited. (2012, August 28). Who We Are. Retrieved August 28, 2012, from Fisher & Paykel: http://www.fisherpaykel.co.nz/global/company/who_we_are.cfm Hofstede, G. (2012, September 11). National Culture: Countries. Retrieved September 11, 2012, from Geert Hofstede: http://geert- hofstede.com/countries.html New Zealand Trade & Enterprise. (2011). Exporter Guide Brazil: Country Profile. New Zealand Trade & Enterprise. New Zealand Trade & Enterprise. (2011). Exporter Guide Chile: Country Brief. New Zealand Trade & Enterprise. Marketline International. (2012). Brazil In Depth Pestle Analysis. London: Marketline International. Marketline International. (2012). Chile In Depth Pestle Analysis. London: Marketline International. The World Bank. (2012). Doing Business In Brazil. Washington DC: The World Bank. The World Bank. (2012). Doing Business In Chile. Washington DC: The World Bank.

Naomi-‐Jane Scroggins
Page 30 of 30
The World Bank. (2012). Doing Business In Italy. Washington DC: The World Bank. The World Bank. (2012). Doing Business In Mexico. Washington, DC: The World Bank. The World Bank. (2012). Doing Business In Thailand. Washington DC: The World Bank. The World Bank. (2012). Doing Business in The USA. Washington DC: The World Bank.
Copyright © 2022 FDOKUMEN