The Opportunity Myth (PDF) - TNTP
68
-
Upload
khangminh22 -
Category
Documents
-
view
3 -
download
0
Transcript of The Opportunity Myth (PDF) - TNTP


01 | MEET ISAAC
04 | INTRODUCTION
07 | METHODOLOGY
09 | THE OPPORTUNITY SEEKERS
20 | DIFFERENT RESOURCES, DIFFERENT RESULTS
28 | THE WEIGHT OF WASTED TIME
43 | CHOOSING THE OPPORTUNITY GAP
54 | CONCLUSION
56 | RECOMMENDATIONS


“I’m willing to take any chance
in my life for this dream.”
–Isaac, 11th grade
When Isaac1 walks across the stage to collect
his high school diploma, with his family cheering
him on, it will not be an accomplishment he takes
for granted.
There was a time when it looked like it might
not happen. He’d struggled during his freshman
year, including experiencing a period of
homelessness, and had encountered adults in
school who undermined his belief in himself—
some quite explicitly.
“There were many people telling me I couldn’t
make it,” says Isaac, who attends a small public
high school. “I stopped going to school. I’d sign
in and leave.” Eventually, his guidance counselor
told him he wasn’t on track to graduate with
his class.
He found himself contemplating the pain he
would cause his family if he didn’t earn that
diploma. “It hurt. I was looking at myself like,
if my brothers can do this, why can’t I?
If my mom can do this, why can’t I?”
Isaac was also struck by the realization that
his lifelong aspiration—becoming a registered
nurse—might slip out of reach. For Isaac, it
was a goal to which he was deeply committed.
“I can’t give up on a dream that I’ve always had
since I was a little boy. I’m willing to take any
chance in my life for this dream.”
After taking on extra credit, staying late,
writing essays—“whatever it takes”—he got
himself back on track to graduate.
Despite his early struggles, Isaac invested
deeply in school. He did everything he was
supposed to do to reach his goals.
But has school held up its end of the deal?
01T
HE
OP
PO
RT
UN
ITY
MY
TH
TH
E O
PP
OR
TU
NIT
Y M
YT
H It’s a question that has to be asked because for too many
students today, the answer is no. While more students than
ever before are enrolling in college,2 far fewer are succeeding
once they get there. Nationwide, 40 percent of college students
(including 66 percent of Black college students and 53 percent
of Latinx3 college students) take at least one remedial course,4
where they spend time and money learning skills they were told
they’d already mastered in high school. A recent study found
that college remediation costs students and their families
$1.5 billion annually, with one in four students spending an average
of $3,000 extra to earn their degrees—and since first-time
bachelor’s degree candidates who take a single remedial course
are 74 percent more likely to drop out, many of these students
are sinking dollars into degrees they’ll never see.5 Graduates
who opt for a career straight out of high school aren’t faring
much better, with many employers reporting that high school
graduates enter their roles missing the skills they need to do
their jobs well.6
In other words, Isaac and millions of students across the country
are working hard to get through school, only to find themselves
ill-prepared to live the lives they hope for. They’re planning
their futures on the belief that doing well in school creates
opportunities—that showing up, doing the work, and meeting
their teachers’ expectations will prepare them for what’s next.
They believe that for good reason: We’ve been telling them so.
02

TH
E O
PP
OR
TU
NIT
Y M
YT
H
UNFORTUNATELY, IT’S A MYTH.
03
TH
E O
PP
OR
TU
NIT
Y M
YT
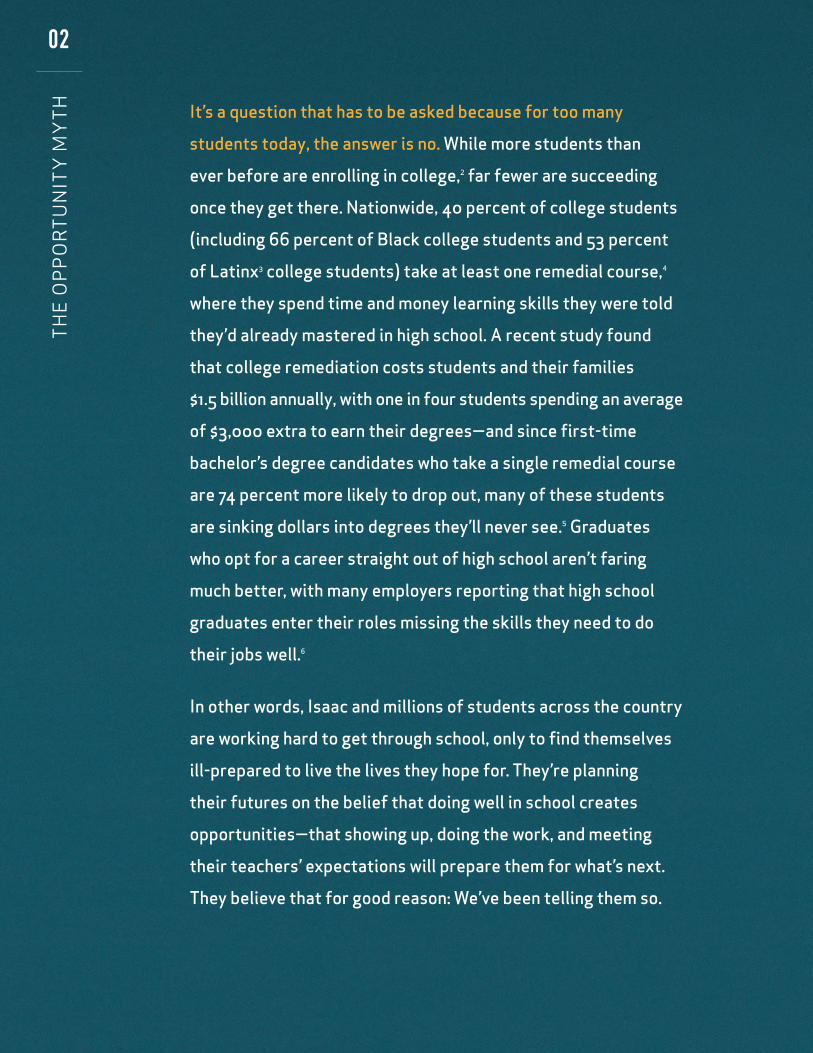
H How can so many students be graduating from high school unprepared to meet their goals for college and careers?
Three years ago, we set out to answer that question.
We suspected that we could gain a better understanding
of students’ daily experiences by observing those
experiences in action, looking closely at the work students
were doing, and most importantly, by asking students
directly. We hypothesized that a clearer picture of
students’ daily experiences could point the way toward
changes to policy and practice that would bridge the gap
between what students need and what they’re getting
every day in their classrooms.
We partnered with five diverse school systems, rural and
urban, district and charter, to listen to students’ views
on their educational experiences and observe how those
experiences played out, in real time, in their classrooms.
While “student experiences” include many things within
and outside school, we chose to focus on a set of in-school
elements that offered a window into what students were
doing in their classes and how they perceived that time.
Above all, we wanted to understand students’ aspirations
for themselves, what kind of lives they wanted to lead,
and how school was preparing them to live those lives—
or letting them down.
HERE’S WHAT WE FOUND:
Students have big, clear plans. They want to be doctors and lawyers, teachers, artists,
and athletes. Ninety-four percent of students we surveyed
aspire to attend college, and 70 percent of high schoolers
have career goals that require at least a college degree.
Most students do what they’re asked in school— but are still not ready to succeed after school. In the nearly 1,000 lessons we observed, students were
working on activities related to class 88 percent of the time.
They met the demands of their assignments 71 percent of
the time, and more than half brought home As and Bs. Yet
students only demonstrated mastery of grade-level standards
on their assignments—a benchmark for being on track for
the lives most of them want as adults—17 percent of the
time. That gap exists because so few assignments actually
gave students a chance to demonstrate grade-level mastery.
Students spend most of their time in school without access to four key resources: grade-appropriate assignments, strong instruction, deep engagement, and teachers who hold high expectations. Students spent more than 500 hours per school year on
assignments that weren’t appropriate for their grade and
with instruction that didn’t ask enough of them—the
equivalent of six months of wasted class time in each
core subject. And students reported that their school
experiences were engaging just 55 percent of the time
overall (among high schoolers, only 42 percent of the
time). Underlying these weak experiences were low
expectations: We found that while more than 80 percent
of teachers supported standards for college readiness
in theory, less than half had the expectation that their
students could reach that bar.
Students of color, those from low-income families, English language learners, and students with mild to moderate disabilities have even less access to these resources than their peers. For example, classrooms that served predominantly students
from higher-income backgrounds spent twice as much
time on grade-appropriate assignments and five times as
much time with strong instruction, compared to classrooms
with predominantly students from low-income backgrounds.
When students who started
the year behind grade level had
access to stronger instruction,
they closed gaps with their
peers by six months.
INTRODUCTION04

TH
E O
PP
OR
TU
NIT
Y M
YT
H
Greater access to the four resources can and does improve student achievement—particularly for students who start the school year behind.When students did have the chance to work on content
that was appropriate for their grade, they rose to the
occasion more often than not. Those chances paid
off: In classrooms where students had greater access to
grade-appropriate assignments, they gained nearly two
months of additional learning compared to their peers.
Classrooms with higher levels of engagement gained
about two-and-a-half months of learning. In classrooms
where teachers held higher expectations, students gained
more than four months. The relationships between the
resources and student outcomes were even stronger in
classrooms where students started the year off behind.
When students who started the year behind grade level
had access to stronger instruction, for example, they
closed gaps with their peers by six months; in classrooms
with more grade-appropriate assignments, those gaps
closed by more than seven months.
In short, students and their families have been deeply
misled. We talk about school as a series of small
opportunities for students—to show up, work hard, earn
good grades—that add up to much bigger ones later in
life. When students don’t find the opportunities they were
promised on the other side of the graduation stage, we
assume they or their families must have done something to
blow their big chance, or that they were simply reaching
too high.
Yet we found classroom after classroom filled with A and
B students whose big goals for their lives were slipping
further away each day, unbeknownst to them and their
families—not because they couldn’t learn what they
needed to reach them, but because they were rarely
given a real chance to try.
That’s the opportunity myth. It means that at every grade
level, in every district, for students of every demographic
background, school is not honoring their aspirations or
setting them up for success—in their next grade, in college,
and in whatever they want to do down the road. This
has a cumulative effect, particularly for the students who
receive the very least of what our schools have to offer.
Let’s be clear: Teachers alone are not responsible for
this myth—either creating it or fixing it. In many ways,
teachers too have been subject to a false promise. Their
time has been wasted on expensive and lengthy teacher
preparation programs that don’t prepare them for the
realities of the classroom7 and development opportunities
that don’t help them improve;8 on having to sift through
far too many mediocre materials;9 with guidance that pulls
them in a thousand directions but doesn’t help them do
their jobs well—all while being undervalued and under-
compensated. While they make many individual decisions
in their classrooms, those choices are often dictated by the
incentives of the system they work within.
At every level of the education sector, from classrooms
to statehouses, from schools of education to nonprofit
offices, adults make daily choices that perpetuate a cycle
of inequity and mediocrity in our schools. Consciously
or not, we choose to let many students do work that’s
far below their grade level. We choose to leave teachers
without the skills and support they need to give all their
students access to high-quality academic experiences.
We choose to act on assumptions about what students
want and need out of school, without really listening to
them and their families. We choose, in essence, which
students are more deserving of reaching their goals.
Yet our research also makes clear that gaps in students’
school experiences and outcomes are not inevitable.
We could make different choices—choices that could
make a real difference in the short term, without an
infusion of new funding, as well as those that will lay the
groundwork for deeper structural change. These are the
kinds of choices that could make the difference between
students like Isaac becoming a nurse, or leaving that
dream unfulfilled. We could choose, in other words,
to upend the opportunity myth.
We wanted to understand how.
05

We observed nearly lessons1,000
We partnered with diverse school systemsFIVE
We reviewed nearly assignments5,000
We analyzed more than student work samples20,000
We collected nearly real-time student surveys30,000
TH
E O
PP
OR
TU
NIT
Y M
YT
H06

We reviewed nearly assignments
More than 50 million children each spend roughly
1,200 hours every year in public school classrooms in
this country.10 Over the course of their K-12 careers,
that amounts to more than 15,000 hours in the lives of
each child. During those hours, adults have nearly all the
power. They decide everything from what work goes in
front of students to how they spend their time; from what
their classrooms and school buildings look and feel like to
what tests they need to pass and what courses they need
to graduate. Ultimately, those choices determine how
well-equipped students are to meet the goals they set for
themselves when they leave school.
But these decisions are rarely based on concrete information
about how students actually experience school—because
those of us in and out of schools who consider ourselves
education “experts” rarely bother to ask. Instead, the
crucial work of getting students the education they need
and deserve is built on a lot of guessing, based on adults’
experiences and implicit biases: guessing at what kids want
out of their lives; what kind of content and instruction
will engage them deeply and therefore allow them to
learn; what factors truly influence academic outcomes.
Filling our collective information gap about what students
really think and feel is an essential piece of helping more
students succeed. We have to stop guessing and inform
our decisions—on everything from teacher training to
curriculum to resource allocation—with input from students
and clearer information about their daily experiences.
That’s what we set out to do in this study. In our work
in schools and districts across the country, we’d seen so
many dedicated educators working hard, often in deeply
challenging conditions, to give students what they need and
deserve. Yet in many of these same classrooms, we observed
lessons that weren’t nearly challenging or engaging enough
to prepare students for academic or professional success
after high school. We didn’t know how to help our partners
address these issues because the solutions weren’t clear to
us, either. We wondered if we could improve the support
we provided to schools and districts if we ourselves had
a better grasp on the student experience. We came to the
conclusion that the only way to do that was to look closely
at what students were doing in school every day, and ask
students themselves how they perceive it.
METHODOLOGY
In our research, we’ve used academic standards
for college and career readiness as an important
bar against which we assessed assignments and
classroom practices.
We believe that bar is the right one because it
defines what students should be able to do at each
grade level. Standards are not curriculum: They do
not, for example, identify an explicit set of texts
students must read, or tell teachers how to help
students master the target skills. Instead, they seek
to clarify the thinking and problem-solving abilities
students need in order to be ready—by the end of
their K-12 careers—for the expectations of college-
level work. Since the vast majority of students told us
they aspired to attend college, that bar matters:
It is the very one students themselves have defined.
TH
E O
PP
OR
TU
NIT
Y M
YT
H
ARE “COLLEGE-READY STANDARDS” THE RIGHT BAR?
07

For our complete methodology, including further explanation of our analytical approaches and full analysis results, see the Technical Appendix at tntp.org/opportunitymythFor our complete methodology, including further explanation of our analytical approaches and full analysis results, see the Technical Appendix at tntp.org/opportunitymyth
TH
E O
PP
OR
TU
NIT
Y M
YT
H To do this, we collected nearly 30,000 in-the-moment
student surveys. Using a technology that prompted
students in grades six through 12 to answer a few
questions at random times during class, we captured a
snapshot of their real-time reactions to school. We also
surveyed third through fifth graders during the last five
minutes of class, and found that elementary students were
just as capable as their older schoolmates of providing
rich and telling insight into their lives at school.
Across our five partner school systems, we also observed
nearly a thousand full-length lessons at all grade levels from
K-12, and reviewed almost 5,000 assignments and more
than 20,000 individual student work samples. We visited
each participating school daily for a week straight at
three points in the year, which gave us the chance to see
the same teachers and students at the beginning, middle,
and end of their time together (and offered a much more
comprehensive lens on the learning environment than a
single day’s lesson could have). These classrooms were not
substantially different than the others in their districts, and
they represented a wide range: those with new teachers and
veterans; those at all age levels; a diverse range of subjects;
mixed-ability classes and tracked ones. Four of these school
systems were located in states that use standards aligned
to the Common Core State Standards; one was not.
To assess the quality of content students worked on, we
looked at four elements of every assignment: (1) whether
the content in the assignments was aligned to relevant
grade-level academic standards; (2) whether the assignments
gave students the chance to engage in important content-
specific practices, like citing evidence from rigorous texts
in literacy, or discussing mathematical ideas using precise
mathematical language; (3) whether the assignments gave
students a chance to learn relevant content that built their
knowledge of the world or helped them see how what they
were learning could be applied in the real world; and (4)
student performance on both the assignments themselves
and against the bar for their grade-level standards.
To study instruction, we observed full-length class periods
and assessed (1) whether students were doing what they
were asked; (2) whether they were being asked to work on
grade-level content; and (3) whether teachers were using
instructional practices that gave students the chance to do
most of the thinking in the lesson.
We surveyed teachers to capture their knowledge of
grade-level standards, their opinions on those standards,
and their beliefs about their classroom practices and their
students’ abilities. We conducted focus groups with nearly
100 teachers and interviewed 24 school leaders at multiple
times throughout the year. And we assessed a large set
of extant data provided to us by our partner districts on
course access, enrollment policies, and district policies
on curriculum adoption, among others.
We hypothesized that students’ experiences of school were
influenced by a confluence of factors—among them, the
quality of the work they were doing, the instruction they
received, and the expectations of their teachers—and that
those factors would interact to have an impact on their
academic growth. Taken together with students’ in-the-
moment survey responses, we were able to triangulate
students’ perspectives with the classes they were in, the
work they were doing and instruction they were receiving,
and their academic outcomes.
In addition to amassing this rich data set, we also sat down
with a smaller subset of students (more than 50 over two
school years), and got to know them. We observed them
in class and spoke to them about their experiences, their
likes and dislikes, their families, their goals. Just a few of
those students are profiled here. While their names and
identifying characteristics have been changed throughout
this report, their stories help us understand what the data
means in the real lives of individual young people.
They also help us understand what real, tangible
changes school systems can make—starting tomorrow
and over the long haul—to provide more students with
school experiences that are meaningful, that honor their
aspirations for themselves and their families, and that
give them a fighting chance to meet those goals.
08

09


TH
E O
PP
OR
TU
NIT
Y M
YT
H11
“My parents came here to America for my education. It’s very
important for me,” says Hajima. She chose her high school specifically
to meet her career goals. “I came here because of the new medical
program and what they had to offer me.”
She’s part of a specialized medical careers track, intended to prepare
students to work immediately after high school in a hospital setting
while simultaneously earning college credit.
Hajima intends to be the first person in her family to go to college.
Her family came to the United States as refugees in 2005. Her older
siblings struggled academically in America, in part, Hajima explains,
because of the language barrier. But she was younger when the family
resettled, and adjusted well. She enjoyed school. Her father wants her
to go to college so she can avoid the kind of suffering he’s experienced
working in a local factory.
That’s her plan, too. “I’m hoping to be a neurologist.”
“I’m hoping to be a neurologist.”
–Hajima, 12th grade


TH
E O
PP
OR
TU
NIT
Y M
YT
H
School hasn’t been the kindest place to Raymond in his 11 years:
He’s been suspended multiple times already, he tells us, including
after a run-in with a teacher who grabbed his arm forcefully—an
injustice he’s still hurt by.
Raymond is humorous and reflective. He thinks math is “kind of fun.”
He loves his English teacher, who is Black, like Raymond and most
of his classmates, and treats her students like “her own children,” as
Raymond and his friends explain enthusiastically. (Their teacher once
introduced them to her son, a college student, and Raymond and his
classmates seem to perceive that she expects the same from them.)
He likes reading in the blue beanbag chair in her classroom, a space
where he feels safe and valued. That’s not a feeling he’s had often in
his school career.
Even at a young age, Raymond already has a sense that what happens
to him in school matters for his life. Both his parents and his sister
went to college, but his two older brothers didn’t, and he recognizes
the differences in their lives. He wants something more than his
brothers’ experiences.
College still seems far off from fifth grade, and he’s not totally sure
what kind of schooling he needs to achieve his professional goals.
But he knows what he wants to be: a police officer.
“I want to go to police academy.”
–Raymond, 5th grade
13
TH
E O
PP
OR
TU
NIT
Y M
YT
H
Luz loves to read. In fact, sometimes she doesn’t do her homework
because she’s reading so much outside of school. She wishes all her
classes were as engaging for her as the books she explores on her
own time, which include fiction and nonfiction; anything, really,
except history.
Luz is a classmate of Isaac’s. Their school is 60 percent Latinx, like
Luz, 30 percent Black, and 10 percent a mix of backgrounds including
Asian, white, and Native American. More than three-quarters of the
student body come from low-income families.
Luz’s vision of the future isn’t quite as clear as Isaac’s, but she thinks
teaching might be a possibility. “I know I want to do something with
kids,” she says. She’s enrolled in a class that prepares students to
work with children. They’re mentoring ninth graders. But the class is
dry. It’s a lot of reading research and summarizing it, she says. The
assignments she finds most interesting—in classes like Advanced
Placement (AP) English—ask her to construct an argument based
on evidence from texts and her own perspective. She wishes all her
classes offered her more opportunities to do that kind of work.
Nonetheless, Luz appreciates when her teachers hold high
expectations, and it motivates her to do the work for them.
Because her school partners with a local college to offer the teacher
preparation course, the teacher is a college professor. That makes
a difference, she says. “He expects a lot of us.”
“I know I want to do
something with kids.”
–Luz, 11th grade
15

TH
E O
PP
OR
TU
NIT
Y M
YT
H
Maggie has lived in the same small community her whole life. But
she’s considering colleges a bit further afield—maybe even out of
state. Wherever she goes, she knows what she plans to do there.
“I’m going to get my Bachelor of Science. I want to be a trauma nurse,
so I’m going to go to nursing school and get additional qualifications
that will allow me to get more opportunities in that,” she says.
“It doesn’t sound hard, but it’s actually pretty hard to get.”
Maggie, like the majority of her classmates at the one high school
in her district, is white. She feels fairly confident that her school is
setting her up for success in college, but she also worries, especially
about math and science.
“I don’t want to feel like I’m behind or, metaphorically speaking,
that I’m sinking.”
“I want to be a trauma nurse.”
–Maggie, 10th grade
17

When students collect their
diplomas, they believe they are
prepared for what’s next—because
that’s what they’ve been told
throughout their K-12 careers.
Their aspirations almost invariably
include higher education.
18T
HE
OP
PO
RT
UN
ITY
MY
TH
TH
E O
PP
OR
TU
NIT
Y M
YT
H
For years, getting more students through high
school has been a huge goal of educators and
policymakers across the country. The effort has
largely paid off: High school graduation rates have
risen steadily, past 80 percent.11 When students
collect their diplomas, they believe they are
prepared for what’s next—because that’s what
they’ve been told throughout their K-12 careers.
Their aspirations almost invariably include higher
education. Enrollment in degree-granting institutions
grew by 23 percent between 1995 and 2005, and a further
14 percent between 2005 and 2015—fueled by increasing
numbers of Black, Latinx, and Asian students.12 For the
first time, students coming of age today are doing so in
a nation where higher education is viewed not as the
purview of a privileged few, but as a baseline expectation
for most families.
The students in our sample embody this trend.
Ninety-four percent said college was part of their plan.
That held true across all five school systems we studied:
In each district, more than 90 percent of the third-
through 12th-grade students we surveyed planned to go to
college. It also held true across all demographic groups:
95 percent of Black students, 95 percent of Latinx
students, and 94 percent of students from families where
a language other than English is spoken at home told us
they want and expect to go to college.
It isn’t an arbitrary goal. Like Hajima and her peers, these
students want to go to college so they can achieve their
career goals. Roughly 70 percent of high school students
told us they aspired to career pathways that required
at least a college degree. The thousands of students we
surveyed intend to become everything from doctors
and lawyers to teachers and hair stylists, musicians and
athletes. Across all grade levels, healthcare and public/
social service were among the top three sectors in which
students aspired to work, and by high school, careers
in science, technology, engineering, and mathematics
(STEM) had risen to the top of the list as well. Nearly a
third of high schoolers across all five school systems told
us they hoped to work in healthcare.
These students expect their K-12 education to add up to
something practical: readiness to meet their goals, to have
the careers they dream of, to support their families and
communities. That’s the promise of school.
But is school delivering on that promise?
19

20

TH
E O
PP
OR
TU
NIT
Y M
YT
HT
HE
OP
PO
RT
UN
ITY
MY
TH
In the hundreds of classrooms we observed, we
found that the majority of students were doing the
work that was asked of them. Contrary to popular
narratives about disruptive kids who don’t put in
much effort, we saw classroom after classroom
where students appeared to be doing the academic
work given to them.
Nearly 90 percent of the time, students told us they were
doing activities related to classwork. Seventy-one percent
of the time, students met the demands of the assignments
their teachers gave them, and more than half of the third-
through 12th-grade students in our partner school systems
earned As and Bs in English language arts (ELA) and
math; 80 percent earned at least a C.
Moreover, the courses students were enrolled in—on
paper—should be putting them on track for college. We
looked at the course trajectories of all high school students
in each district we studied, and assessed them against the
approach set by the National Assessment of Educational
Progress (NAEP).13 Nearly 80 percent of students were on
trajectories categorized as standard, mid-level, or rigorous,
based on course access—all of which could get students
accepted into a four-year college or university.
On the whole, then, most students we studied were
“doing well” in school—one of the most important keys
to success later in life, according to American mythology.
But when we looked at how these students were doing
based on the bar set by actual standards for college
readiness—the bar students themselves said they aspired
to—the opportunity myth emerged. While students
succeeded on more than two-thirds of their assignments,
they only demonstrated success against the grade-
level standards 17 percent of the time on those exact
same assignments (Figure 1). That gap exists because
so few assignments actually gave students a chance to
demonstrate grade-level mastery.
To be clear, “grade-level mastery” doesn’t mean students must
have read a particular list of books. It means they have had
the chance to practice a core set of grade-level-appropriate
competencies for processing information, thinking critically
about texts, and solving problems using evidence. Those
are essential skills that can make the difference between
graduating ready for college or the workplace, or not.
FIGURE 1 | STUDENT SUCCESS ON ASSIGNMENTS VERSUS MASTERY OF GRADE-LEVEL STANDARDS ON THOSE ASSIGNMENTS
71%Students
succeeded on
of their assignments
of those exact same assignments
Even though most students are meeting the demands of their assignments, they’re not prepared for college-level
work because those assignments don’t often give them the chance to reach for that bar.
17%They met grade-level
standards on
21

22T
HE
OP
PO
RT
UN
ITY
MY
TH
Students need these four key resources
in their daily school experiences:
Consistent opportunities to work on
GRADE-APPROPRIATE ASSIGNMENTS
1
DEEP ENGAGEMENT
in what they’re learning
3
2 STRONG INSTRUCTION, where students do
most of the thinking in a lesson
4 Teachers who hold HIGH EXPECTATIONS
for students and believe they can
meet grade-level standards
TH
E O
PP
OR
TU
NIT
Y M
YT
H22

TH
E O
PP
OR
TU
NIT
Y M
YT
H
That readiness is something for which students themselves
yearn. When we asked students what they hoped to
achieve after high school, Hajima and her peers spoke
of college degrees and the meaningful careers that follow.
But a large percentage of those students were being
woefully underprepared to meet their ambitious goals.
What explains this gap between the good work students
put into school and their long odds of graduating ready
to achieve their goals?
Our research suggests that the answers lie, in part, in a set
of resources students have—or don’t have—access to in
school each day, which distinguish high-quality academic
experiences from weak ones. Typically, when we talk about
“resources” in education, we think of tangibles like funding,
space, technology, or supplies. Those matter, of course.
But here, we have identified four key resources beyond
the predictable must-haves, which are critical to students’
success and are correlated to better academic outcomes.
The four key resources at the heart of high-quality
academic experiences for students are:
• Consistent opportunities to work on
grade-appropriate assignments;
• Strong instruction that lets students do most
of the thinking in the lesson;
• A sense of deep engagement in what
they’re learning;
• Teachers who hold high expectations for students
and truly believe they can meet grade-level standards.
When students had access to more of these resources, their
outcomes tended to improve. On average, students in
classrooms with stronger assignments or higher levels of
engagement experienced about two additional months of
learning (Figure 2).14 And the resources interact with each
other in ways that also influence students’ experiences and
outcomes: We saw a relationship, for example, between
stronger instruction and higher levels of engagement. In
classrooms in the top quartile for instructional practices,
engagement was 31 percent higher than in classrooms
with weaker instruction.
Notably, these resources were particularly influential for
students with the most to gain academically. In classrooms
serving high proportions of students behind grade level,
stronger instructional practices amounted to about six
months of additional learning. When students who started
the year behind had greater access to grade-appropriate
assignments, they closed the outcomes gap with their peers
by more than seven months (Figure 3).15 Those classrooms
did not set an unattainable bar for assignment quality:
On average, they offered grade-appropriate assignments
52 percent of the time, compared to 26 percent of the
time across all classrooms. In fact, across all classrooms
in our study, the average top-quartile classroom typically
used grade-appropriate assignments only about 50 percent
of the time. Relatively small improvements in assignment
quality, instruction, and engagement offer a real chance
for students who have been previously under-served by
school to begin catching up to their peers.
The fourth key resource—teacher expectations for students’
success against grade-level standards—demonstrated the
strongest relationship to student growth in our study.
In part, this may be due to the way expectations interact
with the other resources and inform students’ access
to them. For example, teachers who agreed that their
students could meet the bar set by grade-level standards
tended to offer stronger assignments and instruction.
Teachers who held the lowest expectations tended to
offer lower-quality assignments. Those choices have
consequences: Across all classrooms, students in those
in the top quartile for teacher expectations gained about
an additional five months of learning, compared to
students in classrooms in the bottom quartile for
teacher expectations.
When students who started
the year behind had greater access
to grade-appropriate assignments,
they closed the outcomes gap
with their peers by more than
seven months.
23

TH
E O
PP
OR
TU
NIT
Y M
YT
H Students’ perceptions of their teachers’ beliefs also aligned
to stronger academic outcomes. Students who agreed that
their teachers “think it’s important that they learn a lot”
did better on all assignments than students who did not
think their teachers held this belief. On assignments that
were standards-aligned, where students were stretched
to do their very best thinking, students who agreed with
this statement about their teachers’ beliefs met the bar
54 percent of the time, compared to 38 percent of the
time for students who did not.16
In classrooms where we observed more grade-level
assignments, we also found that students met the bar
on those assignments more often than not, even though
the bar was higher. When students were tasked with
assignments that were appropriate for their grade, they
met the demands of those assignments a little more than
half the time (Figure 4). That was true of students in nearly
all groups—regardless of race or language background.
It was also true in nearly all types of classrooms, including
those that are often identified as “high-need.” In all of
these classrooms, students were more likely than not to
have success on assignments that were grade-appropriate—
when they were given the opportunity to try.
The Bright SpotsWhat did these classrooms look like, where students had
greater access to high-quality content and instruction and
were deeply engaged with their learning?
The truth is, each one looked different. There was the
12th-grade English classroom in the western half of
the country, where students read a high-quality, grade-
appropriate memoir. In small groups, students discussed
the book using evidence from the text, pushing each
other to use academic language, guided by a rubric.
Their teacher floated from group to group, listening and
encouraging students to disagree respectfully and use
evidence to support their points of view. All the while,
she gently reinforced the tools and skills they needed to
participate in college-level discourse.
Or there was the fourth-grade math class where students
were engaged for an entire period in an active exploration
of equivalent fractions. In this joyful classroom, the
teacher supported each student’s understanding and
provided individualized support so each student could
access this grade-level content. Students explained their
own thinking, and their teacher offered clarity and praised
their process as she moved them along.
Where we saw entire schools that were bright spots,
there were clear patterns. At an elementary school in the
south, for example, teachers and administrators shared a
consistent definition of what good instruction and student
learning should look like. They articulated a common
expectation that students would have access to rigorous
content and would be responsible for doing the thinking
and learning in the classroom, with teachers acting as
facilitators. They also expected that students would be
deeply engaged in reading, writing, and discussion across
subjects. Students in this school spent 24 percent more
time with grade-appropriate assignments, 61 percent more
time with strong instruction, and reported being engaged
18 percent more of the time than the average elementary
classroom in our study.
Those shared expectations were not accidental: In fact,
they were consistent up and down this district, starting
with the superintendent. Teachers, school leadership,
and district leadership all articulated shared expectations
for the kind of instruction and engagement students
should have access to. There were structures in place to
support and maintain that high bar: Teachers received
walk-throughs of their classrooms every week or two.
24

TH
E O
PP
OR
TU
NIT
Y M
YT
H
The four key resources benefit all students...
...but particularly students who started the year substantially behind their peers.
Assignments Instruction Engagement Expectations
1.70.2 2.5
4.6months
months months
months
FIGURE 2 | DIFFERENCE IN ACHIEVEMENT GROWTH BETWEEN BEST (TOP QUARTILE) AND WORST (BOTTOM QUARTILE) CLASSROOMS
Assignments Instruction Engagement Expectations
7.36.1
0.9
7.9months
months
months
months
FIGURE 3 | DIFFERENCE IN ACHIEVEMENT GROWTH BETWEEN BEST (TOP HALF) AND WORST (BOTTOM HALF) CLASSROOMS AMONG CLASSROOMS WHERE AVERAGE STUDENT IS SUBSTANTIALLY BEHIND GRADE LEVEL
25

In these observations, administrators expected to see
students working on grade-appropriate content, and that
teachers would be able to explain exactly how they were
addressing the full scope of the instructional shifts and
the standards.
In this school, we heard from teachers and administrators
alike that a consistent vision for great instruction, a strong
curriculum, professional development aligned to that
curriculum and designed to support teachers to implement
it successfully, and a culture of high expectations for
everyone were key. As one teacher explained, “Professional
development didn’t used to be helpful, but we started
focusing on standards and what good instruction should
look like.” Another noted, “We are held to high expectations
and we hold our kids to high expectations.” Relative to
the other schools in our sample, this elementary school
showed higher levels of student engagement and strong
instruction—suggesting that their focus on increasing
access to those two resources in particular has paid off.
The other schools that jumped out as positive outliers
shared many of these characteristics. At one small high
school, adults in the building were similarly focused on a
core set of academic priorities: in their case, literacy across
all subjects. (For example, students used a consistent
writing protocol across all their classes.) Teachers and
administrators articulated a common vision of what
instruction should look like and spent a lot of time
addressing how to fully implement the standards. The
school also prioritized a high level of both support and
accountability for teachers, through weekly observations
and debriefs, and regular data meetings with administrators.
We found classrooms and schools like this across our
sample, serving a diverse range of students and families.
In about 70 of the classrooms we observed, students spent
most of their time with grade-appropriate assignments;
in nearly 30 classrooms, we saw strong instruction
throughout all the lessons we observed; in 25 classrooms,
students were engaged at least 80 percent of the time.17
These classrooms looked different, but their spirit was the
same: students who were enjoying their learning; teachers
who believed their students could do well; content and
instructional practices that demanded students stretch
themselves and honored their abilities to do just that.
We met teachers in these classrooms who were making
conscious decisions to take a leap of faith and offer
students more challenging assignments than they might
once have attempted. There were teachers who were
forcing themselves to step back and let their students
do hard work (and sometimes stumble), and those who
were holding themselves and their students accountable
to a high bar. At the school level, we repeatedly saw a
consistent focus on a relatively small set of academic
priorities, and a high level of support for teachers to
meet those priorities.
Unfortunately, classrooms and schools like these were
the exception. School experiences that included ample
access to the four key resources—grade-appropriate
assignments, strong instruction, deep engagement,
and high expectations—were few and far between for
most students.
We found classrooms and schools
like this across our sample, serving
a diverse range of students and
families. They looked different,
but their spirit was the same:
students who were enjoying their
learning; teachers who believed
their students could do well;
content and instructional practices
that demanded students stretch
themselves and honored their
abilities to do just that.
TH
E O
PP
OR
TU
NIT
Y M
YT
H26

FIGURE 4 | STUDENT SUCCESS ON GRADE-LEVEL WORK VERSUS OPPORTUNITIES TO DO GRADE-LEVEL WORK
Success rates on grade-level work were similar...
...but 4 out of 10 classrooms with a majority of students of color never received a single grade-level assignment.
All students tended to succeed on grade-level work, but many students of color were denied any opportunity to even try it.
Percent of classrooms that had no grade-level assignments in classrooms
with mostly white students
38% 12%
Percent of classrooms that had no grade-level assignments in classrooms
with mostly students of color
Percent of classrooms that had no grade-level assignments in classrooms
with mostly white students
NOTE: “Grade-level” assignments are assignments that earned our highest rating on the content domain. See the Technical Appendix for more details on how we rated assignments. To calculate the success rate in both types of classrooms, we combined all grade-level assignments from eligible classrooms. Because some classrooms provided more grade-level assignments than others, and because some classrooms never provided grade-level assignments, some classrooms (and students) are represented more heavily than others in this analysis. Only core subject classrooms with at least five days of assignments are included.
Success rates on all grade-level assignments from classrooms with
mostly students of color
Success rates on all grade-level assignments from classrooms with
mostly white students
Success rates on all grade-level assignments from classrooms with
mostly white students
56% 65%
TH
E O
PP
OR
TU
NIT
Y M
YT
H27
28
When she arrived at her new high school,
Hajima’s hope was that the medical careers
program would put her on the right path for
medical school, both in terms of academic
readiness and with some college credit already
under her belt. In fact, she had transferred from
another public high school—one with higher test
scores and more advanced course offerings—
explicitly because she’d been enticed by the
promise of this program.
Considering that Hajima joined her new school
based on the promise that it would prepare her
for pre-med studies in college, she was shocked
to learn upon arrival that there were no AP math
or science courses available to her.
She maxed out on the school’s math offerings as
a junior. “They only have up to pre-calc,” she says.
“I took that last year. If we feel the classes they
have aren’t challenging for us, there are no
other options.”
It isn’t lost on Hajima that the academic
experiences she has access to at her current
school—where her classmates are primarily
Black—are weaker than those at her previous
school (in the same district), which is primarily
white. The tradeoffs have been painful. She
reflects on her choice to move schools, in pursuit
of better preparation for a medical career: “I
don’t really regret moving here because of all
the new friends. It’s just education-wise, I do,
because it’s not challenging.”
She’d jump at the opportunity to learn more.
“We want to be more prepared,” she says.
When Hajima and her best friend talk about how
it feels to sit in classes that aren’t challenging
enough, they speak of watching the clock. “The
time goes super slow,” Hajima’s friend explains.
In their physics class, for example, they might
get through all the content in the first 20 minutes
—and then have nothing to do. It worries Hajima
deeply when she considers her future.
“I don’t want to feel like I’m behind when I walk
into a class on the first day of college,” she says.
“The teacher is not going to wait for me. I’m just
going to be a small number in a class, and I don’t
want to feel behind or left out.”
“I don’t want to feel behind.”
HAJIMA’S EXPERIENCE
TH
E O
PP
OR
TU
NIT
Y M
YT
H29

SH
OR
TCH
AN
GE
D30
GRADE-APPROPRIATE ASSIGNMENTSHajima and her classmates will never get their
time back—and it adds up. In the four core
subjects—ELA, math, science, and social studies—
an average student spent almost three-quarters
of their time on assignments that were not
grade-appropriate (Figure 5). 18 In a single
school year, that’s the equivalent of more than
six months of learning time.19
Consider the experience of the eighth graders in an ELA
classroom who were asked to fill in missing vowels in a
vocabulary worksheet. Or the students in an AP physics
classroom, who spent an entire class period making a
vocabulary poster. These sound like extreme examples,
but they were far more the norm than the exception.
When students are consistently forced to do work below
their grade level, they’re missing opportunities to learn
and practice the skills they’ll need to make their life
goals achievable. But they’re also being denied a chance
to prove—to themselves as much as anyone else—what
they are capable of. Consider the student in one of our
partner districts who was asked to solve a variety of word
problems using addition and subtraction (a first-grade
standard) and multiplication and division (a third-grade
standard). That might be all right, except for one problem:
This student was in fourth grade.
He did the work he was assigned, and answered
87 percent of the questions correctly. But the assignment
offered him only the opportunity to grapple with content
that was more appropriate for younger students.
Another assignment in the same classroom offered
a better opportunity: The same student was asked to
identify equivalent fractions using visual models,
meeting a fourth-grade standard. Here, on the more
challenging assignment, he answered 100 percent of
the questions correctly.
FIGURE 5 | TIME SPENT ON GRADE-APPROPRIATE ASSIGNMENTS VERSUS NON-GRADE-APPROPRIATE ASSIGNMENTS
Of the 180 classroom hours in each core subject during the school year, students spent...
TH
E O
PP
OR
TU
NIT
Y M
YT
H30
47 hours on assignments that were grade appropriate
133 hours on assignments that were not grade appropriate
hours on assignments that were grade appropriate
The content in front of students on a daily basis
isn’t good enough—simple as that. While improving
content isn’t a quick fix, giving students better
assignments that are appropriately challenging will
give more students the chance to get on track to
meet their goals. Given the variation from classroom
to classroom and the disheartening level of materials
overall, a key question is: Where do these assignments
originate? Who defines what students are asked to
do and when?
We looked at state- and district-level policies on
curriculum adoption, as well as the quality of the
materials districts chose. On the whole, we found
that our partner districts were adopting materials
of widely varying quality—and that in spite of having
these district-provided materials, teachers were
spending a significant amount of their planning time
creating or selecting their own. The typical teacher
in our sample reported spending seven hours per
week on this, which adds up to more than 250 hours
a year—hugely valuable time for teachers who are
already stretched thin.
This might be time well-spent if there were evidence
that teacher-created materials were giving students
access to stronger content than those provided by
districts. But this wasn’t the case. In fact, materials
created or selected by teachers were generally less
likely than those provided by the district to meet
academic standards in ELA and math. On average,
teacher-created or selected materials aligned
to academic standards, meaning they earned our
highest content rating, 20 percent of the time,
while district-adopted materials aligned 34 percent
of the time. This alignment was even higher when
districts had adopted high-quality materials: When
teachers reported that their assignments came from
high-quality district offerings, the assignments were
grade-appropriate 53 percent of the time. Districts’
choices, in other words, were far from universally
great—but they were a stronger start than materials
teachers found or created from scratch.
We also looked at district-mandated interim
assessments to understand what kind of feedback
they were providing teachers about their students’
performance against grade-level state standards.
All of our districts required their teachers to
administer at least quarterly interim assessments in
both math and ELA—but none of these assessments
met the bar for full alignment to the standards:
Of a sampling of 38 interim assessments in math and
ELA, just two were “partially aligned” to appropriate
benchmarks. The remaining 36 were “not aligned,”
largely because they did not ask students grade-
appropriate questions. We heard overwhelmingly
from teachers that they used these assessments
to drive adjustments to their instruction—as they
should, as that is a fundamental goal of measuring
student progress. But in our partner districts,
teachers were receiving misinformation from the
mandated assessments, undermining teachers’
efforts to adjust their instruction in ways that would
improve student outcomes (and quite possibly
confusing teachers about what grade-appropriate
content looks like).20
THE ROLE OF CURRICULUM AND ASSESSMENT POLICIES
TH
E O
PP
OR
TU
NIT
Y M
YT
H31

While some students had access to grade-appropriate assignments...
These eighth-grade students read A Mighty Long Way and wrote an informational essay analyzing historical events, getting the chance to fully meet the depth of multiple standards and learn relevant content.
The fourth-grade student who performed better on the
grade-appropriate assignment compared to the easier
one does not necessarily indicate that students are more
likely to do better on tougher content; overall, students are
still more likely to meet the demands of less challenging
assignments versus more challenging ones. But his
experience debunks the common assumption that students
can’t do more rigorous work. This student was ready,
willing, and able to complete whatever assignment he was
offered. Even more importantly, his example upends the
belief that achievement mainly reflects students’ abilities.
The key variable is actually adults’ decisions.
Neither this student nor his teacher would have known
he could do well on the tougher assignment if he hadn’t
been given the chance—a chance he and every other
student must rely on the adults in their schools to give
them. In our observations, we saw hundreds of students
demonstrating their ability to do grade-level work when
asked to do so, including students with low prior
achievement. But most—especially students of color
and those from low-income families—don’t get those
opportunities nearly often enough.
GRADE 8: MODULE 3B: UNIT 2: LESSON 16
Created by EL Education, Inc. on behalf of Public Consulting Group, Inc. © 2013 Public Consulting Group, Inc., with a perpetual license granted to EL Education, Inc. Common Core ELA Curriculum • G8:M3B:U2:L16 • First Edition • 11
Informational Essay Prompt and New York State Grades 6–8 Expository Writing Evaluation Rubric
Name:
Date:
Prompt: In the events surrounding the Little Rock Nine and the struggle to integrate Central High, the press played a newly powerful role. In what ways did it serve to illuminate events for a national audience, and it what ways did it give an incomplete or even inaccurate picture of events?
New York State Grade 6–8 Expository Writing Evaluation Rubric
Criteria SCORE
4 Essays at this level:
3 Essays at this level:
This means that in my informational essay, I need to …
CONTENT AND ANALYSIS: the extent to which the essay conveys complex ideas and information clearly and accurately in order to support claims in an analysis of topics or texts
—clearly introduce a topic in a manner that is compelling and follows logically from the task and purpose —demonstrate insightful analysis of the text(s)
— clearly introduce a topic in a manner that follows from the task and purpose —demonstrate grade-appropriate analysis of the text(s)
COMMAND OF EVIDENCE: the extent to which the essay presents evidence from the provided texts to support analysis and reflection
—develop the topic with relevant, well-chosen facts, definitions, concrete details, quotations, or other information and examples from the text(s) —sustain the use of varied, relevant evidence
—develop the topic with relevant facts, definitions, details, quotations, or other information and examples from the text(s) —sustain the use of relevant evidence, with some lack of variety
32T
HE
OP
PO
RT
UN
ITY
MY
TH

...many others did not.
After reading a fifth-grade-level text, other eighth-grade students completed multiple-choice vocabulary questions and filled in the missing vowels in words, which is not aligned to any eighth-grade literacy standards.
Sample question from this assignment:
Add vowels (a, e, i, o, u) to complete the words from the reading. It’s hard to imagine that this river was once an unspoiled marine H_B_T_T.
The “Billion Oyster Project” Brings Life Back to NYC Waters
Gazing at Manhattan’s East River, you will see huge cargo ships, ferries, and barges. You’ll see a stream of cars and trains zooming over the city’s bridges. It’s hard to imagine that this river was once an unspoiled marine habitat. Years of industrial development have taken a toll. Much of the natural ecosystem here was lost or damaged. But today, with the help of the Billion Oyster Project and lots of New York City students, that’s starting to change.
Long ago, oysters thrived in the waters around NYC. Have you ever heard of Pearl Street in downtown Manhattan? That street was named for all the oysters that swarmed the nearby river. But as NYC became a shipping hub, the rivers became polluted. The oyster population nearly disappeared. This impacted the whole ecosystem, because oysters were a key ingredient.
As oysters eat, they filter the water supply by removing nitrogen. We see great biodiversity around oyster reefs, because the oysters’ filtering ability attracts life. Around NYC’s oyster reefs, there were large habitats of fish and marine creatures. Even whales were a common sight here. Oyster reefs also helped to buffer Manhattan from erosion. They limited the damage from storms and waves. As NYC’s oysters died off, so did many other creatures, and so did the protective quality of the reefs. This was a big loss for the city.
The Billion Oyster Project has set out to address this loss. The project works to bring oysters back to NYC’s waters. The project began with students at New York Harbor School. It has since expanded to include many schools in the city. Thousands of NYC students have participated in reef construction and oyster planting. So far, over 26 million oysters have been planted in the waters around NYC. And it’s working! With the oysters, many more fish and marine creatures have returned as well. Even whales have been spotted again.
These NYC waterways and harbors will always be some of the world’s busiest. But with the help of the Billion Oyster Project, the dynamic natural world that once thrived here is beginning to return and to coexist more peacefully with the ferries, barges, cars and trains.
TH
E O
PP
OR
TU
NIT
Y M
YT
H33

SH
OR
TCH
AN
GE
D
Fifty minutes into math, Raymond and his
fifth-grade classmates are still working on
the warmup: four homework problems their
teacher put on the board when they came in
(multiplication and division operations that
meet a fourth-grade standard). Their teacher
explains that the warm-up problems are “to calm
[them] down from gym”—though they appeared
perfectly calm when they filed into the room.
Early on in the lesson, she issues an ominous
warning: “What happens when we struggle in
math class? All sorts of bad things.”
The lesson moves at an almost unbearably slow
pace. The teacher moves through the operations
on the board, not checking whether her students
understand, pausing to answer questions, or
asking students to do much of the work. She
solves most of the problems herself, and on one
occasion does so incorrectly.
“I know you just came from gym where you got to
run around and talk,” the teacher says, frazzled.
“It’s math time now. We need to focus.”
One student is asked to leave after talking out of
turn, but there’s nowhere for him to go. Booted
from his classroom, he paces aimlessly in the
hallway, periodically peering through the window
to see what’s happening in class. Inside the
classroom, students check out, one by one.
“Are we still on number two?” asks another
student. She seems astonished. The class period
is nearly over. As she starts to explain the tape
diagram she’d used to solve the problem, her
teacher cuts her off. “Stop. I know what you’re
going to say and that’s not why six is broken
into three.”
One wonders how it feels—at 11 years old—to be
interrupted by a teacher and corrected, before
you’ve even had the chance to finish answering a
question or explain your thinking. The message
students receive, day in and day out, is that they
should pay attention in school, respect their
teachers, and do what they’re asked. And yet,
they undoubtedly internalize a very different
message when they are shut down while trying to
learn, repeatedly, in the very classrooms where
they are expected to be giving their best effort.
Remember, Raymond actually likes math. He
thinks it’s “kind of fun.” But today in math class,
he rests his head on his desk.
“Are we still on number two?”
RAYMOND’S EXPERIENCE
TH
E O
PP
OR
TU
NIT
Y M
YT
H34

FIGURE 6 | TIME SPENT ON STRONG INSTRUCTION VERSUS WEAK INSTRUCTION
Of the 180 classroom hours in each core subject during the school year, students spent...
29 hours on lessons with strong instruction
151 hours on lessons with weak instruction
hours on lessons with strong instruction
STRONG INSTRUCTIONIn assessing the quality of instruction, we looked
at classrooms’ cultures and whether students were
doing the work of the lesson. We also considered
whether students had a chance to work on grade-
level content during the lesson, and whether
teachers’ instructional practices allowed students
to do the thinking about that grade-level content.
Only 16 percent of the lessons we observed in core
subjects offered strong instruction: instructional practices
that allowed students to grapple with appropriate material
in robust ways. Out of 180 hours per school year in each
core subject, that means students spent just 29 hours with
strong instruction (Figure 6).
The problem is not just that the content in front of
students isn’t strong enough—although as we’ve already
seen, that is often the case. It’s also that when content
is high-quality and grade-appropriate, many students
still don’t have the opportunity to actually do the work
themselves. Too often, we saw teachers making choices
that protected—or prevented—students from doing the
thinking of the lesson. Even if those instructional choices
were motivated by a desire to see students succeed, they
undermined the benefits of high-quality content in the
first place. If these lessons represented students’ typical
experiences, they were spending the equivalent of fewer
than two months experiencing strong instruction, and
more than seven months doing something else.
Even when we did see students offered grade-appropriate
assignments, their teachers engaged them effectively with
that content less than half the time, and students had
the chance to do the deep thinking of the lesson just a
quarter of the time. That means in the 295 lessons that
offered grade-level content—already just a fraction of the
nearly 900 core subject lessons we observed in total—only
74 lessons also focused on developing understanding and
required students to do the thinking.21 In other words,
in many classrooms where the content had potential,
students weren’t actually reaping the benefits because
they were not doing the hard work themselves.
TH
E O
PP
OR
TU
NIT
Y M
YT
H35

When students “do the thinking” in a lesson, they
grapple with the process of solving problems. They might
be applying prior knowledge to answer new kinds of
questions, or working in small groups to discuss different
ways to solve a grade-level math problem. They might be
writing an argument after reading and evaluating multiple
texts that shared different perspectives about an issue.
In classrooms where students don’t have these kinds of
opportunities, they are often doing more listening than
talking. They are writing their teachers’ answers verbatim,
plugging numbers into a formula they’ve been supplied,
or filling in blanks.
Ownership in the classroom matters.22 It’s not only
how the brain learns best—by trying out new skills and
wrestling with new knowledge and experiences ourselves,
rather than just receiving information—but it’s also how
students build the confidence to take on new challenges.
When students are asked to try in school, when they are
asked to push their thinking even when they’re stuck,
to explain why they’ve arrived at an answer, to help a
classmate, they also have the chance to stretch their
sense of their own capabilities and see themselves grow.
Strong instruction that asks students to grapple with
challenging content—and that cultivates a classroom-
wide expectation that it’s okay to be wrong—has the
potential to increase students’ natural drive to learn,
rather than squander it. That can in turn deepen
students’ engagement in school.
In many classrooms where the
content had potential, students
weren’t actually reaping the
benefits because they were not
doing the hard work themselves.
36T
HE
OP
PO
RT
UN
ITY
MY
TH

Physics is Isaac’s favorite class. For one thing,
he says, it’s clear how the concepts apply in real
life—“how you can use it outside of school.” With
his aspiration toward a career in nursing, Isaac is
aware that he needs a strong math and science
background. Not only that, but he likes testing
different concepts through experiments. In
contrast, in classes where his teachers do all the
talking, he struggles to stay focused, because
they just don’t engage him deeply.
“Some classes are really dry,” he explains. “You
take nothing but notes. That’s not going to help
me learn what I need in the long term. What if I
need this in my long-term memory? When a class
is really dry, the teacher is not helping us learn
more about the subject.”
Isaac reflects that he is most interested in
classes where the content is useful for what
he wants to do with his life. “Let me learn
something that’s going to help me in nursing
school,” he says. “[It should be] something that’s
harder for you, something that’s going to help
your lifestyle that you’re living.”
His physics class also rates highly from Isaac’s
perspective because his teacher, Mr. Adams,
knows how to crack a joke, while also taking
students’ learning seriously. “There’s not many
classes like that,” Isaac observes.
In contrast to Raymond’s math class, Isaac’s
physics class is a positive, enjoyable place to
learn. For Isaac, his favorite class seems to
occupy the sweet spot between schoolwork that
matters in real life, learning experiences he can
own himself, and teachers who care for him and
his classmates as people.
“I don’t think they want to see us fail,” Isaac
says of most of his teachers. “They want to
see us move on in life.” But he is also acutely
aware of how vital the relationships between
teachers and students are, and how they can
keep a student’s progress on track—or derail
it. While he has several strong relationships
with teachers, Mr. Adams among them, he has
also experienced the opposite: adults who
undermined his self-belief. On several occasions,
Isaac describes hearing a teacher belittle him
or his classmates on account of their race. As a
freshman, he says, one of his teachers told him
that he wouldn’t amount to anything because he
was Black.
It’s a painful experience to recall. “I told her, ‘It
don’t matter the color of my skin. As long as I put
in an effort, I can do it,’” he recalls. “I know I can.”
From his perspective, what happens in his
current school—and the relationships he has
with his teachers there—have a significant
impact on his future. “Some of us come to school,
and we’re dying. We have a lot going on at home,
a lot going on here, but we have to focus here
because this might be our last chance at life.”
If he could change anything about his high
school experience, it would be more people like
Mr. Adams: adults who know him, recognize and
respect his life experiences, and support his
goals. They teach in ways that help him engage
with interesting content and commit it to his
long-term memory, which matters to him. And
they know how to have an occasional laugh while
they’re at it.
“This might be our last chance.”
ISAAC’S EXPERIENCE
TH
E O
PP
OR
TU
NIT
Y M
YT
H37

TH
E O
PP
OR
TU
NIT
Y M
YT
HT
HE
OP
PO
RT
UN
ITY
MY
TH
38
DEEP ENGAGEMENTWe know that the majority of students were “on
task” in the classrooms we observed. Being on task
and doing what’s asked in class certainly matter; it
should be a baseline expectation that students are
working on activities related to their lessons during
class time. This is necessary, but it is not sufficient,
because “engagement” at first glance—behavioral
compliance—doesn’t mean students are truly
engaged, cognitively and emotionally, with the
work they’re doing.
When we measured “engagement,” we wanted to look
at whether students were making a deeper cognitive and
emotional investment in their schoolwork. We considered
whether students were (1) enjoying what they were doing;
(2) interested in it; and (3) concentrating deeply on it.23
When we looked at “worth,” we considered whether
students found the content (1) usable outside of school;
(2) important now; or (3) important in the future.24
Though most students we observed were completing their
work (and even doing well on those assignments), middle
and high school students found their school experiences
engaging and worthwhile less than half the time (Figure 7).
Deep engagement is not a nice-to-have in school. Isaac’s
reflections on what it feels like to sit in a “dry” lesson,
where he’s not learning anything that will stick with him
or help him later in life, should not be dismissed as a
teenager’s complaints. His observations are supported by
neuroscience: Deep learning only happens when people
are cognitively and emotionally engaged with the material
in front of them (and when people feel safe in their
environment).25 Students do better academically when
they feel engaged like this. In our sample, students were
likely to earn better grades and find greater success in
classrooms where they also reported feeling engaged.
But most students don’t have that opportunity regularly.
More than 2,000 students told us about their experiences
in school on at least five separate occasions. Among them,
nearly half rarely or never had an experience that they
believed was both engaging and worthwhile.26
And the further students get into their school careers,
the less engaged they’re likely to be. Elementary students
were more engaged and considered their schoolwork
more worthwhile than their older peers. By the time
they reached high school—just as their identities and
career aspirations started to solidify and students began
to recognize the content and skills they would need to
meet their goals—more and more students perceived
their schoolwork to be disconnected from their futures.
High school students reported that 58 percent of their
experiences were not engaging and 60 percent were not
worthwhile: They were disconnected from their realities
and irrelevant for their futures. Perhaps it’s not a surprise,
then, that nearly half a million students drop out of
high school every year.27
When we surveyed students in real time in their
classrooms, we found them thinking about a variety of
things beyond the lesson. When asked “What are you
thinking about right now?” students in low-engagement
classrooms reported musings on everything from “lunch”
to “sleep” to “Beyoncé.” This range of responses was
true even when students were, in practice, on task in class.
They were doing the work in front of them, but their
assignments did not require their full focus.
This was in contrast to classrooms that scored higher
on our measure of engagement. In these classrooms,
students reported thinking about things like “our group
work” or “what I was working on.” Clearly, students were
prepared to focus on the work at hand, but it needed to be
intellectually stimulating and worthy of their attention to
engage them.
On the whole, we found that the notion that many
teenagers “hate school” simply wasn’t the case. They
were far from uniformly negative about school, nor
were they consistently disengaged across all their classes,
every day of the week. In fact, students were attuned
38
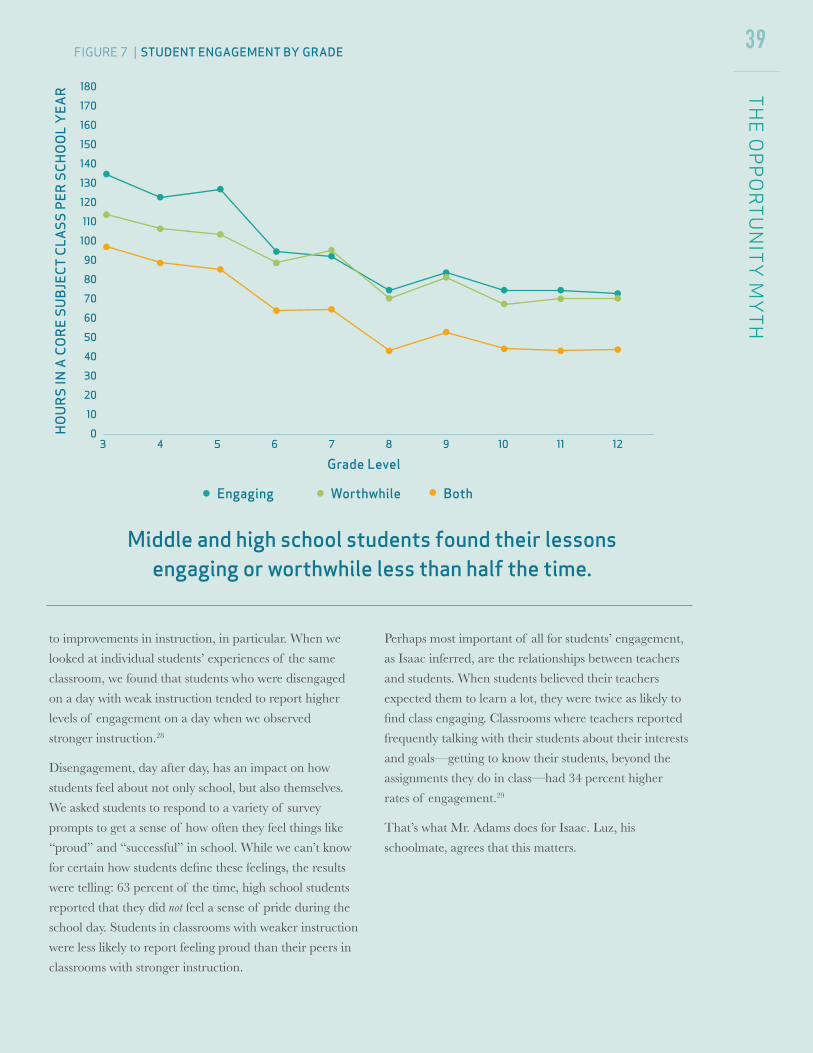
TH
E O
PP
OR
TU
NIT
Y M
YT
H
Middle and high school students found their lessons engaging or worthwhile less than half the time.
FIGURE 7 | STUDENT ENGAGEMENT BY GRADE H
OU
RS
IN A
CO
RE
SU
BJE
CT
CLA
SS
PER
SC
HO
OL
YEA
R
Grade Level
Engaging Worthwhile Both
to improvements in instruction, in particular. When we
looked at individual students’ experiences of the same
classroom, we found that students who were disengaged
on a day with weak instruction tended to report higher
levels of engagement on a day when we observed
stronger instruction.28
Disengagement, day after day, has an impact on how
students feel about not only school, but also themselves.
We asked students to respond to a variety of survey
prompts to get a sense of how often they feel things like
“proud” and “successful” in school. While we can’t know
for certain how students define these feelings, the results
were telling: 63 percent of the time, high school students
reported that they did not feel a sense of pride during the
school day. Students in classrooms with weaker instruction
were less likely to report feeling proud than their peers in
classrooms with stronger instruction.
Perhaps most important of all for students’ engagement,
as Isaac inferred, are the relationships between teachers
and students. When students believed their teachers
expected them to learn a lot, they were twice as likely to
find class engaging. Classrooms where teachers reported
frequently talking with their students about their interests
and goals—getting to know their students, beyond the
assignments they do in class—had 34 percent higher
rates of engagement.29
That’s what Mr. Adams does for Isaac. Luz, his
schoolmate, agrees that this matters.
39

Luz loves school—or she used to.
“Throughout elementary and middle school, I
tried really hard,” she says. “Straight A student,
perfect attendance, that kind of thing. Then
freshman year happened, and I got some Ds and
Cs. I cried. I cried. I had never gotten a C at the
end of the year, or a D. When I saw it happen in
freshman year, I was like, ‘Wow. What happened?’”
Luz is a junior in high school. Her school, which
serves roughly 500 students, was part of a
larger public high school that was closed for
poor performance and broken into four smaller
schools several years ago. She is reflective about
what happened in her transition to high school.
Some of the dip in her grades, she says, was
because she was unprepared for the challenge
of her high school classes.
“I feel like it was a struggle between the
difference between the expectations that
were given to you in middle school, and then
the expectations at high school. I feel that
messed me up.”
As she adapted to high school (and with some
pressure at home from her father), she raised
those grades back up to As and Bs. But she also
describes the importance of having teachers
who not only push her but also support her.
“[In] biology, there was a lot of words I didn’t
understand,” she says. “When I needed help,
my teacher didn’t really help me. I would ask
questions. She would answer them, but they
weren’t what I wanted, so I would have to go
to other students. Sometimes they didn’t
understand it, so I didn’t understand it.”
For Luz, getting help when she asks for it is an
essential component of success in the classroom.
“They got to help me when I need help. Actually
help me. I feel like having a relationship with your
student is important.”
She elaborates. “The teachers that have high
expectations for you in their class, you actually
try harder, because you want to show you can
meet those expectations. But when teachers give
up on their students, you’re like, ‘Why should I try
if my teacher’s not giving it a try?’”
Now, in the second semester of her junior year,
just as Luz is starting to consider college, her
grades are starting to slip again. She feels
herself disengaging from school more often,
and she’s missing the positive relationships with
teachers that anchor her to school. “If I don’t
really connect with that teacher, then it’s like,
why am I in your class?”
“They got to help me when I need help.”
LUZ’S EXPERIENCE
TH
E O
PP
OR
TU
NIT
Y M
YT
H40

41
HIGH EXPECTATIONSThe vast majority of students (93 percent of those
we surveyed) agreed that it’s important to their
teachers that they learn a lot. And students like Luz
correctly intuit that what their teachers expect of
them in class has an impact on what they learn:
When teachers have high expectations for students’
success against grade-level standards, it informs
their choices about the content they put in front of
students, and the instructional practices they employ.
That sounds like common sense, and it plays out in the
data. In classrooms where teachers had higher expectations,
we also saw stronger assignments, instruction, and ultimately
greater student growth, compared to classrooms where
teachers reported the lowest expectations for their students.
But those low expectations for student success were rampant.
While 82 percent of teachers were supportive of state-
level standards in theory, just 44 percent of teachers
believed their own students could meet such high demands
(Figure 8). When that translates into choices about content
and instruction—and into the messages those choices send
to students—it makes a meaningful impact on students’
school experiences and outcomes.
When teachers have low expectations, it may also
contribute to a mismatch between the grades students
bring home and their actual mastery of grade-level work
and skills, because those grades often fail to reflect their
success on work that is appropriately challenging. While
nearly two-thirds of students across our partner districts
earned As and Bs over the last few years, far fewer met
the grade-level bar set by their state’s standardized
assessments. In one partner district, less than 20 percent
of B students did so.30
While higher grades did correspond to a greater chance
that students could do grade-level work on these assessments,
that chance was not especially great, even for students who
were bringing home As and Bs. On the whole, students
who were earning Bs on their math and ELA coursework
had a less than 35 percent chance of having met their state
assessment’s grade-level bar. Even an A was far from a
guarantee: 29 percent of A students did not meet their
FIGURE 8 | TEACHER EXPECTATIONS FOR STUDENT SUCCESS AGAINST GRADE-LEVEL STANDARDS
While most teachers supported the standards in theory, less than half believed they were right for their students.
44% of teachers expected their students could have success with the standards
82% of teachers supported the content of their state’s academic standards
TH
E O
PP
OR
TU
NIT
Y M
YT
H
of teachers supported the content of their state’s academic standards
41

state assessment’s grade-level bar. And we found the same
disconnect when we compared students’ grades to college
entrance exams and AP tests: Roughly half of students
who typically received a B in math and ELA met the
ACT’s or SAT’s college readiness benchmarks, and only
20 percent of students who earned a B in their AP math
or English course actually passed the AP exam.
This is not purely about teachers’ individual expectations
and the choices that flow from them. The reality is that
teachers are themselves acting within a system that shapes
and confines the choices they make for students. Although
we know that some teachers do make decisions that buck
systemic trends, and that teachers have the power to be
vigilant about what goes on in their own classrooms,
their choices are also heavily influenced by the training,
development, and support they’re offered. For example,
when the importance of high expectations (and the
influence of teachers’ unconscious biases on those
expectations) is not prioritized in teacher preparation
programs, it’s unreasonable to expect most teachers to
prioritize it on their own. The system sends teachers the
message that the material they teach and the practices
they employ in their classrooms matter far more than
the expectations they hold for their students. Yet in
our partner districts, these expectations had a stronger
relationship to student achievement growth than any
other factor we studied.
Moreover, in a system where many students pass from
year to year under-prepared for what comes next, teachers
often find themselves teaching students who truly aren’t
yet working at grade level. They feel forced to choose
between assigning grade-level work that’s beyond their
students’ current skillset, or assigning work that matches
those skills—but is below grade level.
In principle, the solution to this is “scaffolding”: Teachers
should provide students the support they need to access
grade-level work, regardless of their starting point, and
do so as quickly as possible during the school year. But
in practice, scaffolding—not to mention differentiating
that support in a classroom with students who start at
many different levels—is a complex skill to master. Many
teachers simply don’t have the training and support in
place to do it effectively. Even with the right skills and best
intentions, meeting 25 or 30 individual students where
they are isn’t possible without additional adults in the
room, the right kinds of resources and technology, and
a host of other resources that most teachers don’t have.
The result is the continuation of a cycle in which students
who are behind grade level—who are all too often
students of color, those from low-income backgrounds,
students with mild to moderate disabilities, or English
language learners—are continuously exposed to work
that never gives them the chance to catch up.
The system doesn’t send teachers the message
that their mindset matters nearly as much as the
material they teach or the practices they employ
in their classrooms. Yet teacher expectations had
a stronger effect on student achievement growth
than any other factor we studied.
42T
HE
OP
PO
RT
UN
ITY
MY
TH

43
Maggie believes that high school is supposed to
get her ready for what she wants to do in life.
“I expect to be getting the knowledge I need to
go to college and get a career, to do whatever
it is I plan on doing, to be a trauma nurse,” she
says. “I don’t expect [school] to be fun, but I also
don’t expect it to be the mountain that it is.” She
describes class periods where she finishes her
work early and sits there with nothing else to do,
and those where she’s assigned a lot of work to
get through, but doesn’t feel she has the support
or guidance to do the work.
“Sometimes, if it’s not something I feel stimulated
by, I feel like taking a nap, honestly,” Maggie
says. (“But I don’t,” she adds quickly.) “Or if it’s
something I don’t understand how to do, I feel
frustrated. I would rather be given the tools to
solve the problem, instead of just being told
‘you need to do this by tomorrow.’ It’s frustrating
or it’s boring. That’s about it.”
Maggie understands that she and her
schoolmates have been tracked by ability (or
perceived ability) since they were young. She’s
been in class with the same kids “for years.
We’re always stuck together.”
In this small school district, there is just one
elementary school, one middle school, and one
high school. But even so, that doesn’t guarantee
that every student has the same opportunity
to work on assignments that challenge them
appropriately. “We’re supposed to be the smart
class,” she says, putting “smart class” in air
quotes. (“I don’t mean to sound conceited,”
she says. “It’s just the way it is.”)
From Maggie’s perspective, her teachers
have fairly high expectations for her and her
classmates. Our data supports that observation:
Maggie’s high school offers some of the best
academic opportunities we saw. (It also has
among the highest percentages of white and
higher-income students in our sample.)
But Maggie isn’t convinced that opportunities
are the same for classes with the “other
students.” They may not be asked to work as hard,
she says, or things that are extra credit in their
class, for example, might not be considered extra
for her, “because [the teacher] expects us to be
able to do it in comparison to them.”
She also has an inkling that this might not be fair.
“I feel like everybody’s capable of the same thing.
I think they can do it just as much as I can do it.”
“We’re supposed to be the smart class.”
MAGGIE’S EXPERIENCE
TH
E O
PP
OR
TU
NIT
Y M
YT
H44

1.5x MORE grade- appropriate assignments
Compared to classrooms containing mostly (>50%) students of color, classrooms with mostly white students tended to receive:
3.6x MORE grade- appropriate lessons
2.1x MORE grade- appropriate assignments
Compared to classrooms with primarily (>75%) low-income students, classrooms with primarily higher-income students tended to receive:
5.4x MORE grade- appropriate lessons
FIGURE 9 | STUDENT ACCESS TO HIGH-QUALITY ACADEMIC EXPERIENCES
We’ve seen that most students don’t have access
to the key resources that lead to better outcomes
in school. But we also found that access to those
resources varies widely.
Remember the eighth graders who were asked to fill in
the vowels in vocabulary words? In another eighth-grade
English class in the very same district, students the same
age, living in the same city, read A Mighty Long Way, a
memoir by one of the Little Rock Nine. Then they wrote
an informational essay analyzing historical events. Unlike
their peers, these students had the chance to do work that
will set them up for high school English, the next step on
their school journeys.
Notably, there was more variation in access to the four
key resources between classrooms than between districts
or schools. The average classroom in our top quartile for
assignment quality, for example, provided students grade-
appropriate assignments 49 percent of the time. But within
the same school, the average bottom-quartile classroom did
so only 13 percent of the time. When given the chance
to work on grade-appropriate assignments, students in
both kinds of classrooms were equally likely to rise to
the bar—but some students received far more of those
opportunities than their peers right down the hall. It’s
what parents and students know but can’t control: Which
class you land in can make or break a school year. Over
time, it can mean the difference between a student being
prepared to meet their goals—or not.
To make matters worse, this isn’t generally a matter of
luck, with a relatively random and equal distribution of
good and mediocre school experiences across all student
subgroups. Positive experiences are few and far between
overall, but they’re also distributed inequitably.
While we found that students of all backgrounds were
capable of doing grade-appropriate work when given
the opportunity—and we did find classrooms that could
be considered positive outliers serving students of all
backgrounds—some groups of students were consistently
given fewer of those opportunities. Students of color and
TH
E O
PP
OR
TU
NIT
Y M
YT
H45

those from low-income backgrounds were less likely
than their white and higher-income peers to be in
classrooms with grade-appropriate assignments and
strong instruction.
These gaps are not explained by the fact that a
disproportionate number of students in those subgroups
start the year behind grade level. It’s conceivable, for
example, that teachers would peg their assignments to
their students’ prior levels of achievement—giving a
fourth grader an assignment meeting first-grade standards
if that student has previously been working at a first-grade
level. But that did not prove to be the case. Even when we
controlled for prior academic achievement, classrooms
with more low-income students, for example, had fewer
high-quality academic experiences than others.31 Among
all students who began the year with achievement above
the state average, students from low-income families
were in classes that typically provided grade-appropriate
assignments only 20 percent of the time, compared to
30 percent of the time for students from higher-income
families. Both groups of students were outperforming the
average student in the state, but those from low-income
backgrounds still spent about one month less on grade-
appropriate assignments.
In other words, students like Hajima, who seek challenge
and have generally excelled at whatever is put in front of
them, are less likely to have opportunities that will ready
them to meet their academic goals—not because they’re
not able to do the work, but because they are Black, or
Latinx, or come from low-income families. And students
who need support to catch up don’t have adequate
opportunities to do that, either, even though our research
shows they benefit more from those opportunities than
their peers who have previously been better served by
school and have been higher-achieving as a result.
Across all districts, classrooms with stronger academic
offerings had higher proportions of white students and
those from higher-income backgrounds. Classrooms with
more than 50 percent white students had 53 percent more
grade-appropriate assignments, while classrooms serving
more than 75 percent students from higher-income
backgrounds had more than twice as many (Figure 9).
Students of color and students from low-income
backgrounds were disadvantaged again when it came to
opportunities to do the deep thinking in their classrooms.
Mostly white classrooms offered about three-and-a-half
times as many strong instructional practices, and higher-
income classrooms offered more than five times as many.
Students in mostly white and higher-income classrooms
also reported higher levels of engagement: 23 percent
more engaging experiences in mostly white classrooms,
and 21 percent more engaging experiences in mostly
higher-income classrooms.32
Students of color and those from low-income
backgrounds were not only offered weaker academic
experiences, they were also subject to an even more
pronounced mismatch between the information they
brought home about their performance in school and
their actual mastery of critical, grade-appropriate skills.
Even when we controlled for prior
academic achievement, classrooms
with more low-income students
had fewer high-quality academic
experiences than others.
46T
HE
OP
PO
RT
UN
ITY
MY
TH

FIGURE 10 | STUDENT PERFORMANCE ON STANDARDIZED TESTS BY LETTER GRADE AND STUDENT RACE/ETHNICITY
Students of color received grades that less accurately reflected their mastery of rigorous content, as measured
by multiple types of assessments.
D or lower
GRADES 3-8 STATE TESTS
C B A
100%
80%
60%
40%
20%
0%
ACT & SAT
D or lower C B A
100%
80%
60%
40%
20%
0%
AP TESTS
D or lower C B A
100%
80%
60%
40%
20%
0%
White students Students of color
PER
CEN
T SC
OR
ING
3
OU
T O
F 5
OR
HIG
HER
PER
CEN
T M
EETI
NG
CO
LLEG
E
REA
DIN
ESS
BEN
CH
MA
RKS
PER
CEN
T M
EETI
NG
G
RA
DE-
LEV
EL E
XPE
CTA
TIO
NS
TH
E O
PP
OR
TU
NIT
Y M
YT
H47
TH
E O
PP
OR
TU
NIT
Y M
YT
H In four out of five districts we studied, white students
receiving Bs were at least 10 percentage points more likely
to have mastered grade-level standards on state tests than
their classmates of color who also received Bs. In two
districts, white students earning As had more than a
25 percentage point higher rate of grade-level mastery than
students of color who also earned As. Across all districts,
white students who earned Bs were nearly as likely to have
mastered the standards as students of color who earned As.
This trend was even more pronounced in courses and tests
directly aimed at college: Whereas 78 percent of white
students who earned an A in a math or English AP class
passed the AP exam, only 30 percent of students of color
who earned the same grade did so (Figure 10).33
Again, this doesn’t reflect different abilities; we’ve already
seen that students of all backgrounds are capable of
meeting the bar set by grade-level standards, given the
opportunity. Instead, it reflects the fact that at every
turn, some groups of students get fewer opportunities to
even try to reach that bar. Those disparities are rendered
largely invisible to students and families because the
grades they bring home don’t capture an honest picture
of their readiness to meet their goals. Opportunity is a
scarce resource, and it’s not doled out equitably.
More research is needed to fully understand the root causes
of these inequities. But in the districts we studied, we saw
a pattern related to teachers’ expectations of students
of color that is worth unpacking: Among classrooms
where students were at least 75 percent Black or at least
75 percent Latinx, 66 percent of teachers who were the
same race or ethnicity as the majority of their students
had high expectations. In classrooms with similar student
demographics but with teachers who were a different race
or ethnicity than the majority of the class, just 35 percent
of teachers reported high expectations (Figure 11).
Those results held true when we controlled for
students’ prior achievement.
As we’ve seen, expectations influence what happens in the
classroom. Remember Raymond’s fifth-grade math class,
where the teacher interrupted her students and offered so
few opportunities for them to explain their thinking? Most
of the students in that classroom, including Raymond, were
Black. Their teacher was white. This teacher, like many others,
reported support for grade-level standards in theory, but
said she did not believe her students could meet such a bar.
Her instruction gave them few opportunities to try. Of course,
it is impossible to say with certainty what motivated the
choices around content and instruction in this or any
particular classroom—but the choices matter regardless.
It’s also worth further exploring the ways teacher
demographics influence engagement. Black and Latinx
students who had a teacher of their same racial or ethnic
background were 19 percent more likely to feel engaged,
compared to students who did not have that experience.
Isaac’s engagement in his physics class, and his relationship
with the teacher, Mr. Adams, illustrates this. Mr. Adams,
like Isaac, is Black. Their shared background is certainly
not the only factor that informs their relationship:
Some of Isaac’s most influential teachers, like his English
teacher, are white. But from Isaac’s perspective, what
these teachers have in common is a deep belief in his
potential, which has helped him invest in school. “They
always tell me, ‘You can do it. You can do it,’” Isaac says.
That opportunity—to have a teacher who does what
Mr. Adams does for Isaac—is vital. We found that students
who believed their teachers expected them to learn a lot
When students who started the
year off behind grade level were
given more grade-appropriate
assignments, stronger instruction,
deeper engagement, and higher
expectations, the gap between
these students and their higher
achieving peers began to
narrow substantially.
48

For students of color working at all achievement levels, teachers of color tended to have higher expectations.
35%of teachers who did not share their students’ race or ethnicity held high expectations
66% of teachers who shared their students’ race or ethnicity held high expectations
Among classrooms with at least 75% Black or at least 75% Latinx students...
FIGURE 11 | TEACHER EXPECTATIONS FOR STUDENT SUCCESS BY TEACHER/STUDENT RACE MATCH
TH
E O
PP
OR
TU
NIT
Y M
YT
H
were also more engaged in their lessons. In our sample,
a student of color was more likely to have a teacher with
high expectations when they had the chance to learn in a
classroom led by a teacher who shared their race or ethnicity.
But given the lack of diversity in the teacher workforce
nationwide, many students will never have that chance.
Many students also miss out on the opportunity to
be held to high expectations (and have access to the
other key resources) simply because they haven’t had
those opportunities in the past, and opportunity begets
opportunity. Our research affirms Maggie’s intuition that
students’ prior achievement influences the quality of their
school experiences moving forward. Across all our partner
districts, students who started the year higher achieving
generally had stronger academic opportunities than those
who started the year behind. In classrooms with the most
grade-appropriate assignments, students started off the
year more than five months ahead of those in classrooms
with the least grade-appropriate assignments.34
It’s an entirely logical but unacceptable result of
inequitable access to the four key resources. Students
who don’t have grade-appropriate assignments or
strong instruction never even have a chance to show
they can do grade-level work, so they’re pegged as “low
achievers.” These students and their families are blamed
for being “low-performing,” and they’re punished with
yet more unacceptable experiences. They will have few
opportunities to ever catch up.
The students who start each school year with an edge
based on their prior experiences and achievement—and
who are therefore most likely to get better experiences
going forward—are disproportionately white. They come
disproportionately from higher-income families, are native
English speakers, and are considered general education
students. Those who start off the year needing an extra
boost—and who are therefore the least likely to get it—
are disproportionately students of color, from low-income
families, new English speakers, or those with mild to
moderate disabilities.
49

The bottom line is this: Students who have greater access
to the four key resources that comprise high-quality
academic experiences tend to do better in school. They’re
likely to rise to a higher bar, even if they start the school
year with barriers. And just as the allocation of those
resources creates and reinforces opportunity gaps, it also
has the power to begin to close those gaps. When students
who started the year off behind grade level were given
more grade-appropriate assignments, stronger instruction,
deeper engagement, and higher expectations, the gap
between these students and their higher-achieving peers
began to narrow substantially—by more than seven
months of learning in a single school year based on
better assignments alone.
If that growth remained steady and cumulative, year
after year, we can extrapolate that students who started
the year behind grade level would catch up to their
state average within five years (Figure 12). Students of
color and those from low-income families would do the
same. Their classrooms would not need to be perfect: In
the classrooms where we saw the most growth, students
worked on grade-appropriate assignments just 52 percent
of the time (compared to 26 percent across all classrooms).
Even raising the floor by a reasonable amount can make a
meaningful difference.
The “achievement gap,” then, isn’t inevitable. It’s baked
into the system, resulting from the decisions adults make,
consciously and unconsciously, about which students get
what resources. It’s a gap of our own design.
At TNTP, we believe those of us working in schools
have a responsibility to design a better system, to
create the programs and structures that disrupt
the inequities of the status quo. There is an urgent
need to authentically engage students and families
in creating paths that honor the aspirations, talents,
and needs of each student.
But the hard truth is that we have also seen a lot
of “innovation” that continues to fall short of our
basic promise to students. All too often, “meeting
kids where they are” becomes an excuse for holding
persistently low expectations, and ineffective
“differentiation” means some students get less
and never have the chance to catch up.
No matter what the tagline, any curriculum, program,
or model that does not allow students consistent
opportunities to engage with grade-appropriate
assignments, to do the thinking in their lessons,
and to engage deeply with what they are learning
is effectively perpetuating the opportunity myth.
Good intentions aside, if we aren’t giving all students
those opportunities regularly, we are systematically
denying them the chance to even try to master the
skills they need to reach their goals.
GOOD INTENTIONS AREN’T ENOUGH
FIG. 12 NOTE: Each panel represents all students in participating classrooms with a prior-year test result in the same subject. Starting Point represents the average test score, standardized against all students in the state, in a school year prior to the year in which the study took place (e.g., the 2015-2016 school year). Year 1 represents the average standardized test score at the end of the school year during our study (i.e., 2016-2017). Years 2 – 5 represent how these averages would change if the rate of growth (or decline) seen from Starting Point to Year 1 continued indefinitely at the same rate. To reduce the effect of outliers, students beginning more than 2.5 standard deviations away from the state mean were dropped (3% of all students). “Students beginning the year substantially behind grade level” are students whose starting point test score was at least 0.5 standard deviations below the state average. See the Technical Appendix for more details on how we standardized test scores and how we identified students’ prior achievement.
50T
HE
OP
PO
RT
UN
ITY
MY
TH

The “achievement gap” is not inevitable. It’s baked into a system where some students get more than others.
FIGURE 12 | MEAN ACHIEVEMENT BY DEMOGRAPHIC AND ASSIGNMENT QUALITY, AND EXTRAPOLATED GROWTH
MO
NTH
S O
F LE
AR
NIN
G
STUDENTS OF COLOR
Starting Point Year One Year Two Year Three Year Four Year Five
0
-5
-10
-15
-20
-25
State Average
MO
NTH
S O
F LE
AR
NIN
G
STUDENTS FROM LOW-INCOME FAMILIES
Starting Point Year One Year Two Year Three Year Four Year Five
0
-5
-10
-15
-20
-25
State Average
MO
NTH
S O
F LE
AR
NIN
G
STUDENTS BEGINNING SUBSTANTIALLY BEHIND GRADE LEVEL
Starting Point Year One Year Two Year Three Year Four Year Five
10
0
-10
-20
-30
-40
State Average
At least 25% of assignments were grade appropriate
Less than 25% of assignments were grade appropriate
Actual results Extrapolated results
TH
E O
PP
OR
TU
NIT
Y M
YT
H51


Where is Isaac now?
He’d struggled deeply in ninth and 10th grades. He’d had a series of interactions
with adults in school who sent him the message—implicitly and in some cases very
explicitly—that he wouldn’t make it. He felt himself drifting toward that reality.
But then he got himself back on track.
“Who wants to see their parents sad because you didn’t make it?” Isaac says.
“That’s not the student I wanted to be.”
From his perspective, earning his diploma was an essential step toward living the
life he wants.
“That diploma means I worked hard,” he says. “I made it this far, through all these years
of school. I want to go to college and be a registered nurse. I feel like I’m ready.”
In the spring, Isaac graduated, alongside his classmates. He’s already enrolled in
a nursing program at a local vocational college specializing in healthcare careers;
he started his coursework even before graduation. He didn’t get a summer vacation,
but it hardly mattered.
As he explains the urgency of meeting his own definition of success, he wipes away
tears. “This is something I’ve always wanted to do. I have to live it.”
“I feel like I’m ready.”
–Isaac
TH
E O
PP
OR
TU
NIT
Y M
YT
H53

Students like Isaac are planning their lives around the promises we attach to
the diplomas they work so hard to earn. And yet we know that for far too many
of them, those diplomas will let them down. The opportunity myth promises
that success in school is the first step on the path to success in life, but the
system we’ve built undermines that promise at every turn.
That system reinforces the flip side of the opportunity myth, too: the
pernicious assumption that if students fail, it’s because they didn’t take the
chance they’d been offered. It is the result of their abilities, their race, their
socioeconomic background, or their choices. For those of us working in school
systems, the opportunity myth makes life comfortable. It allows us to operate
in good faith to help kids succeed, while accepting the false belief that for
many of them, there’s nothing more we can do.
Our research lays that all bare. It shows that while many students do have
barriers to overcome to succeed in school, some of the biggest barriers are
created by decisions very much within our control: whether students get the
opportunity to work on grade-appropriate assignments, or are systematically
assigned work that is appropriate for kids several years younger; whether they
have teachers who ask them to find the answers to challenging problems, or
who think it’s acceptable to assign them the task of copying answers; whether
adults ask students and parents about their goals, or assume that because
they’re Latinx or Black or don’t have a lot of money, college is probably
unrealistic. And then, as a field, we’ve covered up the racist, classist, and just
plain unfair choices we’ve made, by telling parents and students—particularly
students of color—that they are doing fine, when all the evidence from their
classroom work and their exam scores suggests that they are not.
CONCLUSION
54T
HE
OP
PO
RT
UN
ITY
MY
TH

What would it take to make students’ school opportunities more than a myth?
TH
E O
PP
OR
TU
NIT
Y M
YT
H
We can start by acknowledging and understanding the unacceptable
experiences we’ve created for millions of students: three-quarters of the
school year or more wasted in classes that are boring, too easy, or irrelevant
to their life goals; worse experiences for students who need better ones the
most; the tacit belief that some students are less capable and less deserving
than others.
We can own up to our role in perpetuating these problems—because if you’re
reading this and you work in education in any capacity, you bear some of
the responsibility. That includes teachers, whose daily choices influence
students’ outcomes in the most visible ways, but it includes others as well.
Teachers often find themselves forced to implement poor choices made by
school leaders, superintendents, legislators, schools of education, textbook
companies, and others; or asked to implement better decisions without
adequate training and support.
It certainly includes us at TNTP. These conclusions have been painful because
we’ve been part of the problem. For many years, for example, we trained new
teachers to lead compliant students through a standard curriculum, using
standard instructional techniques, and believed that if they did so, students
would succeed at high levels. We are actively working to shift our approach to
ensure that all students—and particularly those who have been historically
under-served, including in our own work—get the resources we write about
that they need to succeed.
Most importantly, we can listen to students and learn from their experiences.
Across all five districts we studied, we saw a promising trend: When we make
different choices about how resources are allocated—when all kids get access
to grade-appropriate assignments, strong instruction, deep engagement, and
high expectations, but particularly when students who start the year behind
receive these resources—achievement gaps shrink. They shrink substantially
enough that if we extrapolate the results we saw in one year over five years,
achievement gaps would disappear, given more equitable access to the four
key resources. If we made different choices, millions of students with big
goals for themselves, most of whom are already doing what they’re asked in
school, would be prepared to live the lives they aspire to.
CONCLUSION
55

Of all the students we spoke to, perhaps Maggie explained
the opportunity myth most explicitly: “I expect to be
getting the knowledge I need to go to college and get a
career, to do whatever it is I plan on doing.” It shouldn’t
be an unreasonable expectation. And yet, most students
will find themselves let down.
It’s time to change that.
What we’ve learned from students about their experiences
has created a new center of gravity for our work. We hope
it will do the same for others seeking fundamental changes
to our school systems. We now have clearer answers than
ever about how and why we’re failing to provide so many
students with the experiences they need to reach their
goals. If we stay focused on those experiences, we’ll be
on a path to sustainable change because the work will be
rooted in the experiences of those we serve.
We readily acknowledge that we don’t have a detailed
operational plan to improve student experiences at
scale. But we believe it’s time to move beyond important
but narrow debates—from how to measure teacher
performance to charter versus district to the role of
standardized testing—and return to the basic guiding
principle that brings us to this work: the right of every
student to learn what they need to reach their goals. Over
the next several years, we will partner with school systems,
educators, students, and parents to build our expertise
about how to give all students more of the key resources
they need and deserve, in different communities and
contexts. We’ll certainly share what we learn as we go,
and we hope you will, too.
But we think we know where to begin, and it starts with
making students’ daily experiences the center of our work.
RECOMMENDATIONS
We call on all adults whose choices affect students’ experiences in
school—particularly school, district, and state leaders, as well as
external partners like ourselves—to make two core commitments
to students and families:
1 | Every student should have access to
grade-appropriate assignments, strong
instruction, deep engagement, and teachers
with high expectations, every day, in every
class—regardless of their race, ethnicity,
or any other part of their identity. We will
continually investigate the extent to which
our students receive this access and report
on our progress.
2 | Every student and family is an authentic
partner and should have real opportunities
to shape the experiences students have
in school, receive accurate and accessible
information about students’ progress, and
have a legitimate role in decision-making.
We will continually seek feedback from all
students and families about whether we’re
living up to this commitment.
56T
HE
OP
PO
RT
UN
ITY
MY
TH

Students are at the heart of this report, and we learned
some profound lessons through the process of asking them
about their goals and experiences. They don’t have all the
answers, to be clear—nor is it their job to tell us how to
do ours better. But they proved again and again, through
their nuanced, sophisticated, and practical observations,
that they are the best experts we have about the current
state of our schools. Above all, we heard from students
that they want to be challenged in school, enjoy their
learning, and be treated with respect, care, and dignity.
They’re asking us to do better, so we should.
Many of us believe in these commitments already, but
in practice we have maintained the status quo. We
think we’re not part of the problem, but the evidence
says otherwise. If you have influence over the school
experience of even a single student who is not being
prepared to meet their goals, this applies to you. If you
don’t know specifically, with direct evidence, how these
commitments are being upheld in your classroom, school,
system, or state, then they are not being upheld.
We can be this categorical because we made this mistake
ourselves. We have often thought we were upholding these
commitments, while settling for less in practice. For
example, we thought we recognized the need to give all
students access to grade-appropriate content, but we have
trained new teachers with ineffective scaffolding practices
that gutted the rigor of assignments. We have talked
about the importance of listening to students, but we have
failed to support teachers to use student survey data to
make improvements.
TH
E O
PP
OR
TU
NIT
Y M
YT
H
Making these commitments means doing things differently.
What follows is a list of five big things students told us they want
in school. This is not a checklist; it’s a collection of challenging
but workable solutions that school and system leaders need to
dig into, implement in the ways that make sense for their school
communities, and continually revisit.
For action guides for students, parents and families, teachers,
school leaders, district leaders, and state policymakers, visit
opportunitymyth.tntp.org/act
57

1. Ask students and families directly about their
goals and school experiences; listen to what they
share; and then act on what they tell you.
Currently, we operate on assumptions about students’ goals
and what students want from school. So many decisions
about school are made in administrative offices that are
far from the real daily experiences of students. In our
research, we saw that the vast majority of students have
big goals for themselves beyond high school, but we also
found that school isn’t setting up most students to meet
those goals—and that different choices at the classroom,
school, and system levels can change that. To start, asking
students explicitly about their experiences can glean
indispensable data.
By listening to students, we have access to rich and
nuanced information that could help us shift away from
focusing on the success of groups of students (generally
pegged to the average) to focusing on the success of
individuals. While students don’t have all the answers,
their perspectives provide a critical bellwether for how
well we’re doing our jobs. When their experiences are
consistently lousy and unchanging, whatever interventions
are presently in place are not working. Continued inaction
in the face of that evidence—given that we can point to
the relationship between different access to high-quality
academic experiences and different outcomes for
students—is no longer defensible.
This doesn’t mean we should jump to the typical
student and family engagement process, where those of
us with power ask for input about decisions that have
largely already been made. Instead, we are advocating
for students and parents to be equipped with the tools
they need to pressure their school systems to replace the
opportunity myth with real opportunity and transparency,
and for educators and system leaders to put students’
daily experiences and access to grade-appropriate
assignments, strong instruction, deep engagement, and
high expectations at the center of decision-making.
To hold ourselves accountable for this work, the views
of students and parents should not only be public, but
easily accessible to all stakeholders. We should share with
students and parents how we are changing our approach
based on their valued input. And report cards, in addition
to providing more detailed information about student
progress, should answer one simple question for parents:
Is my child on track to graduate high school ready for
college, and if not, when and how will they be on track?
2. Make greater access to grade-appropriate
assignments an urgent priority for all students,
no matter what their race, income level, or current
performance level.
Students who get assignments that are appropriate for
their grade have stronger academic outcomes. But the
students in our sample spent more than 500 hours per
school year in core subjects on assignments that did not
meet that bar. Moreover, students that school has let
down in the past—like students of color and those from
low-income backgrounds—were even less likely to get
access to grade-appropriate assignments. When they did,
that high-quality content helped close academic gaps
between them and their peers. We found that classrooms
with students who tended to start behind that worked on
grade-level assignments, on average, even 50 percent of
the time gained seven months of learning in a single year.
Getting better assignments in front of all students more
often will raise the floor for students’ experiences, particularly
for students of color and those from low-income families.
A higher baseline would mean that many more students
are getting good enough experiences in school.
To ensure that all students have access to grade-
appropriate assignments, stakeholders should first assess
how the assignments their students are currently working
on stack up. How much time are students spending
on grade-appropriate content? After that gut check,
stakeholders should make sure that teachers are using
high-quality, aligned instructional materials on a daily
basis. But we cannot leave teachers to sink or swim;
helping students with vastly different needs, some of
whom may be several grade levels behind, to succeed with
grade-level materials requires a lot of experience and skill.
So we must provide teachers materials-based professional
learning to ensure that teachers know the value in grade-
appropriate assignments and how to use them well.
FIVE WAYS TO IMPROVE THE STUDENT EXPERIENCE
58T
HE
OP
PO
RT
UN
ITY
MY
TH

3. Give all students, especially those who are
behind grade level, access to instruction that
asks them to think and engage deeply with
challenging material.
Requiring students to own the thinking in their lessons
asks students to take a risk in front of their peers, since
it’s possible they could be wrong. Even in classrooms
where we saw high-quality assignments, we often observed
students missing out on opportunities to take that risk
and do the thinking with rigorous content. This included
classrooms where teachers did most of the talking, where
students were asked only closed-ended questions that
didn’t require critical thinking, where students were
interrupted by teachers as they were sharing their answers,
or where they weren’t given ample “think time” before
the teacher stepped in with the answer. We found that
students who started the school year behind academically
particularly benefitted from strong instruction: In these
classrooms, greater access to strong instruction led students
to close the gap with their peers by about six months. In
addition, students appreciated lessons where they were
given the chance to do the thinking: In classrooms where
we observed strong instruction, we also saw a 31 percent
increase in engagement levels.
Once students have access to grade-appropriate
assignments, stakeholders should work to make sure that
students have the chance to do the kind of hard thinking
with that content that they’ll be expected to do in college
or in their careers. Make sure all teachers and leaders
realize that is the expectation—and then provide coaching
supports and clear, actionable feedback to teachers about
whether or not students are consistently experiencing
engaging, strong instruction.
4. Ensure educators enact high expectations
for student success by seeing firsthand that
students are capable of succeeding with more
rigorous material.
We found that when teachers have high expectations for
students’ success, they have a meaningful positive impact
on academic achievement. We also saw that a majority
of teachers do not report having high expectations for
their students’ success. Significantly, among classrooms
where students were at least 75 percent Black or at least
75 percent Latinx, 66 percent of teachers who were the
same race or ethnicity as the majority of their students
had high expectations. In classrooms with similar student
demographics but with teachers who were a different race
or ethnicity from the majority of the class, just 35 percent
reported high expectations. Those results held true when
we controlled for students’ prior achievement. Since
teachers with lower expectations were more likely to
provide weaker assignments and ask less of their students,
low expectations translated into some groups of students
getting less access to grade-appropriate assignments and
strong instruction. This inequitable allocation of key
resources in turn produces inequitable outcomes for students.
Raising expectations certainly isn’t on the shoulders of
teachers alone. We studied expectations of teachers here,
but there is no evidence that we would see different results
had we studied principals, central office personnel, or non-
profit leaders. As a field, we have failed to acknowledge
that the expectations decision-makers hold affect students.
Choices about everything from staffing to instructional
materials are informed by the biases, both implicit and
explicit, of the adults making those choices. When we
expect some students to do less, in school and in life, we
offer them less, in everything from the quality of their
assignments to the weight their parents’ opinions are given.
At every level of the system, we need to reckon with this
fact, acknowledge the ways in which our expectations
affect the choices we make for students, and develop
strategies to ensure that all students have access to adults
with consistently high expectations for their success.
This has to include work up and down the school system.
Teachers need ample opportunities to develop the skills
59T
HE
OP
PO
RT
UN
ITY
MY
TH

60T
HE
OP
PO
RT
UN
ITY
MY
TH
For further ideas and resources,
see our action guides for students
and families, teachers, school
leaders, system leaders, and
state policymakers. Visit
opportunitymyth.tntp.org/act
to download your action guide.
necessary to give students (including those who are
working below grade level) grade-appropriate work.
That includes opportunities to collaborate with peers and
learn from educators with track records of success. But if
we’re going to make this huge ask of teachers, it should
be accompanied by fair compensation and investments in
better working conditions, from strong school leadership
to adequate facilities and resources.
We’re all steeped in a culture of racism and systemic
inequity, and undoing implicit bias is incredibly difficult
work. So we know that as a field, we have a significant
amount to learn here. We also know that many existing
attempts to address racialized low expectations are
ineffective or have never been rigorously studied35 and
may even cause adults to double down on their low
expectations.36 But addressing specific behaviors that
influence students’ experiences can serve as a path toward
unraveling implicit bias, rather than the other way around.
In our own teacher and principal training work, for
example, we have seen evidence that once teachers and
school leaders see that students who are behind can be
successful on rigorous assignments, they are much more
willing to provide rigorous experiences to their students.
5. Conduct an equity audit to identify school- and
district-level decisions—from the diversity of staff
at all levels to which students are enrolled in honors
courses—that give some students greater access
than others to key resources.
All students deserve and need equitable access to the four
key resources: grade-appropriate assignments, strong
instruction, deep engagement, and high expectations.
But we’ve seen that some groups of students—namely
students of color, students from low-income backgrounds,
students with mild to moderate disabilities, and English
language learners—have less access than their peers.
They are more likely to be in classrooms with weaker
assignments and instruction, less likely to be engaged, and
are subjected to lower expectations. Given that we know
that greater access to the four key resources improves
outcomes for students—and especially students who
start the year behind academically—the status quo is
not morally defensible.
The root causes of this inequitable allocation of resources
are complex, and there’s no quick fix. But identifying
and then actively working to dismantle structures that
privilege already advantaged groups of students at the
expense of their peers is non-negotiable work. This is not
solely the work of addressing individual implicit biases. It
requires addressing systemic choices and decisions that
result in schools being “places with predictable, systematic
inequalities in experience and outcomes based on people’s
social group memberships—advantaging people from some
social groups while disadvantaging people from others.”37
It is also incumbent that we work to diversify the
education workforce, particularly by hiring and retaining
staff in counter-stereotypical roles (for example, ensuring
that men, particularly men of color, are represented
among teachers in elementary grades). To do this, we
need to address the systemic barriers that keep teachers
of color out of urban and rural classrooms and commit
to a staffing model that values diversity. This will support
us all in raising the bar for what we expect for students
of color, but can also provide a powerful model of high
expectations for all students.38 We must also look at the
policies and systems that determine things like course
access, curriculum adoption, and grading—all of which
can and do contribute to the inequitable allocation of
high-quality school experiences.

TH
E O
PP
OR
TU
NIT
Y M
YT
H
1 All students’ names have been changed throughout.
2 McFarland, J., Hussar, B., Wang, X., Zhang, J., Wang, K., Rathbun, A., Barmer, A., Forrest Cataldi, E., & Bullock Mann, F. (2018). The condition of education 2018 (NCES 2018-144). U.S. Department of Education. Washington, DC: National Center for Education Statistics. Retrieved from https://nces.ed.gov/pubsearch/pubsinfo.asp?pubid=2018144
3 Latinx is a gender-neutral term that refers to individuals of Latin American origin or descent.
4 College remediation rates based on students starting at a four-year college. These rates are 60% among all students, 78% among Black students and 75% among Latinx students beginning at a two-year college. See Table 2 in Chen, X. (2016). Remedial coursetaking at US public 2-and 4-year institutions: Scope, experiences, and outcomes. Statistical Analysis Report (NCES 2016-405). Washington, DC: National Center for Education Statistics. Retrieved from https://nces.ed.gov/pubs2016/2016405.pdf
5 Barry, M.N. & Dannenberg, M. (2016). Out of pocket: The high cost of inadequate high schools and high school student achievement on college affordability. Washington, DC: Education Reform Now and Education Post. Retrieved from https://edreformnow.org/policy-briefs/out-of-pocket-the-high-cost-of-inadequate-high-schools-and-high-school-student-achievement-on-college-affordability/
6 Achieve. (2015). Rising to the challenge: Are high school graduates prepared for college and work? Washington, DC: Achieve. Retrieved from https://www.achieve.org/rising-challenge
7 Drake, G., Pomerance, L., Rickenbrode, R., & Walsh, K. (2018). Teacher prep review. Washington, DC: National Council on Teacher Quality. Retrieved from https://www.nctq.org/publications/2018-Teacher-Prep-Review
8 TNTP. (2015). The Mirage: Confronting the hard truth about our quest for teacher development. Brooklyn, NY: TNTP. Retrieved from https://tntp.org/publications/view/evaluation-and-development/the-mirage-confronting-the-truth-about-our-quest-for-teacher-development
9 Herold, B. & Molnar, M. (2014). Research Questions Common-Core Claims by Publishers. Education Week (March 3, 2014).
10 1,200 hours every year is based on a typical school year of 180 days, with 6.64 hours per school day. See National Center for Education Statistics. (2008). Number of hours in the school day and average number of days in the school year for public schools, by state: 2007–08. Schools and Staffing Survey (SASS). U.S. Department of Education Washington, DC: National Center for Education Statistics. Retrieved from https://nces.ed.gov/surveys/sass/tables_list.asp. See also McFarland, J., Hussar, B., Wang, X., Zhang, J., Wang, K., Rathbun, A., Barmer, A., Forrest Cataldi, E., & Bullock Mann, F. (2018). The condition of education 2018 (NCES 2018-144). U.S. Department of Education. Washington, DC: National Center for Education Statistics. Retrieved from https://nces.ed.gov/pubsearch/pubsinfo.asp?pubid=2018144
11 The adjusted cohort graduation rate in 2015-2016 was 84%, the highest it’s ever been. McFarland, J., Hussar, B., Wang, X., Zhang, J., Wang, K., Rathbun, A., Barmer, A., Forrest Cataldi, E., & Bullock Mann, F. (2018). The condition of education 2018 (NCES 2018-144). U.S. Department of Education. Washington, DC: National Center for Education Statistics. Retrieved from https://nces.ed.gov/pubsearch/pubsinfo.asp?pubid=2018144
12 National Center for Education Statistics. (2018). Digest of education statistics, 2016 (NCES 2017-094), Chapter 3. U.S. Department of Education. Washington, DC: National Center for Education Statistics. Retrieved from https://nces.ed.gov/pubsearch/pubsinfo.asp?pubid=2017094
13 NAEP defines four categories of trajectories based on the type and amount of credits earned in each core subject: rigorous, mid-level, standard, and below-standard. Across all our partner systems, 17% of students were in a rigorous trajectory, 45% were in a mid-level trajectory, 20% were in a standard trajectory and 17% were in a below-standard trajectory. See the Technical Appendix for more details about how we applied these definitions to our participating districts’ data. For the NAEP study, see: Nord, C., Roey, S., Perkins, R., Lyons, M., Lemanski, N., Brown, J., & Schuknecht, J. (2011). The nation’s report card: America’s high school graduates (NCES 2011-462). U.S. Department of Education. Washington, DC: National Center for Education Statistics. Retrieved from https://nces.ed.gov/nationsreportcard/pdf/studies/2011462.pdf
14 We estimated the amount of learning in a classroom by comparing its students’ actual state standardized test scores to the state standardized test scores that were expected of them given how they had scored historically, as well as other characteristics like their race/ethnicity and family income. See the Technical Appendix for more details about this approach and additional analysis results. Throughout the report, we make the commonly used assumption that a difference of 0.25 standard deviations represents 9 months of learning. See Kane, T. J., & Staiger, D. O. (2012). Gathering feedback for teaching: Combining high-quality observations with student surveys and achievement gains. Research Paper. MET Project. Seattle, WA: Bill & Melinda Gates Foundation. Retrieved from https://eric.ed.gov/?id=ED540960
15 We defined classrooms where students started the year behind as those classrooms where students’ average state standardized test score in the previous school year was at least 0.5 standard deviations (or 18 months) below the average score among all students in the state. For each key resource, we split this subset of classrooms in half so that one group represented the 50% of these classrooms with the highest-rated
assignments, lessons, engagement, or expectations, and the other represented the 50% of classes with the lowest scores on these resources. See the Technical Appendix for more details about this approach.
16 Because only grade 3-12 students completed student surveys, these percentages exclude K-2 students.
17 Only classrooms that had a minimum number of submitted assignments, observed lessons, or student surveys were included. See the Technical Appendix for how we set these minima.
18 Assuming a single class contains 180 instructional hours in a school year, the average ELA, math, science, and social studies classroom in our study spent, respectively, 122, 127, 164, and 166 hours on assignments that were not appropriate for the grade. See the Technical Appendix for details on how we estimated the amount of class time spent with grade-appropriate assignments, with strong instruction, or engaged.
19 Though the amount of time in school varies state to state, in all analyses, we assume a single class requires 180 hours in a school year, or 9 months. See National Center for Education Statistics. (2008). Number of hours in the school day and average number of days in the school year for public schools, by state: 2007–08. Schools and Staffing Survey (SASS). U.S. Department of Education. Washington, DC: National Center for Education Statistics. Retrieved from https://nces.ed.gov/surveys/sass/tables_list.asp
20 See the Technical Appendix for more details on how we reviewed and analyzed districts’ curricular and assessment policies, as well as how we rated materials and assessments themselves.
ENDNOTES
For our complete methodology, including further explanation of our analytical approaches and full analysis results, see the Technical Appendix at tntp.org/opportunitymyth
61

21 Our definition of strong instruction did not require teachers to earn perfect scores on the four domains we observed—classroom culture, content, instructional practices, and student ownership—so it was possible for a lesson to be classified as “strong” but not have high ratings on every domain. In this example, many lessons (295) had the highest possible ratings on content, but lower ratings on instructional practices and student ownership. See the Technical Appendix for how we defined “strong instruction.”
22 Scherer, M. (2008). Learning: Who’s job is it? Educational Leadership, 66(3), p.7. Retrieved from http://www.ascd.org/publications/educational-leadership/nov08/vol66/num03/Learning@-Whose-Job-Is-It%C2%A2.aspx.
23 The interest, enjoyment, and concentration approach to measuring engagement is based on Shernoff, D., Csikszentmihalyi, M., Schneider, B., & Shernoff. E. (2003). Student engagement in high school classrooms from the perspective of flow theory. School Psychological Quarterly, 18(2), pp. 158–176. https://doi.org/10.1521/scpq.18.2.158.21860
24 The survey questions we used to represent worth were partly adapted from Uekawa, K., Borman, K. & Lee, R. (2007). Student engagement in U.S. urban high school mathematics and science classrooms: Findings on social organization, race, and ethnicity. The Urban Review, 39(1), pp. 1–43. https://doi.org/10.1007/s11256-006-0039-1. See the Technical Appendix for more details on how we used survey questions to categorize students’ perceptions of engagement and worth.
25 Romero, C. (2015). What we know about belonging from scientific research. Palo Alto, CA: Mindset Scholars Network. Retrieved from http://mindsetscholarsnetwork.org/wp-content/uploads/2015/09/What-We-Know-About-Belonging.pdf
26 “Rarely” defined as having no more than one experience perceived as engaging and worthwhile. 28% never had an engaging and worthwhile experience and 13% rarely did (N = 2,427 students).
27 Rate based on 2012 “event dropouts,” which represent the “percentage of high school students who left high school between the beginning of one school year and the beginning of the next without earning a high school diploma or an alternative credential (e.g., a GED).” See Table 1 in Stark, P., & Noel, A.M. (2015). Trends in high school dropout and completion rates in the United States: 1972–2012 (NCES 2015-015). U.S. Department of Education. Washington, DC: National Center for Education Statistics. Retrieved from https://nces.ed.gov/pubs2015/2015015.pdf
28 On the other hand, the same student tended to be less engaged on days when they received higher-quality assignments. See the Technical Appendix for results on how engagement varied on different days based on the quality of assignments and lessons.
29 Teachers’ perceptions of the extent to which they talked to students about their interests and goals based on four survey items: To what extent do you engage in the following practices: (1) meet with students to discuss their learning progress; (2) meet with students to discuss their strengths and interests; (3) set learning goals with students; (4) communicate with individual students and their families about the aspirations they have for a student’s future. Teachers had four choices for each item: Never, Sometimes, Often, Daily or Almost Daily. We integer-coded teachers’ responses so that Never was a 1 and Daily or Almost Daily was a 4, took the average across all four items, and then classified this composite value into quartiles. Classrooms in the top quartile had an average engagement rate of 62% while classrooms in the bottom quartile had an average engagement rate of 46%.
30 All analyses using students’ letter grades were based on all grade 3-12 students in the participating district or participating CMO school, not just the subset of classrooms we visited. See the Technical Appendix for more details on how we used data on course grades for all students in the participating districts.
31 We ran a series of linear regression models predicting the typical quality of assignments and lessons provided to classrooms based on their demographic characteristics as well as a host of other controls, including prior achievement. Notably, there was still a statistically significant negative relationship between the percent of students from low-income families in a class and the average quality of assignments, even after controlling for prior achievement (p<0.01). See the Technical Appendix for our model specifications and Table A.13 in the Appendix for full model results.
32 For classes where at least 50% of the students were students of color, the typical percent of time spent with grade-appropriate assignments, with strong lessons, and engaged were respectively 23%, 9%, and 50%, while for classes with mostly white students, these values were 34%, 33%, and 62%. For classes where at least 75% of students were from low-income families, these values were respectively 20%, 8%, and 52%, compared to 44%, 41%, and 63% for classes where at least 75% of students were not from low-income families. Only classrooms that contained enough data to meet our inclusion rules were included; see the Technical Appendix for more details on these rules and further analysis comparing access to these key resources by student characteristics.
33Some of the racial/ethnic disparities in test outcomes between students is likely due to “stereotype threat.” Stereotype threat is an experimentally established phenomenon that represents the negative effect on performance when students feel like they must perform well or risk confirming negative intellectual stereotypes. For example, female students have been stereotyped to be less intellectually strong in math, and thus female students’ math test performance likely underestimates their true abilities because the anxiety of having to disprove this negative stereotype lowers their performance on tests. This is particularly true when the student knows the test will be used for comparative purposes, as is the case in state standardized tests, ACT and SAT tests, and AP tests. Research has shown that stereotype threat can underestimate Black
and Latinx students’ total SAT math and reading scores by about 40 points. Though this is a large effect, across our participating districts the difference between students of color and white students with the same course grade was about 100 points on both the SAT math and reading components. Thus, while stereotype threat plays a role in our findings, it likely does not explain them entirely. For a thorough understanding of stereotype threat, see Steele, C. (2010). Whistling Vivaldi: And other clues to how stereotypes affect us. New York, NY: W.W. Norton & Company. See also Logel, C. R., Walton, G. M., Spencer, S. J., Peach, J., & Mark, Z. P. (2012). Unleashing latent ability: Implications of stereotype threat for college admissions. Educational Psychologist, 47(1), 42-50. https://doi.org/10.1080/00461520.2011.611368
34 Classrooms with the most grade-appropriate assignments were defined as those classrooms whose average assignment score ranked in the top quartile; classrooms with the least grade-appropriate assignments were those who ranked in the bottom quartile.
35 Wilson, T. (2011). Redirect: The surprising new science of psychological change. New York, NY: Little Brown.
36 Wenzlaff, R. & Wagner, D. (2000). Thought suppression. Annual Review of Psychology, 51(1), pp. 59-91. https://doi.org/10.1146/annurev.psych.51.1.59
37 Murphy, M.C., Kroeper, K., & Ozier, E. (2018). Prejudiced places: How contexts shape equality and how policy change them. Policy Insights from the Behavioral and Brain Sciences, 5(1), pp. 66-74. https://doi.org/10.1177/2372732217748671
38 Cherng, H. & Halpin, P. (2016). The importance of minority teachers: Student perceptions of minority versus white teachers. Educational Researcher, 45(7), pp. 407–420. https://doi.org/10.3102/0013189X16671718
62T
HE
OP
PO
RT
UN
ITY
MY
TH

ACKNOWLEDGMENTSMany individuals within and beyond TNTP were instrumental in creating this report.
Bailey Cato Czupryk led the research effort and our talented team: in the field, Cody Keffer, Patrick Fitzsimmons, Devon Toth Gadow, Sarabecca Landkamer, Shannon Lindstedt, Lea Marmora, Liz Riggs, and Kendyl Sullivan; conducting the analysis, Adam Maier, Nick Denton-Brown, and Josh Littenberg-Tobias, supported by Claire Allen-Platt, Katherine Durlacher, Sam Firke, Kate Mullan, and Eric Waters.
Kate McGovern and Andy Jacob led writing and editing. Clairelise Kip and Meghann Ziler led design and development. Chris Arnold, Kat Curcio, Joanna Dasher, April Kaplowitz, and Jacqui Seidel supported the execution and release.
Florrie Chapin, Neressa Dukhi, Miri Listokin, Taylor Lynch, and Billie Woods made this project logistically and legally possible.
A team of TNTP leaders—Amanda Kocon, David McKinney, and Daniel Weisberg, along with Kenya Bradshaw, Christina Brown, Leticia de la Vara, Erin Grogan, Atyani Howard, and Monica Milligan—were deeply involved in every stage of the project.
We are grateful for the contributions of our Technical Advisory Panel: Matthew Chingos, Catherine Good, Mary Helen Immordino-Yang, Nathan Jones, Thomas Kane, Sue Pimental, and James Wyckoff; as well as our Content Advisory Panel: Dave Abel, Peter Coe, Ted Coe, Miah Daughtery, Keith Dysarz, Marni Greenstein, Tanji Marshall-Reed, Torrey Palmer, Mary Pittman, Carey Swanson, and Alice Wiggins. Their candid feedback on our methodology and findings helped push our thinking and improve our work. We also wish to thank Lisa Quay of the Mindset Scholars Network for sharing her expertise.
Our Student Advisory Panel played a unique role in this process, reflecting on how our findings resonated with their own experiences, advising us on how to engage students as leaders in acting on these issues, and even weighing in on the report’s final design. This group of students from schools and universities across the country includes: Pilar Amezaga, Cedrine Brisson, La’Monica Griggley, Paul Hee, Woodrow Israel, Jenitza Jack, Martin Martinez Saldaña, Megan Simmons, and Justin Thach. We are deeply appreciative of their time and contributions.
Finally, we are indebted to the staff and families of the school districts that took part in our study, and to the teachers and school leaders who opened their classrooms to us. Above all, we are grateful to the thousands of students who shared their experiences with us, particularly the 50+ young people who gave their time to help us understand who they are, what they want out of their lives and their schooling, and what it’s like to be a student today.
The report, graphics, and figures were designed by Bethany Friedericks and Kristin Girvin Redman at Cricket Design Works in Madison, Wisconsin.
DISCLOSUREThe school systems studied for this report include those with which TNTP is currently engaged as a consultant and/or service provider, as well as those that are unaffiliated with TNTP’s work. None of these school systems held editorial control over this report, and the report was independently funded. All participation was voluntary and school systems were not compensated.
ABOUT TNTP
TNTP believes our nation’s public schools can offer all children an excellent education. A national
nonprofit founded by teachers, we help school systems end educational inequality. We work
at every level of the public education system to attract and train talented teachers and school
leaders, ensure rigorous and engaging classrooms, and create environments that prioritize great
teaching and accelerate student learning. Since 1997, we’ve partnered with more than 200 public
school districts, charter school networks, and state departments of education. We have recruited
or trained more than 50,000 teachers, inspired policy change through acclaimed studies such as
The Mirage (2015), The Irreplaceables (2012), and The Widget Effect (2009), and launched the
Bridge Fellowship, our signature program for diverse leaders with bold ideas for public schools.
Today, TNTP is active in more than 50 cities.
TNTP.org
For an interactive experience and additional resources, visit
opportunitymyth.tntp.org