metal matrix composite technology - DTIC
356
- -. AFML-R.71-204 METAL MATRIX COMPOSITE TECHNOLOGY K.G. KPeidwr, L. Dardl, K. Prewo United Aircraft Research Laboratories fJNr-'D AIRCRAFT OrPOfATPO(M EAST HARTFORD, CONNECTICUT 0bIO8 Pratt &Whitney Aircraft r',VISK)NOý UNIK AIRCRAFT ýORPlRAIKN~. 19T EAST HARTFORD, CONNrCTICUT 06108 •Jjm"L r-- j -7i"j-- JI TECHNICAL REPORT AFML-TR-71--' J4 " DCEMBLR 19 7
-
Upload
khangminh22 -
Category
Documents
-
view
0 -
download
0
Transcript of metal matrix composite technology - DTIC

- -.
AFML-R.71-204
METAL MATRIX COMPOSITE TECHNOLOGY
K. G. KPeidwr, L. Dardl, K. Prewo
United Aircraft Research LaboratoriesfJNr-'D AIRCRAFT OrPOfATPO(M
EAST HARTFORD, CONNECTICUT 0bIO8
Pratt &Whitney Aircraft
r',VISK)NOý UNIK AIRCRAFT ýORPlRAIKN~. 19T
EAST HARTFORD, CONNrCTICUT 06108 •Jjm"L r-- j -7i"j-- JI
TECHNICAL REPORT AFML-TR-71--' J4
" DCEMBLR 19 7
NOTICES
When Govermnent draw..-, specifications, or other data ara used for ann,"purpose other than in 7.onnection with a definitely related Government-procurement operation, the United States Government tbereby incurs noresp&sibility ii-r any obligation whatsoever; and the fact that ltheGovermrent may have fornulated, furnished, or in any way supplied thesaid drawings, specifications, or other data, is not to be regarded byimplication or otherwise as in any manner licensing the hodIer or unyother person or corporation, or conveying any rights or permission tomar Iacture, use, or sell any patentee inv•rtion that may in any way berelated thereto.
Copies of this report should not be returned unless return is reqiiicedby security considerations, contractual obligations, or notine on aspecific 4ocument.
C WHHiE SRCTION
1000 BUFF U ETJON ri
-JUR flIM ATIONJ
Tharnx& E I "'4:' X
7
METAL MATRIX COMPOSITE TECHNOLOSY
K. G. Kreider, L. Dardi, K. Prewo
This document has been approved for public release and sale;its distribution is unlimited.
V1 ,-Z
UO

FOREWORD
This Technical Report covers all work performed on Contract F ,615-69-C-1539for the period July 1, 1969 to June 30, 19 1. The york on this ci'-r-rt withUnited Aircraft Research Laboratories and iratt and Whitney Divis',.n of UnitedAircraft Corporation of East Hartford, Connecticut is performed I tder thedirection of the Metals and Ceramics Division of the Air Force M. crialsLaboratory with Captain D. Rice as program monitor.
This technical report has been reviewed and is approved.
C. T. LYNCHChief, Advanced Metallurgical StudiesMetals and Ceramics Division
,ABSTRAM
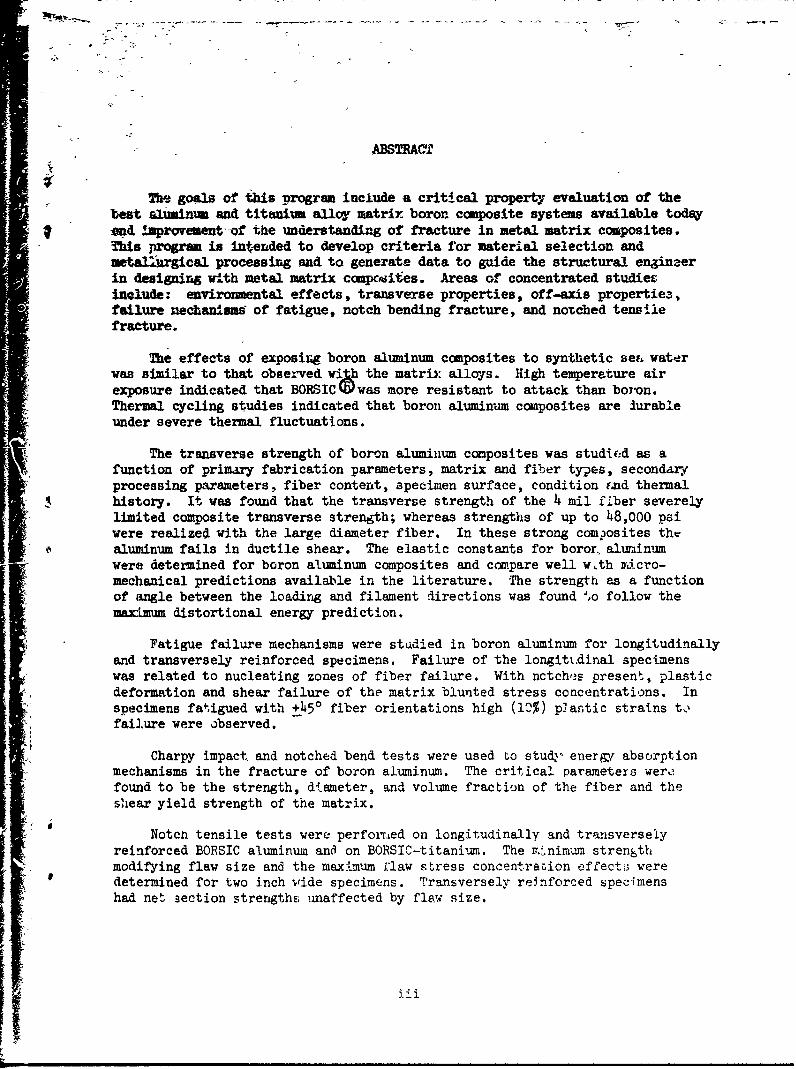
The goals of this program include a critical property evaluation of thebest aluminum and titanium alloy matrix boron composite systems available todayvnd "provement of the understanding of fracture in metal matrix composites.This program is intended to develop criteria for material selection andmetallargical processing and to generate data to guide the structural engineerin designirg with metal matrix compsites. Areas of concentrated studiesinalude: environmental effects, transverse properties, off-axis propertie3,failure nechanixs of fatigue, notch bending fracture, and notched tensilefracture.
The effects of exposing boron aluminum composites to synthetic sea waterwas similar to that observed wilh the matrix allojs. High temperature airexposure indicated that BORSICb was more resistant to attack than boron.Thermal cycling studies indicated that boron aluminum composites are lurableunder severe thermal fluctuations.
The transverse strength of boron aluminum composites was studie:d as afunction of primary fabrication parameters, matrix and fiber types, secondaryprocessing parameters, fiber content, specimen surface, condition End thermalhistory. It was found that the transverse strength of the 4 mil fiber severelylimited composite transverse strength; whereas strengths of up to 48,000 psiwere realized with the large diameter fiber. In these strong comosites thraluminum fails in ductile shear. The elastic constants for boror, aluminumwere determined for boron aluminum composites and comzpare well wLth D'L cro-mechanical predictions available in the literature. The strength as a functionof angle between the loadirng and filament directions was found 1,o follow themaximum distortional energy prediction.
Fatigue failure mechanisms were studied in boron aluminum for longitudinallyand transversely reinforced specimens. Failure of the longiti.dinal specimenswas related to nucleating zones of fiber failure. With nctch,!s present, plastic"deformation and shear failure of the matrix blunted stress concentrations. Inspecimens fatigued with +450 fiber orientations high (10%) p. antic strains tofailure were observed.
Charpy impact., and notched bend tests were used to stud,- energy absorption- mechanisms in the fracture of boron aluminum. The critical parameters were'
found to be the strength, diameter, and volume fraction of the fiber and theshear yield strength of the matrix.
Notcn tensile tests were perforrted on longitudinally and transverselyreinforced BORSIC aluminum and on BORSIC-titanium. The r."nimum strength
modifying flaw size and the maximum flaw Rtress concentration effects wereLi determined for two inch vide specimens. Transversely re~nforced specimens
had net 3ection strengths umaffected by flaw size.

UNCLASSIFIED
NOUM~T CONTROL DATA. -RMD0-11011F c9mtIgetOMw Of 101de. be* 01 abftmfa Ime Inaoh &%Wadas must bo owsm taum Me. .ml nomtsee La cfebeafita
I ORIGIUATIII G ACTIVITY (Compeoswi. 1 eJ 40 REPORT SECUIRITT c l.SIwICATION1
United Aircraft Cornoration. UnclassifiedResearch Laboratories 2b amourEast Hartford, Connecticut
3 REPORT TITLE
Metal Matrix Composite Technology!
4 DESCRIPTIVE NOTES (Tpe of mEetq aidt AncaeI. deft)
Final Report 1 July 1969 - 30 June 1971S AUThOR(S) (LWmass. Som Mst amo &WUWa)
Kreider, Kenneth G,, Dardi, L. E., and Prewo, K. M.
4. REPORT DATE 70. TOTAL NO. OP, PaGas ITb No. or mapsDecember 1911 362 I 120
Go CONEINACT OR GRN&,T No. F33b15-69-C-1539 *8 ORIGIN4ATOR*$ REPORT 10.00IjIgEWS)
& PROJCT Poo. 9M-57)4/7351 K91085i3-12
c Task No. 734107 Ob OTH PONT(S0) (Any eE~egnamh" Blat pbe aat'Sood
_____________________________MIS__ Wr= tP tes n A r F reB s ,O id IBTRC Th ol fti rga uldea c-riticl popet vautono
etalmatrx coposies. reasof cnce irae studies Materials environmetaeffetsincudin exosue toseawatr, ightempeatueresnd th Frermale cycing
trAnSveRsCTe propetis; off-ahis propertwincues faciuechanl pr1ert fvlatigue noftcnThet trmiumansvrd trength aloyati boronalmnu composite syswas studiedasl toa aunctdJ rivmeny ofabictiondparsandneters ctreinmea matrix an ie yesconmarsproes. hsing o
grametersteiber onteent, spcimeni sorfae ondriasection and t mermallhutry.itcalroundn tatd tho geanserate datanto ofid the struturl eineginerer irnidesigconpositerealses satrengomostes; Areeas stenth cofnrae up to udiesO pinuere reavizodmentaltheffecs dnuiameeerofiber to thsea satrong higmhtempteralumins, fadlshirmductileisge
ben rpygimpactue and notched tensil fracts ure.,e osuyenryasrtoTchesm irnsvthe frstrent of boroIn alumiinm co. The citic as saradeer s 4er founct
oarbe thers fibre, ciamentserimand voe rPacti onditofnh ie and thera hsheary.I yied.strendthaof the atrix.rejrntno h ilfie oeeylii~ opst
"Notchy tnilec n othdbn tests were efri~do usedto tudinly energyabsverptl iofn c
BOFSIC aluminum and on BORSTC-titaniuni. The mini-mumr strength modifying fln,3w size anjthe maximum flaw stress concentratLi effects were determined for twc -inch 1vide specj.ens. Transverseilv reinforced speciierns had nF-t section strengths unaffected by fli
DD ýOM. 473 -UNCLASSIFIED_ _
secu'its Classificabion
u UK* A LOOKS 0NIX C
KEFY 1100116 MOS Im 06.6 STrL N
BoronCompositesAluminumBoron/AluminumTitaniumMechanical PropertiesFatigueE~nvironmental Exposure
Notch Toughness
Ortbotropic Properties
of the contractor, subicontractor, grni Deprtea by Do-ycasliale algsadrdsaeet
fens acptivt rohrOgnsto .goioota)iian 1 "Qualified requesters my obtain copies cf thisthe reporepoVt from DDC. O
2.REPORT SECURITY CASM TO:Etrheover- (2) "Foreign samouscomerAat nd disseminatIon of thisalsecurity classification of the report. Jadicate whetherpt yDCtontathrze"Restricted Date" is included. Marking is to be in accord.b DCI sthvzd
anewith appropriate security regiilatloas (3) 68U. L Govermment agencies may Obtain Copies Of2b GROUP: Automatic downgrading is spocifled in DOD Di. usi5 eprt dhllroe tlyhrough Ohe uaiie Orective 5200. 10 sand Arhed Forces Industrial MinmaL. Enter -
the group number. AMio, whnti applicable. show that optionsal-markings have bee.. used for Group 3 and Gr-qt 4 as author- (4) 48U. S. ml!itary agencies may obtain Copies Of this3. RiEPOTTTEdaetncmlt eottd nOlo lrq hog
"I'd, report directly from DDC. Other qualified user
cptlletters. Titles in all causes should be uniclossifiedLiIf meninfultitle cannot be selected withuout classifica-"lsitiuino hsrpr scnrle ultion. sbow title classification in all capitals In parenthesis (5) Aldtrbioofhirpoticnrle.Qa-
immediately following the title. iliad DDC users shall request through
j. ~ ~ ~ 4 DECRiPTIVE NO0TS If appropriate. enter the type of_______________r re.g.. arterus, progress, summary, annual, or finel. if the report has been furnished tc the Office of Technical[iv 'he inclusive dates when a specific reporting period is Services, Department of Commerce. for sale to the public, indi.
covered, cata, this fact end enter the price, if known.S. UTHR(Sp-Enter the name(s) of auithoo(s) so showni Or' IL SUPPLURNTARV NOTES' Usi for r4ditionaffl explans-
or in the report. Rotai lost nawe, first name, middle initial, tory notes.If -rilitaty. r'how rank end branch of service. The name of 1 PNOIGMLTR C!IY ne h aeo
the rinipa . hcr o a abolue miimu reireeftthe departmental project office or laboratory sponsoring (Pay-6. REPORT DATE: Enter the date of the report as day, ing for) the research and development. Include address.month. year or month. year. If more than one date appears 13. ABSTRACT: Enter an abstract giving a brief and factual
on h reort usedat ofpublcaton.summary of the document indicative of the report, even though7a. TOTAL NUMBER OF PAGES: The total page count it may also appear elsewhere in the body of the technical re-shou',d follow normal paginastion procedures. ILe.. enter the port. If additional space is required, a continuation sheet *hall'number of pages containing information, be attached.7b NUMBER OF REFERENCES: Rotor the total nunmber of It is highly desirable that the abstract of classified reportsreferences cited in the report. be unclassified. Each paragraph of the abstract sihall end with
S.. CONTRACT OR GRANIT NUMBER: If appropriate, enter an indication of the military Security Classification Of tht in-the applicable number of the Contract or prant under which formation in the paragraph, represented as (Ti). (s). (c). , or V)the report we* written, There is na limitation cn the length of the abstract. How-Sb, 8c, & Id. PROJECT' NUMBER: Roter the appropriate ever, the suggested length Is from 150 to 225 words.mi *litary department identification, such as project murb'i. 14. KEY WORDS: Key words are technically meaningful terms
suiprojct umbr, ystm nulic, tsk umbr. tc.or short phrases that characterize a report end may be taped as9a. ORIGINATOR'S REPORT NUMER(I): Entor the Offi- index entrie., for cataloging the report. Key words must becial report number by which the document will be identified selected so th.'tt no security classification is required. Mdenu-and controlled by the originating activity- This number b~ust flare, such as equipn'~nt model designation, trade name, militarybe unique to this report. project code name, geographic location, may be usedt as key
has been words but will be followed by an indication of technical con-I9Lb OTHER REPORT NUMBERWP): If the report te ben lst. Mhe assignment of links, rules, and weights is optionalss.igned any other report numbers 1eithe, by the orldtnt~idoor by the sponsor), also enter this number(sQ.10. AVAILABILITY/LIMITATIO)N NOTICE&. Enter m&y lim.itatiors on further dissemination of the report, other than those1
GWO 66-55 iii NCLASSIFIEDI Security Classification

TABLE OF COUNITS
INTROD- CTION . . . . . . . . . . . . . 1
SECTION I - REFERENCES . . . . . . . . . . . .. 3
II. MATERIALS AND PROCESING . . . . . , . . . . . . . . . .. 42.1 Materials . . . . . . . . . . . . . a. .. . .4
2.1.1 Fiber . . . . . . . . . . . . . . .. a . 42.1.2 Matrix Material . . . . . . . ...... ... 42.1.3 5.6 Mil Boron Fiber Composites . . . o. 4
2.2 Processing . . . . . . . .5 . . . .......... 5
SECTION II - REFERENCES . . . . . . . . . . . . . . . . . . 7
FIGURES 2-1- 2-8 . ..... . . . . . . . . . .. . 8
TABLES II-I -II-IV .. .. .. .o. ... * . . , ...... 16
ENVIRON4ENTAL EFFECS- SUMMARY . ..... ............. 23
III. ENVIRONMENTAL EFFECTS . ......... E.T...... 243.1 Salt Exposure ..... ................... ......... ........ 243.2 High Temperature Exposure ....... ....... ...... . 263.3 Thermal Cycling . . . . . . . . . .. . . . . 283.4 Conclusions . . . . . . . . . . . .. . . . 32
SECTION III - REFERENCES .. . . . . . . . . . . . 34
FIGURES 3-1 - 3.27 . . . . . . ............ .. 35
TABLES III-I - III-II .... .......... ......... 62
TRANSVERSE PROPERTIES ST.MA•RY ... . . . . . . . . . .. 64
IV. TRANSVERSE PRCPETIES ....................... 654.1 Matrix Properties . . . . . . .......... .. 654.2 Composite Trpnsverse Elastic Modulus .... .. 664.3 Transverse Tensile Strength of 4.2 Mil
BORSIC-Ailuminum . . . .... . . . . . . . . . . 694.3.1 The Effects of Processing ParamEters an'u
Heat Treatment . . . . . . . . . . . . 694.3.2 Transverse Strength as a Function of Test
Temperature and Matrix S-trength . ........ 724.3.3 Transverse Tensile Strength ,s L Function of
Volume Fraction Fiber .e...t ... *.... 744.3.4 The Effects of Tensile Specimen Configuration
and Edge Conditions on Transverse Strength. . .. 75
Preceding page blankV

TABLE OF CONTENTS (Cont' d)
Paffe
4.3.5 Dispersion Hardened Aliminum 4.2 MilBORSIC Composites ................ 79
4.3.6 Transverse Fiber Properties . . . .. * . . .. . 814.3.7 BORSIC-Al1iminum-Stainless Steel Composites . . . 844.3.8 BORSIC-Aluminum-Titanium Compcsites . .. .. . . 85
4.4 Transverse Tensile Properties of 5.6 Mil FiberReinforced Composites ................. 86
•4.5 Titanium Matrix Composites . .............. 8814.o Conclusions . . . . .............. 90
SECTION IV REFERENCES .F..o................ 92
FIGURES 4-i 4-49 ... ............. . . .. o 94
TABLES IV-I - I-VlIl ............. .. . .... 143
OFF-AXIS BEHAVIO*3 - SUMMARY . . . . . . . . . . . . . .. . 150
V. OFF-AXIS BEHAVICR . . . . . . . . . . . . . . . . . o . . . . 1515.1 Tensile Tes.ts .. .. ... . . . . . . . . . . .. 1525.2 Sonic Velocity Measurements . . . . . . . . . . . o . . 1575.3 Conclusions . . . . . . . . ............... 159
SECTION V - REFERENCES . . . o . . . . . . . . . . . ..o. . 161
FIGURES 5-1 - 5-29 .. . . . . . . . . . ........... 163
TABLES V-I - V-IV o . .. .. . . . o o ........... 192
FATIGUE FAILURE MECHIANISMS - SUMMARY . . . .. . . .*. . . 197
VI. FATIGUE FAILURE MECHANISMS ................ . .... . 1986.1 Fatigue of Axially Reinforced Specimens . . . . . . . . 1986.2 Fatigue cf Center Notched Specimens ............. . . . 2026.3 Transverse Tensile Fatigue . . . . . o . o . . .. .. . 2046.4 Fatigue of Cross Ply Composites . . .. . . . . . .. 2056.5 Conclusions . . . . . . . . . .. -.......... 209
SECTION VI- REFERENCES o................... . 210
FIGURES 6-1- 6-25 . o o . . . . . ... . . . . .. .. . . 211
TABLES VI-I - VI-II . . . . ............ .... 236
vi

TABLE OF CONTENTS (Cont'd)
Page
NOTCH BEND FRACTUJRE -SUMMARY . .. .. ... .. . . . . * 238
VII. NOTCHED BEND FRACTURE ...... .............. 239
7.1 Charpy Impact Tests .................. 2397.2 Slow Bend Tests . . . . . . . . . . . . . . . . . ... 2447.3 Notched Bend Analysis . . . . . . . . . . . . . . . 2477.4 Conclusions . . . . . . . . ....... . . . ..... . 251
SECTION VII - REFERENCES ....... . ......... 253
FIGURES 7-1 - 7-25 ..................... 254
TABLES VII-1 - VII-IV. .................... 279
NOTCH TENSILE FRACTURE - SLMARY .............. 284
VIII. NOTCH TENSILE FRACTURE . . . . .............. 2858.1 Longitudinal Reinforcement ........... . . . . . 285
* 8.1.1 BORSIC + Aluminum Composites .... .......... ... 2868.1.2 BORSIC + Titanium Composites .......... 2908.1.3 HMG-50 + BP 907 Comoosites .... ........... ... 290
* 8.2 Transverse Reinforcement .... ................ 2918.3 Analysis . . . ................... 292
8.3.1 Fracture Mechanics ........................ .. 2928.3.2 Flaw Stress Field ........ . . . . . 293
8.3.3 Notch Blunting Indices ............. 2948.3.4 System Comparisons . . . . ........ 295
8.4 Conclusions . . . ...... . . ... .. . 295
SECTION VIII -REFERENCES ...................... . 296
FIGURES 8-1 - 8-24 . . . . ........... . . .. .. 298
TABLES VIII-I - VIII-X . . ........... ...... 322
Iivi
vii

•n-r r .iwrrrr- -.. ...r~., r
LIST OF ILLUSTRATIONS
2-1 Axial Tensile Stress-Strain Curve for 64 v/o-5.6 Mil Boron 2024-T6Composite Tested at 70°F
2-2 Composite Filament Winding Apparatus
2-3 Plasma Spray Apparatus
2-4 Diffusion Bonded 4.2 Mil BORSIC-Aluminum Composite Using MonolayerPlasma Sprayed Tapes
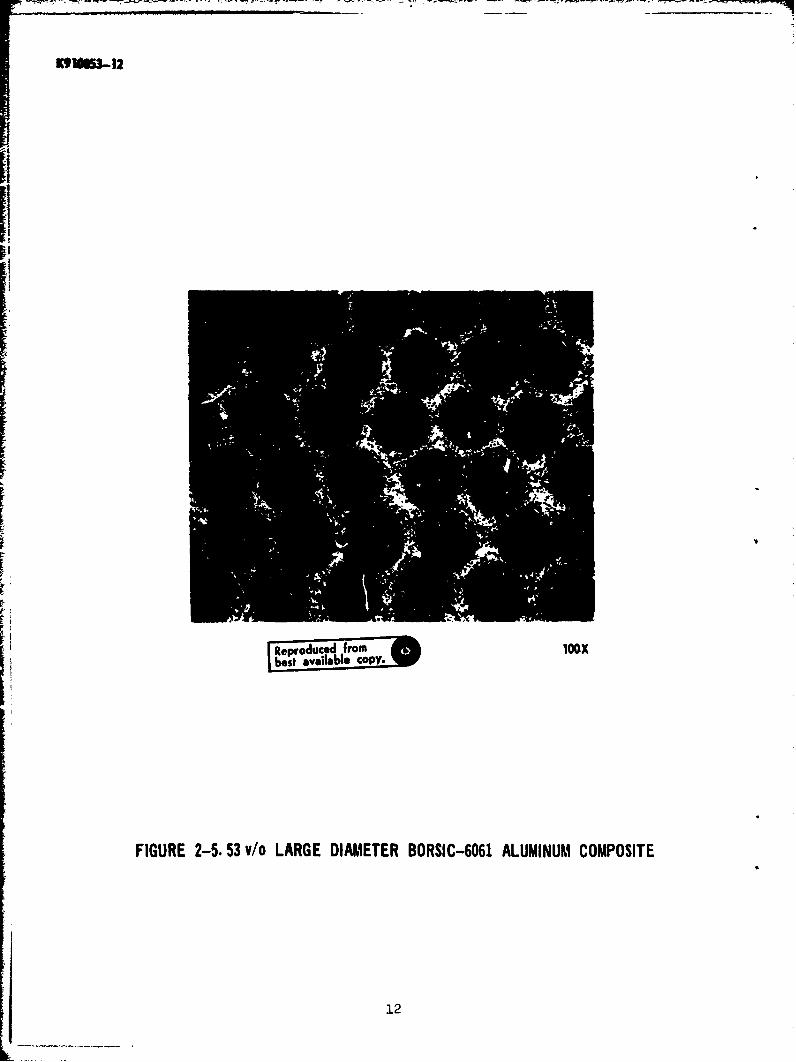
2-5 53 v/o Large Diameter BORSIC-6061 Aluminum Composite
2-6 4.2 Mil BORSIC-Aluminum-Titanium Composite
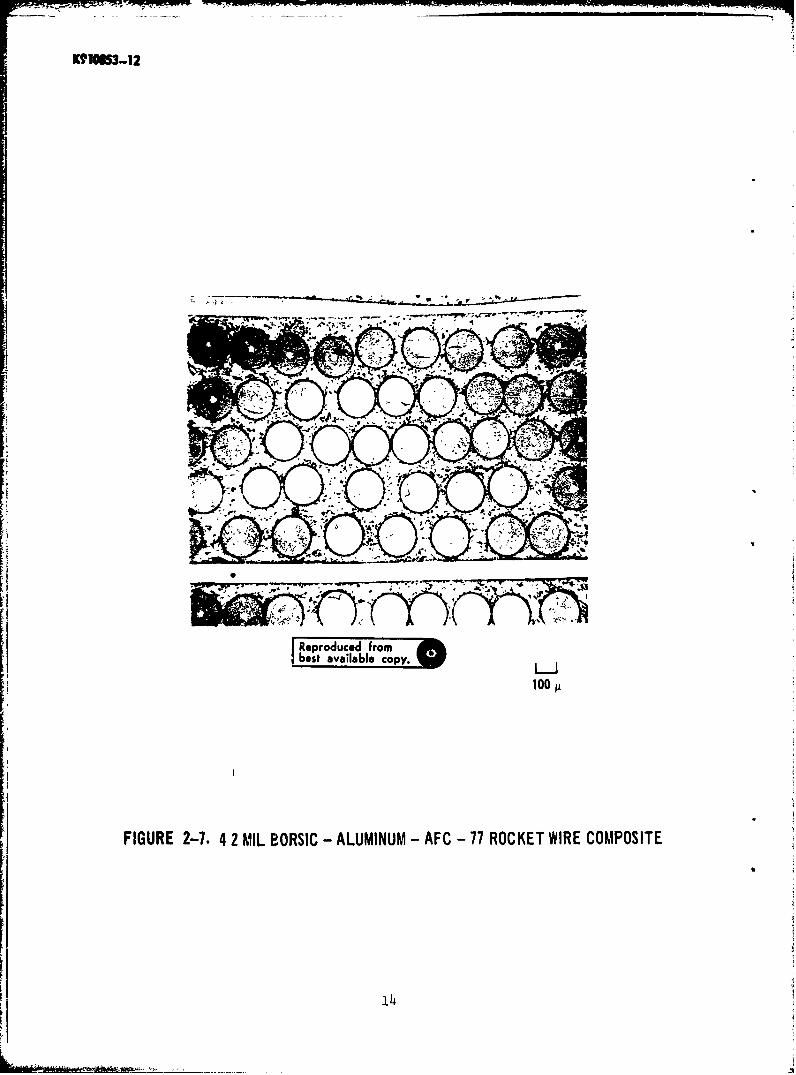
2-7 4.2 Mil BORSIC-Aluminum-AFC-77 Rocket Wire Composite
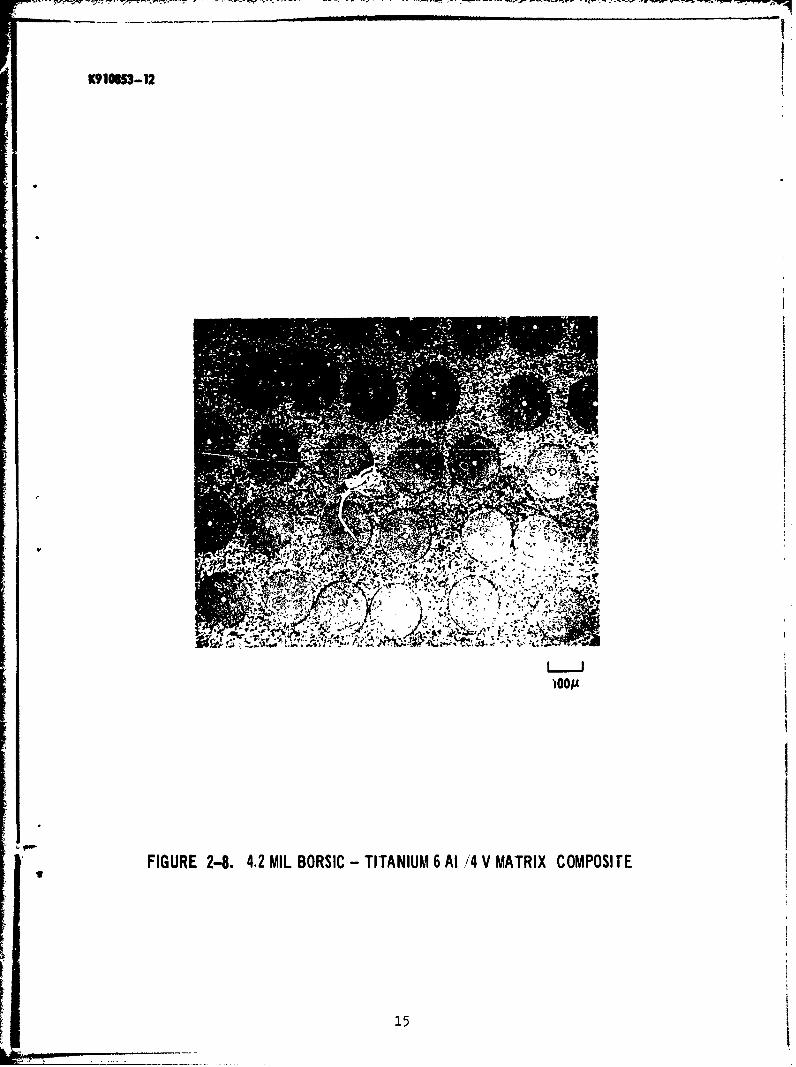
2-6 4.2 Mil DCRSIC-Titanium 6 Al/4 V Matrix Composite
3-1 Three Point Bend Fixture Used for Salt Corrosion Tests
3-2 Stress Corrosion As a Function of Exposure in Synthetic Sea SaltSpray at 950F
3-3 Edge Views of BORSIC + 6061-F (Top) and BORSIC + 2024-F (Bottom)Composite Bend Specimens After Exposure for One Week in SyntheticSea Salt Spray at 95F and 100 KSI
3-h Edge Views of BORSIC + 6061-F (Top) and BORSIC + 2024-F (Bottom)Composite Bend Specimens After Exposure for One Month in SyntheticSea Salt Spray at 95F and 100 KSI
3-5 Transverse Sections of BORSIC + 2024-F (Top) and BORSIC + 2024-T6(Bottom) Bend Specimens After Exposure for Oae Week in SyntheticSea Salt Spray at 95F and 100 KSI
3-6 Edge Views of 4.2 Mil BORSIC + 6061-T6 (Top) and BORSIC +2024-T6(Bottom) Composite Bend Specimens After Exposure for One Month in
Synthetic Sea Salt Spray at 95F and 100 KSI
viii

LIST OF ILLUSTRATIONS (Cont'd)
3-7 Strength of 4.2 Mil BORSIC Fiber Removed from 2024 Aluminum MatrixComposites
3-8 Effect of Exposure Time in Synthetic Sea Salt Spray at 950 F and100 KSI on the Flexural Strength of 4.2 Mil BORSIC + 6061 Aluminumand BORSIC + 2024 Aluminum Composite Materials
3-9 Room Temperature Longitudinal Strength and Modulus of 4-Mil Boron +6061 Aluminum as a Function of Exposure Time in Air at 700°F
3-10 Room Temperature Transverse Strength and Modulus of 4-Mil Boron +6061 Aluminum as a Fvnction of Exposure Time in Air at 700OF
3-11 Taper Section of 4 Mil Boron + 6061-F Aluminum at 10,OOOX AlongFiber Axis and 500X in Transverse Direction
3-12 Room Temperature Longitudinal Strength and Modulus of 4.2 Mil BORSIC+ 6061 Aluminum as a Tunction of Exposure Time in Air at 700'3F
3-13 Room Temperature Transverse Strength and Modulus of 4.2 Mil BORSIC+ 6061 Aluminum as a Function of Exposure Time in Air at 7000F
3-14 Transverse Tensile Strength as a Function of Percent Split Fiberson the Fracture Surface of 4.2-Mil BORSIC + 6061-F Thermal ExposureSpecimens
3-15 Fracture Surfaces of 4.2 Mil BORSIC + 6061-F Transverse TensileSpecimens Showing Typical Appearance of Hig'i Strength Material(Left), Low Strength Material (Middle) and Intermediate StrengthMaterial (Right)
3-16 Room Temperature Longitudinal Strength of 5.7 Mil BORSIC + 6061
Aluminum as a Function of Exposare Time in Air at 700OF
3-17 Room Temperature Transverse Strength and Modulus of 5.7 Mil BORSIC+ 6061 Aluminum as a Function of Exposure Time in Air at 700'F
3-18 Edges of 4.2 Mil BORSIC, + 6061-F Aluminum After Thermal Cycling from70F to 670F
3-19 Effect of Thermal Cycling on Material Density
ix
*5 LIST OF I 0bUSTRATIONS (Cont'd)
3-20 Flexural Strength of Unidirectional 4.2-Mil BORSIC + 6061-F AluminumComposite Material as a Function of the Number of Thermal CycleExposures from 70°F to 670°F
3-21 Dynamic Flexural Modulus of 4.2-Mil BORSIC + 6061-F AluminumComposite Laminates as a Function of the Number of Thermal CycleExposures from 70°F to 670°F
3-22 Longitudinal Microstructure of Unidirectional 4.2 Mil BORSIC +6061-F Composite Material after Thermal Cycling
3-23 Longitudinal Microstructure of +450, 0O, +450 Laminates of 4.2 MilBORSIC + 6061-F Composite Material After Thermal Cycling
3-24 Fracture Surfaces of 4.2 Mil BORSIC + 6061-F Material After ThermalCycling and Flexural Testing
3-25 4.2 Mil BORSIC + 6061-F Composite Specimen After Thermal CyclingLeached to Expose the Fibers (Mag: 56X)
3-26 Effect of Thermal Cycling on Time Interval for Extensional WavePropagation in Longitudinal Direction
3-27 Effect of Thermal Cycling on Average Ultrasonic Attenuation Level
4-1 Aluminum-7% Si Plasma Sprayed and Foil Matrix Material
4-2 Aluminum Alloy Matrix Fracture Surface
4-3 Ultimate Tensile Strength of 6061 Matrix as a Function of Temperature
4-4 Ultimate Tensile Strength of 2024 Matrix as a Function of Temperature
4-5 Composite Transverse Elastic Modulus
4-6 Transverse Modulus as a Function of Temperature
4-7 Transverse Strength as a Function of Matrix Strength for 4.2 MilBORSIC-Aluminum
x

LIST OF ILLUSTRATIONS (Cont'd)
Figure
i 4-8 Fracture Surface of a 50% Volume Fraction 4.2 Mil BORSIC-6061Composite 900 Tensile Specimen
4-9 Transverse Tensile Fracture Surface cf 4.2 Mil BORSIC-I1O0
4-i0 V v/o 4.2 Mil BORSIC-6061 Aluminum 90" Tensile Stress Strain Curves
4-11 Transverse Tensile Strength of 4.2 Mil BORSIC-6061 Aluminum as aFunction of Test Temperature
4-12 Transverse Tensi'. Strength of 4.2 Mil BORSIC-2024 Aluminum as aFunction or Tzst Temperature
4-13 Transverse Tensile Strength of 50% by Volume 4.2 Mil BORSIC-Aluminum
4-14 Transverse Tensile Strength of 50% by Volume 4.2 Mil BORSIC-Aluminum
4 .-15 Compressive Stress Strain Curves for Axial and 900 Fiber Reinforcement
4-16 Transverse Compression Specimen of BORSIC-6061 Aluminum after Com-pletion of Test
4-17 Fracture Surface of a Transverse Compression Specimen
4-18 Transverse Tensile Strength as a Function of Volume Fraction 4.2Mil BORSIC Fiber
4-19 4.2 Mil BORSIC Fibers Cut by a Diamond Abrasive Cutoff Wheel andMat 'x
4-20 Radiograph of Crack Tip in 4.2 Mil BORSIC-6061 Transverse TensileSpecimen
4-21 9Q0 4.2 Mil BORSIC-Al Tensile Specimen with Free Fiber Ed
4-22 Transverse Tensile Test 46 v/o 4.2 Mil BORSIC-2024 Al Alloy
" "4-23 Transverse Tensile Test 46 v/o 4.2 Mil BORSIC-5052/56 Al Alloy
4-24 Transverse Tensile Strength of 46 v/o 4.2 Mil BORSIC-AlIuninum
xi
a.r m
LIST OF ILLUSTRATIONS (Cont'd)
Figure
4-25 Fracture Surfaces of Free Fiber End (Top) and Cut Edge (Bottcm)Specimens of 50 v/o-4.2 Mil BORSIC-5052/56
4-26 51 v/o 4.2 Mil BORSIC - S.A.P.
4-27 Trwmsverse Tensile Strength of 51 v/o 4.2 Mil BORSIC - S.A.P.
4-28 Strength Distribution of 4.2 Mil BORSIC Fiber Testeo in DiametralCompression
4-29 Fragments of a BORSIC Fiber Fractured Under Diametral Compression
4-30 Fiber Fracture Using the FLber Flaw Model
4-31 Strength Distribution of 5.6 Mil Boron Fiber Tested in DiametralCompression
4-32 Strength Distribution of 5.7 Mil BORSIC Fiber Tested in Dia.etralCompression
4-33 5.7 Mil Diameter BORSIC Fiber
4-34 Radiograph of 4.2 Mil BORSIC-6061-AFC-77 Tensile Specimen
4-35 Transverse 47%-4.2 Mil BORSIC-6061-Axial-6%-S.S. Tested in the AxialDirection
4-36 Radiograph of 45 v/o 4.2 Mil BORSIC-35 v/o-6061-20%-Ti-6/4 TensileSpecimen
4-37 Transverse Tensile Stress-Strain Curve for 55 v/0-5. 6 Mil Boron2024-T6 Composite Tested at 70°F
4-38 Composite Transverse Tension Fracture Surface
4-39 Transverse Tensile Strength as a Function of Test Temperature
4-40 Composite Transverse UTS as a Function of Matrix UTS
4-41 Transverse Tensile Fracture Surface of 56 v/0-5.7 Mil BORSIC-2024
xii

LIST OF ILLUSTRATIONS (Cont'd)
Figure
4-42 Transverse Tensile Stress-S4,rain Curve for 52 v/o-5.7 Mil BORSIC6061-T6 Composite Tested at 70°F
4-43 Transverse Tensile Stress-Strain Curve fir 54 v/o-5.7 BORSIC-1100
4-44 Transverse Tensile Strength of 5.7 Mil BORSIC-6061
4-45 Transverse Tensile Elastic Modulus for 5.7 Mil BORSIC-6061 AluminumComposites
4-46 Transverse TeT 3ile Strength of 60 v/o-5.7 Mil BORSiC-6061
4-47 Composite Transverse UTS as a Function of Matrix UTS for 60 v/o-5.7 Mil BORSIC-6061
4-48 Transverse Tensile Strength of 2024 Aluminum Matrix Cc."posites asa Function of Fiber Type (40-50% Fiber Content)
4-49 Dynamic Modulus, Ell, as a Function of Temperature for 50 Percentby Volume BORSIC + Beta III Titanium Composite Material
5-1 Off-Axis Specimen in Rotating Grids
5-2 Continuous Load-Strain Recording Instrumentation
5-3 Coordinate System for 0ff-Axis Uniaxial Tension Tests withOrthotropic Axes ., 2 and Load Axes X, Y
5-4 Rosette Strain Cage Configurations Used in 0ff-Axis Tension Tests
5-5 SII of Unidirec-ional 4.2 Mil BORSIC + 6061-F Aluminum as aFunction of Anglt from the Filament Direction
5-6 S12 of Unidirectional 4.2 Mil BORSIC + 6061-F Aluminum as aFunction of Angle rrom the Filament Direction
* 5-7 S16 of Unidirectional 4.2 Mil BORSIC + 6061-F Aluminum as aFunction of Angle from the Filament Direction
0
xiii
- -.. .. . ... . ... . . - _-t If -- - --
LIST OF ILLUSTRATIONS (Cont'd)
Figure
5-8 S11 of Unidirectional 5. ( Mil BORSIC + 6061-T6 Aluminum as a
Function of Angle from the Filament Direction
* 5-9 S1 2 of Unidirectional 5.7 Mil BORSIC + 6061-T6 Aluminum as aFunction of Angle from the Filament Direction
5-10 S16 of Unidirectional 5.7 Mil BORSIC + 6061-T6 Aluminum as aFunction of Angle from the Filament Direction
5-11 Theorctical SI 1 Values for Unidirectional BORSIC + 6061-F Aluminumas a Function of Angle from the Filament Directior
5-12 Theoretical S1 2 Values for Unidirectional BORSIC + 6061-F Aluminumas a Function of Angle from the Filament Direction
5-13 Theoretical S16 Values for Unidirectional BORSIC + 6061-F Aluminumas a Function of Angle from the Filament Direction
5-14 Stress-Normal Strain Curves for 50 v/o h.2 Mil BORSIC + 6061-FAluminum
5-15 Stress-Shear Strain Curves for 50 v/o 4.2 Mil BORSIC + 6061-FAluminum
5-16 Stress-Normal Strain Curves for 63 v/o 5.7 Mil BORSIC + 6061-T6Aluminum
5-17 Stress-Shear Strain Curves for 63 v/o 5.7 Mil BORSIC + 6061-T6
Aluminum
5-18 Off-Axis Tensile Strength of 4.2 Mil BORSIC + 6061-F Aluminum
5-19 Off-Axis Tensile Strength of 5.7 Mil BORSIC + 6061-T6 Aluminum
5-20 End and Side Views of Fractured 0, 2, and 5 Degree Off-Axis 50 v/o4.2 Mil BORSIC + 6061-F Aluminum Tensile Specimens
5-21 End and Side Views of Fractured 10 and 30 Degree Off-Axis 4.2 MilBORSIC + 6061-F Aluminum Tensile Specimens
xiv

LIST OF ILLUSTRATIONS (Co-t d)
Fige
S5-22 End and Side Views of Fractured 45 Degree Off-Axis 4.2 Kil BORSIC+ 6061-F Aluminum Tensile Specimens Tested in Rotating and RigidGrips
5-23 End and Side Views of Fractured 60 and 80 Degree Off-Axis 4.2 MilBORSIC + 6061-F Aluminum Tensile Specimens
5-24 End and Side Views of Fractured 90 Degree Off-Axis 4.2 Mil BCORSIC+ 6061-F Aluminum Tensile Specimen
5-25 End and Side Views of Fractured 100, 300, and 450 Off-Axis 63 v/o
5.7 Mil BORSIC + 6061-F Aluminum Tensile Specimens
5-26 Transverse Section of 5.7 Mil BORSIC + 6061-T6 Composite Material
5-27 Ultrasonic Velocity Measurement System
5-28 Density Times the Square of Sonic Velocity as a Function of AngleRelative to the Filament Orientatior
5-29 Ratio of Density Times the Square of Sonic Velocity to ElasticModulus as a Function of Angle Relative to the Filament Orientation
6-1 Experimental Method in Fatigue Testing
6-2 Axial Tension - Tension Low Cycle Fatigue of 4.2 Mil BORSIC-6061-FAluminum
6-3 Region of Axial-50 v/o-14.2 BORSIC-6061 Fatigue Specimen
6-4 Axial 50 v/o-4.2 BORSIC-6061 Fatigue Specimen After Fatigue Testing
6-5 Radiograph Taken at the Fracture Surface of a 0°-50 v/o-4.2 MilBORSIC-606l Aluminum Composite Low Cycle Fatigue Specimen
6-6 56 v/o-5.7 BORSIC-6061 Tensile Specimens
6-7 Progressive Fiber Failure at the Edges of Notch in 30 v/o-5.7 MilBORSIC-6061 Tensile Specimen Loaded to 96% of the Ultimate FractureSLoad
6-8 Nztch Edges After Tciisile Failure for Same Specimen as Figure 6-7
xv

LIST OF ILLUSTRATIONS (Cont'd)
6-9 Notch Tips of 56 W/o-5.7 Mil BORSIC-6061-Patigue Specimen after1347 Cycles
6-10 Fractured Center Notched Fatigue Specimen Net UTS = 188,000 psi.Same Specimen as Figure 6-9
6-11 Notch Region of Fractured Fatigue Specimen. Same Specimen asFigure 6-9
6-12 Fracture Surface of Center Notched Fatigue Specimen. Same Specimenas Figure 6-9
6-13 Fractured Specimens After Fatigue Cycling
6-14 Transverse Tension - Tension Low Cycle Fatigue of 4.2 Mil BORSIC-6061 Aluminumn
6-15 Transverse Tension - Tension Low Cycle Fatigue of 58% 5.7 BORSIC-66 Aluminum
6-16 Tension - Tension Low Cycle Fatigue of 1,4 v/o 4.2 Mil BORSIC-606!1Aluminum
6-17 Radiograph of Fatigued Cross Ply 4.2 Mil BORSIC-6061 Composite
6-18 Fracture Surface of +450-4.2 Mil BORSIC-6061 Fatigue Specimen
6-19 Fracture Surface of 00/900 5.7 Mil BORSIC-6061 Fatigue Specimen
6-20 Tensile Str'ess Strain Curve for 00/ 9 00 57 v/o-5.7 BORSIC-6061
6-21 Tension - Thnsion Low Cycle Fatigue of 0 0/900 57 v/o-5.7 BORSIC-6061
6-22 Radiograph cf Crack Tip in 00/900-57 v/o-5.7 Mil BORSIC-6061
6-23 Tensile Stress Strain Curve for +450 5.7 BORSIC-6061
6-24 Fracture Surface of +450 5.7 BORSIC 6o61 Fatigae Specimen
6-25 Fiber Fracture in a +450-57 v/o 5.7 Mil BORSIC-6061 Fatigue Specimen
xvi
LIST OF ILLUSTRATIONS (Cont' d)
Figure
7-1 Microstructures of 4.2 Mil BORSIC + 6061-F Aluminum CompositeMaterial
7-2 Impact Energy Per Unit Area for 4.2 Mil BORSIC + 6061-F AluminumFull Size Charpy "'" Notch Specimens
7-3 Effect of Heat Treatment on the Impact Energy Per Unit Area for50 v/o BORSIC + 6061 Aluminum (Full Size Charpy "V" Notch Specimens)
7-4 Effect of Width on the Impact Energy Per Unit Area for 4.2 Mil BORSIC6061-F Aluminum Charpy "V" Notch Specimens
7-5 Effect of Thickness on the Impact Energy Per Unit Area for 4.2 MilBORSIC + 6061-F Aluminum Charpy "V" Notch Specimens
7-6 Effect of Orientation on Impact Energy Per Unit Area for 4.2 MilBORSIC + 6061-F Aluminum Full Size Charpy "V" Notch Specimens
7-7 Scanning Electron Fractograph of Type LT50 v/o 4.2 Mil BORSIC +6061-F Aluminum Impact Specimen
7-8 Charpy Impact Fracture Surfaces of 4.2 Mil BORSIC + 6061-F ConstantWidth and Notch Depth - Variable Thickness
7-9 Charpy Impact Fracture Surfaces of 4.2 Mil BORSIC + 6061-F ConstantThickness and Notch Depth - Variable Width
7-10 Scanning 2lectron Fractograph of Type TL50 v/o 4.2 Mil BORSIC +6061-F Aluminum Impact Specimen
7-11 Scanning Electron Fractograph of Type TT50 v/o 4.2 Mil BORSIC +6061-F Aluminum Impact Specimen
7-12 Fractograph of Type LT63 v/o 8.0 Mil Boron + 6061-F Aluminum ImpactSpecimen
7-13 Scanning Electron Fractographs of 50 v/o 4.2 Mil BORSIC + 6061-FAluminum +45 Degree Laminates
7-14 Charpy Impact Strength of Selected Materials
xvii
L

LIST OF ILLUSTRATIONS (tont'4)
Filure
7-15 Typical Load-Deflection Curve for Type LT 4.2 Mil BOFSIC + 6061Al Slow Bend Test
7-16 Typical Load-Deflection Curve for Type TL and Type TT 4.2 NilBORSIC + 6o6i Al Slow Bend Test
7-17 Effect of Volume Percent Filament on the Loi ched FlexuralStrength of 4.2 Mil BORSIC + 6061-F Aluminum
7-18 Variation of Impact and Slow Bend Fracture Energy with VolumePercent Fiber for Axially Reinforced 4.2 Mil BORSIC + 6061-FAluminum Composites
7-19 Variation of Impact and Slow Bend Fracture Energy with VolumePercent Fiber for Transversely Reinforced 4.2 Mil BORSIC + 6061-FAluminum Composites
7-20 Kahn Tear-Test Specimens and Representation of Load-DeformationCurves (Left) and Unit Propagation Energy vs. Tensile Yield Strengthof 0.063 in. Aluminum Alloy Sheet (Right) (After Kaufman and Holt)
7-21 Photomicrographs of Interrupted Three Point Bend Test of Type LT4lv/o 4.2 Mil BORSIC + 6061-F A".uminum (Spýciinen Polished Prioi toTest and Loaded to Point A in Figure 7-15)
7-22 Photomicrographs of Interrupted Three Point Bend Test of Type LT5Ov/o 4.2 Mil BORSIC + 6061-F Aluminum (Specimen Polished Prior toTest and Loaded to Point B in Figure 7-15)
7-23 Photomicrographs of Interrupted Three Point Bend Test of Type TL41v/o 4.2 Mil BORSIC + 6061-F Aluminum (Specimen Polished Prior toTest and Loaded to Point A in Figure 7-16)
7-24 Photomicrographs of Interrupted Three Point Bend Test of Type TT50v/o 4.2 Mil BORSIC + 6061-F Aluminum (Specimen Polished Prior toTest and Loaded to Point A in Figure 7.-16)
7-25 Variation of Impact Energy Per Unit Area with the ParameterVfdf(a-uf) 2 for BORSIC + Aluminum and Boron + Aluminum Composites
24 Tmy
x•'iii

LIST OF ILLUSTRATIODS (Cont'd)
8-1 Center-Notched Ten. ile Specimen in Loading Fixture
8-2 Net Fracture Strength of Center Notched 4.2 Mil BORSIC + Aluminum
8-3 Variation of Net Fracture Strength with Flaw Size as a Functionof Specimen Thickness for 4.2 Mil BORSIC + 6061-F AluminumComposites
8-4 Net Fracture Strength of 4.2 Mil BoRSIC + 6061-F Aluminum withCenter Circular Holes
8-5 Net Fracture Strength of Notched Heat Treated 4.2 Mil BORSIC +Aluminum
8-6 Typical Stress-Displacement Curve for 4.2 Mil BORSIC + 6061-FAluminum Center Notch Specimen Under Uniaxial Tension
"8-7 View of Stress-Coat Crack Pattern on an Axially Reinforced (Type LT)50 v/o 4.2 Mil BORSIC + 2024-F Aluminum Center-Notched TensileSpecimen
8-8 Fracture Surface of 50 v/o 4.2 Mil BORSIC + 6061-F Aluminum
Center-Notched Tensile Specimen
8-9 Side View of Fractured Axially Reinforced (Type LTP) 4.2 Mil BORSIC+ 2024-F Aluminum Alloy Center Notched Tensile Specimen (Left) andX-ray Radiograph of Region Near Original Crack Tip (Right)
8-10 Fractured 4.2 Mil BORSIC +. 6061 Aluminum Center Notched Specimen
8-11 Cr Shadowed Replica Around Circular Hole in 4.2 Mil BORSIC + 6061-FAluminum at 99 Percent of Fracture Stress
9-12 Fractured 4.2 Mil BORSIC + 6061-F Aluminum Specimen Containing aCtrcular Hole
8-13 Net Fracture Strength of Center Notched 4.2 Mil BORSIC + Titaniumand Graphite + Epoxy
8-14 Fracture Surface of 50 v/o 4.2 Mil BORSIC + Beta III TitanitunCenter-Notched Tensile Specimen
l • xix

LIST OF TLLUSTRATIONS (Cont'd)
Figure
8-15 Fractured 4.2 Mil BORSIC + Beta III Titanium Center NotchedSpecimen
8-16 View of Fractured Longitudinally Reinforced (Type LT) 50 v/oHMG-50 Graphite + BP-907 Epoxy Center Notched Tensile Spc-!imen
8-17 Net Fracture Stress as a Function of Initial Flaw Length forBORSIC + 6061-F Aluminum Composite Material
8-18 Fracture Surface of a Typical Transversely Reinforced (Type TL)50 v/o 4.2 Mil BORSIC + 6061-F Aluminum Center-Notched TensileSpecimen
8-19 Variation of Transverse Strength with Percent Split "hers on theFracture Surface of 50 v/o 4.2 Mil BORSIC + 6061-F AluminumComposite Material
8-20 Gross Fracture Strength of Center Notched 4.2 Mil BORSIC +Aluminum
8-21 El1stic Longitudinal Strebs Concentration Factor for 50 v/o 4.2Mil BORSIC + 6061-F Aluminum Under Uniaxial Longitudinal Tension
8-22 Elastic Shear Stress Concentration Factor for 50 v/o 4.2 MilBORSIC + 6061-F Aluminum Under Uniaxial Longitudinal Tension
8-23 Elastic Transverse Stress Concentration Factor for 50 v/o 4.2 MilBORSIC + 6061-F Aluminum Under Uniaxial Longitudinal Tension
8-24• Variation of Gross Fracture Strength with Flaw Size for SelectedMaterials
.XE
LIST OF TABLES
Table No.
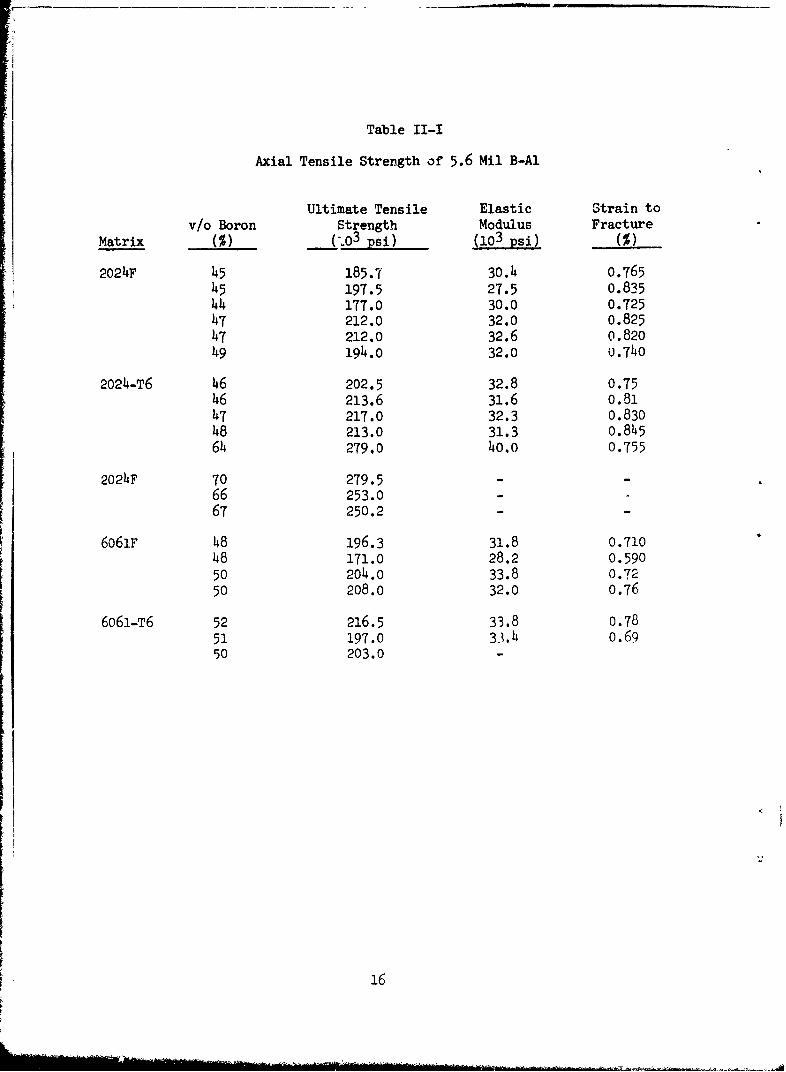
II-I Axial Tensile Strength of 5.6 Mil B-Al
II-II Axial Tensile Strength of 48 v/o 5.6 Mil B-6061
II-III Axial Tensile Strength of 5.7 mil BORSIC-Al Composites
II-IV Strength of 4.2 Mil BORSIC Fibers Extracted fromComposite Tapes
III-I Heat Treatments Given BORSIC-Aluminum Salt Exposure
Specimens
III-II High Temperature Air Exposure of 6061-F Composites
IV-I Heat Treatment Procedures
IV-.I Experimentally Determined Properties of Plasma S9ra-edMaterial with Foil
IV-.'II Diffusion Bonding Conditions Capable of ProducingFully Consolidated 50% BORSIC-Matrix Composites
IV-IV Transverse Tensile Properties of 5.6 mil B-Al
IV-V Transverse Tensile Properties of 5.7 mil BORSIC-Al
IV-VI 4.2 Mil BORSIC-Titanium Composites
IV-VII 5.7 Mil BORSIC-Titanium Composites
V-I Results of h.2 Mil BORSIC + 6061-F Off-Axis Tests
V-II Results of 5.7 Mil BORSIC + 6061-T6 Off-Axis Tests
V-III Micromechanical Elastic Predictions for BORFIC +6061 Aluminum
V-IV Strength of 6061 Alu-inum Alloy
VI-I 5.7 BORSIC-6061 Center Notched Specimen Tensile TestResults
Vi-II Tensile Properties of 57%-5.7 mil BORSIC-6061 CrossPly Composites Tested at 450 to the Fiber Axes
xxi

LIST OF TABLES (Cont'd)
Table No.
VII-I Impact Energy Per Unit Area for Plasma SprryedBORSIC + Aluminum Composites
VII-II Impact Energy Per Unit Area for Nominal 50 v/o 4.2 MilBORSIC Fiber + Aluminum
VII-III Slow Bend Fracture Work for Type LT BORSIC + 6061-FSpecimens
VII-IV Strength of Filaments in Impact Specimens
VIII-I Fracture Strength of Longitudinally Reinforced CenterNotched BORSIC + Aluminum Composites
VIII-II Fracture Strength of Longitudinally Reinforced 4.2 MilBORSIC + 6061-F Aluminum Composites with CenterCircular Holes
VIII-Ill Fracture Strength of Longitudinally Reinforced HeatTreated Center Notched 4.2 mil BORSIC + AluminumCompos ites
VIII-IV Fracture Strength of Longitudinally Reinforced CenterNotcned 4.2 mil BORSIC + Beta III Titanium Composites
VIII-V Fracture Strength of Longitudinally Reinforced CenterNotched HMG-50 Graphite + BP-907 Epoxy Composites
VIII-VI Net Fr&cture Strength of Type LT BORSIC + AluminumComposites
VIII-VII Longitudinal Tensile Properties of 50 v/o 4.2 milBORSIC + Beta III Titanium
VIII-VIII Longitudinal Tensile Properties of HMG-50 Graphite +BP-907 Epoxy Composites
VIII-IX Fracture Strength of Transversely Reinforced CenterNotched BORSIC + 6061-F Aluminum Composites
VIII-X Elastic Stress Concentration Factors for 0.100 inchElliptical Flaws in Fiber Reinforced Composite Systems
I
xxii
L
I. INTRODUCTION
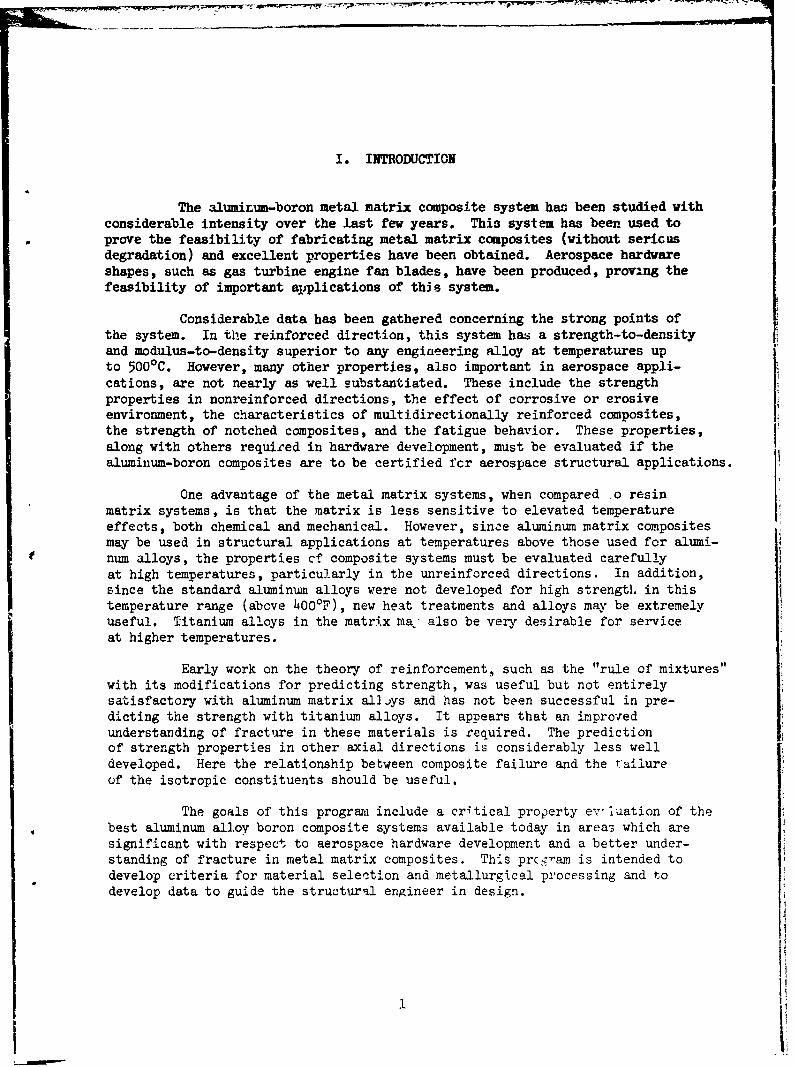
The aluminum-boron metal matrix composite system has been studied withconsiderable intensity over the last few years. This system has been used toprove the feasibility of fabricating metal matrix composites (without sericusdegradation) and excellent properties have been obtained. Aerospace hardwareshapes, such as gas turbine engine fan blades, have been produced, proving thefeasibility of important applications of this system.
Considerable data has been gathered concerning the strong points ofthe system. In the reinforced direction, this system has a strength-to-densityand modulus-to-density superior to any engineering alloy at temperatures upto 500 0 C. However, many other properties, also important in aerospace appli-cations, are not nearly as well substantiated. These include the strengthproperties in nonreinforced directions, the effect of corrosive or erosiveenvironment, the characteristics of multidirectionally reinforced composites,the strength of notched composites, and the fatigue behavior. These properties,along with others required in hardware development, must be evaluated if thealuminum-boron composites are to be certified fcr aerospace structural applications.
One advantage of the metal matrix systems, when compared o resinmatrix systems, is that the matrix is less sensitive to elevated temperatureeffects, both chemical and mechanical. However, since aluminum matrix compositesmay be used in structural applications at temperatures above those used for alumi-num alloys, the properties cf composite systems must be evaluated carefullyat high temperatures, particularly in the unreinforced directions. In addition,since the standard aluminum alloys were not developed for high strengtl in thistemperature range (above 400 0F), new heat treatments and alloys may be extremelyuseful. Titanium alloys in the matrix ma; also be very desirable for serviceat higher temperatures.
Early work on the theory of reinforcement, such as the "rule of mixtures"with its modifications for predicting strength, was useful but not entirelysatisfactory with aluminum matrix alljys and has not been successful in pre-dicting the strength with titanium alloys. It appears that an improvedunderstanding of fracture in these materials is required. The predictionof strength properties in other axial directions is considerably less welldeveloped. Here the relationship between composite failure and the railureof the isotropic constituents should be useful.
The goals of this program! include a critical property ev- luation of thebest aluminum alloy boron composite systems available today in area3 which aresignificant with respect to aerospace hardware development and a better under-standing of fracture in metal matrix composites. This prcgram is intended todevelop criteria for material selection and metallurgical processing and todevelop data to guide the structural engineer in design.
Ii
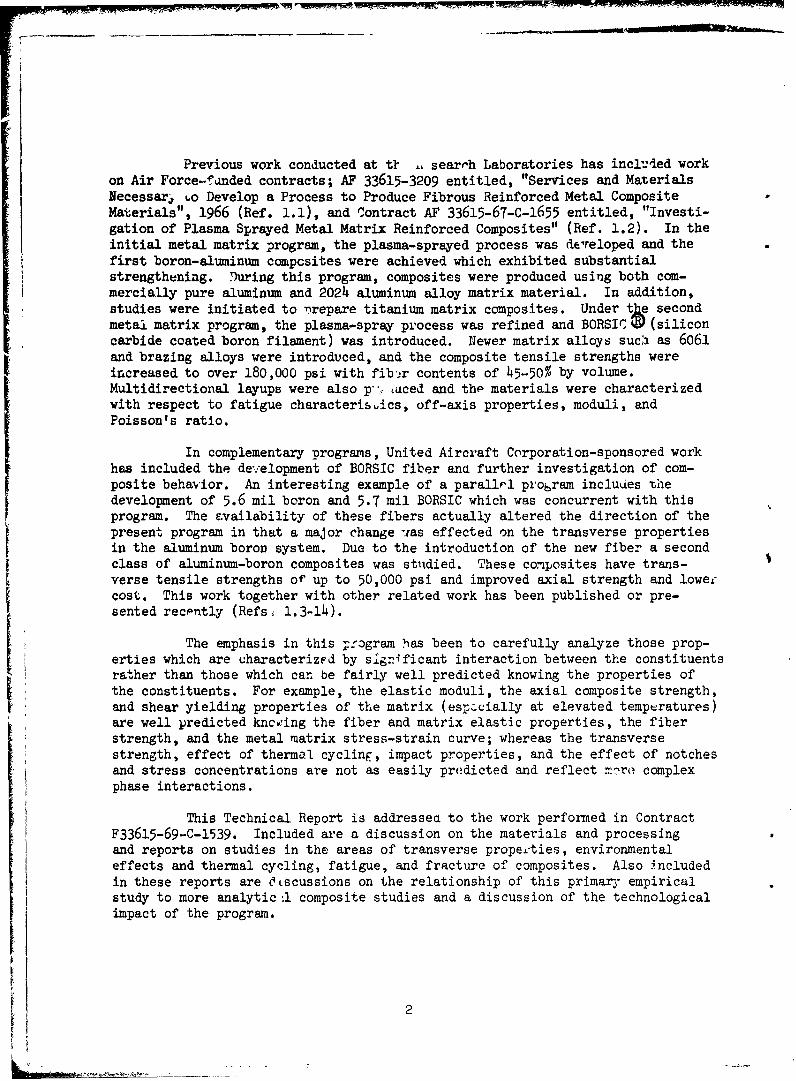
Previous work conducted at t1, - searc'h Laboratories has included workon Air Force-fanded contracts; AF 33615-3209 entitled, "Services and MaterialsNecessar, 6o Develop a Process to Produce Fibrous Reinforced Metal CompositeMaterials", 1966 (Ref. 1.1), and Contract AF 33615-67-c-1655 entitled, "Investi-gation of Plasma Sprayed Metal Matrix Reinforced Composites" (Ref. 1.2). In theinitial metal matrix program, the plasma-sprayed process was developed and thefirst boron-aluminum composites were achieved which exhibited substantialstrengthening. During this program, composites were produced using both com-mercially pure aluminum and 2024 aluminum alloy matrix material. In addition,studies were initiated to nrepare titanium matrix composites. Under tke secondmetal matrix program, the plasma-spray process was refined and BORSICV (siliconcarbide coated boron filament) was introduced. Newer matrix alloys suca as 6061and brazing alloys were introduced, and the composite tensile strengths wereincreased to over 180,000 psi with fib'±r contents of 45-50% by volume.Multidirectional layups were also p- ,aced and the materials were characterizedwith respect to fatigue characterisvics, off-axis properties, moduli, andPoisson's ratio.
In complementary programs, United Aircraft Corporation-sponsored workhas included the development of BORSIC fiber and further investigation of com-posite behavior. An interesting example of a parallel program includes thedevelopment of 5.6 mil boron and 5.7 mil BORSIC which was concurrent with thisprogram. The availability of these fibers actually altered the direction of thepresent program in that a major change ias effected on the transverse propertiesin the aluminum boron system. Due to the introduction of the new fiber a secondclass of aluminum-boron composites was studied. These composites have trans-verse tensile strengths of up to 50,000 psi and improved axial strength and lowercost. This work together with other related work has been published or pre-sented recently (Refs, 1.3-14).
The emphasis in this ;fogram lias been to carefully analyze those prop-erties which are characterized by significant interaction between the constituentsrather than those which can be fairly well predicted knowing the properties ofthe constituents. For example, the elastic moduli, the axial composite strength,and shear yielding properties of the matrix (especially at elevated temperatures)are well predicted kncving the fiber and matrix elastic properties, the fiberstrength, and the metal matrix stress-strain curve; whereas the transversestrength, effect of thermal cycling, impact properties, and the effect of notchesand stress concentrations are not as easily predicted and reflect Zcore complexphase interactions.
This Technical Report is addressed to the work performed in ContractF33615-69-C-1539. Included are a discussion on the materials and processingand reports on studies in the areas of transverse propei'ties, environmentaleffects and thermal cycling, fatigue, and fracture of composites. Also includedin these reports are O.scussions on the relationship of this primary empiricalstudy to more analytic ,l composite studies and a discussion of the technologicalimpact of the program.
t2

"I •---------
SECTION I - REFERENCES
1. K. Kreider and G. R. Leverant, "Boron Plber Metal Matrix Composites",AFML-TR-66-219, July 1966.
2. K. G. Kreider, R. D. Schile, E. M. Breinan, and M. A. Marciano, "PlasmaSprayed Metal Matrix Fiber Reinforced Composites", AFML-TR-68-119, July1968.
3. K. G. Kreider and M. A. Marciano, "Mechanical Properties cf Boron AluminumComposite", Trans. AIME, June 1969.
4. "Mechanical Testing of Metal Matrix Composites", Composite Materials:Testing and Design, STP 490 ASTM, Philadelphia, 1969.
5. E. M. Breinan and K. G. Kreider, "Braze Bonding and Joining of BORSICAluminum composites", Metal Engineering Quarterly, November 1969.
6. E. R. Thompson and K. G. Kreider, "Composite Materials", McGraw Hill Year-book of Science and Technology, 1970.
7. E. M. Brein&. and K. G. Kreider, "Materials Technology for BORSIC AluminumRotating Structural Aircraft Parts", Metals P rgress, May 197U.
8. K. Kreider, "Me al Matrix Composite Mechanical Testing", Conference onTesting Fibrous Composites for Mechanical Propertiez, July 15, 1970,Teddington, Middlesex, England.
9. K. Kreider, "High Modulus Composites in the United States", Presented atU. S. Department of Commerce Symposium on High Performance Materials,London, U. K., April 27, 1971.
10. K. G. Kreider and V. M. Patarini, "Thermal Expansion of Boron Fiber-AluminumComposites", Metallurgict• Trans., Vol. 1, December 1970.
11. K. Kreider and K. Prewo, "Transverse Strength of Boron Fibers", Presentedat Second Conference on Composite Materials: Testing and Design, Anaheim,Calif., April 1971.
12. K. Kr.ider and K. Prewo, "The Transverse Strength and Elastic Modulus ofBoron-Alumiiium Composites", Presented at TMS-AIME in Las Vegas, Nevada,May 1970; To be published in Met. Trans.
13. E. Breinan and K. Kreider, "Transverse Creep and Fracture of BORSIC-Aluminum Composites", Presented at TMS Spring Meeting, May 1970.
l. K. Kreider, "BORSIC Titanium Aluminum Composites", Presented at TMS SpringMeeting, May 14, 1970.
3
II. MATERIALS AND PROCESSING
2.1 Materials
2.1.1 Fiber
Fiber composites were fabricated using primarily boron or BORSIC fiber.Four mil fiber (0.004 + 0.0001 in. in diameter) has an axial modulus of 56-57x 108 psi and typica1l7 has an ultimate tensile strength of 450,000 psi witha mean deviation of less than 80,000 psi. The BORSIC 4.2 mil fiber has a coatingof silicon carbide approximately 0.001 in. thick which permits fabrication athigher temperatures in aluminum and titanium and has far superior oxidationresistance (Refs. 2.1,2). Although 'he oxidation resistance of boron is poorabove 400 0 C, BORSIC has excellent oxidation resistance up to 10000 C. In addition,the reaction between boron and aluminum limits the maximum time-temperatureexposure product (without significant fiber degradation) to approximately 1/2 hrat 500 0 C. Th!a generally forces the diffusion bonding step to be performedat 4000 psi or higher which is often inconvenient in large, or complex shapedparts particularly if they are cross-plied. BORSIC, in both 4 mil and 5.6 milfiber diameters, has ultimate tensile strengths of approximately 10% lower thanthe uncoated boron fiber as it is currently being produced. This lower strengthis also observed in the BOF'SIC-aluminum composites. However, the large diameterboron fiber has a 10% higher average stienfth compared to 4 mil or 500,000 psi.These differences are evident in the composites described in Table II-I. Theboron fiber used in this program was su.l;2ied by the Air Force MaterialsLaboratory.
2.1.2 Matrix Material
The matrix alloyn employed included both foil and plasma spray depositsfrom prealloyed powder. Commercial foils of 2024, 6061, 5052, SAP, 713 (Al +7%Si), and 1145 were used with the corresponding aluminum alloy powders. Also,aluminum-iron and 8001 powders were employed separately. The titanium matrixcomposites were made with commercial Ti 6/4 (Ti + 6AI + 4v) and PIII (Ti +ll.5Mo + 6Zr + 4.5Sn) foils. The specific properties of these matrix materialsis treated in Section IV-Transverse Properties, particularly as they apply tocomposite properties.
2.1.3 5.6 Mil Boron F'ber Composites
Composites made from the 5.6 mil boron fiber hvaw somewhat superioraxial properties compared to those fabricated with 4 mil fiber. Since informa-tion on their strength values is not in the open literature, a discussion ofthe axial properties of 5.6 mil boron composites is given below. These prop-erti( ere determined at United Aircraft Research Laboratories under Corporatefunds.
The results of the axial tensile tests performed at room temperatureon the boron reinforced composites are presented in Table II-IA. The data in
Table II-i indicate that composite tensile strength increases with increasing
14
-- II I II - -_ l -I i -
II
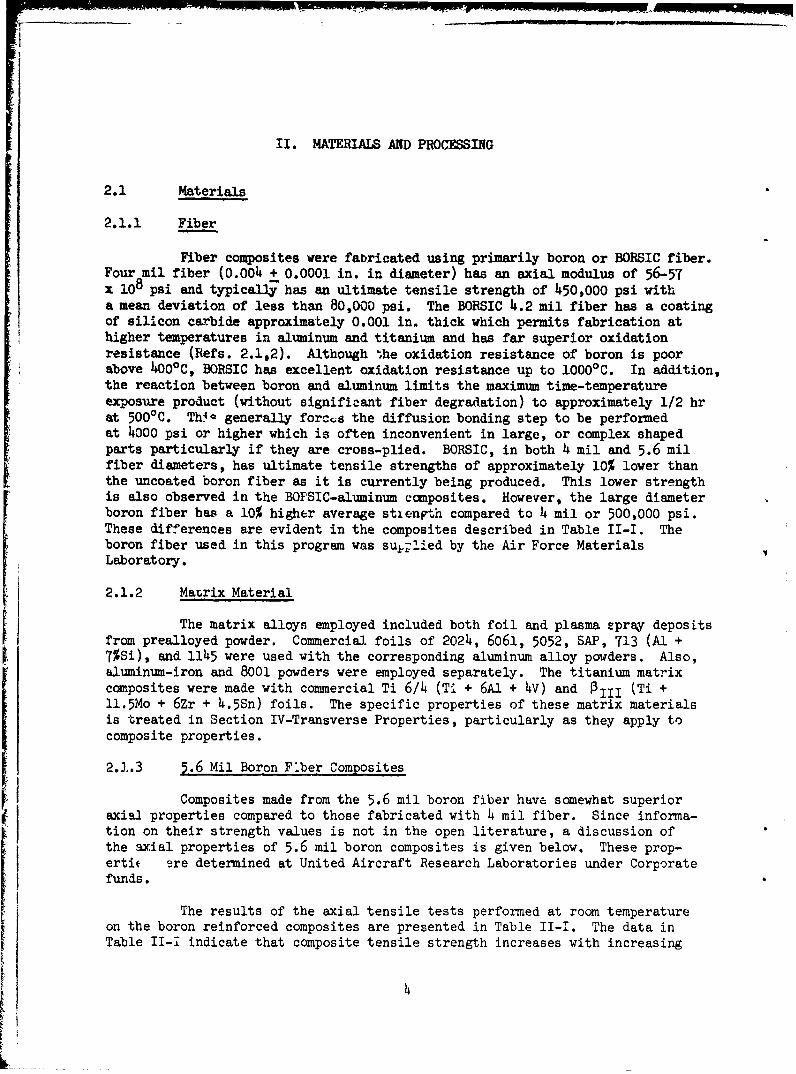
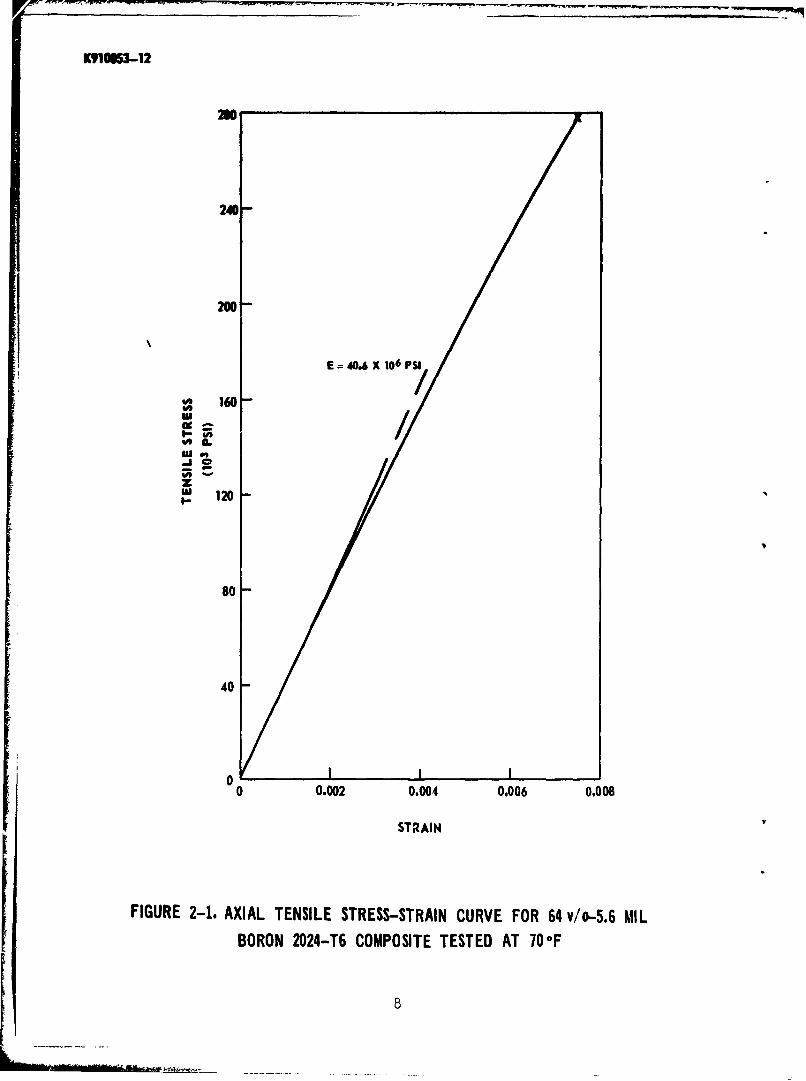
volume fraction fiber and through the use of the T6 heat treatment. The com-posite elastic modulus data are in approximate agreement with a rule-of-mixturescalculation. Figure 2.1 presents the axial tension stress-strain curve for a 2024alloy matrix composite containing 64% by volume of 5.6 mil diameter boron fiber.The composite was heat treated prior to testing to produce a modified T-6 con-dition. The composite ultimate tensile strength was 279,000 psi.
Tensile tests at elevated temperature were performed on compositescontaining approximately 50% by volume 5.6 mil boron in the 6061 alloy matrix.Table II-II includes the results of the elevated temperature tensile results.In each case, the specimen was held at temperature for approximately 30 minutesprior to testing. At 9002' these composites still exhibited 60% of their roomtemperature tensile strength.
Axially reinforced composites of 5.7 mil BORSIC-aluminum were alsotensile tested at room temperature. The results for 6061 aluminuL matrixspecimens tested in the as-fabricated and heat treated conditions are presentedin Table ll-IIl. For comparison it may be pointed out that composites con-taining 58% by volume 4.2 mil BORSIC fiber in 6061 matrix failed at approximately185,000 psi. The data in Table II-III indicate that a stren th level of 200-220,000 psi is typical of the large diameter BORSIC composites for the samevolume fraction fiber. This higher axial tensile strength is directly due tothe superior performance of the large diameter fiber. Transverse strength ofthese composites is discussed in Section III.
2.2 Processing
The composites were fabricated by hot press diffusion bonding ofeither plasma-sprayed or polystyrene-bonded monolayer tapes. The filamentwinding operation is performed on a modified engine lathe, using a screw-threadauger to control the fiber spacing (Fig. 2.2). The aluminum foil wrapped mandrelwhich receives the winding is spring loaded to allow for thermal expansion mis-match between the aluminum foil substrate and the fiber. Plasma-spray fabricationwas done in argon (Fig. 2.3). The cylindrical mandrel covered with a layer ofaligned filament is rotated and traversed before a plasma arc to deposit aneven layer of matrix alloy. Aluminum alloy powder is then injected into thehot gas of the plasma arc and melted in the exothermic or recombination zone.The molten aluminum droplets are impacted on the foil and fiber and quicklysolidified bonding the monolayer tape together.
The hot press diffusion bonding step is discussed also in the trans-verse property section, particularly as to how the vqrious parameters affectthe properties. Best results are obtained by hot pressing within 100OF of thesolidus temperature at greater than 5000 psi in a nonoxidizing atn.:sphere. Plasticdeformation, which is very important in the diffusion of aluminum, is accomplishedby compressing the porosity of the plasma-spray layer and deforming the foil.This composite fabrication technique was used in order to fabricate the compositecontaining 6061 aluminum alloy matrix and 50% volume fraction BORSIC depictedin Fig. 2.4. Similar photomicrographs are given for composites made with 5.7mil RORSIC fiber (Fig. 2.5), and triplex composites boron-aluminum-titanium(Fig. 2.6) and boron-aluminum-rocket wire (Fig. 2.7).
"5

After plasma spraying the monolayer tape, the fibers were removed bydissolving the aluminum in 10% hydrochloric acid and tensile tested. No filamentdegraiiation was evident and typical values of the measured strength are givenin Teale II-IV.
Titanium matrix composites and some aliminum matrix composites werefabricated using the foil plus fiber with a fugitive binder polystyrene. Thelaminate is heated to 450 0C in vacuum to outgas the binder and subsequently hotpressed (typically at 800°C and 10,000 psi for titanium composites) for diffusionbonding. Both alloys, Ti 6/4 and PIII, were used with BORSIC fibers and atypical microstructure is given in Fig. 2.8.
6
SETON II - REFERENCES
1. M. Basche, R. Fanti, and F. Galasso, "Preparation and Properties of SiliconCarbide Coated Boron Filaments", Int. Fiber Sci. and Tech., Vol. 1, 1968.
2. M. Basche, "Interfacial Stability of Silicon Carbide Coated Boron FilamentReinforced Metals" from "Interfaces in Composites, ASrL4-STP 452, Am. Soc. Testingand Material, p. 130, 1969.
7
K91OW3-12
240-
200 -
E =d40.6 X 106 PSi
160-
z*~120
40
40
0O I
0 0.002 0.004 0.006 0.008
STRAIN
FIGURE 2-1. AXIAL TENSILE STRESS-STRAIN CURVE FOR 64 v/0-5.6 MIL
BORON 2024-T6 COMPOSITE TESTED AT 70OF

-- --.- ~-C-
K910653CL
co
LI-
ILQ-
VC
9u

K91U53-12
PESeSSO
En
I-
0�
a-U)
I
U)
-J
a.
(%JLU
K '3,
10

$
K910s03-12
FIGURE 2-4. DIFFUSION BONDED 4.2 MIL BORSIC-ALUMINUM COMPOSITE USING MONOLAYERPLASMA SPRAYED TAPES
Ilk-i
- 910UO3-12
Reproduced from 1001best available copy. -OX
FIGURE 2-5. 53 vfo LARGE DIAMETER BORSIC-6061 ALUMINUM COMPOSITE
12

•-Kq, -12
V 4I I
100 (L
FIGURE 2-6. 4.2 MIL BORSIC - ALUMINUM - TI rANIUM COMPOSITE
13
KVXM-312
Reproduced frombest available copy.
100
FIGURE 2-7. 4 2 MIL BORSIC - ALUMINUM -AFC -77 ROCKET WIRE COMPOSITE
I14
K910853-12
FIGURE 2-8. 4.2 MIL BORSIC - TITANIUM 6 Al /4 V MATRIX COMPOSITE
15
.. ...... ... m~ ~ .. mm l mm~
Table II-I
Axial Tensile Strength of 5.6 Mil B-Al
Ultimate Tensile Elastic Strain tov/o Boron Strength Modulus Fracture
Matrix (%) (-O3 psi) (103 psi) (%)
2024F 45 185.7 30.4 0.76545 197.5 27.5 0.83544 177.0 30.0 0.72547 212.0 32.0 0.82547 212.0 32.6 0.82049 194.0 32.0 0.740
2024-T6 46 202.5 32.8 0.7546 213.6 31.6 0.8147 217.0 32.3 0.83048 213.0 31.3 0.84564 279.0 4o.o 0.755
2024F 70 279.5 -66 253.067 250.2 -
6o61F 48 196.3 31.8 0.71048 171.0 28.2 0.59050 204.0 33.8 0.7250 208.0 32.0 0.76
6o61-T6 52 216.5 33.8 0.7851 197.0 33.4 0.6950 203.0 -
16

1'
Table II-II
Axial Tensile Strength of 48 v/o 5.6 mil B1-6061
Test Temperature UTS
(OF) (103 psi)
70 196.370 171.0
500 177.0500 135.2
900 143.8900 137.3
17
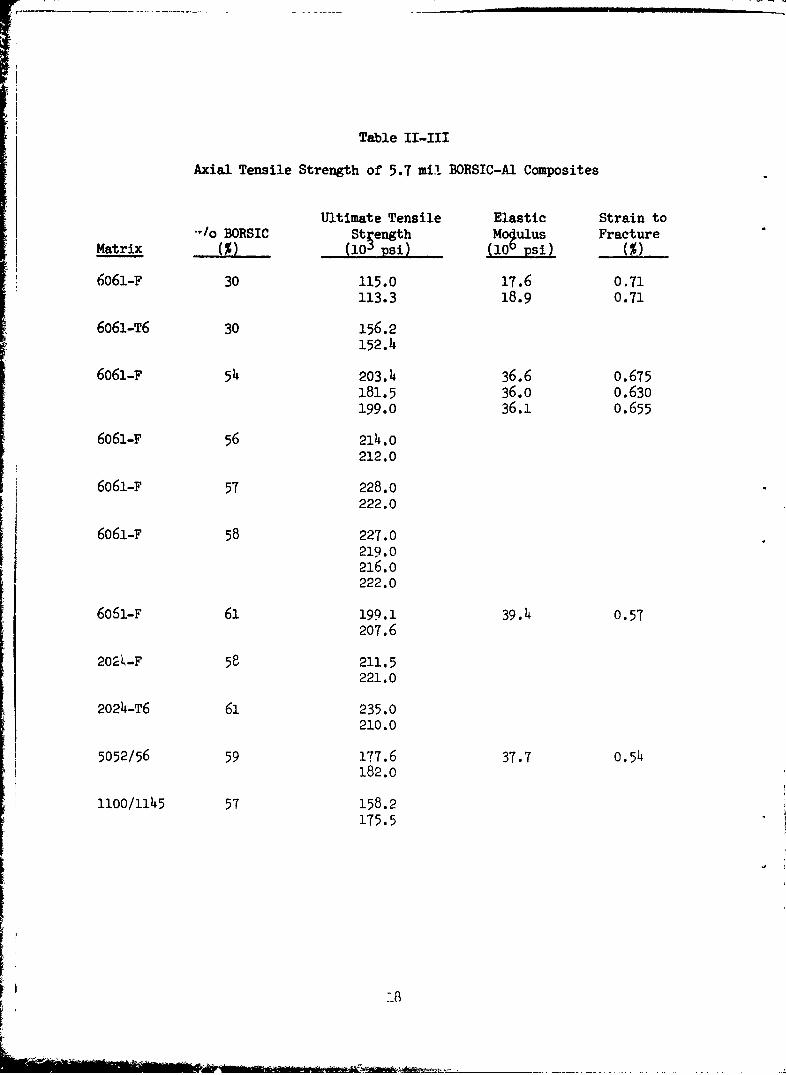
Table Il-Ill
Axial Tensile Strength of 5.7 mi! BORSIC-Al Composites
Ultimate Tensile Elastic Strain to•-,o BORSIC Strength Modulus Fracture
Matrix (%) (10- psi) 1(!0, psi) (%)
6061-F 30 115.0 17.6 0.71113.3 18.9 0.71
6o61-T6 30 156.2152.4
6061-F 54 203.4 36.6 0.675181.5 36.0 0.630199.0 36.1 0.655
6061-F 56 214.0212.0
6061-F 57 228.0222.0
6061-F 58 227.0219.0216.o222.0
6051-F 61 199.1 39.4 0.57207.6
202ý-F 58 211.5221.0
2024-T6 61 235.0210.0
5052/56 59 177.6 37.7 0.554182.0
1100/1145 57 158.2175.5
Id
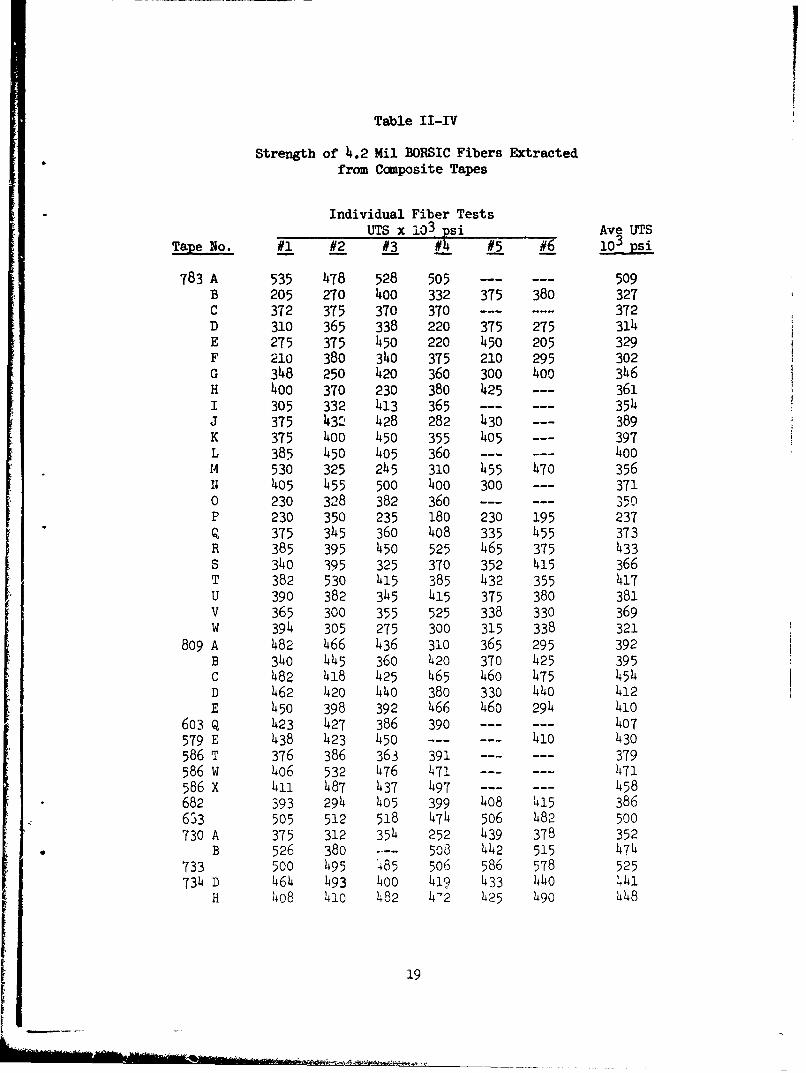
Table II-IV
Strength of 4.2 Mil BORSIC Fibers Extractedfrom Composite Tapes
Individual Fiber TestsUTS x 103 psi Ave UTS
Tape No. #1 #2 #3 #.4 #5 #6 103 psi
783 A 535 478 528 505 --- 509B 205 270 400 332 375 380 327C 372 375 370 370 --- 372D 310 365 338 220 375 275 314E 275 375 450 220 450 205 329F 210 380 340 375 210 295 302G 348 250 420 360 300 400 346H 4oo 370 230 380 425 --- 361I 305 332 413 365 --- 354J 375 432 428 282 430 --- 389K 375 1O0 450 355 405 --- 397L 385 450 405 360 ... ... 4ooM 530 325 245 310 455 470 35611 405 455 500 4oo 300 --- 3710 230 328 382 360 --- -350P 230 350 235 180 230 195 237Q 375 345 360 408 335 455 373R 385 395 450 525 465 375 433S 340 395 325 370 352 415 366T 382 530 415 385 432 355 417U 390 382 345 415 375 380 381V 365 300 355 525 338 330 369W 394 305 275 300 315 338 321
809 A 482 466 436 310 365 295 392B 340 445 360 420 370 425 395C 482 418 425 465 46o 475 454D 462 420 44o 380 330 440 412E 450 398 392 466 460 294 410
603 Q 423 427 386 390 1-- 407579 E 438 423 450 1-- 410 430586 T 376 386 363 391 --- 379586 w 406 532 476 471 .---. 1471586 X 411 487 437 497 1-- 458682 393 294 405 399 408 415 3866'3 505 512 518 474 506 482 500730 A 375 312 354 252 439 378 352
B 526 380 508 442 515 474733 500 495 '85 506 586 578 525734 D 464 493 400 419 433 440 4141
H 4o8 410 482 4"2 425 490 448
19
I-

--. ~~~~~~ ~ ~~ --.- .- ,-----n-----n--m----| • . ..
Table II-TV (Cont'd)
Individual Fiber TestsUTS x 103 psi Ave UTS
Tape No. #1 #_2 # f_ D #6 103 psi
738 350 347 374 311 327 267 329739 510 430 570 480 360 540 482740 465 465 462 468 448 260 4128741 A 525 442 400 468 432 465 455746 408 375 424 417 360 478 414753 A 75 408 418 ... ... ...- 300754 A 90 54o 90 555 420 90 297
B 425 440 422 450 435 --- 434C 520 575 455 445 445 --- 468D 448 445 47o 390 320 470 424
760 485 558 500 445 486 540 502764 B 510 512 410 370 405 485 449
C 505 225 480 472 110 465 376766 335 365 420 400 365 380 378771 470 432 390 442 415 390 423771 D 345 420 520 280 400 560 421
E 478 488 450 340 495 --- 450F 340 462 478 478 385 --- 429
784 398 106 435 365 ... ... 41o792 400 402 412 398 415 335 394793 375 340 300 340 370 430 359801 355 385 345 325 310 385 351
Strength of Boron Fibers Extracted from Composite Tapes
785 A 250 325 345 425 425 105 363B 305 325 350 270 --- 313
20

Table II-IV (Cont'd)
Strength of 5.7 mil BORSIC Extracted from Composite Tapes
Individual Fiber Tests
UTS x 10 3 psi Ave UTSTape No. C/No. Material #1 #2 #3 #4 #5 6 1o3 psi
894 - 6o61/6o61 445 425 495 500 460 360 448899 929 525 48o 395 490 505 48o 479902 931 1400o 485 365 555 565 46o 472914 D -- 1480 385 475 435 550 435 460914 E -- 535 44o 470 550 392 515 484914 F 1018 525 470 482 470 545 54o 505914 C -- 14145 460 310 44o 375 445 413914 B -- 1498 485 585 550 545 535 533914 G -- 4 165 460 515 485 530 48o 489914 H -- 528 460 465 445 500 435 472 472914 I -- 1425 475 382 500 475 470 455914 J -- 140oo 44o 455 435 385 412 421914 A -- 1425 295 435 335 385 245 353914 K -- 508 382 475 485 465 505 470914 L -- 1425 54o 468 430 480 470 469914 M -- 1480 120 380 408 470 225 397914 N -- 390 515 500 455 460 435 459911 0 -- 14140 505 495 500 465 405 467914 P -- 292 310 340 305 393 --- 274914 Q -- 324 309 390 229 236 230 286914 B --R 381 262 348 322 341 400 342914 S -- 333 283 362 405 365 382 355935 lO42 1460 540 460 425 485 470 467.5
465 485 450 435939 1241 2024/2024 340 375 375 525 515 520 450
470 495 495 390943 114o 6061/6061 500 140 490 445 530 500 456.5
415 370 460 415949 1163 1 415 450 425 415 450 435 433
445 415 425 455970 1123 7/3/528 479 510 421 531 497 509 483
530 453 471 432994-1 -- 6061/6o61 370 500 525 385 495 --- 455994-2 -- " 445 420 44o 435 405 --- 429997 1273 2024/2024 500 500 335 420 505 --- 152992 -- 490 525 565 520 433 525 503
575 485 445 480980 -- 8 445 485 440 495 460 471
465 455 460 525
21
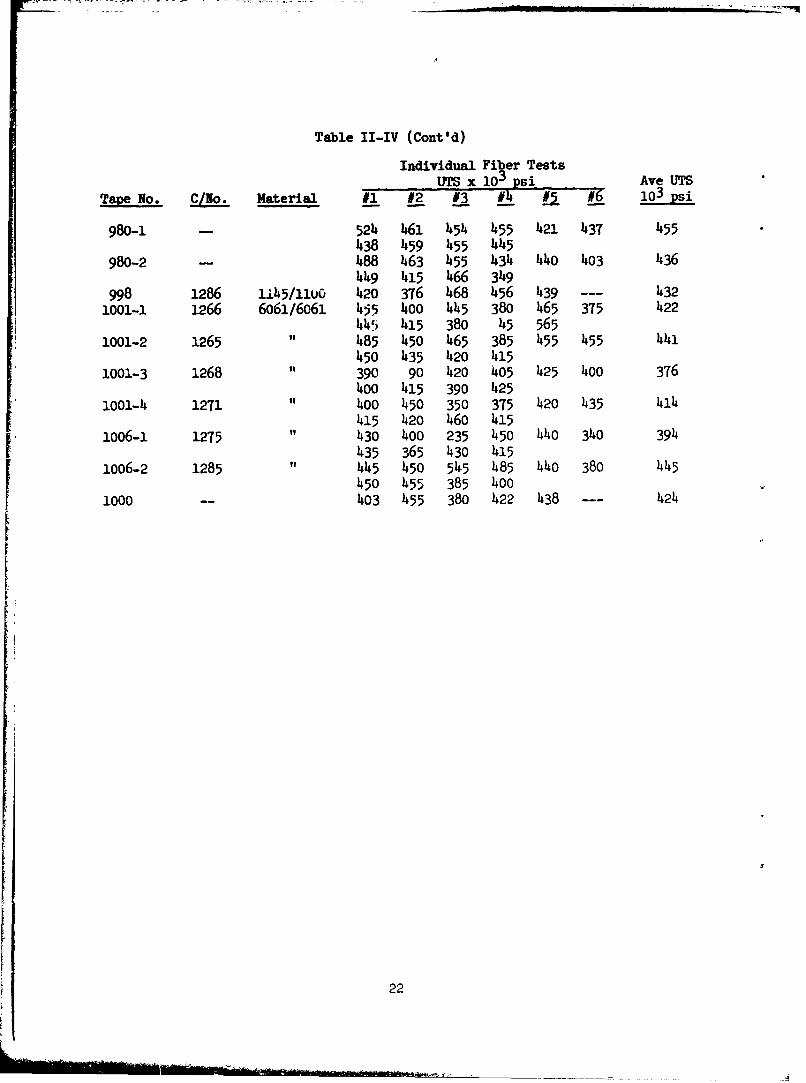
Table II-IV (Cont'd)
Individual Fier TestsUTS x 10 psi Ave UTS
Tape No. C/No. Material #1 #2 #3 L4 - 2 #66 10 3 psi
980-1 - 524 461 454 455 421 437 455438 459 455 445
980-2 - 488 463 455 431 410 403 136449 415 466 349
998 1286 l1.5/lluO 420 376 468 456 439 --- 4321001-1 1266 6061/6061 455 400 445 380 465 375 422
441i 415 380 45 5651001-2 1265 1485 450 465 385 455 455 441
450 435 420 4151001-3 1268 390 90 420 405 425 400 376
4100 15 390 425lO01-1 1271 1400 450 350 375 420 435 414
415 420 460 1151006-1 1275 1430 .00 235 45o 440 340 394
435 365 430 4151006-2 1285 1.1.5 450 545 485 440 380 445
450 455 385 .001000 -- 403 455 380 422 438 --- 424
22

EIJIRONMENTAL EFFECTS
SUM14ARY
Matrix corrosion in 2024 alloy composites resulted in decreased mechanicalprooerties after salt spray exposures. Longitudinal strengths of BORSIC fila-n',ent.s were not affected by the salt spray environment.
Exhposure of 2024 and 6061 matrix BORSIC + aluminum composites to syntheticsea salt spray at 95 0 F and 100 ksi bending stress results in matrix corrosionthat is mcst severe with 2024 matrix material in the as-fabricated condition.6061-F and 6061-T6 matrix composites exhibit general corrosion without pref-erence for regions of high stress whereas 2024-F and 2024-T6 matrix compositesAisplay depths of attack that are approximately 1.9 times greater on thetensile' surfaces than on those in compression without indications of inter-granular stress corrosion cracking. The flexural strengths of 6061-F and6061-T6 matrix composites are unaffected by exposure for periods up to onemconth. The strength of BORSIC + 2024-F and BORSIC + 2024-T6 matrix compositescan be reduced by as much as 100% and 14% respectively after one month as aresult of matrix attack. The longitudinal strength of BORSIC filament is notJegraded as a result of exposure to the humid salt environment.
The exposure of 50 v/o 4.2 mil diameter BORSIC + 6061-F aluminum com-ic.sites to 700'F in air for periods up to 1000 hours has no significanteffect on longitudinal properties (Ca = 166 x 103 psi). The transverse strengthand oodulus of exceptional material 'UT = 18.6 x 10³ psi) were degraded after1000 hours to levels usually exhibited by 4.2 mil BORSIC + 6061-F aluminum(CrT = 13.4 x 10³ psi, E2 2 = 18.9 x 1C6 psi). The strength degradation arisesfrom reduced in situ transverse fiber strength.
The longitudinal strength of 61 v/o 5.7 mil BORSIC + 6061-F was degradedll% (209 x 103 psi to 186 x 103 psi) after 1000 hours at 700'F. Transverseproperties were unaffected. Uncoated 4.0 mil boron + 6061-F material exhibiteda 12% decrease in longitudinal strength (175 x 103 psi to 154 x 103 psi, withthe same exposure conditions. The transverse strength of this material wasfundamentally unchanged (16.9 x 10³ psi to 16.4 x 10³ rsi).
Thermal cycling of 50 v/o 4.2 mil BORSIC + 6061-F aluminum matrix com-posites between 70OF and 670OF can cause void formation within the matrix ofboth unidirectional and complex laminate materials as a result of plasticstrains caused by differences in thermal expansion coefficient among theconstituents. These voids result in decreased density and reduced flexuralmoduli in complex (+450, o0, +450) laminates (20% after 5000 cycles). Theflexural strength of unidirectional material decreases by approximately 13%after 5000 cycles. Cyclic life can be calculated approximately using a formof the Manson-Coffin law.
23
III. ENVIROMNENTAL EFFECTS
An effective composite matrix must not only transfer stress betweenfilaments and serve as a barrier to crack propagation, it must also possessenvironmental stability and be chemically compatible with the reinforcing phaseunder service conditions. Since the filaments provide the bulk of the composite'sload carrying capability and stiffness, the temperature range of useful filamentproperties may generally define the desired range of composite application.Thus, conventional alloys that find service as composite material matrices maywell encounter environments outside their normal application domain.
The two phase structure of a composite introduces potential sourcesof environmental degradation beyond those expected with the constituents alone.For example, although the composite system allows a choice of aluminum matrixalloys to minimize the problem, residual stresses and electrochemical effectfresulting from the contact of two dissimilar materials must now be considered.In addition, interdiffusion between fiber and matrix can result in degradationeither during fabrication or subsequrnt elevated temperature exposure. Finally,thermally induced stresses can arise within unidirectional composite material,even in the absence of thermal gradients, as a result of differing coefficientsof expansion between fiber and matrix. In laminated systems, thermal stressescan develop from the variation of thermal expansion coefficient with ply angle.In unbalenced layups these stresses can lead to warpage; in balanced ply con-figurations they are internally balanced but can lead to plastic deformationand cracking.
Three kinds of environmental effects have been investigated: lowtemperature humid salt, static elevated temperature, and cyclic temperature.Hot press diffusion bonded plasma sprayed monolayer tape material was used inall cases.
3.1 Salt Exposure
Experimental Method
In the first study 20 layer unidirectional 50% by volume BORSIC fiberplus 2024 aluminum alloy compc-ites and BORSIC fiber plus 6061 aluminum matrixcomposites were placed in an environmental test chamber and exposed to syntheticsea salt spray at 95 0 F and high relative humidity. The straight-sided 4 in. x0.5 in. x 0.1 in. specimens were stressed in three point bend fixtures as shownin Fig. 3.1. To prevent direct contact with metal fixture, the specimen endswere coated with wax and a bakelite block was used as the mid-span fulcrum. Amaximum bending stress of 100 ksi along the axis of the beam was applied to allspecimens using one-sixteenth inch longitudinal strain gage instrumentation.
Specimens were exposed for periods of one week and one month in boththe as-fabricated (6061-F, 2024-7) and precipitation hardened conditions (6061-T6,2024-T6). A list of the specimen heat itreatments is given in Table III-I.
24
- . - ~- . ..... . - - i - - i i
Samples of the matrix alloys (as mill products) were also evaluatedforcouparative purposes. These samples were stressed to 8 ksi and U ksirespectively in the case of 6061-F and 2024,F and to 30 ksi in the case of the6061-% and 2024-T6 materials.
Methods for determining the effect of exposure on the composite speci-mens included visual appearsnce, metallographic examination, and three-pointflexural testing. The flexural test specixeus were oriented with their tensileand compressive surfaces in the same sense that existed during the exposure. Inaddition, filament samples taken from corroded composite material were tensiletested at 70OF to determine if they had been degraded.
Results and Discussion
The extent of corrosion for both the composite and matrix alloy speci-mens was determined metallographically; the results for these single snecimentests are given in Fig. 3.2. The 6061 matrix composite specimens exhibitedgeneral corrosion over their entire surfaces without preference for regions ofhigh stress, whereas the 2024 matrix compos+ites displayed depths of attack thatwere approximately 1.9 times greater on the tensile surfaces than on those in com-pression. The extent of corrosior per side given in Fig. 3.2 represents an
average material loss for the combined effect.
Greatest attack was observed with 2024-F matrix composite material.Edge views of 2024-F and 6061-F matrix composites after one week and one monthexposure periods are compared in Figs. 3.3 and 3.4. The higher corrosion rateof the 2024-F material is more evident after the longer exposure; the matrixis almost totally consumed, leaving a bundle of filaments in the fixture. Attackof the 6061-F matrix material after one month was extensive but far less severethan in the case of the 2024-F matrix material, The 6061-F matrix compositematerial exhibited exposed filaments along the edges and at the ends of thespecimen but still supported a bending load. This ranking would be expected onthe babis of monolithic alloy performance (Ref. 3.1).
Transverse sections of BORSIC plus 2024-F and 2024-T6 bend specimensafter exposure for one week are shown in Fig. 3.5. Filaments in surface layersare exposed as a result of matrix corrosive attack; in the case of the 2024-Fmaterial, several fibers have fallen from the specimen. No evidence of inter-granular stress corrosion cracking is apparent. It should be noted that thedamage to the surface fibers is due to mounting and polishing rather thancorrosion during exposure.
Additional testing is needed to confidently establish differencesamong the other materials, however, it appears that the composite specimensexhibit more corrosion than do the mill products matrices tested alone. Therewere two other significant differences between composite aa1 d zill product: firstthe surface oxide was different and this can considerably lengthen the incubationperiod (see Fig. 3.2); second a major part of the compoeite matrix is plasmasprayed which has a different microstructure. Both the 6061-T6 and 2024-T6matrix composites incur less corrosion when tested with unprepared surfaces
25

(oxidized from solution treatment) than when they are polished prior to saltexposure. The lower corrosion rate of the 2024-T6 matrix coposite materialis illustrated in Fig. 3.6. It is interesting to note that with 2024-T6 theplasma spraed coposite is clearly superior.
To determine if BORSIC filament is degraded by salt exposure, fibersamples taken from the nearly consumed 2024-F matrix sample shown in Fig. 3.1were tested at 70 0 F.
The results of these tests are given in Fig. 3.7. The filamentsexhibited an average strength, X, of 460 ksi with a standard deviation, a, of38.7 ksi. Also given in Fig. 3.7 are the strengths of both as-fabricated fila-ment (X = 474 ksi, a = 58.0 ksi) and filament extracted from consolidatedcomposite material (R = 456 ksi, 0 = 36.5 ksi). Thus, the longitudinal strengthof BORSIC filament is not affected by exposure to the humid salt environment andcomposite property degradation arises from attack of the matrix material.
Residual composite strength was studied by flexural testing. Theresults of the three-point flexural tests are given in Fig. 3.8. The strengthsof the 6061-F and 6061-T6 matrix materials were unaffected by exposure for periodsup to one month (approximately 225 ksi and 280 ksi, respectively). However,significant degradation in the flexural strength of 2024 matrix specimens wasobserved. Material with 2024-F matrix alloy exhibited a 10% decrease in strengthafter an exposure of one week (221 ksi to 200 ksi); after exposure for one month,the matrix was almost entirely consumed and the material 'ould no longer supportany load. Samples with 2024-T6 alloy matrices exhibited an 11% decrease instrength after one week (285 ksi to 254 ksi) and a 14% decrease after one month(285 ksi to 245 ksi).
3.2 High Temperature Exposure
Three composite materials iýere exposed at 700OF in air for 500 hrsand 1000 hrs:
1) 50 v/o, 8 layer, 4.0 mil boron + 6061-F2) 50 v/o, 10 layer, 4.2 mil BORSIC + 6061-F3) 61 v/o, 6 layer, 5.7 mil BORSIC + 6061.-F.
All were fabricated from plasma sprayed monolayer tapes. The BORSIC fibersystems were vacuum hot pressed at 1025'F/5 ksi/l hr whereas the boron fibersystem was consolidated at 900°F/l0 ksi/l hr.
After exposure, longitudinal and transverse tensile specimens wereprepared using electrodischa'ge muchining (EDM4). The transverse tensile specimenused a straight-sided 3 in. lor'g by 3/8 in. wide sample with a 1 in. gage lengtn.The longitudinal specimen was 4 in. in overall length and 1/2 in. wide at thegrips; it contained a 1 in. long reduced gage section of 0.150 in. width. Bothspecimens were loaded through 1 in. long epoxy bonded aluminum doublers; specialfixtures were employed to ensure proper alignment. Testing was conducted usinga 60,000 lb capacity Baldwin hydraulic tensile machine. Longitudinal 1/16 in.strain gages were mounted on both sides of the specimens and monitored separatelyduring test to detect any bending and to allow modulus determinations.
26
Results and Discussion
The effect of 700*F air exposure on the room temperature tensileproperties of the boron + aluminum material is given in Figs. 3.9 and 3.10.After 1000 hrs the longitudinal tensile strength decreased apprc "iately 12%(175 x 103 psi to 15• x 103 psi) and t e longitudinal modulus, El1 ,as nearlyunchanged (30.5 x 10 psi to 30.8 x 10 psi). The fracture surface i'eaturesof exposed and unexposed material observed at low magnification (50X) weresimilar.
The transverse tensile strength and modulus, E2 2 , of the boron + 6061-Fmaterial were fundamentallyvunchanged (16.9 x 10³ psi to 16.4 x 10³ psi and16.3 x 106 psi to 15.2 1: 10 psi, respectively) after 1000 hrs. The transversefracture surfaces were ,haracteri7 '-Ct Iy regions of ruptured aluminum matrix andboron fibers split largely along diametral planes.
The specimen exhibiting the lowest longitudinal strength after 1000hrs (134 ksi) was examined metallographically using a tapered section, Fig.3.11. Despite the use of a combined optical and mechanical magnification ofI0,OOOX, no interfacial reaction layer or attack was observed. The decreasein strength is much less than that observed by Basche, et al (Ref. 3.2) (30%after 24 hrs) on bare fibers. This indicates that the aluminum matrix affordsfairly good protection against the oxidation attack of the fiber at 7000 F.
The effect of 700°F air exposure on the room temperature tensile prop-erties of 50 v/o 4.2 mil BORSIC + 6061-F composites is given in Figs. 3.12 and3.1$. Longitudinal strength and modulus were unchanged after 1000 hrs of exposure.
Transverse strength and transverse modulus decreased approximately 28%and 10% respectively after 1000 hrs. However, the compoeite material used forthe transverse property stability investigation proved to be of excellent quality.Transverse strength in the unexposed condition ranged from 18.1 to 19.7 ksi andaveraged 18.6 ksi (5 tests). More typical strengths exhibited by as-fabricatr4BORSIC + 6061 aluminum, generated both in this prog.am and elsewhere (Refs. 3.3,3.4), range from approximately 12.5 to 15.5 ksi. The transverse strengthexhibited by present material after exposure at 700°F for 1000 hrs ranged from12.3 to 14.0 ksi and averaged 13.4 ksi (5 tests). Thus, the strength t.fterexposure of the material used in this work is similar to the strength usuallyexhibited by 4.2 mil BORSIC + 6061 aluminum in the as-fabricated condition.
Exposure at 700O1 has apparently lowered the in situ transverse fiberstrength and thereby the composite tensile strength. This could have resultedfrom changes in the microstructure, defect character or residual stress patternwithin the fiber itself, or may be a result of the oxygen attack on the splitends of the fibers.
The transverse fracture surfaces were examined optically at highmagnification. Th,- failures were characterized by split filaments and rupturedaluminum matrix. No regions o' fiber-matrix interfacial failure were observed.There were large differences waong the specimens ia the number of split fibers
27
that appeared. A measure of the amount of splitting was determined from theratio of the split fiber area observed to the maximum possible split area ofthe fibers. This permits correlation between composite strength and the areaof split fibers in the fracture surface. Figure 3.14 illustrates this correla-tion and indicates that the split fibers were not contributing to the ultimatetensile strength since the line extrapolates to approximately the matrix strength(at zero splitting) and to very low strength (at total area splitting). Thefact. that increasing times lead to lower strengths and proportionately highfiber splitting ties the degradation to the fibers.
The correlation in Fig. 3.14 provides insight into the mechanism offailure. Apparently the 6061 aluminum matrix has no crack sensitivity (Ref. 3.5)and the transverse strength model proposed by Liu is appropriate. These prop-erties will be discussed more fully in Section VI - Transverse Strength.
Typical 4.2 mil BORSIC + 6061 fracture surfaces are shown in Fig. 3.15.The photomicrographs on the left and center exhibit bright areas of aluminummatrix and dark bands cf split fibers; most specimens are of this type. Thefracture surface on the right is comparatively darker and somewhat mottled.Obtainl ig accurate measurements of the percent split fiber in these samplesnecessitated the use of a higher magnification (200X) than required for theother specimens (20X); underestimates were reported in the previous annualreport TR-70-193.
The results of 700OF air exposure on the room temperature propertiesof 61 v/o 5.7 mil BORSIC + 6061 aluminum material is given in Figs. 3.16 and3.17. A longitudi .al strength decrease of approximately 11% after 1000 hrswas measured (duplicate tests).
The transverse properties were fundamentally unchanged by 700°Fexposure. The measurement of transverse strength decreased by 3% and E2 2increased by 6%. Thesc changes are xiot considered significant. Examinationof the fracture surfaces using optical microscopy revealed only slight fibersplitting near machined edges.
A summary of measured property changes for all three systems is givenin Table III-II.
3.3 Thermal Cycling
Experimental Method
Material response to thermal cycling was investigated using 20-layer,50% by volume BORSIC + 6061-F aluminum matrix conmposites. Two ply configurationswere considered: unidirections material, and a +450 , 0O, +450 (4,12,a) mid-plane symmetric laminate. Rec ,angula' specimens of both confirurationsmeasuring 4 in. x 0.5 in. x 0.1 in. v:,re gripped at one end and cycled between70°F and 670 0 F. This was accomplish, d by alternate inmiersion in hot and coldair/sand fluidized beds. A complet, cycle of heating from 70OF to 670OFand cooling to room temperature re ,ired approximately two minutes and included
28

a 50 second exposure to temperatures above 620OF and a 50 second exposure totemperatures belov 1200 F. Specimens were removed from the apparatus afterexposures of 500, 1000, 2000, 3000, 4.000, and 5000 cycles.
Sample conditions both prior to test and after exposure were measuredin several ways; these included linear dimensions, density, ultrasonic atten-uation level, and time for the propagation of an extensional wave in the longi-tudinal d: action. The ultrasonic attenuation measurements were made usinga 5 MHz 1/4 in. diameter lithium sulfate flat transducer and a metal platebeneath the sample (pulse-echo method). A measure of attenurtion was obtainedby passing energy through the specimen and measuring the reflected signal ampli-tude using an oscilloscope. The procedures used in determining extensional wavepropagation times are essentially the same as those described in the Off-Axissection for ultrasonic velocity measurements. These nondestructive tests wereof particular interest since they find utility in the inspection of compositematerial hardware.
In addition, small straight-sided specimens, measuring 3 in. x 0.1in. x 0.1 in. were electrodischarge machined from each sample. The strengthof exposed unidirectional material was determined using three-point flexuraltests since composite material behavior in bending is important in many appli-cations including fan and compressor blades. The flexural moduli of both theunidirectional material and the +450, 0° +45 0 laminates were obtained fromfirst mode resonant frequency measurements of samples vibrating in free-freebending.
Results and Discussion
Characterization
Thermal cycling 4.2 mil BORSIC + 6061-F composite material from 70°Fto 670°F resulted in dimensional changes. Measurements accurate to the nearest0.0002 in. revealed the following:
1. The length (fiber direction) of all specimens remained unchanged asa result of filament constraint.
2. The width of unidirectional material increased by as much as 4.1%after 5000 cycles and thickness remained constant.
3. The width and thickness of the complex laminate increased by 2.6%and 6.0% respectively after 5000 cycles.
Extensive surface deformation and protrusions accompanied this growth, Fig. 3.18.Resulting density changes with cycling are given in Fig. 3.19. The reduced densitysuggests that voids or cracks have opened in the matrix.
The results of the three-point flexural tests of unidirectionalmaterial are given in Fig. 3.20. A decreased flexural strength results fromcycling. The strength loss is approximately 13% after 5000 cycles and is
29
small considering the severity of the test. The specimens accumulated less than100 hrs exposure above 600°F which would not have in itself caused ; :Oradationto BORSIC + 6061 aluminum, Fig. 3.2.
Flexural modulus determinations are given in Fig. 3.21. The stiffnessof the unidirectional material remained unchanged while that of the +450, 00,+450 laminate decreased by approximately 20% after 5000 cycles. The modulusof the unidirectional material is not a sensitive indicator of matrix degradationand remains nearly constant despite matrix void formation. It is primarilydetermined by the volume fraction and modulus of the filaments ad demonstratedby rule-of-mixtures calculations.
The stiffness of the laminated beam, however, is strongly weightedby the modulus of the +450 layers since they are the furthest 'rom the neutralplane. Composite deformation is not strain limited by the filaments at anglesother than 00 to the reinforcement direction and as a result, the influence ofmatrix behavior is significant in determining the properties of +450 material.
Met alloEraphy
Metallographic examination confirmed that voids had formed in the matrixas a result of thermal cycling, Figs. 3.22, 3.23. Their area fraction increasedwith the number of cycles exposure. The voids were elongated in the directionof the fibers and were often concentrated in regions of close fiber spacing. Voidfraction in the +450, 0, +450 laminates was higher than :. unidirectionalmaterial after the same number of cycles. No delamination or fiber-matrix inter-facial failure was observed in e~ther configuration. SEM photographs of severalflexural fracture surfaces are given in Fig. 3.24. The increased matrix voidsize with cycling is evident in these views.
Fibers in exposed samples were examined by dissolving away the matrixalloy. Longitudinally oriented ilaments in both the laminate core and in theunidirectional specimens were - ways unbroken. Several regions of transversefiber splitting were evident in complex laminates ex:posed to 3000 or more cycles,Fig. 3.25. However, these could have been present prior to cycling.
SAPlysis_
Void formation in the composite matrix apparently refler i fatiguedamage arising from the cyclic plastic strain that occurs with eacii temperaturecycle. The extent of damage is of the same magnitude in both types of laminates,though it is somewhat more severe in the +450, 00, +450 system. This observa-tion confirms the results of separate studies (Ref.-3.6) which indicate that thestrain amplitude arising from a 600°F temperature change in 50$ BORSIC plusaluminum due to the difference in thermal expansion coefficient between fiberand matrix is approximately an order of magnitude greater than the strain arisingfrom the ply orientation effect. The analysis of Halpin and Pagano (Ref. 3.7)was used for the latter calculation.
30

The matrix strain accompanying a temperature change in a one dimen-sional compozite system where the matrix is perfectly plastic and the fibersare infinite4 stiff relative to the matrix can be written:
f = (= M - CF AT (3.1)
,ahere e = matrix strainC M = matrix thermal ex-ctnsion coefficienta r = fiber thermal ,;cpansion coefficientA T = temperature change
In addition, for many metals the fatigue life can be approximately related tothe cyclic plastic strain range by the -Manson-Coffin law (Ref. 3.8):
= (N/D)-" 6 (3.2)
where Aepj = cyclic plastic strain= cycles to failure
D = ln (1/1-RA), a ductility parameterRA = fractional reduction of area in a tensile test
Combining (3.1) and (3.2), noting that for a complete temperature reversal
N In (1/1-RA) (3.3)[2 Na - *F) AT]I'
This expression indicates that cyclic life will increase wit'. increased matrixduclility, a closer match of expansion coeffici "nt, and a decreased temperaturerange.
In the present case, AT = 600°F and aM -aF is ipproximately 9.6 x10⁻⁶ in./in./°F (Ref. 3.9). It is expected that the RA of :lasma sprayed 6061-Falloy would be somewhat less than that of mill product 6061.0 aluminum butsignificantly higher than that of SAP alloy, 50% and 11% respectively (Ref. 3.10).
N z 1000 cycles for 50% reduction in areaN z 500 cycles for 30% reduction in area
The results in Fig. 3.18 indicate slight deaage near 500 cycles and acceleratedvoid/crack opening near 3000 cycles. Thus, the agreement with experiment isreasonable. A significant difference between the responses of the two con-figurations arises because the +45°, 00° +450 laminate contains components oftransverse stress.
This calculation does not allow for recovery effects or elastic straincomponents and assumes that failure will occur at the cuadition of maximumn thermalstress and minimum ductility, 70 0 F. However, the actual cyclic strains could besomewhat higher than assumed by the one dimensional model as a result of trans-verse restraint. The behavior of this system contrasts sharply with that of many
31
!I
multidirectional reinforced polymeric matrix systems of high glass transitiontemperature, where cracking can arise simply on cooling from the fabricationtemperature.
Nondestructive Inspection
Exposed material was examined using two nondestructive inspectiontechniques since the present samples represented a convenient vehicle forevaluating their potential usefulness in structural applications. Measuredextensional wave propagation times are given in Fig. 3.26. The recorded timesare approximately inversely proportional to the square root of Young's modulusand directly proportional to the square root of density. The measurementsindicate no fundamental change in the stiffness of unidirectional material inthe stiffness of unidirectional material in agreement with the dynamic modulusmeasurements (Fig. 3.21), and approximately a 15% decrease in the longitudinalstiffness of the +450, 00, +450 laminates (1/11.1 to 1/13.2).
The apparent bending modulus, EB, exhibited by the complex laminatecan be estimated using laminated beam theory:
EB = 0.78 E(+450 ) + 0.22 E(0°) (3.4)
In uniaxial tension the modulus, ET, is:
ET = 0.40 E(+45) + 0.60 E(0°) (3.5)
Taking E(O°) = 38 x 106 psi and E(+450 ) = 18 x 106 psi from Eq. (3.4), EB =21 x 106 psi in fair agreement with the dynamic results in Fig. 3.21. TheNDl indication that ET decreases by 15% implies from Eg. (3.5) that E(+45) inthe laminate decreases by approximately 44% (18.0 x 100 to 10 x 106 psi) aftgr5000 cycles. Phis would iLicate a 27% decrease in bending modulus (22 x 10psi to 16 x 10 psi) which is reasonably consistent to the 20% decrease actuallyobserved, Fig. 3.21.
The effect of thermal cycling on ultrasonic signal attenuation isgiven in Fig. 3.27. These measurements correlate in a general way with observedchanges in density, Fig. 3.19, due to void formation: 1) the effect of cyclingis slight in unidirectional material up to 3000 cycles and morc extensivethereafter, 2) the complex laminate incurs somewhat greater damage below 3000cycles than does unidirectional material, and displays a greater degree ofvoiding above 3000 cycles.
3.4 Conclusions
1. BORSIC + aluminum composites exhibit general corrosion whenexposed to a humid sea salt environmnent as a result of matrix attack. Com-posites with 6061 alloy matrices have superior corrosion resistance to thosewith 2024 alloy matrices. The longitudinal strength of BORSIC filament isunaffected by humid salt environments.
32
C
2. The short time tensile properties of BORSIC * 6061-F compositesare not significantly degraded by air exposure at 700°F for periods of up to1000 hrs which points to their usefulness as elevated temperature structuralmaterials.
3. Thermal cycling of 50 v/o 4.2 mil BORSIC + 6061-F aluminummatrix composites between 70OF and 670°F can cause void formation within thematrix of both unidirectional and complex laminates. These voids are theresult of plastic strains caused by differences in thermal expansion coefficientbetween the constituents. However, less than one percent voids are observedafter 1000 cycles and the problem is not nearly as severe as the behavior ofmultidirectionally reinforced polymeric matrix systems such as graphite andpolyimide which can exhibit cracks on cooling from the fabrication temperature.
33
S... . ..... '• • ?• • "• 'I ........ " • •--I
I
SECTION III - REFERENCES
1. K. R. Van Horn, ed., Aluminum, Vol., Properties, Physical Metallurgyand Phase Diagrams, American Society for Metals, Metals Park, Ohio, 1967.
2. M. Basche, F. Galasso, and R. Fanti, "Preparation and Properties ofSilicon Carbide Coated Fibers", Fiber Science and Technology, Vol. 1,p. 19, 1968.
3. J. Forest and J. Christian, "Development and Application of High MatrixStrength Al-B", Metals Eng. Quart., Feb. 1, 1970.
4. J. Long, et al, "The Evaluation of the Mechanical Behavior of Metal MatrixComposites Reinforced with SiC Coated B Fibers", AFML-TR-69-291, Nov. 1969.
5. J. L. Christian and J. F. Watson, "Mechanical Properties of Several 2000and 6000 Series Aluminum Alloys", in Advances in Cryogenic Engineering,Vol. 10.
6. L. E. Dardi 'nd J. L. Preston, Jr., Pratt & Whitney Aircraft, Unpublishedwork.
7. J. C. Halpin and N. J. Pagano, "Consequences of Environmentally InducedDilation in Solids", Technical Report AFML-TR-68-395.
8. A. S. Tetelman and A. J. McLvily, Jr., Fracture of Structural Materials,John Wiley and Sons, 1967.
9. K. G. Kreider, V. M. Patarini, "Thermal Expansion of Boron Fiber-AluminumComposites", Met, Trans., Vol. 1, No. 12, pp. 3431-3460, Dec. 1970.
10. L. E. Dardi, Pratt & Whitney Aircraft, Unpublished work.
34

K910853-12
MAG: 3/4XFIGURE 3-1
THREE POINT BEND FIXTURE USED FOR SALT CORROSION TESTS
35
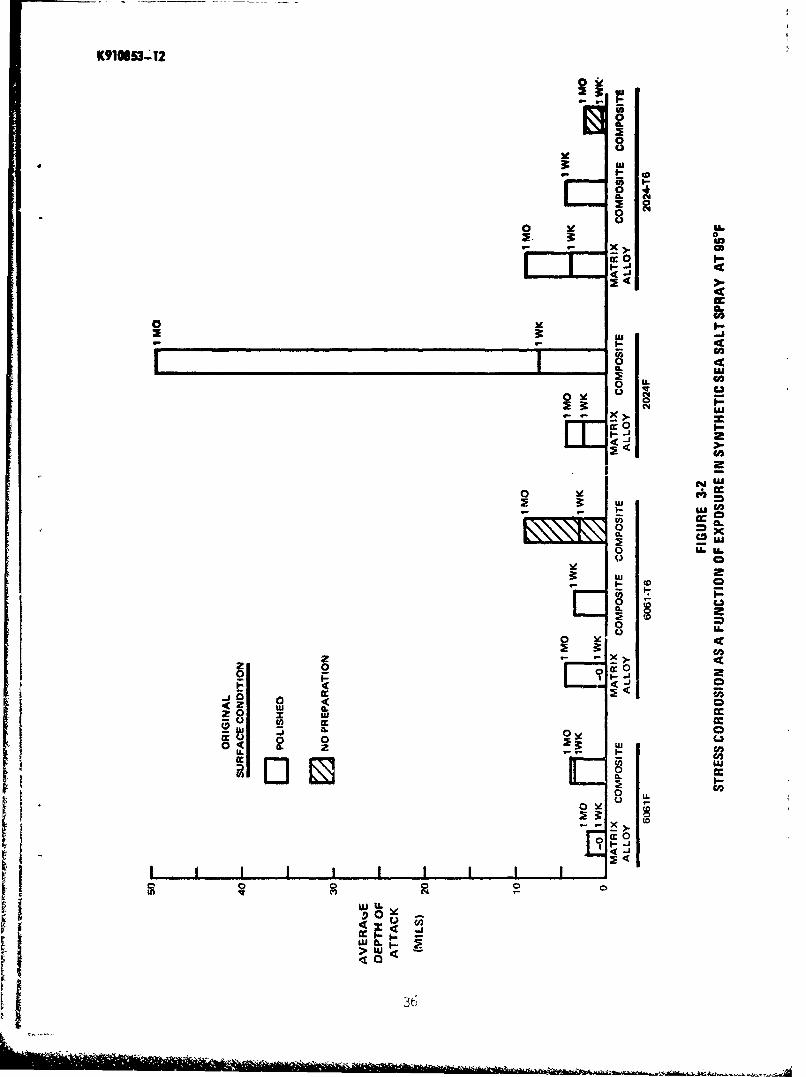
K910S53-A 2
8
X >FE. 0 -
cia
0 le U
FE 0
t-J
C0
oL 4
u. 0
ý7Uu
CL-
0 0
.j a
o IT cc
Fr t. 0 be
000 ze w
0 L
2 to
LU0
~so36

K910853-12
R Reproduced from
best available COPY.W
MAG: lY2X
FIGURE 3-3EDGE VIEWS OF 4.2 MIL BORSIC + 6061-F (TOP) AND BORSIC + 2024-F (BOTTOM)
COMPOSITE BEND SPECIMENS AFTER EXPOSURE FOR ONE WEEK IN SYNTHETICSEA SAI.. SPRAY AT .95F AND 100 KSI
37

K910853-12
Reproduced frombest available copy.
MAG" 4X
FIGURE 3-4EDGE VIF.J'S OF 4.2 MIL BORSIC + 6061-F (TOP) AND BORSIC + 2024-F (BOTTOM)
CJMFOSITE BEND SPECIMENS AFTER EXPOSURE FOR ONE MONTH INSYNTHETIC SEA SALT SPRAY AT 95F AND 100 KSI
38
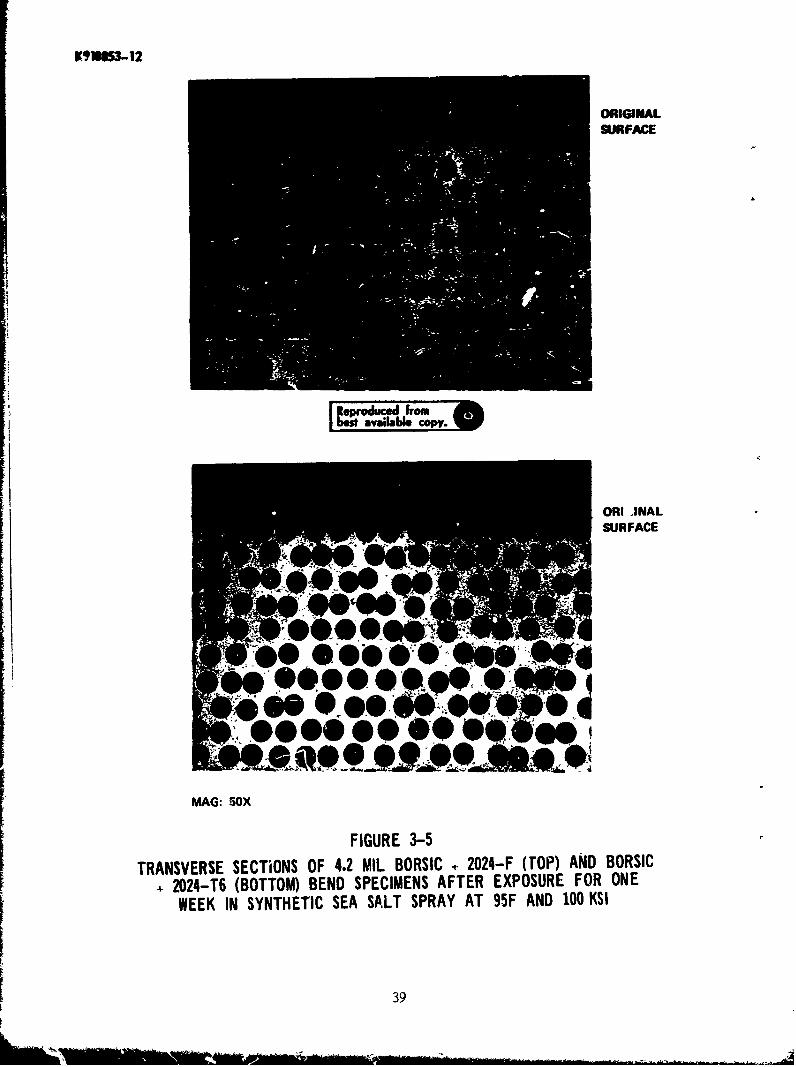
V,91O3-12
ORIGINALSRFACE
Reproduced I ,rombest available copy.
OR! INALSURFACE
MAG: BOX
FIGURE 3-5
TRANSVERSE SECTIONS OF 4.2 MIL BORSIC 2024-F (TOP) AND BORSIC+2024-T6 (BOTTOM) BEND SPECIMENS AFTER EXPOSURE FOR ONE
WEEK IN SYNTHETIC SEA SALT SPRAY AT 95F AND 100 KSI
39
u)oo
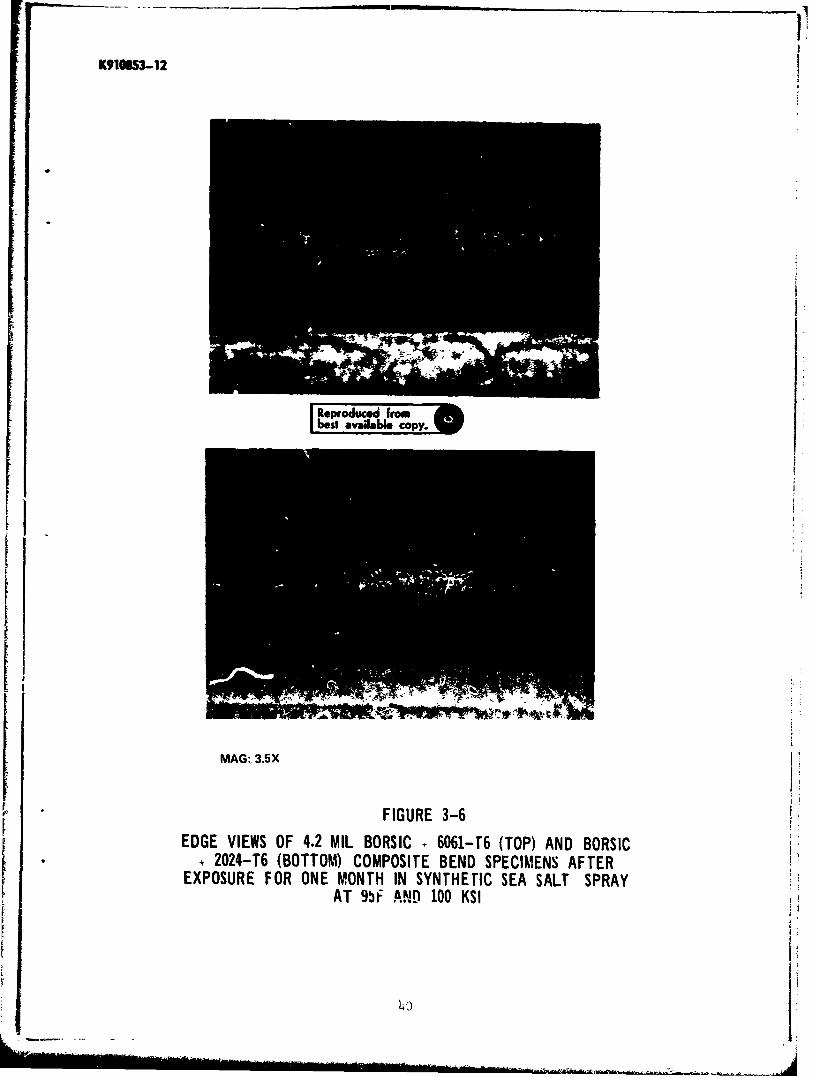
F ~K9I IO53-12
eroduced Iwombesi~ avalabme copy.
MAG:. 3.5X
FIGURE 3-6EDGE VIEWS OF 4.2 MIL BORSIC +6061-T6 (TOP) AND BORSIC
* + 2024-T6 (BOTTOM) COMPOSITE BEND SPECIMENS AFTERF EXPOSURE FOR ONE MONTH IN SYNTHETIC SEA SALT SPRAY
AT 9bF ANID 100 KSI
14o

0
"0 0 0c
CC
'Cj
U6- z(A(
0 0 j CV-LA
LC4
OjZ ZELL'J
uJ c<
IA-0 CD
wco,
410

K91OW5-12
0
V, - )
z U.20 0
xuIL4~ 0
< 'o
_ _ _ _ _ _ _ _ _ z U~
-u 0
-Ji ao u
z z x <
z 0CZZO
LU +~
z) z0 Uo~~~~~ o Z a a a oi~V~~~~~~I LL00 C q D V eQ) e eq q e eq - ~- '-
w UU )
42LL
0 0
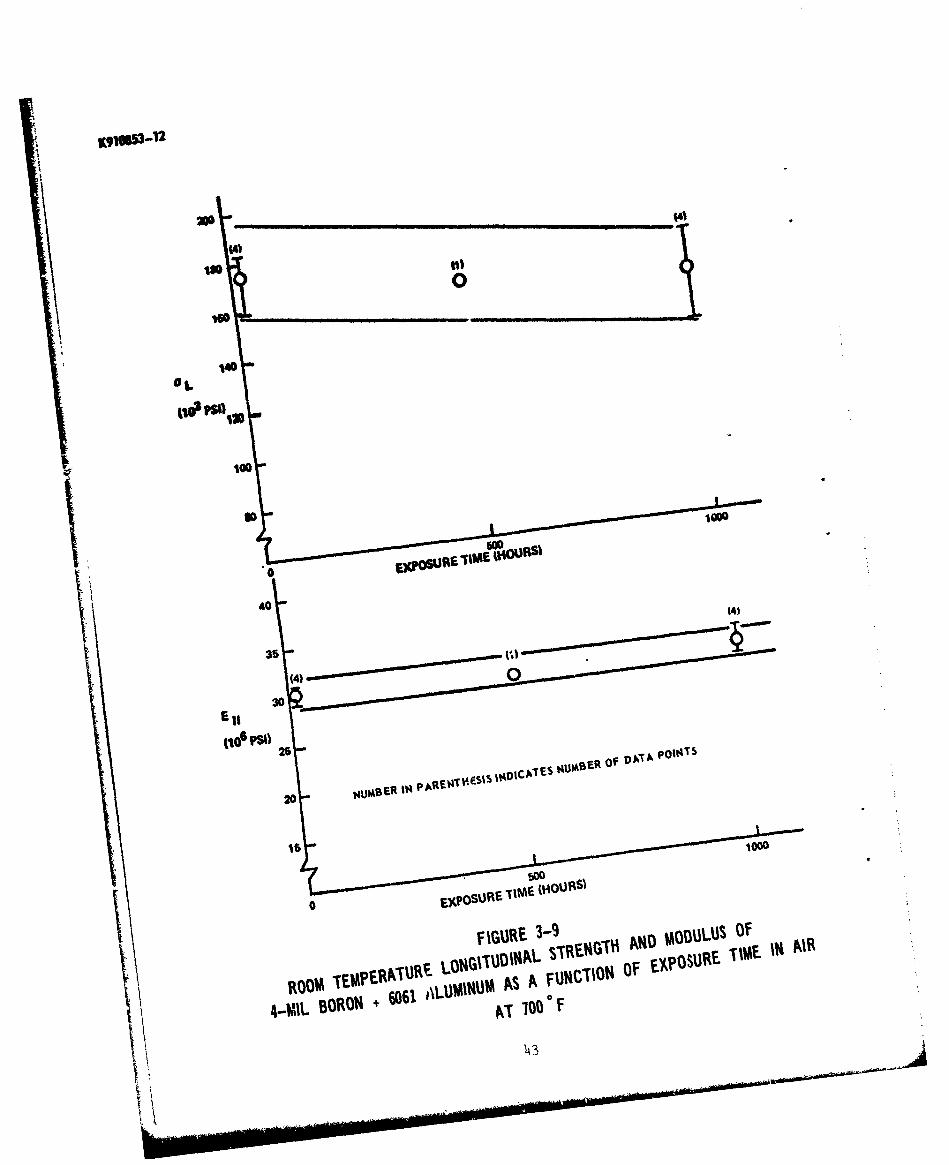
AI140
0 "POWU1M~U
40
(4)
30
PSI) A 26 t4 M E OF ptID A ILS O
20~~ BO MBt4 t 101 A LU~ A ~ IIO F~ ~ E t
lo
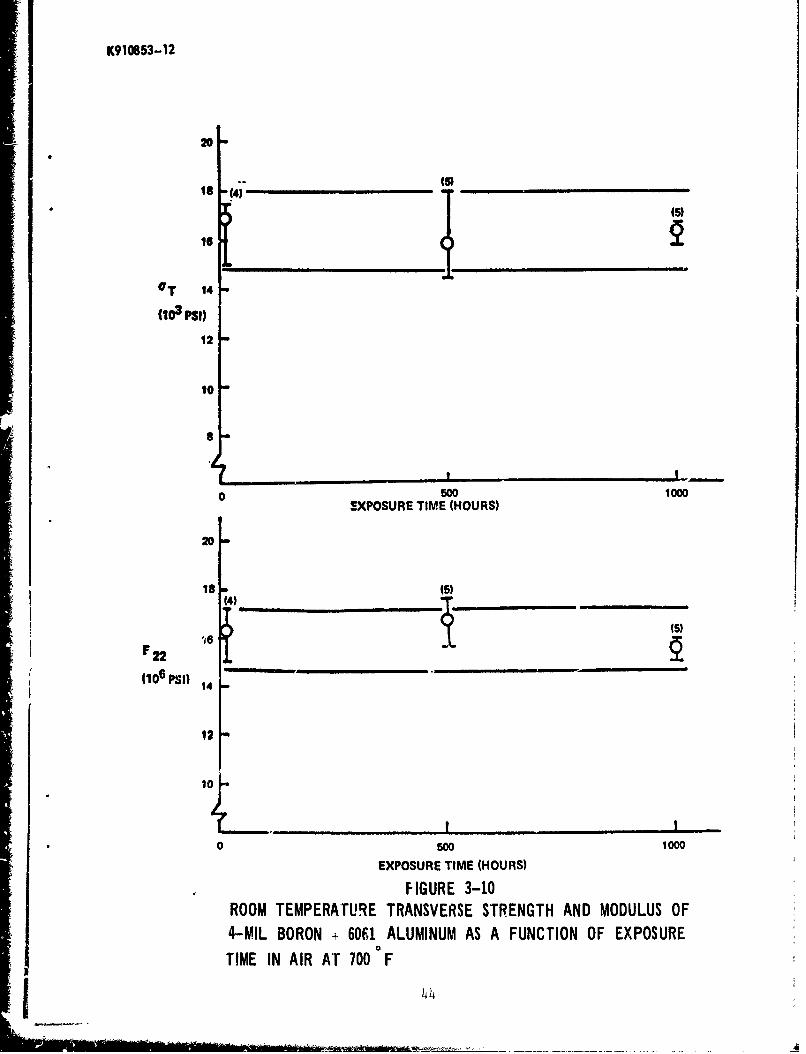
K910853-12
20
16454
ISIS
OT 14
(103 PSI)
12
10
0 500 1000EXPOSURE TIME (HOURS)
20
Y (15)
(106 14
10
EXPOSURE TIME (HOURS)
FIGURE 3-10ROOM TEMPERATURE TRANSVERSE STRENGTH AND MODULUS OF4-MIL BORON + 6061 ALUMINUM AS A FUNCTION OF EXPOSURE
0
TIME IN AIR AT 700 F
44
+•_.'+ m +m••. ..... . ..... +,..... ..,+.:,, +•+,+•_•+., , .• •...... .,

K9 10853 -12
Lu
CA)
f. C~l
-LJI-o
U.i
1%>
C. U
-ýo- .CD
LU-
CJ~l
CA-Lu
45U

K910853-12
200
190 (5)
180-s5)
170 15)
aL 160 1(10, PSI)
140
130E
120
0 500 1000
36-
34 ) 15)
32 (5)
EL
(106 PSI) 30
28
26-
0 500 1000
FIGURE 3-12ROOM TEMPERATURE LONGITUDINAL STRENGTH AND MODULUS
OF 4.2 MIL BORSIC +6061 ALUMINUM AS AFUNCTION OF EXPOSURE TIME IN AIR AT 700°F
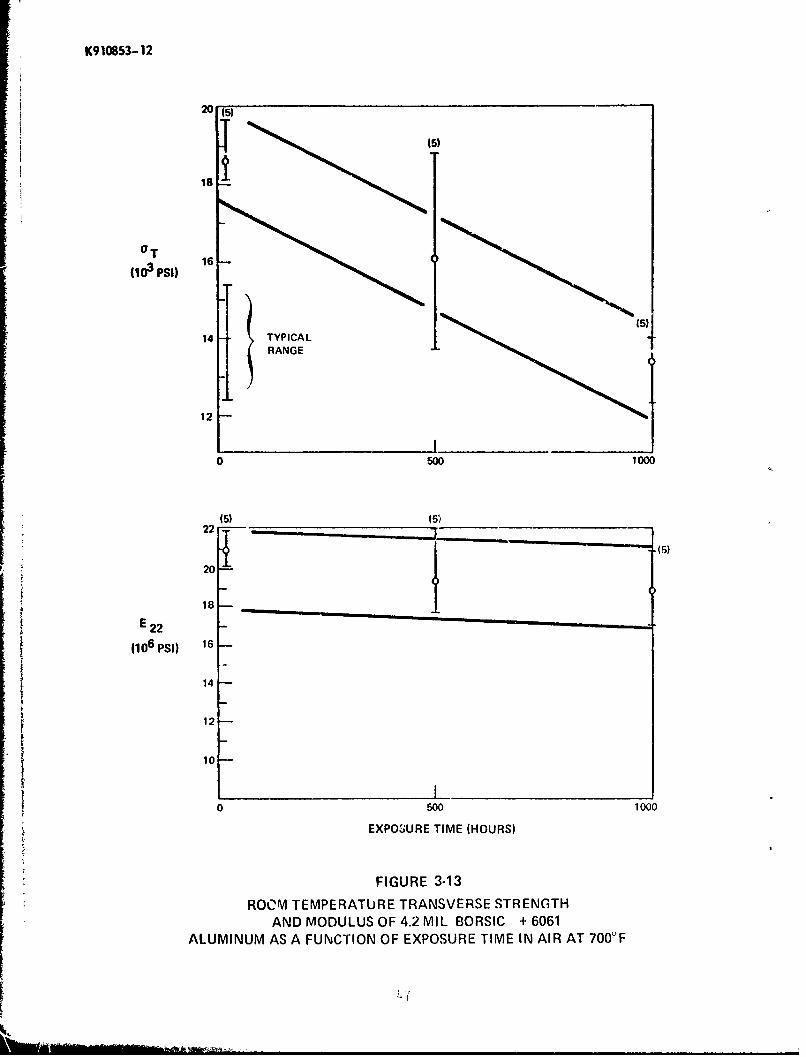
K910853-12
20 (5)18 • 15)
18
OT
1103 PSI) 16
14 TYPICALRANGE
12
0 500 1000
15) 451)
22 --
20-
S~18E22 61106
PSI) 16R
14A
12-
10•
0500 1000
EXPOS;URE TIME (HOURS)
FIGURE 3-13
ROOM TEMPERATURE TRANSVERSE STRENGTHAND MODULUS OF 4.2 MIL BORSlC + 6061
ALUMINUM AS A FUN•CTION OF EXPOSURE TIME IN AIR AT 700°F

K910853-12
cc U
0 8 ILl
0
LL LUI
ccun C.
CI
LL 'o0 L
oU -d
0. = .
co)2
z l
LU LUJLL
dLC,
.LLJC-)
LU-
LA C^)
~LLJ
0.L
'v)
48
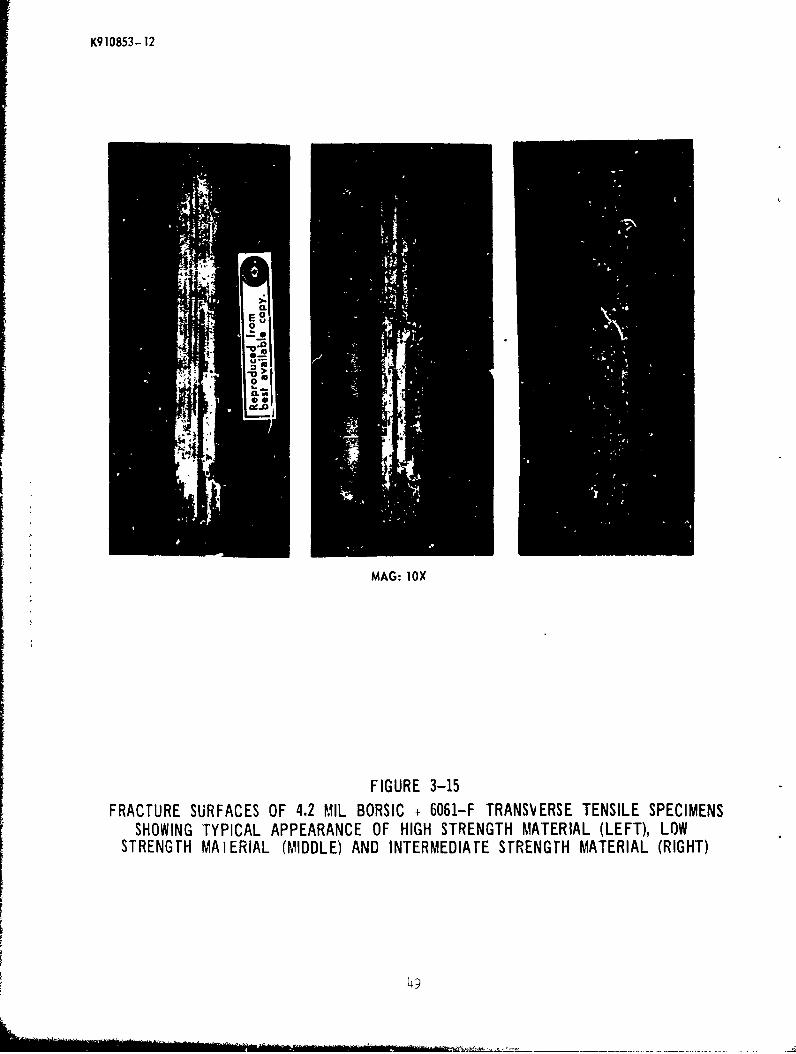
K910853-12
*1
MAG: loX
FIGURE 3-15FRACTURE SURFACES OF 4.2 MIL BORSIC + 6061-F TRANSVERSE TENSILE SPECIMENS
SHOWING TYPICAL APPEARANCE OF HIGH STRENGTH MATERIAL (LEFT), LOWSTRENGTH MAIERIAL (MIDDLE) AND INTERMEDIATE STRENGTH MATERIAL (RIGHT)
I49
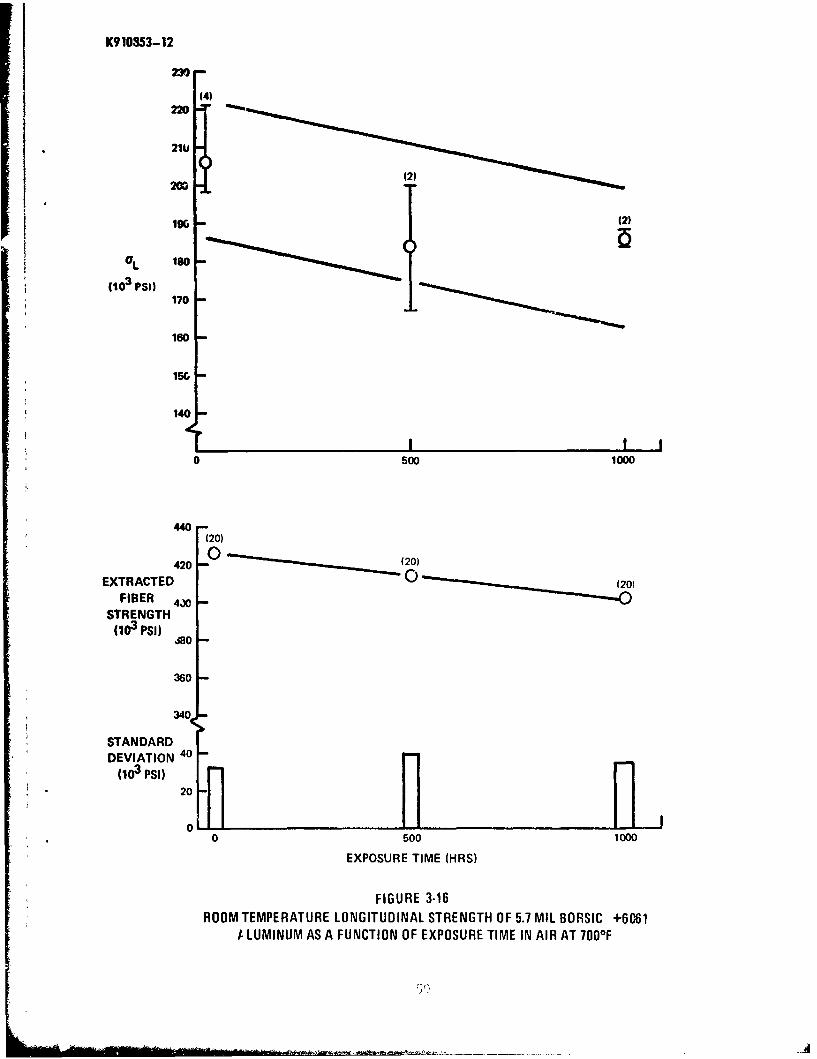
K910853-12
239
(4)
21U
K 200196 12)
(103 PSI)170
160
15 -
140
0 500 1000
440 -(20)
420 (2
EXTRACTED (2o0
FIBER 40 -STRENGTH(103 PSI)
J80-
360
340
STANDARDDEVIATION 40
(103 PSI)20
0 500 1000O
EXPOSURE TIME (HRS)
FIGURE 3-16ROOM TEMPERATURE LONGITUDINAL STRENGTH OF 5.7 MIL BORSIC +6061
/ LUMINUM AS A FUNCTION OF EXPOSURE TIME IN AIR AT 700°F
.. ...
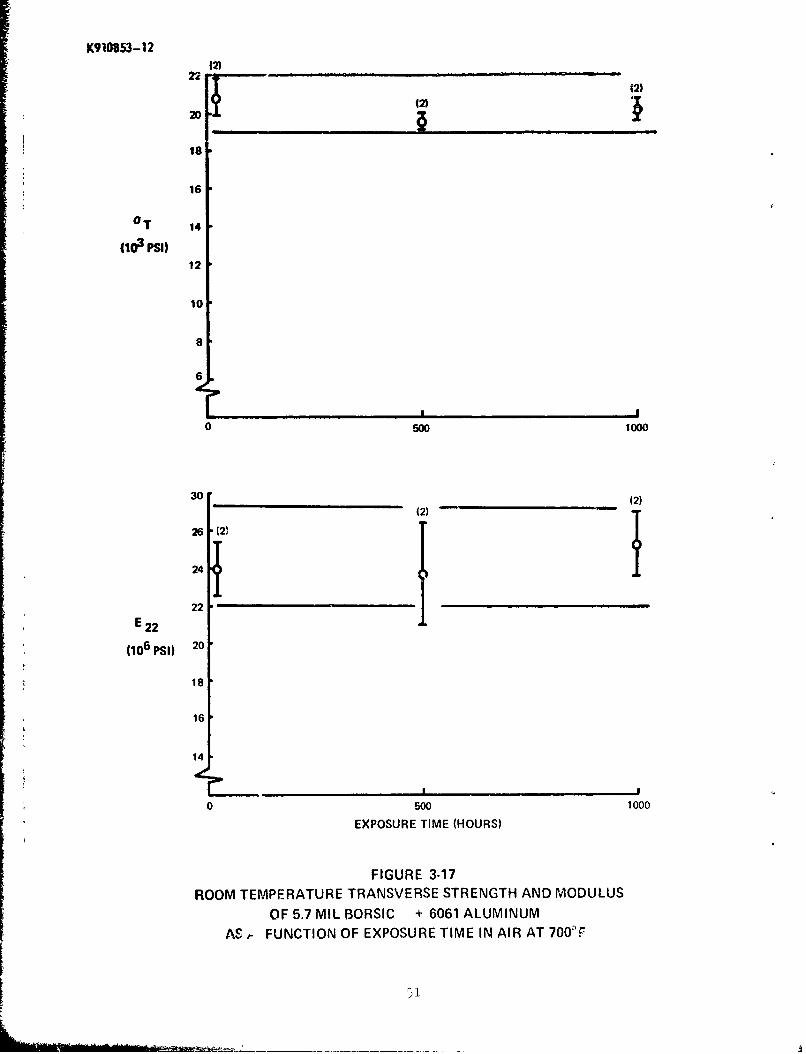
K910853-1212)
is18
16
OT 14
f1io PSi)12
10
8
6
0 500 1000
30 (2)(2)
26 '(2' 1
24T
22E 22
(106 PSI) 20
18
16
14
0 500 1000
EXPOSURE TIME (HOURS)
FIGURE 3-17
ROOM TEMPERATURE TRANSVERSE STRENGTH AND MODULUS
OF 5.7 MIL BORSIC + 6061 ALUMINUM
AS , FUNCTION OF EXPOSURE TIME IN AIR AT 700OF
51
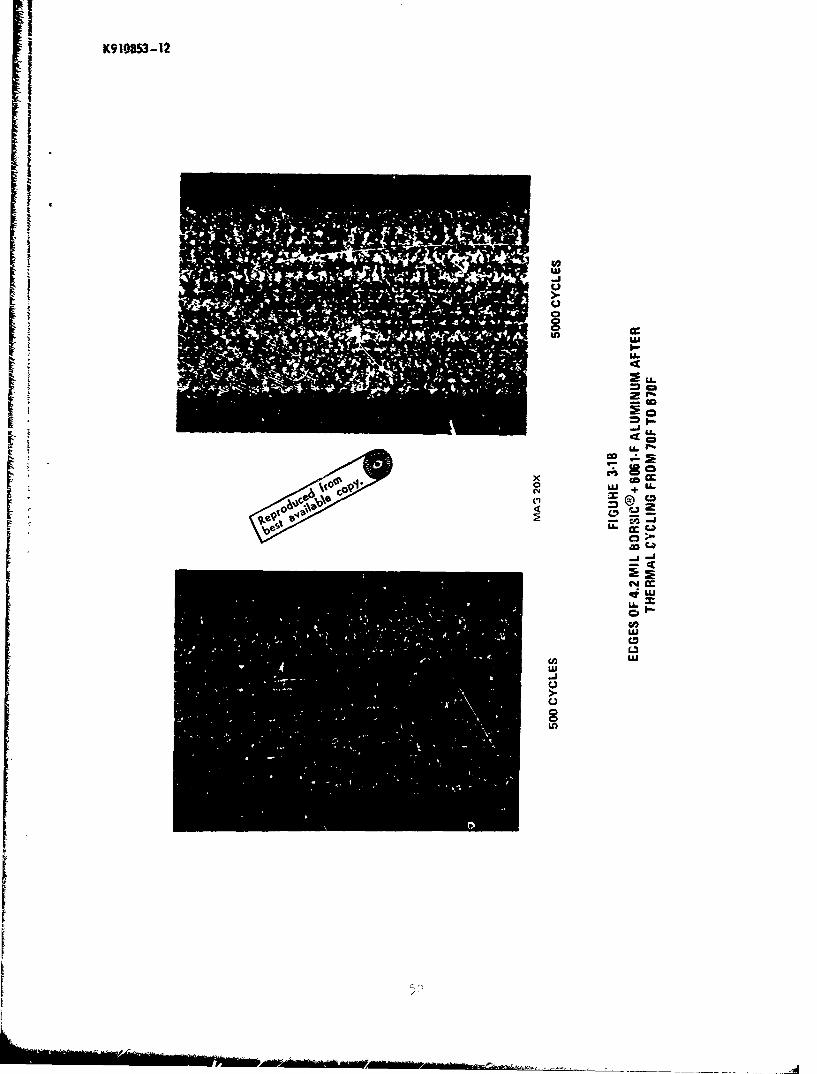
K910803-12
It
UU
CC
40C_j-J
U-
.j.
V (D)

K910153- 12
ILI
z 40Ue.
4 -j
0~ 41u
0>- 0
* 00 w
0.
,0 -8
z0
'7-0
C-),L)
OLw w0~ a)
0LL00
F-C-,w
O W-
0
0
c~j cC
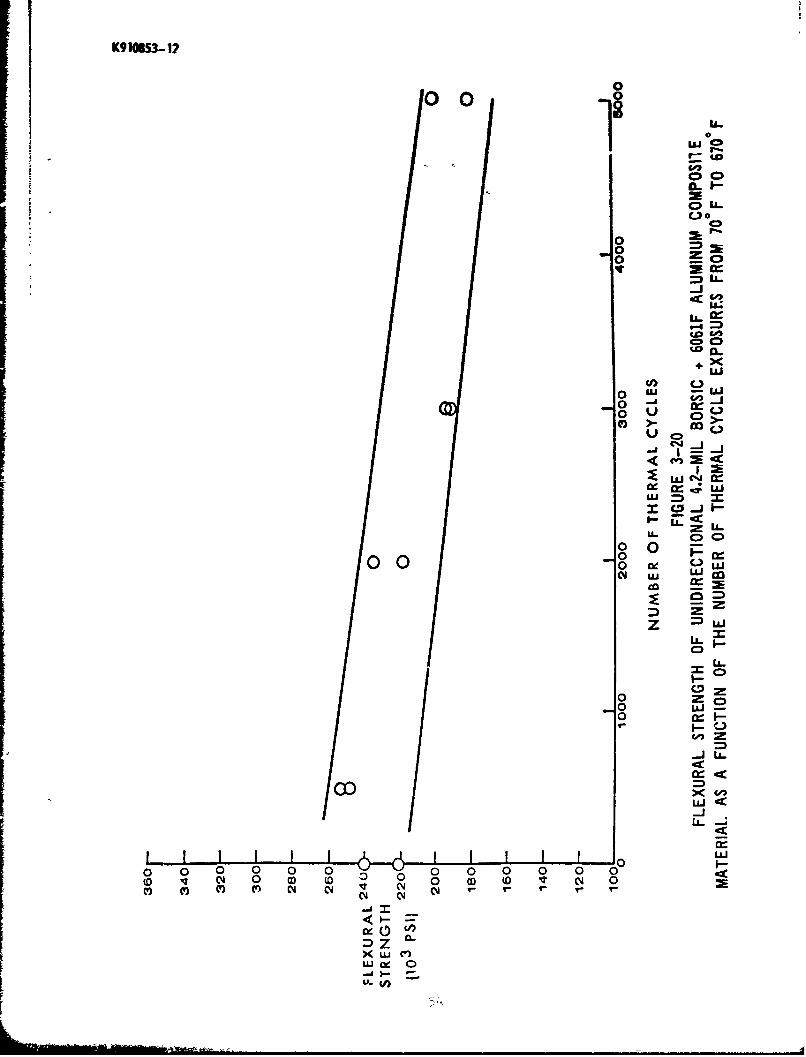
K9)0653- 12
000
C-,
1- 0IL~
0
U-
LL.~
o to
+ -J
~~C-)_000
0 cic
wU =C -Ji-
zLL-
000
-0 P =
LL~.
ILA
0=
o LAU
uji-j
0 0 0 0 0 0 0 0 0 0 0 0 F-'~ C' 0 co ( 0 0 G D 1
C~) C)() ) Nl Nl V CYJ 0 (4 CCl4 04 l ~ ' 9
CXWVD~ 0"X ( 0*
Lu oe

K910853- 12
-ill
0 t_00 G0
Cl L..CA,
~LLS
C.)
'1 0 U LLw
0-~
U-CID C
z
-j L-
z 0
-uJi
jLiJ
0
00 00I0<
Z C, 0
z 0 0E
0

K910653-12
ILU
to
derUU
00LIIn
ui
~~~~~~~C -U.~-- .* - .
f* cc1
,.J
-L
0
474
-O

K910853-12
twj
U.di
Uj l
4~LI
LU
UU
0.IO'-JwDUrCI~~ LL,~j
-An CD~ ~i
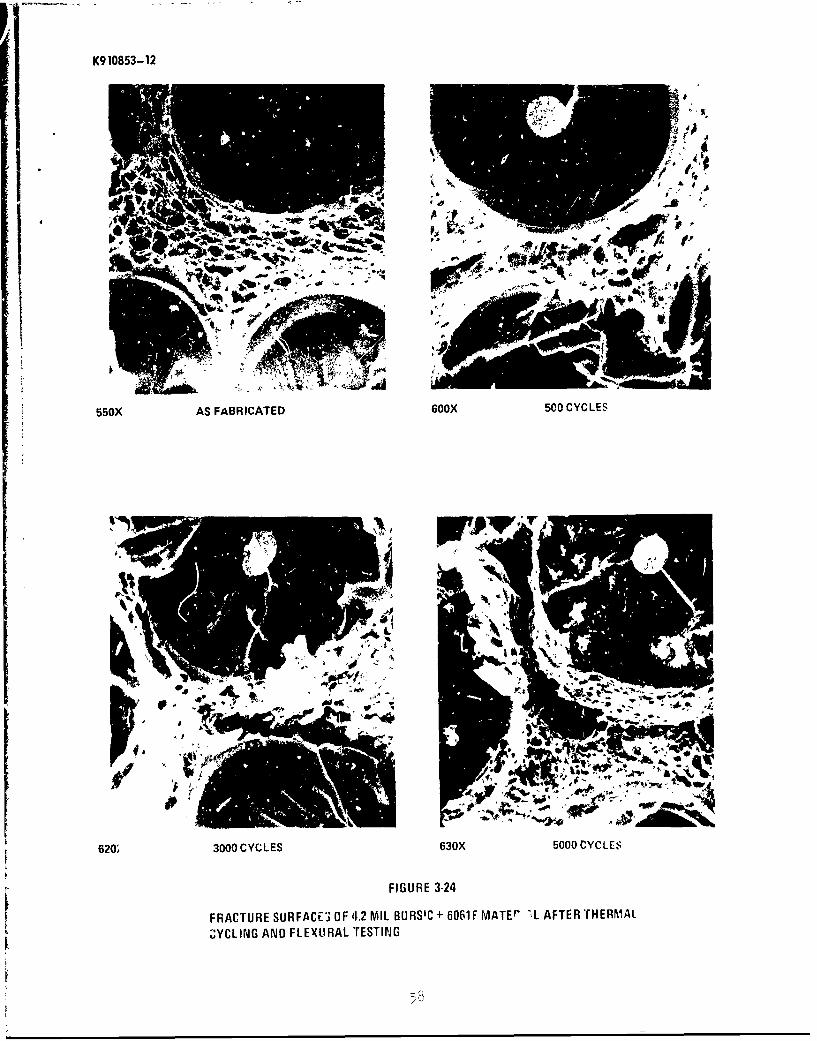
K910853-12
550X AS FABRICATED 60OX 500 CYCLES
620; 3000 CYCLES 630X 5000 CYCLES
FIGURE 3-24
FRACTURE SURFAC13 OF 4t.2 MIL BORS'C + 6061 F MATEr "I AFTER THERMIAL"CYCLING AND FLEXUIRAL TESTING

K910853-12
l eprdc frombes av'ailbler Ocop. 4000 CYCLES
FIGURE 3-254.2 MIL BORSIC 6061-F COMPOSITE SPECIMIEN AFT~ER THERMAL cYCL:NG
LEACHED TO EXPOSE WHE FIBERS (MAG-: 56X)

w
F-
zz
U.,
o uoI-
~U. -4LA..
ILQ
u 0 w C
.u wl = ) C3
2:j
z -i
o I
w wi
0n 2 o c- l >
z ~- 01C-D dL.
000
C-c.
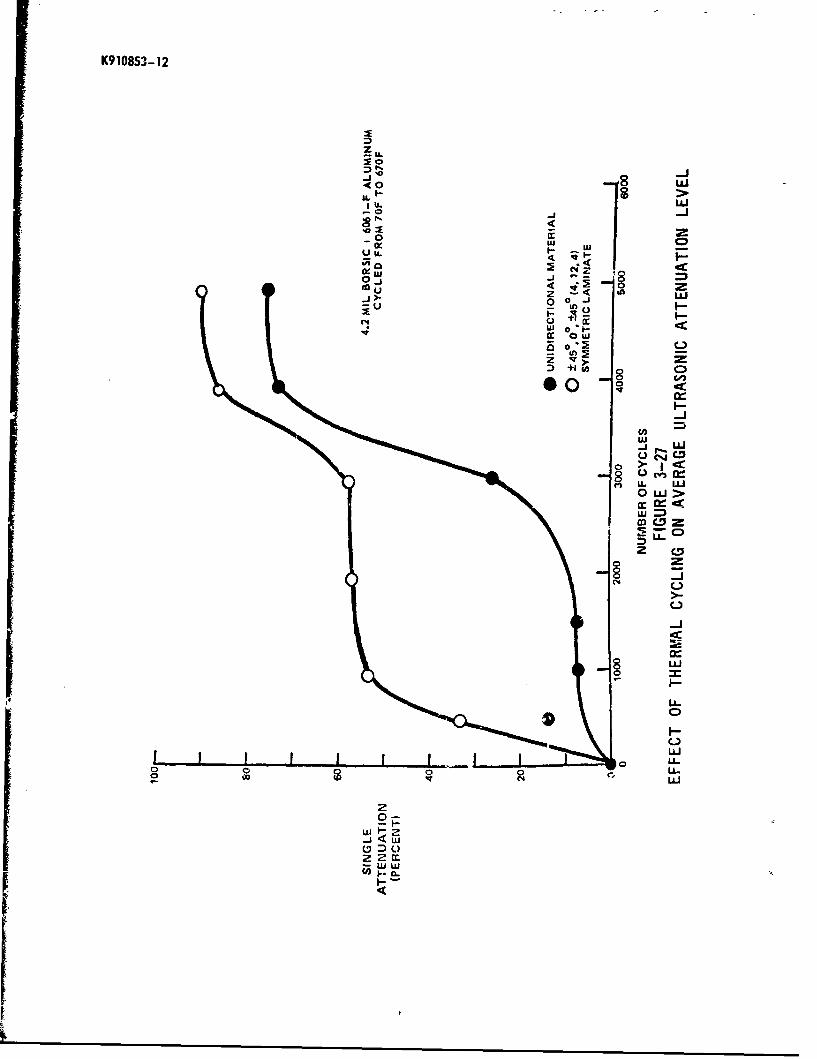
K910853- 12
D
-U.
-0
w0 wu U.
~0 _j
0 0
OILn
z Vz
w w
(.V
8 l z
0 >
cw,
U.
Lu J
zCD
-LJL.,
0 U-)
UiLU
.j w,
o o 0DLo
~z mw' 0.
'C
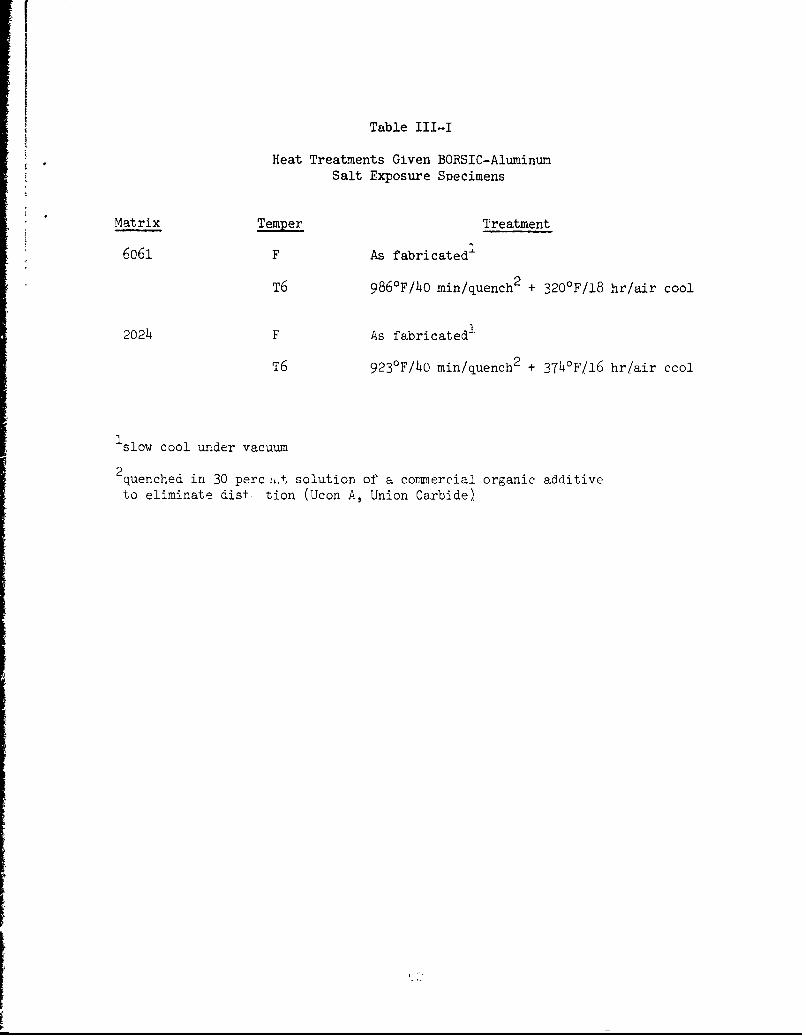
I
Table III-I
Heat Treatments Given BORSIC-AluminumSalt Exposure Specimens
Matrix Temper Treatment
6061 F As fabricated-
T6 986'F/40 min/quench 2 + 320°F/18 hr/air cool
2024 F As fabricated.
T6 9230 F/40 min/quench 2 + 374 0 F/16 hr/air cool
1 slow cool under vacuum
2 quenched in 30 perc .•.t solution of a commercial organic additiveto eliminate dist, tion (Ucon A, Union Carbide)
[.;
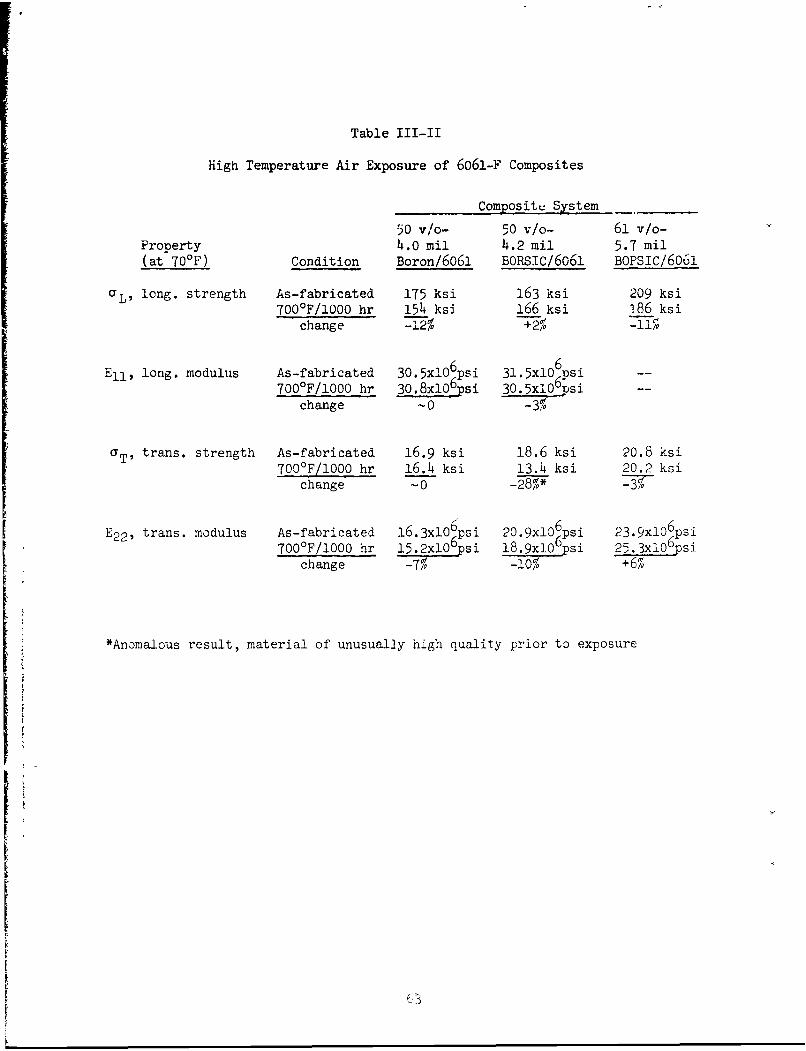
Table IIl-Il
High Temperature Air Exposure of 6061-F Composites
Composite System
50 v/o- 50 v/o- 61 v/o-Property 4.0 mil 4.2 mil 5.7 mil(at 70 0 F) Condition Boron/6061 BORSIC/6061 BOPSIC/606l
, L, long. strength As-fabricated 175 ksi 163 ksi 209 ksi700 0 F/1000 hr 154 ksi 166 ksi 186 ksi
change -12% +2% -1-%
Ell, long. modulus As-fabricated 30.5x60psi 31.5xl06psi
700OF/1000 hr 30.8xlOpsi 30.5x1O6rsi --
change -0 -3%
a T, trans. strength As-fabricated 16.9 ksi 18.6 ksi 20.8 ksi700°F/1000 hr 16.4 ksi 13.4 ksi 20.2 ksi
change -0 -28%* -3-
E2 2 , trans. modulus As-fabricated 16.3xlO6psi 20.9xlO6 psi 23.gxlo6 psi
700°F/1000 hr 15.2xl0 psi 18.9xl0•psi 25.3x10⁶psi
change -7% -10% +6%
*Anomalous result, material of unusual]y high quality prior to exposure

TRANSVERSE PROPERTIES
SUMMARY
The transverse properties of BORSIC fiber reinforced aluminum have beendetermined as a function of primary fabrication parameters. matrix and fibertypes, secondary processing procedures, fiber content, specimen geometry,specimen surface condition and thermal environment. Matrices investigatedinclude 2024, 606i, 5052, 5056, 2219, 1100, '.145, 8001, S.A.P., A1-7% Si,and aluminim containing several percentages of iron. The fibers investigatedinclude 4.0 mil boron, 4.2 mil BORSIC, R. F. boron, 5.6 mil boron, 5.7 milBORSIC, and 4.0 mil silicon carbide. It was shown that the composite trans-verse tensile strength is affected by aL2 of these variables and that transversestrengths of up to 48,000 psi can be achieved by the choice of the proper com-bination of matrix, fiber type and fabrication procedures. The compositesystem of 5.7 mil BORSIC-2024 was demonstrated to be one of the material!capable of exhibiting this strength while 5.7 mil BORSIC-6061 has achievedstrengths of up to 40,000 psi. These strength levels are approximately afactor of two greater than the strength of boron or BOESIC aluminum compositesavailable at the outset of this research program and have mitigated one ofthe major impediments to the application of B01SIC-aluMinum composites foraerospace applications. Composite transverse tensile strains in excess of0.5% have also been achieved during this program.
Composite transverse tensile strength was shown to be related to boththe matrix and fiber strengths. This latter quantity varies substantiallywith fiber type and illustrates the considerable anisotropy of boron fibers.Composite fracture mode, either predominant.y matrix failure or fiber splitting,is dependent upon the magnitude of transverse fiber strength relative tomatrix strength and controls the functional dependence of composite strengthon composite fiber content.
The use of transverse reinforcements of stainless steel wires and titaniumfoils is shown to significantly inc±'ease composite strength. In addition, inthe case of 4.2 mil BORSIC reinforced specimens, transverse strength is increasedby minimizing the effects o0 1iber edge damage.
Two of the experimental procedures used in this progrsm are indicated tobe of significance in the determination of composite integrity and perfection.The measurement of the cransverse modulus is sensitive to the degree of matrixconsolidation and composite bondng while the use of radiographicr echniquesreveals the condition of the reiiforcing fibers. The latter 'echnique is ahigh resolution technique capable of discerning the condition of inividualf ibers.
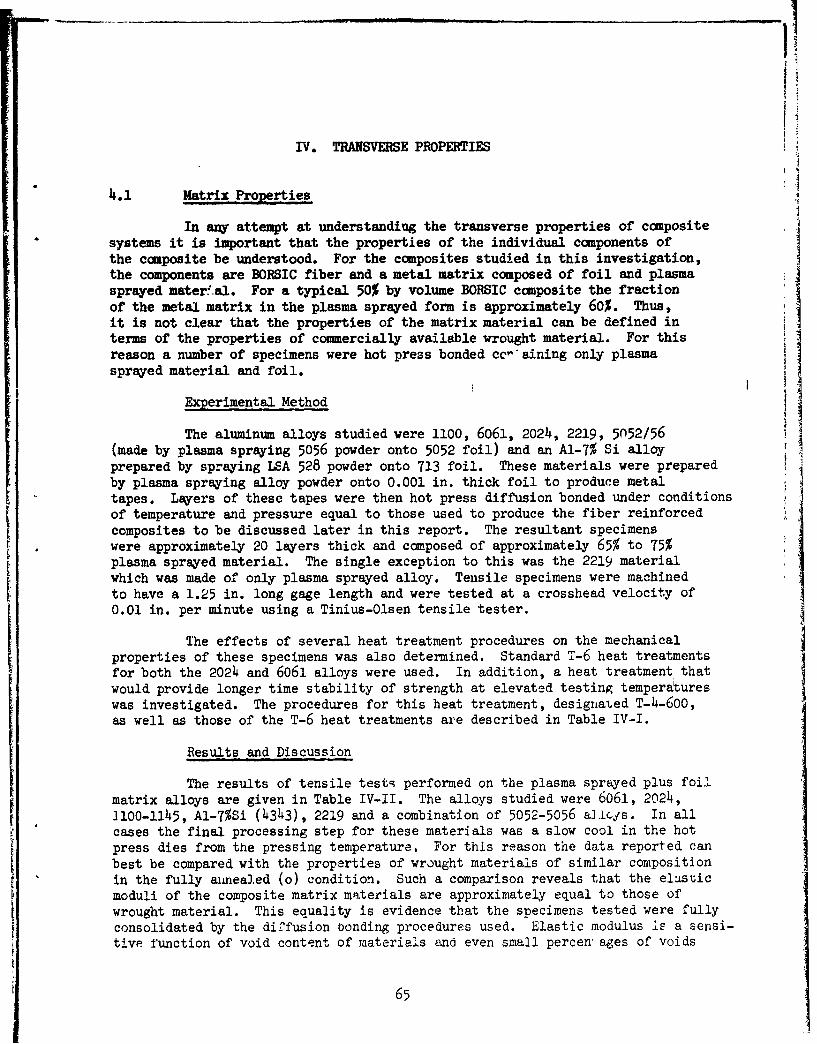
IV. TRANSVERSE PROPERTIES
4.1 Matrix Properties
In any attempt at understanding the transverse properties of compositesystems it is important that the properties of the individual components ofthe composite be understood. For the composites studied in this investigation,the components are BORSIC fiber and a metal matrix composed of foil and plasmasprayed matersal. For a typical 50% by volume BORSIC composite the fractionof the metal matrix in the plasma sprayed form is approximately 60%. Thus,it is not clear that the properties of the matrix material can be defined interms of the properties of commercially available wrought material. For thisreason a number of specimens were hot press bonded cc-" aining only plasmasprayed material and foil.
Experimental Method
The aluminum alloys studied were 1100, 6061, 2024, 2219, 5052/56(made by plasma spraying 5056 powder onto 5052 foil) and an Al-7% Si alloyprepared by spraying LSA 528 powder onto 713 foil. These materials were preparedby plasma spraying alloy powder onto 0.001 in. thick foil to produce metaltapes. Layers of these tapes were then hot press diffusion bonded under conditionsof temperature and pressure equal to those used to produce the fiber reinforcedcomposites to be discussed later in this report. The resultant specimens
, ~were approximately 20 layers thick stud com.posed of approximately 65% to 75%plasma sprayed material. The single exception to this was the 2219 materialwwhich was made of only plasma sprayed alloy. Tensile specimens were machinedto have a 1.25 in. long gage length and were tested at a crosshead velocity of
0.01 in. per minute using a Tinius-Olsen tensile tester.
The effects of several heat treatment procedures on the mechanicalproperties of these specimens was also determined. Standard T-6 heat treatmentsfor both the 2024 and 6061 alloys were used. In addition, a heat treatment thatwould provide longer time stability of strength at elevated at tremperanureswas investigated. The procedures for this hent at ment, designated T-u-600,
as well as those of the T-6 heat treatments are described in Table IV-I.
Results and Discussion
The results of tensile tests performed on the plasma sprayed plus foilmatrix alloys are given in Table IV-II. The alloys studied were 6061, 2024,mIatix145, Al-7%Si (4343), 2219 and a combination of 5052-5056 awlers. In allcases the final processing step for these materials was a slow cool in the hotpress dies from the pressing temperature. For this reason the data reported canbest be compared with the properties of wrought materials of similar compositionin the fully ariealed (o) condition. Such a comparison reveals that the elsticmodui i of the composite matrix materialsuc a pproximately equal to those of
wrought material. This equality is evidence that the specimens tested were fullyconsolidated by the diffusion bonding procedures used. Elastic modulus Is a sensi-tive function of void content of materiaels and even small percen- ages of voids
i 65

present would have caused the measured moduli to be considerably less than thosemeasured (Refs. 4.1,2). The comparison of strengths reveals that the yield andultimate tensile strengths of the composite matrices are greater than those ofthe wrought material. The greatest difference exists for the 2024 alloy whichexhibits a yield strength of 18.6 x 10³ psi and an ultimate tensile strength of35 x 103 as compared with 11 x 103 psi and 27 x 103 psi for the wrought material.The strains to fracture are 30% to 40% less than those of wrought material.This higher strength and lower ductility can be related to the very fine disper-sions of precipitate produced by annealing the plasma sprayed structure. Oxidespresent on the powder used in the plasma spray process will also contribute tothis increase in strength. Polished sections of these alloys display the pre-cipitate and oxide dispersions. The microstructural features of the plasmaspraye'A material are considerably finer than those of the adjacent foils asshown in Fig. 4.1. In this figure the structure of the aluminum-7% silicon plasmasprayed plus foil matrix material is shown. The tW.nner layers are the 0.001 in.foils used. They contain larger Si particles thp!. the neighboring plasma sprayedlayers. Examination of the fracture surfaces of the tested tensile specimensrevealed fracture details similar to those typical of wrought aluminum alloys.Figure 4.2 illustrates the fracture surface details of the plasma spr .yed plusfoil matrix specimens. Large amounts of local plasticity are evident. A com-parison between plasma spray behavior and foil fracture can be made in Fig. 4.2b'There foil fracture is observed in the left portion of the photo and plasmasjray failure is illustrated on the right.
Tensile tests at 400°F and 600°F also have been performed on thesematrix materials. The data obtained for the 20214 and 6061 aluminum alloys arepresented in Figs. 4.3, 4.4. In all cases the specimens were held at the testtemperature for 30 minutes prior to testing. The effect of heat treatment onmatrix strength is also shown in these figures. For both the 6061 and 2024 alloys,a standard T-6 heat treatment increased the room temperature tensile strengthsubstantially above the levels of the as-fabricated material. This differencebecame smaller at the elevated temperatures due to rapid overaging of the alloys.Comparison of the data in the two figures indicates that the 2024 matrix materialis capable of higher strengths than the 6061 material over the entire temperaturerange of testing.
4.2 Composite Transverse Elastic Modulus
The transverse elastic modulus (E2 2 ) of 4.2 mil BORSIC-aluminum is ofmajor concern in applications. Since these applications can occur at tempera-turec higher than 70OF and not only in tensile but also compressive stressstates, investigations have been performed to determine E2 2 under these con-ditions as well as under the more usual room temperature tensile configuration.In addition, the transverse elastic modulus was selected as the parameter tobe used in evaluating composite bor ding procedures to establish those best capableof providing well bonded, fully consolidated composites. The transverse modulusis especially suited to this task. This is in contrast to longitudinal compositeproperties that are determined primarily by the volume fraction of fiber rein-forcement present, degradation of fibers if any, and to a lesser extent processingvariables.
66
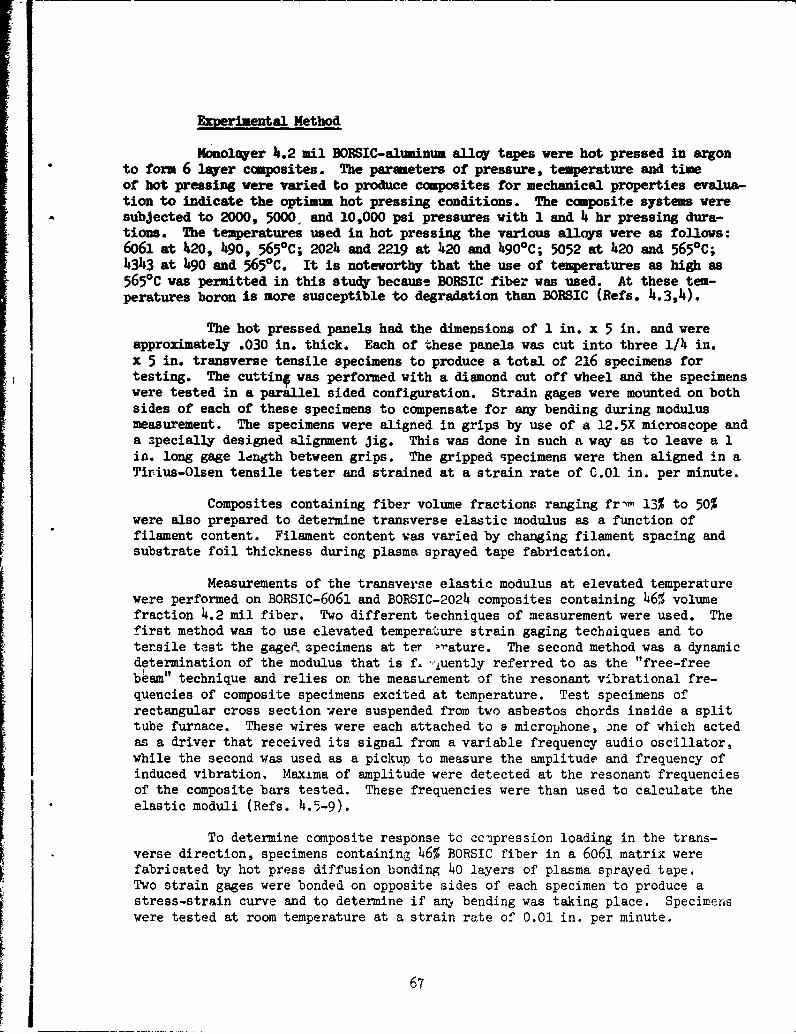
Experimental Method
Monolayer 4.2 ail BORSIC-aluminum alloy tapes were hot pressed in argonto form 6 layer composites. The parameters of pressure, temperature and timeof hot pressing were varied to produce composites for mechanical properties evalua-tion to indicate the optimum hot pressing conditions. The composite systems weresubjected to 2000, 5000, and 10,000 psi pressures with 1 and 4 hr pressing dura-tions. The temperatures used in hot pressing the various alloys were as follows:6061 at 420, 1490, 5650 C; 20214 and 2219 at 420 and 490°C; 5052 at 420 and 5650 C;4343 at 490 and 5650 C. It is noteworthy that the use of temperatures as high as5650 C was permitted in this study because BORSIC fiber was used. At these tem-peratures boron is more susceptible to degradation than BORSIC (Refs. 4.3,4).
The hot pressed panels had the dimensions of 1 in. x 5 in. and wereapproximately .030 in. thick. Each of these panels was cut into three 1/4 in.x 5 in. transverse tensile specimens to produce a total of 216 specimens fortesting. The cuttinf was performed with a diamond cut off wheel and the specimenswere tested in a parallel sided configuration. Strain gages were mounted on bothsides of each of these specimens to compensate for any bending during modulusmeasurement. The specimens were aligned in grips by use of a 12.5X microscope anda zpecially designed alignment jig. This was done in such a way as to leave a 1in. long gage length between grips. The gripped specimens were then aligned in aTirius-Olsen tensile tester and strained at a strain rate of C.01 in. per minute.
Composites containing fiber volume fractions ranging fr- 13% to 50%were also prepared to determine transverse elastic modulus as a function offilament content. Filament content was varied by changing filament spacing andsubstrate foil thickness during plasma sprayed tape fabrication.
Measurements of the transverse elastic modulus at elevated temperaturewere performed on BORSIC-6061 and BORSIC-2024 composites containing 46% volumefraction 4.2 mil fiber. Two different techniques of measurement were used. Thefirst method was to use elevated temperature strain gaging techniques and totensile test the gaged. specimens at ter '-ature. The second method was a dynamicdetermination of the modulus that is f. -'uently referred to as the "free-freebýam" technique and relies on the measurement of the resonant vibrational fre-quencies of composite specimens excited at temperature. Test specimens ofrectangular cross section were suspended from two asbestos chords inside a splittube furnace. These wires were each attached to a microphone, one of which actedas a driver that received its signal from a variable frequency audio oscillator,while the second was used as a pickup to measure the amplitude and frequency ofinduced vibration. Maxima of amplitude were detected at the resonant frequenciesof the composite bars tested. These frequencies were than used to calculate theelastic moduli (Refs. 4.=-9).
To determine composite response tc ccmpression loading in the trans-verse direction, specimens containing 46% BORSIC fiber in a 6061 matrix werefabricated by hot press diffusion bonding h0 layers of plasma sprayed tape.Two strain gages were bonded on opposite sides of each specimen to produce astress-strain curve and to determine if any bending was taking place. Specimenswere tested at room temperature at a strain rate of 0.01 in. per minute.
67

iii
Results and Discussion
The results of the tests performed on specimens hot press diffusionbonded under the range uf conditions described in the Experimental Method sectionindicated that, for all cases, the elastic modulus did depend on the bondingparameters used. Increasing either the temperature or pressure of bondingresulted in higher transverse moduli for all the matrix-fiber combinationsstudied. The length of time allotted for bonding (either 1 or 4 hrs), however,had little effect on the resultant composite modulus. For the composites havingmatrices of 6061, 5052/56 or 4343 the best hot pressing conditions were foundto be 5650C and 10,000 psi. For the 2024 and 2219 matrices, 4900C and 10,000psi were best. Composites containing 50% BORSIC fiber and the above matricesbonded under the above conditions exhibited transverse elastic moduli of 20 x 106
psi. This value is in substantial agreement v-th the theoretical predictionsof Chen and Lin (Ref. 4.10) and Adams and Driner (Ref. 4.11) for a BORSIC-aluminumcomposite containing 50% fiber arranged in a hexagonal array. Other combinationsof temperature and pressure were also found to produce fully consolidated com-posites having moduli equal to or nearly equal to the ideal value. The rangesof these bonding conditions are presented in Table IV-III for each compositesystem studied.
As composites were bonded at temperatures and pressures less than thosegiven above, the transverse modulus was found to decrease. This decrease wasfou-d to be associated with the presence of voids in these composites as measuredby a sink-float technique. For bonding pressures and te.Tteratures lower thanthose described above and in Table IV-III, void contents in excess of 3% byvolume were detected. These voids, present in the matrix, lower the elasticmodulus considerably (Refs. 4.1,2).
The variation of composite traisverse elastic modulus with BORSICfiber content is presented in Fig. 4.5. The modulus increasen with increasingvolume fraction fiber, however, as pointed out by others (Refs. 4.10-14), asimple "rule of mixtures" approech that disregards filament pncking array is notapplicable to an analysis of transverse properties. Unlike the longitudinalelastic modulus, the transverse Young's modulus is sensitive to the filamentdistribution in the composite. Microstructural examination of the specimenstested in this investigation indicate that filament packing is best described interms of a nearly hexagonal array and the data obtained agree best with a theo-retical analysis based on this type of fiber distribution.
The results of transverse elastic modulus determinations at elevated
temperature indicate that the modulus decreases with increasing test temperatureand at 600OF the modulus is 10-20% less than the room temperature value. Figure4.6 presents the data for both methods of modulus determination used. Thisdecrease in modulus is due, in a large measure, to the decrease in modulus exper-ienced by the matrix material over this same temperature interval. This canbe seen from the data shown in Fig. 4.6 of the elastic modulus of a typicalplasma sprayed plus foil matrix material prepared by hot pressing and tested intensiog at elevated temperature. At 600°F the modulus has reached the value of7 x 10 psi in agreement with the value expected for a wrought material of the
68

same composition (Ref. 4.15). This decrease in matrix modulus of 30% can causea major por+ira of the decrease in composite modulus observed (Ref. 4 .11). Theelastic modu.us of the BORSIC fiber is also decreasing with increasing tempera-ture (Refs. 4,16,17); however, little data is available in the temperature regionof 600OF to obtain a reliable value. •he data of Metcalfe and Schmitz (Ref. 4.16)indicate an elastic modulus of 50 x 10 psi for boron at approximately 600°F.Using this modulus for the BORSIC fiber and a modulus of 7 x 10 psi for thematrix, the work of Adams and Doner (Ref. 4.11) would indicate that a modulus ofapproximately 18 x 106 psi would be expected. This is in fairly good agreementwith the values obtained as shown in the figu ii.
The transverse elastic modul -. measured during compression testing atroom temperature was found to be 18 x l0o psi. The specimen tested contained46% volume fraction 4.2 mi) BORSIC fiber. Thus, the elastic modulus as measuredin compression is in substantial agreement "rith that measured in tension.
•4.3 Transverse Tcnsile Strength of 4.2 Mil BORSIC-Aluminuir
The transverse tensile strength of BORSIC-aluminum comp,o•ites hasbecome an important factor in their structural application. Although a uni-directional 50% volume fraction 4.2 mil BORSIC-aluminum conrpc3ite can exhibita lonritudinal ultimate tensile strength in excess of 160,000 psi, its transversestrength is only one-tenth of this value. This is in contrast to the anisotropyof the modulus for which the ratio is less than two to one. A method for cir-cumventing this strength problem has been to cross ply layers of composite toprovide the axial strength of fibers in more than one directic". This, however,is not alwayo a satisfactory solution to the strength problem because of thedecrease in stress sustainable in the original 00 direction. The preferredsolutioA would be one in which we can increase the transverse tensile strengthof composites without compromising their substantial 00 properties. A majorgoal of this contract is to gain an understanding of why the transverse strengthis so low and how it can be improved.
4.3.1 The Effects of Processing Parameters and Heat Treatment
Experimental Method
The composite specimens manufactured under a range of hot pressingconditions and described in the section on transverse elastic modulus were alsoused to determine the dependence of transverse tensile strength on bonding con-ditions. The bonding procedure used and the method of tensile testing are thesame as those described in the earlier section. In addition, subsequent tofabrication, several heat treatment procedures were used in an attempt to deter-mine their effect on composite transverse strength. The heat treatment v'rocedureswere performed on compositer; having 2024 and 6061 aluminum matrices. The firstheat treatment, designated '2-6, is described in Table IV-I while the second heattreatment used is a modification of the T-6 procedure. This modified proceduresubjects the composite to a liquid nitrogen environment (78 0K) for 16 hrs afterquenching from the solution anneal. The usual T-6 aging procedure is performedafter removal from the liquid nitrogen.
69
_ _ _ _ _ _ - - - - - .i- -. n i-Ii -ilO nl li oI. . ,
_i
Results and Discussion
The tensile test data obtained have indicated that the transversestrength of the BORSIC-aluminum composit'is produced under a range of bondingconditions is dependent upon the temperature and pressures used during consoli-dation. This is primarily due to the dependence of matrix porosity on hotpressing parameters. The plasma sprayed aluminum alloys can contain as muchas 10-15% porosity in the as-sprayed condition. If some of this porosity ispermitted to remain after oonding, the strength of the matrix material will beseverely reduced. Coble and Kingery (Ref. 4.2) have summarized a considerableamount of data illustrating the loss of strength metals exhibit with increasingvoid content. This effect of porosity, however, has been eliminated by hot pres-sing under the conditions of 10,000 psi pressure and temperatures of 565 0C (for4343, 6061,5052) and 490 0C (for 2024 and 2024-2219). Using these bonding param-eters no matrix porosity could e detected by the sink-float method. Theseconditions provided the highest values of tensile strength over the range ofproceRqing conditions 'used and agree with the conditions found to produce thehighest transverse modulus values described earlier.
Even at full densification, however, the composite transverse strengthsfall short of what certain theories have predicted. Work by Chen and Lin (Ref.4.10) has indicated that the transverse strength of a 50% volume fraction BORSIC-aluminum composite should be nearly equal to the strength of the matrix materialfor a hexagonal fiber array. A square fiber array of the same volume fractionshould exhibit approximately 75% of the matrix strength. Recent work by D. Adams(Ref. 4.18), using an elastic-plastic solution for the stress state in a BORSIC-aluminum composite subjected to transverse normal tensile loading, also indicatesGhat the transverse strengths on the order of those of the unreinforced matrixare to be expected. The data in Fig. 4.7 do not agree with these predictions.This figure presents the transverse ultimate tensile strength of the compositesdescribed above as a function of matrix strength. The values of matrix strengthare those obtained using the techniques described earlier in this report. Forthe fuily consolidated composites, the average 900 ultimate tensile strength valuesare approximately 13,000 psi despite the fact that the matrix strengths areall substantially above this level. In addition, over the range of matrix
strengths shown in the figure (17,500-30,000) no increase in transverse com-posite strength was noted with increasing matrix strength. This will be discussed
more fully in a later section of this report.
The fracture mode was also found to vary with hot pressing conditions.The use of pressures and temperatures insufficient to cause full matrix consoli-
dation resulted in the fracture path occurring in the composite matrix. Theresultant fracture surface did not exhibit any fiber failure. In contrast tothis, in the case of the fully consolidated specimens, the fracture path wasthrough both the matrix and the fiber. The fracture surface of these specimenswas characterized by fiber splitting. A typical fracture surface is illustratedin Fig. 4.8. This figures illustrates that all the fibers in the plane of thefracture surface are split longitudinally. The plane of splitting passes throughthe core of each of the fibers. In Fig. 4.8 the cores are visible as white Linesin the centers of each of the fractured fibers. No evidence of fiber-matrixdebonding is evident in the figure. Radiographic examination of the remainder
70

of the same specimen revealed that no fiber splits occurred in regions removedfrom the fraoture surface. This was common to other specimens, containingapproximately 50% fiber, examined in a similar fashion and indicates that thefiber splitting accompanying transverse tensile failure is a very localized event,occurring only at the final fract,-a region for these composites. Compositestested having much smaller fiber contents did not all exhibit this localizedfiber splitting.
Several transverse tensile specimens were fabricated and tersile testedusing an 1100 aluminum matrix and 4.2 mil BORSIC reinforcing fiber. The frac-ture surface of these specimens, as shown in Fig. 4.9, is nearly fr-e of fibersplitting. Matrix failure predominates. This, as will be discussed in a latersection, is due to the low strength of the aluminum matrix and is in sharpcontrast to the behavior illustrated by Fig. 4.8.
The heat treatment of both the 2024 and 6061 matrix composites hasresulted in considerable improvement in transverse tensile strength. Compositespecimens containing approximately 50% BORSIC fiber in a 2024 matrix heat treatedto the T-6 condition exhibited transverse tensile strengths of approximately21,500 psi. The T-6 heat treatment is described in Table IV-I, This abilityto cause an increase in strength by heat treatment is consistf.nt with earlierwork performed in this laboratory (Ref. 4.19) and elsewhere (Ref. 4.20). ForBORSIC-6061 both the T-6 heat treatment and tue modified treatment that subjectedthe composite to a liquid nitrogen environment (78 0 K) were used. This latterheat treatment has been used by other investigators (Ref. 4.21) to modify theresidual stresses in the matrix. Both of the above heat treatment proceduresresulted in a composite transverse strength of approximately 20,000 psi fora 50% volume BORSIC-6061 composite. The liquid nitrogen step did not causeany marked change in composite properties.
Figure 4.1O illustrates the stress strain curves of BORSIC-6061 com-posites tested in the 900 direction in both the T-6 and F (as-fabricated)conditions. It is seen that the T-6 heat treatment not only changes the compositeultimate tensile strength but also alters the entire stress strain curve. Theheat treated material exhibits a linear behavior nearly all the way to the pointof fracture. The proportional limit of the heat treated specimens was approxi-mately 18,000 psi while that of as-fabricated specimens occurred at approximately4o00-6ooo psi.
Figure 4.10 also illustrates an important point in the behavior ofas-fabricated composites. Two different types of stress-strain curves weregenerated for composite specimens that have been manufactured and processed underidentical conditions. In general, the initial portions of the curves were similar,however, for some specimens tested, fracture occurred at a strain of approximately0.012 while for others the strain to fracture was twice this amount. The speci-mens which fail at the Larger strain exhibit a region of increasing strain itmdernearly constant stress and frequently fracture in a region directly under the
71
strain gages on the specimen surface. Thus, this phenomenon may be associatedwith the propagationoof failure through the specimen. Curves similar to thissecond type (larger strain to failure) have been observed by others (Ref. 4.22)as reported by Adams (Ref. 4.18).
4.3.2 Transverse Strength as a Function of Test Temperature and MatrixStrength
Experimental Method
Transverse tensile tests were performed at room temperature, 2000 F,400WF, and 600°F. The specimen configuration used was the same as that describedin earlier sections and the composites tested had 2024 and 6061 matrices. Boththe F and T-6 composite conditions were tested. All testing was done in air andthe spe.:imens were held at the test temperature for 30 minutes prior to testing.
Transverse compression tests were performed at both room temperatureand at 6000 F. The 6061 matrix composite in the F condition was the only type ofspecimen tested. Testing was carried out by compressing between flat carbideplatens. The compression specimen ends were ground flat and parallel. No furtherspecimen end preparation was used.
Results and Discussion
The results of the transverse tensile testing of 4.2 mil BORSIC-6061 andBORSIC-2024 composites is presented in Figs. 4.11,12. As discussed in a pre-vious section, the T-6 heat treatment increases the transverse strength abovethat of the as-fabricated composite, This difference becomes smaller with in-creasing test temperature as the overaging of the heat treated material takesplace. At room temperature the strengths of the 2024 and 6061 matrix compositesare .pproximately equal. As the test temperature is increased the 2024 compositeretains a higher strength level than the 6061. This is in agreement with theunreinforced matrix properties presented in Figs. 4.3,4 where the 2024 alloyexhibited higher elevated temperature strength than the 6061 material.
A comparison of tne data obtained for composite transverse strengthwith the unreinforced matrix strength reveals that for both 6061 and 2024 matrixmaterials, the difference between matrix strength and composite strength decreaseswith increasing temperature. In the comparison of the 2024 matrix compositeswith the unreinforced alloy, the composite transverse strength in the F condi"iondecreases only slightly with increasing temperature despite a large decreasein matrix strength. For the T-6 condition both the unreinforced matrix and com-posite exhibit large decreases in tensile strength with increasing temperature.The 6061 matrix composite exhibited a large decrease in strength with increasingtemperature for both the F and T-6 conditions.
The fracture surfaces of the composites tested were examined to deter-mine the mode of fracture. As discussed earlier, at room temperature all ofthe fibers in the composite fracture surface were split longitudinally. Thischanged, however, as the test temperature increased. With increasing temperature
72
---. . .. . _ I , I' I illiI I
of test, the fraction of fracture surface occupied by split fibers decreased.In the case of the 6061 matrix composites, at 600°F no fiber splitting was foundto occur and instead the mode of fracture corresponded to that of matrix failure.None of the fracture surfaces studied exhibited evidence of fiber-matrix debondingas a primary mode of fracture.
A summary of the transverse tensile strength of 4.2 mil BORSIC fiberreinforced composites as a function of matrix strength is presented in Fig. 4.13.The data include five different matrices, two of which are in both as-fabricatedand heat treated conditions, as well as data obtained over the test temperaturerange of 70-6000 F. Three distinct regions of behavior are seen to occur and aredepicted in Fig. 4.14.
Region I - The fracture surfaces of the failed composites exhibitedonly small amounts of split fibers. In this region the composite strength isapproximately equal to the matrix strength. Thus, in this region the matrixfails at an applied ccnposit• stress belou that necessary for fiber failure.The behavior of the 1100 matrix composites at room temperature and the 6061matrix composites at elevated temperature are characteristic of this region.The fracture surface presented in Fig. 4.9 is typical of these composites.
Region II - In this region of matrix strength the cci~posite trans-verse tensile strength is substantially independent of matrix strength.Fracture surfaces are characterized by the presence of large amounts of fibersplitting, Fig. 4.8. In this region the matrix strength is sufficient to causeloading of the fibers to their ultimate transverse strength prior to compositefailure. Upon fiber failure, however, the remaining composite matrix materialalso fails due to overload. The remaining matrix does not have the loadcarrying capability to prevent total composite failure subsequent to fiberfailure. Thus, the constancy and level of composite strength in Region II andthe points of transition between Reg-fins I and II, and II and III are controlledby the fiber transverse tensile strength. A highe' transverse tensile strengthfiber would raise the composite strength level of the Region II plateau and alsoraise the matrix strength levels of the transition points between regions. Examplesof this will be presented in later sections of this report.
Region III - In Region III, as in Region IT, matrix strength is suffi-cient to cause transverse fiber failure prior to ccmposite failure, however,matrix strength is also high enough to prevent immediate overload failure. Thus,the composite strength is determined by the net section of load bearing matrixleft, subsequent to fiber splitting, and the strength of this matrix. In thecase of the heat treated composites, the presence and magnitude of residua'stresses, no doubt, is also of importance. Fracture, surfazes are typicallysimilar to that shown in Fig. 4.8.
It should be noted that the data for the 5052/56 matrix composite waspresented in Region II, not in Region III. This matrix material contains botha foil of 5052 aluminum with a tensile strength of 28,000 psi and the plasmasprayed material of 5056 with a tensile strength of 42,000 psi. After fibersplitting occurs the major portion of the load carrying matrix consists of the
73

- .". MR PI..-.
weaker 5052 foil due to the fact that the foil (or tape) plys are alignedparallel to the traneverse tensile axis. Thus, the residual effective matrixstrength for this composite is actually 28,000 psi which puts it in Region II.
The transverse compression tests were performed on 6061 matrix com-posite specimens containing 46% BORSIC fiber. The room temperature transversecompression stress-btrain curve is presented in Fig. 4.15. It is plotted withthe axial compression stress-strain curve for the same material (Ref. 4.19).The elastic modulus is approximately equal to that exhibited during transversetension; however, the maximum load carrying capability is considerably greaterthan that in tension. After approximately 6% strain,and at a stress of 37,900psi, the lcad began to decrease with increasing strain. The cause of thisdecrease was the shear failure of the specimen as shown in Fig. 4.16. At600°F the specimens failed by the same mechanism, however, the maximum stresswas 9500 psi. One specimen compressed at room temperature to the point ofrupture was used to examine the fracture surfaces produced. The fracturedspecimen is shown in scanning electron microscope photographs in Fig. 4.17.As can be seen in the figure, fiber splitting is once again characteristic ofthe fracture surface. Also visible in Fig. 4.17 is evidence of large amountsof shear deformation of the aluminum between the split fibers.
4.3.3 Transverse Tensile Strength as a Function of Volume Fraction Fiber
Experimental MetL .,d
To determine the effects of varying the volume fraction fiber on trans-verse tensile strength, composites were manufactuxed containing from 13% to46% 4.2 mil BORSIC. The matrix used was 2024 aluminum. To produce this ,aria-tion in fiber content a range of filament winding spacings and several different2024 foil thicknesses were used in conjunction with the usual plasma spray-diffusion bonding procedures. Specimen testing procedures were the same asthose described in previous sections.
Results and Discus "on
The results of the tests performed on 0-46% BORSIC-.2024 conpositesare presented in Fig. 4.18. For both the as-fabricated condition an& T-6condition, when tested at room temperature, the tensile strength decreases withincreasing volume fraction fiber. At 600 0 F, however, the transverse strengthis substantially independent of Liber volume fraction. The values of ultimatetensile strength used for the unreinforced matrix were obtained by testing plasmasprayed plus foil material as described in the section on matrix properties.
The lines drawn in Fig. 4.18 from the two 70°F unreinforced matrixstrength data points do not represent a fit to the composite data but insteadare a result of calculations performed using a simple model. In this model,
it was assumed that the fibers had been removed from the comnosite leav!.ng anetwork of cylindrical holes. The composite strength was then calculated onthe basis of the net minimum cross-sectional area remaining. Little differencein strength was found between the square or hexagonal hole arrays. In both
74
the as-fabricated and T-6 conditions, the composite strengths were 'nd to bein excess of those calculated.
The difference between compesita tehavior at room tempera..•ire and at600OF can be related to differences in fracture mode. At room te-x -rature thefracture surfaces are characterized by longitudinal splitting of I. the fibersin the fracture surface. Composite be]"-. or at room temperature A similar tothat described in Fig. 4.14 for Regions I and III. At the high '1uame fractionsof fiber, in the F conditicn, the matrix is overloaded by local "'.ber failureas was described for Region II. Matrix load carrying capabilit' is increasedby decreasing fiber content and composite heat treatment so that increasing com-posite strength can be achieved, typical of Region III. At 6001., however, theamount of fiber s,:iitting is far less and in some cases no fib. 1plitting atall is found. The failure occurs completely through the matri . For this lattercase of matrix failure the observation that composite strength is independentof volume fraction fiber is consistent with the prediction of 'Then and Lin(Ref. 4.10) and corresponds tc Region I in the previous analý.is. It is alsoclear that the predictions of Ref. 4.10 do not hold for the '.eE.ts performedat room temperature. This is due to the fiber mode of failu-c being operativeat room temperature. The prediction based on the assumption of matrix failurethus should only be used when this mode of failure is predominant.
4.3.4 The Effects of Tensile Specimen Configuration and Edge Conditions
on Transverse Strenlth
Experimental Method
To determine the effects of tensile specimen configuration on measuredtransverse tensile strcngth, a series of specimens was prepared having threedifferent geometries. These configurations were: parallel sided, parallel sidedwith alumin-.m doublers bonded to the specimens in the gripping areas and finallyparallel sided with reduced sections of one inch in length. All specimens werebasically 0.25 in. wide and 0.030 in. thick with the reduced section of the one3pecimen type being 0.210 in. vide. All specimens tested were 50% 4.2 milBORSIC in a 6061 aluminum matrix.
The dependence of transverse tensile strength on specimen volume wasstudied by varying both the specimen thickness -nd specimen gage length. Thegage length was varied sevenfold and the thickness was varied ninefold. Thesecomposites contained a range of from 50 to 3500 fibers in their tested gagesections. Composites all contained approximately 50% 4.2 mil BORSIC in a 6061matrix and all specimens were tested in the parallel sided configuration withbonded aluminum doublers.
The observation has been made that fiber splilting is an importantmode of fracture for 4.2 mil BORSIC-aluminum specimens tested in transversenormal loading. This splitting of fibers occurs across the entire specimengage section, from ndge to edge. Because of this, an envestigation was per-formed to determine the effects of composite edge condition on transversetensile strength. Tensile specimens were prepared containing 40% 4.2 mil
75
BORSIC in a 2024-2219 matrix. These specimens were 0.25 in. wide and were cutfrom diffusion bonded panels using three different methods. The first methodconsisted of cutting with diamond abrasive whee2 and the second method wascutting by electrodischarge machining (EDM). The third procedure consisted ofcutting with a diamond abrasive wheel and then polishing the specimen ndges toremove 0.012 in. from each cut edge. At least three specimens were tested ineach of these conditions.
A fourth type of edge condition was also studied. This consisted oftensile testing transverse composites with the fiber ends of the specimensremaining unstressed. To accomplish this, specimens one inch wide were hot pressdiffusion bonded. The fiber ends of these panels were freed from the matrixby dissolving away at least 0.25 in. from each eage of the panel. This then lefta central load carrying region of aluminum 4.2 mil BOPSIC with long free fiberends protruding from both edges. These specimens were then tensile tested usingthe usual procedures described previously.
Results and Discussion
The results of the tensile tests performed on the specimens havingthree different configurations indicated that the use of the aluminum doublerson parallel sided specimens was successful in localizing all the fractures with-in the specimen gage length and away from the grip edges. In the case ofspecimens with no doublers, the fracture always occurred at the grip edge; however,there was only a 5% difference in ultimate tensile strength between the two typesof specimens, those with doublers having the higher values averaging 13,900 psi.The use of a small reduced section, however, caused a 16% decrease in ultimatetensile strength below the above-mentioned value. These specimens failed in thegage section and not at the machined radii so that the decrease in strength canbe attributed to the extra machining operations involved in preparing the speci-mens. It was found that for all specimen configurations and failure locations,the fracture surface was characterized by split fibers. From the above, it wasconcluded that the best configuration is the parallel sided specimen with doublersto diminish the stress concentrations in the grip end region and thus providefractures occurring in the gage section. The testing of specimens withoutdoublers does not, however, cause any appreciable decrease in tensile strengthand thus the stress concentrations caused by the grips being used are notexcessive.
The effects of varying the volume of the gage section of transversetensile specimen were found to be small. Despite a large variation in specimenvoLume (sixtyfold) no significant changes in transverse tensile strength wereftund to occur. The values measured for all specimens tested ranged from 11,300psi to 15,400 psi; however, no trend with specimen volume was found. As hasbeen stated previously in this report, only a few fibers fail at the point ofcomposite railure in transverse tension. The smallest specimens tested (con-taining 70 fibers in their test section) apparently contain a sufficient numberof sites for failure to prevent the observation of a higher strength due todecreased volume.
76

The results obtained using the three different cutting proceduresare given below:
1. Specimen edges prepared by cutting with a diamond abrasive wheel werefound to contain badly broken fiber ends. The fiber ends are evi-dently broken and not cut by the motion of the wheel. Tensile strengthobtained from tested specimens averaged 12,500 psi. Figure 4.19 showsthe condition the fibor edges are in after abrasive wheel cutting.The edges of the specimen have been etched back to reveal notched andcracked fiber ends.
2. Specimen edges prepared by electrodischarge machining (EDM) were foundto also have broken fiber ends. The average tensile strength exhibitedby three specimens was 13,300 psi.
3. Preparation using a cutting wheel and then polishing resulted in fiberends that were more smooth and less damaged in appearance than eitherof the above techniques provided. The averagc tensile strength ofthese specimens was 11,700 psi.
For all of the specimens tested in these three edge conditions, thefracture surface was characterized by split fibers. The method of cutting oredge preparation for the three cases studied had little effect on either thetransverse tensile strength or the mode of failure.
Figure 4.20 is a radiograph taken of a transverse tensile specimenafter having been stressed to the point of fracture. The test was stopped priorto complete sfecim'' failure to study the mode of fracture propagation. Thisspecirerl, the .d of whic1 were cut with a diamond abrasive wheel, began tofail %t one ,,f e; ,ges. • radiograph shows the propagation of the edgeinitiated crack through the specimen. The longitudinal splitting of fibersis 4isible at the crack tip.
Figure 4.21 illustrates the configuration of the speciriens with the free
fiber ends. The stress-strain carves obtained by tensile test.ing BORSIC-2024composite specimens of th.s configuration are shown in Fig. 4.22. A stress-straincurve exhibited by the more conventional type of transverse tensile specimenshaving cut edges is also included in the figure for comparison. It is seen thatthe specimens Uith the free and cut configurations exhibit the same elasticmodulus; however, the tensile strength and strains to fracture of these compositesdiffer substantially. For the as-fabricated (F) condition, the "cut-edges" com-posite exhibits a transverse tensile strength of 15,000 psi while the "free-end"composite is capable of 19,000 psi. In the T-6 condition, the "free-end" com-posite fails at 36,000 psi, while the tensile strengths of "cut-edge" compositeshaving the same matrix and undergoing the same heat treatment were found to beonly 22,000-24,000 psi. Thus, when the fiber edges of these composites areunstressed, the transverse tensile strength increases substantially. Figure4.23 illustrates this same point; however, in this case, the matrix materialis a 5052/56 aluminum alloy combination. In this figure, once again, the elasticmodulus of the two types of specimens is independent of condition; and the
77
tensile strength of the free-fiber-end composite is nearly 30,000 psi. Figure4.23 also illustrates that two different types of composite behavior are foundto occur for the cut-edge composites. The composite can fail with a fracturestrain of only 0.06%, or it can exhibit a fracture strain of 0.12%. In both,*a.es, the tensile strength was approximately 12,000 psi. This type of behaviorwas previously discussed and illustrated in Fig. 4.10.
Figure 4.24 illustrates the tensile strengths obtained by testing"free-fiber-end" 900 specimens. In the figure, the composite tensile strengthis plotted as a function of the ultimate tensile strength of the unreinforcedmatrix. The lines drawn indicate the tensile strengths to be obtained if com-posite behavior agreed vith the analysis of Cben and Lin (Ref. 4.10). Strengthsexpected for both square and hexagonal fiber arrays are ci:awn. This figureis in marked contrast to one having similar axes reported earlier in Fig. 4.7for cut-edge composites. In that figure it was seen that composites having 2024,6061, and 5052/56 matrices all exhibited the same transverse strength. For thedata reported in Fig. 4.24 this is no longer the case. The transverse strer:gthof the composites tested is not constant and is dependent on matrix strength.The composites having the 5052/56 matrix material exhibited tensile strengthsof approximately 30,000 psi while those having a 6061 matrix failed at only20,000 psi. For all of these composites, the fracture surfaces of the testedspecimens exhibited some fiber splitting. However, the fiber splitting observedwas substantialJ.y less than that reported in the other sections of thisreport when the specimen edges were in the cut conditicn. The fracture surnaces
of free fibe± end and cut edge specimens are compared in Fig. 4.25. The specimenwith free fiber ends is characterized primarily by a matrix mode of failure whilethe cut edge specimerL is characterized primarily by fiber splitting.
The specimens tested in the free end condition with a 2024 aluminummatrix were found to exhibit larger amounts of fiber splitting. This is probablywhy the composite tensile strengths reported in Fig. 4.24 for these specimenswere not higher. An example of the importance of fiber splitting in the fractureof these specimens is found in the two data points reported for the BORSIC-2024 composites in the T-6 condition. The lower value of tensi2e streng 1 of25,850 psi was exhibited by a specimen that had all the fibers in its fracturesurface split. In the case of the other specimen, however, only 50% of the fibersin the fracture surface were split and the composite tensile strength was 36,750psi.
Several transverse tensile specimens were tested with fiber ends pro-truding less than 0.25 in. beyond the matrix edge. No change in fracture modeor tensile strength was noted from that of cut edge specimens. This was foundto be due to the fact that fiber edge damage extended further than 0.25 in. fromthe fiber ends. In a similar manner, some specimens vere found to exhibit fiberdamage to greater than 0.25 in. so that matrix removal would have to extend muchfurther into the specimens to provide increased performance.
78
14.3.5 Dispersion Hardened Aluminum 4.2 Mil BORSIC Composites
One of the major advantages of metal matrix composites over polymericmatrix composites is the higher temperature performance caDability of the metalmatrices. In the case of the BCRSIC-aluminum system, compatibility between fiberand matrix is sufficient to permit long term exposure and usage at above 600 0F,the upper temperature limit for structural application of moýt aluminum alloys.At present, however, BORSIC-aluminum is not generally being considered for highertemperature applications due to the low levels of coimposite transverse strengthand shear strength. Both of these quantities are oeing controlled by matrix prop-erties. The following section will describe effo~ts to achieve an aluminum alloymatrix that will permit composite application at .aigher temperatures.
Experimental Method
Five aluminum alloys, other than those described in tVie earlier sectionof this report, have been used in an attempt at providing BORSIC-aluminum com.posites with superior elevated temperature transverse strength. The alloy systemsinclude aluminum-iron alloys, the alloy desiguated 8001 and high aluminum oxidecontent (21% by weight) aluminum fabricated from qintervd Aluminum Powder (S.A.P.).The 8001 and aluminum-iron matrix composites were fabricated using only fiberand matrix powder. These composites were created by plasma spraying the powd0.-ronto the fibers to produce tape consisting of only plasma sprayed material andfiber. Plasma spraying was not used to fabricate the S.A.P. matrix composites.In this case the S.A.P. was in 2 mil thick foil form. Tapes were prepared bybonding fiber to the foil with polystyrene which is outgased prior to diffusionbonding. The procedure for composite manufacture wa5 'xazinelly the same asthat described in other sections of this report. Sections ol tapes of EORSIC-aluminum alloy • ere hot press dififusion bonded to produce composite sperimens.In addition, fiberless specimens were manufactured and tested to determine basematrix properties.
The aluminum-iron alloy system was chosen as a likely candtdate forhigh temperature applications because of the results obtaineC by powar metal-lurgy at Alcoa (Re,!. 4.23). Excellent strength, creep and stress ruptureproperties at temperatures of up to 800 0F have been obtained. The most cowironlyused alloy contains approximately 8% Fe and can exhibit a ;ensile strength of10,000 psi at 8000 F (Ref. h.23). This is due to an extremely fine dispirsionof FeAl generated in these materials by powder metallurgical technique3. TheS.A.P. ?oil was also chosen for its proven outstanding elevated temp.rftureproperties.
The 8001 alloy (l.l%Ni, 0.6%Fe) is also a dispersion ha-'den~d matrixmaterial and has superior corrosion resistance to the aluminum iron or aluminumcopper alloys at elevated temperatures. Because of this latter property, 6001alloy has found application in atomic reactors. The streng+h of wrought formsof this alloy, however, is quite low at elevated temperature (5000 psi at 6000F).Through the use of plasma spray techniques to generate a fine dispersion ofintermetallics, it will be shown that higher strengths car. be obtained.
79
Results and Discussion
Fiberiess matrix specimens of aluminum alloys containing 1.8, 5.2,and 7.4% Fe were fabricated by the plasma spray plus diffusion bonding pro-cedure. These specimens were tensile tested Ft temperatures ranging from roomtemperature to 600°F. The specimens containing 5.2% Fe demonstrated higher
tensile strengths than either of the other alloys. This was associated with afine dispersion of FeA1 3 distributed in the matrix as a result of p-asma sprayingand probably the rapid cooling from the liquid droplet form in this procedure.Experiments performed by Schiel and Masuda (Pef. 4.24) on the supercooling ofaluminum iron alloys may explain the superior properties of the 5.2% Fe alloy.Although the cutectic point of this system occurs at approximately 2% Fe, rapidcooling throLtgh the eutectic produces a fine coupled eutectic structure atcompositions having higher concentrations of Fe. The authors found that super-cooling of 1000 C causes this coupled region to occur at approximately 5% Fewhile at higher and lower concentrations the structure is no longer coupled.At room temperaturg the unreinforced Al-5.2% Fe material exhibited an elasticmodulus of 10 x 10 psi, a tensile strength of 19,000 psi and a strain to frac-ture of 20%. At 600'F the tensile strength was 12,000 psi. Composites containing46% 4.2 mil BORSIC fiber and a matrix of this same alloy were found to exhibita room temperature transverse elastic modulus of approximately 18 x 106 psi, atransverse tensile strength of 12,500 psi and a strp9'i to fracture of 0.13%.At 600*F the transverse tensile strength was 9000 psi. The results of these testshave indicated that the plasma spray plus diffusion bonding procedures used arenot yet capable of causing the aluminum iron system to achieve the level of s'zrengthobtained using powder metallurgical techniques. In the powder metallurgicalprocedure the material is fabricatec by compaction and extrusion. The extrusionprocedure, not &Dplicable to the composites described herein, provides a micro-structure that is even finer than the one oltained by plasma spraying.
Specimens of 8001 aluminum alloy (l.l%Ni, 0.5%Fe) were prepared by
plasma sjn~ing plus hot pressing. This alloy also contains a precipitate, whichis extremely stable at high temperatures (800 0 F), due to its insolubility in thealuminum matrix. In the absence of any fiber reinforcement the tensile strengthof this material at 70 0F, 400WF, and 6000 F is 20,000 psi, 18,000 psi, and 12,500psi respectively. These values can be compared with the strength obtained forI extruded rod of the same alloy: 20,000 psi, 12,000 psi, and 5400 psi respectively(Ref. 4.25). This comparison reveals that the p.ýasma sprayed material, probablydue to the finely dispersed microstructure developed by plasma spraying, hasmarkedly superior strength at elevated temperature as compared with the wrought
material. Composite strengths obtained, however, were not as high. Specimenscontaining apprcximately 50% 4.2 mil BORSIC failed at 6000 psi at 6000 F.
Figure 4.26 is a typical photomicrograph of the cruzi section of theBORSIC-SAP composites. The resultant transverse tensile strengths of 4.2 milBORSIC-SAP are given in Fig. 4.27. At 70 0 F, 300 0 F, and 6000 F, the compositefracture surfaces are primarily characterized by fiber splitting. At 900OFlevel the matrix is weaker than the fibers and composite failure occurs byiiatrix shear fracture. The strength level achieved at 600°F with the SAP ishigher than that obtained with 6061 (5000 psi), 8001 (6000 psi), or Al-Fe
80

(9000 psi) matrix composites tested previously under this program. Only the2024-T6 mnrtrix has achieved higher strength levels over the entire temperaturerange of up to 6000F. In the F condition, however, the 2024 matrix is alsoweaker than the SAP at elevated temperature. The SAP matrix is stronger afterlong-time exposure at the high temperatures compared tV the 2024-T6 at tempera-tures of 600°F and above due to the rapid overaging of the 2024 and the stabilityof the SAP. This matrix is the best of the dispersion hardened systems testedunder this program. The transverse strain to failure of the sintered aluminumpowder matrix composites is less than that of the other matrix alloy composites.At 70°F the strains to failure measured were 0.056% and 0.088%. This low levelof ductility makes these composites extremely sensitive to eccentric loadingduring testing.
Tensile specimens were also tested with the fibers aligned parallel
to the tensile axis. These tests were performed to insure that no fiber degra-dation was taking place during diffusion bonding at the above-mentioned conditions.The average tenstile strength of specimens containing 52% BORSIC was 168,000 psi.This strength level agrees well with those obtained for other 4.2 mil BORSIC-aluminum matrix composites and indicates that no fiber degradation is takingplace when the SAP matrix is used.
4.3.6 Transverse Fiber Properties
The fracture of 4.2 mil BORSIC-aluminum transverse tensile and com-pression specimens is associated with the failure of the reinforcing BORSIC fibersas described in the composite transverse strength results section. Failure offibers, at a composite stress level of 10,000-20,000 psi, is difficult toreconcile with axial fiber strengths on the order 400,000 psi. This observedbehavior is inconsistent with calculated fiber stress concentration factors, onthe order of 1.5 to 3.0 (Ref. 4.18), operating during transverse loading andsuggests that fiber strength is much lower in the transverse direction than theaxial direction. To better understand the fdilure of these composites, a testis required which can determine the transverse tensile strength of the anisotropicfibers. Unfortunately, it is not feasible to pull the BORSIC fiber in a directionperpendicular to its axis. Therefore, the test used to measure tensile strengthis actually a diametral compression test in wlich the material fails in tension(Refs. 4.26-33). This test permits tensile stresses to be placed on brittlematerials without the problems of traction gripping or the introduction of loadingeccentricities.
Experimental Method
The diametral compression test is performed by loading a right circularcylinder in compression diametrically between two flat platens. Under thisloading configuration tensile stresses are produced along the diameter connectingthe two loading regions in a direction normal to the compressive axis. Forthe test to be a valid tensile test the specimen must fail along the diametralplane that includes the two lines of contact betweer specimen and loading platens.In the ideal case of line contact between platens specimen, the tensilestresses o- generated on the loaded iiameter are uniform and calculable usingthe expression:
81

2PSD!
where P equals the applied load, D equals the cylinder diameter and 1 is thecylinder length. Unfortunately, for this ideal case there are compressive andshear stresses of extremely large magnitude developed at the contact loadingsurfaces which can cause material failure of an undesired nature. Inthe boron fiber, however, due to the residual stress pattern failure is initiatedfrom centrally located cracks.
The diametral compression test was used on 4.2 mil and 5.7 mil diameterBORSIC and 5.6 mil boron fibers by loading 0.5 in. long segments of fiber incompression between smooth tungsten carbide platens. Alignment was provided bya specially constructed jig which could be placed under the crosshead of aTinius-Olsen tensile testing machine. The load was applied at 0.01 in. per minute
and was found to increase in a linear manner with time until the loaded fibersuddenl~v fractured causing a single abrupt drop in load. The maximum load observedwas that used to calculate a tensile stress assumed to be responsible for failure.As with many high strength brittle materials, failure was usually accompaniedby zbattering of the entire specimen.
Results and Discussion
Figure .28 presents the strength distribution of 78 4.2 mil BORSICfiber specimens te ted in diametral compression. The distribution is skewedsharply to the lower strength with a mode of 30,000 psi. The main significanceof these data is that fibers can fail at the low strength levels indicated inthe figure. These values are far less than the tensile strengths of BORSICfibers tested in the axial direction (4oo,OCO-500,000 psi) and indicate thatthe strength of tLese 'ibers is anisotropic.
Figure 4.29 is a photograph of a fragment of ) .2 mil BORSIC fiber thatwas fractured during this series of tests. The frracture surface is along adiametral plane and very similar to that observed on fibers split in 900 com-posite tensile tests. This lends support to the analogy between the diametralcompression test and the failure of fibers in the tra ýzýqe tensile test.
One possible reason for the anisotropy of strength of 4.2 mil BORSICfibers mev be attributable to the existence of fiber flaws in orientations capableof reducin6 transverse strength. Such flaws have been observed in boron fibers(Ref. 4.34) and can be seen in the polished cross sections of BORSIC fibers. Theseflaws have been postulated to be the result of interfacial voids at the tungsten-boron interface of these fibers end the generation of residual stress patternsduring fiber manufacture (Ref. 424).
Figure 4.30 illustrates the effects such flaws or cracks would have onthe performance of fibers tested in diametral compression. A compression loadP is applied to the fiber generating a tensile stress q at right angles to theapplied load. A crack positioned as shown in the figure will cause the fiber
to fail at a stress oo. The magnitude of this stress would depend on the
82
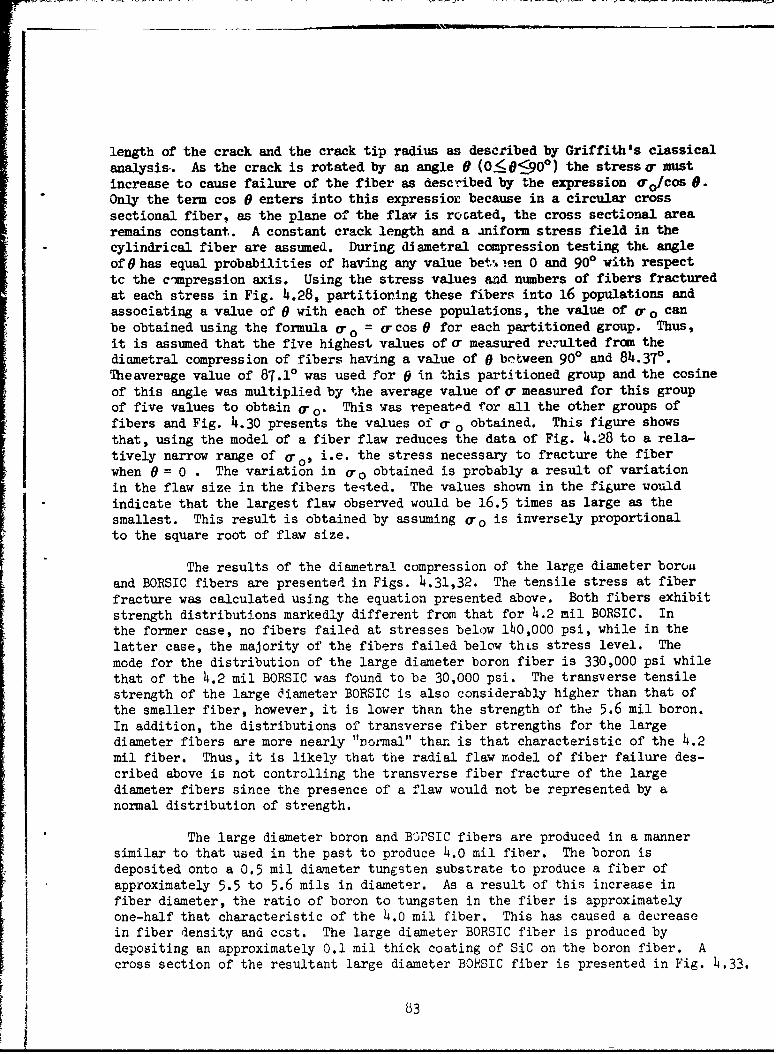
length of the crack and the crack tip radius as described by Griffith's classicalanalysis. As the crack is rotated by an angle 0 (0:!0900) the stressa mustincrease to cause failure of the fiber as described by the expression (o / Cos 0.Only the term cos 0 enters into this expressior because in a circular crosssectional fiber, as the plane of the flaw is rocated, the cross sectional arearemains constant. A constant crack length and a aniform stress field in thecylindrical fiber are assumed. During diametral compression testing th. angleof O has equal probabilities of having any value bet, •en 0 and 900 with respecttc the c-mpression axis. Using the stress values and numbers of fibers fracturedat each stress in Fig. 4.28, partitioning these fibers into 16 populations andassociating a value of 0 with each of these populations, the value of o*ro canbe obtained using the formula 0 o = crcos 0 for each partitioned group. Thus,it is assumed that the five highest values of u measured resulted from thediametral compression of fibers having a value of 0 bctween 900 and 84.370.Theaverage value of 87.10 was used for 0 in this partitioned group and the cosineof this angle was multiplied by the average value of r measured for this groupof five values to obtain (ro. This was repeated for all the other groups offibers and Fig. 4.30 presents the values of a o obtained. This figure showsthat, using the model of a fiber flaw reduces the data of Fig. 4.28 to a rela-tively narrow range of ao' i.e. the stress necessary to fracture the fiberwhen 0 = 0 . The variation in o-0 obtained is probably a result of variationin the flaw size in the fibers te.,ted. The values shown in the fi6ure wouldindicate that the largest flaw observed would be 16.5 times as large as thesmallest. This result is obtained by assuming Cro is inversely proportionalto the square root of flaw size.
The results of the diametral compression of the large diameter boruiiand BORSIC fibers are presented in Figs. 4.31,32. The tensile stress at fiberfracture was calculated using the equation presented above. Both fibers exhibitstrength distributions markedly different from that for 4.2 mil BORSIC. Inthe former case, no fibers failed at stresses below 1W0,000 psi, while in thelatter case, the majority of the fibers failed below thLs stress level. Themode for the distribution of the large diameter boron fiber is 330,000 psi whilethat of the 4.2 mil BORSIC was found to be 30,000 psi. The transverse tensilestrength of the large diameter BORSIC is also considerably higher than that ofthe smaller fiber, however, it is lower than the strength of the 5.6 mil boron.In addition, the distributions of transverse fiber strengths for the largediameter fibers are more nearly "normal" than is that characteristic of the 4.2mil fiber. Thus, it is likely that the radial flaw model of fiber failure des-cribed above is not controlling the transverse fiber fracture of the largediameter fibers since the presence of a flaw would not be represented by anormal distribution of strength.
The large diameter boron and BjPSIC fibers are produced in a mannersimilar to that used in the past to produce 4.0 mil fiber. The boron isdeposited onto a 0.5 mil diameter tungsten substrate to produce a fiber ofapproximately 5.5 to 5.6 mils in diameter. As a result of this increase infiber diameter, the ratio of boron to tungsten in the fiber is approximatelyone-half that characteristic of the 4.0 mil fiber. This has caused a decreasein fiber density and ccst. The large diameter BORSIC fiber is produced bydepositing an approximately 0.1 mil thick coating of SiC on the boron fiber. Across section of the resultant large diameter BOSIC fiber is presented in Fig. 4.33.
83

The larger ratio of boron to tu 1 ±gsten for the large diameter fibersmay be of importance ii. both the axial and transverse tensile strengths of thefiber. Wawner (Ref. 4.26) has pointed out that the removal of boride core of aboron fiber caused a marked increase in fiber strength. Similarly, Adler (zief.4.27) has shown, on the basis of the magnitude of residual stresses developeddue to core reaction during fiber fabricaticn, that the transverse splittingtendency of boron fibers should decrease with increasing fiber diameter.
4.3.7 BCRSIC-Alum:num-Stainless Steel Composites
ExRerimental Method
Specimens were prepared with stainless steel fiber reinforcement atright angles to the 4.2 mil BORSIC fiber axis. These specimens were preparedby hot press diffusion bonding pldsma sprayed tapes of AFC-77 stainless steelfiber with tapes of BORSIC-6061 aluminum. The stainless steel fiber tapes weremade by winding 0.002 in. diameter fiber onto a mandrel covered with 0.001 in.thick 6061 alloy foil and plasma spraying a coating of the same alloy. The amountof stainless steel fiber in the resultant composite could be adjusted to anydesired level by controlling the number of stainless steel reinforced layershot pressed into the composite. The stainless steel fibers used had an as-drawnstrength of 463,000 psi,
Results and Discussion
Composites containing 6% volume fraction 0.002 in. diameter AFC-77stainl.ess steel fibers orientcd at 9g0 to 46% volume fraction BORSIC fiber ina 6061 matrix were testea. The tensile strength of these composites was 41,000psi at room temperature when tested parallel to the stain ess steel fiber axis.The elastic modulus for this same orientation uas 23 x 10 psi and the strainto fracture 1.14%. Figure 4.34 illustrates an interesting feature of thesecomposites. The figure is a radiograph of a steel reinforced 4.2 mil BORSIC-t.luinum specimen that has beer tensile tested along the steel fiber axis. Manyof the BORSIC fibers in the area radiographed have split longitudinally alongtheir axes. This area is not near za-e composite fracture surface and thus indi-cate- that the presence of the stai.nress steel fibers permits fiber splittingwithout crack propagation to a greater extent than that detected in compositeswithout the steel wires. Transverse tensile tests were also performed at 400 0 F,600°F, and 900°F on these composites. The results of these tests are presentedin Fig. 4.35. The values of ultimaue tensile strength obtained offer significantimprovement over those currently attainable in 4.2 mil BORSIC-aluminum. Thisis particularly true at the elcvated temperatures where the excellent hightemperature properties of the AFC-77 wires are of importance. Tensile test resultshave been obtained by testing BORSIC-aluminum stainless steel composites in adirection parallel to the BORSIC fibers. Composites containing 40% by volume4,2 mil BORSIC fiber parallel to thf, tensile axis and 6% steel fiber transverseto the tensile axis failed at a stress of 126,000 psi (average of six tests).This ultimate tensile strength would indicate no significant loss of compositestrength in the BORSIC fiber direction due to the addition of the steel fibers.
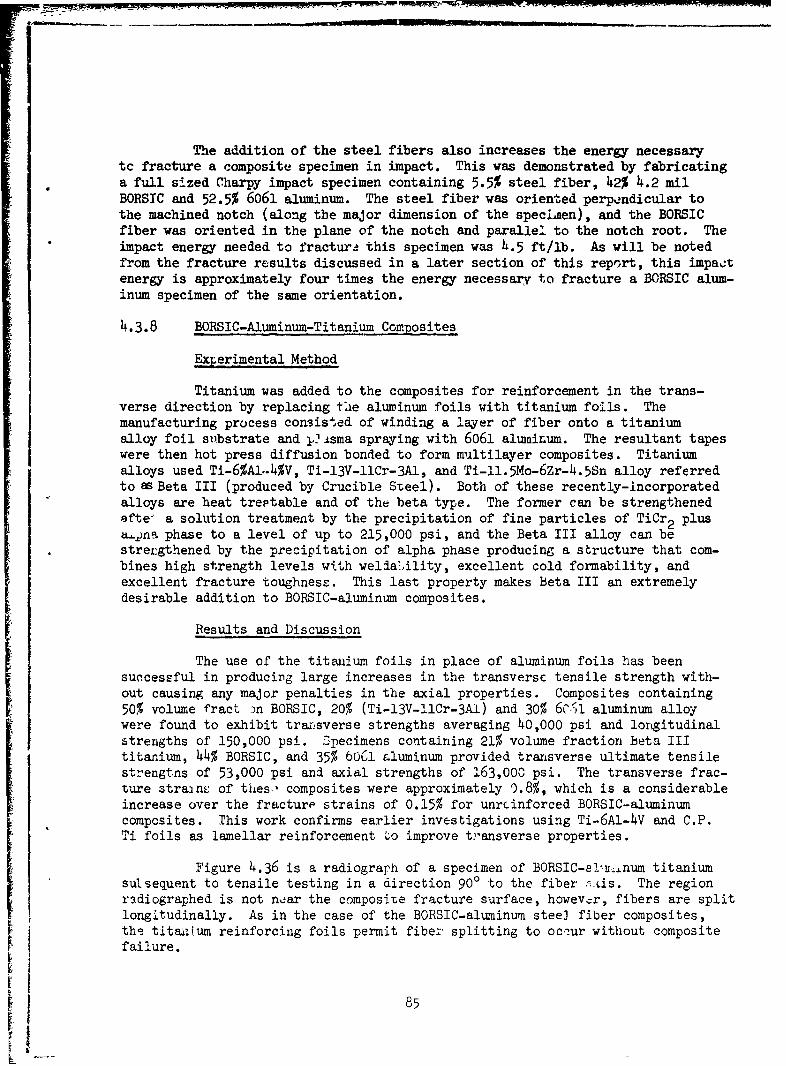
The addition of the steel fibers also increases the energy necessarytc fracture a composite specimen in impact. This was demonstrated by fabricatinga full sized Charpy impact specimen containing 5.5% steel fiber, 42% 4.2 milBORSIC and 52.5% 6061 aluminum. The steel fiber was oriented perpendicular tothe machined notch (along the major dimension of the speciaen), and the BORSICfiber was oriented in the plane of the notch and parallel to the notch root. Theimpact energy needed to fractur! this specimen was 4.5 ft/lb. As will be notedfrom the fracture results discussed in a later section of this report, this impac:tenergy is approximately four times the energy necessary to fracture a BORSIC alum-inum specimen of the same orientation.
4.3.8 BORSIC-Aluminum-Titanium Composites
Exnerimental Method
Titanium was added to the composites for reinforcement in the trans-verse direction by replacing tie aluminum foils with titanium foils. Themanufacturing process consisted of winding a layer of fiber onto a titaniumalloy foil substrate and 1 .tsma spraying with 6061 alutninum. The resultant tapeswere then hot press diffusion bonded to form multilayer composites. Titaniumalloys used Ti-6%Al..4%V, Ti-13V-IICr-3AI, and Ti-ll.5Mo-6Zr-4.5&n alloy referredto asBeta III (produced by Crucible Steel). Both of these recently-incorporatedalloys are heat treetable and of the beta type. The former can be strengthenedsfteý a solution treatment by the precipitation of fine particles of TiCr 2 plusa•t.na phase to a level of up to 215,000 psi, and the Beta III alloy can bestretngthened by the precipitation of alpha phase producing a structure that com-bines high strength levels with weldability, excellent cold formability, andexcellent fracture toughness. This last property makes Beta III an extremelydesirable addition to BORSIC-aluminum composites.
Results and Discussion
The use of the titeadum foils in place of aluminum foils has beensuccessful in producing large increases in the transversc tensile strength with-out causing any major penalties in the axial properties. Composites containing50% volume fract Dn BORSIC, 20% (Ti-13V-1lCr-3A1) and 30% 6C.'1 aluminum alloywere found to exhibit trarsverse strengths averaging 40,000 psi and lorgitudinalstrengths of 150,000 psi. Specimens containing 21% volume fraction Beta IIItitanium, 44% BORSIC, and 35% 6061 &luminum provided transverse ultimate tensilestrengtns of 53,000 psi and axial strengths of 163,000 psi. The transverse frac-ture strasnL of thesýý composites were approximately 0.8%, which is a considerableincrease over the fracture strains of 0.15% for unrcinforced BORSIC-aluminumcomposites. This work confirms earlier investigations using Ti-6Al-4V and C.P.Ti foils as lamellar reinforcement 'o improve transverse properties.
Figure 4.36 is a radiograph of a specimen of BORSIC-a1sir':.num titanium
sulsequent to tensile testing in a direction 900 to the fiber ;odis. The regionradiographed is not near the composite fracture surface, however, fibers are splitlongitudinally. As in the case of the BORSIC-aluminum steel fiber composites,the titaasium reinforcing foils permit fiber splitting to occur without compositefailure.
85
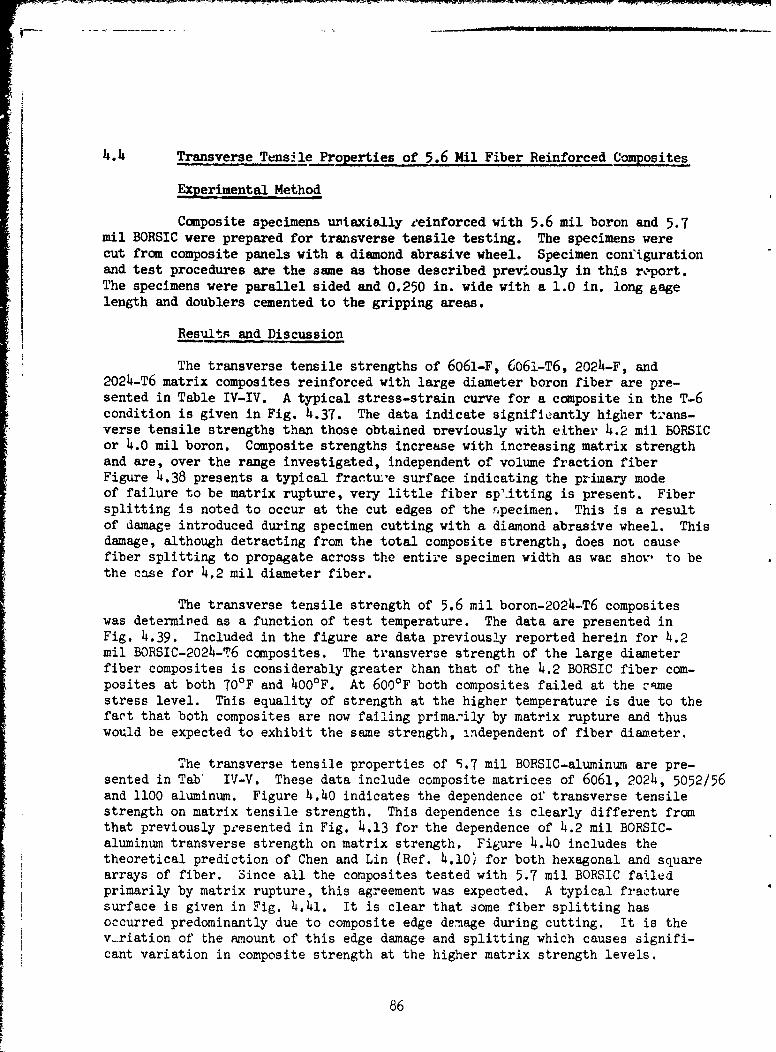
, • • -, - •. - • •- - . • •- • • .- .• •. . .. . - • - • _ . , . . jT , 7 . r , , ,.. -.. , .
4.4 Transverse Tensile Properties of 5.6 Mil Fiber Reinforced Composites
Experimental Method
Composite specimens uniaxially reinforced with 5.6 mil boron and 5.7mil BORSIC were prepared for transverse tensile testing. The specimens werecut from composite panels with a diamond abrasive wheel. Specimen configurationand test procedures are the same as those described previously in this report.The specimens were parallel sided and 0.250 in. wide with a 1.0 in. long gagelength and doublers cemented to the gripping areas.
Results and Discussion
The transverse tensile strengths of 6061-F, 6061-T6, 2024-F, and2024-T6 matrix composites reinforced with large diameter boron fiber are pre-sented in Table IV-IV. A typical stress-strain curve for a composite in the T-6condition is given in Fig. 4.37. The data indicate significantly higher tlans-verse tensile strengths than those obtained previously with either 4.2 mil BORSICor 4.0 mil boron. Composite strengths increase with increasing matrix strengthand are, over the range investigated, independent of volume fraction fiberFigure 4.38 presents a typical frantuL'e surface indicating the primary modeof failure to be matrix rupture, very little fiber sp'.itting is present. Fibersplitting is noted to occur at the cut edges of the specimen. This is a resultof damage introduced during specimen cutting with a diamond abrasive wheel. Thisdamage, although detracting from the total composite strength, does not causefiber splitting to propagate across the entire specimen width as was show, to bethe case for 4.2 mil diameter fiber.
The transverse tensile strength of 5.6 mil boron-2024-T6 compositeswas determined as a function of test temperature. The data are presented inFig. 4.39. Included in the figure are data previously reported herein for 4.2mil BORSIC-2024-T6 composites. The transverse strength of the large diameterfiber composites is considerably greater than that of the 4.2 BORSIC fiber com-posites at both 70OF and 400 0 F. At 600OF both composites failed at the c~mestress level. This equality of strength at the higher temperature is due to thefact that both composites are now failing prima&ily by matrix rupture and thuswould be expected to exhibit the same strength, independent of fiber diameter.
The transverse tensile properties of 5.7 mil BORSIC-aluminum are pre-sented in Tab IV-V. These data include composite matrices of 6061, 2024, 5052/56and 1100 aluminum. Figure 4.40 indicates the dependence of transverse tensilestrength on matrix tensile strength. This dependence is clearly different fromthat previously peesented in Fig. 4.13 for the dependence of 4.2 mil BORSIC-aluminum transverse strength on matrix strength. Figure 4.40 includes thetheoretical prediction of Chen and Lin (Ref. 4.10) for both hexagonal and squarearrays of fiber. Since all the composites tested with 5.7 mil BORSIC failedprimarily by matrix rupture, this agreement was expected. A typical fracturesurface is given in Fig. 4.41. It is clear that some fiber splitting hasoccurred predominantly due to composite edge de-nage during cutting. It is thevw.riation of the amount of this edge damage and splitting which causes signifi-cant variation in composite strength at the higher matrix strength levels.
86

Larger observed amounts of splitting are associated with lover strengths. largemounts of dimpling of the aluminum plasma spray and foil indicate significantmounts of local plastic deformation taking place during failure. Only slightindications of fiber-matrix debonding occurred.
Figures 4.42,43 contain typical .tress strain curves for transversetensile testing of 5.7 mil BORSIC 6061-T6 and 1100 aluminum. Outstanding featuresof these curves are the high tensile strength of' tbzh former and the exceptionallylarge sti in ,o failJ~re of the latter. The transverse tensile strain to failurewas obsei rod t, increase with increasing matrix ductility and decreasing volv-nefraction fiber. The highest strain to failure, approximately 0.6% for 54%fiber reinforcement, was obtained for the 1100 matrix aluminum composi.tes. Thislevel of failure strain is of particular significance because it is aprroxi-mately equal to the composite axial tensile failure strain. Thls, the 1100 matrixcomposite is not anisotropic in its failure strain, a point that mey have t.ppre-ciable significance in appli-!ations where cross ply layips are usd.
"&he variation of composite transverse tensile strength with volumefraction fiber is presented in Fig. 44.4. The data, for a 6061 matrix system,indicate that composite strength is substantially independent of matrix stren.gth.Variations in composite strength do occur, as was pointed out earlier, due tovariations in split fiber degree as a result of edge damage. The higiest valueof strength obtained was 44,000 psi for a composite tested in the T-o condition.This is higher than the strength usually obtained for heat treated foi. plusplasma spray matrices. It is, however, approximately equal to that obtained forwrought 6061-T6 material and may thus just reflect variations 4i efficiency ofcompositc heat treatment. Dependence on volume fraction fiber is far differentfrom that exhibited by 4.2 mil fiber composites where compos'te strength increasedwith decreasing fiber content. The above described independence of strengthwith fiber content has been predicted (Ref. 4.11).
The dependence of transverse elastic modalu• on volume fraction fiberiL presented in Fig. 4.45. This relationshi.p ic similar to that exhibited by4.2 mil BORSIC reinforced canpc.,ites and agreement with theoretical predictionis excellent.
The dependence of c mposite transverse tensile strength on test tempera-ture is presented in Fig. 4.4, for 6061 matrix composites. At all test temperaturesthe composite strength is very nearly equal to the matrix strength a. givenin Fig. 4.47. Matrix failure was observed at all temperatures.
The composite transverse tensile strengths obtained using severaldifferent types of boron and BORSIC fibers as well as silicon carbide fiberare presented in Fig. 4.48. All of these composites were fabricated at UnitedAircraft Research Laboratories using 2024 aluminum alloy plasma sprayed tapes.The comparison of strengths reveals that several different fibers can providecomposite strengths in excess of 40,000 psi. These high strength compositesexhibited only small amounts of fiber splitting. Fibers that did undergo con-siderable fiber splitting, 4.0 mil boron and 4.2 mil BORSIC, provided considerablyweaker composites.
87

4.5 Titanium Matrix Composites
BORSIC fiber reinforced titauim matrix composites have teen fabri-cated and tested during this program because of their significance forapplication with long time exposures at temperatures in excess of 5000 F. ThesecompoRites will be shown to bave significant advantages over monolithic titaniumin terms of both axial and transverse elastic modulus as well as axial tensilestrength. On a specific (property divided by material density) basis theseadvantages will be even greater.
Experimental Method
Composite fabrication was carried out using polystyrene (fugitivebinder) bonded t~pes and the hot press diffusion bonding procedure. Tapeswere fabricated by winding the fiber over titanium foil and spraying with apolystyrene-xyleu,. mixture which hardened to bond fiber and foil together.Diffusion bonding was performed in a two stage process. The f,,gitive binder wasremoved by holding the composite "lay up" at 450 0C for 30 minutes. The secondstage of the procedure was the diffusion bonding of the composites for 30-60minutes at elevated temperature, 750-870 0 C, at pressures of from 10-15 x '103 psi.The diffusion bonding was performed in vacuum of approximately 5 x 10⁻⁶ torr.
The materials used in composite fabrication included both 4.2 mil and5.7 mil diameter BOR3IC fiber. Matrices of commerciai purity (75A) titanium,Ti-6AI-4V and 3eta III titanium were used. The Beta III titanium is a CrucibleSteel alloy havink e. composition of 11.5% Mo, 6.0% Zr, 4.5 % Sn and is notedfor its high strength, superior fracture toughness and excellent cold formability.
Unidirectionally reinforced tenaiie specimens were prepared and testedat both 00 and 900 to the fiber axis. The specimens were parallel sided.Aluminum doublers were bonded onto the specimens for gripping, leaving 1.0 in.to 1.5 in. long gage lengths. Specimen mounted extensometers and strain gageswere used to m,-asure modulus and strain to failure. Tests performed at elevatedtemperature, as well as those performed at room temperature, were in air with20 minutes at temperature prior to testing allotted for system thermal equilibriumto be achieved.
Measurements of elastic modulus were made at elevated temperature
using the free-free beam technique previously described in section 4.2.
Results and Discussion
The resuLts of the tensile testing of 4.2 mil BORSIC reinforced speci-mens are presented in Tatit IV-VI. Mechanical data as well as hot pressingtemperatur are given for each specimen. The hot pressing parameters givenfor each composite system were chosen after several hot pressings had been per-formed under varied conditions to establish the best pressing conditions. Axialtensile strengths of up to 180,000 psi were achieved with axial elasUi2 moduliin excess of twice those of the monolithic titanium alloys. Transverse tensilestrengths were considerably lower, approximately 31,000 psi. This low trans-verse strength was associated with largf -amounts of fiber splitting on the
88

composite fracture surfaces. As was shown in the case of aluminum matrixcomposites, this mode of fiber failure can severely limit composite strength.
Both axial and transverse elastic moduli were higher than those ofthe unreinforced titanium matrices. "The axial composite moduli agree wellwith rule of mixtures predictiong based on constituent material's moduli of58 x 10 psi for BORSIC, 11 x 10 psi for full annealed and furnace cooledBeta III titanium (Ref. 4.28), and 15 x 106 psi for commercially pure titanium.Transverse elastic moduli also agree well with theoretical predictions (Refs.4.10,11) and, due to the low elastic modulus of the Beta III matrix, arenearly equal to those obtained for aluminum.-BORSIC composites as presented insection 4.2. The comparison of titanium-BORSIC composite elastic modili withmonolithic titanium moduli io further increased in favor of the compositeswhen these properties are compared on a Lpecific or modulus over density basis.The density of titanium containing 50% by volume BORSIC is 20% less than thedensity of the matrix alune.
Tho axial elastic mLdulus of Beta Ili-BORSIC composites was determinedas a function of test temperature by the free-free beam technique. The data,presented in Fig. 4.49, indicatg that the modulus decreases from a value of35 x 10 psi at 70°F to 31 x 10" psi at 12000 F. The composite elastic modulusis much less sensitive to temperature than most monolithic titanium alloys.
The tensile test data for composites fp• Leated using 5.7 mil BORSICare presenteu in Table JV-VII. Only the Ti-6t .- 4V matrix was used due to alack of Beta III alloy foil of the thickness needed to produce composites withnearly 50% fiber content. Both the axial and transverse composite strengthsare superior to those obtained with the 4.2 mil fiber. The axial strengthswere, in every case but one, superior to that of the unreinforced matrix. Theone exception, bonded at 7500C, was lower in strength due to the presence oflarge amounts of fiber breakage in the composite after fabrication. Thebonding temperature was too low to permit the titanium to distribute the hotpress load uniformly throughout the composite. Pressing at the higher tempera-tures alleviated this problem.
The transverse tensUl• strength of the 5.7 mil BORSIC composites issuperior to that of the 4.2 rmil fiber composites due to the lack of fibersplitting in the larger diameter fiber: specimens. The composite mode of failurewas altered to one consisting primarily of matrix and fiber-matrix interfacialrupture. These modes of failure predominated over the entire temperature rangeinvestigated, 70-10000 F. The transverse composite tensile strength at 1000'Fwas still up to 33,000 psi.
The axial and transverse composite tensile fracture strains noted inTable IV-VII are approximately 0.5% anO 0.38% respectively. The lack of amajor difference between these values (for BOCSIC-aluminum the difference isnearly a factor of two for most matrix alloys) may be of importance if crossply composite configurations are (Osired. A large transverse failure straincan prevent 900 Fly failure prior .o toLal composite failure.
89

The transverse elastic modulus of the 5.7 ril fiber composites wasgreater than that reported in Table IV-VI for 4.2 mil fiber composites. Thisdifference is not due, however, to the change in fiber diameter but rather toan accompanying change in matrix composition. The Ti6/4 matrix used for thelarger fiber composites, has a modulus of approximately 16 x 106 •si as com-pared to that reported previously for the Beta III alloy, 11 x 10o psi.
A Charpy impact specimen of Ti-6A1-4V containing 59% 5.7 mil BORSICwas impact tested aT room temperature. The impact strength of this specimenwas 436 in.-lbs/in. 2 .
4.6 Conclusions
1. The transverse elastic modulus of BORSIC-aluminum composites issensitive to the degree of composite consolidation and bonding and thus canbe used as a measure for determining the integrity of these composites.
2. The dependence of transverse elastic modulus on constituentmaterial properties and coMposite morphology is well described by existingformulations. These include the work of Chen and Lin, Adams and Tsai, andAdams and Doner.
3. The transverse tensile strength and transverse tensile failurestrain of BORSIC-aluminum composites can be severely limited by low fibeitransverse tensile st-rength.
4. The 5.6 mil boron and 5.7 mil BORSIC fibers have a significantlyhigher transverse tensile strength than 4.0 mil boron and 4.2 mil BORSIC.These higher fiber strengths have resulted in higher composite transversestrengths and failure strains for the large diameter fiber containing composites.
5. BOPSIC--aluminum composites, having heat treatable aluminum alloymatricee can be significantly strengthened in the transverse orientation byheat treatment.
6. The dependence of the transverse tensile strength of LJF$SIC andboron aluminum composites on constituent material properties an' -omposJtestructure is well described by the analysis of Chen and Lin, when longitudinalfiber splitting is not taking place. In the presence of fiber splitting, thecomposite strength can be calculated on the basis of a reduction in effectivecomposite cross sectional area due to fiber failure.
7. Composite and fiber edge condition can severely effect thestrength of transverse tensile specimens.
8. Radiographic techniques, which reveal the condition of the boronfiber core, provide a useful nondestructive inspection method for the examinationof boron aluminum composite condition.
90

9. The addition of transverse reinforcements such as stainless steelfibers and titanium foils increase composite transverse strength significantly.
10. Dispersion hardened aluminum matrices such as sintered aluminumpowder provide BORSIC-aluminum composites with superior elevated temperaturestrength and microstructural stability.
11. BORSIC reinforced titanium matrix composites exhibit elasticmoduli and strength significantly superior to those of monolithic titaniumalloys.
91

SECT'TCX iV- REFERENCES
1. J. K. Mackenzie, "The Elastic Constants of a Solid Containing SphericalPoles", Proc. Roy. Soc., 63B, 2, 1950.
2. R. L. Coble and W. D. Kingery, "Effect of Porosity on Physical Propertiesof Sintered Alumina", J. Am. Cer. Soc., Vol. 39, p. 377, 1956.
3. E. M. Breinan and K. G. Kreider, "Axial Creep and Stress Rupture of BoronAlmninum Composites", Metallurgical Trans., Vol. 1, Jan. 1970.
4. M. BTsche, F. Galasso, and R. Fanti, "Preparatiorn and Properties of SiliconCerbide Coated Fibers", Fiber Science and TechnoiLgy, Vol. 1, p. 19, 1968.
5. D. Hartog, Mechanical Vibration, McGraw Hill, 1956.
6. S. Spinner and R. Valore, J. of Research of the National Bureau of Std.,Vol. 6, p. 459, 1958.
7. S. Spinner, Reichard and Tefft, J. of Research of the National Bureau ofS~td., Vol. 64A, p. 147, 1960.
8. S. Spinner and G. W. Cleek, J. of App. Phys., Vol. 31, p. 1407, 1960.
9. H. J. Stokes, J. of Scientific Inst., Vol. 37, p. 117, 1960.
10. P. E. Chen and J. M. Lin, "Transverse Properties of Fibrous Composites",Materials Research and Standards, p. 29, August 2169.
11. D. F. Adams and D. R. Doner, "Transverse Normal Loading of a UnidirectionalComposite", J. Composite Materials, Vol. 1, p. 152, 1967.
12. D. Adams, S. Tsai, J. Comp. Materials, 368, 1969.
13. A. Zecca, D. Hay, J. Comp. Materials, 556, 1970.
14. J. Ashton, J. Halpin and P. Petit, "Primer on Composite Materials Analysis',Tcchnomic Press, 1969.
15. K. R. Van Horn, "Aluminum", American Society f~r Metals, Vol. 2, 1967.
16. A. Metcalfe and G. Schmitz, Gas Turbine Conference, Cleveland, March 1969.
17. E. Ellison and D. Boon, J. of Less Common M-tals, Vol. 13, p. 103, 1967.
18. D. Adams, "Inelastic Analysis of a Unidirectional Composite Subjected toTransverse Normal Loading", J. Com. Materials, Vol. 4, p. 310, 1970.
19. K. Kreider and M. Marciano, "Iechanical Properties of BORSIC-ALuminirnComposites", Trans. AIME, Vol. 243, p. 1279, 1969.
92

SECTION IV - REFERENCES (Cont'd)
20. J. Cnristian and J. D. Forest, "Development and Application of HighMatrix Strength Al-Boron", ASM Tech. Report No. P9-55.2.
21. I. Toth, "Tensile and Fatigue Behavior of Boron Reinforced AluminumComposites", Presented at Spring 1970 AII4E Meeting.
22. C. W. Rogers, AFML Contract AF33(615)-527, Seventh Quarterly Report,March 1968.
23. R. J. Towner, "Atomized Powder Alloys of Aluminum", Metals Progress,p. 70, May 1968.
24. E. Schiel and Y. Masuda, "Uber das eutektische Gefuge von Al-Cu undAl-Fe Legierungen bei starken Unterkuhlungen", Aluminum, p. 51, Feb. 1955.
25. P. L. Mehr, Private Correspondence, Alcoa Research Laboratories, NewKensington, Pa.
26. F. E. Wawner, Modern Composite Materials, edited by Broutman and Crock,
Addison-Wesley, 1967.
27. R. Adler and Hammond, App. Fhys. Letters. 14 354, 1969.
'8. V. Peterson, et al, AIAJA Paper No. 68-976, and Crucible Steel Data Sheet.
93
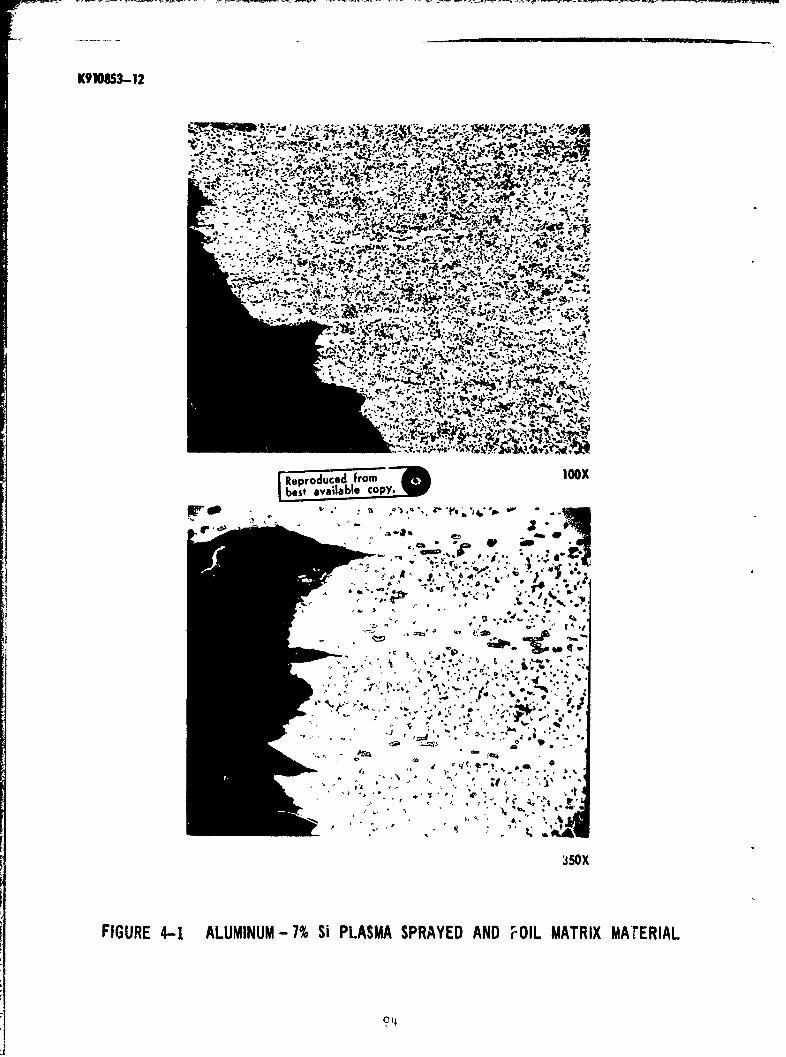
K910853-12
4%:,~'~~ % ,..~w
)~ ~ K9.
"E: Reproduced from *.o'
best' ýovuai.ap.lcopI'
4.~ ~ -. 1..~. 4
3box
94.
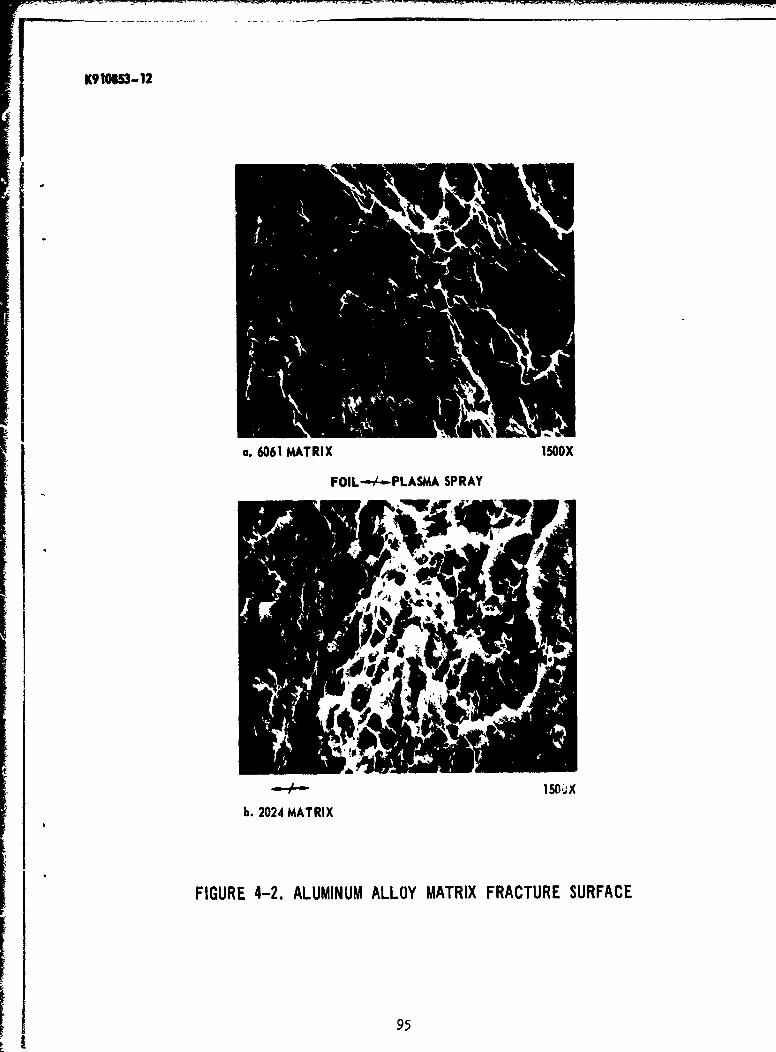
K910853-12
a. 6061 MATRIX 150OX
FOIL--4.-PLASMA SPRAY
-a-,-.1 50,.-b. 2024 MATRIX
FIGURE 4-2. ALUMINUM ALLOY MATRIX FRACTURE SURFACE
95
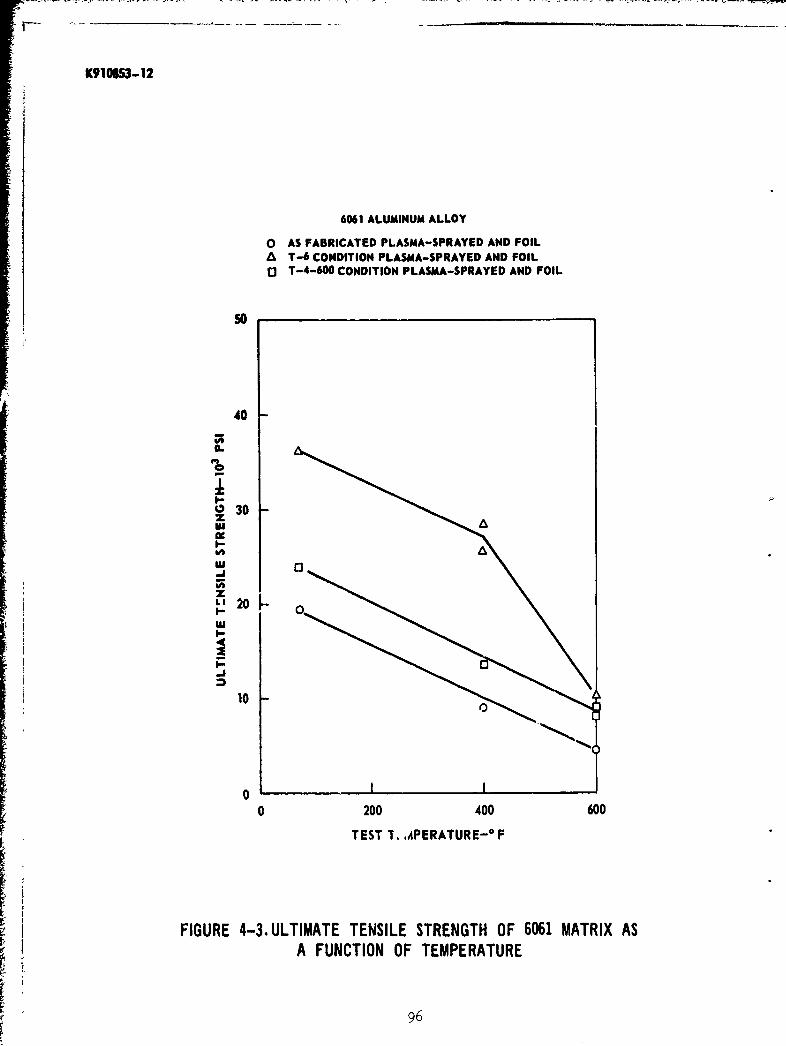
K910853-12
6061 ALUMINUM ALLOY
O AS FABRICATED PLASMA-SPRAYED AND FOIL& T-6 CONDITION PLASMA-SPRAYED AND FOILo T-4-600 CONDITION PLASMA-SPRAYED AND FOIL
so
40
IL
130
I-•
o-I
z
0 200 2020400 600
TEST T. ,APERATURE- 0 F
FIGURE 4-3. ULTIMATE TENSILE STRENGTH OF 6061 MATRIX ASA FUNCTION OF TEMPERATURE
96
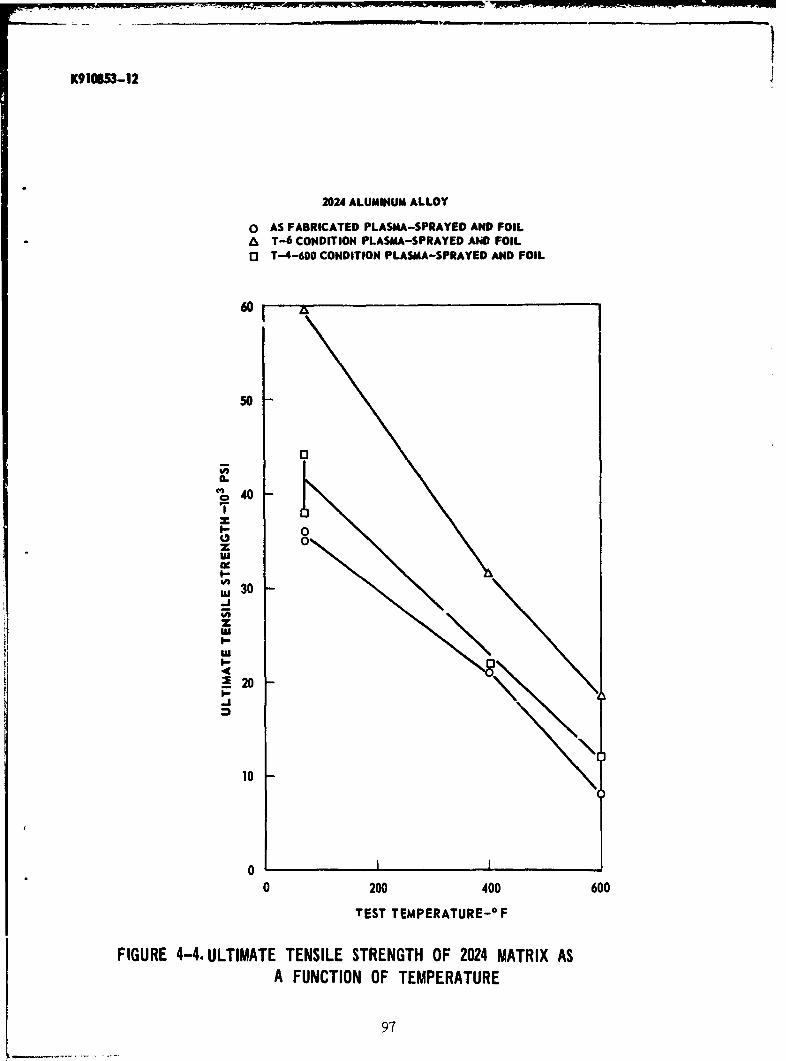
K910853-12
2024 ALUMINUM ALLOY
O AS FABRICATED PLASMA-SPRAYED AND FOILA T-6 CONDITION PLASMA-SPRAYED AND FOILo3 T-4-600 CONDITION PLASMA-SPRAYED AND FOIL
60 ,
50
00o 40
T00zI--
w 30
-J
z
~20
10
0I I0 200 400 600
TEST TEMPERATURE- 0 F
FIGURE 4-4. ULTIMATE TENSILE STRENGTH OF 2024 MATRIX ASA FUNCTION OF TEMPERATURE
97

K910a53-12
25 r
20-
E22154
106 PSI
5I0
0 10 20 30 40 50 60
VOLJME FRACTION 4.2 MIL BORSIC-%
FIGURE 4-5. COMPOSITE TRANSVERSE ELASTIC MOrnULUS
98
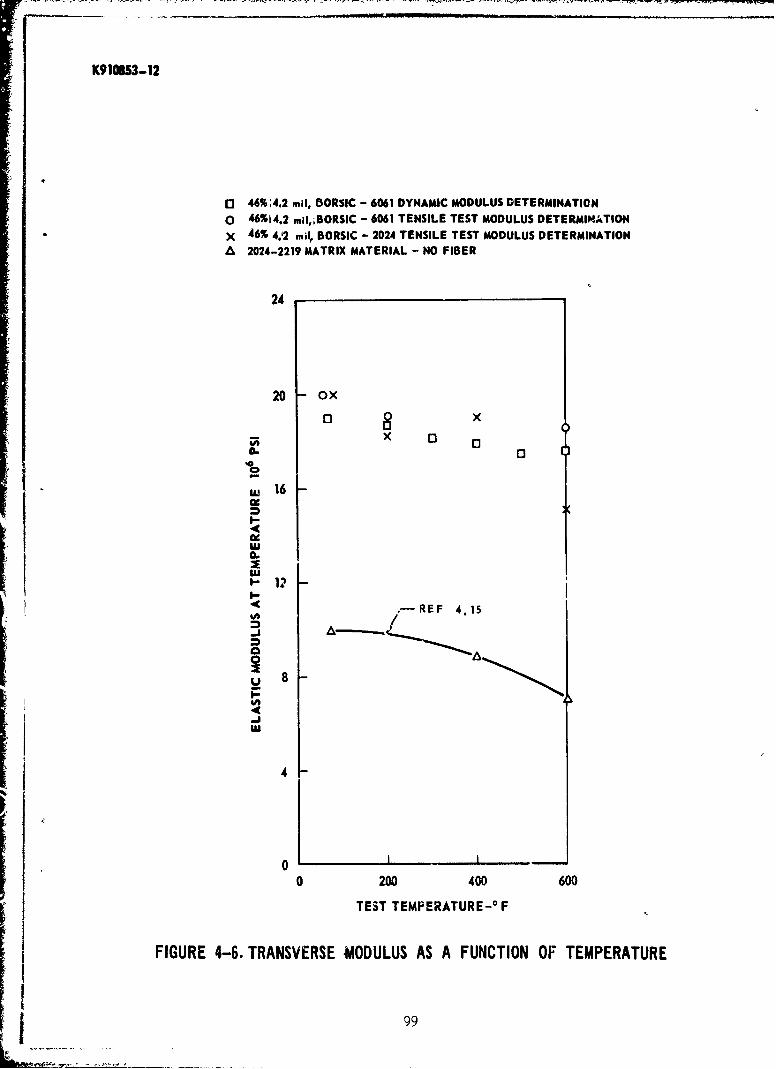
K910B53-12
o3 46%;4.2 mil, BORSIC - 6061 DYNAMIC MODULUS DETERMINATIONO 46%14.2 mil,;BORSIC - 6061 TENSILE TEST MODULUS DETERMIMATIONX 46% 4.12 miil, BORSIC - 2024 TENSILE TEST MODULUS DETERMINATIONA 2024-2219 MATRIX MATERIAL - NO FIBER
24
20 OX
x -0. 0
10
I- ,16
lu
-12
,-REF 4.15
0/
us
0200 400 60
TEST TEMPERATURE-° F
FIGURE 4-6. TRANSVERSE MODULUS AS A FUNCTION OF TEMPERATURE
09
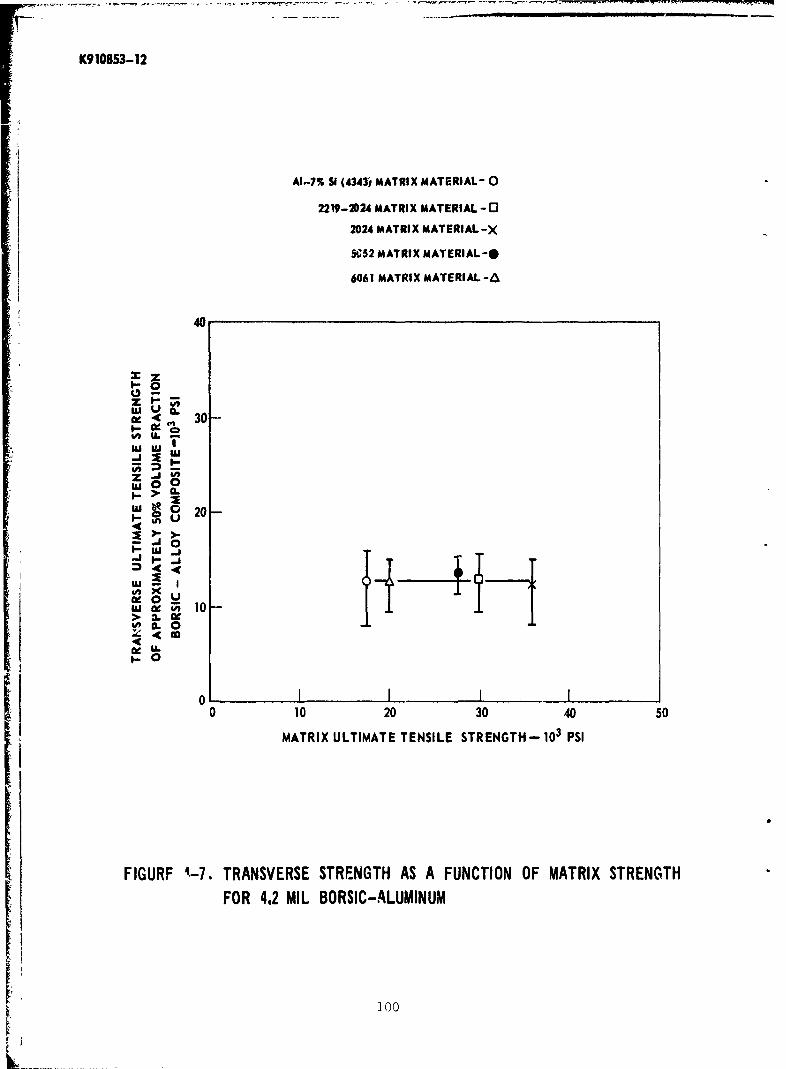
K910853-12
AI-% SI (43431 MATRIX MATERIAL- 0
2219-2D24 MATRIX MATERIAL- O1
2024 MATRIX MATERIAL-X
51452 MATRIX MATERIAL -0
6061 MATRIX MATERIAL-A
40
1--0
w ULad 4( 30-
in = I.-
X J1
200
0~1
wcc 100
> .
0 020 30 40 50
MARXULTIMATE TENSILE STRENGTH- 103 pSI
FIGURF 1-7. TRANSVERSE STRENGTH AS A FUNCTION OF MATRIX STRENGTHFOR 4.2 MIL BORSIC-ALUMINUM
l00

K910653-12FIG. M-12
'Al
I Reproduced from •36X
FIGURE 4-8. FRACTURE SURFACE OF A 50 % VOLUME FRACTION 4.2 MIL BORSIC®-6061 COMPOSITE 90* TENSILE SPECIMEN
101
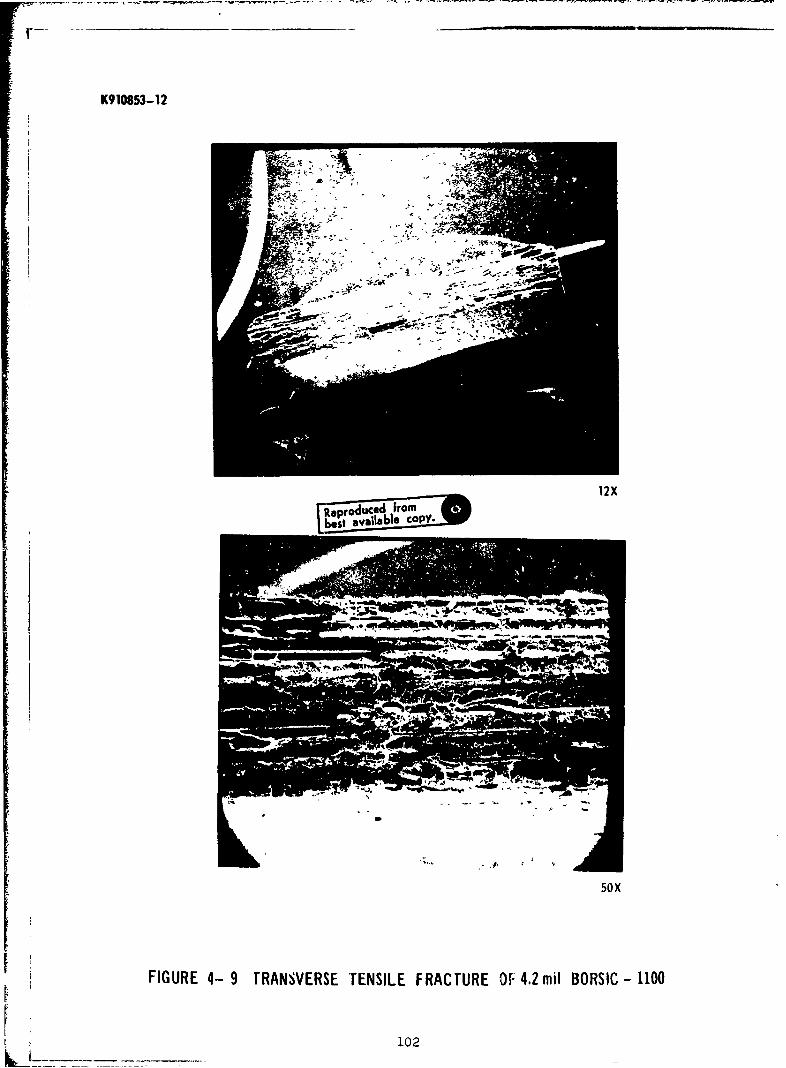
K910853-12
1 2X..... romw
be I vailble COPY-
50 X
FIGURE 4- 9 rRANSVERSE TrENSILE FRAcrURE OF~ 4.2 mit BORSIC - 1100
102

K910S53-12
24
T-6 CONDITION -
"16- F-CONDITION
IL
to12-w
8-
4-
0 4 8 12 16 20 24
STRAIN-10-4 IN./IN.
FIGURE 4-10. 46 v/0 4.2 MIL BORSIC - 6061 ALUMINUM 900 TENSILE STRESS STRAIN CURVES
103

K910Ss3-12
46% VOL. FRACTION BORSIC - 6061 AL ALLOY
0 AS FABRICATED CONDITIONA T-6 CONDITION
24
S16"
z 01,
A.
w0
> 0
x
'U
m
,II
Wi'
0-
0>4zI-
0
TEST TEMPERATURE-° F
FIGURE 4-11 TRANSVERSE TENSILE STRENGTH OF 4.2 MII. BORSIC-6061 ALUMINUMAS A FUNCTION OF TEST TEMPERATURE
'Uo
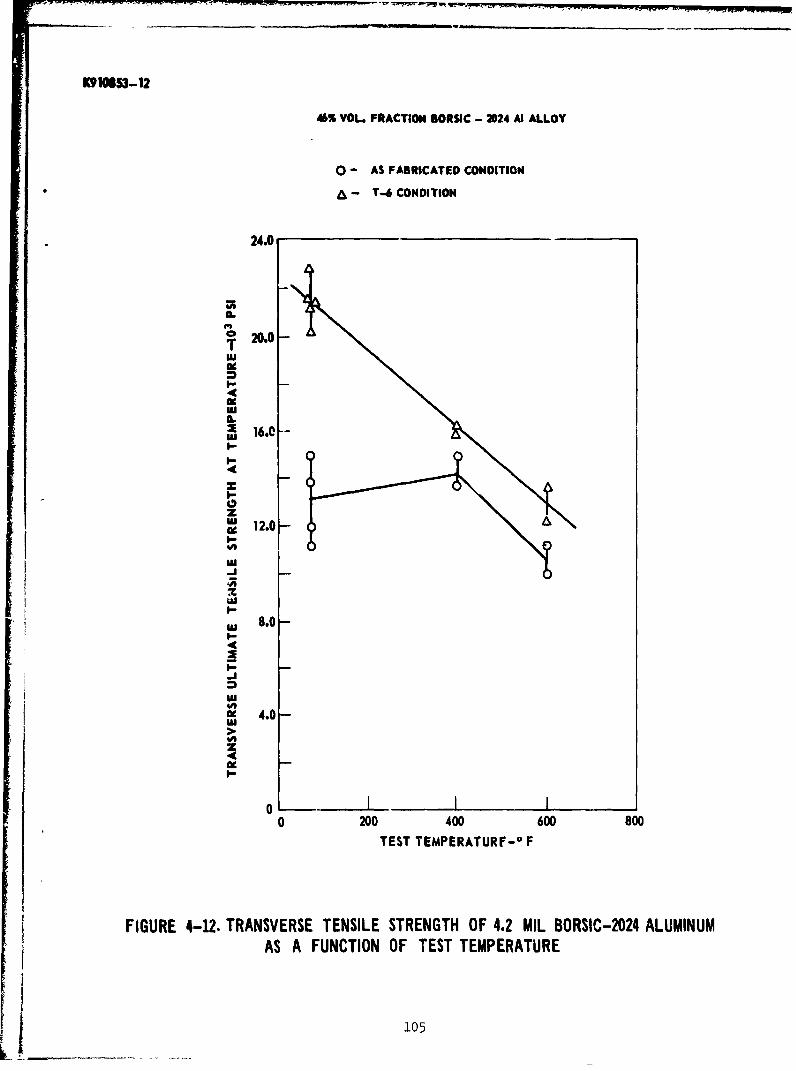
- . ''.i.I, il "-.
K90=53-12
46% VOL. FRACTION BORSIC - 224 At ALLOY
0 - AS FABRICATED CONDITION
- T-6 CONDITION
24.0
c 20.0w
IL
:ac 12.0--
I-
8--
uII-4•
z
12
w
I-
cc 8.0-
w4c
.10
Uc 4.0-
'U[
I-
0 200 400 600 800
TEST TEMPERATUR F-0 F
FIGURE 4-12. TRANSVERSE TENSILE STRENGTH OF 4.2 MIL BORSIC-2024 ALUMINUMAS A FUNCTION OF TEST TEMPERATURE
105
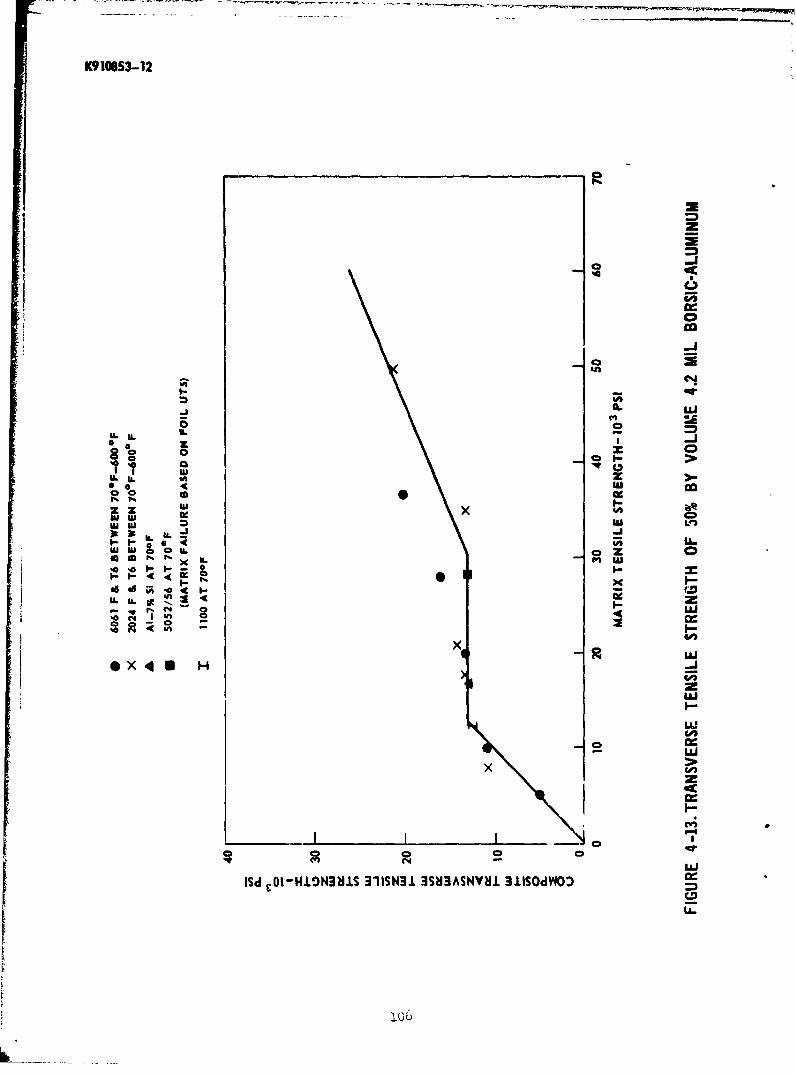
K910653-12
-:E
z
ui
CýV4
W 0 -A
a Aw -JC, tL.Cý Z
X kLM
%0~
o z 0CI-I
zi x
N wIuW OtHONI 31SA.
4)ANYI31SdO
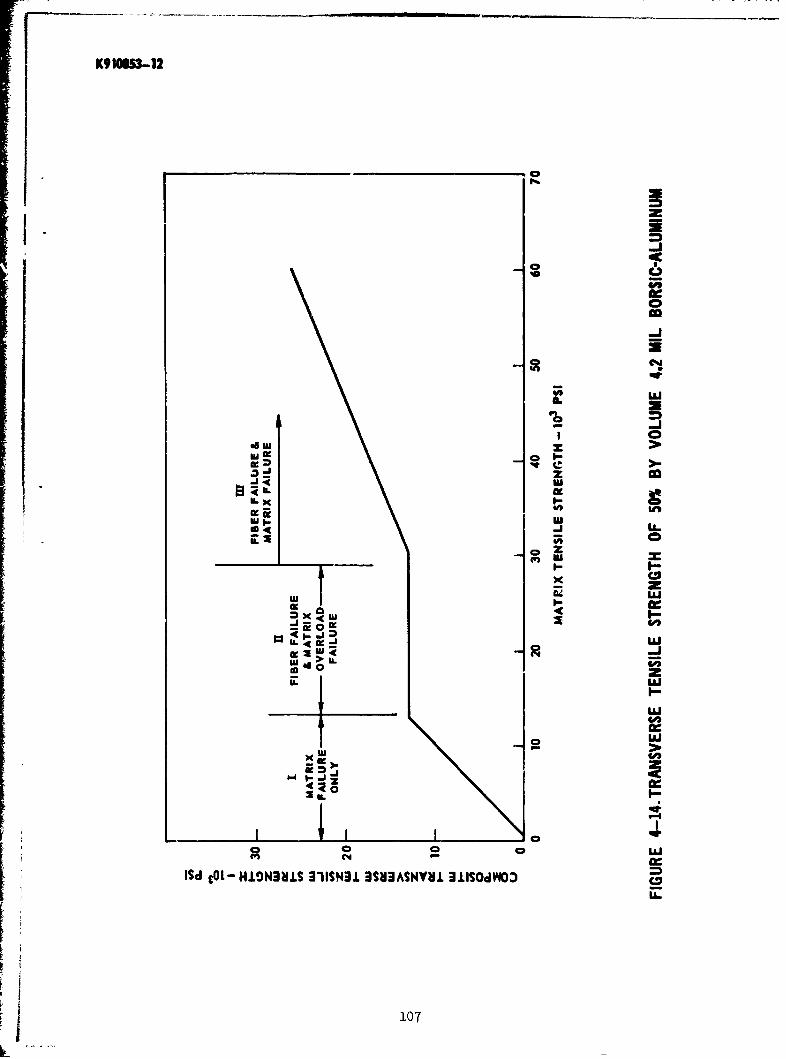
K91OW5-12
coa
-j
at
CD~ z
wzz
x~ I-
C4 CD
w~ cI-iD31 31SU3S11VJl3l~dO)c
m 0 107

K#1053- 12
320
50 '/- - 4.2 miol BORSIC - 6061240 -REF. 4-19
Ell -34X 1o6 PS
S160lu
!US~120-
U, /1! 80
/ E22 =20X 106pSI
4 /46 v 'o - 4.2 miI BORSIC - 6061,o//i~r900
00 0.004 0.008 0.012 0.016 0.020 0.024 0.028STRAIN-IN./IN.
FIGURE 4-15. COMPRESWIVE STRESS STRAIN CURVES FOR AXIAL ANC 900FIBER REINFORCEMENT
108
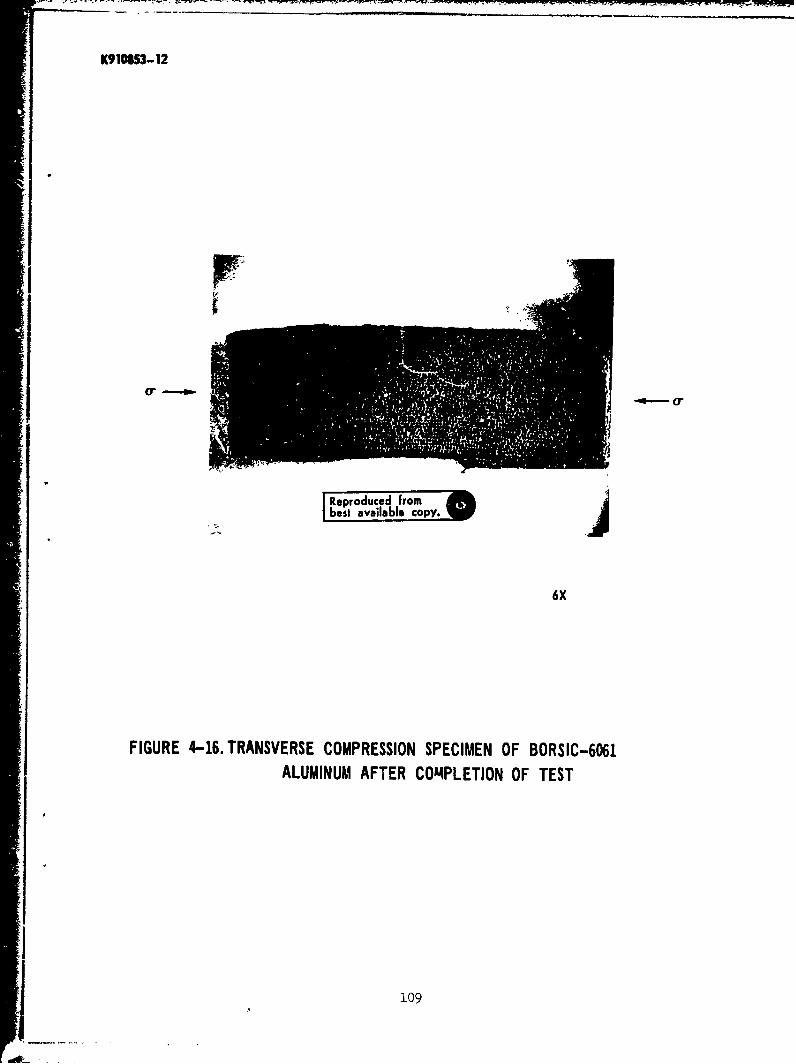
K91053-12
Reproduced frombest available copy.
6X
FIGURE 4-16. TRANSVERSE COMPRESSION SPECIMEN OF BORSIC-6061ALUMINUM AFTER COMPLETION OF TEST
109
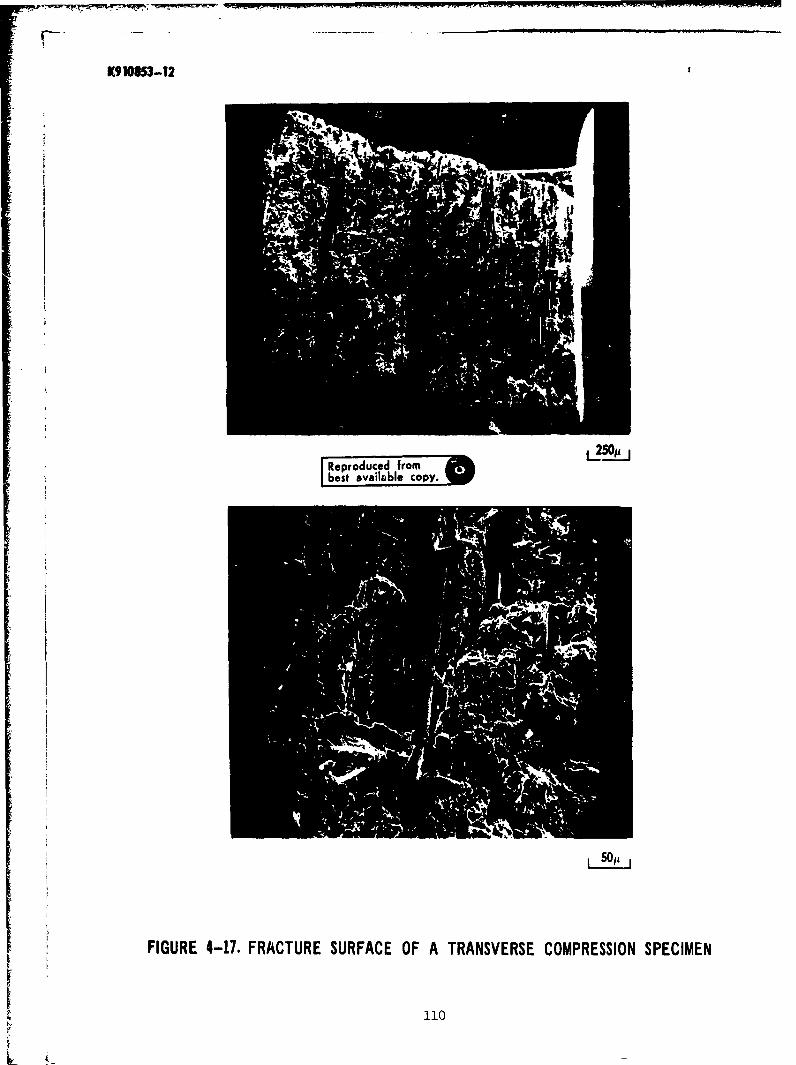
K910853-12
bes, vei,•le coy. t_ 250p
Reproduced from[best availble cSopey..
L 5011
FIGURE 4-17. FRACTURE SURFACE OF A TRANSVERSE COMPRESSION SPECIMEN
110
L
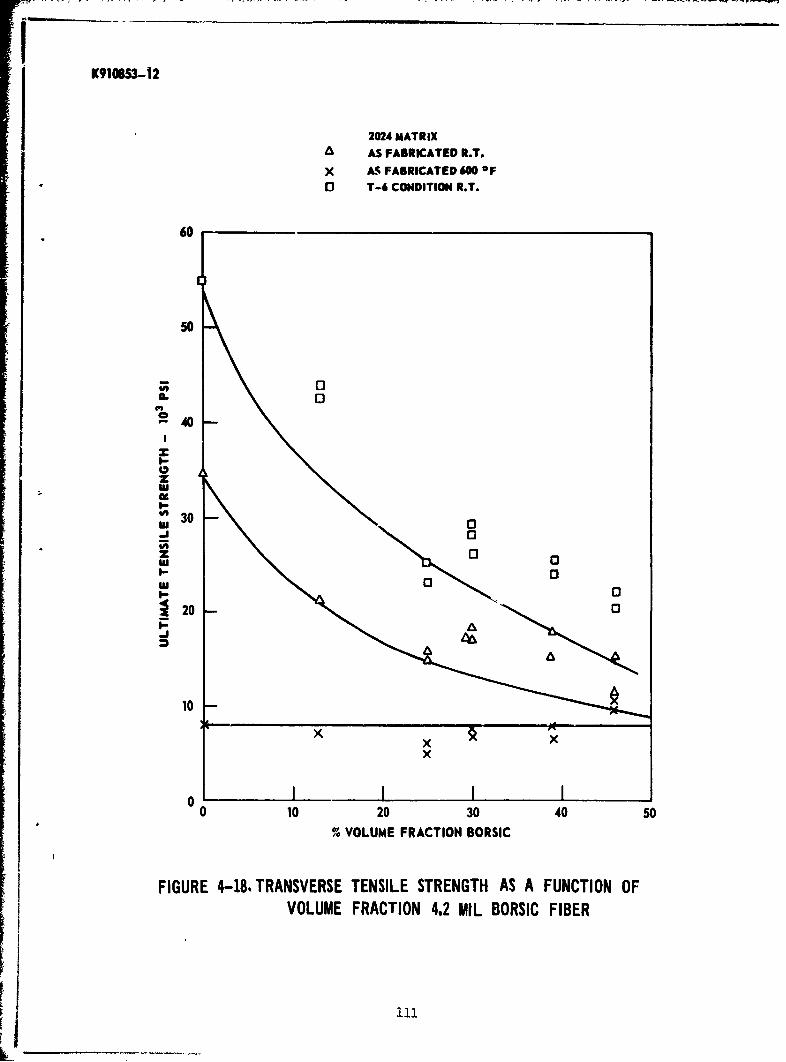
K9108S53-12
2024 MATRIXA AS FABRICATED R.T.
X A1% FABRICATED 600 OF0 T-6 CONDITION R.T.
60
50
G 0
~40
z
I-
30 0x1 0a
I-3 0
~20 03
10
00 10 20 30 40 s0
% VOLUME FRACTION BORSIC
FIGURE 4-18, TRANSVERSE TENSILE STRENGTH AS A FUNCTION OFVOLUME FRACTION 4.2 MIL BORSIC FIBER
i iii.L -
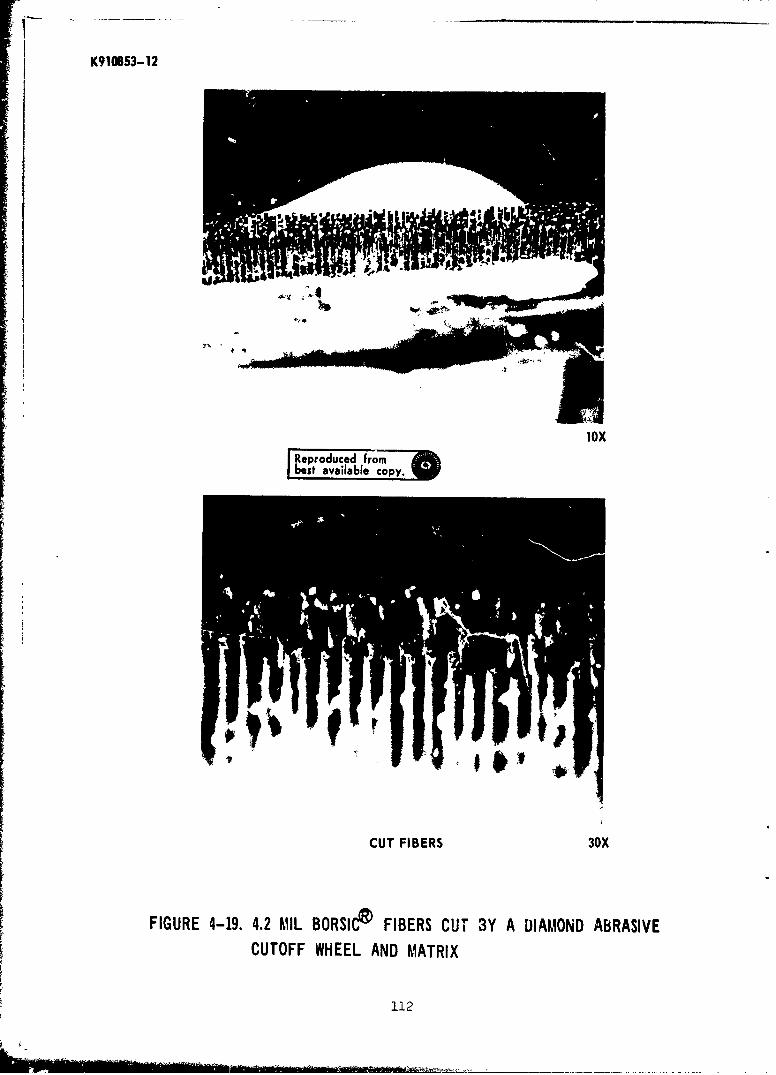
K910653-12
loxReproduced frombest available copy.
CUT FIBERS 30X
FIGURE 4-19. 4.2 MIL BORSICd FIBERS CUT 3Y A DIAMOND ABRASIVECUTOFF WHEEL AND MATRIX
112
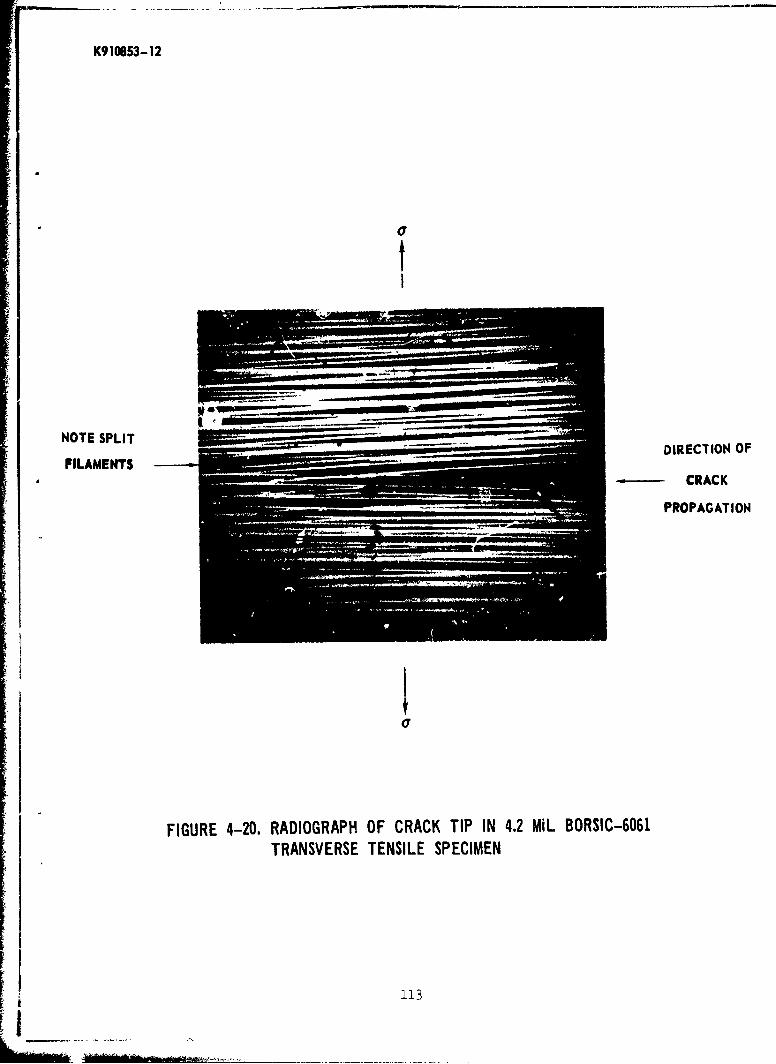
K910653-12
NOTE SPLIT DRCINOFILAMENTS DCRECKINO
PROPAGATION
FIGURE 4-20. RADIOGRAPH OF CRACK TIP IN 4.2 MiL BORSIC-6061TRANSVERSE TENSILE SPECIMEN
113

K?10S53-12
I eproduced fromn
be s I ava~ia bl ou
FIGURE 4-21. 900 4.2 MIL BORSIC-AI TENSILE SPECIMEN WITH FREE FIBER ENDS
1 114
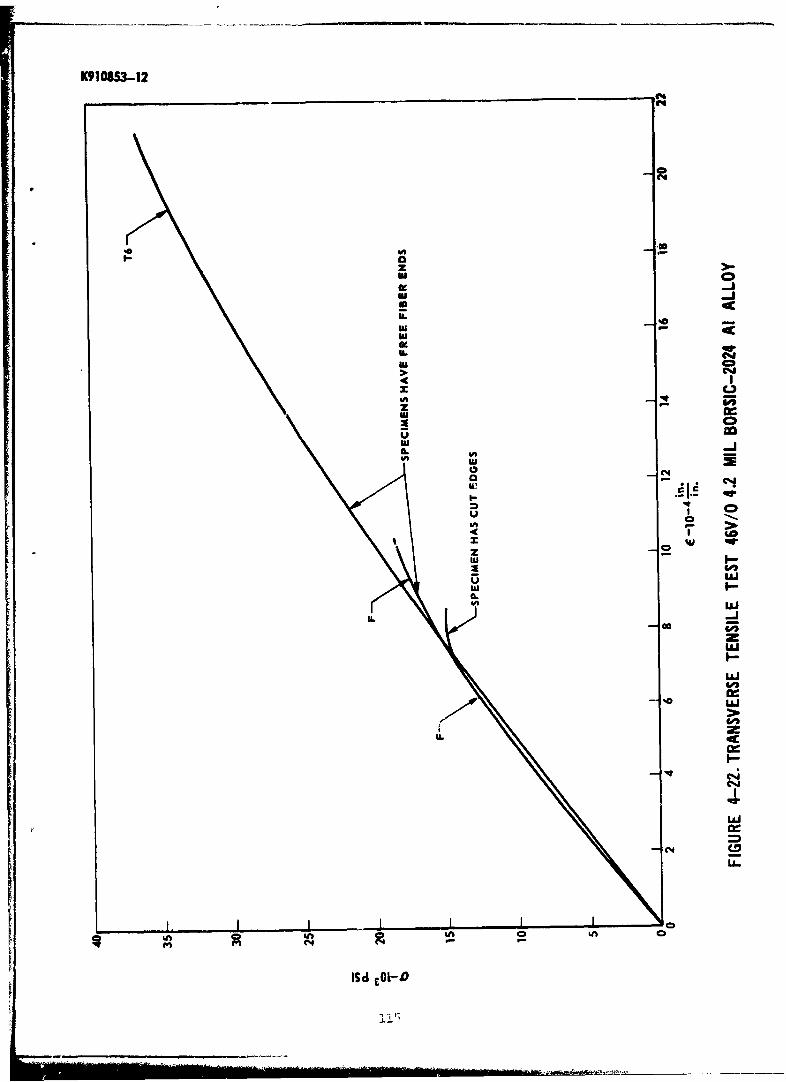
K910853-12
ml'm
IA I
C.)Ur4
U, w
u -j
I-I-
22
LIn
ELU
ml I-
ujC-
In Ln n
cn (4
Isd coiz

K910853- 12
IL
ICL
IAz
4 CS4
2 0 (%JU' eu.
cn C4 C
a.d -O-
I11
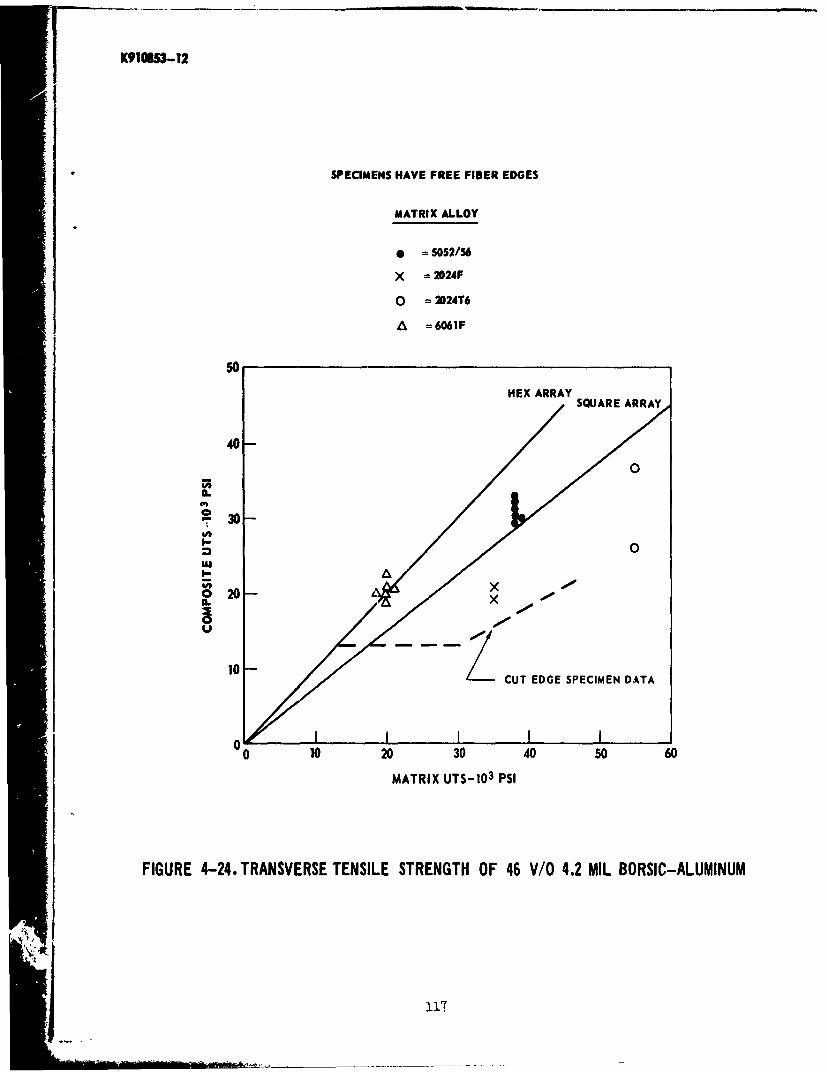
K910CS-12
SPECIMENS HAVE FREE FIBER EDGES
MATRIX ALLOY
• =5052/56
X = 2024F
o = 224T6
A = 6061F
50
HEX ARRAYSQUARE ARRAY
40
0
3...
30 -
I- 0luI-.
C4 x020 x
10 - CUT EDGE SPECIMEN DATA
0010 20 30 40 50 60
MATRIX UTS- 103 PSI
FIGURE 4-24. TRANSVERSE TENSILE STRENGTH OF 46 V/0 4.2 MIL BORSIC-ALUMINUM
117
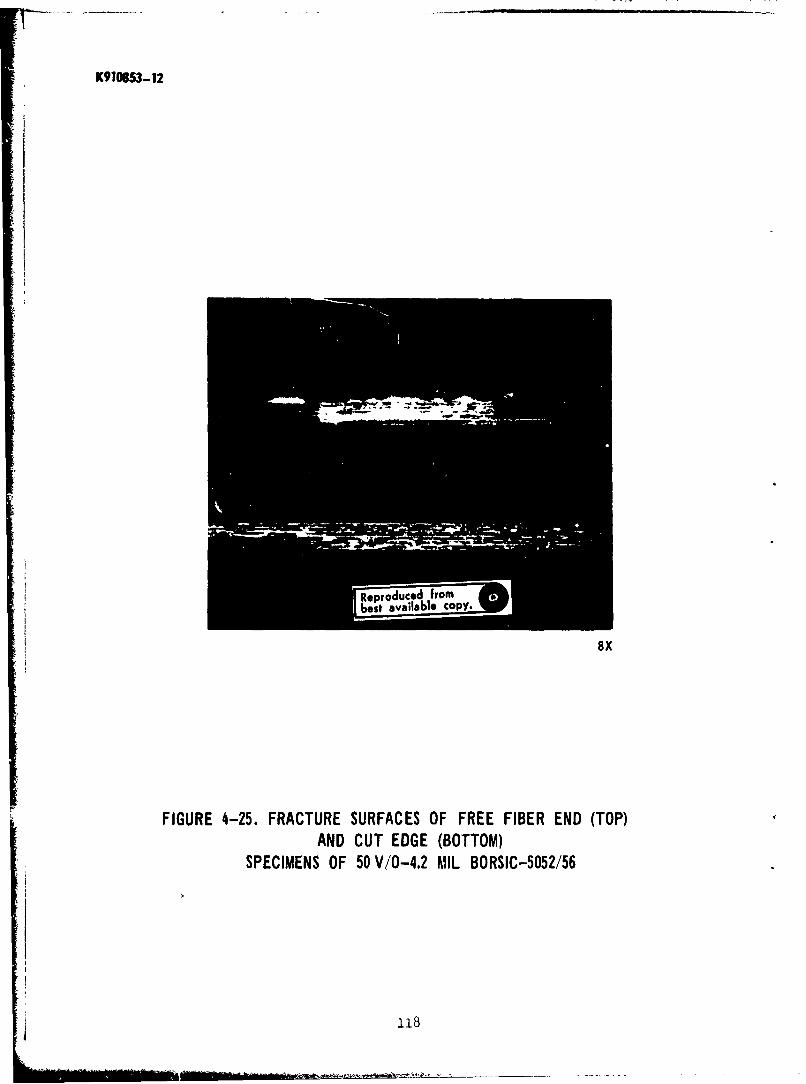
K910853- 12
eoroducod froma•st available COPY.
8X
FIGURE 4-25. FRACTURE SURFACES OF FREE FIBER END (TOP)AND CUT EDGE (BOTTOM)
SPECIMENS OF 50V/0-4.2 MIL BORSIC-5052/56
118

K9108S3-12
boox
FIGURE 4-26. 51 V/0 4.2 MIL BORSIC - S.A.P.
119

K910S53-12
20
16 00 0
IL
S 0 0
S12,I-
il
8aJ
in>WI
I,-3
4
0 i I I0 200 400 600 800 1000
TEST TEMPERATURE -oF
FIGURE 4-27. TRANSVERSE TENSILE STRENGTH OF 51 V/0 4.2 MILBORSIC-S.A.P.
120
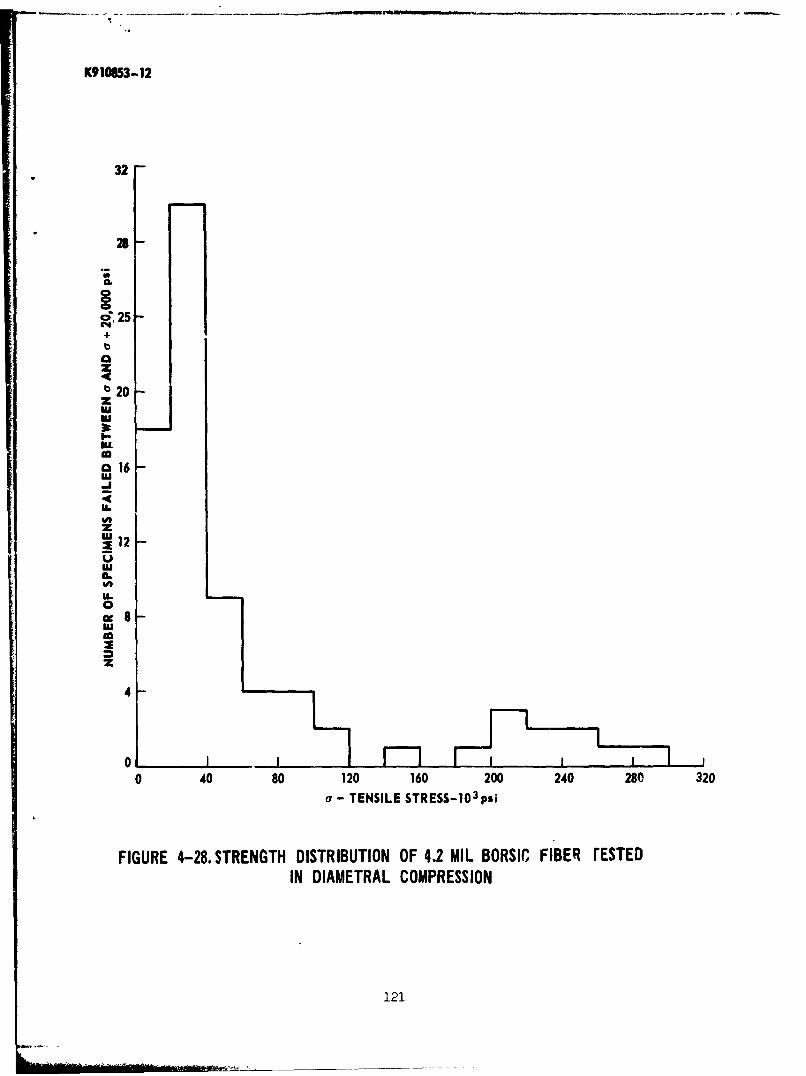
K910853-12
32
28
c, 25+
20z
I.-
ML
a016u.
.4U.
z~12
'3
' U_
IL ESL TRS-O s
4AU.
0
z
4
0 40 80 120 160 200 240 280 320or- TENSILE STRESS-10 3 psi
FIGURE 4-28. STRENGTH DISTRIBUTION OF 4.2 MIL BORSIC FIBER rESTEDIN DIAMETRAL COMPRESSION
121
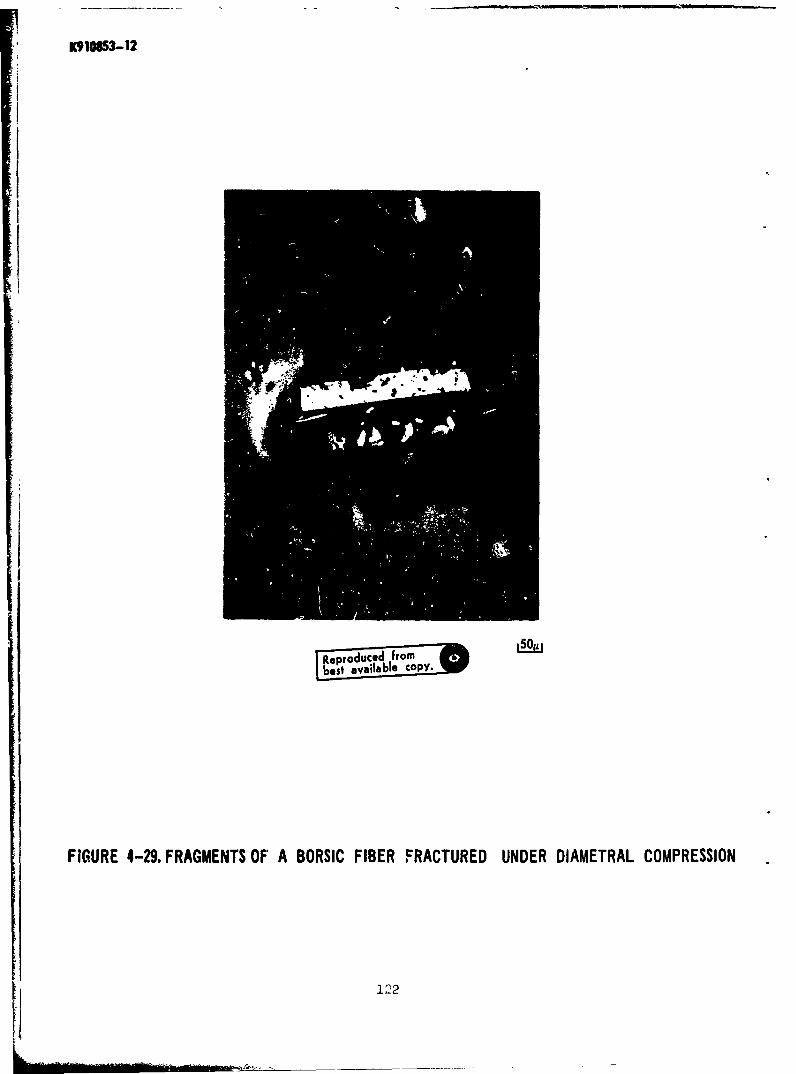
K910853-12
'sOul•bess available copy.V
FIGURE 4-29. FRAGMENTS OF A BORSIC FIBER FRACTURED UNDER DIAMETRAL COMPRESSION
122
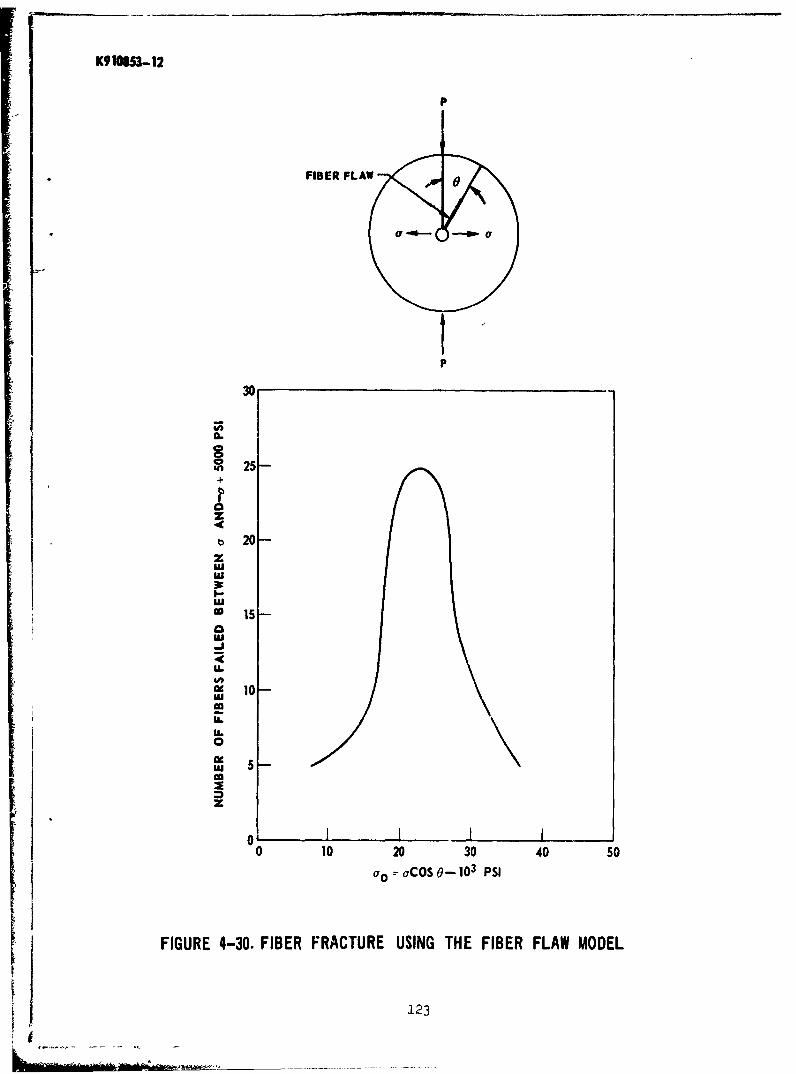
K910L53-12
p
FIBER FLAW "
pp tP
30
g 25+
z
t 20zww
3: \I.
m 15
a
~~ 10
to
U.U.
ID
0 10 20 30 40 50
ao ýaCoS0- 103 pSI
FIGURE 4-30. FIBER FRACTURE USING THE FIBER FLAW MODEL
(1 123
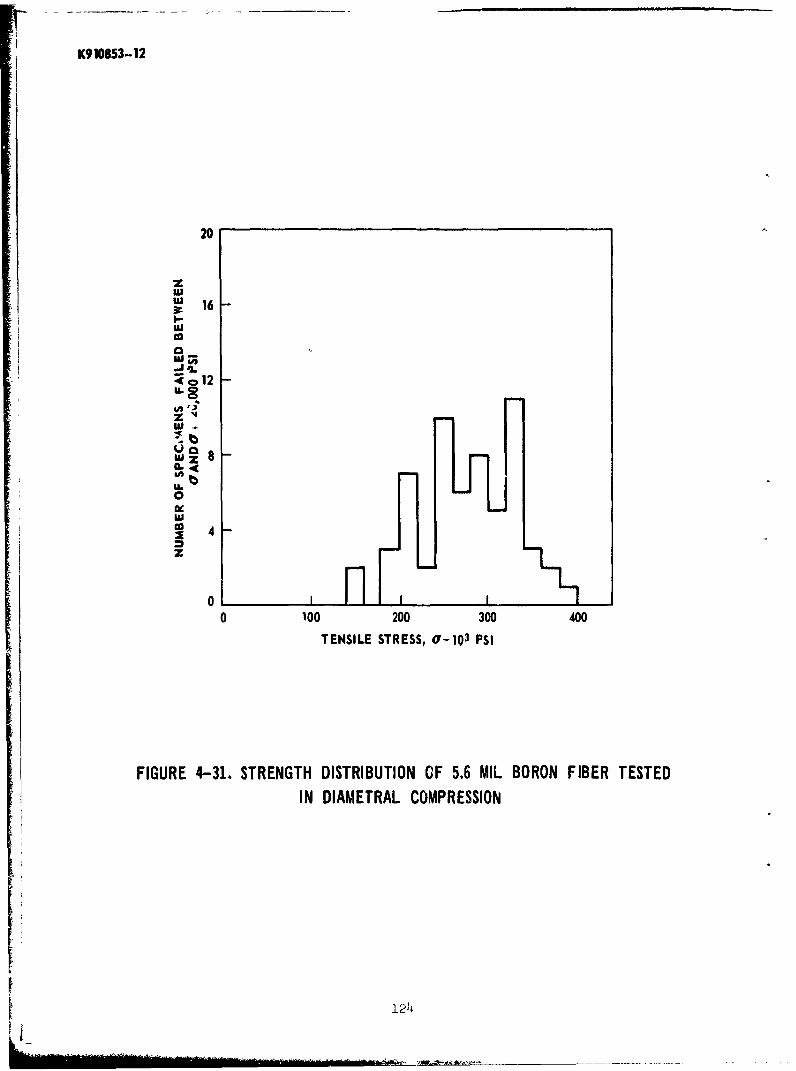
K910853-12
20
"u 16
-J'
::i 12
SUz
<l2
IL
0
i caJ• 4
z
0 100 200 300 400
TENSILE STRESS, a-I13 PSI
FIGURE 4-31. STRENGTH DISTRIBUTION OF 5.6 MIL BORON FIBER TESTEDIN DIAMETRAL COMPRESSION
124I _

K910B3-12
6
mw I
IL
Z
TEHIL STES.4-0 S
'AbU-0
'U
0 100 200 300 400
TENSILE STRESS, g -103 PSI
FIGURE 4-32. STRENGTH DISTRIBUTION OF 5. MIL BORSIC FIBER TESTED
IN DIAMETRAL COMPRESSION
125
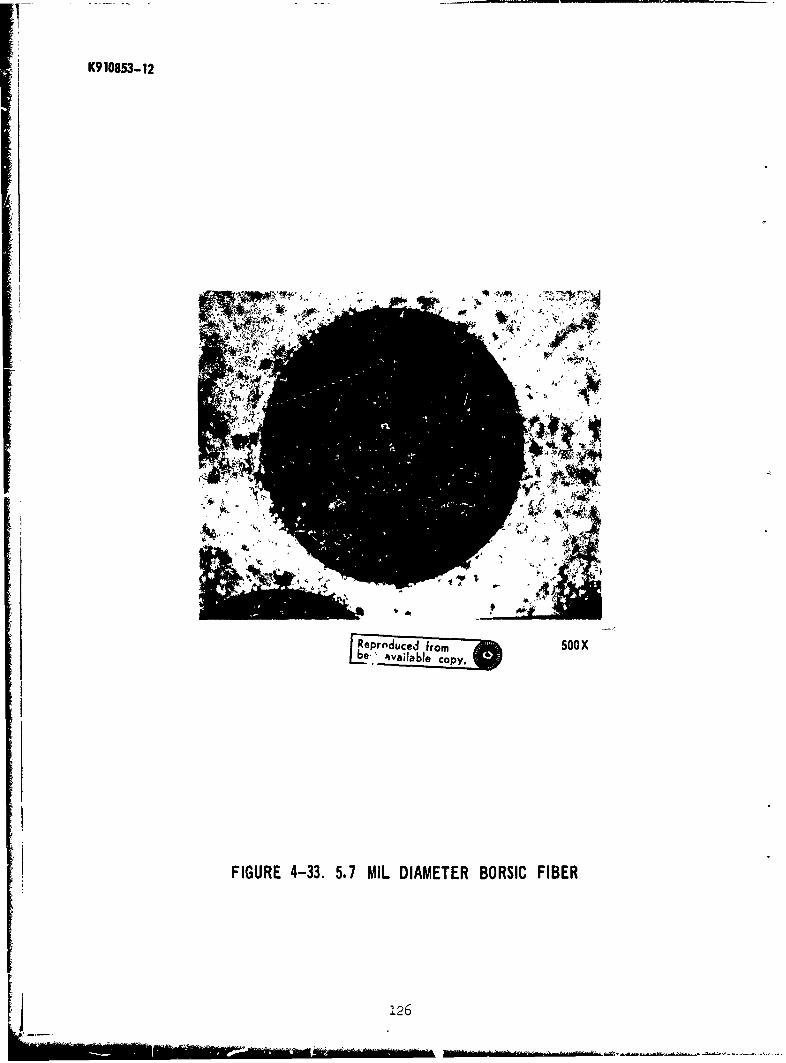
I K910853-12
Repproduced from 50OX
FIGURE 4-33. 5.7 MIL DIAMETER BORSIC FIBER
Ij 126

K910853-12
- I
II
FIGURE 4-34. RADIOGRAPH OF 4.2 MIL BORSIC-6061-AFC-77 TENSILE SPECIMEN
127

K910853-12
60
0-AS FABRICATED
-80-T-6 CONDITION
CP 40-
, 30
-,
'U
I.-< 0
-2 20
2% OF SS. FIBER TENSILE STRENGTH
10-
0 200 400 600 800 1000
TEMPERATURE- OF
FIG. 4-35, TRANSVERSE 47 % - 4.2 MIL BORSIC - 6061 - AXIAL - 6 % - S. S.
TESTED IN THE AXIAL DIRECTION
128
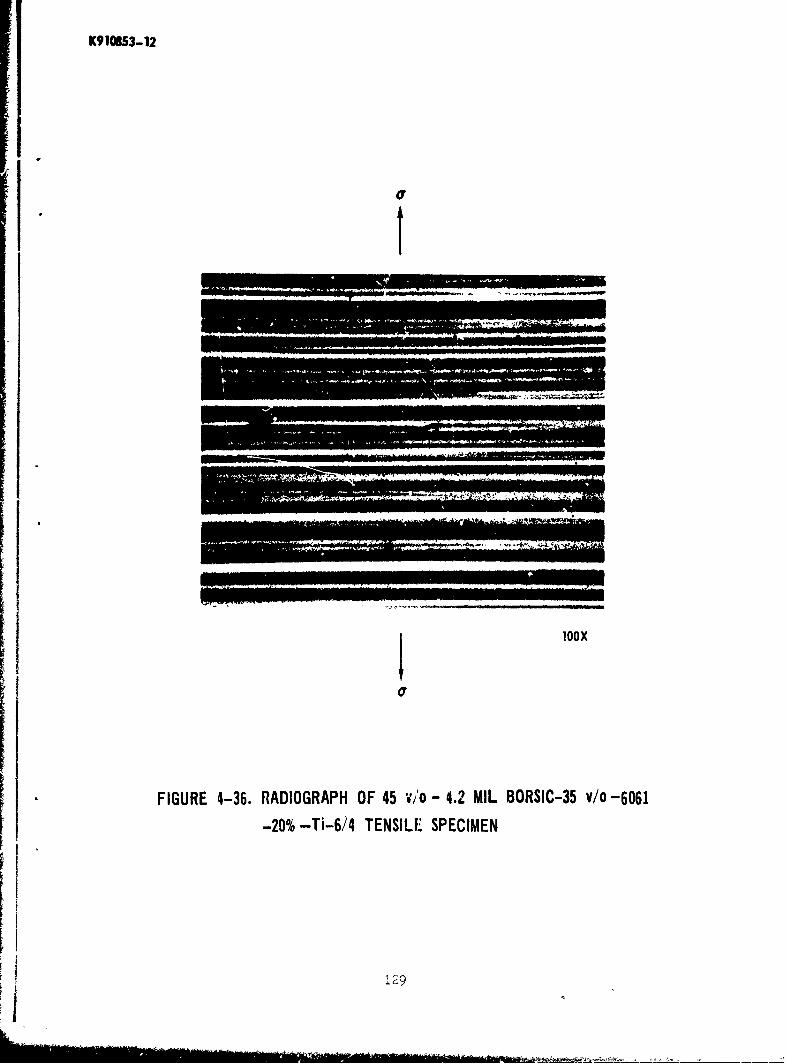
K910B53-12
* ~FIGURE 4-36. RADIOGRAPH OF 45 vo-4.2 MIL BORSIC-35 v/0 -6061-20% -Ti-6/4 TENSILE. SPECIMEN
1 1.29
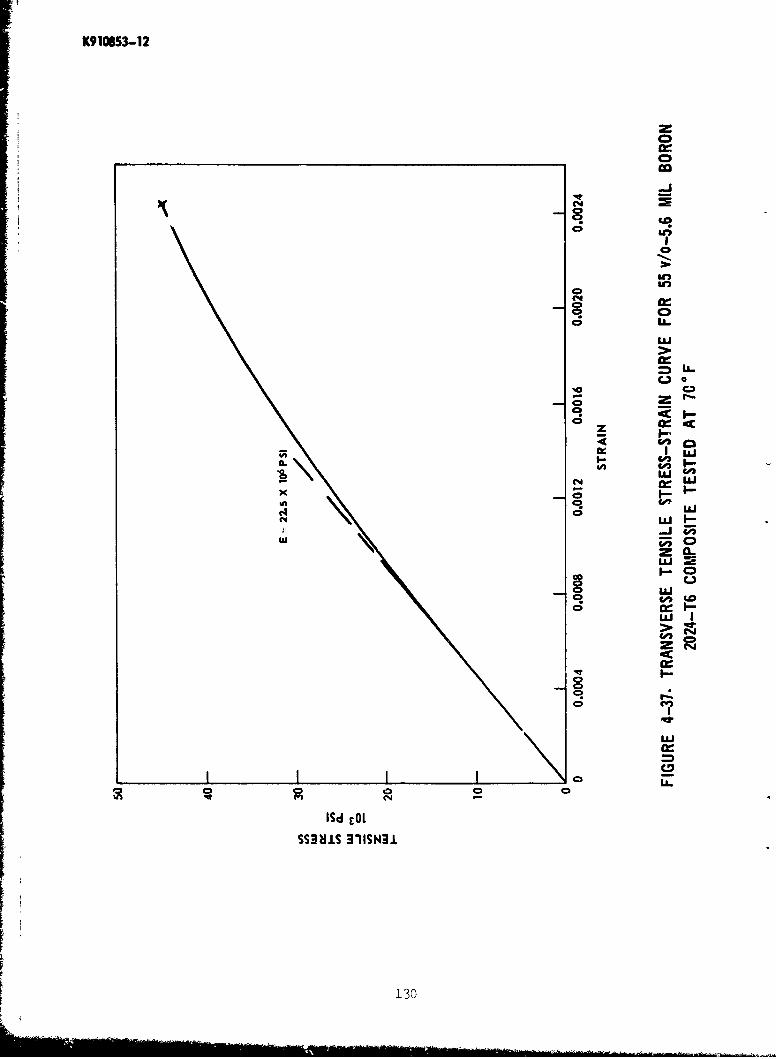
K9109S3-12
C;
ao
C5 U.
au
C3.9CDxd
aUzJ
(4 IW
ZO-
I-0
W IZC%
CI-00lC"
ISd cO'SS3HiS 311SN31.
i30

KY1USI-12
'a-
'U
z
* CLl
'4
CC
131
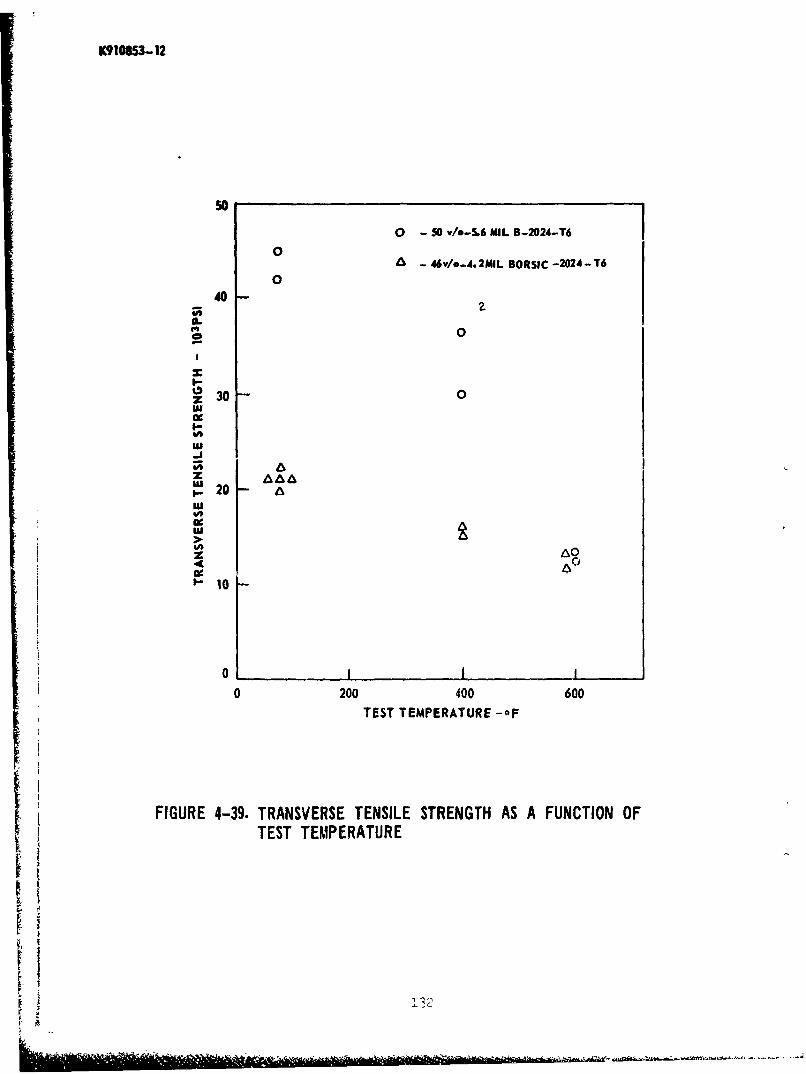
K910853-12
so
0 - 50 v/o-5.6 MIL B-2024-T6
0-046v/0-4.2MILBORSC-2024-T6
040
C-
:30 0w
,u 20I-
U,
AAAo
S10
04
200 400 600
TEST TEMPERATURE -OF
FIGURE 4-39. TRANSVERSE TENSILE STRENGTH AS A FUNCTION OFTEST TEMPERATURE
I ,
-- -- ~- - , - , - - - -1-'-,.
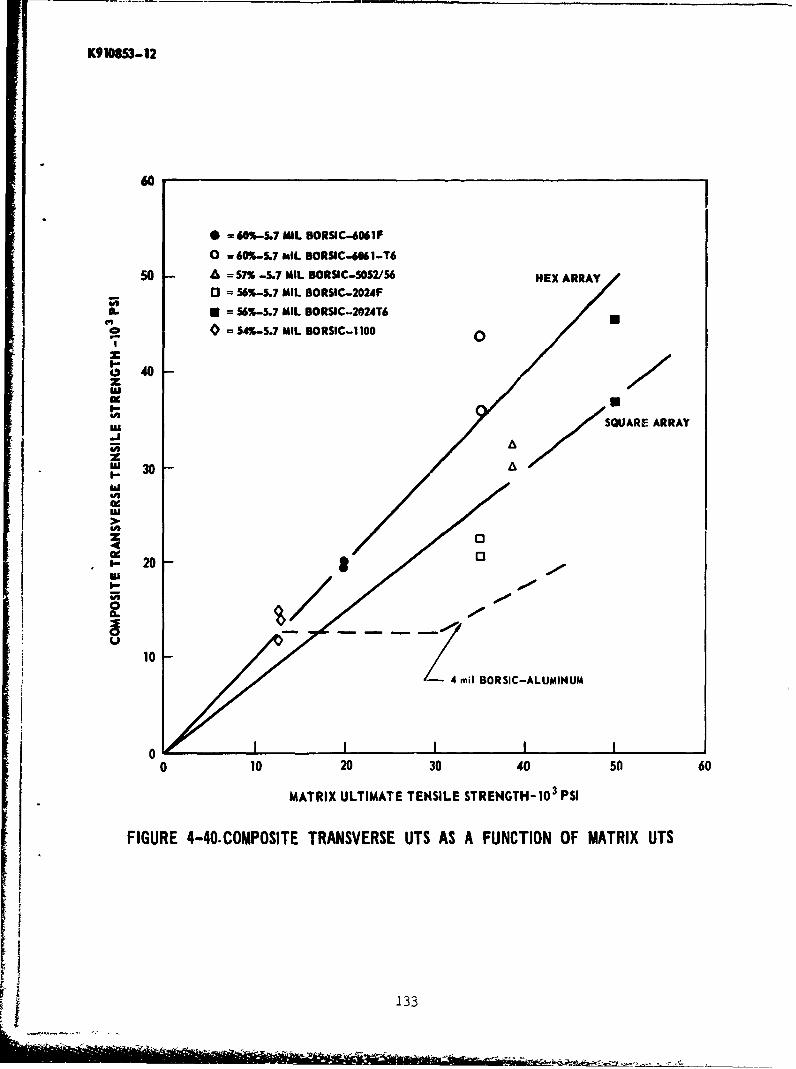
K9108S3-12
60
* =60%-5.7 MIL BORSIC-6061F
o =60%-L7 NIL BORSIC-6M1-T6
so A =57% -5.7 NIL BORSIC-SOS2/56 HEX ARRAY
o = 56%-5.7 NIL BORSIC-202,F
a.. = 56%-5.7 NIL BORSIC-2024T6
0 =$^4-5.7 MIL BORSIC-1 1000
b 40
us SQUARE ARRAY
-I Amu 3id
VAac
0 -mu
10
-4 mil BORSIC-ALUMINUM
0 10 20 30 40 50 60
MATRIX ULTIMATE TENSILE STRENGTH- 103 PSI
FIGURE 4-40.COMPOSITE TRANSVERSE UTS AS A FUNCTION OF MATRIX UTS
.133

K91063- 12
fte!produced from 1000 4best available copy.
1001,
FIGURE 4-41.TRANSVERSE TENSILE FRACTURE SURFACE OF 56 V/o-5.7 MIL BORSIC-2024
134

K9910M-12
50
40-
E = 21.0 X 10⁶ pSl
30
:2010
I-,,In
1-
0 0.0004 0.0008 0.0012 0.0016 0.0020 0.0024
STRAIN
FIGURE 4-42. TRANSVERSE TENSILE STRESS-STRAIN CURVE FOR 52 v/o-5.7 MILBORSIC 6061-T6 COMPOSITE TECTED AT 7n F
135
'3" , .. .I... i • .. . I•'.. ,. .. ... . . .. . . , , • •. .. . ..... . . ..

K910S53-12
14,000
12,000
8000 -
6000
4000
2000O0O
_ _ _ _ _ _ _ _ _ I I I0 0.002 0.004 0.006
IE
FIGURE 4-43.TRANSVERSE TENSILE STRESS-STRAIN CURVE FOR 54 v/o-5.7 BORSIC-1100
136
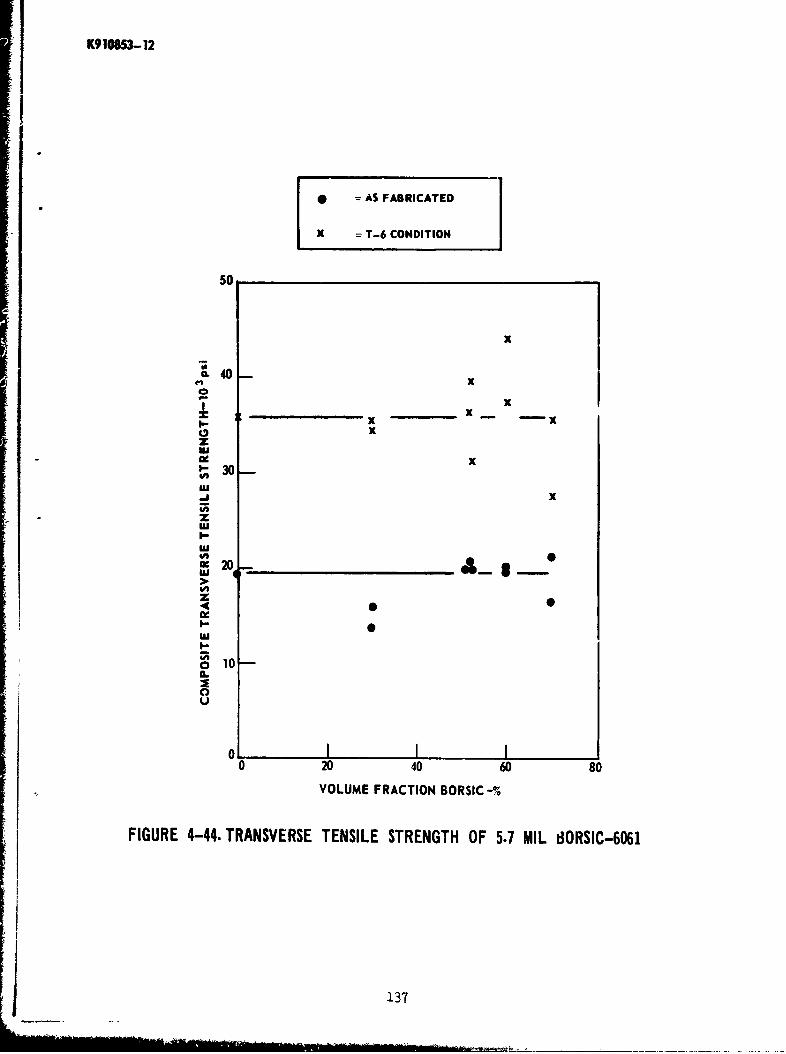
K910853-12
* = AS FABRICATED
X = T-6 CONDITION4
50
cLi40x
• x
zx
030V$
W
.j xV,z
I-Lu
U,0920 _ _ _ _ _ _lu
z
IL0
I-
a.E
0U
0 I I I0 20 40 60 80
VOLUME FRACTION BORSIC-%
FIGURE 4-44. TRANSVERSE TENSILE STRENGTH OF 5.7 MIL 6ORSIC-6061
137

K910853-12
40
o 30
u
S20
uiIo-~ 0
0 10 20 30 40 50 60 70 80
VOLUME FRACTION FIBER-%
FIGURE 4-45. TRANSVERSE TENSILE ELASTIC MODULUS FOR 5.7 MILBORSIC-6061 ALUMINUM COMPOSITES
138
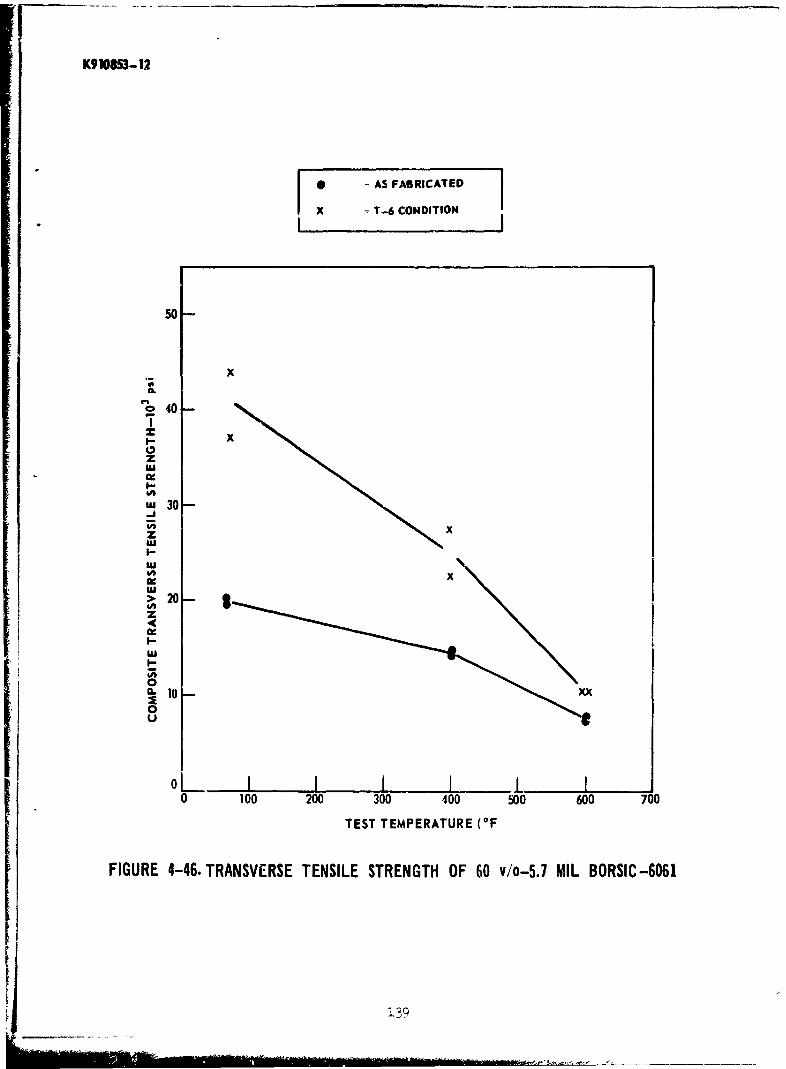
K910853-12
0 AS FABRICATED
X =T-6 CONDITION
50
x
240-
w 30
I-U, xz
I-
Uxmu> 20 3z
mu
TEST TEMPERATURE (OF
FIGURE 4-46. TRANSVERSE TENSILE STRENGTH OF 60 v/o-5.7 MIL BORSIC-6061
1I-!1 •U,+ .- .. . . . ..
l I + P + " ' '+ .. •" "*•" +° . ..+ .. . .. P .... + +, .. -•.....0*.... . . ..

K91C0 53-12
0 = AS FABRICATED
x T-6 CONDITION I
50
~x-ad 3 COMPOSITE UTS- MATRIX UT30
z x
.A X 400°F
I-
z 20
• IO••l400 OF
LX•FIGURE •i-47. ~COMPOSITE RNVRE UTS ASAFNCINO MATRIX UTS O
'I,
-'0
0 102 300
M U TNI .- ST EN T -10 psi
FIURE44.CMOIETASES T SAFNTO FMTI T O60V0-. ILBRIC66

K910853-12
(4c
LIC
CLl
W; A 0
UU
0 z
UU
0' 0 )
LLJ-CLL
WZ
0 co0
ca LL.C-,
zz
II0
!IdcL~HLN3NJS fISN~. 3SASN~IJ.31ISdWO

K910953-12
- zw0
0 8CD lAW
z Ia 4
zmwILL
o ww 1--
U)IA. D 0
L& a, 0uJ 0 w Q
Os 0 0.ILL
cr z
oc
0. +LLu
-84c
00
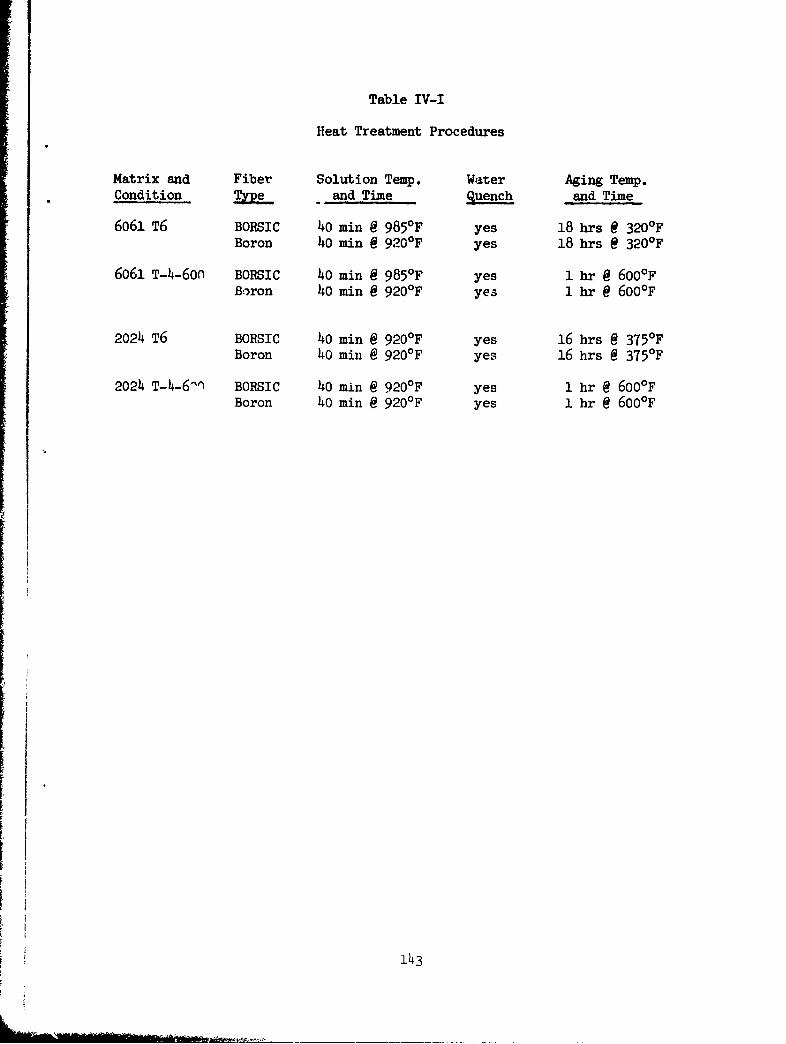
Table IV-I
Heat Treatment Procedures
Matrix and Fiber Solution Temp. Water Aging Temp.Condition T and Time Quench and Time
6061 T6 BORSIC 40 min @ 9850 F yes 18 hrs @ 320°FBoron 40 min @ 920°F yes 18 hrs @ 320°F
6061 T-4-600 BORSIC 40 min @ 9850 F yes 1 hr @ 600°FBoron 40 min @ 920°F yes 1 hr @ 600°F
2024 T6 BORSIC 40 min @ 920°F yes 16 hrs @ 3750 FBoron 40 min @ 920°F yes 16 hrs @ 375 0F
2024 T-4-6-) BORSIC 40 min @ 920°F yes 1 hr @ 600°FBoron 40 min @ 920°F yes 1 hr @ 600°F
143
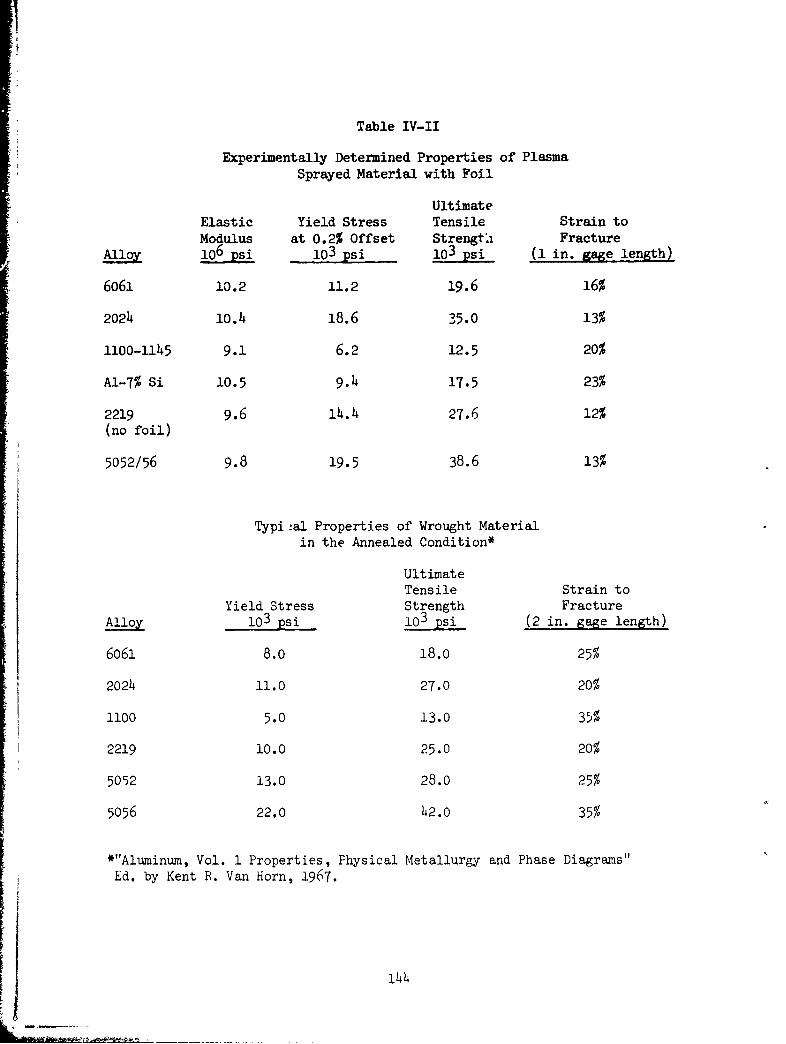
Table IV-II
Experimentally Determined Properties of PlasmaSprayed Material with Foil
UltimateElastic Yield Stress Tensile Strain toModulus at 0.2% Offset Strengta Fracture
Ala106 psi 103 psi .03 psi (1 in. gage length)
6061 10.2 11.2 19.6 16%
2024 10.4 18.6 35.0 13%
l100-1145 9.1 6.2 12.5 20%
Al-7% Si 10.5 9.4 17.5 23%
2219 9.6 14.4 27T.6 12%(no foil)
5052/56 9.8 19.5 38.6 13%
Typi.-al Properties of Wrought Materialin the Annealed Condition*
UltimateTensile Strain to
Yield Stress Strength Fractureo103 psi 103 psi (2 in. gage length)
6061 8.0 18.0 25%
2024 11.0 27.0 20%
1100 5.0 13.0 35%
2219 10.0 25.0 20%
5052 13.0 28.0 25%
5056 22.0 42.0 35%
*"Aluminum, Vol. 1 Properties, Physical Metallurgy and Phase Diagrams"
Ed. by Kent R. Van Horn, 1967.
144

Table IV-Ill
Diffusion Bonding Conditions Capable of ProducingFully Consolidated 50% BORSIC-Matrix Composites
Range of Pressure TemperatureMatrix Alloy (103 psi) ( 0C)
6061 2 to 10 56505 to 10 4900
10 4200
2024 5 to 10 4900
5052/56 2 to 10 565010 4200
AI-7% Si 2 to 10 56505 to 10 490°
S145
!
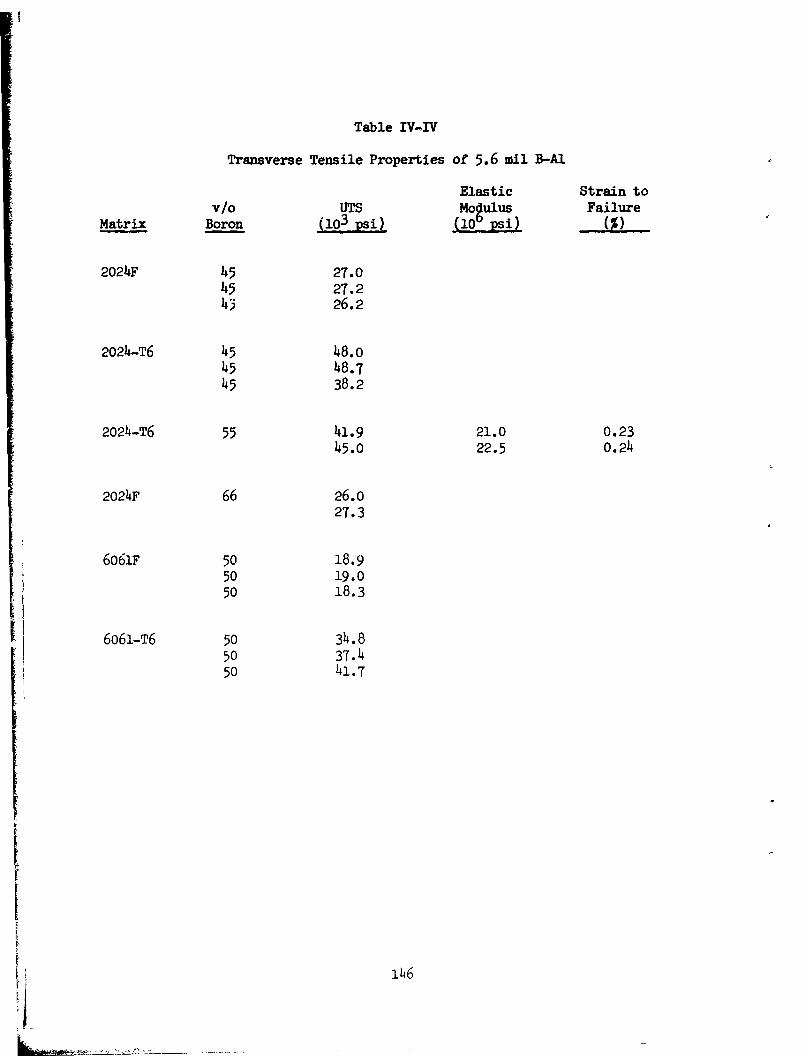
Table IV-IV
Transverse Tensile Properties of 5.6 mail B-Al
Elastic Strain tov/o UTS Mogulus Failure
Matrix Boron (103 psi) (10'psi) (%)
2024F 45 27.045 27.243 26.2
2024-T6 45 48.045 48.745 38.2
2024-T6 55 41.9 21.0 0.2345.0 22.5 0.24
2024F 66 26.027.3
6o61F 50 18.950 19.050 18.3
6o61-T6 50 34.850 37.450 41.7
V 146I_
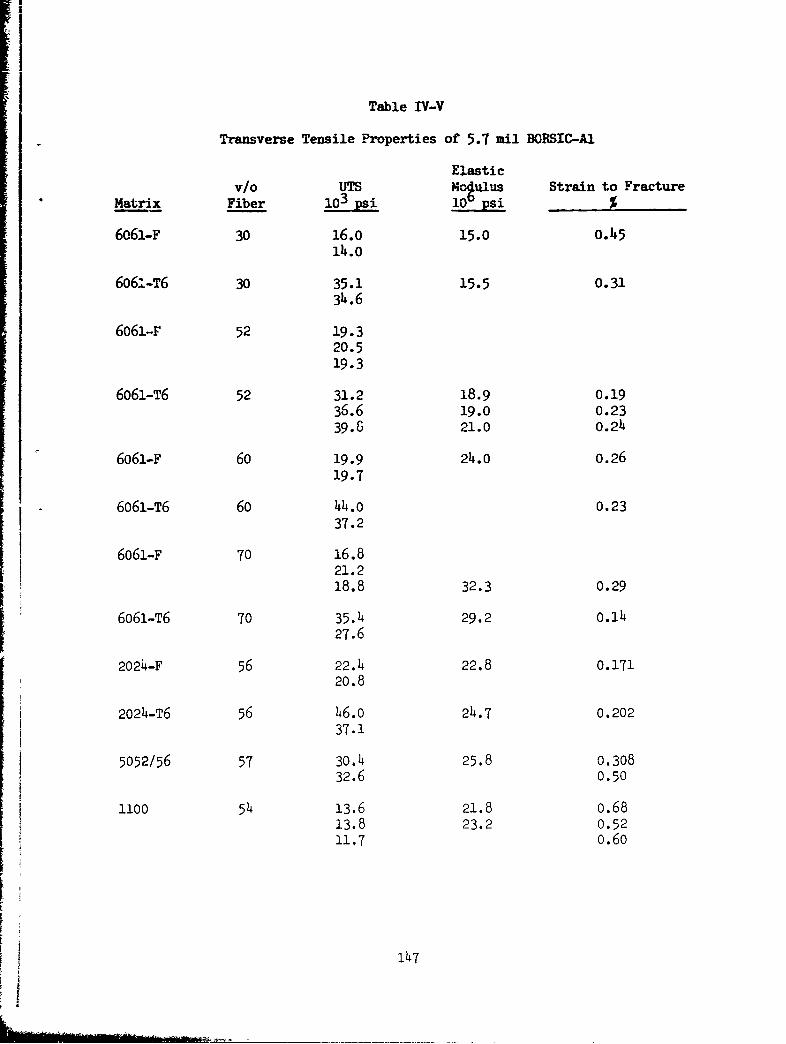
Table IV-V
Transverse Tensile Properties of 5.7 mil BORSIC-Al
Elasticv/o UTS moulus Strain to Fracture
Matrix Fiber p 10 psi %
6061-F 30 16.0 15.0 o.145iii.0
606;-T6 30 35.1 15.5 0.3134.6
6061-F 52 19.320.519.3
6o61-T6 52 31.2 18.9 0.1936.6 19.0 0.2339.6 21.0 0.24
6061-F 60 19.9 214.0 0.2619.7
6o61-T6 60 44.0 0.2337.2
6061-F 70 16.821.218.8 32.3 0.29
6o61-T6 70 35.4 29.2 0.1427.6
2024-F 56 22.4 22.8 0.17120.8
2024-T6 56 46.0 24.7 0.20237.1
5052/56 57 30.4 25.8 0.30832.6 0.50
1100 54 13.6 21.8 0.6813.8 23.2 0.5211.7 0.60
147
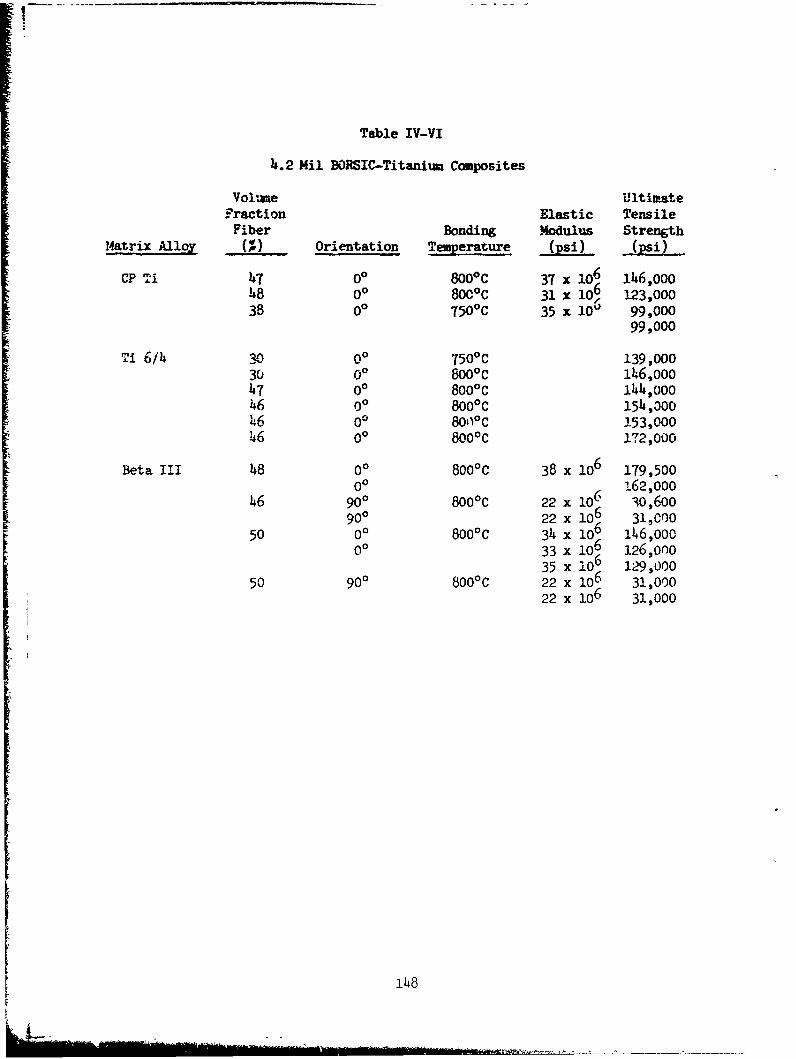
Table IV-YI
4.2 Nil BORSIC-Titanium Composites
Vol-me UltimateFraction Elastic Tensile
Fiber Bonding Modulus StrengthMatrix Alloy 04%) Orientation Teemperature (psi) (psi)
CP Ti 47 00 8oo0c 37 x 1O6 146,00048 00 8000C 31 x 106 123,00038 00 7500 C 35 x 10" 99,000
99,000
Ti 6/i4 3 00 7500C 139,00030 00 8000 C 146,00047 0° 8000C 1l44,00046 0° 8000C 154,30046 00 8000C 153,00046 00 8000C 172,000
Beta iII 48 00 800 0C 38 x 1o6 179,50000 i62,000
46 9go 8000C 22 x 106 30,600"900 22 x I06 31,000
50 00 8000C 34 x Io6 146,000
00 33 x i06 126,00035 x 10⁶ 129,000
50 900 8000C 22 x I06 31,00022 x i0 6 31,000
I114
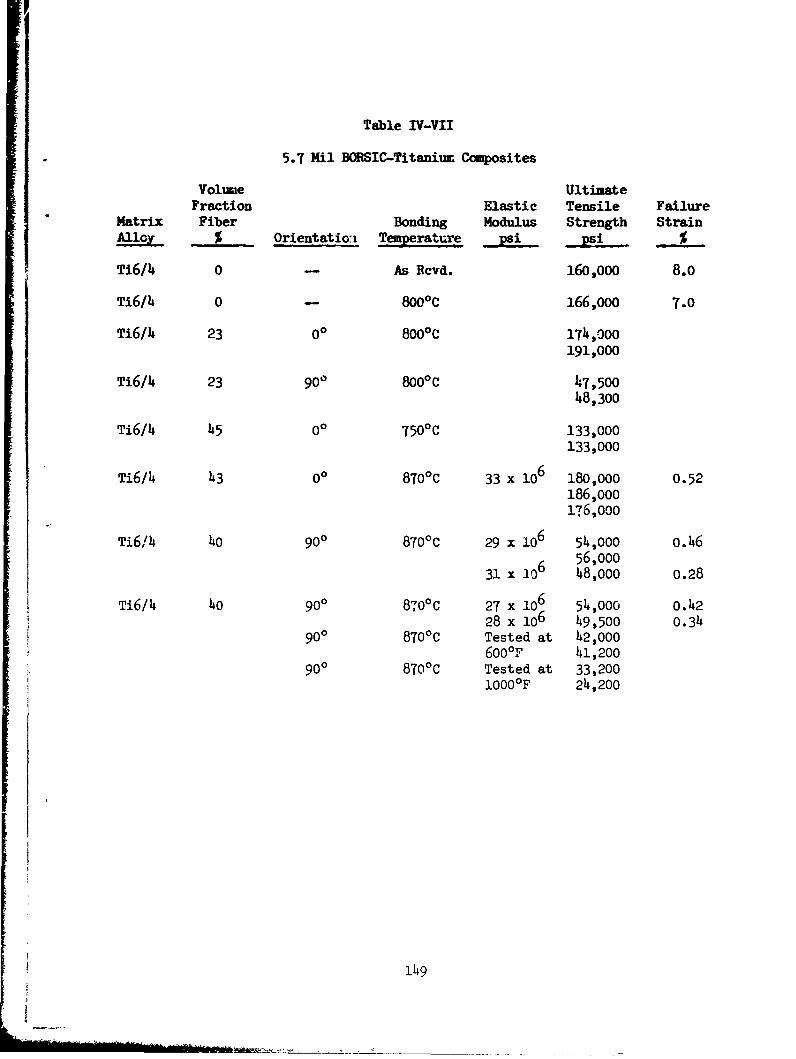
Table IV-VII
5.7 Mil BORSIC-Titanium Composites
Volume UltimateFraction Elastic Tensile Failure
Matrix Fiber Bonding Modulus Strength StrainA.2 % Orientatio'i T Werture psi _psi %
Ti6/4 0 As Rcvd. 160,000 8.0
Ti6/4 0 - 800°c 166,000 7.0
Ti6/4 23 00 800°C 174,000191,000
Ti6/4 23 90g 8000° 147,50048,300
Ti6/4 45 00 7500C 133,000133,000
Ti6/4 43 00 8700 C 33 x 106 180,000 0.52186,000176,000
Ti6/4 4o0 900 8700C 29 x 106 54,000 o.46
6 56,00031 x 10 48,000 0.28
Ti6/4 40 900 870 °C 27 x 106 54,O00 o.4228 x 106 49,500 0.34
90o 8700C Tested at 42,000600°F 41,200
900 8700C Tested at 33,2001000OF 24,200
149

OFF-AXIS BEHAVIOR
SUMMARY
The elastic constants of 50 v/o 4.2 mil BORSIC + 6061-F aluminu• weredetermined at 70 0 F. For the 4.2 mil BORSIC material Ell = 33.8 x i1v psi,E2 2 = 20.5 x 10⁶ psi, G12 = 8.15 x 10⁶ Dsi and V12 = 0.2h. The engineeerngconstants of 63% 5.7 mi BORSIC plus 6061-T6 aluminum are Ell = 43.7 x 100psi, E2 2 = 28.3 x i06 psi, GI 2 = 11.1 x 10⁶ psi, and V1 2 = 0.24. Theseresults compare well with the micromechanical predictions available in theliterature.
The variations of elastic constants vith angle to the fiber directionare in good agreement with the transformation equations. The amount of shearcoupling is small compared to the more ortnot.opic polymeric composite systemssuch as bozon + epoxy. The maximum ncrmal ana coupled shear fracture strainsare exhibited near 300 (1.2%) and 100 (-2%) to the filament direction in 4.2mil BORSIC + 6061-F material.
The strength of both materials is well predicted b, t,'he maximum dis-toitional energy theory (without artifically pinning the curve at an inter-mediate angle). The fracture surfaces of the 4.2 mil BORSIC + 6061-F materialare characterized by fiber rupture at low angles (00, 20, I0) and by fibersplitting and matrix shear at intermediate and high angles (100, 300, 450,600, 80, 90). In the 5.7 mil BORSIC + 6061-T6 material fiber splitting wasnearly absent as a result of the higher transverse strength of the largediameter fiber.
The use of sonic velocity measurements to calculate the off-axis modulus,(Ell (0) = 1/S11 (0) ) of fiber reinforced composite materials can result insignificant error iQ' a relationship of the form Ell = .826 PV 2 is employed.Stiffness in the orthogonal directions are underestimated and intermediateangle stiffnesses are overestimated resulting in greatly overestimated valuesof shear modulus. Extensional wave velociti , measured as a function of angleto the filament orientation are within 4% of the values predicted by theanalysis which includes shear coupling effects by Reuter.
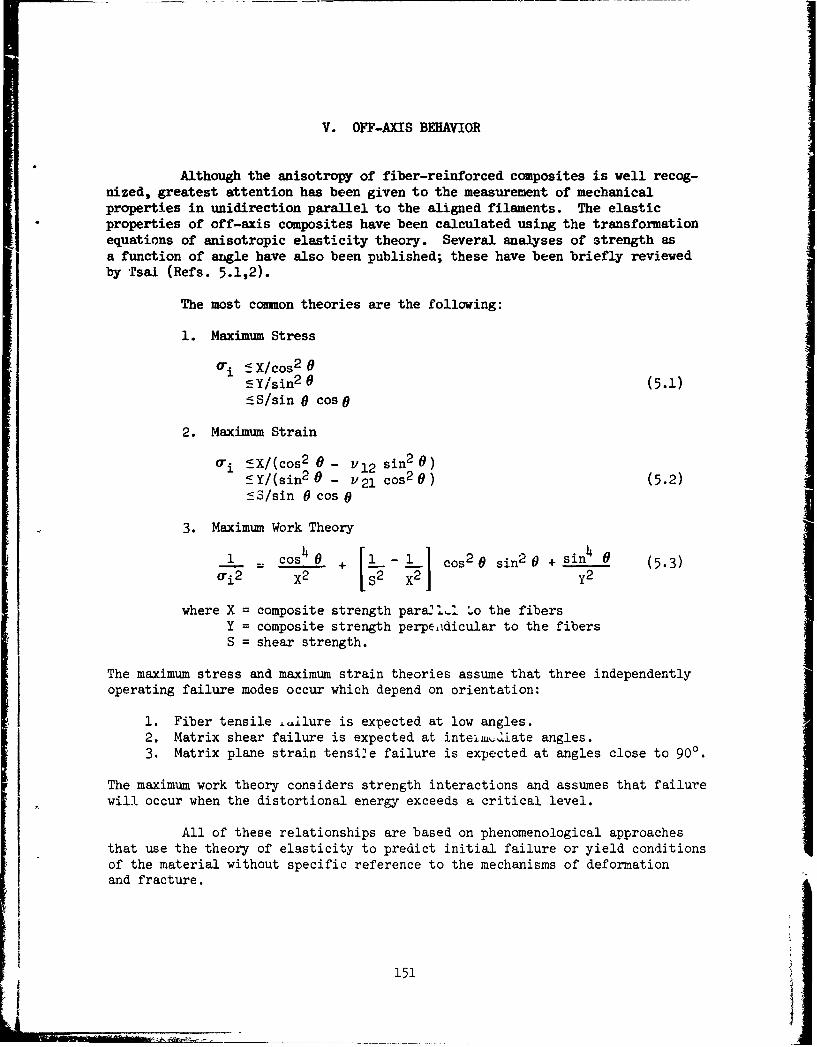
V. OFF-AXIS BEHAVIOR
Although the anisotropy of fiber-reinforced composites is well recog-nized, greatest attention has been given to the measurement of mechanicalproperties in unidirection parallel to the aligned filaments. The elasticproperties of off-axis composites have been calculated using the transformationequations of anisotropic elasticity theory. Several analyses of strength asa function of angle have also been published; these have been briefly reviewedby Tsai (Refs. 5.1,2).
The most common theories are the following:
1. Maximum Stress
•i -• X/cos 2 05 Y/sin2 0 (5.1):5S/sin 0 cos 0
2. Maximum Strain
•i !-X/(cos 2 0 - v12 sin2 0)
,_Y/(sin2 0 - V21 cos 2 ) (5.2)fS/sin 8 cos 0
3. Maximum Work Theory
__ = CO41 cos2 0 sin2 0 + sin 4' 0 (53i2 X2 72y2
where X = composite strength parasl2. .o the fibersY = composite strength perpeidicular to the fibersS = shear strength.
The maximum stress and maximum strain theories assume that three independentlyoperating failure modes occur which depend on orientation:
1. Fiber tensile ,!lure is expected at low angles.2. Matrix shear failure is expected at inte;iLu.iate angles.3. Matrix plane strain tensi2e failure is expected at angles close to 900.
The maximum work theory considers strength interactions and assumes that failurewill occur when the distortional energy exceeds a critical level.
All of these relationships are based on phenomenological approachesthat use the theory of elasticity to predict initial failure or yield conditionsof the material without specific reference to the mechanisms of deformationand fracture.
151* I

The off-axis behavior of 10 layer unidirectional 4.2 mil BORSIC plus50% by volume 6061-F aluminum matrix composite material was investigatedin two ways: using ordinary tensile testing at seven orientations with respectto the fiber axis and by measurements of sonic velocity.
In addition, samples of 63% by volume 5.7 mil BORSIC plus 6061-T6
aluminum composite materials were also evaluated using tensile tests.
5.1 Tensile Tests
Experimental Method
Six inch long unidirectional panels were fabricated with the followingfilament orientations: 00, 20, 50, 100, 300, 450, 600, 800, and 900. Straight-sided "IITRI" tensile specimens from these panels were then machined. An EDMtool was constructed for a six inch long reduced gage specimen that might bemore suitable for low angle tests than the IITRI design; specimtrs of this geometrywere also machined and prepared for testing.
It had been established (Refs. 5.3-7) that the testing teci~nique usedfor measuring off-axis properties was extremely important because cf the sensi-tivity of the test specimen to end effects such as constraint and ioments appliedby the gripping. (inder the influence of an off-axis load the shear coupling com-pliance S16 causes a rectangular specimen to distort into a parallelogram; ifthis distortion is restricted as a result of rigid clamping at the specimenends, a nonuniform stress state is induced in the material. The followingprocedures were adopted to minimize this testing problem:
1. Adhesively bonded aluminum doubler material was employed in gripattachment areas. Tnis layer was sufficiently strong in shear totransfer longitudinal load into t~he specimen and sufficientlycompliant to minimize transverse inte-'ation between the deformingspecimen and relatively massive fixturing.
2. Testing was performed using a fixture that permitted specimen rota-tion in order to accommodate shear coupling distortion (Fig. 5.1).The rotatir'a axis was positioned close to the restraint boundary aoas to n±Liimize the effective moment arm acting on the specimen.
3. The ratio of test specimen gage length tc width (1/w) was 10 to 1or greater to reduce the ratio of bending moment to tensile load.
Tests were conducted in an Instron Tensile machine. Rosette straingage instrumentation was needed to determine the state of stress in an off-axistest. Separate studies by L. E. Dardi have shown that strain rate effects canbe important in room temperature tests of +450 BORSIC-aluminum. Therefore,continuous load-strain recording equipment was used to monitor rosette straingage instrumentation on all specimens (Fig. 5.2). The strain rate in all tests
was 0.005 in./in./min.
152

A diagram of the coordinate system employed in this study is givenin Fig. 5.3; where x, y are the load axes and 1, 2 are the orthortopic axes.Two rosette orientations were employed in the off-axis testing; these aredepicted in Fig. 5.4. The results were interpreted in the following way:
In two dimensions, any linear strain can be expressed by the follovingrelationship:
Etq= xm2 + y n2 + Y mn (5.4)xy XY
where E9 = linear strain in gage directionx,y = reference coordinate systemm,n = cos9; sine
Therefore, in the case of Configuration I:
for 0 = 0°; E0 = (0 900 ; L-90 x=ey (5.5)0 = 450; E 4 = 6x/2 + Ey/2 + YXy/2
and 7XY = 2 4•5 - 60 -E90
In the case of Configuration II:
2or 0 = 0; '0 =x0 = 2700 =E-90 ; E_90 = y (5.6)9= 3150 =E-450; E-45 =6x/2 +Ey/2 - Vxy/2
and Yxy = -(2E45 - 690)
Thus, in an orthotropic material, it is necessary to distinguishbetween these configurations in order to obtain the proper sign of shear strain.
The compliance coefficients SII, S1 2 , and S16 were determined bymeasuring the ratios of strain to applied stress. The constitutive relationsfor an orthotropic bar in plane stress can be written:
ex = Sll Ox + S12cy + S16 TxY=y S1 2 (rx + S22 ry + S26 '
7 xy (5.7)Yxy = S16 - x + S26 Oy + S66 Txy
where the Si are the compliance coefficients with respect to the x,y coordinatesystem (Fig. 5.3). Therefore, under uniaxial tension, where 0- = Txy = 0,
Sl = Ex/ (5x)S1 2 = F.-/ or (5.8)O!6 7xy/(T x
Consistency -along the experimeiital results was checked using thetransformation equations (Refs. 5.8).
153
I --I •, .•,.v • ., c t,. ,• .. ... ... . . .
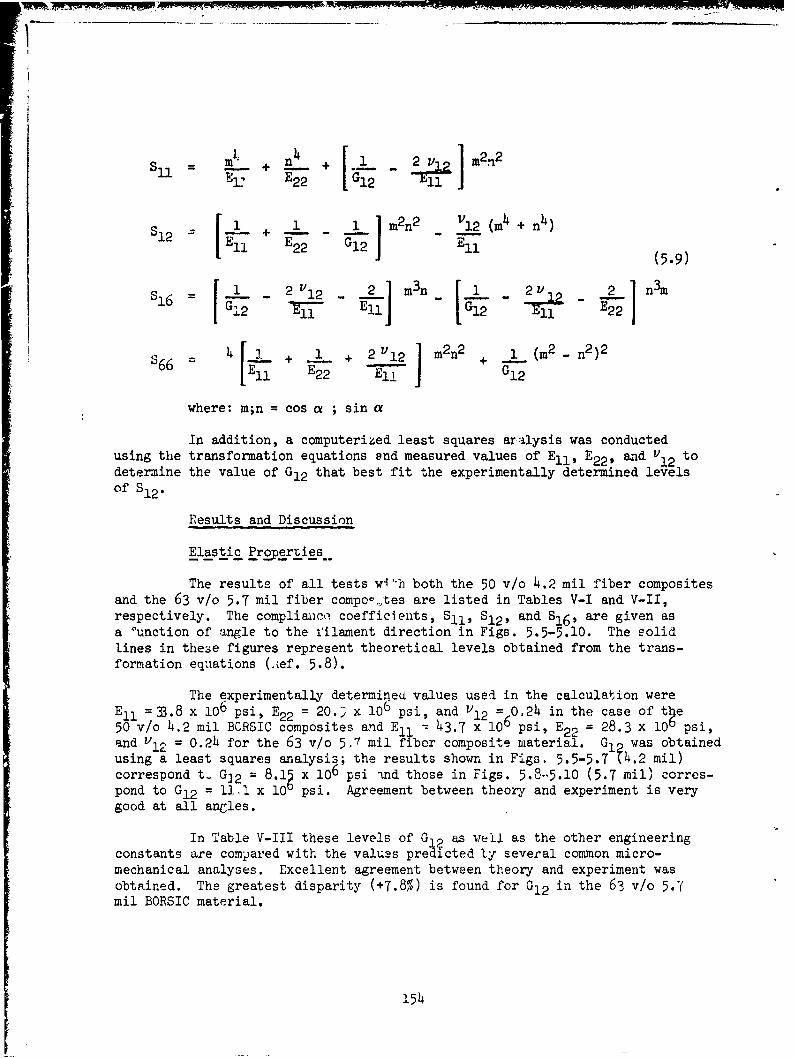
= + [+ 1 2 M122
IEl. E2 2 1ii
S1-2- +.i-L - G+2 ]m 2 n2 V12 (m4 + n4 )S2= Ell E 22 G2Ell (5.9)
16 U, 2 1= - El- 1 G1 2
f4 [_L + __1 + 2"12 ] m2 n2 + n2)2
S$66 LEll E2 2 E1 + G12
where: m;n = cos a ; sin a
In addition, a computerized least squares aralysis was conductedusing the transformation equations end measured values of Ell, E2 2 , and V12 todetermine the value of G12 that best fit the experimentally determined levelsof S1 2 .
Results and Discussion
Elastic Propert ies
The results of all tests wi'h both the 50 v/o 4.2 mil fiber compositesand the 63 v/o 5.7 mil fiber compoo-tes are listed in Tables V-I and V-lI,respectively. The compliaaico coefficients, S11, S1 2 , and S16, are given asa 'unction of angle to the filament direction in Figs. 5.5-5.10. The solidlines in these figures represent theoretical levels obtained from the trans-formation equations (.ef. 5.8).
The experimentally determined values used in the calculation wereEll =33.8 x 10⁶ psi, E2 2 = 20.3 x 10⁶ psi, and V1 2 0=O.24 in the case of t~e50 v/o 4.2 mil BCRSIC composites and Eli - 43.7 x 10⁶ psi, E22 = 28.3 X 10b psi,and V1 2 = 0.24 for the 63 v/o 5.7 mil fiber composite material. GI was obtainedusing a least squares analysis; the results shown in Figs. 5.5-5.7 U4.2 mil)correspond t- G]2 = 8.1 x i06 psi ind those in Figs. 5.8-5.10 (5.7 mil) corres-pond to G12 = 11,1 x 10 psi. Agreement between theory and experiment is verygood at all angles.
In Table V-III these levels of G12 as well as the other engineeringconstants are compared with the values predicted ly several common micro-mechanical analyses. Excellent agreement between theory and experiment wasobtained. The greatest disparity (+7.8%) is found for G12 in the 63 v/o 5.7mil BORSIC material.
154

In the case of the 50% 4.2 mil BORSIC + 6061-F material S1 1 increasesnearly monotonically from 2.96 x 10- 8 in 2 /ib at a = 0o (E11 = 33.8 x 10⁶ psi)to 4.88 x io-8 in 2 /lb at a = 900 (E22 = 20.5 x 10⁶ psi) as given in Fig. 5.5.The ratio of S11 at o = 650 (near maximum) to that at a = 900 is approximately1.01 as determined using the transformation equations with G1 2 - 8.15 x 10⁶ psi.The absence of a pronounced maximum in Sll (or minimum in EXI is due to the highshear modulus of the alurinum matrix. The impact of varying G1 2 at constant Ell,E22 . and V1 2 can be seen in Figs. 5.11-5.13. S12 is symmetrical about 45o (Fig.5.9). The average value measured at a = 00 is -0.70 x 10⁻⁸ in 2 /ib and at# a =900 is -o.,4 x io-8 in 2 /1b (V12 = 0.24); at a = 450, S12 = -1.56 x 10⁻⁸ in 2 /lb.
S1 6 is zero at a = 00, and rises to a maximum positive value ofapproximately 1.17 x 10⁻⁸ in 2 /ib near a = 300 (Fig. 5.7). At angles greaterthan 650, S16 becomes slightly negative r.nd then rises to zero at a = 900. Thus,in the elastic range the BORSIC fibers rotate away from the axis of applied loadwhen the loading angle is less than 650 but greater than 00, and rotate towardthe load axis at higher angles. This behavior is similar to that reported forboron-epoxy (Ref. 5.9). The elastic behavior of the 5.7 mil BORSIC + 6061-T6material is similar to that of the 4.2 mil BORSIC material and will not be dis-cussed in detail. The results of these tests indicate that the amount of shearcoupling in BORSIC-aluminum ic small. The material is much less orthotropicthan polymeric matrix composites such as boron-epoxy.
StrengthProerti e s
Typical s~ress-strain curves for 50 v/o 4.2 mil BORSIC + 6061-F aluminumand 63 v/o 5.7 mil BORSIC + 6061-T6 aluminum materials are given in Figs. 5.14-5.17. The maximum normal fracture strain (1.2%) of the 4.2 mil BORSIC + 6061system is found at 300. At 00 the longitudinal fracture strain of the filamentlimits the strain of the composite, whereas at 900 the fracture strain of 4.2mil material is determined by tbe transverse strain capability of the fiber(splitting). The 00 and 900 normal fracture strains of 5.7 mil material aredetermined by the strength of the fibLrs and the matrix, respectively. Theseeffects are discussed in greater detail in the Transverse Properties sectionof this report.
The maximum coupled ultirLAte shear strain occurs near 100 (> 2.0%)for 50 v/o 4.2 mil BORSIC + 6061-F material. Insufficient tests were conductedto determine the angle of maximum ultimate shear strain for 63 v/o 5.7 milBORSIC + 6061-T6 material. The largest values obtained at 450 averaged 1.3%compared to approximately 0.6% for the 4.2 mil BORSIC 3ystem at the same angle.
The tensile strength of both materials is given as a function ofangle in Figs. 5.18-5.19. Calculated strengths using the maximum stress,Eq. (5.1), maximum strain, Lq. (5.2), and maximum work theory, Eq. (5.3) azealso plotted in Figs. 5.18-5.19. Fbr 4.2 mil BORSIC + 6061-F material averageexperimentally determined strengths at 00 and 90' were used for X and Y. Thevalue of S (shear strength) employed was 14.0 x 10³ psi as determined in otherexperimental work at United Aircraft Corporation b. K. M. Prewo.
155
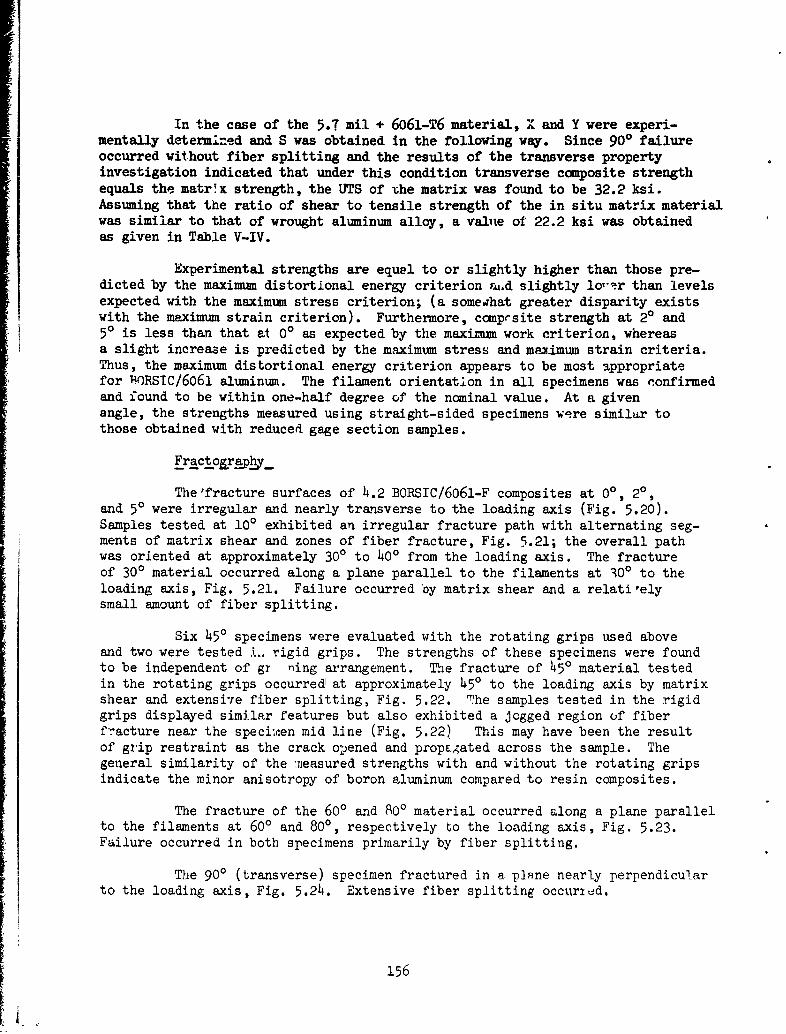
In the case of the 5.7 mil + 6061-T6 material, X and Y were experi-mentally determined and S was obtained in the following way. Since 900 failureoccurred without fiber splitting and the results of the transverse propertyinvestigation indicated that under this condition transverse composite strengthequals the matr~x strength, the UTS of the matrix was found to be 32.2 ksi.Assuming that the ratio of shear to tensile strength of the in situ matrix materialwas similar to that of wrought aluminum alloy, a value of' 22.2 ksi was obtainedas given in Table V-IV.
Experimental strengths are equel to or slightly higher than those pre-dicted by the maximum distortional energy criterion &zd slightly lo,'•.r than levelsexpected with the maximum stress criterion; (a somedhat greater disparity existswith the maximum strain criterion). Furthermore, ccmprsite strength at 20 and50 is less than that at 00 as expected by the maximum work criterion, whereasa slight increase is predicted by the maximum stress and maximum strain criteria.Thus, the maximum distortional energy criterion appears to be most appropriatefor 1RORSIC/6061 aluminum. The filament orientation in all specimens was confirmedand found to be within one-half degree of the nominal value. At a givenangle, the strengths measured using straight-sided specimens were similar tothose obtained with reduced gage section samples.
Fract o~ra~ph_
The'fracture surfaces of 4.2 BORSIC/6061-F composites at 00, 20,and 5' were irregular and nearly transverse to the loading axis (Fig. 5.20).Samples tested at 100 exhibited an irregular fracture path with alternating seg-ments of matrix shear and zones of fiber fracture, Fig. 5.21; the overall pathwas oriented at approximately 300 to 400 from the loading axis. The fractureof 300 material occurred along a plane parallel to the filaments at 300 to theloading axis, Fig. 5.21. Failure occurred by matrix shear and a relatirelysmall amount of fiber splitting.
Six 45' specimens were evaluated with the rotating grips used aboveand two were tested L. rigid grips. The strengths of these specimens were foundto be independent of gy ning arrangement. The fracture of 450 material testedin the rotating grips occurred at approximately 450 to the loading axis by matrixshear and extensive fiber splitting, Fig. 5.22. The samples tested in the rigidgrips displayed similar features but also exhibited a jogged region of fiberfracture near the speci,,en mid line (Fig. 5.22) This may have been the resultof grip restraint as the crack opened and propEAated across the sample. Thegeneral similarity of the xeasured strengths with and without the rotating gripsindicate the minor anisotropy of boron aluminum compared to resin composites.
The fracture of the 600 and 800 material occurred along a plane parallelto the filaments at 600 and 800, respectively to the loading axis, Fig. 5.23.Failure occurred in both specimens primarily by fiber splitting.
The 900 (transverse) specimen fractured in a p1pne nearly perpendicularto the loading axis, Fig. 5.24. Extensive fiber splitting occuried.
156

Fracture surface features of the 63 v/o 5.7 mril OPRSIC + 6061-T6 materialwere similar to those of the 4.2 ail material at 00 but fundamentally differentat 100, 300, 450, and 900. Fiber splitting was nearly absent from all specimensand confined almost entirely to regions adjacent to machined surfaces. Viewsof 100, 300, and 450 fractures are given in Fig. 5.25. A transverse photomicrographof this material is given in Fig. 5.26.
5.2 Sonic Velocity Measurements
Experimental Method
One inch diameter wafers of BORSIC plus 50% by volume 6061-F aluminumalloy matrix were prepared by electrodischarge machining of hot press diffusionbonded laminates of plasma sprayed monolayer tapes. The sonic velocity acrossthe diameters of two wafers was measured as a function of angle from the filamentorientation using the apparatus shown in Fig. 5.27.
A Hewlett Packard Model 214A pulse generator provided a triggeringsignal for an Arenberg Model PG 650C pulsed oscillator and Tektronic type 556oscilloscope. A one cycle, 1 MHz, signal was emitted by the pulsed oscillatorwhich activated a damped BronEin Z-701-C 1 MHz transducer. The wave was detectedby an undamped transducer positioned on the opposite edge of the specimen. Thesignal was then conditioned by an Arenberg Model PA-620 preamplifier and an Aren-berg Model LFA-550 low frequency amplifier, and displayed on the oscilloscope.
Sonic velocities in the composite disc were calculated using the dis-tance between the transducers and measurements of time obtained with theoscilloscope. The latter were calibrated using aluminum bar stock of knowndimensions and sonic velocity.
Results and Discussion
Sonic velocity measurements were made at ten angles relative to thefilament orientation. The results expressed as material density times the squareof sonic velocity are given in Fig. 5.28. Young's modulus (11S11 ) was determinedfrom thesc measurements using the following relationship (Ref. 5.10):
E = PVE2 [l( + iV (1-aV) (5.9)
where E = elastic modulus
VE = velocity of soundP = material mass densityV = Poisson's ratio
This expression results from an analysis of extensional wave propagation in elasticisotropic homogeneous plates. BORSIC/aluminum is neither homogeneous nor iso-tropic, and Poisson's ratio is an elastic constant that varies with the angleof orientation relative to the direction of filament alignment. However, thisrelationship had been applied to determine composite material moduli using a
157
I

constant Poisson's ratio of 0.23 by Zurbrick (Ref. 5.10). Therefore, if
V 0.23
E = PVE2 (0.863) (5.10)
Using Eq. (5.12) longitudinal and transv, se moduli of 32 x 106 to33 x 106 psi and 18 x io1 to 20 x 106 psi, respectively are obtained. Thesevalues are close tobut slightly below 6results established by tensile testing,which are 33.8 x LP psi and 20.5 x 10 psi respectively.
The accuracy of moduli obtained in this way for off-angles such as450 (22 x 106 to 23 x 106 psi) can be assessed in two ways. Direct comparisonwith the results of mechanical tests at 450 (21.5 x 10⁶ psi) indicates they areapproximately 5% too high. In addition, an indirect assessment can be madeusing the functional relationship between modulus and angle due to Tsai (Ref.5.8):
4 22 4=m + --- 2%T~ 2 + (5.11)
E ELG LT ET
where E = Young's modulusm = cos
n si 7EL = ,ngitudinal modulusET = .ransverse modulus
G LT = sh-ar modulusULT - ma,;or Poisson's ratio
Using EL = 32.5 x 10⁶ psi, ET = 19.0 x 10⁶ psi.,, = 0.23 and fitting Eq. (5.11)
to the values of off-axis modulus, one ob+ains a value of GLT of approximately9 x 106 psi. This value is approgimately 10% higher than the value obtainedusing mechanical tests, 8.15 x l0 psi.
In BORSIC-P.uminum these disparities are of a similar order as theuncertainty in measurements and resultizg values may be useful. However, muchgreater errors arise with polymeric matrix composites such as boron-polyimide(Ref. 5.11). Off-axis moduli determined using the assumption that E (or 1/S11)is directly related to pV 2 E by Eq. (5.10) lead to values of shear moduli higherthan those measured by other tests.
Reuter gives an analysis of wave propagation in an orthotropic platein plane stress leading to the following relationships (Ref. 5.12):
V2 2 2(.2P I(L+N) - [(L-N) 2 + 4M211/21 ('.12)
VSE = 2~S-E = 2(5.13)
PI(L+N) + [(L-N) 2 + 4M2]-/2 .
158
where VES = extension-shear wave velocityVS-E = shear-extension wave velocity
L = s6 6 - s36/s22M = Si6 - SN =S 1 1 - SF/S22
Sij compliance coefficients
For the special cases of longitudinal and transverse orientations, these expres-sions reduce to the following:
Ell = pVE2 (l - E2 2 /EII v 12 2), 9 = 00 (5.14)
E22 = PVE2 (1 - E2 2 /EII v1 2 2), 9 = 9g0 (5.15)
G12 = PVS2 0 = 00 or 0 = 900 (5.16)
Equations (5.12) and (5.13) indicate that Ell and E2 2 are not simply proportionalto density times the square of the proper wave velocity as in Eq. (5.9).
The ratio of 0.863 PVE2 to E was calculated as a function of angleusing Eqs. (5.11) and (5.12) and is given in Fig. 5.29. The results show thatE (1/S11) is underestimated at low and high angles and overestimated at inter-mediate orientations (250 to 500). The combined effect results in a largeroverestimate of G1 2. In addition, the assumption that the direction of energypropagation is coincident with transducer orientation which was used to calculatethe sonic velocity is not valid at all angles in fiber reinforced comnosites becausethe wavefront is not spherical and wave interference effects can arise (Ref. 5.13).Thus, considerable attention must be given to experimental technique, particularlyin more orthotropic systems.
Theoretical values of P VE2 are given with the experimental data inFig. 5.29. Experimental values are approximately 8% higher than the theoreticallevel (Reuter) at 00 which represents the greatest point of disparity. Since Pcan be accurately determined, the greatest disparity in VE is approximately 4%.
5.3 Conclusions
1. Off-axis tensile testing of BORSIC + 6061 aluminum can be uLL 1! todetermine elastic and strength properties as a function of orientation withoutsignificant complications due to system orthotropy.
2. The elastic constants of BORSIC + 6061 are within 8% of the valuespredicted by micromechanical analyses and the variation of elastic propertieswith a. 4le is consistent with expectation based on the transformation equations.
3. The ultimate strength of BORSIC + 6061 composite material as afunction of angle is well represented by the maximum distortional energy failurecriterion.
159
4. The extensional wave velocity, VE, measured in BORSIC + 6061 as
a function of angle to the filament direction are within 4% of the values pre-dicted by the Reuter analysis which includes shear coupling effects.
5. Off-axis BORSIC + 6061 elastic moduli determined using t eassumption by Zurbrick that E (1is11 ) is directly proportional to p VE leadto values of G12 that are approximately 10% higher than those determined byother methods. The error would be greater in the case of more orthotropiccomposite systems.
160

SECTION V - REFERENCES
1. S. W. Tsai, "Strength Theories of Filamentary Structures, FundamentalAspects of Fiber Reinforced Composites", Interscience Publishers, 1968.
2. V. D. Azzi and S. W. Tsai, Exp. Mech., 1965.
3. N. J. Pagano and J. C. Halpin, J. Composite Materials, Vol. 2, p. 18, 1968.
4. R. R. Rizzo, 1. Composite Materials, Vol. 3, p. 202, 1969.
5. E. Wu and R. Thomas, J. Composite Materials, Vol. 2, p. 523, 1968.
6. G. L. Richards, T. P. Airhart, and J. E. Ashton, J. C ijosite Materials,Vol. 3, p. 586, 1969.
7. J. E. Ashton, J. C. Halpin, and P. H. Petit, Primer on ComipositeMaterials: Analysis, Technomic Publishing Co., p. 98, 1979.
8. S. W. Tsai, "Mechanics of Composite Materials Part II: TheoreticalAspects", Technical R.eport AFML-TR-66-149, Nov. 1966.
9. N. J. Pagano, "The Importance of Signs of Shear Stress and Shear Strainin Composites", J. Composite Materials, Vol. 3, p. 166, 1969.
10. J. R. Zurbrick, "Development of Nondestructive Tests for PredictingElastic Properties and Component Volume Fractions in Reinforced PlasticComposite Materials", Contract F33615-67-C-1285, Tech. Report, AFML-TR-68-233, Sept. 1968.
11. L. E. Dardi and F. J. Vicki, Pratt & Whitney Aircraft, Unpublished work.
12. R. C. Reuter, J. Comp. Materials, Vol. 4, p. 129, Jan. 1970.
13. Private Communication, Prof. Pao, Cornell University.
14. R. Hill, "Theory of Mechanical Properties of Fiber-Strengthened Materials:I. Elastic Behavior", J. Mech. Phys. Solids, Vol. J.2, p. 199, 1964.
15. J. J. Hermans, "The Elastic Properties of Fiber-Reinforced Materials Whenthe Fibers are 4ligned", Koninklijke Nederlandse Akademic Van Wetenschappen,Amsterdam Proceedings, Series B, Vol. 70, No. 1, p. 1, 1967.
16. A. R. Zecca and D. R. Hay, "Elastic Properties of Metal-Matrix Composites",J. Composite Materials, Vol. 4, p. 566, 197o,
17. J. C. Halpin and S. W. Tsai, "Environmental Factors in Composite MaterialsDesign", AFML-TR-67-423.
161
SECTION V - REFERENCES (Cont'd)
18. Hashim and B. W. Rosen, "The Elastic Moduli of Fiber-Reinforced Materials",J. of Applied Mechanics, p. 223, June 1964.
19. K. R. Van Horn, ed., Aluminum, Vol. 1, Properties, Physical Metallurgy,and Phase Diagrams, American Society for Metals, Metals Park, Ohio, 1967.
162
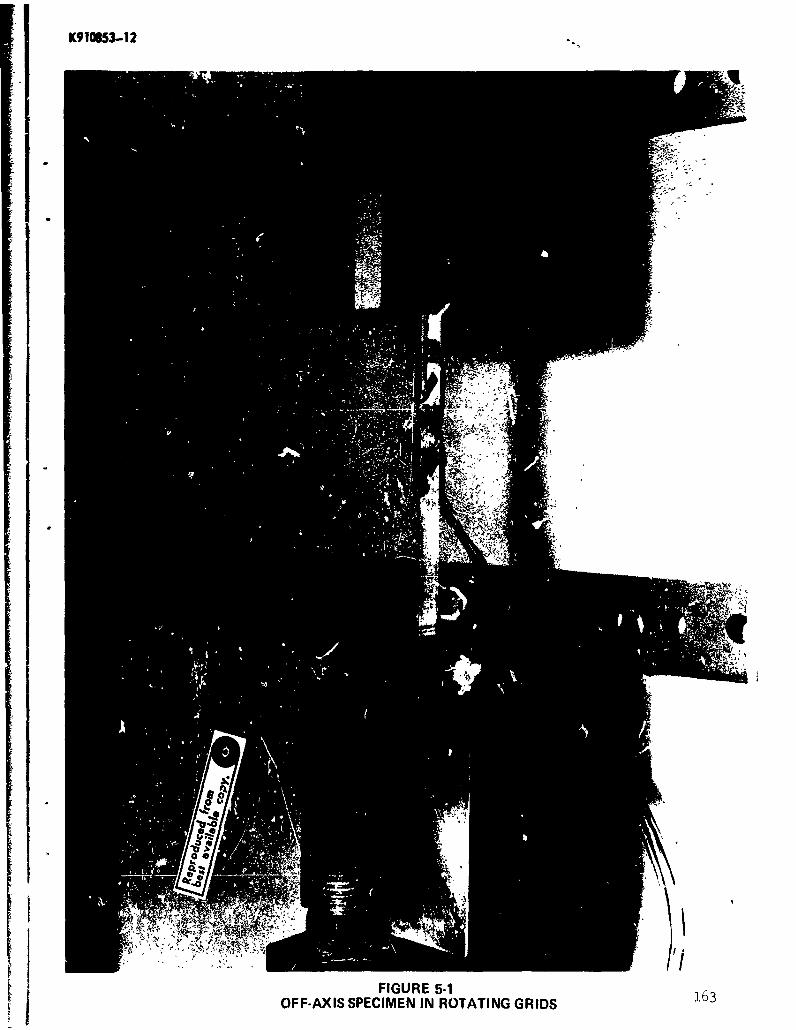
K910853-1 2
FIGURE 5-1 16OF F-AXIS SPECIMEN IN ROTATI NG G RIDS16
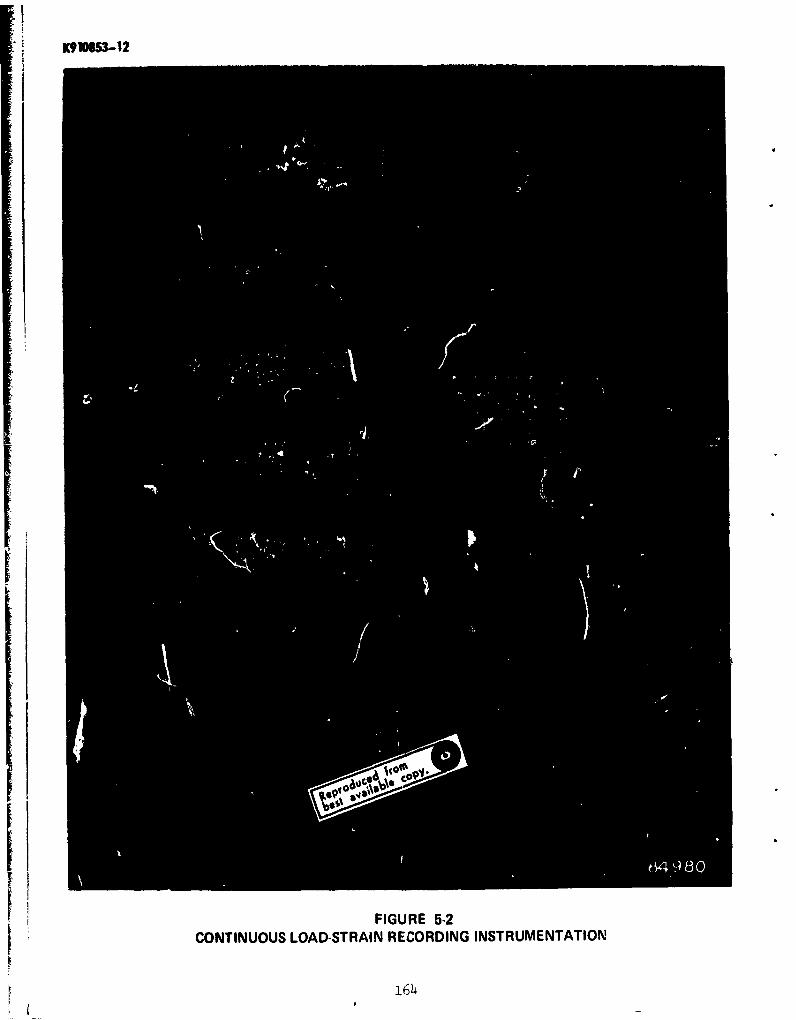
K9=053-12
FIGURE 5-2CONTINUOUS LOAD-STRAI N RECORDING INSTRUMENTATION
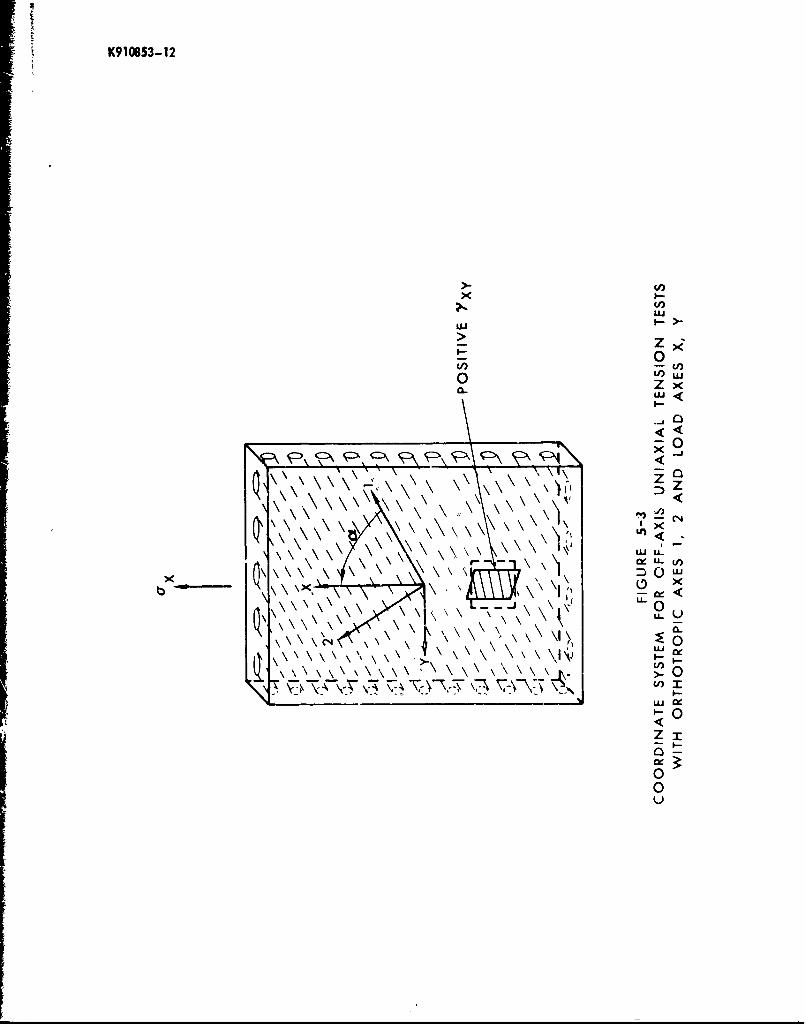
K910653-12
(jiuI-
1-- 0V) - cn
00LI<
D z
L-o0
CL u
uj w
-I \ 0
0-
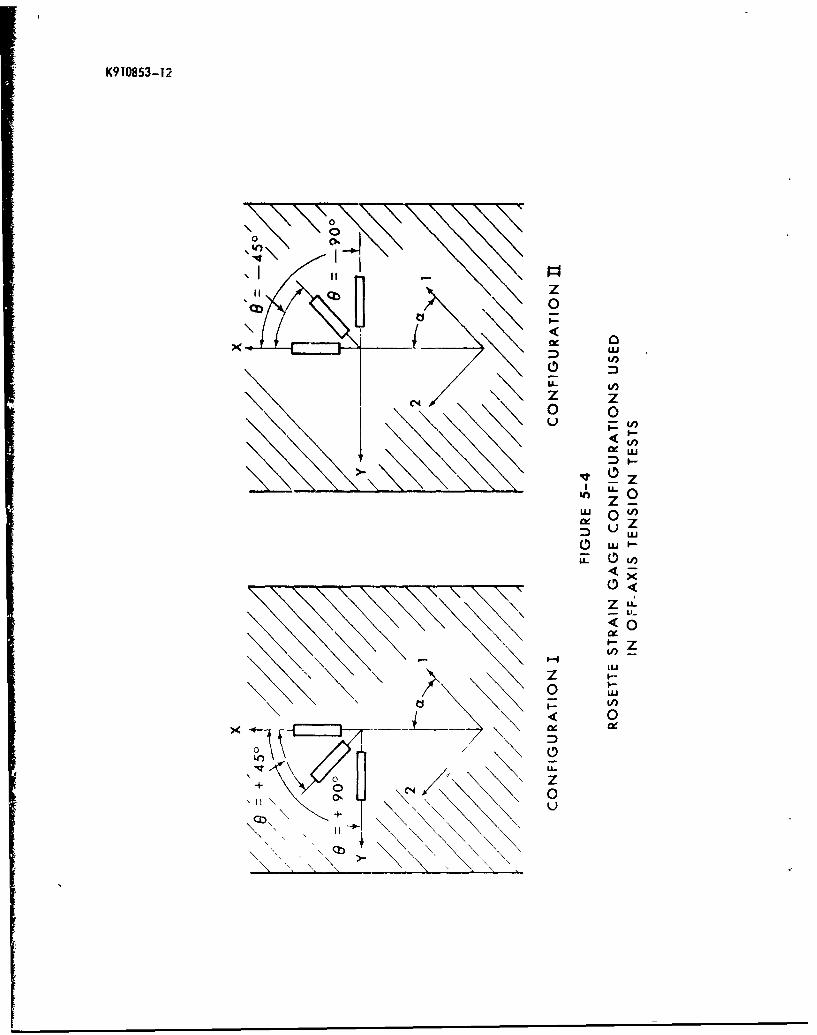
K910853-12
CM z0 0
L A -
z -
zLA-LLJ
<0
CIE
LUJz0 wL
0__ Cr Ix
'II 1D
+O
\ 7 -I
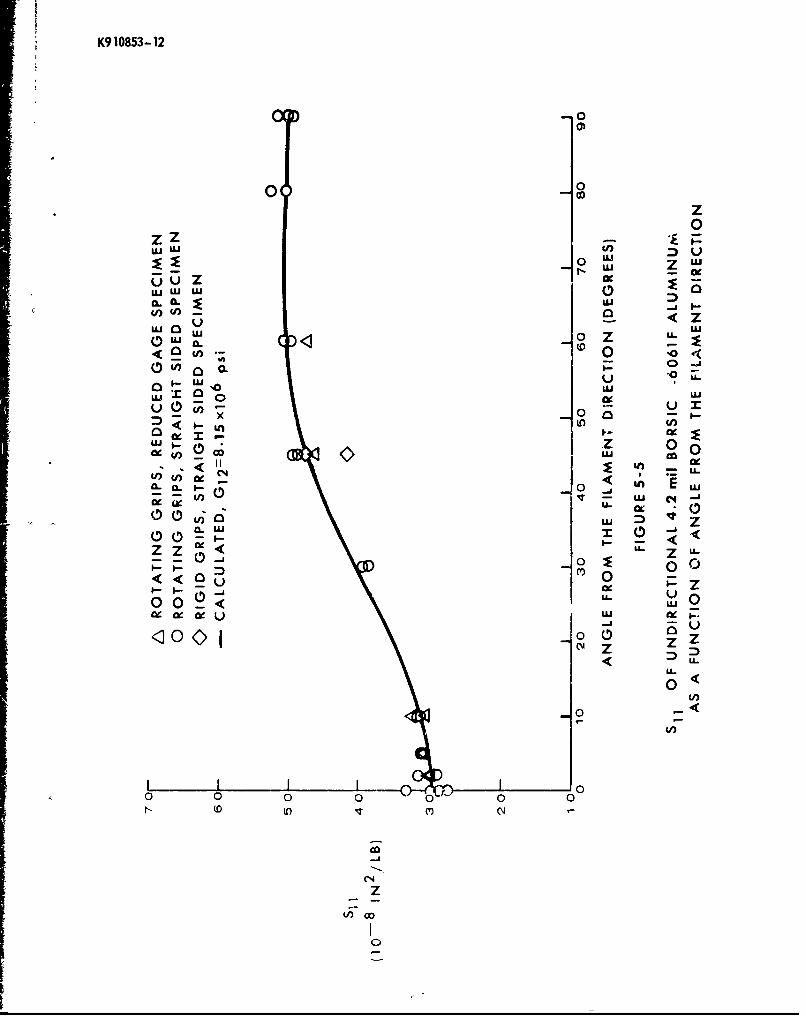
K910853-12
-0
0 0D
z0
Z Z -0-
LWjUJ LU
CL ft .I I 0
u z
in n;;(D0 o-'in 0. 0-
-,o L-
-u x 0 -a-.j
L) Zo--;II
aa 1. S 0 Eu
Ci-e 00 -. czz < IL
IT LU LuIx &
U ad
0 0 L0
N- (0
-J-
00
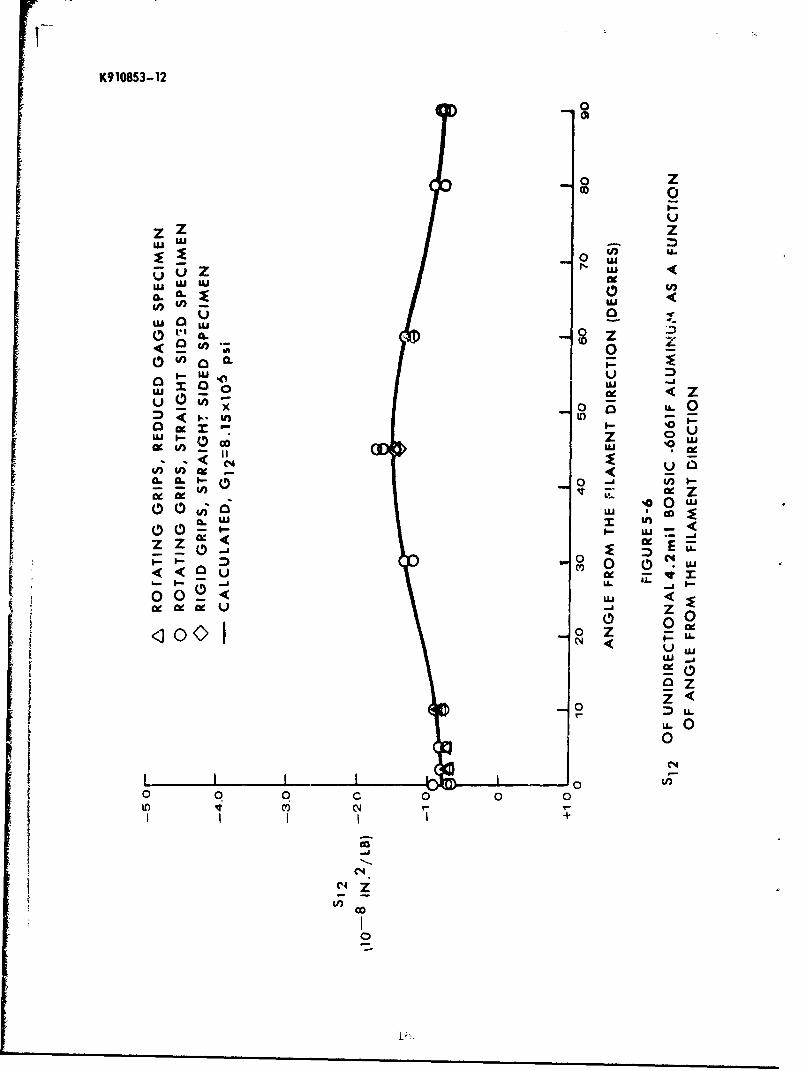
K910853-12
00
o Zz
U.
gou 00u h
<Cu, o L
0LU.
ýow0 -d
UJ I-- z uOO'Ue
I.- LI
0 -j
u I
X_
0 ixo 0 0 07 u.
-J-
00

1(91063-12
z
0
U.
0 U
0 A
ui 2U- IL' L - 94(
LLJ iA
IV)IL
0 0 cc
< -a
(4 0 C4
0 -j 0
LU 0 Z U
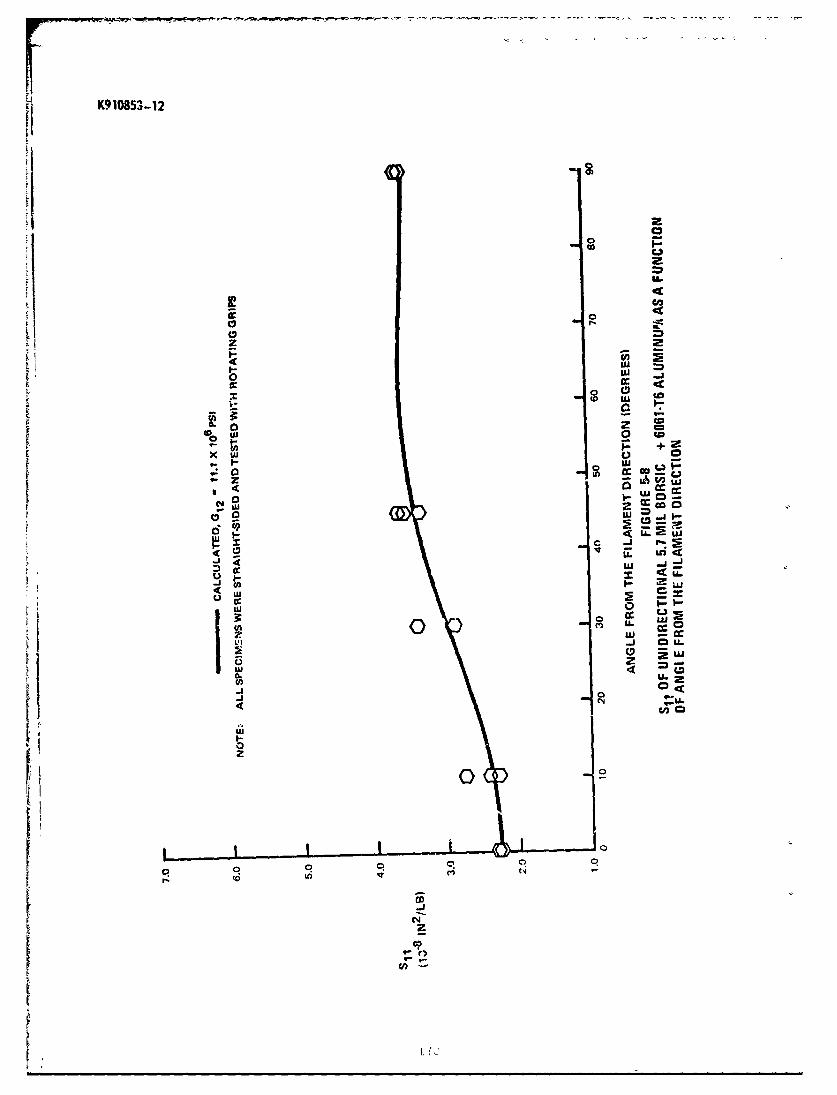
K910853-12
iii
0
UA
0
w 0
00 0
0U x
U. 0- - ui -
-z z
C,
IIN
0
C?0
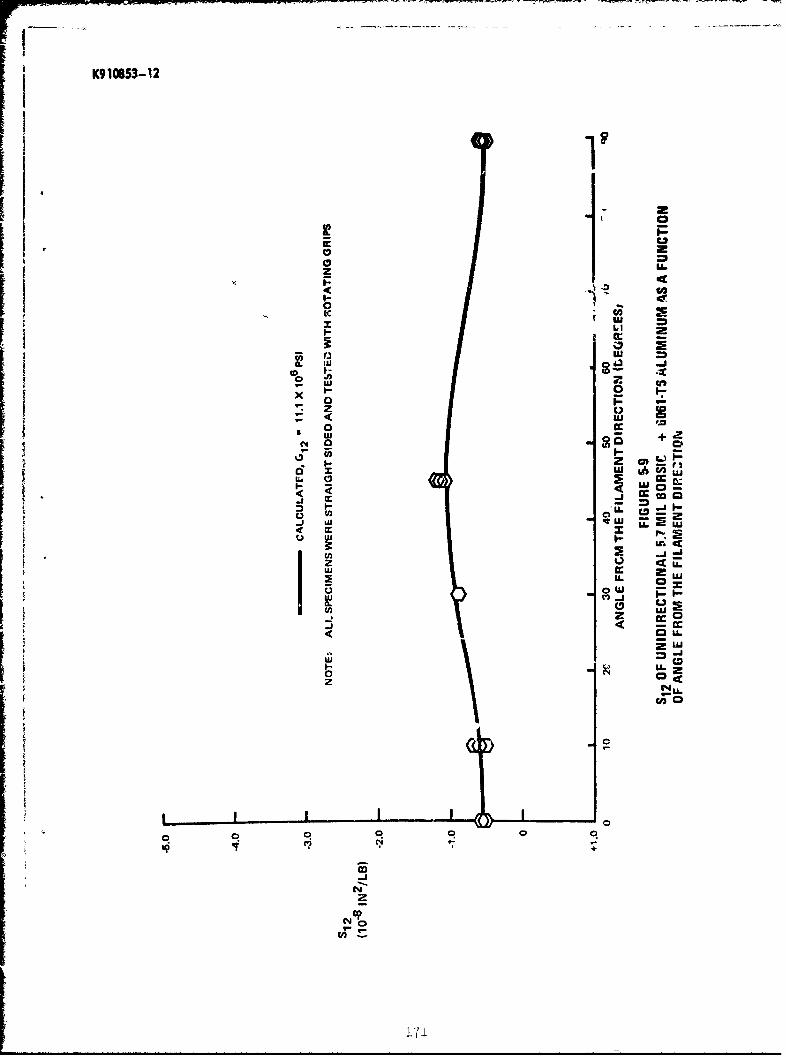
K9106S3-12
Vz
2!
0 '3o U.
w cn
z I-) cD*
C4 0
z ca
LU 0
V) a L
LL, w z.
IU x3w
U..... c c,~ z-I-
%U-
-j _j
oc
IC 0
00
I-
1.71
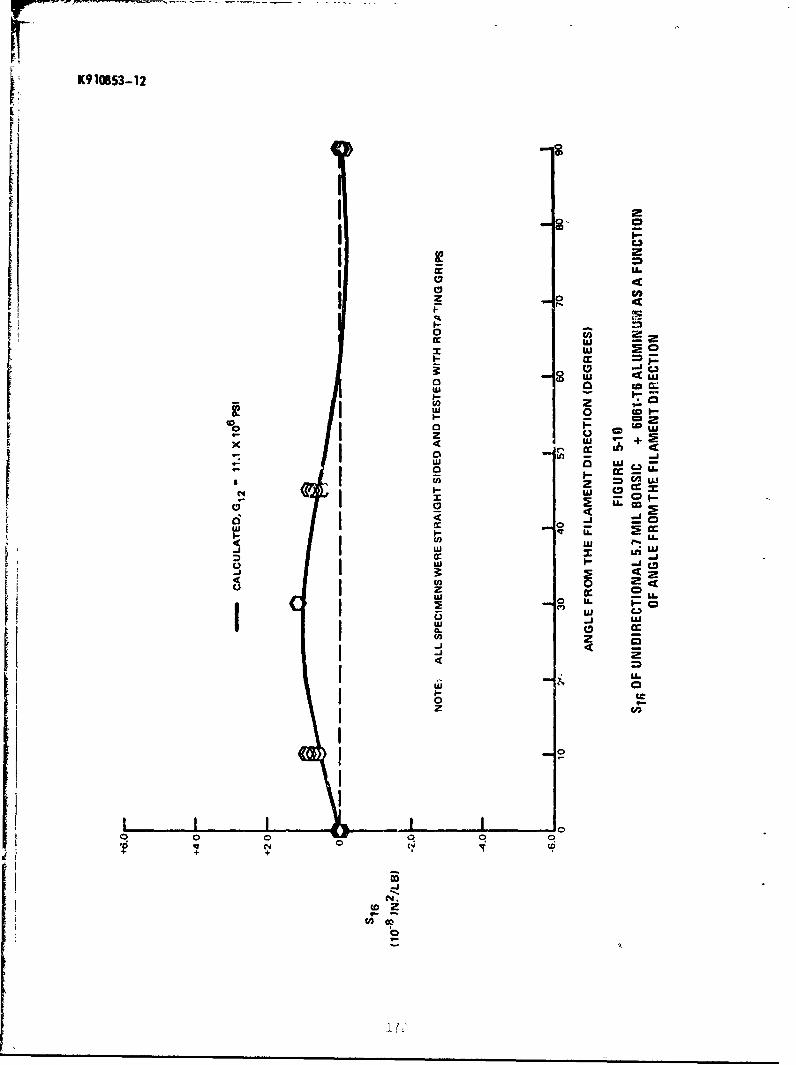
K910953-12
I 20
2
z 0
w -
Z CM
U.
ca a
a cc
I IrW IJ 0
-J w A
w j Lw
-iJ
0 9-'
N.0
0
+H
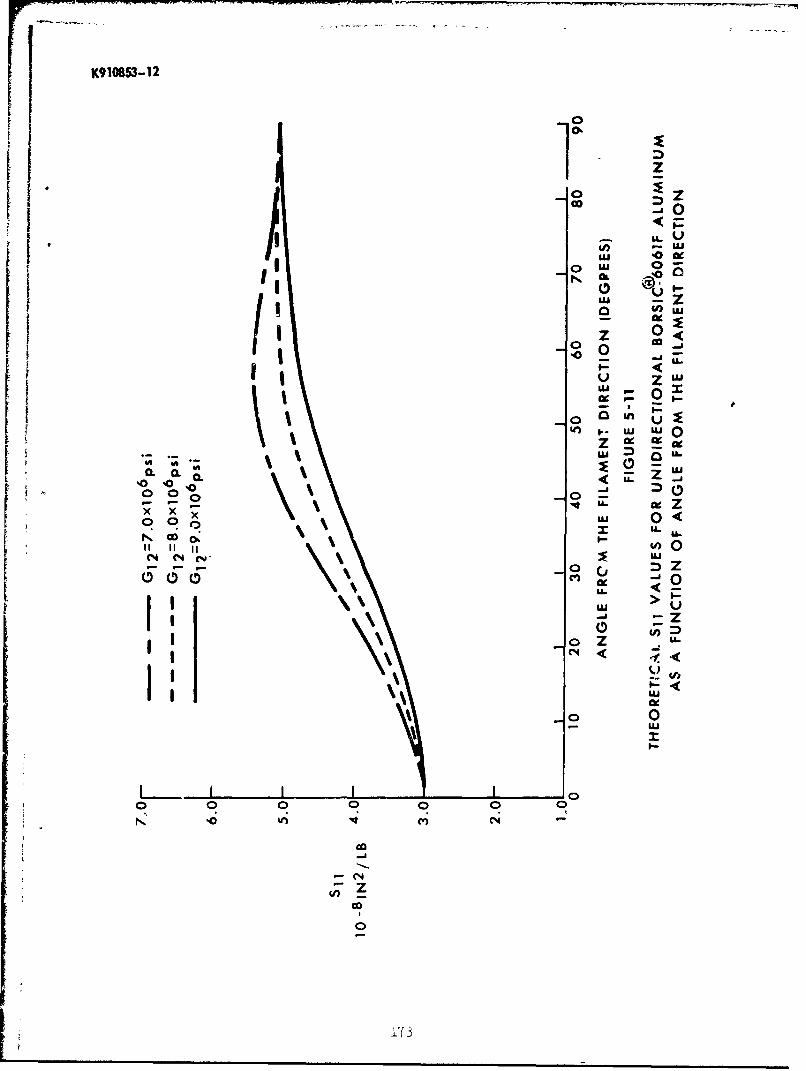
K910853-1 2
z
L0 0
40 -0LU-
-0OL
0(I zz 0-
0 LL.u Z U
I t .. Lu LU 0
z ix e
10%0 .0 0o--
LU 0< U
C.4 (N
LU
- LU
I-
00
VT3

K91,0853-12
0-
zGoz
Ii 0I.-
'L
C, l
IU 'o
0<
ui U U)
000~~ 0cc0 0
P _jLL
u 4 .
-I 4
1* 51 .

K91CM53-12
z
oU.
"Io 00
0
ill,-I~ U toJ0, o X
IlI
u uL
II LU
Z a
xxL L
ILi CL Q%0 'o %0 0 -t
IItv II II
(N(NCLL- -I
000 LU
+ + +
(/) Z
0D
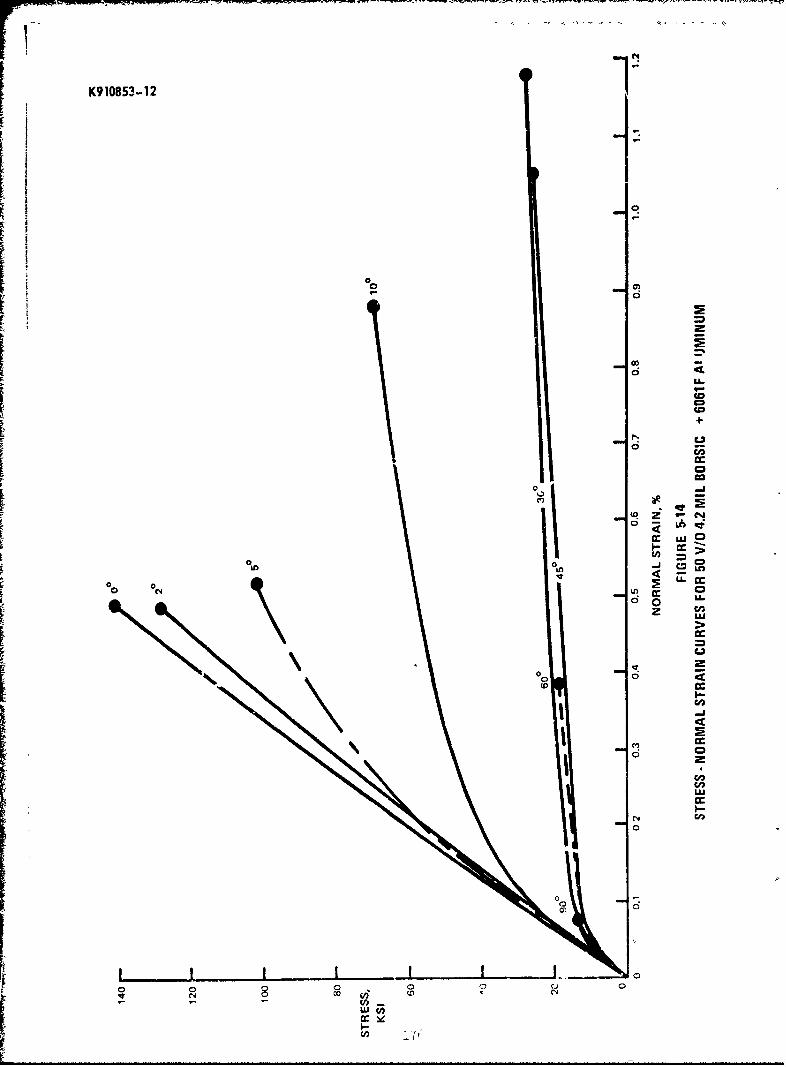
K910853-12
000
-W
co
C2
cc000
a -I
= C=
oln - C.2L
00 c
0 Uz z
0C 0to
0 0D7
C,,
00
0 0 0
0 C8 00 0NW (w

K910853-12
0 M
0 -C
U.
00 -
-- Co%=
4LLu
wU 0
woo >
09)
U~L)
gn
LU
LU)
1 C,7
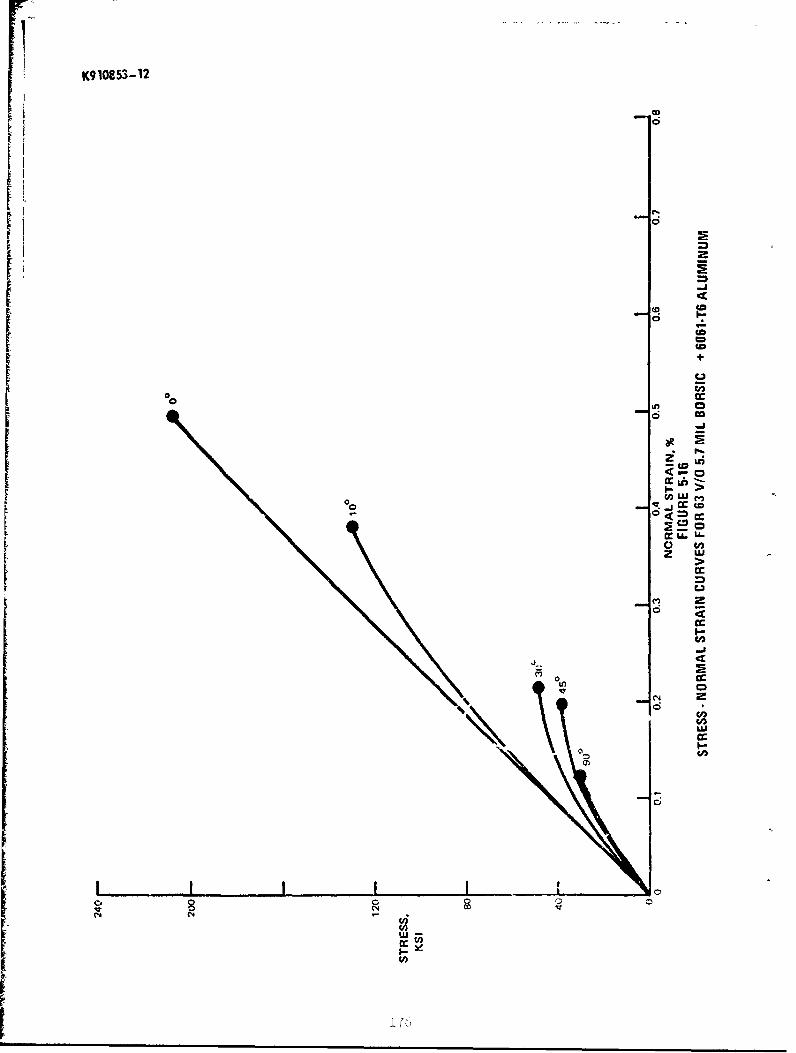
K910853- 12
Lii
r +00c
, 2F
o D
0 to
Z 2i>
%S. a:Uin
010);
6i
I Icc
Cj 0 0 0
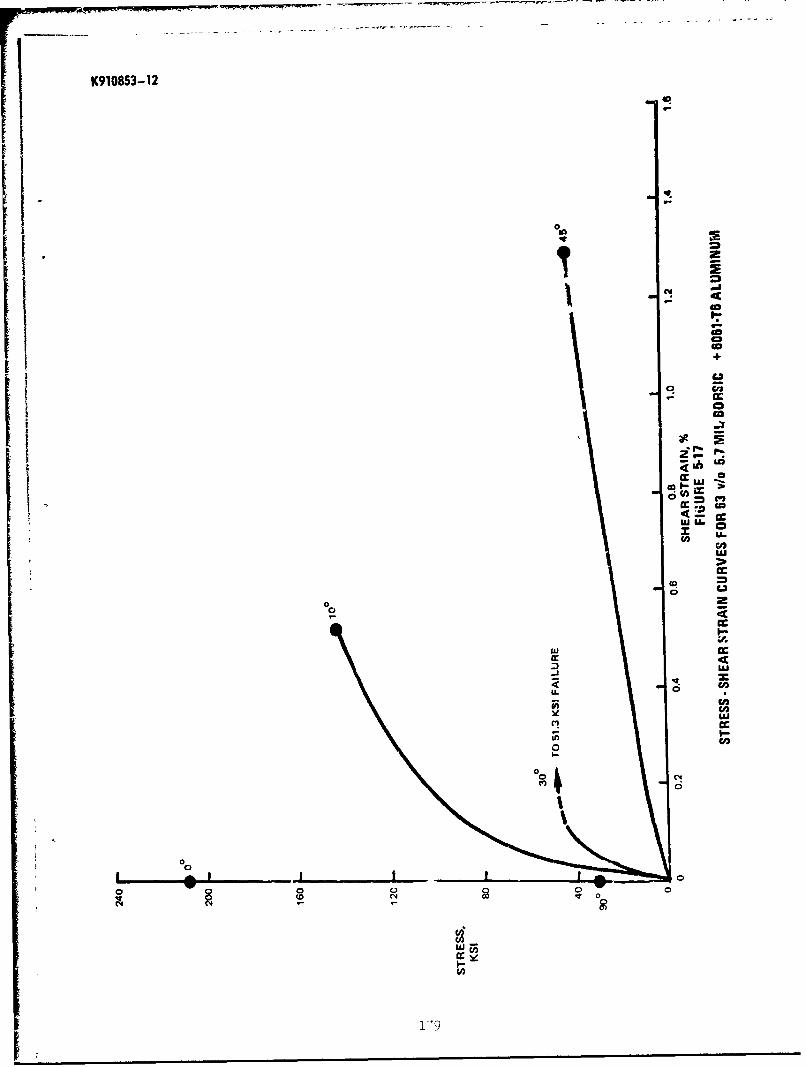
K910853-12
010H. t0
I.Di
.3c-
+
ca
ca
.A
2F n
co.1 z
fmg
I"-
w
-aa
U. CAU
00
99 60
I I7-1ri - •r

K910853- 12
00
W2 w
0. r0
i L 0
Z2 0 o w-
p0 I-
/ t0 ý CAk x 14LU 2a/1 00 LO
-22 -
00 0 0 0 0 j: = 00 C. 0 -0 O ~ ~ !. ~ C. (N <
1 0
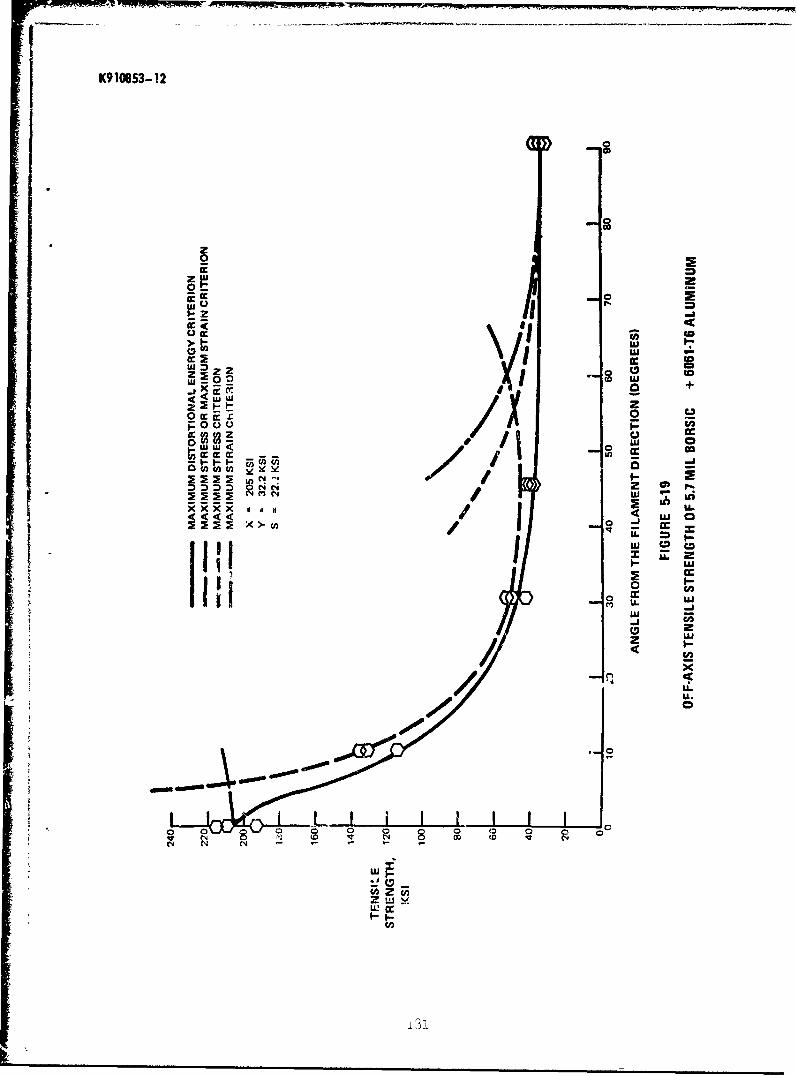
K910653-12
00
z2 5 2z
< U
0 +M 0
000 w <acc i1
Vi W I-to U ýe !./
II' 2 InNrLu o
B~bI0w -o
(D 'z
LL.
00.0
Zw'
Le~I-i
13-

K910853-12
00
S-A
N r.o*
C.4
0 0')
'C%0'a
L0L0.0-
C-,
wW
W C
p ~iZ
InuOr
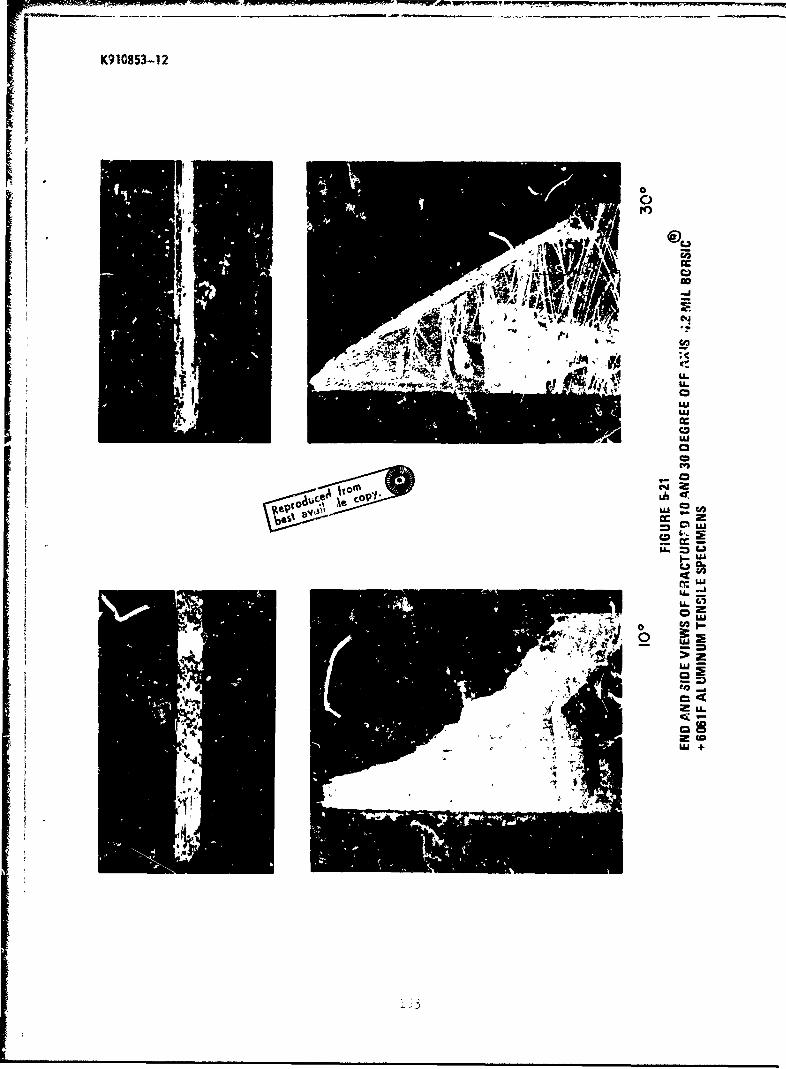
K910853-.12
0
0
'LIu~unI cc
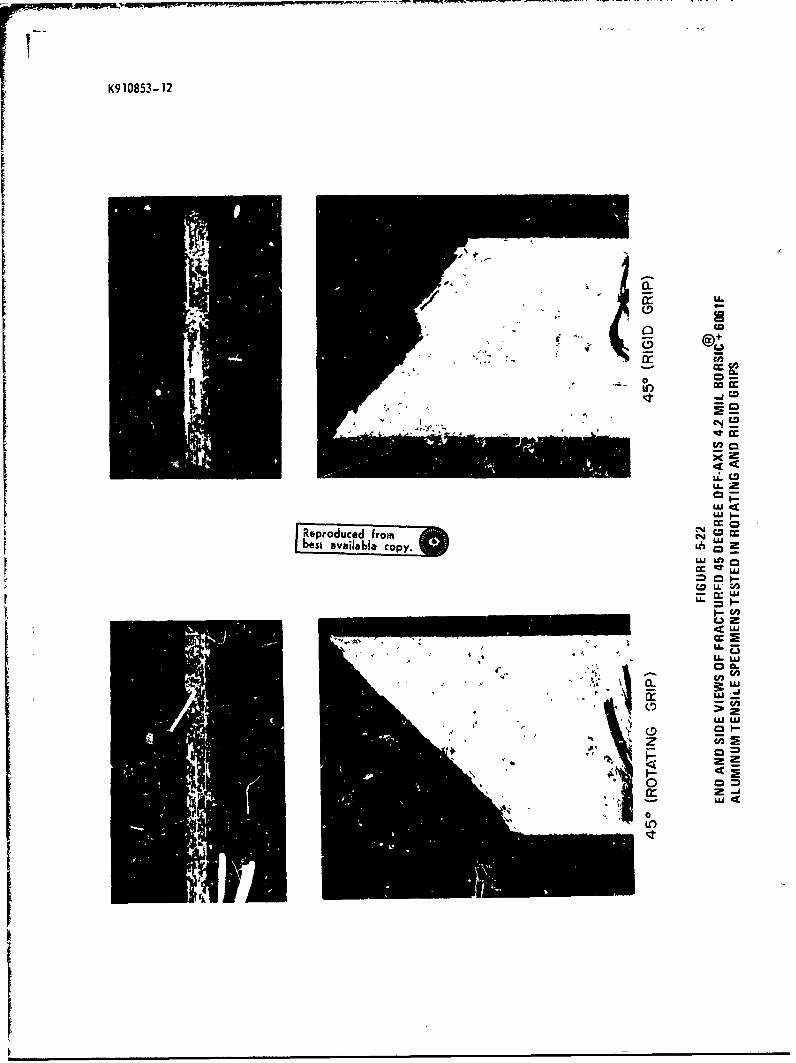
K910853-12
*.r Cm
U..
IReproduced fro CDJ
býeis availabler COPY. L
CA3
00.
'C)a
':-w
I0___i
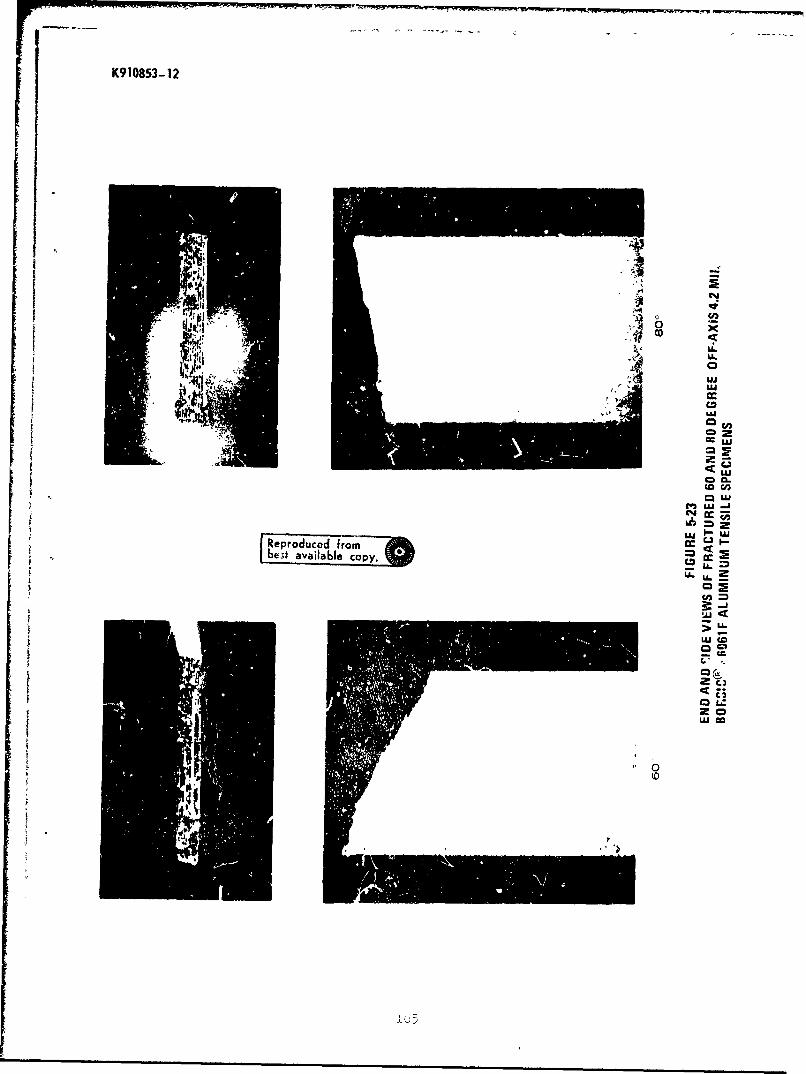
K910853-12
A CA
LLU.
-U
C'nC*J
WIUJ
Rproducedfobe 6 vi lbe copy.
LU.
00C,'
LL.
z 0
0

K910853-12
9~4~
'II
FIGURE 5-24
END AND SIDE VIEW OF FRACTURED 90 DEGREE OFF-AXIS
4.2 MIL BORSIC® + 6061 F ALUMINUM TENSILE SPECIMEN

K910853 -12
X~ z-I,-UA-
C-)a-)
-j
C"J
I (=-JI..+
U- C-)
CD0COO
w)'-"pJ

K910853-12
MAU.: 1OX
FIGURE 5-26
TRANSVERSE SECTION OF 5.7 MIL BORSIC®+ 6061-T6 COMPGSITE MATERIAL

K9 10853-129PIi
C#4)
CA
I I;J
17 -cnLLh
ui
-'Wp
2U>
Li
PpduefrmL etaalal ty
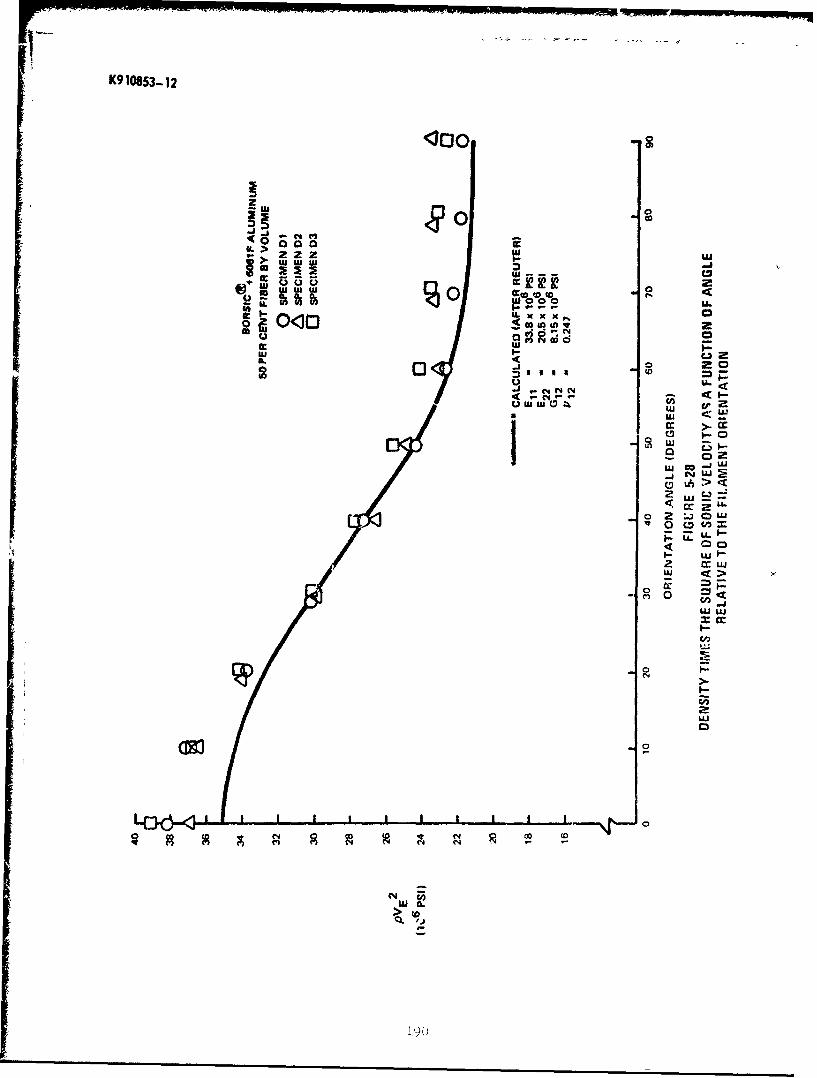
K9 10853-..12
ww+ 00
:E a W- - -SLx0. 0 0 ak
in 0
IC.
.jw C4 N'Ic C40~ ~~2 U;L T4 Uc
CU < L
- 0
w, CO j
:j 0 c L"z
0 to
0 i ,-1
ILIW
C-
oco-
w CL-> to
ej2

K910853-12
w
w
2
EA..
II c V 'U-
x~~ ~ 2020 LL000 w
IIr I ULh Cc LLI
w -)Z n_
EU wz zu
LL C
LO
0 w0
LUL
1904

5! In
Table V-I
Results of 4.2 Mil BORSIC + 6061-F Off-Axis Tests
Compliance CoefficientsFiber
Specimen Orient UTS S1 1 12 162Number (Degrees) (ksi) (10-8 in21b) (10-8 in 2 /lb) (10-8 in /lb)
0Al 0 121 2.86 -0.69 0 080A2 0 133 2.99 -0.77 0.010A3 0 140 2.74 -0.72 0.11OA 0 138 3.36 -0.89 -0.16OXI*** 0 141 2.98 ....0X2 0 150 2.82 -o.44 -0.15
Avg.: 137 2.96 -0.70 -0.11Calc*: 137 2.96 -0.70 0.00
0A5 2 129 2.91 -0.65 0.230A6** 2 --- 3.16 -0.80 0.000A7 2 131 3.02 -0.72 -0.010A8 2 128 3.05 -0.73 0.46
Avg.: 129 3.04 -0.73 0.17Calc.: 130 2.96 -0.73 0.17
0A9 5 j134 3.09 -0 .-l3 0.44OAIO 5 97.7 3.09 -0. ( 3ý 0 690All 102 3.10 -0.73 0.'2b
Avg.: 101 3.09 -0,76 0.46Calc.: 105 3.00 -0.75 0.42
0A12 10 .. 7 3.31 -0.79 0.59S 0A13 .0 73.9 0-4 -u.35 1.18
OA14 LO 75.1 i.0 -_08i 0.79)A10 7.5 3.25 -0.8,-- G,84
Avg.: 72.1 3.18 -0.82 0.b5Calc., 70.3 3.10 -0.82 0.81
)Ai 30 31.1 3.85 -1.20 1.99OA7 028.2 3.95 ni 14 . 29
JX 3 _ý0 30.9 3.84 -0.970.3
Avg.. 30,1 3.88 -1.17 .41,alc. 27.7 4.00 -1.17 1.4 '
192

Table V-I (Cont'd)
Compliance CoefficientsFiber S12
Specimen Orient UTS 31 S12 216Number (Degrees) I (10-8 in 2 /1b) (108 in2/ib) (10-8 in Ilb)
0A1.8*** 45 21.4 -- ..0A19 145 22.2 •4.94 -1.71 0.960A20 45 21.8 4.80 -1.65 0.17OA21 45 20.5 14.64 -1.149 1.310A22*w** 45 22.5 14.15 -1.44 1.330A2314** 45 22.14 h.76 -1.50 0.850X4 45 22.5 4.62 -1.57 1.41OX5*** 45 23.1 -- --
Avg.: 22.0 14.65 -1.56 0.99
Calc.: 19.7 4.66 -1.47 0.96
oA24 60 16.0 5.03 -1.36 0.350A25 60 17.5 4.94 -1.24 0.080A26 60 16.1 4.74 -1.24 0.149
18.1 4.87 -1.2h -0.06
Avg.: 16.9 4. 90 -1.27 0.21"Calc.: 16.0 4.96 -1.29 0.19
0A27 80 13.0 4.86 -0.80 -0.280A28 80 12.9 5,22 -0.92 -0.48WX6 80 15.1 4.79 -0.70 -0.10
Avg.: 13.7 4.96 -o.84 -0.29Cal'.: 14.0 4.91 -0.82 -0.15
0A29 90 12.6 4.97 -0.80 -0.060A30 90 14.2 4.92 -0.72 0.25OA31 90 14.5 r.20 -0.78 -0.13OX7 90 13.7 4.44 -o.65 -0.14
Avg.: 13.8 4.88 -0.74 -0.02Calc.: 13.8 h.88 -0.73 0.00
*UTS -lculatea using maximum work theory with X 137 ksi, Y = 13.8 ks2.S = 14.0 ksi; compliance coeff cients calculated usi g t'e transformatioiequations with Ell = 33.8 x lO psi; E2 2 = 20.5 x 10 psi; G1 2 = .15 psi;and "12 = 0.24.
**Doublers detached before failure***Strain gage failure
****Rigid grips used
193
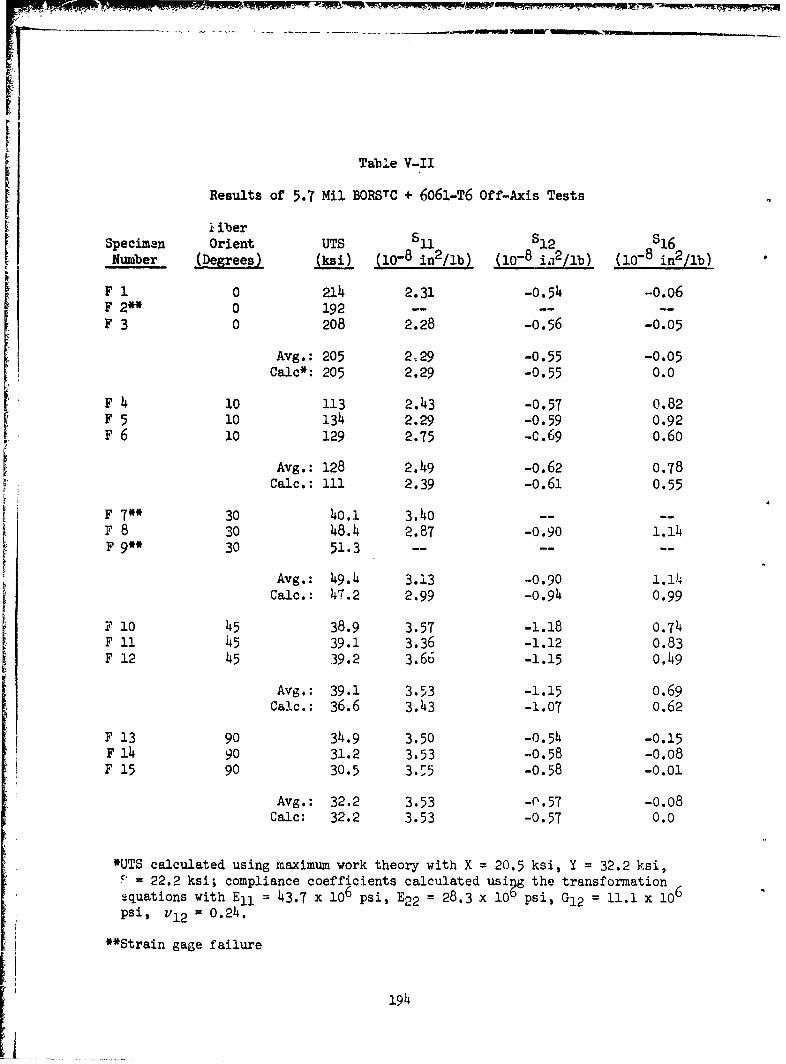
Table V-II
Results of 5.7 Ml BORSTC + 6061-T6 Off-Axis Tests
l iberSpecimen Orient UTS ii 1 2 S16N _umber Degs (ksi) (10-8 in 2 /lb) (10-8 i.1 2 /1b) (108 in 2 /lb)
F 1 0 214 2.31 -0.54 -o.o6F 2** 0 192 -- -- --F 3 0 208 2.28 -0.56 -0.05
Avg.: 205 2ý29 -0.55 -0.05Calc*: 205 2.29 -0.55 0.0
F ,4 10 113 2.143 -0.57 0.82F 5 10 134 2.29 -0.59 0.92F 6 10 129 2.75 -c.69 o.60
Avg.: 128 2.49 -0.62 0.78Calc.: 111 2.39 -0.61 0.55
F 7** 30 40.1 3.40 -- --F 8 30 48.14 2.87 -0.90 1.114F 9** 30 51.3 -- -- --
Avg.: 49.4 3.13 -0.90 1.14iCalc.: 47.2 2.99 -0.94 0.99
F 10 45 38.9 3.57 -1.18 0.74F 11 145 39.1 3.36 -1.12 o.83F 12 45 39.2 3.66 -1.15 0.49
Avg.: 39.1 3.53 -1.15 0.69CaIc.: 36.6 3.43 -1.07 0.62
F 13 90 34.9 3.50 -O.54 -0.15F 14 90 31.2 3.53 -0.58 -0.08F 15 90 30.5 3.ý5 -0.58 -0.01
Avg.: 32.2 3.53 -0.57 -0.08Calc: 32.2 3.53 -0.57 0.0
*UTS calculated using maximum work theory with X = 20.5 ksi, Y = 32.2 ksi,F = 22.2 ksi; compliance coefficients calculated using the transformation 6'ýquations with Ell = 43.7 x 10⁶ psi, E22 = 28.3 x 10 psi, G12 =11.1 x 10Psi, V1 2 = 0.24.
**Strain gage failure
194

+ +
S41 P4 AC- %D % H
0H-1 Hl 0 00 4) H o:1 HCh4jLr\Ln HH
0,4 CM r"93
H
0 ULC%\ L\L
0 0 tP 0H Q
4Z
co H \J H*r4.-
o~ ~ co 0V . pp
0 4)*-H 00
rjLt\ Vj xxmH- 0 85 t-0
E-4 -4,
*r4'r-'IH
r~v d rj4-)3 j CM C\JCH 0V 0 0
UýUr! . . U+)4 HA 4-NC 4)4)
o- 4) 0)4 0, 0
4,-) to I) CHI4) 0 9j 0 H 0
0 P4 t- En E4*r4 H 43 A P4
00 0
(Y)
(n. (aEnW -4 md 0..P4 P443U
0 0C0H H H
H O H C') H~ H C')*)
195
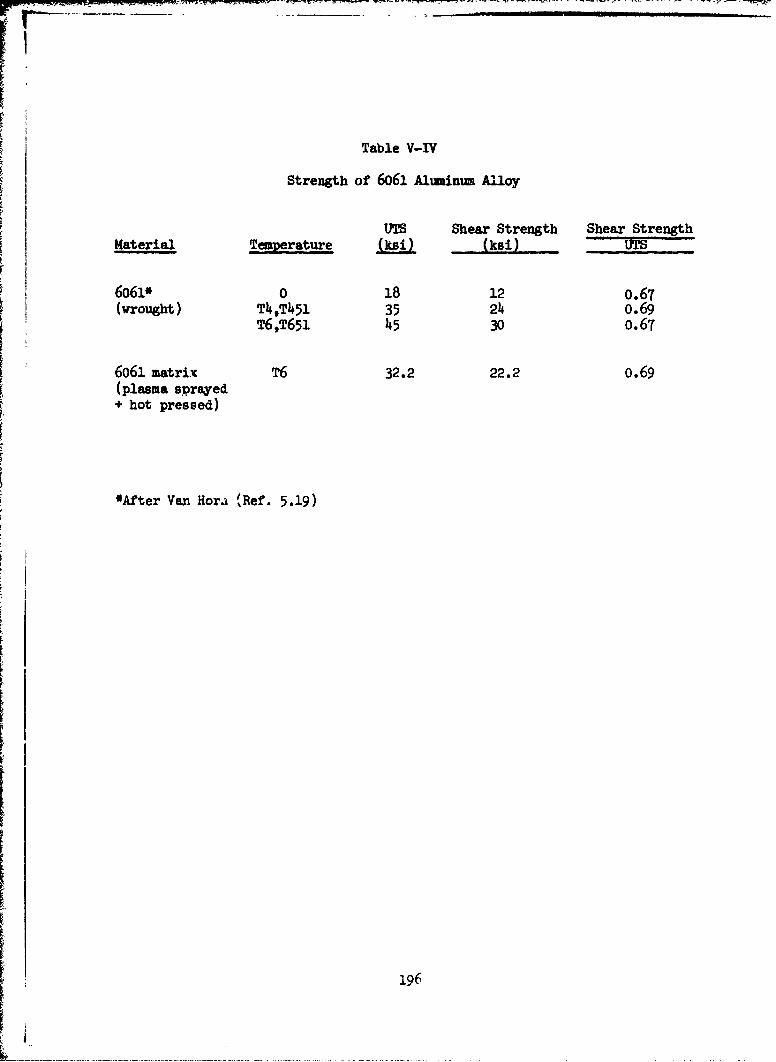
Table V-IV
Strength of 6061 Altuminum Alloy
UTS Shear Strength Shear StrengthMaterial Temperature (ksi) UTS
6o61* 0 18 12 0.67(wrought) T,T451 35 214 o.69
T6,T651 45 30 0.67
6061 matrixc T6 32.2 22.2 0.69(plasma sprayed+ hot pressed)
*After Van Hora fRef. 5.19)
196
FAfTIGUE FAILURE MECHANISMS
SUILAV.Y
The low cycle fatigue of unidirectional and cross p:ly reinforced BORSIC-aluminum composites has been explored to deterune the mechanisms of failure.Both 4.2 mil and 5.7 mil BO) 2C fiber was useL. in a 6061 aluminum alloy matrix.As was found in the case of transverse teni.Jle properties, the lack of splittingof the large diameter fiber has facilitated a stgnificant improvemcuit in com-posite performance. The importance of matrix d&ctility in isolatin6 and blimtingcomposite crack tips during fatigue has been demonstrated. Also, the nature ofcrack tip extension by progressive fiber failure has been illustrated. Tnecrack tip blunting diring fatigue, and not during quasi static tensile failuze,is markedly different from the behavior of structural metals. This fatiguecrack blunting tendency is of considerable importance for the future de elop-ment of composite systems.
It has been demonstrated that cross ply specimens of 5.7 mil BORSIC-6061,tested at 430 to the fiber axes, exhibit static and low cycle fatigue strainsto failure in excess of 10%.
Radiographic techniqueq have been used to show the extent and location offiber damage in BORSIC-alumiuum. The final plane of composite failure can bedetected by this technique prior to final instability. The use of acousticemission and residual stress measurement have also been useful in assessingcomposite damage.
VT. FATIGUE FAILURE MECHANISM
Many of the structural applications involving composite materialsrequire that performance be under oscillating load conditions. These condi-tions may include combinations of axial static and fatigue loading. Thepurpose of this investigation of the fatigue of BORSIC-aluminum was to explorefatigue failure me,.hanisms and to provide, through the understanding of thesemechanisms, improved materials for future applications. Although S-N diagramsare presented, these diagrams are not proposed as design information for appli-cations, instead, these curves are intended to present a general overview ofspecimen performance in fatigue.
6.1 Fatigue of Axially Reinforced Specimens
Experimental Method
Axially reinforced fatigue specimens were fabricated using a 6061aluminum alloy matrix and 4.2 mil diameter BORSIC fibers. Hot pressing param-eters were 10,000 psi at 5650 C. Each fatigue specimen was five inches long andwas tested with a one inch gage length. Specimens with machined reduced gagesections and parailel sided specimens were both tested. The reduced aectionspecimens were 0.210 inch wide in the gage section and 0.250 inch wide at thegrip area while the parallel sided specimens were fully 0.250 inch wide alongthe entire specimen length, Fig. 6.1a. All specimens had doublers of aluminumfoil (0.010 inch thick) bonded on in the grip region. It should be noted thatno significant difference in performance was observed between specimen configu-rations and that no longitudinal splitting of the axially reinforced specimensat the machined shoulders of the reduced section was observed in fatigue testing.Fatigue testing was performed using a Tinius-Olsen tensile testing machine atloading rates of from five to ten cycles per minute. Loading of all specimenswas performed such that the minimum load applied in each cycle was 10% of themaximum load, Fig. 6.1b. This corresponds to an "A ratio" (ratio of alternatingstress to mean stress) of 0.82. All appliod loads were tensile and strain gageswere used to monitor specimen deformation. The use of only tensile stressesand non-zero minimum stresses assured an absence of effects due to bending(sometimes encountered when compressive stresses are applied) and maintainedinitial alignment of the testing system.
Several specimens were tensile tested in a testing machine mounted onan X-ray unit to permit radiographic observation of BORSIC fibers under stress.Fiber condition can be readily examined during a tensile test by this techniquebecause of the large absorption coefficient of the tungsten rich cores of theBORSIC fibers as compared to the absorption coefficients of the boron, siliconcarbide and aluminur composite components. The BORSIC-aluminum specimens wereirradiated by X-rays with a high resolution film placed in contact with thespecimens. The fiber cores appear on the film, a negative after development,as distinct white lines while all other components appear much darker. Almostevery individual fiber in a composite can be resolved for even high volume frac-tions of fiber because the boride core is only 0.0005 in. in diameter and thus
198
little overlap of images occurs. The specimen test procedure involved a suc-cession of steps of specimen loading and irradiation, while at load, to obtainfiber condition in the composites as a function of applied load.
Acoustic emission of several specimens was monitored using a smalltransducer mounted on the specimen surfaces during testing. The signal of thistransducer was amplified and recorded during tension and fatigue testing. Thissignal was then later "replayed" and analyzed in conjunction with the stresshistory of the tested specimen. This acoustic detection system was found todetect also the deformation of aluminum matrix specimens.
Three methods were used to determine the condition of the matrix asa function of fatigue life. These were: metallographic observation, hardnessindentation and X-ray residual stress meas,.rement. The Last of these was per-formed using a diffractometer and X-ray technique described elsewhere (Ref. 6.1).A calibration of this technique was obtained using the four point bend loadingof 6061 aluminum in the X-ray machine with the specimen surface tangent to thefocusing circle. Strain gage measurements, used to determine surface strainwere compared with X-ray measurements of strain to calibrate the residual stressmeasurements made on fatigued composites. It should be noted that only changesin material condition near specimen surfaces can be detected using this technique.
Results and Discussion
Axially reinforced composite specimens containing 4.2 mil BORSIC werefabricated at 48% and 38%, by volume, fiber. The results of the fatigue testingof these specimens are given in Fig. 6.2. The average tensile strength of the48% BORSIC specimens was 143 x 103 psi and that of the 38% fiber composites101. x 103 psi. These strengths are, on the average, approximately 12% lowerthan those expected for 4.2 mil BORSIC-6061 composites based on previous resultsobtained for similar material (Refs. 6.2,3). This lower strength was due tosomewhat lower overall strength of the fiber used in these composites as comparedto that used in the above referenced reports. Average fiber strengths rangedfrom 350-450 x 103 psi for 4 the present composites. Failure (specimon Cractureconstituted failure) at 10 cycles occurred Rt a maximurn stress of ;top•roximately125 x 103 psi and 90 x 103 psi for the 48% and 38% BOHSLC composites r-''ý-tivel.".This provides a ratio of stress at 10 cycles to ultimate tensile strength ofapproximately 0.88 for both composites investigated. Similar results a,,ve beer,obtained in the past for the tension tension low cycle fatigue of boron reiri-forced 2024 aluminum (Ref. 6.4). The 2024 matrix composites, containing 4511by volume of 4.0 mil boron and tested at an " ratioll of approximately i.0,exhibited a ratio of approximately 0.82 of stress at 104 cycles to ultimatetensile strength. This similarity in result is particularly interesting becauseof the considerable differences between the composites described herein and thosereferenced. The 2024 matrix of the boron reinforced composites consisted entirelyoe plasma sprayed material. No foils were used. Composite strength was, however,similar to that tested during this program, i.e. 110,000 psi for 41% boron fiber.Toth (Ref. 6.5) has reported slightly lower ratios of 104 cycle stress to
199
...... ....._.. --
tensile strength for 4.0 nil boron reinforced 6061 matrix composites. Thesecomposites were fabricated using only aluminum foils and fiber, no plasmasprayed material, and tested in tension-tension fatigue at 1500 cpm with an"A ratio" of 1.0.
The results obtained in this investigation indicate that compositeaxial fatigue strength can be increased, for a given composite system, byincreasing volume fraction fiber reinforcement. This is in agreement withother observations (Ref. 6.6) made for boron-aluminum. Both axial tensilestrength and fatigue performan .e were found to increase to maintain a nearlyconstant ratio of stress at 10 cycles failure to ultimate tensile strength.The effects of matrix and fiber on composite fatigue behavior have not beenquantitatively separated in this investigation, however, results of thefatigue testing of boron fiber by Salkind and Patarini (Ref. 6.7), indicatethat boron fibers may be susceptible to fatigue damage It is interesting tonote that their data indicate a fatigue strength at 10 cycles of 0.89 of theaverage fiber tensile strength. Unfortunately, this result may not be appli-cable to the presently reported axial fatigue data due to the use of a rotatingbeam wire tester for the accumulation of data. This type of test generates anonuniform axial fiber stress pattern having its maxima at the fiber surface.Thus, fiber fracture in this test was probably nucleated at the fiber surface.This is not necessarily the case for all fibers tested in axial tension,particularly because of the residual axial compressive stresses present atthe fiber surface as a result of fabrication procedures. More recent resultsof Shimmin (Ref. 6.8) indicate that boron fibers tested in axial fatigue arenot susceptible to fatigue damage. Further tests performed on both boron andBORSIC fibers are needed to clearly establish the nature of the fatigue prop-erties of these fibers.
The roles of fiber and matrix in composite fatigue behavior can bemore clearly uncovered by examining the performance of several specimens byacoustic and radiciraphic techniques. This will be described in the nextparagraphs.
Axial 6061 matrix specimens containing 50% by volume BORSIC fiberwere radiographed to record fiber condition prior to fatigue testing. Theradiographs taken indicated that fibers in the composites were well alignedparallel to the specimen axis -xd predominantly undamaged. Some small amountsof damage were noted, in the region of machined fillets, Fig. 6.3aand randomly in the gage length of the specimen as depicted in Fig. 6.4a.Residual stress measurements, made by X-ray technique on the same composites,indicated matrix residual stresses near the specimen surface of approximately+2000 psi in tension parallel to the fiber axis for the as-fabricated condition.This stress level was increased to +13,000 psi by the T-6 quench and age heattreatment. These matrix tensile stresses are a result of the mismatch betweenfiber and matrix coefficients of thermI expansion and are offset by equal axialcompressive stresses in the fibers for a 50% composite. The increase in fibercempressive residual stress with heat treatment is a major reason for theincrease in T-6 BORSIC-aluminum axial tensile strength. A composite strengthincrease of 14,000 psi was obtained by T-6 heat treatment for the specimens onwhich the rcidual stress measurements were made.
200
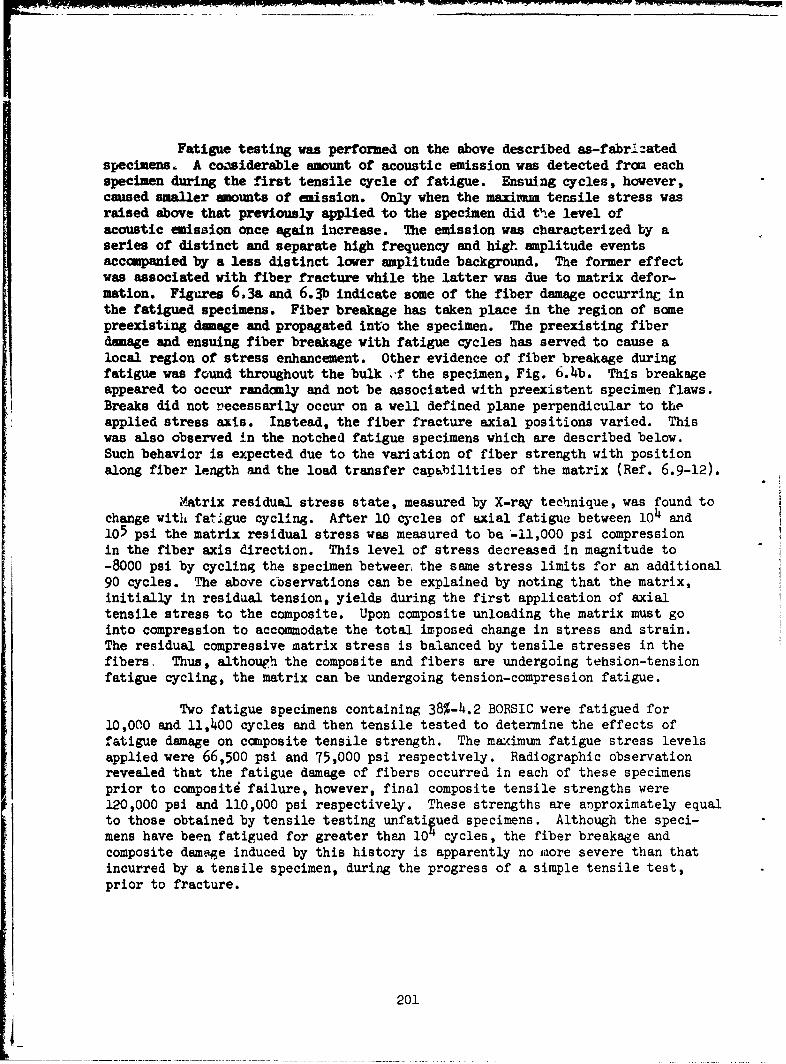
Fatigue testing was performed on the above described as-fabri.atedspecimens. A considerable amount of acoustic emission was detected from eachspecimen during the first tensile cycle of fatigue. Ensuing cycles, however,caused smaller amounts of emission. Only when the maximum tensile stress wasraised above that previously applied to the specimen did tVe level ofacoustic emission once again increase. The emission was characterized by aseries of distinct and separate high frequency and high amplitude eventsaccompanied by a less distinct lower amplitude background. The former effectwas associated with fiber fracture while the latter was due to matrix defor-mation. Figures 6.3a and 6.3b indicate some of the fiber damage occurrinC inthe fatigued specimens. Fiber breakage has taken place in the region of somepreexisting danage and propagated into the specimen. The preexisting fiberdamage and ensuing fiber breakage with fatigue cycles has served to cause alocal region of stress enhancement. Other evidence of fiber breakage duringfatigue was found throughout the bulk .f the specimen, Fig. 6.4b. This breakageappeared to occur randomly and not be associated with preexistent specimen flaws.Breaks did not recessarily occur on a well defined plane perpendicular to theapplied stress axis. Instead, the fiber fracture axial positions varied. Thiswas also observed in the notched fatigue specimens which are described below.Such behavior is expected due to the variation of fiber strength with positionalong fiber length and the load transfer capabilities of the matrix (Ref. 6.9-12).
Matrix residual stress state, measured by X-ray technique, was found tochange with fatigue cycling. After 10 cycles of axial fatigue between 104 and105 psi the matrix residual stress was measured to ba -11,000 psi compressionin the fiber axis direction. This level of stress decreased in magnitude to-8000 psi by cycling the specimen between- the same stress limits for an additional90 cycles. The above cbservations can be explained by noting that the matrix,initially in residual tension, yields during the first application of axialtensile stress to the composite. Upon composite unloading the matrix must gointo compression to accommodate the total imposed change in stress and strain.The residual compressive matrix stress is balanced by tensile stresses in thefibers, Thus, although the composite and fibers are undergoing tehsion-tensionfatigue cycling, the matrix can be undergoing tension-compression fatigue.
Two fatigue specimens containing 38%-4.2 BORSIC were fatigued for10,000 and 11,400 cycles and then tensile tested to determine the effects offatigue damage on composite tensile strength. The maximum fatigue stress levelsapplied were 66,500 psi and 75,000 psi respectively. Radiographic observationrevealed that the fatigue damage of fibers occurred in each of these specimensprior to compositd failure, however, final composite tensile strengths were120,000 psi and 110,000 psi respectively. These strengths are anproximately equalto those obtained by tensile testing unfati ued specimens. Although the speci-mens have been fatigued for greater than 104 cycles, the fiber breakage andcomposite damage induced by this history is apparently no 11iore severe than thatincurred by a tensile specimen, during the progress of a simple tensile test,prior to fracture.
201

Radiographic examination of the fracture surfaces of fatigued speci-mens revealed that the reinforcing fibers do not cleave or separate at asingle point, Fig. 6.5, but that they shatter during failure in a manner typicalof high strength brittle materials. The fracture of fibers, as presented inFigs. 6.3 and 6.4, during fatigue damage prior to final composite failure isalso characterized by this same shattering and thus is not Just associatedwith the advance of a crack front through the composite.
6.2 Fatigue of Center Notched Specimens
Experimental Method
Uniaxially reinforced specimens were tested in simple axial tensionand fatigue with notches machined in the central portions of the gage sections.These specimens were approximctely 0.83 in. wide and 5 in. long. The specimenswere parallel sided with 1.25 in. long doublers placed in the grip areas leaving3.50 in. long gage sections. Notches were machined into these specimens byelectrodischarge machining. The uotches were slits having a length of 0.10 in.and a width of 0.005 in. The notch tip root radii were larger than 0.0025.These specimens were examined radiographically during mechanical testing by theprocedures described in the Experimental Method of section 6.1.
Results and Discussion
Center notched specimens were tested in both simple tension andfatigue. The tensile test results obtained are presented in Table VI-I for boththe 30% and 56% by volume 5.7 mil BORSIC fiber reinforced specimens. Tensile testultimate tensile strength data indicated that the center notches caused a decreasein net section tensile strength at specimen failure. Unnotched specimens containing30% and 56% fiber failed at 112,000 psi and 195,000 psi respectively. The netsection fracture stress of similar specimens with EDM slots was reduced to 73,000psi and 156,000 psi, based on net section, yielding ratios of notched to unnotchedstrength of 0.65 (30% fiber) and 0.80 (56% fiber). The fractured specimens arepresented in Fig. 6.5 for the higher strength composite. Both of the specimensshown exhibited fairly rough fracture surfaces. The center notched specimen'ssurface was somewhat less irregular due to the ability of the notch to define theregion of failure. The notched specimen exhibited longitudinal splits normalto the primary fracture surface after failure. These splits were most pronounced,and visible in Fig. 6.6, at the edges of the preexisting notch and also occurredin the region above and below the plane cf the o:ciginal notch. They were not foundto occur elsewhere in the specimen or in the unnotched tensile specimen indicetingtheir association with failure and the complex stress state at tht- notch.
The behavior of notched tensile specimens during tensile loading wasrecorded radiographically. The radiographs shown in Figs. 6.7 and 6.8 were takEnat the edges of a hole in a specimen prior to and after fracture respectively.The radiographs in Fig. 6.7 were taken at 96% of ultimate tensile fracture loadof the specimen. The regions of damage shown were at the circumferentialpositions on the hole diameter perpendicular to the applied tensile stress. Fiberfracture was first found to occur at 87% of the fracture stress of the specimen.
202
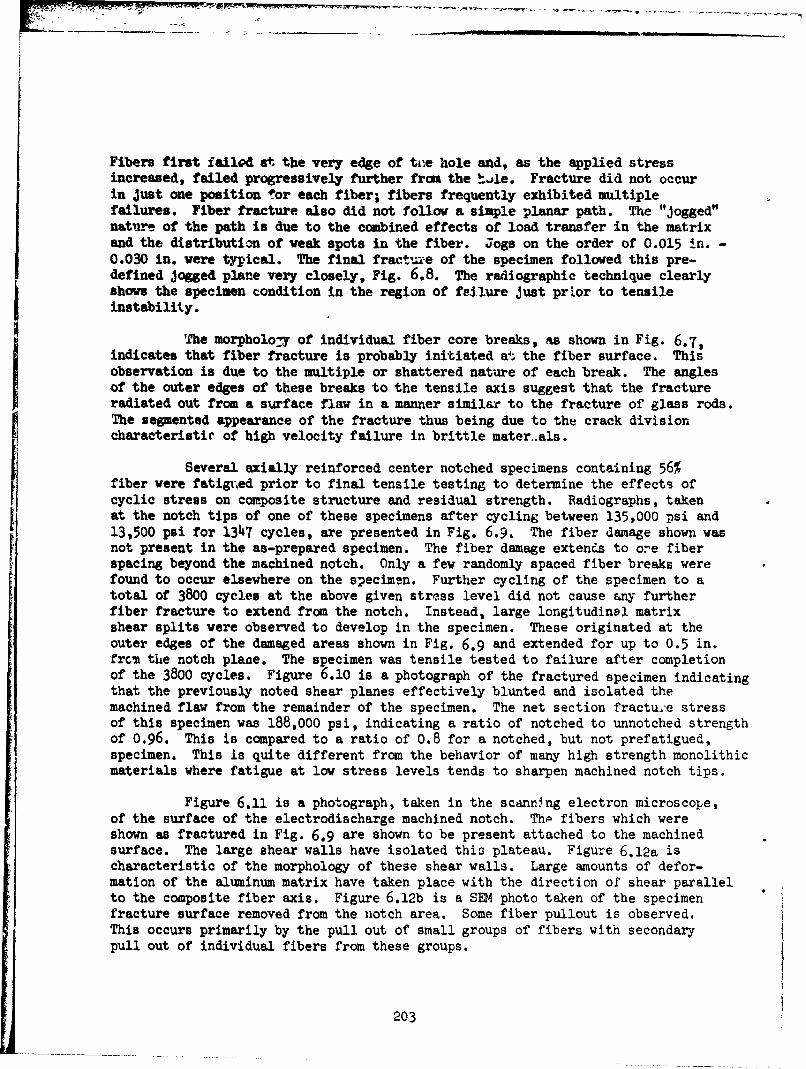
Fibers first failod at the very edge of tne hole and, as the applied stressincreased, failed progressively further from the h!.)le. Fracture did not occurin just one position for each fiber; fibers frequently exhibited multiplefailures. Fiber fracture also did not follow a simple planar path. The "Jogged"nature of the path is due to the combined effects of load transfer in the matrixand the distribution of weak spots in the fiber. Jogs on the order of 0.015 in. -
0.030 in. were typical. The final fractui'e of the specimen followed this pre-defined Jogged plane very closely, Fig. 6.8. The radiographic technique clearlyshovs the specimen condition in the region of failure just prior to tensileinstability.
The morpholo-y of individual fiber core breaks, as shown in Fig. 6.7,indicates that fiber fracture is probably initiated aW the fiber surface. Thisobservation is due to the multiple or shattered nature of each break. The anglesof the outer edges of these breaks to the tensile axis suggest that the fractureradiated out from a surface flaw in a manner similar to the fracture of glass rods.The segmented appearance of the fracture thus being due to the crack divisioncharacteristic of high velocity failure in brittle mater.als.
Several axially reinforced center notched specimens containing 56%fiber were fatigied prior to final tensile testing to determine the effects ofcyclic stress on composite structure and residual strength. Radiographs, takenat the notch tips of one of these specimens after cycling between 135,000 psi and13,500 psi for 1347 cycles, are presented in Fig. 6.9, The fiber damage shown wasnot present in the as-prepared specimen. The fiber damage exten.s to ore fiberspacing beyond the machined notch. Only a few randomly spaced fiber breaks werefound to occur elsewhere on the specimen. Further cycling of the specimen to atotal of 3800 cycles at the above given stress level did not cause any furtherfiber fracture to extend from the notch. Instead, large longitudinal matrixshear splits were observed to develop in the specimen. These originated at theouter edges of the damaged areas shown in Fig. 6.9 and extended for up to 0.5 in.frcm the notch plane. The specimen was tensile tested to failure after completionof the 3800 cycles. Figure 6.10 is a photograph of the fractured specimen indicatingthat the previously noted shear planes effectively blunted and isolated themachined flaw from the remainder of the specimen. The net section fractu.'e stressof this specimen was 188,000 psi, indicating a ratio of notched to unnotched strengthof 0.96. This is compared to a ratio of 0.8 for a notched, but not prefatigued,specimen. This is quite different from the behavior of many high strength monolithicmaterials where fatigue at low stress levels tends to sharpen machined notch tips.
Figure 6.11 is a photograph, taken in the scanning electron microscope,of the surface of the electrodischarge machined notch. The fibers which wereshown as fractured in Fig. 6.9 are shown to be present attached to the machinedsurface. The large shear walls have isolated this plateau. Figure 6 .12a ischaracteristic of the morphology of these shear walls. Large amounts of defor-mation of the aluminum matrix have taken place with the direction of shear parallelto the composite fiber axis. Figure 6.12b is a SEM photo taken of the specimenfracture surface removed from the notch area. Some fiber pullout is observed.This occurs primarily by the pull out of small groups of fibers with secondarypull out of individual fibers from these groups.
203
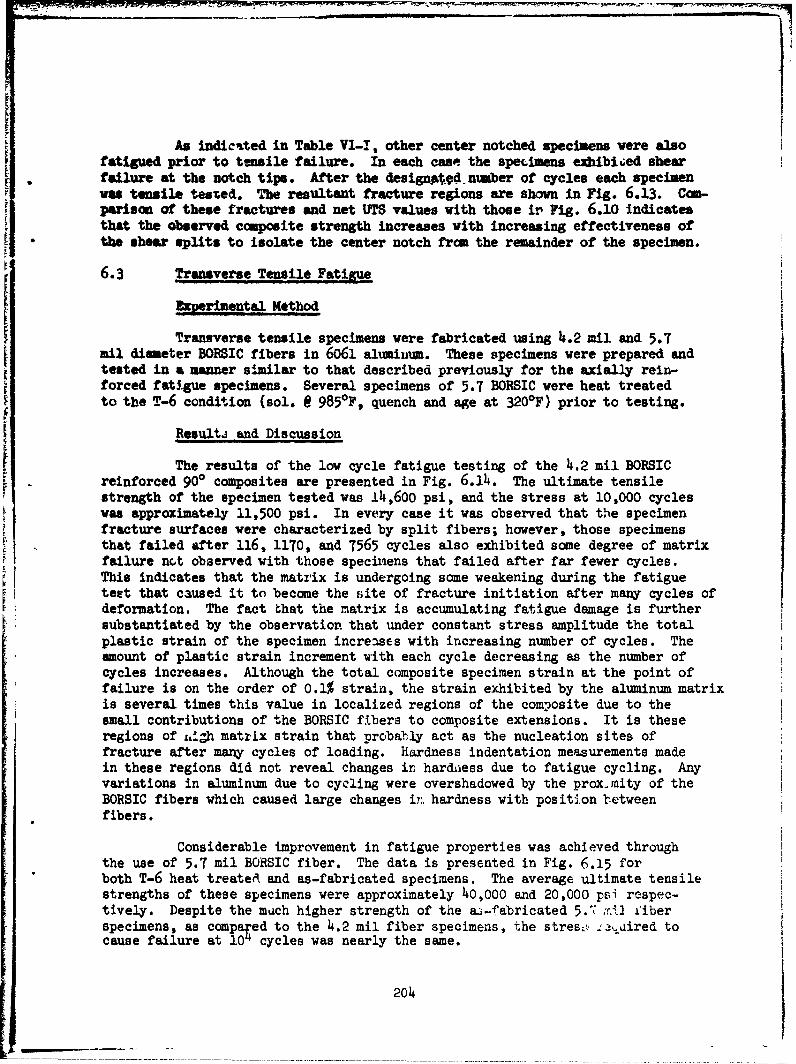
As indicited in Table VI-I, other center notched specimens were alsofatigued prior to tensile failure. In each caseb the specimens exhibited shearfailure at the notch tips. After the designatd. nvuber of cycles each specimenwas tensile tested. The resultant fracture regions are shown in Fig. 6.13. CcM-Parison of these fractures and net UTS values with those ir Fig. 6.10 indicatesthat the observed composite strength increases with increasing effectiveness ofthe shear splits to isolate the center notch from the remainder of the specimen.
6.3 Transverse Tensile Fatigue
Transverse tensile specimens were fabricated using 4.2 ail and 5.7mil dimeter BORSIC fibers in 6061 aluniuum. These specimens were prepared andtested in a manner similar to that described previously for the axially rein-forced fatigue specimens. Several specimens of 5.7 BORSIC were heat treatedto the T-6 condition (sol. @ 9850F, quench and age at 3200F) prior to testing.
Resulta and Discussion
The results of the low cycle fatigue testing of the 4.2 mil BORSICreinforced 900 composites are presented in Fig. 6.14. The ultimate tensilestrength of the specimen tested was 1 4,600 psi, and the stress at 10,000 cycleswas approximately 11,500 psi. In every case it was observed that the specimenfracture surfaces were characterized by split fibers; however, those specimensthat failed after 116, 1170, and 7565 cycles also exhibited some degree of matrixfailure nct observed with those specimens that failed after far fewer cycles.This indicates that the matrix is undergoing some weakening during the fatigueteet that caused it to become the site of fracture initiation after many cycles ofdeformation. The fact that the matrix is accumulating fatigue damage is furthersubstantiated by the observation that under constant stress amplitude the totalplastic strain of the specimen increases with increasing number of cycles. Theamount of plastic strain increment with each cycle decreasing as the number ofcycles increases. Although the total composite specimen strain at the point offailure is on the order of 0.1% strain, the strain exhibited by the aluminum matrixis several times this value in localized regions of the composite due to thesmall contributions of the BORSIC fibers to composite extensions. It is theseregions of i,,ih matrix strain that probably act as the nucleation sites offracture after many cycles of loading. Hardness indentation measurements madein these regions did not reveal changes in hardiess due to fatigue cycling. Anyvariations in aluminum due to cycling were overshadowed by the prox.mity of theBORSIC fibers which caused large changes ir, hardness with position betweenfibers.
Considerable improvement in fatigue properties was achieved throughthe use of 5.7 mil BORSIC fiber. The data is presented in Fig. 6.15 forboth T-6 heat treated and as-fabricated specimens. The average ultimate tensilestrengths of these specimens were approximately 40,000 and 20,000 psi respec-tively. Despite the much higher strength of the aj-fabricated 5.' ,;A] 1iberspecimens, as compared to the 4.2 mil fiber specimens, the stresz, ,.ý.aired tocause failure at 10 cycles was nearly the same.
204&
.. . . .
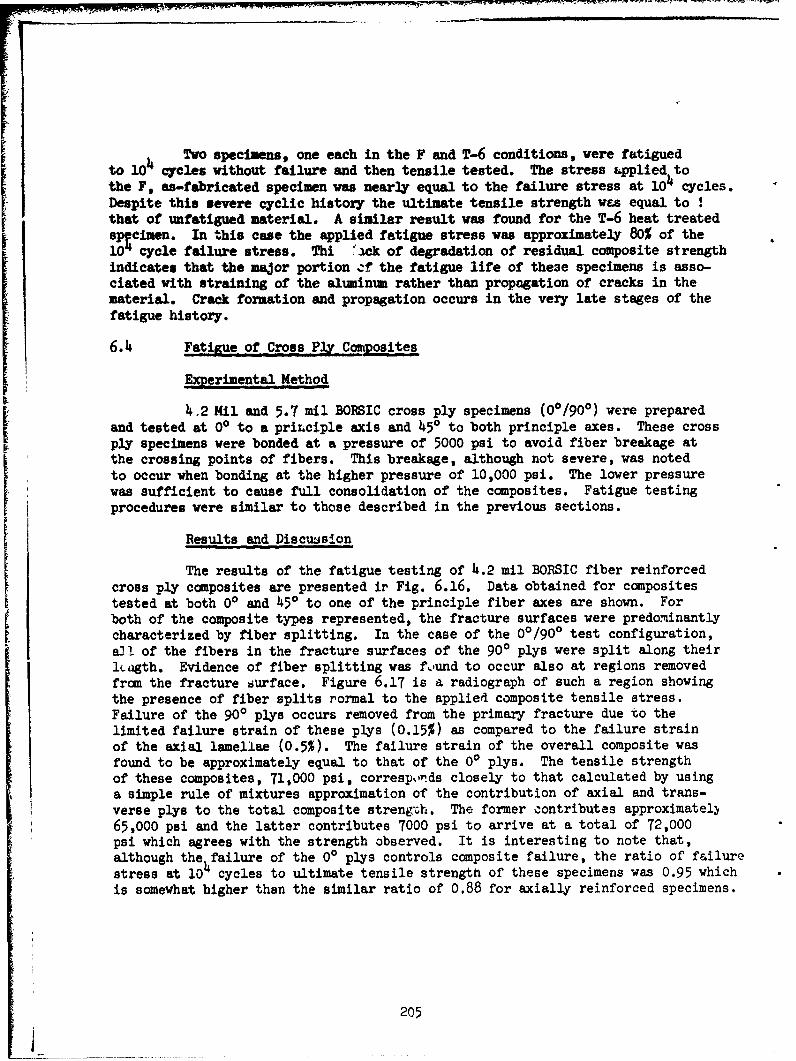
Two specimens, one each in the F and T-6 conditions, were fatiguedto 10 cycles without failure and then tensile tested. The stress applied, tothe F, as-fabricated specimen was nearly equal to the failure stress at 101 cycles.Despite this severe cyclic history the ultimate tensile strength yEs equal to !that of unfatigued material. A similar result was found for the T-6 heat treatedspl cimen. In this case the applied fatigue stress was approximately 80% of the101 cycle failure stress. Thi i'ck of degradation of residual composite strength
indicates that the major portion Zf the fatigue life of the3e specimens is asso-ciated with straining of the aluminum rather than propagation of cracks in thematerial. Crack formation and propagation occurs in the very late stages of thefatigue history.
6.4 Fatiue of Cross Ply Composites
Experimental Method
4,2 Mil and 5.7 mil BORSIC cross ply specimens (00/900) were preparedand tested at 00 to a priLciple axis and 450 to both principle axes. These crossply specimens were bonded at a pressure of 5000 psi to avoid fiber breakage atthe crossing points of fibers. This breakage, although not severe, was notedto occur when bonding at the higher pressure of 10,000 psi. The lower pressurewas sufficient to cause full consolidation of the composites. Fatigue testingprocedures were similar to those described in the previous sections.
Results and Discuosson
The results of the fatigue testing of 4.2 mul BORSIC fiber reinforcedcross ply composites are presented ir Fig. 6.16. Data obtained for compositestested at both 00 and 450 to one of the principle fiber axes are shown. For
both of the composite types represented, the fracture surfaces were predominantlycharacterized by fiber splitting. In the case of the 00/900 test configuration,81! of the fibers in the fracture surfaces of the 900 plys were split along their
lLgth. Evidence of fiber splitting was fo'und to occur also at regions removedfrom the fracture 6urface. Figure 6.17 is a radiograph of such a region showingthe presence of fiber splits rormal to the applied composite tensile stress.Failure of the 900 plys occurs removed from the primary fracture due to thelimited failure strain of these plys (0.15%) as compared to the failure strainof the axial lamellae (0.5%). The failure strain of the overall composite wasfound to be approximately equal to that of the 00 plys. The tensile strengthof these composites, 71,000 psi, correspords closely to that calculated by usinga simple rule of mixtures approximation of the contribution of axial and trans-verse plys to the total composite strength. The former contributes approximatelý65,000 psi and the latter contributes 7000 psi to arrive at a total of 72,000psi which agrees with the strength observed. It is interesting to note that,although the 4failure of the 00 plys controls composite failure, the ratio of failurestress at 10 cycles to ultimate tensile strength of these specimens was 0.95 whichis somewhat higher then the similar ratio of 0.88 for axially reinforced specimens.
"2054 _
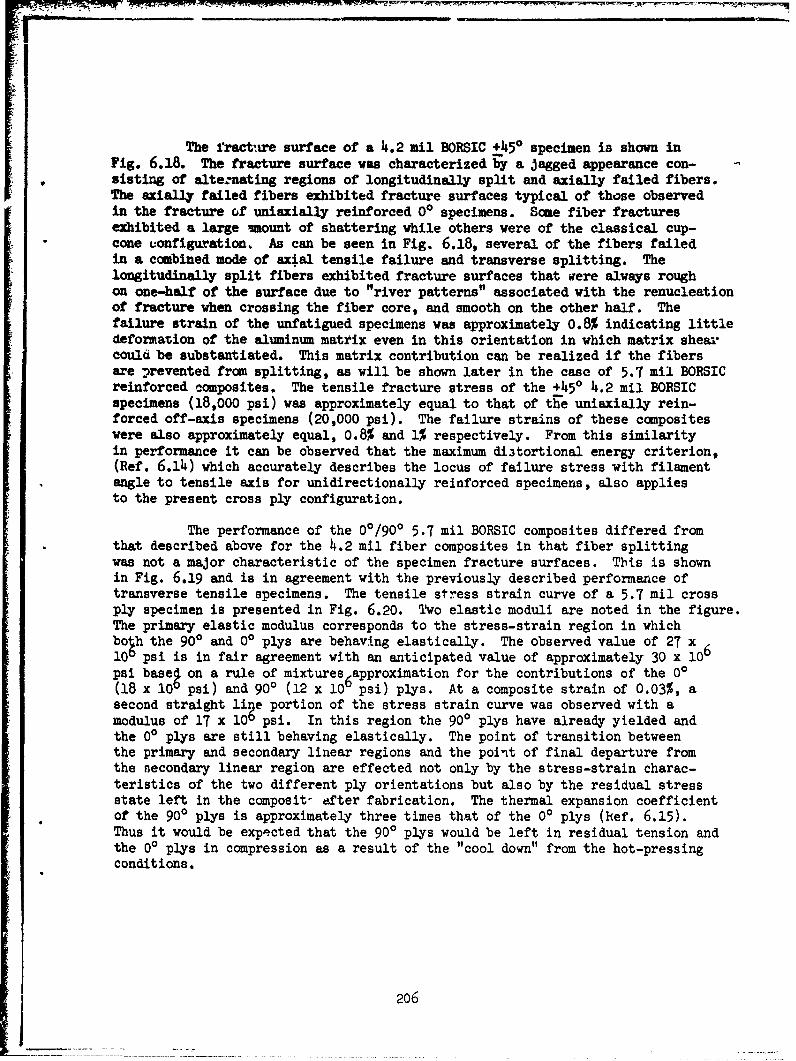
The 'ractire surface of a 4.2 ail BORSIC +450 specimen is shown inFig. 6.18. The fracture surface was characterized by a jagged appearance con-sisting of alte.:nating regions of longitudinally split and axially failed fibers.The axially failed fibers exhibited fracture surfaces typical of those observedin the fracture of uniaxially reinforced 00 specimens. Some fiber fracturesexhibited a large smount of shattering while others were of the classical cup-cone configuration. As can be seen in Fig. 6.18, several of the fibers failedin a combined mode of axial tensile failure and transverse splitting. Thelongitudinally split fibers exhibited fracture surfaces that were always roughon one-half of the surface due to "river patterns" associated with the renucleationof fracture when crossing the fiber core, and smooth on the other half. Thefailure strain of the unfatigued specimens was approximately 0.8% indicating littledeformation of the aluminum matrix even in this orientation in which matrix shearcould be substantiated. This matrix contribution can be realized if the fibersare prevented fron splitting, as will be shown later in the case of 5.7 mil BORSICreinforced composites. The tensile fracture stress of the +450 4.2 mil BORSICspecimens (18,000 psi) was approximately equal to that of the uniaxially rein-forced off-axis specimens (20,000 psi). The failure strains of these compositeswere also approximately equal, 0.8% and 1% respectively. From this similarityin performance it can be observed that the maximum di3tortional energy criterion,(Ref. 6.14) which accurately describes the locus of failure stress with filamentangle to tensile axis for unidirectionally reinforced specimens, also appliesto the present cross ply configuration.
The performance of the 00/900 5.7 mil BORSIC composites differed fromthat described above for the 4.2 mil fiber composites in that fiber splittingwas not a major characteristic of the specimen fracture surfaces. This is shownin Fig. 6.19 and is in agreement with the previously described performance oftransverse tensile specimens. The tensile stress strain curve of a 5.7 mil crossply specimen is presented in Fig. 6.20. Two elastic moduli are noted in the figure.The primary elastic modulus corresponds to the stress-strain region in whichboth the 900 and 00 plys are behaving elastically. The observed value of 27 x100 psi is in fair agreement with an anticipated value of approximately 30 x 106
psi base on a rule of mixtures 6 approximation for the contributions of the 00(18 x 100 psi) and 90' (12 x 10 psi) plys. At a composite strain of 0.03%, asecond straight lige portion of the stress strain curve was observed with amodulus of 17 x 10° psi. In this region the 900 plys have already yielded andthe 00 plys are still behaving elastically. The point of transition betweenthe primary and secondary linear regions and the point of final departure fromthe necondary linear region are effected not only by the stress-strain charac-teristics of the two different ply orientations but also by the residual stressstate left in the composit- efter fabrication. The thermal expansion coefficientof the 900 plys is approximately three times that of the 00 plys (hef. 6.15).Thus it would be expected that the 900 plys would be left in residual tension andthe 00 plys in compression as a result of the "cool down" from the hot-pressingconditions.
206
._...... 7_ .T . _.-. ....... ... ....... " . ._'... ........... .............. .. . ... . . . . . .. . . . . . . . . . . . . .. . . ........

The fatigue performance of the 00/900 composites is shown in Fig.6.21. Both as-fabricated and T-6 heat treated specimens were tested and littledifference in performance was found. This is in contrast to the fact that uni-axially reinforced composite strength can be increased in both transverse and axialdirections by T-6 heat treatment, No decrease in strength due to heat treatment,however, was noted as has been reported previouzly by other investigators (Ref.6.17). The lack of improved strength due to heat treatment is likely due to acomplicated residual stress state developed in the cross ply composite as aresult of the rapid quench used and the differences in coefficient of thermalexpansion between plys cited above and the difference in this quantity betweenfiber and matrix. Quenching would leave the matrix in biaxial tension for thisbiaxial lay up and thus severely reduce its strain capability. This wouldparticularly decrease the effectiveness of the 900 plys and thus negate strengthincreases due to precipitation hardening of the matrix.
One 00/900 specimen of 5.7 mil BORSIC-6061 was fatigued for 104 cycles,at 90% of the stress necessary to cause failure at that number of c2.cles, andthen tensile tested. No degradation in composite strength was observed to takeplace due to the fatigue history. This agrees with the similar observationsmade with uniaxially reinforced composites tested at bkth 00 and 900 to the fiberaxis. Once again, the damage introduced during the first major portion of thefatigue history is not more severe than that introduced during the simple tensiletest prior to ultimate failure.
Figure 6.22 is a radiograph taken of a crack tip in a 5.7 mil crossply specimen. This crack tip is a secondary fracture which branched off fromthe primary crack plane and was stopped suddenly by the unloading of the specimenas a result of the primary fracture. The grid formed by 4he cross plied fibercores acts as a high resolution strain gage system in which the displacementsof the fibers and intersection points describe th. displacement field at thecrack tip. This displacement field was observed to extend out normal to thecrack plane and coincided with the r-egion over which axial fiber fracture couldbe observed. It was also observed that fractured fibers occurred ahead of theobservable crack.
The stress-strain performance of 5.7 mil BORSIC cross ply specimenstested at 450 to the principle fiber axes is presented in Fig. 6.23. Curvesdeveloped for both as-fabricated and prefatigued specimens are shown. The largestrain to failure of the as-fabricated specimens tested is the outstanding featureof their performance. Strains _n excess of 10% were found to occur. This largeelongation was due to the fact that the 5.7 mil fibers did not split duringtesting, thus permitting the aluminum matrix to undergo large amounts of defor-mation. This deformation was accompanied by a reduction in specimen width anda rotation of the fiber Lxes toward the tensile axis. No appreciable reductionin specimen thickness was measured. The total fiber rotation was typically onthe order of 80. At fracture the fibers were approximately 370 to the tensileaxis. A typical fracture surface of this type of specimen is shown in Fig. 6.24.It is observed that matrix failure and fiber tensile failure are the predominantfracture suirface features. A higher magnification view of the same specimen isshown in Fig. 6.25.
j 207
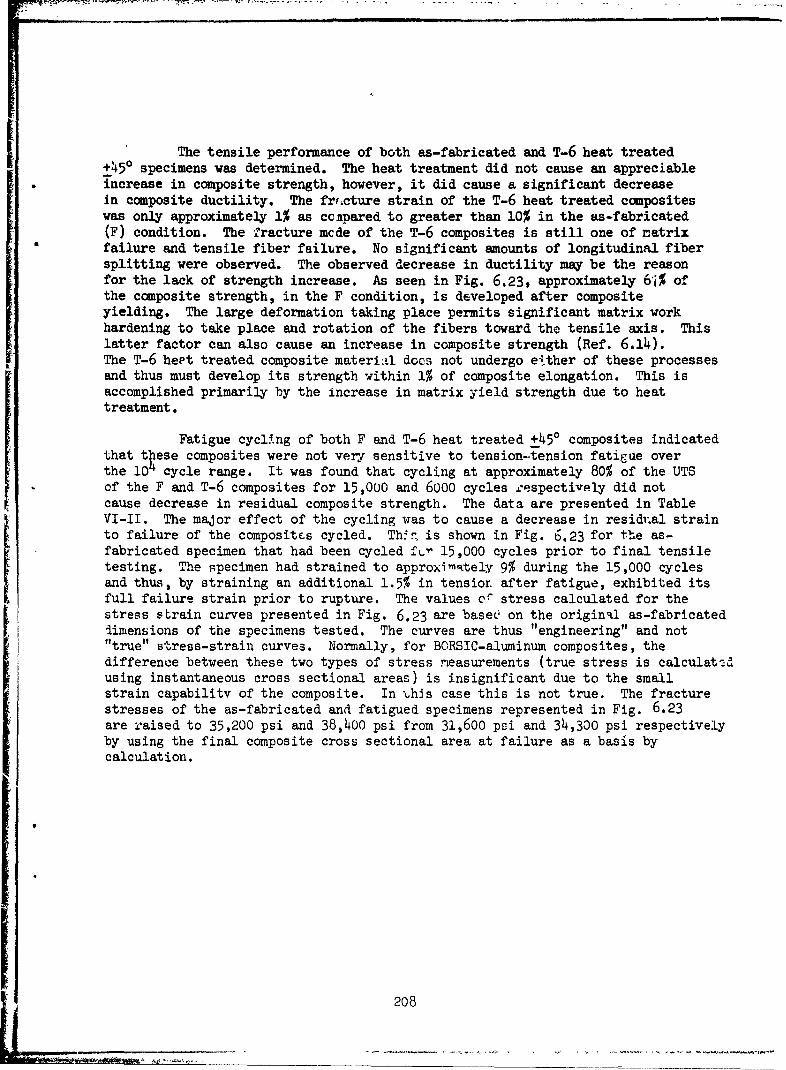
The tensile performance of both as-fabricated and T-6 heat treated+450 specimens was determined. The heat treatment did not cause an appreciableincrease in composite strength, however, it did cause a significant decrease
in composite ductility. The frF.cture strain of the T-6 heat treated compositeswas only approximately 1% as ccnpared to greater than 10% in the as-fabricated
(F) condition. The fracture mcde of the T-6 composites is still one of natrixfailure and tensile fiber failure. No significant amounts of longitudinal fibersplitting were observed. The observed decrease in ductility may be the reasonfor the lack of strength increase. As seen in Fig. 6.23, approximately 6*i% ofthe composite strength, in the F condition, is developed after compositeyielding. The large deformation taking place permits significant matrix workhardening to take place and rotation of the fibers toward the tensile axis. Thislatter factor can also cause an increase in composite strength (Ref. 6.14).The T-6 heat treated composite material does not undergo either of these processesand thus must develop its strength within 1% of composite elongation. This isaccomplished primarily by the increase in matrix yield strength due to heattreatment.
Fatigue cycling of both F and T-6 heat treated +450 composites indicatedthat t ese composites were not very sensitive to tension-tension fatigue overthe 10t cycle range. It was found that cycling at approximately 80% of the UTSof the F and T-6 composites for 15,000 and 6000 cycles cespectively did notcause decrease in residual composite strength. The data are presented in TableVI-II. The major effect of the cycling was to cause a decrease in residval strainto failure of the composites cycled. Th!-. is shown in Fig. 6.23 for the as-fabricated specimen that had been cycled fX 15,000 cycles prior to final tensiletesting. The specimen had strained to approxim.tely 9% during the 15,000 cyclesand thus, by straining an additional 1.5% in tensior after fatigue, exhibited itsfull failure strain prior to rupture. The values of stress calculated for thestress strain curves presented in Fig. 6.23 are base(' on the originatl as-fabricated
dimensions of the specimens tested. The curves are thus "engineering" and not"true" stress-strain curves. Normally, for BORSIC-aluminum composites, thedifference between these two types of stress measurements (true stress is calculated
using instantaneous cross sectional areas) is insignificant due to the smallstrain capability of the composite. In *Lhis case this is not true. The fracturestresses of the as-fabricated and fatigued specimens represented in Fig. 6.23are raised to 35,200 psi and 38,400 psi from 31,600 psi and 34,300 psi respectivelyby using the final composite cross sectional area at failure as a basis bycalculation.
208

6.5 Conclusions
1. The methods of acoustic emission, residual stress measurementand radiography have been uset 1 in characterizing the changes in structuralintegrity of BORSIC-aluminum specimens during mechanical testing. The planeof final composite failure prior to final rupture can be defined by radiography.
2. Axial tension-tension low cycle fatigue of unidirectionallvreinforced BORSIC-aluminum is characterized by progressive failure of BORSICfibers in regions of preexisting localized specimen damage and stress concen-trations and the failure of fihers throughout the bulk of the specimen.Regions of significant amowuts of fiber damage define the final plane offailure frgr the specimen.
3. Shear of the aluminum matrix parallel to the fiber axis in uni-directionally reinforced composites can prevent the progression of a crackacross a specimen. Unlike the behavior of many monolithic materials, crackblunting can occur during the fatigue of notched specimens.
4. The elimination of longitudinal fiber splitting, by the useof 5.7 mil fiber rather than 4.2 mil fiber significantly increased the staticand fatigue performance of cross ply BORSIC-eluminum composites and hasdramatically increased the total elongation to fracture.
209

SECTION VI - REFERENCES
1. B. D. Cullity, "Elements of X-ray Diffraction", Addison-Wesley, 1959.
2. K. G. Kreider, et al, "Plasma Sprayed Metal Matrix Fiber ReinforcedComposites", AFML-TR-68-119.
3. K. G. Kreider and M. Marciano, "Mechanical Properties of BORSIC-AluminumComposites", Trans. AIME, 245, 1279, 1969.
4. K. G. Kreider and G. R. Leverant, "Boron Fiber Metal Matrix Compositesby Plasma Spraying", AFML-TR-66-219.
5. I. J. Toth, "Time Dependent Mechanical Behavior of Metal Matrix Composites",Air Force Tech. Report AFML-TR-71-102.
6. I. J. Toth, "The Time Dependent Mechanical Behavior of Composite Materials",
AFML-TR-70-174.
7. M. Salkind and V. Patarini, Trans. ALME, Vol. 239, 1268, 1967.
8. K. D. Shimmin, Unpublished result as referred to by Toth in Refs. 5 and 6above.
9. D. M. Schuster and E. Scala, AIAA Jl" 6, 527, 1968.
10. C. Zweben, AIAA Jl. 6, 2325, 1968.
12. C. Zweben and W. Rosen, AIAA Paper No. 69-123, 1969.
12, C. Zweben, J. ComP. Mats. 3, 713, 1969.
13. C. A. Berg, Fib. Sci. & Tech., Vol. 3, 295, 1971.
14. S. Tsai, "Strength Theories of Filamentary Structures" in FundamentalAspects of Fiber Reinforced Materials, Interscience Publishers, 1968.
15. V. Patarini and K. Kreider, Met. Trans. 1, 3431, 1970.
210

K9100S3-12
-L0010 IN. THICKl j~rALUMHUM OUBLER
20 IN.1ain loo 1". : 92.o0. IN
0.210 IN,
(a) FATIGUE SPECIMEN CONFIGURATIONS
(7MfX 0 ALTERNATING= 0. 4 5 0 SMAX
z
S1 EA = 0-55o MAX
('MIN 0.10a MAX
TIME
(b) FATIGUE STRESS - CYCLE PROCEDURE
FIGURE 6.1 EXPERIMENTAL METHOD IN FATIGUE TESTING
211
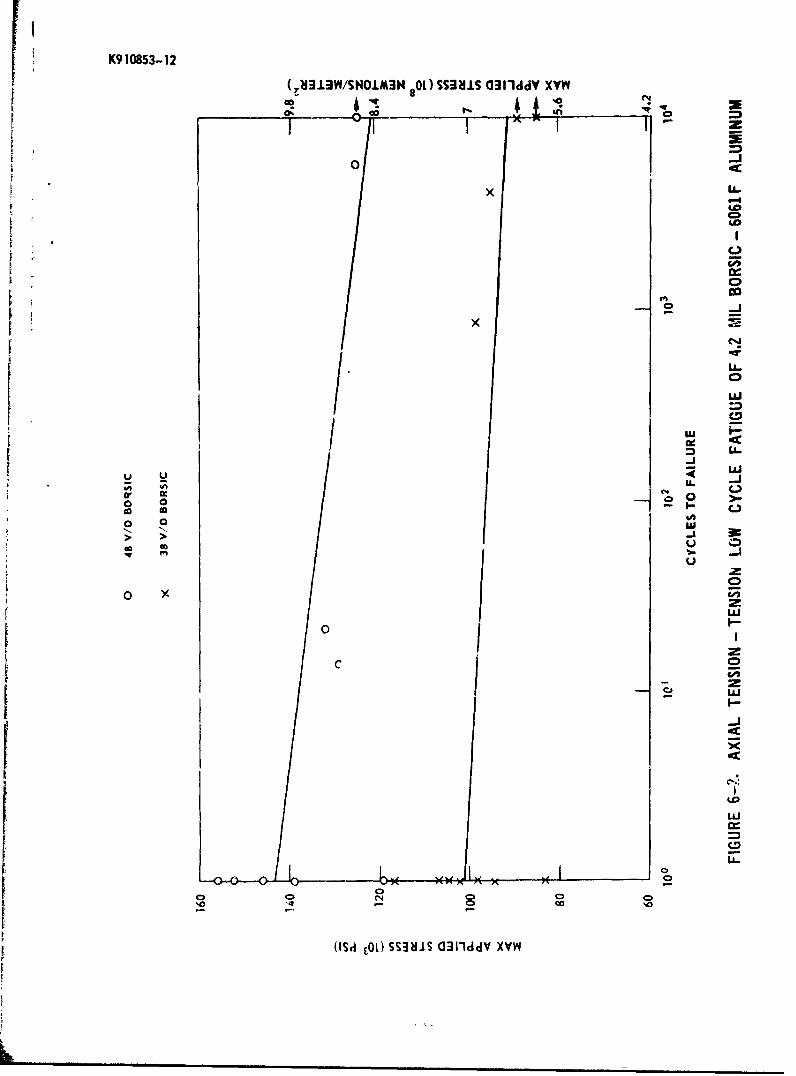
K910853-12
(7 1113W/SNOiIM3N 801) SSM~S O13I'ddy XVW .
xILA-
CD,
oc
1. 0
I N
I IL.
0 00
0 0 I U> >u 0
00
0I
z
CC
IMF-
Cl Cl000
(ISd COL) SS3111S a~llddy XVW
K910853-12
EXTENT OF
DAMAGE
(a) PRIOR TO TEST
-EXTENT OF
DAMAGE
betavailable copy
(b) AFTER FATIGUE TE.SrING
FIGURE k-3 REGION OF AXIAL - 50 v o- 4.2 MIL BORSIC-6061 FATIGUE SPECINIEP
Ik

K910853-12
LOCATION
OF FLAW
(a) FLAW EXISTING PRIOR TO TESTING PHOTOGRAPHED AFTER FATIGUE TEST
-FRACTURED
FIBER
(b) FIBER FRACTURE DURING FATIGUE
FIGURE 6 - 4. AXIAL 50vao - 4.2 N1Lk BORSIC-6061 FATIGUE SPECIMEN AFTER
FATIGUE TESTING
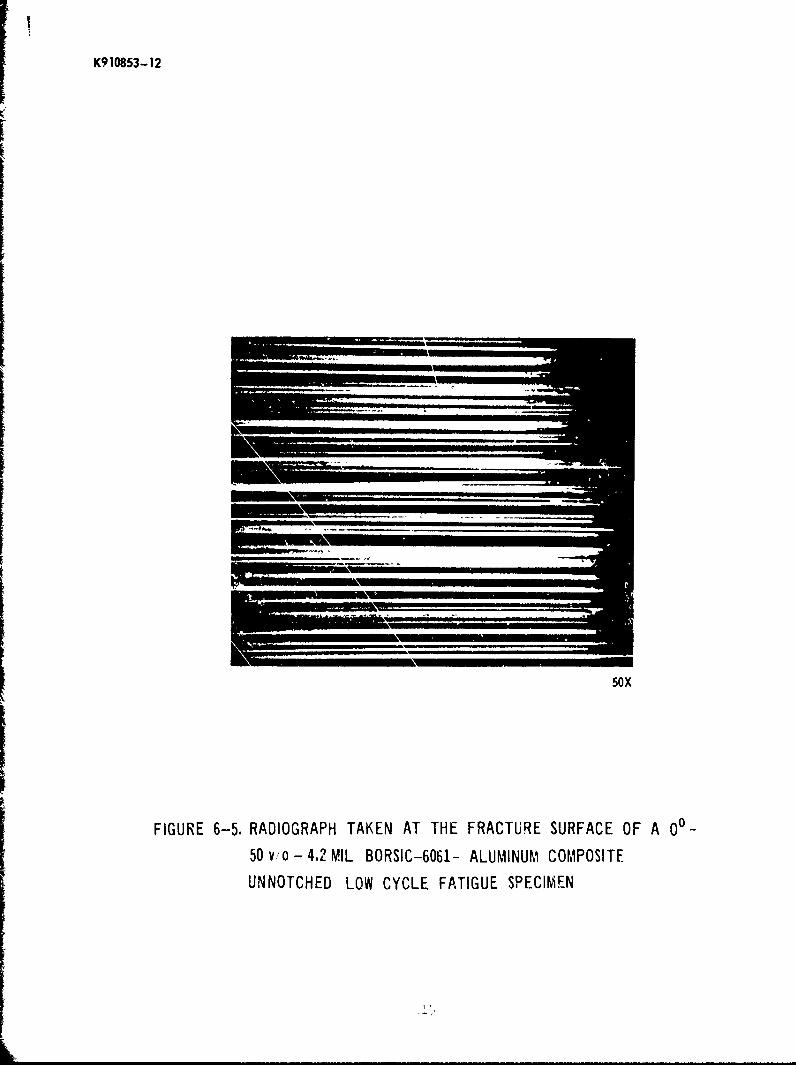
K910853-12
50X
FIGURE 6-5. RADIOGRAPH TAKEN AT THE FRACTURE SURFACE OF A 0°-50 vo - 4.2 MIL BORSIC-6061- ALUMINUM COMPOSITE
UNNOTCHED LOW CYCLE FATIGUE SPECIMEN
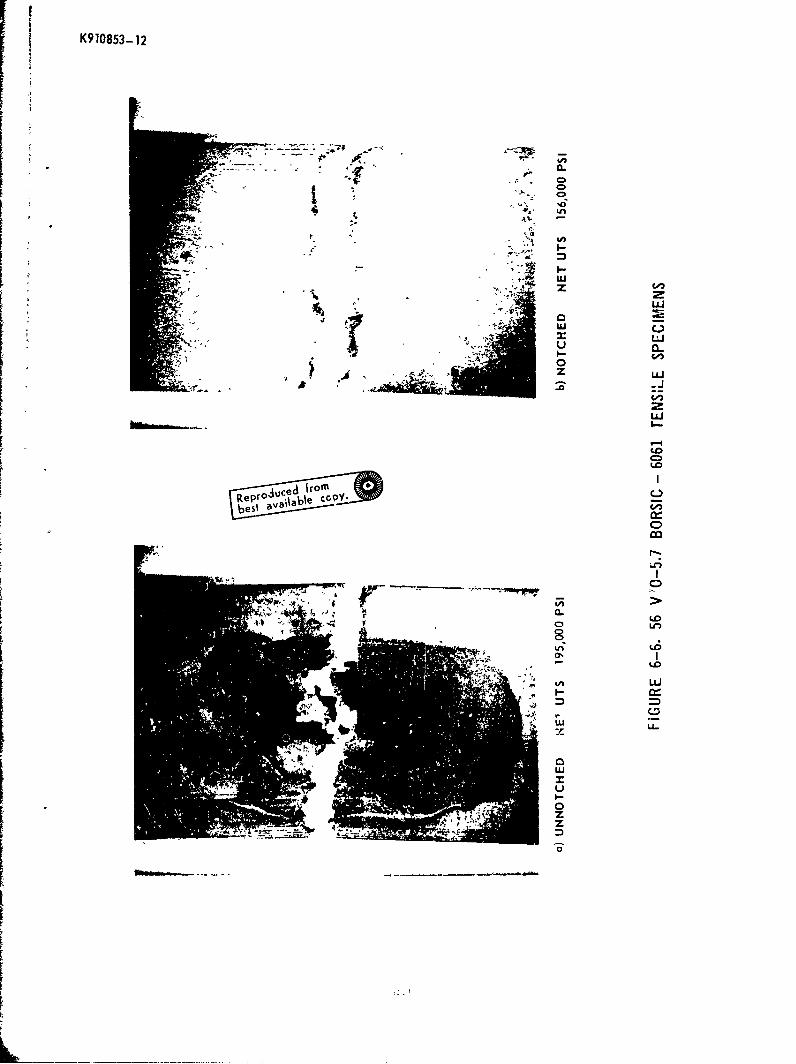
K910853-12
'0F
Cl.
Cl-
LLU
0
zz
La
Repro' ucd 4,ro
Lni
Li~
0.
TIMM z
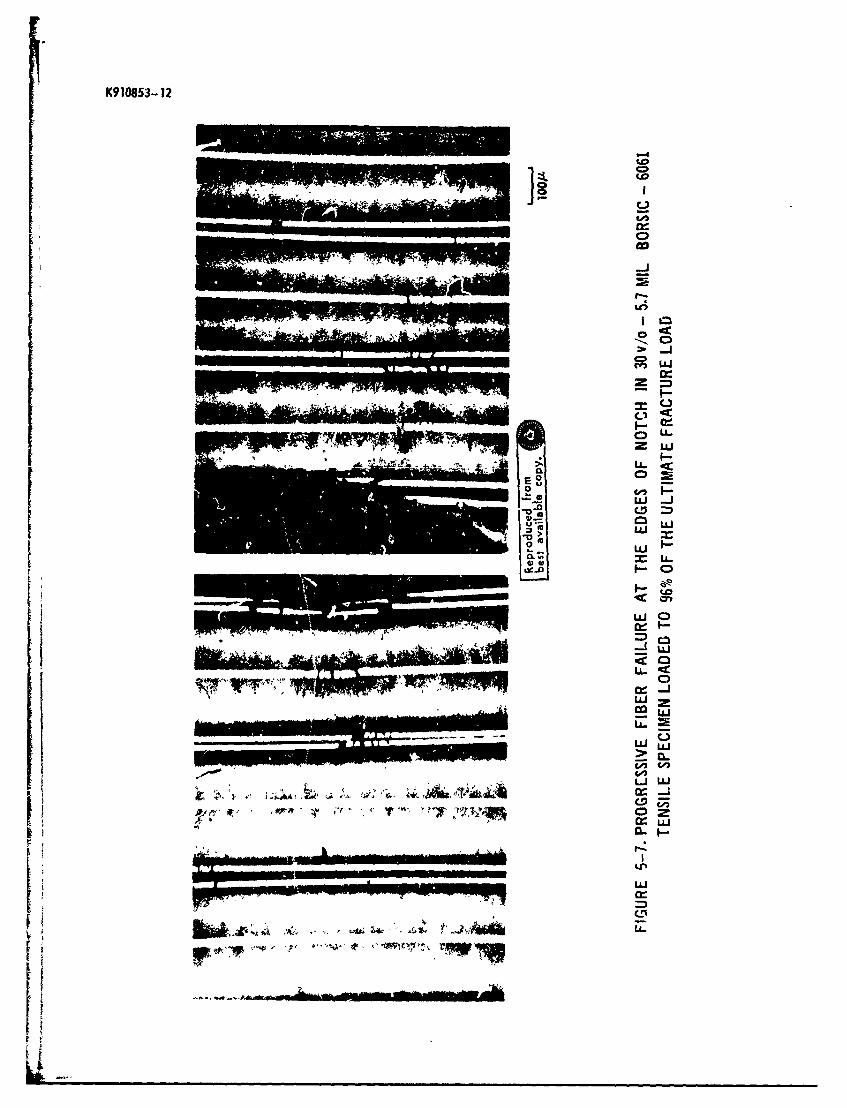
K(910853-12
Co)
-LJ
U,
OLLJ
04'.0LLJ
LA-0
~LijCa)
M AM,. A W
'4
6-
7r __ IT ý21
7 -~'~1 uj
H -N
V '"'V. l.
"AA j .-
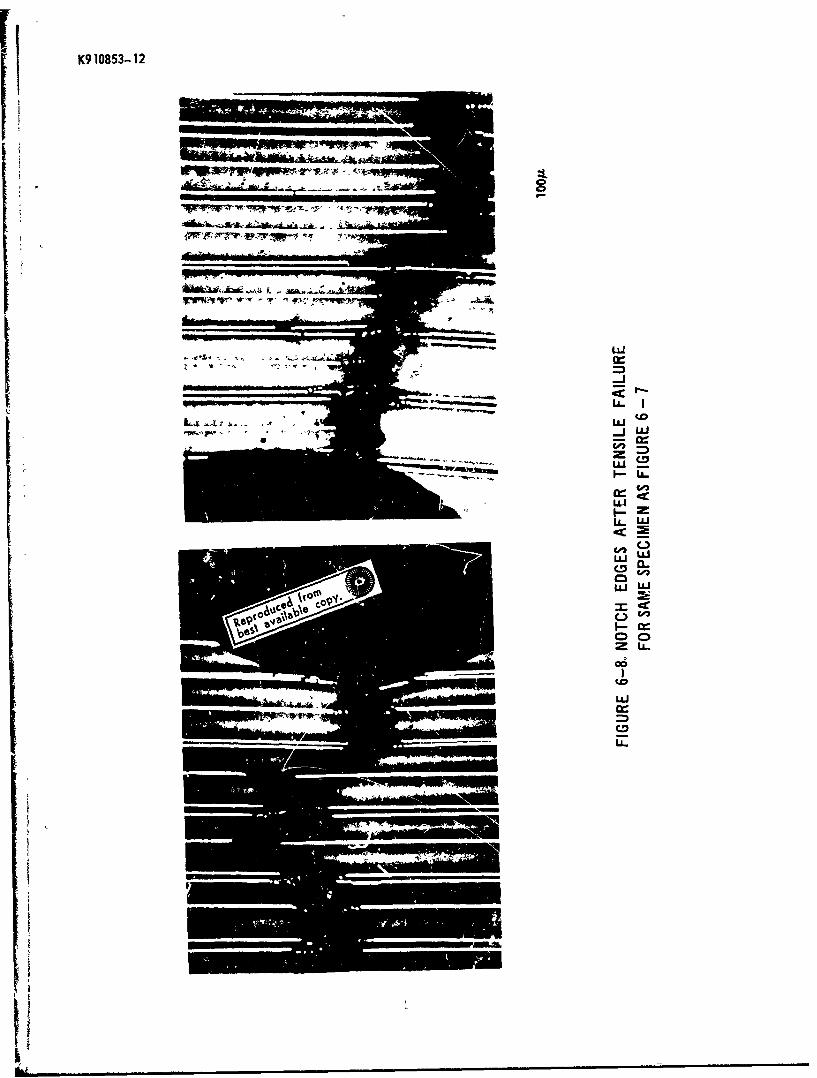
K9 10853.-.12
LLL
LA-UJ
40)
UWLLJ
CD
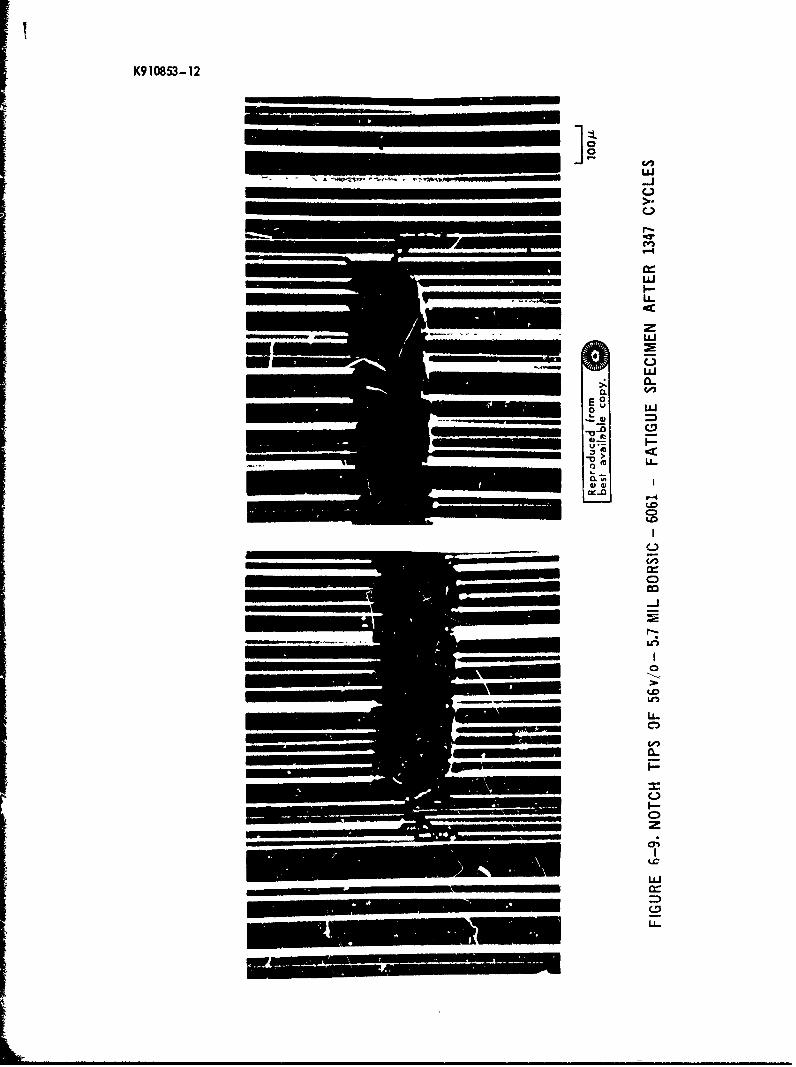
K910853-12
LhJ
I.-
C-,
a-
toolCL
-u)
C)
LL-
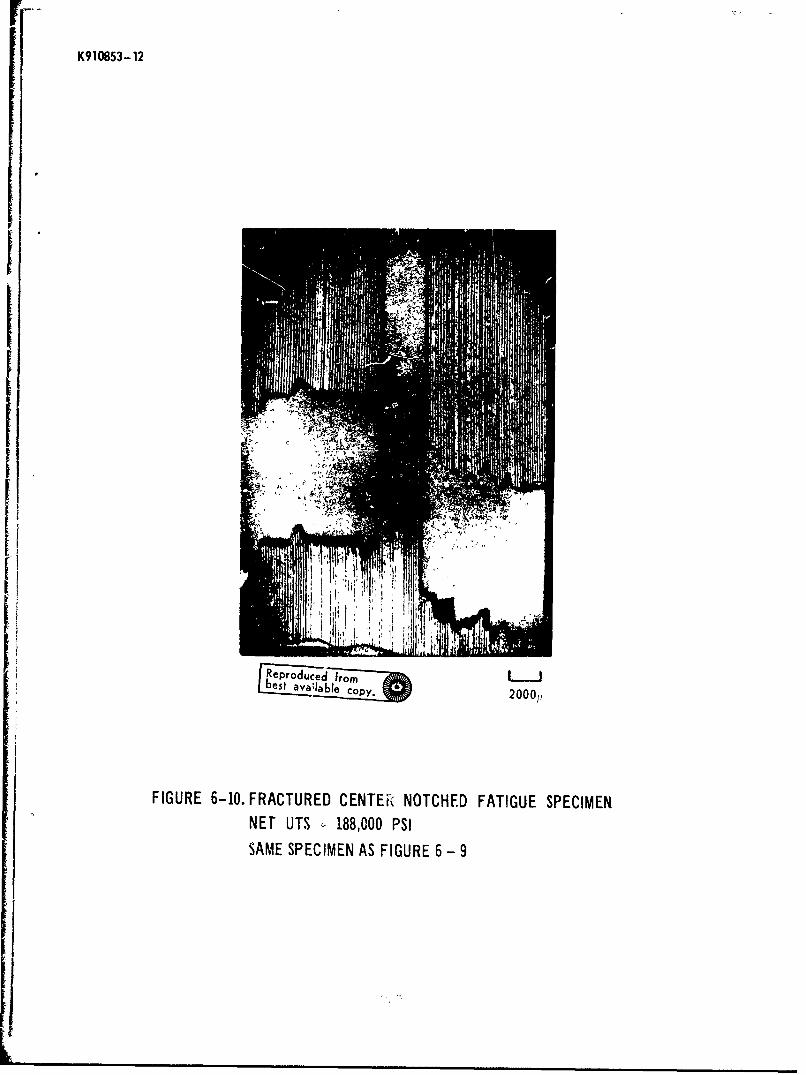
K910853-12
III, ! I I ,
SReproduc romb besaaluaýbIe = py.20001,
FIGURE 6-10. FRACTURED CENTER NOTCHED FATIGUE SPECIMENNET UTS - 188,000 PSISAME SPECIMEN AS FIGURE 6 - 9
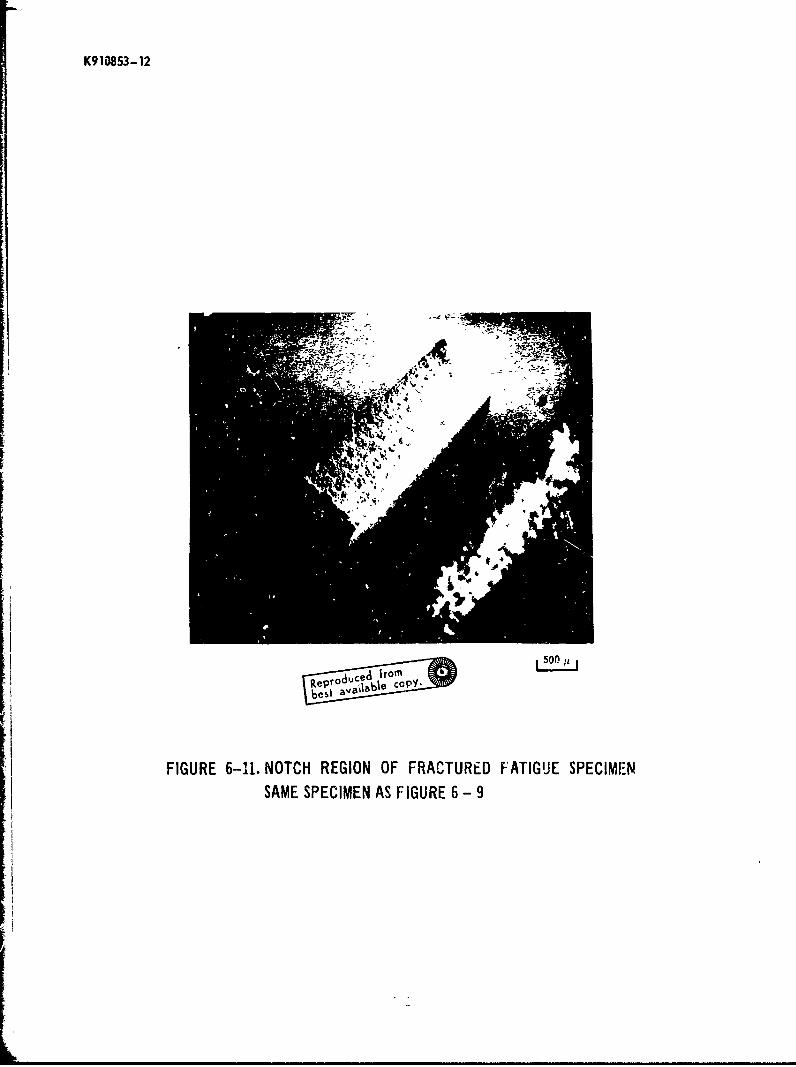
K910853-12
FIGURE 6-11. NOTCH REGION OF FRACTURED FATIGUE SPECIMENSAME SPECIMEN AS FIGURE 6- 9
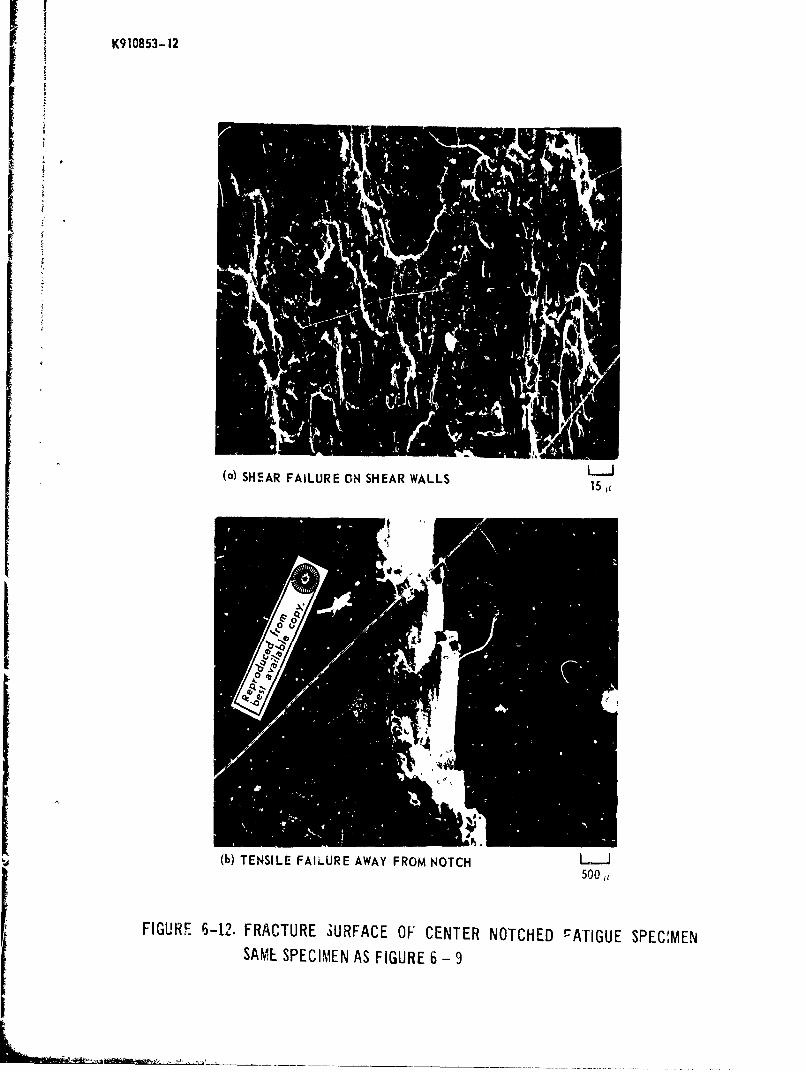
K910853-12
I
(a) SHEAR FAILURE ON SHEAR WALLS 1511
II
(b) TENSILE FAILURE AWAY FROM NOTCH LJ500 ,
FIGURE 6-12. FRACTURE SURFACE OF CENTER NOTCHED FATIGUE SPECIMENSAME SPECIMEN AS FIGURE 6 - 9
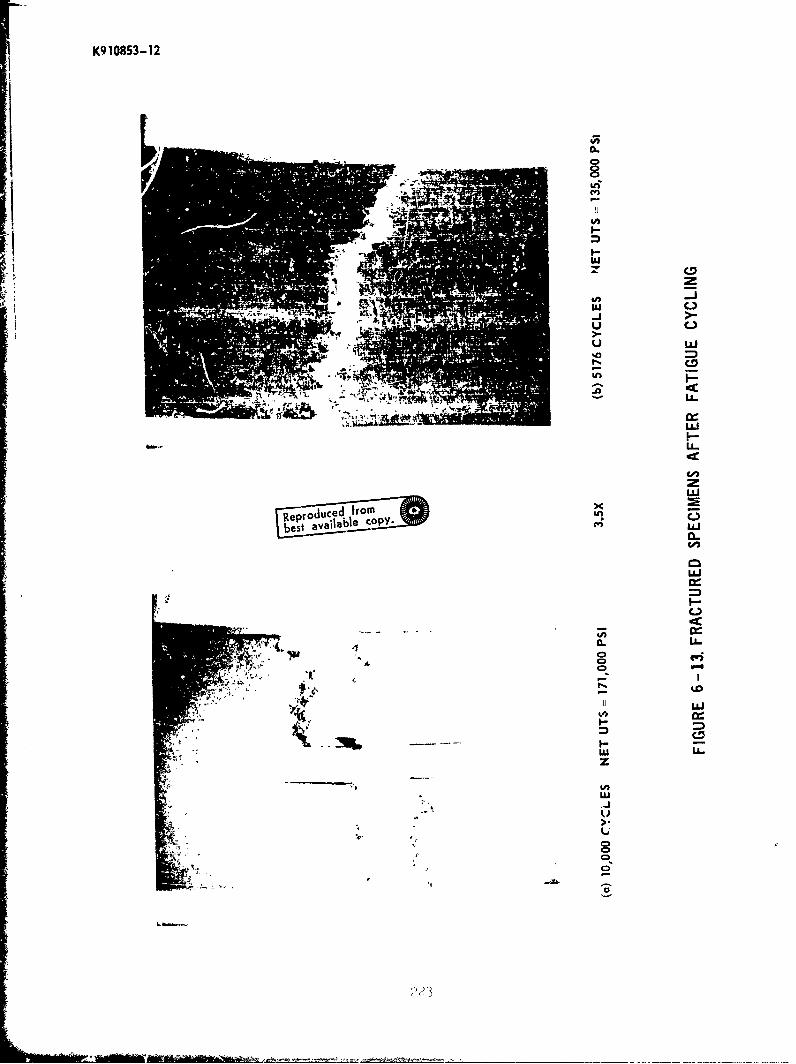
K910853-12
0..
ILA
F-
UU
-to
x i.
Reprduce fro
LLJ
ww
LU0
)3H
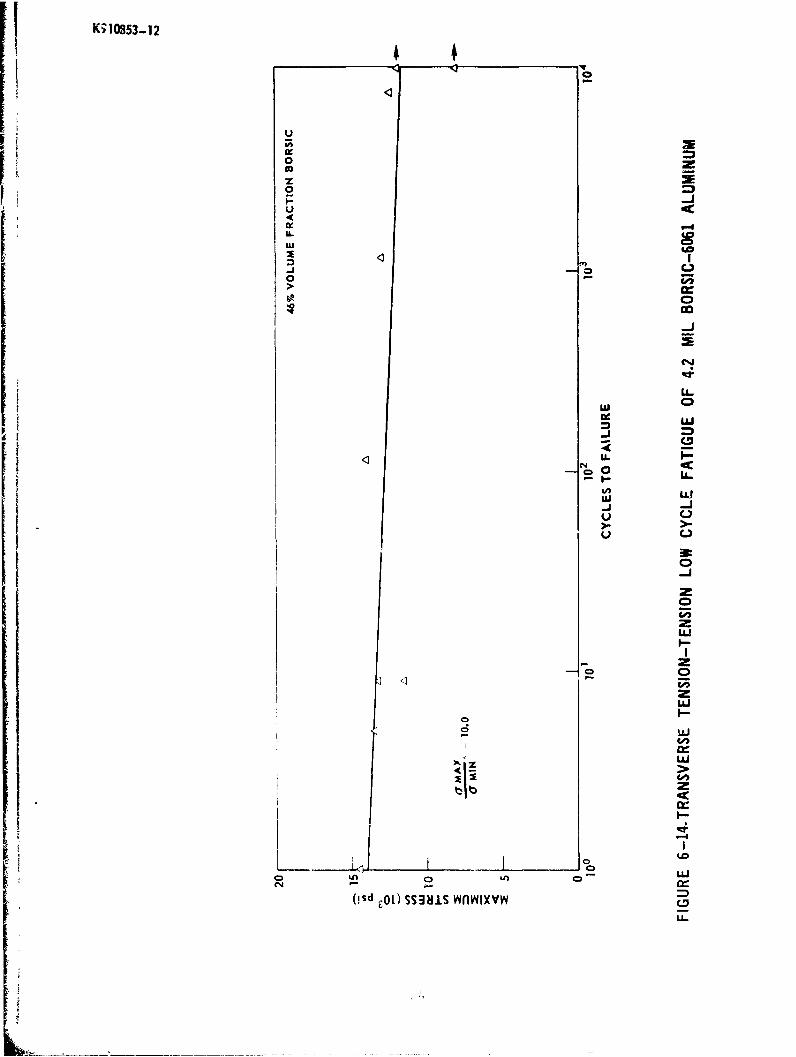
K;10853-.12
UC
0
o o
I- 00
UU
-Jw 0 .
00L-J
uLL
u0
dii
CD
ILL>
'Uo
b zt0
m,
(!sd~ 00S I niv

K910853- 12
CN-
x
C)
0
w LL
uJ
Xe
_
-J )v;
-AJ
U_;
CD,
QzLn 'V M
'I~d C,1) X,,
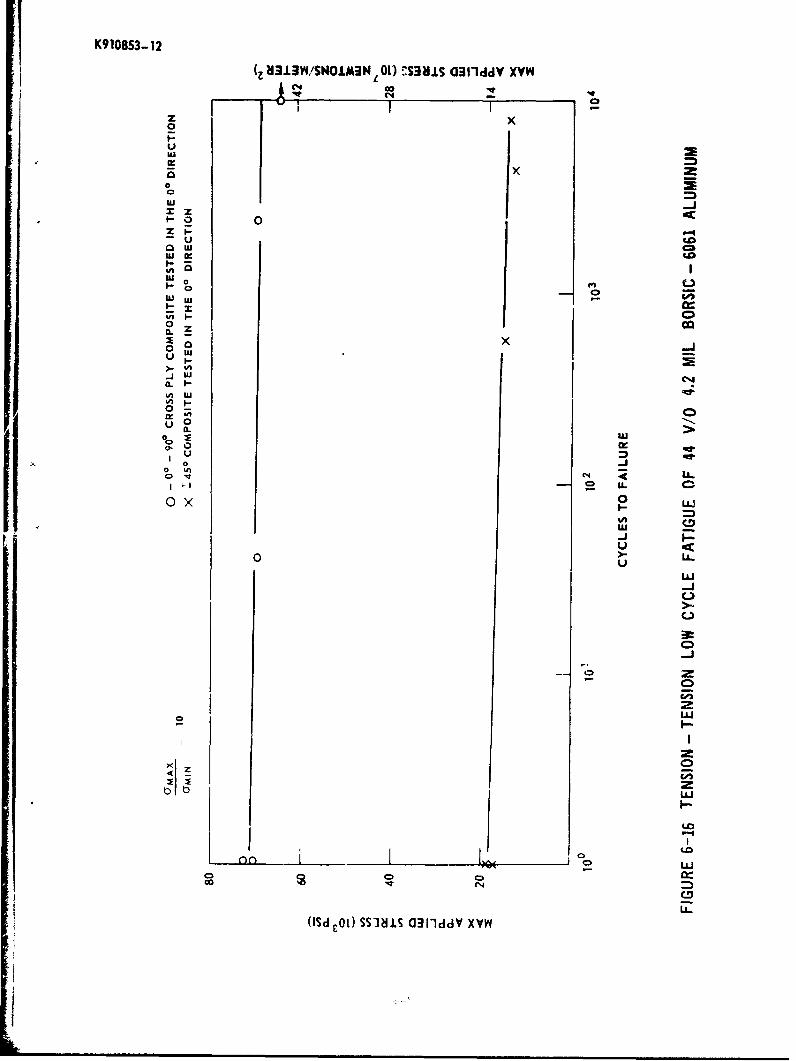
K91083-12(Z H~i3 3W/SNOiN3N 00) S33ViS C1llddY XVW
CC
00wl
zz100
z p-u
1a 0UC
'n 0
0 -J0. -
0-I
_jl W
CLwLU
0:0U 0UCLnI.; 0
u wt
0 i0v C4,
I-u 40
>-0L0
(I~dOi) S)~i.S G1ldd XW

K910853-12
F- GRW - 17. WA4
l.mumot 1151 mil
o- NNI IN/NNm-mo
200X
FIGURE 6- 17. RADIOGRAPH OF FATIGUED CROSS PLY 4.2 MIL BORSIC - 6061 COMPOSIrE
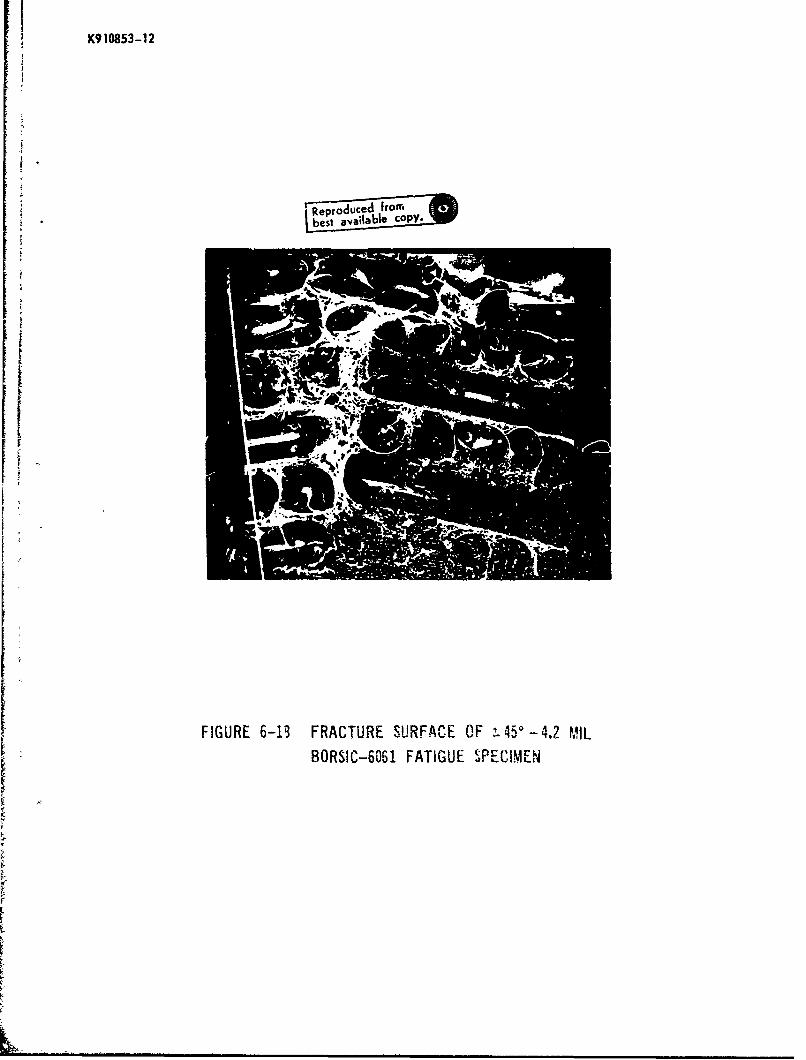
K910853-12
a. I =bleC S-
FIGURE 6-13 FRACTURE SURFACCE OF !-45a-4.2 PAIL
BORSIC-6061 FATIGUE SPECIMEN
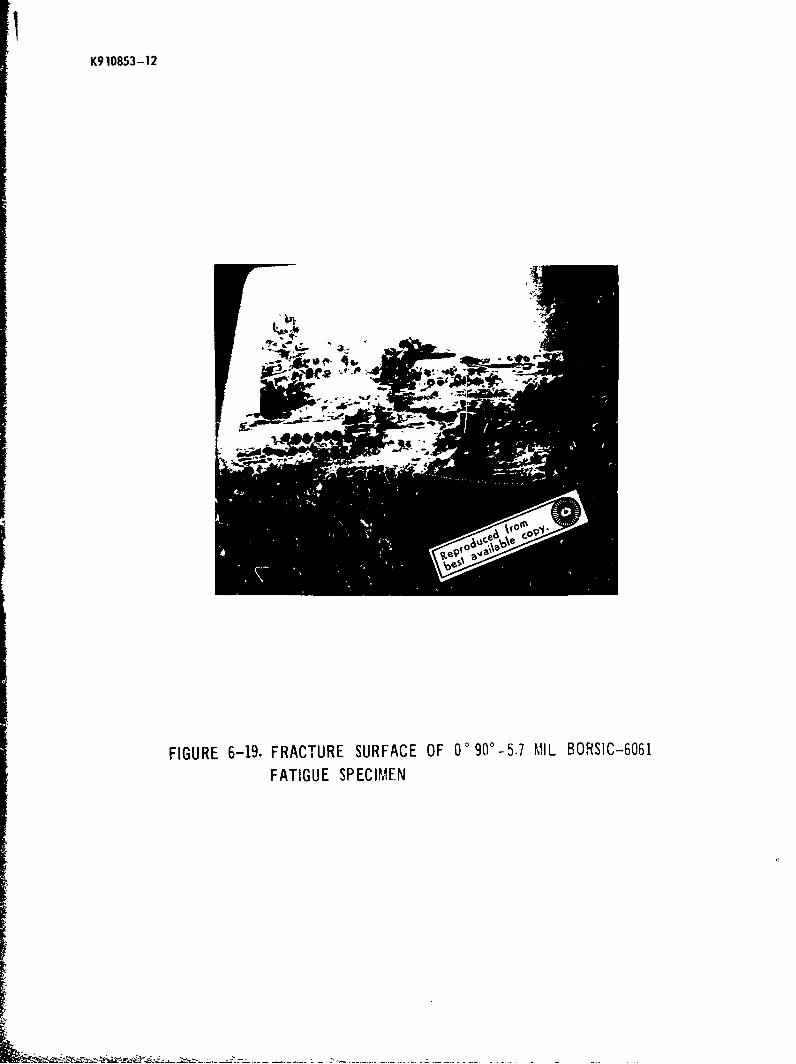
K910853-12
FIGURE 6-19. FRACTURE SURFACE OF 00 900-5.7 MIL BORSIC-6061
FATIGUE SPECIMEN
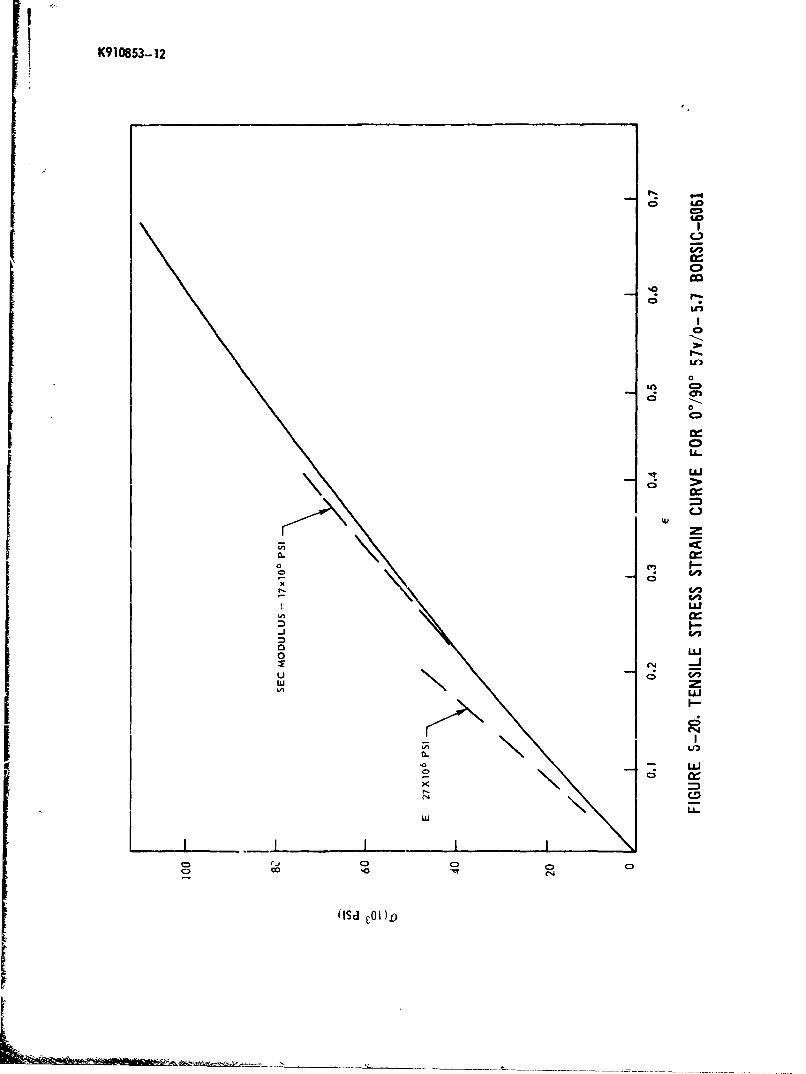
K910853- 12
co
00
00
0-
CD)
0-
* O
ool
00
,uu.
CD C.ol 00C
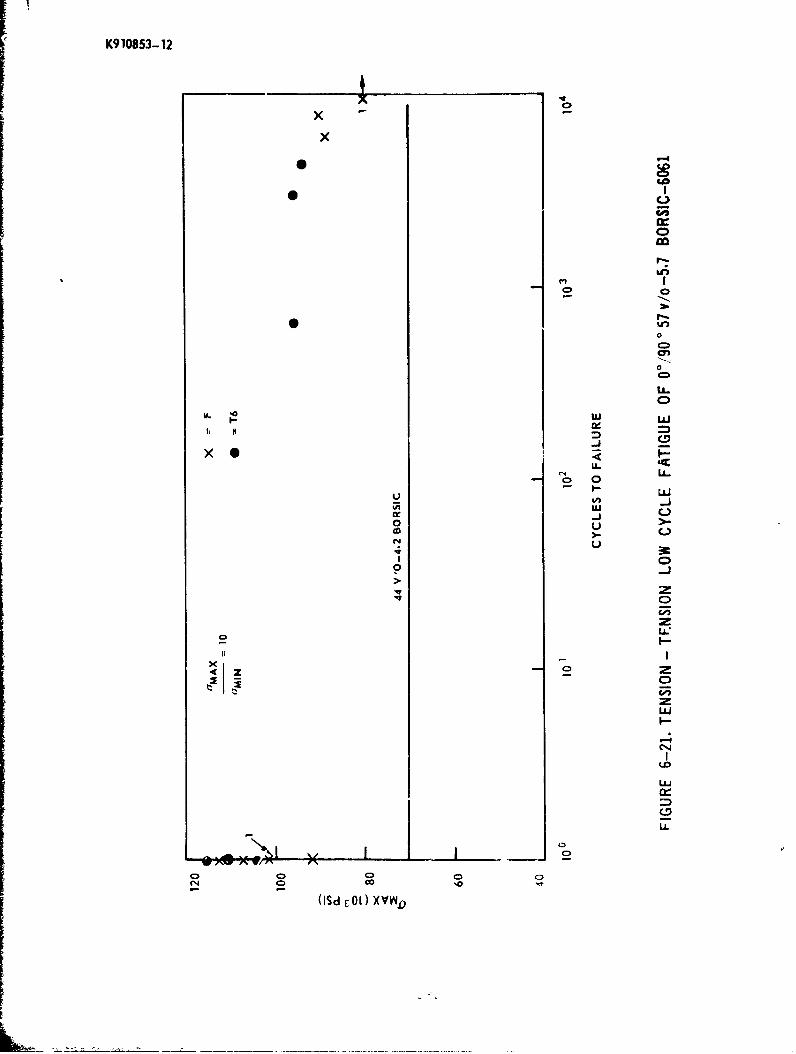
0
0
U-
It CD
U--
wLU-
C-,
0 -0
z.4 0
zC-
w
-*4
u-I
CD
(ISd 01I) XYVW 0
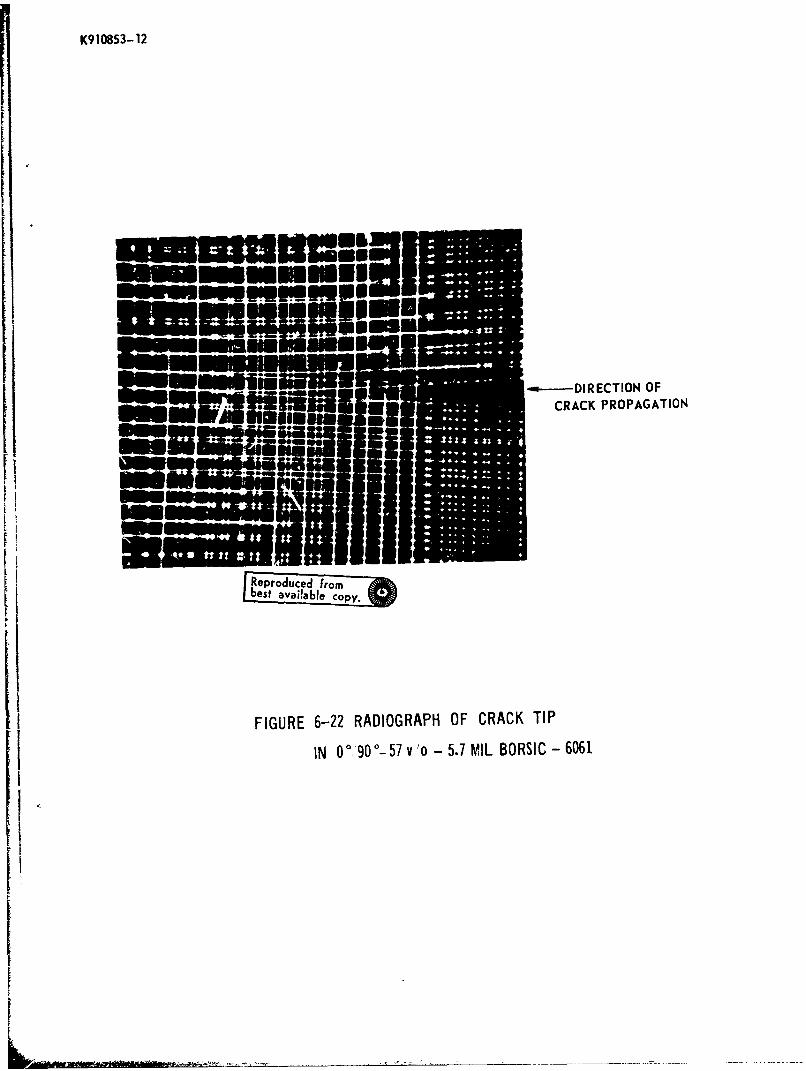
K910853-12
•J•JJJ -=,----DIRECTION OF
is.CRACK PROPAGATION
t Repoduced fromIbest available copy.
FIGURE 6-22 RADIOGRAPH OF CRACK TIP
IN 0 0,,90 o 57 v lo - 5.7 MIL BORSIC - 6061
-[-
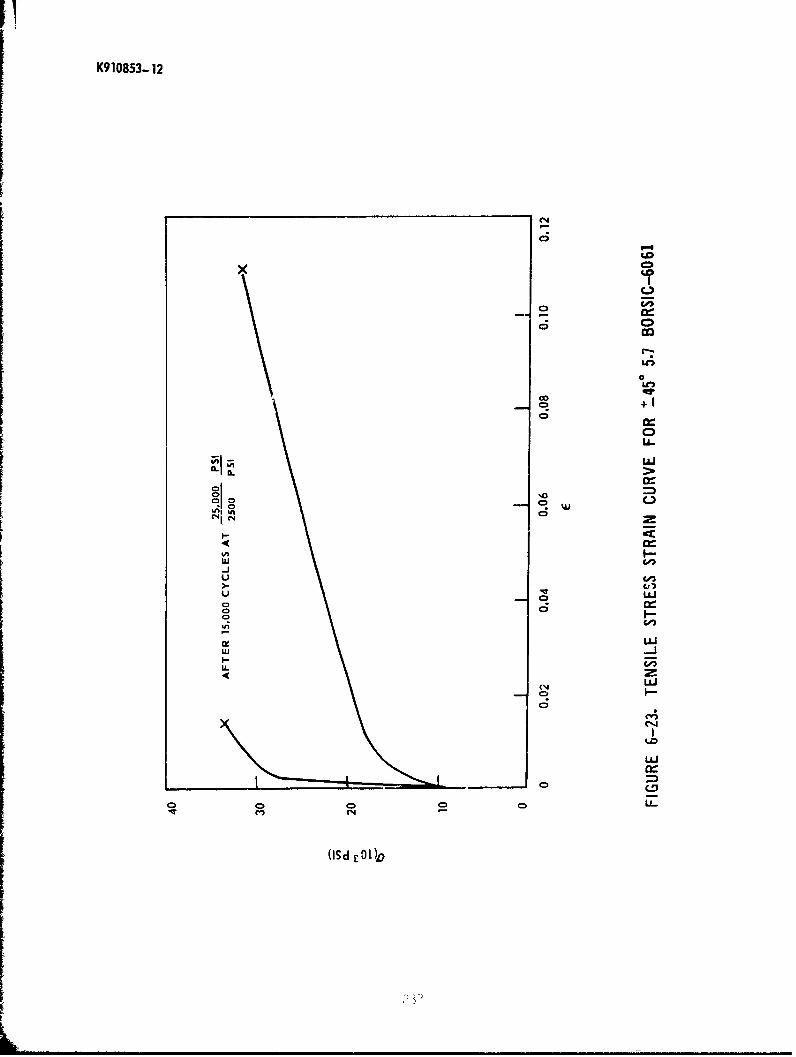
K910853- 12
"4i
aato
C-,
I-
u,>
tn U,0 4
u0
C!-
I-IC1I-
w~-Jj
cr
0D C1
CDC
"C4L
0 0 0 0c000o

K9186$3-12
lift
4WA |f• i
FIGURE 6-24. FRACTURE SURFACE OF ±45' 5.7 BORSIC
6061 FATIGUE SPECIMEN

- 14
Rieproduced from
be str ____ bie ýcopy.
FIGURE 6 - 25. FIBER FRACTURE IN A t 450 - 57 v,'o
5.7 MIL BORS!C - 6061 FATIGUE SPECIMEN
significantly lower, no load fluctuations are observed, and abrupt failure doesnot occur. In addition, the unloading curve displays a long "tail" extendingto deflections that are high relative to those at maximum load.
Notched Flexural Strength
Notched flexural strengths of both longitudinally and transverselyreinforced materials were determined using beam theory; the results are given_n Fig. 7.17. The behav-or of these spe-imens can be accounted for in tefollowing way.
The ratio of notched to unnotched tensile strength for 50% 4.2 milBORSIC+ 6061-F material in the presence of large flaws is approximately 0.53(85 ksi/160 ksi), vig. 8.3. The flexural strerfth of this composite is 225 ksi,Fig. 3.8, "*hich is approximately 1.40 times the tensile strength. in addition,the tensile strengths of 50%, 410, 32%, 4.2 mii BOR-SIC + 6061-F are 160 ksi,131 ksi. and 102 ksi respectively (Ref. 7.7).
Assuming that:
1. The ratio of notched to unnotched strength in the presence of alarge flaw is the same in bending as in tension (0.53);
2. ThE notched to unnotched strength ratio is independent of fibercontent (0.53);
3. The ratio of flexural strength to tensile strength is independentof fiber content (1.40);
the following notched flexu._al strengths are cal~ulated." 119 ksi at 50%; 97 ksiat 41%; and 76 ksi at 32%. The measured values agree closely:. 116 ksi at 50%,85 ksi at 41% (single test), and 78 ksi at 32%, Fig. 7.17.
The notched to unnotched tensile strength ratio fnr transversely rein-forced 4.2 mil BORSIC + 6061-F composite material is approximately 1.00; nettensile strength is unaffected by the crack, Fig. 8.17. In addition, the trans-verse tensile strength of 4.2 mil BOSIC + 6061-F is nearly independent of fibercontent at approximately 15 ksi, Figs. 3.13, 4,7, and 4.13.
Assuming tnat:-
1. The net fracture stress in bending is unaffected by the notch asin the case of tension;
2. The ratio of flexural stiength to tensile strength is the samefor transversely reinforced material as for longitudinally reinforced material;then a notched strength of avprox~m-tely 21 k-i is expected for ail three fibercontents. Measured values rarre from i12.9 ksi to 28.0 Kýsi -ud are approximately30% higher at 54, than at 32%, Fir-. 7.17. Agreement with the calculation isreasonable but not as clos,,e as for the, lon,-'tudinally reinforced nrtrerial.
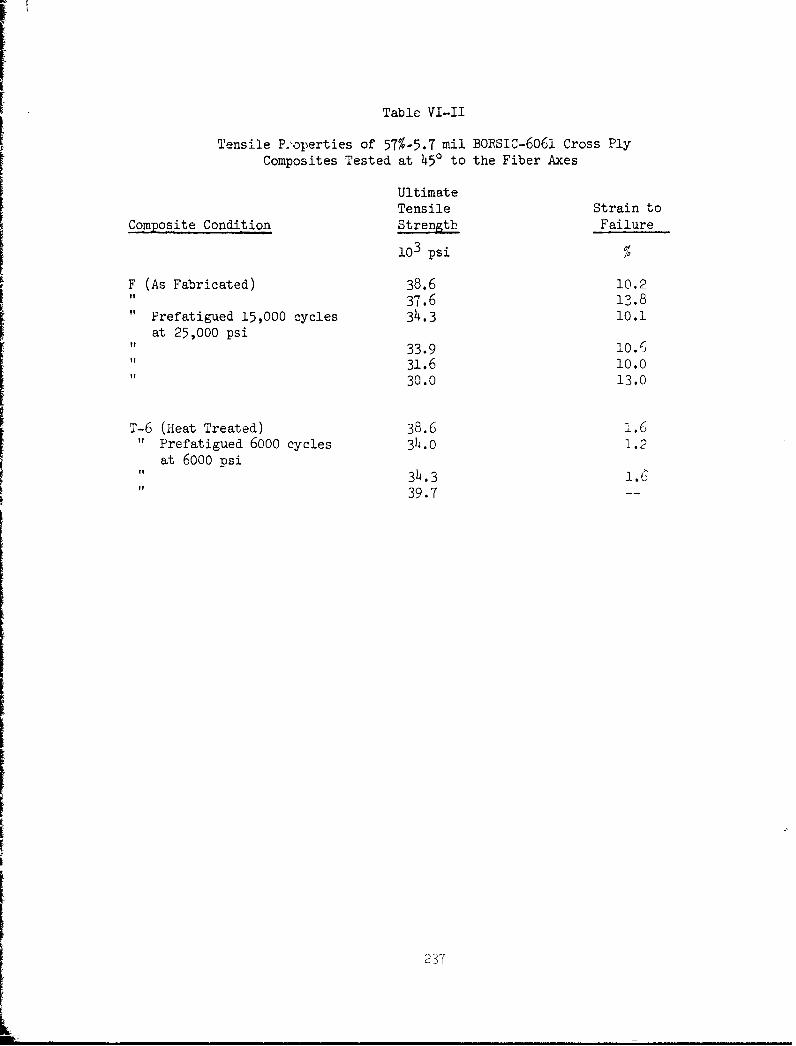
Table VI-II
Tensile P. operties of 57%-5.7 mil BORSIC-6061 Cross PlyComposites Tested at 450 to the Fiber Axes
Ultimate
Tensile Strain toComposite Condition Strength Failure
10 3 psi %
F (As Fabricated) 38.6 10.2"i 37.6 13.8
"Prefatigued 15,000 cycles 34.3 10.1at 25,000 psi
"33.9 10.31.6 10.030.0 13.0
T-6 (Heat Treated) 38.6 1.6
" Prefatigued 6000 cycles 34.0 1.2at 6000 psi
"U 34.3 1.6'39.7 --
2I7
NOTCH BF RACTURE
SUMMARY
The fracture behavior of BORSIC + aluminum camposites has been investi-gated using Charpy impact tests and slow bend tests of Charpy "V" notchspecimens in several orientations and fiber volume fractions. The czergyper unit area of longitudinally reinforced material was found to increasewith fiber volume percentage. The impact energy of transversely reinforcedBORSIC + aluminum is nearly independent of volume fiection fiber andapproximately one-third to one-fifth that of longitudinally reinforcedmaterial. The energy per unit area of +450 orientations are intermediateto longitudinally and transversely reinforced materials.
Potentially significant mechanisms of energy absorption were discussedand it was found that the impact energy per unit area, G irn.-lb/in. 2 could beexpressed in terms of the fiber diameter, df, fiber strength, af, volumefraction fiber, Vf, End matrix shear yield strength by the relationship:
G = 26 + 8.5 x 10- 3 af2 df VfTm
Interrupted s2ow bend tests veze employed to investigate deformation inthe specimens. An i. ortant mechanism of energy absorption proved to bematrix plastic strain. This was confirmed in tests of Charpy specimens withreduced thicknesi at constant notch dimensions which exhibited a nearly lineardecrease in energy per unit area due to the decrease in shear stress withspan to depth ratio.
Extensive fract~graphy was conducted using both scanning electron andconventional light microscopy. Three regions, differing in degrees of filamentbundle protrusion, characterized the fracture surfaces of longitudinallyreinforced material. The fracture surfaces of transversely reinforced 4.2mil BORSIC + aluminum materials exhibit extensive fiber splitting, whereastransversely reinforced '.7 mil BORSIC + aluminum composites do not exhibitsignificant splitting.
VII. NOTCHED BEND FRACTURF
Composite materials containing relatively high volume fractions ofBORSIC or other brittle high modulus reinforcements exhibit nearly elasticbehavior and a limited strain capability when loaded in the direction of fiberalignment. This occurs in the reinforcement direction because high modulusfilaments carry the bulk of the load and largely determine the longitudinalstrain to failure. At intermediate to large angles from the fiber directionthe properties of the matrix and the transverse properties of the fiber becomeimportant but the matrix plastic strain is constrained by the rigid fibers. Inaddition, transverse splitting of weak fibers can diminish the plastic elon-gation by further concentration of the strain field. The effects of constituentproperties on the deformation and fracture behavior of sound composites hasbeen C,*scussed in sections IV and V of this report. This investigation wasconcerned with composite behavior in the presence of large flaws under flexuralloadings.
7.1 Charm_ Tmpact Tests
Ea1mntal Method
The inter. of the first series of experiments was to measure thcgross energy associated with fracture as it function of volume percent fiber,matrix properties, and composite anisotropy. Full size notched Charpy specimensof 30 v/o, 40 v/o, and 50 v/o 4.2 mil BORSIC + 6061-F, 50 v/o 4.2 mil PORSIC +
6061-T6, 63 v/o 5.7 mil BORSIC + 6061-F, 50 v/o 4.2 mil BORSIC + 2024-F, and50 v/o 4.2 mil BORSIC + 5052/56-F were prepared with three crack planeorientations.
Since unidirectional BORSIC/aluminum can be considered transverselyisotropic, the specimen geometries are referred to as types "LT", "TL", "TT",where the first letter refers to the direction (longitudinal or transverse)normal to the nominal crack plane and the second letter denotes the directionof crack propagation.
Since the laminate designs of many composite structures contain +450plies to provide increased torsional stiffness, the impact behavior of thismaterial is also of direct interest. Plasma-sprayed monolayer tapes werefabricated and vacuum hot press bonded into 80-layer 6 in. x 2 in. [(+45)40]Tblocks of 50 v/o 4.2 mil BORSIC + 6061-F composite material. Full size notchedCharpy specimens of two orientations were evaluated. The distinction betweenthe two arises because the equivalent longitudinal and transverse laminate direc-tions of +450 material are distinct from the through-thickness or three directionof the laminate. In one case, coded "X", both the crack plane normal and crackpropagation direction is di" ected along a +450 laminate axis. In the secondcase, coded "Z", the crack plane normal is parallel to a +450 laminate direction(1 or 2 axis) bat the direction of crack propagation is through the laminatethickness perpendicular to the laminae (3 axis).
239

A final series of experiments involved tests with Charpy specimens ofsubsized width and thickness. Since significant plasticity effects accompanythe fracture of BORSIC-aluminum, these experiments were aimed at determiningthe degree to which the apparent fracture energy measured in an impact testdepends on sample size in given specimen orientation.
The bulk of this work was performed using material consolidated fromplasma sprayed monolayer tapes. The microstructures of these materials werecharacterized by good fiber spacing, excellent bonding, and less than one percentvoids, Fig. 7.1. In addition, impact tests were also performed using materialfabricated from polystyrene bonded fiber and matrix foils. These were also
well consolidated and bonded.
In all of these tests, measurements were taken of the loss of pendulumenergy, in accordance with ASTM Standard A370-67 using a 24 ft-lb capacitymachine. Pendulum velocity at impact was approximately 11 ft per second.
Results and Discussion
Work of Fracture
The results of the Charpy "V" notch impact tests are listed in Table.,VII-I and VII-If. The relationships of volume fraction fiber and specimen :.ien-tation to impact energy of 6061-F matrix composites are given in Fig. 7.2. Theimpact energy of longitudinally reinforced material (type LT) increases withvolume fraction fiber and is approximately three times greater than the energiesof the transversely reinforced materials (types TL and TT). The difference inenergy between types TL and TT is approximately 10% and both of these energylevels remain nearly constant with volume fraction fiber.
Types TL and TT absorb substantially less energy than type LT becauseboth are oriented such that the large longitudinal specimen stress loads thecomposite in the direction perpendicular to the fibers, whereas in-the type LTspecimens, the large longitudinal specimen stress is directed along the fiberdirection and matrix shear stresses are higher. Both the tensile strength andfracture strain of BORSIC/aluminum are much lower in the transverse directionthan in the longitudinal direction. In addition, since the crack in type LTis propagating in a plane normal to the filaments, every fiber in the compositemust be broken. Energy is absorbed in type LT specimens by matrix shear in planesparallel to the filaments and by the process of "pulling out" subcritical fiberlengths on both sides of the fracture surface (Refs. 7.1,2).
The 'difference in energy between types TL and TT is small and may,in part, be associated with the orientation of active slip planes relative tothe fiber direction (Ref. 7.3). Slip (plastic deformation) ahead of the advancingcrack tip on planes oriented from 450 to 900 to the crack can take place withcomparatively little fiber interaction in type 'IT specimens. In type TL, how-ever, relatively little plastic deformation can occur without transferring loadto the fibers since the 450 slip planes intersect the array of filaments. Thus,the relative volume of matrix material undergoing plastic deformation is larger
240
in type TT and this mw produce the higher fracture energy values. If planestrain conditions are developed in this specimen, part of the difference mightbe attributed to the fact that type TL specimens experience an induced trans-verse specimen stress normal to the fibers while the transverse stress intype TT lies in the stronger direction (parallel to the fibers).
Neither type TT nor TL appears to exhibit a significant variationin work of fracture as a function of volume fraction fiber. Lower fracturework was expected as a result of decreased volume of the ductile phase. However,as is shown in Fig. 7.2, the impact energy is nearly independent of volume frac-tion fiber in a similar manner to the transverse tensile strength.
The 6061-T6 matrix composites exhibit fracture energies substantiallylower than those of 6061-F matrix composites, Fig. 7.3. The energy is 40/lower in the LT orientation, 50% lower in the TL orientation, and 62% lower inthe TT orientation. Similarly, the 2024-F matrix and 5052/5056-F matrix com-posites exhibit fracture energies less than one-half of those of the 6061-Fmatrix composites, Table VII-I.
The tensile strengths of these composite systems (longitudinal andtransverse) and the elastic moduli of the matrices are very similar. Therefore,the variations in composite fracture behavior arise from differences in the insitu matrix strength and ductility.
Varying the width of the Charpy specimen does not affect the fractureenergy of type LT 4.2 mil BORSIC + 6061-F material, Fig. 7.4. This suggeststhat the additional transverse constraint arising from increased width is
insignificant in view of the constraint already on the matrix in the specimen.The width independence of energy could be of practical significance if the Charpytest were part of a quality control specification. Decreasing the width of atype TT specimen from 0.400 in. to 0.100 in. however, results in approximatelya 50% decrease in measured energy. This may be due in part to filament damageduring machining. Surfaces normal to the fiber orientation are particularlysusceptible to machining damage since the fiber splits easily. Weakened filamentcan result in a reduced transverse strain (or stress) capability and the energyrequired to fracture the specimen would be lower.
Reducing the thickness of the Charpy specimen while maintaining con-stant notch dimensions results In a nearly linear decrease in measured energyper unit area, Fig. 7.5. This appears to be related to the decrease in the ratioof horizontal shear stress to tensile stress parallel to the fibers. T/0. isdirectly proportional to the depth to span ratio. This confirms tn.at an importantmechanism is matrix deformation in planes of "easy soear" parallel to the filaments.
The behavior of the two +450 laminate test configurations is consistentwith this principle, Fig. 7.6. The type Z orientation exhibits approximately 50%more energy absorption than does type X. This difference arises because as thecrack opens extensive matrix shear occurs in planes that are parallel to the plies(fibers) and normal to the crack plane. In the type X orientation all planesparallel to the advancing crack front intersect filaments and less plastic
241
deformation occurs. The prefer.-ed shear planes are oriented at 450 to the crackplane; these are parallel to one-half of the filaments and normal to the otherhalf.
Fr~acto~r~p•_
It was determined by optical fractographic examination that the fracturesurface characteristics were similar for the various fiber volume fractions ofthe 4.2 .il + 6061-F system. Detailed examination of the fracture surfaces wasmade by scanning electron microscopy on composites containing volume fractionsof 0.50. The results of this examination are discussed below.
A photograph of a typical LT fracture is presented in Fig. 7.7. Themachined notch lies on the right, fracture has progressed from right to leftin Fig. 7.7 (left) along a surface roughly normal to the filaments. At leastthree kinds of fiber breaks are evident. Filaments exhibiting little or noprotrusion from the matrix usually fragment into wafer-like sections, whilefilaments protruding significantly from the 3urface tend to exhibit a conicalfracture surface. In addition, a very small number of both conical and waferedare longitudinally split. No matzix delamination or fiber matrix interfacialI failure is observed. The type LT fracture surface can be characterized bythree regions:
1. Region I: An area extending from 2 to 10 fiber layers (0.010in. to 0.050 in.) adjacent to the notch with relatively long protruding fibers,each with a "sheath" of aluminum matrix, and holes or cavities that correspondto protruding fibers on the mating: surface. These protrusions typically containfrom 1 to 5 filaments and extend from 0.025 in. to 0.060 in. from the nominalfracture plane in the case of 606:-F matrix material.
2. Region II: An Area extending over approximately two-thirds ofthe reduced section where fiber bundles of up to several hundred filaments havebeen pulled out (or are protrudir.g) from the nominal fracture surface. Theseareas usually exhibit markings on the matrix fracture surface where the bundleshave been pulled out, Fig. 7.7 (right). Within a given bundle, the plane ofmatrix shear rupture or the local fracture surface is typically less than 0.001in. from the ends of fractured filaments.
3. Region MIl: A shelf extending from 12 to 20 fiber layers (0.060in. to 0.100 in.) from the back surface of the specimen that is nearly flat.The areas of bundle pull out claracterizing region II are totally absent. Theextent of this region remains ,±early constant with changes in either the widthor thickness of the specinen, Figs. 7.8 and 7.9 (left).
Region I results from the extensive longitudinal matrix shear nearthe crack tip that occurs during loading prior to unstable crack growth.Region II is produced by mE~trix shear rupture along planes linking positionswhere filaments are broken ahead of the advancing crack. The crack can turnand run longitudinally for short distances, resulting in areas of fiber bundleprotrusion (Ref. 7.3). Region III, the shelf, appears to be a result of fiber
242
I • ,,o ,•••• • . . •• • . . . .. . .. ... . .
damage. in the specimn under the loading nose which is subjected to contactstresses. This effect vili be discussed in the slow bend section of this report.
A typical type TL fracture is shown in Fig. 7.10 (left). The notch is
at the bottom of the photograph and the crack has propagated upward. In thisorientation the composite is loaded in a transverse direction and the crackpropagates longitudinally with respect to the fibers. Under these conditionsnearly all the filaments exposed on the fracture are longitudinally split. Thecrack does not simply split all the fibers in a single plane and propagateacross the specimen; frequent deviations to adjacent layers of fibers both inthe direction of propagation and more often, across the specimen width, areobserved.
Longitudinal splitting usually occurs along a plane roughly bisectingthe filament, exposing the tungsten boride core. However, splitting can alsooccur within the SiC coating or between the boron fiber and the SiC coating asshown in Fig. 7.10 (right). On the left is a filament split through the core;on the right is a region of SiC coating material displaying a smooth but crackedfracture surface suggestive of cleavage failure. Between the two is an area ofaluminum matrix that has failed in shear rupture.
A typical type TT failure is shown in Fig. 7.11 (left). The notch lieson the lower left of this photograph; the crack has propagated toward the upperright of the figure in a direction roughly normal to the filaments under theinfluence of an applied stress transverse to the fibers. The fracture appearanceis very similar to that of a type TL specimen. Nearly all the fibers are longi-tudinally split and the fracture is not flat. The largest irregularities occurin the direction of propagation; less frequent deviations to adjacent fiber layersare found across the specimen width. A closer view of a split filament appearsin Fig. 7.11 (right). Typically, on one side of the core the fracture surfaceappears very smooth while on the opposite side it is comparatively rough. Theorientation of the fracture (rough-smooth) was found to be random with respectto the direction of crack propagation.
The fracture surfaces of the 4.2 mil BORSIC + 6o61-T6, 8 mil boron +6061-F, 5.6 mil BORSIC + 6061-F, 4.2 mil BORSIC .. 2024-F and 4.2 mil BORSIC +5052/5056-F systems are similar to those of tne 4.2 mil BORSIC + 6061-F systemjust described. However, the type LT fractures of the 6061-T6, 2024-F and5052/5056-F matrix system exhibit protrusion lengths in both zone I and zone IIthat are less than one-half of those of 4.2 mil BORSIC + 6061-F material. Thisis expected as a result of higher matrix yield strength and shorter critical loadtransfer length. In the case of the 8 mil boron + 6061-F system the protrusionlengths were greater, Fig. 7.12.
Fracture of the +450 4.2 mil BORSIC + 6061-F composite material occurredin a surface approximately normal to the specimen at the reduced section. Regard-less of the direction of crack propagation the fracture surface eThibited a +450saw tooth character parallel to the original laminae (1-2 plane), Fig. 7.13.-Th's reflects the preferred shear planes described previously.
243

The impact energy of BORSIC + aluminum is more than an order ofmagnitude greater than monolithic ceramics such as alumina (less than 0.1 ft-lb,Ref. '[.4) even in a transverse orientation, but is approximately five timeslower than common structural alloys such as Ti-6AI-4V (15-20 ft-lbs, Ref. 7.5)as shown in Fig. 7.1I.
7.2 Slow Bend Tests
Experimental Method
Slow bead tests were conducted using a 60,000 lb Baldwin hydraulictensile machine and a three point fixture identical to the one used in theimpact tests. A deflection rate of 0.050 in. per minute was employed. Con-tinuous load-deflection curves were obtained using the outputs from an LVDTdeflectometer and the load cell. Slow bend tests were either interrupted priorto failure to permit metallogipaphic observations oi -rack extension, or loadedto fracture to determine the maximum load and the integrated aree• under theload deflection curve.
Results and Discussion
Load-Deflection Response
A typical load-deflection curve for 6061 matrix type axially rein-forced type LT specimens, Cnarpy "V' notch tested in slow bending is given inFig. 7.15. The applied load needed to maintain a constant deflection rate (0.050in./min) increases smoothly until near maximum load. The curve initially displa:'ja positive second derivative probably as a result of compressive ielding atthe loading noses and seating of the deflectometer. A fairly large, almost linearregion follows until the interlaminar shear stress reaches approximately 5 x 10³to 8 x 10³ ksi and yielding is observed. Fluctuations are observed near maximumload. Abrupt failure does not occur until the specimen has been deflected wellbeyond the point of maximum load. When failure does occur, the reccoding equip-ment employed here does not respond quickly enough to monitor the curve.Figure 7.15 contains a dashed line constructed parallel to the curve generatedwhen the apparatus is once more able to measure the unloading curve. The areaunder the curve was taken using this line as a boundary. The behavior of typeLT 2024 matrix composites is similar to this except that observed dcflectionsbeyond maximum load are small, less than those of 6061-F matrix material.
It should be noted from Fig. 7.15 that the specimen exhibits con-siderable plastic deflection prior to unstable crack growth. The energyabsorbed is not simply the elastic energy required to load the specimen to itsbreaking load as reported for glass-polyester (Ref. 7.6).
A typical load-deflection curve of a transversely reinforced compesiteappears in Fig. 7.16. Behavior of specimen in the other transverse orientation,type TT, is nearly identical to that of type 1L. These curves exhibit loadingbehavior similar to that of type LT material. However, the maximum loads are
244
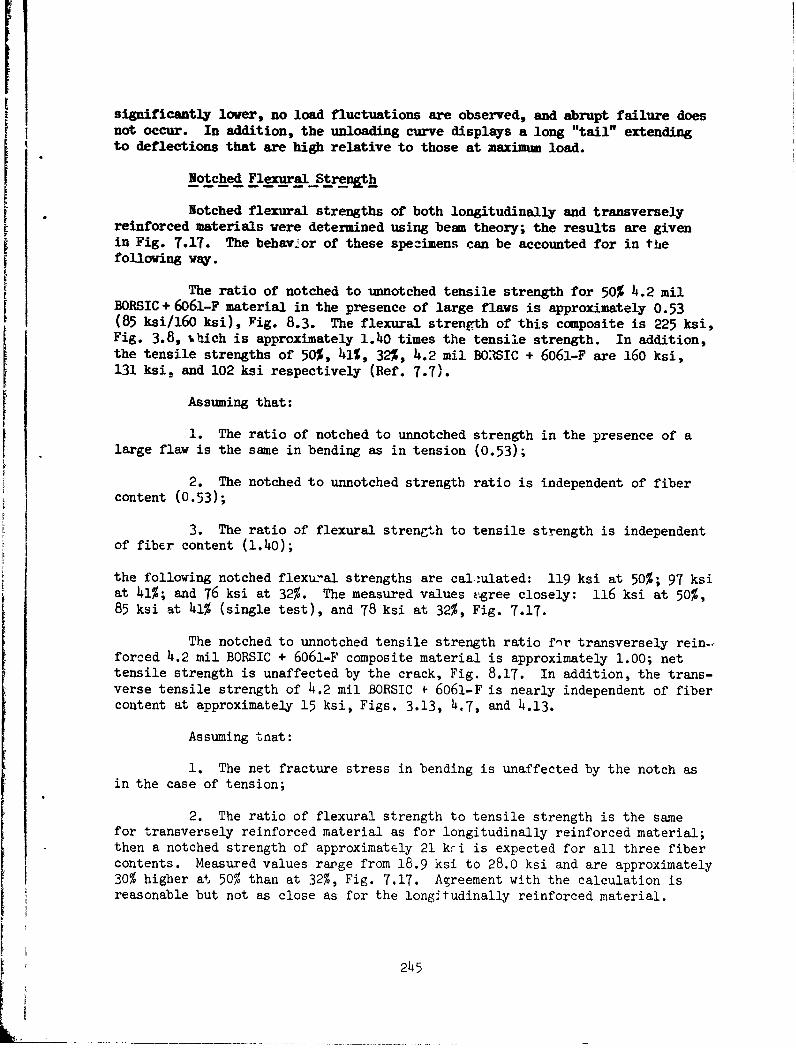
significantly lower, no load fluctuations are observed, and abrupt failure doesnot occur. In addition, the unloading curve displays a long "tail" extendingto deflections that are high relative to those at maximum load.
Notched Flexural Strength
Notched flexural strengths of both longitudinally and transverselyreinforced materials were determined using beam theory; the results are givenin Fig. 7.17. The behavior of these specimens can be accounted for in thefollowing way.
The ratio of notched to unnotched tensile strength for 50% 4.2 milBORSIC+ 6061-F material in the presence of large flaws is approximately 0.53(85 ksi/160 ksi), Fig. 8.3. The flexural strength of this composite is 225 ksi,Fig. 3.8, khich is approximately 1.40 times the tensile strength. In addition,the tensile strengths of 50%, 41%, 32%, 4.2 mil BOiSIC + 6061-F are 160 ksi,131 ksi, and 102 ksi respectively (Ref. 7.7).
Assuming that:
1. The ratio of notched to unnotched strength in the presence of alarge flaw is the same in bending as in tension (0.53);
2. The notched to unnotched strength ratio is independent of fibercontent (0.53);
3. The ratio of flexural strength to tensile strength is independentof fiber content (1.40);
the following notched flexu:-al strengths are cal:ulated: 119 ksi at 50%; 97 ksiat 41%; and 76 ksi at 32%. The measured values tgree closely: 116 ksi at 50%,85 ksi at 41% (single test), and 78 ksi at 32%, Fig. 7.17.
The notched to unnotched tensile strength ratio fnr transversely rein..forced 4.2 mil BORSIC + 6061-F composite material is approximately 1.00; nettensile strength is unaffected by the crack, Fig. 8.17. In addition, the trans-verse tensile strength of 4.2 mil BORSIC f 6061-F is nearly independent of fibercontent at approximately 15 ksi, Figs. 3.13, 4,7, and 4.13.
Assuming tnat:
1. The net fracture stress in bending is unaffected by the notch asin the case of tension;
2. The ratio of flexural strength to tensile strength is the samefor transversely reinforced material as for longitudinally reinforced material;then a notched strength of approximately 21 kri is expected for all three fibercontents. Measured values rarge from 18.9 ksi to 28.0 ksi and are approximately30% higher at 50% than at 32%, Fig. 7.17. Agreement with the calculation isreasonable but not as close as for the longitudinally reinforced material.
245
Work of Fracture_
The energy to fracture the slow bend specimens was determined by inte-grating under the load-deflection curves. Results for type LT BOPS!I" + 6061-Fmaterial compare closely with energies obtained in impact t+sts, Fig. 7.18. Thegreatest disparity was found at 32 v/o fiber, 25%; at .0 v/o fiber the resultswere nearly the same. Tests on 2024 matrix composites with 50 v/0 fiber alsoresulted in substantially the same energy levels: 185 and 169 in.-lb/in.2 inslow bend tests compared to 180 &ad 166 in.-lb/in. 2 in impact tests.
Results for the type TL and TT specimens are given in Fig. 7.19.Observed slow bend energy levels are only one-quarter to two-thirds of the energiesmeasured in impact tests. This effect may be related to the different strainrates characterizing the two tests. The ultimate strength of 1100-0 aluminumfor example increases from 11 ksi to approximately 17 ksi as the strain rate isincreased from 10-6 to 103 (Ref. 7.8). In addition, multiaxial stress can havean appreciable effect on strain rate sensitivity (Ref. 7.9). The impact energiescould be higher than the slow bend values because annealed 6061 alloy is a rela-tively low yield strength material and the effect of increased strength is toincrease the work of matrix rupture, Fig. 7.20. The maximum disparities inall three orientations are found at the lowest fiber volume percents (highestmatrix fraction).
[ Interrupted Tests
Photographs of a type LT slow bend test specimen interrupted priorto maximum load (at point A in Fig. 7.15) are given in Fig. 7.21. Extensivegeneral matrix slip is evident on the polished surfaces both at the notch tipand under the loading nose. Little plastic deformation has occurred near midthickness. In addition, the filaments in the region under the loading nose arebroken in several fiber layers. This most likely caused the previously men-tioned zone III on the fracture surfaces of broken specimens.
A type LT specimen interrupted after maximum load but before unstablecrack propar•ation (at point B in Fig. 7.15) is shown in Fig. 7,22. Extensivematrix shear has occurred throughout the entire reduced section. A large numberof fiber fractures are evident with the highest density of breaks near the notchtip. It should be noted that these -urface fibers were undoubtedly weakened bythe polishing operation; filaments within the specimen may not exhibit thisdegree of multiple fracture.
Surface views of a type TL specimen test that was interrupted aftermaximum load was reached (at point A in Fig. 7.16) are shown in Fig. 7.23.Longitudinal splitting is evident in filaments below the notch, The specimenhas not yet sustained gross deflections and separated. Extensive slip parallelto the fibers has also occurred, Fig. 7.23 (right).
Similar views of a type TT specimen appear in Fig. 7.24. The surfaceis characterized by extensive fiber splitting and zones of intense matrix shearlinking split filaments.
246
7.3 Notched Bend Analysis
There are three potentially significant mechanisms of energy absorp-tion in BORSIC + aluminum composites associated with crack initiation andpropagation:
1. Uy , Energy to create new fiber surface area
2. UE, Elastic energy needed to load up the fibers
3. UP, Plastic work in the matrix.
Fiber-matrix debonding and matrix-matrix delamination are not observed inproperly fabricated plasma sprayed composites and are therefore not includedabove. These sources of energy absorptior are discussed in the followingsections.
Fiber Fracture Surface Enerv
This contrioution to the observed fracture work is small as demon-strated below. The surface energy of boron fiber can be approximated as beingslightly higher than ceramics such as 14gO or S1O2 glass but less than that of
beryllium, or 1200-1600 ergs/cm2 (6-9 x 10⁻³ in.-lb/in. 2 ) (Ref. 7.12). Thefiber fracture surface energy contribution to the toughness of a 50% byvolume fiber composite is therefore small: 6-9 x 1o-3 in.-lb/in. 2 . EDien ifone increases this value by a factor of 50 (Ref. 7.12) to account for probablelocal plasticity effects in the filament, and also by a factor of 10 to allowfor the possibility of multiple breaks in each fiber, the resulting contri-bution is only 5 in.-lb/in. 2 , com'pared to experimental values of over 3C0in.-lb/in. 2 for the composite in the LT orientation and over 75 in.-lb/in. 2
for 6061-F matrix material in transversely reinforced orientations.
Fiber Elastic Energy_
An important parameter it fracture tests is the quantity of elasticenergy stored in the specimen since this represents a source of potentialenergy available to perform the work of fracture. 1., advanced compositesystems such as BORSIC + aluminum this elastic energy is largely containedin the filaments. Significant amounts of elastic energy are needed to initiatefracture in these materials since matrix or interfacial effects isolate thefilaments froi tress singularities and fracture does not occur at extremelylow levels of applied stress.
Since the stress distribution throughout a notched ductile matrixcomposite has not been established, an estimate of the elastic energy in theBORSIC + aluminum specimens considered in this investigation is given below
and compared to measured values of fracture work.
One may consider a rectangular bar notched at the center subjectedto three-point bending so as to load the material below the notch in tension.It is assumed that simple beam theory can be applied, that behavior is elastic,
247

and that the beam modulus in tension equals that in compresLion. It is furtherassumed that there is no stress concentration effect associated with the notchand that the derth of the notch simply reduces the height of material understress.
The maximum total elastic energy in the specimen at peak load isthen given by:
U = AL 1'c2 /18E
where U = total energy in specimenA = cross-sectional arz4L = length between supports (1.57 in. for Charpy fixture)rc = fracture stressE = elastic modulus along the axis of the beam.
If this energy were consumed in creating the fracture surface ofarea A, the measured work per unit area, UE, would thein be:
UE = L M2 /l1E (7.1)
Equation (7.1) represents an upper bound on the elastic enerby since stressconcentration effects at the notch result in lower stress levels throughoutthe beam at failure compared to the unnotched geometry.
Using the notched flexural strengths determined previously andassuming rule-of-mixtures moduli, one obtains the levels of elastic energylisted in Table VII-III. Also given in Table VII-IiI are elastic energyvalues determined from the area under the elastic triangle of several slowbend tests. The elastic energy contribution is approximately 0.29 to 0.34 ofthe total fracture work measured for type LT specimens. This amount ofelastic energy is better represented by the expression:
UE = L (T.2 /25Ec (7.2)
In the case of type TL and TT specimens the elastic energy estimateis approximately 2 in.-lb/in. 2 . Since the total absorued energy is much moreti.an the maximum elastic energy the fracture is not abrupt and plastic energy is
I absorbed afte- maximum load is passed (Figs. 7.15,7.16).
I Equation (7.2) can be conveniently written in terms of constituent
I properties using rule-of-mixtures expressions for composite modulus and strengthand neglecting the matrix contributions:
, z Vf f (7.3)
Ec z Vf Ef (7.4)
Therefore:2UE L/25 Vf of /Ef (7.5)
248
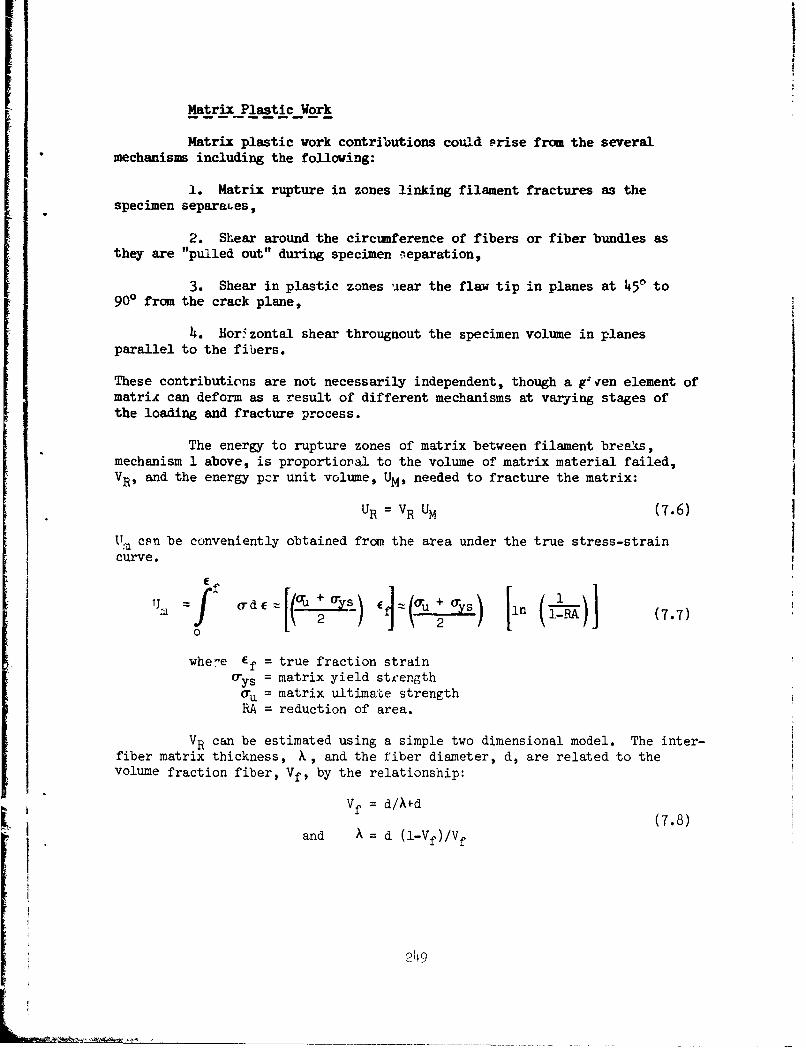
Matrix Plastic Work
Matrix plastic work contributions could Prise from the severalmechanisms including the following:
1. Matrix rupture in zones linking filament fractures as thespecimen separates,
2. Shear around the circumference of fibers or fiber bundles asthey are "pulled out" during specimen •eparation,
3. Shear in plastic zones iear the flaw tip in planes at 450 to900 from the crack plane,
4. Hotr zontal shear throughout the specimen volume in planesparallel to the fibers.
These contributions are not necessarily independent, though a g` 'en element ofmatriA can deform as a result of different mechanisms at varying stages ofthe loading and fracture process.
The energy to rupture zones of matrix between filament breaks,mechanism 1 above, is proportioraJ to the volume of matrix material failed,VR, and the energy pcr unit volume, UM, needed to fracture the matrix:
UR = VR UM (7.6)
I; cpn be conveniently obtained from the area under the true stress-straincurve.
fa (rde ( •s_ •E±'uj + y in (1-A (7.7)0
whe~e Ef = true fraction strain(rys = matrix yield stfengthau = matrix ultimate strengthRA = reduction of area.
VR can be estimated using a simple two dimensional model. The inter-fiber matrix thickness, X, and the fiber diameter, d, are related to thevolume fraction fiber, Vf, by the relationship:
Vf = d/Xfd(7.8)
and A = d (l-Vf)/Vf
249
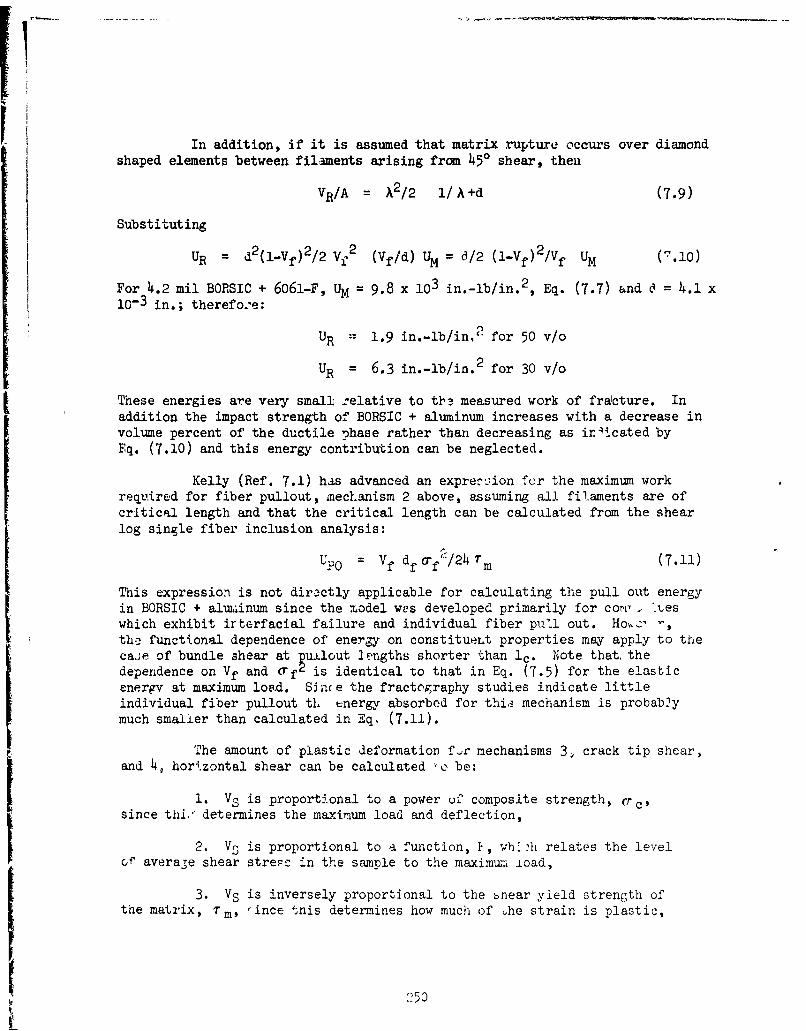
In addition, if it is assumed that matrix rupture occurs over diamond
shaped elements between filaments arising from 450 shear, then
VR/A = L2 /2 l/A+d (7.9)
Substituting
UR = d2 (l-Vf) 2/2 Vg2 (Vf/d) UM = d/2 (1-Vf) 2/Vf UM (7.101
For 4.2 mil BORSIC + 6061-F, UM = 9.8 x 103 in.-lb/in. 2 , Eq. (7.7) and d = 4.1 x10⁻³ in.; therefo.e:
UR 1.9 in.-lb/inO for 50 v/o
UR = 6.3 in.-lb/in. 2 for 30 v/o
These energies are very small relative to th? measured work of fracture. Inaddition the impact strength of BORSIC + aluminum increases with a decrease involume percent of the ductile phase rather than decreasing as ir"!cated byEq. (7.10) and this energy contribution can be neglected.
Kelly (Ref. 7.1) has advanced an exprez-ion fer the maximum workrequired for fiber pullout, mechanism 2 above, assuming all filaments are ofcritical length and that the critical length can be calculated from the shear
log single fiber inclusion analysis:
I = Vf df f"/2 4 Tm (7.11)
This expression is not directly applicable for calculating the pull out energyin BORSIC + aluLiinum since the model wes developed primarily for cori *xeswhich exhibit irterfacial failure and individual fiber pull out. Hoýý' -,th.2 functional dependence of energy on constituent properties may apply to theca,;e of bundle shear at pullout lengths shorter than 1 c. Note that. thedependence on Vf and rf2 is identical to that in Eq. (7.5) for the elasticenergy at maximum load. Sjn(e the fractography studies indicate littleindividual fiber pullout ti unergy absorbed for thi.• mechanism is probabJymuch smaller than calculated in Eq. (7.11).
The amount of plastic deformation f.r mechanisms 3, crack tip shear,and 4, hori.zontal shear can be calculated "c be:
1. VS is proportional to a power of composite strength, Crc,since thi' determines the maximum load and deflection,
2. VS is proportional to a function, i, which relates the levelof' average shear stresc in the sample to the maximum ±oad,
3. VS is inversely proportional to the bnear yield strength ofthe matrix, 'Tm, •ince this determines how much of ýhe strain is plastic,
250
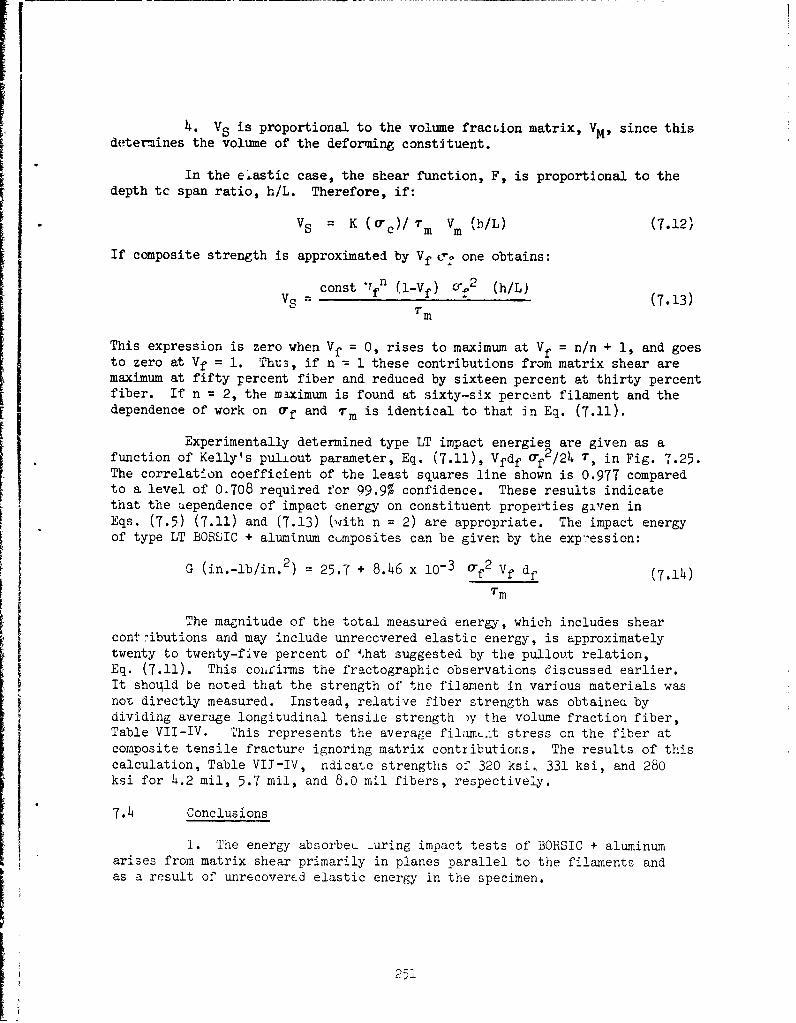
4. VS is proportional to the volume fraction matrix, VM, since this
determines the volume of the deforming constituent.
In the elastic case, the shear function, F, is proportional to thedepth tc span ratio, h/L. Therefore, if:
VS = K (a-c)/ Tm Vm (b/L) (7.12)
If composite strength is approximated by Vf •o one obtains:
const 'Tfn (l-Vf) 0-2 (h/L)Vs f (7.13)TM
This expression is zero when Vf = 0, rises to maximum at Vf = n/n + 1, and goesto zero at Vf = 1. ThU3, if n = 1 these contributions from matrix shear aremaximum at fifty Fercent fiber and reduced by sixteen percent at thirty percentfiber. If n = 2, the m3ximum is found at sixty-six percent filament and thedependence of work on O'f and Tm is identical to that in Eq. (7.11).
Experimentally determined type LT impact energies are given as afunction of Kelly's puliout parameter, Eq. (7.11), Vfdf G*f2/24 T', in Fig. 7.25.The correlation coefficient of the least squares line shown is 0.977 comparedto a level of 0.708 required for 99.9% confidence. These results indicatethat the uependence of impact energy on constituent properties given inEqs. (7.5) (7.11) and (7.13) (with n = 2) are appropriate. The impact energyof type LT BORSIC + aluminum cumposites can be given by the expression:
G (in.-lb/in. 2 ) = 25.7 + 8.46 x 10⁻³ o-f2 Vf df (7.14)
ITmThe magnitude of the total measured energy, which includes shear
cont-ibutions and may include unreccvered elastic energy, is approximatelytwenty to twenty-five percent of that suggested by the pullout relation,Eq. (7.11). This coifirms the fractographic observations discussed earlier.It should be noted that the strength of the filament in various materials wasnot directly measured. Instead, relative fiber strength was obtainea bydividing average longitudinal tensile strength )y the volume fraction fiber,Table VII-IV. This represents the average filamn.:t stress on the fiber atcomposite tensile fracture ignoring matrix contributions. The results of thiscalculation, Table VII-IV, ndicate strengths of 320 ksi., 331 ksi, and 280ksi for 4.2 mil, 5.7 mil, and 8.0 mil fibers, respectively.
7.L Conclusions
1. The energy absorbeu _uring impact tests of BORSIC + aluminumarises from matrix shear primarily in planes parallel to the filaments andas a result of unrecovercd elastic energy in the specimen.
V 251

2. Impact energy per unit area, G (in.-lb/in. 2 ) of longitudinallyreinforced material can be expressed in terms of the fiber diameter, df, fiberstrength, of, volume fraction fiber, Vf, and mati.x shear yield strength bythe empirical relationship:
G = 26 + 8.5 x 10- 3 crf 2 df Vf/Tm
3. Reducing the thickness of the &ype LT Charpy specimen at con-stant notch dimensions results in a nearly linerr decrease in measured energyper unit area due to the decrease in horizontgsL shear stress with depth tospan ratios.
4. Reducing the width of the type LT Charpv specimen at constantnotch dimensions and height has no significant effect on fracture eL.ergyper unit area.
5. Slow bend load-deflection curves of longitudinally reinforcedBORSIC + aluminum display considerable plastic deformation prior to unstablecrack growth; transversely reinforced material also deforms plastically.
6. Longitudinally reinforced materials exhibit fracture surfacescharacterized by three regions of differing degreez of filament bundleprotrusion. The fracture surfaces of transversely reinforced materials con-taining 4.2 mil BORSIC exhibit extensive fiber splitting largely aloncdiametral planes whereas those containing 5.7 mil BORSIC do not exhibitsignificant splitting.
252
SECTION VII - REFERENCES
1. A. Kelly, Strong Solids, Clarendon Press, 1966.
2. J. Cook and J. E. Gordon, Proc. Royal Soc. A., Vol. 282, p. 508-520, 1964.
3. M. J. Salkind a.d F. D. George, Trans. AIME, Vol. 242, p. 1237-1247, 1968.
4. J. F. I.ynch, C. G. Ruderer, and W. H. Duckworth, ed., Engineering Propertiesof Sel'icted Ceramic Materials, American Ceramic Society, Columbus, Ohio, 1966.
5. D. L. Ruckle, Pratt & Whitney Aircraft, unpublished work.
6. W. Spath and M. E. Rosner, Impact Testing of Materials, Gordon and Breach,New York, 1961.
7. K. G. Kreider, R. D. Schile, E. M. Breinan, M. A. Marciano, "Plasma SprayedMetal Matrix Fiber Reinforced Composites", AFML-TR-68-119, July, 1966.
8. S. R. Bodner, "Strain Rate Effects in Dynamic Loading of Structures", in
Behavior of Materials under Dynamic Loading Rates, p. 93, ASME, 1965.
9. E. A. Ripperger, "Dynamic Plastic Behavior of Aluminum, Copper and Iron", in
Behavior of Materials under Dynamic Loading, N. J. Huffington, Jr. Ed.,p. 62, ASME, 1965.
10. J. G. Kaufman and M. Holt, "Fracture Characteristics of Aluminum Alloys",Alcoa Research Laboratories.
11. B. L. Averbach, "Some Physical Aspects of Fracture" in Fracture, Vol. 1,H. Liebowitz, ed., Academic Press, 1968.
253
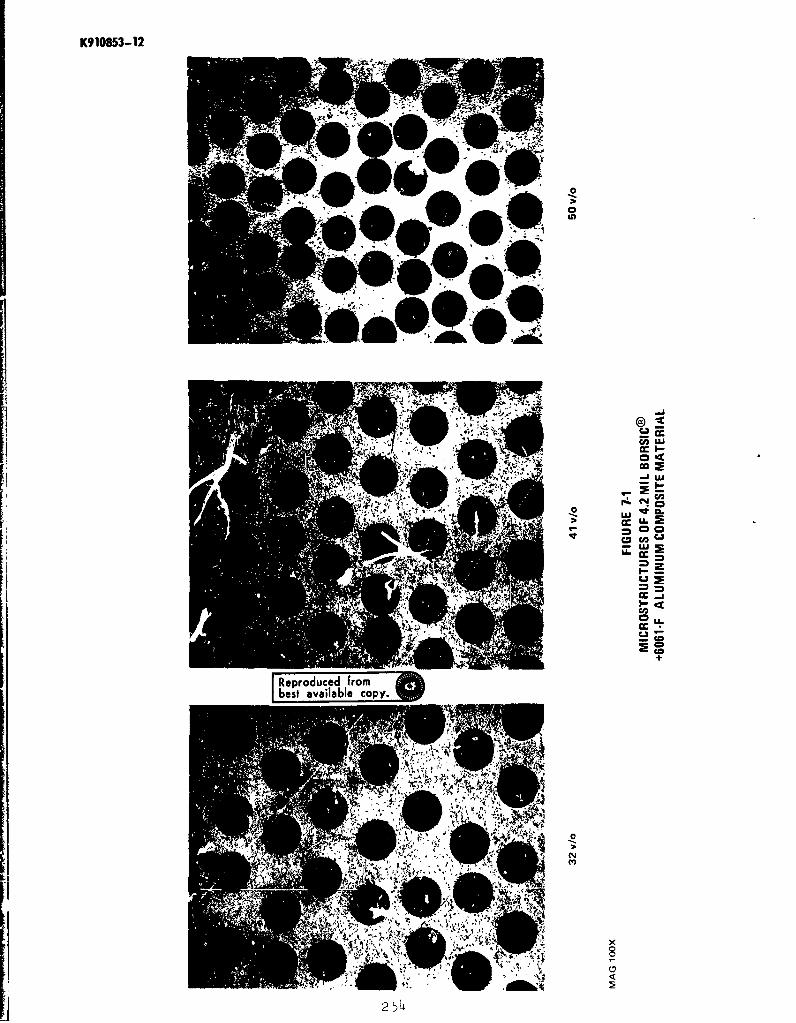
K(910853-12
30cc~u
U.w
Ca-
Reproduced frombest available copy.
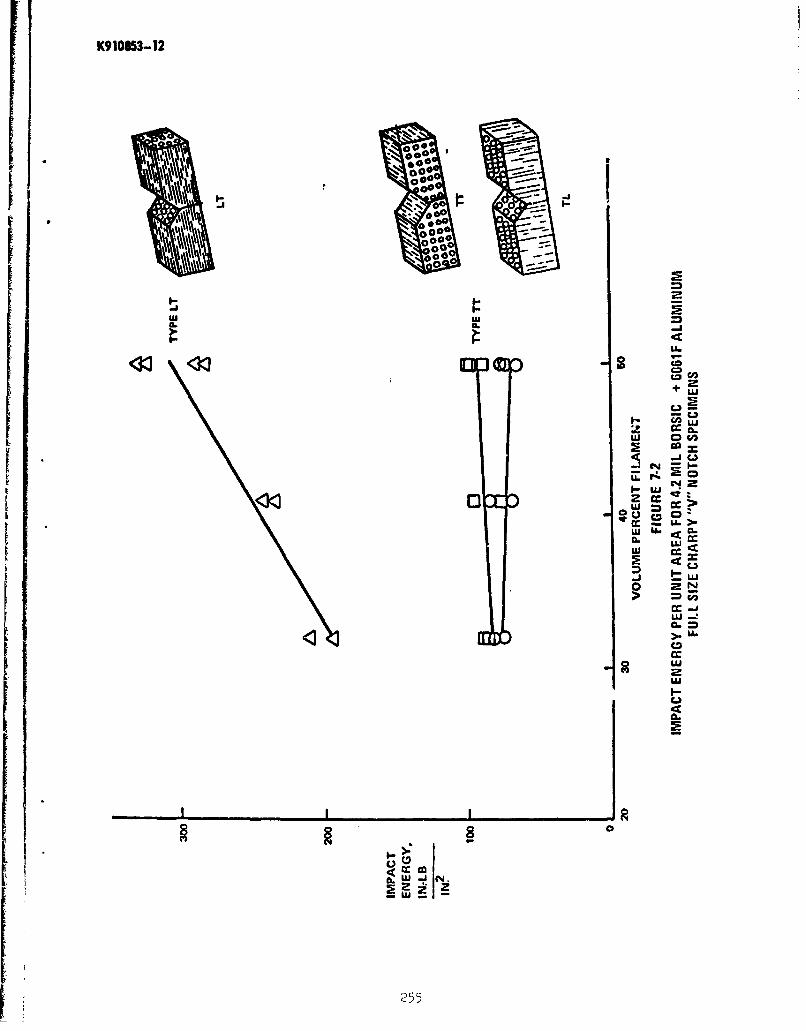
K(910853-12
0 '.
000o00
000-
"0000--0000000-
,00
U'U6
ana
LL
-Co
cmawL AY
I-Lu rJ
CC - L.>
W .CLa
-J
K LuJI-
w --
255
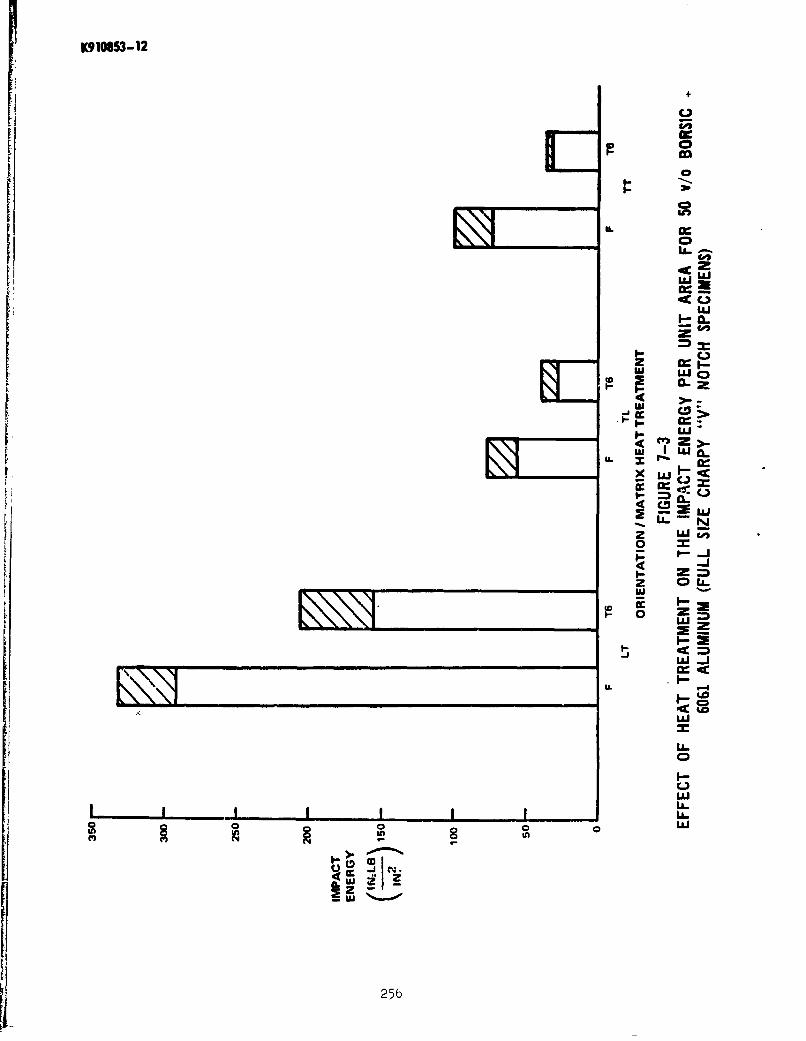
K910853-12
W
C-,
0
au a
to~'
ui
w -JC
LL.
z '
L N
4I- ZE0 OIL
LL~
ILL
0
La..
_ _ _ _ _ _ _ _ _ _ _ _ _ _ _ _ _ _ _ _ _ _ _ _ _ _ _ _ _ _ __t o
-~ e ~ 0
In ID256
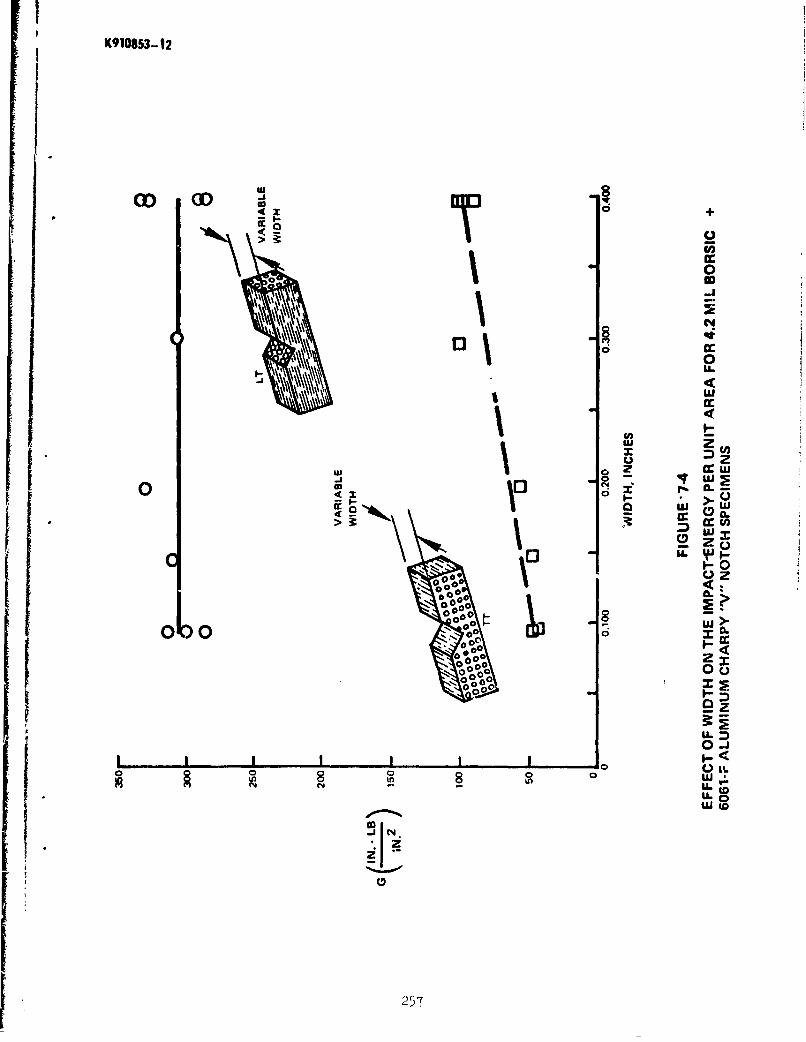
K9108S3-12
w 8
T 0
cm
0l 0
£ wUz
w 2i(3j
CD CL
0 1 u
U z000
.000000 a1I
0 0 LIJ0
0 U- 0>V0 0005T
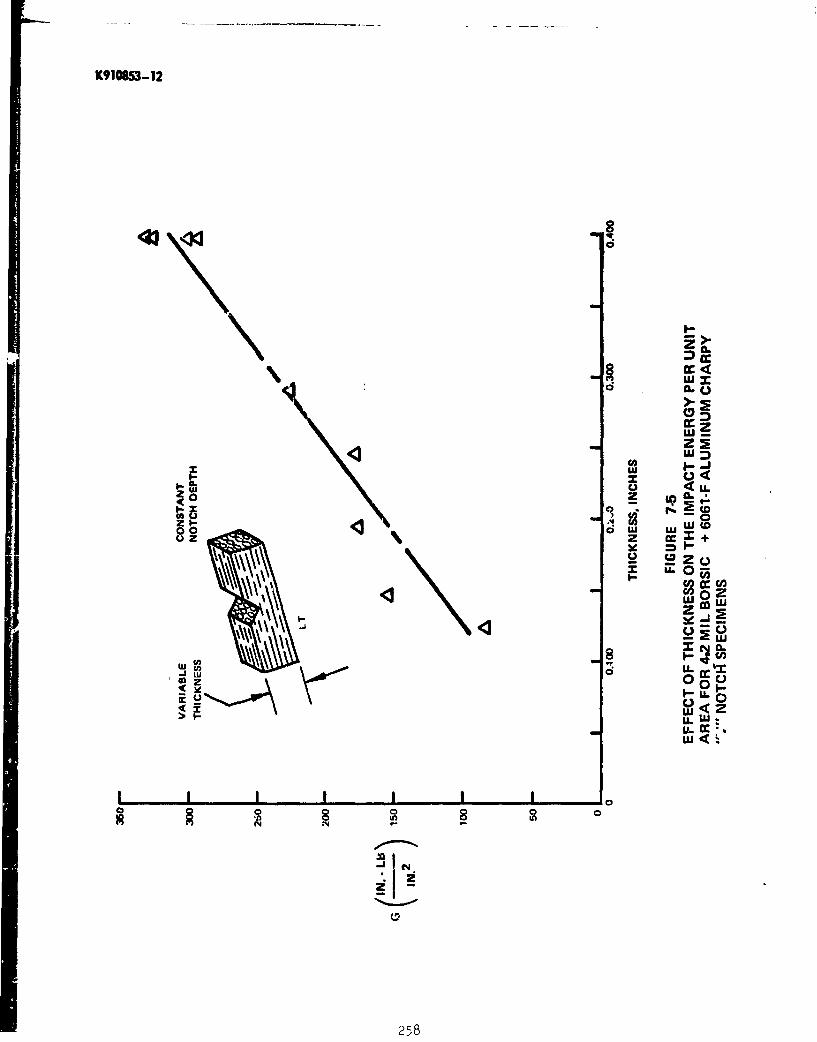
K910853-12
0
z-
U U Xu((
z
z U,)OC
0V '- W U .
0.c 0 (
U)IN
258I
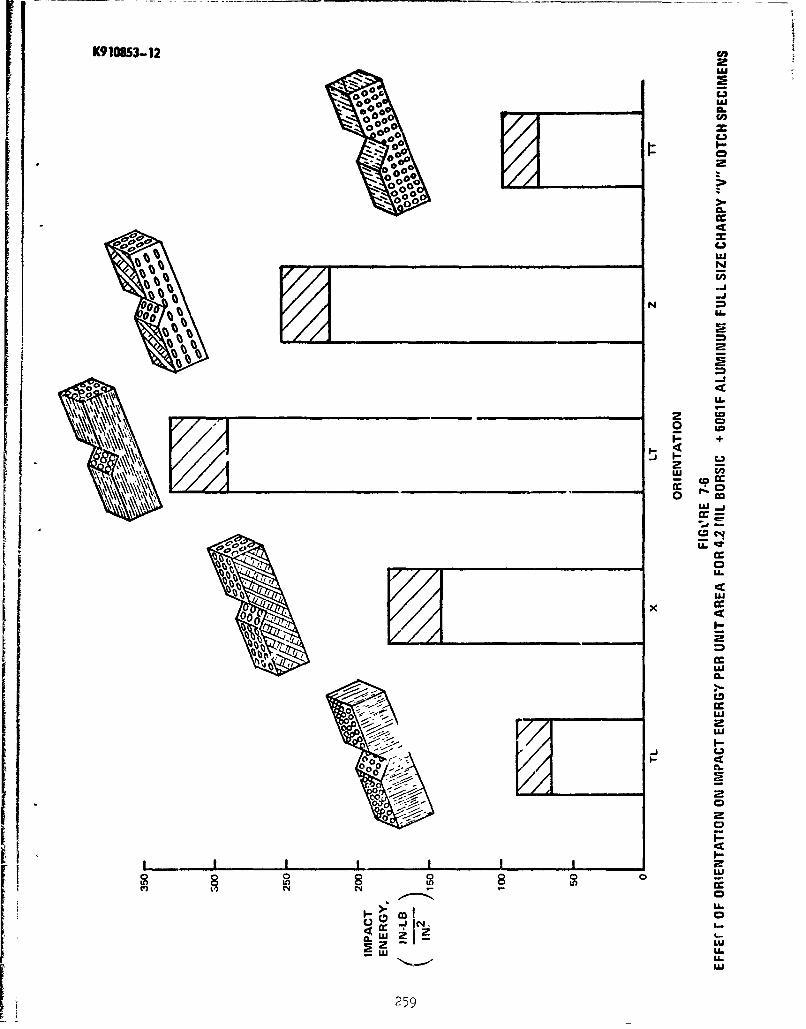
K910853-12 CA,0'U
~000 ci
00a~ 00
0000
C.
w
'U
N 0 *
co
0 c
U ._
,I-_ _ _ _ _ _ _ _ _ _ _ _ _ _ _ _ _ _ _ _ _ _ _ _ _ _ _ _ _ _ _ _ _ _ _ _ _ _ _ _ _ _ _ _ _C6
I,,JI 0
LU
r//J.
-)-- aU
LULU.ocP~2 2
259S

iC(10853-12
8 qU.
co
0La
N
Rr.
IL
cm
F 2U
ui -c I-I
ftcprodu 'Irofl'U.C
C2
InI--
4L
260

M085S3-12
I-6
ww
+ I.-
Zixax~ I I-
rL. L
~U. C.
Reprodu-ced from c
LULC
U -
cc w
I---'p.0. i
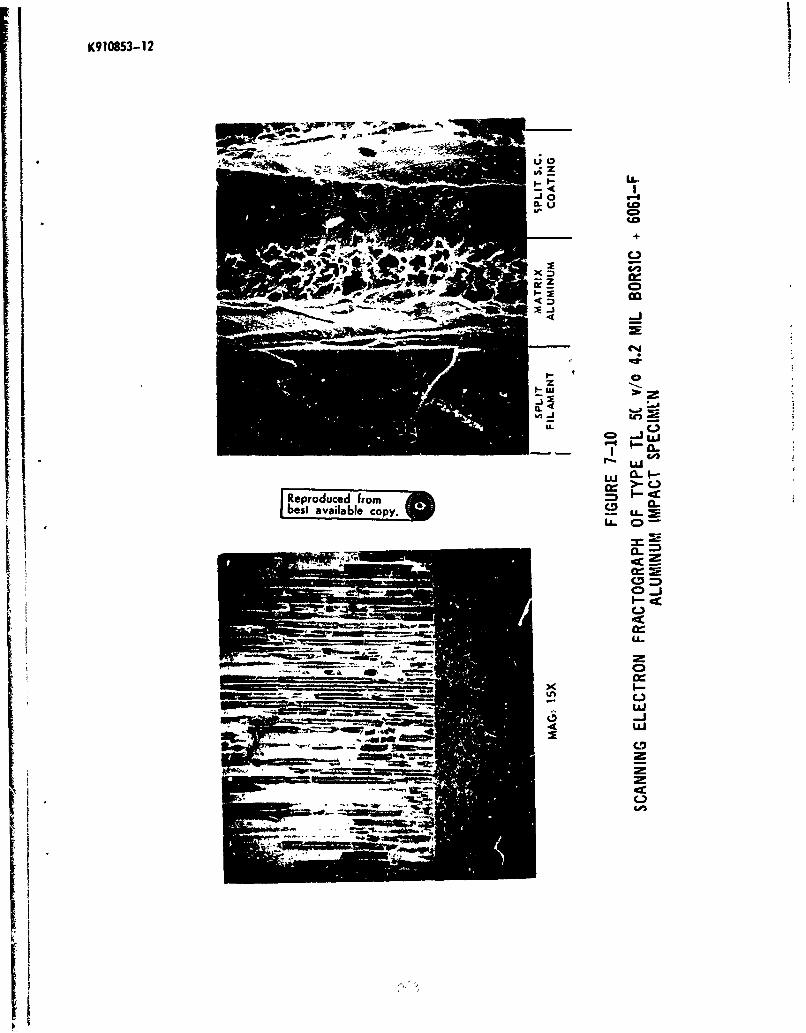
K910853-12
-1-0
IL U ~CD-I
L L 0
0-i
C,
U-
CDX0
_ I-Iti
_ _ _ _ _ _ _ __ _ _ _ _ _ _ _ -
4 U)
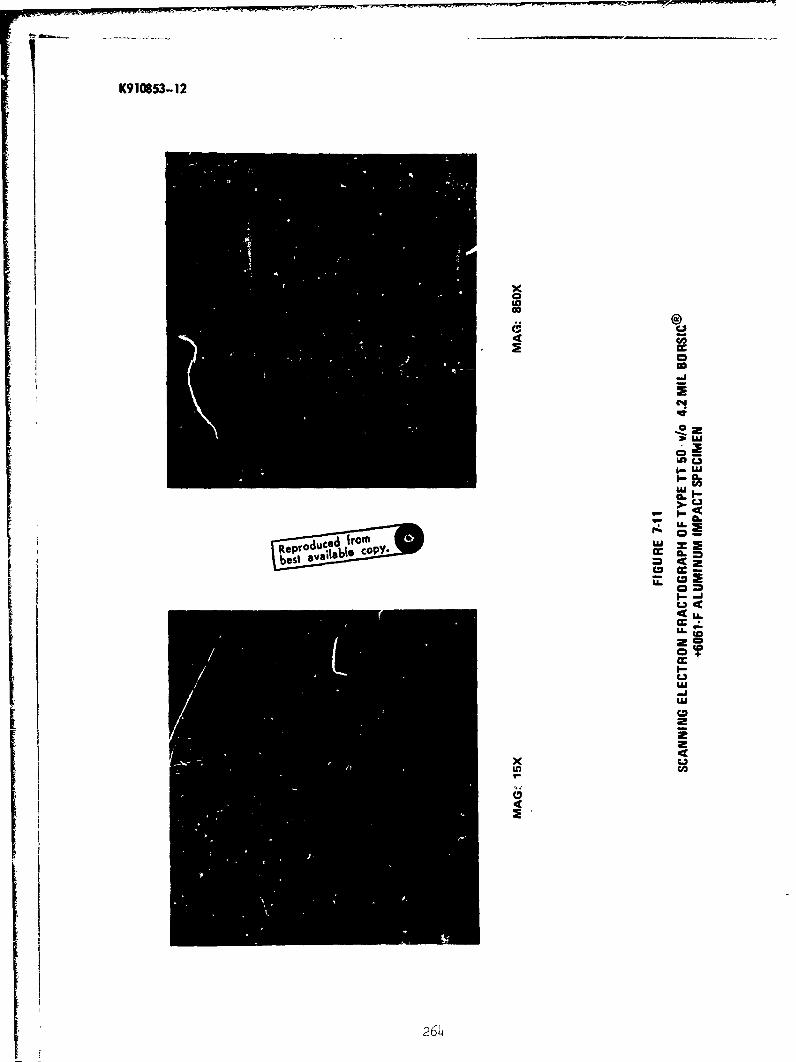
K910653-12
xE
CJ
00 0
LU
4 ~CL0L
eprodced rom U x
ci
U.-
20
I--LU-J
x .I-o
264
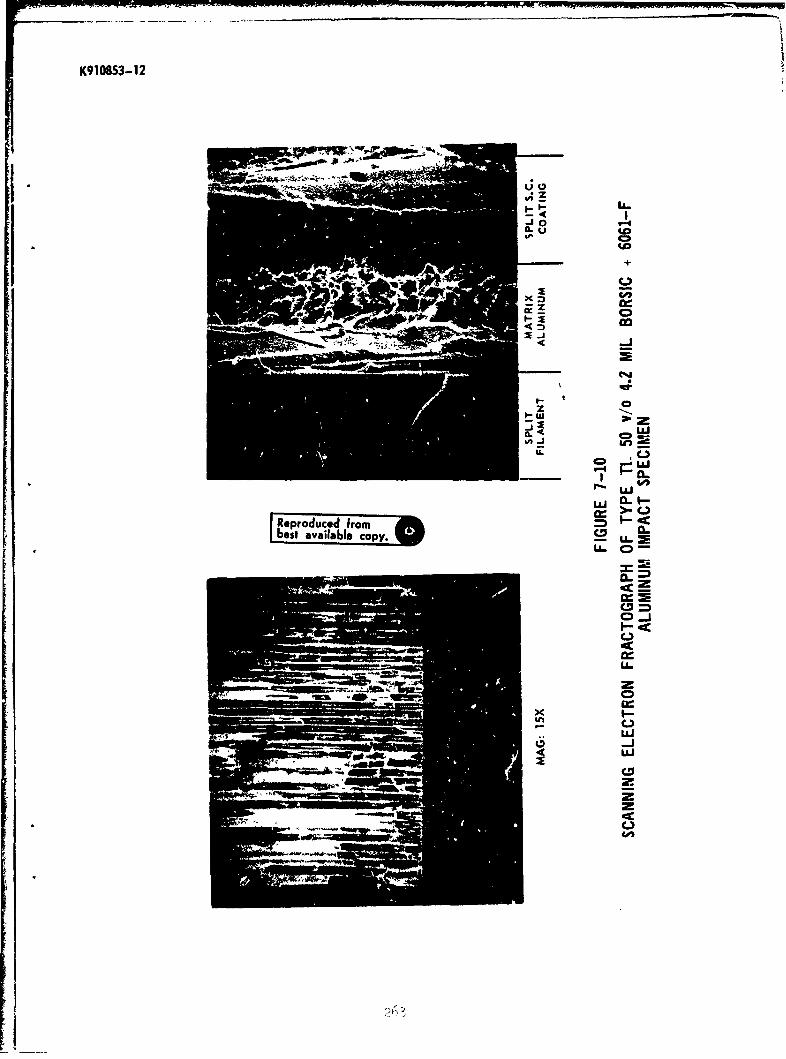
K910853-12
I.U
CD
X -iw
r-.
Reproduced M.mC,~
C-,IJCL
LA-
I..-
C-,
MINNO= LA
LnD
z

FK9 10853-12
MAG: 4.5X
FIGURE 1-12
FRACTOGRAPH OF TYPE IT 63 V/O 8.0 MIL BORON +6061-F AL.UMINUMIMPACT SPECIMEN
265
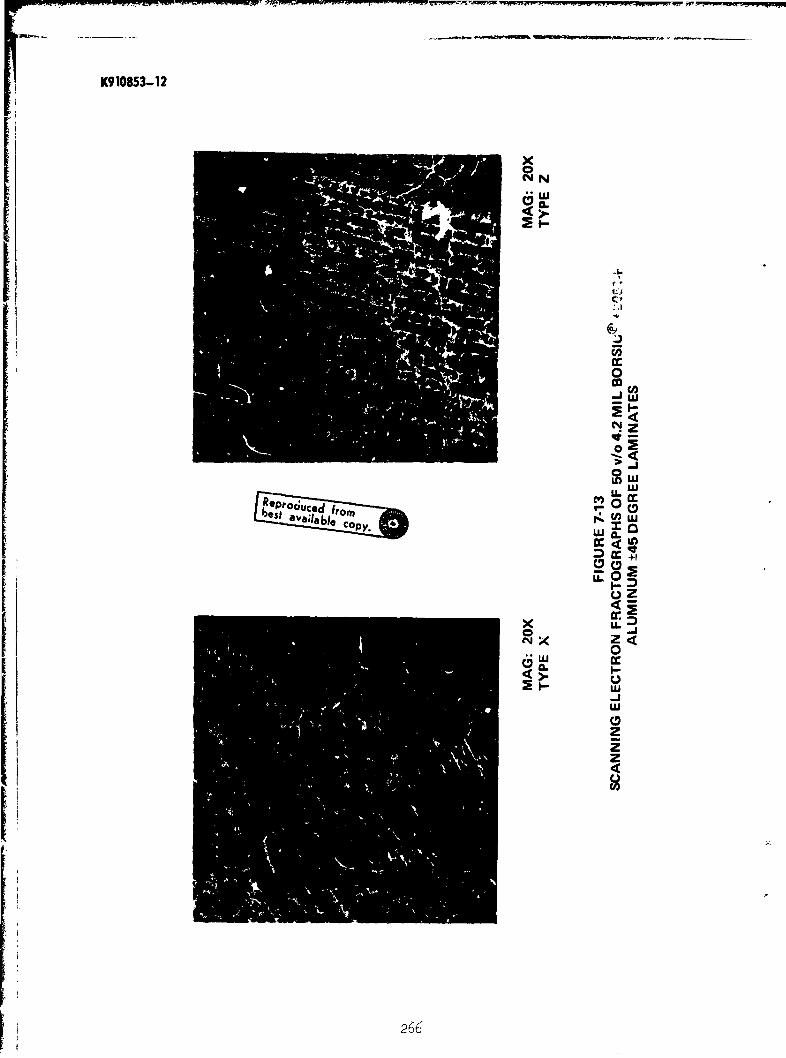
K910853-12
x0N N
'0
r-LI~epoLuc Croa
0 0
x ~ U.xw
0J
zz
266-
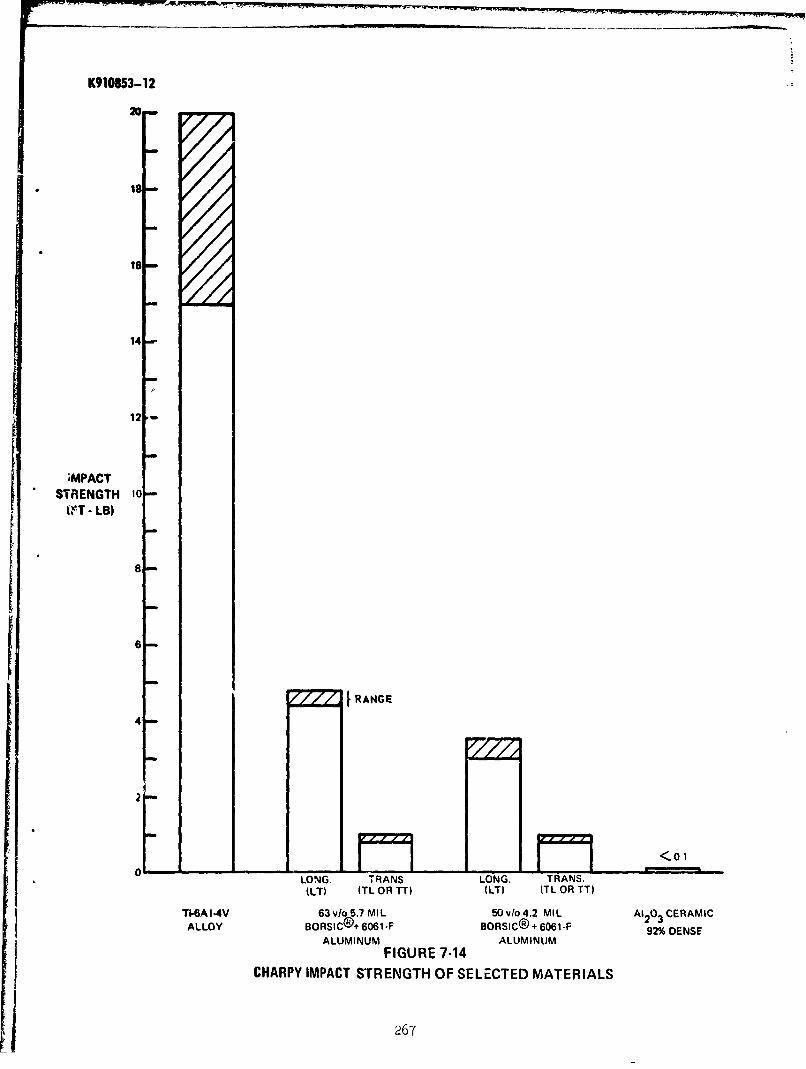
K910853-12
20 ý///
* 18,- r
o ll
14-
12-
I /
IMPACTSTRENGTH 10-
-- -LB)
8-
SRANGIE
4-
0 £LONG.;TRANS LONG. TRANS,iLT) TL O TT)(LT) (TL OR TT)
TýI!6A1.4V 63 v/o 5.7 MI L 5Oy/a 4.2 MIL A120 3 CERAMICALLOY BORSICO+6061.F BORSIC@+ 60651-F 92% DENSE
FIGURE 7-14CHARPY IMPACT STRENGTH OF SELECTED MATERIALS
267
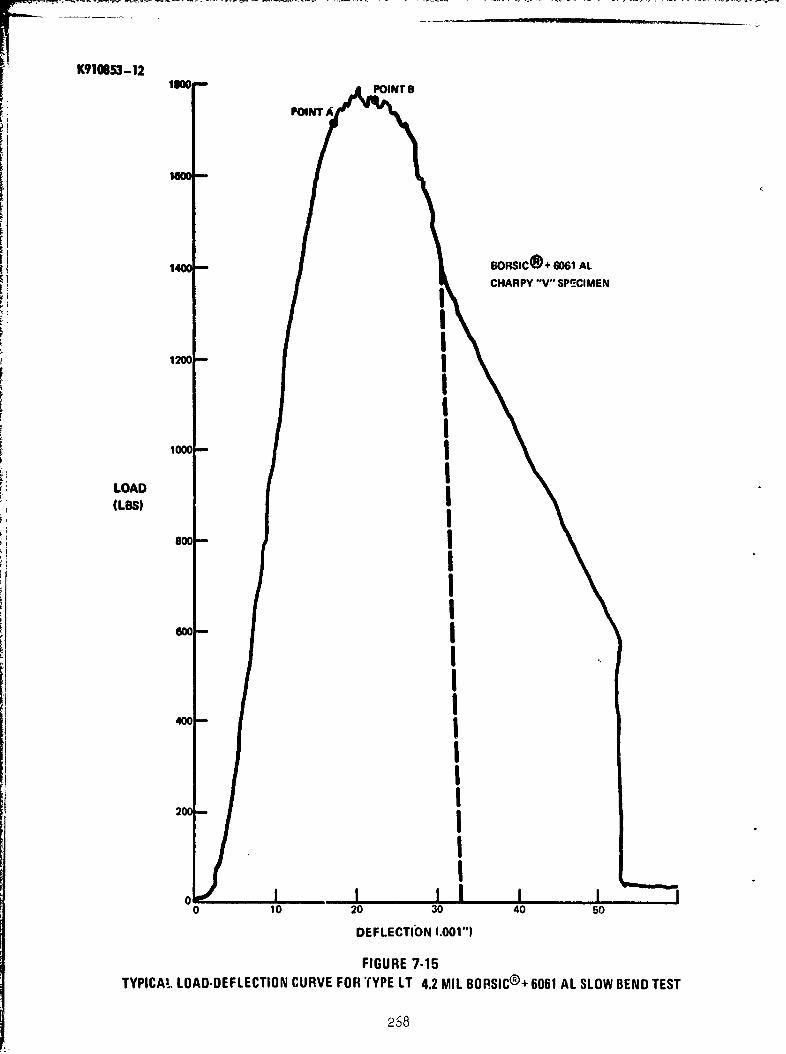
F~- .... .-,
K910653-12111o -- PoIrir 8
POINT A
1
1400- BORSIC@+ 6061 AL
CHARPY "V" SPECIMEN
1200--
1000 i
LOAD(LBS)
800 -
600-
200
IIII
400
0 10 20 30 40 so
DEFLECTIbN (.001")
FIGURE 7-15TYPICAL, LOAD.DEFLECTION CURVE FOR TYPE LT 4.2 PAIL BORSIC®+ 6061 AL SLOW BEND TEST
2268

. .........
K910853-12
POINT A
300-
BORSIC@ + 6061 ALCHARPY "V" SPECIMEN
250
LOADILBS)
200-
150-
100
50 CONTINUESTO 60.5
I I IIIII0 5 10 15 20 25 30 3!
DEFLECTION (.001")
FIGURE 7-16TYPICAL LOAD-DEFLECTION CURVE FOR TYPE TL AND TYPE TT
4.2 MIL BORSIC®+ 6061 AL SLOW BEND TEST
269
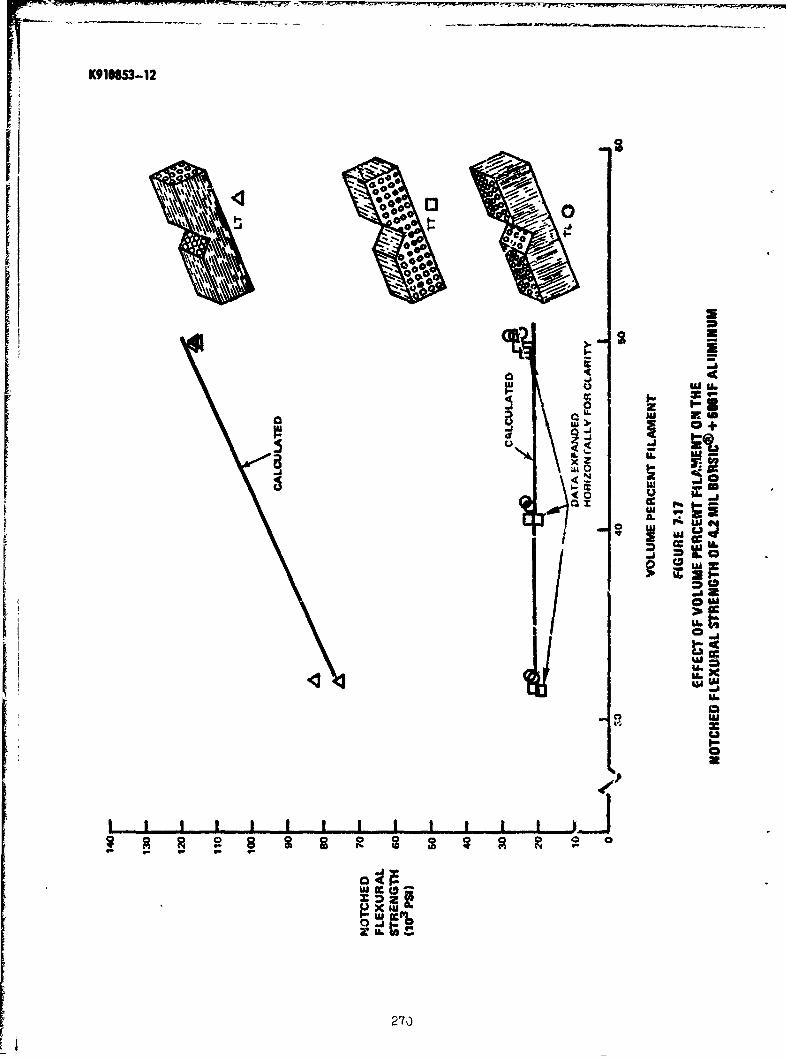
K910853-12
j~ J
Co o
Wi.
w 0+1IL
dX
IuCc, j m
ccCCU
IOW6
0-
LU CC
270-
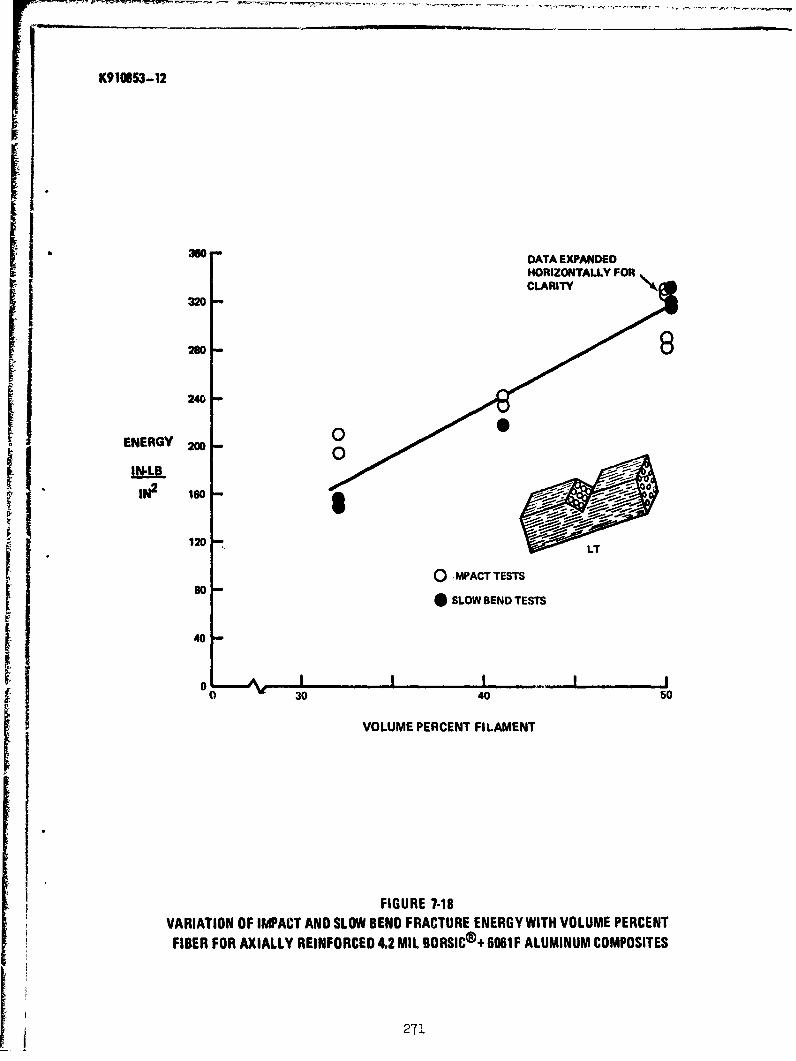
K910853-12
360 DATA EXPANDED
HORIZONTALLY FOR
320
240
ENERGY 200 0
IN2 160
120 LT
0 -MPACT TESTS80
* SLOW BEND TESTS
40
,-_o I II 1 II0 30 40 50
VOLUME PERCENT FILAMENT
FIGURE 7.18
VARIATION OF IMPACT AND SLOW BEND FRACTURE ENERGY WITH VOLUME PERCENTFIBER FOR AXIALLY REINFORCED 4.2 MIL BORSIC®+ 6061F ALUMINUM COMPOSITES
271

K9 10853-12
00'..000
- 006
0-
0 2 000I0003
00
=0
ui +
E 0W Uw --
0 0 00 c jw r
wI LA. U.W~.U . o l
g). w
(0
LU~
cc
00c 0
~ 4-6
CC cD
272
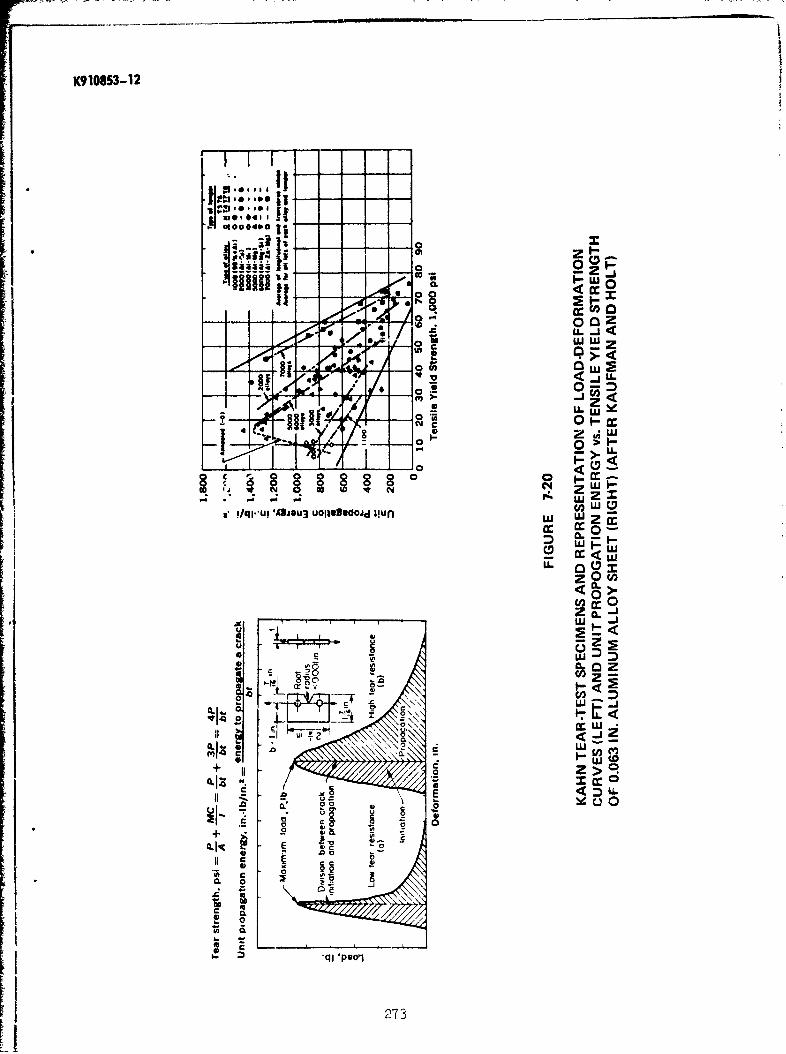
K910853-12
010004- - 10
- z
* _ _ ~ II04 L
-4--Io
ae 0 -
AI a
> U
o (
CoL
cc 0~mw w
a C
~C 0
z Cw 0j
t 243iiLL
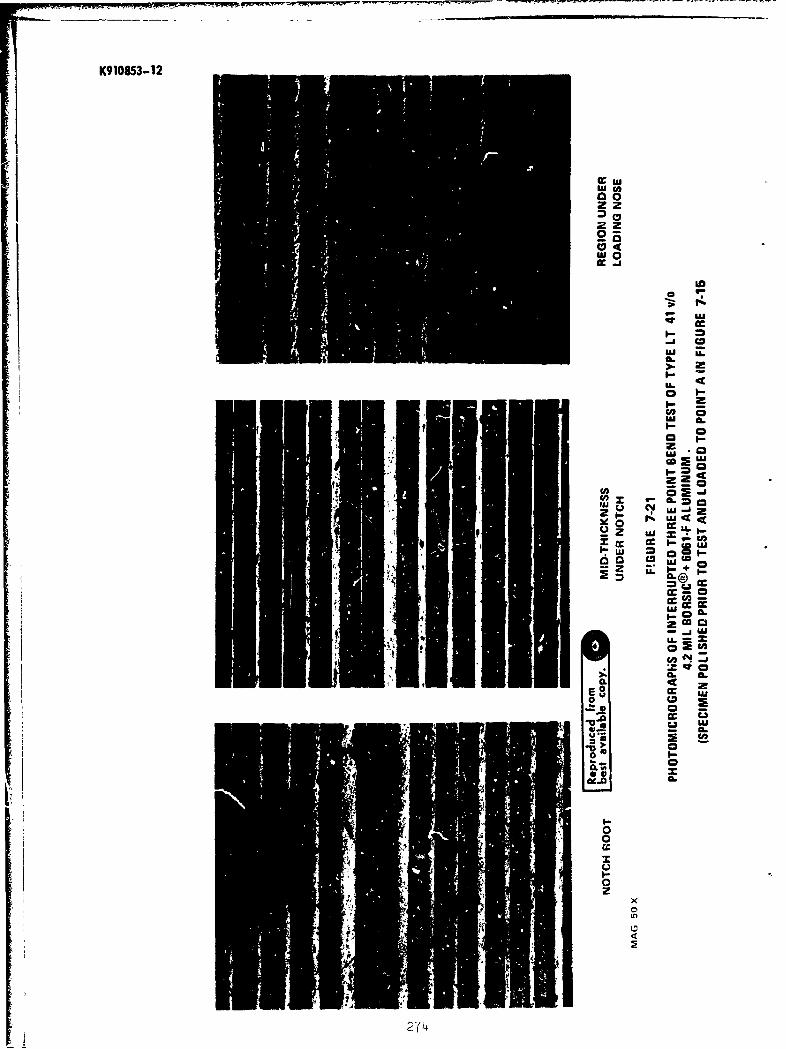
K910853-12
wc02z
22
o_
ui
o
-J cz
IL
U-
I,--
W Cm LU _j .
ot60 o
I,-
+
c0
z~
00 ca jw
&X
w
= 00
274
C-
06
2'( 4r
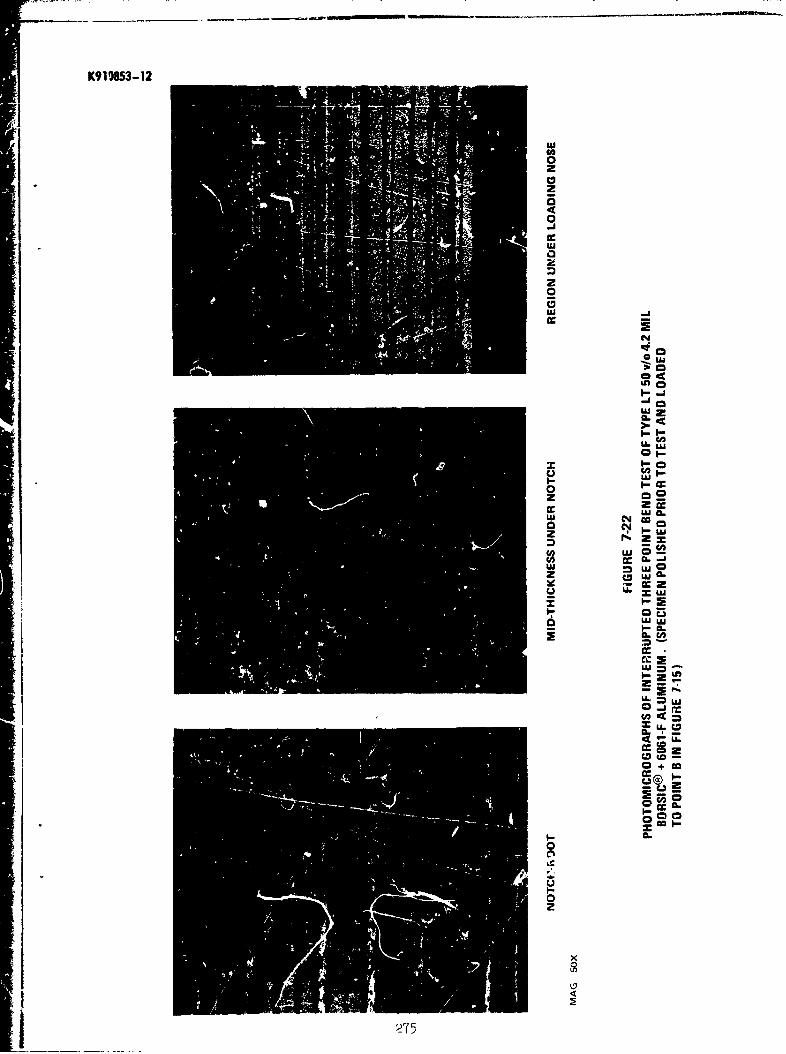
K91 2853-12
0z0
0j
cc uii
N
UL
02z
w N
B. C6,
= U -2
U00
0 L2-C
x.c
275c
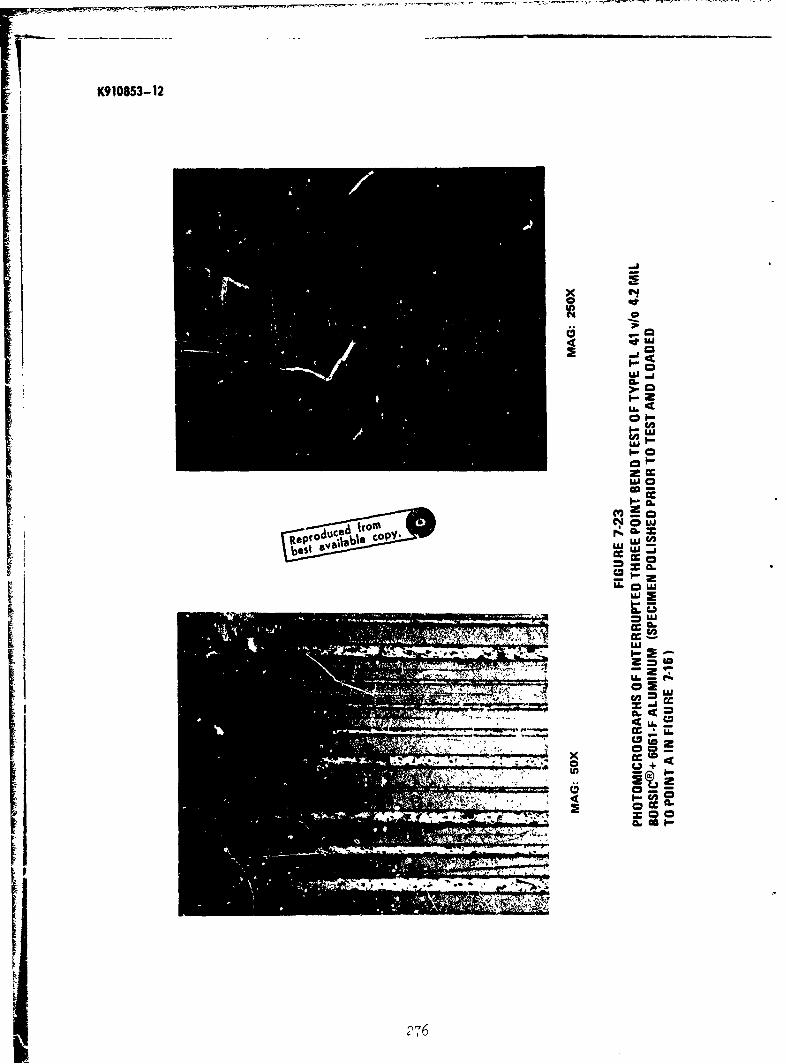
K910853.-12
x
acanU
4 4
caI-0
LUJ
cvr_____________ C'1 ~LU
Ca L
Ca-
0 +
2it6
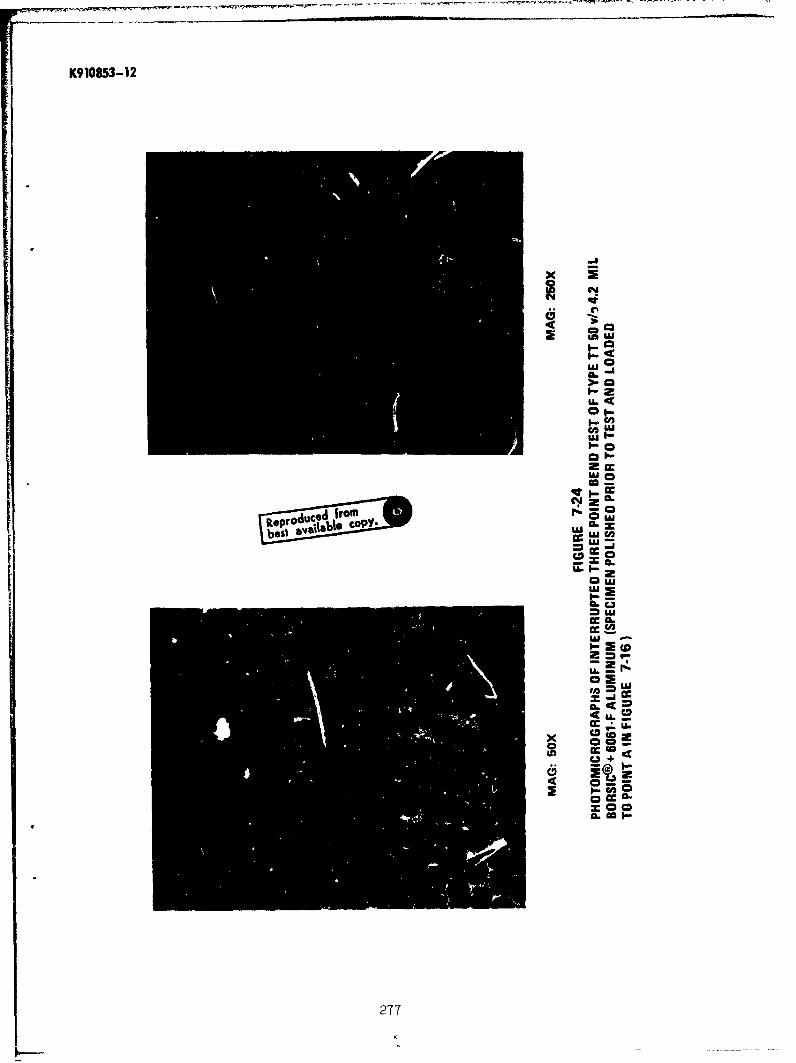
K910953-12
-a
I.-C
FI-LU0
U0.
CA
U.
CO.
L3+
cy zp.a
rodued f 277L
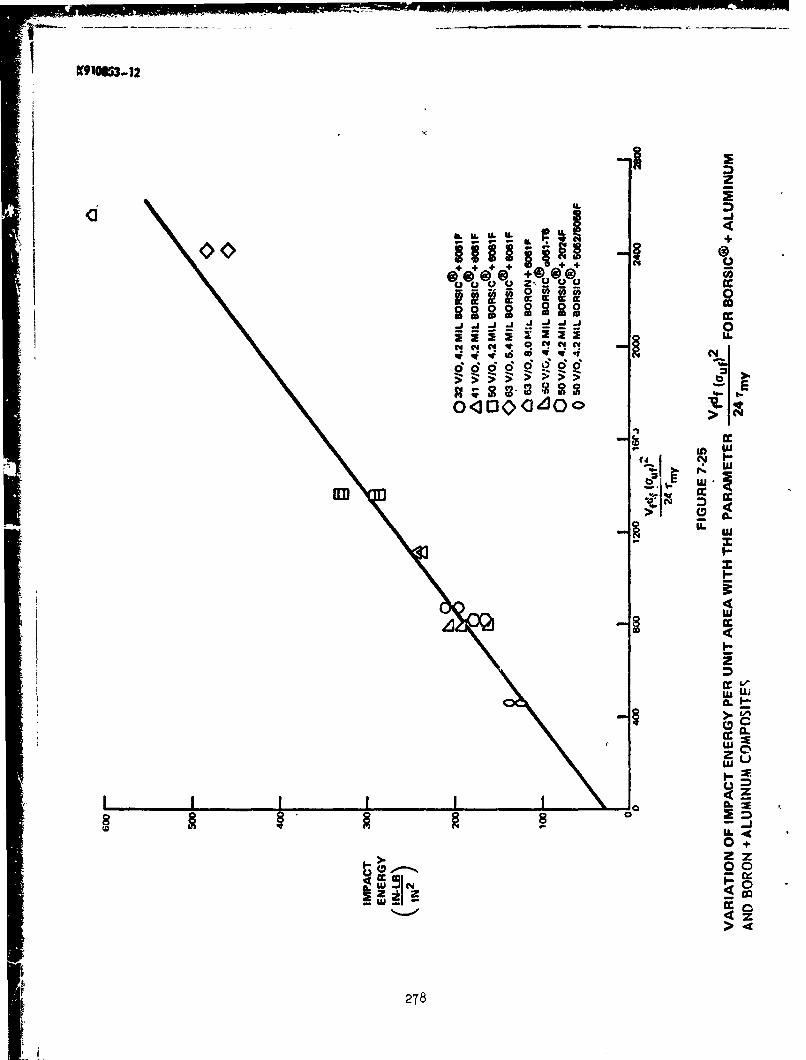
<3II
2 04ILM> >S IL>4- -r -ILR
040000
C4@ t@@@2~~r 2 2Z2 W,2222222*,j~~I~5 j~I~~jD
LAW
tdx
In, t?~E
CL~
zL-
8i
wLL~
Z z
LU I4
ziZz
IA 278

Table VII-I
Impact Energy Per Unit Area for Plasma SprayedBORSIC + Aluminum Composites
(Full size Charpy "V" notch specimens)*
NominalFiber Orientation/Energy (in.-lb/in. 2)Matrix Alloy Fiber v/o TL X LT Z TT
6061-F 4.2 mal. BORSIC 32 81.9 195 88.374.8 211 84.3
4.2 mil BORSIC 41 68.8 236 94.983.3 21,3 752710 85.1
4.2 mil BORSIC 50 284 T3.O73.2 141 292 219 99.365.1 143 327 219 97.9
6. 179 332 253 89.17 154 309 230 89.8
5.7 mil BORSIC 63 46073.6 483 86.9
471
8.0 mil Boron 63 615
6061-T6 4.2 mil BORSIC 50 39.7 160 36.728.1 192 32.438.6 206 32.635.5 33.9
2024-F 4.2 mil BORSIC 50 28.5 180 40.635.5 166 28.832.0 173
5052 foil/ 4.2 mil BORSIC 50 1245056 138
131
*Specimen width is .395 + .003 in.; specimen thickness is .395 + .003 in.
I C

Table 711-II
impact Energy per Unit Area for Nominal 50 v/o 4.2 MilBORSIC Fiber + Aluminum
(Sub-size Charpy "V" notch specimens, constant notch depth)
Width Thickness Energy 2Matrix AlloZ Orientation Ji. (in.) (in.-ib/in.
6061-F (plasma sprayed) LT .275 .y16 307
.194 .375• 330
.144 .377 310
o094 .370 315o094 .370 300
.094 .369 287301
.375 .289 226
.37)' .245 178
.377 .195 176
.375 .146 154
.370 .124 83.1
TT .295 .374 99.8
.196 .374 55.2
.147 .375 46.0
.096 .371 42.7
.095 .372 46.o
6061-F (foil) TL ,316 .395 79.6.321 .394 62.5.318 .395 71.3
71.1
LT .317 .392 215.317 .395 181.317 .393 1i8
280
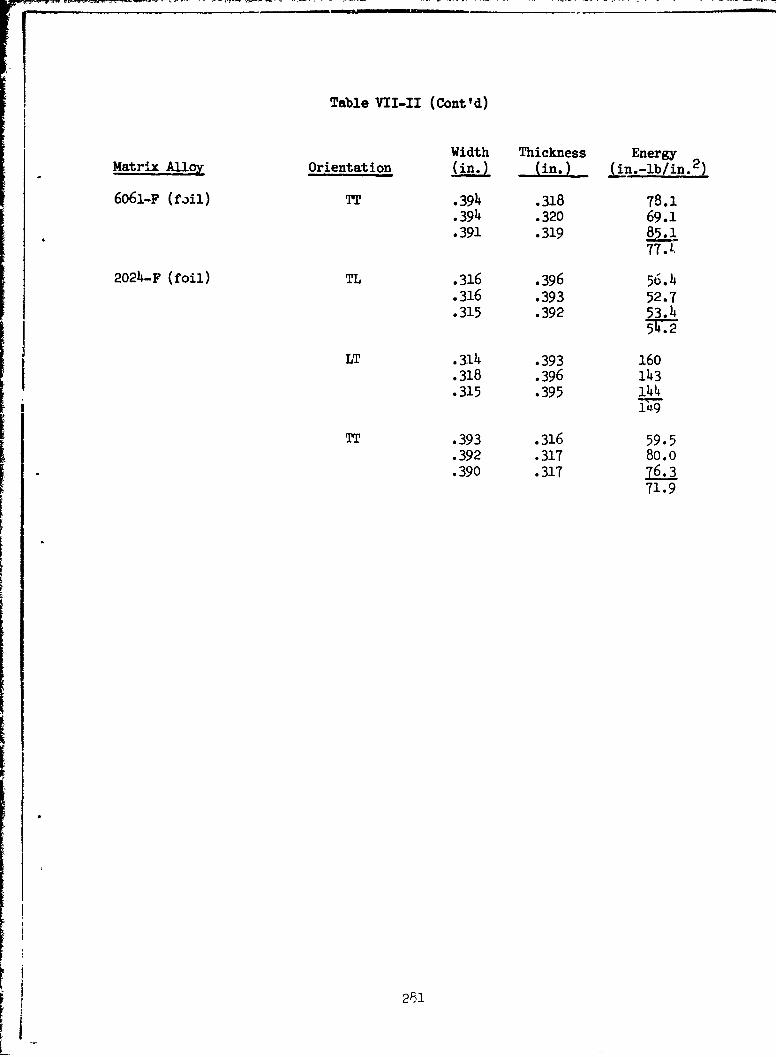
Table VII-II (Cont'd)
Width Thickness EnergyMatrix Alloy Orientation (i(in.) (in W-b/in. 2 )
6061-F (foil) TT .394 .318 78.1.394 .320 69.1.391 .319 85.1
77J.
2024-F (foil) TL .316 .396 56.4.316 .393 52.7.315 .392 53.4
LT .3314 .393 160J.318 .396 143
.315 .395 14414~9
TT .393 .316 59.5
.392 .317 80.o•.390 .317 76.3
71.9
251

Table VII-III
Slow Bend Fracture Work for Type LTBORSIC + 6061-F Specimens
Elastic EnergyEstimated
Total Energy a2L/18E Measured a 2 L/ 2 5Evlo Fiber Lin.-lb/in.2) -(in.,lb/i.• (in.-lblin.2) (irj..-lb/in. 2).
50 318 131 92 94322 131 102 94
41 218 101 75 73
32 157 70 52 50149 70 45 50
282

IA
Table VII-IV
Strength of Filaments in Impact Specimens
AverageTensile Fiber
UTS StrMaterial Fiber (103 psi) (i0_ h )
4.2 mil BORSIC + 6061-F(I) 50 160 320(Ref. 41 131 320
32 102 319Ave. 320
5.7 mil BORSIC + 6061-T6(2) 61 206(3) 33863 205(4) 32
Ave. 331
8.0 mil boron + 6061-F 50 14o 280(Ref. Ave. 280
(1)Actual fiber diameter is 4.1 x 10⁻³ in.
(2)Actual fiber diameter is 5.4 x 10⁻³ in.
(3)Results of environmental investigation, Section III
(4)Results of off-axis investigation, Section V
283
NOTCH TENSILE FRACTURE
SUMMARY
`>OIWIC aluminum and BORSIC titanium center notched specimens were eval-iuated in uniaxial tension. The fracture strength of longitudinally reinforced",0 r/o 4.2 mil BORSIC + 6061-F and 50 v/o 4,2 mil, BOQIC t 2024-F was,cmp irically found to be given by the following expressions:
agross = 52 (2c)-Y0 2 T ksi 2c - 0.025
anet = •UTS 2c - 0.025
where 2c = crack length
0 gross = (1-2c/w) anet (w = 2 in.)
Notched BORSIC + aluminum was found to exhibit significant longitudinalmatrix shear prior to fracture which causes notch blunting. These compositeshave a propensity for longitudinal shear fracture which reduces the notchsensitivity.
The behavior of notched longitudinally reinforced 50 v/o h.2 mil, BORSIC +Beta III titanium is similar to ý.hat of 4.2 mul, BORSIC + aluminum. Longitudinalsplits were not observed with this material.
The net fracture strengths of transversely reinforced 50 v/o 4.2 milBORSIC + 6061-F and 63 v/o 5.7 mil BORSIC + 6061-F were found to be equal on anet section area basis to that, of unnotched material. The transverse netstrength of the 4.2 mil BORSIC material is governed by the transverse strengthof the fibers.
284

VIII. NOTCH TENSILE FRACTURE
The overall goals of this investigation are to determine whether thefracture of BORSIC + aluminum can be successfully treated within the frameworkof existing linear elastic fracture mechanics, to assess the significance offracture work, to examine the mechanisms of fracture, and to study the effectof constituent properties and composite geometry on material behavior. Anunderstanding of these factors is needed to facilitate future material prop-erty improvements as well as to provide confidence in material applications.
The method of approach used was to determine the response of flawed
unidirectional composite material to symmetric uniaxial loading in a directionnormal to the flaw orientation. Center-notched specimens, measuring 6 in. over-all amd 2 in. wide, containing initial flaw sizes ranging from 0.02 in. to 0.80in. were used. This particular specimen was initially chosen in order t.obtain the analytical simplicity of the center notch geometry at a sufficientwidth so that finite width corrections might be ignored in a firs. orderanalysis. Loading was accomplished thruugh 1 in. compliant doublers (rather
than pinholes) in a manner similar to current composite material tensiletesting practice, Fig. 8.1. An alignment fixture was employed to ensure properpositioning of the specimens. Straia gage measurements on smooth specimensindicated that The maximum strain dc!sparity across the specimen and between
opposite faces -as less than one percent.
The butlk of this work was performed using 50 v/o 4.2 mil BORSIC +6061-F material. Three specimen thicknesses (nominal 0.050 in., 0.100 in.,and 0.150 in.) and two types of notch geometry (center notch and center circularhole) were examined. In addition, a limited number of tests were performedwith center-notched 4.2 mil BORSIC + 2024-F, 4.2 mil BORSIC + 6061-T6, 4.2 milBORSIC + 2024-T6, 5.7 mil BORSIC + 6061-F, 4.2 mil lORSIC + Beta III titanium,and HMG-50 graphite + BP-907 epoxy.
Notches were usually introduced into the BORSIC + aluminum andBORSIC + titanium samples by first electrodischarge machining (EDM) slotsperpendicular to the specimen edge and then extending them using 0.005 in.diameter diamond coated rocket wire. However, the flaws in a number of speci-mens were prepared with tip radii of 0.004 in. entirely by EDM techniques. Nodifferences in response were observed between the two populations. The notchesin the graphite + epoxy material were introduced by drilling 0.010 in. diameterholes in the center of Lhe specimens and extending them with the 0.005 in.diameter abrasive wire.
8.1 Longitudinal Reinforcement
in these series of experiments, the filaments were parallel to theload axis and normal to the flaw. Fiber alignment was wit"h-n 00301 as deter-mined by X-ray radiographic techniques. Test results rý,e listed in TablesVIII-I,II,III,IV,V and discussed in greater detail i-i the following sections.
285

8.1.1 BORSIC + Aluminum Composites
Fracture Strength
The effect of flaw length on the net fracture strength of 50 v/o4.2 mil BORSIC composites with 6061-F (17 tests) and 2024-F (10 tests) matrixmaterials is given in Fig. 8.2. The dependence is characterized by threeregions:
1. Region I: The fracture strength of specimens with very shortflaws (less than 0.025 to 0.030 in.) is much like the ultimate tensile strengthof unnotched material. Notch weakening is not observed.
2. Region II: Net fracture strength decreases with increased flawsize up to flaw lengths of approximately 0.3 in.
3. Region III: Notch strength remains nearly constant at approxi-.nately 85 ksi for flaw lengths greater than 0.3 in. This represents a notchedto unnotched strength ratio of approximately 0.53. At flaw length, greaterthan 0.6 in. (2c/W > 0.3) net fracture stress appears to increase, probablyas a result of finite width effects.
The fracture strengths of the 2024-F matrix and 6061-F matrix com-posites are nearly equal. A similar result was observed with regard to themaximum load carrying capability of the notched bend tests. These observationscontrast sharply with the results of the impact and slow bend tests in whichthe fracture energies measured in the BORSIC/6061-F system were approximatelytwice those demonstrated by the BORSIC/2024-F material. Thus, energy measuredin impact tests is not simply related to composite static strength in thepresence of a flaw.
The gross fracture strength of 4.2 mil BORSIC + 6061-F and 4.2 milBORSIC + 2024-F is well represented by a straight line on log-log coordinates.Net fracture strength, (TG, and net fracture stress are related by cracklength, 2c, and specimen width, w, by the relationship:
TG = (l-2c/w)(0 N (8.1)
Since w equals 2 in. for the bulk of these tests, gross and ne6 stress arewithin 5% for 2c :O.l. A computerized least squares analys.-s of the dataestablished that one could write with 99.9% confidence:
OýG = 52.0 (2c)"0"27 ksi (8.2)0.80 2c .025
T N = 'UTS 2c <- 0.025 (8.3)
The fracture strengths of 6061-F matrix composites in 0.100 in. and0.150 in. thicknesses are nearly equal to those at 0.050 in. No effe'cts ofthickness due to either charges in constraint or variations in material prop-erties were observed, Fig. 8.3.
286
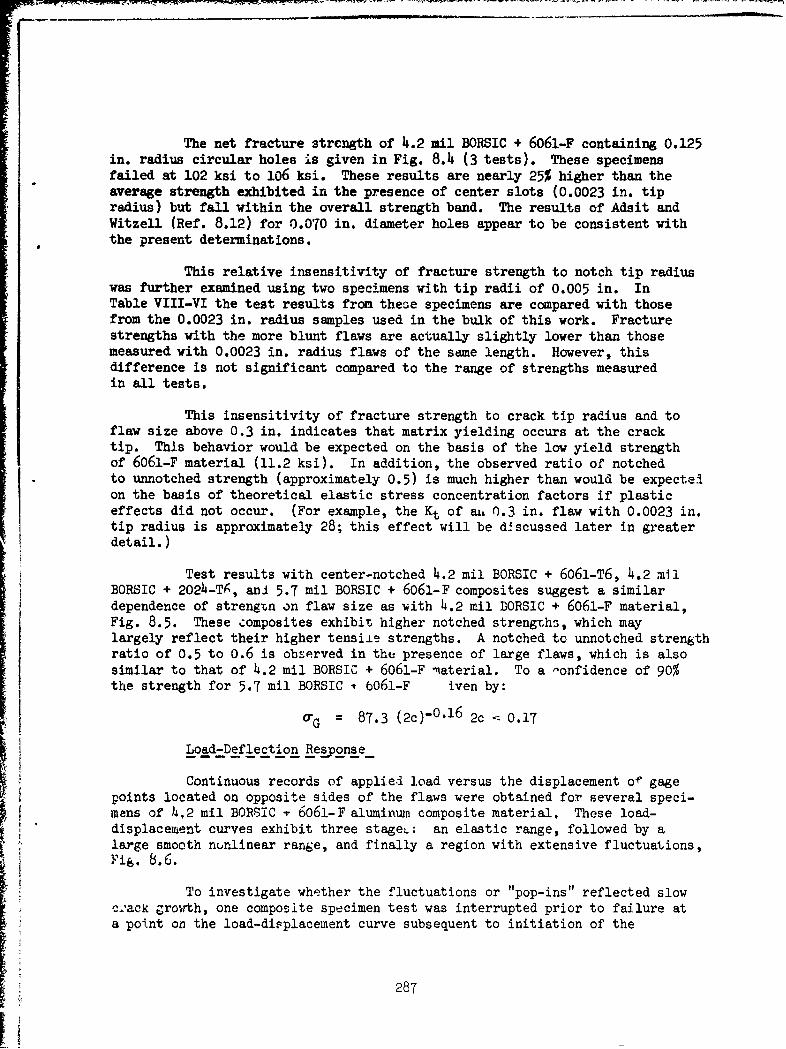
The net fracture strength of 4.2 mil BORSIC + 6061-F containing 0.125in. radius circular holes is given in Fig. 8.4 (3 tests). These specimensfailed at 102 ksi to 106 ksi. These results are nearly 25% higher than theaverage strength exhibited in the presence of center slots (0.0023 in. tipradius) but fall within the overall strength band. The results of Adsit andWitzell (Ref. 8.12) for 0.070 in. diameter holes appear to be consistent withthe present determinations.
This relative insensitivity of fracture strength to notch tip radiuswas further examined using two specimens with tip radii of 0.005 in. InTable VIII-VI the test results from these specimens are compared with thosefrom the 0.0023 in. radius samples used in the bulk of this work. Fracturestrengths with the more blunt flaws are actually slightly lower than thosemeasured with 0.0023 in. radius flaws of the same length. However, thisdifference is not significant compared to the range of strengths measuredin all tests.
This insensitivity of fracture strength to crack tip radius and toflaw size above 0.3 in. indicates that matrix yielding occurs at the cracktip. This behavior would be expected on the basis of the low yield strengthof 6061-F material (11.2 ksi). In addition, the observed ratio of notchedto unnotched strength (approximately 0.5) is much higher than would be expecte!on the basis of theoretical elastic stress concentration factors if plasticeffects did not occur. (For example, the Kt of ea, 0.3 in. flaw with 0.0023 in.tip radius is approximately 28; this effect will be d4scussed later in greaterdetail.)
Test results with center-notched 4.2 mil BORSIC + 6061-T6, 4.2 milBORSIC + 2024-TA, anl 5.7 mil BORSIC + 6061-F composites suggest a similardependence of strengzn on flaw size as vith h.2 mil IORSIC + 6061-F material,Fig. 8.5. These composites exhibit higher notched strengths, which maylargely reflect their higher tensi±e strengths. A notched to unnotched strengthratio of 0.5 to 0.6 is observed in the presence of large flaws, which is alsosimilar to that of 4.2 mil BORSIC + 6061-F qaterial. To a ,onfidence of 90%the strength for 5.7 mil BORSIC , b061-F iven by:
a-G = 87.3 (2c)0.16 2c , 0.17
Load-Deflection Response-
Continuous records of applied load versus the displacement of gagepoints located on opposite sides of the flaws were obtained for several speci-mens of 4,2 mil BORSIC - 6061-F aluminum composite material. These load-displacement curves exhibit three stageL: an elastic range, followed by alarge smooth nonlinear range, and finally a region with extensive fluctuations,Fg 8.6.
To investigate whether the fluctuations or "pop-ins" reflected slow
c•'ack growth, one composite specimen test was interrupted prior to failure ata potnt on the load-divplacement curve subsequent to initiation of the
287
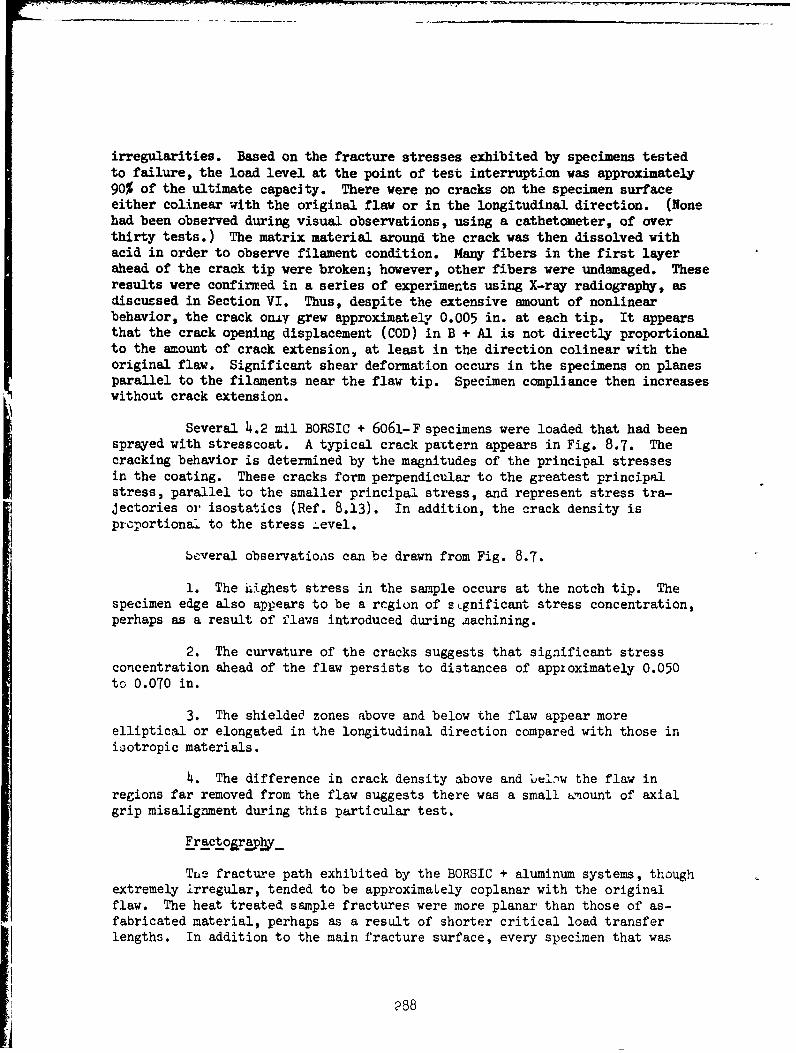
S. .
irregularities. Based on the fracture stresses exhibited by specimens testedto failure, the load level at the point of test interruption was approximately90% of the ultimate capacity. There were no cracks on the specimen surfaceeither colinear with the original flaw or in the longitudinal direction. (Nonehad been observed during visual observations, using a cathetometer, of overthirty tests.) The matrix material around the crack was then dissolved withacid in order to observe filament condition. Many fibers in the first layerahead of the crack tip were broken; however, other fibers were undamaged. Theseresults were confirmed in a series of experiments using X-ray radiography, asdiscussed in Section VI. Thus, despite the extensive amount of nonlinearbehavior, the crack on-Ly grew approximately 0.005 in. at each tip. It appearsthat the crack opening displacement (COD) in B + Al is not directly proportionalto the amount of crack extension, at least in the direction colinear with theoriginal flaw. Significant shear deformation occurs in the specimens on planesparallel to the filaments near the flaw tip. Specimen compliance then increaseswithout crack extension.
Several 4.2 mil BORSIC + 6061-F specimens were loaded that had beensprayed with stresscoat. A typical crack paTtern appears in Fig. 8.7. Thecracking behavior is determined by the magnitudes of the principal stressesin the coating. These cracks form perpendicular to the greatest principalstress, parallel to the smaller principal stress, and represent stress tra-jectories or isostatics (Ref. 8.13). In addition, the crack density isproportional to the stress _evel.
beveral observatioas can be drawn from Fig. 8.7.
1. The highest stress in the sample occurs at the notch tip. Thespecimen edge also appears to be a rcgion of s Lgnificant stress concentration,perhaps as a result of flaws introduced during machining.
2. The curvature of the cracks suggests that significant stressconcentration ahead of the flaw persists to distances of appioximately 0.050to 0.070 in.
3. The shielded zones above and below the flaw appear moreelliptical or elongated in the longitudinal direction compared with those inisotropic materials.
4. The difference in crack density above and belew the flaw inregions far removed from the flaw suggests there was a small umount of axialgrip misalignment during this particular test.
Fractogr.ap.y_
Ttie fracture path exhibited by the BORSIC + aluminum systems, thoughextremely irregular, tended to be approximaLely coplanar with the originalflaw. The heat treated sample fractures were more planar than those of as-fabricated material, perhaps as a result of shorter critical load transferlengths. In addition to the main fracture surface, every specimen that was
288

evaluated disrL•ed longitudinal splits. These splits originated at pointsbehind the flaw tip, often at the point of changing crack height of the EDMslot. Visual examinations revealed tnat the topography of the main fracturesurface was similar to that exhibited by 2ongitudinal tensile specimens.Fracture surface features of r3gions directly ahead of the machined flaw didnot appear different from those of areas nearer the specimen edge, Fig. 8.8.
A slde view of a fractured 4.2 mil BORSIC + 2024-F specimen and anX-ray radiograph of a region near the tip of the original flaw in ai:-therspecimen of the aame type appear in Fig. 8.9. The change in contrast sioundthe region of crack extension in the conventional photgraph arises because"stresscoat" has broken away from this ares. during specimen failure.
The fiber image produced in t• d X-ray micrograph is due to the0.0005 in. diameter tungsten boride core of the filament. Several featuresare notable:
1. There is considerable fieber (core) breakage below the fracturesurface. This may be damage that occurred prior to gross crac] extension orfar more likely be the result of reverberations after specimen separation.
2. There is comparatively lit• le fiber damage below the cracksection introduced by EDM machining.
3. The region of longitudinal aplitting contains many split filamentsand exhibits a permanent transverse displacement relative to surroundingmaterial. This suggests that the region was subjected to significant transversetensile stress at some time during the test. High shear stresses could alsobe involved.
4. The area where the stresscoat broke away from the sample termi-nates along the longitudinal splits. It has remained on the sample in thoseareas remote from the fracture and in the shielded areas above and below theoriginal flaw.
Two BORSIC + aluminum specimens failed near the doublers rather thanat the flaw. One specimen contained a 0.020 in. flaw, Fig. 8.10; in the otherit measured 0.050 in. Thus in Region I or early ir Region II, the stressconcentration associabed witli gripping the specimen can be of the same magni-tude as the stress concentration associated wiih the flaw.
To investi6ate the matrix plasticitj effects arouri flaws, severalspecimens were held at constant load and their surfdces were examined usingstandard replicating techn4.ques. A Cr shadowed replica of a 4.2 mil BORSIC +6061-F sample c~ntaining a 0.125 in. radius circular hole that was interruptedat less than lO psi below its fracture stress is shown in Fig. 8.11. On theleft is a crack that has initiated, run longitudinally, and -hen been arrested.The dark vertical bands around tbe hole circumference are zones of plasticdeformation in the matrix. It could be easily observed visually that the holewas ellipbical in shape at this load.
289
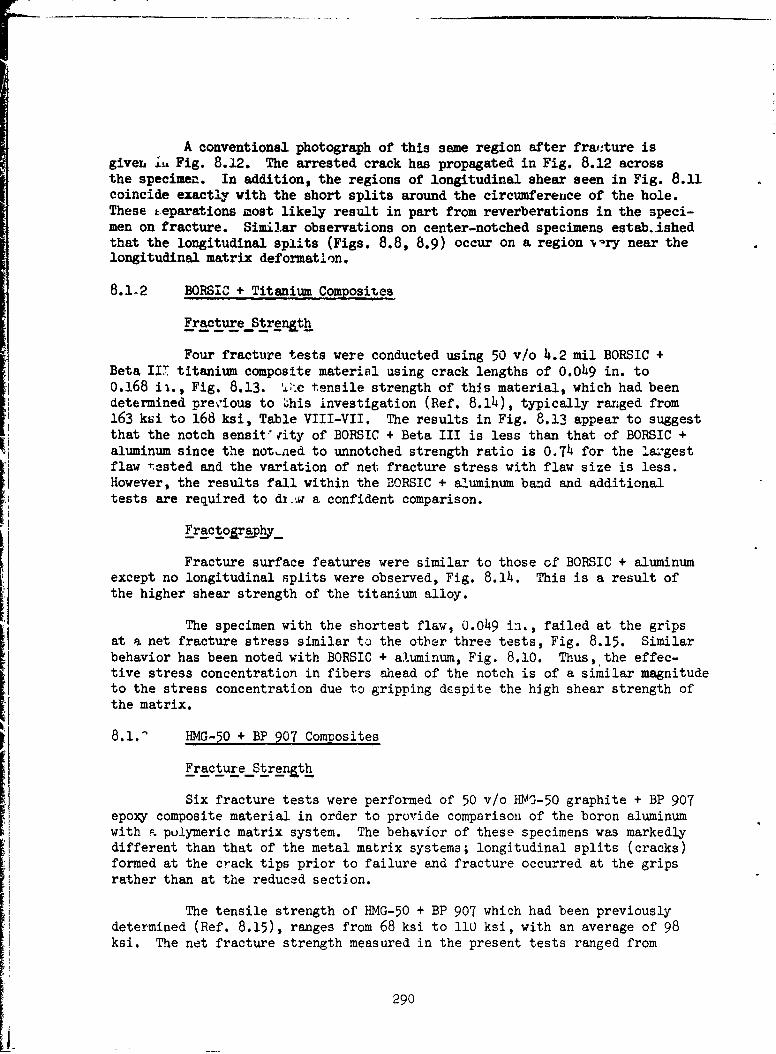
A conventional photograph of this same region after fraf.!ture isgiven lu Fig. 8.12. The arrested crack has propagated in Fig. 8.12 acrossthe specimen. In addition, the regions of longitudinal shear seen in Fig. 8.11coincide exactly with the short splits around the circumference of the hole.These t.eparations most likely result in part from reverberations in the speci-men on fracture. Similar observations on center-notched specimens estab..ishedthat the longitudinal splits (Figs. 8.8, 8.9) occur on a region Nry near thelongitudinal matrix deformation.
8.1.2 BORSIC + Titanium Composites
Fracture Strength
Four fracture tests were conducted using 50 v/o 4.2 mil BORSIC +Beta 117 titanium composite material using crack lengths of 0.049 in. to0.168 ii., Fig. 8.13. I•Lc tensile strength of this material, which had beendetermined pre.ious to 'his investigation (Ref. 8.14), typically ranged from163 ksi to 168 ksi, Table VIII-VII. The results in Fig. 8.13 appear to suggestthat the notch sensit' •ity of BORSIC + Beta III is less than that of BORSIC +aluminum since the not.ned to unnotched strength ratio is 0.74 for the laxgestflaw tested and the variation of net fracture stress with flaw size is less.However, the results fall within the BORSIC + aluminum band and additionaltests are required to di.zw a confident comparison.
Fractojr aphy
Fracture surface features were similar to those of BORSIC + aluminum
except no longitudinal splits were observed, Fig. 8.14. This is a result ofthe higher shear strength of the titanium alloy.
The specimen with the shortest flaw, 0.049 in., failed at the grips
at a net fracture stress similar to the otber three tests, Fig. 8.15. Similarbehavior has been noted with BORSIC + aluminum, Fig. 8.10. Thus, the effec-tive stress concentration in fibers ahead of the notch is of a similar magnitudeto the stress concentration due to gripping despite the high shear strength ofthe matrix.
8.1.- HMG-50 + BP 907 Composites
Fracture Strength
Six fracture tests were performed of 50 v/o HMv-50 graphite + BP 907
epoxy composite material in order to provide comparison of the boron aluminumwith & polymeric matrix system. The behavior of these specimens was markedly
different than that of the metal matrix systems; longitudinal splits (cracks)formed at the crack tips prior to failure and fracture occurred at the gripsrather than at the reduced section.
The tensile strength of HMG-50 + BP 907 which had been previouslydetermined (Ref. 8.15), ranges from 68 ksi to il0 ksi, with an average of 98ksi. The net fracture strength measured in the present tests ranged from
290

64 ksi to 96 ksi, Fig. 8.13. The material was not significantly weakened bythe notch beyond that due to the loss in cross section and
2c ,o.6
F~ract~o~r aph•
The failed specimens were characterized by longitudinal splits atregions other than at the crack tip and very large permanent crack openings,Fig. 8.16. (The flaw shown was initially 0.005 in. high.) Material behindt:e flaw remained attached to the grip sections. The crack path runs from thespecimen edge along the grip boundary, longitudinally to the crack tip, acrossthe flaw, longitudinally to the grip, and across the specimen once again.
Optical zxamination of tie fracture surfaces at high magnificationindicated that the longitudinal splits propagated preferentially at the fiber-matrix interface. The features of the transverse coa.ponents of the fracturewere similar to those characterizing longitudinal tensile failures.
8.2 Transverse Reinforcenent
Exerimental Method
These ex;ariments were conducted with the flaws parallel to thefiber direction r-ing 6061-F matrix composites. Test procedures and alignmentstandards were identi"-21 to those used for longitudinally reinforced material.Two msterials were investigated: 50 v/o 4.2 mil BCRSIC + 6061-F and 63 v/o5.7 mil BORSIC + 6061-F.
Results and Discussion
Results of the fracture tests are given in Fig, 8.17 and TableVIII-IX. The flawed specimens of both materials exhibited a net fracturestress independent of flaw length which was similar to the levels encounteredin measurements of transverse tensile strength: 12 ksi to 18 ksi in the caseof 4.2 mil BORSIC material and 17 ksi to 26 ksi in the case of the 5.7 milBORSIC composites. Thus, the observed fracture st* ength is:
O'NET = O'UTS 2c < 0.6 (8.5)
The center-notched transversely reinforced (type TL) specimensfractured along surfaces nearly coplanar with the original flaws. A typicalfailed 4.' il BORSIC + 6061-F specimen is shown in Fig. 8.15. The sampleexhibits 4 45 0 slanted fracture surface. The specimen edge "rotations" relativeto the original 900 flaw were invariably in the opposite sense (clockwise andcounterclockwise). A region of extensive fiber splitting lies directly aheadof the original flaw. Regions of fracture surface outward from the centerexhibited vary'ng degrees of splitting from specimen to specimen. The 5.7 milBORSIC + 6061-F displayed similar features except that fiber splitting wasminimal and restricted to a small area at the original notch tips.
291
The percentages of split fibers appearing on fracture surfaces of 4.2mil BORSIC material in regions removed from the original flaws were measuredas described in Section III. The variation of fracture strength with percentsplit fibers is shown in Fig. 8.19 for the same population of specimens thatappeared in Fig. 8.17 as well as for those appearing in Fig. 3.14. Theexcellent correlation obtained reinforces the earlier observation that trans-verse strength is governed by the transverse strength of the fibers.
8.3 Analysis
8.3.1 Fracture Mechanics
It was mentioned in the introduction to' section VIII that 'nrhomogeneous elastic orthotropic materials the Griffith-Irwin fracture criterionis applicable if the flaw is oriented along one of the principal directionsof elastic symmetry and propagation is colinear with the original flaw (Refs.8.1-11).
The Griffith-Irwin expression is a thermodynamic one arising fromequating the elastic energy release associatcd with incremental crack exten-sion to the energy required to create new surface or perform local plasticwork. The critical stress system criterion is derived by describing the stressfield ahead of the crack with elastic stress field equations that contain aC-1/2 type singularity. This stress criterion is characterized by the stressintensity factor K; for the opening mode one can write (Ref. 8.16):
K A1122 A 2 2 A12 + A6 6 1/2 (8.6)V 2 2 22 2A 1 2G = 2All 2 All
and
KC'-/2 (8.7)K = •TFC.
This implies that for a given material
2(7FC const (8.8)
where OF = gross fracture stressC = half crack length at the onset of unstable crack extension
Ai. = elastic constants= crack extension force or energy per unit area of crack
extension.
The results of all longitudinally reinforced center-notched tensiontests of 4.2 mil BORSIC + 6061-F and 4.2 mil BORSIC + 2024-F are given inFig. 8.20, where gross fracture strength is presented as a function of flawsize. The data is well characterized by a linear fit on log-log coordinatesexhibiting a slope of -0.27. A slope of -0.50 would be expected from theGriffith-Irwin relationship of linear elastic fracture mechanics.
292

Original flaw lengths were used in Fig. 8.20 since acid digestionexperim.ent had showed that little fiber breakage had occurred ahead of theflaw at loads very close to failure, and because visual observations of manytests indicated that fracture occurred abruptly without prior crack extensionon the specimen surface. On a net stress basis the data are not described bya straight line on log-log coordinates. Application of the Irwin "tangentformula" for finite width correction (Ref. 8.1) causes a negligible change whichis in the direction of poorer agreement. As a result, if standard linear elasticfracture mechanics are used to characterize fracture of BORSIC + 6061-F aluminuma "critical stress intensity" would emerge that is a function of crack lengthdespite "valid" test conditions (Ref. 8.12). A bimilar difficulty would arisefor transversely reintorced material, Fig. 8.17, since UN = const. in thisorientation.
8.3.2 Flaw Stress Field
The fracture process is governed by the state of stress around thecrack tip and in isotropic homogeneous materials the longitudinal stress normalto the flaw is the significant variable (Ref. 8.1). Fracture mechanics provideunique and single-valued relaticnships among stress, strain and energy whenplasticity effects are small. Implicit in this treatment is the assumptionthat there is sufficient stress generated (or sufficient local work is performed)at the crack tip or point of singularity to break atomic bonds.
The inhomogeneity and strength anisotropy of BORSIC + aluminum andmany other fiber reinforced materials complicates this situation. The elasticstress field at the boundary and directly ahead of an elliptical crack, orientedin directions of elastic symmetry, in a semi-infinite plate under uniaxialtension is given in Figs. 8.21-8.23. The analysis of Savin (Ref. 8.18) wasemployed to calculate, as a function of position: (1) the ratio of longitudinalnormal stress to the applied tensile stress, Kxx; (2) the ratio of longitudinalshear stress to the applied tensile stress, Kxy; and (3) the ratio of normaltransverse stress to the applied tensile stress, Kyy, an elliptical crack oflength 0.100 in. and 0.030 tip radius in BORSIC + aluminum was analyzed.
Kxx is maximum at the crack tip and decays ahead of the flaw moreslowly than lA'T, Fig. 8.21. Kxy is maximum (-0.99) slightly behind the cracktip with a sign of shear strain consistent with the actual displacements,Fig. 8.22. Ky is zero at the crack tip and attains local maxima both aheadof and behind (0.55) the tip of the notch, Fig. 8.23. The root radius usedhere is an estimate of what is likely to be the minimum effective value, one-half the critical load transfer length, and a 2c of 0.100 in. was chosen asbeing typical of the crack lengths evaluated in this program.
On the basis of these Ftress concentration factors and the longi-tudinal strength (160 ksi), transverse strength (15 ksi) and shear strength(15 ksi) of BORSIC + 6061-F aluminum, one would expect:
1. Shear yielding at 15.1 ksi (15/0.99)
293
2. Transverse tensile failure at 27.2 ksi (15/0.55)3. Longitudinal failure at 38 ksi (160/4.21).
The measured gross fracture strength of this material with a 0.100 in. flaw isover 100 ksi, rather than 38 ksi because failure by shear yielding occurs firstand this relieves the stress concentration. Regarless of bow sharp an initialflaw, one assumes (or how low a net section stress is impliei., sufficient localfiber displacement to cause fracture is not generaten because extensive sheardeformation occurs behind flaw tip, and the "exce.%s load" aririqi.. 2rpm thediscontinuity is supported by a larger volume of material. Evi,,nce 3f tipblunting and shear displacements observed in this material have been discussedpreviously. Although significant stress concentrations can be developed overa volume of material with dimensions related .o the critical load transferlength, fracture cannot occur at low nominal stresses as a result of a stresssingularity.
Since 6061-F is not elastic to failure one would expect shear yieldingat stresses below 15 ksi and this is observed, Fig. 8.6.
8.3.3 Notch Blunting Indices
A list of maximum stress concentration factors for BORSIC + Al,BORSIC + Ti, and graphite + epoxy is given in Table VIII-X. One can definea longitudinal shear index Ixy by the following expression:
Ixy - Kxx/X . S/IKxyI (8.9)
where Ki = stress concentration factorsshear strength
X = longitudinal tensile strength
This represents the fraction of the applied stress for tensile failure atwhich shear failure occurs. A similar index can be written for transversefailure.
Ixy for isotropic materials is always greater th-n one and thiseffect cannot apply. For BORSIC + aluminum, Ixy is approximately 0.4 (elastic)at a crack length of 0.100 in. and Ixy decreases for sharper cracks. Thematerial will yield but not break and a degree of notch sensitivity remains.
For graphite + epoxy Ixy.is approximattly 0.7 at a flaw length of0.100 in. Since graphite + epoxy is nearly elastic to failure, the materialwill split near the notch tip and eliminat.2 the effect of stress concentrationFig. 8.13.
For BORSIC + titanium Ixy is probably greater than one, but T
can be less than one. This may have caused the relative notch insensitivityobserved, Fig. 8.13.
294
8.3.4 System Comparisons
The notch strength (toughness) of the composite systems evaluatedin this work are compared to several common isotropic materials in Fig. 8.24.The gross fracture strength of the isotropic materials was calculated usingthe Irwin tangent formula (Ref. 8.1) uncorrected for plastic zone and thefollowing data:
1. KIc 50 ksi Vm for Ti-6AI-4V (Ref. 8.19)2. Gc = 340 in.-lb/in. 2 for 2024-T3 aluminum (Ref. 8.20)3. Gc = 0.04 in.-lb/in. 2 for soda lime glass (Refs. 8.20,21).
Also shown is a hypothetical system of 160 ksi strength that is unaffected bythe notch:
0-F = JUTS (1 - 2c/w)
The composite systems are weaker in the presence of flaws than theconstant net stress upper bound. However, they are comparable to or somewhatstronger than Ti-6A1-4V allky and clearly superior to 2024-T3 (or glass whichis more than an order of magnitude less flaw resistant than the other systems).
8.4 Conclusions
1. Linear elastic fracture mechanics does not provide a valid frame-work f'or predicting the fracture strength of BORSIC + 6061 Al, BORSIC + 2024Al, BORSIC + Beta III Ti, or graphite + epoxy as a result of notch bluntingeffects that arise from inhomogeneity and anisotropy of strength.
2. The failure strength of these composite materials is governedby the level of strain generated in filaments ahead of the crack or in thereduced section in the presence of notch blunting effects.
3. The energy measured in an impact or slow bend v:est is not simplyrelated to the strength of these systems in the presence of a flaw.
4. The notch strengths, of longitudinally reinforced BORSIC +aluminum, BORSIC + Beta III titanium, and graphite + epoxy are comparableto or somewhat higher than Ti-6A1-4V alloy and clearly superior to 2024-T3aluminum alloy.
295

SECTION VIII - REFERENCES
1. A. S. Tetelman and A. J. McEvily, Jr., Fracture of Struct-;ral Materials,
John Wiley and Sons, 1967.
2. E. M. Wu, J. Applied Mech., Vol. 34, p. 967-974, 1967.
3. E. M. Wu, "Application of Fracture Mechanics to Orthotropic Plates",Univ. of Illinois, TAM Report 248, Naval Research Laboratory, ContractNo. 14onr 2947(02)X, 1963.
4. E. M. Wu and R. C. Reuter, "Crack Extension in Fiberglass ReinforcedPlastics", Univ. of Illinois, TAM Report 275, Bureau ef Naval Weapons,NOW-64-0178-d, 1965.
5. E. M. Wu, "A Fracture Criterion for Orthotropic Plates Under the Influenceof Compression and Shear", Univ. of Illinois, TAM Report 283, Bureau ofNaval Weapons, Contract No. NOW-0204-d, 1965.
6. G. R. Irwin, "Analytical Aspects of Crack Stress Field Problems", Univ.of Illinois, TAM Report No. 213, March 1962.
7. E. M. Wu, "Discontinuous Mode 3f Crack Extension in UnidirectionalComposites", Univ. of Illinois, TAM Report No. 309, 1968.
8. E. M. Wu, "Fracture Mechanics of Anisotropic Plates", S.W. Tsai, et al,Composite Materials Workshop, Technomic Publishing Co., p. 20-43, 1968.
9. G. C. Sih, et al, Int. J. Fracture Mech., Vol. 3, p. 189-203, 1965.
10. P. C. Paris and G. C. Sih, 'Stress Analysis of Cracks", ASTM STP 381,p. 30-83, 1965.
11. D. D"! Ang and M. L. Williams, J. Applied Mech., Vol. 28, No. 3, p. 278-372, 1961.
12. N. R. Adsit and W. E. Witzell, "Fracture Toughness of Aluminum-BoronComposites", SAMPE, p. 391, 1969.
13. J. W. Dally and W. F. Riley, Experimental Stress Analysis, McGraw-Hill
Book Company, New York, 1965.
14. L. E.,Dardi and L. J. Pionke, Pratt & Whitney Aircraft, Unpublished work.
15. L. E. Dardi and J. C. Preston, Jr.., Pratt & Whitney Aircraft, Unpublishedwork.
16. G. C. Sih, F. C. Paris, and G. R. Irwin, "On Cracks in RectilinearlyAnisotropic Bodies", Intl. Jl. of Fracture Mechanics, Vol. 1, No. 3,p. 189-203, 1965.
296
wpm" *q" 1 - - w%
SECTION VIII - REvERENCES (Cont'd)
17. E. F. Olster and R. C. Jones, "Toughening Mechanisms in Fiber ReinforcedMetal Matrix Composites", Report R70-75, Department of Civil Engineering,Massachusetts Institute of Technology, Cambridge, Mass., No%. 1970.
18. G. N. Savin, Stress Concentration Factors Around Holes, Translated byW. Johnson and E. Gros, Pergamon Press, London, 1961.
19. D. L. Ruckle, Pratt & Whitney Aircraft, Unpublished work.
20. N. H. Polakowski, E. J. Ripling, Strength and Structure of EngineeringMaterials, Prentice-Hall, Inc., Englevood Cliffs, New Jersey, p. 4116, 1966.
21. "1971 Materials Selector", Materials Engineering, Vol. 72, No. 6, p. 312,1970.
2.
•29

K910653-12
ZC L '
II
MAG: 0.34 X
FIGURE 8-1
CENTER-NOTCHED TENSILE SPECIMEN IN LOADING FIXTURE
298
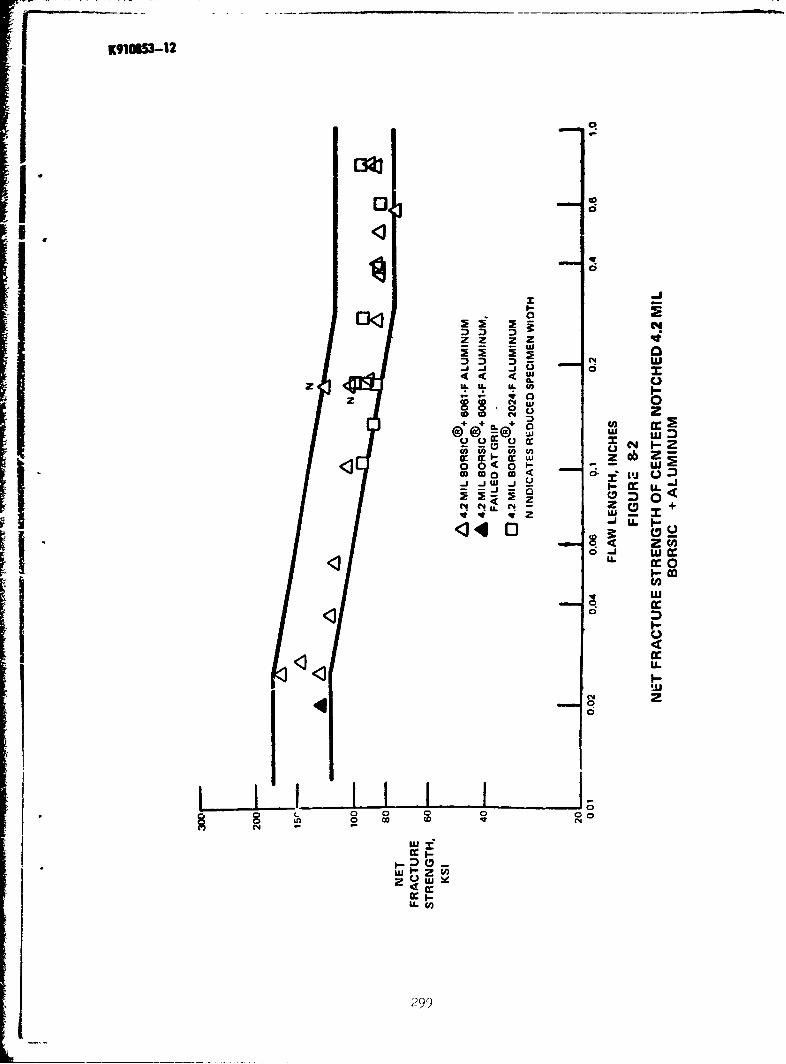
K91OL53-12
1* 0 0
01 i
'.4 wa C
0 0 L0
Z+ +0 +) 0
02 + L
zco&L
C',
U.
41 0
LUU
LLC
2(99

K91OW5-12
w w
~W>
- 2J
8 In
I I- LL
w U
N L
~ (~z-IL ILUJ
z .
C4C
d
~LL
30
wit-

K K91O65-12
0
0z
00
Ci M
0 > tic
U.
n w
9~c 0>0e w
w 0
a ~ L CC,
2301
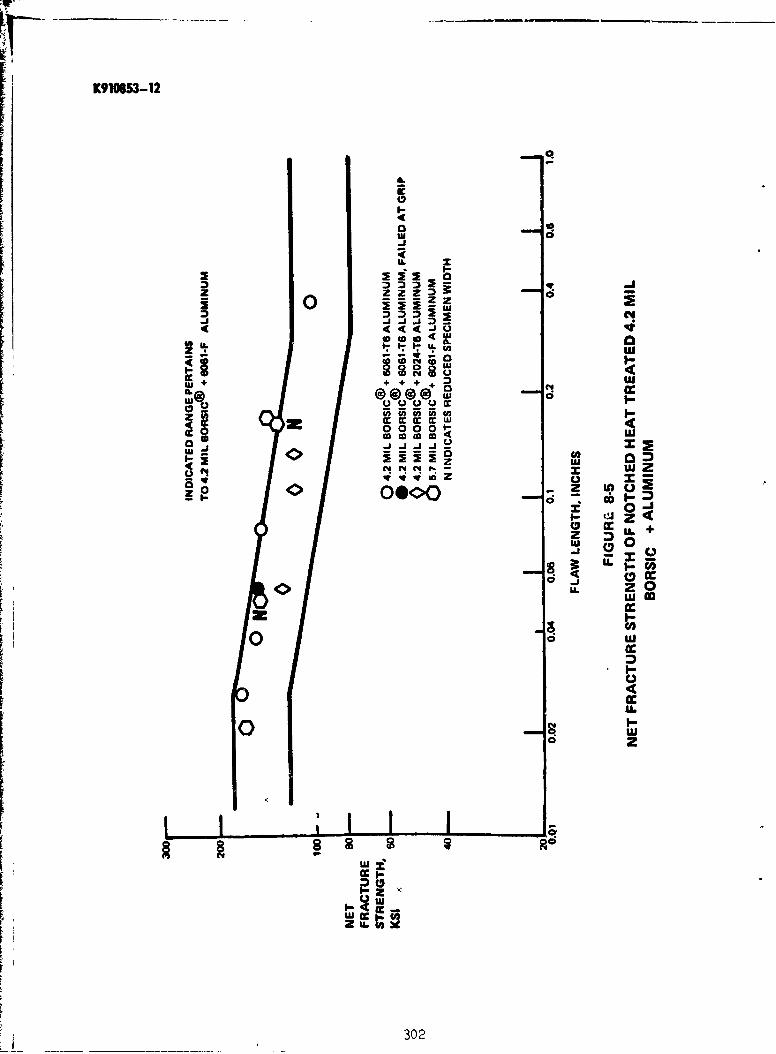
K910853-12
rI a~i0
6A
ii zim
BA[ W I LI4
0 -l.N-us
Iw.
1 0. 0Z
30

K910853-12
90r0
80.0
70.0
60.0 P
50.0 W= 2"
NE/ E I ,
40.0
SGENERAL YIELD:
SSTAGE I TO STAGE 11
SHI:AR YIELDAT CRACK TIP
10.0
oIIiI I I I
0 1 2 3 4 5 6 7
DISPLACEMENT, 10'3 INCHESFIGURE 8-6
TYPICAL STRESS. DISPLACEMENT CURVE FOR 4.2 MIL BORSIC + 6061-F ALUMINUMCENTER NOTCH SPECIMEN UNDER UNIAXIAL TENSION
303
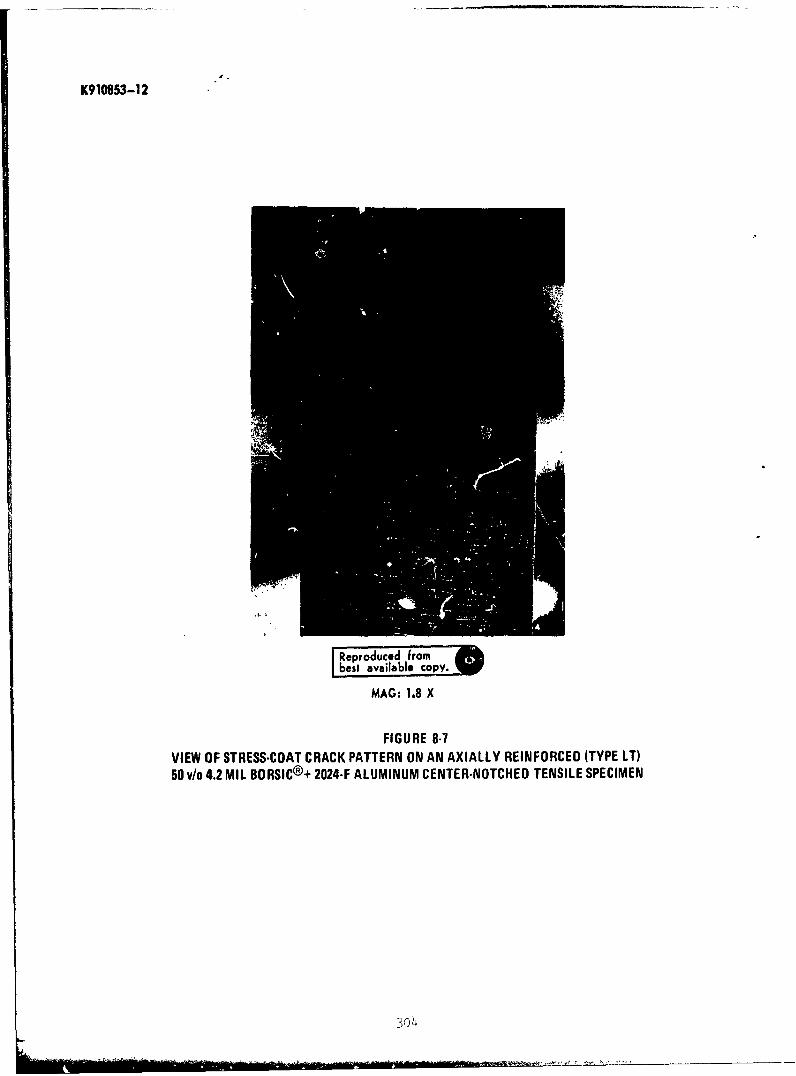
K910853-12
Reproduced ofrombest availablecopy.W
MAG: 1.8 X
FIGURE 8-7
VIEW OF STRESS-COAT CRACK PATTERN ON AN AXIALLY REINFORCED (TYPE LT)
50 v/o 4.2 MIL BORSIC®+ 2024-F ALUMINUM CENTER-NOTCHED TENSILE SPECIMEN
304

K910853-12
U-C-
0c-
aciprodciidc fromwb St available COPY.
LL -0
soIzI
L.L
0u,
U-
w
305
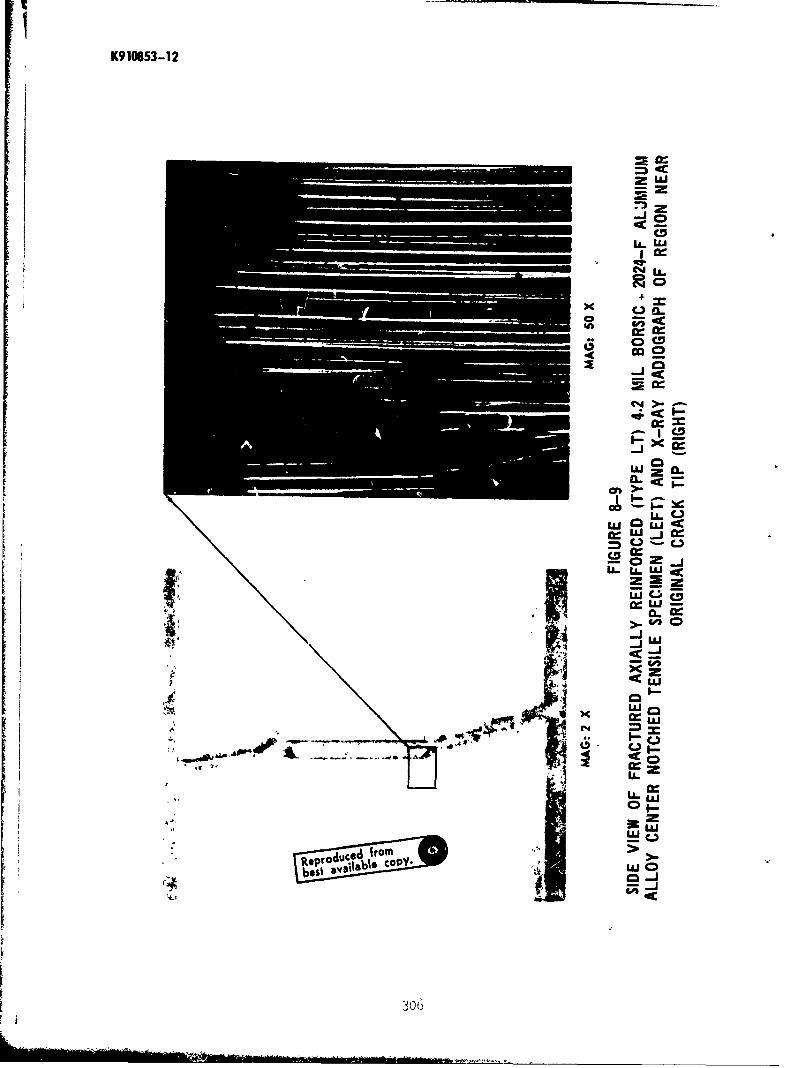
K910853-12
-JoIc-
C14
x +
InC
COCu.L
W z a
LLCJ
UL'4 -wCZ
C jJ
,poduced froml,
306

K910853-12
FIGURE 8-10
FRACTURED 4.2 MIL BORSIC + 6061 ALUMINUM
CENTER NOTCHED SPECIMEN
307

K910653-12
i4o
FIGURE 8-ii
Cr SHADOWED REPLICA AROUND CIRCULAR HOLE IN 4.2 MIL BORSIC + 6061F ALUMINUMAT 99 PERCENT OF FRACTURE STRESS
308~

K910953-1 2
FIGURE 8-12
FRACTURED 4.2 MIL BORSIC + 601-F ALUMINUM SPECIMEN CONTAINING A CIRCULAR HOLE
309
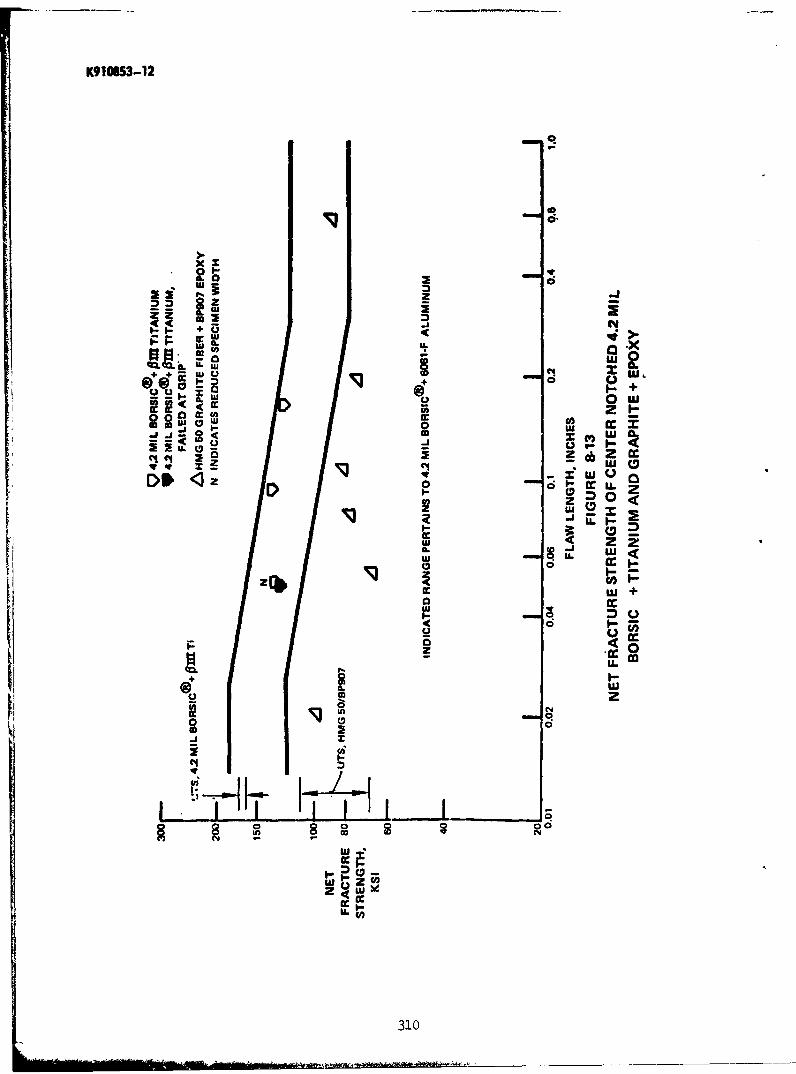
K910853-12
xzz
-XQX jL 6 wo
r9 +
-- us
Cl C4- Z wU
c;S~ 0 U.zD I. C
ww
z
'm 0
I..'.
.9.
310

K910853-12
4U
to 0
Cc-
4LI- _5
-JZLUW
N x
C, U
4'20
311
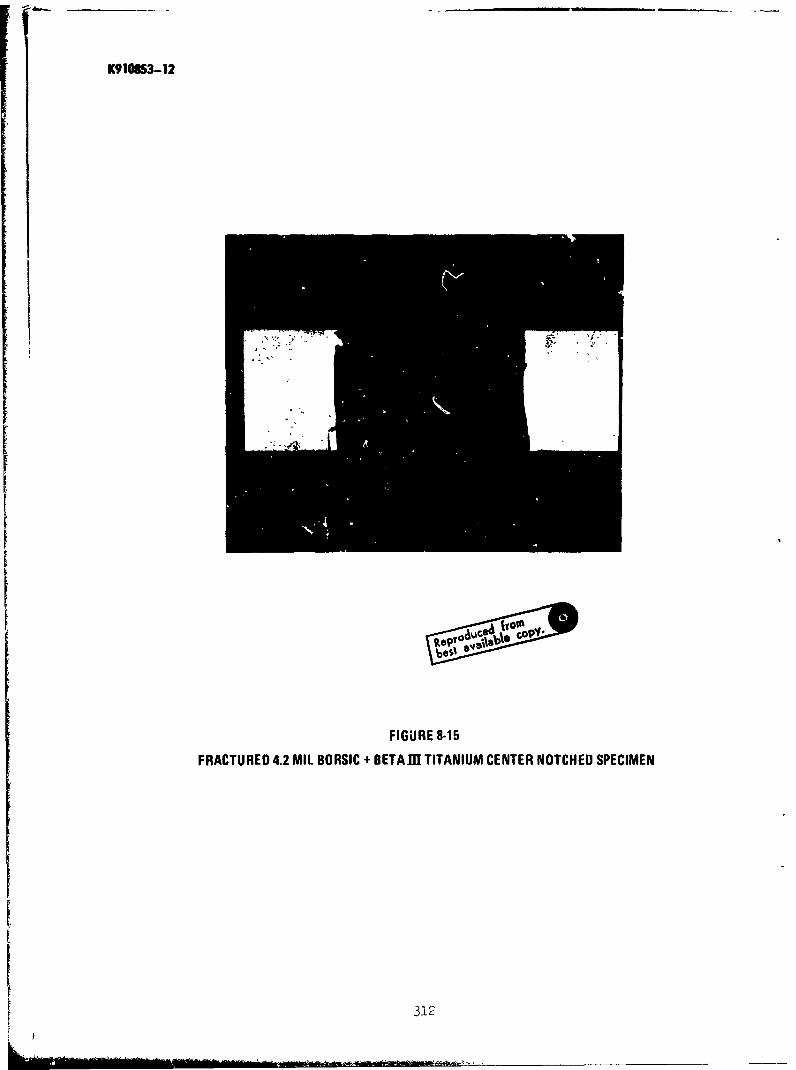
K910853-12
FIGURE 8-15
FRACTURED 4.2 MIL BORSIC + BETAIT TITANIUM CENTER NOTCHED SPECIMEN
312

K910853-12
0zU
iz01-0 LU
Ou
'U
OxDOI-0
z e001
U.-
E0~.0 u
u U21 3J>
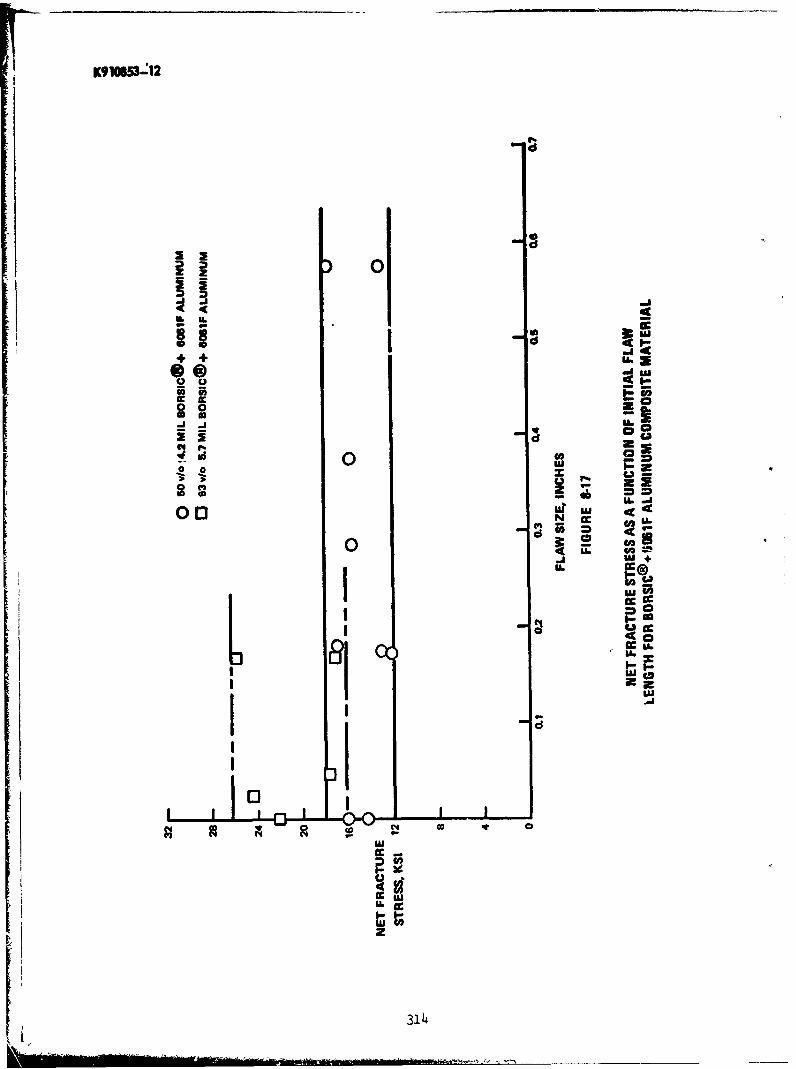
K91063-'12
ccc
E c
00
jwE
0. N-cCAU
41 L6 -
iCC ci
Icc
tFE
N C~AM
ILuEuL 814
L6u
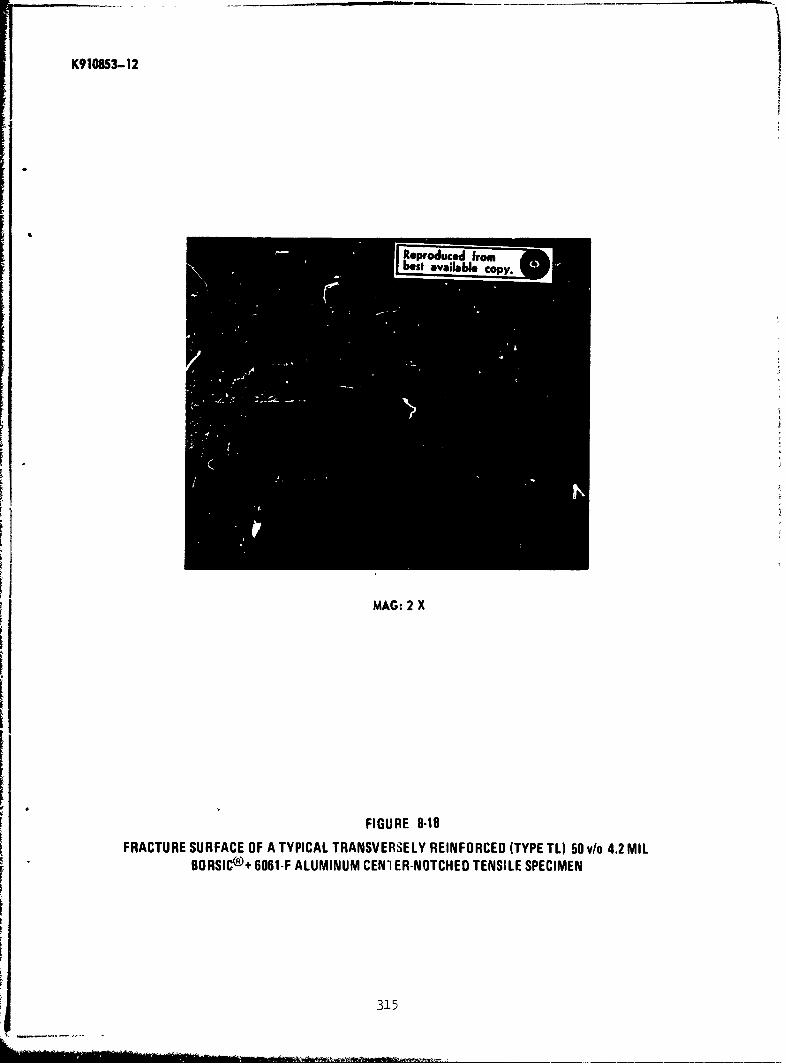
K910853-12
MAG: 2 X
FIGURE 8-18
FRACTURE SURFACE OF A TYPICAL TRANSVERSELY REINFORCED (TYPE TI) 50 v/o 4.2 MILBORSIC®+ 6061-F ALUMINUM CENTER-NOTCHED TENSILE SPECIMEN
315
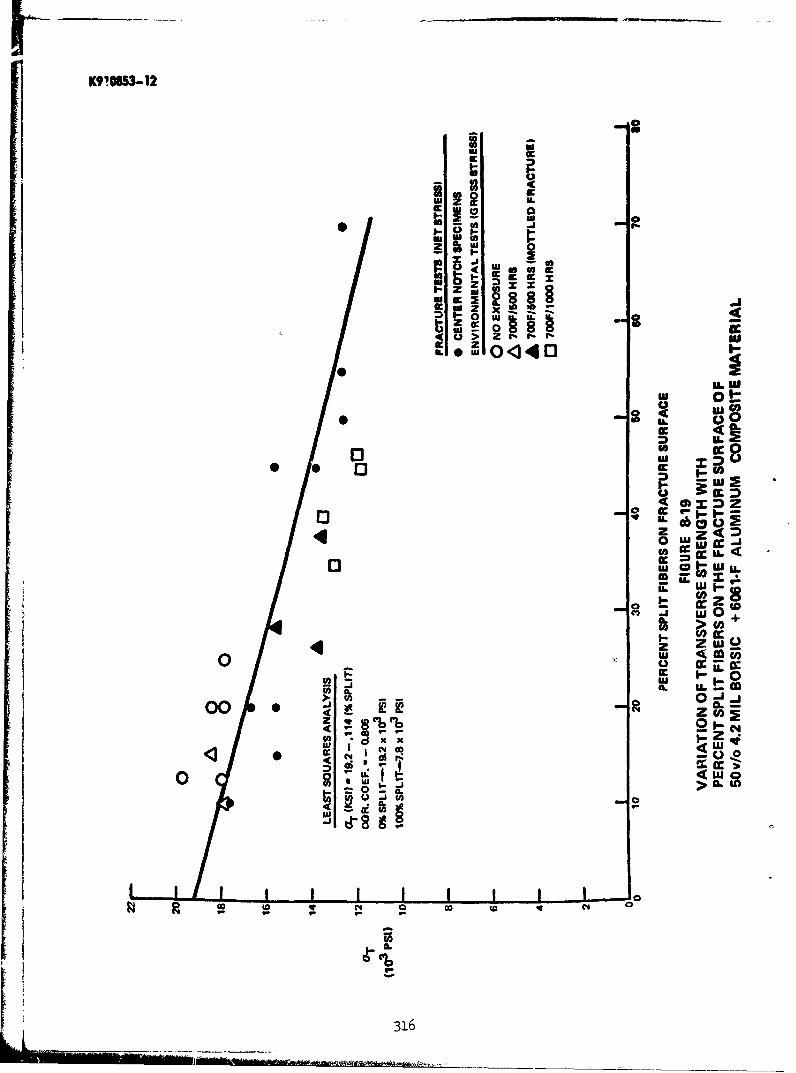
0!08653-12
z ~U.
X t
z0uj
0 0-U C
Y 0WE~~4 IL5
0640>~c 8rrr
U3CDx
o. C1
4 zzw0oo it
LAL
0 J
0c v6 w -C
UU0 -j >~
C4 co tow
U 31.
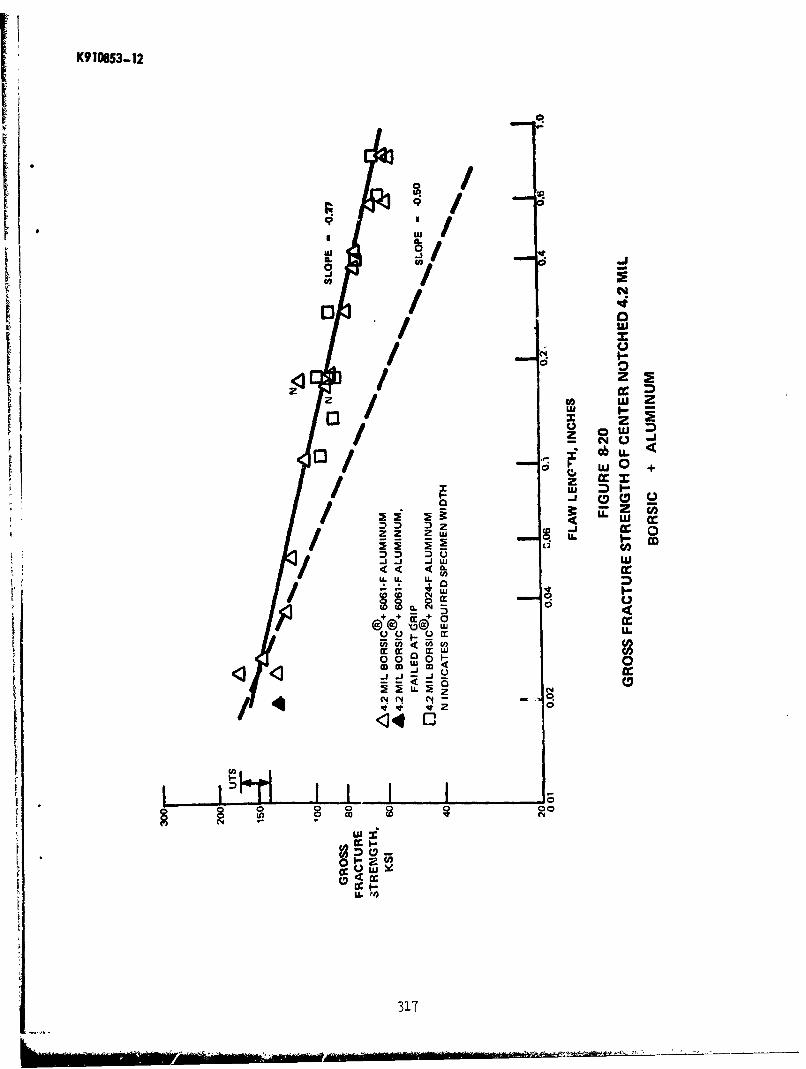
K9 10853-12
9L
I~ j j
N
00
/u w
UJ0 +H 1,1 uj
0 w+
J -IJ L
/ýNZ 2
Co--L 0
RJJ .J
, 0
C4 (I
mmOm 0
Ull
317
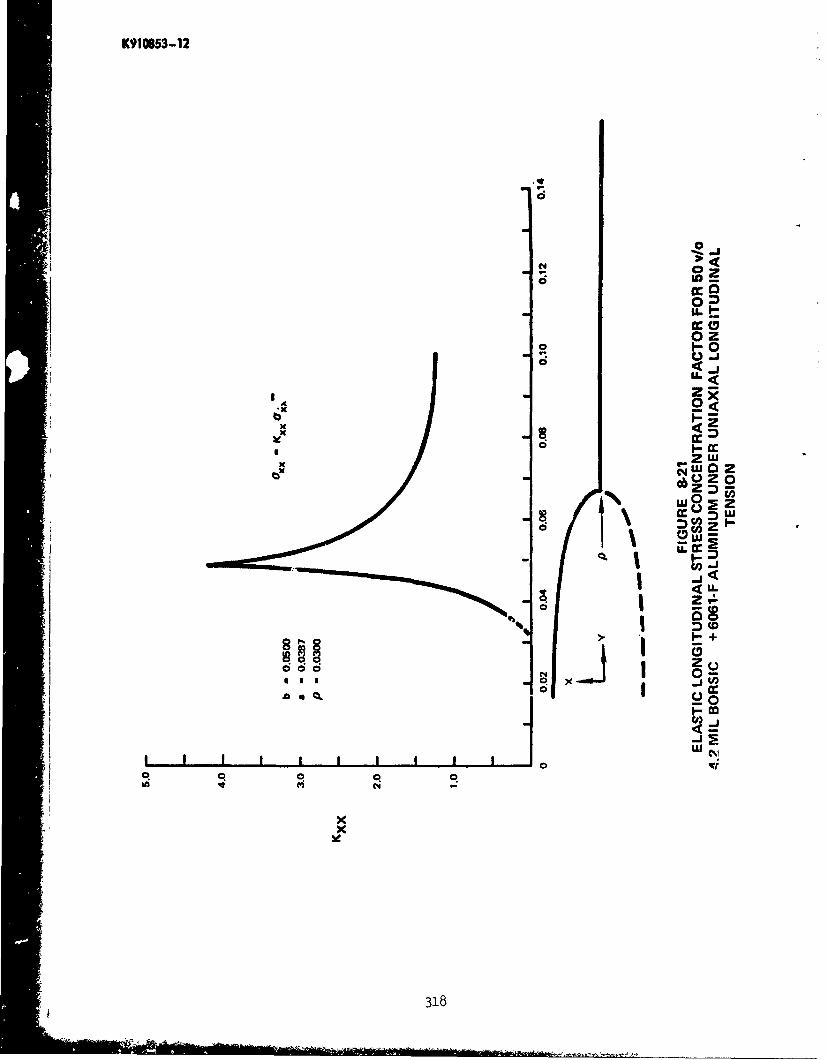
K910853-12
0
0 az
0z
w0 z
zwox wZDig2
CC~txX 3
j0 I
Z
-J c
x
318

K910653-12
0
I o
30. U.
bK cc5
00uJ
d ~U.-mzx
_ _ _ _ _ _ _ z
I- W:p I-
LU.doccc
> IýC! LpT0 ' x
IQCO
I:x
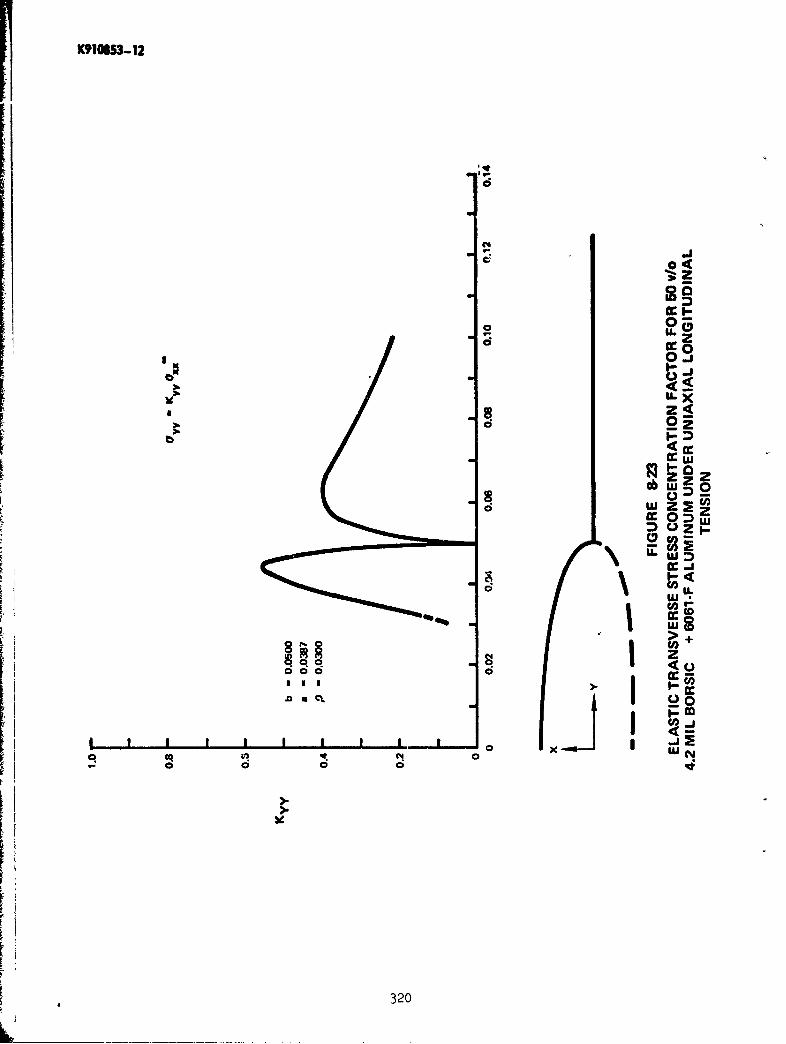
K91053-12
d
C14
oo
- 02
Oji
wzz
e~~ nHZLIU
320
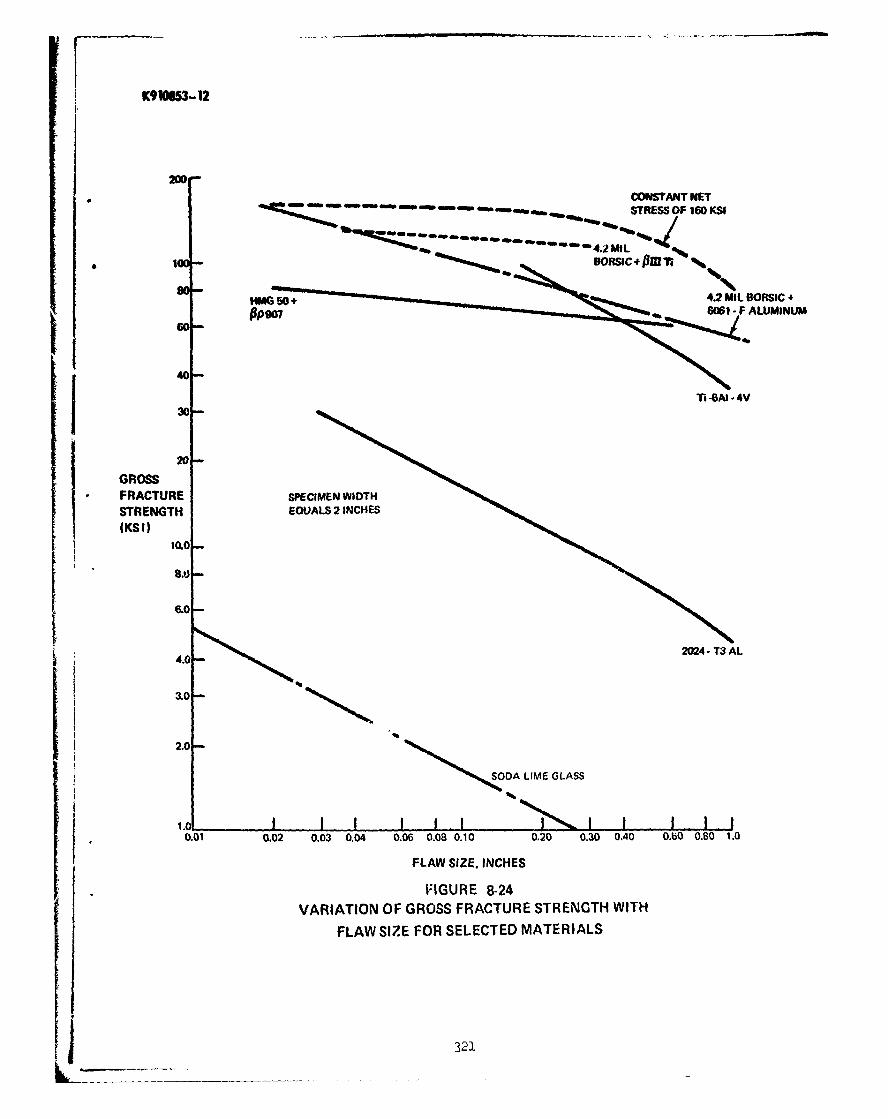
K9101S-12
200CONSTANT NET
- # m1 tft4ft STRESS OF 160 KSI
100 BOSI Pm r.
-- MG 50 + 4.2 MIL BORSIC +
40-
20-
GROSSFRACTURE SPECIMENWIDTH
STRENGTH EOUALS 2 INCHES(KSI)
10.0-
8.0-
6.0--6.0 2024 - T3 AL
4.03.0-
2.0
S*SODA LIME GLASS
0.01 0.02 0.03 0.04 0.06 0.08 0.10 0.20 0.30 0.40 0.0 0.B0 1.0
FLAW SIZE. INCHES
I'IGURE 8-24
VARIATION OF GROSS FRACTURE STRENGTH WITH
FLAW SIZE FOR SELECTED MATERIALS
321

Table VIII-I
Fracture Strength of LongitudinallyReinforced Center Notched BORSIC + Aluminum Composites
Initial Gross NetFlom Ult. Fracture Fracture
Spec. Width Thick. Length Load Stress StressTye ( (in.) (in.) ilkL (ksi) (ksi)
S 1.996 0.0483 0 14,900 155 155S 1.997 0.0502 0 13,900 139 139S 1.936 0.0232 0.020 5,610* 125* 126*S 2.020 0.0252 0.025 8,450 166 168S 1.936 o.048o 0.025 11,820 127 129S 2.019 0.0535 0.027 14,600 143 145S 2.020 0.0535 0.037 12,600 117 119s 2.026 0.0540 0.053 12,200 112 115S 2.018 0.0539 0.102 10,8oo 99.3 105S 0.949 0.0467 o.167 3,750 84.5 103s 0.967 0.0467 0.175 4,580 101 124S 2.012 0.0506 0.178 7,45o** 73.2** 8o.3**s 2.015 o.o485 0.185 7,950 81.3 89.6S 2.015 o.o492 0.278 7,200 72.6 84.3s 2.000 0.1516 0.372 20,625 68.0 83.6s 2.018 0.0522 0.408 7,150 67.9 85.1s 2.019 0.0967 0.570 11,700 59.9 83.5s 2.019 0.o5A4 0.580 16,ooo 53.5 75.3
s 2.017 0.0968 0.780 10,200 52.3 85.2S 1.996 0.0483 0.790 5,200 53.8 89.1
FS 2.002 0.0429 0 18,120 211 211FS 2.005 0.0426 0.021 13,820 162 164FS 0.989 0.0433 0.049 5,900 138 145FS 0.984 0.0433 0.165 4,575 107 129FS 2.001 0.0430 o.168 10,870 126 138
T 2.008 0.0501 0 16,6oo 165 A65T 2.013 0.0497 0 13,900 139 139T 1.978 0.0490 0.105 8,600 88.8 93.7T 1.987 0.0491 0.135 7,940 81.4 87.3T 2.012 0.0478 0.178 7,500 78.0 85.5T 2.014 o.o464 0.178 7,750 82.9 91.1T 1.999 0.0485 0.278 7,800 80.5 93.4T 1.998 0.0477 0.392 6,4oo 67.2 83.5T 2.012 O.O46o 0.575 5,100 55.1 77.2T 1.998 0.o486 0.602 5,500 56.6 81.1T 1.997 0.0472 0.788 5,400 57.3 94.6
S Specimens are 4.2 mil BORSIC + 6061F matrixT Specimens are 4.2 mil 3ORSIC + 2024F matrixFS Specimens are 5.7 mil BORSIC + 6061F matrix* Failed at grip** Interrupted test
322
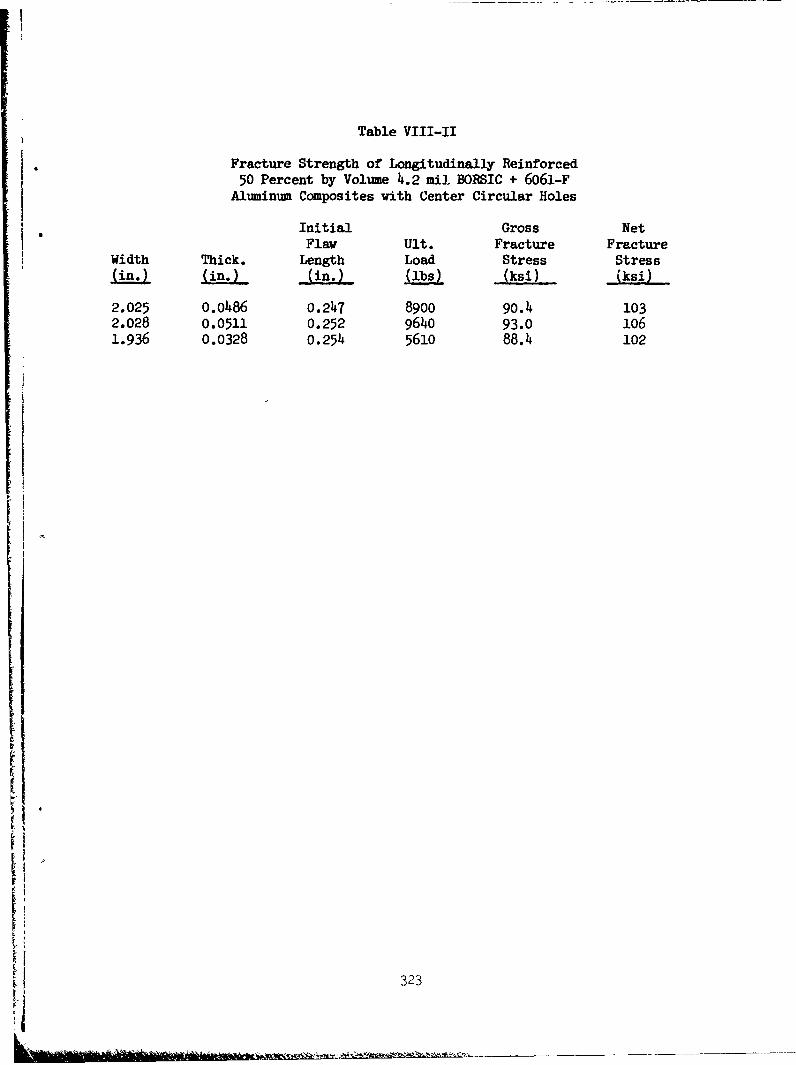
Table VIII-II
Fracture Strength of Longitudinally Reinforced50 Percent by Volume 4.2 mil BORSIC + 6061-F
Aluminum Composites with Center Circular Holes
Initial Gross NetFlaw Ult. Fracture Fracture
Width Thick. Length Load Stress Stress(in. (in.) (lbs) (ksi) (ksi)
2.025 0.0486 0.247 8900 90.4 1032.028 0.0511 0.252 9640 93.0 1061.936 0.0328 0.254 5610 88.4 102
323
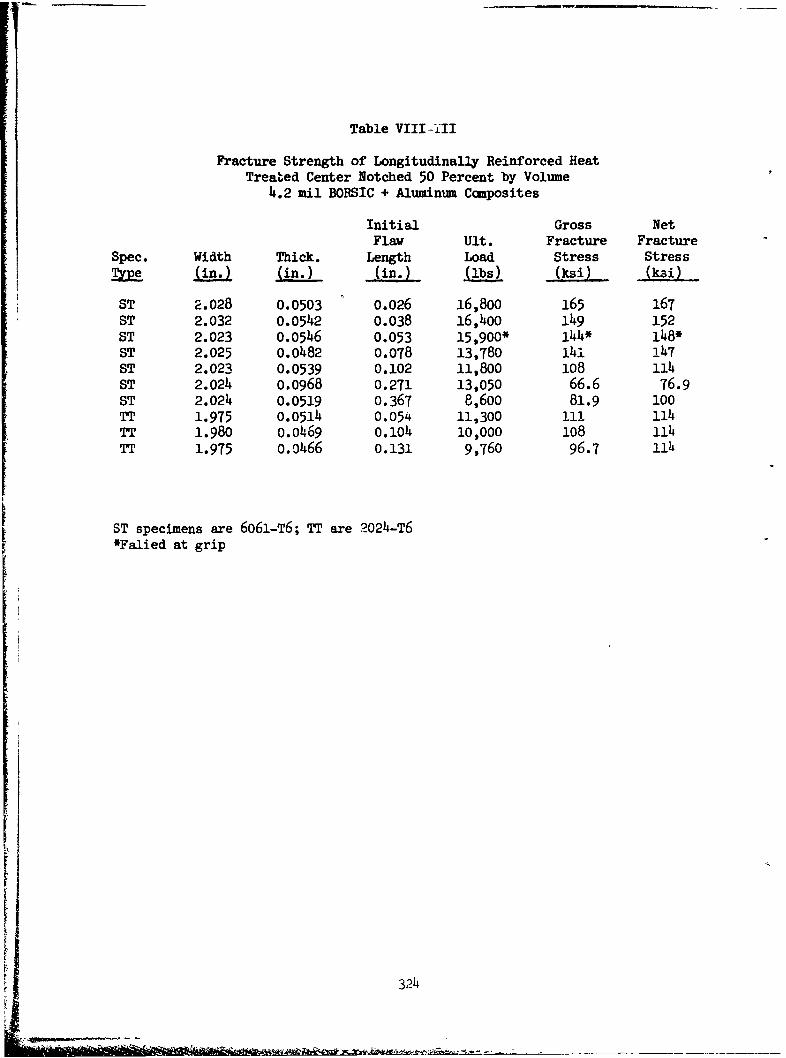
Table VIII-III
Fracture Strength of Longitudinally Reinforced HeatTreated Center Notched 50 Percent by Volume
4.2 mil BORSIC + Aluminum Composites
Initial Gross NetFlaw Ult. Fracture Fracture
Spec. Width Thick. Length Load Stress StressTi. ( (in.) (Ibs) (ksi) (ksi)
ST 2.028 0.0503 0.026 16,800 165 167ST 2.032 0.0542 0.038 16,400 149 152ST 2.023 0.0546 0.053 15,900* 144* 148*ST 2.025 0.0482 0.078 13,780 14i 147ST 2.023 0.0539 0.102 11,800 108 114ST 2.024 0.0968 0.271 13,050 66.6 76.9ST 2.024 0.0519 0.367 8,600 81.9 100TT 1.975 0.0514 0.054 11,300 11! 114TT 1.980 0.0469 0.104 10,000 108 114TT 1.975 o.o466 0.131 9,760 96.7 114
ST specimens are 6061-T6; TT are 2024-T6
*Falied at grip
324
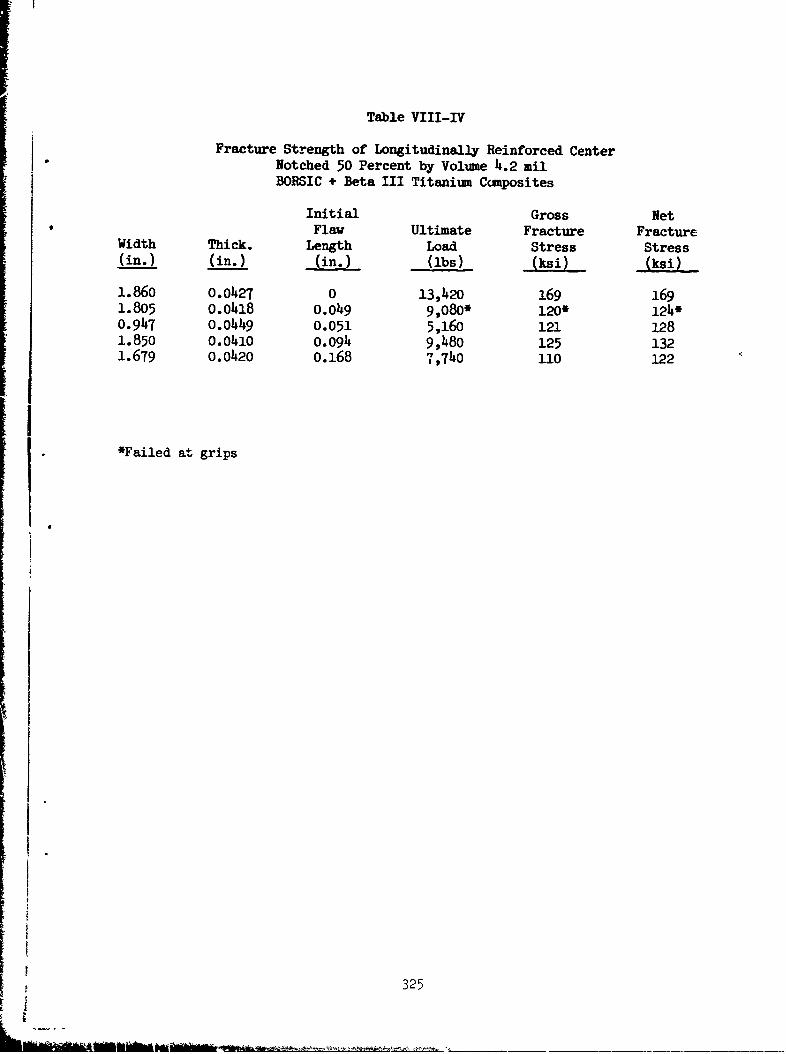
Table VIII-IV
Fracture Strength of Longitudinally Reinforced CenterNotched 50 Percent by Volume 4.2 railBORSIC + Beta III Titanium Composites
Initial Gross NetFlaw Ultimate Fracture Fracture
Width Thick. Length Load Stress Stress(in.) (in.) (in.) (ibs) (ksi) (ksi)
1.860 0.0427 0 13,420 169 1691.805 0.0m418 O.O49 9,080* 120* 124*0.947 0.0449 0.051 5,16o 121 1281.850 0.0410 o.o94 9,48o 125 1321.679 0.0o420 o.168 7,740o 110 122
*Failed at grips
325

Table VIII-V
Fracture Strength of Longitudinally Reinforced CenterNotched 50 Percent by Vol'ne HMG-50Graphite + BP-907 Epoxy Composites
Initial GrossFlaw Ultimate Fracture Fracture
Width Thick. Length Load Strength Strength
Skn.) (in.) (in.) (lbs) (ksi) (ksi)
2.001 0.0682 0 11,205 83.2 83.21.992 0.0720 0 15,630 109 1092.000 0.0690 0.021 13,160 95.4 96.42.000 0.0712 0.054 8,900 62.5 614.21.979 0.07o4 0.080 10,89o 75.1 78.22.000 O.0671 0.109 10,080 75.1 79.141.998 0.0753 0.199 9,700 614.5 71.61.979 0.0701 0.595 8,1!60" 59.0 814.3
326
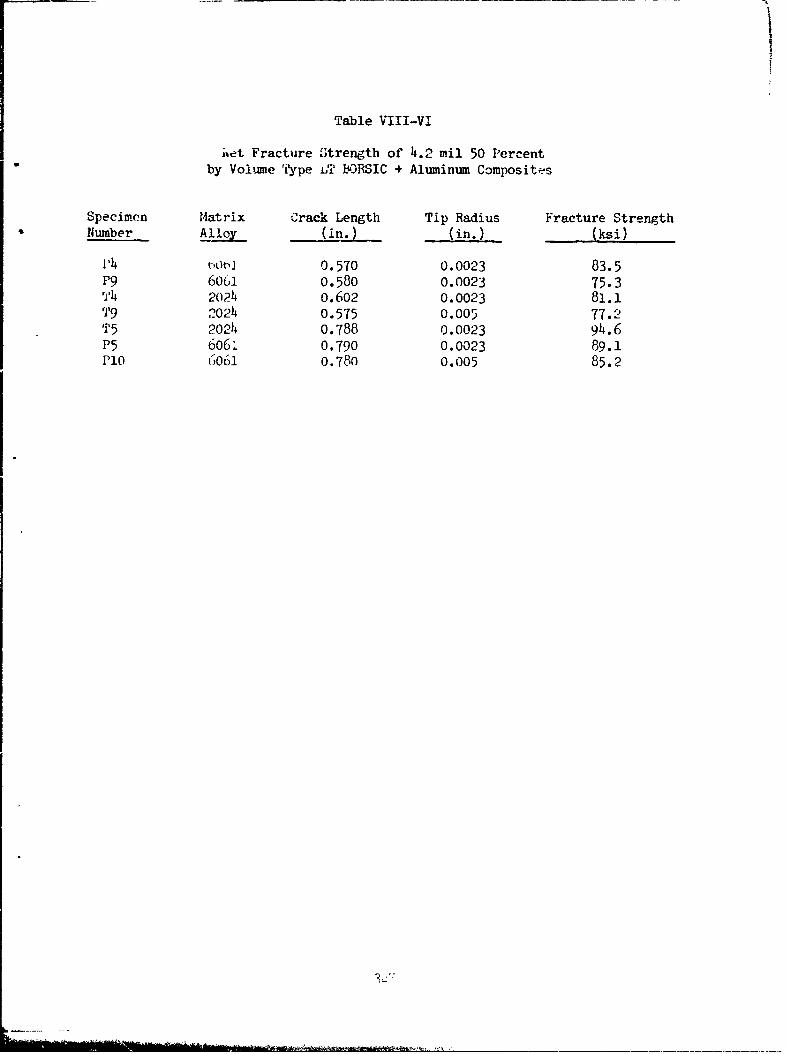
Table VIII-VI
inet Fracture Strength of 4.2 mil 50 Percentby Volume TPype ilT ' ORSIC + Aluminum Composites
Specimen Matrix Crack Length Tip Radius Fracture Strength
Number Alloy (in.) (in.) (ksi)
i,4 W,014 0.570 0.0023 83.5P9 6061 0.580 0.0023 75.3A 2024 o.602 0.0023 81.1T9 2024 0.575 0.005 77.2T5 2024 0.788 0.0023 94.6P5 6M6. 0.790 0.0023 89.1PO 6o61 o0.780 0.005 85.2

Table VIII-VII
Longitudinal Tensile Properties of 50 VolumePercent 4.2 mril BORSIC + Beta III Titanium
Width Thickness UTS EliSpecimen, (in) (in.) (ksi) (106 psi) V12
H-1 0.399 o,044 168 36.5 0.26H-2 O.1•l 0.044 164 2.6 0.25H-3 O.400 O.0o44 167 33.5 0.26H-4 O.40Ol 0.039 192 37.0 0.26F-2 0.398 O.0•48 163 33.6 0.25
3
328
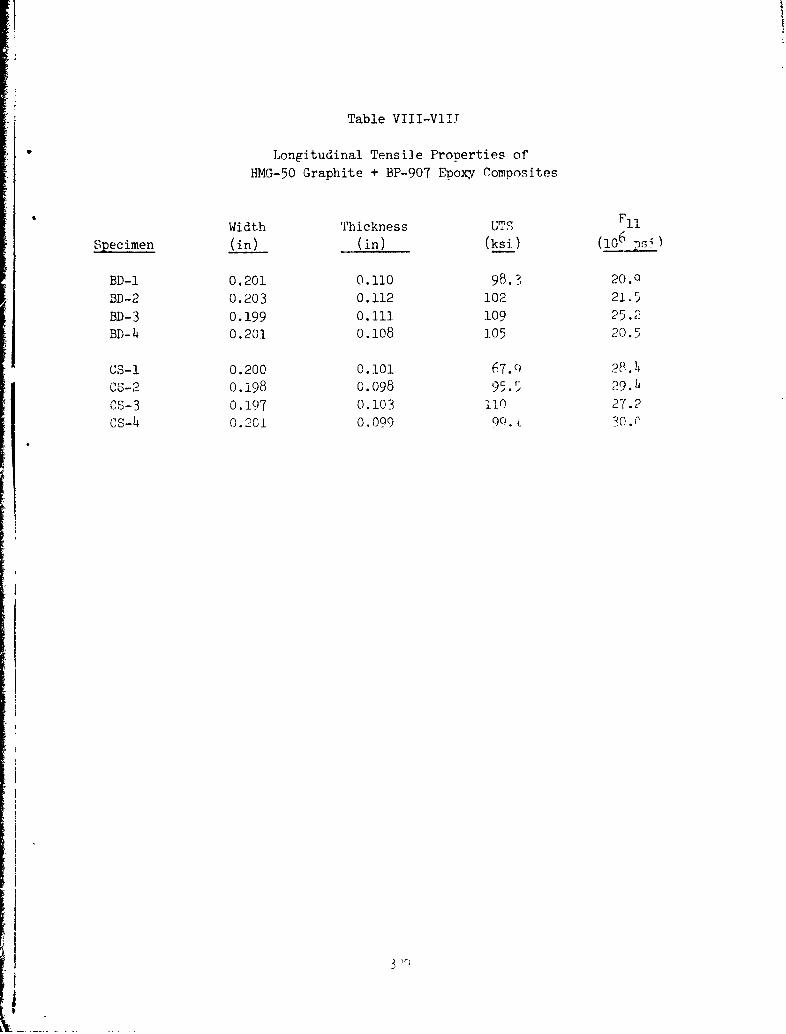
Table VIII-VlITr
Longitudinal Tensile Properties of
HMG-50 Graphite + BP-907 Epoxy Composites
Width Thickness UrS FII
Specimen (in) (in) (ksi) (1 00 *sj ]
BD-I 0.201 0.110 98.?• 20.0
BD-2 0.203 0.112 102 21.5
BD-3 0.199 0.111 109 25.2BD-4 0.201 0.108 105 20.5
CS-I 0.200 0.101 67.C) 28.L4
CS-2 0.198 0.098 95.5 29.14
CS-3 0.197 0.103 110 27.2
CS-4 0.201 0.099 90. C .
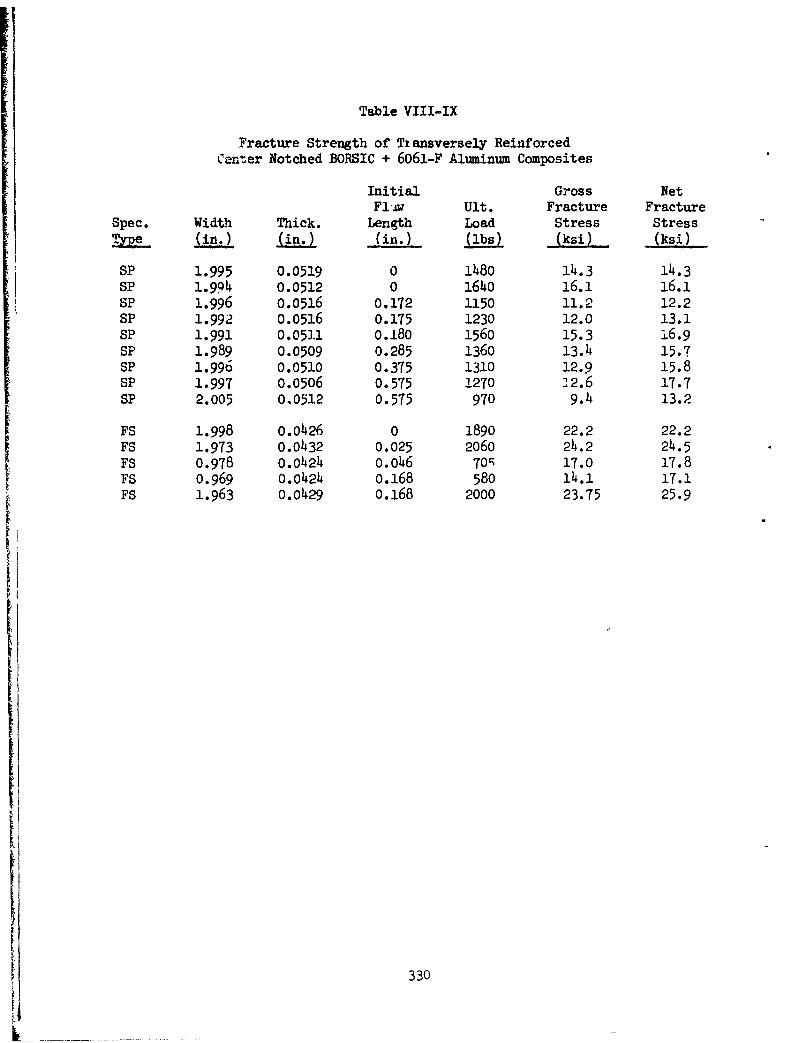
Table VIII-IX
Fracture Strength of Ti ansversely ReinforcedCiener Notched BORSIC + 6061-F Aluminum Composites
Initial Gross NetFl-xw Ult. Fracture Fracture
Spec. Width Thick. Length Load Stress Stress
In (i96.) (in.) L (lbs) ki (ksi)
SP 1.995 0.0519 0 1480 14.3 14.3SP 1.994 0.0512 0 1640 16.1 16aSP 1.996 0.0516 0.172 1150 11.2 12.2SP 1.992 0.0516 0.175 1230 12.0 13.1SP 1.991 0.0511 o.18o 1560 15.3 A6.9SP 1.989 0.0509 0.285 1360 13.4 15.7SP 1.996 0.0510 0.375 1310 12.9 15.8SP 1.997 0.0506 0.575 1270 J2.6 17.7SP 2.005 0.0512 0.575 970 9.4 13.2
FS 1.998 0.0426 0 1890 22.2 22.2
FS 1.973 0.0432 0.025 2060 24.2 24.5FS 0.978 0.0424 0.046 70; 17.0 17.8FS 0.969 0.0424 0.168 580 14.1 17.1FS 1.963 0.0429 0.168 2000 23.75 25.9
330

Table VIII-X
Elastic Stress Concentration Factors for0.100 Inch Elliptical Flaws in Fiber
Reinforced Composite Systems
Max SCFSystem Tip Radius Kxx Ky Kyy
BORSIC + Beta III Titanium 0.0025 11.58 -2.99 1.91
BORSIC + Aluminum 0.0025 12.13 -2.97 1.81
HMG-50 Graphite + BP-907 Epoxy 0.0025 28.39 -2.67 0.73
BORSIC + Beta III Titanium 0.005 8.49 - 2 .17 1.36
BORSIC + Aiuminum 0.030 4.21 -0.99 0.5q
HMG-50 Graphite + BP-907 Epoxy 0.003 26.01 -2.44 0.67
BORSIC + Aluminum 0.050 3.49 -0.81 0.44
331