Mediterranean summer air temperature variability and its connection to the large-scale atmospheric...
17
Mediterranean summer air temperature variability and its connection to the large-scale atmospheric circulation and SSTs Received: 27 August 2002 / Accepted: 13 December 2002 / Published online: 13 March 2003 Ó Springer-Verlag 2003 Abstract The interannual and decadal variability of summer (June to September) air temperature over the Mediterranean area is analyzed for the period 1950 to 1999. The combined influence of the large-scale atmo- spheric circulation at different levels and thermic pre- dictors (thickness patterns and Mediterranean SSTs) on station temperature data is assessed by means of optimal objective techniques. The validity of the statistical models has been evaluated through cross-validation. Three large-scale predictor fields (300 hPa geopotential height, 700–1000 hPa thickness and SSTs) account for more than 50% of the total summer temperature vari- ability. The positive phase of the first canonical mode is associated with blocking conditions, subsidence and stability related to warm Mediterranean summers. The second CCA mode shows an east–west dipole of the Mediterranean summer air temperature connected by a combination of a trough as well as an extended ridge over the western and eastern parts of the Mediterranean, respectively. Though both modes are found to contrib- ute to long-term summer temperature trends in the 1950–1999 period, it is shown that the first canonical mode is mainly responsible for the 0.4 °C warming (significant at the 95% level) over the last 50 years of the twentieth century. Further, the analysis reveals that the Mediterranean summer temperatures were higher in the 1860s, 1950s and 1990s and lower around 1910 and in the 1970s. A significant temperature increase of 0.5 °C (0.27 °C) is found for the 1900–1999 (1850–1999) period. 1 Introduction Ecological systems, human health and socio-economic sectors, all of which are vital for sustainable develop- ment, are sensitive to climate change (Watson et al. 1997). Quantifying and understanding climatic changes at the regional scale is one of the most important and uncertain issues within the global change debate. Until the present, projections of regional climate changes for the twenty first century have been based on coupled atmosphere–ocean general circulation model (AOGCM) simulations of the climate system response to changes in anthropogenic forcings (e.g. Kattenberg et al. 1996; Cubasch et al. 2001). A step towards the understanding of regional climatic changes and impacts is the assessment of the charac- teristics of natural climate variability and of the AOGCM performance in reproducing it (Giorgi 2002a,b). Climate variability can mask man-made forced signals, so that a characterization of the natural vari- ability is necessary to evaluate the intensity of the forced change signal. A large number of previous studies described trends and variability through a wide range of scales, from the global to the local (e.g. Nicholls et al. 1996; Jones et al. 1999; Easterling et al. 2000; Hansen et al. 2001, 2002; Folland et al. 2001; New et al. 2001). The structure of climate series can differ considerably across regions and locations showing variability at a range of scales in re- sponse to changes in the direct radiative forcing and variations in internal modes of the climate system (New et al. 2001; Hansen et al. 2001; Giorgi 2002a). Mediterranean climate constitutes an issue of partic- ular concern within the context of regional climate Climate Dynamics (2003) 20: 723–739 DOI 10.1007/s00382-003-0304-x E. Xoplaki J. F. Gonza´lez-Rouco J. Luterbacher H. Wanner E. Xoplaki (&) J. Luterbacher H. Wanner Institute of Geography, University of Bern, Hallerstrasse 12, 3012 Bern, Switzerland E-mail: [email protected] E. Xoplaki Department of Meteorology and Climatology, University of Thessaloniki, Greece J. F. Gonza´lez-Rouco Departamento de Astrofı´sica y Ciencias de la Atmo´sfera, Universidad Complutense de Madrid, Spain J. Luterbacher H. Wanner NCCR Climate, University of Bern, Switzerland
-
Upload
uni-giessen -
Category
Documents
-
view
0 -
download
0
Transcript of Mediterranean summer air temperature variability and its connection to the large-scale atmospheric...

Mediterranean summer air temperature variability and its connectionto the large-scale atmospheric circulation and SSTs
Received: 27 August 2002 / Accepted: 13 December 2002 / Published online: 13 March 2003� Springer-Verlag 2003
Abstract The interannual and decadal variability ofsummer (June to September) air temperature over theMediterranean area is analyzed for the period 1950 to1999. The combined influence of the large-scale atmo-spheric circulation at different levels and thermic pre-dictors (thickness patterns and Mediterranean SSTs) onstation temperature data is assessed by means of optimalobjective techniques. The validity of the statisticalmodels has been evaluated through cross-validation.Three large-scale predictor fields (300 hPa geopotentialheight, 700–1000 hPa thickness and SSTs) account formore than 50% of the total summer temperature vari-ability. The positive phase of the first canonical mode isassociated with blocking conditions, subsidence andstability related to warm Mediterranean summers. Thesecond CCA mode shows an east–west dipole of theMediterranean summer air temperature connected by acombination of a trough as well as an extended ridgeover the western and eastern parts of the Mediterranean,respectively. Though both modes are found to contrib-ute to long-term summer temperature trends in the1950–1999 period, it is shown that the first canonicalmode is mainly responsible for the 0.4 �C warming(significant at the 95% level) over the last 50 years of thetwentieth century. Further, the analysis reveals thatthe Mediterranean summer temperatures were higher in
the 1860s, 1950s and 1990s and lower around 1910 andin the 1970s. A significant temperature increase of 0.5 �C(0.27 �C) is found for the 1900–1999 (1850–1999) period.
1 Introduction
Ecological systems, human health and socio-economicsectors, all of which are vital for sustainable develop-ment, are sensitive to climate change (Watson et al.1997). Quantifying and understanding climatic changesat the regional scale is one of the most important anduncertain issues within the global change debate. Untilthe present, projections of regional climate changes forthe twenty first century have been based on coupledatmosphere–ocean general circulation model (AOGCM)simulations of the climate system response to changes inanthropogenic forcings (e.g. Kattenberg et al. 1996;Cubasch et al. 2001).
A step towards the understanding of regional climaticchanges and impacts is the assessment of the charac-teristics of natural climate variability and of theAOGCM performance in reproducing it (Giorgi2002a,b). Climate variability can mask man-made forcedsignals, so that a characterization of the natural vari-ability is necessary to evaluate the intensity of the forcedchange signal.
A large number of previous studies described trendsand variability through a wide range of scales, from theglobal to the local (e.g. Nicholls et al. 1996; Jones et al.1999; Easterling et al. 2000; Hansen et al. 2001, 2002;Folland et al. 2001; New et al. 2001). The structure ofclimate series can differ considerably across regions andlocations showing variability at a range of scales in re-sponse to changes in the direct radiative forcing andvariations in internal modes of the climate system (Newet al. 2001; Hansen et al. 2001; Giorgi 2002a).
Mediterranean climate constitutes an issue of partic-ular concern within the context of regional climate
Climate Dynamics (2003) 20: 723–739DOI 10.1007/s00382-003-0304-x
E. Xoplaki Æ J. F. Gonzalez-Rouco Æ J. LuterbacherH. Wanner
E. Xoplaki (&) Æ J. Luterbacher Æ H. WannerInstitute of Geography,University of Bern, Hallerstrasse 12,3012 Bern, SwitzerlandE-mail: [email protected]
E. XoplakiDepartment of Meteorology and Climatology,University of Thessaloniki, Greece
J. F. Gonzalez-RoucoDepartamento de Astrofısica y Ciencias de la Atmosfera,Universidad Complutense de Madrid, Spain
J. Luterbacher Æ H. WannerNCCR Climate, University of Bern,Switzerland

variability and change. The IPCC (2001) has shown thathigher maximum temperatures and more hot days arelikely to increase in frequency during the twenty firstcentury. Over the last few decades, extended heat wavesand droughts appear to have become more frequent inthe Mediterranean (IPCC 2001). These can have disas-trous consequences on natural ecosystems and severalaspects of society like health or economic wealth: heatwaves cause rises in the death rate, especially in urbanareas (e.g. July/August 1983, July 1987, 1988 in Greece,1998 in Cyprus, Katsouyanni et al. 1988, 1993; Giles andBalafoutis 1990; Giles et al. 1990; Matzarakis andMayer 1991, 1997; Perry 2001); soil degradation mayforce migration, an issue of great concern particularly inthe southern Mediterranean area; prolonged droughtsand water supply problems and fires might weakentourist inflows to the Mediterranean (Kundzewicz et al.2001; Tsiourtis 2001). The extent and severity of deser-tification, water shortage and water quality, food secu-rity, risks in public health, sensitivity of valuableecosystems and indirect effects on national economiesare some of the topics indicating the vulnerability of theMediterranean basin to climate variability.
Fluctuations and changes in atmospheric circulationare important elements of the climate. Namias (1948)was among the first to state that the mean monthlygeopotential height fields for mid tropospheric levelsdetermine monthly air temperature anomalies. There-fore, advective processes exerted by the atmosphericcirculation are a crucial factor controlling the regionalair temperature changes (e.g. Trenberth 1990, 1995; Xu1993; Hurrell 1995; Hurrell and van Loon 1997; Slono-sky et al. 2001; Xoplaki et al. 2000, 2002; Jacobeit et al.2001; Pozo-Vazquez et al. 2001; Slonosky and Yiou2002; Xoplaki 2002).
The Mediterranean basin and the surrounding landsare influenced by some of the most relevant mechanismsacting upon the global climate system. It marks a tran-sitional zone between the deserts of North Africa situ-ated within the arid zone of the subtropical high andCentral and Northern Europe affected by the westerlyflow during the whole year. In addition, the Mediterra-nean climate is exposed to the South Asian Monsoon insummer, the Siberian High Pressure System in winter,the El Nino Southern Oscillation and the North AtlanticOscillation (e.g. Corte-Real et al. 1995; Maheras 2000;Ribera et al. 2000). The main physical and geographicalfactors controlling the spatial distribution of the climaticconditions over the Mediterranean are the atmosphericcirculation, the latitude, the altitude and generally theorography, the land–sea interactions (distance from thesea) and smaller scale processes (Lolis et al. 1999; Xo-plaki et al. 2000; Xoplaki 2002). The size, position, andconfiguration of the Mediterranean produce a variety oflocal modifications that ranges from desert to humidmountain climates.
Mediterranean climate is also influenced by thealmost enclosed Mediterranean Sea itself. It representsan important source of energy and moisture for cyclone
development and its complex land topography plays acrucial role in steering air flow (Bartzokas et al. 1994;Trigo et al. 1999; Maheras et al. 2001).
Mediterranean summers are warm and mostly dry in alarge part of the basin. This can be mainly attributed to astrong high pressure ridge extending from theAzores sub-tropical high. Over Egypt, this ridge is displaced south-ward by a trough extending northwest from the ArabianGulf towards Greece, which is associated with the Indiansummer monsoon depression (Palutikof et al. 1996).
Giorgi (2002a) analyzed the winter, summer andyearly air temperature variability and trends over thelarger Mediterranean land-area (averaged over the gridpoints 30�N–48�N and 20�W–40E) for the period 1901–1998 based on the gridded (0.5�·0.5� latitude–longitude)data set of New et al. (1999, 2000). He found a statis-tically significant annual warming trend over the largerMediterranean land-area of around 0.75 �C (1901–1998), mostly from contributions in the early and latedecades of the century. Slightly higher values were ob-tained for winter and summer. This is in agreement withthe findings of the IPCC (Folland et al. 2001). Based onthe same gridded data (New et al. 1999, 2000), Jacobeit(2000) found a significant overall summer warming overthe entire Mediterranean for the period 1969–1998.
It has also been proposed that sea surface tempera-ture (SST) anomalies govern, at least partly, precipita-tion and air temperature anomalies in neighboringcontinental regions (Hunt and Gordon 1988; Zorita et al.1992; Reddaway and Bigg 1996; Rimbu et al. 2001;Xoplaki 2002; Xoplaki et al. 2002). In addition, there arestrong indications that fluctuations in SST, and hencefluctuations of surface fluxes, are intimately involved indecadal-scale climate variability (Trigo et al. 2000).
Many studies have been published relating changes inMediterranean air temperature regimes to the large-scaleatmospheric circulation (Corte-Real et al. 1995, 1998;Reddaway and Bigg 1996; Hurrell and van Loon 1997;Kutiel and Maheras 1998; Maheras et al. 1999; Saenzet al. 2001; Kutiel and Benaroch 2002; Xoplaki 2002;Xoplaki et al. 2002). Parts of these papers have evalu-ated the fraction of air temperature variability explainedby major sea level pressure (SLP) and/or upper-air large-scale anomalies. Other studies analyzed the air temper-ature variability patterns over a specific geographicalarea in the Mediterranean and identified the surface andupper-air large-scale anomalies such as the NorthAtlantic Oscillation, the Eastern Atlantic pattern, theScandinavian pattern, the Eurasian pattern (Barnstonand Livezey 1987) and the El Nino Southern Oscillation.
To determine the cause of the observed changes inMediterranean air temperature over the last few decadesneeds improved understanding of the origin of theatmospheric circulation changes as well as the influenceof the state of the SSTs. Instead of relating one singlefield to explain spatial climate variability, it is moreappropriate to combine information from various large-scale climate fields in order to account for strongerrelations and a higher amount of air temperature and
724 Xoplaki et al.: Mediterranean summer air temperature variability and its connection
precipitation variability over a given area. Xoplaki et al.(2002) showed that the combination of eight large-scalepredictor fields including SLP, geopotential height fieldsat different levels, thickness and Mediterranean SSTfields explain more of the total summer air temperaturevariability over Greece and western Turkey than using asingle field alone.
In this study, we extend our analysis over the entireMediterranean to improve our understanding of inter-annual and decadal variability of Mediterranean sum-mer air temperature for the period 1950–1999. Thesimultaneous relationship between the combined infor-mation of large-scale atmospheric circulation at variouslevels and SSTs is directly assessed with an optimalmethodology. Hundreds of series of monthly surface airtemperature measurements, quality checked and ho-mogenized, will be used in combination with reanalysisdata and SST fields.
In Sects. 2 and 3, the data sets and the multivariatemethods are briefly described. Section 4 includes theresults related to the combined information of large-scale anomaly fields of SLP, geopotential height fields,thickness patterns and SSTs to Mediterranean summerair temperature through canonical correlation analysis(CCA) in the empirical orthogonal function (EOF)space. The discussion and the conclusions are presentedin Sects. 5 and 6, respectively.
2 Data
The following data sets have been used in this study: (1) gridded(2.5�·2.5� latitude–longitude resolution) SLP data, geopotentialheights at different levels (1000 hPa, 850 hPa, 700 hPa, 500 hPaand 300 hPa) and gridded (T62 Gaussian grid) air temperature at2 m height were taken from the NCEP/NCAR reanalysis data sets(Kalnay et al. 1996; Kistler et al. 2001). Monthly mean values werecomputed from the 6-hourly data. Thickness fields (300–500 hPa;500–700 hPa and 1000–700 hPa) were derived from the corre-sponding geopotential height data. The monthly SST data weretaken from the Global Sea Ice Surface Temperature, version 2.3b(GISST2; spatial resolution is 1�·1� latitude–longitude) dataset(Rayner et al. 1996, updated). (2) Monthly station series of airtemperature for the area 25�–48�N and 10�W–45�E including 30
countries along or close to the Mediterranean Sea were collectedand digitized. The data were obtained mainly from the variousNational Meteorological services or other official institutions. Forcountries that did not provide any data, the GHCN (Global His-torical Climatology Network) version 2 air temperature data havebeen used, which are extensively quality controlled (Vose et al.1992; Peterson and Vose 1997; Peterson et al. 1998; for a detaileddiscussion of the GHCN v2 data the reader is referred to: http://cdiac.esd.ornl.gov/ghcn/ghcn.html#over2).
From 1901 to the end of the 1940s the Mediterranean areas arecharacterized by poor station coverage, especially over NorthernAfrica and the eastern basin. Around 1950 there is a sharp increasein the number of stations, which were mainly due to the inclusionof the 1951–1960 version of the World Weather Records dataset inthe World Monthly Surface Station Climatology (Dai et al. 1997)Therefore, the analysis is restricted to the 50 year period 1950–1999with a spatially homogeneous station distribution of 247 air tem-perature series over the larger Mediterranean area.
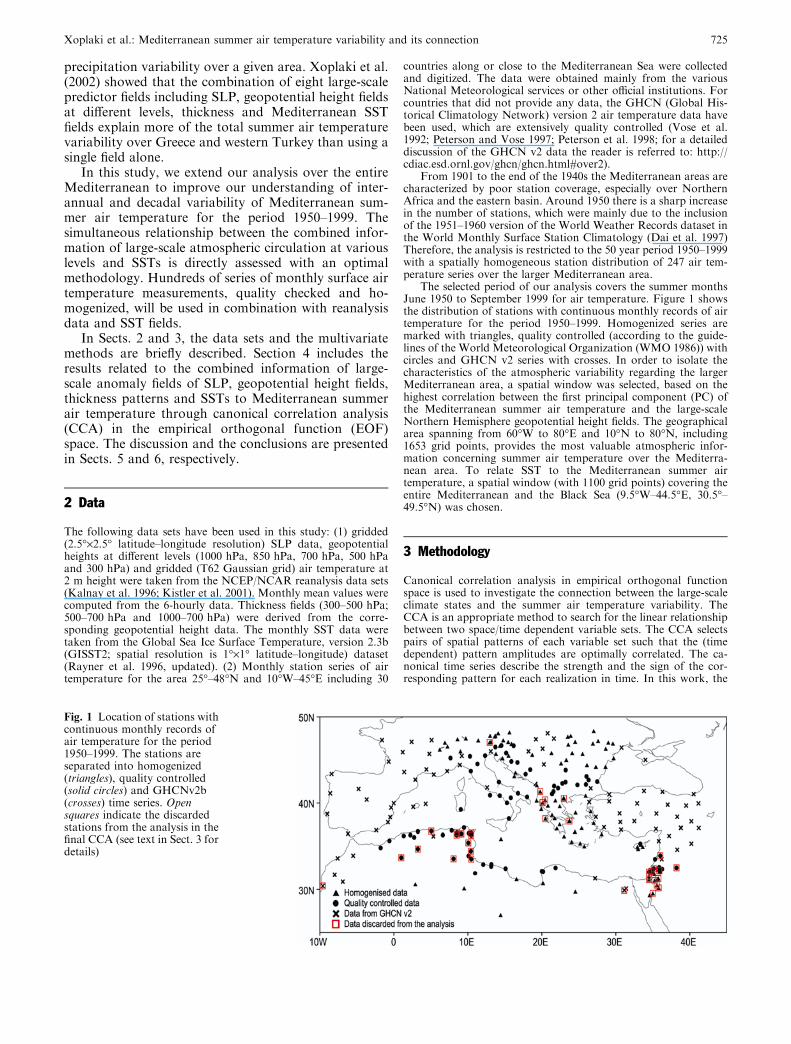
The selected period of our analysis covers the summer monthsJune 1950 to September 1999 for air temperature. Figure 1 showsthe distribution of stations with continuous monthly records of airtemperature for the period 1950–1999. Homogenized series aremarked with triangles, quality controlled (according to the guide-lines of the World Meteorological Organization (WMO 1986)) withcircles and GHCN v2 series with crosses. In order to isolate thecharacteristics of the atmospheric variability regarding the largerMediterranean area, a spatial window was selected, based on thehighest correlation between the first principal component (PC) ofthe Mediterranean summer air temperature and the large-scaleNorthern Hemisphere geopotential height fields. The geographicalarea spanning from 60�W to 80�E and 10�N to 80�N, including1653 grid points, provides the most valuable atmospheric infor-mation concerning summer air temperature over the Mediterra-nean area. To relate SST to the Mediterranean summer airtemperature, a spatial window (with 1100 grid points) covering theentire Mediterranean and the Black Sea (9.5�W–44.5�E, 30.5�–49.5�N) was chosen.
3 Methodology
Canonical correlation analysis in empirical orthogonal functionspace is used to investigate the connection between the large-scaleclimate states and the summer air temperature variability. TheCCA is an appropriate method to search for the linear relationshipbetween two space/time dependent variable sets. The CCA selectspairs of spatial patterns of each variable set such that the (timedependent) pattern amplitudes are optimally correlated. The ca-nonical time series describe the strength and the sign of the cor-responding pattern for each realization in time. In this work, the
Fig. 1 Location of stations withcontinuous monthly records ofair temperature for the period1950–1999. The stations areseparated into homogenized(triangles), quality controlled(solid circles) and GHCNv2b(crosses) time series. Opensquares indicate the discardedstations from the analysis in thefinal CCA (see text in Sect. 3 fordetails)
Xoplaki et al.: Mediterranean summer air temperature variability and its connection 725

canonical series are normalized to unit variance and the canonicalcorrelation vectors (patterns) represent typical anomalies in theunits of the variable respect to its mean state. The correlation be-tween the canonical series measures the degree of association be-tween the canonical patterns of predictor and predictand variables.Before CCA, the original data are usually projected onto theirEOFs retaining only a limited number of them, accounting formost of the total variance and avoiding noise.
The advantages of using data in EOF space can be summarizedas the independence of the data (orthogonal functions), the possi-bility to retain a certain number of EOFs for the subsequent CCAand the reduction of the problem’s dimensionality. Discarding toomany EOFs could lead us to exclude part of the significant signaland consequently to a poorer prediction of the overall CCA model.On the other hand, retaining too many EOFs could lead to anoverfit of the statistical models to the particular data sets and pe-riod considered, most likely missing an adequate description of theunderlying process.
During the model calibration step, the criterion was to select thenumber of eigenvectors for each predictor and predictand variable,which provided the best results in the cross validation process. Theselected PCs are used as input for the CCA analysis and the re-sulting canonical patterns are regressed with the original datasets toproduce the canonical components. The predictor and predictandcanonical patterns are used in the verification period to estimate theregional summer temperatures from the large-scale variables in asimilar manner to Zorita and von Storch (1999), Gonzalez-Roucoet al. (2000, 2001) and Xoplaki et al. (2002). No lead or lag rela-tionships were taken into consideration for this work, our analysiswas restricted to simultaneous connections between the differentfields and summer air temperature.
Similar CCA experiments as in Xoplaki et al. (2002) were per-formed though for the entire Mediterranean in two different ways:(1) nine CCA experiments relating each single predictor data (SLP,geopotential height, thickness and SST predictor fields) to summerair temperature and (2) CCA experiments (see later) with multi-component predictors.
The first approach allows us to study the relationship betweeneach large-scale variable and Mediterranean temperature. The sec-ond approach has the advantage of relating summer air temperaturesto the joint information from various atmospheric and SST fieldsallowing assessment of the improvement in predictability when sev-eral predictors are used simultaneously. In this case, in order toreduce the dimensionality of the problem, two EOF analyses wereapplied to the predictor fields. The first onewas used in order to selecta few of the first PCs of each of the original variables. The resultingcomponents were merged together and a second EOF analysis wasperformed on them to pick up the main modes of variation commonto all predictor fields as in Xoplaki et al. (2002). Finally, a number ofthe resulting predictor PCs was selected to perform the CCA incombination with the PCs of the predictand field.
Detailed discussion on the EOF and CCA methods can befound in Barnett and Preisendorfer (1987), Wilks (1995), vonStorch and Zwiers (1999), Livezey and Smith (1999a,b) and Smithand Livezey (1999).
3.1 The cross-validated CCA
Cross-validation is a statistical procedure used to reduce theproblem of artificial skill produced by the overfitting of randomvariability in small samples of data (Barnett and Preisendorfer1987; Michaelsen 1987; von Storch and Zwiers 1999). The proce-dure is nonparametric and can be applied to any automated modelbuilding technique. Cross-validation is a resampling technique,where the available data are repeatedly divided into validation andverification data subsets. In the model building procedure, a fewobservations are omitted and then the model is tested on theskipped observations. If n is the time length of the available datasets, cross-validation is carried out using calibration subsets oflength m and verification subsets of length n–m, the number ofpartitions being then n!/(m!)(n–m)! (Wilks 1995).
The cross-validation was applied by discarding four observa-tions (months) from the data set in each step and then predictingthem, based on the remaining data. This process was repeated foreach summer season in the 50-year record. The model is fitted tothe retained data (196 summer months) and used to make specifi-cation of the withheld data (von Storch and Zwiers 1999).
The performance of the statistical model was evaluated bycalculating the correlation (q) and the Brier skill score (b, Brier1950; Wilks 1995; von Storch and Zwiers 1999) between the pre-dicted and the raw data. The correlation provides a measure of timeconcordance in the series, while the Brier score allows for a measureof the explained variance by the model (Livezey 1995). The Brierskill score is a widely used accuracy gage of quality of probabilityforecast accuracy, usually in relation to climatology. It is conven-tionally described as the relative probability score comparedwith the probability score of a reference forecast. It is defined asb ¼ 1� S2
FP=S2P
� �where SFP
2 represents the variance of the error ofthe forecasts F to the reference predictands P and SP
2 stands for thevariance of the predictand variable. The last term is the ratio of theerror variance and the observations variance. Thus, the Brier skillscore with climatology as the reference is also the proportion ofexplained variance. Thus, for predictions with errors which vari-ance ranges on the order of the variance of the predictand, b will beclose to 0 or negative and for predictions with a small amount oferror, b tends to 1 (von Storch and Zwiers 1999). Negative pre-dictions would indicate that climatology may be a better forecastthan that tested.
For the calculation of the CCA experiments, a varying numberof EOFs and canonical components were selected for the predictorand predictand variables. The objective criterion used to retain theoptimal number of patterns was to select the EOFs and CCAs thatprovided the best results in terms of q and b during the validationprocess.
In order to improve the coherence between the predictor andpredictand fields as well as accounting for a maximum amount ofvariance of regional air temperature, we performed a screening andexcluded insignificant stations. The stations with non-significantcorrelation at the 99% level (r > = 0.18 with n = 200; serialcorrelation not included) between the cross-validated and the rawdata in at least six out of the nine predictor fields were omitted. TheCCA experiments have been re-performed with the reduced airtemperature (213) time series. The discarded air temperature sta-tions are indicated by open squares in Fig. 1.
As a first step before the EOF and CCA analyses, the annualcycle was removed from all station and grid point time series bysubtracting from each monthly value the respective month’s 1950–1999 long-term mean. In order to account for the latitudinal dis-tortions, each grid point of the large-scale field anomalies wasweighted by the square root of cosine of latitude (u) to ensure thatequal areas are afforded equal weight in the analysis (North et al.1982). The long-term stationarity of the time series is preserved forthe calculation of EOF and CCA through detrending the time serieswith a linear least square fit. Subsequently, eigenvectors (canonicalvectors) are obtained via diagonalization of the covariance (cross-correlation) matrix. Once the eigenvectors (canonical vectors) areavailable, the PCs (canonical series) can be obtained through re-gression (von Storch and Zwiers 1999) of the original not detrendeddataset with the eigenvectors (canonical vectors).
4 Results
Figure 2 presents the spatial and temporal characteris-tics of summer (JJAS) temperature over the Mediterra-nean between 1950 and 1999. For the purpose ofcomparison, observational data are plotted with NCEPreanalysis values (Kalnay et al. 1996; Kistler et al. 2001).Figure 2a, b shows the average and standard deviationpatterns at the 213 sites (colour shading) and in the
726 Xoplaki et al.: Mediterranean summer air temperature variability and its connection

reanalysis data (contours). The most extensive areas ofsummer high air temperatures up to 30–32 �C areover the desert areas of North Africa and the Near East.At the northernmost part of the area under consider-ation, the summer temperatures are approximately10 �C lower. Standard deviations reveal the oppositewith increasing variability from south to north, rangingfrom values of 1 �C in the southeast to 3 �C in thenorthern areas. In general, there is good agreement inthe behaviour of the observations and reanalysis data.Local discrepancies arise due to the higher resolution ofthe observations that present more spatial variability. In
this first approach, picturing the variability of the data,land–sea contrast appears as the main factor controllingthe mean and deviation of temperature over the regionunder investigation. The sharp gradients in the standarddeviation along the coastal areas are obvious in Fig. 2bpointing to the thermal moderating effect of the ocean.
Figure 2c depicts the monthly time evolution of thesummer temperature anomalies (land areas) overthe region, both for the observations (solid line) and thereanalysis data (dashed line). The coolest periods inthe Mediterranean were the 1960s and 1970s, with thecoolest year in 1976 and the warmest summers in 1994
Fig. 2a–c Spatial and temporalcharacteristics of theMediterranean summer (JJAS)temperature; 1950–1999.a Summer mean temperatureover the 213 Mediterraneansites (grey shading) and fromthe NCEP-reanalysis data(contours). b Summertemperature standard deviationover the Mediterranean stations(grey shades) and based on thereanalysis data (contours).c Mediterranean monthlysummer temperature anomalies(land areas) for theobservations (solid line) and thereanalysis data (dashed line)
Xoplaki et al.: Mediterranean summer air temperature variability and its connection 727
and 1999. Therefore, decadal variability during thisperiod reveals cooling in the 1950s and warming sincethe mid 1970s. The trend for the period 1950–1960 is–1.15 �C/decade and 0.5 �C/decade for the period 1980to 1999 (both trends evaluated on the observational dataand are significant at the 95% level, allowing for auto-correlation). The trend over the entire 50 years from1950–1999 is 0.08 �C/decade (statistically significant atthe 95% level, allowing for autocorrelation). Here too, agood agreement between observations and reanalysis isfound, pointing to a good quality in both datasets andthe robustness of the trends described.
4.1 CCA in EOF space
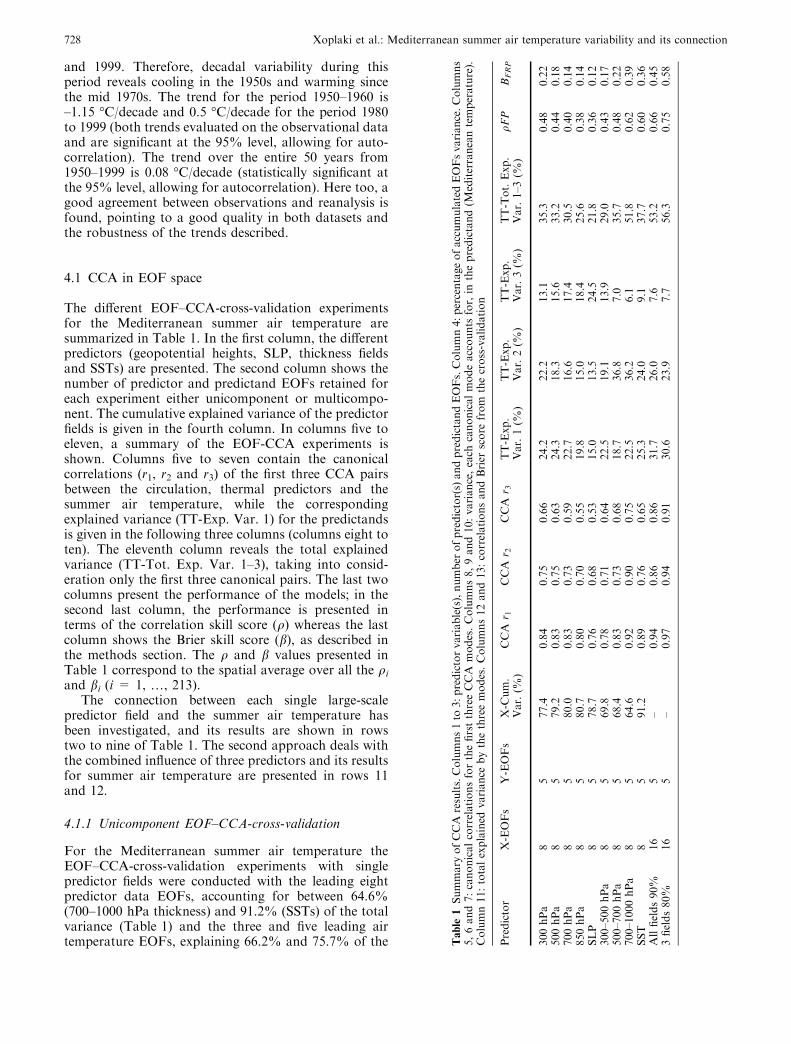
The different EOF–CCA-cross-validation experimentsfor the Mediterranean summer air temperature aresummarized in Table 1. In the first column, the differentpredictors (geopotential heights, SLP, thickness fieldsand SSTs) are presented. The second column shows thenumber of predictor and predictand EOFs retained foreach experiment either unicomponent or multicompo-nent. The cumulative explained variance of the predictorfields is given in the fourth column. In columns five toeleven, a summary of the EOF-CCA experiments isshown. Columns five to seven contain the canonicalcorrelations (r1, r2 and r3) of the first three CCA pairsbetween the circulation, thermal predictors and thesummer air temperature, while the correspondingexplained variance (TT-Exp. Var. 1) for the predictandsis given in the following three columns (columns eight toten). The eleventh column reveals the total explainedvariance (TT-Tot. Exp. Var. 1–3), taking into consid-eration only the first three canonical pairs. The last twocolumns present the performance of the models; in thesecond last column, the performance is presented interms of the correlation skill score (q) whereas the lastcolumn shows the Brier skill score (b), as described inthe methods section. The q and b values presented inTable 1 correspond to the spatial average over all the qi
and bi (i = 1, …, 213).The connection between each single large-scale
predictor field and the summer air temperature hasbeen investigated, and its results are shown in rowstwo to nine of Table 1. The second approach deals withthe combined influence of three predictors and its resultsfor summer air temperature are presented in rows 11and 12.
4.1.1 Unicomponent EOF–CCA-cross-validation
For the Mediterranean summer air temperature theEOF–CCA-cross-validation experiments with singlepredictor fields were conducted with the leading eightpredictor data EOFs, accounting for between 64.6%(700–1000 hPa thickness) and 91.2% (SSTs) of the totalvariance (Table 1) and the three and five leading airtemperature EOFs, explaining 66.2% and 75.7% of the T
able
1Summary
ofCCA
results.Columns1to
3:predictorvariable(s),number
ofpredictor(s)andpredictandEOFs.Column4:percentageofaccumulatedEOFsvariance.Columns
5,6and7:canonicalcorrelationsforthefirstthreeCCA
modes.Columns8,9and10:variance,each
canonicalmodeaccounts
for,in
thepredictand(M
editerraneantemperature).
Column11:totalexplained
variance
bythethreemodes.Columns12and13:correlationsandBrier
score
from
thecross-validation
Predictor
X-EOFs
Y-EOFs
X-C
um.
Var.(%
)CCA
r 1CCA
r 2CCA
r 3TT-Exp.
Var.1(%
)TT-Exp.
Var.2(%
)TT-Exp.
Var.3(%
)TT-Tot.Exp.
Var.1–3(%
)qF
PBFRP
300hPa
85
77.4
0.84
0.75
0.66
24.2
22.2
13.1
35.3
0.48
0.22
500hPa
85
79.2
0.83
0.75
0.63
24.3
18.3
15.6
33.2
0.44
0.18
700hPa
85
80.0
0.83
0.73
0.59
22.7
16.6
17.4
30.5
0.40
0.14
850hPa
85
80.7
0.80
0.70
0.55
19.8
15.0
18.4
25.6
0.38
0.14
SLP
85
78.7
0.76
0.68
0.53
15.0
13.5
24.5
21.8
0.36
0.12
300–500hPa
85
69.8
0.78
0.71
0.64
22.5
19.1
13.9
29.0
0.43
0.17
500–700hPa
85
68.4
0.83
0.73
0.68
18.7
36.8
7.0
35.7
0.48
0.22
700–1000hPa
85
64.6
0.92
0.90
0.75
22.5
36.2
6.1
51.8
0.62
0.39
SST
85
91.2
0.89
0.76
0.65
25.3
24.0
9.1
37.7
0.60
0.36
Allfields90%
16
5–
0.94
0.86
0.86
31.7
26.0
7.6
53.2
0.66
0.45
3fields80%
16
5–
0.97
0.94
0.91
30.6
23.9
7.7
56.3
0.75
0.58
728 Xoplaki et al.: Mediterranean summer air temperature variability and its connection

summer variability, respectively. The results containedin Table 1 refer to five retained summer air temperatureEOFs, with significantly better model performance thanthree EOFs.
According to the total explained variance of theMediterranean summer air temperature, the most skilfulcirculation predictors are the 300 hPa and 500 hPageopotential heights. The best thermic predictor is the700–1000 hPa thickness field followed by the Mediter-ranean SSTs. Atmospheric thickness and SSTs tend toperform better than circulation predictors do. Poorerperformance is obtained using the SLP as predictorvariable. Cross-validation (last two columns of Table 1)mostly confirms the behaviour of CCA1, with higher(lower) skill on the upper levels concerning the geopo-tential (thickness) fields.
4.1.2 Multicomponent CCA
Several CCA experiments with multicomponent predic-tor fields and temperature have been designed (Table 1).In the first EOF analysis of each predictor field, testswere made selecting 80%, 85% and 90% of variance. Inaddition, several experiments have been performed withvarying numbers of retained EOFs prior to the CCA.The best performance was obtained by selecting 80% ofvariance from each predictor field and retaining 16 PCsin the second EOF analysis of the predictor variables.For the summer temperature predictand variable, anumber of five PCs (77.5% variance) was retained be-fore performing the CCA.
The calculations with the Mediterranean summer airtemperature as predictand were applied with variousnumbers of EOFs for the large-scale and for the pre-dictand fields. Several experiments have been conductedwith the full set of the nine large-scale predictors.Compared to the unicomponent experiments, no sig-nificant gain has been obtained either in the totalexplained variance or in the model’s performance(Table 1, row 11). For this reason, we performed an-other experiment only with the three large-scale fields,explaining the highest amount of variability and withbest performance in the cross-validation procedure inthe unicomponent cases. Thus, the 300 hPa geopotentialheights field, the 700–1000 hPa thickness and the Med-iterranean SSTs have been selected as predictors, withconsiderable improvement of the model (Table 1, row12). Considerably higher values in the total explainedvariance of the Mediterranean summer air temperatureare achieved by applying the multicomponent CCA ex-periments. Moderate gain is obtained in the perfor-mance of the model (last two columns in Table 1). Morethan 50% of the Mediterranean summer air temperatureis explained by the three combined predictors.
The results of the multicomponent CCA experimentsincluding three predictor fields for summer temperatureare described in the following section with the aimof studying the interannual covariability betweenthe Mediterranean summer air temperature and the
combined large-scale circulation at different levels,thickness and SST fields during the period 1950–1999.
4.2 Maps of CCA results
The relationship between the interannual variability inthe three large-scale predictors with best performance inthe unicomponent CCA (300 hPa geopotential heights,700–1000 hPa thickness and Mediterranean SSTs) andMediterranean summer air temperatures is studied bymeans of multiple CCA in the EOF space. Canonicalseries and their associated spatial vectors for the leadingtwo modes are presented in Figs. 3 to 6. All the maps inthese figures are regression maps between the resultingcanonical series and the original fields, thus, anomaliesindicate realistic deviations in the physical units of eachvariable. These figures can be interpreted with the pre-sent sign configuration or with opposite sign both for thepatterns and the time series.
Figure 3 presents the results for the first canonicalmode using three large-scale predictors for local summerair temperature over the larger Mediterranean area. Inthe case of the three predictors 16 EOFs were retained;for the Mediterranean summer air temperature fiveEOFs were selected (see Table 1). The first CCA exhibitsa correlation between the multicomponent 300 hPageopotential height, 700–1000 hPa thickness, Mediter-ranean SST fields and the summer air temperature of0.97. CCA1 accounts for 30.6% of the summer tem-perature variability. The canonical component (Fig. 3)of the 300 hPa geopotential height field explains around4% of the total upper height variability. The spatialpattern shows strong positive anomalies centred overCentral Europe. A region of negative anomalies with itscentre over southeast Greenland extends to the north–east around the area of positive anomalies. The westernand central Mediterranean is dominated by this large-scale anomaly whereas the eastern Mediterranean is onlymarginally influenced.
The 700–1000 hPa thickness pattern indicates a sim-ilar structure as the 300 hPa geopotential height field,with a warm troposphere over much part of Europe andthe central and western Mediterranean. From Libya toTurkey and the entire Near East, there is evidence of acooler lower troposphere. The pattern accounts foraround 5% of the total large-scale summer thicknessvariability.
The SST anomaly pattern reveals a monopole patternwith positive (negative) values over the entire basin.Maximum departures are prevalent in the Ligurian Sea(northern Italy and southern France), the lowest valuesare found in the western basin and the Levant Sea. Thispattern accounts for around 28% of summer Mediter-ranean SST variability.
The summer surface air temperature pattern exhibitsa gradual decrease of positive anomalies from CentralEurope towards the eastern Mediterranean. Egyptand the Near East countries indicate slightly negative
Xoplaki et al.: Mediterranean summer air temperature variability and its connection 729
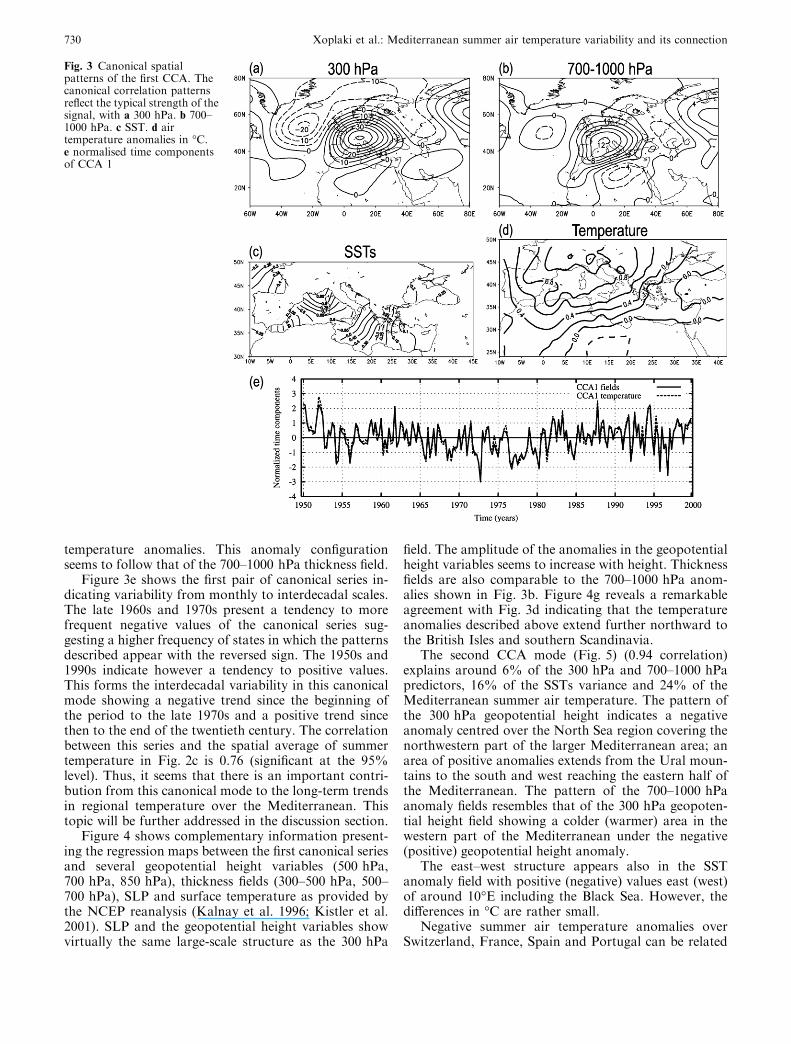
temperature anomalies. This anomaly configurationseems to follow that of the 700–1000 hPa thickness field.
Figure 3e shows the first pair of canonical series in-dicating variability from monthly to interdecadal scales.The late 1960s and 1970s present a tendency to morefrequent negative values of the canonical series sug-gesting a higher frequency of states in which the patternsdescribed appear with the reversed sign. The 1950s and1990s indicate however a tendency to positive values.This forms the interdecadal variability in this canonicalmode showing a negative trend since the beginning ofthe period to the late 1970s and a positive trend sincethen to the end of the twentieth century. The correlationbetween this series and the spatial average of summertemperature in Fig. 2c is 0.76 (significant at the 95%level). Thus, it seems that there is an important contri-bution from this canonical mode to the long-term trendsin regional temperature over the Mediterranean. Thistopic will be further addressed in the discussion section.
Figure 4 shows complementary information present-ing the regression maps between the first canonical seriesand several geopotential height variables (500 hPa,700 hPa, 850 hPa), thickness fields (300–500 hPa, 500–700 hPa), SLP and surface temperature as provided bythe NCEP reanalysis (Kalnay et al. 1996; Kistler et al.2001). SLP and the geopotential height variables showvirtually the same large-scale structure as the 300 hPa
field. The amplitude of the anomalies in the geopotentialheight variables seems to increase with height. Thicknessfields are also comparable to the 700–1000 hPa anom-alies shown in Fig. 3b. Figure 4g reveals a remarkableagreement with Fig. 3d indicating that the temperatureanomalies described above extend further northward tothe British Isles and southern Scandinavia.
The second CCA mode (Fig. 5) (0.94 correlation)explains around 6% of the 300 hPa and 700–1000 hPapredictors, 16% of the SSTs variance and 24% of theMediterranean summer air temperature. The pattern ofthe 300 hPa geopotential height indicates a negativeanomaly centred over the North Sea region covering thenorthwestern part of the larger Mediterranean area; anarea of positive anomalies extends from the Ural moun-tains to the south and west reaching the eastern half ofthe Mediterranean. The pattern of the 700–1000 hPaanomaly fields resembles that of the 300 hPa geopoten-tial height field showing a colder (warmer) area in thewestern part of the Mediterranean under the negative(positive) geopotential height anomaly.
The east–west structure appears also in the SSTanomaly field with positive (negative) values east (west)of around 10�E including the Black Sea. However, thedifferences in �C are rather small.
Negative summer air temperature anomalies overSwitzerland, France, Spain and Portugal can be related
Fig. 3 Canonical spatialpatterns of the first CCA. Thecanonical correlation patternsreflect the typical strength of thesignal, with a 300 hPa. b 700–1000 hPa. c SST. d airtemperature anomalies in �C.e normalised time componentsof CCA 1
730 Xoplaki et al.: Mediterranean summer air temperature variability and its connection

to the influence of the large-scale negative upper levelanomaly, a cooler lower troposphere and lower SSTsover the western Mediterranean. Over the majority ofthe larger Mediterranean area, warmer summer condi-tions are connected with an upper level ridge, a warmingwithin the first 3500 m and positive SSTs.
The second pair of canonical series (Fig. 5e) showsintense negative anomalies in the summers of 1976, 1983and 1989, and positive in 1952 and 1999. In general, it isapparent that there was a negative phase from the late1960s to the end of the 1970s and positive phases in the
1950s and 1990s. Thus, as in the case of the firstcanonical series there seems to be a contribution ondecadal and long-term variability from this canonicalmode. The correlation between this series and the spatialaverage of temperature in Fig. 2c is 0.58 (significant atthe 95% level).
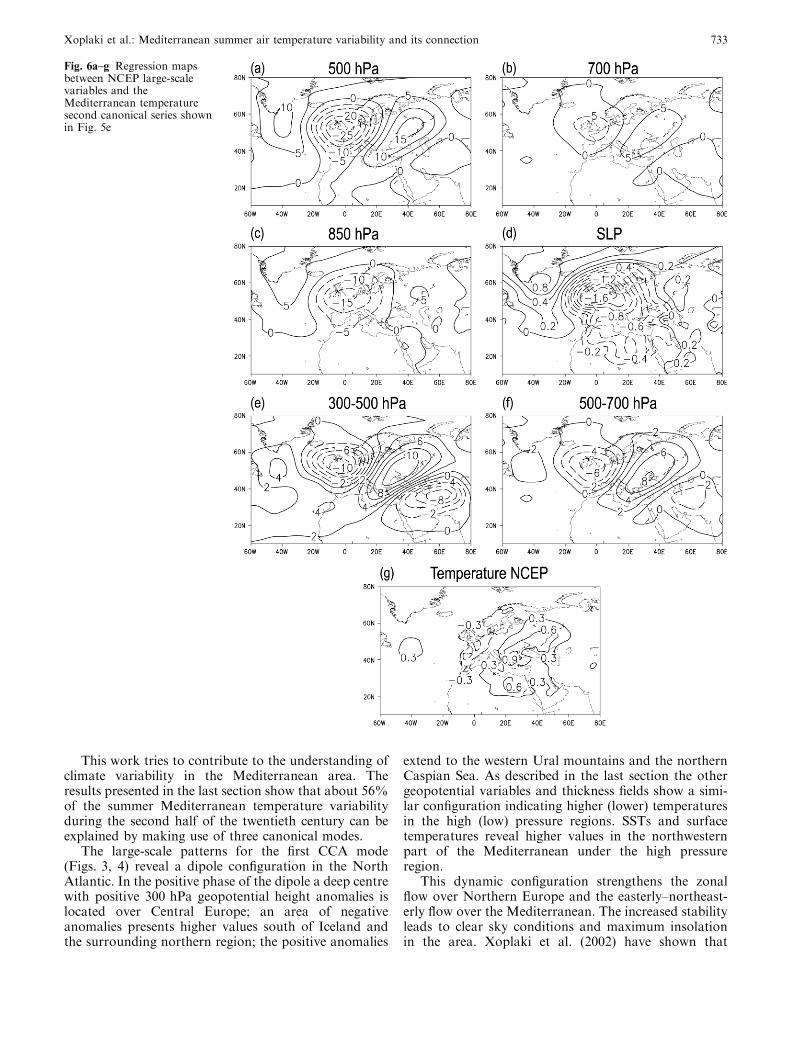
Figure 6 shows regression maps between the secondtemperature canonical series and the large-scale vari-ables that were not used as predictors in this analysis,as well as surface temperature from the NCEPreanalysis. Once again, the geopotential and thickness
Fig. 4a–g Regression mapsbetween NCEP large-scalevariables and theMediterranean temperaturefirst canonical series shown inFig. 3e
Xoplaki et al.: Mediterranean summer air temperature variability and its connection 731

variables follow the configurations already describedfor the second CCA mode. The analysis highlightsstronger geopotential anomalies on the highest levels.For instance, it can be pointed out that the signature ofthe region of positive anomalies over Russia vanishesalmost completely for the lower troposphere. Thisfeature will be considered in more detail in the dis-cussion section.
The surface temperature (NCEP) regression map,though with lower resolution than that of Fig. 3e, pro-vides a broader spatial perspective. It shows that positiveand negative anomalies in the Mediterranean areaextend northward mimicking the areas covered inextension by the negative and positive anomalies in theupper geopotential height and thickness variables.
Figure 7 shows the spatial distribution of skill usingthe model with three predictors (300 hPa geopotentialheight, 700–1000 hPa thickness and SSTs) as presentedin Figs. 3 to 6. Essentially, both the correlation and theBrier skill score indicate a very similar spatial structurewith higher values in the northern half of the studiedarea. Therefore, in these regions the downscaling modelperforms better. We should bear in mind that this is theregion with higher variance in the dataset (Fig. 2b). Itshould also be pointed out that this skill pattern issomewhat reminiscent of the first canonical vector of
Mediterranean temperature (Fig. 3d), a reasonablefinding considering that this is the mode that accountsfor more regional variance. This behaviour in the skillwas also found in the downscaling approach of Gon-zalez-Rouco et al. (2000) for precipitation in the IberianPeninsula.
5 Discussion
The description of the mean state and the variability ofrecent climate has implications in several aspects ofregional climate change research: monitoring anddetecting climate change, calibration of or merging withsatellite data, climate model evaluation, biogeochemicalmodelling, and construction of climate change scenarios(New et al. 1999).
As stated in the introduction, progress in under-standing climate variability in the Mediterranean area isnot only an issue of interest in itself, but also of rele-vance for society and natural ecosystems (IPCC 2001).Climatic extremes predictions and potential changesexpected from an increase in anthropogenic emissionsdepend on the knowledge of the meaningful modes oflarge-scale climate which drive regional climate changesand extremes.
Fig. 5 Canonical spatialpatterns of the second CCA.The canonical correlationpatterns reflect the typicalstrength of the signal, witha 300 hPa. b 700–1000 hPa.c SST. d air temperatureanomalies in �C. e normalisedtime components of CCA 2
732 Xoplaki et al.: Mediterranean summer air temperature variability and its connection
This work tries to contribute to the understanding ofclimate variability in the Mediterranean area. Theresults presented in the last section show that about 56%of the summer Mediterranean temperature variabilityduring the second half of the twentieth century can beexplained by making use of three canonical modes.
The large-scale patterns for the first CCA mode(Figs. 3, 4) reveal a dipole configuration in the NorthAtlantic. In the positive phase of the dipole a deep centrewith positive 300 hPa geopotential height anomalies islocated over Central Europe; an area of negativeanomalies presents higher values south of Iceland andthe surrounding northern region; the positive anomalies
extend to the western Ural mountains and the northernCaspian Sea. As described in the last section the othergeopotential variables and thickness fields show a simi-lar configuration indicating higher (lower) temperaturesin the high (low) pressure regions. SSTs and surfacetemperatures reveal higher values in the northwesternpart of the Mediterranean under the high pressureregion.
This dynamic configuration strengthens the zonalflow over Northern Europe and the easterly–northeast-erly flow over the Mediterranean. The increased stabilityleads to clear sky conditions and maximum insolationin the area. Xoplaki et al. (2002) have shown that
Fig. 6a–g Regression mapsbetween NCEP large-scalevariables and theMediterranean temperaturesecond canonical series shownin Fig. 5e
Xoplaki et al.: Mediterranean summer air temperature variability and its connection 733

precipitation presents positive correlation values withthe negative geopotential height regions and negativevalues with the positive geopotential height areas sup-porting the presence of clear skies and stability in thewarm highs. Thus, the radiative ‘bonus’ favoured by thedynamical configuration could be the main factorallowing for the higher temperatures in the warm highpressure regions. The SSTs anomaly structure followsthat of the atmospheric anomalies. Since the atmo-spheric structure dominates over a much larger areathan the sea anomaly pattern and also over the wholetroposphere, we suggest that the atmosphere seems to bethe forcing agent for the ocean in this CCA mode.
The negative phase of the first CCA mode can bediscussed reversing the sign in the previous reasoning. Ifthe positive phase can be made responsible for a rein-forcement of the zonal flow over Northern Europe, thenegative phase would contribute to a weakening of it,allowing for winds with westward components over theBaltic Sea and strengthening of the westerlies andsouthwesterly flow in theMediterranean. As described byXoplaki et al. (2002), this behaviour could be labelled asthat of a ‘high-index’ type: for the positive (negative)phase of this CCA mode, negative (positive) anomaliesdominate in higher latitudes and positive (negative) onesover the Mediterranean. This leads to a weakened(intensified) zonal flow to the Mediterranean and north-ward (southward) shift of the Subtropical Jet (300 hPa).
Concerning the second CCA mode (Figs. 5, 6), the300 hPa field shows a configuration of zonally distrib-
uted anomalies of alternating sign and extending fromsouthern Greenland to the Middle East. A similar rea-soning can be made as in CCA1 about the warm highs(cold lows) favouring (inhibiting) radiative warming.From the dynamical point of view, the circulation con-figuration can be pictured, as in Xoplaki et al. (2002) asthat of a ‘low-index’ type. In summer months with highpositive values of this CCA mode there is an increase inthe frequency of anomalous meridional flow overEurope, from Scandinavia towards the western Medi-terranean, connected with the Polar Front Jet mean-dering between a low centred over Great Britain, a highover Eastern Europe and a low to the southeast of theCaspian Sea. The negative phase of the mode reveals theopposite sign configuration. In this context, SSTs andsurface temperatures behave in accordance with theatmospheric patterns, with negative anomalies below thecold low (western Mediterranean) and positive anoma-lies under the warm high (central and eastern Mediter-ranean). As in the previous mode, the SSTs seem tofollow the atmospheric anomalies under the surplus(highs) or deficits (lows) of radiation. At the surface, theSLP pattern shows some signs of the high pressure sys-tem over Russia, but over the Mediterranean it hascompletely given way to the low pressure system overGreat Britain which extends to the southeastern bordersof the Mediterranean. This configuration favours windsfrom North Africa and the Sahara to the central andwestern Mediterranean area, contributing to the warmthin these areas (Maheras and Kutiel 1999).
The first CCA mode described in this section agreeswell with the second mode in the study of Xoplaki et al.(2002) on summer temperatures over Greece, whereasthe second mode of influence for Mediterranean tem-peratures coincides well with the first mode. Thus, itseems plausible to extend the reasoning in their work tothe entire Mediterranean area. From this perspective,the variability of summer temperatures in the Mediter-ranean would be well described with a parsimoniousconceptual model invoking two modes, the ‘high-index’type and the ‘low-index’ type, which picture transitionsfrom the zonal to the meridional flow.
The canonical series corresponding to both CCAmodes shown in Figs. 3e and 5e correlate well with thespatial average of Mediterranean summer temperature:0.76 and 0.58 for the first and second canonical mode,respectively. Actually, direct contributions to somespecific exceptional temperature episodes can be directlydetermined from observation of Figs. 2c, 3e and 5e. Forinstance, the high temperatures in the 1994 and 1999Mediterranean summers correspond well with peakvalues in the scores of both canonical series. The firstcanonical mode seems to have contributed to the highscores in the early 1950s and the negative ones in 1996while the second mode played an important role in theexceptional 1964 summer that was warm for the centraland eastern Mediterranean and cooler for the westernregions. It is also worth mentioning the summer of 1976,which was the coolest in the second half of the twentieth
Fig. 7 a Spatial distribution of correlation b Brier skill scoreobtained from cross-validation for the model with three large-scalepredictors
734 Xoplaki et al.: Mediterranean summer air temperature variability and its connection

century (Fig. 2c) and can be attributed to the lowestscores in the second canonical series (Fig. 5e). Accord-ing to this analysis, the second canonical mode presentedits negative phase in 1976, with a deep low affecting thecentral and western Mediterranean (Xoplaki et al. 2002)and a high centred over the British Isles reachingthe western borders of the Mediterranean. Thus, thisaccounts also for the very warm conditions experiencedin Great Britain (Ratcliffe 1978) at that time.
Concerning long-term trends, it seems that bothcanonical series have contributed to the cooling trend inthe 1960s and the warming trend in the1980s. This is adifference to Xoplaki et al. (2002) where no contributionto long-term trends is found on the ‘high-index’ mode. Apossible explanation for this is that their analysis is re-stricted to a part of the eastern Mediterranean. In thisarea the first canonical component shown herein (secondcomponent in their analysis) is less intense, a feature thatcould have made trends less evident in their analysis.
Figure 8 allows for a further remark concerning long-term trends and the associated large-scale configura-tions. The use of SLP data from the NCAR dataset(Jenne 1975; Trenberth and Paolino 1980) allows for abroader perspective on trends since the beginning of thetwentieth century. The time series labelled CCA1 andCCA2 in Fig. 8 show the regressed time series (10-yearsmoving average filter outputs) between the SLP dataset(1900 to 1999) and the SLP patterns in Figs. 4d and 6d,respectively. Previous to this step, the regression pat-terns were interpolated to the same spatial resolution(5�·5�latitude · longitude) as the SLP dataset. Thesetime series can be considered as an estimation withminimum error of the intensities of the canonical seriesin Figs. 3e and 5e through the entire twentieth centuryusing the information provided by the SLP dataset. InFig. 8, CCA1 and CCA2, show distinct cooling trends inthe 1960s and 1980s, in agreement with these statements.However, their behaviour for the first half of the centuryis rather different: while CCA2 indicates a clear de-creasing trend through the whole period, CCA1 showshigh values in the 1920s and 1950s and a deep minimumaround 1910. The solid line in Fig. 8 (labelled Spatialaverage) presents the standardized time series (10-yearsmoving average filter output) of the spatial average of
Mediterranean temperature using the dataset presentedin Fig. 1. CCA1 and the Mediterranean temperatureshow a remarkable agreement in their evolutionthroughout the twentieth century. The correlationbetween the spatial average time series and CCA1 andCCA2 is 0.86 (significant at the 95% level, allowing forfewer degrees of freedom due to the filter) and –0.1 (notsignificant), respectively. A CCA was made using theNCAR SLP dataset as a single predictor and Mediter-ranean temperatures (62 stations) for the period 1900 to1999 (not shown here). The same time evolution asshown in Fig. 8 was found.
Therefore, in view of these results we suggest that thelong-term trends in Mediterranean summer tempera-tures through the twentieth century are inherentlyrelated to the variation of the first canonical mode(‘high-index’ type) described before. The associatedpatterns between the surface of the atmosphere (SLP)and the upper atmosphere variables (geopotential andthickness variables) described by the first canonicalmode in Figs. 3 and 4 can be assumed to remain stablein time. Thus, it can be argued that during the first halfof the twentieth century, the upper levels of the atmo-sphere should have behaved in accordance to the CCA1time series in Fig. 8.
The spatial average for Mediterranean temperaturesalso describes the evolution of temperatures during thesecond half of the twentieth century showing high valuesduring the 1860s (13 stations), comparable to thoseduring the 1950s and 1990s. For the period 1850 to 1999,a trend of 0.018 �C/decade is found (significant at the95% level). For the period 1900 to 1999, a change of0.05 �C/decade is found. This points to an increase intemperature of about 0.27 �C in the 1850–1999 period,and of 0.5 �C in the twentieth century. This result agreesin its order of magnitude with the warming trend indi-cated by Folland et al. (2001) though their infra-esti-mates show 0.75 �C as the warming value for the wholecentury. The reasons for this difference could also be inthe different datasets used.
The modes of concurrent CCA pairs between Medi-terranean temperature and the large-scale 500 hPa fieldspresented by Corte-Real et al. (1995) also indicate thepresence of a four centred pattern causing higher than
Fig. 8 Regressed time series(dashed lines) between the SLPNCAR (Trenberth and Paolino1980) dataset and the SLPpatterns in Fig. 4d (CCA1) andFig. 6d (CCA2). The solid line(spatial average) corresponds tostandardized values of thespatial average ofMediterranean summertemperatures for the period1850 to 1999. All time series areoutputs of a 10-years centredmoving average filter
Xoplaki et al.: Mediterranean summer air temperature variability and its connection 735
normal temperatures to the central and eastern Medi-terranean. The location and intensity of the leadinganomaly patterns within the two first CCAs revealedsome differences.
Corte-Real et al. (1995) investigated the connectionsbetween the non-seasonal connection between regionalclimate and the large-scale atmospheric circulation atthe 500 hPa level. Thus, these results can only partly becompared with our findings due to the different temporaland spatial resolution as well as the different EOF-CCAexperiments.
6 Conclusions
In this study, the interannual to decadal connectionbetween the Mediterranean summer (JJAS) surface airtemperature, as expressed by 213 station time series, andthe state of the large-scale atmospheric circulation, thethickness patterns as well as the Mediterranean SSTs,was investigated for the period 1950–1999.
Warmer Mediterranean summers characterize the1950s, 1980s and 1990s and cooler summers wereprevalent from the mid-1960s to the mid-1970s. Wefound a significant warming of 0.05 �C/decade over the1980 to 1999 period. For the whole twentieth century,the significant upward trend is of the order of 0.05 �C/decade.
The CCA experiments with the combined, multi-component large-scale predictors and summer tempera-ture served to investigate the covariability betweengeopotential height and large-scale thermal fields andthe Mediterranean summer air temperature. The com-bined information of the 300 hPa geopotential heightfield, the 700–1000 hPa thickness and the MediterraneanSSTs account for more than 50% of the Mediterraneansummer temperature variability for 1950–1999. Addi-tional predictors did not improve the statistical model.
The two canonical modes found agree well with thoseof Xoplaki et al. (2002) and can be expressed in a simpleconceptual model invoking high-index and low-indextype of circulation configurations. The first CCA mode(high-index type) pictures shifts on the zonal flow. In itspositive phase it is related to warm summers, blockingconditions, subsidence and stability over the Mediter-ranean. Further, warm summers can be attributed to awarm lower troposphere as shown by thickness variablesand positive Mediterranean SSTs. The second CCAcomponent (low-index type) is associated with intrusionsof cold air in the upper atmospheric levels that derivefrom a jet stream meandering between high and lowgeopotential height anomalies of alternating sign, whichextend from the southwest of Greenland to the CaspianSea. In its positive phase, this mode leads to a warmer(colder) central and eastern (western) Mediterranean,thus a dipole pattern over the basin.
Both modes contribute to the trends in the secondhalf of the twentieth century, though it is shown thatonly the first mode is related to the long-term trends for
the entire twentieth century. Thus, we suggest that thehigh-index type situations regulate the long-termchanges in Mediterranean summer temperature allowingfor a surplus (deficit) of solar radiation reaching thesurface in the positive (negative) phase of the firstcanonical component when high (low) pressure systemsare persistent in the area.
During the 1900 to 1999 period, summer Mediterra-nean temperature increased by 0.5 �C. Since the begin-ning of the records (1850), the increase in summertemperature has been found to be 0.27 �C.
Our results contribute to the understanding of cli-mate variability in the Mediterranean area during thetwentieth century. Implications can also be derived forthe climate change discussion since regional changesdue to the increase of the concentrations of greenhousegases and aerosols would be partially imposed by thelarge-scale through changes in the intensity and fre-quency of the patterns described herein (first CCAmode). An appropriate assessment of the simulation ofthe described modes of variability by AOGCMs isneeded as model validation as well as insight of theextent to which the regional to large-scale relationshipsare modified in scenario simulations. This type ofassessment can contribute to provide scenario predic-tions of temperature and precipitation with high reso-lution using the modes of variability described in thiswork as a reference.
Acknowledgements The authors wish to express their thanks to thefollowing institutions or persons, who kindly provided their valu-able climate time series, through which the climate analysis for theMediterranean region were made possible (in alphabetical order ofthe countries): Albania: Prof. Sanxhaku, Academy of Sciences,Hydrometeorological Institute, Tirana; Algeria: Dr. M. Kadi, Of-fice National de la Meteorologie Climate Center, Dar el Beida,Algiers Austria: Dres. I. Auer, R. Bohm and W. Schoner, Zen-tralanstalt fur Meteorologie und Geodynamik (ZAMG), Vienna;Bosnia-Herzegovina: Dr. E. Sarac, Federal Meteorological Insti-tute, Sarajevo; Bulgaria: National Institute of Meteorology andHydrology, Bulgarian Academy of Sciences, Sofia and D. Lister,Climatic Research Unit, University of East Anglia, Norwich, UK;Croatia: Dr. M. Gajic-Capka, Meteorological and HydrologicalService of Croatia, Department for Meteorological Research,Zagreb; Cyprus: Dr. L. Hadjioannou, Ministry of Agriculture,Natural Resources and Environment, Meteorological Service,Nicosia; Greece: Hellenic National Meteorological Service, Hel-linikon, Athens; Israel: Dr. A. Porat, Ministry of Transport, IsraelMeteorological Service, Bet Dagan; Italy: Colonel Dr. M. Capaldo,Aeronautica Militare, Centro Nazionale di Meteorologia e Cli-matologia Aeronautica Aeroporto Pratica di Mare, Pomezia; Jor-dan: Dr. H. AL Sha’er, The Hashemite Kingdom of Jordan,Meteorological Department, Climate Division Amman Civil Air-port, Amman; Lebanon: Dr. A. Bejjani, Republic of Lebanon,Ministry of Transport, Meteorological Services, Beirut; Libya: Dr.K. Elfadli, Libyan Meteorological Department, Climatological andAgrometeorological Section, Tripoli; Moldavia: Dr. L. Fisher,Hidrometeo Service (Chimet), Chisinau; Romania: Dr. A. Busuioc,National Institute of Meteorology and Hydrology, Bucharest;Skopje: Dr. N. Aleksovska, Hydrometeorological Institute of theFYR Macedonia, Meteorological and Climatological division,Skopje; Slovenia: Dres. T. Ovsenik-Jeglie, J. Miklavcic andB. Zupancic, Hydrometeorological Institute of Slovenia, Ministryof the environment and Physical Planning, Ljubliana; Switzerland:Swiss Meteorological Office (MeteoSchweiz), Zurich; Tunisia:Dr. M. Ketata and Prof. H. Hajji, Republique tunesienne, Ministere
736 Xoplaki et al.: Mediterranean summer air temperature variability and its connection

de Transport, Institute National de la Meteorologique, Tunis-Carthage. For Egypt, France, Hungary, Malta, Morocco, Portu-gal, Serbia, Syria and Turkey the data have been obtained from theGHCN (Global Historical Climatology Network) version 2 and/orwhere kindly provided by the German Meteorological Service(DWD), Geschaftsfeld Seeschifffahrt and David Lister, ClimaticResearch Unit, University of East Anglia, Norwich, UK. Tomm-aso Abrate, Department of Hydrology and Water Resources,WMO, Geneva, Switzerland, provided us with addresses and rele-vant information on how to contact the responsible persons andinstitutions from the different countries. Dr. J. Fidel Gonzalez-Rouco was partially funded by project REN-2000-0786-cli and Dr.Jurg Luterbacher was supported by the Swiss NCCR Climateprogramme.
References
Barnett TP, Preisendorfer RW (1987) Origins and levels of monthlyand seasonal forecast skill for United States air temperaturedetermined by canonical correlation analysis. Mon WeatherRev 115:1825–1850
Barnston AG, Livezey RE (1987) Classification, seasonality andpersistence of low frequency atmospheric circulation patterns.Mon Weather Rev 115:1083–1126
Bartzokas A, Metaxas DA, Ganas IS (1994) Spatial and temporalsea-surface temperature covariances in the Mediterranean. Int JClimatol 14:201–213
Brier GW (1950) Verification of forecasts expressed in terms ofprobability. Mon Weather Rev 78:1–3
Corte-Real J, Zhang X, Wang X (1995) Large-scale circulationregimes and surface climatic anomalies over the Mediterranean.Int J Climatol 15:1135–1150
Corte-Real J, Qian B, Xu H (1998) Regional climate change inPortugal: precipitation variability associated with large-scaleatmospheric circulation. Int J Climatol 18:619–635
Cubasch U, Meehl GA, Boer GJ, Stouffer RJ, Dix M, Noda A,Senior CA, Raper S, Yap KS (2001) Projections of future cli-mate change. In: Houghton JT, Ding Y, Griggs DJ, Noguer M,van der Linden PJ, Xiaoxu D (eds) Climate change 2001; thescientific basis, ch 9. Contribution of Working Group I to theThird Assessment Report of the Intergovernmental Panel onClimate Change (IPCC). Cambridge University Press, Cam-bridge, UK, pp 99–181
Dai A, Fung IY, del Genio AD (1997) Surface observed global landprecipitation variations during 1900–1988. J Clim 10:2943–2962
Easterling DR, Karl TR, Gallo KP, Robinson TA, Trenberth KE,Dai AG (2000) Observed climate variability and changeof relevance to the biosphere. J Geophys Res 105:20,101–20,114
Folland CK, Karl TP, Christy JR, Clarke RA, Gruza GV, Jouzel J,Mann ME, Oerlemans J, Salinger MJ, Wang SW (2001) Ob-served climate variability and change. In: Houghton JT, DingY, Griggs DJ, Noguer M, van der Linden PJ, Xiaoxu D (eds)Climate change 2001; the scientific basis, ch 2. Contribution ofworking group I to the third assessment report of the Inter-governmental Panel on Climate Change (IPCC). CambridgeUniversity Press, Cambridge, UK, pp 99–181
Giles BD, Balafoutis C (1990) The Greek heatwaves of 1987 and1988. Int J Climatol 10:505–517
Giles BD, Balafoutis C, Maheras P (1990) Too hot for comfort: theheat waves in Greece in 1987 and 1988. Int J Biometeorol34:98–104
Giorgi F (2002a) Variability and trends of sub-continental scalesurface climate in the twentieth century. Part I: Observations.Clim Dyn 18:675–691
Giorgi F (2002b) Variability and trends of sub-continental scalesurface climate in the twentieth century. Part II: AOGCMsimulations. Clim Dyn 18:693–708
Gonzalez-Rouco JF, Heyen H, Zorita E, Valero F (2000) Agree-ment between observed rainfall trends and climate changesimulations in Southern Europe. J Clim 13: 3057–3065
Gonzalez-Rouco JF, Jimenez JL, Quesada V, Valero F (2001)Quality control and homogenization of monthly precipitationdata in the southwest of Europe. J Clim 14:964–978
Hansen J, Ruedy R, Sato M, Imhoff M, Lawrence W, Easterling D,Peterson T, Karl T (2001) A closer look at United States andglobal surface temperature change. J Geophys Res 106:23,947–23,963
Hansen J, Ruedy R, Sato M, Lo K (2002) Global warming con-tinues. Science 295:275
Hunt B, Gordon H (1988) The problem of naturally occurringdrought. Clim Dyn 3:19–33
Hurrell JW (1995) Decadal trends in the North Atlantic Oscilla-tion: regional temperatures and precipitation. Science 269:676–679
Hurrell JW, van Loon H (1997) Decadal variations in climateassociated with the North Atlantic Oscillation. Clim Change36:301–326
IPCC (2001) Climate change 2001: the scientific basis. In; Hough-ton JT, Ding Y, Griggs DJ, Noguer M, van der Linden PJ, DaiX, Maskell K, Johnson CA (eds.) Contribution of workinggroup I to third assessment report of the intergovernmentalpanel on climate change. Cambridge University Press, Cam-bridge, UK
Jacobeit J (2000) Rezente Klimaentwicklung im Mittelmeerraum.Petermanns Geogr Mittl 144:22–33
Jacobeit J, Jonsson T, Barring L, Beck C, Ekstrom M (2001) Zonalindices for Europe 1780–1995 and running correlations withtemperature. Clim Change 48:219–241
Jenne RL (1975) Data sets for meteorological research. NCAR TN1A-111
Jones PD, New M, Parker DE, Martin S, Rigor IG (1999) Surfaceair temperature and its changes over the past 150 years. RevGeophys 37:173–199
Kalnay et al. (1996) The NCEP/NCAR 40-Year Reanalysis Pro-ject. Bull Am Meteorol Soc 77:437–471
Katsouyanni K, Pantazopoulu A, Touloumi G, Tselepidaki I,Moustris K, Asimakopoulos D, Poulopoulou G, TrichopoulosD (1993) Evidence of interaction between air pollution and hightemperatures in the causation of excess mortality. Archit En-viron Health 48:235–242
Katsouyanni K, Trichopoulos D, Zavitsanos X, Touloumi G(1988) The 1987 Athens heatwave. Lancet 573:ii
Kattenberg A, Giorgi F, Grassl H, Meehl GA, Mitchell JFB,Stouffer RJ, Tokioka T, Weaver AJ, Wigley TML (1996) Cli-mate models – projections of future climate. In: Houghton JT,Meirho Filho LG, Callander BA, Harris N, Kattenberg A,Maskell K (eds) Climate Change 1995. The Science of ClimateChange. The second assessment report of the IPCC contribu-tion of WG1. Cambridge University Press, pp 285–357
Kistler R et al. (2001) The NCEP-NCAR 50-year Reanalysis:monthly means CD-ROM and documentation. Bull AmMeteorol Soc 82:247–267
Kundzewicz ZW, Parry ML (2001) Europe. In: McCarthy JJ,Canziani OF, Leary NA, Dokken DJ, White KS (eds) Climatechange 2001. Impacts, adaptations and vulnerability. Contri-bution of working group II to the third Assessment report ofthe intergovernmental panel on climate change. CambridgeUniversity Press, Cambridge, UK and NY, USA
Kutiel H, Maheras P (1998) Variations in the temperature regimeacross the Mediterranean during the last century and their re-lationship with circulation indices. Theor Appl Climatol 61:39–53
Kutiel H, Benaroch Y (2002) North Sea-Caspian pattern (NCP) –an upper level atmospheric teleconnection affecting the EasternMediterranean: identification and definition. Theor Appl Cli-matol 71:17–28
Livezey RE (1995) The evaluation of forecasts. In: von Storch H,Navarra A (eds.) Analysis of climate variability. Springer,Berlin, New York, Heidelberg, pp 177–196
Livezey RE, Smith TM (1999a) Considerations for use of theBarnett and Preisendorfer (1987) algorithm for canonical cor-relation analysis of climate variations. J Clim 12:303–305
Xoplaki et al.: Mediterranean summer air temperature variability and its connection 737

Livezey RE, Smith TM (1999b) Covariability of aspects of NorthAmerican climate with global sea surface temperatures on in-terannual to interdecadal timescales. J Clim 12:289–302
Lolis CJ, Bartzokas A, Metaxas DA (1999) Spatial covariability ofthe climatic parameters in the Greek area. Int J Climatol19:185–196
Maheras P (2000) Synoptic situations causing drought in theMediterranean basin. In: Vogt JV, Somma F (eds) Drought anddrought mitigation in Europe. Kluwer Academic, Dardrecht,pp 91–102
Maheras P, Kutiel H (1999) Spatial and temporal variations in thetemperature regime in the Mediterranean and their relationshipwith circulation; 1860–1990. Int J Climatol 19:1697–1715
Maheras P, Flocas HA, Patrikas I, Anagnostopoulou C (2001) A40 year objective climatology of surface cyclones in the Medi-terranean region: spatial and temporal distribution. Int J Cli-matol 21:109–130
Maheras P, Xoplaki E, Davies TD, Martin-Vide J, Barriendos M,Alcoforado MJ (1999) Warm and cold monthly anomaliesacross the Mediterranean basin and their relationship withcirculation; 1860–1990. Int J Climatol 19:1697–1715
Matzarakis A, Mayer H (1991) The extreme heat wave in Athens inJuly 1987 from the point of view of human biometeorology.Atmos Env 25B:203–211
Matzarakis A, Mayer H (1997) Heat stress in Greece. Int J Bio-meteorol 41:34–39
Michaelsen J (1987) Cross-validation in statistical climate forecastmodels. J Climate Appl Meteorol 26:1589–1600
Namias J (1948) Evolution of monthly mean circulation andweather patterns. Trans Am Geophys U29:777–788
New MG, Hulme M, Jones PD (1999) Representing twentieth-century space time climate variability. Part I: development of a1961–1990 mean monthly terrestrial climatology. J Clim12:829–856
New MG, Hulme M, Jones PD (2000) Representing twentieth-century space time climate fields. Part II: development of a1901–1996 mean monthly terrestrial climatology. J Clim13:2217–2238
New M, Todd M, Hulme M, Jones P (2001) Precipitation mea-surements and trends in the twentieth century. Int J Climatol21:1899–1922
Nicholls N, Gruza GV, Jouzel J, Karl TR, Ogallo LA, Parker DE(1996) Observed climate variability and change. In: HoughtonJT, Meira Filho LG, Callander BA, Harris N, Kattenberg A,Maskell K (eds.) Climate change 1995; the science of climatechange, ch 3. Contribution of working group I to the secondassessment report of the Intergovernmental Panel on ClimateChange (IPCC). Cambridge University Press, Cambridge, UK,pp 133–192
North GR, Moeng FJ, Bell TL, Cahalan RF (1982) The latitudedependence of the variance of zonally averaged quantities. MonWeather Rev 110:319–326
Palutikof JP, Conte M, Casimiro Mendes J, Goodess CM, EspritoSanto F (1996) Climate and Climatic Change. In: Brandt CJ,Thornes JB (eds.) Mediterranean desertification and land use.Wiley, New York, pp 43–86
Perry AH (2001) More heat and drought – can Mediterraneantourism survive and prosper? In: Matzarakis A, de Freitas CR(eds) Proc 1st International workshop on climate, tourism andrecreation. Int Soc Biometeorol, commission on climate tourismand recreation. December 2001, Thessaloniki, Greece, WP3,pp 1–6
Peterson TC, Vose RS (1997) An overview of the global historicalclimatology network temperature database. Bull Am MeteorolSoc 78:2837–2849
Peterson TC, Vose RS, Schmoyer R, Razuvaev V (1998) Globalhistorical climatology network (GHCN) quality control ofmonthly temperature data. Int J Climatol 18:1169–1179
Pozo-Vazquez D, Esteban-Parra MJ, Rodrigo FS, Castro-Diez Y(2001) A study of NAO variability and its possible non-linearinfluences on European surface temperature. Clim Dyn 17:701–715
Ratcliffe RAS (1978) Meteorological aspects of the 1975–76drought. Proc R Soc London A 363:3–20
Rayner NA, Horton EB, Parker DE, Folland CK, Hackett RB(1996) Version 2.2 of the global sea-Ice and sea surface tem-perature data set, 1903–1994. CRTN 74. Available from HadleyCentre Met Office Bracknell, UK
Reddaway JM, Bigg GR (1996) Climatic change over the Medi-terranean and links to the more general atmospheric circula-tion. Int J Climatol 16:651–661
Ribera P, Garcia R, Diaz HF, Gimeno L, Hernandez E (2000)Trends and interannual oscillations in the main sea-level surfacepressure patterns over the Mediterranean, 1955–1990. GeophysRes Lett 8:1143–1146
Rimbu N, le Treut H, Janicot S, Boroneant C, Laurent C (2001)Decadal precipitation variability over Europe and its relationwith surface atmospheric circulation and sea surface tempera-ture. Q J R Meteorol Soc 127:315–329
Saenz J, Rodriguez-Puebla C, Fernandez J, Zubillaga J (2001)Interpretation of interannual winter temperaturevariations over southwestern Europe. J Geophys Res106:20,641–20,651
Slonosky VC, Yiou P (2002) Does the NAO index represent zonalflow? The influence of the NAO on North Atlantic surfacetemperature. Clim Dyn 19:17–30
Slonosky VC, Jones PD, Davies TD (2001) Atmospheric circula-tion and surface temperature in Europe from the 18th centuryto 1995. Int J Climatol 21:63–75
Smith TM, Livezey RE (1999) GCM systematic error correctionand specification of the seasonal mean Pacific-North Americaregion atmosphere from global SSTs. J Clim 12:273–288
Trenberth KE (1990) Recent observed interdecadal climate changesin the Northern Hemisphere. Bull AmMeteorol Soc 71:989–993
Trenberth KE (1995) Atmospheric circulation climate changes.Clim Change 31:427–453
Trenberth K, Paolino DA (1980) The Northern Hemisphere sea-level pressure data set: trends, errors and discontinuities. MonWeather Rev 108:855–872
Trigo IF, Davies TD, Bigg GR (1999) Objective climatology ofcyclones in the Mediterranean Region. J Clim 12:1685–1696
Trigo IF, Davies TD, Bigg GR (2000) Decline in Mediterraneanrainfall caused by weakening of Mediterranean cyclones. Geo-phys Res Lett 27:2913–2916
Tsiourtis NX (2001) Drought management plans for the Mediter-ranean region. Report of the Water Development Department,Nicosia, Cyprus. Available at: http://www.pio.gov.cy/wdd/eng/scientific_articles/archieve2001/article03.htm
von Storch H, Zwiers FW (1999) Statistical analysis in climateresearch. Cambridge University Press, UK
Vose RS, Schmoyer RL, Steurer PM, Peterson TC, Heim R, KarlTR, Eischeid J (1992) The Global Historical ClimatologyNetwork: long-term monthly temperature, precipitation, sealevel pressure, and station pressure data. ORNL/CDIAC-53,NDP- 041, Carbon Dioxide Information Analysis Center, OakRidge National Laboratory, Oak Ridge, Tennessee, USA
Watson RT, Zinyowera RH, Moss H (1997) The regional impactsof climate change: an assessment of vulnerability. IPCC SpecRep Working Group II. Cambridge University Press, UK
Wilks DS (1995) Statistical methods in the atmospheric sciences: anintroduction. In: Dmowska R, Holton JR (eds.) Int GeophysSer, 59. Academic Press, New York, USA
WMO (1986) Guidelines on the quality control of surface clima-tological data/prepared by Abbott PF (UK) as Rapporteur inthe WMO Commission for Climatology. Geneva: WCP, (WCP-85). iv, appendices
Xoplaki E (2002) Climate variability over the Mediterranean. PhDthesis, University of Bern, Switzerland ([http://sinus.unibe.ch/klimet/docs/phd_xoplaki.pdf])
Xoplaki E, Luterbacher J, Burkard R, Patrikas I, Maheras P (2000)Connection between the large-scale 500 hPa geopotential heightfields and precipitation over Greece during wintertime. ClimRes 14:129–146
738 Xoplaki et al.: Mediterranean summer air temperature variability and its connection

Xoplaki E, Gonzalez-Rouco FJ, Gyalistras D, Luterbacher J,Rickli R, Wanner H (2002) Interannual summer air tempera-ture variability over Greece and its connection to the large-scaleatmospheric circulation and Mediterranean SSTs 1950–1999.Clim Dyn DOI 10.1007/s00382-002-0291-3
Xu JS (1993) The joint modes of the coupled atmosphere–oceansystem observed from 1967 to 1987. J Clim 6:816–838
Zorita E, von Storch H (1999) The analog method – a simplestatistical downscaling technique: comparison with more com-plicated methods. J Clim 12:2474–2489
Zorita E, Kharin V, von Storch H (1992) The atmospheric circu-lation and sea surface temperature in the North Atlantic area inwinter: their interaction and relevance for Iberian precipitation.J Clim 5:1097–1108
Xoplaki et al.: Mediterranean summer air temperature variability and its connection 739