Patterns of atmospheric circulation associated with cold outbreaks in southern Amazonia
12
METEOROLOGICAL APPLICATIONS Meteorol. Appl. (2014) Published online in Wiley Online Library (wileyonlinelibrary.com) DOI: 10.1002/met.1458 Review Patterns of atmospheric circulation associated with cold outbreaks in southern Amazonia Rita Micheline Dantas Ricarte, a Dirceu Luis Herdies a * and Tatiane Felinto Barbosa b a Center for Weather Forecast and Climate Studies (CPTEC), National Institute for Space Research (INPE), Cachoeira Paulista, SP, Brazil b Instituto Nacional de Meteorologia – INMET, Brasília, DF, Brazil ABSTRACT: This study is based on climatological records (1979–2008) of cold outbreak (friagem) events that occurred in the southern Amazon region during the austral winter months (May to September). The friagem events were identified with an objective method that used climatological data from the surface station of the Department of Airspace Control (DCEA) in Vilhena city, including the minimum temperature (T min ), the pressure reduced to mean sea level (P msl ) and the decrease in T min (DT min ). The purpose of this study was to investigate the association between atmospheric circulation and friagem events using Climate Forecast System Reanalysis (CFSR) and a composite method. One hundred and forty-four friagem events were identified with the proposed methodology. These events produced large changes in weather conditions in Amazonia, including an abrupt decrease in air temperature, an increase in the amount of dry air, and an increase in surface pressure. The main atmospheric features associated with friagem events are an intensification of high post-frontal surface pressure that is caused by the intensification of a ridge at middle and high levels when air approaches the Andes and strong southerly winds at the surface that carry cold, dry air to tropical latitudes. KEY WORDS Amazon; climate studies; friagem; modelling; verification Received 10 May 2013; Revised 23 January 2014; Accepted 16 February 2014 1. Introduction Incursions of masses of cold air with polar characteristics (cold and dry air) affecting the continent of South Amer- ica are generally associated with complex mechanisms, for example, wave – wave interactions (Marengo et al., 2002), tropics–extratropics interactions (Müller et al., 2005; Müller, 2007), interactions between different spatiotemporal scales due to important heat exchanges and the movement of moisture and momentum between low, medium, and high levels in both synoptic- and planetary-scale phenomena (Krishnamurti et al. 1999; Garreaud, 2000; Seluchi and Marengo, 2000; Vera and Vigliarolo, 2000). The characteristics of migratory systems associated with cold air outbreaks are analysed in the literature in several ways. Some studies focus on the evolution of atmospheric circulation asso- ciated with cold episodes (Krishnamurti et al., 1999; Escobar et al., 2004) and analyse the dynamics and synoptic systems that occur during different events (Marengo et al., 1997b; Gar- reaud, 2000; Seluchi and Marengo, 2000; Marengo et al., 2002). Other papers consider individual cases (Hamilton and Tarifa, 1978; Fortune and Kousky, 1983; Garreaud, 1999) or a deter- mined set of intense events identified with particular criteria (Vera and Vigliarolo, 2000; Marengo et al., 2002; Müller et al., * Correspondence: Dirceu Luis Herdies, Center for Weather Forecast and Climate Studies (CPTEC) National Institute for Space Research (INPE) Rodovia Presidente Dutra km 40, Cachoeira Paulista, São Paulo, Brazil. E-mail: [email protected] 2005; Pezza and Ambrizzi, 2005; Müller, 2007). In all of these studies, a general concept has emerged: cold air outbreaks asso- ciated with intense events are characterized by a mid-latitude wave pattern. This wave pattern is often defined by the ampli- fication of a ridge west of the Andes along the coast of Chile in advance of a cyclone on the southeast coast of South America. The intense northward flow between this high and the leading low facilitates the entry of cold air from southern Argentina to south-southeastern Brazil; in some cases, cold air is channelled to low latitudes. Several studies (e.g. Parmenter (1976), Fortune and Kousky (1983), Marengo et al. (1997a), Satyamurty et al. (2002)) sought to understand the atmospheric changes caused by the incursion of cold air that spreads occasionally to the southern Amazon region. Locally known as friagem events, these phenomena alter the characteristics of the weather and impact the lives of the residents of this region. The sharp decreases in minimum tem- perature and specific humidity that occur in southern and south- western Amazonia are the main features of the frontal system incursion in southern South America. Another predominant fea- ture is the trailing anticyclone that moves eastward towards the Atlantic Ocean and northern Brazil and is capable of reaching low latitudes or even crossing the equator (Myers, 1964). Given its heterogeneity and extent, different regions of the Amazon Basin experience different effects from these cold air incursions. The effects of the passage of this system can be quite obvious in the southernmost locations, for example, the city of Vilhena. During the austral winter, southern and southwestern Ama- zonia are affected by cold fronts. According to Harman (1987) the extratropical anticyclones move from west to east with an © 2014 Royal Meteorological Society
Transcript of Patterns of atmospheric circulation associated with cold outbreaks in southern Amazonia

METEOROLOGICAL APPLICATIONSMeteorol. Appl. (2014)Published online in Wiley Online Library(wileyonlinelibrary.com) DOI: 10.1002/met.1458
Review
Patterns of atmospheric circulation associated with coldoutbreaks in southern Amazonia
Rita Micheline Dantas Ricarte,a Dirceu Luis Herdiesa* and Tatiane Felinto Barbosaba Center for Weather Forecast and Climate Studies (CPTEC), National Institute for Space Research (INPE), Cachoeira Paulista, SP, Brazil
b Instituto Nacional de Meteorologia – INMET, Brasília, DF, Brazil
ABSTRACT: This study is based on climatological records (1979–2008) of cold outbreak (friagem) events that occurred inthe southern Amazon region during the austral winter months (May to September). The friagem events were identified withan objective method that used climatological data from the surface station of the Department of Airspace Control (DCEA)in Vilhena city, including the minimum temperature (Tmin), the pressure reduced to mean sea level (Pmsl) and the decrease inTmin (DTmin). The purpose of this study was to investigate the association between atmospheric circulation and friagem eventsusing Climate Forecast System Reanalysis (CFSR) and a composite method. One hundred and forty-four friagem eventswere identified with the proposed methodology. These events produced large changes in weather conditions in Amazonia,including an abrupt decrease in air temperature, an increase in the amount of dry air, and an increase in surface pressure. Themain atmospheric features associated with friagem events are an intensification of high post-frontal surface pressure that iscaused by the intensification of a ridge at middle and high levels when air approaches the Andes and strong southerly windsat the surface that carry cold, dry air to tropical latitudes.
KEY WORDS Amazon; climate studies; friagem; modelling; verification
Received 10 May 2013; Revised 23 January 2014; Accepted 16 February 2014
1. Introduction
Incursions of masses of cold air with polar characteristics(cold and dry air) affecting the continent of South Amer-ica are generally associated with complex mechanisms, forexample, wave–wave interactions (Marengo et al., 2002),tropics–extratropics interactions (Müller et al., 2005; Müller,2007), interactions between different spatiotemporal scales dueto important heat exchanges and the movement of moistureand momentum between low, medium, and high levels in bothsynoptic- and planetary-scale phenomena (Krishnamurti et al.1999; Garreaud, 2000; Seluchi and Marengo, 2000; Vera andVigliarolo, 2000).The characteristics of migratory systems associated with cold
air outbreaks are analysed in the literature in several ways. Somestudies focus on the evolution of atmospheric circulation asso-ciated with cold episodes (Krishnamurti et al., 1999; Escobaret al., 2004) and analyse the dynamics and synoptic systemsthat occur during different events (Marengo et al., 1997b; Gar-reaud, 2000; Seluchi and Marengo, 2000; Marengo et al., 2002).Other papers consider individual cases (Hamilton and Tarifa,1978; Fortune and Kousky, 1983; Garreaud, 1999) or a deter-mined set of intense events identified with particular criteria(Vera and Vigliarolo, 2000; Marengo et al., 2002; Müller et al.,
*Correspondence: Dirceu Luis Herdies, Center for Weather Forecastand Climate Studies (CPTEC)National Institute for Space Research (INPE)Rodovia Presidente Dutra km 40, Cachoeira Paulista, São Paulo, Brazil.E-mail: [email protected]
2005; Pezza and Ambrizzi, 2005; Müller, 2007). In all of thesestudies, a general concept has emerged: cold air outbreaks asso-ciated with intense events are characterized by a mid-latitudewave pattern. This wave pattern is often defined by the ampli-fication of a ridge west of the Andes along the coast of Chile inadvance of a cyclone on the southeast coast of South America.The intense northward flow between this high and the leadinglow facilitates the entry of cold air from southern Argentina tosouth-southeastern Brazil; in some cases, cold air is channelledto low latitudes.Several studies (e.g. Parmenter (1976), Fortune and Kousky
(1983), Marengo et al. (1997a), Satyamurty et al. (2002)) soughtto understand the atmospheric changes caused by the incursionof cold air that spreads occasionally to the southern Amazonregion. Locally known as friagem events, these phenomena alterthe characteristics of the weather and impact the lives of theresidents of this region. The sharp decreases in minimum tem-perature and specific humidity that occur in southern and south-western Amazonia are the main features of the frontal systemincursion in southern South America. Another predominant fea-ture is the trailing anticyclone that moves eastward towards theAtlantic Ocean and northern Brazil and is capable of reachinglow latitudes or even crossing the equator (Myers, 1964). Givenits heterogeneity and extent, different regions of the AmazonBasin experience different effects from these cold air incursions.The effects of the passage of this system can be quite obvious inthe southernmost locations, for example, the city of Vilhena.During the austral winter, southern and southwestern Ama-
zonia are affected by cold fronts. According to Harman (1987)the extratropical anticyclones move from west to east with an
© 2014 Royal Meteorological Society

R. M. D. Ricarte et al.
equatorward component of motion. The cold air masses associ-ated with these anticyclones are shallow and modified along theirtrajectories by thermodynamic changes caused by heat and mois-ture exchange with the surface.The incursions of polar air masses towards the equator occur
east of the Andes in a north–south direction (Garreaud, 2000).These cold, dry air masses reach the low latitudes by way ofinteractions between synoptic-scale flows and surface topogra-phy. During the austral winter, these incursions have a profoundeffect on low-level temperature profiles; in contrast, the warmseason episodes produce less intense temperature variations andform deep convective bands along the edge of themass of cold air.Previous studies have examined individual significant intense
events that affect southern Amazonia. However, few studies haveinvestigated the climatology of the Amazon friagem. The presentstudy analyses the general climatology of friagem events thataffect the southern Amazon region, and identifies major atmo-spheric circulation patterns associated with these events. Finally,the atmospheric circulation characteristics associated with thesepatterns at low, middle, and high levels are described. The studyis organized as follows. The data and methodology are presentedin Section 2. Section 3 provides the results of the friagem selec-tion process, the synoptic classification of these events, and thephysical processes associated with different circulation patterns.Lastly, Section 4 presents a summary of the main results.
2. Data and methodology
Data from the Climate Forecast System Reanalysis (CFSR; Sahaet al., 2010) of the National Centers for Environmental Predic-tion (NCEP) from 1979 to 2008 were used to analyse the fieldsassociated with the atmospheric circulation of cold air incur-sions in southern Amazonia. The CFSR was developed to sim-ulate conditions in a coupled ocean–atmosphere, land–ice andsea–surface model with high resolution. The global atmosphericmodel has a resolution of ∼38 km (T382) with 64 vertical lev-els. These data are collected every 6 h. However, the daily aver-age was used for this study to describe the main characteristicsof the flow at high, medium and low levels of the troposphereand to compare the characteristics identified in this study withthose identified by Garreaud (2000). The pressure reduced tomean sea level (Pmsl, hPa), temperature (∘C), and specific humid-ity (g kg−1) at 925 hPa, zonal and meridional wind components(m s−1) at 925 and 250 hPa, vertical velocity (Pa s−1) at 500 hPaand geopotential height (m2 s−2) at 500 hPa were evaluated.Daily minimum, maximum and mean temperatures (Tmin, Tmax
and Tmed, respectively) and minimum, maximum and average(Pmin, Pmax and Pmin, respectively) pressures from the Depart-ment of Airspace Control (DCEA) surface stations at Vilhena,Rio Branco, Porto Velho, Cruzeiro do Sul and Tabatinga from1979 to 2008 were used. The analysed cities are located in thesouth, southwest and west of the Brazilian Amazon (Figure 1)along the path of the frontal systems from southern South Amer-ica, where cold air incursions cause friagem events. These datawere used to identify friagem events in Vilhena and to study thebehaviour of these parameters in all five cities.Friagem events that occurred in the austral winter (May to
September) were identified. The frequency of occurrence offrontal systemswas highest during thesemonths (Satyamurty andLima, 1994). The friagem events that occurred in the southernAmazon were identified at the Vilhena station; this station islocated in the southern Amazon region, where the effects of thefrontal systems are detected more easily than in other locations.
Figure 1. Location of the studied region with cities indicated by blackdots.
In this study, the objective criteria used to detect cold waves inthe southern Amazon included decreases in Tmin (DTmin), Tminand Pmed in Vilhena. The one-day decrease in Tmin is defined asfollows:
DTmin (d) = Tmin (d) − Tmin (d − 1) and DT =(DTmin (d) < 0
)
where Tmin(d) is Tmin of the current day, Tmin(d− 1) is Tmin of theprevious day and DT is the decrease in Tmin. The climatologicalmean values DT (DTClim) and Pmed (PmedClim) were calculated foreach of the five analysed months (May to September).For each month, the criteria used to define friagem events in
the southern Amazon include the following conditions:
1. Tmin ≤ 16 ∘C (the minimum temperature for the day of theevent must be <16 ∘C). This value was determined by calcu-lating the average of the climatological averages of Tmin ofeach month and subtracting the mean standard deviation ofthe Tmin of the 5 month period;
2. |DT|> |DTClim| (the one day decrease in minimum temper-ature for the day of the event must be greater than the clima-tological average for the month);
3. Pmed >PmedClim + 0.5�PNM (the mean pressure for the dayof the event must be greater than the sum of the meanclimatological pressure and half of the standard deviation ofthe pressure for the month).
The day when the above criteria have been met (i.e. the begin-ning of a friagem event in Vilhena) is defined as day D0. Sev-eral statistical calculations were performed using DCEA data forfriagem events (D0), for example, the frequency distribution ofevents and Tmin, Tmax and mean values of various parameters.Moreover, themean values of the temperature, temperature trend,and Pmsl of selected events were calculated from the time seriesDCEA data in all five cities from days D−4 to D−1 and fromday D0 to D+4. The field and anomaly composites were createdwith CFSR reanalysis data to identify the characteristic means ofthe atmospheric circulation associated with friagem events in the
© 2014 Royal Meteorological Society Meteorol. Appl. (2014)

Outbreaks in Amazonia
Amazon. The field composites and anomalies are defined for thedays preceding day D0 (D−3, D−2, and D−1) and for the daysfollowing day D0 (D1 and D2). The composite anomalies con-sisted of the difference between the friagem event means and the30 year seasonal mean; differences between variables were testedfor statistical significance using Student’s t-test (Wilks, 2011).
3. Results
3.1. Analysis of the mean cases
Table 1 presents the monthly mean values of the parameters usedto detect friagem events at Vilhena for normal days and friagemevent days. The average Tmin was 4.5
∘C lower on friagem daysthan on normal days. A pronounced decrease in the averageTmin was observed during friagem events throughout the 5monthperiod; this decrease was most pronounced in July, when theaverage Tmin was 13.1
∘C. However, the difference between theTmin of friagem events (14 ∘C) and the mean climatologic Tmin(19 ∘C) from May to September was ∼5 ∘C, indicating that thefriagem events produced important decreases in temperature insouthern Amazonia. A trend towards increasing |DTmin| duringfriagem events was also observed; in particular, the DTmin inJuly was −4.4 ∘C. This finding indicates that the temperaturein southern Amazonia decreases significantly when the friagem
Table 1. Minimum temperature (Tmin), magnitude of the temperaturetrend (DTmin), mean Pmsl (Pmed), and minimum temperature standarddeviation (STmin) for climatology (May to September during the period1979–2008) and for identified friagem (cold outbreak) events in Vilhena.
Parameter May June July August September
Meanclimatology
Tmin 19.0 17.5 16.7 18.1 19.5
STmin 2.0 2.3 2.6 2.3 2.1|DTmin| 1.3 1.5 1.7 1.5 1.5Pmed 1015.7 1017.1 1017.4 1016.4 1015.1
Mean coldoutbreak
Tmin 14.0 13.4 13.1 14.1 14.4
STmin 3.9 4.2 4.4 4.4 5.0|DTmin| 3.9 4.2 4.4 4.4 5.0Pmed 1018.8 1020.4 1021.0 1019.3 1019.0
reaches the region. Furthermore, the mean pressure increased by∼3.6 hPa during friagem events, which illustrates the influenceof a high pressure system in the study area.Using the methodology described above, 144 friagem events
were identified between 1979 and 2008. The outbreaks of coldair occurred throughout all of the analysed months (Figure 2(a));however, the largest number of cases occurred in July (40 friagem
(a)
(b)
Figure 2. Frequency of (a) monthly and (b) annual friagem events in Vilhena.
© 2014 Royal Meteorological Society Meteorol. Appl. (2014)

R. M. D. Ricarte et al.
(a) (b)
Figure 3. Frequency distribution histogram of the (a) Tmin anomaly (∘C) and (b) Tmax anomaly (∘C) for Vilhena.
events). A total of 23, 25, 30 and 26 events were observed inMay, June, August and September, respectively. Satyamurty andLima (1994) similarly observed that 80% of intense extratropicalanticyclones passing through southern South America occurredfrom June to September, with a maximum in July.The interannual variability in the number of friagem events
occurring in Vilhena in the 30 year period is shown inFigure 2(b). The number of occurrences varied from 2 to10 cases per year, and an average of five events occurredeach year. This finding agrees with the reported five tosix annual cases reported in the Climanálise newsletter(http://climanalise.cptec.inpe.br/∼rclimanl/boletim/). The leastnumber of events (only two cases) occurred in 1989, 1997 and2007; the highest number of cold outbreaks occurred in 1981,1990 and 1993 (10, 8 and 7 cases, respectively). The maximumand minimum number of friagem events does not appear toconsistently coincide with El Niño, La Niña, or neutral years, asthe correlation between the number of events and the SouthernOscillation Index (SOI) IOS is very small and not statisticallysignificant. This study did not analyse the direct relationshipbetween the seasonal variability in the occurrence of cold airwaves and ENSO (EN) and La Niña (LN) events or whether ENand LN events produce large atmospheric circulation changes,for example, disturbances in surface temperature and pressureduring friagem events.The frequency distribution of Tmin and Tmax anomalies during
friagem events identified in Vilhena is shown in Figure 3. Tminanomalies ranged from −4 to −2 ∘C in 61 (42.4%) cases andfrom −6 to −4 ∘C in 49 cases (34%). Therefore, the Tmin rangedfrom −6 to −2 ∘C in 76.4% of all cases. The Tmin was lessthan −6 ∘C in only 23 events (15%). The Tmax anomalies rangedfrom −6 to −2 ∘C in 53 cases (36.8%). This value is lower thanthat of the Tmin anomaly of the same range. Nevertheless, arelatively large number of events (47%) had anomalies of lessthan −6 ∘C. Moreover, as shown in Figure 3, the temperaturedecreases were more pronounced during the afternoon. Thus,the cold air incursions associated with friagem events in theAmazon produced a large decrease in temperatures in generaland in maximum temperatures in particular.The time series of friagem events (Figure 4) shows the
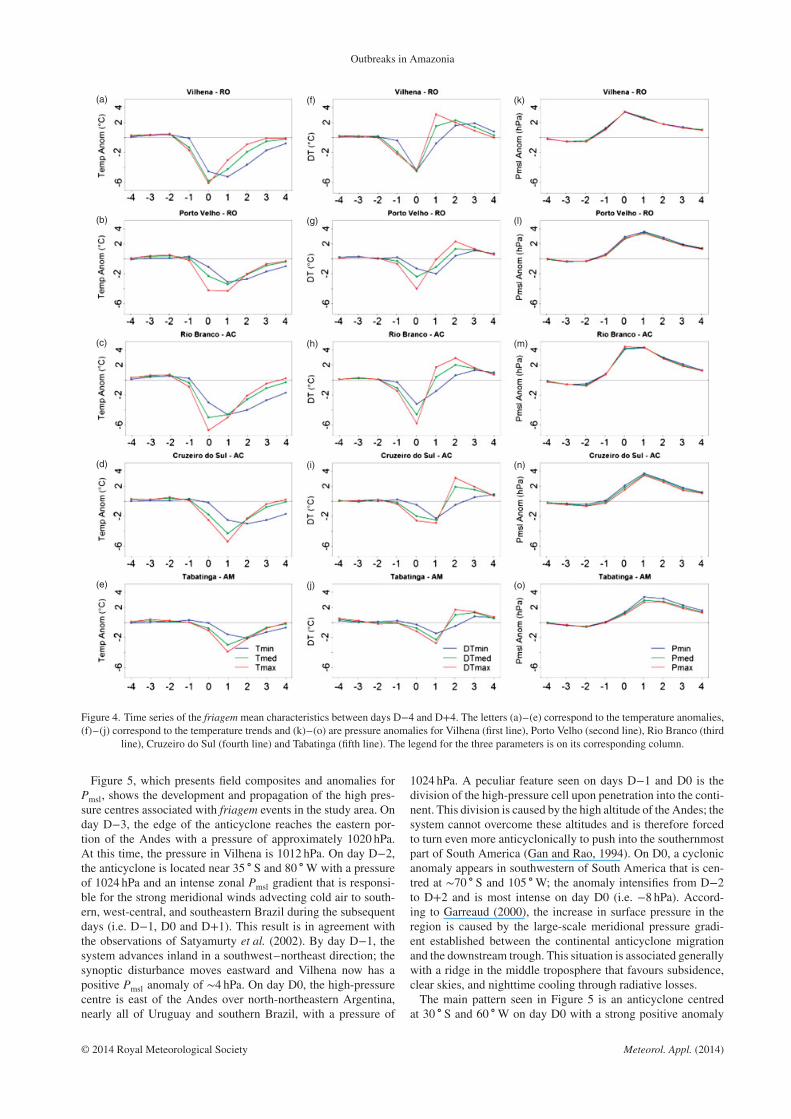
daily evolution in temperature (first column), air temperature
(second column) and mean sea level pressure (third column)anomalies 4 days before the onset of the friagem and 3 daysafter its arrival in the five cities located in southern and south-eastern Amazonia. The temperature anomalies (first columnin Figure 4) are positive during the 3 days prior to the event(D0) in Vilhena and Rio Branco. However, in other cities,this positive anomaly occurs during the 4 days prior to theonset of the friagem. The temperature anomaly at Vilhena,Porto Velho and Rio Branco decreases significantly on dayD0, and the reduction in Tmax is even more pronounced. InCruzeiro do Sul and Tabatinga, the same phenomenon occurson day D+1 when the system reaches the southwestern andwestern Amazon. A similar trend was observed in the tem-perature trend time series (second column in Figure 4). Thelarger decrease in temperature on day D0 is consistent with themaximum positive pressure anomalies (third column Figure 4)in Vilhena and Rio Branco. Similar decreases occurred onday D+1 in Tabatinga and Cruzeiro do Sul. This behaviourillustrates the effects of the entry of masses of cold air through-out the entire region. Starting on day D+1 in Vilhena, PortoVelho and Cruzeiro do Sul the atmosphere began to nor-malise: temperatures began to rise, and pressures tended todecrease. This finding is consistent with results of Marengoet al. (1997b), who showed that changes in meteorologicalvariables require an average of 5–6 days to return to theirnormal conditions.
3.2. Mean synoptic characteristics of friagem events
Diagnostic fields are important for understanding the variousphysical processes responsible for the cyclone and anticyclonestructure associated with friagem phenomena and their evolutionand progression. From the dataset of 144 cold air incursion eventsin the southern Amazon region, composite fields were obtainedfor 6 day periods (3 days prior and 2 days after the friagemevents) to analyse the main synoptic patterns associated withfrontal systems that affect the southern part of northern Braziland produce friagem events and to determine the fundamentalcharacteristics of the studied systems.
© 2014 Royal Meteorological Society Meteorol. Appl. (2014)
Outbreaks in Amazonia
(a)
(b)
(c)
(d)
(e)
(f)
(g)
(h)
(i)
(j)
(k)
(l)
(m)
(n)
(o)
Figure 4. Time series of the friagemmean characteristics between days D−4 and D+4. The letters (a)–(e) correspond to the temperature anomalies,(f)–(j) correspond to the temperature trends and (k)–(o) are pressure anomalies for Vilhena (first line), Porto Velho (second line), Rio Branco (third
line), Cruzeiro do Sul (fourth line) and Tabatinga (fifth line). The legend for the three parameters is on its corresponding column.
Figure 5, which presents field composites and anomalies forPmsl, shows the development and propagation of the high pres-sure centres associated with friagem events in the study area. Onday D−3, the edge of the anticyclone reaches the eastern por-tion of the Andes with a pressure of approximately 1020 hPa.At this time, the pressure in Vilhena is 1012 hPa. On day D−2,the anticyclone is located near 35 ∘ S and 80 ∘W with a pressureof 1024 hPa and an intense zonal Pmsl gradient that is responsi-ble for the strong meridional winds advecting cold air to south-ern, west-central, and southeastern Brazil during the subsequentdays (i.e. D−1, D0 and D+1). This result is in agreement withthe observations of Satyamurty et al. (2002). By day D−1, thesystem advances inland in a southwest–northeast direction; thesynoptic disturbance moves eastward and Vilhena now has apositive Pmsl anomaly of ∼4 hPa. On day D0, the high-pressurecentre is east of the Andes over north-northeastern Argentina,nearly all of Uruguay and southern Brazil, with a pressure of
1024 hPa. A peculiar feature seen on days D−1 and D0 is thedivision of the high-pressure cell upon penetration into the conti-nent. This division is caused by the high altitude of the Andes; thesystem cannot overcome these altitudes and is therefore forcedto turn even more anticyclonically to push into the southernmostpart of South America (Gan and Rao, 1994). On D0, a cyclonicanomaly appears in southwestern of South America that is cen-tred at ∼70 ∘ S and 105 ∘W; the anomaly intensifies from D−2to D+2 and is most intense on day D0 (i.e. −8 hPa). Accord-ing to Garreaud (2000), the increase in surface pressure in theregion is caused by the large-scale meridional pressure gradi-ent established between the continental anticyclone migrationand the downstream trough. This situation is associated generallywith a ridge in the middle troposphere that favours subsidence,clear skies, and nighttime cooling through radiative losses.The main pattern seen in Figure 5 is an anticyclone centred
at 30 ∘ S and 60 ∘W on day D0 with a strong positive anomaly
© 2014 Royal Meteorological Society Meteorol. Appl. (2014)

R. M. D. Ricarte et al.
(a) (b)
(c) (d)
(e) (f)
Figure 5. Field composites (contours) and anomalies (shaded) of Pmsl in hPa for days D−3 to D+2. Pmsl values greater (less) than 1016 hPa arerepresented with solid (dotted) lines at intervals of 4 hPa.
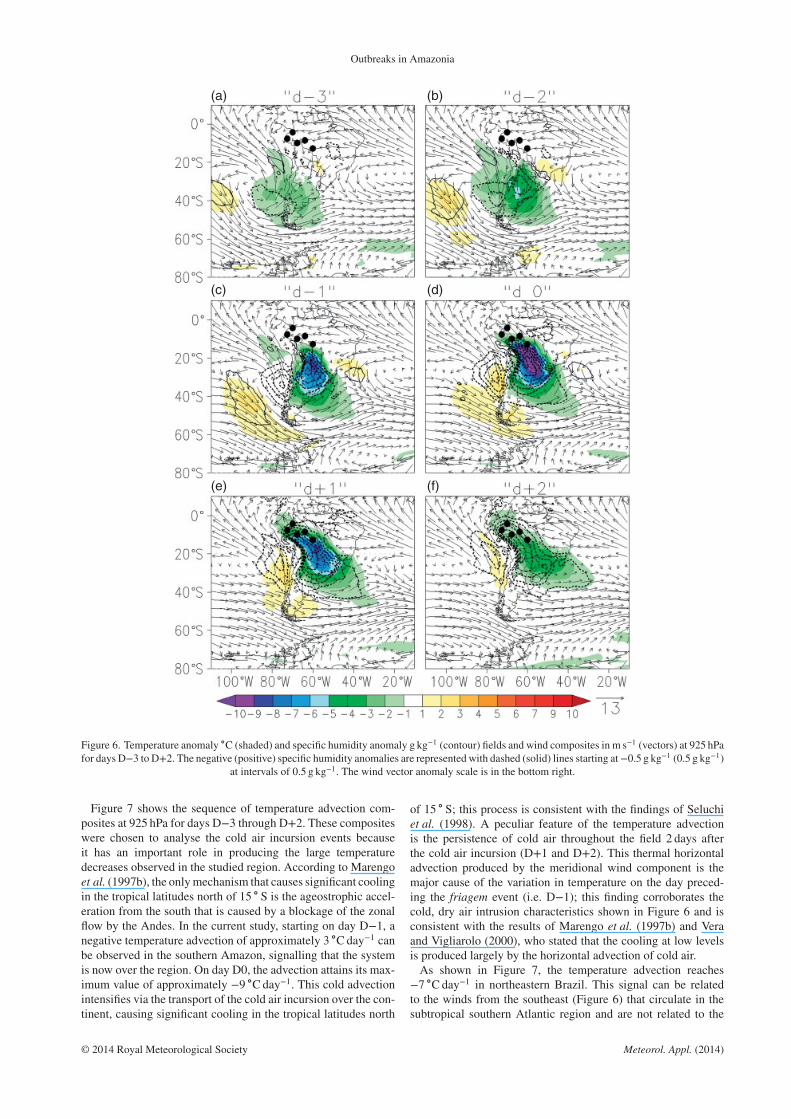
of 10 hPa from 50 ∘ S to 10 ∘ S that draws cold air toward 10 ∘ S(see Figure 7). This feature is a synoptic signature of friagemevents and is in agreement with the results of Pezza and Ambrizzi(2005). Müller et al. (2005) found similar synoptic weatherpatterns in their classification of frosts: these authors identifieda low-pressure system on the eastern edge of the continent anda high-pressure system that originates in the Pacific Ocean andcrosses over the humid pampas, creating a strong incursion ofcold, dry air from the south. A similar phenomenon is illustratedin Figure 5.Figure 6 depicts temperature and specific humidity anoma-
lies and wind vector composites at 925 hPa. Beginning on dayD−1, an area of negative temperature anomalies is presentbetween 40 ∘ S and 12 ∘ S, indicating the prominence of con-ditions of cold, dry air that approximately coincide with themaximum Pmsl anomaly shown in Figure 5. Moreover, negative
anomalies >10 ∘C associated with a frontal system can be foundover Paraguay, south-central Brazil, and western Amazonia. Thenorthwest–southeast orientation of this system is typical of thefrontal-type incursion into the western Amazon.Drainage winds at low levels (Figure 6) produce a southerly
flow on days D−1 and D0; this flow, in turn, produces a strongadvection of cold air towards central and northern South Amer-ica. The anticyclonic circulation over the southern Pacific Ocean,which is prominent through the entire period, is associatedwith the anticyclone previously described in Figure 5 (in agree-ment with the pattern found between days D−3 and D−1).This anticyclone is responsible for strong northerly winds thatflow to the east of the high-pressure centre and skirt southernSouth America. The flow turns anticyclonically and enters thecontinent with a southerly component on the lee side of theAndes.
© 2014 Royal Meteorological Society Meteorol. Appl. (2014)
Outbreaks in Amazonia
(a) (b)
(c) (d)
(e) (f)
Figure 6. Temperature anomaly ∘C (shaded) and specific humidity anomaly g kg−1 (contour) fields and wind composites in m s−1 (vectors) at 925 hPafor days D−3 to D+2. The negative (positive) specific humidity anomalies are represented with dashed (solid) lines starting at−0.5 g kg−1 (0.5 g kg−1)
at intervals of 0.5 g kg−1. The wind vector anomaly scale is in the bottom right.
Figure 7 shows the sequence of temperature advection com-posites at 925 hPa for days D−3 through D+2. These compositeswere chosen to analyse the cold air incursion events becauseit has an important role in producing the large temperaturedecreases observed in the studied region. According to Marengoet al. (1997b), the onlymechanism that causes significant coolingin the tropical latitudes north of 15 ∘ S is the ageostrophic accel-eration from the south that is caused by a blockage of the zonalflow by the Andes. In the current study, starting on day D−1, anegative temperature advection of approximately 3 ∘Cday−1 canbe observed in the southern Amazon, signalling that the systemis now over the region. On day D0, the advection attains its max-imum value of approximately −9 ∘Cday−1. This cold advectionintensifies via the transport of the cold air incursion over the con-tinent, causing significant cooling in the tropical latitudes north
of 15 ∘ S; this process is consistent with the findings of Seluchiet al. (1998). A peculiar feature of the temperature advectionis the persistence of cold air throughout the field 2 days afterthe cold air incursion (D+1 and D+2). This thermal horizontaladvection produced by the meridional wind component is themajor cause of the variation in temperature on the day preced-ing the friagem event (i.e. D−1); this finding corroborates thecold, dry air intrusion characteristics shown in Figure 6 and isconsistent with the results of Marengo et al. (1997b) and Veraand Vigliarolo (2000), who stated that the cooling at low levelsis produced largely by the horizontal advection of cold air.As shown in Figure 7, the temperature advection reaches
−7 ∘Cday−1 in northeastern Brazil. This signal can be relatedto the winds from the southeast (Figure 6) that circulate in thesubtropical southern Atlantic region and are not related to the
© 2014 Royal Meteorological Society Meteorol. Appl. (2014)

R. M. D. Ricarte et al.
(a) (b)
(c) (d)
(e) (f)
Figure 7. Composite fields of temperature advection (∘Cday−1) for days D−3 to D+2.
friagem events. The zonal wind is dominant in the temperatureadvection because the easterly winds are more intense thanthe southerly winds and because there is a large difference intemperatures between the continent and the ocean. The negativetemperature advection in northeastern Brazil is consistent withthis scenario.The analysis of the 500 hPa geopotential anomaly field is
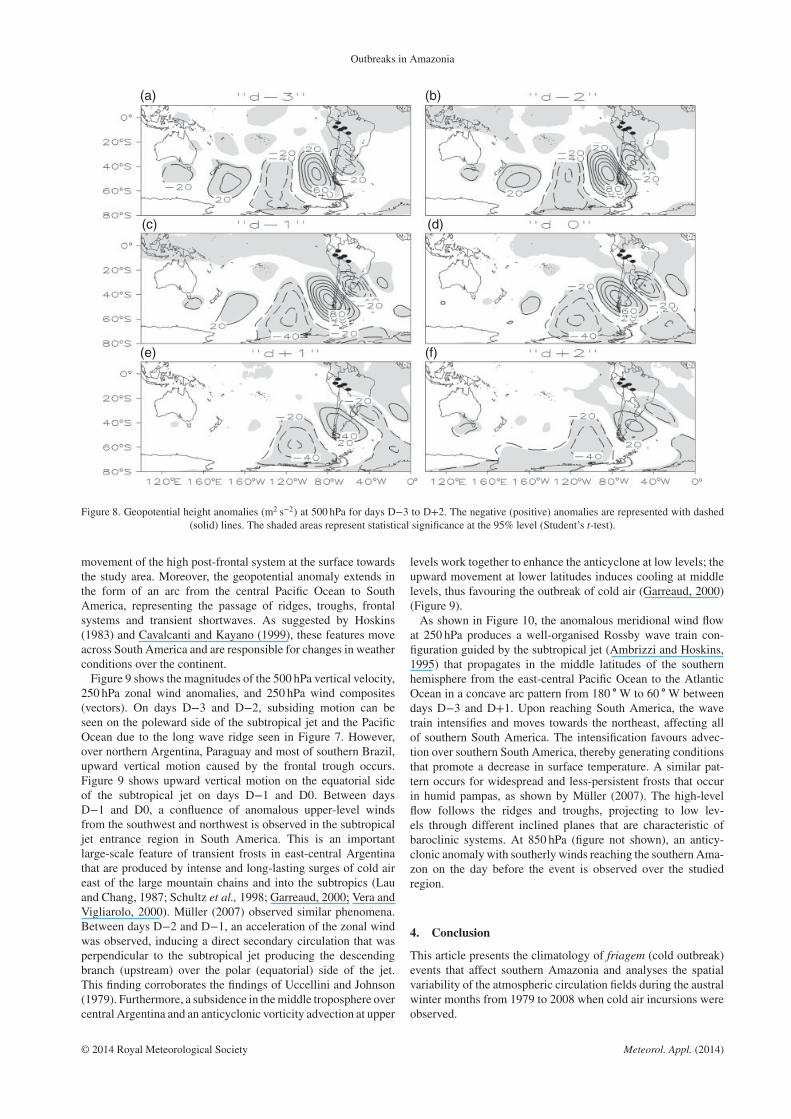
shown in Figure 8 for days D−3 to D+2. The synoptic patternobtained in this study is characteristic of polar air incursionsthat affect South America. The evolution of an intense baroclinicwave is quite evident when this wave is compared with thePmsl anomaly field seen in Figure 5. The day before the event,anticyclonic anomalies of +100m2 s−2 and −70m2 s−2 couldbe detected over the Andes and over northeastern Argentina,Uruguay, and throughout southern Brazil, respectively. On dayD0, the anticyclonic anomaly extends over a large portion ofsouthern South America covering nearly all of Argentina; onD+1, the wave moves eastward towards the Atlantic Ocean.From days D−3 to D−1, the intense cyclonic anomaly that formsa cyclonic centre between 33 ∘ S and 52 ∘W is amplified; on dayD−1, an anticyclonic anomaly develops in south-central Chile
andmoves eastwardwith the upper level system that intensifies asit follows a trajectory to the lee side of the Andes. As indicated byLichtenstein (1989) during the passage of anticyclones across theAndes the cold air at low levels cannot cross the upper parts of themountains in southwestern South America. The frontal systemtherefore circumvents the obstacle, turning anticyclonically andincreasing its anticyclonic vorticity. According to Lichtenstein(1989) the two anomalies (cyclonic and anticyclonic) south of30 ∘ S deepen mainly because of the advection of vorticity atupper levels within the mid-latitude baroclinic wave.In agreement with Gan and Seluchi (2009) the combination of
these systems produces a feedback mechanism with baroclinicwaves that amplifies these waves at upper levels. This processintensifies the southerly wind over the continent, which, in turn,causes an increase in cold air advection and intensifies the trough(Gan and Seluchi, 2009). This cold wave pattern is seen at highand medium levels (shown above) and agrees with findings ofMarengo et al. (1997b), Garreaud (1999), Vera and Vigliarolo(2000) and Müller et al. (2005). As shown in Figures 5 and 8, onday D0, the maximum positive Pmsl anomaly occurs at the sametime as themaximumnegative geopotential anomaly, indicating a
© 2014 Royal Meteorological Society Meteorol. Appl. (2014)
Outbreaks in Amazonia
(a) (b)
(c) (d)
(e) (f)
Figure 8. Geopotential height anomalies (m2 s−2) at 500 hPa for days D−3 to D+2. The negative (positive) anomalies are represented with dashed(solid) lines. The shaded areas represent statistical significance at the 95% level (Student’s t-test).
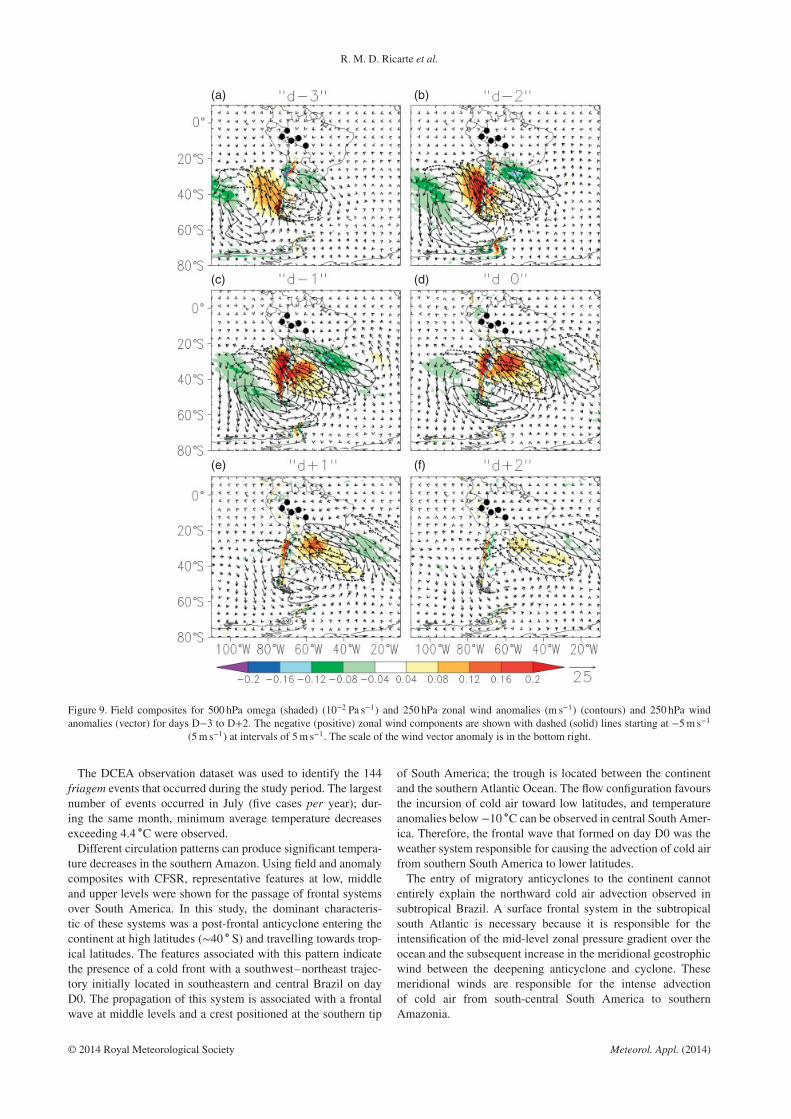
movement of the high post-frontal system at the surface towardsthe study area. Moreover, the geopotential anomaly extends inthe form of an arc from the central Pacific Ocean to SouthAmerica, representing the passage of ridges, troughs, frontalsystems and transient shortwaves. As suggested by Hoskins(1983) and Cavalcanti and Kayano (1999), these features moveacross South America and are responsible for changes in weatherconditions over the continent.Figure 9 shows the magnitudes of the 500 hPa vertical velocity,
250 hPa zonal wind anomalies, and 250 hPa wind composites(vectors). On days D−3 and D−2, subsiding motion can beseen on the poleward side of the subtropical jet and the PacificOcean due to the long wave ridge seen in Figure 7. However,over northern Argentina, Paraguay and most of southern Brazil,upward vertical motion caused by the frontal trough occurs.Figure 9 shows upward vertical motion on the equatorial sideof the subtropical jet on days D−1 and D0. Between daysD−1 and D0, a confluence of anomalous upper-level windsfrom the southwest and northwest is observed in the subtropicaljet entrance region in South America. This is an importantlarge-scale feature of transient frosts in east-central Argentinathat are produced by intense and long-lasting surges of cold aireast of the large mountain chains and into the subtropics (Lauand Chang, 1987; Schultz et al., 1998; Garreaud, 2000; Vera andVigliarolo, 2000). Müller (2007) observed similar phenomena.Between days D−2 and D−1, an acceleration of the zonal windwas observed, inducing a direct secondary circulation that wasperpendicular to the subtropical jet producing the descendingbranch (upstream) over the polar (equatorial) side of the jet.This finding corroborates the findings of Uccellini and Johnson(1979). Furthermore, a subsidence in themiddle troposphere overcentral Argentina and an anticyclonic vorticity advection at upper
levels work together to enhance the anticyclone at low levels; theupward movement at lower latitudes induces cooling at middlelevels, thus favouring the outbreak of cold air (Garreaud, 2000)(Figure 9).As shown in Figure 10, the anomalous meridional wind flow
at 250 hPa produces a well-organised Rossby wave train con-figuration guided by the subtropical jet (Ambrizzi and Hoskins,1995) that propagates in the middle latitudes of the southernhemisphere from the east-central Pacific Ocean to the AtlanticOcean in a concave arc pattern from 180 ∘W to 60 ∘W betweendays D−3 and D+1. Upon reaching South America, the wavetrain intensifies and moves towards the northeast, affecting allof southern South America. The intensification favours advec-tion over southern South America, thereby generating conditionsthat promote a decrease in surface temperature. A similar pat-tern occurs for widespread and less-persistent frosts that occurin humid pampas, as shown by Müller (2007). The high-levelflow follows the ridges and troughs, projecting to low lev-els through different inclined planes that are characteristic ofbaroclinic systems. At 850 hPa (figure not shown), an anticy-clonic anomaly with southerly winds reaching the southern Ama-zon on the day before the event is observed over the studiedregion.
4. Conclusion
This article presents the climatology of friagem (cold outbreak)events that affect southern Amazonia and analyses the spatialvariability of the atmospheric circulation fields during the australwinter months from 1979 to 2008 when cold air incursions wereobserved.
© 2014 Royal Meteorological Society Meteorol. Appl. (2014)
R. M. D. Ricarte et al.
(a) (b)
(c) (d)
(e) (f)
Figure 9. Field composites for 500 hPa omega (shaded) (10−2 Pa s−1) and 250 hPa zonal wind anomalies (m s−1) (contours) and 250 hPa windanomalies (vector) for days D−3 to D+2. The negative (positive) zonal wind components are shown with dashed (solid) lines starting at −5m s−1
(5m s−1) at intervals of 5m s−1. The scale of the wind vector anomaly is in the bottom right.
The DCEA observation dataset was used to identify the 144friagem events that occurred during the study period. The largestnumber of events occurred in July (five cases per year); dur-ing the same month, minimum average temperature decreasesexceeding 4.4 ∘C were observed.Different circulation patterns can produce significant tempera-
ture decreases in the southern Amazon. Using field and anomalycomposites with CFSR, representative features at low, middleand upper levels were shown for the passage of frontal systemsover South America. In this study, the dominant characteris-tic of these systems was a post-frontal anticyclone entering thecontinent at high latitudes (∼40 ∘ S) and travelling towards trop-ical latitudes. The features associated with this pattern indicatethe presence of a cold front with a southwest–northeast trajec-tory initially located in southeastern and central Brazil on dayD0. The propagation of this system is associated with a frontalwave at middle levels and a crest positioned at the southern tip
of South America; the trough is located between the continentand the southern Atlantic Ocean. The flow configuration favoursthe incursion of cold air toward low latitudes, and temperatureanomalies below −10 ∘C can be observed in central South Amer-ica. Therefore, the frontal wave that formed on day D0 was theweather system responsible for causing the advection of cold airfrom southern South America to lower latitudes.The entry of migratory anticyclones to the continent cannot
entirely explain the northward cold air advection observed insubtropical Brazil. A surface frontal system in the subtropicalsouth Atlantic is necessary because it is responsible for theintensification of the mid-level zonal pressure gradient over theocean and the subsequent increase in the meridional geostrophicwind between the deepening anticyclone and cyclone. Thesemeridional winds are responsible for the intense advectionof cold air from south-central South America to southernAmazonia.
© 2014 Royal Meteorological Society Meteorol. Appl. (2014)

Outbreaks in Amazonia
(a) (b)
(c) (d)
(e) (f)
Figure 10. Fields of 250 hPa meridional wind anomalies (m s−1) for days D−3 to D+2. The negative (positive) values are shown with dashed (solid)lines. The shaded areas represent statistical significance at the 95% level (Student’s t-test).
The incursion of cold air represents a weather phenomenonwith a variable duration and an irregular frequency in tropicalBrazil and in the western Amazon. The number of occurrencesvaried from 2 to 10 cases per year, and an average of fiveevents occurred each year during the austral winter. In general,a typical wave of cold dry air dominates the weather conditionsin southern and southwestern Amazonia, causing the lowering ofthe pre-established minimum and maximum temperatures.
Acknowledgments
The authors acknowledge the financial support of theInter-American Institute for Global Change Research (IAI)Cooperative Research Network 2094 (CRN-2094), Coor-denação de Aperfeiçoamento de Pessoal de Nível Superior(CAPES) scholarship and PROEX/CAPES.
References
Ambrizzi T, Hoskins B. 1995. Rossby wave propagation and teleconnec-tion patterns in the austral winter. J. Atmos. Sci. 52: 3661–3672.
Cavalcanti IFA, Kayano MT. 1999. High frequency patterns of theatmospheric circulation over the Southern Hemisphere and SouthAmerica. Meterol. Atmos. Phys. 69: 179–193.
Escobar GC, Compagnucci J, Bischoff RHS. 2004. Sequence patterns of1000 hPa and 500 hPa geopotential height fields associated with coldsurges in Buenos Aires. Atmosfera 12: 69–89.
Fortune M, Kousky VE. 1983. Two severe freezes in Brazil: precursorsand synoptic evolution.Mon. Weather Rev. 111: 181–196.
Gan MA, Rao VB. 1994. The influence of the Andes cordillera ontransient disturbances. Mon. Weather Rev. 122: 1141–1157.
Gan MA, Seluchi ME. 2009. Ciclones e ciclogênese. In Tempo e Climado Brasil, Cavalcanti IFA, Ferreira NJ, Dias MAF, Justi MGA (eds).Oficina de textos: São Paulo; 111–125.
Garreaud RD. 1999. Cold air incursions over subtropical and tropicalSouth America. A numerical case study. Mon. Weather Rev. 122:2823–2853.
Garreaud RD. 2000. Cold air incursions over subtropical South America:mean structure and dynamics. Mon. Weather Rev. 128: 2544–2559.
Hamilton M, Tarifa J. 1978. Synoptic aspects of a polar outbreak lead-ing to frost in tropical Brazil, July 1972. Mon. Weather Rev. 106:1545–1556.
Harman JR. 1987. Mean monthly North American anticyclone frequen-cies, 1950–1979.Mon. Weather Rev. 115: 2840–2848.
Hoskins BJ. 1983. Dynamical processes in the atmosphere and the useof models. Q. J. R. Meteorol. Soc. 109: 1–21.
Krishnamurti TN, TewariM, ChakrabortyDR,Marengo J, SilvaDias PL,Satyamurty P. 1999. Downstream amplification: a possible precursorto major freeze events over southeastern Brazil.Weather Forecast. 14:242–270.
LauKM, Chang CP. 1987. Planetary scale aspects of the winter monsoonand atmospheric teleconnection. InMonsoonMeteorology, Chang CP,Krishnamurti TN (eds). Oxford University Press: London; 161–202.
Lichtenstein, E. 1989. Some influences of the Andes cordillera on thesynoptic scale circulation. Preprints, Third International Congress onSouthern Hemisphere Meteorology and Oceanography, Buenos Aires,Argentina. AMS, 156–159.
Marengo JA, Ambrizzi T, Kiladis G, Liebmann B. 2002. Upper-airwave trains over the Pacific Ocean and wintertime cold surgesin tropical-subtropical South America leading the freezes insouthern and southeastern Brazil. Theor. Appl. Climatol. 73:223–242.
Marengo J, Cornejo A, Satyamurty P, Nobre C, Sea W. 1997a. Coldsurges in tropical and extratropical South America: the strong event inJune 1994.Mon. Weather Rev. 125: 2759–2786.
Marengo JA,Nobre C, Culf AD. 1997b. Climatic impacts of “friagens” inforested and deforested areas of the Amazon basin. J. Appl. Meteorol.36: 1553–1566.
© 2014 Royal Meteorological Society Meteorol. Appl. (2014)

R. M. D. Ricarte et al.
Müller GV. 2007. Patterns leading to extreme events in Argentina: partialand generalized frosts. Int. J. Climatol. 27: 1373–1387.
Müller GV, Ambrizzi T, Nunez MN. 2005. Mean atmospheric circula-tion leading to generalized frosts in Central Southern South America.Theor. Appl. Climatol. 82: 95–112.
Myers VA. 1964. A cold front invasion of Southern Venezuela. Mon.Weather Rev. 92: 513–521.
Parmenter FC. 1976. A Southern Hemisphere cold front passage at theequator. Bull. Am. Meteorol. Soc. 57: 1435–1440.
Pezza AB, Ambrizzi T. 2005. Dynamical conditions and synoptic tracksassociated with different types of cold surge over tropical SouthAmerica. Int. J. Climatol. 25: 215–241.
Saha S,Moorthi S, Pan HL,WuXR,Wang JD, Nadiga S, Tripp P, KistlerR, Woollen J, Behringer D, Liu HX, Stokes D, Grumbine R, Gayno G,Wang J, Hou YT, Chuang HY, Juang HMH, Sela J, Iredell M, TreadonR, Kleist D, Van Delst P, Keyser D, Derber J, Ek M, Meng J, Wei HL,Yang RQ, Lord S, Van den Dool H, Kumar A, Wang WQ, Long C,Chelliah M, Xue Y, Huang BY, Schemm JK, Ebisuzaki W, Lin R,Xie PP, Chen MY, Zhou ST, Higgins W, Zou CZ, Liu QH, Chen Y,HanY, Cucurull L, Reynolds RW,RutledgeG,GoldbergM. 2010. TheNCEP climate forecast system reanalysis. Bull. Am.Meteorol. Soc. 91:1015–1057.
Satyamurty P, Fonseca JFB, Bottino MJ, Seluchi ME, Louren MCM,Gonçalves LGG. 2002. An early freeze in southern Brazil in April1999 and its NWP guidance.Meteorol. Appl. 8: 1–16.
Satyamurty P, Lima LCE. 1994. Movimento e intensificação de antici-clones extratropicais na região sul americana. Anais do VIII CBMet 2:75–77.
Schultz DM, Bracken WE, Bosart LF. 1998. Planetary and synoptic-scale signatures associated with central american cold surges. Mon.Weather Rev. 126: 5–27.
Seluchi ME, Marengo JA. 2000. Tropical-extratropical exchange of airmasses during summer and winter in South America: climatic aspectsand extreme events. Int. J. Climatol. 20: 1167–1190.
Seluchi M, Serafini YV, Treut HL. 1998. The impact of the Andes ontransient atmospheric systems: a comparison between observationsand GCM results. Mon. Weather Rev. 126: 895–912.
Uccellini LW, Johnson DR. 1979. The coupling of upper and lowertropospheric jet streaks and implications in development of severeconvective storms. Mon. Weather Rev. 107: 682–703.
Vera CS, Vigliarolo PK. 2000. A diagnostic study of cold-air outbreakover South America. Mon. Weather Rev. 128: 3–24.
Wilks DS. 2011. Statistical Methods in the Atmospheric Sciences. Else-vier: Oxford, UK. 704.
© 2014 Royal Meteorological Society Meteorol. Appl. (2014)