Source characteristics of hazardous Chihuahuan Desert dust outbreaks
12
Source characteristics of hazardous Chihuahuan Desert dust outbreaks Nancy I. Rivera Rivera a , Thomas E. Gill a, b, * , Max P. Bleiweiss c , Jenny L. Hand d a Environmental Science and Engineering Program, University of Texas at El Paso, 500 West University Ave., El Paso, TX 79968, USA b Department of Geological Sciences, University of Texas at El Paso, 500 West University Ave., El Paso, TX 79968, USA c Department of Entomology, Plant Pathology and Weed Science, New Mexico State University, Las Cruces, NM 88003, USA d Cooperative Institute for Research in the Atmosphere, Colorado State University, Fort Collins, CO 80523, USA article info Article history: Received 2 October 2009 Received in revised form 17 March 2010 Accepted 17 March 2010 Keywords: Dust Remote sensing Chihuahuan Desert Land cover AVHRR abstract The Chihuahuan Desert region is an important contributor to atmospheric dust loading and transport in North America; however, specific dust sources in this region are poorly characterized. Major dust events frequently are characterized by multiple dust plumes developing nearly simultaneously over a large region. Remote sensing data were used to identify the source locations and associated land cover for the most extreme dust events in the Chihuahuan Desert since 2002. Analysis of infrared channels utilizing brightness temperature differences was used to analyze data from geostationary and polar-orbiting satellites, from which dust sources were determined and located. This methodology was applied to the five dust events in the region that resulted in “hazardous” PM 10 levels in Texas per the USEPA’s Air Quality Index. Source locations determined from satellite images were used in conjunction with LANDSAT data and Google EarthÔ images to determine the corresponding land-surface features. Agricultural lands, playas, and their edges are pointed out as focus areas for dust emission, at least during the most intense events. The 130 dust plume initiation sites were relatively uniformly spaced over the landscape, not clumped into a few “hotspots,” suggesting the role of spatiotemporally random meteorological factors in determining major points of emission within and between dust storms. These findings provide an initial characterization of Chihuahuan Desert dust source locations and establish a baseline for continued research in determining potential locations for future dust outbreaks in the southwestern U.S. and northwestern Mexico. Ó 2010 Elsevier Ltd. All rights reserved. 1. Introduction The entrainment of mineral aerosols into the atmosphere by wind erosion represents an important process of landeatmosphere interaction (Washington et al., 2003). Mineral aerosols play an important role in earth’s climate, impacting the radiation budget, atmospheric photochemistry, and cloud processes (e.g. Kondratyev et al., 1983; Grini et al., 2005; Zender and Kwon, 2005; Mahowald et al., 2006). Dust events are important signs of environmental deterioration (Goudie, 2009). Goudie and Middleton (1992) describe numerous environmental and human-related consequences of dust storms, including soil erosion, sedimentation, disruption to infra- structure, pesticide transport, and other hazards. Recent research in the U.S. has shown a relationship between exposure to high levels of airborne mineral dust particles and respiratory illness (Chimonas and Gessner, 2007). Previous studies have used a variety of methods to monitor sources, frequency and magnitude of dust storms, including satellite and ground-based remote sensing and meteoro- logical data (Ackerman, 1997; Falke et al., 2001; Doyle and Dorling, 2002; Darmenova et al., 2005; Yin et al., 2005; Baddock et al., 2009) for potential impacts on climate, visibility and health-related air quality issues. Dust sources are predominantly associated with a few specific geomorphic features, especially topographical lows located in arid regions with annual rainfall under 200e250 mm, with limited or decreased vegetation cover (Prospero et al., 2002). Dust sources are often seasonal and are extremely sensitive to environmental conditions including high wind speeds, lack of non-erodible roughness elements, soil moisture, land-surface type, low threshold wind velocity and other factors (Gillette, 1999). The detection and characterization of dust events, their source regions and transport pathways has benefited to a great extent from the use of remote sensing at different scales (Prospero et al., 2002; Washington et al., 2003; Lee et al., 2009; Baddock et al., 2009; Ginoux et al., 2010). The determination of the geomorphic variability of dust sources, and the variability of the sediments that are entrained and transported as aerosols, requires the upwind (source) end of dust plumes to be * Corresponding author at: Department of Geological Sciences, University of Texas at El Paso, 500 West University Ave., El Paso, TX 79968, USA. Tel.: þ1 915 747 5168; fax: þ1 915 747 5073. E-mail address: [email protected] (T.E. Gill). Contents lists available at ScienceDirect Atmospheric Environment journal homepage: www.elsevier.com/locate/atmosenv 1352-2310/$ e see front matter Ó 2010 Elsevier Ltd. All rights reserved. doi:10.1016/j.atmosenv.2010.03.019 Atmospheric Environment 44 (2010) 2457e2468
-
Upload
independent -
Category
Documents
-
view
2 -
download
0
Transcript of Source characteristics of hazardous Chihuahuan Desert dust outbreaks
lable at ScienceDirect
Atmospheric Environment 44 (2010) 2457e2468
Contents lists avai
Atmospheric Environment
journal homepage: www.elsevier .com/locate/atmosenv
Source characteristics of hazardous Chihuahuan Desert dust outbreaks
Nancy I. Rivera Rivera a, Thomas E. Gill a,b,*, Max P. Bleiweiss c, Jenny L. Hand d
a Environmental Science and Engineering Program, University of Texas at El Paso, 500 West University Ave., El Paso, TX 79968, USAbDepartment of Geological Sciences, University of Texas at El Paso, 500 West University Ave., El Paso, TX 79968, USAcDepartment of Entomology, Plant Pathology and Weed Science, New Mexico State University, Las Cruces, NM 88003, USAdCooperative Institute for Research in the Atmosphere, Colorado State University, Fort Collins, CO 80523, USA
a r t i c l e i n f o
Article history:Received 2 October 2009Received in revised form17 March 2010Accepted 17 March 2010
Keywords:DustRemote sensingChihuahuan DesertLand coverAVHRR
* Corresponding author at: Department of GeoloTexas at El Paso, 500 West University Ave., El Paso, TX5168; fax: þ1 915 747 5073.
E-mail address: [email protected] (T.E. Gill).
1352-2310/$ e see front matter � 2010 Elsevier Ltd.doi:10.1016/j.atmosenv.2010.03.019
a b s t r a c t
The Chihuahuan Desert region is an important contributor to atmospheric dust loading and transport inNorth America; however, specific dust sources in this region are poorly characterized. Major dust eventsfrequently are characterized bymultiple dust plumes developing nearly simultaneously over a large region.Remote sensing data were used to identify the source locations and associated land cover for the mostextreme dust events in the ChihuahuanDesert since 2002. Analysis of infrared channels utilizing brightnesstemperature differences was used to analyze data from geostationary and polar-orbiting satellites, fromwhich dust sources were determined and located. This methodology was applied to the five dust eventsin the region that resulted in “hazardous” PM10 levels in Texas per the USEPA’s Air Quality Index. Sourcelocations determined from satellite images were used in conjunction with LANDSAT data and GoogleEarth� images to determine the corresponding land-surface features. Agricultural lands, playas, and theiredges are pointed out as focus areas for dust emission, at least during the most intense events. The 130dust plume initiation sites were relatively uniformly spaced over the landscape, not clumped into a few“hotspots,” suggesting the role of spatiotemporally random meteorological factors in determining majorpoints of emission within and between dust storms. These findings provide an initial characterization ofChihuahuan Desert dust source locations and establish a baseline for continued research in determiningpotential locations for future dust outbreaks in the southwestern U.S. and northwestern Mexico.
� 2010 Elsevier Ltd. All rights reserved.
1. Introduction
The entrainment of mineral aerosols into the atmosphere bywind erosion represents an important process of landeatmosphereinteraction (Washington et al., 2003). Mineral aerosols play animportant role in earth’s climate, impacting the radiation budget,atmospheric photochemistry, and cloud processes (e.g. Kondratyevet al., 1983; Grini et al., 2005; Zender and Kwon, 2005; Mahowaldet al., 2006). Dust events are important signs of environmentaldeterioration (Goudie, 2009). Goudie andMiddleton (1992) describenumerous environmental and human-related consequences of duststorms, including soil erosion, sedimentation, disruption to infra-structure, pesticide transport, and other hazards. Recent research inthe U.S. has shown a relationship between exposure to high levelsof airborne mineral dust particles and respiratory illness (Chimonasand Gessner, 2007). Previous studies have used a variety of methods
gical Sciences, University of79968, USA. Tel.: þ1 915 747
All rights reserved.
to monitor sources, frequency and magnitude of dust storms,including satellite and ground-based remote sensing and meteoro-logical data (Ackerman, 1997; Falke et al., 2001; Doyle and Dorling,2002; Darmenova et al., 2005; Yin et al., 2005; Baddock et al., 2009)for potential impacts on climate, visibility and health-related airquality issues.
Dust sources are predominantly associated with a few specificgeomorphic features, especially topographical lows located in aridregions with annual rainfall under 200e250 mm, with limited ordecreased vegetation cover (Prospero et al., 2002). Dust sourcesare often seasonal and are extremely sensitive to environmentalconditions including high wind speeds, lack of non-erodibleroughness elements, soil moisture, land-surface type, low thresholdwind velocity and other factors (Gillette, 1999). The detection andcharacterization of dust events, their source regions and transportpathways has benefited to a great extent from the use of remotesensing at different scales (Prospero et al., 2002; Washington et al.,2003; Lee et al., 2009; Baddock et al., 2009; Ginoux et al., 2010).The determination of the geomorphic variability of dust sources, andthe variability of the sediments that are entrained and transported asaerosols, requires the upwind (source) end of dust plumes to be
N.I. Rivera Rivera et al. / Atmospheric Environment 44 (2010) 2457e24682458
identified as accurately and precisely as possible (Baddocket al., 2009). Identification and cataloging of dust source points ina region allows for improved numerical modeling of the evolution ofindividual dust plumes and better forecasting of the onset and end ofdust storm conditions (Walker et al., 2009).While progress has beenmade in characterizingmineral dust in the atmosphere on the globalscale, there has been less advancement in identifying specific pointsources of dust plumes in the numerous global source regions, theenvironmental processes that affect dust generation at local scales,and the meteorological factors that affect its subsequent transport(Esmailli et al., 2006).
The Chihuahuan Desert, located in southwestern North Americaand northwestern Mexico, encompasses a climatic boundarybetween the subtropics and the middle latitudes, having a semiaridclimate consisting of relatively cool, dry winters and warm wetsummers (Castalgia and Fawcett, 2006). Blowing dust is a commonphenomenon at El Paso (Texas, USA)/Ciudad Juarez (Chihuahua,Mexico), the largest metropolitan area in the region, particularlyduring the windy spring months of March, April, and May (Novlanet al., 2007; Rivera Rivera et al., 2009). Similar seasonalities (springmaximum) have been observed with east Asian dust storms(Kim, 2008; Li et al., 2009). Convective (haboob-type) dust eventsare frequent in the Chihuahuan Desert during the North Americanmonsoon in summer; while dramatic in appearance, they aremostly local in scope and do not transport dust long distances.The first systematic investigation identifying dust sources in theChihuahuan Desert was by Prospero et al. (2002), whose globalinventory of dust sources used the Total Ozone Mapping Spec-trometer (TOMS) record; they identified “substantial but variablyactive” dust sources in the region.
Dust storms in drylands may be caused by a number of mete-orological phenomena (Zhang et al., 1997; Liu et al., 2003;Tegen et al., 2004). Regional climatic variables such as surface airtemperature, lack of precipitation, availability of erodible soilparticles and higher wind velocities are favorable conditions fordust storm occurrence and intensity (Gillette and Walker, 1977;Gillette, 1999; Nilgun and Nickovic, 2000; Ding et al., 2005). Thewind speed at a particular site associated with synoptic-scale dustevents depends primarily on the nature and strength of large-scaleweather systems influencing the region (Wigner and Peterson,1987). Lee cyclones developing downwind of the southern RockyMountains of North America (Bierly and Harrington,1995) are oftenassociated with strong southwesterly winds over the northern andeastern Chihuahuan Desert. Although dust storms associatedwith cyclogenesis are the least frequent, they are the most intense,and are associated with the lowest visibilities, highest particulateconcentrations, longest duration, and greatest total mass ofsediment moved. Similar conclusions regarding cyclogenetic duststorms have been made globally (Middleton et al., 1986), in othermajor dust source areas such as China (Qian et al., 2002; Takemiand Seino, 2005), and in the southern Great Plains immediatelynortheast of the Chihuahuan Desert (Wigner and Peterson, 1987;Lee and Tchakerian, 1995; Bernier et al., 1998). The mechanismsgenerating dust episodes in the Chihuahuan Desert are likelyto be similar to those causing dust events in the southern GreatPlains, due to their adjacent locations, their arid/semiarid andwindy climate, and the presence of erodible soils in both regions.Both sites have little precipitation, relatively bare soils and arerelatively cloudless during the driest, windiest part of the year.The Southern High Plains receives 73% of possible insolation at thesurface (Wigner and Peterson, 1987) and El Paso receives 88.2%(Gill, 2006). In such areas, when the soil and air are dry and solarheating is strong, convective updrafts created by intense heatingfrom the ground should enhance dust uplift (Engelstaedter andWashington, 2007a).
Characterizing dust sources in the Chihuahuan Desert is criticalbecause this region experiences dust outbreaks having continent-wide impacts (Park et al., 2007, 2009) and because land-surfacefeatures and meteorological conditions leading to these dust eventsare poorly studied to date. The transport of dust to urban regions inthis area contributes to air quality degradation, reduced visibility(Novlan et al., 2007), and may be associated with health effects(Yin et al., 2005; Peng et al., 2010). Improved characterization of dustsources in the Chihuahuan Desert will improve source apportion-ment, forecasting, andunderstandingof the potential effects of theseevents. This study aims to identify the locations and characterize theland use of the source areas giving rise to the most significant duststorms in the Chihuahuan Desert region of southwestern NorthAmerica, through the interpretation of remote sensing data.
2. Materials and methods
Remote sensing data used in this research include imagery fromNOAA (National Oceanic and Atmospheric Administration, USA)’sGOES (Geostationary Operational Environmental Satellite) andPOES (Polar-Orbiting Environmental Satellite) platforms. The GOESgeosynchronous orbit contains the Imager, a five-channel imagingradiometer with one visible and four infrared channels. Thedifferent channels have a spatial resolution of 1, 4 and 8 km. ThePOES is sun-synchronous and completes a polar orbit roughly 14.1times daily. The POES system has morning and afternoon satellites,providing global coverage four times daily. The Advanced VeryHigh Resolution Radiometer (AVHRR) on board the POES has fivechannels in the visible and infrared wavelengths with a spatialresolution of 1 km each. Therefore, AVHRR images have betterspatial resolution than GOES images, although GOES images havebetter temporal resolution since they are acquired every 15 min.AVHRR data used in this study is from the afternoon satellite passes,since dust events in the Chihuahuan Desert predominantly begin inthe afternoon hours.
A methodology for locating dust sources from satellite imagerywas developed to examine the most extreme dust events in theChihuahuan Desert since 2002. The first part of this period (through2005) was characterized by an ongoing, extreme, decade-longdrought in the region (Seager and Heim, 2009) that undoubtedlycontributed to frequent dust events (Rivera Rivera et al., 2009).Extremely strong monsoon rains in 2006 (Rogash et al., 2009) led towidespread “greening” of the Chihuahuan Desert; plant communitiesin the dust source region respond strongly to enhanced monsoonalprecipitation (Scuderi et al., 2010). This increase in wetland inunda-tion and grass cover almost completely suppressed dust production inthe Chihuahuan Desert from mid-2006 through 2007 (DominguezAcosta, 2009). Although anthropogenic fugitive dust and convectivedust storms (haboobs) are also frequent in the region (Rivera Riveraet al., 2009), only the most significant, synoptically-forced dustoutbreaks were selected for this study. The five cases selected for thisanalysis met two criteria: they produced plumes that were largeenough to be detected on satellite imagery, and resulted in a 24-haverage PM10 concentration at a Texas Commission on EnvironmentalQuality (TCEQ) air monitoring site in the El Paso metropolitan areaof at least 425 mg m�3, thus classified as “hazardous” on the U.S.Environmental Protection Agency (EPA) Air Quality Index (AQI) scale.Events meeting these criteria included March 8, 2002 and March 4,April 15, November 22, and December 26, 2003.
The methodology consisted of examining “split-window”
difference images using far infrared (far-IR) channels (Gu et al.,2003) in the various satellite images to highlight dust plumes.The split-window product is created by differencing the 12 mm and10.7 mm brightness temperatures (BTD), which highlights theabsorption (and subsequent emission) of thermal radiation by the
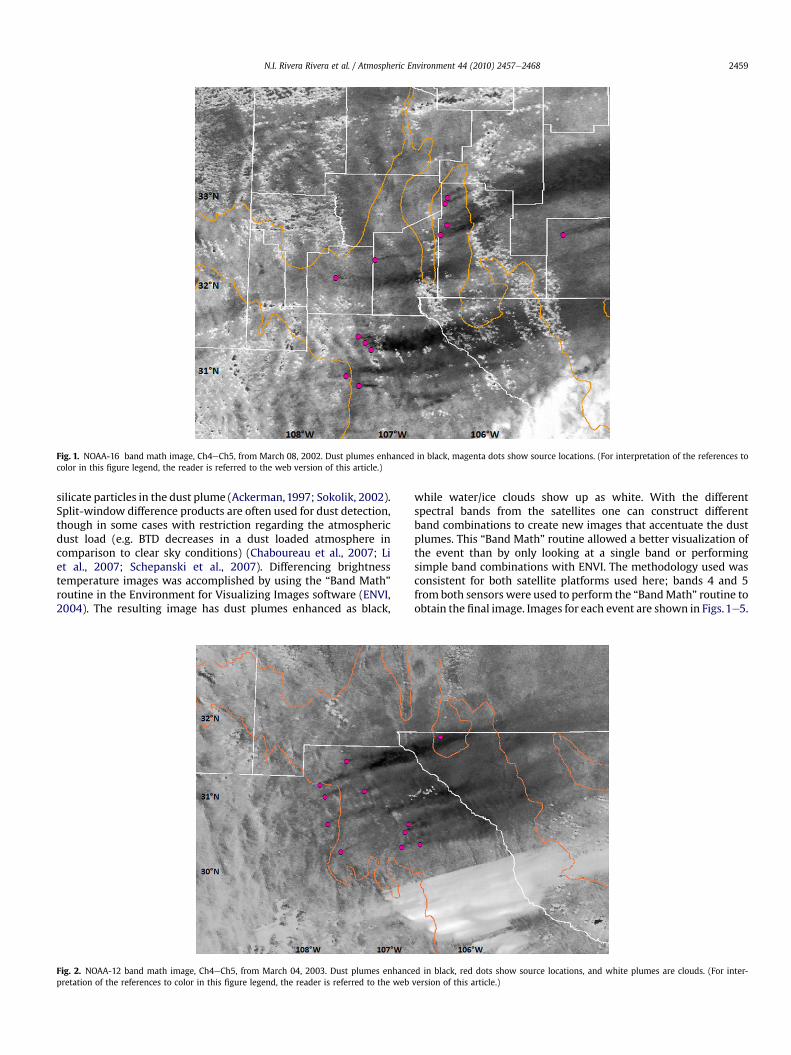
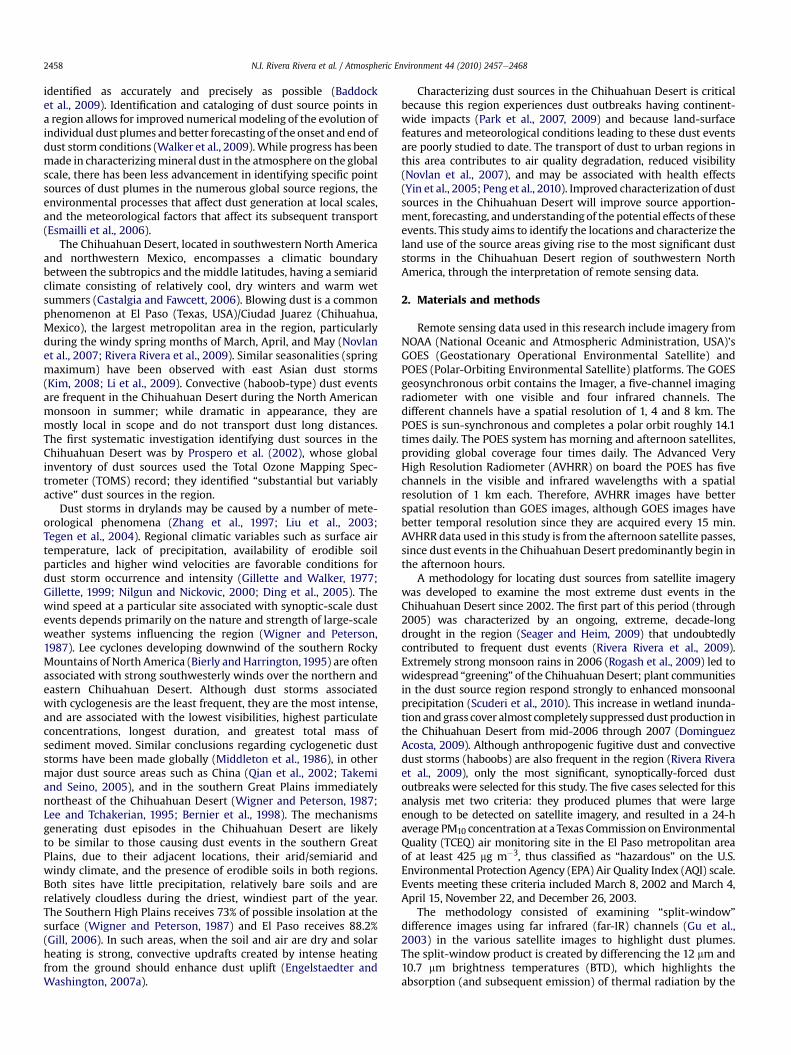
Fig. 1. NOAA-16 band math image, Ch4eCh5, from March 08, 2002. Dust plumes enhanced in black, magenta dots show source locations. (For interpretation of the references tocolor in this figure legend, the reader is referred to the web version of this article.)
N.I. Rivera Rivera et al. / Atmospheric Environment 44 (2010) 2457e2468 2459
silicate particles in the dust plume (Ackerman,1997; Sokolik, 2002).Split-window difference products are often used for dust detection,though in some cases with restriction regarding the atmosphericdust load (e.g. BTD decreases in a dust loaded atmosphere incomparison to clear sky conditions) (Chaboureau et al., 2007; Liet al., 2007; Schepanski et al., 2007). Differencing brightnesstemperature images was accomplished by using the “Band Math”routine in the Environment for Visualizing Images software (ENVI,2004). The resulting image has dust plumes enhanced as black,
Fig. 2. NOAA-12 band math image, Ch4eCh5, from March 04, 2003. Dust plumes enhancepretation of the references to color in this figure legend, the reader is referred to the web
while water/ice clouds show up as white. With the differentspectral bands from the satellites one can construct differentband combinations to create new images that accentuate the dustplumes. This “Band Math” routine allowed a better visualization ofthe event than by only looking at a single band or performingsimple band combinations with ENVI. The methodology used wasconsistent for both satellite platforms used here; bands 4 and 5from both sensors were used to perform the “BandMath” routine toobtain the final image. Images for each event are shown in Figs.1e5.
d in black, red dots show source locations, and white plumes are clouds. (For inter-version of this article.)

Fig. 3. NOAA-12 band math image, Ch4eCh5, from April 15, 2003. Dust plumes enhanced in black, red dots show source locations. (For interpretation of the references to color inthis figure legend, the reader is referred to the web version of this article.)
N.I. Rivera Rivera et al. / Atmospheric Environment 44 (2010) 2457e24682460
The latitudes and longitudes of the origins of the dust plumeswere estimated manually and obtained as closely as possible fromthe difference images, utilizing the ‘point collection’ tool from ENVI.The “point collection tool” is used manually by the software user tocollect pixel location and map location from the display window.The points were displayed and saved in a table as ASCII or ENVIvector files (EVFs) (ENVI, 2004).
The methodology utilized to locate the dust sources hasuncertainties, as pointed out by Lee et al. (2009). Differences intemporal and spatial resolution of the satellite imagery used topinpoint source locations can cause some discrepancy in the loca-tions. Dust plumes can be too faint to discern on imagery, dust
Fig. 4. NOAA-16 band math image, Ch4eCh5, from Nov. 22, 2003. Dust plumes enhanced inthis figure legend, the reader is referred to the web version of this article.)
sources are small areas rather than true points, the intensity of dustemission at each point is not known, and additional point sourcesmay be hidden beneath plumes downwind; thus, there is somesubjectivity in this approach to locate dust sources (Lee et al., 2009).These limitations were kept in mind as the work was performedand constrained the subsequent interpretations of the data. Theactual impacts of these factors on dust source determination, fullintercomparison of events, and exact attribution of sources wouldbe hard to discern without close reference to surface meteorolog-ical data (visibility, wind speed) and ground truthing during duststorms (Mahowald et al., 2007; Bullard et al., 2008; Baddock et al.,2009; Ginoux et al., 2010). However, Baddock et al. (2009) pointed
black, green dots show source locations. (For interpretation of the references to color in

Fig. 5. NOAA-16 band math image, Ch4eCh5, from Dec. 26, 2003. Dust plumes enhanced in black, green dots show source locations. (For interpretation of the references to color inthis figure legend, the reader is referred to the web version of this article.)
N.I. Rivera Rivera et al. / Atmospheric Environment 44 (2010) 2457e2468 2461
out that other currently-available methods also have uncertainties,and concluded that if the user is familiar with the underlyingground surface characteristics and has visible images available todiscern cloud cover, the method used here is the simplest andpossibly most accurate technique of dust source determination.
The source locationswere then located on land cover data imagesto assess the surface land cover type corresponding to eachdust source location (e.g. grassland, shrub/scrub, barren/minimalvegetation, etc.). GeoCover land cover data products (http://www.mdafederal.com/geocover) were used. These land cover maps werederived from spectral analysis of consistently orthorectified LandsatThematic Mapper imagery (Tucker et al., 2004), featuring a 13-classland cover categorization designed to provide a basic understandingof the landscape. Landsat scenes used to categorize land coverwere acquired as close to peak-of-greenness as possible, given imageavailability and scene characteristics, in any year within three yearsof 1990 and 2000. This methodology benefits from the availability ofseveral platforms of satellite data (and spectral bands); however the
Table 1Summary of dust events analyzed in this study. “CAMS” refers to a Continuous Ambient M12 and Ascarate Park, CAMS 37). Wind speed and wind direction at time of minimum visvisibility was �10 km at the airport.
Event date Type of RSimage used
Land cover classifications
March 8, 2002 NOAAePOES GOES-10 Shrub/Scrub, Grassland (>10% coverageand Agriculture, General
March 4, 2003 NOAAePOES GOES-10 Shrub/Scrub, Grassland (>10% coverageBarren/Minimal Vegetation(<10% ground cover), and “Wetlands”
April 15, 2003 NOAAePOES GOES-10 Shrub/Scrub, Grassland (>10% coverageBarren/Minimal Vegetation(<10% ground cover), andAgriculture, General
November 22, 2003 NOAAePOES GOES-10 Shrub/Scrub, Grassland (>10% coverageand Barren/Minimal Vegetation(<10% ground cover)
December 26, 2003 NOAAePOES GOES-10 Shrub/Scrub, Grassland (>10% coverageand Agriculture, General
agreement of the locations from all the satellite images depends onthe differing spatial and temporal resolution of the various satelliteoverpasses and temporal evolution of the storms themselves. Ofthe main land cover classes applicable to the Chihuahuan Desert,shrub/scrub is defined as being predominantly comprised of woodyvegetation> 3m in height, grasslands are predominantly comprisedof herbaceous grasses, and barren/minimal vegetation includeslandwith<10% ground cover. Google Earth�maps and topographicmaps (INEGI, 1998a,b) were used to cross-check land cover andobtain the place names closest to the source points.
3. Results
Table 1 summarizes the different dust events, including dates,type of satellite data used, land cover classifications correspondingto the dust source locations, TCEQ station recording the highest 24 hPM10 level, maximum recorded wind speed at El Paso, wind direc-tion during the event at El Paso, maximum 24 h PM10 concentration,
onitoring Station from the TCEQ, located in metropolitan El Paso, Texas (UTEP, CAMSibility at El Paso International Airport, duration refers to elapsed time when surface
TCEQ El Paso,TX Stations
PM10 24-haverage(mg m�3)
Wind speed(m s�1)
Winddirection
Duration ofthe event (h)
), CAMS 12 (UTEP) 755 29 WSW 5
), CAMS 12 (UTEP) 691 28 WSW 4CAMS 37(Ascarate Park)
715
), CAMS 12 (UTEP) 718 37 WSW 7
), CAMS 12 (UTEP) 1137 25 SW 8.25
), CAMS 37 (Ascarate Park) 512 27 SW 5
N.I. Rivera Rivera et al. / Atmospheric Environment 44 (2010) 2457e24682462
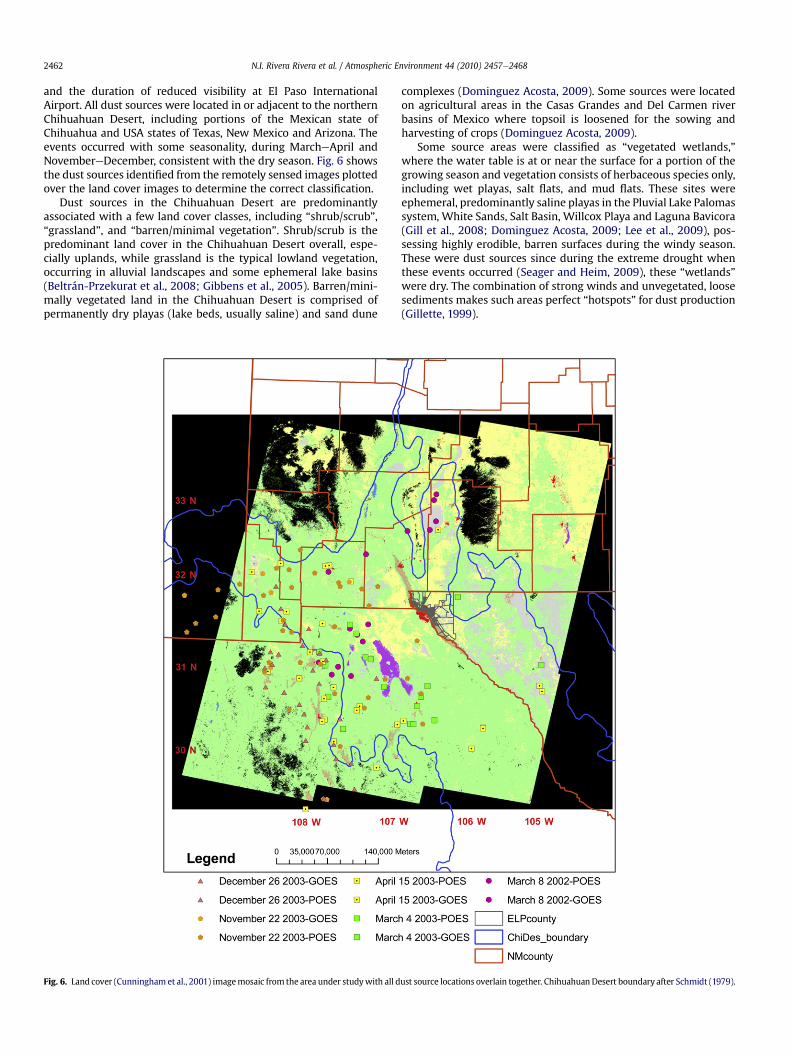
and the duration of reduced visibility at El Paso InternationalAirport. All dust sources were located in or adjacent to the northernChihuahuan Desert, including portions of the Mexican state ofChihuahua and USA states of Texas, New Mexico and Arizona. Theevents occurred with some seasonality, during MarcheApril andNovembereDecember, consistent with the dry season. Fig. 6 showsthe dust sources identified from the remotely sensed images plottedover the land cover images to determine the correct classification.
Dust sources in the Chihuahuan Desert are predominantlyassociated with a few land cover classes, including “shrub/scrub”,“grassland”, and “barren/minimal vegetation”. Shrub/scrub is thepredominant land cover in the Chihuahuan Desert overall, espe-cially uplands, while grassland is the typical lowland vegetation,occurring in alluvial landscapes and some ephemeral lake basins(Beltrán-Przekurat et al., 2008; Gibbens et al., 2005). Barren/mini-mally vegetated land in the Chihuahuan Desert is comprised ofpermanently dry playas (lake beds, usually saline) and sand dune
Fig. 6. Land cover (Cunningham et al., 2001) imagemosaic from the area under studywith all d
complexes (Dominguez Acosta, 2009). Some sources were locatedon agricultural areas in the Casas Grandes and Del Carmen riverbasins of Mexico where topsoil is loosened for the sowing andharvesting of crops (Dominguez Acosta, 2009).
Some source areas were classified as “vegetated wetlands,”where the water table is at or near the surface for a portion of thegrowing season and vegetation consists of herbaceous species only,including wet playas, salt flats, and mud flats. These sites wereephemeral, predominantly saline playas in the Pluvial Lake Palomassystem, White Sands, Salt Basin, Willcox Playa and Laguna Bavicora(Gill et al., 2008; Dominguez Acosta, 2009; Lee et al., 2009), pos-sessing highly erodible, barren surfaces during the windy season.These were dust sources since during the extreme drought whenthese events occurred (Seager and Heim, 2009), these “wetlands”were dry. The combination of strong winds and unvegetated, loosesediments makes such areas perfect “hotspots” for dust production(Gillette, 1999).
ust source locations overlain together. Chihuahuan Desert boundary after Schmidt (1979).
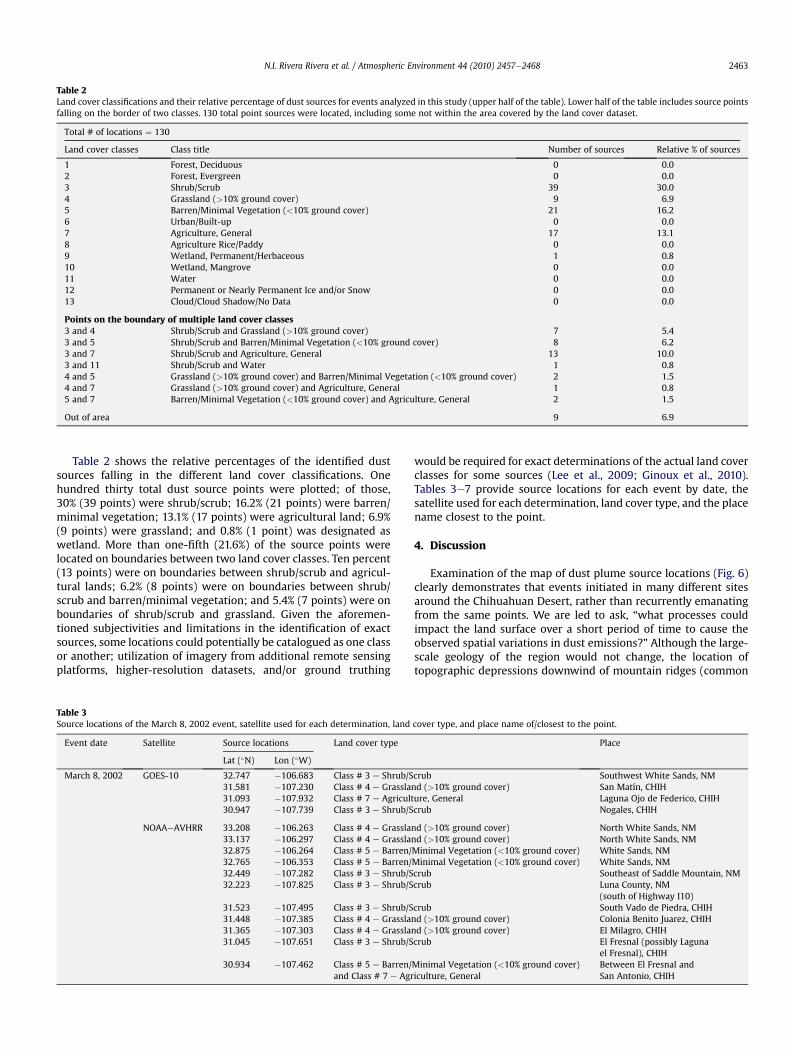
Table 2Land cover classifications and their relative percentage of dust sources for events analyzed in this study (upper half of the table). Lower half of the table includes source pointsfalling on the border of two classes. 130 total point sources were located, including some not within the area covered by the land cover dataset.
Total # of locations ¼ 130
Land cover classes Class title Number of sources Relative % of sources
1 Forest, Deciduous 0 0.02 Forest, Evergreen 0 0.03 Shrub/Scrub 39 30.04 Grassland (>10% ground cover) 9 6.95 Barren/Minimal Vegetation (<10% ground cover) 21 16.26 Urban/Built-up 0 0.07 Agriculture, General 17 13.18 Agriculture Rice/Paddy 0 0.09 Wetland, Permanent/Herbaceous 1 0.810 Wetland, Mangrove 0 0.011 Water 0 0.012 Permanent or Nearly Permanent Ice and/or Snow 0 0.013 Cloud/Cloud Shadow/No Data 0 0.0
Points on the boundary of multiple land cover classes3 and 4 Shrub/Scrub and Grassland (>10% ground cover) 7 5.43 and 5 Shrub/Scrub and Barren/Minimal Vegetation (<10% ground cover) 8 6.23 and 7 Shrub/Scrub and Agriculture, General 13 10.03 and 11 Shrub/Scrub and Water 1 0.84 and 5 Grassland (>10% ground cover) and Barren/Minimal Vegetation (<10% ground cover) 2 1.54 and 7 Grassland (>10% ground cover) and Agriculture, General 1 0.85 and 7 Barren/Minimal Vegetation (<10% ground cover) and Agriculture, General 2 1.5
Out of area 9 6.9
N.I. Rivera Rivera et al. / Atmospheric Environment 44 (2010) 2457e2468 2463
Table 2 shows the relative percentages of the identified dustsources falling in the different land cover classifications. Onehundred thirty total dust source points were plotted; of those,30% (39 points) were shrub/scrub; 16.2% (21 points) were barren/minimal vegetation; 13.1% (17 points) were agricultural land; 6.9%(9 points) were grassland; and 0.8% (1 point) was designated aswetland. More than one-fifth (21.6%) of the source points werelocated on boundaries between two land cover classes. Ten percent(13 points) were on boundaries between shrub/scrub and agricul-tural lands; 6.2% (8 points) were on boundaries between shrub/scrub and barren/minimal vegetation; and 5.4% (7 points) were onboundaries of shrub/scrub and grassland. Given the aforemen-tioned subjectivities and limitations in the identification of exactsources, some locations could potentially be catalogued as one classor another; utilization of imagery from additional remote sensingplatforms, higher-resolution datasets, and/or ground truthing
Table 3Source locations of the March 8, 2002 event, satellite used for each determination, land
Event date Satellite Source locations Land cover type
Lat (�N) Lon (�W)
March 8, 2002 GOES-10 32.747 �106.683 Class # 3 e Shrub/S31.581 �107.230 Class # 4 e Grassla31.093 �107.932 Class # 7 e Agricult30.947 �107.739 Class # 3 e Shrub/S
NOAAeAVHRR 33.208 �106.263 Class # 4 e Grassla33.137 �106.297 Class # 4 e Grassla32.875 �106.264 Class # 5 e Barren/32.765 �106.353 Class # 5 e Barren/32.449 �107.282 Class # 3 e Shrub/S32.223 �107.825 Class # 3 e Shrub/S
31.523 �107.495 Class # 3 e Shrub/S31.448 �107.385 Class # 4 e Grasslan31.365 �107.303 Class # 4 e Grasslan31.045 �107.651 Class # 3 e Shrub/S
30.934 �107.462 Class # 5 e Barren/and Class # 7 e Agr
would be required for exact determinations of the actual land coverclasses for some sources (Lee et al., 2009; Ginoux et al., 2010).Tables 3e7 provide source locations for each event by date, thesatellite used for each determination, land cover type, and the placename closest to the point.
4. Discussion
Examination of the map of dust plume source locations (Fig. 6)clearly demonstrates that events initiated in many different sitesaround the Chihuahuan Desert, rather than recurrently emanatingfrom the same points. We are led to ask, “what processes couldimpact the land surface over a short period of time to cause theobserved spatial variations in dust emissions?” Although the large-scale geology of the region would not change, the location oftopographic depressions downwind of mountain ridges (common
cover type, and place name of/closest to the point.
Place
crub Southwest White Sands, NMnd (>10% ground cover) San Matín, CHIHure, General Laguna Ojo de Federico, CHIHcrub Nogales, CHIH
nd (>10% ground cover) North White Sands, NMnd (>10% ground cover) North White Sands, NMMinimal Vegetation (<10% ground cover) White Sands, NMMinimal Vegetation (<10% ground cover) White Sands, NMcrub Southeast of Saddle Mountain, NMcrub Luna County, NM
(south of Highway I10)crub South Vado de Piedra, CHIHd (>10% ground cover) Colonia Benito Juarez, CHIHd (>10% ground cover) El Milagro, CHIHcrub El Fresnal (possibly Laguna
el Fresnal), CHIHMinimal Vegetation (<10% ground cover)iculture, General
Between El Fresnal andSan Antonio, CHIH
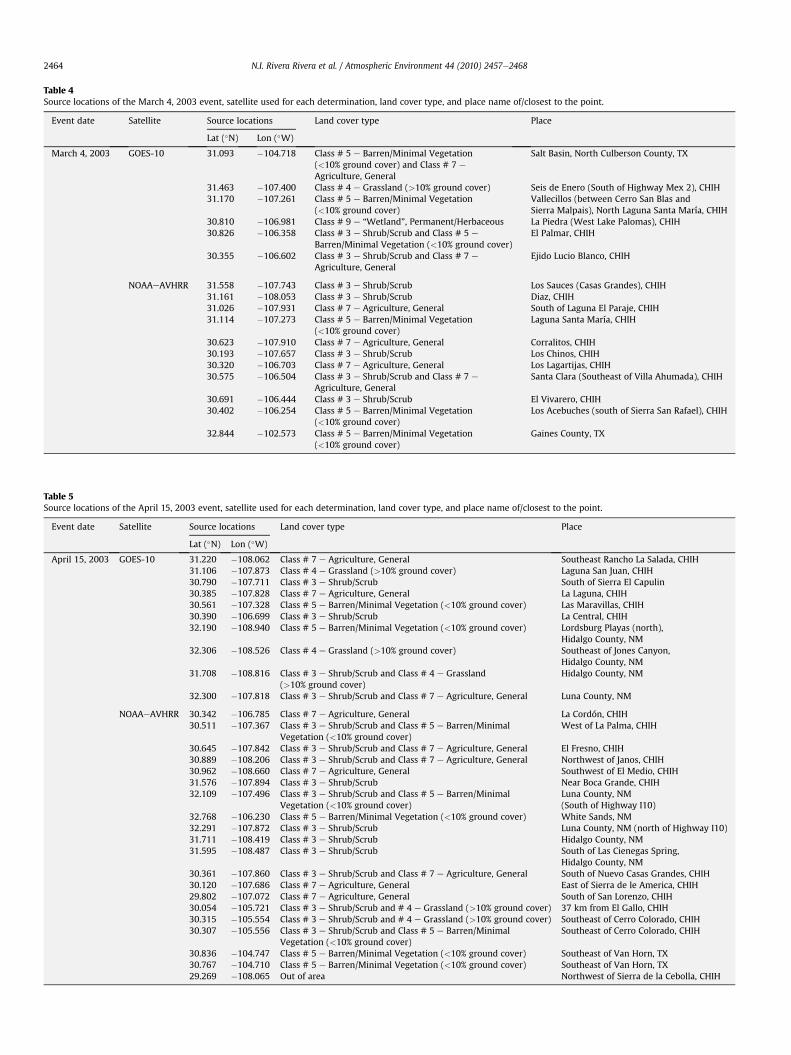
Table 4Source locations of the March 4, 2003 event, satellite used for each determination, land cover type, and place name of/closest to the point.
Event date Satellite Source locations Land cover type Place
Lat (�N) Lon (�W)
March 4, 2003 GOES-10 31.093 �104.718 Class # 5 e Barren/Minimal Vegetation(<10% ground cover) and Class # 7 e
Agriculture, General
Salt Basin, North Culberson County, TX
31.463 �107.400 Class # 4 e Grassland (>10% ground cover) Seis de Enero (South of Highway Mex 2), CHIH31.170 �107.261 Class # 5 e Barren/Minimal Vegetation
(<10% ground cover)Vallecillos (between Cerro San Blas andSierra Malpais), North Laguna Santa María, CHIH
30.810 �106.981 Class # 9 e “Wetland”, Permanent/Herbaceous La Piedra (West Lake Palomas), CHIH30.826 �106.358 Class # 3 e Shrub/Scrub and Class # 5 e
Barren/Minimal Vegetation (<10% ground cover)El Palmar, CHIH
30.355 �106.602 Class # 3 e Shrub/Scrub and Class # 7 e
Agriculture, GeneralEjido Lucio Blanco, CHIH
NOAAeAVHRR 31.558 �107.743 Class # 3 e Shrub/Scrub Los Sauces (Casas Grandes), CHIH31.161 �108.053 Class # 3 e Shrub/Scrub Diaz, CHIH31.026 �107.931 Class # 7 e Agriculture, General South of Laguna El Paraje, CHIH31.114 �107.273 Class # 5 e Barren/Minimal Vegetation
(<10% ground cover)Laguna Santa María, CHIH
30.623 �107.910 Class # 7 e Agriculture, General Corralitos, CHIH30.193 �107.657 Class # 3 e Shrub/Scrub Los Chinos, CHIH30.320 �106.703 Class # 7 e Agriculture, General Los Lagartijas, CHIH30.575 �106.504 Class # 3 e Shrub/Scrub and Class # 7 e
Agriculture, GeneralSanta Clara (Southeast of Villa Ahumada), CHIH
30.691 �106.444 Class # 3 e Shrub/Scrub El Vivarero, CHIH30.402 �106.254 Class # 5 e Barren/Minimal Vegetation
(<10% ground cover)Los Acebuches (south of Sierra San Rafael), CHIH
32.844 �102.573 Class # 5 e Barren/Minimal Vegetation(<10% ground cover)
Gaines County, TX
Table 5Source locations of the April 15, 2003 event, satellite used for each determination, land cover type, and place name of/closest to the point.
Event date Satellite Source locations Land cover type Place
Lat (�N) Lon (�W)
April 15, 2003 GOES-10 31.220 �108.062 Class # 7 e Agriculture, General Southeast Rancho La Salada, CHIH31.106 �107.873 Class # 4 e Grassland (>10% ground cover) Laguna San Juan, CHIH30.790 �107.711 Class # 3 e Shrub/Scrub South of Sierra El Capulin30.385 �107.828 Class # 7 e Agriculture, General La Laguna, CHIH30.561 �107.328 Class # 5 e Barren/Minimal Vegetation (<10% ground cover) Las Maravillas, CHIH30.390 �106.699 Class # 3 e Shrub/Scrub La Central, CHIH32.190 �108.940 Class # 5 e Barren/Minimal Vegetation (<10% ground cover) Lordsburg Playas (north),
Hidalgo County, NM32.306 �108.526 Class # 4 e Grassland (>10% ground cover) Southeast of Jones Canyon,
Hidalgo County, NM31.708 �108.816 Class # 3 e Shrub/Scrub and Class # 4 e Grassland
(>10% ground cover)Hidalgo County, NM
32.300 �107.818 Class # 3 e Shrub/Scrub and Class # 7 e Agriculture, General Luna County, NM
NOAAeAVHRR 30.342 �106.785 Class # 7 e Agriculture, General La Cordón, CHIH30.511 �107.367 Class # 3 e Shrub/Scrub and Class # 5 e Barren/Minimal
Vegetation (<10% ground cover)West of La Palma, CHIH
30.645 �107.842 Class # 3 e Shrub/Scrub and Class # 7 e Agriculture, General El Fresno, CHIH30.889 �108.206 Class # 3 e Shrub/Scrub and Class # 7 e Agriculture, General Northwest of Janos, CHIH30.962 �108.660 Class # 7 e Agriculture, General Southwest of El Medio, CHIH31.576 �107.894 Class # 3 e Shrub/Scrub Near Boca Grande, CHIH32.109 �107.496 Class # 3 e Shrub/Scrub and Class # 5 e Barren/Minimal
Vegetation (<10% ground cover)Luna County, NM(South of Highway I10)
32.768 �106.230 Class # 5 e Barren/Minimal Vegetation (<10% ground cover) White Sands, NM32.291 �107.872 Class # 3 e Shrub/Scrub Luna County, NM (north of Highway I10)31.711 �108.419 Class # 3 e Shrub/Scrub Hidalgo County, NM31.595 �108.487 Class # 3 e Shrub/Scrub South of Las Cienegas Spring,
Hidalgo County, NM30.361 �107.860 Class # 3 e Shrub/Scrub and Class # 7 e Agriculture, General South of Nuevo Casas Grandes, CHIH30.120 �107.686 Class # 7 e Agriculture, General East of Sierra de le America, CHIH29.802 �107.072 Class # 7 e Agriculture, General South of San Lorenzo, CHIH30.054 �105.721 Class # 3 e Shrub/Scrub and # 4 e Grassland (>10% ground cover) 37 km from El Gallo, CHIH30.315 �105.554 Class # 3 e Shrub/Scrub and # 4 e Grassland (>10% ground cover) Southeast of Cerro Colorado, CHIH30.307 �105.556 Class # 3 e Shrub/Scrub and Class # 5 e Barren/Minimal
Vegetation (<10% ground cover)Southeast of Cerro Colorado, CHIH
30.836 �104.747 Class # 5 e Barren/Minimal Vegetation (<10% ground cover) Southeast of Van Horn, TX30.767 �104.710 Class # 5 e Barren/Minimal Vegetation (<10% ground cover) Southeast of Van Horn, TX29.269 �108.065 Out of area Northwest of Sierra de la Cebolla, CHIH
N.I. Rivera Rivera et al. / Atmospheric Environment 44 (2010) 2457e24682464
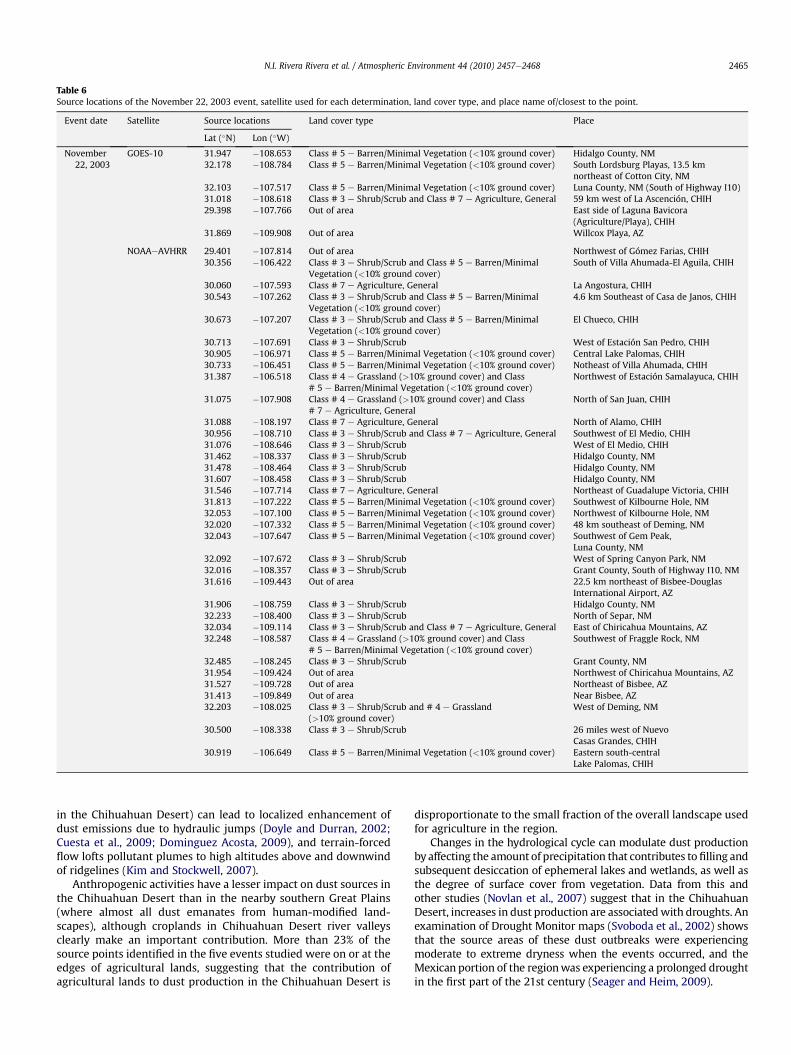
Table 6Source locations of the November 22, 2003 event, satellite used for each determination, land cover type, and place name of/closest to the point.
Event date Satellite Source locations Land cover type Place
Lat (�N) Lon (�W)
November22, 2003
GOES-10 31.947 �108.653 Class # 5 e Barren/Minimal Vegetation (<10% ground cover) Hidalgo County, NM32.178 �108.784 Class # 5 e Barren/Minimal Vegetation (<10% ground cover) South Lordsburg Playas, 13.5 km
northeast of Cotton City, NM32.103 �107.517 Class # 5 e Barren/Minimal Vegetation (<10% ground cover) Luna County, NM (South of Highway I10)31.018 �108.618 Class # 3 e Shrub/Scrub and Class # 7 e Agriculture, General 59 km west of La Ascención, CHIH29.398 �107.766 Out of area East side of Laguna Bavicora
(Agriculture/Playa), CHIH31.869 �109.908 Out of area Willcox Playa, AZ
NOAAeAVHRR 29.401 �107.814 Out of area Northwest of Gómez Farias, CHIH30.356 �106.422 Class # 3 e Shrub/Scrub and Class # 5 e Barren/Minimal
Vegetation (<10% ground cover)South of Villa Ahumada-El Aguila, CHIH
30.060 �107.593 Class # 7 e Agriculture, General La Angostura, CHIH30.543 �107.262 Class # 3 e Shrub/Scrub and Class # 5 e Barren/Minimal
Vegetation (<10% ground cover)4.6 km Southeast of Casa de Janos, CHIH
30.673 �107.207 Class # 3 e Shrub/Scrub and Class # 5 e Barren/MinimalVegetation (<10% ground cover)
El Chueco, CHIH
30.713 �107.691 Class # 3 e Shrub/Scrub West of Estación San Pedro, CHIH30.905 �106.971 Class # 5 e Barren/Minimal Vegetation (<10% ground cover) Central Lake Palomas, CHIH30.733 �106.451 Class # 5 e Barren/Minimal Vegetation (<10% ground cover) Notheast of Villa Ahumada, CHIH31.387 �106.518 Class # 4 e Grassland (>10% ground cover) and Class
# 5 e Barren/Minimal Vegetation (<10% ground cover)Northwest of Estación Samalayuca, CHIH
31.075 �107.908 Class # 4 e Grassland (>10% ground cover) and Class# 7 e Agriculture, General
North of San Juan, CHIH
31.088 �108.197 Class # 7 e Agriculture, General North of Alamo, CHIH30.956 �108.710 Class # 3 e Shrub/Scrub and Class # 7 e Agriculture, General Southwest of El Medio, CHIH31.076 �108.646 Class # 3 e Shrub/Scrub West of El Medio, CHIH31.462 �108.337 Class # 3 e Shrub/Scrub Hidalgo County, NM31.478 �108.464 Class # 3 e Shrub/Scrub Hidalgo County, NM31.607 �108.458 Class # 3 e Shrub/Scrub Hidalgo County, NM31.546 �107.714 Class # 7 e Agriculture, General Northeast of Guadalupe Victoria, CHIH31.813 �107.222 Class # 5 e Barren/Minimal Vegetation (<10% ground cover) Southwest of Kilbourne Hole, NM32.053 �107.100 Class # 5 e Barren/Minimal Vegetation (<10% ground cover) Northwest of Kilbourne Hole, NM32.020 �107.332 Class # 5 e Barren/Minimal Vegetation (<10% ground cover) 48 km southeast of Deming, NM32.043 �107.647 Class # 5 e Barren/Minimal Vegetation (<10% ground cover) Southwest of Gem Peak,
Luna County, NM32.092 �107.672 Class # 3 e Shrub/Scrub West of Spring Canyon Park, NM32.016 �108.357 Class # 3 e Shrub/Scrub Grant County, South of Highway I10, NM31.616 �109.443 Out of area 22.5 km northeast of Bisbee-Douglas
International Airport, AZ31.906 �108.759 Class # 3 e Shrub/Scrub Hidalgo County, NM32.233 �108.400 Class # 3 e Shrub/Scrub North of Separ, NM32.034 �109.114 Class # 3 e Shrub/Scrub and Class # 7 e Agriculture, General East of Chiricahua Mountains, AZ32.248 �108.587 Class # 4 e Grassland (>10% ground cover) and Class
# 5 e Barren/Minimal Vegetation (<10% ground cover)Southwest of Fraggle Rock, NM
32.485 �108.245 Class # 3 e Shrub/Scrub Grant County, NM31.954 �109.424 Out of area Northwest of Chiricahua Mountains, AZ31.527 �109.728 Out of area Northeast of Bisbee, AZ31.413 �109.849 Out of area Near Bisbee, AZ32.203 �108.025 Class # 3 e Shrub/Scrub and # 4 e Grassland
(>10% ground cover)West of Deming, NM
30.500 �108.338 Class # 3 e Shrub/Scrub 26 miles west of NuevoCasas Grandes, CHIH
30.919 �106.649 Class # 5 e Barren/Minimal Vegetation (<10% ground cover) Eastern south-centralLake Palomas, CHIH
N.I. Rivera Rivera et al. / Atmospheric Environment 44 (2010) 2457e2468 2465
in the Chihuahuan Desert) can lead to localized enhancement ofdust emissions due to hydraulic jumps (Doyle and Durran, 2002;Cuesta et al., 2009; Dominguez Acosta, 2009), and terrain-forcedflow lofts pollutant plumes to high altitudes above and downwindof ridgelines (Kim and Stockwell, 2007).
Anthropogenic activities have a lesser impact on dust sources inthe Chihuahuan Desert than in the nearby southern Great Plains(where almost all dust emanates from human-modified land-scapes), although croplands in Chihuahuan Desert river valleysclearly make an important contribution. More than 23% of thesource points identified in the five events studied were on or at theedges of agricultural lands, suggesting that the contribution ofagricultural lands to dust production in the Chihuahuan Desert is
disproportionate to the small fraction of the overall landscape usedfor agriculture in the region.
Changes in the hydrological cycle can modulate dust productionbyaffecting the amount of precipitation that contributes tofilling andsubsequent desiccation of ephemeral lakes and wetlands, as well asthe degree of surface cover from vegetation. Data from this andother studies (Novlan et al., 2007) suggest that in the ChihuahuanDesert, increases in dust production are associatedwith droughts. Anexamination of Drought Monitor maps (Svoboda et al., 2002) showsthat the source areas of these dust outbreaks were experiencingmoderate to extreme dryness when the events occurred, and theMexican portion of the regionwas experiencing a prolonged droughtin the first part of the 21st century (Seager and Heim, 2009).

Table 7Source locations of the December 26, 2003 event, satellite used for each determination, land cover type, and place name of/closest to the point.
Event date Satellite Source locations Land cover type Place
Lat (�N) Lon (�W)
December 26, 2003 NOAAeAVHRR 32.022 �108.582 Class # 3 e Shrub/Scrub West of Coyote Peak, Hidalgo, CHIH31.747 �108.502 Class # 3 e Shrub/Scrub Southeast of Hidalgo, CHIH31.560 �108.437 Class # 3 e Shrub/Scrub East of Little Tank, CHIH31.509 �108.088 Class # 4 e Grassland (>10% ground cover) Laguna Los Moscos, CHIH31.207 �108.632 Class # 3 e Shrub/Scrub and # 4 e Grassland
(>10% ground cover)Northwest of Hacienda Nogales, CHIH
31.299 �108.173 Class # 3 e Shrub/Scrub Southwest of Rancho Monumento, CHIH31.007 �108.704 Class # 3 e Shrub/Scrub and Class # 7 e Agriculture, General East of Sierra las Espuelas, CHIH31.181 �108.515 Class # 3 e Shrub/Scrub and # 4 e Grassland
(>10% ground cover)Northeast of Hacienda Nogales, CHIH
30.770 �108.684 Class # 3 e Shrub/Scrub North of Manga Punta de Agua, CHIH30.995 �108.013 Class # 7 e Agriculture, General South of Ascención, CHIH30.708 �108.418 Class # 3 e Shrub/Scrub and Class # 7 e Agriculture, General West of Sierra del Oro, CHIH30.829 �107.916 Class # 3 e Shrub/Scrub and Class # 7 e Agriculture, General North of Loma Boquilla, CHIH30.564 �108.195 Class # 3 e Shrub/Scrub Laguna de Dos Reales, CHIH30.447 �108.122 Class # 3 e Shrub/Scrub West of Nuevo Casas Grandes, CHIH30.290 �108.071 Class # 7 e Agriculture, General South of Colonia de Juarez, CHIH30.121 �108.089 Class # 3 e Shrub/Scrub Northeast La Breña, CHIH30.399 �107.606 Class # 3 e Shrub/Scrub and # 4 e Grassland
(>10% ground cover)East of Nuevo Casas Grandes, CHIH
30.080 �107.689 Class # 7 e Agriculture, General Las Galeras, CHIH29.902 �107.650 Class # 3 e Shrub/Scrub South of Carbajaleno, CHIH29.403 �107.806 Out of area Laguna de Bavicora (playa), CHIH29.530 �107.379 Class # 3 e Shrub/Scrub and Class #11 e Water Lago Tintero, CHIH29.847 �107.432 Class # 3 e Shrub/Scrub and Class # 7 e Agriculture, General East of San Buenaventura, CHIH
GOES 31.053 �108.603 Class # 3 e Shrub/Scrub West of Rancho San Bacilio, CHIH31.209 �107.922 Class # 7 e Agriculture, General North of Ascensión, CHIH31.130 �107.825 Class # 3 e Shrub/Scrub East of Cerros Rayados, CHIH30.912 �107.094 Class # 3 e Shrub/Scrub and Class # 5 e Barren/Minimal
Vegetation (<10% ground cover)Southwest Lake Palomas, CHIH
31.556 �108.432 Class # 3 e Shrub/Scrub Southwest of Little Tank, CHIH
N.I. Rivera Rivera et al. / Atmospheric Environment 44 (2010) 2457e24682466
Although comprising only a small fraction of the overall land-scape, 21.6% of the identified sourcepoints fell at boundaries betweendifferent land cover classes. Such “edges,” especially between playasand surrounding shrublands, are ideal sites fordust emission througha saltation/sandblasting process (Gillette and Chen, 2001). Playaedges in the Chihuahuan Desert generally bound sand dunes/sheets(providing particles for saltation) and lacustrine/alluvial sediments(providing fine particles for suspension) (Gill et al., 2008; DominguezAcosta, 2009). In addition, winds blowing over fallow agriculturallands, grasslands and unvegetated playas will have relativelylow threshold friction velocities and small aerodynamic roughnesslengths, increasing their propensity for dust emission (Gillette, 1999)and increasing wind erodibility where they bound other landsurfaces.
Dust plumes from the most intense events clearly emanatedfrom relatively widely spaced and different locations, rather thanbeing “clumped together” in recurrent “hotspots.” This suggests therole of spatiotemporally random, meteorological factors in drivingthe exact sources of dust emission between and within individualstorms. Such variations in dust source locations may have the mostto do with variations of position, path, strength and developmentof individual weather systems during different seasons andyears (Wigner and Peterson, 1987: Lee et al., 1994; Rivera Riveraet al., 2009), gustiness of winds (Engelstaedter and Washington,2007b), and the location of small-scale wind speed maximawithin individual storms (Lee et al., 2009).
5. Conclusions
We applied a technique to identify the source locations ofsignificant recent dust events in the ChihuahuanDesert using remotesensing imagery. This method located dust plume sources that were
consistent from a variety of satellite platforms. Brightness tempera-ture differences were very effective at highlighting dust plumes notvisible when looking at a single band. When coupled with the bandmath routine used in this research, dust sources could be visualizedthat would not be seen by evaluating only simple band combinationimages. Coupling the identified points to land cover data and GoogleEarth� maps improved determination of the roles of land covertypes and geological, hydrological, meteorological and anthropo-genic processes in facilitating or suppressing dust emissions withinthe Chihuahuan Desert. Additional ground truthing, examination ofthe meteorological conditions accompanying each event, utilizationof higher-resolution land cover datasets, and analysis of images frommultiple remote sensors are ultimately needed to exactly assess thefactors causing individual dust outbreaks.
This study has begun to characterize the source points of themost intense dust outbreaks in the Chihuahuan Desert, one of themajor mineral aerosol sources in North America, causing air qualityand visibility degradation across portions of Mexico, the UnitedStates, and beyond. Playas (ephemeral or dry lakes), agriculturallands, and their edges are pointed out as focus areas for dust emis-sion in the region, at least during themost intense events. Continuedand improved evaluation of the source characteristics of significantdust events in the ChihuahuanDesert (and elsewhere)will only helpimprove their forecasting and mitigation of their impacts.
Acknowledgments
We thank David Novlan, Matthew Baddock and Jeffrey Lee forhelpful comments on the manuscript. Rivera Rivera was supportedin part by NOAA through the Educational Partnership Program forMinority Serving Institutions (EPP/MSI) Cooperative AgreementNA17AE1623, and the Significant Opportunities in Atmospheric
N.I. Rivera Rivera et al. / Atmospheric Environment 44 (2010) 2457e2468 2467
Research andScience (SOARS) Program.Gill was supported inpart bythe US Environmental Protection Agency through a grant from theSouthwest Center for Environmental Research and Policy (SCERP),and by a grant from the Norman Hackerman Advanced ResearchProgram of the Texas Higher Education Coordinating Board.
References
Ackerman, S.A., 1997. Remote sensing aerosols using satellite infrared observations.Journal of Geophysical Research 102 (D14), 17069e17079.
Baddock, M.C., Bullard, J.E., Bryant, R.G., 2009. Dust source identification usingMODIS: a comparison of techniques applied to the Lake Eyre Basin, Australia.Remote Sensing of Environment 113, 1511e1528.
Bernier, S.A., Gill, T.E., Peterson, R.E., 1998. Climatology of dust in the Southern HighPlains of Texas. In: Busacca, A. (Ed.), Proceedings of the International Confer-ence on Dust Aerosols, Loess Soils and Global Change, Seattle, October 1998.Washington State University College of Agriculture and Home EconomicsMiscellaneous Publication 190, pp. 4e7.
Beltrán-Przekurat, A., Pielke Sr., R.A., Peters, D.P.C., Snyder, K.A., Rango, A., 2008.Modeling the effects of historical vegetation change near-surface atmosphere inthe northern Chihuahuan Desert. Journal of Arid Environments 72, 1897e1910.
Bierly, G.D., Harrington Jr., J.A., 1995. A climatology of transition season Coloradocyclones: 1961e1990. Journal of Climate 8, 853e863.
Bullard, J.E., Baddock, M.C., McTainsh, G.H., Leys, J.F., 2008. Sub-basin scale dustsource geomorphology detected using MODIS. Geophysical Research Letters 35(15), L15404. doi:10.1029/2008GL033928.
Castalgia, P.J., Fawcett, P.J., 2006. Large Holocene lakes and climate change in theChihuahuan Desert. Geology 34, 113e116.
Chaboureau, J.-P., Tulet, P., Mari, C., 2007. Diurnal cycle of dust and cirrus over WestAfrica as seen fromMeteosat Second Generation satellite and a regional forecastmodel. Geophysical Research Letters 34, L02882. doi:10.1029/2006GL027771.
Chimonas, M.A.R., Gessner, B.D., 2007. Airborne particulate matter from primarilygeologic, non-industrial sources at levels below National Ambient Air QualityStandards is associated with outpatient visits for asthma and quick-reliefmedication prescriptions among children less than 20 years old enrolled inMedicaid in Anchorage, Alaska. Environmental Research 103, 397e404.
Cuesta, J., Marsham, J.H., Parker, D.J., Flamant, C., 2009. Dynamical mechanismscontrolling the vertical redistribution of dust and the thermodynamic structureof the West Saharan atmospheric boundary layer during summer. AtmosphericScience Letters 10, 34e42.
Cunningham, D.J., Melican, J.E., Wemmelmann, E., Jones, T.B., 2001. GeoCover LC e Amoderate resolution global landcover database. In: Proceedings of the 2002ESRI User's Conference.
Darmenova, K., Sokolik, I.N., Darmenov, A., 2005. Characterization of east Asian dustoutbreaks in the spring of 2001 using ground based and satellite data. Journal ofGeophysical Research 110, D02204. doi:10.1029/2004JD004842.
Ding, R., Li, J., Wang, S., Ren, F., 2005. Decadal change of the spring dust storm innorthwest China and the associated atmospheric circulation. GeophysicalResearch Letters 32, L02808. doi:10.1029/2004GL021561.
Dominguez Acosta, M., 2009. The Pluvial Lake PalomaseSamalayuca Dunes system.Ph.D. dissertation (Geology), University of Texas at El Paso.
Doyle, M., Dorling, S., 2002. Satellite and ground based monitoring of aerosolplumes. Water, Air, and Soil Pollution: Focus 2, 615e629.
Doyle, J.D., Durran, D.R., 2002. The dynamics of mountain-wave-induced rotors.Journal of the Atmospheric Sciences 59, 186e201.
Engelstaedter, S., Washington, R., 2007a. Atmospheric controls on the annual cycleof North African dust. Journal of Geophysical Research 112, D03103.doi:10.1029/2006JD007195.
Engelstaedter, S., Washington, R., 2007b. Temporal controls on global dust emis-sions: the role of surface gustiness. Geophysical Research Letters 34, L15805.doi:10.1029/2007GL029971.
Environment for Visualizing Images (ENVI), August 20, 2004. Version 4.1. ResearchSystems, Inc., Boulder, Colorado, USA (Chapter 4).
Esmailli, O., Tajrishy, M., Arasth, P.D., 2006. Result of the 50 year ground-basedmeasurements in comparison with satellite remote sensing of two prominentdust emission sources located in Iran. Proceedings of the SPIE 6362, 636209-1.doi:10.1117/12.692989.
Falke, S.R., Husar, R.B., Schichtel, B.A., 2001. Fusion of SeaWiFS and TOMS satellitedata with surface observations and topographic data during extreme aerosolevents. Journal of the Air and Waste Management Association 51, 1579e1585.
Gibbens, R.P., McNeely, R.P., Havstad, K.M., Beck, R.F., Nolen, B., 2005. Vegetationchanges in the Jornada Basin from 1858 to 1998. Journal of Arid Environments61, 651e668.
Gill, T.E., 2006. Teaching meteorology at the University of Texas, El Paso. In: Preprints,Fifteenth Symposium on Education. AmericanMeteorological Society, 6 pp. P1.34.
Gill, T.E., Domínguez Acosta, M., Rivera Rivera, N.I., 2008. The Lake Palomas basin:dust engine of the Chihuahuan Desert. Geological Society of America Abstractsand Programs 40 (6), 78.
Gillette, D.A., 1999. A qualitative geophysical explanation for “Hot Spot” dustemitting source regions. Contributions to Atmospheric Physics 72, 67e77.
Gillette, D.A., Chen, W., 2001. Particle production and Aeolian transport froma “supply limited” source area in the Chihuahuan Desert, New Mexico, UnitedStates. Journal of Geophysical Research 106, 5267e5278.
Gillette, D.A., Walker, T., 1977. Characteristics of airborne particles produced bywind erosion of sandy soil, High Plains of West Texas. Soil Science 123, 97e110.
Ginoux, P., Garbuzov, D., Hsu, N.C., 2010. Identification of anthropogenic and naturaldust sources using Moderate Resolution Imaging Spectroradiometer (MODIS)Deep Blue level 2 data. Journal of Geophysical Research 115, D05204.doi:10.1029/2009JD012398.
Goudie, A.S., 2009. Dust storms: recent developments. Journal of EnvironmentalManagement 90, 89e94.
Goudie, A.S., Middleton, N.J., 1992. The changing frequency of dust storms throughtime. Climatic Change 20 (3), 197e225.
Grini, A., Myhre, G., Zender, C.S., Isaksen, S.A., 2005. Model simulation of dustsources and transport in the global atmosphere: effects of soil erodibilityand wind speed variability. Journal of Geophysical Research 110, D02205.doi:10.1029/2004JD005037.
Gu, Yingxin, Rose, W.I., Bluth, G.J.S., 2003. Retrieval of mass and sizes of particles insandstorms using two MODIS IR bands: a case study of April 7, 2001 sandstormin China. Geophysical Research Letters 30 (15), 1805. doi:10.1029/2003GL017405.
INEGI (Instituto Nacional de Estadística, Geografía e Informática, México), 1998a.Carta Geológica, Ciudad Juárez, 1:250,000. Hoja H13-1.
INEGI (Instituto Nacional de Estadística, Geografía e Informática, México), 1998b.Carta Geológica, Nuevo Casas Grandes, 1:250,000. Hoja H13-4.
Kim, J., 2008. Transport routes and source regions of Asian dust observed in Koreaduring the past 40 years (1965e2004). Atmospheric Environment 42, 4778e4789.
Kim, D., Stockwell, W.R., 2007. An online coupled meteorological and air qualitymodeling study of the effect of complex terrain on the regional transport andtransformation of air pollutants over the Western United States. AtmosphericEnvironment 41, 2319e2334.
Kondratyev, K.Ya., Grigoryev, A.A., Pokrovsky, O.M., 1983. The effects of aerosols onclimate and aerosol climatology on the basis of observations from space.Advances in Space Research 2 (5), 3e10.
Lee, J.A., Tchakerian, V.P., 1995. Magnitude and frequency of blowing dust on theSouthern High Plains of the United States, 1947e1989. Annals of the Associationof American Geographers 85, 684e693.
Lee, J.A., Allen, B.L., Peterson, R.E., Gregory, J.M., Moffett, K.E., 1994. Environmentalcontrols on blowing dust direction at Lubbock, Texas, U.S.A. Earth SurfaceProcesses and Landforms 19, 437e449.
Lee, J.A., Gill, T.E., Mulligan, K.R., Domínguez Acosta, M., Perez, A.E., 2009. Land use/land cover and point sources of the December 15, 2003 dust storm in south-western North America. Geomorphology 105, 18e27.
Li, J., Zhang, P., Schmit, T.J., Schmetz, J., Menzel, W.P., 2007. Quantitative monitoringof a Saharan dust event with SEVIRI on Meteosat-8. International Journal ofRemote Sensing 28, 2181e2186.
Li, J., Dong, Z., He, S., 2009. Seasonal variation in dust events and the causes of thevariation in the Tarim Basin, China. Sciences in Cold and Arid Regions 1,143e150.
Liu, H.Y., Tian, Y.H., Ding, D., 2003. Contributions of different land cover types inOtindag Sandy Land and Bashang area of Hebei Province to the material sourceof sand stormy weather in Beijing. Chinese Science Bulletin 48 (17), 1853e1856.
Mahowald, N.M., Muhs, D.R., Levis, S., Rasch, P.J., Yoshioka, M., Zender, C.S., Luo, C.,2006. Change in atmospheric mineral aerosols in response to climate: lastglacial period, preindustrial, modern, and doubled carbon dioxide climates.Journal of Geophysical Research 111, D10202. doi:10.1029/2005JD006653.
Mahowald, N., Ballantine, J.A., Feddema, J., Ramankutty, N., 2007. Global trends invisibility: implications for dust sources. Atmospheric Chemistry and Physics 7,3309e3339.
Middleton, N.J., Goudie, A.S., Wells, G.L., 1986. The frequency and source areas ofdust storms. In: Nickling, W.G. (Ed.), Aeolian Geomorphology. Allen and Unwin,Boston, pp. 237e259.
Nilgun, K., Nickovic, S., 2000. An illustration of the transport and deposition ofmineral dust onto the eastern Mediterranean. Atmospheric Environment 34,1293e1303.
Novlan, D.J., Hardiman, M., Gill, T.E., 2007. A synoptic climatology of blowing dustevents in El Paso, Texas from 1932e2005. In: Preprints, Sixteenth Conferenceon Applied Climatology. American Meteorological Society, 13 pp. J3.12.
Park, S.H., Gong, S.L., Zhao, T.L., Vet, R.J., Bouchet, V.S., Gong, W., Makar, P.A.,Moran, M.D., Stroud, C., Zhang, J., 2007. Simulation of entrainment and trans-port of dust particles within North America in April 2001 (“Red Dust Episode”).Journal of Geophysical Research 112, D20209. doi:10.1029/2007JD008443.
Park, S.H., Gong, S.L., Gong, W., Makar, P.A., Moran, M.D., Stroud, C.A., Zhang, J.,2009. Sensitivity of surface characteristics on the simulation of wind-blown-dust source in North America. Atmospheric Environment 43, 3122e3129.
Peng, Y., Staniswalis, J.G., Grineski, S.E., Gill, T.E., 2010. A retrospective analysis of theassociation of dust storms and respiratory hospitalizations in El Paso, Texas,using a case-crossover study design. In: Abstracts, First Environment andHealth Symposium, American Meteorological Society Annual Meeting, Atlanta,GA, January 2010, J20.7.
Prospero, J.M., Ginoux, P., Torres, O., Nicholson, S.E., Gill, T.E., 2002. Environmentalcharacterization of global sources of atmospheric soil dust identified with theNimbus 7 Total Ozone Mapping Spectrometer (TOMS) absorbing aerosolproduct. Reviews of Geophysics 40 (1), 1002. doi:10.1029/2000RG00095.
Qian, W., Quan, L., Shi, S., 2002. Variations of the dust storm in China and itsclimatic control. Journal of Climate 15, 1216e1229.
N.I. Rivera Rivera et al. / Atmospheric Environment 44 (2010) 2457e24682468
Rivera Rivera, N.I., Gill, T.E., Gebhart, K.A., Hand, J.L., Bleiweiss, M.P., Fitzgerald, R.M.,2009. Wind modeling of Chihuahuan Desert dust outbreaks. AtmosphericEnvironment 43, 347e354.
Rogash, J., Hardiman, M., Novlan, D., Brice, T., MacBlain, V., 2009. Meteorologicalaspects of the 2006 El Paso Texas metropolitan area floods. National WeatherDigest 33, 77e101.
Schepanski, K., Tegen, I., Laurent, B., Heinold, B., Macke, A., 2007. A new Saharandust source activation frequency map derived from MSGeSEVIRI IR-channels.Geophysical Research Letters 34, L18803. doi:10.1029/2007GL030168.
Scuderi, L.A., Laudadio, C.K., Fawcett, P.J., 2010. Monitoring playa lake inundation inthe western United States: modern analogues to late-Holocene lake levelchange. Quaternary Research 73 (1), 48e58.
Seager, R., Heim, R.R., 2009. Early 21st-century drought in Mexico. Eos e Trans-actions of the American Geophysical Union 90 (11), 89e90.
Schmidt, R.H., 1979. A climatic delineation of the ‘real’ Chihuahuan Desert. Journalof Arid Environments 2 (3), 243e250.
Sokolik, I.N., 2002. The spectral radiative signature of wind-blown mineral dust:implications for remote sensing in the thermal IR region. Geophysical ResearchLetters 29 (24), 2154. doi:10.1029/2002GL015910.
Svoboda, M., LeComte, D., Hayes, M., Heim, R., Gleason, K., Angel, J., Rippey, B.,Tinker, R., Palecki, M., Stooksbury, D., Miskus, D., Stephens, S., 2002.The drought monitor. Bulletin of the American Meteorological Society 83,1181e1190.
Takemi, T., Seino, N., 2005. Dust storms and cyclone tracks over the arid regions ofeast Asia in spring. Journal of Geophysical Research 110, D18S11. doi:10.1029/2004JD004698.
Tegen, T.M., Werner, M., Harrison, S.P., Kohfeld, K.E., 2004. Relative importance ofclimate and land use in determining present and future global soil dust emis-sion. Geophysical Research Letters 31, L05105.
Tucker, C.J., Grant, D., Dykstra, J., 2004. NASA’s global orthorectified Landsat dataset. Photogrammetric Engineering and Remote Sensing 70, 313e322.
Washington, R., Todd, M., Middleton, N.J., Goudie, A.S., 2003. Dust storm source areasdetermined by the Total Ozone Monitoring Spectrometer and surface observa-tions. Annals of the Association of American Geographers 93 (2), 297e313.
Walker, A.L., Liu, M., Miller, S.D., Richardson, K.A., Westphal, D.L., 2009. Develop-ment of a dust source database for mesoscale forecasting in southwest Asia.Journal of Geophysical Research 114, D18207. doi:10.1029/2008JD011541.
Wigner, K.A., Peterson, R.E., 1987. Synoptic climatology of blowing dust on the TexasSouth Plains, 1947e84. Journal of Arid Environments 13, 199e209.
Yin, D., Nickovic, S., Barbaris, B., Chandy, B., Sprigg, W.A., 2005. Modeling wind-blown desert dust in the southwestern United States for public health warning:a case study. Atmospheric Environment 39, 6243e6254.
Zender, C.S., Kwon, E.Y., 2005. Regional contrast in dust emission responses to climate.Journal of Geophysical Research 110, D13201. doi:10.1029/2004JD005501.
Zhang, X.Y., Arimoto, R., An, Z.S., 1997. Dust emission from Chinese desert liked to varia-tions in atmospheric circulation. Journal of Geophysical Research 102, 28041e28047.