Reconstructions of spring/summer precipitation for the Eastern Mediterranean from tree-ring widths...
24
Ramzi Touchan Æ Elena Xoplaki Æ Gary Funkhouser Ju¨rg Luterbacher Æ Malcolm K. Hughes Æ Nesat Erkan U ¨ nal Akkemik Æ Jean Stephan Reconstructions of spring/summer precipitation for the Eastern Mediterranean from tree-ring widths and its connection to large-scale atmospheric circulation Received: 30 August 2004 / Accepted: 14 February 2005 ȑ Springer-Verlag 2005 Abstract This study represents the first large-scale sys- tematic dendroclimatic sampling focused on developing chronologies from different species in the eastern Med- iterranean region. Six reconstructions were developed from chronologies ranging in length from 115 years to 600 years. The first reconstruction (1885–2000) was de- rived from principal components (PCs) of 36 combined chronologies. The remaining five, 1800–2000, 1700– 2000, 1600–2000, 1500–2000 and 1400–2000 were developed from PCs of 32, 18, 14, 9, and 7 chronologies, respectively. Calibration and verification statistics for the period 1931–2000 show good levels of skill for all reconstructions. The longest period of consecutive dry years, defined as those with less than 90% of the mean of the observed May–August precipitation, was 5 years (1591–1595) and occurred only once during the last 600 years. The longest reconstructed wet period was 5 years (1601–1605 and 1751–1755). No long term trends were found in May–August precipitation during the last few centuries. Regression maps are used to identify the influence of large-scale atmospheric circu- lation on regional precipitation. In general, tree-ring indices are influenced by May–August precipitation, which is driven by anomalous below (above) normal pressure at all atmospheric levels and by convection (subsidence) and small pressure gradients at sea level. These atmospheric conditions also control the anomaly surface air temperature distribution which indicates be- low (above) normal values in the southern regions and warmer (cooler) conditions north of around 40ŶN. A compositing technique is used to extract information on large-scale climate signals from extreme wet and dry summers for the second half of the twentieth century and an independent reconstruction over the last 237 years. Similar main modes of atmospheric patterns and surface air temperature distribution related to ex- treme dry and wet summers were identified both for the most recent 50 years and the last 237 years. Except for the last few decades, running correlation analyses be- tween the major European-scale circulation patterns and eastern Mediteranean spring/summer precipitation over the last 237 years are non-stationary and insignificant, suggesting that local and/or sub-regional geographic factors and processes are important influences on tree- ring variability over the last few centuries. 1 Introduction The Mediterranean region is climate-sensitive, stressed by extremes of heat, highly variable precipitation, and limited water resources. These features are of great sig- nificance to the growing human populations of the area. High (monthly, seasonal, annual and interannual) and low (interdecadal to century) frequency variations of precipitation play a crucial role in the regional agricul- ture, ecosystems, environment and socio-economics and waterresources(Tu¨ rkes¸ 1998; Mann 2002; Xoplaki et al. 2000, 2004). Regional climate variability results from the interactions of local factors and a variety of large-scale R. Touchan (&) Æ G. Funkhouser Æ M. K. Hughes Laboratory of Tree-Ring Research, The University of Arizona, P.O. Box 210058, Tucson, AZ, 85721-0058 USA E-mail: [email protected] Tel.: +1-520-6212992 Fax: +1-520-6218229 E. Xoplaki Æ J. Luterbacher Institute of Geography and NCCR Climate, University of Bern, Hallerstrasse 12, 3012 Bern, Switzerland N. Erkan Southwest Anatolia Forest research Institute (SAFRI), POB 264, Antalya, Turkey U ¨ nal Akkemik Faculty of Forestry, Department of Forest Botany, University of Istanbul, 34473 Bahc¸eko¨y-Istanbul, Turkey J. Stephan Forestry Department, Ministry of Agriculture, Beirut, Lebanon Climate Dynamics (2005) 25: 75–98 DOI 10.1007/s00382-005-0016-5
Transcript of Reconstructions of spring/summer precipitation for the Eastern Mediterranean from tree-ring widths...

Ramzi Touchan Æ Elena Xoplaki Æ Gary Funkhouser
Jurg Luterbacher Æ Malcolm K. Hughes Æ Nesat Erkan
Unal Akkemik Æ Jean Stephan
Reconstructions of spring/summer precipitation for the EasternMediterranean from tree-ring widths and its connection to large-scaleatmospheric circulation
Received: 30 August 2004 / Accepted: 14 February 2005� Springer-Verlag 2005
Abstract This study represents the first large-scale sys-tematic dendroclimatic sampling focused on developingchronologies from different species in the eastern Med-iterranean region. Six reconstructions were developedfrom chronologies ranging in length from 115 years to600 years. The first reconstruction (1885–2000) was de-rived from principal components (PCs) of 36 combinedchronologies. The remaining five, 1800–2000, 1700–2000, 1600–2000, 1500–2000 and 1400–2000 weredeveloped from PCs of 32, 18, 14, 9, and 7 chronologies,respectively. Calibration and verification statistics forthe period 1931–2000 show good levels of skill for allreconstructions. The longest period of consecutive dryyears, defined as those with less than 90% of the mean ofthe observed May–August precipitation, was 5 years(1591–1595) and occurred only once during the last600 years. The longest reconstructed wet period was5 years (1601–1605 and 1751–1755). No long termtrends were found in May–August precipitation duringthe last few centuries. Regression maps are used toidentify the influence of large-scale atmospheric circu-lation on regional precipitation. In general, tree-ringindices are influenced by May–August precipitation,
which is driven by anomalous below (above) normalpressure at all atmospheric levels and by convection(subsidence) and small pressure gradients at sea level.These atmospheric conditions also control the anomalysurface air temperature distribution which indicates be-low (above) normal values in the southern regions andwarmer (cooler) conditions north of around 40�N. Acompositing technique is used to extract information onlarge-scale climate signals from extreme wet and drysummers for the second half of the twentieth centuryand an independent reconstruction over the last237 years. Similar main modes of atmospheric patternsand surface air temperature distribution related to ex-treme dry and wet summers were identified both for themost recent 50 years and the last 237 years. Except forthe last few decades, running correlation analyses be-tween the major European-scale circulation patterns andeastern Mediteranean spring/summer precipitation overthe last 237 years are non-stationary and insignificant,suggesting that local and/or sub-regional geographicfactors and processes are important influences on tree-ring variability over the last few centuries.
1 Introduction
The Mediterranean region is climate-sensitive, stressedby extremes of heat, highly variable precipitation, andlimited water resources. These features are of great sig-nificance to the growing human populations of the area.High (monthly, seasonal, annual and interannual) andlow (interdecadal to century) frequency variations ofprecipitation play a crucial role in the regional agricul-ture, ecosystems, environment and socio-economics andwater resources (Turkes 1998; Mann 2002; Xoplaki et al.2000, 2004). Regional climate variability results from theinteractions of local factors and a variety of large-scale
R. Touchan (&) Æ G. Funkhouser Æ M. K. HughesLaboratory of Tree-Ring Research, The University of Arizona,P.O. Box 210058, Tucson, AZ, 85721-0058 USAE-mail: [email protected].: +1-520-6212992Fax: +1-520-6218229
E. Xoplaki Æ J. LuterbacherInstitute of Geography and NCCR Climate, University of Bern,Hallerstrasse 12, 3012 Bern, Switzerland
N. ErkanSouthwest Anatolia Forest research Institute (SAFRI), POB 264,Antalya, Turkey
Unal AkkemikFaculty of Forestry, Department of Forest Botany, University ofIstanbul, 34473 Bahcekoy-Istanbul, Turkey
J. StephanForestry Department, Ministry of Agriculture, Beirut, Lebanon
Climate Dynamics (2005) 25: 75–98DOI 10.1007/s00382-005-0016-5
circulation features. Some of the main physical andphysico-geographical factors controlling the spatial dis-tribution of climatic conditions over the Mediterraneaninclude atmospheric circulation, latitude, altitude(orography), Atlantic and Mediterranean sea surfacetemperatures, land-sea interactions (distance from thesea), and smaller-scale processes (Lolis et al. 1999;Xoplaki et al. 2000, 2003a, b, 2004).
Natural and human systems are vulnerable to thescarcity and irregular availability of water resources thatcharacterize the region’s climate. This is due mainly tothe high seasonal and year-to-year variability of pre-cipitation. In the Mediterranean region, where most ofthe annual rainfall occurs during the winter half-year,severe water deficits can occur during the growing sea-son even when there is sufficient annual precipitation.This is especially true in the eastern Mediterranean andNear East (e.g. Tarawneh and Kadioglu 2003).
These climatic features can play a role in thedynamics of regional demographic, socio-cultural, eco-nomic, and environmental change (Tsiourtis 2001).Therefore, understanding natural climate variability isof great importance. Developing this understanding isdifficult from the relatively short available instrumentalrecord. Natural archives such as tree rings and otherproxy records can be used to capture information aboutclimate variability on longer time scales (e.g. Hughes2002; Jones and Mann 2004 and references therein).
One advantage of tree-ring records is their precisedating to the calendar year, which allows them to becompared directly with instrumental records. Thisprovides a powerful tool for developing qualitativeand quantitative reconstructions of climate on sea-sonal to century or longer time scales. They alsorepresent the most geographically widespread proxyrecords capable of yielding annually resolved timeseries over the past several centuries (e.g. Touchanet al. 2003; Jones and Mann 2004; Briffa et al. 2004;
Esper et al. 2004) and generally possess the highestcorrelations with instrumental climate data (Joneset al. 1998). Depending upon growth ecology, theannual patterns of tree rings may reflect environmentalinfluences such as precipitation, temperature, stream-flow, and the frequency of extreme drought events(Chbouki 1992; Touchan et al. 1999; Hughes et al.1999; Meko et al. 2001).
Dendroclimatology in the eastern Mediterranean re-gion is still in the initial stages of development. Moststudies are recent (Akkemik 2000; Akkemik and Aras2005; Akkemik et al. 2005; D‘Arrigo and Cullen 2001;Hughes et al. 2001; Touchan et al. 1999, 2003, 2004;Touchan and Hughes 1999) with the exception of anearlier work by Gassner and Christiansen-Weniger(1942). This body of work has demonstrated that tree-ring growth is significantly influenced by precipitation atthe investigated sites. It is well known that atmosphericcirculation has a significant impact on winter precipita-tion over all or parts of the Mediterranean (e.g. Zoritaet al.1992; Corte-Real et al. 1995; Turkes 1998; Esheland Farrell 2000; Cullen and deMenocal 2000; Cullenet al. 2002; Eshel et al.2000; Quadrelli et al. 2001;Dunkeloh and Jacobeit 2003; Bartzokas et al. 2003;Fernandez et al. 2003; Xoplaki et al. 2000, 2004 andreferences therein; Turkes and Erlat 2005). Generally,this connection is less strong during summer as localand/or sub-regional conditions are more important thanthe large-scale influence (e.g. Turkes and Erlat 2003).
This study represents the first large-scale systematicdendroclimatic sampling campaign focused on develop-ing chronologies from the species Cedrus libani, Cedrusbrevifolia, Juniperus excelsa, Pinus brutia, Pinus nigra,Pinus sylvestris, Pinus leukodermis, and Abies cilicica inTurkey, Syria, Lebanon, Cyprus, and Greece. We pres-ent late spring/summer (May–August) precipitationreconstructions ranging from 115 years to 600 years inlength using the above tree-ring chronologies. We also
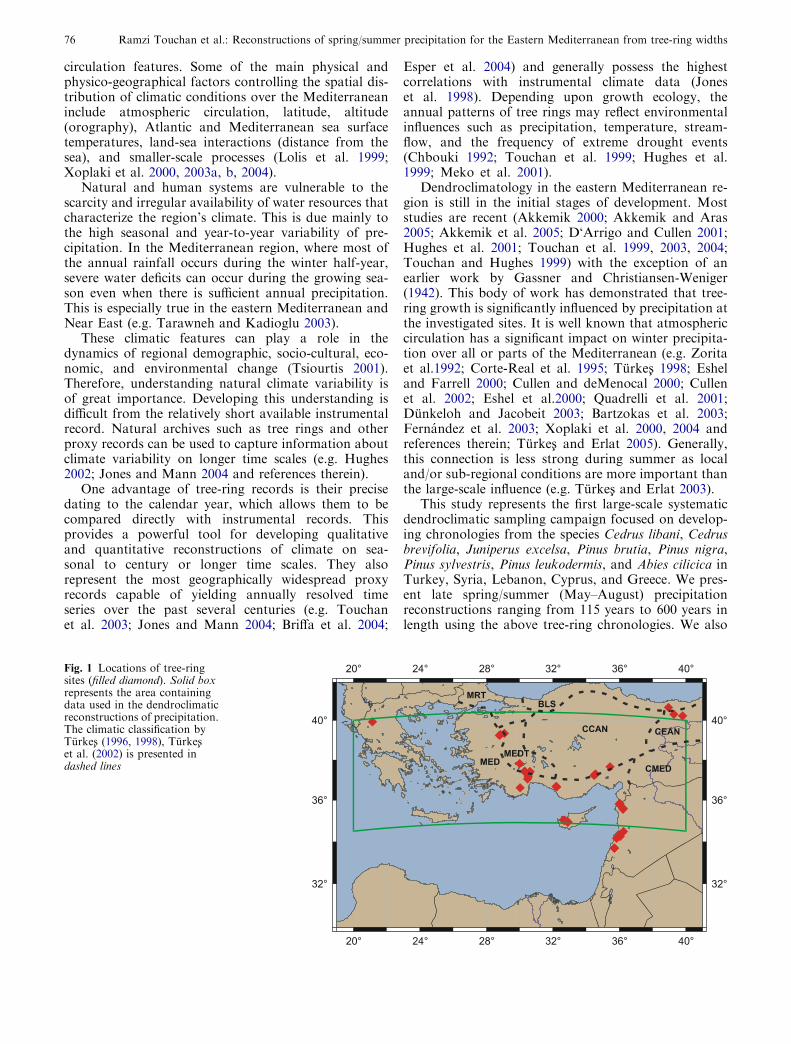
Fig. 1 Locations of tree-ringsites (filled diamond). Solid boxrepresents the area containingdata used in the dendroclimaticreconstructions of precipitation.The climatic classification byTurkes (1996, 1998), Turkeset al. (2002) is presented indashed lines
76 Ramzi Touchan et al.: Reconstructions of spring/summer precipitation for the Eastern Mediterranean from tree-ring widths

Table
1Siteinform
ationfortheEasternMediterraneanregion
Sitename
Sitecode
Country
Species
Elevation(m
)Latitude
Longitude
Tim
espan
(year)
Totalno.ofyears
No.oftrees
No.ofcores
Earliest
Latest
YatakCam
ıYAT
Turkey
Pinussylvestris
2213–2278
40�49¢N
42
�26
¢E1757
2001
245
17
34
EsekMeydanı
ESE
P.sylvestris
2305–2388
40�46¢N
42
�23
¢E1613
2001
389
40
72
Gavraz
GAV
P.sylvestris
1852
40�40¢N
36
�57
¢E1788
2001
214
14
20
Ayazoglu
mevkii
AYA
P.sylvestris
2394–2419
40�37¢N
42
�30
¢E1770
2001
232
20
37
_ Istasyonmevkii
IST
P.sylvestris
1604–2491
40�21¢N
42
�33
¢E1748
2001
254
19
33
TozluTepe
TOZ
P.sylvestris
2156–2192
40�18¢N
39
�16
¢E1732
2001
270
15
30
AkyolDeresi
AKY
P.sylvestris
2430–2595
40�16¢N
42
�44
¢E1719
2002
284
38
69
CalDagı
CAL
P.sylvestris
1619–1724
40�14¢N
39
�05
¢E1787
2001
215
16
30
Kirazli
KIR
Pinusnigra
1557–1739
39�20¢N
29
�05
¢E1796
2002
207
20
34
Aligalani
ALI
P.nigra
1582–1732
39�16¢N
28
�51
¢E1771
2002
232
12
23
Atalani
ATA
P.nigra
1453–1499
39�14¢N
28
�47
¢E1792
2002
212
10
19
Circirtepe
CIR
PP.nigra
1496–1553
37�38¢N
35
�26
¢E1475
2001
527
18
18
SuBatan
SUB
Juniperusexcelsa
1808–1916
37�25¢N
30
�18
¢E1246
2000
755
25
36
Aziziye
AZY
P.nigra
1601–1670
37�25¢N
30
�17
¢E1511
2001
491
23
35
DumanliDag
DUD
Pinusbrutia
887–1426
37�24¢N
30
�38
¢E1694
2001
218
21
27
Katrandagi
KAT
Cedruslibani
1421–1517
37�23¢N
30
�36
¢E1693
2001
309
23
36
Ananardic
ANA
J.excelsa
1762–1868
37�16¢N
34
�33
¢E1330
2001
672
18
23
Silpisli
SIL
JJ.excelsa
1727–1851
37�16¢N
34
�33
¢E1350
2001
652
17
22
Neseli
NESJ
J.excelsa
1708–1741
37�12¢N
34
�28
¢E1235
2001
767
24
29
Goller
GOLP
P.brutia
1002–1093
37�09¢N
30
�31
¢E1695
2001
308
22
35
Goller
GOLJ
J.excelsa
1002–1093
37�05¢N
30
�31
¢E1152
2000
849
16
31
BayatBadem
leri
BAB
P.brutia
641–754
37�02¢N
30
�28
¢E1738
2001
264
15
15
KozluPinari
KOP
P.nigra
1597–1669
36�39¢N
32
�12
¢E1586
2000
415
16
24
YellicBeli
YEB
C.libani
1668–1779
36�39¢N
32
�11
¢E1628
2000
373
16
24
Elm
ali
ELMJ
J.excelsa
1853–2022
36�36¢N
30
�01
¢E1032
2001
970
44
63
Elm
ali
ELMC
C.libani
1853–2022
36�36¢N
30
�01
¢E1449
2001
553
50
70
Atera
ATEP
Syria
P.brutia
409–462
35�50¢N
36
�01
¢E1892
2001
110
77
BaitHamik
BAIP
P.brutia
459–565
35�47¢N
35
�59
¢E1882
2001
120
21
25
MafrakBaitAblak
MBAP
P.brutia
553–560
35�47¢N
36
�01
¢N1901
2001
101
10
11
KumatBaniMata
KNM
C.libani
1423–1471
35�36¢N
36
�13
¢E1837
2001
165
19
20
BedayatAlKhandakAlTawil
BKTA
Abiescilicica
1401–1416
35�34¢N
36
�12
¢E1830
2001
172
16
17
RawisatAlm
edeki
RWIA
A.cilicica
1476–1493
35�33¢N
36
�12
¢E1795
2001
207
17
18
WadiBalat
WAB
Lebanon
A.cilicica
1156–1192
34�28¢N
36
�14
¢E1722
2001
280
16
19
Herch
Ehden
HCH
C.libani
1617–1664
34�18¢N
35
�59
¢E1809
2001
193
21
22
Bsheri
BSH
C.libani
1826–1975
34�14¢N
36
�02
¢E1382
2002
621
46
69
Arz
Jaj
ARJ
C.libani
1605–1979
34�08¢N
35
�49
¢E1778
2002
225
39
52
Barouk
BAR
C.libani
1738–1812
33�41¢N
35
�41
¢E1829
2002
174
18
31
Maaser
MAA
C.libani
1693–1734
33�40¢N
35
�41
¢E1730
2002
273
12
19
StavzosPsokas
STP
Cyprus
P.brutia
1040–1082
35�01¢N
32
�38
¢E1739
2002
264
20
38
Tripylos
TRI
Cedrusbrevifolia
1392–1401
34�59N
32
�40
¢E1532
2002
471
22
42
Chionistra
CHI
P.nigra
1747–1795
34�56¢N
32
�52
¢E1379
2002
624
22
44
Arm
iantos
AMIB
P.brutia
1483–1646
34�55¢N
32
�54
¢E1584
2002
419
17
33
AMIN
P.nigra
1618–1666
34�55¢N
32
�54
¢E1554
2002
449
19
38
ValiaKalda
VKAN
Greece
Pinusleukodermis
1639–1729
39�55¢N
21
�09
¢E1407
2003
597
20
40
VKAL
P.nigra
1692–1714
39�54¢N
21
�10
¢E1232
2003
772
21
52
Ramzi Touchan et al.: Reconstructions of spring/summer precipitation for the Eastern Mediterranean from tree-ring widths 77

diagnose large-scale climate influences in the tree-ringdata for the instrumental and reconstruction periods.
2 Site and climate descriptions
Forty-two tree-ring sites sampled from Turkey, Syria,Lebanon, Cyprus, and Greece are presented in Fig. 1and Table 1. The sites range in elevation from 400 m to2,400 m a.s.l. May–August precipitation was found tobe the most important seasonal predictor for tree-ringgrowth in the region (see Results section). In the fol-lowing section, we briefly describe climate conditionsover the study area with emphasis on the May–Augustseason. Figure 2 presents (a) the May–August totalprecipitation and (b) the May–August mean tempera-ture using the gridded data of Mitchell et al. (2004) overthe investigated area for the period 1948–2000.
2.1 Climates of Turkey
The tree-ring sites in Turkey (Table 1) are located infour rainfall regions based on the classification byTurkes (1996, 1998), Turkes et al. (2002). These are theMediterranean climate region (MED) which includes the
sites: BAB, ALI, ATA, KIR, ELMJ, ELMC, GOLP,GOLJ, KOP, YEB, and ARAJ; the transition zone be-tween the Mediterranean and the Mediterranean Tran-sition-Mediterranean to Central Anatolia regions(MED-MEDT) which includes the sites: AZY, DUD,KAT, and SUB; the Continental Central Anatolia re-gion (CCAN) which includes the sites: CIRP, ANA,SIL, NESJ, and GAV; and the Continental EasternAnatolia region (CEAN) which includes the sites: AKY,AYA, CAL, ESE, IST, TOZ, and YAT.
The MED region is characterized by dry, hot, sum-mers and cool, rainy, winters (Turkes 1996; Turkes et al.2002). Precipitation follows a strong seasonal pattern,with the most rainfall occurring during the cold seasonand very low amounts during the summer. Total annualrainfall is around 750 mm while total May–Augustrainfall is 50–100 mm (Fig. 2a). Wintertime seasons arecharacterized by a water surplus, and warm seasons bywater deficits. Generally, summer dryness is associatedwith large-scale regional climate (i.e., the Mediterraneanmacro-climate) that is controlled by both mid-latitudeand North African-Asiatic tropical (e.g. monsoon low)pressure systems (Turkes and Erlat 2003). The MED-MEDT region is similar to the Mediterranean regionwith moderately rainy winters and springs. The May–August precipitation is 100–150 mm (Fig. 2a) with an-nual precipitation of 520 mm.
Cool rainy springs, cold rainy winters, and warm andfairly dry summers characterize the semi-arid and drysemi-humid steppe climate of the CCAN region. May–August precipitation is 100–200 mm (Fig. 2a) with an-nual precipitation of 400 mm. The sites under theCEAN region conditions have cool rainy springs, earlysummers and very cold and snowy winters. The climatecan be characterized as dry semi-humid and semi-humidsteppe and highland. Average May–August precipita-tion is 150–300 mm (Fig. 2a) with an annual rainfall of460 mm. The May–August mean temperature in Turkeyranges between 15�C and 27�C (Fig. 2b). At high ele-vations cooler summers (eastern Turkey) contribute tothe lower temperatures. Closer to the MediterraneanSea, where the role of orography is reduced, higher an-nual temperatures are observed.
2.2 Climates of Syria, Lebanon, and Cyprus
The study areas located in Syria, Lebanon, and Cyprusare characterized by a Mediterranean climate with atypical seasonal rhythm of long, hot and dry summersand cool, rainy winters. Most precipitation occurs fromfall through spring, with summers being fairly dry. Mostof the sites, due to their high elevation, are covered withsnow from December through April. May–August pre-cipitation ranges between 0 mm and 100 mm (Fig. 2a)with annual precipitation ranging between 500 mm and1,400 mm.
Higher mean May–August temperatures characterizethe lower elevations of these countries. Values range
a)
b)
Fig. 2 May–August total precipitation (mm) and temperature (�C)over the eastern Mediterranean, 1948–2000 based on the griddedMitchell et al. (2004) data
78 Ramzi Touchan et al.: Reconstructions of spring/summer precipitation for the Eastern Mediterranean from tree-ring widths

Table
2Summary
statisticsforthe36chronologiesfortheARSTAN
program
Chronologyname
Sitecode
Totalchronology
Kurtosis
Commonintervals
Meansample
segmentlength
Standard
deviation
Skew
ness
First
year
SSSa>
0.85
Tim
espan
Meancorrelation
amongradii
Explained
variance
PC1(%
)
YatakCam
ıYAT
186
0.13
0.21
0.79
1803
1853–2001
0.32
35
EsekMeydanı
ESE
239
0.14
0.48
1.07
1682
1837–2001
0.34
36
Gavraz
GAV
170
0.16
0.22
0.10
1804
1812–2001
0.48
49
Ayazoglu
mevkii
AYA
175
0.12
0.02
0.19
1802
1857–2001
0.33
35
_ Istasyonmevkii
IST
144
0.11
�0.13
0.57
1846
1905–2001
0.26
29
TozluTepe
TOZ
166
0.15
0.65
0.55
1799
1885–2000
0.47
50
AkyolDeresi
AKY
200
0.12
�0.07
1.00
1757
1855–2001
0.35
35
CalDagı
CAL
150
0.17
0.28
1.18
1836
1890–1997
0.32
35
Northwestb
ALI-ATA-KIR
172
0.17
0.21
0.14
1799
1851–2001
0.37
38
Circirtepe
CIR
P390
0.20
0.40
3.82
1577
1689–2001
0.37
41
SuBatan
SUB
299
0.18
0.12
0.14
1338
1672–1950
0.44
50
Aziziye
AZY
204
0.13
0.08
0.00
1789
1861–2000
0.31
34
DumanliDag-Goller
cDUD-G
OLP
159
0.16
0.32
0.29
1793
1890–1999
0.41
42
Katrandagi
KAT
157
0.18
0.17
0.20
1815
1878–2000
0.47
49
South
Centrald
ANA-N
ESJ-
SIL
J289
0.20
0.19
0.14
1353
1823–1998
0.41
44
Goller
GOLJ
341
0.16
0.14
0.49
1594
1759–2000
0.32
36
BayatBadem
leri
BAB
171
0.19
�0.50
0.25
1751
1797–1996
0.59
65
KozluPinari
KOP
295
0.15
0.24
0.91
1682
1744–2000
0.31
35
YellicBeli
YEB
200
0.19
0.18
0.26
1743
1818–2000
0.36
41
Elm
ali
ELMJ
309
0.19
0.34
0.19
1470
1820–2000
0.37
40
Elm
ali
ELMC
330
0.17
�0.40
1.21
1505
1759–1997
0.48
50
PIB
RForest-SYR
eATEP-BAIP-MBAP
89
0.13
�0.39
0.08
1909
1937–2000
0.20
24
KumatBaniMata
KNM
99
0.20
0.16
0.04
1883
1921–2001
0.36
41
ABCE
Forest-SYR
fBKTA_RWIA
110
0.25
0.77
2.86
1872
1913–2000
0.26
31
WadiBalat
WAB
137
0.14
�0.22
0.44
1876
1913–2001
0.22
28
Herch
Ehden
HCH
138
0.18
1.41
11.93
1857
1891–1990
0.40
43
Bsheri
BSH
253
0.22
0.33
3.51
1548
1807–1964
0.42
44
Arz
Jaj
ARJ
113
0.18
0.18
2.51
1874
1924–2001
0.33
36
Barouk
BAR
116
0.24
2.00
11.81
1870
1899–2002
0.37
41
Maaser
MAA
156
0.24
�0.19
1.04
1821
1880–2002
0.49
53
StavzosPsokas
STP
213
0.16
�0.02
1.15
1765
1829–2002
0.37
39
Tripylos
TRI
238
0.18
0.64
3.56
1743
1812–2002
0.37
39
Chionistra
CHI
332
0.19
0.62
0.81
1596
1727–2002
0.41
44
Arm
iantos
AMIB
229
0.18
0.16
0.81
1706
1803–2002
0.42
45
AMIN
325
0.14
0.16
0.61
1591
1640–1934
0.30
33
ValiaKalda
VKAN-V
KAL
358
0.22
0.27
0.87
1308
1707–2002
0.42
44
aSSSisSubsample
SignalStrength
(Wigleyet
al.1984)
bNorthwestcombines
Kirazli,Aligalani,andAtalaniinto
onechronology(see
text)
c DumanliDag-Goller
combines
DUD
andGOLPinto
onechronology(see
text)
dSouth
Centralcombines
Neseli,Ananrdic
andSilpisliinto
onechronology(see
text)
e PIB
RForest-SYR
combines
Atera,BaitHamik,andMafrakBaitAblak(see
text)
f ABCEForest-SYR
combines
BedayatAlKhandakAlTawiandRawisatAlm
edeki(see
text)
Ramzi Touchan et al.: Reconstructions of spring/summer precipitation for the Eastern Mediterranean from tree-ring widths 79

between 18�C and 28�C, indicating a slightly warmersummer climate than Turkey (Fig. 2b).
Summer conditions over the eastern Mediterraneanare highly persistent, particularly during the July–August period. The lower levels of the atmosphere aredominated by the Persian trough (Alpert et al. 1990;Bitan and Saaroni 1992; Saaroni et al. 2003; Ziv et al.2004), a surface low-pressure trough extending from theAsian monsoon through the Persian Gulf, and alongsouthern Turkey to the Aegean Sea. The combination ofthe sub-tropical high of the Azores and the Persiantrough leads to northwesterly (Etesian) winds. TheEtesian winds are connected with a continual cooladvection from Eastern Europe and the Mediterraneaninto the Levant (e.g., Saaroni et al. 2003; Ziv et al. 2004).
In contrast, a persistent warming by subsidence,which dominates the eastern Mediterranean, counteractsthe advective cooling over the region (Saaroni et al.2003; Ziv et al. 2004, 2005). Ziv et al. (2004) report on afirst-order effect that has direct control of the Asianmonsoon on the interdiurnal variations of the verticalmotion over the Levant and a second-order effect thatcontrols the concurrent variations of the Etesian windsand the subsidence.
2.3 Climate of the Greek sites
The sites in Greece are located in the northern mainland,which has a modified continental Mediterranean cli-mate. This regime combines an equal annual rainfalldistribution plus the influence of Mediterranean sea-sonal variability. Total May–August precipitation overthe area reaches 150 mm (Fig. 2a), though highly vari-able, with an annual rainfall of 500 mm. Temperaturesvary with elevation, remaining below 20�C at upperaltitudes (Fig. 2b). Warm anomaly conditions overGreece occur when warm air dominates over the easternMediterranean, in connection with an anomalousnortheasterly-to-easterly flow and subsidence at the up-per levels. This leads to increased stability and inhibitionof convection, resulting in clear skies and maximuminsolation conditions. Such a combination favors atemperature structure with land–sea contrasts due to thehigher heat capacity of the water masses and fasterthermal response of the land (Xoplaki et al. 2003a).
3 Data
3.1 Tree-ring data and chronology development
Thirty-six chronologies from 42 sites were developedfrom Turkey, Syria, Lebanon, Cyprus, and Greece(Table 2). The dominant tree species in the study areasare shown in Table 1. Samples were collected fromspecies known to share a high degree of common vari-ation that is strongly driven by climate. Increment coreswere taken at all sites and full cross-sections were taken
from stumps of cedar and juniper. Samples were fine-sanded and crossdated using standard dendrochrono-logical techniques (Stokes and Smiley 1996; Swetnam1985). The width of each annual ring on the cores andcross-sections was measured to the nearest 0.01 mm.
Each series of tree-ring width measurements was fitwith a 67% cubic smoothing spline with a 50% cutofffrequency to remove non-climatic trends due to age, size,and the effects of stand dynamics (Cook and Briffa1990). The de-trended series were then pre-whitenedwith low-order autoregressive models to remove persis-tence not related to climatic variations. The individualindices were combined into single averaged chronologiesfor each combination of site and species using abi-weight robust estimate of the mean (Cook 1985).Since visual crossdating and computer-based qualitycontrol showed a strong similarity among the followingsites, they were combined to form single chronologies:(1) South Central combines Neseli (NESJ), Ananrdic(ANA), and Silpisli (SIL); (2) Northwest combinesKirazli (KIR), Aligalani (ALI), and Atalani (ATA); (3)Dumanli Dag-Goller combines Dumanli Dag (DUD)and Goller (GOLP); (4) PIBR Forest-SYR combinesAtera (ATEP), Bait Hamik (BAIP), and Mafrak BaitAblak (MBAP); and (5) ABCE Forest-SYR combinesBedayat Al Khandak (BKTA) and Rawisat Almedeki(RWIA).
3.2 Climate data
Two gridded climate data sets were used for thisstudy: (1) Monthly precipitation and temperature re-cords were obtained from the high resolution 0.5�gridded climate dataset CRU TS 2.0 (Mitchell et al.2004). A gridded region defined by latitudes 30�N–45�N and longitudes 20�E–40�E was selected as theinitial total universe of possible historic climate data.This region is larger than the core area defined by thelocation of the tree-ring sites so that regional, as wellas local, climate effects on tree growth could be de-tected. Climate data for the land areas within thisgridded network were available for 823 of the 1,200total individual grid points. The period 1931–2000 waschosen for analyses because it maximizes the numberof station records used in constructing the griddedclimate network while optimizing stability and consis-tency in sample depth.
Monthly (January through December), seasonal (e.g.winter, spring, summer, fall), and annual total precipi-tation and mean temperature datasets were developedfor each of the 823 available grid points. Monthly datafrom multiple grid points were used to build a library ofvarying sized gridded climate networks. From this,seasonal and annual total precipitation and mean tem-perature data were created for each of the climate grids.All these data (from the individual and combined gridpoints) were used in evaluating the climate–tree growthrelationship. For our analysis we defined the gridded
80 Ramzi Touchan et al.: Reconstructions of spring/summer precipitation for the Eastern Mediterranean from tree-ring widths

region latitudes 34.5�N–40�N and longitudes 20�E–40�Eas the most appropriate window.
(2) Gridded (2.5�·2.5� latitude–longitude resolution)monthly sea level pressure (SLP) data and geopotentialheights at different levels (850, 700, 500 and 300 hPa) forthe period 1948 to 2000 were taken from the NCEP/NCAR reanalysis data sets (Kalnay et al. 1996; Kistleret al. 2001). In order to isolate those characteristics ofatmospheric variability related to the tree-ring data, aspatial window was defined based on the highest corre-lation between the first principal component of the 36tree-ring width data set and the large-scale NorthernHemisphere geopotential height fields and SLP. It wasfound that the geographical window spanning from40�W–90�E and 20�N–70�N provided the most suitableatmospheric information for use with the tree-ringindices.
4 Methods
4.1 Response function analysis
Response function analysis (Fritts 1976; Fritts andGuiot 1990; Fritts and Shashkin 1995) was conductedbetween the 0.5� gridded climate data (temperature andprecipitation, see Sect. 3.2) and the tree-ring chronolo-gies. Candidate predictors were monthly temperatureand precipitation values for the 14 months ending inOctober of the year of growth. Predictands were: (1)tree-ring chronologies from the individual countries, (2)tree-ring chronologies built from each species (in totaland by country), and (3) chronologies of different
lengths were developed (described in Sect. 4.2). Thesepredictands were tested against the nearest individualgrid points and averages of numerous combinations ofthe climate data (predictors).
4.2 Precipitation reconstructions
The response function analysis identified May–Augusttotal precipitation as the most appropriate seasonalpredictand for reconstruction (not shown) based onconsistent patterns of monthly series with significantresponse function elements of the same sign. The pre-cipitation reconstructions were calibrated on the meanMay–August precipitation of the box shown in Fig. 1,covering latitudes 34.5�N–40�N and longitudes 20�E–40�E. Six separate reconstructions were developed toaccommodate the varying chronology lengths and totest the stability of the model: 1400–2000 (seven chro-nologies), 1500–2000 (nine chronologies), 1600–2000(14 chronologies), 1700–2000 (18 chronologies), 1800–2000 (32 chronologies) and 1885–2000 (36 chronolo-gies).
The different chronology sets were transformed touncorrelated predictors by projecting them to theirprincipal components (PCs) prior to developing theregression equation. Predictors for the final reconstruc-tion models were selected from the PCs by a forwardstepwise regression procedure. For the 1885–2000, 1800–2000, 1700–2000, 1600–2000, 1500–2000, and 1400–2000reconstructions, regression against the first PC accountsfor 52, 49, 41, 37, 41, and 40%, respectively of thevariance of May–August precipitation, and entered as
Table 3 Results of the statistical calibrations between May – August precipitation and tree growth for six reconstructions
Reconstruction CalibrationPeriod
VerificationPeriod
Variable Coefficient F Value P Adjusted-R2
CalibrationR2 Verification Reduction of
Error, RE
1885–2000 1966–2000 1931–1965 Constant 77.12 29.49 0.0001 0.46 0.57 0.58PC1 �5.18
1800–2000 Constant 77.16 25.72 0.0001 0.42 0.54 0.54PC1 �5.02
1700–2000 Constant 76.82 19.50 0.0001 0.35 0.46 0.46PC1 �5.52
1600–2000 Constant 76.62 17.06 0.0001 0.32 0.41 0.42PC1 �5.79
1500–2000 Constant 77.41 17.12 0.0001 0.32 0.47 0.46PC1 �7.31
1400–2000 Constant 77.56 18.65 0.0001 0.34 0.45 0.45PC1 �8.29
1885–2000 1931–1965 1966–2000 Constant 78.48 44.19 0.0001 0.56 0.47 0.48PC1 �5.29
1800–2000 Constant 78.42 37.89 0.0001 0.52 0.42 0.45PC1 �5.12
1700–2000 Constant 78.21 28.03 0.0001 0.44 0.37 0.38PC1 �5.79
1600–2000 Constant 78.17 23.25 0.0001 0.40 0.34 0.34PC1 �6.45
1500–2000 Constant 77.79 29.31 0.0001 0.45 0.34 0.34PC1 �8.90
1400–2000 Constant 76.58 27.04 0.0001 0.43 0.36 0.37PC1 �9.27
Ramzi Touchan et al.: Reconstructions of spring/summer precipitation for the Eastern Mediterranean from tree-ring widths 81

the single most significant predictor for each of thereconstructions.
Calibration equations were developed using precipi-tation data (predictand) for the period 1931–2000. ThePRESS procedure was used for cross-validation (Weis-berg 1985; Fritts et al. 1990; Meko 1997; Touchan et al.1999, 2003) in order to maximize the number of obser-vations and degrees of freedom used to calculate modelsignificance in the final regression equation. This mea-sure is calculated by sequentially removing singleobservations from the calibration period and calculatinga new regression equation over the remaining n-1observations and using the equation to estimate theobservation that was removed. This is repeated for eachof the n observations. In order to verify model stability,a split-sample procedure (Snee 1997; Meko and Graybill1995; Touchan et al. 2003) that divided the full periodinto two subsets of equal length (1931–1965 and 1966–2000) was used (Table 3). The reduction of error statistic(RE; Cook et al. 1994) was used to test whether therewas skill beyond what could be derived by simply usingthe calibration period mean as the reconstruction (Fritts1976). This test is passed if the RE value is positive. Theresulting models for the period 1931–2000 were thenused to calculate the six reconstructions from the chro-nology sets.
4.3 Analysis of extreme dry and wet events
Runs analysis (Dracup et al. 1980), a non-parametrictest of whether consecutive values above or below adefined threshold are random, was used on the recon-structions to study extreme May–August drought andwet events. Empirical thresholds for the dry and wetevents were defined as 90% (70 mm) and 110% (85 mm)of the 1931 to 2000 mean observed May–August pre-cipitation, respectively (Touchan et al. 2003, 2004).
4.4 Large-scale circulation patterns
4.4.1 Canonical correlation analysis in the empiricalorthogonal functions space
We follow the same approach as Xoplaki et al. (2003b,2004) relating Mediterranean summer temperature andwet season precipitation to large-scale atmospheric cir-culation dynamics. A downscaling model is calibratedusing canonical correlation analysis (CCA) in theempirical orthogonal function (EOF) space. We providehere a short overview of these methods. The reader isreferred to the detailed descriptions provided by Barnettand Preisendorfer (1987), Wilks (1995) and von Storchand Zwiers (1999).
Canonical correlation analysis is an appropriatemethod to search for linear relationships between twospace/time dependent variable sets. The CCA selectspairs of spatial patterns of each variable set such that the
(time dependent) pattern amplitudes are optimally cor-related. The canonical time series describe the strengthand sign of the corresponding pattern for each realiza-tion in time. Here, canonical series are normalized tounit variance and the canonical correlation vectors(patterns) represent typical anomalies in the units of thevariable with respect to its mean state. The correlationbetween the canonical series measures the degree ofassociation between the canonical patterns of predictorand predictand variables.
Prior to CCA the original data are usually projectedonto their EOFs, retaining those that account for mostof the total variance and minimize noise. As a pre-liminary step to the EOF calculation, the annual cyclewas removed from all grid point time series by sub-tracting the respective month’s 1931–2000 mean fromeach monthly value. In order to account for latitudinaldistortions in the grid area, the gridded predictor datawere weighted by multiplying them with the square rootof the cosine of their latitude (North et al. 1982; Livezeyand Smith 1999). A second step to ensure the stationa-rity of the variables needed for calculating EOFs andsubsequent CCA involved removal of the linear trend ofthe time series (standard least square fit, e.g. Edwards1984).
After the diagonalisation of the covariance and cross-correlation matrices during EOF and CCA processes,the long term trends were recovered by projecting(regressing) the original datasets onto their EOFs(canonical vectors), thus providing estimations of theprincipal components and canonical series with longterm variability and trends (e.g. Xoplaki et al. 2003a, b,2004). To determine the most suitable number of EOFsto retain from the predictor field and predictand timeseries, various CCA analyses with different numbers ofretained EOFs were performed. The first eight precipi-tation principal components were selected to performthe subsequent CCA analysis in combination with theprincipal components of the predictand field (i.e. tree-ring indices).
We performed different EOF-CCA experimentsrelating precipitation and temperature, as well as vari-ous large-scale circulation fields (300, 500, 700, and850 hPa, SLP), with the tree-ring indices. We also tes-ted different combinations of the months and seasonswhich account for the highest amount of explainedvariance of the tree-ring data. May–August precipita-tion proved to be the most important predictor,explaining approximately 22% of the total variabilityin the tree-ring indices. A multiple CCA using severalpredictors (temperature and precipitation or circulationfields at different levels) did not improve the explainedvariance (not shown).
4.4.2 Linear regression analysis
Regression maps have been used in several studies toidentify large-scale climate signals associated with giventime series such as identifying precipitation and tem-
82 Ramzi Touchan et al.: Reconstructions of spring/summer precipitation for the Eastern Mediterranean from tree-ring widths

perature signals connected with the Arctic and NorthAtlantic Oscillations (e.g. Hurrell 1996; Thompson andWallace 1998; Shindell et al. 1999) and large-scaleatmospheric variables related to Mediterranean summerair temperature (Xoplaki et al. 2003a, b). If the linkbetween the time series and the space-time-dependentfield is formulated individually for each location,regression maps (which are a collection of individualregression coefficients) are a straightforward way tocapture the signal of the time series in the space-time-dependent field (e.g. Widmann 2004).
For our purposes, it is of interest to understand theinfluences on tree-ring indices variability for the easternMediterranean region during the May–August seasonover the last few decades. Since precipitation proved tobe the most important predictor, we are mainly inter-ested in explaining the rainfall variability represented inthe first CCA by regressing its time series to the large-scale atmospheric circulation at sea level, at differentupper levels, and gridded air temperature. With the firstCCA time series, large-scale patterns are generated bycomputing the regression slope coefficients between the
CCA time series of the May–August precipitation andthe time series of May–August 300, 500, 700, and850 hPa, SLP, and surface air temperature from eachpoint in the data set.
4.4.3 Composite analysis
We also used composite analysis to extract informationregarding the large-scale climate SLP and surface airtemperature signals contained in the eastern Mediter-ranean tree-ring indices and extreme high and lowreconstructed precipitation both for the instrumentalperiod and back to 1764. For this, we reconstructed SLPand surface air temperature fields as described byLuterbacher et al. (2002, 2004) though using only stationpressure (station temperature) series. The SLP andsurface air temperature fields are independent (i.e. theyshare no common predictor in the reconstruction pro-cedure). Since summer SLP fields can be consideredreliable from 1764 (not shown), we restricted ourcomposite analysis to the last 237 years.
Fig. 3 Time coverage of thechronologies. Each horizontalline marks the time span of thechronology whose letter codeappears by the right-hand scale
Ramzi Touchan et al.: Reconstructions of spring/summer precipitation for the Eastern Mediterranean from tree-ring widths 83

The composite technique involves identifying coher-ent structures in the SLP, geopotential height, and nearsurface air temperature fields that are associated withbelow and above normal reconstructed precipitation.Common composite analyses are given as means withsome form of statistical significance test to assess chanceoccurrence of the pattern. These analyses have at leasttwo shortcomings (Brown and Hall 1999): (1) the mean(as a measure of location) is not resistant to the effects ofoutliers, especially in small samples and (2) it does notaccount for the associated variance. For these reasonswe applied the recently presented scaled mean andmodified t values that are particularly useful for smallsamples or in cases where the data distribution is un-known or known to be non-Gaussian (Brown and Hall1999).
We conducted two composite analyses: The first wasbased on the first CCA, where we selected the positiveand negative precipitation canonical scores with thethreshold of one standard deviation and calculated theanomaly composite for the corresponding upper, middleand lower tropospheric atmospheric fields, SLP, surfaceair temperature, and precipitation for the period 1948–2000 (for which NCEP Reanalysis data are available).For the second, we used the driest and wettest easternMediterranean summers over the last 237 years thatexceed 1.5 standard deviations from the mean andplotted the corresponding SLP and surface air temper-ature anomaly patterns.
4.4.4 Running correlation analysis
Running correlation analysis (computed in movingwindows) is frequently used in climate research todiagnose changes in relationships between two circu-lation indices (e.g. Schmutz et al. 2000; Jacobeit et al.2001, 2003; Gershunov et al. 2001; Slonosky et al.2001; Slonosky and Yiou 2002; Jones et al. 2003; Timmet al. 2004). At lower frequencies, the relationshipsbetween any pair of observed interannual climatemodes are expected to fluctuate in a purely stochasticmanner. Although some of this modulation may have a
physical basis and be predictable, most of it may bestochastic and, therefore, unpredictable (Gershunovet al. 2001). A 30-year running correlation analysisbetween the first and second EOF (which together ac-count for approximately 55% of total variance ofEuropean summer SLP) of SLP (Luterbacher et al.2002) and precipitation series were calculated for theperiod 1764–2000. Significance levels were estimatedfrom 1,000 Monte Carlo simulations of independentwhite noise processes.
5 Results and discussion
5.1 Tree-ring chronologies
The lengths of the 36 combined chronologies (derivedfrom the 42 site collections) range from 115 (PIBRForest-SYR, Syria) to 970 years (Elmali, Turkey;Table 1 and Fig. 3). Statistical analyses of each chro-nology are summarized in Table 2. The mean correla-tion among individual radii at each site represents thestrength of their common signal and ranges from 0.26 to0.59. The highest correlation is for Bayat Bademleri(Turkey) and the lowest is for the chronology developedfrom Bedaya, Al Khandak, Al Tawi and Rawisat Al-medeki (Syria).
The mean sample segment length (MSSL) of the 36chronologies ranges from 89 years to 390 years. Half ofthese chronologies have MSSL greater than 200 years inlength and many have several samples that exceed400 years. For the chronologies used to develop the1400–2000 reconstruction, MSSL for BSH, south cen-tral, SUB, ELMJ, CHI, GOLJ, and VKAN-VKAL are253, 289, 299, 309, 332, 338, and 358 years, respectively.In each of these chronologies 10–35% of the samples aregreater than 400 years in length. Therefore, the chro-nologies are suitable for investigating low-frequency(that is, centennial) climate variability.
Principal components analysis was used to capturethe regional dendroclimatic signal and provide anunderstanding of how the chronologies filter their
Table 4 Results of the statistical calibrations and cross-validation between May – August precipitation and tree growth for six recon-structions
Reconstructions Calibration Period Variable Coefficient F Value P Adjusted-R2 calibration PRESS No. of chronologies
1885–2000 1931–2000 Constant 77.78 76.92 0.0001 0.52 0.50 36.00PC1 �5.22
1800–2000 Constant 77.77 66.63 0.0001 0.49 0.46 32.00PC1 �5.05
1700–2000 Constant 77.46 49.93 0.0001 0.42 0.38 18.00PC1 �5.64
1600–2000 Constant 77.27 42.22 0.0001 0.37 0.34 14.00PC1 �6.10
1500–2000 Constant 77.43 48.11 0.0001 0.41 0.38 9.00PC1 �8.18
1400–2000 Constant 77.00 47.93 0.0001 0.41 0.38 7.00PC1 �8.87
84 Ramzi Touchan et al.: Reconstructions of spring/summer precipitation for the Eastern Mediterranean from tree-ring widths

respective climatic signals. PC1 accounts for 35% of thecommon tree-ring variance for the 1885–2000 data set(where all the chronologies were included in the analy-sis). PC1 shows strong positive weights throughout theregion, especially in southern Turkey and Cyprus. PC2(accounting for 9% of the variance) shows the contrastbetween northeastern Turkey and Syria and Lebanon(not shown).
The 36 chronologies are well replicated from treesgrowing on sites where their growth is strongly influ-enced by climatic variability. They represent the firstspecifically dendroclimatic tree-ring network for thisregion and indicate the great potential that exists forfuture work. This spatial network of chronologies con-tains seasonal precipitation and temperature signalscovering a fairly broad geographical area as indicatedby the analyses reported here. This provides further
evidence of the value for continued and intensifiedsampling in the eastern Mediterranean region. Thechronologies show a common high response to extremedry and wet May–August precipitation. This synchro-nicity of strong patterns in tree-ring growth suggests thatpan-regional growth forcing mechanisms are responsi-ble.
One of the major objectives of dendroclimatogists isto obtain the longest possible tree-ring records fromliving and dead trees to investigate climate variabilityover several centuries or longer. In most cases we wereable to collect samples that were several hundred yearsin length. This was accomplished primarily by applyingexperience gained in the semi-arid American Southwestin the selection of species, sites, and individual trees foranalysis. Furthermore, the MSSL of the chronologies isadequate to investigate centennial climate variability
Table 5 Pearson correlation coefficient (p=0.0001) between the different reconstructions
Reconstructions 1400–2000 1500–2000 1600–2000 1700–2000 1800–2000
1500–2000 0.971600–2000 0.92 0.961700–2000 0.91 0.95 0.991800–2000 0.87 0.91 0.94 0.971885–2000 0.87 0.91 0.93 0.96 0.99
Year1930 1940 1950 1960 1970 1980 1990 2000
May
-Aug
ust P
PT (
mm
)
40
80
120
160
A
B
C
D
E
F
Fig. 4 Comparison of actual(red line) and estimated May–August precipitation (blue line)for the 1931–2000 period.a 1885–2000 reconstruction,based on 36 chronologies;b 1800–2000 reconstruction,based on 32 chronologies;c 1700–2000 reconstruction,based on 18 chronologies;d 1600–2000 reconstruction,based on 14 chronologies;e 1500–2000 reconstruction,based on nine chronologies;f 1400–2000 reconstruction,based on seven chronologies
Ramzi Touchan et al.: Reconstructions of spring/summer precipitation for the Eastern Mediterranean from tree-ring widths 85

when combined, as here, with conservative de-trendingof the individual measurement series.
5.2 Precipitation reconstructions
Final regression statistics for the six reconstructionsobtained from the relationship between the first PC ofthe tree-ring (predictors) and precipitation (predictand)data are highly significant (Table 4). Pearson correlationcoefficients among the six reconstructions range between0.87 and 0.99 (Table 5). Because of the similarity andstrength of the derived calibration equations and verifi-cation tests, the full calibration period (1931–2000) wasused for all reconstructions. This allowed us to retain themaximum variability in the reconstructions (Table 4 andFig. 4). All subsequent discussion refers to the longest ofthese reconstructions, that covering the period AD1400–2000.
This reconstruction is significantly correlated with aFebruary–August precipitation reconstruction devel-oped by D’Arrigo and Cullen (2001) (r=0.69, n=353,p=0.001) for Sivas, central Turkey. A similarly strong
relationship was found with reconstructed May–JulyStandardized Precipitation Index for most of Turkeyand adjoining regions (Touchan et al. 2004).
Several major historical events coincide with extremedry and wet periods seen in the May–August precipita-tion reconstruction (Kuniholm 1990; Purgstall 1983).Kuniholm (1990) relays historical evidence (H. Inalcikand W. Griswold, personal communication) of a wide-spread famine and food shortages across Turkey, Syriaand Italy during the period of 1590–1595. This is coin-cident with the longest period of extended extremedrought in the reconstruction (1591–1595). In addition,several other episodes of famine brought on by cropshortages correspond with dry events in the recon-struction. In 1570–1571, when wheat exports were for-bidden in the Ottoman Empire, the reconstructionshows evidence of a 2-year dry event. Kuniholm (1990)identified single year short-term events such as a 1579famine in the Aegean region and Syria and a 1585famine and drought in west Anatolia and Eastern AsiaMinor, both of which correspond to extreme dry eventsin the reconstruction. He also references a great droughtin 1874 in Ankara, Turkey, which resulted in the death
1400 1450 1500 1550
40
80
120
160
1800 1850 1900 1950 2000
40
80
120
160
1600 1650 1700 1750
40
80
120
160
Year
1930 1940 1950 1960 1970 1980 1990 2000
May
-Aug
ust P
PT (
mm
)
40
80
120
160
Fig. 5 Time series plots of thesix May–August precipitationreconstructions overlaid on thesame axes demonstratingsimilar patterns in highfrequency variability
86 Ramzi Touchan et al.: Reconstructions of spring/summer precipitation for the Eastern Mediterranean from tree-ring widths

Year1850 1900 1950 2000
May
-Aug
ust P
PT (
mm
)
20
40
60
80
100
120
1401650 1700 1750 1800
20
40
60
80
100
120
140
1400 1450 1500 1550 1600
20
40
60
80
100
120
140
1460-63
1926-29
1591-95
1607
1935
1565
1936
1532-35
1601-051751-55
Fig. 6 1400–2000 May–Augustprecipitation reconstructiontime series. Horizontal solid lineis the mean of the observeddata. Horizontal dashed line isthe empirical threshold of 90%of the 1931–2000 mean May–August precipitation (70 mm).Horizontal dashed-dotted-dashed line is the empiricalthreshold of 110% of the 1931–2000 mean May–Augustprecipitation (85 mm). Solidgrey line is the actual May–August precipitation (Mitchellet al. 2004)
1650 1700 1750 1800
60
80
100
1400 1450 1500 1550 1600
60
80
100 95% Confidence Interval
Drought Threshold
Year1850 1900 1950 2000
60
80
100Wet Threshold
May
-Aug
ust P
PT (
mm
)
Fig. 7 Five-year movingaverage of reconstructed May–August precipitation. Valuesare plotted at the center of each5 year period. Uncertainty inreconstructed values is shownby two standard errors
Ramzi Touchan et al.: Reconstructions of spring/summer precipitation for the Eastern Mediterranean from tree-ring widths 87

of nearly a third of the human population as well aslarge number of herd animals. This, too, was an extremeevent year in the reconstruction.
Purgstall (1983) reported catastrophic fires and fam-ine in Anatolia in 1660. The reconstruction shows indeedthat 1660 was an extremely dry summer. In addition, thepreceding year was wetter than average. This is a com-mon pattern where during wet years there is a buildup offine fuels which become an important pre-condition forfire ignition and spread when conditions become drier(Baisan and Swetnam 1990; Swetnam 1993; Touchanet al. 1996). Purgstall (1983) reported a sustained faminein Anatolia from 1925–1928. The reconstruction showsan extended period of 4 years of drought during thesame period. It is worth noting that this period ofdrought ends with one of the wettest years recorded inthe reconstruction (1930 is the seventh wettest yearidentified in the reconstruction).
5.3 Analysis of extreme dry and wet events
The statistics are similar for all reconstructions.Therefore, we restricted the analysis of drought andwet events to the longest reconstruction (1400–2000;Table 5 and Fig. 5). The standard deviations from themean (77.4 mm) over the calibration period are14.1 mm for the reconstruction and 22.0 mm for theobserved data. The May–August precipitation timeseries is plotted in Fig. 6. The reconstruction contains186 dry events with a mean recurrence interval of3.2 years. The maximum interval between May–Au-gust dry periods is 12 years (1517–1529). A total of 97dry events had a duration of 1 year. Twenty-six dryperiods had a duration of 2 years, eight drought events
had a duration of 3 years, two drought events had aduration of 4 years (1460–1463 and 1926–1929), andone drought event had a duration of 5 years (1591–1595). The driest year (40 mm) in the reconstruction is1607. The driest year (31 mm) in the observed May–August precipitation data is 1935. May–August dryperiods of 1 year were evenly distributed from 1400through 1700.
Although there is no visible trend in reconstructedprecipitation, there is a notable increase in the frequencyof single dry years during the nineteenth and twentiethcenturies. Dry periods of 2 years were well distributedfrom 1500 through 1700. However, these dry periodsdecline in frequency during the fifteenth, nineteenth, andtwentieth centuries. The fifteenth century had the highestnumber of 3-year dry periods (four events). No 3-yeardry periods occurred during the sixteenth and seven-teenth centuries.
The extreme drought events of the May–Augustreconstruction were evaluated against two climate sta-tions, Beirut (Lebanon) and Nicosia (Cyprus), from1888–1930 to test the strength of the reconstruction.Even though these stations are at low elevations andsome distance from the tree-ring sites, the reconstructioncorrectly identified 5 of the 12 extreme dry events re-corded by these stations.
The reconstruction contains 180 May–August wetevents with a mean recurrence interval of 3.3 years and amaximum interval of 15 years (1481–1496). The wettestyear in the reconstruction was 1565 (131 mm). Thewettest year during the instrumental period was 1936(140 mm). Eighty-six wet events had a duration of1 year, 22 wet events had a duration of 2 years, elevenwet events had a duration of 3 years, one wet event hada duration of 4 years (1532–1535), and two wet events
a) b)
c)
Fig. 8 Patterns of the firstcanonical pair of a May–August precipitation sumanomalies (in mm, contourinterval 2 mm) and b tree ringwidth series over the 1931–2000period. They explain 9%(precipitation) and 22% (tree-ring width) of the totalvariance. c Normalized timecomponents of the first CCA.The correlation between thetwo series is 0.82
88 Ramzi Touchan et al.: Reconstructions of spring/summer precipitation for the Eastern Mediterranean from tree-ring widths

had a duration of 5 years (1601–1605 and 1751–1755).Generally, 1, 2, and 3 year wet periods were evenlydistributed throughout the reconstruction.
A May–August 5 year moving average of the pre-cipitation reconstruction demonstrates multiannual todecadal variation and suggests several prolonged wetand dry events (Fig. 7). The driest 5-year reconstructedperiod was 1436–1440 (61 mm). The driest 5-year periodin the instrumental data was 1941–1945 (61 mm). Thewettest 5-year reconstructed period was 1751–1755(98 mm), while the wettest period during the instru-mental data was 1972–1976 (95 mm). Figure 7 shows anupward trend (though not significant) from approxi-mately 1490–1520 followed by a period of high vari-ability in extreme wet and dry events until the latesixteenth century. The period 1750–1780 shows a pattern
of low variability. Two periods of high variability areevident from approximately 1650–1670 and from the1850s to the 1930s. There is no significant trend detect-able within the twentieth century.
5.4 Large-scale circulation patterns related to tree-ringindices AD 1931–2000
The relationship between May–August precipitationvariability and the eastern Mediterranean tree-ringindices over the 1931–2000 period was studied by meansof CCA in the EOF space. Canonical series and theirassociated spatial vectors for the leading first mode arepresented in Fig. 8. These maps represent anomaliesindicating realistic deviations in the physical units of
a) b)
c) d)
e)
f)
Fig. 9 Regression maps between NCEP Reanalysis large-scale variables (anomalies in gpm), gridded surface air temperature (anomalies in�C) and the first canonical series of precipitation presented in Fig. 8c over the period 1948–2000. Solid lines mark positive values anddashed lines negative values
Ramzi Touchan et al.: Reconstructions of spring/summer precipitation for the Eastern Mediterranean from tree-ring widths 89

each variable. These figures can be interpreted with ei-ther the present sign configuration or with the oppositesign, following the sign of the time series. For both the
predictor (precipitation) and the predictand (tree-ringindices), eight EOFs were retained for the subsequentCCA analysis.
Fig. 10 Scaled anomaly composites of a–d May–August geopoten-tial heights, e SLP, f surface air temperature and g precipitationanomalies for positive precipitation derived from Fig. 8c 1948–2000. Significant areas in (a–e) at the 90% and at the 95%confidence level are shaded in light and dark grey color,
respectively. Significant areas in (f, g) at the 90% and the 95%are given in dashed and solid lines. Units are arbitrary. Abovenormal May–August precipitation characterizes the summers 1959,1963, 1972, 1983, 1991, 1998
a)
c) d)
e)
f) g)
b)
90 Ramzi Touchan et al.: Reconstructions of spring/summer precipitation for the Eastern Mediterranean from tree-ring widths

The first CCA exhibits a correlation of 0.82 betweenthe predictor and the predictand (normalized timecomponents; Fig. 8c). The year-to-year variation of thetwo time series is presented in Fig. 8c. The strong rela-tionship between the two data sets implies that thiscoupled mode reflects more than half of the interaction
between the tree-ring indices and May–August precipi-tation over the period 1931–2000. The normalized timecomponents of the predictand and predictor representthe ‘sign’ corresponding to the patterns presented inFig. 8a, b. CCA1 accounts for 22% of the total tree-ringindices for the 36 chronologies.
a) b)
c) d)
e)
f) g)
Fig. 11 Same as Fig. 10 but for the negative precipitation scores derived from Fig. 8c. Below normal May–August precipitationcharacterizes the years 1956, 1973, 1977, 1978, 1985, 1994, 1996
Ramzi Touchan et al.: Reconstructions of spring/summer precipitation for the Eastern Mediterranean from tree-ring widths 91

The canonical component of the precipitation(Fig. 8a) explains approximately 9% of the total var-iability. In the positive phase (positive normalized timecomponents), the spatial pattern shows positive pre-cipitation anomalies stretching from Greece to Turkey,to the Near East region, and parts of the Balkans.Below normal rainfall is visible north of the BlackSea. Wet conditions are associated with above normaltree-ring indices at 35 of the 36 locations. The largestanomalies occurred in the Turkish, Cypriot and Syrianseries. These findings are broadly consistent with thosedetermined using response function analysis withclimate data local to the tree-ring sites (see Sect. 2.2).
Figure 9 shows the regression maps between the firstcanonical series of precipitation and: (1) several geopo-tential height variables (300, 500, 700, 850 hPa), (2) SLPas provided by the NCEP Reanalysis (Kalnay et al.1996; Kistler et al. 2001), and (3) surface air temperature(Mitchell et al. 2004) expressed as anomalies from the
1948 to 2000 period. A CCA analysis using the 1948–2000 period revealed essentially the same results as the1931–2000 period (not shown).
All the maps of Fig. 9 are regression maps between theresulting canonical series and the original fields. Thus,anomalies indicate realistic deviations in the physicalunits of each variable. The regression patterns for thegeopotential height fields show a strong dipole patternwith negative anomalies south of around 40�N and posi-tive anomalies further north connected with strongeranomalous easterlies (in absolute charts reduced wester-lies, not shown) in the north. In contrast, the easternMediterranean region is mainly influenced by anomalouslow pressure conditions and convection. These positiveand negative anomalies decrease towards lower levels anddisappear almost entirely at SLP. The surface air tem-perature regression illustrates a north-south pattern withcooler conditions south of around 40�N and above nor-mal temperatures over the remaining areas.
Fig. 12 Scaled anomaly composites of a, c reconstructed SLP(Luterbacher et al. 2002) b, d reconstructed temperature (Luterb-acher et al. 2004) for the wettest (1.5 standard deviation; left panel)and driest (1.5 standard deviation; right panel) eastern Mediterra-nean summers (May–August) after 1764. Significant areas in a, c at
the 90% and at the 95% confidence level are shaded in light anddark grey color, respectively. Significant areas in (b, d) at the 90%and the 95% level are given in dashed and solid lines. Units arearbitrary
a)
b) d)
c)
92 Ramzi Touchan et al.: Reconstructions of spring/summer precipitation for the Eastern Mediterranean from tree-ring widths

In general, above (below) normal tree-ring indicesover the eastern Mediterranean region in the second halfof the twentieth century appear to be influenced mainlyby above (below) normal May–August precipitation.This is driven by anomalous below (above) normalpressure at all levels and by convection (subsidence) andsmall pressure gradients at sea level. These atmosphericconditions are also responsible for the anomaly surfaceair temperature distribution, which indicates below(above) normal values in the southern regions andwarmer (cooler) conditions north of around 40�N.
5.5 Large-scale atmospheric circulation related to tree-ring and reconstructed precipitation data
5.5.1 Anomaly composites of high and low tree-ring widthAD 1948–2000
This section describes the spatial variability of atmo-spheric circulation at different levels, surface air tem-perature and precipitation as related to anomalous wetand dry late spring/summer seasons (derived from thefirst CCA time series; Fig. 8c).
Figure 10 shows the scaled anomaly (1948–2000mean subtracted) composites of the different large-scalefields related to the precipitation scores larger than onestandard deviation over the 1948–2000 period. Signifi-
cance of the composite anomalies, relative to the 1948–2000 mean, was computed using 90% and 95% signifi-cance thresholds of the modified two-sided t test (Brownand Hall 1999).
May–August geopotential heights and SLP anomalycomposites related to extreme positive precipitation overthe eastern Mediterranean (Fig. 10) indicate belownormal values in a zonally elongated band stretchingfrom the southern North Atlantic to the Mediterranean,Near East, and Asia. There are only small areas withinthe Mediterranean that exceed the 90% and 95% sig-nificance levels of the two-sided t test. Above normalgeopotential height and SLP values are prevalent northof around 50�N and parts of the northern NorthAtlantic. The anomaly composite patterns resemble theregressed patterns presented in Fig. 9 and those identi-fied by Hughes et al. (2001) and Touchan et al. (2003).
Below-normal geopotential heights and low pressureare connected with convectivity and atmospheric insta-bility. Low pressure systems passing over the Mediter-ranean (mostly in May) and other factors not directlyrelated to the large-scale atmospheric forcing lead tosignificantly above-normal precipitation over the easternMediterranean. The lower pressure and instability arealso responsible for lower temperatures over the region.High pressure and positive geopotential height anoma-lies in the north are significantly connected with conti-nental dry and warm air towards the northern Black Searegion and the Balkans (Fig. 10). The same analysis
a)
b)
Fig. 13 Thirty year runningcorrelation between the PCs ofthe first (a) and second (b) EOFof May–August SLP and May–August precipitation 1764–2000. The 90, 95 and 99%correlation significance levelshave been calculated withMonte Carlo simulations
Ramzi Touchan et al.: Reconstructions of spring/summer precipitation for the Eastern Mediterranean from tree-ring widths 93

based on the ten highest tree-ring indices reveals similarresults with slightly larger significant areas (not shown).
Anomaly composites related to the precipitationscores lower than one standard deviation over the period1948–2000 are shown in Fig. 11. They resemble the re-versed regression patterns shown in Fig. 9 and the dryyears pattern identified by Touchan et al. (2003). Thesignal and significant areas are much stronger and morewidespread than the anomaly composites related topositive precipitation (and thus tree-ring indices;Fig. 10). Anomalous negative precipitation (Fig. 10f) isgenerally connected with significantly higher geopoten-tial height and SLP anomalies stretching from northernAfrica to the eastern Mediterranean, the Caspian Seas,and Asia.
Low tree-ring indices (reduced precipitation) are thusrelated to a barotropic structure of the troposphere withblocking, subsidence, and stability over the easternMediterranean (Fig. 11a–e). This is connected withdryness and significantly higher temperatures south ofaround 42�N (Fig. 11f–g). Another important featurecharacterizing the eastern Mediterranean is a persistantinversion that prevails over the region from June toSeptember (Dayan et al. 1988, 2002; Saaroni et al. 2003).This inversion traps lower level moisture and pollutioncontributing to the enhancement of heat stress over thearea. The weakening of the Etesian winds, leading to areduction in the prevailing cool advection from north-west can explain, at least in part, the significant above-normal temperatures over the eastern Mediterranean.Significantly below-normal temperatures and abovenormal precipitation in the north of the Black Sea can bepartially explained by the anomalous weak mid to upperlevel trough over western Russia. This trough is associ-ated with instability and cooler air originating innorthwestern Europe.
Independent large-scale SLP and surface air temper-ature estimates allow us to analyze the large-scale cli-mate patterns related to the summer precipitationextremes derived from reconstructed precipitation in anhistorical context. From the May–August precipitationreconstruction (Fig. 6), we selected the driest and wettestsummers (exceeding 1.5 standard deviation; 16 dry and17 wet summers) from 1764 to 2000 and calculatedanomalous SLP and surface air temperature compositesand their associated significant regions (Fig. 12). Thedriest summers from 1764 reconstructed from the tree-ring indices reveal a consistent picture with significantpositive SLP anomalies over the Mediterranean similarto Fig. 11, though with shifted centers of maximumdepartures.
Differences in the SLP distribution and the center oflargest anomalies can be related not only to uncertaintiesin the SLP and precipitation reconstructions for the pre-1900 period, but also to a variety of circulation patternsresponsible for anomalous extremes of precipitation inthe area. More important however, are the small pres-sure gradients during the summer and the fact that theclimatic conditions are influenced mainly by regional
scale processes and are more sensitive to local forcingrelated to insolation distribution, high sensitivity to locallower boundary conditions (soil moisture), and othereffects such as topography, exposure and continentality.
There is a resemblance in terms of significant areasbetween the anomalous temperature patterns during thelast 50 years of the twentieth century (Fig. 11) and thetemperature patterns associated with dry conditionsover the last 237 years (Fig. 12d). Main differences canbe found over western Turkey. In general, though, ourresults point to the stability of the large-scale climatepatterns over the last several centuries related to easternMediterranean extremes. They have been associatedwith anomalously high pressure over large parts of theMediterranean, warmer conditions over southern andeastern Turkey as well as Near East, and cooler condi-tions over the western and northern Black Sea region.
Concerning the wettest summers over the easternMediterranean region for the 1764–2000 period(Fig. 12c), the SLP anomaly composite (Fig. 12a) showsa similar pattern compared to the wet cases over the last50 years of the twentieth century (Fig. 10g), though withsignificant areas over the western and eastern Mediter-ranean Basin. Nevertheless, the lower pressure zonefrom the Atlantic through Europe to the southeasternMediterranean points to recurrent low pressure systemsbringing frontal systems from the northwest to the re-gion. This, together with the orography and smallerscale processes that play a very significant role, leads toabove normal rainfall, particularlly during late springand summer. The anomalous temperature pattern(Fig. 12b) shows strong similarities (except for Greece)with negative values along the southern Turkish coastand the Near East region, but positive anomalies northof the Black Sea area, the Balkans and Greece.
5.5.2 Relationship between atmospheric circulation andreconstructed precipitation from AD 1764–2000
In addition to the analysis of wet and dry extremes in thepast and present, this section examines the overall cor-relation and running correlations between atmosphericcirculation and precipitation for the instrumental andreconstruction periods. The correlation between the firstCCA precipitation scores and major teleconnectionindices (http://www.cpc.ncep.noaa.gov/data/teledoc/telecontents.html; NOAA-CPC 2004) published by theNOAA Climate Prediction Center for the last 50 yearsindicates a significant (at the 5% level) correlation onlywith the East Atlantic Jet (EA-Jet) pattern. The EA-Jetis the third primary mode of low frequency variabilityfound over the North Atlantic, appearing from April toAugust.
The EA-Jet pattern also shows a north-south dipoleof anomaly centers, with one main center located overthe high latitudes of the eastern North Atlantic andScandinavia, and the other center located over north-ern Africa and the Mediterranean Sea. A positive phaseof the EA-Jet pattern reflects an intensification of
94 Ramzi Touchan et al.: Reconstructions of spring/summer precipitation for the Eastern Mediterranean from tree-ring widths

westerlies over the central latitudes of the easternNorth Atlantic and much of Europe (in agreement withour regression patterns, Fig. 9), while a negative phasereflects a strong split-flow configuration over these re-gions, sometimes in association with long-lived block-ing anticyclones in the vicinity of Greenland and GreatBritain (NOAA-CPC 2004). Our anomaly regressionpattern at 500 hPa (Fig. 9) is similar to the first sum-mer (JJAS) CCA results between 500 hPa and Medi-terranean precipitation reported by Dunkeloh andJacobeit (2003). They also noted a significant correla-tion with the EA-Jet pattern throughout the entireMediterranean coastal area for the second part of thetwentieth century.
A further investigation has been made on the strengthof the correlations between the reconstructed precipita-tion time series and atmospheric circulation for theperiod 1764–2000 to see how they change over time.Thus, this analysis is an indication of potential insta-bilities through time and the importance of the mainEuropean atmospheric modes on regional easternMediterranean summer precipitation. As EA-Jet patternreconstructions are not available prior to 1950, we per-formed running correlations for overlapping 30-yearperiods between the first and second principal compo-nents of the North Atlantic/European SLP and recon-structed precipitation (Fig. 13). The significance of thecorrelation coefficients is based on the calculation of1,000 Monte Carlo simulations.
The first EOF of May–August SLP for the period1764–2000 explains 32% of the total May–August SLPvariability and reveals a monopole pattern with nega-tive anomalies centered over the British Isles (notshown). The Mediterranean area is at the southernborder of this negative anomaly pattern. This patternstrongly resembles the EA-Jet anomaly pattern de-scribed above. Interestingly, the first SLP PC correlatessignificantly at the 99% level (r=0.35) with the EA-Jetindex over the common period 1950–2000. Thus, thisPC can be considered a ‘proxy’ for the EA-Jet over thelast 237 years.
The second EOF accounts for 23.3% of summer SLPvariance and is connected with positive pressure anom-alies south of approximately 55�N and below normalSLP centered over Iceland (not shown). As expected, thecorrelations between the main modes of summer atmo-spheric circulation and eastern Mediterranean precipi-tation are weak and often statistically insignificant. Forthe first PC, significant positive correlations are foundshortly after 1850 and during the middle of the twentiethcentury, but with negative correlations over the last fewdecades (Fig. 13a). These analyses suggest that recentsignificant correlation with the EA-Jet pattern is notstable through time. We believe that changing climaticconditions are responsible for this apparent disagree-ment. The 30 year-running correlation between the sec-ond SLP EOF and precipitation reveals mostlyinsignificant relationships, except for the middle of thetwentieth century (Fig. 13b).
Similar findings on non-stationary relations betweenatmospheric circulation and European climate coveringthe past few centuries have been found recently (e.g.Schmutz et al. 2000; Jacobeit et al. 2001, 2003; Slonoskyet al. 2001; Slonosky and Yiou 2002; Jones et al. 2003;Timm et al. 2004). Jacobeit et al. (2003) report thatduring July, the long-term evolution of increasing anti-cyclonicity over Europe has strengthened during the last50 years, becoming recently a unique phenomenonwithin the last centuries and causing an unprecedenteddecline in Central European July precipitation duringthe second half of the twentieth century.
We did not find a reduction of precipitation over thesame period for southeastern Europe. However, Julyprecipitation over this area is almost exclusively con-nected to smaller scale processes and local factors.Further, climate variations of the atmospheric circula-tion, or changes in the probability distribution of cir-culation modes induced by anthropogenic effects, arelikely to project onto the natural modes during thetwentieth century (e.g. Hsu and Zwiers 2001). Fromthis fact one would conclude that EA-Jet or any otherteleconnection index reconstructions based on theeastern Mediterranean precipitation (or tree-ringinformation) data for the second half of the twentiethcentury would be less representative than in pre-industrial times.
6 Conclusions
This study represents the first large-scale systematicdendroclimatic sampling focused on developing chro-nologies from Turkey, Syria, Lebanon, Cyprus, andGreece. It demonstrates that annual tree-ring growthfrom the region contains excellent records of May–Au-gust precipitation. Extending annual observed climaticdata through dendrochronology offers new perspectiveson the level, variability, and duration of past climatictrends and extreme events. The reconstruction of latespring/summer (May–August) precipitation also pro-vides a climate variable with annual resolution that addsa new dimension to the environmental contexts histori-ans and archaeologists working in the region can use fortheir descriptions and interpretations of human socialand population dynamics.
Multiannual and decadal variations are evident in theMay–August precipitation reconstruction. There is anupward, though not significant, trend from approxi-mately 1490–1520 followed by high variation in extremewet and dry events until the late sixteenth century. Twoperiods of high variability are evident from approxi-mately 1650–1670 and from the 1850s to the 1930s.There is no significant trend detectable in the twentiethcentury. The longest dry period during the past sixcenturies lasted 5 years (1591–1595) and occurred onlyonce during the last 600 years. The longest wet periodduring the past 600 years also lasted 5 years (1601–1605and 1751–1755).
Ramzi Touchan et al.: Reconstructions of spring/summer precipitation for the Eastern Mediterranean from tree-ring widths 95

We found that tree-ring indices in the area are sen-sitive mainly to May–August precipitation and, to alesser extent, temperature. Strong (weak) tree-ringgrowth is associated with above (below) normal pre-cipitation over large parts of eastern Mediterranean.Above (below) normal precipitation in these areas canbe related to anomalous below (above) normal SLP overthe larger Mediterranean area, connected with convec-tive instability (stability). A novel comparison withindependent reconstructions of surface air temperatureand SLP since 1764 suggests that similar main climatemodes over the recent 50 years and the last 237 years arerelated to anomalous wet and dry summers. Runningcorrelation series calculated over 30-year windows revealnon-stationarities and mostly insignificant relationshipsbetween atmospheric circulation and eastern Meditera-nean summer precipitation and also, tree-ring indices ondecadal time scales, suggesting caution must be used inextrapolating current relationships between circulationand tree-ring indices. In addition to atmospheric influ-ence on regional tree-ring data, other processes such asconvective instability, land-sea interactions, orography,and thermally induced local precipitation events are alsorelevant.
Acknowledgments The authors wish to thank the Ministry ofForestry, Southwest Anatolia Forest Research Institute (SAFRI),the Director Mr. Yusuf Cengiz for his great help and support inmaking this study possible. We would like also to thank theLebanon Ministry of Agriculture, Department of Forestry, theDirector Mr. Ghattas Ak and Assistant Director Mr. Fadi Asmer;the University of Aleppo, Faculty of Agriculture; the CyprusMinistry of Agriculture, Department of Forestry and the CyprusForestry College, Cyprus Meteorological Service, Dr. AndreasChristou, Mr. Christos Alexandrou, and Mr. Stelios Pashiardis;and University of Patras, Botanical Institute, Department ofBiology, Greece, Mr. Dimitris Sarris and Dr. Dimitris Christod-oulakis for their help and support. We thank Drs. Peter Kuni-holm and Maryanne Newton, Malcolm and Carolyn WienerLaboratory for Aegean and Near Eastern Dendrochronology,Cornel University for their assistance and for providing us withsome of their C. libani samples from Lebanon. We thank Drs.Gregg Garfin, Dave Meko, and Martin Munro for their adviceand suggestions. We thank Brian Wallen, Maher Qishawi, NecatiBas, Erdogan Uzun, Nesibe Dagdeviren Galip Yanik, and EvanAdams for their valuable assistance in the field; we thank MelissaHubbard, Christopher Shuler, Chandler Birch, and CandiceMarburger for their assistance in sample preparation and mea-surement. We thank Mr. Richard Warren for his independentverification of our cross-dating of some of the samples. We thankDr. J. Fidel Gonzar Rouco and Mr. Paul Della-Marta for sta-tistical advice. We thank Dr. Murat Turkes for providing hisclimate classification scheme from Turkey. We thank the TyndallCenter for allowing us to use the Mitchell et al. (2004) tempera-ture and precipitation data. We wish to thank the anonymousreviewers for their constructive comments and suggests on themanuscript. Funding was provided by the US National ScienceFoundation, Earth System History (Grant No. 0075956). ElenaXoplaki was partially supported by Fifth Framework Programmeof the European Union (project SOAP), the Swiss ScienceFoundation (NCCR Climate) and US National Science Founda-tion, Earth System History (Grant No. 0075956). Jurg Luterb-acher was supported by the Swiss Science Foundation (NCCRClimate). Finally, we thank our close friend, the late RichardHolmes for his great support and advice since the inception ofthis project.
References
Akkemik U, Aras A (2005) Reconstruction (A.D. 1689–1994) ofApril–August precipitation in southern part of central Turkey.Int J Climatol (in press)
Akkemik U, Dagdeviren N, Aras A (2005) A preliminary recon-struction (A.D. 1635–2000) of spring precipitation using oaktree rings in the western Black Sea region of Turkey. Int JBiomet. DOI 10.1007/s00484-004-0249-8
Akkemik U (2000) Dendroclimatology of umbrella pine (Pinuspinea L.) in Istanbul, Turkey. Tree Ring Bull 56:17–23
Alpert P, Abramski R, Neeman BU (1990) The prevailing summersynoptic system in Israel—subtropical high, not Persian trough.Isr J of Earth Sci 39:93–102
Baisan CH, Swetnam TW (1990) Fire history on a desert mountainrange: Rincon Mountain Wilderness, Arizona, USA. Can JForest Res 20:1559–1569
Barnett TP, Preisendorfer RW (1987) Origins and levels of monthlyand seasonal forecast skill for United States air temperaturedetermined by canonical correlation analysis. Mon Wea Rev115:1825–1850
Bartzokas A, Lolis CJ, Metaxas DA (2003) The 850 hPa relativevorticity centres of action for winter precipitation in the Greekarea. Int J Climatol 23:813–828
Bitan A, Saaroni H (1992) The horizontal and vertical extension ofthe Persian Gulf trough. Int J Climatol 12:733–747
Briffa KR, Jones PD, Schweingruber FH, Karlen W, Shiyatov SG(1996) Tree-ring variables as proxy-indicators: problems withlow-frequency signals. In: Jones PD, Bradley RS, Jouzel J (eds)Climatic variations and forcing mechanisms of the last2000 years. NATO ASI Series I41, pp 9–41
Briffa KR, Osborn TJ, Schweingruber FH (2004) Large-scaletemperature inferences from tree rings: a review. Global PlanetChange 40:11–26
Brown TJ, Hall BL (1999) The use of t values in climatologicalcomposite analyses. J Clim 1:2941–2945
Chbouki N (1992) Spatio-temporal characteristics of drought asinferred from tree-ring data in Morocco. PhD dissertation, TheUniversity of Arizona, Tucson
Cook ER (1985) A time-series analysis approach to tree-ringstandardization. PhD Dissertation, Department of Geosciences,The University of Arizona, Tucson
Cook ER, Briffa KR (1990) A comparison of some tree-ringstandardization methods. In: Cook ER, Kairiukstis LA (eds)Methods of dendrochronology. Kluwer, Dordrecht, pp 104–123
Cook ER, Briffa KR, Jones PD (1994) Spatial regression methodsin dendroclimatology—a review and comparison of two tech-niques. Int J Climatol 14:379–402
Corte-Real J, Zhang X, Wang X (1995) Large-scale circulationregimes and surface climatic anomalies over the Mediterranean.Int J Climatol 15:1135–1150
Cullen HM, deMenocal PD (2000) North Atlantic influence onTigris-Euphrates streamflow. Int J Climatol 20:853–863
Cullen HM, Kaplan A, Arkin PA, deMenocal PD (2002) Impact ofthe North Atlantic Oscillation on middle eastern climate andstreamflow. Clim Change 55:315–338
Dunkeloh A, Jacobeit J (2003) Circulation dynamics of Mediter-ranean precipitation variability 1948–1998. Int J Climatol23:1843–1866
D’Arrigo R, Cullen H (2001) A 350-yr reconstruction of Turkishprecipitation. Dendrochronologia 19:169–177
Dayan U, Shenhav R, Graber M (1988) The spatial and temporalbehavior of the mixed layer in Israel. J Appl Meteorol 27:1382–1394
Dayan U, Lifshitz-Goldreich B, Pick K (2002) Spatial and struc-tural variation of the atmospheric boundary layer duringsummer in Israel-Profiler and rawinsonde measurements.J Appl Meteorol 41:447–457
96 Ramzi Touchan et al.: Reconstructions of spring/summer precipitation for the Eastern Mediterranean from tree-ring widths

Dracup JA, Lee KS, Paulson EG Jr (1980) On the definition ofdroughts. Water Resour Res 16:297–302
Edwards AL (1984) An introduction to linear regression and cor-relation, 2nd edn. WH Freeman, New York, pp 81–83
Eshel G, Farrell BF (2000) Mechanisms of Eastern Mediterraneanrainfall variability. J Atmos Sci 57:3219–3232
Eshel G, Cane MA, Farrell BF (2000) Forecasting Eastern Medi-terranean drought. Mon Weather Rev 128:3618–3630
Esper J, Frank DC, Wilson JS (2004) Climate reconstructions: low-frequency ambition and high-frequency ratification. Eos85:113–120
Fernandez J, Saenz J, Zorita E (2003) Analysis of wintertimeatmospheric moisture transport and its variability over South-ern Europe in the NCEP-reanalyses. Clim Res 23:195–215
Fritts HC (1976) Tree Rings and climate. Academic Press, NewYork
Fritts HC (1991) Reconstructing large-scale climatic patterns fromtree-ring data: A diagnostic analysis. The University of ArizonaPress, Tucson
Fritts HC, Guiot J (1990) Methods of calibration, verification andreconstruction. In: Cook ER, Kairiukstis LA (eds) Methods ofdendrochronology: applications in the environmental sciences,International institute for applied systems analysis. Kluwer,Boston, pp 163–176
Fritts HC, Shashkin AV (1995) Modeling tree-ring structure asrelated to temperature, precipitation, and day length. In: LewisTE (ed) Tree rings as indicators of ecosystem health. CRCPress, Ann Arbor Michigan, pp 17–57
Fritts HC, Guiot J, Gordon G (1990) Verification. In: Cook ER,Kairiukstis LA (eds) Methods of dendrochronology: applica-tions in the environmental sciences, International institute forapplied systems analysis. Kluwer, Boston, pp 178–184
Gassner G, Christiansen-Weniger F (1942) DendroklimatologischeUntersuchungen uber die Jahresringentwicklung der Kiefern inAnatolien. Nova Acta Leopoldina: Abhandlung der KaiserlichLeopoldinisch-Carolinisch deutschen Akademie der Naturfor-scher NF, Band 12, Nr 80
Gershunov A, Schneider N, Barnett T (2001) Low-frequencymodulation of the ENSO–Indian monsoon rainfall relationship:signal or noise? J Clim 14:2486–2492
Hsu CJ, Zwiers FW (2001) Climate change in recurrent regimesand modes of Northern Hemisphere atmospheric variability.J Geophys Res 106:20145–20159
Hughes MK (2002) Dendrochronology in climatology—the state ofthe art. Dendrochronologia 20:95–116
Hughes MK, Vaganov EA, Shiyatov SA, Touchan R, FunkhouserG (1999) Twentieth-century summer warmth in northernYakutia in a 600-year context. Holocene 9:603–608
Hughes MK, Kuniholm PI, Eischeid JK, Garfin G, Griggs CB,Latini C (2001) Aegean tree-ring signature years explained. TreeRing Res 57:67–73
Hurrell JW (1996) Influence of variations in extratropical winter-time teleconnections on Northern Hemisphere temperature.Geophys Res Lett 23:665–668
Jacobeit J, Jonsson P, Barring L, Beck C, Ekstrom M (2001) Zonalindices for Europe 1780–1995 and running correlation withtemperature. Clim Change 48:219–241
Jacobeit J, Wanner H, Luterbacher J, Beck C, Philipp A, Sturm K(2003) Atmospheric circulation variability in the North-Atlan-tic-European area since the mid-seventeenth century. Clim Dyn20:341–352. DOI 10.1007/s00382-002-0278-0
Jones PD, Mann ME (2004) Climate over past millennia. RevGeophys 42:RG2002. DOI 10.1029/2003RG000143
Jones PD, Briffa KR, Barnett T, Tett S (1998) High resolutionpaleoclimatic records for the last millennium: interpretation,integration and comparison with General Circulation Modelcontrol-run temperature. Holocene 8:455–471
Jones PD, Osborn TJ, Briffa KR (2003) Pressure-based measures ofthe North Atlantic Oscillation (NAO): a comparison and anassessment of changes in the strength of the NAO and in itsinfluence on surface climate parameters. In: Hurrell JW,Kushnir Y, Ottersen G, Visbeck M (eds) The North Atlantic
Oscillation: climatic signifcance and environmental impact.Geophysical Monograph 134, American Geophysical Union,Washington, pp 51–62
Kalnay E et al. (1996) The NCEP/NCAR 40-year reanalysis pro-ject. Bull Am Meteorol Soc 77:437–471
Kistler R et al. (2001) The NCEP-NCAR 50-year reanalysis:monthly means CD-ROM and documentation. Bull AmMeteorol Soc 82:247–267
Kuniholm PI (1990) The archaeological record: evidence and non-evidence for climate change. In: Runcorn SJ, Pecker J-C (eds)The Earth’s climate and variability of the sun over recent mil-lennia. Phil Trans R Soc Lond A, pp 645–655
Lolis CJ, Bartzokas A, Metaxas DA (1999) Spatial covariability ofthe climatic parameters in the Greek area. Int J Climatol19:185–196
Livezey RE, Smith TM (1999) Considerations for use of the Bar-nett and Preisendorfer (1987) algorithm for canonical correla-tion analysis of climate variations. J Climate 12:303–305
Luterbacher J, Xoplaki E, Dietrich D, Rickli R, Jacobeit J, Beck C,Gyalistras D, Schmutz C, Wanner H (2002) Reconstruction ofsea level pressure fields over the eastern North Atlantic andEurope back to 1500. Clim Dyn 18:545–561. DOI 10.1007/s00382-001-0196-6
Luterbacher J, Dietrich D, Xoplaki E, Grosjean M, Wanner H(2004) European seasonal and annual temperature variability,trends, and extremes since 1500. Science 303:1499–1503. DOI10.1126/science.1093877
Mann ME (2002) Large-scale climate variability and connectionswith the Middle East in past centuries. Clim Change 55:287–314
Meko DM (1997) Dendroclimatic reconstruction with time varyingsubsets of tree indices. J Climate 10:687–696
Meko DM, Graybill DA (1995) Tree-ring reconstruction of UpperGila River Discharge. Water Resour Bull 31:605–616
Meko DM, Therrell MD, Baisan CH, Hughes MK (2001) Sacra-mento river flow reconstructed to A.D. 869 from tree rings. AmWater Resour Assoc 37(4):1020–1037
Mitchell TD, Carter TR, Jones PD, Hulme M, New M (2004) Acomprehensive set of high-resolution grids of monthly climatefor Europe and the globe: the observed record (1901–2000) and16 scenarios (2001–2100). Tyndall Centre Working Paper 55
NOAA-CPC (2004) Northern Hemisphere teleconnection indices(1950–2004; monthly). http://www.cpc.ncep.noaa.gov/data/teledoc/telecontents.html
North GR, Bell TL, Cahalan RF, Moeng FJ (1982) Sampling er-rors in the estimation of empirical orthogonal functions. MonWea Rev 110:699–706
Purgstall BJVH (1983) Ottoman state history, vol 1–7. Translator:Vecdi Burun, Ucdal Publishing, Istanbul (in Turkish)
Quadrelli R, Pavan V, Molteni F (2001) Wintertime variability ofMediterranean precipitation and its links with large-scale cir-culation anomalies. Clim Dyn 17:457–466
Saaroni H, Ziv B, Edelson J, Alpert P (2003) Long-term variationsin summer temperatures over the Eastern Mediterranean.Geophys Res Lett 30:1946 DOI 10.1029/2003GL017742
Schmutz C, Luterbacher J, Gyalistras D, Xoplaki E, Wanner H(2000) Can we trust proxy-based NAO index reconstructions?Geophys Res Lett 27:1135–1138
Shindell DT, Miller RL, Schmidt GA, Pandolfo L (1999) Simula-tion of recent northern winter climate trends by greenhouse-gasforcing. Nature 399:452–455
Slonosky VC, Yiou P (2002) Does the NAO index represent zonalflow? The influence of the NAO on North Atlantic surfacetemperature. Clim Dyn 19:17–30
Slonosky VC, Jones PD, Davies TD (2001) Atmospheric circula-tion and surface temperature in Europe from the 18th centuryto 1995. Int J Climatol 21:63–75
Snee RD (1997) Validation of regression models: methods andexamples. Technometrics 19:415–428
Stokes MA, Smiley TL (1996) An introduction to tree-ring dating.The University of Arizona Press, Tucson
von Storch H, Zwiers FW (1999) Statistical analysis in climateresearch. Cambridge University Press, UK
Ramzi Touchan et al.: Reconstructions of spring/summer precipitation for the Eastern Mediterranean from tree-ring widths 97

Swetnam TW (1985) Using dendrochronology to measure radialgrowth of defoliated trees. USDA Forest Service, Coopera-tive State Research Service. Agriculture Handbook No. 639,1–39
Swetnam TW (1993) Fire history and climate change in giant se-quoia groves. Science 262:885–889
Tarawneh Q, Kadioglu M (2003) An analysis of precipitation cli-matology in Jordan. Theor Appl Climatol 74:123–136
Thompson DWJ, Wallace JM (1998) The Arctic Oscillation sig-nature in the wintertime geopotential height and temperaturefields. Geophys Res Lett 25:1297–1300
Timm O, Ruprecht E, Kleppek S (2004) Scale-dependent recon-struction of the NAO index. J Clim 17:2157–2169
Touchan R, Hughes MK (1999) Dendrochronology in Jordan.J Arid Environ 42:291–303
Touchan R, Allen C, Swetnam TW (1996) Fire history and climaticpatterns in ponderosa pine and mixed-conifer forests of theJemez Mountains, Northern New Mexico. In: Proc Symposiumon La Mesa Fire. USDA Forest Service, Rocky MountainForest and Range Experiment Station General Technical Re-port, vol 286, pp 33–46
Touchan R, Meko DM, Hughes MK (1999) A 396-year recon-struction of precipitation in Southern Jordan. J Am WaterResour Assoc 35:45–55
Touchan R, Garfin GM, Meko DM, Funkhouser G, Erkan N,Hughes MK, Wallin BS (2003) Preliminary reconstructions ofspring precipitation in southwestern Turkey from tree-ringwidth. Int J Climatol 23:157–171
Touchan R, Funkhouser G, Hughes MK, Erkan N (2004) Stan-dardized precipitation indices reconstructed from tree-ringwidth for the Turkish region. Clim Change (in press)
Tsiourtis NX (2001) Drought management plans for the Mediter-ranean region. Report of the Water Development Department,Nicosia, Cyprus. http://www.pio.gov. cy/wdd/eng/scien-tific_articles/archieve2001/article03.htm
Turkes M (1996) Spatial and temporal analysis of annual rainfallvariations in Turkey. Int J Climatol 16:1057–1076
Turkes M (1998) Influence of geopotential heights, cyclone fre-quency and southern oscillation on rainfall variations in Tur-key. Int J Climatol 18:649–680
Turkes M, Erlat E (2003) Precipitation changes and variability inTurkey linked to the North Atlantic Oscillation during theperiod 1930–2000. Int J Climatol 23:1771–1796
Turkes M, Erlat E (2005) Climatological responses of winter pre-cipitation in Turkey to variability of the North Atlantic Oscil-lation during the period 1930–2001. Theor Appl Climatol.DOI:10.1007/s00704-004-0084-1
Turkes M, Sumer UM, Kılıc G (2002) Persistence and periodicityin the precipitation series of Turkey and associations with500 hPa geopotential heights. Clim Res 21:59–81
Weisberg R (1985) Applied linear regression. Wiley, New YorkWidmann M (2004) One-dimensional CCA and SVD and their
relationship to regression maps. J Clim (in press)Wigley TML, Briffa KR, Jones PD (1984) On the average value of
correlated time series with applications in dendroclimatologyand hydrometeorology. J Clim Appl Meteorol 23:201–213
Wilks DS (1995) Statistical methods in the atmospheric sciences: anintroduction. International Geophysics Series, vol 59. AcademicPress, New York
Xoplaki E, Gonzalez-Rouco JF, Gyalistras D, Luterbacher J,Rickli R, Wanner H (2003a) Interannual summer air tempera-ture variability over Greece and its connection to the large-scaleatmospheric circulation and Mediterranean SSTs 1950–1999.Clim Dyn 20:537–554. DOI 10.1007/s00382-002-0291-3
Xoplaki E, Luterbacher J, Burkard R, Patrikas I, Maheras P (2000)Connection between the large-scale 500 hPa geopotential heightfields and precipitation over Greece during wintertime. ClimRes 14:129–146
Xoplaki E, Gonzalez-Rouco JF, Luterbacher J, Wanner H (2003b)Mediterranean summer air temperature variability and itsconnection to the large-scale atmospheric circulation and SSTs.Clim Dyn 20:723–739. DOI 10.1007/s00382-003-0304-x
Xoplaki E, Gonzalez-Rouco JF, Luterbacher J, Wanner H (2004)Wet season Mediterranean precipitation variability: influence oflarge-scale dynamics and trends. Clim Dyn 23:63–78. DOI10.1007/s00382-004-0422-0
Ziv B, Saaroni H, Alpert P (2004) The factors governing thesummer regime of the eastern Mediterranean. Int J Climatol24:1859–1871
Ziv B, Saaroni H, Baharad A, Yekutieli D, Alpert P (2005) Indi-cations for aggravation in summer heat conditions over theMediterranean basin. Geophys Res Lett (in press)
Zorita E, Kharin V, von Storch H (1992) The atmospheric circu-lation and sea surface temperature in the North Atlantic area inwinter: their interaction and relevance for Iberian precipitation.J Clim 5:1097–1108
98 Ramzi Touchan et al.: Reconstructions of spring/summer precipitation for the Eastern Mediterranean from tree-ring widths