Mediterranean Journal of Social Sciences - CiteSeerX
694
Published by MCSER - Mediterranean Center of Social and Educational Research Mediterranean Journal of Social Sciences Special Issue Vol. 3, No. 11, November 2012 Rome, Italy 2012
-
Upload
khangminh22 -
Category
Documents
-
view
0 -
download
0
Transcript of Mediterranean Journal of Social Sciences - CiteSeerX

Published by
MCSER - Mediterranean Center of Social and Educational Research
Mediterranean Journal of Social Sciences
Special Issue
Vol. 3, No. 11, November 2012
Rome, Italy 2012

Mediterranean Journal of Social Sciences
Editor in Chief
Dr. Andrea Carteny
Executive Director, MCSER Prof. Antonello Biagini Editing Dr. Antonello Battaglia Editorial Assistant Dr. Giuseppe Motta
Scientific Coordinator Prof. Giovanna Motta Graphic Design Dr. Gabriele Natalizia Editorial Managing Dr. Igor Baglioni
Copyright 2012 MCSER – Mediterranean Center of Social and Educational Research CEMAS – Sapienza University of Rome, Italy
ISSN 2039-9340 (print) ISSN 2039-2117 (online)
Index Copernicus Year 2011 Impact Factor 3.77
Doi:10.5901/mjss.2012.v3n11
Special Issue
Vol. 3, No. 11, September 2012
Publisher MCSER – Mediterranean Center of Social and Educational Research
CEMAS – Sapienza University of Rome, Italy Piazzale Aldo Moro, 5, Cap. 00186, Rome, Italy
Tel/Fax: 039/0692913868 E-mail: [email protected]
Web: http://www.mcser.org
This journal is printed by
Gruppo Atena.net Srl Via del Lavoro, 22,
36040, Grisignano VI, Italy Tel: 0039/0444613696
Web: http://www.atena.net

Mediterranean Journal of Social Sciences
Vol. 3, No. 11, November 2012
ISSN: 2039-9340 (print) ISSN: 2039-2117 (online)
About the Journal
Mediterranean Journal of Social Sciences (MJSS) is a double blind peer-reviewed journal, published three times a year, by Mediterranean Center of Social and Educational Research, CEMAS and Sapienza University of Rome. The journal publishes research papers in the fields of Mediterranean and World Culture, Sociology, Philosophy, Linguistics, Education, History, History of Religions, Anthropology, Statistics, Politics, Laws, Psychology and Economics. MJSS is open for the academic world and research institutes, academic and departmental libraries, graduate students and PhD candidates, academic and non-academic researchers and research teams. Specifically, MJSS is positioned as a vehicle for academics and practitioners to share field research. In addition to scientific studies, we will also consider letters to the editor, guest editorials, and book reviews. Our goal is to provide original, relevant, and timely information from diverse sources; to write and publish with absolute integrity; and to serve as effectively as possible the needs of those involved in all social areas. If your research will help us achieve these goals, we would like to hear from you. MJSS provides immediate open access to its content on the principle that making research freely available to the public supporting a greater global exchange of knowledge. All manuscripts are subject to a double blind peer review by the members of the editorial board who are noted experts in the appropriate subject area.
Editor in Chief, Andrea Carteny
Sapienza University of Rome, Italy

Indexing/Abstracting/Library
Mediterranean Journal of Social Sciences is included on the following index/abstracting/library
• IBSS - International Bibliography of the Social Sciences
• ProQuest – Social Sciences Index • ProQuest Political Sciences • Sociological Abstract – ProQuest • DOAJ – Directory of Open Access
Journals • EBSCOhost • EBSCO Publishing • Index Copernicus International • Cabell’s Publishing – Directories of
Academic Journals • Ulrichsweb – Global Serials Directory • Socol@r Index • E-Journals.org • World Wide Web Virtual Library • Genamics JournalSeek • Kaohsiung Medical University Library • PsycINFO – Bibliographic Database of
the American Psychological Association • MLA Index – International Bibliography
of the Modern Language Association
• Georgetown University Library • Scirus Index • Open J. Gate Index • Ohio Library and Information Network –
OhioLINK • Academic Journals Database • Indiana University Libraries • California State Monterey Bay Library –
CSUMB • University of Saskatchwean Library • San José State University – Electronic Journal
Index • University of Ottawa Library • Birmingham Public Library • Exlibris Index, The Bridge of Knowledge • Shenzen University Library • WZB Library • Colorado States University Libraries • Berlin State Library • University of Washington Libraries • University Library of Regensburg • Digital Library of Wroclaw University • Shenzen University Library

Mediterranean Journal of Social Sciences
Editor in chief Dr. Andrea Carteny Sapienza University of Rome, Italy
International Editorial Board
Vincent Hoffmann-Martinot University of Bordeaux, France Dimitri A. Sotiropoulos University of Athens, Greece Giuseppe Motta Sapienza University of Rome, Italy Sibylle Heilbrunn Ruppin Academic Center, Emek-Hefer, Israel Anne Cross Metropolitan State University, USA Marco Cilento Sapienza University of Rome, Italy Werner J. Patzelt University of Dresden Germany Mohamed Ben Aissa University of Tunis, Tunisia Emanuele Santi African Development Bank, Tunis, Tunisia Arda Arikan Akdeniz University, Antalya, Turkey Alessandro Vagnini Sapienza University of Rome, Italy Godfrey Baldacchino University of Malta, Malta Kamaruzaman Jusoff Universiti Putra Malaysia Daniel Pommier Vincelli Sapienza University of Rome, Italy Hossein Vahid Dastjerdi University of Isfahan, Isfahan, Iran Gabriele Natalizia Sapienza University of Rome, Italy Francisco J. Ramos Universidad de Castilla-La Mancha, Spain Igor Baglioni Sapienza University of Rome, Italy Tarau Virgiliu Leon Babes-Bolyai University, Cluj-Napoca, Romania
José Sánchez-Santamaría University of Castilla-La Mancha, Spain Dorina Orzac Babes-Bolyai University, Cluj-Napoca, Romania
Marian Zlotea Sapienza University of Rome / Government Agency, Romania Petar Jordanoski Sapienza University / University of Skopje Slavko Burzanovic University of Montenegro, Montenegro Martina Bitunjac Humboldt University of Berlin, Germany Aranit Shkurti CIRPS Sapienza University / CIT University, Albania Francesco Randazzo University of Perugia, Italy Gulap Shahzada University of Science and Tecnology, Pakistan Nanjunda D C Universiy of Mysore, Karnataka, India Nkasiobi S.Oguzor Federal College of Education (Technical), Omoku- Nigeria Shobana Nelasco Fatima College, Madurai-India Jacinta A. Opara Universidad Azteca, Mexico Fernando A. Ferreira Polytechnic Institute of Santarem, Portugal Hassan Danial Aslam Human Resource Management Research Society, Pakistan Asoluka C. Njoku Alvan Ikoku Federal College of Education, Owerri-Nigeria
Alice Kagoda Makerere University, Kampala-Uganda B.V. Toshev University of Sofia, Bulgaria Benedicta Egbo University of Windsor, Ontario-Canada Adriana Vizental University Aurel Vlaicu, Romania Florica Bodistean University Aurel Vlaicu, Romania Bassey Ubong Federal College of Education (Technical), Omoku-Nigeria Tutku Akter Girne American University, Northern Cyprus A. C. Nwokocha Michael Okpara University of Agriculture, Umudike-Umuahia, Nigeria Murthy CSHN Tezpur University Napaam Assam India Femi Quadri Federal College of Education (Technical), Omoku-Nigeria Abraham I. Oba Niger Delta Development Commission, Nigeria Fouzia Naeem Khan Shaheed Zulfikar Ali Bhutto Institute of Science and Technology, Pakistan Marcel Pikhart University Hradec Kralove, Czech Republic Sodienye A. Abere Rivers State University of Science and Technology, Port Harcourt, Nigeria Luiela-Magdalena Csorba University Aurel Vlaicu, Romania
Joan Garcia Garriga Institut de Paleoecologia Humana i Evolució Social (IPHES) / Universitat Oberta de Catalunya (UOC), Spain
Georgios A. Antonopoulos Teesside University Middlesbrough, UK
Vennila Gopal Bharathiar University, Coimbatore, India Eddie Blass Swinburne University of Technology, Australia Hanna David Tel Aviv University, Jerusalem-Israel Raphael C. Njoku University of Louisville, USA Ali Simek Anadolu University, Turkey Austin N. Nosike The Granada Management Institute, Spain Gerhard Berchtold Universidad Azteca, Mexico Samir Mohamed Alredaisy University of Khartoum, Sudan Lawrence Ogbo Ugwuanyi University of Abuja, Abuja-Nigeria Oby C. Okonkwor Nnamdi Azikiwe University, Awka-Nigeria Ridvan Peshkopia American Unievrsity of Tirana, Albania George Aspridis Technological Educational Institute of Larissa, Greece Talat Islam University of the Punjab, Lahore, Pakistan Sokol Paçukaj Aleksander Moisiu University, Albania Federico Niglia Libera Università Internazionale degli Studi Sociali (LUISS) “Guido Carli”, Italy Isara Tongsamsi Songkhla Rajabhat University, Thailand S.E. Onuebunwa Federal College of Education (Technical), Omoku-Nigeria

7
TABLE OF CONTENTS Articles Causal Relationship Model of Environmental Education 11 Nongnapas Thiengkamol
Gratification and Social Adjustment of Blind Children in District Faisalabad, Pakistan 19 Muhammad Asim, Aisha Zafar, Zahira Batool, Atif Jamal
Punctuation in Translation: the Unseen Side of the Coin 25 Seyed Mohammad Hosseini-Maasoum, Mehdi Mahdiyan
Mental Imagery: Is It Worth the Endeavour? 33 Nuttanuch Munsakorn
Inclusive Literacy: Overview of the Skill of Writing Development in an inclusive Classroom 41 Latif Ahmad
A Monthly Analysis of Road Traffic Accident in Selected Local Government Areas of Lagos State, Nigeria 47 Atubi, Augustus .O.
SMEs and Enterprises, Represent Potential Employment and Economic Growth in Emerging Economies in Albanian Development 63 Hava Muçollari, Alba Dumi, Lidra Kukaj
Maintenance of University Facilities in Developing Country: Case study of Lagos State University Ojo Nigeria 69 Oyenuga, S.O., Akinsola, O. E., Hussaini, P. O., Fatokun, A.O.
Oil and Conflict in the Niger Delta: A Reflection on the Politics of State Response to Armed Militancy in Nigeria 77 Celestine Oyom Bassey
Considerations on the Fortresses Toponyms from High Middle Ages until Today 91 Eliana Paço
Waste Management and the Administrative Evaluation of Resources for the Benefit of the Community. The Analysis of Methods for Their Use 97 Bajame Skenderi, Alba Dumi
Gender Issues in Sexual Fulfillment; Nigerian Situation 105 Akanle F.F, Ola, Tolulope Monisola
Does Glossing Affect Thai EFL Students’ Reading Comprehension and Lexis Acquisition? 111 Win Jenpattarakul
Exergame-Design and Motor Activities Teaching: An Overview of Scientific Paradigms on Motor Control 119 Pio Alfredo Di Tore, Gaetano Raiola
Italian Eurasian Diplomacy: Giulio Melegari and his Work as Ambassador Between Tokyo and St. Petersburg (1896-1912) 123 Francesco Randazzo
Naturalization of Slavery and Discrimination in the United States: An Analysis of the Roles of Protestantism, Capitalism and Social Darwinism in the Formation of Demeaning Black Stereotypes 133 Maryam Soltan Beyad, Farshid Nowrouzi Roshnavand
The International Words in the Balkan Linguistic Area 141 Eliana Paço

8
Optimizing the Advantages of Monolingual Dictionary Utilization by Thai EFL Students 145 Win Jenpattarakul
An Assessment of Parental Knowledge, Belief and Attitude toward Childhood Immunization among Minorities in Rural Areas of District Faisalabad, Pakistan 153 Muhammad Asim, Nazia Malik, Haroon Yousaf, Iram Gillani, Nazeen Habib
Learners’ Satisfaction on CALL 161 Nuttanuch Munsakorn
Construct Validity Examination of Life Skills for Primary School Students in Iran 167 Fatemeh Parasteh Ghombavani, Nor Hayati Alwi, Ibrahim Ghadi, Rohani Ahmad Tarmizi
The Impact of Economic Conditions on Traditional and new Categories of Property Crimes – An Exploratory Research in European Countries – 175 Silvia Bartoletti
Speech Act of Responding to Compliments: A Study of Verbal Politeness Strategies of Spanish and Italians 187 Pilar Robles Garrote
A Comparative Analysis Between The Hairy Ape and Emperor Jones by Eugene O'Neill from Expressionism Viewpoint 197 Zahra Yousefi Nezhad, Moussa Ahmadian
Privatization and Firm Performance: An Empirical Study of Selected Privatized Firms in Nigeria 207 Yahya Zakari Abdullahi, Hussainatu Abdullahi, Yelwa Mohammed
An Investigation of Pakistani L2 HI Writers’ Perceptions of Previous Writing Experience in L2: 221 Implications for Literacy Development in Pakistan for HIC Ghulam Haider
Socio Economic Impact of Water Crisis on Agrarian Community in District Faisalabad, Pakistan 235 Muhammad Asim, Ali Hassan Vains, Haroon Yousaf, Muhammad Azam Ramzan
Housing Market Constraints in the West African Region 241 Basirat A. Oyalowo
Latin Lesson Lectio Aulae 253 Eliana Paço
Developing Infrastructure in Nigeria: Why is the Cost So High? 257 Patience Tunji – Olayeni, Philip Olayemi Lawal, Lekan Murtala Amusan
Causal Relationship Model of Environmental Education and Psychological Trait 263 Nongnapas Thiengkamol
The Impact of Phasing-out Textile Quota on the Egyptian Textile and Clothing Sector (Case studies from Alexandria) 273 Hanan Abouel-Farag, El-Sayeda Moustafa, Ahmed Mandour
What Inhibits Manufactured Exports in Sub-Saharan Africa: Firm Level Evidence? 285 Ogujiuba Kanayo, Stiegler Nancy, Amakom Uzochukwu
The Indigenous Knowledge of Illuminated Boat Procession of the Thai-Lao Ethnic Group in Mekong Sub-region 295 Pinit Intirard, Sombat Kanajakit, Achara Phanurat, Kunnika Jitakoom Udomthawee
Development of Hospital Environmental Management Model through PAIC Process 303 Nipaporn Jongwutiwes, Nongnapas Thiengkamol, Tanarat Thiengkamol
Development of Food Security Management Model through PAIC Process 311 Kruemas Tumpracha, Nongnapas Thiengkamol, Chatchai Thiengkamol
Causal Relationship Model of Four Noble Truths 319 Nongnapas Thiengkamol

9
HOL Design with Natural Process of Khmer-Thai Ethnics Group in Cultural Ecology of Lower Mekong Basin 327 Prasong Tungprasit, Kasem Chunkao, Achara Phanurat, Kotchanipha Udomthawee
Ethnic Personality of Community in the World Heritage Areas of Sukhothai and Angkor Wat 337 Arunee Jindarat, Sujrit Pianchob, Boonyung Mundee, Benjawan Wongsawadee
The Feminist Analysis of Shirley Jackson’s The Lottery; A Dominant-Discourse-Control Framework 343 Seyed Mohammad Hosseini-Maasoum, Hoda Davtalab, Mahnoosh Vahdati
Development of Model of Water Conservation through PAIC Process 353 Chalermsak Udonboon, Nongnapas Thiengkamol, Chatchai Thiengkamol
Development A Prototype Environmental Education Teacher through PAIC Process 361 On-anong Ruboon, Nongnapas Thiengkamol, Tanarat Thiengkamol, Jurairat Kurukodt
Taboo and Health Behavior of Mahout in Elephant Biosphere of Thailand and Lao People’s Democratic Republic 369 Somsri Boonmee, Krasae Chanawongse, Malinee Uttisaen, Kittima Rewdang
Can be Explained the Moroccan Growth of Public Spending by the Demand Approach? 375 El Mustapha Kchirid, Lakhdar Adouka, Aissa Darraji, Mohamed Kerbouche
Traveling Behavior Model for Primary School 389 Manascha Waewthaisong, Nongnapas Thiengkamol, Chatchai Thiengkamol
Volunteers’ Employment and Counterinsurgency in Italy: The Case the Hungarian Legion (1861-1862) 397 Andrea Carteny
Metadiscourse in Applied Linguistics Research Articles: A Cross-Sectional Survey 405 Davud Kuhi, Mahin Yavari, Ali Sorayyaei Azar
Zimbabwean Science Students’ Perceptions of Their Classroom Learning Environments and Attitude Towards Science 415 Mandina Shadreck
Model of Environmental Education and Psychological Factors Influencing to Global Warming Alleviation 427 Nongnapas Thiengkamol
Gender Equality in Housing Delivery - A Panacea to Adequate Housing Supply in Nigeria 437 Olusegun Oriye, Oluranti Owoeye, Innocent I. Weje
Causal Relationship Model of Hospital Environmental Management 447 Nipaporn Jongwutiwes, Nongnapas Thiengkamol, Tanarat Thiengkamol
Kantian notions of Feminine Beauty and Masculine Sublimity in Hawthorne’s ‘The Birthmark’ 459 Najmeh Hafez, Moussa Ahmadian, Fazel Asadi Amjad
Evaluation, a Challenge for Successful Management of the Public Administration 465 Marjana Lako, Alba Dumi
Case Study on Physical Education and Sport in Naples, Italy 471 Di Tore P. A., Raiola G.
Politics and International Criminal Court Debate: A Critical Discourse Analysis of Utterances by Politicians in Kenya 477 Juliet Akinyi Jagero
Development Strategy for Economic Status Elevation of Sri-utumporn Community Based on Sufficiency Economy Philosophy through Systematic Approach 483 Amnaj Wangsu, Direk Lerkrai, Supawan Wongkumchan, Thavajchai Sakpuram
Critical Factors Influencing Facility Maintenance Management of Tertiary Institutional Buildings in Southwest Nigeria 489 Akinsola, O. E. , Hussaini P. O. , Oyenuga S.O. , Fatokun, A.O. Model of Environmental Education with Integration of Life Cycle Assessment in term of Recycling Behavior 497 Sirikanya Donkonchum, Nongnapas Thiengkamol, Chatchai Thiengkamol

10
Language as a Tool for Identifying Social Dissimilarity of Speakers 505 Rrezarta Draçini
Development Strategy of Communication on Cardiovascular Disease Prevention for Risk Group 511 Punnapat Chivachaichawan, Suchat Saengthong, Supawan Vongkamjan
Exploratory Factor Analysis of The Effects of Design on Brand Strategy-Performance in Malaysian Furniture Firms 519 Puteri Fadzline Tamyez, Norzanah Mat Nor, Syed Jamal Abdul Nasir bin Syed Mohamad
Factors Affecting Villagers Participation in Community Environment Development 535 Chuleewan Praneetham, Nongnapas Thiengkamol, Kongsak Thathong, Tanarat Thiengkamol
The Fight for Balkan Latinity (II). The Aromanians after World War 541 Giuseppe Motta
The Country of Origin and the Consumer Behavior - How to Improve Chinese Products Brands? 551 Mohammed Kerbouche, Lakhdar Adouka, Abdenour Belmimoun, Habib Guenouni
Development of Dengue Fever Prevention and Control Model 561 Koraphat Artwanichakul, Nongnapas Thiengkamol, Tanarat Thiengkamol
Lexical Cohesion in English and Persian Texts of Novels 569 Ali Rahimi, Nabi A. Ebrahimi
Waste Management and Enterprise Development in Slum Communities of Ado-Ekiti, Nigeria 579 Abike Ibidunni Awosusi, Olusegun Oriye, Julius Oluranti Owoeye
Causal Relationship Model of Water Conservation Behavior 591 Chalermsak Udonboon, Nongnapas Thiengkamol, Chatchai Thiengkamol
First Language Acquisition: Towards Strategy-Oriented Perspective 605 Masoumeh Ahmadi Shirazi, Majid Nemati
Milk Sector and Dairy Policies in Algeria: A Reading of Results in the Region of Souk Ahras 615 Sawsan Kacimi El Hassani
Causal Relationship Model of Food Security Management 625 Kruemas Tumpracha, Nongnapas Thiengkamol, Chatchai Thiengkamol
Trade Openness and Manufacturing Sector Growth: An Empirical Analysis for Nigeria 637 Adegbemi B.O Onakoya, Ismail O. Fasanya, Muhibat T. Babalola
Policy Variables and Economic Growth in South Africa: Understanding the Nexus 647 Kanayo Ogujiuba, Nancy Stiegler, Oluwasola Omoju
Contrastive Analysis of Different Types of Shifts in Persian Translation of The Secret 659 Seyed Mohammad Hosseini-Maasoum, Hoda Davtalab
The Contractual Rights of International Civil Servants: Administrative Tribunals of the United Nations and International Labour Organization Perspective 667 Md. Kamal Uddin, Md. Siraj Uddin
Minister Hooper’s Melancholic Virtue 679 Najmeh Hafezi, Fazel Asadi Amjad, Moussa Ahmadian
The Challenges of Democratic Governance in Nigeria’s Fourth Republic 685 Ogbonnaya, Ufiem Maurice, Omoju, Oluwasola Emmanuel, Udefuna, Nnadozie Patrick

ISSN 2039-9340 Mediterranean Journal of Social Sciences Vol. 3 (11) November 2012
11
Causal Relationship Model of Environmental Education
Dr. Nongnapas Thiengkamol
Department of Environmental Education
Faculty of Environment and Resource Studies Mahasarakham University, Mahasarakham 44150, Thailand
Doi:10.5901/mjss.2012.v3n11p11
Abstract Environmental education has been accepted and applied for encouraging the global citizens to take a responsible practice through their behavior changing in daily life activity. This might be an effective and rapid change to decrease the greenhouse gases via the awareness raising, attitude and value adjusting, skill and participation increasing including real practice in daily living. The populations will be undergraduate students of academic year 2011 of Mahasarakham University. The Multi-stage random sampling was used to collect the sample for 450 undergraduate students from different faculties. The questionnaire was employed as instrument for data collecting. LISREL was used for model verification. Results illustrated that considering on structural model confirmatory factors of Environmental Education (EE) was able to explain the variation of endogenous factors of Psychological Trait (Trait) caused endogenous factor of Environmental Behaviors for Global Warming Alleviation (BEH) with 82.0 percents. BEH = 0.29 TRAIT + 0.75 EE ……………………..(1) (R2 = 0.82) Key Words: Causal Relationship Model / Environmental Education / Global Warming Alleviation
1. Introduction
Global warming is recognized as seriously environmental issues because the rising in the average temperature of Earth’s atmosphere and oceans is still rapidly incessant. This finding is realized by the national science academies of all the major industrialized countries and is not disputed by any scientific body of national or international standing. Particularly, the majority of scientists specify that the warming in current decades has been caused first and foremost by human being activities that have enlarged the amount of greenhouse gases in the atmosphere such as deforestation, fossil fuel combustion and destroyed biodiversity of ocean by over harvesting fishery (United States National Academy of Sciences., 2008, National Research Council of USA., 2010, & Thiengkamol, 2011e).
The main international mitigation effort is the Kyoto Protocol, which seeks to stabilize greenhouse gas concentration to prevent a “dangerous anthropogenic interference” (UNFCCC, 2005). At international level as of May 2010, 192 states members of the UNFCCC had ratified the protocol. The only members of the UNFCCC that were asked to sign the treaty but have not yet ratified it are the USA and Afghanistan (UNFCCC, 2011).
Currently, environmental information on climate change with global warming has become hot issue for general people who are directly impacted by the earth quake, flood, and drought, furthermore it also affected to natural system, ecological system, biodiversity loss, new vector of disease born, species migration, and so on. However, the environmental problem can’t absolutely separate from individual level. The main of cause is revealed that the people have not enough knowledge and understanding, and lack of consciousness, awareness, and attitude to practice proper behavior including realizing that they take very important parts to take responsibility for conservation of natural resources and environment (Thiengkamol, 2011e).
The Tenth National Economic and Social Development Plan of Thailand (B.E. 2550-2554), it included the principle of participation of every sectors in Thai society and aimed to set Thai citizen as center of development in order to accomplish a sustainable economic and society based on the moral and ethics for living and conservation of natural resources and environment in order to develop the quality of life of Thai people in numerous aspects that was consistent to principle of sustainable development in accordance to concept of conference of environment and development of United Nation since 1992. In Agenda 21 of global action plan mentioned that “Sustainable development is development which meets the needs of the presented without compromising the ability of future generations to meet their own needs.” (Office of National Economic and Social Development Plan, 2010, WCED, 1987, Volker, 2007, Watkinson, 2009,

ISSN 2039-9340 Mediterranean Journal of Social Sciences Vol. 3 (11) November 2012
12
&Thiengkamol, 2011e). In order to meet sustainable development, it can be done through the environmental education process by via all channels whether informal, formal, non-formal, lifelong education systems, moreover the mass media and internet are also included but it needs to stress in the way of attitude changing and continuous implementation to develop permanently environmental behavior of natural resources and environmental conservation (Thiengkamol, 2011e).
The intention of psychologists tried to understand on human behavior, and then they had developed a large number of theories and models but they had the main focus on explanation how individual perceived and evaluated the stimulant before making decision to express his behavior. Nevertheless, study on human behavior, it can’t be neglected the psychological trait. Trait theorists are primarily interested in the measurement of traits, which can be defined as habitual patterns of behavior, thought, and emotion including psychological health and physical health which are inherited trait from parents. There is much debate over how much of who we are is by nature (genetic) or nurture (environment), and both contribute significantly to our complete expression (Kassin, 2003, & Pearson, 2006).
According to this perspective, traits are relatively stable over time, differ across individuals, and influence behavior. However, in studying of human geography, it revealed that both physical and biological features are the stimulants to make people convey their behavior in different approaches of place, surrounding people, and experience. These are unable to ignore since the human and environment are deeply and tightly related to each other, while environment play a role as stimulant to make human to perform different activities. Therefore, the human behavior was expressed by psychological trait and also caused to make a change of environment (Suwan, 2006). The ability of understanding about behavioral occurrence or expression of human, it leads to predict and control the undesirable behavior or promote and build the desirable behaviors.
It was obviously seen that there was no research done on environmental behavior for global warming alleviation affecting by environmental education based on psychological trait covering physical health, psychological health, self-confidence, mercy and kindness, achievement motivation, and goal of life. Currently, it is very rarely and there is no research is holistically integrative done about environmental education when it compared with other aspects of relating factors affecting to environmental behaviors. Therefore, this research was designed to study by covering all factors relating as mentioned above, it would be able to develop a model of environmental behaviors for global warming alleviation that are affected by environmental education and psychological traits. 2. Objective The objective was to propose the structural model of environmental education and psychological trait affecting to environmental behavior for global warming alleviation.
3. Methodology The research design was implemented in steps by step as follows: 3.1 The populations were 35,010 undergraduate students of the first semester in academic year 2011 of
Mahasarakham University. The Multi-stage random sampling was employed to collect 450 students from different faculties of Mahasarakham University.
3.2 The research instrument was the questionnaire and it was used for data collecting. The content and structural
validity were determined by Item Objective Congruent (IOC) with 5 experts in the aspects of environmental education, psychology, social science and social research methodology. The reliability was done by collecting the sample group from 50 undergraduate students of Rajabhat Mahasarakham University which is nearby Mahasarakham University. The reliability was determined by Cronbach's Alpha. The reliability of environmental education, psychological traits, and the whole questionnaire were 0.937, 0.838 and0.956 respectively.
3.3 The descriptive statistics used were frequency, percentage, mean and standard deviation. The inferential statistics
used was LISREL by considering on Chi-Square value differs from zero with no statistical significant at .05 level or Chi-Square/df value with lesser or equal to 2, P-value with no statistical significant at .05 level and RMSEA (Root Mean Square Error Approximation) value with lesser than 0.05 including index level of model congruent value, GFI (Goodness of Fit Index) and index level of model congruent value, AGFI (Adjust Goodness of Fit Index) between 0.90-1.00.

ISSN 2039-9340 Mediterranean Journal of Social Sciences Vol. 3 (11) November 2012
13
4. Results
4.1 Results of Confirmatory factors of Exogenous Variables Results of Confirmatory Factor Analysis of Exogenous Variables of Environmental Education (EE) and Psychological Trait (TRAIT) affecting to environmental behaviors for global warming alleviation (BEH), were revealed as followings. 1) Confirmatory factors of EE had Bartlett’s test of Sphericity of 995.457 statistically significant level (p< .01) and Kaiser–Mayer–Olkin Measure of Sampling Adequacy/MSA) of 0.809. This indicated that components of EE aspect had proper relationship at good level and it can be used for analysis of confirmatory factors as shown in picture 1 and table 1. Picture 1. Model of Confirmatory factors of Environmental Education
Table 1. Results of Analysis of Confirmatory factors of Environmental Education
Components of Environmental Education Weight SE t 2R X1Knowledge and Understanding on Environment 0.52 0.052 9.93** 0.22 X2 Attitude toward Environment 0.65 0.029 22.84** 0.82 X3 Value for Environment 0.48 0.028 17.03** 0.53 X4 Skill for Environmental Practice 0.58 0.033 17.43** 0.56 X5 Participation to Environmental Activities 0.58 0.036 16.24** 0.51 Chi-square = 3.30 df = 3 P = 0.34705 GFI = 1.00 AGFI = 0.99 RMSEA = 0.015 RMR =0.010
** Statistically significant level of .01 From picture 1 and table 1, results of analysis of confirmatory factors of EE from 6 observe variables were revealed that the model was congruent to empirical data by considering from 1) Goodness of Fit Index (GFI) equaled to 1.00 and Adjust Goodness of Fit Index (AGFI) equaled to 0.99 2) Root Mean Square Error of Approximation (RMSEA) equaled to 0.015 (RMSEA < 0.05) and 3) Chi- Square value had no statistically significant at level of .01 and degree of freedom was lesser than or equaled to .05 ( 00.5/2 ≤dfχ ).
X1 0.95
X2 0.09
X3 0.20
X4 0.26
X5 0.32
1.00
Chi-Square=3.30, df=3, P-value=0.34705, RMSEA=0.015
0.52
0.65
0.48
0.58
0.58
-0.12
0.10
EE

ISSN 2039-9340 Mediterranean Journal of Social Sciences Vol. 3 (11) November 2012
14
Considering on loading weight of observe variables in model, it was revealed that observe variables had loading weight with 0.48 to 0.65 and had covariate to model of Environmental Education with 22.00 to 82.00 percents. 4.2 Results of Confirmatory Factor Analysis of Endogenous Variables
1. Confirmatory Factor Analysis of Endogenous Variables of Psychological Trait (TRAIT) affecting to environmental behaviors for global warming alleviation (BEH) was revealed as followings. Confirmatory factors of TRAIT had Bartlett’s test of Sphericity of 591.807 statistically significant level (p< .01) and Kaiser–Mayer–Olkin Measure of Sampling Adequacy/MSA) of 0.782. This indicated that components of TRAIT aspect had proper relationship at good level and it can be used for analysis of confirmatory factors as shown in picture 2 and table 2. Picture 2. Model of Confirmatory factors of Psychological Trait
Table 2. Results of Analysis of Confirmatory factors of Psychological Trait
Confirmatory factors of Psychological Trait Weight SE t 2R X6 Physical Health 0.24 0.035 6.94** 0.16 X7 Psychological Health 0.43 0.028 15.14** 0.57 X8 Self-Confidence 0.39 0.029 13.71** 0.46 X9 Mercy and Kindness 0.36 0.037 9.71** 0.25 X10 Achievement Motivation 0.25 0.031 8.02** 0.17 X11 Goal of Life 0.46 0.040 11.45** 0.34 Chi-square = 10.20 df = 7 P = .17745 GFI = 0.99 AGFI = 0.98 RMSEA = 0.032 RMR = .0093
** Statistically significant level of .01
X6 0.31
X7 0.14
X8 0.18
X9 0.37
X10 0.29
X11 0.43
1.00
Chi-Square=10.20, df=7, P-value=0.17745, RMSEA=0.032
0.24
0.43
0.39
0.36
0.25
0.46
0.05
0.13
TRAIT

ISSN 2039-9340 Mediterranean Journal of Social Sciences Vol. 3 (11) November 2012
15
From picture 2 and table 2, results of analysis of confirmatory factors of TRAIT from 6 observe variables were revealed that the model was congruent to empirical data by considering from 1) Goodness of Fit Index (GFI) equaled to 0.99 and Adjust Goodness of Fit Index (AGFI) equaled to 0.98 2) Root Mean Square Error of Approximation (RMSEA) equaled to 0.015 (RMSEA < 0.05) and 3) Chi- Square value had no statistically significant at level of .01 and degree of freedom was lesser than or equaled to .05 ( 00.5/2 ≤dfχ ). Considering on loading weight of observe variables in model, it was revealed that observe variables had loading weight with 0.24 to 0.46 and had covariate to model of Psychological Trait with 16.00 to 57.00 percents. 2. Confirmatory Factor Analysis of Endogenous Variables of Environmental Behaviors for Global Warming Alleviation (BEH) Confirmatory Factor of Environmental Behaviors for Global Warming Alleviation (BEH) had Bartlett’s test of Sphericity of 834.218 statistically significant level (p< .01) and Kaiser–Mayer–Olkin Measure of Sampling Adequacy/MSA) of 0.832. This indicated that components of BEH aspect had proper relationship at good level and it can be used for analysis of confirmatory factors as shown in picture 4 and table 4. Picture 3. Model of Confirmatory factors of Environmental Behaviors for Global Warming Alleviation (BEH)
Table 3 Results of Analysis of Confirmatory factors of Environmental Behaviors for Global Warming Alleviation
Confirmatory factors of Environmental Behaviors for Global Warming Alleviation Weight SE t 2R Y1 Consumption Behavior 0.59 0.029 19.95** 0.69 Y2 Energy Conservation 0.40 0.032 12.67** 0.34 Y3 Waste Management 0.21 0.028 7.41** 0.13 Y4 Travelling Behavior 0.34 0.039 8.81** 0.18 Y5 Recycling Behavior 0.76 0.044 17.01** 0.54 Y6 Knowledge Transferring and Supporting for Environmental Conservation 0.60 0.031 18.96** 0.64 Chi-square = 11.08 df = 7 P = 0.13517 GFI = 0.99 AGFI = 0.98 RMSEA = 0.000 RMR = 0.036
** Statistically significant level of .01
Y1 0.16
Y2 0.32
Y3 0.29
Y4 0.52
Y5 0.49
Y6 0.20
1.00
Chi-Square=11.08, df=7, P-value=0.13517, RMSEA=0.036
0.59
0.40
0.21
0.34
0.76
0.60
0.04
0.07
BEH

ISSN 2039-9340 Mediterranean Journal of Social Sciences Vol. 3 (11) November 2012
16
From picture 3 and table 3, results of analysis of confirmatory factors of BEH from 6 observe variables were revealed that the model was congruent to empirical data by considering from 1) Goodness of Fit Index (GFI) equaled to 0.99 and Adjust Goodness of Fit Index (AGFI) equaled to 0.98 2) Root Mean Square Error of Approximation (RMSEA) equaled to 0.000 (RMSEA < 0.05) and 3) Chi- Square value had no statistically significant at level of .01
and degree of freedom was lesser than or equaled to .05. 00.5/2 ≤dfχ . Considering on loading weight of observe variables in model, it was revealed that observe variables had loading weight with 0.21 to 0.76 and had covariate to model of Environmental Behaviors for Global Warming Alleviation with 13.00 to 69.00 percents. 4.3 Results of Effect among Variables in Model in Terms of Direct Effect 1) Confirmatory factors of Environmental Education (EE) had direct effect to Environmental Behaviors for Global Warming Alleviation (BEH) with statistically significant at level of .01 with effect of 0.75. Moreover, confirmatory factors in aspect of Environmental Education (EE) had indirect effect to Environmental Behaviors for Global Warming Alleviation (BEH) with statistically significant at level of .01 with effect of 0.093.
2) Confirmatory factors of Environmental Education (EE had direct effect to Psychological Trait (TRAIT) with statistically significant at level of .01 with effect of 0.32.
3) Considering on structural model confirmatory factors of Environmental Education (EE) was able to explain the variation of endogenous factors of Psychological Trait (Trait) to caused Environmental Behaviors for Global Warming Alleviation (BEH) with 82.0 percents as following.
BEH = 0.29 TRAIT + 0.75 EE ……………………..(1) (R2 = 0.82) Equation (1) factors that had the most effect to Environmental Behaviors for Global Warming Alleviation (BEH) was Environmental Education (EE), subsequences was Psychological Trait (TRAIT) and these were able to explained the variation of Environmental Behaviors for Global Warming Alleviation (BEH) with 82.0 percents.
Picture 5. Model of Direct and Indirect Effect of EE through TRAIT Affecting to BEH
-0.04
1.03
0.98
0.42 0.26 0.46 0.64
0.29
X3
Chi-Square=251.23, df=143, P-value=0.165, RMSEA=0.035
EE
X5
TRAIT
X1
X2
0.16
0.22
X4
0.15
X6
X7
X8
X9
X10
X11
0.20 0.30 0.30 0.49 0.19
0.61
0.33
0.23
0.23
0.26
0.32
0.37
0.75
0.32
BEH
Y1 0.10
Y2 0.33
Y3 0.29
Y4 0.55
Y5 0.56
Y6 0.14
0.79
0.49 0.25 0.38 0.88 0.81

ISSN 2039-9340 Mediterranean Journal of Social Sciences Vol. 3 (11) November 2012
17
5. Discussion The findings indicated that environmental education had direct affecting to psychological trait and environmental behavior for global warming alleviation with highly with statistically significant at level of .01 with effect of 0.32 and 0.75. Additionally, Moreover, when considering on weight of loading of observe variables of Skill for Environmental Practice (X4), and Participation to Environmental Activities (X5) was able to predicted the variation of EE that was congruent to different studies of Thiengkamol, N. (2004, 2005a, 2005b, 2010b, 2011a, 2011b, & 2011c) that the results illustrated that the participants of Participatory Appreciation Influence Control (PAIC) training process with the integration of focus group discussion and brain storming would perform better environmental behaviors whether consumption behavior, energy consumption, recycling behavior, travelling behavior and knowledge transferring and supporting for environmental conservation after they had real practice via different activity participation for environmental conservation. Nevertheless, confirmatory factors of Psychological Trait (TRAIT) had direct effect to Environmental Behaviors for Global Warming Alleviation (BEH) with statistically significant at level of .01 with effect of 0.29. This result is congruent to the concept of psychologists about psychological trait also an important factor that affected to behavior of people and research of Thiengkamol, that studied on the affecting of psychological trait to environmental behavior (Thiengkamol, 2012c). It might be concluded that environmental education determined by observe variables of Knowledge and Understanding on Environment (X1), Attitude toward Environment (X2), Value for Environment (X3), Skill for Environmental practice (X4), and Participation to Environmental Activity (X5) and Psychological Trait (TRAIT) composing of Physical Health (X6), Psychological Health (X7), Self-Confidence (X8), Mercy and Kindness (X9), Achievement Motivation (X10), and Goal of Life (X11) affecting to Behavior for Global Warming Alleviation (BEH) covering of Consumption behavior (Y1), Energy conservation (Y2), Waste disposal (Y3), Travelling behavior (Y4), Recycling behavior (Y5), and Knowledge transferring and supporting for environmental conservation (Y6). The exogenous factors of Environmental Education (EE) was able to explain the variation of endogenous factors of Psychological Trait (TRAIT) to caused Environmental Behaviors for Global Warming Alleviation (BEH) with 82.0 percents. The model of EE affecting to BEH through TRAIT was verified the proposed model was fitted with all observe variables according to criteria of Chi-Square value differs from zero with no statistical significant at .05 level or Chi-Square/df value with lesser or equal to 2, P-value with no statistical significant at .05 level and RMSEA (Root Mean Square Error Approximation) value with lesser than 0.05 including index level of model congruent value, GFI (Goodness of Fit Index) and index level of model congruent value, AGFI (Adjust Goodness of Fit Index) between 0.90-1.00. Therefore, it might be concluded that environmental education and psychological trait play very important roles to create the environmental behavior of consumption behavior, energy conservation, waste management, travelling behavior, recycling behavior , and knowledge transferring and supporting for environmental conservation, therefore environmental education should introduced by integration in every subjects in the school. These results were congruent to concepts proposed by Thiengkamol (2009b, 2009c, & 2011e) and researches of Thiengkamol, (2012c) and Jumrearnsan, & Thiengkamol, (2012).
References
Jumrearnsan, W., & and Thiengkamol, N. (2012). Development of an Environmental Education Model for Global Warming Alleviation.
The Social Sciences, 7: 65-70. Kassin, S. (2003). Psychology. USA: Prentice-Hall, Inc. National Research Council of USA. (2010). Advancing the Science of Climate Change. Washington, D.C.: The National Academies
Press. Office of National Economic and Social Development Plan. (2010). The Tenth National Economic and Social Development Plan B.E.
2550-2554. Retrieve from http://www.nesdb.go.th/Default.aspx?tabid=90 Pimdee, P., Thiengkamol N,, Thiengkamol T., (2012) Psychological Trait and Situation Affecting through Inspiration of Public Mind to
Energy Conservation Behavior of Undergraduate Student, Mediterranean Journal of Social Sciences Vol 3 (3) Pearson, H. (2006). “Genetics: what is a gene?” Nature 441 (7092): 398–401. Suwan, M. (2006). Management of Environment: Principle and Concept. Bangkok: Odian Store. Thiengkamol, N. (2004). Development of A Learning Network Model for Energy Conservation. Doctoral Dissertation of Education
(Environmental Education) Faculty of Graduate Studies, Mahidol University, Thailand. Thiengkamol, N. (2005a). Strengthening Community Capability through The Learning Network Model for Energy Conservation. Journal
of Population and Social Studies, 14 (1), 27-46. Thiengkamol, N. (2005b). Development of Health Cities Network for Mekong Region. In Proceedings of the International Conference
“Transborder Issues in the Grate Mekong Sub-Region” Ubon Ratchathani, Thailand, 30 June-2 July 2005 (pp.111-119). Ubol Ratchathani: Nevada Grand Hotel.
Thiengkamol, N. (2009b). The Great Philosopher: the Scientist only know but Intuitioner is Lord Buddha. Bangkok: Prachya Publication.

ISSN 2039-9340 Mediterranean Journal of Social Sciences Vol. 3 (11) November 2012
18
Thiengkamol, N. (2009c). The Happiness and the Genius can be Created before Born. Bangkok: Prachya Publication. Thiengkamol, N. (2010b). Urban Community Development with Food Security Management: A Case of Bang Sue District in Bangkok.
Journal of the Association of Researcher, 15 (2), 109-117. Thiengkamol, N. (2011a). Holistically Integrative Research (2nd ed.). Bangkok: Chulalongkorn University Press. Thiengkamol, N. (2011b). Development of Energy Security Management Model for Rural Community through Environmental Education
Process. In Proceedings of the 1st EnvironmentAsia International Conference on “Environmental Supporting in Food and Energy Security: Crisis and Opportunity” Bangkok, Thailand, 22-25 March 2011 (pp.11). Bangkok: Rama Garden Hotel.
Thiengkamol, N. (2011c). Development of Food Security Management Model for Undergraduate Student Mahasarakham University through Environmental Education Process. In Proceedings of the 1st EnvironmentAsia International Conference on “Environmental Supporting in Food and Energy Security: Crisis and Opportunity” Bangkok, Thailand, 22-25 March 2011 (pp.12). Bangkok: Rama Garden Hotel.
Thiengkamol, N. (2011e). Environment and Development Book. (4th ed.).Bangkok: Chulalongkorn University Press. Thiengkamol, N. (2012c). Model of Psychological Trait Affecting to Global Warming Alleviation. European Journal of Social Sciences, 30
(3), 484-492. United Nations Framework Convention on Climate Change. (2005). Retrieved from http://unfccc.int/essential_background/convention
/background/items/1353.php.. United Nations Framework Convention on Climate Change. (2011). “Kyoto Protocol: Status of Ratification”. Retrieved from http://unfccc.int/kyoto_protocol/ status_of_ ratification/items/2613.php
United States National Academy of Sciences. (2008). Understanding and Responding to Climate Change. Retrieved from http://americasclimatechoices.org/climate_change_2008_final.pdf
Volker., H. (2007). Brundtland Report: A 20 Years Update. Retrieve fromhttp://www.sd-network.eu/pdf/doc_berlin/ESB07_ Plenary_Hauff.pdf.
Watkinson, J. (2009). WCED (1987) – Copenhagen (2009): Will we ever take the environment seriously? Retrieve from http://myliberaldemocratpoliticalramblings.wordpress.com/2009/08/27/wced-1987-copenhagen-2009-will-we-ever-take-the-environment-seriously/
World Commission on Environment and Development (WCED. (1987). Our Common Future. Oxford: Oxford University Press. The Brundtland Report. United Nations World Commission on Environment and Development. Retrieve from http://en.wikisource.org/wiki/Brundtland_Report

ISSN 2039-9340 Mediterranean Journal of Social Sciences Vol. 3 (11) November 2012
19
Gratification and Social Adjustment of Blind Children in District Faisalabad, Pakistan
Muhammad Asim
Department of Sociology, Government College University Faisalabad, Pakistan
Email: [email protected]
Aisha Zafar
Assistant Professor Government College for Women, Madina Town Faisalabad, Pakistan
Zahira Batool
Institute of Agri. Extension and Rural Development,
University of Agriculture, Faisalabad, Pakistan
Atif Jamal
Institute of Agri. Extension and Rural Development, University of Agriculture, Faisalabad, Pakistan
Doi: 10.5901/mjss.2012.v3n11p19
Abstract: Most of the blind people live in the developing countries with the blindness rate 10-20 times higher than that developed countries. Especially special children face many social and economic problems blind children. Such children want to have special attention regarding their social adjustment. The study was designed to identify and analyze the need satisfaction and social adjustment of blind children in Faisalabad, Pakistan. The universe of the present study was particularly comprised of blind educational institutions in Faisalabad. Eighty respondents were selected through convenient sampling technique. The data were collected through well designed interview schedule. The study revealed that a large majority 78.8% of the respondents of the total reported that that they faced blindness since birth. A mainstream of the population 52.5% reported that their parents paid attention during their sickness and 47.5% of the respondents reported that they discussed their personal problems with their parents. Key words: Child blindness, social adjustment, need, satisfaction 1. Introduction Most of the world’s blind people live in developing countries with blindness affected rate 10-20 times higher than that in developed countries. Blindness rate in developing countries are often in the range of 1-3% or higher, while figure of the developed countries are in the order of 0.1-2%. The majority of the blindness in under developing countries is due to either preventable or curable causes. The leading causes of blindness in developing and under developing countries are generally associated with poverty, illiteracy and depression, mostly commonly found in rural often remote and underdeveloped areas (Teshome, 2002). Globally the number of people of all ages visually impaired is estimated to be 285 million, of whom 39 million are blind. People 50 years and older are 82% of all blind. The major causes of visual impairment are uncorrected refractive errors (43%) and cataract (33%); the first cause of blindness is cataract (51%). Visual impairment in 2010 is a major global health issue: the preventable causes are as high as 80% of the total global burden (Pascolini, 2011). Global estimate of the number of people visually impaired.
Population (Millions) (A) Blind (Millions) (B) Low Vision (Millions) (A+B)Visually Impaired (Millions) 6,737.50 39.365 246.024 285.389
Source: (WHO, 2012).
ISSN 2039-9340 Mediterranean Journal of Social Sciences Vol. 3 (11) November 2012
20
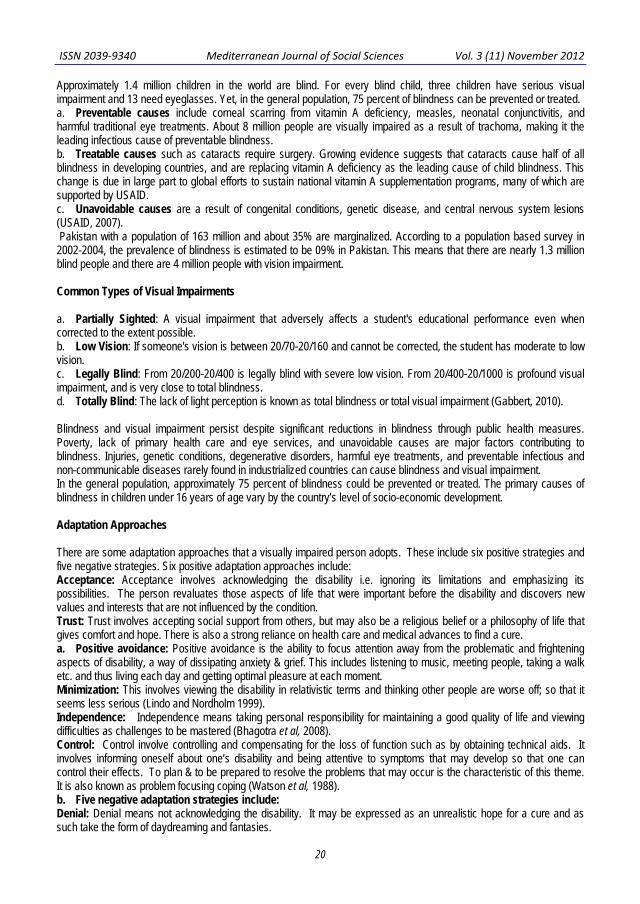
Approximately 1.4 million children in the world are blind. For every blind child, three children have serious visual impairment and 13 need eyeglasses. Yet, in the general population, 75 percent of blindness can be prevented or treated. a. Preventable causes include corneal scarring from vitamin A deficiency, measles, neonatal conjunctivitis, and harmful traditional eye treatments. About 8 million people are visually impaired as a result of trachoma, making it the leading infectious cause of preventable blindness. b. Treatable causes such as cataracts require surgery. Growing evidence suggests that cataracts cause half of all blindness in developing countries, and are replacing vitamin A deficiency as the leading cause of child blindness. This change is due in large part to global efforts to sustain national vitamin A supplementation programs, many of which are supported by USAID. c. Unavoidable causes are a result of congenital conditions, genetic disease, and central nervous system lesions (USAID, 2007). Pakistan with a population of 163 million and about 35% are marginalized. According to a population based survey in 2002-2004, the prevalence of blindness is estimated to be 09% in Pakistan. This means that there are nearly 1.3 million blind people and there are 4 million people with vision impairment. Common Types of Visual Impairments a. Partially Sighted: A visual impairment that adversely affects a student's educational performance even when corrected to the extent possible. b. Low Vision: If someone's vision is between 20/70-20/160 and cannot be corrected, the student has moderate to low vision. c. Legally Blind: From 20/200-20/400 is legally blind with severe low vision. From 20/400-20/1000 is profound visual impairment, and is very close to total blindness. d. Totally Blind: The lack of light perception is known as total blindness or total visual impairment (Gabbert, 2010). Blindness and visual impairment persist despite significant reductions in blindness through public health measures. Poverty, lack of primary health care and eye services, and unavoidable causes are major factors contributing to blindness. Injuries, genetic conditions, degenerative disorders, harmful eye treatments, and preventable infectious and non-communicable diseases rarely found in industrialized countries can cause blindness and visual impairment. In the general population, approximately 75 percent of blindness could be prevented or treated. The primary causes of blindness in children under 16 years of age vary by the country’s level of socio-economic development. Adaptation Approaches There are some adaptation approaches that a visually impaired person adopts. These include six positive strategies and five negative strategies. Six positive adaptation approaches include: Acceptance: Acceptance involves acknowledging the disability i.e. ignoring its limitations and emphasizing its possibilities. The person revaluates those aspects of life that were important before the disability and discovers new values and interests that are not influenced by the condition. Trust: Trust involves accepting social support from others, but may also be a religious belief or a philosophy of life that gives comfort and hope. There is also a strong reliance on health care and medical advances to find a cure. a. Positive avoidance: Positive avoidance is the ability to focus attention away from the problematic and frightening aspects of disability, a way of dissipating anxiety & grief. This includes listening to music, meeting people, taking a walk etc. and thus living each day and getting optimal pleasure at each moment. Minimization: This involves viewing the disability in relativistic terms and thinking other people are worse off; so that it seems less serious (Lindo and Nordholm 1999). Independence: Independence means taking personal responsibility for maintaining a good quality of life and viewing difficulties as challenges to be mastered (Bhagotra et al, 2008). Control: Control involve controlling and compensating for the loss of function such as by obtaining technical aids. It involves informing oneself about one’s disability and being attentive to symptoms that may develop so that one can control their effects. To plan & to be prepared to resolve the problems that may occur is the characteristic of this theme. It is also known as problem focusing coping (Watson et al, 1988). b. Five negative adaptation strategies include: Denial: Denial means not acknowledging the disability. It may be expressed as an unrealistic hope for a cure and as such take the form of daydreaming and fantasies.

ISSN 2039-9340 Mediterranean Journal of Social Sciences Vol. 3 (11) November 2012
21
Resentment: Resentment is a feeling of bitterness about having become a victim of the disease. The person resents that he or she can no longer do all the things that he or she used to do. Shame: Shame is the feeling of inferiority in comparison to healthy people. The person feels ashamed of being different from what he or she used to be. Isolation: Isolation involves the feeling of being an outsider, of being misunderstood by others. As a result, the person avoids socializing. Helplessness: Helplessness is the feeling of self-pity and of not being able to cope. 2. Methodology The study was design to identify and analyze the need gratification and social adjustment of blind children in district Faisalabad, Pakistan. In order to achieve this objective, existing literature on the subject was reviewed and survey research was design to collect the information from 80 respondents who were selected by employing convenient sampling technique. Two institutions (Al faisal Markaz Nabina and government school for special education, Faisalabad) were selected (40 from each). The aim was to take hold of the knowledge of the work done by the other researchers under different settings. Keeping in view our cultural norms values and beliefs the respondents were selected on the basis of certain basic criteria, which are called control variables or basic assumption of the study. 3. Result and Discussion Social adjustment permits the blind to live as usual a life as possible, equivalent to the lives of those people who were without any disability in the society, contrary to it, leads to maladjustment. Maladjustment is the result of negative accommodation. Maladjustment could suggest dysfunction in the one's life. That was why researchers were keenly interested to explore the factors i.e. needs, satisfaction and social adjustment of blind children. Age is the major indicator of social behavior and action. Attitude of the individuals changes with the passage of time. Data show that more than half of the respondents i.e. 52.5% were 11-15 years age group, whilst the mean age was 14.22 years with 3.56 standard deviation. Majority of the respondents were studying in between 6-8 grade class. In this survey majority of the respondents 57.5% were female and remaining 47.5% were male. This data show that gender-based blindness inequality begins in childhood respectively. It was also reported by USAID, (2007) that girls had less access to medical and surgical services than that of boys. These services included diagnosis of correctable cataract, treatment of eye infections, and provision of corrective glasses. In a study in Tanzania, parents were less likely to take their young daughters with congenital cataracts to the hospital for surgery than their sons. This gender inequity continues into adulthood women account for two-thirds of blindness and three-fourths of trachoma-related blindness. Data demonstrated that majority of the respondents belonged to joint family system. Data shows that almost half of the respondents i.e. 47.5% respondents’ monthly house hold income up to 10000 rupees belonged to poor family and 17.5% of the respondents’ monthly household income. Table: 1 Socio economic characteristic of the respondents
No.1 Age of the respondents Frequency Percentage Mean Standard Deviation i. Up to 10 years 10 12.5 8.57 2.32 ii. 11-15 years 42 52.5 12.82 1.92 ii. 16-19 years 28 35.0 17.02 2.21
Total 80 100.0 14.22 3.56 2 Year of schooling
i. 1-5 grade 28 35.0 3.7 1.33 ii. 6-8 grade 36 45.0 6.88 0.55 iii. 9-10 grade 16 20.0 9.35 0.45
Total 80 100.0 6.52 2.42 3 Monthly Family Income (in rupees)
i. ≤ 10000 38 47.5 60589 2158 ii. 10001-20000 28 35.0 13456 3158 ii. ≥ 20001 14 17.5 25621 4365

ISSN 2039-9340 Mediterranean Journal of Social Sciences Vol. 3 (11) November 2012
22
Total 80 100.0 12545 4856 4 Type of Family Frequency Percentage
i. Nuclear 18 22.5 ii. Joint 62 77.5
Total 80 100.0 5 Sex of the respondents
i. Male 34 42.5 ii. Female 46 57.5
Total 80 100.0 Table 2 shows that large majority of the respondents 77.5% were blind by birth and 10.5% of the respondents became blind less than one year of their age. 17.5% respondents told that they became blind due to different types of illness such as typhoid fever, glaucoma and cataracts. While the 5% of the respondents stated that they became blind accidently. As far as the attitude of the teachers concerned, majority of the respondents reported that the attitude of the teachers were friendly and polite and more than one fourth i.e. 35% respondents reported that the attitude of teachers were normal, whilst a small proportion i.e. 5% respondents claimed that the attitude of the teachers were rude and not well cooperative. Table 2: Background characteristics of the respondents
No.1 Age when they become blind Frequency Percentage i. By Birth 62 77.5 ii. Less than one year 8 10.0 ii. 1-4 6 7.5 v. 5-10 4 5
Total 80 100.0 2 Reasons of their disability Frequency Percent
i. By Birth 62 77.5 ii. By Illness 14 17.5 ii. Accidently 4 5
Total 80 100.0 3 Attitude of the teachers
i. Friendly 46 57.5 ii. Normal 28 35 ii. Rude 6 7.5
Total 80 100.0 Table 3: Distribution of the respondents according to their social problems and involvement in recreational activities
No.1 Feel problems in routine activities
To a great extent To some extent Not at all Freq. %age Freq. %age Freq. %age
i. Cooking Foods 12 15.0 22 27.5 46 57.5 ii. Using Washrooms 8 10.0 16 20 56 70.0 ii. Changing Clothes 6 7.5 18 22.5 56 70.0 v. Washing Clothes 7 8.75 25 31.25 48 60 v. Traveling 36 45 40 50.0 4 5
2 Participate in Recreational Activities i. Music 18 22.5 30 37.5 32 40.0 ii. Indoor Games 39 48.8 21 26.2 20 25.0 ii. Reading 30 37.5 34 42.5 16 20.0 v. Radio listening 17 21.3 42 52.5 21 26.3 v. News listening 3 3.8 37 46.3 40 50.0
Table 3 shows that the respondents’ social problems and involvement in recreational activities during their leisure time. Data show that majority of the respondents did not feel any problem in their daily routine work. Whilst the small proportion of the respondents felt problems in their routine work up to great extent and some extent. Similar study conducted by

ISSN 2039-9340 Mediterranean Journal of Social Sciences Vol. 3 (11) November 2012
23
Huebner (1998) who pointed out that blind children took active participation in age appropriate routine activities in their houses and schools in such activities including eating, house care, money management, sewing, telephone use, child care and at minor level household maintenance. One of the other scholars Beer et al, (2006) found that lost vision almost half of the people experiencing sight loss could not cook for themselves. Indeed, the most frequently reported household tasks that were deemed challenging were preparing meals and household cleaning. One of the researchers Zelalem (2002) pointed out that parents believed that their blind children had less learning potential, unable to accomplish household chores, and unable to play like sighted. A huge majority of the respondents 45% and 50% claimed up to great extent and some extent respectively that they had to face many problems whenever they experienced to move from one place to another place. While 5% of the respondents did not experience any difficulties in travelling. As far as participation in recreational activities concerned, 22.5% and 37.5% respondents were interested to listen the music whenever they were free up to great extent and some extent respectively. Whilst 40% of the respondents did not take any interest in musical activities. Data indicate that majority of the respondents showed their interest to participate in different type of home based recreational activities such as different indoor games, reading, listening the radio and news whenever they were free. Table 4: Distribution of the respondents with regard to their attitudinal statements
No Parents pay attention during their sickness To great extent To some extent Not at all
F % F % F % 1 Parents pay attention during their sickness 42 52.5 34 42.5 4 5.0
2 Discuss their personal problems with parents 38 47.5 37 46.3 5 6.3 3 Discuss the study problem with their teachers 32 40.0 44 55.0 4 5.0 4 Fell difficulty in maintaining academic standard 22 27.5 32 40.0 26 32.5 5 Teachers help in solving their problems 42 52.5 32 40.0 6 7.5 6 Fell uneasiness in meeting stranger 18 22.5 16 20.0 46 57.5 7 Feel that their parents consider them as a
burden upon them 20 25.0 35 43.8 25 31.3
8 Participation in extra curriculum activities 17 21.3 20 25.0 43 53.8 Table 4 shows that the attitude of the blind children according to their confidence, dependency and needs attainment from others. More than half of the respondents i.e. 52.5% argued that parents paid their attention to great extent when they were sick and 42.5% of the respondents reported that parents gave up to some extent attention when they were sick. Whilst 5% of the respondents claimed that parents did not give any attention during their sickness. One of the researchers Zelalem (2002) found that parents articulated diverse responses as a result of having blind children. These were shock, denial, anger and sadness. The set of belief held by parents about the causes of their children’s blindness varies from real cause to sin, evil eye, curse, misdeed in previous life by parents and misfortune. Those parents who are in better educational level have positive perception about their blind children and play positive role in the overall personality development of their children As far as discuss their personal problems with parents concerned 47.5% and 46.3% of the respondents shared their personal problems with their parents to great extent and some extent respectively. More than half of the respondents 55.0% respondents discussed the study problem with their teachers up to some extent. 27.5% and 40.0% of the respondents claimed that they suffered maintaining academic excellence to a great extent and some extent respectively. While the 32.5% of the respondents stated that they had never felt any difficulty in their academic career due to blindness. Majority of the respondents were agreed that the teachers helped in solving their academic problems. Similar result presented by the Ayinmod et al, (2011) they found that most of the blind people were reasonably adjusted in key areas of social interaction with parents and teachers, marriage, and other kinship relations. Majority were considered to be poorly adjusted in the areas of education, vocational training, employment, and mobility. Data exhibited that majority of the respondents 57.5% did not feel any hesitation when they experienced to meet any strangers. When the researchers asked the respondents have you feel your parents consider you a burden on them? One fourth of the respondents i.e. 25% and 43.8% respondents were great extent and some extent agreed about this assertion respectively. While the 31.3% respondents were not agreed about that the parents consider them as “a burden”. Similar results found by Macha (2001) and Barnartt (2005) they observed that disability was a great problem not only for child but also for the entire family. Macha (2001) further argued that in Africa some parents of disabled children were afraid of being laughed at and isolated by the society. To have a blind child was considered the punishment by God.
ISSN 2039-9340 Mediterranean Journal of Social Sciences Vol. 3 (11) November 2012
24
As far as participation in extra curriculum activities concerned more than half of the respondents i.e. 53.8% did not take part in extra curriculum activities. 4. Conclusion Blind children in our society are not considered as helping hand, rather than “a burden”. More than half of the blind children belonged to lowest income group. It was found that majority of the respondents were blind by birth due to inherited problems, some were blind by illness due to typhoid, anemia and accidently. Most of the children were satisfied with the attitude of friends and teachers toward them in socio-cultural norms of the society. Majority of the respondents were satisfied with the technical training being provided by them. There is great need that parents of blind children must be encouraged, supported and to take an active role in the education of disable children.
References
. Ayinmode, T. M., T. M. Akande, D. S. A. Popoola. 2011. Psychological and Social Adjustment to Blindness: Understanding from Two
Groups of Blind People in Ilorin, Nigeria. Annals of African Medicine.10 (2): 155-164 Barnartt, S. 2005. Report of the ASA Committee on the Status of the Persons with Disabilities (PWD) 111-13 Beer, J., Southern, R., Gilling, D. et al. 2006. Cornwall Blind Association: Needs Assessment and Business Development Study. Social
Research and Regeneration Unit. University of Plymouth. Bhagotra, S., A. K. Sharma and B. Raina. 2008. Psycho- Social Adjustments and Rehabilitation of the Blind. Journal of Medical
Education and Research. 10(1): 48-51 Gabbert, C. 2010. Common Types of Visual Impairments. Retrieved Date 08/02/ 2011. http://www.brighthub.com/education/special/articles/35103.aspx Huebner, K.M. 1998. Social Skills in Schools: Foundation of Education for the Blind and Visually Handicapped Children and Youth
Theory and Practices New York: American Foundation for the Blind, Inc., 341-363 Lindo, G., L. Nordholm. 1999. Adaptation Strategies. Well being and activities of daily living among people with low vision. Journal of
Visual Impairment Blindness. 7:434-46. Macha, E. 2001. Disabled people and Discrimination a Global Overview. Justice, Peace and Creation Echoes. Geneva: World Council of
Churches. Pascolini D, Mariotti SPM. Global Estimates of Visual Impairment: 2011. British Journal Ophthalmology Online First published December
1, 2011 as 10.1136/bjophthalmol-2011-300539. Teshome, T. 2002. Prevalence and Causes of Blindness in Merhabete, North Shoa, Ethiopia. Ethiopian Journal of Health
Development.16(1):71-76 USAID. 2007. The USAID Child Blindness Program. U.S. Agency for International Development. 1300 Pennsylvania Avenue, NW.
Washington, DC. Watson, M., S. Geer and J.Q. Young. 1988. Development of Questionnaire Measure of Adjustment in Cancer: MACL scale.
Psychological medical Journal. 18 (2): 203-09 WHO. 2012. Causes of blindness and visual impairment. Retrieved Date 02/01/2012. Assessed by: http://www.who.int/blindness/en/ Zelalem, F. 2002. The Attitudes of Parents towards their Blind Children: A Case Study in Bahir Dar Town. Published Master Thesis.
School of graduate studies of Addis Ababa University.
ISSN 2039-9340 Mediterranean Journal of Social Sciences Vol. 3 (11) November 2012
25
Punctuation in Translation: The Unseen Side of the Coin
Dr. Seyed Mohammad Hosseini-Maasoum
Department of Linguistics and Foreign Languages,
Payame Noor University, I.R. Iran Email: [email protected]
Mehdi Mahdiyan
Department of English, Quchan Branch, Islamic Azad University, Quchan, Iran
Email [email protected]
Doi:10.5901/mjss.2012.v3n11p25 Abstract: This paper critically surveys the role of three punctuation marks: the colon, the semicolon, and the comma, in translating from English to Persian. It aims at investigating how problematic these punctuation marks can be and to what extent the students’ familiarity with their pragmatic and metadiscourse functions can affect their translation from English to Persian. To accomplish this, twenty two graduate students of translation were selected and asked to translate some sentences from English to Persian. The results have indicated that only a minority of them were successful. The root causes of their poor performance can be traced back to the lack of contrastive study on punctuation systems of English and Persian as well as lack of familiarity with metadiscourse functions of punctuation marks. Key words: punctuation, metadiscourse, comma, semicolon, colon, translation. 1. Introduction As Gile (1995) has said, the translation process consists of three main phases: comprehension of the source text, the transfer phase, and revision (cited in Mendoza& Ponce, 2009: 129). The analysis of the source text can be regarded as one of the most important phases in translation. To achieve this goal, a good translator should scrutinize both intra- and extra-textual elements. Considering intra textual elements, most translators pay obsessive attention to the structure and lexemes of the text while minorities of them consider punctuation as an influential part in their work. In this respect, Newmark (1988:58) has said “punctuation is potent, but is so easily overlooked".
Besides its mechanical function, punctuation is important from a pragmatic point of view. It is considered as an integral part of written discourse to bound elements of a text. Punctuation marks can be regarded as nuts and bolts of writings. They attach the sentences together and bring unity to the texts. Moreover, punctuation can be enumerated as a part of metadiscourse usually defined as “the linguistic resources used to organize a discourse or the writers’ stance toward either its content or reader (Hyland 2000: 109). Metadiscourse focuses on the relationship between the writer and the reader of the text. Mauranen (1993: 9) asserts that in metadiscourse the writer tries to show "his or his presence" in the text and shows the reader "how the text is organized.” Inadequate punctuation makes the reader confused and forces him/her to iterate reading the text several times to understand its meaning. Kirkman provides a good example to show how lack of punctuation in a text can make it difficult to understand: “He draws an analogy between this and the learning process of a new-born child as it develops into maturity and quotes Freud: ... “(2006:3). Without a comma before the phrase “and quotes Freud,” the meaning changes drastically. Similarly, using punctuation marks desperately in places where they are not supposed to be used can be overwhelming for the reader. Therefore, the correct application of punctuation marks is notable for translators because of their vital role in transferring meaning from the source text to the target text.
In the current paper, an attempt will be made to clarify how punctuation marks have semantic and pragmatic load and can be problematic in translation. After a comparative study of punctuation marks of English and Persian, three intra-sentential ones were selected. They include comma, colon, and semicolon. The logic for selecting these marks is that they are repeatedly used in English written discourse and that they have some additional functions in English such as stating omitted words or adding emphasis other than those that they have in Persian (revise this part). The importance

ISSN 2039-9340 Mediterranean Journal of Social Sciences Vol. 3 (11) November 2012
26
and multi-functional nature of punctuation has stimulated the researchers to investigate the level of familiarity of Iranian students of English translation with this discoursal device. The research is hoped to discover the extent to which punctuation can be problematic for the selected translators and how much these translators can perceive the role of punctuation in conveying the meaning and therefore translate it correctly. To do this, 22 undergraduate students of English translation in Azad University of Quchan were asked to translate some paragraphs adopted from some books or some novels. The sample consisted of students who had taken at least, eight semesters (theoretical and practical courses), to ensure that they had proper mastery of translation practice and theory. Students were asked to translate sample texts from English into Persian. Special attention was paid to their renderings of the punctuation marks to see whether the students were aware of their semantic and pragmatic uses. The findings may be illuminating in training the translators.
2. Literature review 2. 1. The status of punctuation in translation Languages vary significantly in the sentence-marking features they possess and the way they use these to combine elements of them. When analyzing the text, the translator should beware of subtle differences between SL and TL. In this respect Baker (1992:151) asserts that “apart from syntactic structure, punctuation can also be used as a device for signaling information structure in written language. . . Different languages use different devices for signaling information structure and translators must develop sensitivity to the various signaling systems available in the languages they work with.”
According to El-Shiyab (n.d:115) “punctuation and its functions lie within the field of pragmatics. The meaning of a particular utterance has to be deduced from the speaker’s intention with reference to the context of situation in which the utterance is used.” It means that in addition to its ordinary usages, punctuation also points to the tone and intention of the writer and carries pragmatic load. So many translators naively consider punctuation marks as mechanical elements, which relate the segments of a sentence together. A tiny ‘comma’ can be greatly influential in the interpretation of the reader from the information that comes after a relative clause. The following examples are adopted from Kirkman (2006: 39):
1. A six-month-old calf was submitted for examination, showing alameness in all four legs which had been present since soon after birth. (The which clause defines: it relates to legs, and tells us that the legs had been present since soon after birth).
2. A six-month-old calf was submitted for examination, showing lameness in all four legs, which had been present since soon after birth. (The which clause comments: it relates to lameness, and tells us that the lameness had been present since soon after birth).
The given examples are alike in terms of arranging words. The difference is only understood through the application of the comma. If one considers accurately the implications created by the use of the comma, s/he will observe that the first clause does not add any new information; it is supposed that the reader already knows enough about the calf to identify it from this description. Therefore, it is a defining or restrictive clause. Simultaneously, if one examines the implications created in the second clause, s/he can observe that there is a particular information structure showed by using the comma, and this structure embodies new information. Therefore, it is a commenting or non-restrictive clause. Therefore, a comma, as tiny as it appears, makes a big difference between two units of information worded similarly. Dale (1991:118) poses three functions for the punctuation as it follows: • Degree of rhetorical balance: i.e., the relative importance of juxtaposed elements; • Aggregation: i.e., the relative closeness and distance of juxtaposed material; and • Particular rhetorical relations: some punctuation marks seem to play a role in indicating what semantic or rhetorical relations hold between juxtaposed elements. The firs function discloses that punctuation marks are kinds of indicators for translators, which show the lexical elements next to them, may be of high significance, so they should be taken more thoroughly. The third function seems to be more related to translation because it shows interrelatedness of meaning between the elements of a sentence and the meaning they have in context and conveying the meaning relations between the elements of the text.

ISSN 2039-9340 Mediterranean Journal of Social Sciences Vol. 3 (11) November 2012
27
2.2. Punctuation from the viewpoint of metadiscourse As mentioned before, punctuation is a sub-category of metadiscourse. Metadiscourse has recently been defined as ‘‘the cover term for the self-reflective expressions used to negotiate interactional meanings in a text, assisting the writer (or speaker) to express a viewpoint and engage with readers as members of a particular community’’ (Hyland, 2005: 37). It is a language device or a tool that enhances interaction for successful communication. The functional theoretical framework of metadiscourse defines writers as the conductors of interaction with the readers. The notion of the writer-reader interactions has underpinnings on the following three key principles of metadiscourse that was suggested by Hyland &Tse: •"Metadiscourse is distinct from propositional aspects of discourse. • Metadiscourse refers to aspects of the text that embody writer-reader interactions. • Metadiscourse refers to relations only that are internal to the discourse"(2004:159). The first principle indicates metadiscourse does not add anything to the propositional meaning and just facilitates the writer-reader interaction. In the second one, metadiscourse is about interaction therefore it only involves the interpersonal function, not the textual function. This indicates that metadiscourse takes into account the readers' knowledge, textual experiences and processing needs while it also equips the writer with (Farrokhi&Ashrafi, 2009:43). The last principle mentions that metadiscours just unfolds the discourse and does not relate to the external world of the context.
Dafouz-Milne puts the punctuation in textual metadiscourse category and enumerates explaining, rephrasing, or exemplifying textual materials as its functions (2008:98). Researches about metadiscourse have done in different genres: Research articles (Mauranen, 1993; Dahl, 2004; Hyland, 1998, 2001a, 2002, 2007), textbooks (Hyland, 1999), advertisements (Fuertes-Olivera et al., 2001), science popularizations (Varttala, 1998), newspaper discourse (Hempel and Degand, 2008) and academic talks and lectures (Thompson, 2003; Eslami and Eslami- Rasekh, 2007). In this way, metadiscourse can also be considered in academic writing. Therefore it seems that there is a close relationship between metadiscourse and translation. Therefore, it will be possible to find some ways and different strategies in translation of metadiscourse. Accordingly, punctuation helps the reader to follow the writer’s path of thought more easily and create meaningful connection with the text. Therefore, the duty of the translator will be multiplied in transferring the function of punctuation from the SL to the TL.
3. Punctuation in Persian As Mohamadifar has asserted, the history of punctuation in Persian writing is not very old and it did not exist in classical writings. Its usage goes back to the advent of press industry in Iran (2002:439). So it seems important to go through the punctuation system of Persian language at first and then try to find which punctuation marks may be more problematic for Iranian translators. In this respect, Newmark advises translators to make a separate comparative punctuation check on their version and the original (1988:58). Yahaghi and Naseh in their book A Guide to Writing and Editing (1996) have listed sixteen punctuation marks as the most prevalent ones in Persian writing. They are as follows:
Punctuation Sign Function Comma ، Showing pause, separating two successive words, after and before appositive, after direct address Semicolon ; After related sentences, for separating independent meanings Full stop . After complete declarative sentences, after abbreviations. Colon : For showing items which need definition, shoeing items which need enumeration Dash - Before and after appositive, for separating numbers and figures For separating parts of a date, for showing the equivalence of words Diagonal line / Underlining the For showing importance and emphasis Curved brackets ( ) For separating excessive information within a sentence Square brackets [ ] For showing missing parts in a quotation, for explanation Dots … For avoiding repetition, for showing omitted words Question mark ؟ For direct question, for showing sarcasm Exclamation mark
! For showing surprise, addressing someone, pray, sigh
Double quotation marks
“ “
For showing direct quotation, showing proper nouns
Ditto sign ” ” ” For showing repetition
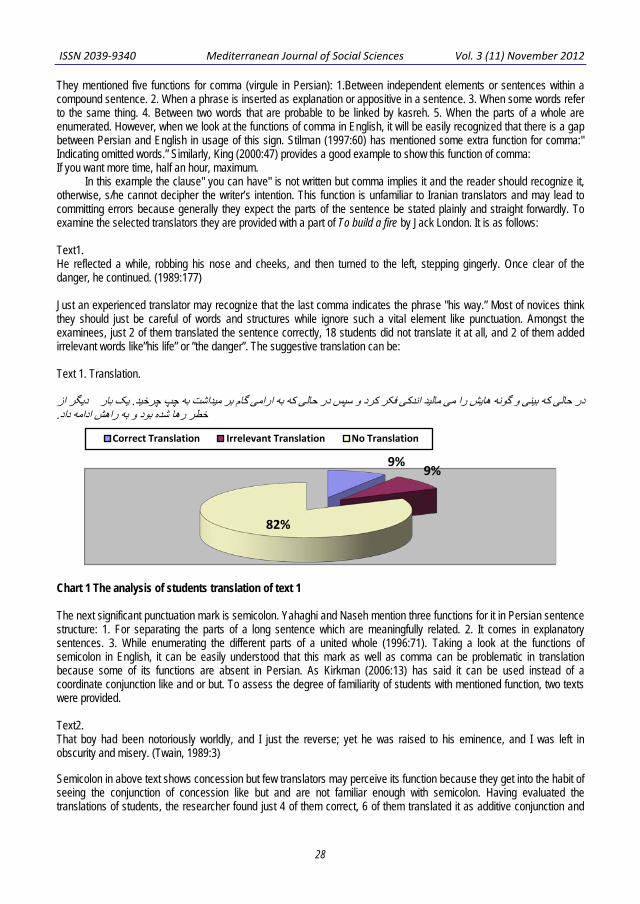
ISSN 2039-9340 Mediterranean Journal of Social Sciences Vol. 3 (11) November 2012
28
They mentioned five functions for comma (virgule in Persian): 1.Between independent elements or sentences within a compound sentence. 2. When a phrase is inserted as explanation or appositive in a sentence. 3. When some words refer to the same thing. 4. Between two words that are probable to be linked by kasreh. 5. When the parts of a whole are enumerated. However, when we look at the functions of comma in English, it will be easily recognized that there is a gap between Persian and English in usage of this sign. Stilman (1997:60) has mentioned some extra function for comma:" Indicating omitted words.” Similarly, King (2000:47) provides a good example to show this function of comma: If you want more time, half an hour, maximum.
In this example the clause" you can have" is not written but comma implies it and the reader should recognize it, otherwise, s/he cannot decipher the writer’s intention. This function is unfamiliar to Iranian translators and may lead to committing errors because generally they expect the parts of the sentence be stated plainly and straight forwardly. To examine the selected translators they are provided with a part of To build a fire by Jack London. It is as follows:
Text1. He reflected a while, robbing his nose and cheeks, and then turned to the left, stepping gingerly. Once clear of the danger, he continued. (1989:177)
Just an experienced translator may recognize that the last comma indicates the phrase "his way.” Most of novices think they should just be careful of words and structures while ignore such a vital element like punctuation. Amongst the examinees, just 2 of them translated the sentence correctly, 18 students did not translate it at all, and 2 of them added irrelevant words like”his life” or ”the danger”. The suggestive translation can be:
Text 1. Translation.
از ديگردر حالی که بينی و گونه هايش را می ماليد اندکی فکر کرد و سپس در حالی که به ارامی گام بر ميداشت به چپ چرخيد. يک باراد.خطر رها شده بود و به راهش ادامه د
Chart 1 The analysis of students translation of text 1 The next significant punctuation mark is semicolon. Yahaghi and Naseh mention three functions for it in Persian sentence structure: 1. For separating the parts of a long sentence which are meaningfully related. 2. It comes in explanatory sentences. 3. While enumerating the different parts of a united whole (1996:71). Taking a look at the functions of semicolon in English, it can be easily understood that this mark as well as comma can be problematic in translation because some of its functions are absent in Persian. As Kirkman (2006:13) has said it can be used instead of a coordinate conjunction like and or but. To assess the degree of familiarity of students with mentioned function, two texts were provided. Text2. That boy had been notoriously worldly, and I just the reverse; yet he was raised to his eminence, and I was left in obscurity and misery. (Twain, 1989:3) Semicolon in above text shows concession but few translators may perceive its function because they get into the habit of seeing the conjunction of concession like but and are not familiar enough with semicolon. Having evaluated the translations of students, the researcher found just 4 of them correct, 6 of them translated it as additive conjunction and
9%9%
82%
Correct Translation Irrelevant Translation No Translation

ISSN 2039-9340 Mediterranean Journal of Social Sciences Vol. 3 (11) November 2012
29
even 12 students did nottranslate it. Those who translated semicolon to but (amma in Persian) were right. A suggestive translation into Persian is as follows: Text 2. Translation آن پسر به طور عالم گيری بد نام شده بود و من بر عکس او بودم، امااو به شهرتش رسيده بود و من در گمنامی و بد بختی رها شده بودم.
Chart 2 Analysis of students’ translation of text2 In a different text, this punctuation mark has another meaning but again a minority of examinees could distinguish it. But unlike the previous text, semicolon acts as an additive conjunction in the below text. Text3. Classical method was adopted as the chief means for teaching foreign languages. Little thought was given at the time to teaching oral use of languages; after all, languages were not thought primarily to learn oral communication. (Brown, 2007:16) Although it is not clear that the clauses before and after semicolon are those of the same value, the translator should be able to recognize it and join them by additive conjunction “and”. Considering the translations, the results state that just 4 students were right, 16 of them did not translate the semicolon ,and 2 of them wrote ”but ”instead of ”and”. In Persian they should have written va (additive). The following translation can be suggested for the above text: Text 3. Translation روش کالسيک (باستانی) به عنوان ابزار اصلی برای آموزش زبانهای خارجی اتخاذ شد.در آن زمان اهميت کمی به تدريس کاربرد شفاهی
زبانها داده می شد وروی هم رفته، زبانها از ابتدا برای آموختن ارتباط شفاهی تدريس نمی شدند.
Chart 3 Analysis of student’s translation of text 3 Stilman (1997:93) enumerates functions of semicolon as an alternative to some conjunctions like”so”,”as”, and”for”, but besides these conjunctions, semicolon can be used as contrastive emphatic conjunction. In English it is used to mean emphasis but In Persian balkhe has this function and for assessing the examinees the following text was presented to them:
18%
27%55%
Cocessive Addetive Not Translated
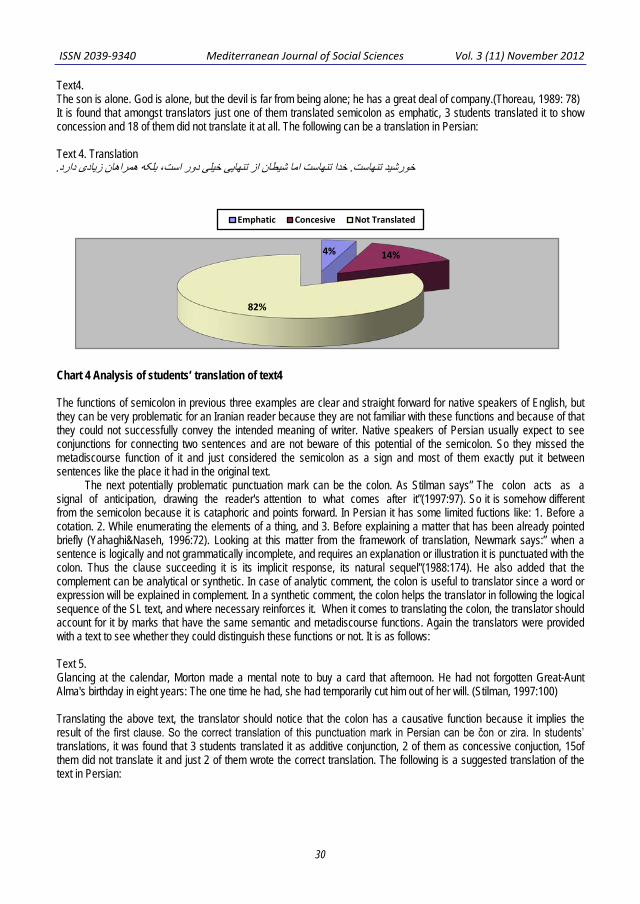
ISSN 2039-9340 Mediterranean Journal of Social Sciences Vol. 3 (11) November 2012
30
Text4. The son is alone. God is alone, but the devil is far from being alone; he has a great deal of company.(Thoreau, 1989: 78) It is found that amongst translators just one of them translated semicolon as emphatic, 3 students translated it to show concession and 18 of them did not translate it at all. The following can be a translation in Persian: Text 4. Translation خورشيد تنهاست. خدا تنهاست اما شيطان از تنهايی خيلی دور است، بلکه همراهان زيادی دارد.
Chart 4 Analysis of students’ translation of text4 The functions of semicolon in previous three examples are clear and straight forward for native speakers of English, but they can be very problematic for an Iranian reader because they are not familiar with these functions and because of that they could not successfully convey the intended meaning of writer. Native speakers of Persian usually expect to see conjunctions for connecting two sentences and are not beware of this potential of the semicolon. So they missed the metadiscourse function of it and just considered the semicolon as a sign and most of them exactly put it between sentences like the place it had in the original text.
The next potentially problematic punctuation mark can be the colon. As Stilman says” The colon acts as a signal of anticipation, drawing the reader's attention to what comes after it”(1997:97). So it is somehow different from the semicolon because it is cataphoric and points forward. In Persian it has some limited fuctions like: 1. Before a cotation. 2. While enumerating the elements of a thing, and 3. Before explaining a matter that has been already pointed briefly (Yahaghi&Naseh, 1996:72). Looking at this matter from the framework of translation, Newmark says:” when a sentence is logically and not grammatically incomplete, and requires an explanation or illustration it is punctuated with the colon. Thus the clause succeeding it is its implicit response, its natural sequel”(1988:174). He also added that the complement can be analytical or synthetic. In case of analytic comment, the colon is useful to translator since a word or expression will be explained in complement. In a synthetic comment, the colon helps the translator in following the logical sequence of the SL text, and where necessary reinforces it. When it comes to translating the colon, the translator should account for it by marks that have the same semantic and metadiscourse functions. Again the translators were provided with a text to see whether they could distinguish these functions or not. It is as follows: Text 5. Glancing at the calendar, Morton made a mental note to buy a card that afternoon. He had not forgotten Great-Aunt Alma's birthday in eight years: The one time he had, she had temporarily cut him out of her will. (Stilman, 1997:100) Translating the above text, the translator should notice that the colon has a causative function because it implies the result of the first clause. So the correct translation of this punctuation mark in Persian can be čon or zira. In students’ translations, it was found that 3 students translated it as additive conjunction, 2 of them as concessive conjuction, 15of them did not translate it and just 2 of them wrote the correct translation. The following is a suggested translation of the text in Persian:
4% 14%
82%
Emphatic Concesive Not Translated

ISSN 2039-9340 Mediterranean Journal of Social Sciences Vol. 3 (11) November 2012
31
Text 5. Translation با نگاهی به تقويم، مورتون در ذهنش حک کرد آن بعد از ظهر يک کارت بخرد. او هشت سال بود تولد عمه بزرگ آلما را فراموش نکرده
بود چون آن دفعه ای که فراموشش شده بود او (عمه اش) موقتا او را از وصيت نامه اش خارج کرده بود.
Chart 5 Analysis of students’ translations of text 5 4. Discussion As mentioned earlier, the purpose of this paper has been to show how punctuation marks have pragmatic and metadiscourse functions and to what extent they can be problematic for Iranian translators while translating from English to Persian. As Dafouz-Milne (2008:97 has said:”Metadiscourse refers to those features which writers include to help readers decode the message, share the writer’s views and reflect the particular conventions that are followed in a given culture. . . Metadiscourse thus is not simply a stylistic device, but is dependent on the rhetorical context in which it is used and the pragmatic function it fulfills”. As punctuation is a sub- category of metadiscourse, writers use it to fulfill the stated functions so translators who neglect it seldom are able to convey the intended message of the ST to the TT. As the charts has illustrated, in most cases, the majority of students couldn’t translate the intended punctuation mark or mistranslated it. Just a few of them could correctly reshape the text in Persian. This fact means that they had not been bewared that punctuation marks may carry meaning and be effective in connecting a mutual relationship between the reader and the writer. These findings strongly prove this hypothesis that lack of familiarity and knowledge of English punctuation system hinders Iranian translators to do their work flawlessly. 5. Conclusion According to the goal of this study, three punctuation marks which supposed to be more problematic were selected. In case of the comma, just 9% of students could translate correctly. Considering the different functions of the semicolon, respectively 18%, 18%, and 4% were rightly translated. Finally, the right translation of the colon was just 4%. The focus of attention has been on the performance of the translators in transferring pragmatic and metadiscourse functions. These disappointing results may have some origins. First, the system of punctuation in Persian is inadequate because it does not have well-established rules for the use of specific punctuation marks. Second, no scientific and contrastive study has been done on punctuation system of Persian and English in order to distinguish the differences between the functions of similar marks in Persian and English. Third and final reason can be lack of courses to teach the findings of linguistics which are serviceable in translation.
To amplify the student and working translators’ comprehension of the potential value of punctuation marks, more contrastive studies of the marks from a linguistic point of view and from a translation point of view are needed. It is hoped to fulfill the objectives of this paper and notice the students and expert translators how tiny punctuation marks can be determining in translation.
14%9%
9%68%
Additive Concessive Causitive Not Translated

ISSN 2039-9340 Mediterranean Journal of Social Sciences Vol. 3 (11) November 2012
32
References Baker, M. (1992). In other words: A course book on translation. London: Routledge. Brown,H.D. (2007). Principles of language learning and teaching. New York: Pearson Education. Dafouz-Milne, E. (2008). The pragmatic role of textual and interpersonal metadiscourse markers in the construction and attainment of
persuasion: A cross-linguistic study of newspaper discourse. Journal of Pragmatics, 40, 95-113. Retrieved June 2, 2011, from http:// www.elsevier.com/authored_subject.../journal_of_pragmatics.pdf.
Dale,R. (1991). Exploring the role of punctuation in the signalling of discourse structure. Retrieved June 2, 2011, from http:// citeseerx.ist.psu.edu/viewdoc/download?doi=10.1.1.15.
El-Shiyab,S. (n.d). The pragmatics of punctuation and its problematic nature in translation. Babel, 46(2), 112–124. Retrieved May 19, 2011, from http:// www.benjamins.com/cgi-bin/t_articles.cgi?bookid.
Farrokhi,F. & Ashrafi,S. (2009). Textual metadiscourse resources in research articles. Journal of English Language Teaching and Learning,212, 39-76. Retrieved June 8, 2011, from http:// literature.tabrizu.ac.ir/Files/3Farrokhi.pdf.
Hyland, K. (2005). Metadiscourse: Exploring interaction in writing. London: Continuum. Hyland,K.&Tse,P. (2004). Metadiscourse in academic writing: A reappraisal. Applied Linguistics, 25 (2), 156–177. King,G. (2000). Good punctuation. Glasgow: Harper Collins Publishers. Kirkman,J. (2006). Punctuation matters: Advice on punctuation for scientific and technical writing (4th ed.). Oxon: Routledge. London, J. (1988). To build a fire. In R.M. Grindell, L.R. Marelli, & H. Nadler. American readings (p.176). New York: McGraw-Hill. Mohamadifar,M. (2002). Punctuation guide. Tehran: Diba. Newmark, P. (1981). Approaches to translation. Oxford: Pergamon. Newmark,P.(1988). A textbook of translation. Hertfordshire: Prentice Hall. Stilman,A. (1997). Grammatically correct: The writer's essential guide to punctuation, spelling,style, usage and grammar. Cincinnati:
Writer’s Digest Books. Thoreau, H.D. (1988). Solitude. In R.M. Grindell, L.R. Marelli, & H. Nadler. American readings (p.78). New York: McGraw-Hill. Twain,M. (1988). A young boy’s ambition. In R.M. Grindell, L.R. Marelli, & H. Nadler. American readings (p.3). New York: McGraw-Hill. Yahaghi,M.J.,& Naseh, M.M. (1996). A guide to writing and editing. Mashad: Astan Ghods Press.

ISSN 2039-9340 Mediterranean Journal of Social Sciences Vol. 3 (11) November 2012
33
Mental Imagery: Is It Worth the Endeavour?
Nuttanuch Munsakorn
Bangkok University, Thailand E-mail: [email protected]
Doi:10.5901/mjss.2012.v3n11p33
Abstract: Based on current research and theory in various fields of study, mental imagery is believed as a specific type of memory aid which is most widely and effectively used. Unfortunately, in EFL language class, the learner received very little training in dealing with mental imagery as a mnemonic device. The point this paper wants to emphasize is that knowing the advantages of mental imagery will assist the learners to be able to apply this memory device on their own. To understand this point, a one-group experiment was conducted to point out some of the advantages of using mental imagery of Bangkok University’s students in Thailand. It is hypothesized that the subjects will have better recall after being trained to utilize mental imagery in vocabulary learning. The results shed important light on the fact that the imagery which helps the students to enlarge and improve vocabulary knowledge independently. These results do not only show positive results, but also introduce an additional comment that the tools learners use to learn vocabulary should fit the situation in which the learners find themselves (Nist and Simpson, 2000). Keywords: memory aid, mental imagery, vocabulary learning 1. Introduction We know from many studies and our personal experiences that vocabulary knowledge is taken the most important part of language learning. The reason why vocabulary knowledge is important is that the learners with limited vocabularies usually have difficulty in reading and spend more energy and time in reading activities or tests. As EFL instructors, we have found that memorizing vocabulary is one of EFL learner’s weakest points. Moreover, the learners who memorize without understanding of vocabulary find themselves confused during reading tasks and frustrated of mixing words and definitions. Since there are many words that the learners have difficult time learning and remembering, they need memory tools that help them to improve their memory. For educators, memory is the only evidence that something or anything has been learned (Banikowski et al., 1999). As illustrated by the picture below, the human brain has five functions: memory, problem solving, attention, speed, and flexibility, and memory function accounts for the majority part of the brain. The memory plays a vital role in the people daily activities including in learning. Consequently, scientists and educators are trying to unlock the secrets to enhancing people’s memory (Banikowski et al., 1999).
Figure 1: Brain Function Source: http://www.lumosity.com/app/v4/personalization

ISSN 2039-9340 Mediterranean Journal of Social Sciences Vol. 3 (11) November 2012
34
Mnemonic systems are special techniques or strategies used to improve memory in that they store information in long-term memory and retrieve when needed. As a result, memorization becomes an easy task (Oxford, 1990). Additionally, mental imagery simply regarded as one type of mnemonics is used to remember association. In fact, new words can also be associated with a particularly vivid personal experience of the underlying concept, for example, a learner mentally connecting the word “snow” to a memory of playing in the snow while a child (Schmitt & McCarthy, 2009). Explained continuously, imagery deals with any of the five senses although visualization is one of the more popular for using with memory strategy. Using imagery or visualization to remember the definition of a word can be relatively easy, once you find an image that works for you (Davis, 1988). In the EFL context, it is generally understood by the instructors that mnemonics are a variety of memory aids that help learners memorize vocabulary faster and retain it longer. Thus, to assist the learner incorporating new words that they want to remember and use later, the instructor should expose learners to mnemonics that they can use independently to increase their vocabulary knowledge. Mental imagery is one of mnemonic devices considered as the most effective way to retain what people learned (White, 2011) so that the first thing is to be clear in one’s own mind: how exactly mental imagery works. This question is indeed more complex than it seems. However, this was answered clearly by Thomas (2001), a cognitive scientist, describing concisely that our brain is designed to encode and interpret complex stimuli such as images, colors, structures, sounds, smells, tastes, touch, positions, emotions and language. We use these stimuli to make sophisticated models of the world in which we live in. Our memories store all of these very effectively (Thomas, 2001). This biological fact is more underlined by a memory expert showing the technique for remembering information is to code the information using vivid mental images. When the mental images are vivid, they are easy to recall when we need them (White, 2010). Additionally, Thomas (2001) displayed that mental imagery is commonly defined as a form of experience: quasi-perceptual experience, an experience that subjectively resembles the experience we have when we actually perceive something. This implies that we are unlikely to be able to understand imaginable consciousness unless we understand perceptual consciousness (and perhaps vice-versa). However, it also, implies that imagery is always and necessarily conscious: if something is not consciously experienced, it cannot be mental imagery. As simply explained, the mental images are pictures in our minds which are associated with our own experiences. The explanation makes clear in the context of EFL that learners can apply new words to their own experiences in the form of mental visualization or images, rather than remembering vocabulary meanings through words as they normally do. This view was emphasized by Bush (2007) proving that culture and vocabulary are widely accepted as important elements for language teaching. Many discussions on mental imagery in different areas of study have been appeared over the years. That imagery is the most effective way to retain what people learned was revealed by a memory expert and two-time USA Memory Champion names White (2011). He also confirmed that imagery is the vocabulary learning process. People always associate words with something they are familiar with through their senses (White, 2011). By extension, this view is similar to Rossman (2012), a physician widely known for his pioneering work with guided imagery in the healing arts, insisting that imagery is a way of using our imagination, and it has countless potential benefits. It is in accordance with Campo and Fernandez (1995, cited in Fernandez et al., 2004), professors at Department of Psychology, University of Santiago de Compostela, Spain, finding that both normal and unusual students (students with mental retardation), who used imagery, obtained a higher level of recall than students who did not. Additionally, it has been indicated that mental images improve memory, as not only the word is stored, but also the image of the object is stored (Campos and Fernandez, 2004 cited in Fernandez et al., 2004). Like others, Nist and Simpson (2000), authors and educators at the University of Georgia, USA, said that imagery is the most widely used memory aid and benefits students more than other memory devices. The use of mental imagery as a preferred method for facilitating vocabulary recall was clearly demonstrated by numerous research studies. For example, Paivio et al. (1979) gave evidence that imagery simultaneously facilitated both recall and comprehension. The study focused on 24 university students with some background in French as a second language who used an imagery-based hook mnemonic and rote rehearsal to learn sets of French words. He described that the hook technique involved associating the new items with an over learned series of French stimulus words and images, which could be retrieved during recall. Once again, the experimental evidence of the study of Paivio (1980) pointed out that mental images can be used as learning and memory aids in numerous tasks, including foreign language learning, for example, image program provides referential contexts for the language in the absence of the referent objects and situations themselves. Similarly, Vesely and Gryder (2007) found that the students personally used visual imagery as a tool to learn new vocabulary. One important finding from another research suggested that imagery technique is useful for school children who use mental imagery to facilitate their learning of arithmetic, spelling, and vocabulary (Roeckelein, 2004).

ISSN 2039-9340 Mediterranean Journal of Social Sciences Vol. 3 (11) November 2012
35
Switching the focus from the EFL to ESL context, the study of Uchiyama (2011) showed that character imagery (CI) in the story telling was found to be significantly greater in improving both comprehension and vocabulary development. This study provided evidence that teachers should employ suitable stories told using character imagery in English as second language classroom. In line with Keogh et al. (2009), they stressed in their study that pictorial elucidation helps learners comprehend and remember the meaning of second language idioms. The result also echoed that the meanings of English idioms were clarified to students with reference to the literal use of the expressions. Another line of study showing information-imagery, processing techniques, Latin vocabulary acquisition, and memory retention helps to improve the participant’s performance (Carter et al., 2001). Furthermore, the experimental study of Richard (1975) demonstrated that the mental imagery technique can be used with other techniques considered as the combination between keyword method and mental imagery. The result also echoed that imagery instructions have a significant advantage over sentence-generation instructions when the keyword method is used in Russian and Spanish vocabulary learning class. Based on several experts in various fields of study and educators in language teaching, it is quite evident that mental imagery carries out huge positive results for the language learner. As researchers and EFL classroom instructors, it is essential that we investigate how mental imagery can aid EFL learning. For these reasons, this article focuses on the vocabulary development of students at Bangkok University, Thailand. Thus, the purposes of this paper are to investigate the advantages of the imagery technique in vocabulary learning. Methodologically, the research questions that we asked ourselves were as follows: 1) To what extent did the learners increase their vocabulary knowledge after being trained with imagery technique? 2) How did the learners respond to the use of imagery technique? 2. Methodology Participants and Setting: The total sample consisted of 40 EFL male and female first-year students studying in faculty of Humanities majoring in English at Bangkok University, Thailand. 120 English major students as participant enrolled in the English for Expressing Idea course. The experiment was conducted during a regular class by the researcher and the researcher was also the teacher of these 40 participants. Instruments: Two types of instruments were used in this study. 1) Two vocabulary tests are aimed at checking learner’s vocabulary memorization; one functioning as a pre-test and another as a post test. Each test consisted of 40 vocabulary items selected from the course book: Skills for Success II (Reading and Writing), Oxford University Press, by McVeigh and Bixby (2011). As the pretest and post-test, the teacher constructed a 40-item teacher-made vocabulary tests, and the questions were based on the vocabulary taught in class. The 40 vocabulary questions of the pretest and post-test are different from each other. However, the vocabulary lists were different and the difficulty level is closely similar. Each test lasted 60 minutes and took place during class time. 2) A final self-report questionnaire invited participants to evaluate their views regarding the explicit strategy in-class training in week 5. The final questionnaire was administered in class in week 5 to monitor the effects of mental imagery strategy training over 3 weeks. Treatment Procedure: The following procedures were adopted to meet the objectives of this study. The treatment was carried out in 5 sessions (5 weeks), each took 140 minutes. Session 1, the teacher started teaching new 40 words in traditional way with clarifying the meaning in both English and Thai. Allow the participants 60 minutes to memorize words on their own by using the traditional method: reciting the words a few times and then move on to another word. In this session, there was no explanation or introduction of any vocabulary strategies. Then, allow 60 minutes to the participants to complete the vocabulary test (pre-test). Session 2, a week later, concept, usefulness, and application of mental imagery technique were introduced and guided by the teacher. This week, the teacher introduced mental imagery technique (sometime known as mind’s eyes) by modeling how to create a visual image in the time to recall words and definitions. Then, the teacher shared the image by describing things seen in mind to the participants. The teacher suggested that visual image seen in each participant’s mind could be different depending on individual background knowledge or experience. The participants were suggested how to use a vivid images or extraordinary scenes or events to urge them to memorize words better, as shown in picture 2: A sample of mental imagery. Teacher also encouraged participants to visualize different images or situations involving the other new vocabulary words and to share thoughts about their imagined situations to their classmates. Sessions 3-4, the participants were provided opportunities to employ the mental imagery technique in authentic vocabulary learning tasks on their own. In fact, they could activate their background knowledge.

ISSN 2039-9340 Mediterranean Journal of Social Sciences Vol. 3 (11) November 2012
36
Session 5, the teacher launched a new 40-word list and let the participants 60 minutes to memorize the words and meanings by using mental imagery technique as trained for 2 weeks. Then, the second vocabulary test (post-test) and a 10-statement self-reported questionnaire were given to the participants. 3. Result and Discussion The data obtained from this study were subjected to a number of statistical techniques including the basic descriptive statistics, such as mean (x), standard deviation (SD), and variance as shown in Tables 1, 2, 3 and figure 1. To answer the first research question concerning the student’s performance in using mental imagery technique, the paired t-Test was employed to analyze the data in this study as shown in Tables 1, 2 and figure 1. Table 1. Pre-test and Post-test scores
Participant Number
Pre-test :Tradition Method (40 scores)
Post-test :Mental Imagery (mnemonic) (40 scores)
Participant Number
Pre-test :Traditional Method (40 scores)
Post-test :Mental Imagery (40 scores)
21 36 21. 21 28 18 29 22. 30 38 12 28 23. 11 30 17 34 24. 14 25 28 38 25. 18 28 27 38 26. 22 34 12 28 27. 24 36 25 34 28. 19 36 30 40 29. 33 38 23 38 30. 22 37 29 40 31. 28 40 12 30 32. 25 38 16 32 33. 19 32 18 32 34. 20 30 24 38 35. 20 38 33 40 36. 13 28 19 29 37. 9 15 34 38 38. 29 40 37 36 39. 25 36 36 38 40. 21 33 Total 22.35 33.90
According to table 1, the results of the vocabulary tests indicated that 39 students (97.5%) obtained higher scores in the post-test completed in week 4 than in the previous test. However, only one student (2.5%), student number 19 whose score was dropped when compared to pretest. Notably, 5 students (12.5%), number 9,11,16,31, and 38 achieved the
Picture 2: A sample of mental imagery Source: http://www.wikihow.com/Improve-Your-Memory

ISSN 2039-9340 Mediterranean Journal of Social Sciences Vol. 3 (11) November 2012
37
highest score of 40 in the post-test. This means that mental imagery technique affects students’ vocabulary memorization. Figure 1: Students’ Scores
As illustrated in figure 1, it is noticed that the scores of 39 students were improved after the treatment administration, except only 1 student whose score was dropped. This means that the use of mental imagery technique has noticeably enhanced the student’s vocabulary memorization. Table 2: Mean of the pre-test and post-test of the students
N X S.D. t Sig
Pretest 40
22.35 7.238
-16.377 .000
Posttest 40
33.90 5.315
Additionally, the scores in the vocabulary test indicated that participants obtained statistically higher scores (p<0.05) in test 2 than in test 1, as illustrated in table 2. To put it another way, the means of these scores has considerably and meaningfully increased comparing to the pretest scores before the students were trained to use the mental imagery technique. It was concluded that mental imagery technique assisted the participants to recall word in self-regulated situations. Taken in this light, memorizing words through the use of mental imagery technique could recall the new learned words much better than reciting one word to another. It was concluded that this memory device (mental imagery technique) likely improved the student’s vocabulary memorization. The research reported here supported previous evidence that mental imagery can be used as memory aids in vocabulary learning (Paivio et al., 1979; Paivio, 1980; Vesely and Gryder, 2007; and Roeckelein, 2004). The results of this study are also in line with the studies that advocated the use of mental imagery to improve both comprehension and vocabulary development (Paivio et al., 1979; Keogh, B. et al., 2009; and Uchiyama, 2011). To answer the second research question concerning students’ reflection, a final self-report was employed to analyze the data in this study as reported in Tables 3.
0
5
10
15
20
25
30
35
40
45
1 3 5 7 9 111315171921232527293133353739
scor
es
Participants No.
Tradition method

ISSN 2039-9340 Mediterranean Journal of Social Sciences Vol. 3 (11) November 2012
38
Table 3: The Self-report Questionnaire
Statements: By using mental imagery, …. Satisfaction Unsusceptible Dissatisfaction Mean SD
1. I can memorize words for a long term. 35 (87.5%)
5 (12.5%)
0 (0.0%) 2.88 .335
2. vocabulary size is expanded. 30 (75.0%)
10 (25.0%)
0 (0.0%) 2.75 .439
3. the vocabulary memorizing difficulty is decreased.
29 (72.5%)
11 (27.5%)
0 (0.0%) 2.73 .452
4. my creativity is stimulated. 38 (95.0%)
2 (5.0%)
0 (0.0%) 2.95 .221
5. memorizing new vocabulary is easier. 28 (70.0%)
10 (25.0%)
2 (5.0%) 2.65 .580
6. I can apply this technique not only memorize words, but also comprehend text.
31 (77.5%)
8 (20.0%)
1 (2.5%) 2.75 .494
7. I can associate new learned words with others in visualization.
39 (97.5%)
1 (2.5%)
0 (0.0%) 2.95 .316
8. I think this technique is useful. 40 (100.0%)
0 (0.0%)
0 (0.0%) 3.0 .000
9. I am relaxed in vocabulary learning. 40 (100.0%)
0 (0.0%)
0 (0.0%) 3.0 .000
10. I understand the word meaning faster. 29 (72.5%)
9 (22.5%)
2 (5.0%) 2.68 .572
Total 2.83 .412 Mean levels: 2.34-3.00 = high, 1.67-2.33 = moderate, 1.00-1.66 = low The results of the self-report questionnaire showed that the overall mean score was at a high level (x=2.83, S.D.=0.412). This could explain that the students reflect their positive attitudes toward using the mental imagery technique in vocabulary memorization. The three highest scores of the participants’ opinions fell on statement numbers 9 (I am relaxed in vocabulary learning.), statement umber 8 (I think this technique is useful.), statement number 7 (I can associate new learned words with others in visualization.) and statement number 4 (My creativity is stimulated) respectively. In other words, the participants think that mental imagery has three dominant advantages for recalling vocabulary accordingly: 1) the mental imagery technique helps them to memorize new learned vocabulary, 2) they feel relaxed when they memorize new vocabularies by using mental imagery, 3) the mental imagery can help them to associate the related words with targeted vocabulary in their minds and 4) the student’s creativity is stimulated by mental imagery. The lowest score of the participants’ opinion goes to statement number 5 (Memorizing new vocabulary is easier.). However, some participants rated “dissatisfaction” in memorizing new vocabulary easier (5.0%) and faster (5%), and student expressed that they can apply mental imagery technique to memorize words and comprehend text.
Table 3 also reported that the majority of participants (100%) found the mental imagery technique useful and relaxing. The data thus support the idea that improving memory is not exactly easy if the learners struggle with depression and anxiety. It is consistent with Darke (2008) who found that high level of anxiety reduces both the storage and processing capacity of working memory. Another linkage was proved by Kizibash et al. (2002), who proved that when depression was compounded by anxiety, there was not only an adverse effect on immediate recall and amount of acquisition, but also on the retrieval of newly learned information. In other words, when language learners feel more relaxed and less stressful, their language acquisitions will increase.
Furthermore, it is interesting to find that the participants can associate targeted words with some other related words in their mental visualization. These findings closely appealed the result of Richard (1975) showing that the mental imagery technique can be used as the strategy combinations between keyword method and mental imagery in language learning. The common thread running through these discussions is that the learners should use various kinds of strategies in language learning to be strategic readers. This view is supported by the study of Gu (2006), who believed that the combination of strategies is more effective than single strategy in people's learning.
Additionally, the data showed that the participants’ creativity was stimulated by using mental imagery technique. In the same line with the previous research reviewed by Fareshteh et al. (2011) indicating a significant difference was found between creativity and language learning strategies. It is believed that mental imagery is beneficial for students to use their imagination and creativity for facilitating them in language learning, especially in writing and speaking English, not only memorizing new learned words.

ISSN 2039-9340 Mediterranean Journal of Social Sciences Vol. 3 (11) November 2012
39
It is concluded that mental imagery is useful and has high efficiency in vocabulary memorizing and recalling. Moreover, the result from the questionnaire showed that the students had a very high level opinion on satisfaction on using mental imagery. They also expressed that they feel relaxed when memorizing new words. In addition, their creativity is also stimulated. Based on the conclusions of this research, mental imagery helps the students to enlarge and improve vocabulary knowledge independently. It is strongly confirmed that mental imagery is worth for training in-class as a memory device instead of the rote memorization in vocabulary learning.
References Banikowski et al. (1999). Strategies to enhance memory based on brain-research. http://scboces.org/english/IMC/FocusMemory_
strategies2.pdf Brain Function. http://www.lumosity.com/app/v4/personalization. Bush, M. D. (2007). Facilitating the Integration of Culture and Vocabulary Learning: The categorization and use of pictures in the
classroom. Foreign Language Annals. 40(4). Carter, T. et al., (2001). Latin vocabulary acquisition: An experiment using information-processing techniques of chunking and imagery.
Journal of Instructional Psychology. 28(4). Darke, S. (2008). Anxiety and working memory capacity. Cognition and Emotion. 2(2). Doi.org/10.1080/02699938808408071. Davis, J. (1988). Mental imagery. http://www.howtoimprovememoryhub.com/index.php. Fereshteh, F. and et al. (2011). Relationship between creativity and language learning strategies in adult learners. Conference
Proceedings. The third ICT international conference for language learning. Fernandez, C. I. et al. (1995). The use of mental imagery in pair-associate learning in persons with Down’s Syndrome. The British
Journal of Development Disabilities. 50(98). 3-12. Gu, Y. et al. (2006). Vocabulary learning strategies and language learning outcomes. Language learning. 46(4). 643-679.
Doi:10.1111/j.1467-1770.1996.tb01355.x. Improve your memory. http://www.wikihow.com/Improve-Your-Memory. Keogh, BF. et al (2009). Does pictorial elucidation foster recollection of idioms? Language Teaching Research. 13(4), 367-382. doi:
10.1177/1362168809341505 Kizibash. A. et al. (2002). The effects of depression and anxiety on memory performance. Archives of Clinical Neuropsychology. 17(1).
57-67. Doi.org/10.1010/S0887-6177(00)00101-3. McVeigh, J. (2011). Skills for success: reading and writing. Oxford University Press. Nist, S. and Michael, S. (2000). Developing Vocabulary for College Thinking. Greg Ed. Simpson. Allyn and Bacon.5. Oxford, R.L. (1990). Language learning strategies: What every teacher should know. New York: Newbury Houst Publishers. Paivio, A. et al. (1979). Effects of an imagery mnemonic on second language recall and comprehension. Canadian Journal of
Psychology /Revue canadienne de psychologie.33(1).17-28. doi: 10.1037/h0081699. http://psycnet.apa.org/journals/cep/33/1/17/ Paivio, A. (1980). Imagery as a private audiovisual aid. Instructional Science. 9. 295-309. doi 10.1007/BF00121763 Richard, C. A. (1975). Mnemotechnics in second-language learning. American Psychologist. 30(8). doi: 10.1037/h0077029. Roeckelein, J E. (2004). Imagery in psychology: A reference guide. Westport, CT: Praeger. Rossman, M. (2012). The Benefits of Imagery. Psych Central. http://psychcentral.com/lib/2007/the-benefits-of-imagery/. Schmitt, N.; McCarthy, M. (2009). Vocabulary descriptive, acquisition and pedagogy. UK: Cambridge University Press. Thomas, N. (2001). Mental Imagery. The Stanford Encyclopedia of Philosophy (Winter 2011 Edition), Edward N. Zalta (ed.),
http://plato.stanford.edu/archives/win2011/entries/mental-imagery/>. Uchiyama, T. (2011). Reading versus telling of stories in the development of English vocabulary and comprehensions in young second
language learners. Reading Improvement. 48(4). Vesely, P. and Gryder, N. (2007). Teaching Visual Imagery for Vocabulary Learning. Academic Exchange Quarterly. 11(2). White, R. (2011). Imagery helps you learn a new language. http://www.memorise.org/brain-articles/imagery-helps-learn-language-
001503.html. White, R. (2010). How to improve your memory power. http://www.articlesbase.com/self-improvement-articles/how-to-improve-your-
memory-power-1328871.html.

ISSN 2039-9340 Mediterranean Journal of Social Sciences Vol. 3 (11) November 2012
41
Inclusive Literacy: Overview of the Skill of Writing Development
in an Inclusive Classroom
Latif Ahmad
Senior Special Education Teacher Government Training College for Teachers of Deaf Gulberg, Lahore, Pakistan
Doi:10.5901/mjss.2012.v3n11p41
Abstract: This study reports on an observational study that dwells on conventional views of literacy that how in the most of our literacy class rooms a conventional approach to teaching literacy is dominant, at least to pupils with SLD. Children are being taught words and phonics, how to get information from books and other kinds of text, and lessons we observed looked very similar to those that can be seen in mainstream classrooms all around the country. There is a greater variation for pupils with profound learning disabilities, but even so, many lessons look, in essence similar to the prescription for the Literacy Hour. Keywords: Effective instruction, ,learning difficulties, learning disabilities, teaching, writing, written expression,difficulties faced by those with profound learning disabilities, storytelling ideas 1. Introduction Teachers are one of the key factors in delivering instruction that leads to the development of competent literacy learners. From the earliest studies of effective instruction (Bond & Dykstra, 1967) to more recent studies (Alton-Lee, 2003; Darling Hammond, 2000; Hattie, 2002; Timperley, 2005), teachers have been found to be pivotal in influencing students’ literacy achievement. Some of these teachers may be described as “exemplary teachers”, defined as those teachers who consistently use effective practices and “demonstrate the quality of excellence in every action they perform … both in what they and their students do” (Collins Block & Mangieri, 2003, p. 35). Investigations of exemplary teachers have provided detailed pictures of the curricula, instructional practices, classroom interactions, assessment tasks and classroom environments they have used or created. Researchers from various famous universities (Universities of Birmingham, Manchester Metropolitan and Plymouth) studied the way schools approach teaching literacy to children with severe learning difficulties. Although not the main focus of the study, pupils with profound learning disabilities featured in the information we collected. This article is an attempt to share some of what we found. 2. Literature Review 2.1 Conventional Literacy Most definitions of the word ‘literacy’ contain reference to reading and writing text and the reality in schools (special or mainstream) is that Literacy on the timetable is about learning to read and write or to engage in activities that are eventually meant to lead to reading printed or written text as well as generating written text and writing. The original National Literacy Strategy material (DfEE, 1998) answers its own question of ‘what is literacy?’: with ‘Literacy unites the important skills of reading and writing’. It does go on to include speaking and listing as important, but the rest of the materials are about reading and writing: speaking and listening are hardly mentioned again. This position has changed with the new Primary National Strategy (DfES, 2006), where speaking and listening are much more prominent under the literacy heading, with 4 of the 12 strands relating to 1) speaking, 2) listening and responding, 3) group discussion and interaction and 4) drama. The other 8 all relate specifically to reading and writing, with the emphasis at an early stage on learning through ‘synthetic phonics’, where children need sophisticated knowledge about the segmental nature of spoken language and to be able to match speech-sounds and letters.

ISSN 2039-9340 Mediterranean Journal of Social Sciences Vol. 3 (11) November 2012
42
2.2 Students with Learning Difficulties Students with learning difficulties are generally described as those underachieving in academic areas, most commonly in literacy (Elkins, 2007; van Kraayenoord, 2006). They are students who often need instructional support or extra assistance. While there are authors who suggest that learning difficulties are caused by neurological deficits, in Australia most researchers in the field argue that problems in literacy can be the result of many, often interacting, variables, such as limited opportunities and exposure to literacy, the quality of instruction and lack of motivation (see van Kraayenoord, 2008).
In Newcomer and Barenbaum’s (1991) meta-analysis, the written texts of students with learning disabilities were characterised by a “paucity of ideas that prevents them from developing or embellishing their ideas” (p. 583), and a lack of cohesiveness.
Specific problems were identified with a lack of planning and ongoing revision which would enable prevention and recognition of inconsistencies and organisational errors.
The meta-analysis also identified that these students had difficulties with spelling, punctuation, word sequencing and fluency (that is, the number of words in a story).
Other research has shown that while skilled writers pay attention to planning, revising, organising and evaluating (Graham & Harris, 2003), struggling writers are known to have difficulty with mastering these process elements of writing (Graham & Harris, 1997; Graham, Harris, Finz-Chorzempa, & MacArthur, 2003; Graham, MacArthur & Schwartz, 1995; Hillocks, 1984). Sandler, Watson, Footo, Levine, Coleman and Hooper (1992) found that students with writing disorders also had difficulties with the rate at which they produced text, that is, they were considerably slower than their peers and their written language lacked sophistication.
With respect to motivation, students with learning difficulties have low motivation and maladaptive beliefs about the causes of success and failure (Sexton, Harris & Graham, 1998). They often have lower academic self-concepts than their peers, and this is manifested in areas such as reading and writing (Chapman, 1988; Haager & Vaughn, 1997; Hay, 1996). In the WriteIdeas Project workshop and written materials for teachers, we argued that knowing students as learners is important to informing instruction and differentiating it. We suggested that the teachers’ awareness of individual student characteristics, for example in relationship to their cognitive skills, rate of learning, motivation and engagement, would allow them to be more responsive to individual students’ needs.
Teachers could use the information to maximize the achievement of the learning outcomes related to writing and make adaptations to instruction and assessment of writing as necessary. In addition, we argued that teacher awareness of the students as adolescent, middle-school learners was important.
I have dwelt on conventional views of literacy because when we went to schools for pupils with SLD/ PMLD, we found that most of them were taking a conventional approach to teaching literacy, at least to pupils with SLD. Children were being taught words and phonics, how to get information from books and other kinds of text, and lessons we observed looked very similar to those that can be seen in mainstream classrooms all round the country. There was a greater variation for pupils with profound learning disabilities, but even so, many lessons looked, in essence similar to the prescription for the Literacy Hour. 3. Objectives of the study The study was conducted to enable Special Education Teachers to reflect on aspects of teaching and learning in relation to pupils with profound (and multiple) learning disabilities. So that they should be able to reflect on their literacy sessions and decide how they might be developed even more to be an even better story teller for pupils with PMLD and consequently they might enable pupils with PMLD to participate effectively in inclusive class rooms lessons. 4. Method The study took about 18 months to complete and during that time, the researcher carried out four different activities: desk-based research using books, journals, magazines and web-sites observations in classrooms, in both literacy lessons and others lessons where literacy skills might be being used interviews of the teachers who taught those lessons focus groups of teachers to discuss our results

ISSN 2039-9340 Mediterranean Journal of Social Sciences Vol. 3 (11) November 2012
43
5. Observations Typically, a class of children with severe and profound learning disabilities were seen sitting in a semi-circle around a teacher holding a big book. The book was read or a story told using the pictures and staff engaged the pupils in the story through pictures and objects. Following the story, again typically, the class divided into smaller groups for work related in some way to the book but pitched at a level that was right for the individuals in that group. Usually, the whole class met again for a plenary session at the close of the lesson where pupils’ work was recalled and celebrated.
The work the researcher observed that was specifically designed for pupils with profound learning disabilities was often sensory in nature. It was usually centred on a story or a book, but access to the activity was often through objects to touch and activate or odours to smell, things to look at and listen to or even food to taste. The researcher saw stories being told through a range of sensory experiences.
There were also examples of what might be called ‘pure communication’, rather than anything specifically related to conventional literacy or pre-literacy skills. These were variations on Intensive Interaction (Nind and Hewett, 2000) and usually began from the child him or herself, rather than from a book or a story. The intention appeared to be to engage the child and achieve even minimal social interaction using little games associated with typically developing infants and caregivers. One game observed involved the adult having a conversation of ‘ahs’, following the lead of the child’s vocalisations. It is not known whether the adult thought that what was happening was part of literacy but it was happening in a Literacy lesson. 6. Inclusive Literacy One of the central concepts that developed through the study was the idea of ‘inclusive literacy’. Conventional literacy is clearly not open to children (or adults) with profound learning disabilities as they are not going to learn to read and write. However, if the researcher conceives of literacy as ‘inclusive’, there may be ways in which even the most profoundly disabled can take part. So what did the researcher means by ‘inclusive literacy’? The researcher identified a range of activities (with the help of literature available) for learners with SLD that the researcher wants to argue could legitimately be identified as ‘inclusive literacy’ even if there was no use of text at all, and many of these can include those with profound learning disabilities. The researcher identified: Objects of reference Life quilts and life history boxes Personal storytelling Sensory stories & multimedia stories Cause and effect software Photo albums and scrap books Picture books & stories Graphic facilitation Reading icons and symbols Talking books Early conventional reading skills Simple conventional books Drama and role play Simple software for computer Television and films Navigating websites (eg: Eastenders) Creating websites Still photography to create books Film-making The list includes some activities that definitely do not fit into conventional literacy relating to letters, words and text. Some can be seen as ‘new literacies’ belonging to the media age of television, ipods and computers (Lankshear and Knobel, 2003) and others are seen as, perhaps simplifications of, or substitutions for, the whole business of traditional text-based literacy, such as objects of reference, life quilts and sensory stories.

ISSN 2039-9340 Mediterranean Journal of Social Sciences Vol. 3 (11) November 2012
44
6.1 Objects of Reference The first few in the list seem to have the greatest potential for learners with profound learning disabilities. Objects of reference (Ockelford, 2002), for example could be seen as the first real step into learning about symbols, which in conventional literacy might lead to more and more abstract symbols and eventually into letters, words and text. In the absence of this kind of progression, learning to use objects of reference can be seen as an early and important form of literacy in its own right for those learners who are unable to progress further down the conventional literacy or even the new literacies route. 6.2 Life Quilts and Life Boxes Life quilts (Grove, 1996) or life history boxes can be seen as akin to books about a person. A life quilt is literally a quilt made from sewing together pieces of material from the clothes, curtains, cushions, duvet covers that have meaning for that person from early childhood through to adulthood. There can also be objects sewn into the quilt: anything that might spark familiarity. If this started at an early age and continually added to and enjoyed, it can become an important ‘book’. Alternatively or in addition, a box can be used to collect important objects such as slippers, a personal cup, a toy or birthday candles. These can be used regularly to ‘tell the story’ of the person’s life. 6.3 Sensory Stories and Multimedia Activities There are many examples of sensory stories in schools and colleges: published and home-made, although perhaps fewer multimedia stories. If you haven’t already found Pete Well’s disgusting stories, you might try them especially with teenagers or young adults. The following links can help in this regard: http://www.portland-school.co.uk/Petes-stuff/PetesStuff.htm, www.priorywoods.middlesbrough.sch.uk/ and http://atschool.eduweb.co.uk/meldreth/textandinfo/Powerp/Media2.html. 6.4 Pictures and Moving Pictures The activities on our list that are related to pictures (still or moving) may or may not be meaningful to an individual with profound learning disabilities. Learning to understand and ‘read’ pictures is an important skill for learners with SLD and the first rungs of that ladder may be relevant to someone with profound disabilities, especially recognising themselves, their family and friends on video. For some people, attaching the camera to the television and watching themselves in real time can be motivating and interesting. 6.5 Film-making and Drama There are some other activities on our list above within which learners with profound disabilities could be included, for example film making or drama. Nicola Grove and Keith Park have many suggestions for how this can be achieved and if you haven’t come across their work, you might start with their book ‘Odyssey Now’ (Grove and Park, 1996) or ‘Macbeth in Mind’ (Grove and Park, 2001) or find Keith’s many articles published in SLD Experience. Keith’s work can also be seen on Teacher’s TV online in a programme called ‘Special Schools: Access the Curriculum http://www.teachers.tv/video/1403. 7. Conclusions From our research we were able to see examples of activities that we called ‘inclusive literacy’. We recognise, as did the teachers in the study, that literacy for learners who don’t learn to read and write is not conventional. It includes a wider view of communication than might typically be seen as literacy, as well as some of the new literacies that are more often associated with creative, performance or media studies or information and communications technology. For the most profoundly disabled learners, to be inclusive, literacy must also embrace the use of objects as a kind of text and perhaps even see someone learning to anticipate a favourite activity as learning to ‘read’ what is happening. I don’t want to stretch literacy to a ridiculous degree but there is definitely more to it than the conventional reading and writing of text. Hopefully, the inclusive literacy activities that have been briefly discussed in this article will inspire you to be as creative as you can in providing experiences for learners with profound learning disabilities. Although joining in a

ISSN 2039-9340 Mediterranean Journal of Social Sciences Vol. 3 (11) November 2012
45
conventional literacy hour with more able peers is one activity, there are lots more that appear to us as legitimate responses to teaching literacy to learners who are not going to learn to read and write. Have fun in Literacy!
References Bag Books website http://www.bagbooks.org/index.html Caldwell, P. (2007) From Isolation to Intimacy: Making Friends Without Words London: Jessica Kingsley Corke, M. (2002) Approaches to Communication Through Music London; David Fulton Coupe O’Kane, J. and Goldbart, J. (1998) Communication Before Speech London; David FultonDfES (1998) The National Literacy Strategy London: DfES DfES (2006) The Primary National Strategy http://www.standards.dfes.gov.uk/primaryframeworks/ (accessed 25.10.06) Fyfe, C. (2001) Gulliver’s Travels: A Multisensory Approach London: Bag Books Grove, N. (1996) Life quilts, Talking Sense 42, 2 (http://www.sense.org.uk/publications/allpubs/magazine/tsarticles/1996/lifequilts.htm)
(accessed 26.10.06) Grove, N. and Park, K. (1996) Odyssey Now London: Jessica Kingsley Grove, N. etc (2000) See What I Mean? Guidelines to Aid Understanding of Communication by People with Severe and Profound
Learning Disabilities Kidderminster: BILD Grove, N. and Park, K. (2001) Social Cognition through Drama and Literature for People with Learning Disabilities: Macbeth in Mind
London: Jessica Kingsley Grove, N. (2005) Ways into Literature London: David Fulton Lacey, P. and Ouvry, C. (1998) People with Profound and Multiple Learning Disabilities London: David Fulton Lacey, P. (2006) Inclusive Literacy PMLD-Link 18, 3, 11-13 Lankshear, C. and Knobel, M. (2003) New Literacies: Changing Knowledge and Classroom Learning Maidenhead: Open University
Press Nind, M. and Hewett, D. (2000) A Practical Guide to Intensive Interaction Kidderminster: BILD Ockleford, A. (2002) Objects of Reference London: RNIB


ISSN 2039-9340 Mediterranean Journal of Social Sciences Vol. 3 (11) November 2012
47
A Monthly Analysis of Road Traffic Accident in Selected Local
Government Areas of Lagos State, Nigeria
Atubi, Augustus .O. (Ph.D.)
Associate Professor Department of Geography and Regional Planning
Delta State University, Abraka E-mail: [email protected] Phone No.: 08037450078
Doi: 10.5901/mjss.2012.v3n11p47
Abstract: This study examined monthly analysis of road traffic accidents in selected Local Government Areas of Lagos State, Nigeria and to suggest preventive and corrective safety measures towards reducing road traffic accidents in the study area. Using accident records from the Nigerian Police Force and Federal Road Safety Commission for the thirty two (32) years period from 1970 – 2001, this study seeks to reveal the traffic situation and accident pattern on monthly basis in 9 Local Government Areas of Lagos State, Nigeria. Further observation revealed that the most accident prone Local Government Areas (LGAs) are Lagos Island, Lagos Mainland, Ajeromi/Ifelodun, Ikeja, Oshodi/Isolo, Apapa, Eti-Osa, Kosote and Ojo. Thus, these are the LGAs that deserve urgent traffic accident mitigation attention e.g. intensified policing by the road safety corps. Again, for various reasons, it was also observed that most of the accidents in Nigeria occur in the months of June, July, September, October, November and December. June, July and September are the peak rainy months and more road accidents occur in rainy months because wet road conditions affect many drivers’ ability to see and be seen. Based on the findings, recommendations were proffered on how to reduce the phenomenon of road traffic accidents in Lagos State, Nigeria. Keywords: Analysis; road; traffic accident; monthly; selected LGAs; Lagos State 1. Introduction As in other developing countries, road traffic accidents in Nigeria are one of the most serious problems in need of pragmatic solution. Yet this problem has been difficult to address probably because of the country’s level of development. Nigeria is said to have the highest road traffic accident rates in Africa and the second in the world (Akpogomeh, 1998; Obinna, 2007, P. 35, and Atubi 2012e). According to one study, the proportion of deaths from road traffic accidents in Nigeria increased from 38.2 percent to 60.2 percent in the ten years from 1991 to 2001 (Obinna, 2007). Thus, Nigeria’s annual 8,000 to 10,000 accident deaths between 1980 and 2003 were a major personal and traffic safety problem as well as a terrible waste of human resources for the country. In terms of the personal safety problem, Nigeria and indeed Lagos State is a high risk region with an average of 32 traffic deaths per 1,000 people (Filani et al, 2007; Atubi, 2012c). This is very high compared with the United States’ 1.6 traffic deaths per 1,000 populations and with the United Kingdom’s 1.4 deaths per 1,000 people (Trinca et al, 1988). In terms of traffic safety, there are on average 23 accidents per 1,000 vehicles in Nigeria (i.e. 230 per 10,000 vehicles) far in excess of the accident rates in the USA (2.7 accidents per 10,000 vehicles) and the UK (3.2 accidents per 10,000 vehicles). According to data from the Nigerian Federal Road Safety Commission, the country has the highest rate of death from motor accidents in Africa; leading 43 other nations in the number of deaths per 10,000 vehicles crashes (FRSC, 2006, Obinna, 2007, P. 35). Nigeria is followed by Ethiopia, Malawi and Ghana with 219,183 and 178 deaths per 10,000 vehicles respectively (Daramola, 2004). The number of reported cases of fatal road traffic accidents in Nigeria has shown an increasing trend from 12,212 cases of accidents in 1995 to 13,913 in 1996 and 15,418 in 2004, indicating an increase of 13.9% in fatal road accidents from 1995 to 1996 (Central Bank of Nigeria, 1997). Fatal road accident figures across the federation of Nigeria rose sharply in 1992 resulting in 22,992 deaths (CBN, 1994). According to the Annual abstract of statistics (2008), between 2003 and 2007, a total of 225,891 accident cases were reported by the Nigeria Police Force, out of which 29,490 were fatal, 39,065 were services cases, 23,380 were minor cases. Traffic crashes also impact on the economy of developing countries at an estimated cost of 1.2% of a country’s GNP per annum, as a result of morbidity, mortality and property – related costs (Fourracre and Jacobs, 1976; Jacobs and Sayer, 1983; WHO, 1989, Jadan, 1989a and 1990; Downing et al, 1991). Causes of motor vehicle crashes are

ISSN 2039-9340 Mediterranean Journal of Social Sciences Vol. 3 (11) November 2012
48
multifactorial and involve the interaction of a number of pre-crash factors that include people, vehicles and the road environment (Haddon, 1980; AMA, 1983; Stanfield et al, 1992; Robertson, 1992). Human error is estimated to account for between 64 and 95% of all causes of traffic crashes in developing countries (Atubi, 2009b). A high prevalence of old vehicles that often carry many more people than they are designed to carry, lack of safety belts and helmet use, poor road design and maintenance and the traffic mix on roads are other factors that contribute to the high rate of fatalities in less developed countries. In Nigeria, road traffic accident situation over the last three decades has been particularly disturbing. In 1976, there were 53,897 road traffic accidents resulting in 7,717 deaths. Although in 1981, the magnitude reduced to 5,114 accidents, but the fatality increased to 10,236 which means that there was an average of 96 accidents and situation in subsequent years has not been any better. The number of people killed in road accidents between 1990 and 2005 rose from 28,253 and the fatality rate remains consistently high (Atubi, 2009c). International comparison indicates that the chance of a vehicle killing someone in Nigeria is 47 times higher than in Britain. The proportion of fatalities to injuries reported is also very high. For example, while Czech Republic has only one death in 197 accidents, France one death in 175, South Africa, one death in 47 accidents, Nigeria has one death in 2.65 accidents (Atubi, 2010b). Road traffic accidents’ statistics in Nigeria reveal a serious and growing problem with absolute fatality rate and casualty figure rising rapidly. In majority of developing countries, accident occurrence and related deaths are relative to either population or number of vehicles. Ironically, in Nigeria, studies have indicate that better facilities in terms of good quality and standardized roads have been accompanied by increasing number of accidents (Onakomaiya, 1988; Gbadamosi, 2002; Atubi and Onokala, 2009). This is totally contrary to the trends in countries were even the level of sophisticated road network and volume of vehicular traffic are much higher (Atubi, 2010a). In an effort to check this alarming trend, the Nigerian Federal Government inaugurated the Federal Road Safety Commission (FRSC) in 1988. The commission’s functions include among others, the regular patrol of the highways with the aim of checking reckless driving. But for this function to be performed effectively, the FRSC and the police have to be familiar with the temporal distribution of road traffic accidents in the country i.e. they must know where road traffic accidents are most frequent. For instance, in our study area of Lagos State, the most accident prone Local Government Areas (LGAs) are Lagos Island, Lagos Mainland, Ajeromi/Ifelodun, Ikeja, Oshodi/Isolo, Apapa, Efi-Osa, Kosofe and Ojo. Thus, these are the LGAs that deserve urgent traffic accident mitigation attention e.g. intensified policing by the road safety corps. 1.1 Study Area Lagos State is a suitable case study because it hosts metropolitan Lagos, Nigeria’s major traffic centre, fastest growing city, and most heavily motorized urban area in the country. Consequently, the state has one of the highest accident and casualty rates in the country (Federal Republic of Nigeria, 1997, p. 6). Moreover, the traffic situation in Lagos State is bad because of the absence of effective planning, vehicle-misuse, poor management, inadequate street parking, traffic congestion, delays and accidents among other contributory factors.
Lagos State is situated in the South Western corner of Nigeria. This elongated state spans the Guinea Atlantic coast for over 180km, from the Republic of Benin on the west to its boundary with Ogun State in the east (figure 1), while Lagos State is the smallest in Nigeria, it has over 5 percent (i.e. 9,013,534) of the country’s estimated 140 million people (National Population Census, 2006). Its rate of population growth has been in excess of 9 percent per annum, or 25,000 per month or 833 per day or 34 per hours in the last decade (Lagos urban Transport Project, 2002). This population increase has been accompanied by a corresponding increase in motor vehicles and traffic accidents. However, accident rates in Lagos State are still very much on the high side compared to other states in the federation. But, fatalities and non-survival indices for the state are on the decline. This is attributable to its high level of traffic congestion (which reduces the probability of the high fatality accidents resulting from over speeding) and accessibility to good post – crash medical care in the Lagos metropolitan area.

ISSN 2039-9340 Mediterranean Journal of Social Sciences Vol. 3 (11) November 2012
49
Fig. 1: Map of Lagos State showing the accident prone local government areas
Source: Atubi, A.O. 2001 revalidated 2011) 2 Research methodology The data used in this study were derived from secondary source. The secondary data includes records of road traffic accidents, total number of deaths, total number of injuries, fatal, serious and minor cases of road traffic accidents in Lagos state for a period of 32 years (i.e. 1970-2001). Also, information on monthly variation of road traffic accidents were collected from Lagos State Police command, Ikeja, and the Federal Road Safety Commission (FRSC), Lagos. The data on monthly variations of accident cases were presented in tables and analysed with the aid of time series and averaging models. 3 Discussion of results/findings Tables 1 to 9 and figures 2 to 19 shows the monthly variation of road traffic accidents in nine (9) selected Local Government Areas of Lagos State. The month of July recorded the highest number of accidents. This month alone accounted for about 27 percent of all the road traffic accidents recorded in the selected Local Government Areas of Lagos State. Next were February, 23 percent, April, 22 percent and December, 22 percent as well. These four months alone thus account for 94 percent of all the accidents in Lagos State over the thirty two year period. This no doubt suggests that these months are very critical to road safety in the area (See Tables 1 to 9). Table 1: Monthly Variation in the Road Traffic Accidents in Lagos Island Local Government Area from 1970 to 2001
S/N Month Minor Cases Serious cases Fatal cases Total % Casualty 1 January 364 296 235 895 59 2 February 477 444 276 1197 60 3 March 411 306 187 904 55 4 April 377 347 244 968 61 5 May 267 324 239 830 68 6 June 396 295 214 905 56 7 July 582 533 275 1390 58 8 August 257 280 182 719 64 9 September 327 222 223 772 58
10 October 410 318 222 950 57 11 November 406 312 256 974 58 12 December 399 304 259 962 59
Total 4673 3981 2812 11466 6793 % 40.8% 34.7% 24.5% 100% Average 389 332 234 956
Source: Computed from police records, (2004) Note: A CASUALTY road accident is one in which death or injuries were recorded (Transport Canada, 1990)
Ikeja Ikorodu
Ojo
Amuwo Odofin
Epe
Ibeju/Lekki Lagos Lagoon
Badagry
Oshodi/Isolo Lagos Mainland
Eti-Osa Lagos Island Apapa
Mushin
Alimosho
Som
olu
Koso
fe
Surulere
Agege Ifako Ijaye
OGUN STATE
REPU
BLIC
O
F B
ENIN
Ajeromi Ifelodun
G U L F O F B E N I N
OGUN STATE
Water body
L.G.A. H/Q
Int’l Boundary State Boundary L.G.A. Boundary
N
0 10 20 30km
Key
Highest Accident L.G.A.
Water body
L.G.A. H/Q
Int’l Boundary State Boundary L.G.A. Boundary
N
Key
Highest Accident L.G.A.

ISSN 2039-9340 Mediterranean Journal of Social Sciences Vol. 3 (11) November 2012
50
Table 2. Monthly Variation in the Road Traffic Accidents in Ajeromi/Ifelodun Local Government Area from 1970 to 2001
S/N Month Minor Cases Serious cases Fatal cases Total % Casualty 1 January 963 294 213 1470 34 2 February 445 383 231 1059 58 3 March 443 286 188 917 52 4 April 375 221 213 809 54 5 May 379 228 194 801 53 6 June 393 283 189 865 55 7 July 591 475 278 1344 56 8 August 245 200 181 626 61 9 September 236 223 207 666 65
10 October 314 278 201 793 60 11 November 294 292 228 814 64 12 December 421 210 245 876 52
Total 5099 3373 2568 11040 5941 % 46.2% 30.6% 23.3% 100% Average 425 281 214 920
Source: Computed from police records, (2004) Table 3: Monthly Variation in the Road Traffic Accidents in Ikeja Local Government Area from 1970 to 2001
Source: Computed from police records, (2004) Table 4: Monthly Variation in the Road Traffic Accidents in Lagos Mainland Local Government Area from 1970 to 2001
S/N Month Minor Cases Serious cases Fatal cases Total % Casualty 1 January 383 317 134 834 54 2 February 463 334 149 946 51 3 March 399 357 126 882 55 4 April 415 359 128 902 54 5 May 390 347 126 863 55 6 June 411 346 127 884 54
S/N Month Minor Cases Serious cases Fatal cases Total % Casualty 1 January 407 291 326 1024 56 2 February 440 384 263 1087 60 3 March 401 322 202 925 57 4 April 353 353 222 928 62 5 May 366 340 210 916 60 6 June 502 332 195 1029 51 7 July 552 560 303 1415 61 8 August 312 294 209 815 62 9 September 361 252 216 829 56
10 October 399 202 232 833 52 11 November 431 311 234 976 56 12 December 441 347 269 1057 58
Total 4965 3988 2881 11834 % 42.3% 34.0% 23.7% 100.0% Average 414 332 233

ISSN 2039-9340 Mediterranean Journal of Social Sciences Vol. 3 (11) November 2012
51
7 July 609 476 194 1279 52 8 August 337 283 104 724 50 9 September 287 299 140 726 60
10 October 306 316 135 757 60 11 November 349 328 135 812 57 12 December 420 380 154 954 56
Total 4769 4142 1652 10563 5744 % 45.0% 40.0% 15.0% 100.0% Average 397 341 138
Source: Computed from police records, (2004) Table 5: Monthly Variation in the Road Traffic Accidents in Apapa Local Government Area from 1970 to 2001
S/N Month Minor Cases Serious cases Fatal cases Total % Casualty 1 January 218 189 62 469 54 2 February 274 209 75 558 51 3 March 22 211 58 291 54 4 April 221 228 57 506 56 5 May 227 208 57 492 54 6 June 215 183 62 460 53 7 July 325 301 92 718 55 8 August 149 129 49 327 54 9 September 157 145 59 361 57
10 October 226 209 67 502 55 11 November 205 181 64 450 54 12 December 218 207 74 499 56
Total 2657 2400 776 5833 3176 % 45.6% 41.1% 13.3% 100% Average 221 200 65
Source: Computed from police records, (2004) Table 6: Monthly Variation in the Road Traffic Accidents in Oshodi/Isolo Local Government Area from 1970 to 2001
S/N Month Minor Cases Serious cases Fatal cases Total % Casualty 1 January 193 175 78 446 57 2 February 241 223 93 557 57 3 March 177 207 72 456 61 4 April 192 162 70 424 55 5 May 200 196 68 464 57 6 June 185 195 79 459 60 7 July 292 314 99 705 59 8 August 171 178 66 415 59 9 September 130 140 77 347 63
10 October 183 179 79 441 59 11 November 172 158 71 401 57 12 December 192 195 88 475 60
Total 2328 2322 940 5590 3262 % 41.6% 41.5% 170.0% 100% Average 194 194 78
Source: Computed from police records, (2004)

ISSN 2039-9340 Mediterranean Journal of Social Sciences Vol. 3 (11) November 2012
52
Table 7: Monthly Variation in the Road Traffic Accidents in Ojo Local Government Area from 1970 to 2001
S/N Month Minor Cases Serious cases Fatal cases Total % Casualty 1 January 147 166 72 385 62 2 February 240 212 95 547 56 3 March 196 234 67 497 61 4 April 199 195 78 472 58 5 May 177 178 64 419 58 6 June 164 180 78 422 61 7 July 277 302 94 673 59 8 August 128 146 63 337 62 9 September 120 133 72 325 63
10 October 191 134 76 401 52 11 November 144 182 70 396 64 12 December 171 193 81 445 62
Total 2154 2255 910 5319 3165 % 40.5% 42.4% 17.1% 100% Average 180 188 76
Source: Computed from police records, (2004) Table 8: Monthly Variation in the Road Traffic Accidents in Eti-Osa Local Government Area from 1970 to 2001
S/N Month Minor Cases Serious cases Fatal cases Total % Casualty 1 January 161 143 78 382 58 2 February 225 195 92 512 56 3 March 207 197 75 479 57 4 April 191 204 66 461 59 5 May 184 202 66 452 59 6 June 180 194 74 448 60 7 July 294 275 93 662 56 8 August 139 115 57 311 55 9 September 127 132 70 329 61
10 October 189 212 73 474 60 11 November 165 109 66 340 51 12 December 194 160 81 435 55
Total 2256 2138 891 5285 3029 % 42.7% 40.5% 16.8% 100% Average 188 178 74
Source: Computed from police records, (2004) Table 9: Monthly Variation in the Road Traffic Accidents in Kosofe Local Government Area from 1970 to 2001
S/N Month Minor Cases Serious cases Fatal cases Total % Casualty 1 January 192 177 87 456 58 2 February 227 223 94 544 58 3 March 214 200 85 499 57 4 April 219 206 73 498 56 5 May 192 188 75 455 58 6 June 200 197 72 469 57 7 July 301 282 101 684 56

ISSN 2039-9340 Mediterranean Journal of Social Sciences Vol. 3 (11) November 2012
53
8 August 162 152 69 383 58 9 September 158 110 80 348 55
10 October 179 129 81 389 54 11 November 185 135 76 396 53 12 December 196 155 91 442 56
Total 2425 2154 984 5563 3138 % 43.6% 38.7% 17.7% 100% Average 202 82 82
Source: Computed from police records, (2004) It is pertinent to note that these months are rainy months. The study area experiences about 9 months of rainfall in a year, starting effectively from March and lasting through to November sometimes with a short relative dryness in August. It has been observed by Shell Petroleum Development Company (SPDC) (1998) that there is some relationship between wet climatic conditions and road traffic accidents. Road traffic accidents are not totally inevitable and so will not generate much cause for concern if injuries and/ or loss of life are not involved. Consequently, the average monthly variation so far examined may not be enough for a conclusion on the most unsafe months. In other words, the total number of accidents recorded is an indicator of how unsafe a month or place is could be misleading. For instance, a month with few road traffic accident cases could have had all the accidents resulting in death (fatal) or serious bodily harm (serious accidents). While a month with a large number of road accidents cases may have had almost all of them as minor cases (i.e. neither death nor bodily harm was recorded). It is thus imperative that the casualty index will be a better indicator of the level of risk a motorist or passenger is exposed to in a place or time period. The first observation from figure 2 is that all months of the year recorded at least a 50 percent casualty rate. In other words, any accident in any of the months had a 50 percent chance or more of resulting in bodily harm/loss of life or lives. These percentages give indications of one’s chances of being involved in a fatal/serious accident. Consequently, the chances of being involved in a fatal or serious accident was 68 percent in the month of May, 64 percent in August, 61 percent in April, 60 percent in February, 59 percent in December and January, and 58 percent in July, September, and November. These are very high chances, it should be noted that in both cases (total and casualty cases) the trend peaked in the month of July (Fig. 3). Consequently the month emerges as the most unsafe. It is also observed that although the ‘ember’ months (September, October, November and December) recorded relatively low figures when total road traffic accidents are concerned, these months rated very high when casualty cases are concerned and thus rate among the most unsafe months (See Figs. 2 and 3). Fig. 2. Monthly Variation of total and casualty road traffic accidents in Lagos Island Local Government Area from 1970-2001
Source: Data Collected

ISSN 2039-9340 Mediterranean Journal of Social Sciences Vol. 3 (11) November 2012
54
Fig. 3: Monthly Trend of road traffic accidents in Lagos Island Local Government Area from 1970-2001
The high casualty rate for December in particular and the ‘ember’ months in general could be explained by the increased movement of persons which characterises this period of festivities. All over the world this period is known as the Christmas and New Year season. In this part of the world, this season usually witnesses increased vehicular movement within and between cities. Moreover, motorists are likely to be more tensed and alcohol impaired drivers are very likely to be among the traffic. The chances of being involved in a fatal or serious accident was 65 percent in the month of September, 64 percent in November, 61 percent in August and 58 percent in February for Ajeromi/Ifelodun Local Government Area. It was also observed that all months of the year (except January) recorded at least a 50 percent casualty rate. It should also be noted that in both cases (total and casualty cases) the trends peaked in the month of July (Figs. 4 and 5). Consequently, the month emerges as the most unsafe. Fig. 4. Monthly Variation of total and casualty road traffic accidents in Ajeromi/Ifelodun Local Government Area from 1970-2001
Source: Data Collected

ISSN 2039-9340 Mediterranean Journal of Social Sciences Vol. 3 (11) November 2012
55
Fig. 5. Monthly Trend of road traffic accidents in Ajeromi/Ifelodun Local Government Area from 1970-2001
The third observation from figures 6 and 7 is that all months of the year recorded at least a 50 percent casualty rate. In other words, any accident in any of the months had a 50 percent chance or more of resulting in bodily harm/loss of life or lives. Consequently, the chances of being involved in a fatal or serious accident was 62 percent in the months of April and August, 61 percent in the month of July, 60 percent in the months of February and May for Ikeja Local Government Area. Fig. 6. Monthly Variation of total and casualty road traffic accidents in Ikeja Local Government Area from 1970-2001
Source: Data Collected

ISSN 2039-9340 Mediterranean Journal of Social Sciences Vol. 3 (11) November 2012
56
Fig. 7: Monthly Trend of road traffic accidents in Ikeja Local Government Area from 1970-2001
The forth observation from figures 8 and 9 is that all months of the year recorded at least a 50 percent casualty rate. In other words, any accident in any of the months had a 50 percent chance or more of resulting in bodily harm/loss of life or lives. Consequently, the chances of being involved in a fatal or serious accident was 60 percent in the months of September and October, 57 percent in the month of November, 56 percent in the month of December and 55 percent in the months of March and May for Lagos Mainland Local Government Area. Fig. 8. Monthly Variation of total and casualty road traffic accidents in Lagos Mainland Local Government Area from 1970-2001
Source: Data Collected

ISSN 2039-9340 Mediterranean Journal of Social Sciences Vol. 3 (11) November 2012
57
Fig. 9: Monthly Trend of road traffic accidents in Lagos Mainland Local Government Area from 1970-2001
While the chances of being involved in a fatal or serious accident was 57 percent in the month of September, 56 percent in the month of April and December, 55 percent in the months of July and October for Apapa Local Government Area. It is observed that in both cases (total and casualty cases) the trends peaked in the month of July (figures 10 and 11). Consequently, the month emerges as the most unsafe. It is also observed that although the months of (September, October, November and December) recorded relatively low figures when total road traffic accidents are concerned, these months rated very high when casualty cases are concerned and thus rate among the most unsafe months. Fig. 10: Monthly Variation of total and casualty road traffic accidents in Apapa Local Government Area from 1970-2001
Source: Data Collected

ISSN 2039-9340 Mediterranean Journal of Social Sciences Vol. 3 (11) November 2012
58
Fig. 11: Monthly Trend of road traffic accidents in Apapa Local Government Area from 1970-2001
Another observation from figures 12 and 13 is that all months of the year recorded at least a 50 percent casualty rate. Consequently, the chances of being involved in a fatal or serious accident was 63 percent in the month of September, 61 percent in the month of March, 60 percent in the months of June and December, 59 percent in the months of July, August and October for Oshodi/Isolo Local Government Area. It is also observed that in both cases (total and casualty cases) the trends peaked in the months of July (figures 12 and 13). Consequently, the month emerges as the most unsafe. It is also observed that for Oshodi/Isolo Local Government Area, although the months of (March, August, September and October) recorded relatively low figures when tot5al road traffic accidents are concerned, these months rated very high when casualty cases are concerned and thus rate among the most unsafe months. The next observation from figures 14 and 15 is that all months of the year recorded at least a 50 percent casualty rate. In other words, any accident in any of the months had a 50 percent change or more of resulting in bodily harm/loss of life or lives. Consequently, the chances of being involved in a fatal or serious accident was 64 percent in the month of November, 63 percent in the month of September, 62 percent in the months of January, August and December, 61 percent in the months of March and June for Ojo Local Government Area. While the chances of being involved in a fatal or serious accident was 61 percent in September, 60 percent in the months of June and October, 59 percent in the months of April and May for Eti-Osa Local Government Area. It is observed that in both cases (total and casualty cases) the trends peaked in the month of July (total and casualty cases) the trends peaked in the month of July (figures 16 and 17). Consequently, the month emerges as the most unsafe. It is also observed that for Ojo Local Government Area, although the months of (January, August, September and November) recorded relatively low figures when total road traffic accidents are concerned, these months rated very high when casualty cases are concerned and thus rate among the most unsafe months. Fig. 12. Monthly Variation of total and casualty road traffic accidents in Oshodi/Isolo Local Government Area from 1970-2001
Source: Data Collected

ISSN 2039-9340 Mediterranean Journal of Social Sciences Vol. 3 (11) November 2012
59
Fig. 13: Monthly Trend of road traffic accidents in Oshodi/Isolo Local Government Area from 1970-2001
Fig. 14: Monthly Variation of total and casualty road traffic accidents in Ojo Local Government Area from 1970-2001
Source: Data Collected Fig. 15: Monthly Trend of road traffic accidents in Ojo Local Government Area from 1970-2001

ISSN 2039-9340 Mediterranean Journal of Social Sciences Vol. 3 (11) November 2012
60
Fig. 16. Monthly Variation of total and casualty road traffic accidents in Eti-Osa Local Government Area from 1970-2001
Source: Data Collected Fig. 17. Monthly Trend of road traffic accidents in Eti-Osa Local Government Area from 1970-2001
The final observation from figures 18 and 19 is that, the chances of being involved in a fatal or serious accident was 58 percent in the months of January, February, May and August, 57 percent in the months of March and June for Kosofe Local Government Area. Fig. 18. Monthly Variation of total and casualty road traffic accidents in Kosofe Local Government Area from 1970-2001
Source: Data Collected

ISSN 2039-9340 Mediterranean Journal of Social Sciences Vol. 3 (11) November 2012
61
Fig. 19: Monthly Trend of road traffic accidents in Kosofe Local Government Area from 1970-2001
4. Recommendations Specific to Lagos State To deal with the accident prone areas of Lagos State (i.e. Lagos Island, Lagos Island, Lagos Mainland, Ajeromi/Ifelodun, Ikeja, Oshodi/Isolo, Apapa, Eti-Osa, Kosote and Ojo) the authorities should: Improve traffic patrol especially in accident prone seasons times Provide recommendations for: effective transport planning, human – misuse, poor management, inadequate street parking, traffic congestion, delays and accidents. Strong political commitment to ensure on a long term basis, appropriate monitoring of the road accident situation on which pertinent decisions can be made. Proper design of road networks as well as the planning of the general public transport system. 5 Recommendations for Nigeria Proper traffic patrol at the times of very high accident occurrence will go along way towards reducing traffic accidents and the associated injures and fatalities in Nigeria. Consistent road safety efforts should be intensified during the months of June, July, September, October, November and December as well as Fridays, Saturdays and Sundays. These are periods when the highest number of road accidents cases involving death and injuries are recorded. Ensure that drivers are constantly trained to ensure that they operate vehicles safety at all times. Learn from other countries with better traffic management systems e.g., the U.S. and Great Britain. Ensure adequate funding for the Federal Road Safety Corps. 6 Conclusions Generally, Nigerians have been found to exhibit nonchalant attitudes to traffic regulations. As such traffic offence has become a regular behavioural tendency among various classes of road users. Thus, an obvious policy question is how to increase the level of compliance of road user’s compliance with traffic regulations so as to reduce the level of traffic offences. There is need to create avenues through which road users’ behaviour can be improved upon in other to conform with existing road safety norms.
References Akpogomeh, O.S. (1998) Temporal Variations in road traffic accident parameters in the Port Harcourt metropolis. Journal of Transport
Studies, Vol. 2, No. 1, Pp. 15-36. American medical Association (1983) Automobile related injuries: components, trends and prevention. Journal of the American Medical
Association. 249: 3216-3222. Atubi, A.O. (2009b) “Urban Transportation: An Appraisal of Features and Problems in the Nigerian Society”. International Journal of
Geography and Regional Planning. Vol.1,No 1,Pp. 58-62.

ISSN 2039-9340 Mediterranean Journal of Social Sciences Vol. 3 (11) November 2012
62
Atubi, A.O. (2010a) Spatial and Temporal Perspective on Road Traffic Accident variations in Lagos mainland, South Western Nigeria. African Research Review, Vol. 4 (1) pp.256-272.
Atubi, A.O. (2010b) Road Transport System Management and Traffic in Lagos, South Western Nigeria, Journal of African Research Review. Vol. 4. No.4. Pp. 459-470.
Atubi, A.O. (2012c) Determinants of road traffic accident occurrences in Lagos State: Some Lessons for Nigeria. International Journal of Humanities and Social Science. Vol. 2, No. 5, Pp. 225-343.
Atubi, A.O. (2012e) Epidemiology of Injuries from Road Traffic Accidents in Lagos State, Nigeria. International Journal of Science and Technology, Vol. 1, No. 2, Pp. 56-75.
Atubi, A.O. and Onokala, P.C. (2009) Contemporary Analysis of Variability in Road Traffic Accidents in Lagos State, Nigeria. Journal of African Geographical Review. Vol. 28, Pp. 11-41.
Atubi,A.O.(2009c) Modelling Road Traffic Accidents in Lagos State, South Western Nigeria. Journal of Society and State Vol. 1. Nos 1 &2, pp 57-74.
Central Bank of Nigeria (1994) Annual Report and Statement of Account for the Year Ended 31 December, 1993. C.B.N., Lagos April. Central Bank of Nigeria (1997) Annual Report and Statement of Account for the Year Ended 31 December, 1996. C.B.N., Lagos April. Daramola, A.Y. (2004) “Innovative Options for financing transport infrastructure in Nigeria”. In Nisereel, The Magazine of the Nigerian
Institute of Social and Economic Research, Nos. 485, December, Ibadan. Downing, A.J.; Baguley, C.J. and Hills, B.L. (1991) Road Safety in Developing Countries: An Overview, Crowthorne: Transport and Road
Research Laboratories. Filani, M.O. and Gbadamosi, K.T. (2007) Spatial and Temporal Pattern of Road Traffic Accident Occurrences in Nigeria: 1970-1995.
Nigerian Geographical Journal. Vol. 5, No. 1, Pp. 55-70. Fouracre, P.R. and Jacobs, G.D. (1976) Comparative Accident Costs in Developing Countries, TRL Supplementary Report 207,
Crowthorne, U.K. Gbadamosi, K.T. (2002) ‘Traffic Regulations and Road Traffic Accidents in Nigeria – A Spatial Analysis. Unpublished Ph.D. Thesis,
Department of Geography, University of Ibadan. Hadden, W. (1980) Advances in the epidemiology of injuries as a basis for public policy. Public Health Reports, 95: 411-421. Jacobs, G.D. and Sayer, I.A. (1983) Road Accidents in Developing Countries. Accident Analysis and Prevention. 15:337-353. Jadaan, K.S. (1989a) Road accident costs in Jordan. Journal of the Royal Society of Health, 109: 144-146. Jadaan, K.S. (1990) Traffic accidents in Kuwait: An Economic Dimension. Accident analysis and prevention, 22: 399-401. Obinna, C. (2007) Road traffic crashes Kill 0.4million youths every year. Vanguard, April, 24, P. 35. Onakomaiya, S.O. (1988) Unsafe at any speed: Toward road transportation for survival; Inaugural Lecturer, University of Ilorin, Ilorin. Robertson, L.S. (1992) Injury Epidemiology. Oxford University Press, New York. Shell Petroleum Development Company of Nigeria (1998) Safety Pocket Book, Safety Department. Stansfield, S.K.; Smith J.S. and McGreevey, W.P. (1992) Injury in Disease Priorities in Developing Countries, (Eds Jamision, D.T. and
Mosley, W.H.) World Bank, Oxford University Press, London, Pp. 609-633. Transport Canada (1990) Canadian Motor Vehicle Traffic accident statistics. Leaflet, Ontario. Trinca, G.W. et al. (1988) Reducing traffic injury: A global challenge. A.H. Massina and Co. Melbourne. World Health Organisation (1989) Analysis of Achievements of Traffic Safety in Industrialized Countries.

ISSN 2039-9340 Mediterranean Journal of Social Sciences Vol. 3 (11) November 2012
63
SMEs and Enterprises, Represent Potential Employment and Economic
Growth in Emerging Economies in Albanian Development
Ma. Hava Muçollari
Agricultural Tirana University, Albania, Accountability Expert Email:[email protected]
Prof. As. Dr. Alba Dumi
Dean of Graduated School” Ismail Qemali” Vlore University”
Email:[email protected]
Ma. Lidra Kukaj
“Ismail Qemali” University, Albania, Vlore Albania Email:[email protected]
Doi: 10.50901/mjss.2012.v3n11p63
Abstract: Small and medium-sized enterprises (SMEs) are the backbone of all economies and are a key source of economic growth, dynamism and flexibility in advanced industrialized countries, as well as in emerging and developing economies.SMEs constitute the dominant form of business organization, accounting for over 95% and up to 99% of enterprises depending on the country. They are responsible for between 60-70% net job creations in OECD countries. Small businesses are particularly important for bringing innovative products or techniques to the market. Financing is necessary to help them set up and expand their operations, develop new products, and invest in new staff or production facilities. Many small businesses start out as an idea from one or two people, who invest their own money and probably turn to family and friends for financial help in return for a share in the business. But if they are successful, there comes a time for all developing SMEs when they need new investment to expand or innovate further. That is where they often run into problems, because they find it much harder than larger businesses to obtain financing from banks, capital markets or other suppliers of credit. This “financing gap” is all the more important in a fast-changing knowledge-based economy because of the speed of innovation. Innovative SMEs with high growth potential, many of them in high-technology sectors, have played a pivotal role in raising productivity and maintaining competitiveness in recent years. If SMEs cannot find the financing they need, brilliant ideas may fall by the wayside and this represents a loss in potential growth for the economy. Key words: SME developing programs, financial help, innovations, raising productivity, financing gap 1. Introduction to management and types of SMEs Since the late 1990s, Albanian Government has undertaken several structural reforms, involving land reform, financial market liberalization and privatization. During this time, almost all Small and Medium-sized Enterprises (SME) have been privatized and significant progress has been made in the privatization of strategic sectors, like telecommunications and banking. The banking sector has gradually increased the amount and quality of loans and financial services to SME-s. (Angjeli A, 2011) The Government has adopted a new bankruptcy law and established a new Agency for supporting the deposit insurance scheme. Moreover, on October 2002 a new Law on SME-s was adopted, followed by a broader strategy on SME-s, which subsequently led to the establishment of the Agency for SME Development in June 2003.The “bag” vacuum cleaner and the “wind-up” radio or flashlight which need no batteries are now common household items, but nearly failed to see the light of day because their inventors could not find financial backing to transform their ideas into production. The difficulties that SMEs encounter when trying to access financing can be due to an incomplete range of financial products and services, regulatory rigidities or gaps in the legal framework, lack of information on both the bank’s and the SME’s side. Banks may avoid providing financing to certain types of SMEs, in particular, start ups and very young

ISSN 2039-9340 Mediterranean Journal of Social Sciences Vol. 3 (11) November 2012
64
firms that typically lack sufficient collateral, or firms whose activities offer the possibilities of high returns but at a substantial risk of loss. (MOE Report 2010) 1.1 What are the obstacles to SME access to financing? The paper contents five sections which describes the main barriers of small and medium enterprises in Albania to growth in the first section. The second section is focused on the main economic feature and the characteristics of the market size in Albania. The discussion is followed in the third and forth section aiming to shed light on the implementation of the competition law and policy in Central and East European countries and presents some of the issues faced by the Albanian reforms The final remarks indicates the main issues that should be consider in assessing the level of the enforcement of the competition law and policy. (Dumi A, JERM USA 2012) SMEs tend by their very nature to show a far more volatile pattern of growth and earnings, with greater fluctuations, than larger companies. Their survival rate is lower than for larger companies – one analyst found that manufacturing firms with fewer than 20 employees were five times more likely to fail in a given year than larger firms. Thus, SMEs are at a particularly severe disadvantage when trying to obtain financing relative to larger and more established firms. It can also be difficult for potential creditors or investors to distinguish the financial situation of the company from that of its owners. If there are two cars in the driveway, can one or both be considered part of the company’s assets? If the owner dies, is there someone to take over the business, or will it die with him or her? If entrepreneurs cannot gain access to finance through the regular system, they may not start up a business or simply go out of business, a potential loss to the economy. Albania has entered a new phase of economic reforms for a better future and the prosperity of the country. The country’s development is linked to the strengthening and enhancement of the private sector, which is one of the strongest pillars for ensuring the successful integration of Albania into the European Union. (Sykja B, 2011 MOE Report) The Government is committed to create a better climate for business and is guided by the motto “Albania is the most attractive country for new investments” But the other danger is that they will abandon the formal system altogether and operate in the informal economy, sidestepping taxes and regulations, and thus not making a full contribution to economic growth and job creation. In most countries, commercial banks are the main source of finance for SMEs (Figure 1), so if the SME sector is to flourish it must have access to bank credit. Figure 1. Commercial banks, the main source of finance for SMEs
2 Literature Review and Hypotheses 2.1 Data from Albanian SMEs The Program for the Development of SME-s in Albania is greatly helping local businesses, especially SME-s which make-up 95 percent of all companies in the Albanian market. In one way or another, they end up in the environment resources that may be a combination of air, land and water resources. The overall SME financing gap is particularly pressing in non-OECD countries, since the bulk of them report a widespread shortage of financing for all categories of SMEs. Micro-credit and micro-finance schemes play an important role in developing countries and efforts should be made to boost their effectiveness and diffusion. Any provision of official funding should respect the principle of risk sharing, so official funds should only be committed in partnership with funds from entrepreneurs, banks, businesses or universities. Governments
SME and the development needs
Credit lines and financing Low share credit Employment and economy growth

ISSN 2039-9340 Mediterranean Journal of Social Sciences Vol. 3 (11) November 2012
65
should also look at whether government- technical support can be used generate the emergence of business angels and to make the existing business angel systems operate more efficiently.
This Program is of particular importance for the Ministry of Economy, Trade and Energy and the Albanian Government, more generally, because it potentiates the fast-paced development of the country’s economy. (Source MOE, Albania 2011) The Program consists of three components: 2.5 million Euro for the development of the Guarantee Fund which helps SME-s obtain loans when they lack collateral; 1.7 million Euro grant for technical assistance aimed at capacity building for the Program’s implementation and, more generally, for the initiation of SME-s in the domestic financial market. 25 million Euros of soft loans for the line of credit of SME-s. Even though SMEs account for a large share of enterprises, and represent potential employment and economic growth in emerging economies, they receive a very low share of credit. Indeed, most of them are denied any access to formal financial markets. The characteristics of the banking system in emerging markets frequently inhibit SME lending. 2.2 Literature and Development concept The economic growth was also stimulated by the rapid increase of business loans. Loans for the private sector ranged from 6.4 percent of the GDP in 2002 to 37.4 percent of GDP in 2009, meanwhile the annual growth rate varied from 41 percent to 74.9 percent (the highest reached in 2005). During 2009 the bank insecurity and the hesitation of businesses noted a growth of loans of only 12.1 percent. Chart 2 below provides a comparison of the economic growth in Albania and other South Eastern Europe Countries (Sicignano A, 2011 DIDC in Albania) 2.1.1 Monetary policy and Albanian budget deficit One of the key aspects of economic policy in Albania has been the tight fiscal and monetary policy. The budget deficit has been declined from 9 percent of GDP in 2000 to 6.6 percent in 2002. In addition, Bank of Albania has played a conservative interests rate policy by keeping its key interest rate well above CPI. Figure 2shows that in 1996 and especially 1997 the economy lost its momentum, reflected also in the increase of CPI (end of period) by 22.7percent. Figure 2. In 1996 and especially 1997 the economy lost its momentum, reflected also in the increase of CPI
H1.Governments should also act to improve awareness among entrepreneurs of the range of financing options available to them from officials, private investors and banks. General Business Development: The ambition and comprehensive macroeconomic program undertaken by Albanian Government after 1997 yielded quick results in macroeconomic stability followed also by increasing real GDP at satisfactory rates. Over the period 1998-2002, contribution of private sector in GDP growth is obvious. In the Report this is demonstrated by increasing share of service sector (where dominate private firms) to GDP formation, as well as in increasing the number of employment in private enterprises compared with those in public enterprises especially in construction and trade sectors. Private sector’s contribution to GDP became more important.
Fiscal and monetary policy
Conservative interests rate policy
The budget deficit Inflation pressures
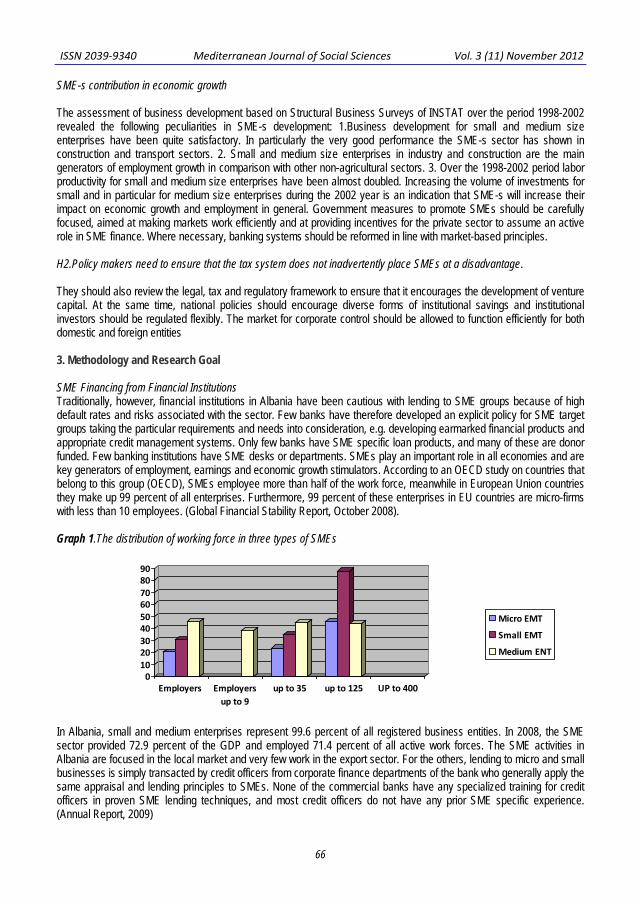
ISSN 2039-9340 Mediterranean Journal of Social Sciences Vol. 3 (11) November 2012
66
SME-s contribution in economic growth The assessment of business development based on Structural Business Surveys of INSTAT over the period 1998-2002 revealed the following peculiarities in SME-s development: 1.Business development for small and medium size enterprises have been quite satisfactory. In particularly the very good performance the SME-s sector has shown in construction and transport sectors. 2. Small and medium size enterprises in industry and construction are the main generators of employment growth in comparison with other non-agricultural sectors. 3. Over the 1998-2002 period labor productivity for small and medium size enterprises have been almost doubled. Increasing the volume of investments for small and in particular for medium size enterprises during the 2002 year is an indication that SME-s will increase their impact on economic growth and employment in general. Government measures to promote SMEs should be carefully focused, aimed at making markets work efficiently and at providing incentives for the private sector to assume an active role in SME finance. Where necessary, banking systems should be reformed in line with market-based principles. H2.Policy makers need to ensure that the tax system does not inadvertently place SMEs at a disadvantage. They should also review the legal, tax and regulatory framework to ensure that it encourages the development of venture capital. At the same time, national policies should encourage diverse forms of institutional savings and institutional investors should be regulated flexibly. The market for corporate control should be allowed to function efficiently for both domestic and foreign entities 3. Methodology and Research Goal SME Financing from Financial Institutions Traditionally, however, financial institutions in Albania have been cautious with lending to SME groups because of high default rates and risks associated with the sector. Few banks have therefore developed an explicit policy for SME target groups taking the particular requirements and needs into consideration, e.g. developing earmarked financial products and appropriate credit management systems. Only few banks have SME specific loan products, and many of these are donor funded. Few banking institutions have SME desks or departments. SMEs play an important role in all economies and are key generators of employment, earnings and economic growth stimulators. According to an OECD study on countries that belong to this group (OECD), SMEs employee more than half of the work force, meanwhile in European Union countries they make up 99 percent of all enterprises. Furthermore, 99 percent of these enterprises in EU countries are micro-firms with less than 10 employees. (Global Financial Stability Report, October 2008). Graph 1.The distribution of working force in three types of SMEs
In Albania, small and medium enterprises represent 99.6 percent of all registered business entities. In 2008, the SME sector provided 72.9 percent of the GDP and employed 71.4 percent of all active work forces. The SME activities in Albania are focused in the local market and very few work in the export sector. For the others, lending to micro and small businesses is simply transacted by credit officers from corporate finance departments of the bank who generally apply the same appraisal and lending principles to SMEs. None of the commercial banks have any specialized training for credit officers in proven SME lending techniques, and most credit officers do not have any prior SME specific experience. (Annual Report, 2009)
0102030405060708090
Employers Employersup to 9
up to 35 up to 125 UP to 400
Micro EMT
Small EMT
Medium ENT

ISSN 2039-9340 Mediterranean Journal of Social Sciences Vol. 3 (11) November 2012
67
Why SME Credit Schemes Have Been Ineffective? We have concluded that SME financing in Albania has generally not been effective. What are the reasons? The key missing factors are: 1. Adequacy of the institutional framework 2.Legal and Regulatory -Framework 3.SME Managerial Capacity and Lack of Training 4.Adequacy of Development in progress of Institutional-Framework. Among the resources needed for the production of goods and services, there are many things that set capital apart from the other inputs. Assets such as equipment and land provide benefits that derive from their physical characteristics. (Annual Report, 2001)Unfortunately we cannot say the same thing about the financial resources used to run a business. The acquisition of financial resources leads to contractual obligations. Here are some examples: 1. When a bank: lends money to a business, the loan generates a contractual obligation between the borrower and the business. Under the loan contract, the lender is entitled to receive specified payments of principal and interest during the term of the loan. If the business is a sole proprietorship or partnership, the owners of the business are personally liable. If the loan is to a corporation, the corporate entity is liable. 2. An investment in the shares of a business is also a contractual relationship. Shareholders are entitled to share in any earnings which are distributed as dividends. In addition, shareholders are entitled to their pro rata share of the net assets of the company upon at liquidation 4. Findings of this paper research From the above, we conclude as follows: • There is a strong demand for the government to elaborate and implement policies and strategies for financing SMEs as well as for developing and improving financial institutions and financial instruments; • There is a need to harmonize those policies and strategies as well as the instruments for implementing them • The legal framework plays an important role in the creation and successful operation of SMEs and should encourage a simplification of the procedures involved in the creation, financing, training and other aspects of the SME sector; • In Albania, banks do not pay sufficient attention to the development of SMEs. The role of Governments should be to open the dialogue and to create instruments together with the banks to promote the financial aspects of successful SME development; • There is a great need for improving different aspects of financial services for SMEs such as seed money, leasing, venture capital, and investment funding. There is a lack of long-term loans; interest rates are still high, etc. Fig. 3. Promotion of SME’s development in all regions of Albania
Promotion of SME-s to increase the number of employees, as well as eliminating the phenomena of hiding the real number of employees (informality) and informal economy. The coordination and monitoring of the programs related to the European Charter of Small Business remain as very important objectives. 5. Conclusions and Recommendations The analysis regarding the overall business environment in Albania leads us to the following conclusions: 1.The economic program undertaken by the Albanian Government at the end of 1997 allowed the economy to bounce back at the same rate as before the 97’ crisis. The strong economic performance continued in 2000 and 2001. GDP
SME harmonize those policies and strategies
Albanian Government is to create instruments to protect SMEs
Municipality activities and projects for SMEs
Albanian government must pay attention to SME facility instruments
ISSN 2039-9340 Mediterranean Journal of Social Sciences Vol. 3 (11) November 2012
68
growth declined in the forth quoted of 2001. This slowdown, which continued also in 2002, was mainly related to power shortages and the slowdown in the world economy after September 11. 2. Albania, in the last 5 years, has followed a tight fiscal and monetary policy. The budget deficit has declined from 9 percent of GDP in 2000 to 6.6 percent in 2002. In addition, the Central Bank of Albania has played an active interests rate policy by keeping its key interests rate well above CPI. Inflation pressures were kept under control in 1998 and CPI has moved in the narrow band of -1 to 4 percent in recent years. Interest rates applied by commercial bank for credits in Lek have decreased in the last 3 years. 3. After 1999, employment in private firms increased much faster than in public firms. This can be explained by the acceleration of the privatization reform in Albania in early 2000, which was followed by an increase in the share of employment in the private firms in the industrial sector by about 9 percent in 2002.On 2010 the development of SMEs are with 45% more than 2008
References
Anderson, Wayne, Chester, and Richard Stillman, The effective local Government manager Washington, ICMA, 1983. Avinash K & Barry J. N “Thinking Strategic” New York year 1991 Brown, Stephen 1. (1996b). Posing mathematically. Portsmouth, NH: Heinemann Press. Benovetz James M. & Charls B. Hetrick ”Management in local government in small cities and countries”. Washington, ICMA, 1984. Brown, Stephen 1. (1997). Math lingo vs. plain English: Multiple entendre. Humanistic Mathematics Berman & Norton, “Strategies Local Partnership Government Program” Warsaw, year 2000 Bank of Albania (BOA) Monetary Policy Report 2009, March 2010 BAS Brief for Albania 2009-2001, June 2009.Strategjia per Shqiperia 2009-2012, November 2009. Dumi A, JERM USA 2012) “Albanian development and integration in EU” pp 406 FIAS (2003), Albania, Abolishment of Administrative Barriers for Investment: An Inseparable Part of Development Strategy, Tirana,
March 2003 Financial Stability Report 2009, 2010.Financial Stability Report 2010 H1, October 2010. Supervision Annual Report 2009, 2010.Monetary Policy Report third quarter 2010, November 2010. European Bank for Reconstruction and Development (EBRD) Taxes, Competition and Finance for Albanian Enterprises: Evidence from
a Field Study, 1999. South-Eastern Europe: Lessons from the Global Economic Crisis, February 2010. International Monetary Fund (IMF) Financial Soundness Indicator-Background Paper, May 2003. World Economic Outlook, October 2007-2010.Global Financial Stability Report, October 2008. Bank of Albania (2002), Annual Report, 2001, Tirana, May 2002, INSTAT (2000a), General Results of Annual Structural Survey of
Economic Enterprises, Year 1997, Tirana, May 2000 INSTAT (2000b), General Results of Annual Structural Survey of Economic Enterprises, Year 1998, Tirana, June 2000 INSTAT (2001a), General Results of Annual Structural Survey of Economic Enterprises, Year 1999, Tirana, April 2002 INSTAT (2003a), Gross Domestic Product, 1996 – 2000, Tirana, January 2003 INSTAT (2003b), General Results of Annual Structural Survey of Economic Enterprises, Year 2001, Tirana, March 2003 INSTAT
(2004a), General Results of Annual Structural Survey of Economic Enterprises, Year 2002,

ISSN 2039-9340 Mediterranean Journal of Social Sciences Vol. 3 (11) November 2012
69
Maintenance of University Facilities in Developing Country:
Case study of Lagos State University Ojo Nigeria
Oyenuga, S.O.
Department of Estate Management School of Environmental Studies Yaba College of Technology
Akinsola, O. E.
Department of Building Technology
School of Environmental Studies Yaba College of Technology
Hussaini, P. O.
Department of Building Technology School of Environmental Studies Federal Polytechnic, Ede
E-mail: [email protected],
Fatokun, A.O. (Corresponding Author)
Department of Building Technology School of Environmental Studies Yaba College of Technolgy.
E-mail: [email protected], +2348052314874
Doi: 10.5901/mjss.2012.v3n11p69 Abstract: Cursory study of universities in developing countries has been a subject of concern. This necessitated a study into the maintenance of Lagos state university Ojo Campus Nigeria with a view to identify certain factors responsible for the deteriorating state of the facilities and also proffer remedial solution to the problems. The research used both qualitative and quantitative method. Group focus and in-depth interview are some of the many formal approaches that are used. These include; customer feedback forms, report or media clip. Data are collected using sampling techniques and structured questionnaire, incorporating a fixed set and order of questions with a closed list of responses. Out of the Twenty-Two (22) questionnaire sent, only seventeen (17) were responded to, representing a seventy-seven (77%) response rate. The data collected were analyzed using descriptive and inferential statistics. The study revealed that; lack of planned maintenance, lack of maintenance policies in the institution, lack of update security system and qualified personnel are among the major factor influencing deteriorating state of facilities at the university. The research work concludes that lack of planning approach to maintenance issue and structured maintenance policy is the banes of the university facilities problem.The study also conclude that there are no regular inspections of the facilities to check maintenance needs and the university does not use facilities to generate fund, other than government funding for maintenance purposes. The paper recommends that universities in developing countries should have a good maintenance policy in place and use facilities for investment purposes to foster increased income to cater for maintenance needs among other things. 1. Introduction The maintenance of university facilities is important for the well-being of users; students, lecturers, administration, clerical, technical and support staff. It is indispensable for the promotion of productive activities and social development. The vast majority of people spend over Ninety95% of their time in or next to a building of one kind or another, so in this sense the built environment has become our natural environment (words worth, 2001). The conditions of the surroundings in which we live and learn are reflection of the nation’s wellbeing (Lee, 1997). Neglecting maintenance implies increased in cost of operating facilities and a waste of related natural and financial resources (Jackson, 2003). According to Banful (2004), the financial consequences of neglecting maintenance are often
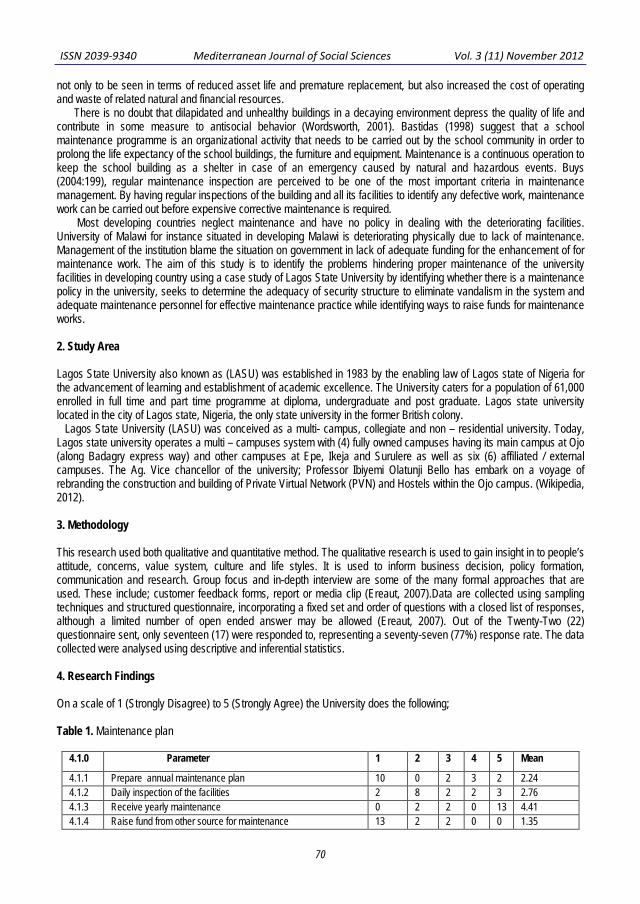
ISSN 2039-9340 Mediterranean Journal of Social Sciences Vol. 3 (11) November 2012
70
not only to be seen in terms of reduced asset life and premature replacement, but also increased the cost of operating and waste of related natural and financial resources.
There is no doubt that dilapidated and unhealthy buildings in a decaying environment depress the quality of life and contribute in some measure to antisocial behavior (Wordsworth, 2001). Bastidas (1998) suggest that a school maintenance programme is an organizational activity that needs to be carried out by the school community in order to prolong the life expectancy of the school buildings, the furniture and equipment. Maintenance is a continuous operation to keep the school building as a shelter in case of an emergency caused by natural and hazardous events. Buys (2004:199), regular maintenance inspection are perceived to be one of the most important criteria in maintenance management. By having regular inspections of the building and all its facilities to identify any defective work, maintenance work can be carried out before expensive corrective maintenance is required.
Most developing countries neglect maintenance and have no policy in dealing with the deteriorating facilities. University of Malawi for instance situated in developing Malawi is deteriorating physically due to lack of maintenance. Management of the institution blame the situation on government in lack of adequate funding for the enhancement of for maintenance work. The aim of this study is to identify the problems hindering proper maintenance of the university facilities in developing country using a case study of Lagos State University by identifying whether there is a maintenance policy in the university, seeks to determine the adequacy of security structure to eliminate vandalism in the system and adequate maintenance personnel for effective maintenance practice while identifying ways to raise funds for maintenance works. 2. Study Area Lagos State University also known as (LASU) was established in 1983 by the enabling law of Lagos state of Nigeria for the advancement of learning and establishment of academic excellence. The University caters for a population of 61,000 enrolled in full time and part time programme at diploma, undergraduate and post graduate. Lagos state university located in the city of Lagos state, Nigeria, the only state university in the former British colony. Lagos State University (LASU) was conceived as a multi- campus, collegiate and non – residential university. Today, Lagos state university operates a multi – campuses system with (4) fully owned campuses having its main campus at Ojo (along Badagry express way) and other campuses at Epe, Ikeja and Surulere as well as six (6) affiliated / external campuses. The Ag. Vice chancellor of the university; Professor Ibiyemi Olatunji Bello has embark on a voyage of rebranding the construction and building of Private Virtual Network (PVN) and Hostels within the Ojo campus. (Wikipedia, 2012). 3. Methodology This research used both qualitative and quantitative method. The qualitative research is used to gain insight in to people’s attitude, concerns, value system, culture and life styles. It is used to inform business decision, policy formation, communication and research. Group focus and in-depth interview are some of the many formal approaches that are used. These include; customer feedback forms, report or media clip (Ereaut, 2007).Data are collected using sampling techniques and structured questionnaire, incorporating a fixed set and order of questions with a closed list of responses, although a limited number of open ended answer may be allowed (Ereaut, 2007). Out of the Twenty-Two (22) questionnaire sent, only seventeen (17) were responded to, representing a seventy-seven (77%) response rate. The data collected were analysed using descriptive and inferential statistics. 4. Research Findings On a scale of 1 (Strongly Disagree) to 5 (Strongly Agree) the University does the following; Table 1. Maintenance plan
4.1.0 Parameter 1 2 3 4 5 Mean
4.1.1 Prepare annual maintenance plan 10 0 2 3 2 2.24 4.1.2 Daily inspection of the facilities 2 8 2 2 3 2.76 4.1.3 Receive yearly maintenance 0 2 2 0 13 4.41 4.1.4 Raise fund from other source for maintenance 13 2 2 0 0 1.35

ISSN 2039-9340 Mediterranean Journal of Social Sciences Vol. 3 (11) November 2012
71
4.1.5 Receive donation for maintenance 10 2 0 3 0 1.73 4.1.6 Recover maintenance cost from users 15 0 0 0 0 1.00 4.1.7 The maintenance manager is involved in the design of new
facilities 2 0 0 0 15 4.53
4.1.8 Put in place a sound maintenance policy to ensure that maintenance fund is available.
11 2 0 0 3 1.67
4.1.9 Maintenance exercise according to priorities. E.g. Emergency, routine
0 0 0 0 17 5.00
4.1.10 Put out tender for outsource maintenance work 0 0 4 9 4 4.00 4.1.11 Outsource only major maintenance work 0 0 0 0 17 5.00 4.1.12 Management determine minimum accepted standard of building 13 2 0 0 2 1.59 4.1.13 Maintenance Manager makes ultimate decision with regard to
maintenance 2 12 0 0 3 2.41
The following are chart derived from the above data in Table 4.1 on a scale 1(Strongly Disagree) to 5(Strongly Agree). Chart 1: Annual Maintenance
59% of the respondent representing strongly disagree that there is any maintenance plan, 12% are neutral, 18% agree while 12% strongly agree that there is a maintenance planning and are mostly done on ad hoc basis, if at all. Maintaining facilities on ad hoc basis can lead to funding problems, because the lack of forward planning leads to costs that are unpredictable and therefore incorrectly included in the budget. The lack of annual maintenance planning can lead to a lack of require skilled labour of the time of need. Chart 2: Daily Inspection
12%
47%12%
12%
18% strongly disagree
disagree
neutral
agree
strongly agree

ISSN 2039-9340 Mediterranean Journal of Social Sciences Vol. 3 (11) November 2012
72
12% of the respondent strongly disagree that there is daily inspection while 47% of the respondent disagree, 12% are neutral, 12% agree and 18% strongly agree that there are daily inspections. The mean score shows that the respondents are “neutral` that the facilities are inspected on a daily basis. This shows that some of the school annex or affiliated ones may be inspecting facilities while others may not as shown on the chat that 47% disagree. According to Buys (2004), ranking of the criteria for the best practice in maintenance management system in order of important, established that regular inspection cycle to identify maintenance work was ranked first. On a scale of 1(Minor contribution) to 5(Major contribution) the following items contribute to the University source of funds for maintenance. Table 2. Source of funds Minor Contribution Major Contribution
4.2.0 Sources of funding 1 2 3 4 5 Mean 4.2.1 Student fees 8 0 3 0 0 1.55 4.2.2 Donations 4 3 0 0 3 2.50
4.2.3 Government funding 0 0 0 2 15 4.88 4.2.4 Fund raising 10 0 0 0 0 1.00 4.2.5 Cost of recovery from user charges 8 2 0 0 0 1.20
Table 3. Ranking source of funds
4.3.0 Source of fund Mean Funding Ranking 4.3.3 Government funding 4.88 Very large 1 4.3.2 Donations 2.50 Little 2 4.3.1 Student fee 1.55 Very little 3 4.3.5 Cost recovery from user charges 1.20 Very little 4
4.3.4 Fund raising 1.00 Very little 5
The following are result derived from the above data in Table 4.2 and 4.3 on a scale of 1(Minor contribution) to 5(Major contribution). It was assumed that funding for maintenance is obtained from all five sources and the least source of funding is regarded as contributing very little or no funding while the one with most votes among the sources would be assumed to contribute the majority funds. Interpretation of the mean score for funding: Very little (≥1.0 to ≤ 1.8), Little (≥ 1.9 to ≤ 2.7), Average (≥2.8 to ≤ 3.6), Large (≥3.7 to ≤ 4.2), Very large (≥ 4.3 to ≤ 5.0). In this case, the data shows that government funding with mean score of 4.88 is the major source of funding for the maintenance of the school facilities.

ISSN 2039-9340 Mediterranean Journal of Social Sciences Vol. 3 (11) November 2012
73
Chart 3: Maintenance Decision.
Chat 3 was based on table 1 expressing if maintenance manager makes decision. Chat 3 indicate that 12% of respondent strongly disagree, 71% representing,18% representing strongly agree that ultimate decision for maintenance are made by the maintenance manager. The mean score of 2.41 indicate that the respondents generally “disagree` those ultimate decisions concerning maintenance are made by the maintenance manager. This shows that the maintenance manager does not make ultimate decision concerning maintenance of facilities. Table 4. Maintenance caused by vandalism
4.4.0 0% 1-19% 20-39% 40-59% 60-79% 80-99% 100% Mean 4.4.1 1 2 3 4 5 6 7 4.4.2 0 4 2 2 0 9 0 4.47
From the above data in table 4.4 for maintenance caused by vandalism on a scale of 1(0%) to 7(100%). This was done to find a percentage of maintenance caused by vandalism. Interpretation, the following percentage was used regarding mean score 0%(1), 1 to 9(≥1.0 to ≤2.0), 20 -29%(˃2.0 to ≤3.0) , 40-59%(˃3.0 to ≤4.0), 60-79%(˃4.0 to ≤5.0), 80-99%(˃5.0 to ≤6) and 100%(˃6 to 7). The table shows that the respondent feel that between 60% to 79% of the maintenance caused by vandalism is mainly influenced by a lack of security as vandals take advantage of deserted area / surroundings. Table 5. Security
PARAMETER 1 2 3 4 5 MEAN 4.5.1 General school grounds 10 0 0 0 7 2.65 4.5.2 Effective parameter boundary wall 14 0 0 0 3 1.71 4.5.3 N0 of Entrance to campus are absolute minimum 14 0 0 0 3 1.71 4.5.4 Effective access control system operated by security personnel at the
entrance gates 14 0 0 3 0 1.68
4.5.5 Effective lightning between boundary and buildings 12 2 0 0 3 1.82 4.5.6 Available tools e.g. ladder around the building to enable intruder to
gain access 2 15 0 0 0 1.88
4.5.7 Trees that offer concealment to intruders 8 2 0 2 5 2.65 4.5.8 Guards have unobstructed sight lines covering the building 4 0 0 8 5 3.59 4.5.9 Minimum of entrance(access points) to the building 2 3 5 0 7 3.41 4.5.10 Doors and windows with adequate construction and strength 4 0 0 5 8 3.76 4.5.11 Secure locks to windows and doors 0 3 3 2 9 4.00 4.5.12 Effective intruder detection alarm system 2 13 0 0 2 2.24 4.5.13 CCTV surveillance system monitored by security personnel 4 13 0 0 0 1.76 4.5.14 Adequate security accommodation e.g. surveillance and search
rooms 4 7 3 3 0 2.29
4.5.15 Processes exist to limit any unnecessary movement of valuable items within the building.
7 2 0 2 6 2.88

ISSN 2039-9340 Mediterranean Journal of Social Sciences Vol. 3 (11) November 2012
74
According to the respondents, there is no existence of effective perimeter boundary wall` that allows intruder to access the school ground at anytime. This is backed by mean score of 1.71, thereby indicating that the boundary wall does not exist. On the other hand, the number of entrance are absolute minimum` had a mean score of 1.71, indicating that there are many entrance to the university, which makes it vulnerable to attack by vandals. “Effective access control system is operated by security personnel to the entrance gate had a mean score of 1.68, indicating that the entrance to the university is not operated by security checks. This also allow people with evil intentions to damage the school properties and enter without being checked.
Effective lightning between boundary and buildings had a mean score of 1.82, indicating that it does not really exist. This allows thieves to approach and leave the school in the dark without being noticed.
Available tools, like ladders round the school premises that can allow intruder to gain access to the building, with a mean score of 1.88 are not available, in effect the school is secure. Trees that offer concealment to intruders with mean score of 2.6 do not significantly exist, making it possible for passer-by to see attractive items on the campus grounds. The guards have unobstructed sight lines covering the building has a mean score of 3.59, showing that guards exist and have a clear sight to each other making the building secure. It was however established during the visit, that the guards had no clear line of sight and had no radio, which would make it difficult for them to communicate. Practically, there is a minimum of entrance (access points) (doors used for entering) to the building with a mean score of
3.41. This means that there are few entrance to the building which makes it easier to control and monitored entrances. Doors with adequate construction strength have a mean score of 3.6, which means that they are strong door that
offer adequate security to the building. This makes it hard for a thief to break in. Secure windows and doors with mean scores of 4.00 indicate that the secure door and window do heavily exist. The only problem is that when they are broken, they are not replace in a reasonable time frame due to lack of maintenance plan which makes it easier for intruders to occasionally have access rooms.
There is no CCTV surveillance system monitored by security personnel, evident by mean score of 1.76, which make it hard to identify vandals or thieves. “Effective intruders ` detection alarm system has a mean score of 2.24, which means that the intrusion of people cannot be detected. Adequate security accommodation e.g. surveillance and search rooms with mean score of 2.29, means there is o adequate security accommodation to effectively carry out their duties. This can allow intruder to take advantage of the weather when guards hide in unsuitable areas in rainy day. It also create environment where intruders can go without being physically searched due to lack of rooms. Processes to limit unnecessary movement of vulnerable items within the campus has a mean score of 2.88 which means there is some control of movement of items among the rooms. In order for security to be efficient and effective, all the above requirements need to exist on any building facility. Failures in some of the requirement of security indicate a weakness in the whole security system. Table 6. Qualifications
Qualification Major Programme Years of Experience Technical school certificate Building Construction 12 Years Ordinary Diploma Estate Management 22years
Higher National Diploma Building construction Technology Over 20 years B.Sc/B.Tech Building construction 10years PhD Construction management 7years
All maintenance manager of the university interviewed maintained that maintenance manager have either Technical school certificate, Ordinary Diploma, Higher National Diploma, Bachelor of science in building construction and PhD in construction management. Their position is called “work supervision”. These shows that the university employ them at a lower level of management, these people can therefore not make any decision that are acceptable at the top management level, even with the experience. 5. Conclusion The results of the empirical study show that universities in developing countries lack planning approach to maintenance issue. In the study area (Lagos State University) Isolo, Lagos Nigeria the school (LASU) does not have specific maintenance policy. It was confirmed that there are no regular inspection of the facilities to check maintenance needs.

ISSN 2039-9340 Mediterranean Journal of Social Sciences Vol. 3 (11) November 2012
75
The university does not use facilities to make fund, other than government funding for maintenance purposes. Vandalism is the main reason for the need for maintenance apart from re-active maintenance caused by deterioration of the facilities. The general maintenance needs include the following; replacement of plumbing accessories, general electricity, etc. 6. Recommendations A maintenance department needs to be structured according to the size of the organization. In university, it’s important to employ a manager with high skill and high level of experience, so that maintenance work will be plan and carry out strategically.
Maintenance manager should be able to spend much time in planning by getting involved in daily operational problem. This can be done by empowering other members of the team to make decision and by encouraging problem to address at the lower level of the hierarchy.
Investment in Information Technology (IT) is another way of making information processing more easily. This enable the maintenance work to have updated planning strategy that suit the organization needs.
Another method of improving maintenance is to become more proactive. This can be through arrangement of meeting internally to discuss the service provided, which can be done every two months and it should involve the head of each department. These men would have been briefed on the meetings. Proactive behavior could also include emerging area s of significant activity, such as environmental management and business management planning.
In University, efforts are directed in ensuring the students stay as pleasant as possible, therefore, maintenance managers should target people who can provide them with needed / useful information, in order to improve their services through feedbacks.
The University can also open exclusive club for alumni and company’s executive, where they can meet. The subscription fee can be used for the maintenance of building and facilities as a whole. The club offer services which include sports facilities for their members, restaurant and bored rooms. Regular inspection should be made periodically, take into account all maintenance needs in enabling preparation of annual budgets. Investment in security would also minimize the cost caused by vandalism. It would also enhance the protection of facilities and minimize future maintenance.
References Banful, E. (2004). A Stitch in Time Saves Nine; Cultivating a Maintenance Culture in Ghana, an Article Presented at a Seminar on
Maintenance Culture in Banful, E. (2004). A Stitch in Time Saves Nine; Cultivating a Maintenance Culture in Ghana, An Article Presented at a Seminar on Maintenance Culture in Ghana. March 16, 1 – 2.
Bastidas, P. (1998). Maintenance manual for school buildings in the Caribbean (online) America: organization of American States. Available from http://www.oas.org/CDMP/ documents/schools/maintman.htm. (Accessed on 11th of April 201).
Buys, F. (2004). Maintenance Management in Tertiary Education Institutions in South Africa Unpublished PhD. Thesis, Nelson Mandela Metropolitan University, South Africa.
Ereaut, G. (2007). What is Qualitative Research? (Online) http://www.qsrinternational.com/what-is-qualitative-research.aspx.. (Accessed on 09th of March 2012).
Housing delivery in Nigeria. Builders Focus 1, 31-36. Jackson, B. (2003). DBSA Development Report 2003, Finance for Development: Enhancing the role of private sector finance (online),
http://www.gapresearch.org/ finance/DBSApaper1.pdf. (Accessed on 11th April 2012). Lee, R. (1995) Building Maintenance Management, Blackwell Science Ltd, Oxford: UK Wordsworth, P. (2001). Lee’s Building Maintenance Management, 4th Edition. Oxford. Blackwell Science Ltd.


ISSN 2039-9340 Mediterranean Journal of Social Sciences Vol. 3 (11) November 2012
77
Oil and Conflict in the Niger Delta:
A Reflection on the Politics of State Response to Armed Militancy in Nigeria
Celestine Oyom Bassey
Department of Political Science University of Calabar, Cross River State-Nigeria
Phone: +2348037625205 E-mail: [email protected]
Doi:10.5901/mjss.2012.v3n11p77
Abstract: The Niger Delta is currently in the vortex of protracted social conflict, as crisis of regime legitimacy, “political ostracism and social marginalization” fuel armed rebellion with incalculable consequences for the stability of the Nigerian state. The root cause of this crisis has been the subject of extensive debate in the literature (Otite, 1990; Bassey, etal, 2002). The current dimension of the crisis is arguably the systemic resultant of the multiple disorders (intense “bureaucratic politics”) in the policy process under the Obasanjo administration and that of his successor, Yar’ Adua –Jonathan, and the equal determination of militant youth movements (MEND, NDV, etc.) to assert their presence in the region. This melodrama is currently played out in the official circle of Nigeria’s Federal Government with the unmistakable paradigm shift of policy discourse from accommodation and commitment to transformative action to the language of criminality, gangsterism, terrorism and force. While these contending tendencies characterized bureaucratic debate in the Nigerian policy circles (with the military establishment pushing for a “final solution” in line with the decisive action against Biafran secession), the military onslaught on the militant camps in the Niger Delta in May 2009 marked a watershed in the praxis of state response through force. The implication is unmistakable: with less sympathy for the struggle against “domestic colonialism in the region, the dominant mindset of the Yar’ Adua- Jonathan administration (the “group think factor”) is committed to the Colombian or Zaireen style solution. How this dialectics of force and resistance is played out will determine the future of Nigeria in the next decade: failed, collapsed or problem state?
“For by our actions we have denigrated our country and jeopardized the future of our children—I predict that the scene here will be played and replayed by generations yet unborn – the riddle of the Niger Delta will soon come—The agenda is being set at this trial. Whether the peaceful ways I have favoured will prevail depends on what the oppressor decides.”
Ken Saro-Wiwa 1. Preamble The Niger Delta is currently in the vortex of protracted social conflict, as crisis of regime legitimacy, “political ostracism and social marginalization” fuel armed rebellion with incalculable consequences for the stability of the Nigerian state. The root cause of this crisis has been the subject of extensive debate in the literature (Otite, 1990; Bassey, etal, 2002). The escalation of this tragic confrontation has transformed the Niger Delta into a volatile space exploited by Clandestine Transnational Actors (CTAs) employing “strategies of extraversion” (Bayart, 2000). The emergence of these criminal elements and their activities- “the political instrumentalisation of social disorder”—has provided the context for discrediting of genuine aspirations and agitation for change in the delta. This melodrama is currently played out in the official circle of Nigerian Federal Government with unmistakable paradigm shift of policy discourse from accommodation and commitment to transformative action which characterized the initial period after General Saui Abacha’s death (General Abubakar’s Administration sponsored Memorandum of Understanding) to the language of criminality, gangsterism, terrorism, and force. While these contending tendencies characterized bureaucratic debate in the Nigerian policy circle (with the military establishment pushing for a “final solution” in line with the decisive action against “Biafran” secession and a range of communal crises in the last decade), under the current Administration, the military onslaught against militant camps in May 2009, is considered a watershed in the praxis of state response through force.
Ken Saro Wiwa (1995:63) provided an incisive and tragic summary of this discourse on " man's inhumanity to man":the increasing monologue of violent encounter the Niger Delta:
The present structure reinforces indigenous colonialism- a crude, harsh, unscientific and illogical system. Twenty years after the civil war, the system of revenue allocation, the development policies of successive Federal administrations and the insensitivity of the Nigerian elite have turned the delta and environs into an ecological disaster and dehumanized its inhabitants. The notion that the oil-bearing areas can provide the

ISSN 2039-9340 Mediterranean Journal of Social Sciences Vol. 3 (11) November 2012
78
revenue of the country and yet be denied a proper share of that revenue because it is perceived that the inhabitants of the area are few in numbers is unjust, immoral, unnatural and ungodly.
Leaders of the Movement for the Emancipation of the Niger Delta (MEND) and the Niger Delta Vigilante (NDV) are
declared criminal sponsors of terrorism as the deportation from Angola and the detention of MEND operative, Okah, indicates. The 2008 Appropriation Bill of the Federal Government entrenches Four hundred and fifty billion naira for “security” in the Niger Delta while only sixty billion naira was allocated for infrastructure and social programmes intervention through the Niger Delta Development Commission. This gross disparity, it could be argued, is symptomatic of the mindset of the dominant bureaucratic fraction of the Federal Establishment whose perception of security in the Niger Delta borders only on the protection of the “oil and gas” megastructure that contributes “95% of export revenues, 76% of government revenues and about a third of gross domestic product” (Today, 2007:31). The implications of this development is unmistakable: with less sympathy for the struggle against “domestic colonialism” in the Niger Delta, the majority ethnic- dominated federal bureaucracy of the Yar “Adua Administration is sliding towards the “Colombian”/ “Zairian” style solution. It will be argued below that how this dialectic is played out will determine the future of Nigeria in the next decade: failed, collapsed or problem state? 2. Context The armed revolt in the oil rich region of Nigeria (the Niger Delta) which surfaced with elemental fury during the regime of General Sani Abacha (1993-1998) reached a crisis proportion in 2007 with the spate of attacks on strategic installations (oil and gas facilities) and the abduction of expatriate workers with the oil companies. Thus, the crisis of underdevelopment has combined with mass conccientization and mobilization of youths to engender accelerated pattern of revolutionary insurgency and state repression with inevitable consequences for the stability of the country.
The root causes of this crisis has been much debated (The “product of structural deficiencies inherent in the Nigerian state, and systemic anomalies within its society”), however, the current level of escalation, if allowed to continue, may threaten the very ability of the Federal and State Governments to carry out their statutory functions: provide for health, education, foreign policy, defense and energy infrastructure. The consequences could be incalculable and may threaten the very survival of the Nigeria state as a corporate entity similar to the collateral fallout of the protracted conflict in the Katanga (Shaba) region of Zaire (Democratic Republic of the Congo) and Columbia.
The reason is obvious. The oil and gas industry is the most important private and public sector business in the Nigerian economy. According to one of the latest survey (TELL, February 18, 2008:26), the total oil production in 2006 including condensates, natural gas liquids and crude oil “averaged 2.45 million barrels per day, with oil accounting for 2.28 million bpd” as a consequence. As Thomas Imobighe (2004) notes:
The Niger Delta region of Nigeria is very strategic to the country’s economic survival. This is because Nigeria’s main strategic minerals – oil and gas – are concentarted in the region. The Delta accounts for almost all of Nigeria’s gas and oil production, which in turn represents 80% of governments’ revenue, 95% of export receipts and 90& of foreign exchange earnings.
In the light of the strategic importance of the oil and gas industry to the Nigerian economy, a major disruption of production activities of the “Petroleum Complexes” in the Niger Delta could certainly have devastating consequences for the monocultural economy of Nigeria. Events over the past decade certainly justify this conclusion. The violent eruption of youth militancy between 1993 and 2007 threatened to close down the oil industry. Several attacks and occupation of oil platforms, flow stations, operating rig terminals, pipelines, refineries and power installations incapacitated the petro businesses in the region. (Goldwyn, 2005)
Shell was forced to shut down operations in many parts of Delta costing the company and government an estimated one million dollars daily. Shell apparently suffered 180 disruptions of oil production between 1993 and 1998: “an estimated loss of 315 million dollars (about N25.5 billion) due in the main to shut downs, occasioned by sabotage of its operations in Ogoniland only.”(Nwabueze, 1999) Between January and August, 1998, Shell installation in the eastern division alone were blocked 117 times leading to a loss of about 11 million barrels of Crude oil estimated at 1.32 billion dollars.
In Rivers, Bayelssa and Delta States, more than 15 of Shell’s flow stations were shut down in October alone, leading to disruptions in the schedules of oil lifting both at the Forcados and Bonny terminals. Within this period, the NNPC/Shell venture incurred the a loss of over 25.12 billion dollars forcing the company to declare a force majeure, an

ISSN 2039-9340 Mediterranean Journal of Social Sciences Vol. 3 (11) November 2012
79
“exculpation clause that shields the company form bearing liability for non fulfillment of its contractual obligation of prospecting, mining and exporting crude oil” (Zandviet and Pedro, 2002).
The situation has since assumed a frightening dimension for the petroleum industry both in terms of scale and geographical reach with the mayhem in Port Harcourt and attack on the Aluminum Industry at Ikot Abasi, Akwa Ibom State. As Traub-Merz and Yates (2004) observes, “Nigeria has indeed become the very symbol of oil—related violence. The Niger Delta where most of the oil produced is literally aflame. Forceful occupation of flow states, vandalization of pipelines, kidnapping of oil managers, bunkering (stealing of oil), clashes between heavily armed militias, retaliation by the armed forces.” This volatile condition in the Niger Delta has constituted the graves affront to the security of the Nigerian state (as its affects the entire spectrum of the oil and gas industry) prompting equally forceful response by the Federal Government. According to Afolabi Akindolire (Nigeria Today, 2007:25):
Between January and October 2006, at least 20 militants’ attacks were inflicted on oilfield installations and operations. The Nigerian Natural Petroleum Corporation (NNPC) estimates that from 1994 to 2002, pipeline vandalization incidents increased exponentially, leapfrogging from 18 in 1994-1999, to 578 by 2000. NNPC estimates that from January to December, 2002, the loss of revenue through vandalization of pipelines was more than 7.7 billion. The hostilities leaped into catastrophic proportions early last year with the blast of a gas line reapplying the 1000 MW Egbin Station, the country’s largest thermal generating plant.
This current dimension of the crisis is arguably a systemic consequence of the multiple disorder arising from intense bureaucratic politics in the policy process under the Olusegum Obasanjo and his successor Umaru Yar’ Adua administrations. The difference with Ibrahim Babangida and Sani Abacha era is that in the prevailing circumstances, bureaucratic resistance to change is confronted with equally determined and organized Youth resistance movements (MEND, NDVF, NDV, etc.) The judicial murder of Ken Saro-Wiwa and the Ogoni nine by the brutal regime of Sani Abaeha transformed the non-violent agitation into a vortex of conflict and insurgency driven by mass conscientization and mobilization. Thus, “what began as an idealistic struggle by Niger Delta youths to protest unemployment, pollution and inadequate political compensations has degenerated into exploitative abductions…” (Newswatch, September, 2007:19) At issue is the conjunctural crisis of:
Diametrically opposed views of security in the Niger Delta between the local communities, the state (FGN) and the oil multinationals. As Okechukwu Ibeanu (2000:25) has put it, “for oil-bearing communities, security means the maintenance of the carrying capacity of the fragile Niger Delta environment—state officials and petro business, on the other hand, see security in terms of uninterrupted production of petroleum irrespective of environmental and social impacts.”
The role of military force in the resolution of the escalating crisis in the context of the accelerating militarization of the region. MEND has for instance, given as a reason for the recent attack on the Bonga oilfield the “leaked Joint Task Force secret brief to the chief of army staff, which authored military line of operation to stem military in the region, the appointment of Prof Ibrahim Gambari to Chair the Niger Delta Summit, the over 400 billion budget for security in the Niger Delta, have provided the impetus for the recent spate of attacks.” (Buardian, Friday, 27, 2008:31)
The pressure towards decisive action against the militants has been a constant theme in defense planning. Under the current administration, the reorganization of the Joint Task Force and the infusion of logistical resources and raising of troop levels to divisional status became a policy objective. This position is reflected in several policy statements and press briefs from the Defence Headquarters. Following President Umaru Yar’ Adua directive to the military to “fish out those behind the attack on Bonga oil facility, the Chief of Army Staff declared that “anyone who thought that it lacked the capacity to root out militancy in the Niger Delta or insurgency in any part of the country not to dare it.” (Sunday Punch, July 6:8). In a propaganda pamphlet obviously sponsored by the Federal Ministry of Information, captioned “Militants: The Enemy Within” (2009) by the “Niger Delta Peace an Development Partners”, the Niger Delta insurgents are portrayed as extortionist and criminal elements – Cultists political thugs, armed bandits – our to perpetrate destructive acts of social banditry for selfish ends. According to the publication:
Militancy as a word has been misused and abused in the Niger Delta situation. Armed robbers, kidnappers, assassins, pirates etc. now claim to be militants because their activities in our communities are similar in nature. So to be called a militant is one of the most shameful and dreaded name because it means you could be robbers, pirates, assassins…in short a criminal (NDPDP, 2009)

ISSN 2039-9340 Mediterranean Journal of Social Sciences Vol. 3 (11) November 2012
80
This piece of propaganda double lie is clearly indicative of the direction and dominant mindset of the bureaucratic complex that control policy decisions under the current administration of President Umaru Yar’ Adua. It is not surprising, therefore, that a member of the northern establishment in the House of Representatives proposed as a “final solution” to the Niger Delta problem “Sacrificing 20 millions out of 150 million Nigerians to bring the boiling Niger Delta to heel and give the rest of the country some respite”! Such a callous disregard for human life is fast defining the cultural boundaries (ethnic vortex) that characterize the “fault lines” of Nigeria racial landscape. It also explains the scorch earth military operations in Odi and Gbaramater Kingdom of Warri. In response to the above legislative rascality, Juriaid Mohammed, a Second Republic Senator, has noted rightly that “eliminating 20 million people so that the remaining 150 million can have an easy peace is a delusion, and clearly that illiterate scoundrel does not even know his history. Wherever that kind of drastic thing was adopted it never led to permanent peace or to permanent democratization” (The Nation, Friday, July 10, 2009:13) Nevertheless, his own solution of eliminating the elite in the Niger Delta and the rest of the country (the Rawling style) is equally oblivious of the lesson of the January 1966 military coup d’ etat: that is, how in the murky vortex of Nigeria’s ethnic cauldron, revolutionary action easily triggers genocidal retaliatory impulses. Thinking in terms of absolutes – “militants as criminals” or “eliminating elites” to save Nigeria – only suggests failure of circumspective contextualization of social discourse and, therefore, preempting effective policy response. It is in this regard that Wole Soyinka has noted that:
The attempt in some quarters to confuse issues by refusing to separate the principled militants, such as members of MEND and its affiliates, from the opportunistic mercenaries and criminals, has always struck me so dishonest and diversionary. Separating the wheat from the chaff is a simple enough process. (The Nation, June 26, 2009:3)
The first step to deconstructing the banal premises (that equates legitimate militants with banditry) as the rationale for military action is, as Soyinks put it, to recognize than the “Delta contestation is a product of the desperate sustenance of the very immorality of the Nigerian State – and the continuing, corrupt desperation of power.” On this view any policy decision that glosses over the sordid condition that precipitated the armed revolt in the region in the first place cannot provide sustainable basis for peace. Thus, the former Minister of Petroleum Resources, Tam David-West recently admonished that “it would be rash to assume that the last minute mass surrender by leaders of Niger Delta militia at the weekend has ended militancy and restiveness in the oil – bearing region”. According to him, the “amnesty programme would fail, unless government addressed the fundamental issues that led to the insurgency.” (The Daily Sun, 28 October, 2009) 3. Military Option The case for force is invariably based on the consideration that it is the primary responsibility of the armed forces of any country to defend its core and context specific values (the survival of the state and the life and properties of its citizens) against external aggression and domestic insurrections. Thus, whether conceived in terms of its direct or indirect employment, the military has become in the modern era the legally sanctioned instrument of violence which states use in their relations with each other, and, where necessary, in an internal security. To paraphrase, William Kaufman (1956:234) it is not easy to see how domestic and international order can be maintained, if military power were totally absent. The sheer imperative of preserving physical security—territorial integrity and resources—from violent threat has inevitability entailed the deployment of national “power of resistance” as a counter to such developments. In this regard, the development of an effective military institution (armed forces with the requisite combat power) has been considered a sine qua non by most governments – an indispensable instrument of national preservation and survival in the face of unpredictable and capricious circumstances (Bassey 2005). As a consequence, the security policy of a state may be seen as “that set of decisions and actions taken by a government to preserve or create an internal and external order congenial to its interest and values primarily (although not exclusively) through the threat of use of force” (Kolodziej, 1982). The Nigerian State is not an exception to this rule, as the imperative of sheer physical survival has in the past and recent occasions compelled the activation of the armed forces as an instrument of pacification and crisis in the country since the end of the civil war in 1970. Specifically, in the Niger Delta case, as one writer has noted: “As a sovereign power, Nigeria has the obligation to secure its territory, natural resources and, if necessary, to enter into agreements to achieve these objectives” (Lubeck, 2007:20). The graveness of the growing insurgency against oil facilities in the region

ISSN 2039-9340 Mediterranean Journal of Social Sciences Vol. 3 (11) November 2012
81
in terms of the overall liquidity of the Nigerian state was not lost to the Federal Government since the Administration of General Babangida. (1984-1993) From the standpoint of the Federal Government, the organized assaults of Delta youths, especially under the Movement for the Emancipation of the Niger Delta (MEND) and the Niger Delta Vigilante (NDV) amounted to acts of subversion that called for decisive action. The Government response was characteristically, therefore, forceful and unequivocal: the youth militancy under whatever guise constitutes a mortal threat to the security of the Nigerian state and must be contained by whatever means available. Hence, the Federal Government charge that the “seemingly unending violence in the Niger Delta area was being championed by a dangerous band of psychopathic, merciless mercenaries who exploit their sophistry to kill, rape, kidnap, destroy and extort money from anybody available” (Ofuoka, 1999:8). The directive to the Joint Task Force Commander was equally “specific” and “unambiguous”: “to dislodge perpetrators of violence, restore Law and order and apprehend murderers”. To provide legal backing to this directive, General Babandiga Administration promulgated a Decree (3rd May 1993) making youth activism in the Niger Delta a treasonable felony. This directive initiated the first major deployment of army troopers, naval contingents and frigates in the flashpoints of the Niger Delta. The army operations was initiated under the River State Internal Security Task Force commanded by Major Paul Okuntimo and subsequently, Operation Hakuri II, under Lt. Col. Agbabiaka, in the wake of the murder of 12 police officers at Odi, Bayelsa State. According to the Defense Minister, General Theophilus Danjuma, Operation Hakuri II was initiated, among other things, to protect pipelines, refineries and power installations in the Niger Delta. In a broader context, the army search and destroy operation was specifically targeted at the organization network and infrastructure that support militant movements in the Niger Delta. The resulting mayhem has been described as “Oil, Blood and Fire” (Okonta and Douglas, 2003). Similarly, the Navy has the broader operational task of (i) maritime surveillance and interdiction of vast quantity of sophisticated weaponry coming into the Niger Delta (ii) the protection of offshore oil platforms from attack and occupation by the militant and angry youths (iii) protection of flow stations, operating terminal and lives and property of nationals and expatriates in the petroleum industry. The roles of the Navy became even more critical in the operational context of the geography of the Niger Delta: the 36,000 square Kilometers of marshland, creeks, tributaries and lagoons which drain the Niger River into the Atlantic at the Bight of Biafra. With several of the flashpoints almost completely surrounded by water, the containment of youth militancy became the provenance of the Navy. These series of military activities were followed by:
Operation Restore Hope launched in August 2003, with the purpose of containing the “destructive actions of militant youths in the Niger Delta by arresting the degenerating security situation” and preventing the crisis from spreading to other parts of the region and Operation Flush out III, launched in September 2004, to curtail gangsterism and banditry in Buguma and Okrika towns of the River State. With the escalation of insurgency since 2007 and the spectacular attack by militants on pipelines and the largest offshore oil facility, Bonga oilfield, the situation is fast deteriorating into a full scale war with the current Federal Government orders to the JTF to crush the militants.
In May this year (2009), the Joint Task Force (JFT) finally unleashed the long planned offensive in the Niger Delta involving Land, Sea and Air contingents of the Nigerian armed forces. The operation was planned to annihilate the network of militant camps and paralyze the ability of the armed youths to organize and carry out operations on the vast network of petroleum complexes in the Niger Delta. It was, as Sunny Awhefeada noted, the “most horrendous and fratricidal onslaught, the ongoing military blitzkrieg has been conceived to brutally subjugate, and if need be annihilate, a target group that has championed the Niger Delta struggle for a decade now. The commando – like pounding of Niger – Delta communities and Creeks is nothing but war”. The civilian casualities were equally appalling: “thousands of innocent citizens died, hundred of thousands displaced, hunger and hardship now stalk the living” (Guardian, May 25, 2009:67) The assault only succeeded in aggravating the situation in the petroleum industry as the militants responded with a devastating string of attacks on the pipelines, flow stations and depot: Escarvos – Warri petroleum products marketing company pipeline; utoma flow station; Makarabo – Abiteye pipeline; shell pipeline conveying crude oil from Billekrama to Bonny Export Terminal; Shell’s Forcados offshore platform; Chevron’s Okomanifold; and Atlas Cove terminal in Lagos. The assault of the Joint Task Force may have been orchestrated to justify the disproportionate budgetary allocation in the 2009 fiscal allocation; however, in terms of its strategic objective of destroying the resistance of MEND and its affiliates, it was unmitigated failure. The insurgents simply melted into the vast mangrove swamps of the Delta, reorganized and struck back with unprecedented ferocity at the oil and gas infrastructure. Among the obvious consequences was the precipitate decline in power generation and the mayhem of darkness in Nigerian cities.

ISSN 2039-9340 Mediterranean Journal of Social Sciences Vol. 3 (11) November 2012
82
Clearly embarrassed by this development the Federal Government moved to diffuse the escalation of military operation and insurgency response through conditional offer of amnesty. (The Nation, June 26, 2009:1-2). Providing a justification for these developments, President Umaru Yar’ Adua declared that:
Developments in the nation’s Niger Delta region over the past few weeks have necessitated the Federal Government decisive action against armed criminal elements who have hijacked genuine agitation in the region and constituted themselves into very real threats to Nigeria’s national security and economic revival. (The Nation, 5 July, 2009: 13)
There is doubt, however, that the “military onslaught has been counterproductive and has proved to be futile in addressing the fundamentals”, as one representative of the civil society organization has noted. Similarly, the offer of 60 days amnesty amounted only to dictating rather than negotiating peace in the region. Hence the current Defence Minister, General Godwin Abbe’s ultimatum that, the Federal Government does not recognize the Movement for the Emancipation of the Niger Delta (MEND) and will after 4th October, 2009, take “whatever action necessary to restore normalcy to the Niger Delta” (Sun, Wednesday, 30 September, 2009) 4. Contestation The pertinent question that has arisen from these series of military operations is of course how effective have they been in containing the explosive situation which threatens the petroleum infrastructure in the region. In terms of operational balance sheet, the honest answer would be minimal. This is hardly surprising given the geographical and political context of the escalating insurgency in the region. First, some analyst have argued that the situation would have been worse than it is today if the armed forces had not been deployed in strength to contain the rising tide of youth militancy in the region. In other words, if left unchallenged, following the Kaima Declaration by the lJaw Youth Council on 2nd December, 1998, the militant youths under such organizations as Egbesu Youths, Arogbo Freedom Fighters (AFF) and Movement for the survival of the lJaw Ethnic Nationalities in the Niger Delta (MOSIEND) could have isolated the region and dictate oil production and export policy through acquisition. This is so because despite the multiplicity of the ethnic based youth protest movements, they share similar fundamental policy goals: self determination, land and resource control and environmental security. Military operations in this respect were meant to:
Effectively curtail and deter attacks on oil and gas facilities, Check and paralyze the growing profitable business of oil bunkering (stealing) that fuels the informal economy of Niger Delta, Stem social banditry, trade in arms, drugs and kidnapping that has created an atmosphere of fear and unsettled condition in major cities such as Port Harcourt and Warri, and Through the deployment of the Navy ensure the protection of oil Riggs and oil supply route in and out of the Gul of Guinea (Metogo 2006).
Thus, the military option, as one contributor to a recent forum on the Niger Delta put it, “has its short-term benefits of checking elements that are masquerading as fighters for the rights of the area, but they would be short term”. It is perhaps on this ground that there is a widespread view in the Nigerian Defense Establishment that if certain structural requirements of the forces deployed are met by the Federal Government, the military can decisively prevail in the Delta region as it did over “Issac Boro’s rebellion, Maitasine uprising, Odi and Zaki Biam crises” among others. This line of thinking is perhaps best represented by comment from an army officer who completed a tour of duty in the Delta (The News September, 2007):
The Federal Government ought to take decisive measures in handling the crisis. In as much as the government has commercial responsibility for infrastructure and economic development of the Niger Delta, the resort to arms by youths of the area and attack on security and military forces need not be condoned. Therefore there is need for government to take decisive military actions against any group who attack security and military forces. This could be achieved by attacking all known militant camps which includes Camp 5, Camp Africa, Okerenko and AGIC camps. Thus, avoid setting dangerous precedence which could lead to anarchy in the country and more problems in future.

ISSN 2039-9340 Mediterranean Journal of Social Sciences Vol. 3 (11) November 2012
83
On this view, the failure of the armed forces to accomplish the operational objectives of Operation Restore Hope and Operation Flush Out (“arresting the deteriorating security situation in the region and to prevent spread of the crisis to other parts of the Niger Delta”) has less to do with the difficult terrain of the Niger Delta and the determination and dexterity of youth militancy, but more to governmental equivocation at providing the necessary logistical resources to the Joint Task Force. These include:
• Inadequate logistics support especially of “troop carrying gunships, uniforms, petroleum, oil and lubricant (POL) and provision for other basic essentials”;
• Lack of specialized equipments such as flat bottom boats (FBB), fast patrol craft (FPCs), Inshore patrol craft (IPCs), helicopters and POL storage facilities like bowers. Others include communication equipment, operational vehicles, ballistic floatation vests, night vision devices and appropriate arms and ammunition;
• Surveillance devices like MPA, coastal radar, UAVs for extended coverage and intelligence gathering; • Dedicated military jetties to enhance operational efficiency of the JTF. The use of civilians control jetties under
the Nigerian Ports Authority “exposes the FPCs to possible attacks or sabotage”; • Specialist training in jungle amphibious and counter-terrorist warfare, to improve performance of troops and • The imperative need to raise the troop level by additional Brigade to ensure effective controls of the difficult
environment in the Niger Delta. The mandate of JTF initially recommended troop strength of Brigade level, whereas the current realities suggest a divisional strength for effective response.
While there is need for troop deployment in the region to contain the criminal excesses of banditry, bunkering and attacks on petroleum facilities, it is quite pertinent and legitimate to ask whether if all the above requirements for operational effectiveness were met, the military option alone can contain and stifle the current rebellion against the Nigerian state and multinational oil companies. The answer of course is categorically no. Evidential support for such a pessimistic appraisal derives from two sources. The first is essentially extrapolative, the conventional wisdom regarding the ineluctable linkage of the past, present and future. The second source of empirical evidence, linked to the first, concerns development in three major areas of intra-system relations. First, the troop surge in the Niger Delta since 1993 has only aggravated rather than diffuse the situation in Niger Delta if considered in terms of the minimum threshold of assessing the success of any peace support operation: (i) “success in accomplishing the mandate, and (ii) “contribution to stable peace and security” (Bellamy and Williams, 2005:179). After a protracted period of battling insurgency in the region, the current situation as reported by the TELL Magazine (“50 years of Oil in Nigeria” 18th February, 2008) is grave: increasing and audacious attacks on oil, and gas facilities and ships, bunkering, piracy, kidnappings, gangsterism and banditry. As Governor Chubike Amaechi of Rivers state lamented:
Security remains the greatest challenge threatening our state. While this time it was difficult to ensure the safety of lives and property as aliens were taken at will and kidnapping became almost a daily occurrence. This is a place where criminals and warlords were on the prowl, foreigners were leaving our state in droves and investors divested from our state.
These attacks took a catastrophic dimension with the 2006 blast of a gas line supplying the 1000 MW Egbin Station, the country’s largest thermal generating plant. Worrisome and destabilizing of the industry is the recent attack on the largest offshore of facility, the Bonga oilfield, which produce 225,000 barrels and 150 million cubic feet of natural gas per day. It is not, therefore, surprising that the Guardian Newspaper of Monday, 18 February, 2008, reported that “Crude shut-in hits one million barrels per day” based on the report of Auditors at the National Petroleum Investments Management Services (NAMPIMS): “Nigeria and its joint venture partners both in joint ventures and PSC may be losing $90 million (10.8 billion Naira) on a daily basis from this shut-in the countries. The second consideration is obviously that the use of force only confronts the symptoms rather than the root cause of the crises. From a policy standpoint, dealing with effects of protracted social crisis (bunkering, kidnapping, piracy, vandalism/sabotage, gangsterism etc.) rather than the deep fissure of youth revolt and militancy in the Nigeria Delta may only aggravate rather than diffuse the increasingly explosive situation. As widely reflected in the literature, the root causes of the crises in the Niger Delta are political and economic which engendered marginalization, poverty and environmental degradation (proximate causes). These in turn triggers widespread social discontent: frustration and powerlessness; loss of livelihood and widespread sense of relative deprivation. (Idemudia and Ite, 2006:393). As Cyril Obi has aptly argued “The reigion is by far the most central to the nation’s economic and political survival,” but paradoxically, it is one of the “poorest, least developed and reciprocated for its contributions to national wealth”.

ISSN 2039-9340 Mediterranean Journal of Social Sciences Vol. 3 (11) November 2012
84
Seen in the above context, youth militancy in the Niger Delta represents a “major contestation at two levels”: First, it is a challenge by civil groups and communities in the ND over the control of oil and the distribution of its benefits among the constituent units of the nation. Second, it is a challenge to the state and its multinational partners of policies and practices that disadvantage the region, destroy its environment and impoverish its people (Ikelegbe, 2001:438) Given this contestation, arising from the “contradiction of wealth generation amidst poverty and frustration and hostility to the state and multinational oil corporations”, the path to peace from comparative historical experience reside more in constructive engagement with stakeholders in the region (as represented by the MOU evolved under General Akubakar Administartion) rather than the escalation of military operations currently associated with the mandate of JTFs RESTORE HOPE AND FLUSH OUT III. There is no doubt that given the prevailing state of insecurity in the region, the task of arresting criminal activities, restoring law and order as well as ensuring “a secured and enabling environment for socio-economic activities and unhindered operation of the oil/gas industries is essential to the economic survival of the nation. However, this calls for the primacy of political and economic instrumentalities in conflict resolution over the brazen and unrestrained expansion of use of force, as the report of the General Ogomudia’s Committee on the Niger Delta recommends. The reason basically resides in the nature and sensitivity of the Petroleum industry. As Rudolf Traub—Merz and Douglas Yates (2004) have rightly noted, “Oil platforms, tankers, pipelines and the whole integrated infrastructure of the petroleum industry are extremely vulnerable to attacks.” The Nigerian Petroleum complexes is extensive and cannot be completely (especially the pipelines) militarily secured from insurgent attacks. Most of the oil supply is onshore “from about 250 fields dotted across the Delta”, 5,284 on—and off—shore wells, 7,000 Kilometers of pipelines, ten exporting terminals, 275 flow stations, ten gas plants, four refineries and a massive LNG project in Bonny and Brass (Lubeck, et all, 2007:5). Securing this vast network of infrastructure from Insurgency amounts to a mission impossible and at best a logistical nightmare even for a division level JTF. Thus military operation cannot compensate for political solution or eradicate insurgency in the Niger Delta in the light of glaring environmental catastrophe, mass poverty and infrastructural underdevelopment of the region. As a member of the current National Assembly, Victor Ndona-Egba has noted:
The military option having been used and some respites having been secured, I believe that we now have every opportunity to pursue, very urgently, physical and material development and to also address the root cause of the agitation proper. The primary cause was the agitation for rights and equity…But even though the criminality tended in the latter state to overshadow the genuine and authentic agitation of the region, you cannot miss out the underlying reason for the agitation in the first place – Justice equity and development.
Ndoma-Egba’s observation was the subject of a study conducted by the Center For Environment, Human Rights and Development (CEHRD) based in Port Harcourt. According to the study, the “ultimate solution” to the Niger Delta problem “lies in the ability of the Nigerian government to pursue a true and genuine agenda of demonetization, justice, economic stabilization and creation of opportunities for its citizens”. The failure of programmatic response by government to the deplorable environmental and human conditions in the region can only result in accelerated crisis of gangstersim and violence:
Armed warlords operating in the region will undermine the region and plunge it into a dangerous conflict zone where the gangs will rule at the expense of legitimate authority, development, security and proper of all. The situation works hopeless, and, again, if not checked, the blood child in Somalia and other conflict zones armed the world will be a child’s play (CEHRD, 2009).
The remedial measures required in the Niger Delta has been a subject of numerous past reports (the Poopola Report and the Alexander Ogomudia Reports etc.) and a host of grandiose development plans. So far, however, these reports and plans have either been ignored or treated with utmost levity by the majority – ethnic dominated Federal Government of Nigeria. Under the current administration of Umaru Yar’ Adua a Niger Delta Technical Committee headed by Ledum Mitee was setup to “marry all the reports, produce a simplified version and give an idea of what kind of roadmap to take”. The committee recommended, among others: A labor employment scheme that will employ at least 2,000 youths in community work in each local government in the region, and also skills acquisition or employment centers “in line with international best practices on amnesty” for ex-militants; Disarmament, Decommissioning and Reintegration (DDR) process that “begins with a confidence building measure on all sides including ceasefire and pull back of forces”,

ISSN 2039-9340 Mediterranean Journal of Social Sciences Vol. 3 (11) November 2012
85
Grant amnesty to all Niger Delta militants willing and ready to participate in the DDR programme; address short term issues arising from amnesty to militants, by providing security for ex-militants and rebuilding of communities destroyed by military invasion, work out long term strategies of human capacity development and reintegration for ex-militants. Equip the security forces especially the Navy to “effectively monitor activities within coastal waters to check illegal bunkering and trafficking of arms.” For the purpose of effective governance, the TCND recommended that the Federal Government should establish certain institutions and mechanisms to support the implementation of this report: National Minorities Commission to deal with special issues of Minorities’ and Micro-minorities; A special Niger Delta Infrastructure Intervention Development Fund to support the building of capital projects and a Multi-stakeholders Niger Delta Policy and Project Compliance Monitoring Agency to monitor implementation of these recommendations and other programmes in the Niger Delta Region, Carry out comprehensive audit and correct the imbalance against the region in matters of allocation of oil blocks, oil contracts, and allocation of marginal fields; undertake a Human Welfare and Human Misery Audit, every State of the Region as a means of capturing and redressing all incidences of violence, deprivation, killing, kidnapping, rape, and injustice in the region, and Finally, a revisit of the crucial problem of fiscal federalism as “part of a total package for rebuilding our federalism in theory and practice.” According to the report, the “fiscal dimension of federalism relates to the demand to rectify what is seen as a skewed pattern of resource generation, allocation and management.” (TCND Report, 2009, Vanguard July 6, 2009)
As was the case with past reports on the region, the current report submitted by the Technical Committee on the Niger Delta has so far received only selective attention at best or treated with contemptuous superciliousness at worst. No white paper has been issued and “no follow up implementation and monitoring mechanisms were set up by government”. (TELL Magazine, June 22, 2009) In other words, the TCND Report has suffered the same fate that beset commissioned reports on the Niger delta since the First Republic. As Ledum Mittee he noted:
It is clear that although past governments, since 1958 set up very high powered committees to look into the problems of the Niger Delta and these Committees submitted for reaching and comprehensive reports, they have suffered the same fate of non-implementation. In cases where some of the recommendations have been considered at all, they have been taken out of context and implemented piecemeal or without the required enthusiasm, consistency and monitoring (Vanguard, July 6, 2009)
This contemptuousness toward the appalling condition in oil producing areas by consecutive majority ethnic-dominated federal governments since the First Republic has generated the “current quagmire in which we find ourselves in the region and country today which has culminated in violence, kidnappings, oil theft, illegal bunkering, political uncertainty, economic dislocation, divestment, and inter and intra-community suspicion and conflicts”. (Guardian, July 31, 2009) The inevitable consequence has been the protracted social conflict resulting from the “creeping insensitivity, neglect and at time, marginalization of already powerless and devastated communities which has made it possible for political opportunists, bad leaders, corruption, waste, institutional decay and inefficiency to thrive” (The News, June 8, 2009) This brazen condition of domestic colonialism was aggravated overtime by the syndicated and programmatic “political instrumentalisation of social disorder”, arising first from the “skewed pattern of resource generation, allocation, and management” through the proliferation of states and local government administrations in the majority ethnic-group geopolitical spheres. Second, this strategy of extraversion was granted legitimation through fiscal commission which literally strips oil-producing communities of statutory entitlements to revenues generated from oil exploration. These include the Dinah Commission of 1968, the Ojetunji Aboyade Commission of 1977 and Pius Okigbo Commission of 1979. As far as derivation principle enjoyed by the majority-ethnic dominated regions in the First Republic was concerned, for the oil producing states, the recommendations of these Commissions resulted in a State of “elimination without substitution”. Thus Karl Maier has graphically noted in this regard that:
Immense wealth that oil represented was there to see but not to touch. People felt abandoned by the newly independent government of Nigeria and the companies that removed petroleum from their land but provided scare educational and health facilities in return. Many locals saw an almost spiritual correlation between the arrival of the oil companies and the declining fertility of the land. The seeds of future conflict had been planted, and it was only a matter of time before they bore their explosive fruit.
This differential treatment of oil producing communities and states, compared with the cash crops (groundnuts, cocoa, palm oil) producing regions of the First Republic, was reinforced by elaborate pseudo-legal contraptions designed to

ISSN 2039-9340 Mediterranean Journal of Social Sciences Vol. 3 (11) November 2012
86
sustain the hegemonic structure of state-societal relations which operated in favour of dominant ethnic-nationalities in Nigeria. These include the Petroleum Decree (1969); the Petroleum Act (1969), the Exclusive Economic Zone Act (1990); the Land Use Act (1990), the Revenue Allocation Act; the Oil in Navigable Waters Act; Petroleum Production and Distribution, Anti-Sabotage Act; the Minerals and Mining Act no.34, 1999; Lands (Title Vesting etc) Decree No. 52, 1993, and Section 44 (2) of the Constitution of the Federal Republic of Nigeria, the Revenue Mobilization, Allocation and Fiscal Commission and National Inland Waterways Authority Act. On the basis of these considerations, Chris Akiri has aptly concluded in his analysis of two era of fiscal federalism and subsisting regimes in Nigeria that:
The four commissions on revenue sharing formula – Phillipson Commissions of 1946 and 1951, the Chick Commission (1953) and Raismon Commission (1958) – took into consideration the peculiarities of the federating regions and plumbed for derivation as the best option for the country. Those were the pre-oil days. But with the emergence of petroleum oil as the mainstay of the Nigerian economy in the mid-sixties, Nigerian leaders from the so-called three major ethnic groups (including Chief Accolowo) began to vociferate the oneness of the country, vigorously intoning and apotheosizing the oxymoronic conflation of “unity in diversity” (Guardian, September 30, 2008)
It is not, therefore, surprising he concludes that in 1965, the “Binns Commission, reading the collective mind of the oppressors, put an accent on equality of status and financial comparability as the dominant principle of revenue allocation”. Even Obafemi Awolowo who astutely defended the principle of derivation in relation to the rights of the regions to “keep any wealth that accrues to it either by the sweat of its brow, or by cunning, or by the unaided bounty of nature”, could not escape the inanity of propaganda double – lie when it came to the petroleum resources of the niger Delta and helped shaped the Petroleum Decree (1969) and Petroleum Act (1969) that contradicts the grandiose postulations in his book “The Strategy and tactics of the People’s Republic of Nigeria” (1961). Prognosis for Action It is, therefore, pertinent to conclude from the above observations, that the path to peace and sustainable development of Niger Delta Communities lies in empowerment through a policy regime which recognizes the organic linkages between security, economic empowerment and development. What this structural condition entails is that the security policy response of the Federal government to the unsettled condition in the Niger Delta must address a spectrum of factors beyond the traditional concern for the defense of petroleum installations against internal subversion and external complicity and attack. These (in the Niger Delta) include a set of interrelated issues that now impact inexorably on policy formulation and planning. First, security issues and policy responses in the region must be situated within the changing policy context: mass conscientization and popular revolt against ecological devastation and neglect which have “left much of the Niger Delta desolate, uninhabitable, and poor”. Security in this sense:
Refers to the carrying capacity of the fragile biophysical environment of the Niger Delta. It is the realization that an unsustainable exploitation of crude oil with its devastation of farmland and fishing waters, threatens resource flows and livelihood for both individuals and communities as collectivities, when a population feels its threatened livelihood it feels insecure. Therefore, elimination of deprivation is a key concern of the oil-bearing communities of the Niger Delta. Since the state and its allies appropriate almost all the oil wealth from these communities, they are resentful of the state and petro business and feels that a good part of the financial resources should be invested in the communities” (Ibeanu, 200:24)
Second, the security policy of the Federal Government toward the Niger Delta must recognize the transformed social context: the dynamics and dialectics of the region’s “distinctive political economy”. Security in this context designates the “capacity of groups (and individual as their agents) to provide their physical and psychosocial need and livelihoods”. This means a progressive “elimination of objective conditions that limit this capacity, as well as reduction of fears and anxieties about their abilities to meet these needs”. In this sense, “security had to do with protection from poverty, exploitation, disease, bio-chemical contamination, injustice, and the like. The issue here is the control of resource flow” (Ibeanu, 2000:26). This new imperative as Orubu (1999:210) argued, is “based critically on the argument of sustainable development and intergenerational equity, potential output loss, negative externalities of oil industry activities and the implied new expenditure requirement in respect of mitigating and ameliorating programmes in oil producing communities.”

ISSN 2039-9340 Mediterranean Journal of Social Sciences Vol. 3 (11) November 2012
87
This new direction in thinking seems to have influenced both the General Abubakar and Obsanjo Administration initial policy thrust in the Niger Delta. This is the conviction that the approach of the previous military regimes of General Babangida and Abacha glossed over fundamental problems of state-societal relations in a highly unsettled social system with deep segmentations along ethnic lines such as Nigeria. In the process there was an “implicit disjunction between the state and society, slurring over questions about the social foundation of political power and the making of public policy” (Alavi and Shanim, 1983:289).
This consideration of stick and carrot approach may have underscored General Abubakar’s conciliation moves in the Niger Delta by dispatching a high level delegation of military officers (Including Adm. Akhigbe, then Chief of General Staff, and General Bamiyi, the Chief Army staff and their civilian counterparts in government) on tour of the “trouble area to appeal directly to the people and through their traditional rulers, to bury the hatchet”. This was followed two years later by President Obasanjo’s comprehensive institutional response through the Niger Delta Development Commission. In other words, the Federal government policy toward the oil producing communities reflects the belated realization that youth revolts and violence in the Niger Delta in only a symptom rather than the cause of such crises. Everywhere in the world (Brazil, Colombia, Congo, Indonesia etc.) revolutionary pressure develops in condition of poverty and marginalization amidst the exploitation of natural wealth of the communities on ancestral lands. Finally, the government should ensure through rigorous monitoring and evaluation of the activities of the NDDC that, as an interventionary regime, its activities and performance profile meet the expectations outlined in the instrument of its incorporation. A contrary development could be catastrophic in the light of the multiple failures of past interventionary regimes, from the Niger Delta Development Board of the First Republic to the OMPADEC and Petroleum Trust Fund of the Generals Babangida and Abacha era. In the final analysis, the various communities of the Niger Delta will judge the success or failure of the Ministry of Niger Delta and the Niger Delta Development Commission, (and ultimately the seriousness of the Yar’ Adua administration) in terms their effectiveness. As the Warri Accord puts it, the ultimate goal is to address the “dire and urgent need for the provision of basic amenities such as constant electricity, potable water, good roads and dredging of our riverine waterways with a view to the rapid modernization and urbanization of our reverine and township areas” in the Niger Delta. This, in sum, constitutes the terminal objective of conflict resolution in a condition of multiple disorders such as the Niger Delta Region.
It is within the context of this policy thrust that a number of proposals have been put forward during the series of intervention and workshops in the past eight years of Obasanjo/ Yar’ Adua Adminstrations. Of particular interest is the dual, if controversial, options put forward by Ebere Onwudiwe, a professor of political science at the Central State University, Ohio, United States of America: the Alaska and Abuja options. The Alaska option derives from the policy of the Union torwards Alaska in which its “citizens are entitled to their share of oil revenue payment.” On this view he proposed that “the best way to tackle the Niger Delta problem is direct cash transfers to Nigerians”:
This model of taxable resource revenue distribution to individual Deltans creates a powerful endowment effect that has significance for government accountability. People care more about their money (income tax for example) than the allocations to their state governments that they never get to see the legal gramework for the implementation of this model is for government to decide what share of derivation fund should go to the state government and how much should go to individual citizens of the Niger Delta. This can be established by a special loan that will also set up a Niger Delta Revenue Distribution Agency perhaps under the NDDC or as an independent entity.
Although from Onwudiwe perspective, this model could impact directly on the life expectancy of beneficiaries, however, the inflationary consequences for a country that imports virtually all consumer products was bound to be catastrophic. Such direct payment will only encourage ostentatious life style through massive acquisition of foreign imports rather than productive investment. The oil producing communities could certainly benefit more from the commitment of derivation allocations directly to physical quality of life infrastructures: roads, light, water, hospitals, schools, community library, and ICT learning resources.
The second option according to Onwudiwe’s proposal is for “the federal government to build from the scratch a brand new Federal Delta City, FDC, on a territory carved out of three adjoining Delta States”:
The city which should be our country’s second planned metropolitan could start as the hub of new petrochemical industries that use petroleum and gas as raw materials. The construction of such a city will constitute an employment bonanza for many Nigerians and the peoples of Niger Delta. Once this is done, the hands that now reach for the revolver and machine guns, will be gainfully employed and this would be appropriate antidote to militancy. (Newswatch, 2007:17)
ISSN 2039-9340 Mediterranean Journal of Social Sciences Vol. 3 (11) November 2012
88
However, there is current unease about the seriousness and the direction of the current administration of Yar’Adua. The fur ore over the proposed Niger Delta Summit under Professor Ibrahim Gambari is indication of public temper. As reported by a newspaper columnist (Sunday sun, June 29,2008:8), the “militant group contended that rather than hold another conference, the Federal Government should implement the report of the General Alexander Ogomudia Panel on the Niger Delta, which was set up by the immediate past Olusegun Obasanjo administration as a starting point for further negotiations”. In a characteristic manner, President Yar’ Adua yielded to protest and replaced Gambari (his kinsman) with Mitee (a Deltan), noted above, but finally ensured that the Report of the Technical Committee on Niger Delta (TCND) was given the treatment it deserved: ignored. Instead in May 2009 he yielded to the option the military establishment has been pushing and resisted by the previous administration of Obasanjo: a coordinated assault on the militant camps and positions in the Niger Delta. Under the pretext of unacceptable provocation – seizure of foreign ship and its crew – the JFT unleashed ground, air and sea assault – on militant camps. The allegation of piracy and bunkering as causes belli was, however, not convincing to the general public as there is signigicant evidence to the effect that “some JFT commanders, some serving and retired military top brass, top politicians and Nigerian National Petroleum Corporation personnel are part of the burgeoning bunkering bazaar” (TELL, 22 June, 2009). As one of the militants put it, “ships involved in bunkering are not planes. They do not fly in and out but go through series of security barriers”. On the contrary, as was widely revealed in the tumultuous days following the death of General Sani Abacha in 1998, all members of his Armed Forces Ruling Council had oil wells and were tied to the network of illegal oil trade. As one member of the current National Assembly has noted: “What is going on in the Niger Delta is no longer the legititmate struggle of the people for a fair deal, but an “economic war” between the JTF and militants who are fighting for their pockets.” (TELL, June 22, 2009:26). Indeed, as TELL Magazine Special Report noted:
The militants are stubbornly barging into the bunkering business because they feel the oil belongs to them and that outsiders are feeding fat on the illegal proceeds. They also feel that the proceeds of the oil legally sold are also stolen by government officials. As a result of the rising income profile of some Niger Delta people, including militants, sources say they are becoming financially strong enough to go beyond just providing security for the bunkers proper. This has been a major source of conflict. That is why the JFT is cracking down on “indigenous” operators in the upstream and downstream sectors of the black market of the oil industry.
The failure of the May 2009 offensive of the Joint Task Force (JFT) to achieve its strategic objective (“final solution”) of “flushing out brigands and cowing criminals” in the Niger Delta, the Federal Government came out with the “face-saving option of an amnesty for all militants who surrendered their weapons and renounced armed struggle.” (Guardian, July 31, 2009:22). Although the Federal Government has declared the disarmament and decommissioning exercise an unmitigated success, there is, however, considerable evidence to support the skepticism that among the thousands of “militants” that “surrendered” are the “bayside boys” (Lumpenproletariat), the teeming unemployed youths of the sprawling shanties of cities and towns (such as Port Harcourt and Warri) in the Niger Delta. These youths have been extensively associated with clandestine activities such as the sale of small arms and light weapons, drugs and political thuggery during elections (“hired guns”). The Movement for the emancipation of Niger Delta (MEND), for instance, has distanced itself from the exercise and only declared indefinite ceasefire after its series of retaliatory attacks. Said Adejumobis observation is highly germane in this regard:
What then do we make of the current amnesty by Yar’ Adua in the Niger Delta given these contexts for amnesty provision? Perhaps the president and his advisers seek to provide incent rue for the militants to shelve their guns and see reason, which may be a basis for future peace talks. But the president has not tabled any proposal of a dialogue or talks with the militants – he only offered unconditional amnesty. The second possibility may be just for the regime to be seen to be doing something without any clear agenda of what it seeks to achieve and how it seeks to achieve it. At least granting amnesty is a big media hype especially in the western world. The amnesty may them provide a diversion for the Nigerian state to complete its military operation and wipe out the militants completely from the region. (Guardian, July 13, 2009:73)
It is obvious that amnesty alone does not address the objective conditions – injustice and underdevelopment of the region – that precipitated the revolt in the region in the first place. As the chairman of the Technical Committee on the Niger

ISSN 2039-9340 Mediterranean Journal of Social Sciences Vol. 3 (11) November 2012
89
Delta, Ledum Mitee, noted, “Amnesty as stand-alone that fails to accompany some attempts to address the issues could be counterproductive… Dealing with militancy alone might be dealing with the symptoms of the problem. Indeed, dealing boldly with the fundamentals isolates the militants and removes the rug from under their feet”. Elizabeth Donnelly, African Programme Manager at the British Institute Chatam House, has similarly observed that “it would be unrealistic to say this is the end of the Niger Delta’s problem. The amnesty process is a chance to implement some change but there are a lot of reasons to be skeptical since there could be more broken promises.” In the light of past betrayal and implementational failures, it would be a historic achievement of incalculable proportion for the Umaru Yar’ Adua administration if it overcomes bureaucratic obstacles and intrigues and sustain the Disarmament, Demobilization and Reintegration process (DDR). However, both his style of leadership and the enormity of countervailing social forces (representing powerful majority-ethnic complexes) suggest that the “crisis may linger for a long time”. Considered from this standpoint, Adejumobi’s (2009) conclusion is irresistible: that the “serious democratic deficit in Nigeria’s political system today suggests that the Nigerian ruling class still cherishes violence in realizing political ends or goals…Wherever the democratic voices of the people cannot be heard and prevail armed resistance tends to be an attractive option especially for those who are already engaged in it.” How this dialectics of force and resistance is played out will determine the future of Nigeria in the next decade: failed, collapsed or problematic State? The grim prognosis of the Western Intelligence Community (especially the US Intelligence Report of 2005-2008 on Nigeria) notwithstanding, with any post – Yar’ Adua leadership audacious enough to unleash social change the catastrophe of the accelerated unjunctural crises and deep contradictions in the Nigerian social formation may be deferred if not avoided. As yusuph OLaniyonu (This day, 5 November, 2009) has forewarned, “time for sloganeering should be over. What is needed now is real action…concrete development programmes must be embarked upon immediately. We cannot afford to lose the current momentum.”
References
Alavi, H and Shanin, Sociology of Developing Societies. London: Macmillan, 1983. Anikpo, M “Conflict in the Niger Delta: Is there a way out?” African Conflict Profile Vol. 1, No. 2, 2005: 183-191. Bassey, C.O. Contemporary Strategy and The African condition. Ibadan: Macmillan, 2005. Bassey, C.O. “Retrospects and Prospects of Political Stability in Nigeria” African studies Review, Vol 32, No.1, 1989:97-113 Bassey, C.O. “Local Governance, Resource Control and Development in the Niger Delta” in O. Uya and J. Okoro eds. Local Government
Administration and Grassroots Democracy in Nigeria. Calabar: University of Calabar Press, 2002. Clausewitz, C. On War. Edited and translated by Michael Howard and Peter Paret, Princeton: Princeton University Press, 1976. Eberlein, R. “On the Road to the States Perdition? Authority and Sovereignity in the Niger Delta” Journal of Modern African studies, 44,
4, 2006: 573-596. Goldwyn, D. and Morrison, J.S A strategic U.S. Approach to Governance and Security in the Gulf of Guinea. A Report of the Crisis Task
Force on Gulf of Guinea Security. July 2005. Ibeanu, O. “Oiling the Friction: Environmental conflict management in the Niger Delta” Environmental Report Issue No. 6, Summer,
2000: 19-32. Ikelegbe: “Civil Society, Oil and Conflict in the Niger Delta region of Nigeria: ramification of Civil Society for a regional resource struggle”
Journal of Modern African Studies, 39,3,2001: 437-479. Imobighe, T., “Conflict in Niger Delta: Unique case, or a model for future conflict in other Oil – Producing Countries” in R. Traub – Merz
and D. Yates (eds.) Oil Policy in the Gulf of Guinea, Bonn: Frankad Publishers, 2004: 101-115. KoodzetJii, E and Harkavy, R (eds.) Security Policies of Developing Countires. Lexington, 1982:167. Lubeck, P, et.Al, “Convergent Interests: US Energy Security and the Securing of Nigerian Democracy” International Policy Report
February 2007. Mane, D. Emergence of the Gulf of Guinea in the Global Economy: Prospects and Challenges. IMF working paper, 2005. Maier, K. This House Has Fallen Harmondsworth: Penguin, 2000 Metogo, G. Security and Stability in the Gulf of Guinea. USAWC strategy Research Project, 2006. News Magazine 21 January, 2008 News Magazine 1 June, 2009 Obi C, “Oil, Environmental conflict and National Security in Nigeria: ramifications of the ecology – Security Nexus for Sub-regional
peace:, University of Illinois at Urbana Champaign, 1997. Orubu, C “Oil Wealth and Derivation Principle: The need for a New Fiscal Imperative Towards Oil-Producing States “Calabar Journal of
Politics and Administration Vol. 1, No 1. Juno 1999: 182-211. Okonta I and Douglas, O. Where Vultures feast. London: Verse, 2003 Sunday Champion, “Ateke Tom, Creek Warlord”, January 27, 2008. TELL Magazine “50 years of Oil in Nigeria” 18 February, 2008.
ISSN 2039-9340 Mediterranean Journal of Social Sciences Vol. 3 (11) November 2012
90
TELL Magazine “Fresh Threats To Peace in Nigeria Delta” March 22, 2009 TELL Magazine, “Niger Delta” June 22, 2009. TELL Magazine “Yar’ Adua: The Journey So Far” August 17, 2009. Chris Akiri, “The Niger Delta and the Conquistatadors” Guardian Newspaper, 29 September, 2009. Sunny Awhefeada, “The Niger Delta Genocide” Guardian Newspaper May 25, 2009. Said Adejumobi, “Niger Delta: What Amnesty?” Guardian Newspaper July 13, 2009. Ancetie Akpam et. al. “South-South Governors Rise in One Strong Voice Against In justice On their Land, People” Guardian Newspaper
July 31, 2009. Jimitota Onayume, “Niger Delta” Vanguard, June 27, 2009. Ledun Mitee, “Niger Delta: Amnesty Alone Can’t End Crisis” Vanguard, July 6, 2009. “Amnesty: Militants must surrender arms in 60 days” The Nation, June 26, 2009. Wole Soyinka “Between Amnesty and Amnesia” The Nation, June 26, 2009. Wole Soyinka “We must Restructure Nigeria on Equitable Basis” The Nation July 27, 2009. Adewale Adeoye, “Amnesty: Too Many Rivers to Cross” The Nation, July 15, 2009. Junaid Mohammed, “Yar’ Adua is Overwhelmed by Nigeria’s Problems” The Nation July 10, 2009. “Politics: South South Elders take on Federal Government’s Amnesty to Niger Delta Militants”. Suday Punch, August 16, 2009. Yusuph OLaniyonu, “Niger Delta: This opportunity must not slip” This Day

ISSN 2039-9340 Mediterranean Journal of Social Sciences Vol. 3 (11) November 2012
91
Considerations on the Fortresses Toponyms from High Middle Ages until Today
Dr. Eliana Paço
Facoltà di Lingue Straniere
Università di Tirana e-mail: [email protected]
Doi:10.5901/mjss.2012.v3n11p91
Abstract: In the focus of the article are presented some of toponyms in the book of Prokopio of Cesarea "De Aedificiis" which refer to their strongholds or places situated near the Illyrian and Epirotic settlements. Different authors have noticed that in some cases, the toponyms are not associated with archaeological correct data and some of them are written with linguistic mistakes. These two gaps make it difficult analysis undertaken, but not impossible. On its part, the author of the article, has tried, also relying on other historical sources and various studies made by albanologists of different times, to give its opinion on these toponyms and achieve the important conclusions. Keyword: consonant, darkening, fortress, Illiri, initial / terminal, phonetic laws, toponym, vowel.
Considerazioni sui Toponimi delle Fortezze dall’alto Medioevo fino ad Oggi In una lingua con una tradizione tardiva della scrittura come la lingua albanese, dove il primo documento in albanese scritto da Gjon Buzuku risale al 1555, la ricchezza del materiale documentario da parte degli autori antichi, storici, scienziati e ricercatori, compensano fino ad un certo punto la carenza della propria antica documentazione. Il valore dei documenti antichi, delle testimonianze dei toponimi, come prova di una fase passata, la più antica storica, comprende in sé una particolare importanza, contribuendo a tracciare lo sviluppo delle forme dei toponimi secondo dinamiche lessicali seguite dalla lingua albanese nello sviluppo del suo lessico.
Per vedere lo sviluppo dei cambiamenti dei toponimi dall'antichità fino a come si presentano all'orecchio degli ascoltatori di oggi, ci riferiremo agli scribi e agli storici antichi, che seguiti l'invasione, le guerre dei noti personaggi storici e le loro gesta, hanno svolto il loro ruolo nello sviluppo e nel cambiamento della storia del mondo. Ci siamo rivolti in primo luogo ai toponimi proposti da Procopio di Cesarea (Cesarea in Palestina, ca. 490 – Costantinopoli, ca. 565) nella sua opera “De Aedificiis” (Sugli Edifizi).
Nell'opera “De Aedificiis” (l'anno della composizione non è certo: alcuni datano l'opera al 554, altri al 560) di Procopio di Cesarea (un’opera encomiastica sugli edifici fatti costruire da Giustiniano), c’è un elenco di nomi che includono una serie di province, quali l’Epiro (Antico e Nuovo), la Macedonia, la Dardania, la Dakina Analumase o Interna, la provincia di Remisiana. In questa lista ci sono anche nomi di castelli esistenti nei pressi di diverse città, quali Germene, Pautalia, Skasetana (in Macedonia), Nais, Akue, Timathohiom. Con una estensione territoriale così grande, l’opera è piena anche di una grande varietà di forme di toponimi. Pertanto, questa lista ha attirato l’attenzione dei vari scienziati che hanno cercato di trovare la loro fonte originale a partire dal nome odierno dei paesi della lista del Procopio. Tali sono le opere di A. Helder, M. Krahe, A. Mayer, W. Tomashek, J. J. Rusu e V. Beshevliev.
Negli ultimi anni del VI secolo e nei primi decenni del VII secolo hanno cominciato le invasioni slave anche in Albania, prima in Albania del Nord edell’Est e più tardi nell’Albania del Sud. L’elenco di Procopio è stato scritto intorno all'anno 558 d.C, proprio al tempo delle invasioni slave, quando le tribù slave iniziarono a riversarsi all'interno della penisola balcanica, ma la loro influenza linguistica era ancora debole. Questa lista prezioso è un fondo di grande ricchezza composta con circa 167 nomi geografici di fortificazioni pre-slave, che si presentano in un certo stato linguistico, senza l’influenza slava.
Gran parte dei toponimi dei territori albanesi riscontrati nella lista di Procopio, quali Skodreon, Dyrrahion, Arzon, Himairai, Skupion , Aulon, Amantia, Antipatrai ecc., mantengono la loro forma più antica nota anche dagli autori antichi. I nomi dei castelli nella lista di Procopio, sono stati scritti in greco bizantino, poiché dal 395 dC, dopo la divisione dell'Impero Romano, l’Epiro (Antico e Nuovo) faceva parte dell’Impero d'Oriente, e rimase sotto l’influenza della cultura greca interrotta subito dopo le invasioni slave e gote che causarono la caduta dell’Impero.

ISSN 2039-9340 Mediterranean Journal of Social Sciences Vol. 3 (11) November 2012
92
I nomi dei castelli nella lista di Procopio sono stati scritti male dal punto di vista linguistico (con suffissi sincopati e cambiamento di genere) e posti nel territorio sbagliato. Tutto questo mette in difficoltà lo studio dettagliato linguistico ed etimologico. Procopio stesso, come lo dimostrano i nomi della lista, non conosceva bene l’etno geografia delle regioni per cui scrive. Così ad esempio, il nome Skupion si trova nella provincia Sardika, ecc.
Anche se per alcuni dei toponimi della lista di Procopio manca il giusto posizionamento archeologico, le leggi fonetiche della lingua albanese, ci saranno di grande aiuto per realizzare la loro identificazione linguistica. Loro serviranno come base delle forme esistenti odierne, poiché alcuni dei toponimi più importanti del territorio dell'Albania sono stranieri. Non ci sono dubbi sul fatto che le suddette forme sono passate attraverso la bocca degli albanesi, si spiegano con le leggi della lingua albanese e solo attraverso questa lingua, si può spiegare la loro forma.
Vediamo alcuni dei toponimi della lista di Procopio. 1. Arbatias (Άρβάτιας) - nome di castello. Per H. Krahe (BIG - N, 80) e A. Mayer (Ety Notill 14) emerge come nome
illirico, nome di paese 'Άρβα, Άρβων,' Άρβανών. La forma arb di questo toponimo si testimonia dagli Illiri, mentre nei bizanti la riscontriamo nella forma alb (nel nostro caso Procopio ha conservato la forma arb che probabilmente veniva utilizzata dalla popolazione nativa). Qual è la forma più antica di questo nome arb- o alb- ci sono opinioni diverse, che le porta il prof. E. Çabej (“Studi etimologici nell’ambito dell’albanese”, II, A-B, pag. 62): Siamo d'accordo con il parere di Pedersen che vede la forma alb come una forma secondaria della più vecchia arb-, perché se si guarda lo sviluppo storico di suoni, una r si trasforma in l in diverse parole albanesi. Questo è un fenomeno di natura albanese, come ad esempio in greco όρμος in italiano armeggio, in albanese almisë. Nell’albanese parlato di oggi troviamo gjalpër per gjarpër (serpente). Nella parola Arbatias pensiamo che si tratti di un un errore grafico, una forma presa dai macedoni come Arvanitis. La giusta forma di questo nome deve essere stata con un n davanti a t tipo Arbantias. Anche V. Beshevliev osserva che in alcuni toponimi mancano i n, il gruppo nt si è trasformato prima in nn e dopo in n. Molto probabilmente, dato che i dati archeologici non ci aiutano in questo caso, Arba(n)tias deve essere una forma della odierna Arbana nome questo abbastanza comune nel centro dell’Albania, che in seguito è stato preso come denominazione per tutta l’Albania e gli albanesi.
2. Argyas ('Άργυας) appare in Procopio come nome di un castello vicino all’omonimo fiume nella zona di Epiro Nuovo. Oggi questo fiume si chiama Gjanica ed è un ramo del fiume Seman, Argyas si conserva nel nome Arian-it. Siamo d'accordo con Shuflaj (Städte und Burgen 23, Archiv II, 199) che pensa che dal nome Argyas deriva Arian. Questo nome si trova scritto su una tabella nei pressi di Bylys in Mallakastra. Noi pensiamo che qui abbiamo il passaggio da Argyas, emerso da Argu-nt, in Arianit sotto l’azione delle leggi fonetiche albanesi. Queste leggi hanno fatto sì che -g dopo -r sonora con il valore di semivocale (nel nostro caso) e davanti a una vocale cada come se si trovasse in una posizione tra vocali, mentre la -y greco, come in altri casi, ha dato i in albanese, ad esempio υέις, Epiro, Illyria: shi (pioggia), Epiro, Illyria. Secondo il prof. E. Cabej (St. Etimol, Nell’ambito dell’albanese, II, AB, p. 77), questo nome è linguisticamente formato con il suffisso -it, che è caratteristico per il dialetto tosco. Noi pensiamo che questo nome era originariamente formato con il suffisso -an, che viene utilizzato anche oggi per mostrare i residenti di un villaggio o città, come dibran, matjan, kuksian, shkodran, ecc., mentre il suffisso –it, caratteristico di questa zona, serve altressì per formare nomi etnici (vedi A. Xhuvani, E. Çabej, I suffissi della lingua albanese).
3. Arsa ('Άρσα) - nome di castello, dato da Procopio per la provincia di Dardania. Pensiamo che questo nome è conservato oggi come nome di paese. Lo troviamo oggi in due forme Arsa e Arra, toponimo della zona di Dukagjin a destra del fiume Drin. In questo nome si conserva la -a iniziale accentata. Oggi il significato di questo nome è collegato alla parola albanese arrë – noce. Questo nome è abbastanza comune come toponimo in Albania: Fushë - Arrëz, Arra (Noce), Arrë - Molla, ecc. A. Meyer (Die Sprache der Alten Illyrier, p. 61), collega il nome Arsa di Procopio con il nome del villaggio chiamato Ras; questa somiglianza è meno probabile.
4. Balauson (Βάλαυσον) - nome di castello, identificato da Procopio nella regione di Skasetana. Pensiamo di portare questo toponimo nella forma antica nel nome odierno Ballsh. Secondo Tomashek (Thr II, 2, 58), Mateesk (Granite 471) e Detchev (Spr 41) è nome tracco; secondo Duridanov (IBE XVI - 1968, 67) è nome dacio; secondo H. Krahe (BIGN 82) e A. Mayer (A1 74) è nome illirico. Secondo Kristo Frasheri, queste città hanno conservato i loro nomi antichi anche dopo il X secolo (periodo in cui cominciano ad apparire i nomi slavi). Se facciamo l’analisi linguistica di questo nome, risulta che anche questo, come forma bizantina, è cambiato dalle leggi fonetiche albanesi dandoci la forma odierna Ballsh. Il suffisso -on del nome Balaus-on è un suffisso illirico, che non è conservato nell’albanese di oggi. Non siamo d'accordo con V. Beshevlievin (Zur-Dt, p. 103), che vede -on come un suffisso celtico. Come osservato anche da H. Krahe, l’ -on di solito si trova nei nomi illirici di fiume, come ad esempio: Drilon, Arzon, Naro, Salon. Il gruppo au situato in mezzo della parola Bal-au-s-on è caduto, dopo esser trasformato in una forma ridotta -a non accentata, poi cambiata in –ë, e infine caduta;la –l intervocalica e si è trasformata in -ll come nelle parole Apolonia / Apollonia, gala / dhalla, mentre il passaggio –s / –sh è un fenomeno già conosciuto nelle parole ereditate dall'antichità come Isamnus / Ishëm, Astibos / Shtip, Naisus / Nish, Drivastum / Drisht ecc. Queste sono alcune delle leggi fonetiche che pensiamo abbiano agito sul nome Balauson per

ISSN 2039-9340 Mediterranean Journal of Social Sciences Vol. 3 (11) November 2012
93
darci il nome Ballsh. Questo nome anche nella forma bizantina conserva il suo legame con la parola ballë (fronte). Molti studiosi vedono nel nome Byllis l’antica parola illirica "Ballë", che si conserva in tutte le denominazioni usate per questa città da diversi popoli, Kefalonia dai greci nel Medioevo, Gllavenicë dagli slavi e Ballsh dagli odierni albanesi.
5. Besiana, Bessaiana (Βέσσαιανα) - nome di castello, secondo Procopio in Dardania. Nella mappa dell’Ilirikum del IV-VI secolo dC si trova Bessana una città nei pressi di Lisus, vicina a Mathi. Noi pensiamo che si tratti dello stesso luogo. Besiana può essere il nome Bessana scritto in modo sbagliato. In A. Mayer (Die Sprache, p. 79) lo troviamo come Bassania, che l'autore collega con il villaggio Pozana e Pezana situato a nord di Mat. Non non condividiamo questa spiegazione poiché oggi nello stesso luogo dove si è messo Bessana c’è un villaggio chiamato Berzana e noi pensiamo che dal punto di vista linguistico sia la conservazione dell’antica forma. Nel nome Bessana si verifica l’aggiunta di una –r e come succede anche in altre parole albanesi le due –ss si sono trasformate in –z, ad esempio Sasson ha dato Sazan.
6. Dardapara (Δάρδαπαρα), nome di castello in Dardania. A. Majer (Die Sprache der Alten Illyrien, p. 108) dice che ci sono due castelli con questo nome, uno in Dardania e l'altro in Remisianë. Ci occuperemo del castello di Dardania. Nel nord-est dell’Albania, nella mappa del 1890 della zona una volta considerata come Dardania, c’è un villaggio chiamato Dardas, oggi Dardhë. A nostro avviso si tratta dello stesso luogo citato da Procopio come Dardapara: -para è un elemento tracco per la formazione di parole, ed anche Thermi-dava, elementi che si riscontrano qualche volta nelle parole il liriche (come osservato anche da Weigandi ed il prof. E. Çabej nei loro studi). La parola Darda si collega bene con l’attuale parola odierna Dardhë (pera, frutto); il gruppo –rd ha dato nell’albanese -rdh, come ad esempio nei nomi Bardyllis / Bardhi, gard / gardh; dalla parola burdo-is deriva bardhë “thes”. Il villaggio di nome Dardhë si trova ora a destra del fiume Fan, più precisamente vicino alle fonti del Grande Fan. Dardhë è un toponimo molto diffuso nel territorio dell'Albania. Abbiamo Zall-Dardhë, Dardhë nel distretto di Puka, Dardhë nel distretto di Korça, ecc.
7. Euria (Εύροιας) - nome di castello nell’Antico Epiro. "Egli (Giustiniano), - afferma Procopio – ha ricostruito la città di Nikopol, Fotika e la cosiddetta Foinike. Ma, dal momento che questi ultimi due erano in terreno paludoso ed era impossibile costruire muri su solide fondamenta, li lasciò come erano e gli bastò costruire nei loro pressi solidi castelli sulle colline circostanti. Qui c’era una piccola città ricca di sorgenti da cui ha ricevuto il nome Kështjella e Euries (Il castello di Eurie). Questi dati ci aiutano a identificare il paese nei pressi del villaggio odeerno Qenuri, sopra il quale si erge una collina, dove oggi si trovano le rovine di un castello chiamato da parte della popolazione locale Kështjella e Uria-s. Nel nome odierno Uria, si nota la trasformazione del nome Euria tramite le leggi fonetiche albanesi della conservazione nella bocca degli albanesi. In questo nome si nota la perdita della vocale iniziale non accentata come è successo nei nomi Aulon / Vlorë, angustis / ngushtë, ecc. Oggi in questo luogo vive una popolazione minoritaria, che ha conservato questo nome come è stato precedentemente chiamato dalla popolazione albanese, perché nella bocca dei Greci, avrebbe dato la parola Evria o Efria.
8. Gurasson (Γούρασσον) - nome di castello dato a Procopio per la provincia di Macedonia. Gurasson emerge come nome di castello in Dardania e vicino a Nish si trova un castello chiamato Gurbikon. Questi nomi si associano alla parola albanese gur (pietra). Oggi nei territori albanesi ci sono tanti toponimi contenenti la parola gur, ad es Gurabardhi, Gurikuq, Gurimadhi, Guraziu, Gurë-Lurë, Gurë-Reç, ecc. La parola Gurasson si è sottomessa alle leggi fonetiche albanesi dando la parola Gurëz, in cui –ss si è trasformato in –z e la –a non accentata si è trasformata in –ë, mentre il suffisso – on è caduto come in tanti altri nomi albanesi.
9. Haradros (Χάραδρος) - nome di castello nella provincia della Macedonia secondo Procopio. Questo nome con una –h iniziale in greco, sarebbe caduto del tutto in albanese o avrebbe dato un nome con –k come è successo nei nomi Λαχανον / lakër; Μαχανον / mokër, ecc. Quindi inizialmente questo –h dovrebbe essere stato un riflesso di un altro suono dell’albanese, perché noi pensiamo che questo toponimo (Haradros) risponda in albanese all’idronimo Gjadër. Nelle mappe di A.Armao e di A.Baldacci del 1892 troviamo questo nome con la iniziale –j, che non può essere pensata come molto vecchia, perché altrimenti avrebbe dato una –z come nella parola jugum / zgjedhë. La –j e più tardi –gj deve essere un riflesso di una –s Indo-Europea. Jokli ci dice che nel 1438 al toponimo Gjadër corrisponde il toponimo Gladra e nel 1459 abbiamo Jadro: cioè la trasformazione di –kl e –j in –gj appartiene a quegli anni. In H. Krahe troviamo questo nome scritto con la –j iniziale. Noi pensiamo che questa –j sia la presentazione da parte degli stranieri del fonema –gj, come nel caso del toponimo Traias (Mappa di Gubernantis 1880) per Tragjas. La –s indeoeuropea è stata riflessa in una –h in greco e come visto precedentemente in albanese si è trasformata in una –gj. "Quindi, suppongo, - afferma Pedersen nel suo lavoro sulla riflessione delle gutturali, - che la rappresentante sonora della –s indoeuropea ... innanzi tutto si è trasformata secondo la regola in –j (da dove è immersa la –gj)...". Ciò giustifica il mantenimento delle due forme di questo nome con –gl / –gj e –j. Sappiamo già che Procopio ha spesso cambiato i nomi in conformità con la scrittura bizantina (greca), per questo motivo pensiamo che la iniziale –h di questo nome sia il risultato della grafia bizantina di questo nome. Che la –s indoeuropea abbia dato una –h in greco e per le stesse parole una –gj in albanese, basta vedere alcuni esempi: gjalp in albanese – helpos in greco – sargish in sanskr; gjallë in albanese – holos in greco –salvus in lat; gjak in albanese – haima in greco – sangues in lat., ecc. In questo nome si verifica anche la conservazione della –a iniziale
ISSN 2039-9340 Mediterranean Journal of Social Sciences Vol. 3 (11) November 2012
94
accentata che risulta lunga dopo la caduta della sillaba seguente, nel nostro caso –ra-. Inoltre si nota pure la conservazione del gruppo –dr che diventa dër come è accaduto in diversi nomi come Scodra / Shkodër, Dibren / Dibër,ecc.
10. Kastina - nome di castello nell’Antico Epiro. Pensiamo che questo sia una forma del nome Kestrina, un villaggio a sud del fiume Kallama. Qui abbiamo una mancanza della –r, come succede in altri toponimi che ci dà Procopio. Kestrina è una forma latina della parola castra dove la –a è stata trasformata in –e. La forma latina di questo nome si conserva nell’Albania settentrionale come Kastri nei pressi del villaggio di Vig (nel distretto di Scutari).
11. Koma (Κόμη) - castello ricostruito dall'imperatore Giustiniano nel VI secolo. Nell'elenco di Procopio ci sono pure le costruzioni fatte per le Cisterne della fortezza Kome. Secondo noi dovrebbe trattarsi del luogo dove oggi si trova il villaggio Koman. Forma Koman ha conservato l’antica forma di Koma. Il suffisso –an che contiene il toponimo Kom-an è suffisso caratteristico del dialetto ghego del nord-est e dimostra i nomi dei luoghi e dei residenti, come ad esempio: Goj-an, Dushm-an, Terp-an, ecc.
12. Kuskulis - nome di castello. Secondo Tomashek (Thr II, 87) e Detchev (Spr. 265) è un nome della Tracia. Secondo V. Beshevliev (Imena 253 Quisquilae) –ulis è un suffisso diminutivo, che non è stato conservato in albanese. Pensiamo che Kuskulis sia la forma antica del toponimo moderno di Kukës. In questo nome la –s del gruppo –sk è di troppo, come succede spesso nell’elenco di Procopio; la –u accentata della prima sillaba è stata conservata, mentre –ulis è stato sostituito da una –us. Nella mappa del 1869 il nome appare come Kukusa. La trasformazione di –us in ës appartiene ad un tempo più recente ed è un fenomeno conosciuto in albanese.
13. Pezion - nome dato da Procopio ad un castello dell’Antico Epiro. Pensiamo che questo nome con la caduta del suffisso –ion si mantiene nella forma odierna Pezë come il nome di un villaggio vicino a Tirana.
14. Piskinai (Πισχιναί) - nome di castello, secondo Procopio si trova nella provincia di Nuovo Epiro. Secondo noi Piskinain si identifica con l’odierno Peqin. Il nome subendo le leggi fonetiche albanesi ha dato da Piskinai - Peqin. V. Beshevliev osserva che Procopio aggiunge una –s ad alcuni nomi che non fa parte di quella parola. Ammessa la grafia sbagliata usata da Procopio, riteniamo che la –s del gruppo –sk sia di troppo, mentre la –k vicina ad una –i è stata palatalizzata. H. Pedersen (Guest, p 325) dice: “Secondo i valori indo-europei è stato accettato che essi sono rappresentati in albanese, con la –k, -g, da cui in un secondo momento, in certe circostanze sono emerse –k' (q), –g' (gj). La palatalizzazione della –k in –q davanti a una –a ed –e è un fenomeno noto per la lingua albanese. Nelle mappe del 1892 il nome di Peqini è stato scritto con una –k palatalizzata: Pekinai. Quindi pensiamo che il nome Piskinai si collega al nome odierno di Peqin.
15. Priscupera (Πρισχόυπερα) - nome dato da Procopio come castello in Dardania. Se nella parola Priscupera, la –r è uno dei suoni che aggiunge qua e là Procopio, avremo la forma Piskupera, che secondo noi è la forma più antica del nome Peshkopi di oggi. In questo nome la –i iniziale è stata trasformata in –e accentata some è successo in altre parole latine quali spissus / shpesh; piscis / peshk, ecc. Ormai è noto che il gruppo –sc ha dato –shk, mentre il passaggio della –u in –o è un fenomeno familiare al dialetto settentrionale come klumësht / klomësht. I residenti di Peshkopi nel loro parlato dicono anche Peshkupaj, cosa che dimostra il legame di questo nome con la forma antica Piskupera. Non condivido l’opinione di taluni studiosi che collegano il nome Peshkopi con peshkopatë (episcopato).
16. Tetiana (Τιτιανα) - nome di castello nel Nuovo Epiro. Noi pensiamo che il nome abbia subito le leggi fonetiche albanesi dando la parola –Tetaj nome di luogo nella regione di Tropoja. Questo villaggio si trova oggi su Raja. Il suffisso –ana del nome Tetiana, come suffisso illiro avrebbe dato –an in albanese. Questo suffisso sarà fuso con il suffisso –aj che è caratteristico del nord Albania, come Bunaj, Kolgecaj, Nikaj-Merturi ecc., e come risultato si ottiene il nome Tetaj.
17. Trana (Τράνα) - nome di castello ricostruito da Giustiniano nell’Antico Epiro. A nostro parere Trana sia la vecchia forma del Treni di oggi. In questo habitat si sono trovati molti reperti archeologici dell'antica cultura e dell’Alto Medioevo. Riguardo a tale nome ci vengono in aiuto anche i dati archeologici. Nel passaggio da Trana a Treni abbiamo la conservazione della –n non roteata, mentre la –a accentata della prima sillaba è stata trasformata in –e accentata come è successo in tanti altri nomi presi dal latino: imperator / mbret, civitatem / qytet, ecc. la – a terminale atona è caduta.
18. Therma (Τhέρμα) - nome di castello in Nuovo Epiro secondo Procopio. Pensiamo che questo castello doveva trovarsi nei pressi di Scutari in quel luogo chiamato Thermidava. Prof. E. Çabej vede in questo nome elementi trachi. Noi oggi non possiamo indicare con sicurezza il posto esatto di questo castello.
19. Zdebren (Ζδεβρήν είς Δέρβην = ad Debram) – nome di castello dato da Prokop. Secondo V. Beshevliev, la –z iniziale davanti alla –d è sempre di troppo in Procopio. Secondo Tomashek (Thr II 2, 78), Brandenstein e Detchev il nome derivia dallo slavo e vuol dire "dubro = acqua". Noi pensiamo che l’albanese conservi questo nome nella sua forma latina e che la pretesa dei sopramenzionati studiosi non sia basata. Questo nome nella stessa forma viene documentata nelle opere di autori antichi quali Claudio Tolomeo, Thukididi, Strabone ed Erodoto già nel secolo II dC in un periodo che non si parlava neanche di tribù slave. Negli scritti bizantini appare Δέύρι e negli scritti latini appare Debram (Vedi K. Frashëri, S. H., 1975/4, p. 153). Sottoposta alle leggi fonetiche albanesi ha dato il nome di Dibër – Dibra. Con la caduta della –z

ISSN 2039-9340 Mediterranean Journal of Social Sciences Vol. 3 (11) November 2012
95
iniziale nel nome Δέβρην, si è spostato l'accento dall’ultima sillaba sulla penultima, poi è successa la trasformazione della –e accentata in –i accentata e l’oscuramento della –a terminale di Debram in –ë che è entrata in mezzo al grup –br. La stessa cosa fa la vocale –ë entrando nel mezzo del grupp –dr nelle parole: Shkodër, kodër, ecc., e così da Debram oggi abbiamo Dibër. Conclusioni L’articolo verifica alcuni toponimi dell’elenco rilasciato da Procopio dal punto di vista linguistico. Nell’elenco di Procopio ci sono molti toponimi che appartengono alle regioni dell'Albania. I toponimi di Procopio, si presentano come forme di uno stadio intermedio tra le forme giunte dagli autori antichi e le forme usate oggi. Ai nomi che sono già stati studiati dal prof. E. Çabej e da altri studiosi, come Shkodër, Lezhë, Nish, Shkup, Pukë, Erzen, Drin, Vlorë, Sazan, ecc., abbiamo pensato di aggiungere anche i toponimi di Procopio quali: Arbana, Argyas / Arianit, Arsa / Arra e Arsa, Balauson / Ballsh, Dardapara / Dardhë, Euria / kështjella Uria, Koma / Koman, Besiana / Bersana, Gurasson / Gurë, Trana / Treni, Haradros / Gjadër, ecc. Questi indicano la continuità degli antichi Illiri e che i loro eredi albanesi hanno lasciato le loro tracce nei toponimi di queste fortezze. Le forme odierne dimostrano il fatto di essere passate per la bocca degli abitanti ed essere conservate da loro. Lo studio di tale elenco assume una rilevante importanza come testimonianza del carattere autoctono del popolo albanese. Essi dimostrano che la culla di questo popolo è stato nel bacino Adriatico meridionale e nel Bacino dell’Ionio Settentrionale.
Bibliografia Beshevliev, Veselin (1964). Zur Deutung der Kastellnamen, p. 16. Börm, Henning (2007). Prokop und die Perser. Untersuchungen zu den römisch-sasanidischen Kontakten in der ausgehenden
Spätantike [Oriens et Occidens 16], Stuttgart. Brodka, Dariusz (2004). Die Geschichtsphilosophie in der spätantiken Historiographie. Studien zu Prokopios von Kaisareia, Agathias von
Myrina und Theophylaktos Simokattes, [Studien und Texte zur Byzantinistik 5], Frankfurt am Main. Çabej, Eqrem. Vendi i shqipes në rrethin e gjuhëve indoevropiane, “Studime Filologjike”, IV, p.15; “Studime Filologjike”, II, p.62. Çabej, Eqrem. Vendi i shqipes në rrethin e gjuhëve indoevropiane, në “Studime gjuhësore”, IV, p. 15. Cameron, Averil (1985). Procopius and the Sixth Century, Berkeley. Crevatin, Franco (1978). Due problemi di storia linguistica e culturale aria. Diehl, Charles (2007). Figure bizantine, introduzione di Silvia Ronchey, (1927 originale), Einaudi Frashëri, Kristo. Des illiriens aux albanais, “Histoire de l’Albanie des origines à nos jours”, p. 38. Greatrex, Geoffrey B. Recent work on Procopius and the composition of Wars VIII; in: Byzantine and Modern Greek Studies 27 (2003),
S.45–67. H.-G. Beck (1988). Lo storico e la sua vittima. Teodora e Procopio, Laterza, Roma-Bari. Kaldellis, Anthony (2004). Procopius of Caesarea. Tyranny, History, and Philosophy at the End of Antiquity, Philadelphia. Krahe, Hans (1925). Die alten balkanillyrischen geographischen namen auf grund von autoren und inschriften. C. Winter. p.25. Krahe, Hans (1929). Lexikon altillyrischen Personennamen. Heidelberg. Krahe, Hans (1950). "Das Venetische: seine Stellung im Kreise der verwandten Sprachen". Sitzungsberichte der Heidelberger Akademie
der Wissenschaften, Philosophisch-Historische Klasse 3: 1–37. Krahe, Hans (1955). Die Sprache der Illyrier. Erster Teil: Die Quellen. Wiesbaden. Krahe, Hans (1962). "Die Struktur der alteuropäischen Hydronomie". Abhandlungen der Geistes- und Sozialwissenschaftlichen Klasse 5:
285–341. Krahe, Hans (1964). Unsere ältesten Flussnamen. O. Harrassowitz. Krahe, Hans. BIGN, 80, 82. Mateescu, Vlad. Granitia 471. Mayer, Anton (1957). Die Sprache der alten Illyrier, Volume 1. In Kommission bei R. M. Rohrer. Mayer, Anton (1959). Die Sprache der alten Illyrier. Wien. Mayer, Anton. Etym. Notill., 14. Pedersen, Holger (1894). Bidrag til den albanesiske sproghistorie. (Festskrift til Vilhelm Thomsen). Kobenhavn. Pedersen, Holger (1905). "Albanesisch", Rom. Jb., 9. Pedersen, Holger. Guest, p. 325. Pedersen, Holger. Guturalet në gjuhën shqipe, p. 309. Ravegnani, Giorgio (2004). I Bizantini in Italia, Bologna, il Mulino. Shuflay, Milan. Städt und Burgen Arhiv II. Xhuvani, Aleksandër & Çabej, Eqrem (1965). Prapashtesat e gjuhës shqipe.


ISSN 2039-9340 Mediterranean Journal of Social Sciences Vol. 3 (11) November 2012
97
Waste Management and the Administrative Evaluation of
Resources for the Benefit of the Community. The Analysis of Methods for their Use
Ma. Bajame Skenderi
Agricultural University of Tirana, Albania Email:[email protected]
Prof. As. Dr. Alba Dumi
Dean of Graduated School ”Ismail Qemali” Vlore University”
Email:[email protected]
Doi:10.5901/mjss.2012.v3n11p97 Abstract: Administrative and Support and Waste Management and Remediation Services sector comprises establishments performing routine support activities for the day-to-day operations of other organizations. These essential activities are often undertaken in-house by establishments in many sectors of the economy. The establishments in this sector specialize in one or more of these support activities and provide these services to clients in a variety of industries and, in some cases, to households. Activities performed include: office administration, hiring and placing of personnel, document preparation and similar clerical services, solicitation, collection, security and surveillance services, cleaning, and waste disposal services. This paper research provides information relating to employment and unemployment in waste management and remediation services. While most data are obtained from employer or establishment surveys, information on industry unemployment comes from a national survey of households. The following tables present an overview of the industry including the number of jobs, the unemployment rate of those previously employed in the industry, mass layoffs, data for occupations common to the industry, and projections of occupational employment change. We are gather information from Albanian projects and incentives on waste management. Why waste management is still with problems in Albania? In this paper research we want to analyze the factors for promoting and recycling the waste in Albania region. Key words: waste management, functional efficiency, landfill, reducing pollution, Albania region 1. Introduction to waste management In the past the methods and surfaces of casting the waste were not selected referring to effects of human health and life safety, but were chosen on the basis lower cost. Environmental considerations are not enabled to have great influence on decisions about waste management. Now the development of systems and possibilities of management in the casting waste, such as finding the country for placement of landfill, became the subject of a major study and evaluation. If someone, needs a main guide to apply in what happens recently with the planning considerations of opportunities, he should also remember Kevin Lynch: Different types of land use are divided for functional efficiency, reduce of bothering, improvement of health and safety, reducing pollution, or to simplify the planning (Lynch 1980).Despite the above, may show higher attention of opportunities in establishing waste management, because there are many planning problems and the environment that accompany it. The land surrounding urban areas and other types of human settlement, contain different sources and vital for human society, for present and future generations, these vital resources include lands in the importance of first hand of agriculture, aggregate sources, such as sand and gravel, areas of water collection of a satisfactory landscape. Villages surrounding urban areas contain large recreational resources for the urban population, and as often happens, majority of developed land needed to support the expansion of urban population, economic activities and infrastructure (Plummer & Russwurm 1987). So, is important that governments should have sufficient policy to address the impacts in relief of waste management. So, "waste management" is a term widely used, it means different things for different people. Meanings of waste ranging from throw confusing or unreliable and unusable area to the wasteful spending, and for other diseases. In other words, description of waste include: demolition, destruction, pollution, dirt, garbage trash. In a word residues are what they don't use and invalid for human purposes (Lynch, 1990). Waste management is the residue and throwing of them, however ways in which they collected and thrown is one of the main issues of a great debate. First need to know

ISSN 2039-9340 Mediterranean Journal of Social Sciences Vol. 3 (11) November 2012
98
volume of waste that should have under control to determine what size should the deal: all waste materials should end up somewhere. 2 Literature Review and Hypotheses In one way or another, they end up in the environment resources that may be a combination of air, land and water resources. The proposal of landfill management and burning of a certain focus, such as the connection of consumer things that have modern societies, environmental quality and regularity of the primarily waste throwing system urban in rural areas 2.1 Business Patterns (CBP) Database and gathering data In particular, the Information and Cultural Industries sector was once again updated. The updates take into account the rapid changes within this area, including the merging of activities. NAICS is constructed within a supply-based, or production-oriented, conceptual framework where establishments using similar production processes to produce goods and services are grouped to form industries.
Graph 1 The distribution hierarchical structured in some develop countries The boundaries between industries demarcate, in principal, differences in production processes and production technologies. Its hierarchical structure is composed of sectors (two-digit code), subsectors (three-digit code), industry groups (four-digit code), and industries (five-digit code). These are broadly comparable for all three countries, although there are a number of important exceptions. The Business Patterns (CBP) database is released semi-annually and contains data that reflect counts of business establishments as of December 2009 by: nine employment size ranges; geography groupings: province/territory, census division, census metropolitan area and census agglomeration; and, North American Industry Classification System (NAICS).In Canadian Industry Statistics, the Canadian Business Patterns data is analyzed under the following topic for the Canadian economy and its sectors, as well as subsectors, industry groups, industries and national industries belonging to the Manufacturing sector 2.2 The North American Classification System on waste management The industries on this site are classified according to the North American Industry Classification System (NAICS) Canada of 2007. Statistics Canada maintains this industry classification which has superseded the 1980 Standard Industrial Classification (SIC).NAICS was jointly adopted in 1997 by Canada, Mexico and the United States against the backdrop of NAFTA. The classification was designed to provide common definitions of the industrial structure of the three countries and a common statistical framework to facilitate the analysis of the three economies. Considering the dynamics of today's economies, Canada, the United States and Mexico agreed upon revisiting the structure of the North American Industry Classification System (NAICS) every five years to make any necessary changes. As per the agreement, in 2002, a revision of NAICS was implemented. Adjustments were made to increase comparability in specific areas and to recognize important changes which have occurred since the introduction of NAICS in 1997. NAICS Canada 2002 affects the
Residents in the metropolis Residents in rural areas Residents in urban areas

ISSN 2039-9340 Mediterranean Journal of Social Sciences Vol. 3 (11) November 2012
99
organization of the NAICS 23 - Construction and NAICS 51 - Information and Cultural Industries sectors. NAICS was revised for 2007 to reflect changes to the Canadian and world economies.(Source INATT 2011) 2.3 Conflicts on waste throwing and community conflicts The issue, which takes a critical importance for society today, is that the contaminated land and resource base is located within land around the city or surrounding suburbs rural-urban, and often has been the subject of competing demands and often conflicting. Conflicts about the activities land uses are inevitable in rural-urban suburbs and so they are everywhere. Is already known and documented that the land around construction areas or urban suburbs, traditionally is used by the urban community for many uses. These include: providers of food, expansion areas of the city, and for uses that are desirable not be performed in urban areas such as: car construction sites, power generating plants, airports and waste management facilitator. In many cases, what is not to be kept within the limits of a city, often finds solution in displacement of the problem in rural areas (Brtyant & Siddel, 1982). 3. Methodology and Research Goal The choice of a placement that would resolve for the land-fill is another point of conflict over land use and in deciding how land should be used. What is the best method for selecting the location? Planning should examine ways to deal with land use considerations and also all the environment. Waste management practices are subject of major changes in relation to what has been done in the past. In early societies have been a narrow meaning of waste throwing and what previously existed can not be considered acceptable today. Diseases have historically been present. Waste were placed and piled in the streets and streams or different pond that was also used for washing and drinking. These water sources generally were dirty. 3.1 The conceptual difficulty and public needs The conceptual universe and target population of this survey covers all businesses and governments from all the provinces and territories in Albania. Public establishments can be municipal, provincial or federal. Capital spending by government departments involving grants and/or subsidies to outside entities (i.e. municipalities, agencies, institutions or businesses) is not counted. The establishment is considered to be a private institution based on ownership: specifically, if less than 50% of the voting rights are controlled by the government.
Tab 1 What is the best method for selecting the location? For example, Outlays for used Canadian assets are excluded since they constitute a transfer of assets within Canada and have no effect on the aggregates of our domestic inventory. Assets imported from outside Canada are included as they increase our domestic inventory. Assets acquired for lease to others are included, but assets acquired as a lessee are not. 3.2 Developments in waste management, one important municipality projects. In these bad conditions, illnesses such as typhus, was spread by contaminated water. Drainage systems are not realized the sanitary arrangements, but the rain water (Lynch, 1990). In fact, one needs for planning comes about the purpose of
Best method for selecting the location
Population and territories investments
Municipality activities and projects
Institutions or businesses capital
investments

ISSN 2039-9340 Mediterranean Journal of Social Sciences Vol. 3 (11) November 2012
100
solving health problems (Leung, 1989). Municipalities gradually improve the health situation take measures to cleaning water, cleaning parks, streets, removal of waste and adjustable leakage.
As a result of these actions waste throwing is progressively displaced far away from the origin. Waste throwing method has changed. Concerns about the management of materials have been a component of environmental debate that started the end of 1960 and early of 1970. Although at this time the emphasis in the debate was in the restrictions on further growth in policy making economic policy and environmental integration (Gandy, 1993). In 1980 the focus was on sustainable development and growth (Gandy 1993). The issue of waste problems became part of the great environmental debate.
So, there is an increase in the amount of waste, costs and logistical difficulty in the management of municipal waste (Gandy, 1993). In global terms, are large cities which represent major changes in the behavior of municipal waste, because they represent a geographical concentration of waste products combined with reduction of opportunities for their free destruction (Gandy, 1993).Destruction of municipal solid waste are based on years of many methods In advanced market economies are extensively involved three methods, will be treated as follows, as part of waste management efforts. 3.2 Basic concepts of waste management and the hierarchy of waste management There are a number of concepts related to waste management which vary according to country or region. But some of the more general concepts widely used are: Waste hierarchy referred to the term “3 Rs” (reduce, reuse and recycle) which classifies waste management strategies according to their desirability in terms of minimizing waste. The purpose of the waste hierarchy is to derive maximum benefits of partial of these products and to generate the minimum amount of waste.
The concept of “3 Re” should not be used in isolation. A new direction that is suggested recently in solid waste policy is: "hierarchy of waste management". Effectively, this includes the "3 Rs" in everyday life. 3.3 The hierarchy of waste Viewing the concept of adaptation in practice we have taken in study exactly these three elements in Regions with maximum flow hydro as Vlore, Sarande, Pogradeci and Durres. In these 10 years reduction in hydro and its use efficiently has resulted in these countries very few water sources to remain non-exploited the biggest defect is re-use water for the only reason that significantly absent businesses large and medium which have as a raw material efficiency of hydro inflows.
3 Re Vlorë Sarandë Pogradec Durrës
Reduction 20% 30% 16% 45%
Recycling 60% 30% 30% 50% Reuse 20% 40% 20% 10%
Table 2. Hierarchy of waste generation and density of their distribution in the regions obtained in the study.
VloreSarandePogradecDurres

ISSN 2039-9340 Mediterranean Journal of Social Sciences Vol. 3 (11) November 2012
101
Materials that remain should be placed in the landfill (Gottlieb et al, 1993). A successful example of recycling programs is Ontario, where most recycling programs are voluntary (Waste Reduction Advisory Committee, 1991). However, the use of the "3 Rs" and cost of these programs has been very high. For more costs are often higher than the benefits from the discovery of materials (Waste Reduction Advisory Committee, 1991). Steps in recycling operations are according the hierarchy of waste management are: Minimization of waste and prevention of waste in the manufacturing process Production of waste is inevitable, becomes re-use within the manufacturing process itself. Reusing and repair of products to extend its usability before transfer to the category of waste. Primary advertising materials to create new raw materials (from the collection of materials or sale of collection points) The benefit of the energy of calorific values of materials (Gandy, 1993). Also there is a lack in the planning of strategies towards "3 Rs". These problems and continuing public opposition to the "2 B's" ("Two B's" / Burn and / or Burry) , or in other words (burning and / or landfill. s, incineration and / or landfill) has created a kind of debate about the plans of waste (Dottilieb et al, 1990).Therefore always required the best alternative 4. Extended Producer Responsibility Extended Producer Responsibility (EPR) is a strategy that allows integration of environmental costs associated with the product, throughout their life cycle, in sales price of the product.EPR passes the responsibility along all the product lifecycle and packaging introduced in the market. This means that firms which produce and / or sell products, required to be responsible financial or physical even after full use of them. 4.1 Manager of the product and management concept Manager of the product is a concept, through which environmental protection used to itself product, and everyone who is involved in the life of the product must take responsibility in relation to his impact on the environment. For manufacturers, this includes planning and if necessary payment for recycling or removal of the product at the end of his life complete. For retailers or consumers, this implies a more active role in providing accurate of the displacement or recycling of the product at the end of his life. 4.2 The principle of payment for pollution. The principle of payment for pollution is a principle, where polluter pays damages partly made in the natural environment. In relation to waste management, it refers request to generate payments for relocation (throwing) the exact waste. 4.3 Waste management techniques. The concept of municipal waste, industrial waste and commercial waste traditionally consists of collecting and continue with the disposal or remove them. They may be collected depending on the type of tools and the surface, and the level of processing. This procedure may be to reduce risk, finding materials for recycling, for electricity production from waste or to reduce them in volume for a more efficient relocation. Collection methods vary widely through different countries and regions, so it is impossible to be described at all. For example, Australian practice is such: Household waste containers have 240 liters volume and drawn once a week by the local committee. However, in many areas the small areas is not possible to achieve a formal system of waste collection. Urban centers in Canada collection according to a schedule is common in waste throwing, from which collects waste and / or recyclable, and / or organic based on a schedule depending on residential areas, in rural areas people throw their waste in transfer stations. Waste collected transferred in landfill areas. Waste throwing methods, vary widely too. In Australia the most common method throwing of solid waste is placing in landfill, since it is a country with relatively large surface and populating the lower density. In contrast, in Japan is common for waste to burn, because the land smaller and land is scarce. This, not simply for the fact that have already been accumulated enough educated intellectual capacities within and outside the country, but also because a specifications number presents the Albanian economy in this period of transition, which makes its recognition and consequently, for the implementation of popular models to assess the level and to extent of the informal economy. Undertaking joint studies involving local researchers, state institutions that deal with fiscal

ISSN 2039-9340 Mediterranean Journal of Social Sciences Vol. 3 (11) November 2012
102
issues of employment, and institutions internationally recognized expertise in this field it would be even more effective way to complete studies and offer policy recommendations applicable to this sector.
Tab 3. The indicators of waste management techniques, Source: (Lonngan & Dottilieb et al, 1990). Waste management techniques are: Landfill Burning Finding resources Recycling Consumption against of Waste separation by Car. Composting and anaerobic digestion. Mechanical and biological treatment 5. Landfill and the management hygienic method Waste throwing in a landfill, is the traditional method, and it remains the most common practice in many countries. Historically, landfills often created in excavations unusable, in gaps excavated minerals, or mineral wells. A landfill designed correctly and well manage may be a hygienic method and relatively expensive of throwing waste materials, in order to minimize their impact on the local environment. 5.1 Methods directly through (A) Surveys The control of tax through expenditure statistics and income of state and individual firms. (B) .Indirect methods through: National accounts statistics (the discrepancy between the statistics of income and expenditure in national accounts and individual) The statistics of start of work (Lower labor participation in the formal economy by assuming that participation in work has a participation rate that stays constant) Transactions (monetary transaction volume data to calculate PBB -economy in total and official). Demand for money (increasing the demand for cash because the informal economy transactions conducted in cash). Electricity consumption because it is the best indicator of overall economic activity physical (difference between GDP growth and increased energy consumption). For having in control and to enable the gradual formalization of the informal economy we think that should be studied: Its role in the domestic economy, weight that is in employment and dynamics in different sectors, in alleviation of the social consequences of transition, etc… Legal environment that leaves space for the informal economy. Tax system problems, state bureaucracy and social security problems. Work of minors in the informal sector.
1Finding resources2Recycling
1Consumption against of Waste separation by Car.
1Landfill2Burning

ISSN 2039-9340 Mediterranean Journal of Social Sciences Vol. 3 (11) November 2012
103
Also, note that all partial studies carried out by researchers mainly foreign from state institutions and media publications, a great place in the study of the informal economy should be given domestic researchers. This fact, and the increase in the influence of odd material consumption, has led to an increase in efforts to minimize the amount of waste sent to landfill, in many areas. This effort involves the taxation of waste at landfill, recycling of materials. The converting materials into energy, designing products that use more material and legislation that mandates manufacturers to become more responsible for cost of dumping the product or packaging
Tab 4. The influences of state institutions and media in support for promoting regional reforms to WM Previously, weak projected landfill or mismanagement of their, creates a number of adverse impact as, small bulge with winds, attract parasites, etc, which may pollute the environment. Many localities local, especially in urban areas, have found difficulty in creating new landfills, because of opposition from neighboring landowners. Consequently, solid waste throwing in these areas has become more expensive, because materials should be transported away (or managed by other methods). It for what we ask is industrial ecology, where the material flows between industries. By product of an industry can be fully usable and comfortable for another, leading to a generation of waste material reduced. 6. Profits by recycling. The profitable and public benefits Two are the benefits of recycling: reduces inputs (energy and materials unused) into a product. Some materials like aluminum can be recycled and not defined. Other materials such as paper requires to add a proportion of raw material (wood fibers), in order to compose existing fibers. Since the materials to be processed are brought, needs the smaller energy for transport from the division. This usually reduces the cost environmental, social and economic production. By recycling aluminum, obtained 95% of the energy cost needed to produce new aluminum because melting temperature of 900 ° C reduced to 600 ° C. Aluminum resulting material to be recycled more efficient. Emphasize that maximum profits earned by minimization of waste (reducing amount of waste produced), and re-use of terms in the current form, such as bottles that refilled. All recycling techniques consume energy for transportation and process as well as a significant amount of water. The right order for a sustainable environment is: Reduction of waste. Reuse of waste Recycling of waste Finally, recycling is in great more attention for his role in reducing harmful gas issuance, since recycled resins produced with less gas than issued will be broadcast from raw materials. 7. Conclusions A flourishing economy makes official statistics on unemployment, the labor force, on consumption, acceptable etc…Unbelievable are programs and policies in economies bureaucratic leanings that are designed on the basis of these statistics may be inappropriate for implementation. Not wanting to draw conclusions speed, can cast the hypothesis that modern achievements in the implementation of a poverty reduction strategy and economic development, expressed in the inability to convert popular macroeconomic achievements developing regional and sector in the water area, have due,
State institutions and media publications
Intellectual capacities Implementation of popular models Involving local researchers

ISSN 2039-9340 Mediterranean Journal of Social Sciences Vol. 3 (11) November 2012
104
among others, and significant barriers to the informal sector of the economy and the lack of instruments, enabling its formalization without the injured. Namely being "bleached" it in favor of sustainable development of our country. Elements breakaway informal activities (Some public services at home: repair television, washing machine, human services: medical examinations, injections etc. while foreign language courses, trade on the streets of cities and populated centers of agricultural products from their villages surrounding areas making "in kind" for family needs a quantity of agriculture products work for hire of time: members of cooperatives of agricultural enterprises " taking the family needs the raw material different from industrial enterprises wards etc.) was also present during the period of centralized economy. While large-scale presence and informal economic activity abrupt in Albania was mainly due to the collapse of the institutions of centralized economy, legal and institutional gap created immediately after initial weaknesses and to create legal and fiscal institutions appropriate to a market economy. Not be neglected even devastating effects of crises with which it is faced country during this period and economic and social polarization rather large and constant, throughout the transition period until nowadays. So you have to emphasize that it is precisely this polarization, which in some cases carried out in suspicious ways, has brought on stage and the wider debate on fiscal amnesty. We think that the key factors led to the strengthening of the informal economy in this period are: Demographic shifts toward larger field areas, to the big cities and especially to Tirana. The drafting of new legislation and continuous improvement, but that still leaves space for a high level of informal economy. The main effects of the informal economy are based on: Monetary indicators. Activities with informal nature tend to be made with cash on hand (cash) thus increasing the demand for currency in circulation. Participation in the labor market and its length. If increase the number of people employed in the informal economy and hours of work, then it would decrease the rate of participation in the official economy and the relevant number of working hours. Official statistics production. The growth of the informal economy brings consequently less reliable statistics and lower figures for official rate of economic growth. For economic growth there are two opposing currents for the effect of the economy. Public spending, in terms of the high level of informal economy, leading to that informal economy's own growth and that, in a vicious circle, increasing taxes to meet the needs of public spending. Potential opportunities for the transfer of a part of the informal economy and in financial support to crime, especially organized economic crime. Increasing corruption by giving bribes to civil state that are linked to tax and control nausea, resulting in corruption and the distortion of activity in state administration. Very strong pressure has on official bodies in Albania for employment in tax administration and especially at the customs.
References
Commission of the European Communities, “Council directive of 27 July 1985 on the assessment of the affects of certain public and private projects on the environment”, in Official Journal of the European Communities, pages 40-48.
Towards sustainability-a European Community program of policy and actions in relation to the environment and sustainable development” COM(92) 23 final- vol 11(Commission of the European Communities, Brussels, Belgium), 1992.
Leung, Hok Lin. Land Use Planning Made Plain Ronald Fruye & Company: Kingston, Ontario, 1989. Hydric Management : Departament of the Environment , London 1991. De Soto, Hermine; Egamberdi, Nilufar; Center for Economic and Social Studies (CESS), 2001. Albania -Rural Water Supply and Sanitation Strategy 2003Albania: Municipal Water and Sanitation-Social
Assessment. DC 2008 BBreport,Government of Albania. 2003. Dumi A International conference,Vjenna 2012,University Comell pp123 The National Strategy for Socio-Economic, Development (NSSED).Hoering, Uwe. 2002. Public Private Partnerships in the Water
SectorDeutsche Stiftung fur international

ISSN 2039-9340 Mediterranean Journal of Social Sciences Vol. 3 (11) November 2012
105
Gender Issues in Sexual Fulfillment; Nigerian Situation
Dr (Mrs) Akanle F.F
Institute of Education Faculty of Education
Ekiti State University, Ado-Ekiti [email protected]
Dr. Ola, Tolulope Monisola
Department of Sociology
Ekiti State University, Ado-Ekiti Nigeria. [email protected]
Doi: 10.5901/mjss.2012.v3n11p105
Abstract: For many married women sexual relationship is hardly enjoyable, is it is more of a conjugal function than an enjoyable activity and many are in a violent relationship. This study therefore investigate the feelings of women concerning their sexuality, what percentage of women have pleasurable and fulfilled sexual life and those things which women count as sexual fulfillment. A descriptive research design was used. The population consists of women aged 18-60 years and who are either literate or non-literate. A total of number 200 women were selected using simple random sampling technique, a self-constructed questionnaire was used to collect the data which was analyzed using percentages, cross tabulation and T-test. The findings show even when women have sex regularly most respondent do not have satisfactory sexual life. 1. Introduction Sexuality is central aspect of being human throughout life and encompasses, sex, gender, identities and roles, sexual orientation, eroticism, pleasure, intimacy and reproduction, sexuality is expressed though thoughts, fantasies, desire , belief , behaviors, practices, roles and relationships. Sexual health is a state of physical emotional mental and general well-being in relation to sexuality. Sexual health requires a positive and respective approach to sexuality and sexual relationships as well as the possibility of having pleasurable and safe sexual experiences free of discrimination and violence, Africa regional sexuality Resources Centre ARSRC(2006).
Human sexuality in Africa (2007) reported that sexual rights embraces human rights that are already in national laws, international human rights documents and other consensus statements. They include the right of all persons to pursue a satisfactory, safe and pleasurable sexual life, decide whether or not, and when, to have children and decide to be sexually active or not. Women for women’s human right (1994) observed that marriages in Africa seem to produce an environment that do no support sexual right. Marital relations are several and sexualized, producing and reproduction inequality in the African context, discussion around sexuality and sexual right does not support sexual pleasure and minimal attention have been given to pleasure, pleasure have been the site of male domain. Some married couples are of the opinion that sex should be for procreation and hence their sexual life is devoid of sexual fulfillment. Many husband see their wives as sex toys that are desired only when they want to release tension.
Alengbege in Saturday Punched observed that any married couple that truly wants to enjoy a healthy, sex life should make an attempt to find out what good sex means from each other. It is important to assume that people already know enough. It is necessary to make one’s partner fulfilled in sexuality. This is necessary because every man or woman have different sexual needs and preference. Each person expresses his or her sexual needs in special ways.
Alengbege reported that men frequently think about sex more than women do. Men are easily strongly motivated sexually by visual images, they are turned on by erotic pictures, skimpy dresses and nudity. Studies have shown that at least 90 percent of men are tempted by pornography and that they are easily aroused by the anatomy of the women folk. However, women are mostly aroused when their emotional needs are satisfied, naturally women offer sex in exchange for affection and intimacy. Affection is the women most sensitive cord to sexual response. Sweet talks, kind, tender gesture and having to care can turn women on easily. Understanding and tolerant partners quickly and effortlessly stimulate women and they always get the best from them. Loving for women starts when the husband listens, values her opinion and respects her ideas. This gives women emotional stability needed for good sex.

ISSN 2039-9340 Mediterranean Journal of Social Sciences Vol. 3 (11) November 2012
106
The quality of our sexuality is ultimately connected to the quality of our lives and relationships. Because our sexuality is an integral part of ourselves, it reflects our excitement and boredoms, intimacy, distance, emotional well-being, distress, health and illness. Sexual just i health is more than the absence of disease, and sexual health is more than the presence of healthy sexual partner. The World Health Organization (2002) indicated that sexual health requires a positive and respectful approach to sexuality and sexual relationship as well as the possibility of having pleasurable and safe sexual experience, free of coercion, discrimination and violence. For sexual health to be maintained, the sexual right of all persons must be respected, protected and fulfilled.
The traditional view is that the exercise of sexual feelings is justifiable if it is for reproductive purpose. The new situation is that it is the undeniable fact that sex is a natural feeling, an urge that men and women have. This mean that is natural to express one’s sexuality anytime, anywhere and with sexual partners of our choice either for fun, enjoyment, or for reproductive purposes. Sexuality is not only for procreation, every individual has the right to enjoy sex or set pleasure from experiences of sexuality, this can be witnessed in the campaign to eliminate female genital mutilation, where women’s sexual pleasure is disadvantaged as a justification for eliminating female genital mutilation in Africa. Many African countries seem to be notorious for charges of sex associated with gender roles. Sex as reported by researcher is very important than it seems. It is the only thing that truly amuses and entertains. To maintain an enthusiastic sexual relationship in one’s marriage, there is need for the knowledge of what sexuality is, and what the sexual preference of one’s partner is. To be able to make men understand the sexual preference of their partner and make them understand what good sex refers to. There is need for this study, hence the following general question are raised for the study. 2. General Question What percentage of women have satisfactory sexual life. What percentage of women has regular sex. What makes women sexuality aroused. Do partners of women show understanding and tolerance in sex 3. Hypotheses Ho ; There is no significant difference on the sexual arousal of women from different religious 4. Methodology The study in two stages. The first stage involved the gathering quality data on women needs in relation to sexuality; intimacy, affection, sexual arousal, respect of opinion sexual matters and general sexual fulfillment and satisfactory sexual life. The second stage involves a cross-sectional survey conducted in 10 towns in Ekiti State. All women in the survey sample are those in current relationship. They are aged 18-50 years in monogamous heterosexual relationship. The questionnaire was developed using quantitative data from the first phase of the project and existing instrument, such as the 9 item general sexual health questionnaire. The study defined sexual fulfillment as sexual dealings which involve intimacy, tolerance, respect of sexual opinion and sexual arousal which makes women sexually fulfilled. All aspect of sexual fulfillment were measured using the following questions. Do you have sex?, do you have a sexual partners? Do you have sex regularly? Do you have a satisfactory sexual life? Does your partner show affection your opinion, Do you sometimes feel sexually aroused and what makes you to be sexually fulfilled? 5. Data Analysis Research Question One: What Percentage of women have satisfactory sexual life.

ISSN 2039-9340 Mediterranean Journal of Social Sciences Vol. 3 (11) November 2012
107
Background Characteristics of Respondent * Percentage of Women who have Satisfactory Sexual Life Cross tabulation Count Percentage of Women Who Have
Satisfactory Sexual Life
Total % YES % NO %
BACKGROUND CHARACTERISTICS OF RESPONDENT
POOR 51 100% 0 0% 51 25.5%
FAIR 26 100% 0 0% 26 13%
GOOD 5 9.4% 48 90.6% 53 26.5%
EXCELLENT 0 0% 70 100% 70 35% Total 82 41% 118 59% 200
The above information presents a cross tabulation result on the percentage of women who have satisfactory sexual life and background characteristics,51( 25.5%) of the respondents who have a poor background characteristics, in affiliation with the fact that 0 (0%) of the respondent have No satisfactory sexual life, 26(100%) of the respondents have a fair background characteristics, it’s in affiliation with result gathered that 0(0%) of the No satisfactory sexual life.5(9.4%) of respondents have good background characteristics, its in-line with the fact that 48(90.6%) of the respondents have No satisfactory sexual life. 0(0%) of respondents have excellent background characteristics, its in-line with the fact that 70(100%) of the respondents have No satisfactory sexual life. The result shows that 82(41. %) women have satisfactory sexual life, while 118(59%) women have No satisfactory sexual life. Therefore there most respondents don’t have satisfactory sexual life. Research Question Two: What percentage of women has regular sex?
Age of Respondent * Percentage of Women Who Have Sex Regularly Cross tabulation Count Percentage of Women Who Have Sex
Regularly
Total % YES % NO %
AGE OF RESPONDENT 41 AND ABOVE 106 100% 0 0% 106 53%
21-40 60 87% 9 11% 69 34.5%
18-20 0 0% 25 100% 25 12.5% Total 166 83% 34 17% 200
The result presented shows a cross tabulation of result between age of respondent and what makes women sexually aroused,106(100%) of the respondents were within the age range of 41years and above, 60(87%) of the respondents were within the age of 21-40years and 9(11%) of the result were in affiliation with respondents who don’t have sex regularly,0(0%) of the respondents were within the age range of 18-20 years and 25(100%0 of the result were in affiliation with respondents who don’t have sex regularly. The result shows that 166 (83%) women have sex regularly, while 34 (17%) women do not have sex regularly. Therefore respondents do have sex regularly. Research Question Three: What make women sexuality aroused?

ISSN 2039-9340 Mediterranean Journal of Social Sciences Vol. 3 (11) November 2012
108
Religion of Respondents * Percentage of Women Who Are Sexually Aroused Cross tabulation Count Percentage of women who are sexually aroused
Total %
If my partner listen to, values and respect my opinion %
Understanding and tolerant partner %
Affection and intimacy with my partner %
Satisfaction of my emotional needs %
RELIGION OF RESPONDENTS
OTHER 0 0% 0 0% 0 0% 21 100% 21 10.5%
ISLAMIC 0 0% 31 37.3% 30 36.1% 22 26.5% 83 41.5%
CHRISTIANITY 93 97% 3 3.1% 0 0% 0 0% 96 48% Total
93 47% 34 17% 30 15% 43 21.5% 200
Research Question Four: Do partners of women show understanding and tolerance in sex? Level of Education * Do Partners of Women Show Understanding and Tolerance In Sex /Crosstabulation Count
Does Partners Of Women Show Understanding And Tolerance In Sex
Total % YES % NO % LEVEL OF EDUCATION SECONDARY
SCHOOL AND BELOW
104 93% 9 8% 113 57%
ABOVE SECONDARY SCHOOL
0 0% 54 100% 54 27%
NONE 0 0% 33 100% 33 16.5%
Total 104 48% 96 52% 200 The above information shows the cross tabulation result of religion and what makes women sexually aroused, 21(100%) for other religion and sexually aroused through satisfaction with emotional needs, 31(37.3%) of the respondents have sexual arousal through understanding and tolerance with partners, 30(36.1%) of the respondents have sexual arousal through affection and intimacy with partner, also 22(26.5%) of the respondents or sexually aroused when satisfied with emotional needs, 83(41.5%) of the respondents are for Islamic Religion, 96(48%) of the respondents are Christian, 93(47%) of the respondents are sexually aroused when partners listen to values and respect each others opinion,3(3.1%) of the respondent are sexually aroused through understanding and tolerance.
Based on the result above, the respondents are sexually aroused when partners listen to values and respect each others opinions with 93(47%), they are sexually aroused when understanding and tolerance to each other with 34(17%), however, 30(15%) are sexually aroused with affection and intimacy, and 43(21.5%) of the respondents are sexually aroused when satisfied with emotional needs. Therefore, respondents or women are sexually aroused when partners listen to value and respect each others opinion.
The above information shows a cross tabulation result between respondents’ level of education and do respondents shows understanding and tolerance in sex.113(57%) of the respondents have secondary school education and below, 104(93%) of the respondents do have partners that shows understanding and tolerance in sex and 9(8%) of the respondent do not have there partners showing understanding and tolerance in sex, 54(100%) of the respondents have

ISSN 2039-9340 Mediterranean Journal of Social Sciences Vol. 3 (11) November 2012
109
above secondary school and partners of women do not show understanding and tolerance in sex with 54(27%).33(16.5%) of the respondents do have education, the result show that partners do not shows understanding and tolerance in sex with 33(100%). 104(48%) partners of women do show understanding and tolerance in sex, while, 96(52%) partners of women do not show understanding and tolerance in sex. 6. Hypotheses Testing From the result of the analysis attached at the appendix A of this research work. The hypothesis of this research work can therefore be interpreted using t-test analysis as follows: H1:- There is no significant difference in sexual arousal of women from different religion. One Sample Test One sample T-Test is used to test whether the mean of one variable differs from a constant. When P<0.05 the researcher concludes the group mean is significantly different from the constant.
N
Mean
Standard deviation
Df
T- calculated
T-critical
P
DECISION
Religion 200
1.6250 0.6683 199
24.677
1.96
0.05
Accept the alternative Hypothesis
Sexual arousal
2.1150 1.2121
Source: SPSS Result and Author’s Field Survey, 2011. From the above result analysis presented, it shows that the probability value is less than 0.05 at 5% level of significance. The t-calculated value is 24.677 and the t-critical is 1.96 at degree of freedom 199 using two tailed significant level. There is significant difference in the sexual arousal of women from different religion 7. Discussion The study examined the feeling of women concerning sexuality and the percentage of women who have fulfilled sexual life. The result of the following shows that only 41% of the women reported that they have satisfactory sexual life while 59% do not have a satisfactory sexual life. The findings of this research is supported by that of women for women human right (WWHR) 2004) which reported that marriages and sexuality in African context produces inequality and that sexuality and sexual rights in Africa does not support sexual right and sexual pleasure. The findings of this study about women that having sexually fulfilled life is not surprising this may be because some married couples are of the opinion that sex is for procreation and hence their sexual life devoid of sexual fulfillment. Furthermore, many husband see their as sex toys that are desired only when one wants to release tension. The findings of this study shows majority of women 47% reported that they are sexually aroused when partners listen to, value respect their opinion. While 17% reported that affection intimacy make them to be sexually aroused while 21.5% reported that they are sexually aroused when their emotional needs are satisfied by the partners. This findings corroborates that of Alegbe who opined that affection is the most sensitive cord to human sexual response sweet talk, tender gesture, care can turn a woman on easily understanding, tolerance could stimulate a woman and make a man to get the best from a woman. Loving for a woman starts when the husband listen, value a woman opinion and respect her opinion and her ideas. This gives the woman emotional stability needed for good sex. 8. Conclusion The major findings of these study shows that Nigerian women do not have satisfactory sexual life. Many women do not have pleasurable sexual life. This suggests that the sexual right of women to enjoy a satisfactory and pleasurable sexual life is not protected in Nigeria and that marriage in Nigeria do not support women’s sexual right.

ISSN 2039-9340 Mediterranean Journal of Social Sciences Vol. 3 (11) November 2012
110
The implication for policy Programme and sexual health educators is that intervention aimed at sexual pleasure and sexual fulfillment in regards to women is needed The public at large needs to be sensitized in order to challenge the culture that favour only the sexual enjoyment and fulfillment of men. It is necessary to make everybody man or woman sexually fulfilled. Sexual pleasure and right is a right that embraces human right that is already in national laws.
References African Regional Sexual Resources Centre ARCR (2006) Sexuality in the media: Emerging issues in Africa Lagos: Fineprint Ltd. Women for women’s Sexual Right (WWHR) (2004) Women and women sexuality in Muslim societies in Instaibual Turkey: New Ways. The World Health Organization (2002): WHO’S Gender Policy: Integrating Gender Perspective in the Work WHO, Geneva.

ISSN 2039-9340 Mediterranean Journal of Social Sciences Vol. 3 (11) November 2012
111
Does Glossing Affect Thai EFL Students’ Reading Comprehension
and Lexis Acquisition?
Win Jenpattarakul
Assistant Professor, Language Institute Bangkok University, Thailand
E-mail: [email protected]
Doi:10.5901/mjss.2012.v3n11p111
Abstract This study was a one-group pretest-posttest experiment and aimed to investigate the effect of glossing on reading comprehension and lexis acquisition of 30 Bangkok University students and explores their attitude towards the use of glossing. The instruments were the reading comprehension tests, and the questionnaire exploring attitude towards glossing. The pretest and posttest scores of the experimental group were calculated by descriptive statistics and compared by using a dependent t-Test measure. It was found that students obtained higher scores for the posttest than the pretest scores at the 0.05 level of significance. In addition, their attitude towards using glossing was at a high level. Moreover, the results from this study supported that using glossing helped the students remember vocabulary and can be a substitute for a dictionary consultation when encountering low frequency words in a reading passage. Pedagogical implications into reading comprehension and lexis acquisition were suggested. Keywords: Reading comprehension, vocabulary learning 1. Introduction Vocabulary is an essential part of language learning and considered to be the most important aspect of second language (L2) learning (Knight, 1994 cited in Hong, 2010). Consequent, a great deal of researches including empirical researches and theories about vocabulary learning and vocabulary acquisition which is directly linked to enhance vocabulary size are in attention (Oxford, 1990; Nation, 2008; Wei, 2007; Cheng & Good, 2009). Hunt & Beglar, 1998 cited in Hong, 2010 suggested that among three approaches to boost vocabulary learning – incidental vocabulary learning, explicit instruction, and independent strategy development, incidental vocabulary learning was regarded as an integral part of L2 vocabulary learning. Ways to promote gains in incidental vocabulary learning encompass the use of dictionary, guessing from context, glossing and so forth (Hong, 2010). Glossing, among three ways, is the one which was extensively experimented to assert that it affects the students’ reading comprehension and vocabulary acquisition (Al-Jabri, 2009). As Nation (2006) puts it, glossing means a brief definition or synonym, either in L1 or L2 which is provided with the text as an example below.
Mr Jones, of the Manor farm, had locked the hen-houses for the night, but was too drunk to remember to shut the pop-holes. With the ring of light his lantern dancing from side to side, he lurched across the yard, kicked off his books at the back door, drew himself a last glass of beer from the barrel in the scullery, and made his way up to bed, where Mrs Jones was already snoring.
*small holes in the door of a hen-house *walked unsteadily *room joined to the kitchen for washing dishes
He states further that glossing has certain attractions. Firstly, it allows texts that may be too difficult for learners to read without glosses to be used. This means that unsimplified and unadapted texts can be used. Secondly, glossing provides accurate meanings for words that might not be guessed correctly; this should help vocabulary learning and comprehension. Thirdly, glossing provide minimal interruption of the reading process, especially if the glosses appear near the words being glossed. Dictionary use is much more time-consuming. Fourthly, glossing draw attention to words and thus may encourage learning. Research has focused on the effects of different types of gloss, and the effects of glossing on vocabulary learning and reading comprehension.
Furthermore, various perspectives of glossing in terms of its definitions and advantages are presented as follows:

ISSN 2039-9340 Mediterranean Journal of Social Sciences Vol. 3 (11) November 2012
112
1. Ko (2005) mentioned after reviewing many studies extensively that marginal glossing is one way to help a learner comprehend reading materials. By offering additional notes or information beyond the text in the margin on the same page or on another page, glosses guide the learner and assist as a mediator between the text and the learner. Glosses have various functions in helping to decode the text by providing additional knowledge in specific content, skills, strategies, and definitions of difficult words. In the case of second language (L2) learning, glosses generally mean information on important words via definitions or synonyms. The two important reasons to use glosses are to assist reading comprehension and aid vocabulary learning. In general, four advantages result from glossing. ► Firstly, glosses can help the readers understand new words more accurately by preventing incorrect guessing.
Deriving meaning from context can be difficult and risky because of readers’ lack of language or reading strategies. ► Secondly, glossing can minimize interruption while reading is in the process. Since glossing provides definitions for
low frequency words, L2 readers do not have to constantly look them up. ► Thirdly, glosses may help the readers build a bridge between prior knowledge or experience and new information in
the text. In other words, interactions among gloss, reader and text may promote comprehension and retention of the context of the text. Besides these points, glosses in key words can help the readers recall their background knowledge and connect it to the text.
► Fourthly, glosses can make the students less dependent on their teacher, allowing for greater autonomy. Since not all students have problems with the same words, they can look up just the words they do not know. Some studies have shown that students prefer to have glosses in their L2 language reading materials.
2. Nation (1990) elaborates on glossing that one way of dealing with “one-timers” and other low-frequency words in a text is to provide a short definition somewhere near the text which is called glossing. This has several advantages. First, it allows the reader to follow the text without too much interruption. It is a way of dealing quickly with the words which are important in the text but are not important in the language as a whole. Second, it gives the learner independent from the teacher. The learner does not have to wait for the teacher to supply the meanings of the unknown words. Third, it individualizes attention to vocabulary. You look at the definition only if you need to. For this reason, it is best if words which are glossed are not marked in any way in the text. Some form of marking in the text (the use of bold letters or an asterisk) would encourage learners to look at the definition when they did not to. It would develop a sense of insecurity about vocabulary which would interfere with their reading. Learners should be encouraged to use glosses as a way of confirming guessing from the context. They should not look up the meaning of a word without first having a guess at its meaning. For this reason, glosses are best situated at the end of the text or in the back of the book. 3. Hong (2010) wrapped up the concept of glossing that researchers generally agree that the use of glosses in L2 reading materials is a common practice and glosses facilitate reading comprehension and vocabulary learning in both printed materials and electronic materials. He added that several definitions of glossing are proposed by many researchers accordingly: ► Glosses are short definition or referred as translations or brief explanations of difficult or technical texts (e.g. unusual
words) and categorized into textual glosses, pictorial (visual) and aural glosses and various combinations. ► Glosses are many kinds of attempts to supply what is perceived to be deficient in a reader’s procedural or declarative
knowledge. ► Typically located in the side or bottom margins, glosses are most often supplied for unfamiliar words which may help
to limit continual dictionary consultation that may hinder and interrupt the L2 reading comprehension process. In view of positive result of glossing to reading comprehension and vocabulary learning, many studies revealed the findings interestingly. Lomicka (1998) examined the effects of multimedia reading software on reading comprehension. Specifically, the study aimed to explore how multimedia annotations influence the level of comprehension. Twelve college students enrolled in a second semester. French course were instructed to think aloud during the reading of the text on the computer screen. Participants read the text under one of the three conditions: full glossing, limited glossing, or no glossing. In addition, a tracker was set up in the software to record the amount and type of glosses, and length of time that each was consulted. The raw data clearly indicate an increase in the amount of causal inferences generated for students who had access to full glossing. Computerized reading with full glossing may promote a deeper level of text comprehension.
Later, Ko (2005) inspected how different types of gloss conditions affect Korean college students’ reading comprehension. They read the material under one of three conditions: no gloss, Korean gloss (L1 glossing), and English

ISSN 2039-9340 Mediterranean Journal of Social Sciences Vol. 3 (11) November 2012
113
gloss (L2 glossing). After reading, they were asked to take a multiple-choice reading comprehension test to and to answer the questionnaire. The results of the quantitative analyses indicated that only the second language gloss condition significantly affected students’ reading comprehension. However, the think aloud protocols revealed that both types of glossing made their reading comprehension smoother and faster than those who read without glosses. In other words, even first language (L1) glosses enabled them to comprehend more easily while reading, although statistics did not indicate a significant difference between the no gloss and L1 gloss conditions. When surveyed, the learners showed their preference for glosses in the margin: more than 62% of the learners favored L2 glosses for their reading material.
Likewise, Huang (2003) cited in Cheng & Good (2009) investigated three kinds of glossing conditions for comprehension and vocabulary retention with 181 third-year junior high subjects in Taiwan and found a forgetting pattern. The two-week long study (including a vocabulary pretest, reading comprehension test, immediate vocabulary recall test and two delayed vocabulary recall tests) took place in four different sessions. She gave each of the comparable, intact classes the text with just one of the three glossing conditions. She also had a control group with no glossing. The findings showed that the groups reading with any of the three kinds of glosses condition outdid the control group. This meant that glosses could indeed increase subjects’ reading comprehension and vocabulary recall. Furthermore, Jacobs, DuFon, and Fong (1994) cited in Al-Jabri (2009) also agreed with the benefits of glossing by examining the effects of L1, L2 glosses and no gloss on foreign language reading comprehension and foreign language vocabulary learning. Eighty-five English speaking participants who were learning Spanish had to read a Spanish text with 613 words under three conditions: 1) L1 gloss (English); 2) L2 gloss (Spanish); and 3) No gloss. After reading the text which had 32 glossed words, participants had two unexpected test; one immediately after the reading and the other four weeks later. Results showed that L1 and L2 gloss conditions were better than the no gloss condition and that the difference between L1 and L2 condition was not statistically significant. However, participants expressed preference for L2 glosses to L1 glosses.
The last research whose outcome of glossing to reading comprehension is positive was carried out by Chen (2002) cited in Al-Jabri (2009) who looked into the effect of gloss types with Taiwanese participants studying English as a second language. Eighty five college freshmen were divided into three groups: L1 gloss (Chinese), L2 gloss (English), and no gloss. They read a 193-word English text with 20 glossed words. Results of this study showed that the difference between L1 and L2 gloss groups was not statistically significant and that the L2 gloss group outperformed the no gloss group.
However, some researches have brought mixed results. That is, some indicated that glossing is not instrumental to both reading comprehension and lexis acquisition while some revealed that glossing improved either reading comprehension or lexis acquisition The first study conducted by Jacobs et al. (1994) cited in Cheng & Good ( 2009) showed no significant effects with glossing. In the experiment, 85 English-speaking students were asked to 1) write down in their L1 everything they could remember after reading an L2 text, and 2) translate vocabulary items into English. Their study investigated three gloss conditions (L1 English glosses, L2 Spanish glosses, and no glosses) by giving subjects a Spanish text (613 words) with 32 glosses. Their overall findings suggested that although high proficiency participants who had glosses recalled more of the text, and those who had glosses performed better in the vocabulary translation tasks, there was no significant difference among the three conditions on reading comprehension and vocabulary learning.
Subsequently, Cheng & Good (2009) ascertained the effects of 3 kinds of glosses to explore whether providing glosses can facilitate reading comprehension and vocabulary acquisition. The study showed that L1 glosses helped the students learn new words and review learned words. Unexpectedly, reading comprehension did not improve significantly.
Cited in Farvardin & Biria (2012), the following researchers also showed no significant effect of glossing on L2 reading comprehension (Holley & King ,1971; Johnson ,1982; Jacobs et al.,1994; Bell & LeBlanc ,2000; Cheng and Good, 2009).
What’s more, Joyce (1997) cited in Cheng & Good (2009) also used recall protocols to test subjects’ comprehension after reading. She explored the effects of glossing on one of the intermediate and advanced French textbooks which was being used at the University of Pennsylvania. An anthentic text (485 words) in the field of journalism was distributed to 90 undergraduates under two conditions (L1 English marginal glosses and no glosses). After the subjects read the text, they were instructed to write down whatever they could remember of the text in their L1 (English). The results from the recall protocol again showed that subjects receiving glosses did not recall significantly when compared to the control group. Therefore, owing to the positive effects and mixed results of glossing in facilitating reading comprehension and promoting vocabulary acquisition, this research would like to explore whether or not glossing affects reading comprehension and vocabulary acquisition of Bangkok University students so that pedagogical implications will be used to improve teaching and learning reading and lexis in Bangkok University.

ISSN 2039-9340 Mediterranean Journal of Social Sciences Vol. 3 (11) November 2012
114
2. Purposes of the Study To compare the students’ reading comprehension after they read two reading tests: 1) reading test without glossing 2) reading test with English glossing plus example sentences. To survey the students’ attitude towards using glossing. 3. Research Questions To accomplish this investigation, the following research questions were addressed: To what extent did the students improve their reading comprehension after they read two reading tests: 1) reading test without glossing, 2) reading test with English glossing plus example sentences. How did the students respond to the use of glossing? 4. Research Methodology 1. This research is one-group pretest-posttest design. The data were collected from 30 students enrolling in EN 211 in the first semester of 2012 academic year at Bangkok University. The participants were selected by the purposive sampling technique. Among these participants, fifteen of them were males and other fifteen students were females. The age of the participants ranged from 18 to 20 years old. 2. Two instruments were employed in the study: 1) reading comprehension test without glossing for pretest and reading comprehension test with English glossing plus example sentences for posttest, 2) the questionnaire surveying the students’ attitude towards using glossing. 3. The data obtained from reading comprehension pretest and posttest and the questionnaire were analyzed quantitatively through dependent t-Test and descriptive statistics. 4. Treatment procedure was presented accordingly. Week 1: The teacher had the students take the first reading test. The 20-item test does not provide (L2) glossing, and the test requires the students to choose the best answer. Each student completed the test within 30 minutes. After that, the teacher corrected and recorded the pretest scores as shown in the table 1. Week 2: The teacher introduced the students to glossing concerning the definition of glossing, benefits of glossing to reading comprehension and lexis acquisition, and types of glossing. Week 3: The students were asked to do the second 20-item reading test whose contents are similar to that of the first test. However, the second test was provided with (L2) marginal glossing and example sentences whereas the first test was not. The students have 30 minutes to complete the test. The test was aimed at checking the students’ reading comprehension by using glossing. The teacher corrected the test and recorded the posttest scores as shown in table 1. After that, the students were asked to fill in the questionnaire surveying their attitudes towards using glossing. Table 1: Pretest and posttest scores
Student No. Pretest (20 scores)
Posttest (20 scores)
1. 12 14 2. 14 15 3. 11 16 4. 10 15 5. 9 15 6. 8 13 7. 11 16 8. 12 16 9. 12 17 10. 9 13 11. 7 14 12. 6 10 13. 11 12 14. 14 15 15. 16 18

ISSN 2039-9340 Mediterranean Journal of Social Sciences Vol. 3 (11) November 2012
115
16. 13 15 17. 14 16 18. 12 16 19. 11 15 20. 10 14 21. 9 13 22. 8 13 23. 7 15 24. 8 16 25. 12 15 26. 11 15 27. 14 16 28. 13 16 29. 12 17 30. 11 15
= 10.90 = 14.87
5. Result Research Question 1: To what extent did the students improve their reading comprehension after they read two reading tests: 1) reading test without glossing, 2) reading test with glossing plus example sentences. To answer the first research question concerning the student’s reading comprehension, the results of which have been shown in Table 2. Table 2: Mean of the pretest and posttest of the students
N
S.D. t sig Pretest 30
10.90 2.440 -11.644 .000
Posttest 30
14.87 1.634
The results shown in table 2 indicate that the mean of the posttest is higher than that of the pretest by using the Paired-Sample Test. The result from the t-Test revealed that there was significant difference in pretest and posttest. The findings supported that glossing can improve the students’ reading comprehension. Research Question 2: How did the students respond to the use of glossing? To answer the second research question concerning students’ views in self-report, the results of which have been shown in table 3.
Χ Χ
Χ

ISSN 2039-9340 Mediterranean Journal of Social Sciences Vol. 3 (11) November 2012
116
Statements for checking students’ attitude towards using glossing
Response Total number of students (n=30)
No. of students Percentage 1. Glossing is interesting for reading comprehension and vocabulary learning.
Yes 27 90
No 2 6.6 Not sure 1 3.4 2. Glossing helps me to understand the passage I read.
Yes 27 90
No 1 3.4 Not sure 2 6.6 3. Glossing helps me to remember vocabulary since I have to repeat the words several times and read example sentences.
Yes 28 93
No 1 3.4 Not sure 1 3.4 4. I prefer Thai (L1) glossing to English (L2) glossing
Yes 26 86.6
No 4 13.4 Not sure 0 0 5. Glossing helps me to read faster and more smoothly.
Yes 27 90
No 3 10 Not sure 0 0 6. Glossing helps me not to be too dependent on the teacher to supply the meanings of unknown words.
Yes 24 80
No 6 20 Not sure 0 0 7. Glossing helps me not to consult the dictionary very often and allows me to follow the text without much interruption.
Yes 27 90
No 3 10 Not sure 0 0 8. I like to have marginal glossing in the reading material.
Yes 28 93.3
No 2 6.7 Not sure 0 0 9. Glossing helps me minimize erroneous guessing the meaning of words and get the correct meaning of the unknown words to fit the context.
Yes 28 93.3
No 0 6.7 Not sure 2 0
Table 3 shows that the students’ attitude towards glossing is positive because the majority of the students responded to each statement as follows: 1. 90 % of the students thought that glossing is interesting for reading comprehension and vocabularylearning. 2. 90% of the students reported that glossing helps them to understand the passage they read. 3. 93% of the students said that glossing helps them to remember vocabulary since they have to repeat the words several times and read example sentences. 4. 86.6% of the students expressed that they prefer Thai (L1) glossing to English (L2) glossing 5. 90 % of the students identified that glossing helps them to read faster and more smoothly.

ISSN 2039-9340 Mediterranean Journal of Social Sciences Vol. 3 (11) November 2012
117
6. 80 % of the students reported that glossing helps them not to be too dependent on the teacher to supply the meanings of unknown words. 7. 90 % of the students indicated glossing helps them not to consult the dictionary very often and allows them to follow the text without much interruption. 8. 93.3 % of the students reported that they like to have marginal in the reading material. 9. 93.3 % of the students pointed out that glossing helps them minimize erroneous guessing the meaning of words and get the correct meaning of the unknown words to fit the context. 8. Conclusion and Implication The research findings revealed that glossing contributes to the improvement of students’ reading comprehension and enables them to comprehension more easily and faster while reading (Bell & LeBlanc, 2000; Ko, 2005; Al-Jabri, 2009). This is due to the fact that (1) glossing allows the readers to follow the text without too much interruption; it is a way of dealing quickly with words which are important in the text, and (2) glossing provides accurate meanings for words that might be guessed incorrectly; this should help comprehension and vocabulary learning (Nation, 2006; Nation, 2008). In fact, as suggested by (Hong, 2010; Laufer, 1997; Huckin & Coady, 1999), the advantages of glossing which prevents the readers from making wrong guessing the meanings of words can also solve the following two problems of reading for L2 vocabulary development: First, wrong inferences, superficial vocabulary learning, which prevents learners from using words actively. Some lexical items, such as words with a deceptive morphological structure, idiom, words with multiple meanings, false cognates and synforms (morphologically or phonologically similar words) often misguide the learners and make them misunderstand the words. It short-circuits readers’ contextual guessing process. Second, guessing is effective only when the context is well understood and almost all of the surrounding words in the text are known which requires good textual clues and substantial prior vocabulary knowledge on the part of the learners. Unlike native speakers, L2 learners have some difficulties guessing word meanings correctly, for they always have more opportunities to encounter new words within various contexts with their lack of sufficient word knowledge. Moreover, correct guessing of word meanings depends on accurate recognition of surrounding words and good use of reading strategies. However, learners always feel frustrated in comprehension when facing overwhelming texts in extensive reading. So the readers may decide to ignore the words, or cannot infer a word from context. Furthermore, according to the students’ attitudes involving vocabulary learning expressed in the questionnaire, the students agreed that glossing helps them to remember vocabulary since they have to repeat words several times and read example sentences. The results are in line with Thornbury (2008) reporting that one kind of repetition that is important is repetition of encounters with a word. It has been estimated that, when reading, words stand a good chance of being remembered if they have been met at least seven times over spaced intervals. Besides, Watanabe (1997) cited in Nation (2006) proposed that glossing drew attention of the learners to the word and thus encouraged seeing the word as an item to learn and not just as a part of the message and that because glossing contained the word form, looking at the gloss gave another repetition of the word. He also suggested that glossing involves three meetings with the word: see it in the text, see it in the gloss, look back at it in the text to see how the meaning in the gloss fits the context. Confirming that reading example sentences in glossing can boost the students’ vocabulary learning, Nation (2008) opined in his study that example sentences are usually carefully chosen to show both the meaning of the word and its typical use. Reading these example sentences will increase knowledge about the word, and forming a visual picture in your mind of the meaning of the sentence will help that word and its meaning be remembered. The visual picture helps because it means that the information about the word will be stored both linguistically and pictorially and these two ways will be linked. In the light of the conclusion of this research, it is recommended that the teacher should: 1.) Carefully select the target words in the passage to be glossed because the readers will pay attention to the glossed words which are crucial in understanding the story (Ko, 2005). Hong (2010) also supported that the teacher should avoid selecting too many words and selecting words based on their intuitive sense or personal judgment. Instead, they may base the selection on the available lists and frequency corpora and gloss the words according to the usefulness and importance in the text. 2.) Design glossing to be clear and fit the context as well as compatible with the learners’ English proficiency level. The results of the research showed that the students prefer Thai marginal glossing due to their limited English proficiency, so Thai marginal glossing should be provided in the reading as the students requested.

ISSN 2039-9340 Mediterranean Journal of Social Sciences Vol. 3 (11) November 2012
118
3.) Provide glossing in every reading material because the students prefer to read the passage with glossing plus example sentences. In addition, glossing remains a common and acceptable aid for many foreign language textbooks (Davis, 1989 cited in Lomicka (1998). 4.) Stimulate the students to read external reading which has glossing because: 1) glossing can make the students less dependent on their teachers, allowing the greater autonomy. That is, glossing makes the text a bit self-contained by reducing the need for the teacher explanation or dictionary use (Nation, 2008; Ko, 2005); 2) when the teacher let them choose the books or material in which they are interested by themselves, their reading comprehension will be improved due to their automatic application of glossing, various vocabulary learning strategies and a variety of reading strategies.
Reference Al-Jabri, S.S. (2009). The effects of L1 and L2 glosses on reading comprehension and recalling ideas by Saudi students. Moharram
1430 AH., 1(1), 11-27. Bell, F.L., &LeBlanc, L. B. (2000). The language of glosses in L2 reading on computer : Learners’ preferences. Hispania, 83(2), 274-285. Cheng, Y. & Good, R.L. (2009). L1 glosses: Effects on EFL learners’ reading comprehension and vocabulary retention. Reading in a
Foreign Language, 21(2), 119-142. Farvardin, M.T. & Biria, R. (2012). The impact of gloss types on Iranian EFL students’ reading comprehension and lexical retention.
International Journal of Instruction, 5(1), 99-144. Huckin, T. & Coady, J. (1999). Incidental vocabulary acquisition in a second language. Studies in Second Language Acquisition, 21,
181-193. Hong, Xu. (2010). Review of effects of glosses on incidental vocabulary learning and reading comprehension. Chinese Journal of
Applied Linguistic (Bimonthly), 33(1), 56-73. Jacobs, G.M., Dufon, P., & Hong, F.C. (1994). L1 and L2 vocabulary glosses in L2 reading passages: Their effectiveness for
increasing comprehension and vocabulary knowledge. Journal of Research in Reading, 17(1), 19-28. Ko, M.H. (2005). Glossing, comprehension, and strategy use. Reading in a ForeignLanguage, 17(2), 1-17. Laufer, B. (1997). The lexical plight in second language reading. Second Language Vocabulary Acquistion : A Rationale for Pedagogy.
(1), 20-34. Lommicka L. L. (1998). To gloss or not to gloss: an investigation of reading comprehension online. Language Learning and Technology,
1(2), 41-50. Nation, I.S.P. (2008). Teaching vocabulary (strategies and techniques). Boston: Heinie. Nation, I.S.P. (2006). Learning vocabulary in another language. Cambridge : Cambridge University Press. Nation, I.S.P. (1990). Teaching and learning vocabulary. New York : Newbury House Publishers. Oxford, R. L. (1990). Language learning strategies: What every teacher should know. New York: Newbury House Publishers. Thornbury, S. (2008). How to teach vocabulary. England: Pearson Education Limited. Wei, M. (2007). An examination of vocabulary learning of college-level learners of English in China. Retrieved April 12, 2007, from
http://www.asian-efl-journal.com

ISSN 2039-9340 Mediterranean Journal of Social Sciences Vol. 3 (11) November 2012
119
Exergame-Design and Motor Activities Teaching:
An Overview of Scientific Paradigms on Motor Control
Pio Alfredo Di Tore
Gaetano Raiola
University of Salerno, Department of Human, Philosopical and Educational Sciences Corresponding author.Pio Alfredo Di Tore E-mail: [email protected]
Doi:10.5901/mjss.2012.v3n11p119
Abstract: This study is part of a larger project designed to assess the effectiveness of the use of exergames in the teaching of motor activities. The project starts with an overview of the state of the art of exergames and the influence of psychological models of the movement in software design. The experimental section of the project involves the creation of 3 exergames educational, of which:an exergame related to visuomotor integration, on the basis of tests as Bender Gestalt and VMI, an exergame dedicated to test, in augmented / virtual environments, some commonly accepted principles in motor control (speed-accuracy trade-off, Hick's law, stimulus – response compatibility, Fitts' law), and an exergame related to the acquisition of cognitive skills through the involvement of the whole body (reading – writing skills). In this general framework, this study locates itself as the scientific starting basis, providing an overview of the literature on exergames (from which does not seem to be present exergames specifically designed for use in teaching of motor activity) and a summary of the psychological models of movement Keywords: exergames; motor control; cognitive approach; motor learning;
1. Introduction The term "exergame" is used to define the combination of gaming with exercise. In particular, with exergame we refer to a category of video games in which the interaction is not based only on the hand-eye coordination, but on the whole body. The interaction based on the whole body is made possible by a series of non-standard controller, such as, for example, the Wiimote and Balance Board, connected to the Nintendo Wii console, and the Microsoft Kinect sensor, popular as an accessory for the Xbox.
The exergames were immediately hailed as a welcome development, for the contribution they offer as a weapon against a sedentary lifestyle (Chamberlin & Gallagher) and the level of user involvement, which adds to the traditional value of videogames (Baranowski, Buday, Thompson, & Baranowski, 2008) the attractiveness of natural interfaces (Wigdor & Wixon).
Attention was initially focused on promoting healthy lifestyles and on the struggle against physical inactivity, therefore the focus was on energy expenditure. (SIEGEL, HADDOCK, DUBOIS, & WILKIN)
The aspect that is frequently emphasized in the studies that have dealt with the energy expenditure is the attraction exerted by exergames on individuals normally reluctant to physical activity. The exergames, in other words, are mainly a way to promote wellness and encourage the movement of persons engaged in sedentary lifestyles.
“Exergaming is a term used to describe video games that provide encouragement to exercise, particularly for an audience that may be reluctant to engage in the more traditional forms of exercise. Exergames are a commonly accepted method of encouraging more physical activity to promote better health for those with high levels of sedentary screen time”(Whitehead, Johnston, Nixon, & Welch).
The results are encouraging, considering that energy expenditure doubled in subjects involved in exergames as compared to individuals that use "traditional" videogames. (Lanningham-Foster et al.)
On the basis of positive results, research has explored other fields, showing how the videogaming based on the whole body can bring benefits at cognitive level in autism or enhance brain activity in the elderly.
“Exergaming may be useful for the management of behavioral disturbance and for increasing cognitive control in children on the autism spectrum” (Anderson-Hanley, Tureck, & Schneiderman, 2011); “Exergames' boost brain function among seniors” (Anderson-Hanley et al.)

ISSN 2039-9340 Mediterranean Journal of Social Sciences Vol. 3 (11) November 2012
120
The results of cited studies cited had the effect of subverting the traditional skepticism with which gaming activities have often been considered within physical education and health education.
The current trend is to consider how video games present many potential advantages in the field of motor activities and promotion of wellness. The features which can positively influence skills, attitudes and behaviors regarding health and exercise, are:
• the fascination of these games (and therefore the increased motivation), • opportunities that videogames offer for active and experiential learning of concepts and skills, • personalized feedback and instruction, • opportunity for learning through social interaction.
“Exergame present many potential benefits for HE and PE. […] Pulling together those benefits, it derives that major common strengths for both disciplines, which may positively influence young people’ knowledge, skills, attitudes and behaviors in relation to health and physical exercise, are the unique motivational appeal that those games possess as well as the opportunities that they offer for active, exploratory and experiential learning of concepts and skills, for rehearsal of skills within a safe environment, for individualized feedback and differentiated instruction, and for learning through social interactions. In addition, the new generation of physically interactive electronic games seems to be particularly valued in the overviewed literature as it can provide opportunities for actual physical exercise and motor skill learning within PE contexts.” (Papastergiou).
However, other studies have led to less exciting results and revealed the limits of exergames A study by Hsu (Hsu et al.) on effects of Wii Bowling in an exercise regimen for patients with long-term dysfunction of
the upper limbs showed that the only significant finding was a greater enjoyment of 'activity compared to a control group subjected to a standard regimen.
A study on “effects of adding Nintendo Wii® Bowling to a standard exercise regimen for residents of long-term care with upper extremity dysfunction” showed as“the only significant finding was a measure of enjoyment of activity when compared to a standard exercise group.” (Tanaka et al.)
This leads to consider how the current generation of exergames is not designed specifically to support teaching of motor activities or rehabilitation. There are general purpose products, intended for large groups of users, but software products based on a robust theoretical framework, oriented to the acquisition of specific motor skills, for use in teaching of physical education and rehabilitation, are still prerogative of the experimental research and have not enough spread to allow an overall estimate of the cognitive and educational impact of exergames.
The research on the actual effectiveness of exergames in the acquisition of specific motor skills still seems lacking. (Di Tore & Raiola, 2012)
“Because many exergames such as DDR or Wii Sports tennis require rapid hand–eye or foot–eye coordination, they may improve general coordination skills. However, the majority of research on coordination benefits involves elderly people playing sedentary video games, not exergames. Video game play increased perceptual-motor skills including hand–eye coordination, dexterity, and fine motor ability (Drew & Waters). At present, there is no exergame research on this topic.” (Staiano & Calvert) 2. Exergame-design and motor activities teaching In this context, below is presented a brief summary of currents of thinking in the context of motor control and its learning, to assess their methodological and didactic consequences and evaluate the didactic implications to be considered in exergame design and development process. In the context of PE teaching, the main approaches to motor control and motor learning are:
• the cognitive approach • the ecological approach
The different approaches are distinguished by the position and the role attributed to prescriptive mental structures: representations, knowledge, motor plans, plans in the production of motor skills. The motor control theories developed in cognitive psychology have generated a substantial amount of educational applications. According to these theories, the human being has, at the cerebral level, a series of motor programs, or sequences of commands that at the level of the central nervous system, coordinate the execution of the movements. According to a first draft, the information processing by sense organs and associated analyzers, including those defined proprioceptors, allows the system to correct the movements during the performance through the closed loop model of motor control (Adams).

ISSN 2039-9340 Mediterranean Journal of Social Sciences Vol. 3 (11) November 2012
121
The closed loop model assumes that the movements are performed slowly, in the order of 200 milliseconds, such as to allow the correction of the error registered during the action, on the basis of feedback. The longer the time of execution, the larger the possibility of using the motor control circuits based on feedback, peripheral control, and on the on line error correction (Schmidt & Wrisberg, 2008).
In lower execution times, ie when the movement is more rapid, due to the high speed of conduction of nerve impulses, the movement is not susceptible of correction in progress and is fully programmed at the level of central nervous system , with the open loop motor control model (Schmidt). Errors can be recorded for possible use in the next run.
The cognitive theory of motor learning is derived directly from the integration of open loop model and closed loop model in a synthesis commonly accepted known as generalized motor program.
Learning movements is to develop cognitive structures, by information processing, definitions of motor programs, selection of programs with monitoring actions. These processes allow to compare in real time (closed loop) or later (open loop) results and expected results, triggering a process of continuous adjustment and refinement of movement and, ultimately, of the motor program itself.
The generalized motor program "is a motor program that defines a model (pattern) motion, this flexibility allows you to adapt it so as to produce variations of the motor pattern adapted to the changed demands of the environment" (Schmidt & Wrisberg, 2008). Its structure is such that allows the performer to adjust the movement in order to deal with the changing needs of the environment.
The teaching model that follows cognitive approach is, therefore, a prescriptive model , that is to give precise rules to student athlete with practice mode to stabilize and improve the motor program to achieve the highest possible performance: breaking down the variability of execution up to cancel to achieve technical perfection. Obviously, in order to acquire the learning motor according to the vision of cognitive psychology have been tried a huge amount of educational practices that have produced results on the strategies and techniques for structuring exercises to achieve optimal learning.
The ecological approach, instead, does not consider it necessary to use prescriptive mental structures: the action is directly available for those who act in their own environment. In other words, the system sensorimotor possesses properties of self-organization which does not necessitate the use of a motor program. In the ecological approach, the central nervous system is not regulated by specific laws, but it developed from the environmental influences on the neuronal groups that specialize on specific tasks. (Edelman, Tononi, & Ferraresi, 1995).
In this approach, learning is defined as an education of attention (Gibson, 1986) to make the body in close relation with the environment. The perception assumes a particular importance and gives meaning to the implementation of the action, acting on the mechanisms of motor learning. Learning involves optimizing the processes of perception and develop the ability to select appropriate stimuli for an immediate effect on motor behavior.
In the two approaches presented, the perception of the context is different and different is the definition of the learning process. In the first case of stabilizing a motor program effective in function of information processing. In the other, is a question of the adaptability of the motion by coupling the diversity of the environment and the specificity of the individual (Carnus).
The direct consequence of cognitive theory to learning applications is a prescriptive approach. If learning movements means structuring motor programs increasingly articulated and optimizing parameters, the result is a prescriptive teaching of motor activities, which consists in prescribing exercise to the student how to stabilize motor programs and minimize execution variability. On this basis, was developed huge amount of results on the strategies and techniques for structuring exercise to achieve optimal learning outcomes.
By contrast, in ecological approach, practice does not mean repeating the same solution to a given task, but stimulate the emergence of spontaneous solutions (heuristics) to motor problems, then leverage the execution variability, that is to implement a process of finding solutions motor that passes through the continuous variation of motor gestures.
According to the ecological approach, learning means being able to gradually find the best solution to a given motor task in a given context. A prime example is the expression coined by Bernstein (Bernshteĭn, 1967), "repetition without repetition": practice does not mean repeating the same solution to a given task, but repeating over and over again the process of solution of the task. If learning movements means optimizing the process of solving motor tasks, educational implications are different from those prescriptive of the cognitive approach:
The teacher should assist the student in finding autonomous solutions. If the learning task is too complex, teacher does not have to impose constraints to learner to simplify the motor execution, but he must apply constraints to the environment. The precondition for any effective strategy for facilitating learning is that the unitary perception / action structure, postulated in the ecological approach, is not altered.

ISSN 2039-9340 Mediterranean Journal of Social Sciences Vol. 3 (11) November 2012
122
3. Conclusion On the basis of the above, knowledge of psychological models of movement is a necessary basis for the design and development of exergames intended for teaching of motor activities. The next challenge for designers is the development of exergames oriented to the learning of motor skills, developed with reference to a scientific tradition, in order to achieving effective and efficient tools for teachers and trainers.
References Adams, J. A. (1971). A closed-loop theory of motor learning. Journal of Motor Behavior; Journal of Motor Behavior. Anderson-Hanley, C., Arciero, P. J., Brickman, A. M., Nimon, J. P., Okuma, N., Westen, S. C., et al. (2012). Exergaming and Older Adult
Cognition: A Cluster Randomized Clinical Trial. American Journal of Preventive Medicine, 42(2), 109-119. Anderson-Hanley, C., Tureck, K., & Schneiderman, R. L. (2011). Autism and exergaming: effects on repetitive behaviors and cognition.
Psychology research and behavior management, 4, 129. Baranowski, T., Buday, R., Thompson, D. I., & Baranowski, J. (2008). Playing for real: Video games and stories for health-related
behavior change. American journal of preventive medicine, 34(1), 74-82. e10. Bernshteĭn, N. A. (1967). The co-ordination and regulation of movements: Pergamon Press. Carnus, M. F. (2010). Analyse didactique clinique de l'activité décisionnelle de deux enseignantes en éducation physique et sportive
(EPS). Education et didactique, 4(3), 49-62. Chamberlin, B., & Gallagher, R. (2008). Exergames: Using video games to promote physical activity. Di Tore, A., & Raiola, G. (2012). Exergames e didattica delle attività motorie e sportive. European Journal of Sustainable Development,
1(2), 221-228. Drew, B., & Waters, J. (1986). Video games: Utilization of a novel strategy to improve perceptual motor skills and cognitive functioning in
the non-institutionalized elderly. Cognitive Rehabilitation. Edelman, G. M., Tononi, G., & Ferraresi, S. (1995). Darwinismo neurale: la teoria della selezione dei gruppi neuronali: Einaudi. Gibson, J. J. (1986). THE ECOLOGICAL APPROACH TO VISUAL PERCEPTION: Taylor & Francis. Hsu, J. K., Thibodeau, R., Wong, S. J., Zukiwsky, D., Cecile, S., & Walton, D. M. (2011). A “Wii” bit of fun: The effects of adding
Nintendo Wii® Bowling to a standard exercise regimen for residents of long-term care with upper extremity dysfunction. Physiotherapy Theory and Practice, 27(3), 185-193.
Lanningham-Foster, L., Jensen, T. B., Foster, R. C., Redmond, A. B., Walker, B. A., Heinz, D., et al. (2006). Energy expenditure of sedentary screen time compared with active screen time for children. Pediatrics, 118(6), e1831-e1835.
Papastergiou, M. (2009). Exploring the potential of computer and video games for health and physical education: A literature review. Computers & Education, 53(3), 603-622.
Schmidt, R. A. (1975). A schema theory of discrete motor skill learning. Psychological review, 82(4), 225. Schmidt, R. A., & Wrisberg, C. A. (2008). Motor learning and performance: a situation-based learning approach: Human Kinetics
Publishers. SIEGEL, S. R., HADDOCK, B. L., DUBOIS, A. M., & WILKIN, L. D. (2009). Active video/arcade games (exergaming) and energy
expenditure in college students. International journal of exercise science, 2(3), 165. Staiano, A. E., & Calvert, S. L. (2011). Exergames for physical education courses: Physical, social, and cognitive benefits. Child
Development Perspectives, 5(2), 93-98. Tanaka, K., Parker, J., Baradoy, G., Sheehan, D., Holash, J. R., & Katz, L. (2012). A Comparison of Exergaming Interfaces for Use in
Rehabilitation Programs and Research. Loading... 6(9). Whitehead, A., Johnston, H., Nixon, N., & Welch, J. (2010). Exergame effectiveness: what the numbers can tell us. Wigdor, D., & Wixon, D. (2011). Brave NUI world: designing natural user interfaces for touch and gesture: Morgan Kaufmann.

ISSN 2039-9340 Mediterranean Journal of Social Sciences Vol. 3 (11) November 2012
123
Italian Eurasian Diplomacy: Giulio Melegari and his Work as Ambassador Between
Tokyo and St. Petersburg (1896-1912)
Francesco Randazzo
University of Perugia, Italy
Doi:10.5901/mjss.2012.v3n11p123 Abstract: One of the most painful pages in Russian history is represented by its defeat in the Russian-Japanese war of 1904-1905. From that event derive the notorious Bloody Sunday (January 1906) and the October Manifesto which forced the Tsar to give the people popular representation- Duma. An observer of these events was Giulio Melegari, son of the ex Minister of Foreign Affairs Luigi Amedeo. From Tokyo to St. Petersburg, where his carrier will end, he will be a careful witness of two powers in the center of world history and a worthy diplomat; author of the Racconigi Agreement (1909). Keywords: Russia, Diplomacy, Giulio Melegari, Italy, Russian-japanese war; Kokovcov, Witte, Nicola II The year 1861 represents an important one for Italians and also for Russians. At the completion of the Risorgimento Movement, under the Savoy lead, the Romanov Empire responds by emancipating approximately forty million peasants. The historic harmony embraces unanimous sympathies in Italy but clashes against Minister Aleksandr Michajlovič Gorčakov (1798-1883) resistance in recognizing the new kingdom in which territorial limits were not established and to admit it could have disturbed the peace in Europe, especially in the hot zones like the Balkans 1. Such diplomatic perplexities are testified by Ministers Filippo Oldoini and Gioacchino Pepoli, Envoy Extraordinaries of the Kingdom of Italy in Russia (Petracchi, 1993). Talks between Consul Pepoli and Minister Gorčakov are famous for being inherent to problems of the principal of liberty and nationality of the people; too risky for the security of Europe according to the statesman, rich in virtue for the Italian2
Germany’s Chancellor Bismarck is undoubtedly a strong ally able to avert the danger of a France who’s intent is declaring war on Italy because of the famous “clerical affair” which destabilized not only Italian domestic politics but gave rise to a heated debate between different schools of thought (Biagini-Reichel, 1991). Francesco Crispi, the protagonist of politics between 1870 and 1890’s, though ousted from the Depretis cabinet, chose as companions Nicotera, Amedeo Melegari, Zanardelli, Mancini, Mezzacapo, Coppino, Brin and Majorana, to lead Italy towards the neo-colonial adventure diverting for several years away from its main mission; the enlargement of the universal suffrage, the underdevelopment of many southern areas and the combination, according to historian Ghisalberti, which still exists between the “rigida centralizzazione amministrativa con la quale era governato il regno di Sardegna fino al 1861 e […] il moderno liberalismo” (rigid centralized government with which it ruled the kingdom of Sardinia until 1861 and […] modern liberalism, Ghisalberti, 1993). Crispi’s way proved not to be the route to undertake, therefore, towards the mid- nineties, with Antonio di Rudini, Italy partially abandons the venture and proceeds with the intent to consolidate foreign affairs and to improve internal conditions. The two countries, Italy and Russia lived different stages of evolution and progress; only after the
. In effect, to recognize the struggle for Italian liberation would have aroused the recognition of Polish problems which were in turmoil after the insurrections of 1863. After the exit of Pepoli from the scene, Italian-Russian relations became positive, because of Edoardo De Launay’s fervent work, he knew how to mend and fortify these relations: supporting authoritarian and conservative Russian ideas and expansionistic goals in regards to central Asia and Ottoman territories. Ideas of Minister De Launay, in the wake of the collective phenomena of Pan-Germanism and Pan-Slavism, are summarized in his statement “ce sont là des grands mots. Comme les feux follets, quand on court sous, on le fait reculer” (Chabod, 1965).
Italian foreign policy, after its unification, was projected initially on tying the country’s destiny to that of other European powers in order to complete a reunification to be achieved in stages. The crisis of the Ottoman Empire following the defeat against the Russians, and the subsequent Congress of Berlin in 1878, momentarily reanimated interest regarding the fate of Italians in Trento, Trieste and Dalmatia “with the typical idea of Mazzini’s; Mazzini wanted to recall the power of Slav Risorgimento to dissolve the Habsburg monarchy and promote, weakening Austria, the full realization of Italian unity” (Chabod, 1965).
1 Documenti Diplomatici Italiani (DDI), s. I, (1861-1870), Vol. II, (31 dicembre 1861-31 luglio 1862), n. 87, 11 febbraio 1862, p. 127. 2 DDI, s. I, 1861-1870, Vol. III (1 agosto 1862-9 luglio 1863), n. 525, 19 Aprile 1963, p. 471.

ISSN 2039-9340 Mediterranean Journal of Social Sciences Vol. 3 (11) November 2012
124
intervention of Piedmont in the Crimean War, interest by Russian liberal groups grew for the Italian Risorgimento, which became the ideal common theme where ideologues and intellectuals of the time constantly confronted one another.
On the eve of the twentieth century, Russia was experiencing a time of intense economic and social transformation. This process was not widely supported by the Tsarist regime, resulting in a slow and cumbersome maturation process under the pressure of innovative ideas from the Decembrist Revolt of 1825 onwards accompanied a phase of modernization. The social transformations underway as evident by the copious and fascinating literary and cultural activity of the time, in addition to rapid industrialization, leading to a modest growth of capitalism and two social groups; Bourgeoisie and the Urban proletariat, which nevertheless represent a small percentage compared to the mass of the peasantry who still lives mainly within the traditional community structure in Russia, the obsina. This change did not go unnoticed in the eyes of many Europeans, most notably many Italians, who left during the time of the Crimean War, which marked a setback in relations between Russia on one side, the Kingdom of Savoy, ally of the Ottoman Empire, France and England on the other. The review of that judgment is clear through books published in Italy during those years
(Modrich, 1892; Carletti, 1894; Barbiera, 1894). . Among the aspects most highlighted by the new literary production are the reformist force of Tsarism, latent
energies of the Russian people and reforms in the social field. Tomaso Carletti, a young employee of the Embassy of St. Petersburg, emphasized the parallels between mir and the way of English self-government meanwhile strikes, riots and student protests were increasingly common in a country that was headed toward a mixed phase of revolution and reform as never before in its imperial history. Even the resounding defeat of the Tsarist empire in Manchuria against the emerging Japan, takes a back seat to the Bloody Sunday of January 1905, that pushes for the first time the Romanov Dynasty to accept the compromise of a constitutional monarchy. The theory of a liberal model takes off; it cyclically invests a country and tends its history towards an inescapable need for individual freedom and parliamentary democracy. In an effervescent climate relations are renewed between Italy and Russia. Thanks especially to the diplomatic actions of Giulio Melegari who in substitution to Conte Roberto Morra of Lavriano, knew how to build a diplomatic action that tends to favor a rapprochement between the two countries culminated with the encounter of Raconigi; truly an important success of his diplomatic action. Giulio Melegari, born in Turin, on December 11, 1854, he was the son of Luigi Amedeo Melegari3
“Signor Cavaliere, coll’ossequiato Dispaccio del 3 corrente mi si annunciava che con Decreto del 25 ultimo scorso Sua Maestà aveva degnato conferirmi la qualità di Segretario di Legazione di seconda classe. Sento di dover particolarmente codesto onore e tutto il bene che potrà derivarne in avvenire per me all’Eccellenza Vostra, onde sia che la mia vita Le rimanga vincolata da un perenne debito di riconoscenza che con ogni
(1805-1881), a well-known politician and state counselor of the Kingdom of Italy and of Maria Carolina Mandrot (called Magdalene). He graduated law school from the University of Pisa in 1877. On August 10th of the same year he was admitted to the Ministry as Honorary Officer of Legation, two years later he was effectively admitted in the diplomatic service. Dispatched to Bern, where his father resided as Envoy Extraordinary and Minister Plenipotentiary, he was also appointed as attaché to the Bern Embassy (May 7, 1879), for three subsequent years from 20 May 1879 he worked in a familiar reality as a result of exposure to his father’s profession. After several months in the Swiss capital he was appointed Second Secretary of Legation (Royal Decree of 25 December, 1880). In this regard, given the esteem granted to him at high levels, January 14, 1880, he wrote to Benedetto Cairoli, President of the Council and Minister of Foreign Affairs, the following words of appreciation:
3 Figlio di Pietro e di Maria Simonazzi, Luigi Amedeo Melegari nacque il 19 febbraio 1805 a Meletole di Castelnovo di Sotto in provincia di Reggio Emilia. Conseguita la laurea in giurisprudenza a Roma, venne nominato professore di diritto costituzionale all’Università di Torino nel burrascoso anno 1848. Diversi anni li trascorrerà a Losanna dove sio ritroverà esule patriota insieme a Mazzini, di cui divenne amico, e tanti altri. Deputato dalla II all’VIII legislatura per i collegi di Bticherasio, Bosco di Alessandria, Correggio e Montecchio, sarà nominato consigliere di Stato nel 1859 mentre l’anno successivo sarà assegnato alla sezione grazie e giustizia. Nel 1862 viene nominato senatore. Rivestirà per diversi anni la carica di inviato straordinario e ministro plenipotenziario a Berna mentre la sua carriera culmina nel gabinetto Depretis dove ricoprirà dal 25 marzo 1876 al 26 dicembre 1877 la carica di ministro per gli Affari Esteri. Note sono le sue corrispondenze con Giuseppe Mazzini pubblicate da D. Melegari in una serie di scritti (Lettres intimes de Joseph Mazzini, Paris, 1895; La Giovine Italia e la Giovine Europa. Dal carteggio inedito di Giuseppe Mazzii e Luigi Amedeo Melegari, Milano, 1906). Morirà in servizio a Berna il 22 maggio 1881. Notizie tratte dal volume La formazione della diplomazia internazionale (1861-1915). Repertorio bio-bibliografico dei funzionari del Ministero degli Affari Esteri, Roma, Istituto poligrafico e Zecca dello Stato, 1987, pp. 486-487. Sui rapporti di Mazzini con Melegari si veda anche il contributo di Giovanni Ferretti, Luigi Amedeo Melegari a Losanna, Roma, Vittoriano, 1942, XLX, pp. 368, in 8*. l. 45.

ISSN 2039-9340 Mediterranean Journal of Social Sciences Vol. 3 (11) November 2012
125
studio curerò di scontare ogni qual volta mi se ne porga l’augurata opportunità. Gradisca intanto, Signor Ministro, coi miei più vivi ringraziamenti, l’espressione del mio profondo ossequio4
In July 1881, two months after the death of her husband Luigi Amedeo, Maria, wife of the former State Senator, wrote a letter to Cairoli from Bern for her son Giulio referencing the position of first secretary in Rome where the family wanted to relocate to (letter in French from Bern on July 11, 1881). Almost a year later, May 27, 1882, Giulio Melegari returned to serve in the Ministry (where in the meantime the Minister of Foreign Affairs is Mancini) but for a short period because, in place of Cavalier Riva, he returned to serve temporarily in Bern August, 1882 (Ministerial Decree of July 19th). In February 1883, Melegari went to Florence where his sister Dora had called for him due to their mother’s health problems. He then asked for three months leave which were granted. Upon return from leave he was relocated from Bern to the Ministry of Foreign Affairs in Rome
”.
5. With the Ministerial Decree of 5 May, 1885, he was called to serve in the Royal Legation of Rio de Janeiro as First Secretary. Melegari arrived in the capital on September 6th. In regards to this period there isn’t a lot of information, only that Melegari requested a period of leave, through Ambassador Ernesto Martuscelli, for the summer of 1887 in order to tend to “domestic interests”6
non sarebbe, a parere dello scrivente, cosa giusta ed equa, qualora, senza tener alcun conto dei quattro anni e mezzo passati dal Silvestrelli fuori di servizio (la metà della sua carriera), lo si riammettesse in attività di servizio nella stessa posizione che prima occupava, e ciò a scapito di chi, avendo quasi uguale anzianità, prestò per dieci anni un non interrotto servizio di cui parte in America
. From Rome, on January 19, 1888, Melegari addressed a letter to the Ministry in which he criticizes his colleague Giulio Silvestrelli, Second Class Secretary of the Legation, for the length of his career, even through several non-operational years. Above all, the reason that pushes a diplomat into a career is the actual count of occupational time as an honorary officer, which is not valid for seniority. He writes:
7
Melegari’s “observations” would yield some effects; after a few months on 20 April, 1888, he was invited to the Royal Legation in Berne with the duties of First Secretary rendering “diligent and intelligent work”; the Italian Ambassador to Switzerland praised and affirmed this in his letter to the Ministry on July 5, 1888. He replaced Cav. Vigoni for a short period after which, by Royal Decree, on June 18th he was dispatched to Monaco of Bavaria where Barone Cova was acting ambassador. The promotion to First Class Secretary of Legation took place on November 14, 1888, with the effective date of December 1st and an “annual salary of 4000 lire”. During these years he came into contact with the German-Prussian mentality and followed the evolution of the Bismarckian policy without leaving any particular sign. In 1888, Guglielmo II came to power in a German state dominated by a military caste and a parliament which submitted to the government, though elected by universal suffrage. The Kaiser, who had an impulsive temperament, within a few years, shattered the Bismarck project aimed at creating a network of diplomatic relations in favor of Germany. The new address briefed to foreign affairs, the belief that they could act without the contribution of the Tsarist Empire against rivals England and France, brought about in a short time the following: the rapprochement between the courts of St. Petersburg and Paris (1892); the discharge of old Chancellor Bismarck and an active economic cooperation with the Sublime Porte with an enormous capital for the construction of the Baghdad Railroad that connected Constantinople to the Persian Gulf. In the summer of 1890 because of a poorly treated case of diphtheria caught in May, Melegari is forced to ask for two months leave from work. Two years later, February 15, 1892, with Ministerial Dispatch no. 5607/121 he received the decoration, “Officer of the Crown of Italy”. In a letter to the Marquis of Rudini, then president of the council, he expressed his gratitude for “the precious certificate of kindness in my regards by which I will always try, within the limits of my feeble
.
(it's not, in the writers opinion, right or fair, without taking into consideration the four and a half year Silvestri was out of service (half of his carrier), putting him back into service in the same position as occupied before, that in spite of who, having almost the same seniority, served without interruption for 10 years of which in part in America.)
4 MAE, Archivio Personale, Serie VII, Fondo M 5, “Giulio Melegari”. Dalla Legazione di Berna, Lettera di Giulio Melegari al Signor Benedetto Cairoli, presidente del Consiglio, ministro degli Affari Esteri in data 14 gennaio 1880. Insieme a tale documento vi è una lettera del giorno prima scritta da Luigi Amedeo Melegari, padre di Giulio, nella quale oltre a ringraziare il ministro per la benevolenza dimostrata nei confronti del figlio, l’ex vecchio ministro invoca per il figlio un posto “onorevole nel nostro corpo diplomatico”. 5 MAE, Archivio Personale, Serie VII, Fondo M 5, “Giulio Melegari”. Lettera del ministro Mancini al cav. Giulio Melegari in data 11 febbraio 1883. 6 MAE, Archivio Personale, Serie VII, Fondo M 5, “Giulio Melegari”. Lettera dell’ambasciatore Martuscelli al cav. Depretis, presidente del Consiglio e ministro degli Affari Esteri in data 24 aprile 1887. Depretis concederà il permesso di rientro in Italia del primo segretario cosicché dal 14 agosto Melegari poté usufruirne. 7 MAE, Archivio Personale, Serie VII, Fondo M 5, “Giulio Melegari”. Lettera personale di Giulio Melegari al Ministero degli Affari Esteri di Roma in data 19 gennaio 1888.

ISSN 2039-9340 Mediterranean Journal of Social Sciences Vol. 3 (11) November 2012
126
strength, to make myself always worthy of, even in the future”8
In Bucharest on February 11, 1895, Melegari receives the news of having been awarded with the decoration “Officer of the Order of Saints Maurice and Lazarus”, by the Decree of 20 January, 1895. After two years from his arrival in the Romanian capital, in April 1896, he is transferred for the first time to St. Petersburg, where in the summer of that same year he worked at the embassy pro tempore. His resistance to accept the assignment is overcome by the insistence of the ministry and with a letter dated simply “Sunday night”, he surrenders and accepts the assignment. He speaks to Minister Onorato Caetani of Sermoneta with these words: “I surrender to your advice and accept the post in Petersburg in the hope of, in a not too distant future, to receive another more convenient destination for me” not knowing that this post, in the near future, would mark an important step, last and decisive of his diplomatic career.
. In January 1893, Melegari is offered a transfer to the Embassy in Lisbona that he refuses. On June 14, 1894, he is assigned for duty at the Royal Legation in Bucharest, headed by Count Curtopassi, where he finds a very different situation from the previous location. He leaves Monaco of Bavaria definitively on August 7th. The Balkan world was still troubled by a lively nationalism that reanimated after the Congress of Berlin in 1878. The various kingdoms and principalities of the Balkan Peninsula experience a very critical domestic situation due to the constant contrast among the conservative nobles, pro-Austrians, and small peasant proprietors. In particular Charles I of Hohenzollern-Sigmaringen’s (1866-1914) Romania was in a state of agitation because of the sale of Bessarabia to Russia in 1878. This implied its approach to a dual monarchy even if within a deep resentment towards the Magyarization policy initiated by the Hungarians against the Romanian population of Transylvania.
9
The Tsar, in the meantime, paid attention to the newspapers propaganda which at the time deemed completely inappropriate the attitude of those kingdoms that have “invaded” the African regions. One of these pamphlets, entitled “Abessincy, v’’ bor’bje za svobodu” [Abyssinia, in war for liberty]
He went in hopes of soon obtaining a more favorable destination along with a promotion to counselor because St. Petersburg is for every career diplomat a “punitive” assignment in which you receive more for demerits than merits. Additionally the post was run for years by simple business managers, like Count Francesco Bottaro and Joseph Costa Silvestrelli (Petracchi, 1993). The reasons were clear why even the old Ambassador Costantino Nigra outright refused to return to the Russian capital, considering the refusal of Conte Luigi Tonielli before him and the sudden death of Francesco Curtopassi during his trip from Vienna to St. Petersburg. But, as pointed out by Giorgio Petracchi in his volume on Italian diplomacy in Russia, at the base of the resistances of the men assigned to that post, other than economic reasons, the Russian post is considered the most expensive of Europe because of its numerous representation parties, there are also political reasons and there are particular problems “ in reconstructing and interpreting the Tsarist political process, both domestic and foreign” which discourages many ambassadors from applying themselves with any study of Russia for that period. It’s a Russia that looks with suspicion upon the neo-colonization initiated by western countries, to the detriment of the African territories because of the limited navigability of the Suez Canal, vital for its Asian interests.
10 strongly condemned the Italian adventure in Abyssinia citing a Latin phrase “Concordia parvae res crescunt, discordia maxumae dilabuntur”. It’s with great enthusiasm that Russia embraces the announcement of the new government run by Rudini. The Italian ambassador in St. Petersburg, Maffei, after hearing about the change of management responds in this way: “it’s not necessary that I say how hostile Russian public opinion is to the Italian policy of expansion in Abyssinia” and attaches excerpts and translations of articles extracted from the “Jounal de St. Petersbourg”, official agency of the state, and of “Novosti” and “Novoe Vremja” which in unison applaud the entrance of the new staff of men like Colombo and Branca, who are not partisans of the triple alliance11
The Marquis, Carlo Alberto Maffei of Boglio, a former ambassador in Madrid and appointed to the seat in St. Petersburg, wrote from St. Petersburg on June 11, 1896, to the Foreign Minister Duke of Sermoneta, that the Tsarist controlled official media “Il Journal de S. Petersbourg”, devoted several pages to the Anglo-Italian question about “African
. With Rudini’s new staff there is a perception of a change of course in Italian foreign policy, guided previously by Crispi, and the feeling of archiving the disastrous experience in Abyssinia (even though Russian newspapers, like Novoe Vremja, continue until the end of May to condemn the Italian government’s behavior for not letting convoys of the Red Cross transit in Abyssinia).
8 MAE, Archivio Personale, Serie VII, Fondo M 5, “Giulio Melegari”. Lettera dalla Regia Legazione d’Italia a Monaco di Giulio Melegari al Marchese di Rudinì, 18 febbraio 1892. 9 MAE, Archivio Personale, Serie VII, Fondo M 5, “Giulio Melegari”, Lettera privata di Giulio Melegari al ministro degli Affari Esteri, da Roma, senza data. 10 Gli autori del libello sono anonimi e si firmano con A. T. e V. L. Abessincy, v’ bor’bje za svobodu”, S.-Peterburg’, Ekonomič. Tipo-Litografija, 1896, pp. 1-43. In MAE, Serie Politica “P”, Russia 1896-1898, Busta 342, f. 66 11 MAE, Serie Politica “P”, Russia 1896-1898, Busta 342, Lettera di Maffei al Ministero degli Affari Esteri del 12 Marzo 1896, allegato n.3.

ISSN 2039-9340 Mediterranean Journal of Social Sciences Vol. 3 (11) November 2012
127
things” highlighting how l’affaire is strongly felt among Russian public opinion and the Tsarist court12. Maffei, in his last reports from the Russian capital, before the reign of Melegari, openly blames Nicholas II, saying that “it is not a hazard to already affirm that who expects great things from today’s Emperor will experience bitter disappointment, notwithstanding that he has already given proof of irresolution and weakness of character. These defects are always serious for anyone who is called to lead the destiny of a nation, they become fatal to the one who wears the crown of the Tsar, who had the appearance of physically crushing Nicholas II on the day he put on the crown in the historic church of the Assumption” 13
Melegari held the embassy position throughout the summer of 1896, and subsequently, returned in charge a few days before Maffei’s death on May 15th of the following year. Here Melegari comes into contact for the first time with the Russian world that he observed with curiosity and interest. Russia is no longer a distant and unknown power but a partner with which to establish new social and political relations since the Italian government, which tended to have hands free in neo-political colonial Mediterranean Africa. They welcomed the work of containment pursued by Tsarist regime in the Balkans as an anti-Austrian function. Melegari’s first report from St. Petersburg is dated June 30, 1896, and is report n. 405/241.In it, the ambassador speaks of the immense carnage in Moscow during the celebrations of the coronation and the strikes by the government factory workers of St. Petersburg. He underlined how these events impacted heavily on the “good-hearted Nicholas II” who would become ill with jaundice; “malattia che facilmente trae la sua origine da cause morali” (disease that easily takes its origin from moral causes). The Italian diplomat was convinced that these disturbances were due to progress made in Russia by socialist ideas and the Tsar. To defeat them, he had a choice to take into account suggestions from the influential Attorney General of the Holy Synod, Pobedonoscev, which wanted strict enforcement measures, or from various advisers and ministers who would opt for milder solutions
.
14. In subsequent reports, Melegari deals with a variety of different issues, among which were: Russian-Chinese relations in regards to the construction of the Trans-Siberian railway; new loans to Russia by French capitalists 15 ; the resignation of Baron Voruntsov-Daskov as Minister of the Imperial Household (one of which was directly responsible for the massacre in Moscow); and the possible trip of the Tsar and Tsarina to visit various European courts, not only in Berlin, as not to offend the French sensitivity, etc., etc. With regard to the latter issue, Melegari writes: “I’m told that the mother Empress raised many problems against the planned visit. The widow of Alexander III, determined to see her son persevere in the attitude of reserve, which was a constant trait of the late Emperor, in her relation with foreign courts she openly demonstrates her opposition (being particularly unfavorable to the trips to England) and insists that the Imperial trip be limited to the usual visit to the Danish Court.”16
Russia, despite the large influx of foreign capital that goes in part to finance projects such as the construction of the Trans-Siberian railway that links St. Petersburg to Vladivstok (on the Pacific Ocean), remains an empire with semi-feudal features and a despotic and reactionary regime, poorly tolerated by the vast majority of Russian people, ready to revolt. Despite that, Russia was not willing to give up the influential Asian area; on the contrary, it initiated a campaign for the colonization of the East, in which she clashed with England for control of the Pamir region
In another communication to the Italian government, Melegari complains because of the tight knit Tsarist group’s level of cooperation which was little to none and created a scarcity of information.
17
12 MAE, Serie Politica “P”, Russia 1896-1898, Busta 342, f. 66, Lettera di Maffei al Ministro degli Affari Esteri avente per oggetto “La politica Anglo-Italiana nell’Africa, giudicata in Russia”, rapp. n. 328/199 dell’11 giugno 1896 13 MAE, Serie Politica “P”, Russia 1896-1898, Busta 342, f. 66, rapp. n. 384/227 del 24 giugno 1896 avente come oggetto “Il nuovo Czar e la politica nazionale di Alessandro III”. In questa lettera indirizzata dal Maffei al Duca di Sermoneta, ministro degli Affari Esteri, l’ambasciatore italiano fa un lungo excursus sulla “russificazione” operata durante gli anni dello zar Alessandro III nei confronti di tutte le amministrazioni pubbliche. Se infatti con Alessandro II l’elemento tedesco aveva “dominato supremo su tutte le amministrazioni pubbliche”, con il sovrano successivo tale tendenza fu ampiamente abbandonata a favore della cosiddetta “coscienza nazionale” che avrebbe arginato l’antica propaganda nihilista, “più o meno caldeggiata dai nobili, disgustati dalle riforme liberali di Alessandro II”. 14 MAE, Serie Politica “P”, Russia 1896-1898, Busta 342, f. 66, rapp. n. 405/241 del 30 giugno 1896 avente come oggetto “Ritorno a Pietroburgo delle Loro Maestà. Scioperi a Pietroburgo”. 15 A tal riguardo, una relazione dell’ambasciatore italiano a Berlino, Giorgio Calvi Di Bergolo (1852-1924), del 6 agosto 1896, riferiva al nuovo ministro degli Affari Esteri, marchese Visconti Venosta, che i banchieri tedeschi stavano per affrettarsi a concedere nuovi prestiti al governo russo il quale aveva bisogno di più soldi rispetto a quelli realmente chiesti dal ministro Sergej Vitte. In MAE, Serie Politica “P”, Russia 1896-1898, Busta 342, f. 66, rapp. n. 1080/361 del 6 agosto 1896 avente come oggetto “prestito russo”. 16 MAE, Serie Politica “P”, Russia 1896-1898, Busta 342, f. 66, rapp. n. 455/268 del 2 agosto 1896 avente come oggetto “viaggio all’estero delle Loro Maestà Imperiali.
. In March 1896, the
17 La controversia fu Russia e Inghilterra fu risolta con l’istituzione di una Commissione per la delimitazione dei confini russo-afgani che dall’11 marzo al 28 luglio 1895 lavorò per l’elaborazione di un Protocollo di intesa. La trattativa finale, contenente 10 protocolli di cui l’ultimo stipulato in data 10 settembre 1895, venne fatta alla presenza di due delegati dell’emiro afgano, Ghulam Mohi-ud-din Khan e Mufti Ashoor Muhammad Khan, per parte russa dal generale di Stato Maggiore A. Povalo-Schveikovsky, il Consigliere di Stato P. Ponafidin e il colonnello di Stato Maggiore A. Galkin, per parte inglese dal general-maggiore Montagu G. Gerard, C. B.. Da questi accordi la Russia ne ricava che la Gran Bretagna si impegna a non annettere né a stabilire porti militari od opere di fortificazioni tra la

ISSN 2039-9340 Mediterranean Journal of Social Sciences Vol. 3 (11) November 2012
128
Ambassador Maffei, in St. Petersburg, reports the new imperial project created “two new army groups, assigned to the eastern frontier of the empire” (rapp. Riservato n.137/90 del 3 Marzo 1896) and the reinforcement of the naval squad of the Pacific, commanded by Rear Admiral Alekseev.
After the interlude of a few years in Berlin (1898-1901), on April 18, 1901, he was transferred to Tokyo with minister credentials. There he was granted on May 2, 1901, the license for Consul General. In the same year he was promoted to Envoy Extraordinary and Second Class Minister Plenipotentiary. Now his diplomatic career was at a turning point, having gained years of experience Melegari was seasoned enough to hold the fate of a prestigious embassy. In Tokyo he experienced the extraordinary accession of the “Rising Sun Empire” that, after defeating China to which it imposed the Treaty of Shimonoseki (known to China as the Treaty of Maguan), it was determined to challenge Russia on land. In this, England favored Japan and in an attempt to counteract Russian expansionism in central Asia, Korea and Manchuria, concluded a treaty of alliance18 with the Japanese Emperor Meiji; whose reign lasted for more than forty years, from 1868 to 1912. During this period of time, contemporaneously to what was happening in Italy, the unitary Japanese state formed, unlike Italy, where the Albertine statute went to form the basis on which to build the new political reality, devoid of a constitution that came to light only in 188919. The Italian diplomat wrote in his reports from the Japanese capital; despite its basic political problems, Japan had begun to broaden its horizons into the international political scene with an army and navy fleet. He also included that their military was well equipped and able to thwart the ambitions of Russia against Korea and East Asian regions20. In those years an extensive correspondence, on the policy of rearmament implemented by the Japanese government, occurred between the Italian ambassador and the Ministry of Foreign Affairs in Italy. Giulio Melegari witnessed the preparatory phase of the Russian-Japanese war and in some of his reports he analyzes, in detail, the internal situation in Japan, highlighting the features of Emperor Meiji’s policy and diplomacy. In a letter sent from Tokyo on August 7, 1901, to G. Prinetti21, then Minister of Foreign Affairs, Melegari, referred to multinational force commander, British General Alfred Gaselee’s trip to Japan; from Tientsin he left for the liberation of Beijing in the summer of 1900, and described the British officer’s reception as being particularly warm, adding “the more than flattering way, major British newspapers corresponding from China, have consistently spoken about the Japanese troops, have greatly contributed to increase in these populations this undoubted wave of sympathy towards England and its army”. Clear, therefore, are the moves of the government in London which aims to promote Japan in the Far East Asia to contain aspirations and preserve their colonies. The Italian diplomat speaking of tensions between Russia and Japan for control of Manchuria stated that the official newspaper of the empire published the text of the agreement which stipulated the concession of a large area of land in Musampò as a settlement between the Japanese and Korean government. The grant was undoubtedly a new success for Japan in its dispute to have influence over Russia which “come già è risaputo anelò per lunghi anni di fare di quell’importante punto strategico prospiciente alle coste giapponesi una formidabile stazione navale e dove pure arrischiò un tentativo di settlement ora quasi interamente fallito. Al posto dei fortilizi, degli arsenali e delle corazzate Russe si vedranno erigersi fra qualche anno a Musampò i fumaiuoli degli opifici e le fattorie a un prospero settlement giapponese chiamato a costituire un nuovo anello di quella salda catena con cui l'operosità economica dei sudditi del Mikado ha saputo in pochi anni avvolgere tutta la costa meridionale della Corea, da Chunulpo a Fusan e che assai più dei cannoni russi varrà a stabilire l'incontrastata supremazia di quest'Impero sulla vicina penisola”22
frontiera russa e il territorio dell’Indo-Kush, appartenente ufficialmente all’Afganistan. I documenti sull’accordo sono contenuti al MAE, Roma, Archivio degli Affari diplomatici, Serie Politica “P”, Russia, 1896-1898, Busta 342, f. 66, rapp. n. 57/20 da Londra in data 26 gennaio 1897 avente per oggetto “Pamiro” e indirizzata al ministro degli Affari Esteri il marchese Visconti-Venosta dall’ambasciatore italiano a Londra A. Ferreri. 18 Il Trattato viene firmato il 30 gennaio 1902 a Londra ed è strutturato in 6 punti con validità di cinque anni. L’accordo, in funzione anti-russa, spingerà lo zar Nicola II a stipulare una nuova alleanza con Francia e Inghilterra rispettivamente nel 1904 e nel 1907. 19 Sull’argomento vi è uno studio abbastanza completo frutto del primo Convegno italo-giapponese di studi storici che ha avuto luogo nel 1985 dal tema “Lo Stato liberale italiano e l’età Meiji”. I punti sostanziali di tale convegno sono stati ripresi da Hatsushi Kitahara nel suo saggio Dal Giappone in una edizione curata da Filippo Mazzonis, L’Italia contemporanea e la storiografia internazionale, Venezia, Marsilio, 1995, pp. 269-281. 20 Un enorme quantità di relazioni diplomatiche attestano la corsa all’approvvigionamento di materiale navale da parte del Giappone durante gli anni che precedono la guerra contro la Russia e Melegari stesso documenta con cifre alla mano tale mobilitazione. 21 MAE, Roma, Lettera di G. Melegari al ministro degli Affari Esteri Giulio Prinetti del 7 agosto 1901, da Tokyo, rapp. n. 144/50. 22 MAE, Roma, Serie Politica P., Giappone, anni 1902-1909, Busta 299, Lettera dell’Ambasciatore Italiano a Tokyo Giulio Melegari al Ministero degli Esteri, in data 7 giugno 1902, avente per oggetto “Settlement Giappone a Ma Sampò”.
.These are the years in which Russia and Japan took advantage of China’s weaknesses and planned an expansion of their economic interests in Korea and Manchuria. The intervention in the Chinese Boxer Rebellion highlighted the quality of the Japanese military contingent which consisted of more than seven thousand units represented by far the largest international coalition. Included were: Russians (3480), English

ISSN 2039-9340 Mediterranean Journal of Social Sciences Vol. 3 (11) November 2012
129
(2232), Americans (1825), and to a lesser extent French, Germans, Austrians and Italians (De Courten-Sargeri, 2005; Renouvain, 1946; Vagnini-Gyun Cho, 2008). The Russian political action definitely was hampered by the difficult times the monarchy was experiencing struggling with stagnant economic problems and peasant uprisings; opposed to Japan who was internally strong and stable. Next to the positive notes, reserved for the Japanese ruler’s positive actions, Melegari did not hesitate to praise the prestige that a politician like Aleksandr Izvol’skij enjoyed or the authority that surrounded Sergej Vitte, Ambassador in Monaco and Minister of Russian Finances: “il signor Izvolsk’ij al pari dei suoi predecessori passa a torto o ragione per essere uno dei principali manipolatori della politica Russa, in tale compito molto efficacemente coadiuvato dal noto sig. Oloshevo […] agli ordini diretti dell'onnipotente Ministro delle Finanze Sig. Witte. Costui come risaputo conduce già da tempo in Asia una politica proficua talvolta più attiva ed efficace di quella ufficiale. […] Tutto sta ora a vedere in base a quali tendenze e con quali mezzi si svolgerà questo eventuale nuovo programma di azione. Se, mantenendosi scrupolosamente nei limiti fissati dai vigenti accordi russo-giapponesi, la politica del Governo dello Czar sarà unicamente diretta ad un pacifico accrescimento dell’influenza russa in Corea, specie dal lato economica, nulla avrà a ridire il Giappone, e ciò tanto meno che esso è già da tempo ... convinto che in questo terreno poco ho nulla hanno da temere della concorrenza russa. Se invece essa fosse per assumere un carattere più aggressivo e soprattutto se fossero per ripetersi i tentativi di acquisto di una stazione navale lungo la costa prospiciente al Giappone, le cose potrebbero prendere una piega più minacciosa, e ci troveremo di bel nuovo di fronte ad un altra fase acuta della questione di Corea”23. In a subsequent letter, Melegari compares the struggle of influence, which had been fought for the past five years in Korea, like the one Russia was fighting against with the Austrian-Hungarian influence on the Baltic States and, in particular, in Serbia. The ambassador hits the mark, as a matter of fact, throughout 1903; relations between the two empires intensified to the point that war was imminent. Referring the news of General Tamura’s death, Deputy Chief of Staff of the Italian Army, Melegari speaks of a man in whom the Japanese had their hopes on in case of war between Russia and Japan which according to our diplomat “is becoming more and more probable”24
A few months later, Melegari speaks of the dissolution of the Japanese Elective Chamber, he justifies such an act for the reason that it could have rendered diplomatic negotiations with the Tsar easier because “a chamber with a majority hostile towards Russia and animated by an aggressive attitude would surely be a source of new agitations and arguments for the negotiators and a serious embarrassment”
.
25. Therefore, in admitting state reasons superior to any action, Melegari defended Kabura’s Cabinet actions, even though, how he would later say about the dissolution of the second Duma by the Tsar and Petr Stolypin, the act “is legally quite questionable and probably the Crown would not have succumbed if the critical international conditions did not absolutely advise against a government mutation, for now”. The following year on January 8th, he communicates the rigid application of article 22 of the “Law on the Press” that orders not to publish any news regarding military movements or strategic plans and war operations26
Tōgō Heihachirō
. On February 11th, referring to the annual commemoration of the dynasty foundation, Melegari speaks of a sovereign that with regret, communicates to his guests, all of which are ambassadors, about the fracture in diplomatic relations with a foreign power. We are at the eve of a conflict with Russia, the Italian ambassador who had widely foresaw this, gave account of the Rising Sun’s government choices, even though there was almost total absence of detailed information on the sovereign moves. Meanwhile, to the ultimatum imposed by Japan, followed a surprise attack on Port Arthur on behalf of the Japanese naval fleet led by Admiral (Milza, 1990; Biagini, 2012). In a letter from the Ministry, about a month after the beginning of hostilities, Melegari traces a first assessment of the war communicating to the Ministry numbers presented from the Imperial government to the newly established Cabinet; far different from the previous, less resentful and surely more willing to collaborate with the government27
23 MAE, Roma, Serie Politica P., Giappone, 1902-1909, busta 299, Lettera dell’Ambasciatore Italiano a Tokyo Giulio Melegari al Ministero degli Esteri in data 9 Agosto 1902, avente per oggetto “Russia e Giappone in Corea”. 24 MAE, Roma, Serie Politica P., Giappone, 1902-1909, busta 299, Lettera dell’Ambasciatore Italiano a Tokyo Giulio Melegari al Ministero degli Esteri in data 7 ottobre 1903, avente per oggetto “Morte del generale Tamura”. 25 MAE, Roma, Serie Politica P., Giappone, 1902-1909, busta 299, rapp. n. 391/177, Lettera dell’Ambasciatore Italiano a Tokyo Giulio Melegari al Ministero degli Esteri Tittoni, in data 12 dicembre 1903, avente per oggetto “Dissoluzione della Camera Elettiva” 26 MAE, Roma, Serie Politica P., Giappone, 1902-1909, busta 299, rapp. n. 11/4, Lettera dell’Ambasciatore Italiano a Tokyo Giulio Melegari al Ministero degli Esteri Tittoni, in data 8 gennaio 1904, avente per oggetto “Ordinanza ministeriale” 27 MAE, Roma, Serie Politica P., Giappone, 1902-1909, busta 299, rapp. n. 152/69, Lettera dell’Ambasciatore Italiano a Tokyo Giulio Melegari al Ministero degli Esteri Tittoni, in data 17 marzo 1904, avente per oggetto “Bilancio della guerra”
. From such documents the overall amount destined to the war is evident, of which108 million Yen would go to the War Ministry and 47 million to the Navy. Besides such an action, there was a stronger tax implementation which started with land ownership (25 million), income (5 million), sugar consumption (7 million), salt (almost 3 million), and silk (4 million), etc. It was a detailed account, followed by explicative charts that gave a clear picture of the Japanese economic situation at the time. The losses Japan suffered during the first months of war where considerable; the Russians simply defended themselves without actually replying because they were awaiting

ISSN 2039-9340 Mediterranean Journal of Social Sciences Vol. 3 (11) November 2012
130
help from St. Petersburg through the Trans-Siberian, a majestic railway project contemplated in the last decade (XIX century) because of a massive Russian colonization of Eastern Siberia, through the Suez Canal and the circumnavigation of Africa. A few months after the defeat of Russia in Port Arthur (9 February 1904), while Melagari tended to his job as diplomat in the Japanese capital, on June 30, 1904, the Italian State sent him to his new destination in St. Petersburg with credentials of Ambassador Extraordinary and Minister Plenipotentiary. Upon communication of change in post, Melegari expressed his perplexity; the letter sent from the Tokyo post on 15 July 1904, starts with these observations:
As soon as my destination to St. Petersburg was here know to all with whom I have official or private relations, I received the most cordial and warm manifestation of affection, without myself nor any member of this Legation being able to recognize, from their mouths, any allusion to indicate how such a destination, in the present moment, be politically judged inopportune or in any way interpreted as a not-so-friendly act of the Italian Government towards Japan. Even the local press, in giving the news of my nomination, refrained indistinctly from any unfavorable comments28
Melegari follows the whole process of belligerence between the two nations with a privileged glance of who knew one first then the other fighting faction. He analyzed many aspects of the Russian-Japanese conflict; from the influence on Korea to the contestation of Sakhalin; from the occupation of the Kuril Islands to the defense of the commercial ports of the Pacific, without leaving out considerations in the order of politics and economics. He, therefore, left Japan to go to the Russian capital where he had already been eight years ago, in a very delicate moment for international relations because of the African neo-colonization, started by several European states, of which one was Italy. The Russia before him is with no doubt different from the one he left behind at the end of the nineties of the previous century. The vast industrialization, the arrival of huge amounts of foreign capital and new authoritative political men, that emerged from those social classes that were betrayed by the Tsarist politics and contributed to the diffusion of liberal ideas. These were new elements that inserted themselves in a political scene that was devastated by errors in foreign affairs, from the misery of the farmers, the revolts in the factories, the famine at the beginning of the century and, last but not least, a monarch that was weak and retrograde as Nicholas II. All this laid before Melegari’s eyes; that reaching St. Petersburg during the pre-revolutionary phase, during a typical periodic acceleration of its history and in the clash between conservation and modernization. This stimulated the intellectual interest and passion for the Russian situation, in the attempt to answer the question of its future evolution in international relations. In the beginning of 1905, two closely related events put the Tsarist policy in crisis: the fall of Port Arthur, after a long and bloody siege and the St. Petersburg workers revolt, better known as the Small Russian Revolution. Melegari analyzes the Russian subversive process, on the western revolutionary model, in particular with the stages of the French. The diplomat saw, in the Zemskij Sobor the national assembly, the expression of requests, opinions and representation in equal proportions to the Russian social classes, and reproduction of the French General States of 1788
.
29
28 MAE, Roma, Serie Politica P., Giappone, 1902-1909, busta 299, rapp. n. 11/4, Lettera dell’Ambasciatore Italiano a Tokyo Giulio Melegari al Ministero degli Esteri Tittoni, in data 15 luglio 1904, avente per oggetto “Mio trasferimento a Pietroburgo”. 29 MAE, Roma, Serie politica P (1891-1916), Russia, b. 343, rapp. n. 68/28, Pietroburgo, 2/15 febbraio 1905.
. Meanwhile, the Japanese army defeats the Russians in Mukden, meanwhile in the Sea of Japan Admiral Zinovij Rožestvenskij’s naval fleet arrived, but was of no use. Rožestvenskij’s naval fleet had left from the Kronstadt Naval Base in August 1904, after many hardships and diplomatic incidents it had to overcome, it was then completely defeated on 27 and 28 May, 1905 during the decisive battle of Tsushima. The Portsmouth (New Hampshire) Treaty of the following September, wanted and mediated by the American President Theodore Roosevelt, reinforces the prestige of Japan confirming itself as a great Asian world power. The obtainment of territorial advantages in Korea was annexed five years later, in the Sakhalin Island and in Manchuria, these were losses that took away the remaining prestige the Tsar enjoyed and so begins a “hot” autumn, made of strikes and official contestations. Even though Despite the works of Count Vitte for the peace agreement (which were the object of great appreciation by important Russian politicians, like Kokovcov, who in his biographic memoires exalts the Russian minister - Kokovcov, 1933) and the social protests which were derived from the peoples malcontent after “Bloody Sunday” in the beginning of the year, did not stop . The strike in autumn 1905, brought about the first assembly called “Soviet” which ensued the signing of the historic October Manifesto. For Ambassador Melegari this represented a point of arrival in the revolutionary process, the institutional way out that would bring the Duma to become a real and true national assembly. The fundamental laws of May, 1906 made the Tsars monarchic prejudices emerge, he agreed to the constitution as an ideological simulation. According to Max Weber, l’ukaz of 21 October, 1905, with whom the neo president Sergej Vitte created a Cabinet and a prime minister with the function of director, this represented the end of the classic autocracy and the consolidation of the centralized dominium of modern bureaucracy (Petracchi, 1993). Social and constitutional structures of the old order, like king’s power and aristocratic supremacy, were preserved based on the Bismarck’s style.

ISSN 2039-9340 Mediterranean Journal of Social Sciences Vol. 3 (11) November 2012
131
In a punctilious manner, Melegari takes note of all Vitte’s steps to remove the promises in the October Manifesto. In July 1906, Pëtr Stolypin was nominated Pime Minister in place of the dubious Ivan Goremykin, the Tsar decides to dissolve the Duma and for Melegari such an act represented a true coup d’état30. The Russian revolution did not follow the French revolutionary footsteps and the dissemblance of the Tsar brought man, more so than the diplomat, to a sort of discouragement and disillusion. Worthy of note is today’s argumentations on the economic field, his detailed analysis on the business-politics duo, in regards to international loans and reforms during the Vitte-Durnovo period. According to Melegari, the Russian empire was obliged to take foreign opinion in consideration because it depended on the financial markets and state improvements that came from European banks, in order to accept huge loans they based themselves on liberal guarantees offered by the October Manifesto 31
durante gli otto anni che ebbi l’onore di rappresentare Sua Maestà alla Corte Imperiale di Russia, sia per trovare ai miei capitali un collocamento che vi era allora motivo di ritenere sicuro e proficuo, sia pure, in certa misura, per avere sui luoghi un fondo di riserva di facile ed immediata realizzazione di cui potessi anche valermi per le mie spese di rappresentanza, avevo convertito parte della dote di mia moglie ed il modesto mio avere personale in valori di Stato e di Banche fondiarie russe per un importo complessivo che non oltrepassava le quattrocento mila lire. Quando agli inizi del 1913 abandonai definitivamente Pietrogrado, le gravi preoccupazioni domestiche che allora attraversavo non mi permisero di occuparmi dell’alienazione di quei valori. Venne poi improvvisamente la guerra Europea che rese rischiose se non impossibili la trasferta e la vendita dei titoli russi (non contrattabili in Italia) cosicché al principio della rivoluzione bolscevica mi ritrovai quasi interamente rovinato.
. In Italy and in public opinion, incomplete and distorted information arrived, mainly, in regards to strikes, pogrom and stories inherent to mutinies. After 1907, when the revolution was surely at its end and western style definitive parliament was awaited in vain the revolution seemed a faraway memory and not only did it not seep into Italy but it actually left Europeans indifferent, too busy with hotter national issues derived from the implosion of the multinational empires.
Melegari’s work in the Russian Embassy had excellent repercussions on relations between the two countries. Besides internal problems and his involvement in the Russian social mutations; in the course of eight years, he overturned a situation that saw Italy as not so credible before the Tsarist court. In 1907, Russia and Italy renewed their Commerce and Rates Treaty of 1863, while the meeting of Racconigi in 1909, the two countries set things up for a collaboration in the Balkan area. Melegari inserted himself in a positive context in which several key characters push for a rapprochement of the two countries. Among them were Aleksandr Izvol’skij, Russian Minister of Foreign Affairs, who knew Melegari since the time he was ambassador in Tokyo, and Nikolaj Murav’ëv, Russian ambassador in Rome, another prominent figure who represented an important contact compared to his predecessor Lev Urusov. The agreement between Russia and England in 1907, in addition to the historic agreement with France, further confirmed the agreement of Racconigi, it completed the European conversion of Russian foreign affairs. Italy was able to insert itself in the Balkan context and to obtain from Russia its first true recognition for its interests. The following events divided the intentions of the two countries; they actually differentiated on the interest they attributed to the conservation of the status quo in the Balkans. Italy was aiming a complicated project and the Titoni plans foresaw an Italian-Russian rapprochement as a starting point for a future Austrian-Russian-Italian understanding (Petracchi, 1993). During 1910, certain conditions brought forth the break in the rapprochement which had been recently achieved; the newly nominated minister of foreign affairs from San Giuliano possessed a remarkable pro-Austrian orientation. Melegari himself saw his position compromised and in 1912 was discharged from his job he was substituted with Counselor Pietro Tomasi of Torretta, which ruled the embassy for a year before the arrival of Andrea Carlotti, Marquis of Riparbella. The renewal in December 1912, of the Triple Alliance, suppressed what little was left of the spirit of Racconigi. Such an overturn in intentions should have been foreseen considering the Italian internal events, which were intensifying with the clashes between the extremist left and the imperialist bourgeoisie. During the various phases of the Giolitti government, divergences of a society emerged in continuous change, in a nationalist way, and the Italian-Turkish colonial war in Libya did nothing more than exacerbate the extremist right. Italian-Russian relations did not cease thanks to the successive intervention of Sergej Sazonov, but the divergences in the Balkan area where surely noticed when the Albanese issue divided the two governments. Some months after leaving the diplomatic post in St. Petersburg, the Tsar Nicholas II confered Melegari the honorary order of St. Aleksandr Nevskij with diamonds, for his long ambassador activities in Russia. The First World War, for a few years, interrupted Melegari’s relations with the state authorities to be picked back up several years later when the ex-ambassador addresses a letter to Benito Mussolini, he complained the restitution of state titles bought in Russia during his stay in St. Petersburg and affirmed:
30 MAE, Serie Politica P (1891-1916), Russia b. 344, Rapp. n. 542/222, Pietroburgo, 26 luglio 1906. 31 MAE, Serie Politica P (1891-1916), Russia b. 344, Rapp. n. 543/223, Pietroburgo, 15/28 luglio 1906.

ISSN 2039-9340 Mediterranean Journal of Social Sciences Vol. 3 (11) November 2012
132
Le mie gravi strettezze finanziarie mi obbligarono a ritirarmi in campagna, ove vivo tuttora la maggior parte dell’anno32
la conflagrazione mondiale e le sue travolgenti conseguenze sembrano aver cavato un abisso di secoli fra il passato ed il presente; tutta l’opera diplomatica, anche dello immediato ante-guerra, svalutata e negletta, non rappresenta ormai, nella memoria dei più, che un vago e molto lontano ricordo. Così, i lunghi servigi che fui in grado di prestare durante la mia missione a Pietroburgo, e che furono pure di qualche utilità per il nostro paese, come lo attestano il vantaggioso trattato di commercio che fui in misura di concludere, ed anzitutto il notevole riavvicinamento politico fra l’Italia e la Russia e che ebbe la sua consacrazione nella visita dello Czar a Racconigi, sembrano oggidì quasi interamente dimenticati
.
The long letter continues with Melegari’s hope that once commercial relations revive with the new Bolshevik government, the issue of the credits of the Italians towards Russia can be better regulated. In the closure is a brief observation on current events:
33
V. N. Kokovcov, (1933) Iz moego prošlogo. Vospominanija 1911-1919,[Dal mio passato. Ricordi 1911-1919], t. I, Paris, Ed. de Seuil.
.
A bitter summary that highlights the merits of his own diplomatic activity inside a new Italian and European reality, transformed by the war and even more by the Bolshevik revolution. Perhaps with the intent to not upset the neo relations between the Soviets and Italians, from the Foreign Minister and leading Italian embassy in Russia, no positive answer arrived to the Italian diplomat’s request. Hopeless, he definitively abandons the idea of ever appropriating himself of his possessions in Russia and retires to a private life. Last news regarding him go back to the spring of 1934, residing at the Hotel Majestic in Florence, a usual for him during certain periods of the year, he requests a new passport from the Foreign Ministry. From there on all traces are lost. At the age of eighty, he was about to go abroad but surely not in the Soviet Union where his presence is not welcome. The work done by the Italian diplomat was without a doubt important and had its positive consequences with the Racconigi agreement. Melegari’s sudden change of post from Tokyo to St. Petersburg during the years of the Rusian-Japanese war did not go unnoticed and it is presumed, in light of the agreements success of Racconigi, that the move was well planned out by the Italian government to ingratiate the Tsar and therefore have a solid ally in the Balkan question. Such a hypothesis does not seem entirely without foundation since Melegari himself was surprised by his transfer, considering it as “inopportune” without imagining the government’s plan to obtain that action. If we then consider the fact that the Foreign Minister followed the lines traced by Visconti Venosta, who in 1903 assigns General Roberto Morra of Lavriano as ambassador in St. Petersburg, it shows more clearly that the Italian diplomacy had pro-Russian tendencies during the early nine hundreds, a course that will bear its fruits with Racconigi in 1909.
Bibliografia A. Biagini-D. Reichel, (1991) Italia e Svizzera durante la triplice alleanza. Politica militare e politica estera, Roma, SME. A. F. Biagini, La guerra russo-giapponese, Roma, Edizioni Nuova Cultura, 2012; A. Vagnini-S. Gyun Cho, (2008) La Memoria della Cina. Fonti archivistiche italiane sulla storia della Cina, E. Nuova Cultura, Roma, AUSSME - Archivio Ufficio Storico, Stato Maggiore dell’Esercito - Roma C. Ghisalberti, (1993 )L’età della destra in Italia e i problemi dell’unificazione in La Storia. I grandi problemi dell’età contemporanea, vol. III, Dalla Restaurazione alla prima guerra mondiale, Milano, Garzanti; M. Grillandi, Francesco Crispi, Torino, UTET, (1969) La formazione della diplomazia internazionale (1861-1915). Repertorio bio-bibliografico dei funzionari del Ministero degli Affari Esteri, Roma, Istituto poligrafico e Zecca dello Stato. F. Chabod, (1965) Storia della Politica estera italiana dal 1870 al 1896, Bari, Laterza, F. Mazzonis, (1995) L’Italia contemporanea e la storiografia internazionale, Venezia, Marsilio, G. Modrich, (1892) La Russia. Note e ricordi di viaggio, Torino, Le Roux e C. G. Petracchi, (1993) La Diplomazia Italiana in Russia (1861- 1941), Roma, Bonacci Editore. L. de Courten-G. Sargeri, (2005) Le regie truppe in Estremo Oriente, 1900-1901, AUSSME, Roma. MAE - Archivio Storico Diplomatico del Ministero Affari Esteri – Roma P. Milza,(1990) Les relations internationales de 1871 à 1914, Paris, Armand Colin P. Renouvain, (1946) La question d’Extreme-Orient, 1840-1940, Hachette, Paris. R. Barbiera,(1894) La Russia d'oggi veduta da un diplomatico italiano, in “Illustrazione italiana”, gennaio-giugno. T. Carletti, (1894) La Russia Contemporanea, Milano, Treves,
32 MAE, Archivio Personale, Serie VII, Fondo M 5, “Giulio Melegari”, Lettera privata di Giulio Melegari a Mussolini, presidente del Consiglio e ministro degli Affari Esteri, in data 27 luglio 1924. 33 Ibidem.

ISSN 2039-9340 Mediterranean Journal of Social Sciences Vol. 3 (11) November 2012
133
Naturalization of Slavery and Discrimination in the United States:
An Analysis of the Roles of Protestantism, Capitalism and Social Darwinism in the Formation of Demeaning Black Stereotypes
Maryam Soltan Beyad
Assistant Professor
Faculty of Foreign Languages and Literatures University of Tehran, Iran Email: [email protected]
Farshid Nowrouzi Roshnavand (Corresponding Author)
PhD Student of English Language and Literature
Faculty of Foreign Languages and Literatures University of Tehran, Iran
Email: [email protected]
Doi: 10.5901/mjss.2012.v3n11p133
Abstract: After the first encounter between the Occident and the non-white, non-Christian subjects in the fifteenth century, the Western mind began to Otherize blacks through a deliberate exaggeration of their physical and sociocultural differences. This process of Otherization and inferiorization was reinforced by the West’s employment of a stereotypical representational strategy which depicted the Negroid either as a noble child of nature or a demonic savage. In the pre-emancipation United States where the slave trade had turned into one of the most lucrative businesses of the day, these objectifying stereotypes were so preponderant that they battered down and almost vanished the real black presence. By demoting blacks to a subhuman status and portraying them as brutish, heathen and depraved, the dominant white society could easily justify the atrocious deeds perpetrated against blacks during the slavery era. Even after the emancipation, the extant demeaning stereotypes served as powerful instruments in the hands of white dominators to impose discrimination and segregation on the subalternized blacks. This paper analyzes the roles of Protestantism, Capitalism and Social Darwinism in the formation and perpetuation of demeaning black stereotypes, and tries to demonstrate how these major religious, economic and scientific trends of the day naturalized the institution of slavery and the pervasive discrimination against blacks. Keywords: Stereotype, Slavery, Discrimination, Protestantism, Capitalism, Social Darwinism 1. Introduction The Western enterprise of Otherization and subalternization has been at work since the first encounter of European expansionist colonizers with the inhabitants of Americas. From the very beginning, the ethnic and chromatic differences were essentialized in the hands of Western colonizers and thus gradually turned into a basis for hierarchical sociopolitical and moral rankings (Brown, 1993). The stereotypical representations justified the necessity and inevitability of colonial control by constantly reinforcing the superiority of the West over the inferiority of the Other. The result was an unvarying portrait of “a subject race, dominated by a race that knows them and what is good for them better than they could possibly know themselves” (Said, as cited in Gandhi, 1998). The same fixating agenda was adopted in the representation of blacks, at times bolstered by religious, economic and scientific discourses. Even though the United States never officially ruled colonies in Africa, Americans benefitted from the enterprise of colonization through the institution of slavery. The plundering of Africa, whether direct or indirect, necessitated a stereotypical representation of Africans as subordinate. As a consequence of the colonial process of inferiorization and subalternization, Americans generalized that the black Others were more different from whites than they were similar. Through the exaggeration of social, cultural, psychological and physical differences, white dominators could maintain their constructed images of blacks and apply epithets such as mysterious, dark and backward to peoples of African descent (Keim, 2009).

ISSN 2039-9340 Mediterranean Journal of Social Sciences Vol. 3 (11) November 2012
134
Such classification and labeling were in fact parts of the process of description-domination in which certain listed features were considered to constitute a generic and comprehensive description of the subaltern group. By emphasizing the differences of the subaltern group and changing them into absolute natural positions, the dominators established categories and subsequently hierarchical binarisms which could justify and legitimize their expansionist program and colonial rule (Brown, 1993). This paper tries to shed light on the roles of the dominant religious, economic and scientific discourses, namely Protestantism, capitalism and Social Darwinism, in the formation and perpetuation of degrading black stereotypes in the pre- and post-emancipation United States. It also aims to demonstrate the mainstream American society’s employment of the above-mentioned discourses to naturalize and justify the institution of slavery and the entrenched racism and discrimination against subalternized blacks. 2. Protestantism, the Black Stereotype and the Justification of Slavery
“It's undoubtedly the intention of Providence that the African race should be servants, – kept in a low condition,” said a grave-looking gentleman in black, a clergyman, seated by the cabin door. “'Cursed be Canaan; a servant of servants shall he be,' the scripture says.” (Stowe, 2009)
No concept truly tantamount to the present day notion of race can be observed in the writings and attitudes of Greeks, Romans, and the early Christians. Greeks hierarchized the civilized and the barbarous, but these classifications do not seem to have been considered as hereditary. Romans had slaves from different colors and nationalities and also citizens of corresponding variety; so it is no exaggeration to say that no evidence has been detected to prove that dark skin color served as the criterion of discriminatory distinctions anywhere in the ancient world. Over time and as Catholic Europe expanded by dint of conquering and colonizing the marginal parts of the continent, attitudes of superiority to the indigenous populations of the conquered lands gradually surfaced, a stance that foreshadowed the spirit of dominance and supremacy that would mark the later invasion and infiltration of Europeans into Asia, Africa, and the Americas. However, no color-coded white-over-black racism was ascertained in the Middle Ages. Even many medieval Christians, drawing upon the scriptural testimony that the first non-Jewish person who embraced Christianity was an Ethiopian eunuch, extolled black converts as the living proof of the universality of their religious beliefs; in view of such an attitude, a positive image of blacks seems to have been instilled in the Western mind in the late Middle Ages. Therefore, the arguments that Europeans were heavily prejudiced against blacks before the commencement of the slave trade and that color-coded racism existed earlier than slavery seem to be fallacious (Fredrickson, 2002). Nonetheless, the conversion of the last heathen Slavs of Eastern Europe and Russia signified that there were nearly no European populations accessible for enslavement under the pretext of religious mission (Fredrickson, 2002), so this time the missionary project determined to enchain and “save” the souls of the inhabitants of the “dark” continent. With the juggernaut of colonization gaining momentum, the biblical association of Satan with darkness functioned as an excuse in the Puritan mind for turning the native inhabitants of the colonized lands into scary enemies and in this way, provided a justification for the slave trade. Through imputing the blackness of Africans to the biblical curse of Ham or Canaan, the purchase and transport of African slaves could conveniently be justified in terms of religious sanction without resorting to an explicit racism. The Christian colonizers believed that black Africans were among the “beasts of the field” mentioned in Genesis I and argued that God had intended continents to serve as His “color line”; in their view, Christians were elected by God as the guardians of black slaves in order to bring them into the kingdom of civilization and enlighten them through Christianity (MacCann, 2001). The racist discriminatory zeitgeist of Europe, confirmed and reproduced by the religious rhetoric, crossed the Atlantic and turned into a practical tool in the hands of the American slaveholders. For the majority of Americans, Protestant value system regulated the ethical norms of the society and everyday sociocultural practices. While some of the Founding Fathers had been Deists, believing in a “watchmaker” God who had created the whole world and then had left it to function through rational choice, it was Calvinism which exerted a great influence on the mindset of many Americans, especially in New England (Robbins, 2007). Though Calvinist thought emphasized the need for the promotion of a sense of brotherhood and unity, it did not maintain that all men were equal (Ronald Wallace, as cited in Stevenson, 1999). It assumed that the elect, i.e., the chosen elites of God, would achieve the bliss of salvation through grace rather than good actions, and that anyone who could not attain a conviction of personal conversion was inevitably doomed to damnation. The supposition that one could not find his way among the elect through mere personal attempts and the emphasis on the need to accept grace and salvation as coming straight from God gave rise to profound introspection and an acceptance of mankind’s intrinsic unworthiness among the followers of Calvinism; a feeling which, at its best, could induce deep reflection and humility (Robbins, 2007).

ISSN 2039-9340 Mediterranean Journal of Social Sciences Vol. 3 (11) November 2012
135
Many New Divinity ministers such as Samuel Hopkins, Levi Hart and Jonathan Edwards, Jr., greatly influenced by the ideas and writings of John Calvin and Jonathan Edwards, believed that God had predetermined sin and sinfulness; and this meant that the almighty, all-knowing God manifested His benevolence when He preferred that sin exist. They contended that sin was a providential way of unfolding divine benevolence and was indubitably an advantage to the universe because it was employed by God as the occasion for good. To prove this assumption, they alluded to the selling of Joseph into slavery which turned into an opportunity for him to rise to power and the leadership of his people. Applying the oppositional design of God’s overruling of sin to the slave trade and claiming that there was no absolute evil in the whole universe, the New Divinity ministers managed to construct an aura of inevitability around the institution of slavery. Jonathan Edwards, Jr. (1745-1801), for instance, believed that “God in his providence suffers some men to be enslaved … from the beginning he intended that they should be enslaved, and made them with this intention" (as cited in Saillant, 1995); and Samuel Hopkins (1721-1803) maintained that “Although the slave traders have really meant and done that which is evil, yet God has designed it all for good, the good of which all this evil shall be the occasion” (as cited in Saillant, 1995).
Viewing slaves, who had then become “enlightened” and “civilized” under the instruction of white Christian masters, as God’s instruments to introduce the gospel among the African nations, the New Divinity minsters came up with an expatriationist proposal which suggested that making amends for the sin of slavery was possible only through returning freed slaves to their homeland, Africa. Though this proposal was made within the context of a strict perception of God’s oppositional utilization of sin, their other writings on race implied that their religious faith and racism fed each other (Saillant, 1995). In effect, the New Divinity minsters did not propose their expatriationist proposal in order to object to the maltreatment of slaves; rather, they concentrated on slavery's threats to the Revolutionary cause. According to the New Divinity men, slaves had no reason to be patriotic; as a result, slavery and the slave trade were, in the words of Jonathan Edwards, Jr., "hurtful to the state which tolerates them" since "every slave is naturally an enemy to the state in which he is holden in slavery and wants nothing but an opportunity to assist in its overthrow. And an enemy within a state is much more dangerous than one without it" (as cited in Saillant, 1995).
Given the above descriptions, it is no surprise to note that churchmen, especially in the South, hardly ever raised their voices against laws which decreed black illiteracy (in spite of a traditional stress on Scripture reading) and which deprived blacks of basic sociopolitical rights, seldom asked for religious privileges for slaves beyond what slaveholders voluntarily provided, mostly refrained from performing marriage vows to slaves, and almost never called for limitations of property rights so as to prevent the breaking up of slave families through sales (Bailey, 1975). Instead, they inculcated in the slaves the conviction that they were not worthy of freedom, that it was God’s providence that they were enslaved and put to work, that the devil was producing those wicked desires for liberty in their hearts, and that runaways would be excommunicated from the church. To most of the white ministers of the slavery days, the blessed slaves were those who were patient, faithful, hardworking, and above all, submissive and obedient (Blassingame, as cited in Mocombe, 2009). Practically speaking, religion, monopolized and exploited by white masters, was transformed into an intimidating vehicle to teach slaves to steer clear of “wishing evil upon those who prayed with them on Sunday but beat them on Monday” (Sernett, 1999).
In effect, Protestantism played a major role in creating an aura of sacrosanctity and supremacy around the conception Americans developed about themselves and their mission in the world. Calvinism and other American Protestant faiths had several characteristics in common. One was the belief that Protestant Christianity was the best source for the authorities and leaders to guide the Republic. Another was the assurance that regarded America as a blessed nation; like the individual chosen by God for salvation, the United States had a sacred mission to carry out in the world. This principle of Protestant Christianity’s superiority was exactly what the political leaders of the United States employed throughout its early history to justify such deeds as the slave trade, Indian Removal, expansionist movement toward western territories, waging wars to annex Catholic Mexican lands, and discrimination against Irish Catholics (Robbins, 2007). 3. Capitalism, the Black Stereotype and the Justification of Slavery
Capitalism is a system of virtual slavery, serving the narrow interests of a comparative handful of “exploiters” … who, driven by insatiable greed and power-lust, exist as parasites upon the labor of masses. (Reisman, 1998)
Racial differences made it easier to justify and rationalize Negro slavery, to exact the mechanical obedience of a plough-ox or a cart-horse, to demand that resignation and that complete moral and intellectual subjection which alone make slave labor possible. … The features of the man [the Negro], his hair, color and dentifrice, his "subhuman" characteristics

ISSN 2039-9340 Mediterranean Journal of Social Sciences Vol. 3 (11) November 2012
136
so widely pleaded, were only the later rationalizations to justify a simple economic fact: that the colonies needed labor and resorted to Negro labor because it was cheapest and best. (Williams, 1944)
The socioeconomic history of the United States is a rare case with regards to the fact that the development of all institutional characteristics of capitalism can be detected in it. The independence of the United States in 1776 earned freedom for Americans (or better to say, the white population of the country) who expediently decided to utilize their liberty to benefit themselves. Early after the independence, white Americans went for the establishment of private property through moving westward and appropriating the lands which had been for long inhabited by indigenous peoples. Gradually, calculations of profit and loss came to rule and exert influence on different aspects of the life in America; the consequence was the creation of a “dollar chasing” attitude among Americans which was steered merely by profit motive (Reisman, 1998). The same is true about the institution of slavery which originated by economic, and not racial, reasons: “it had to do not with the color of the laborer, but the cheapness of the labor” (Williams, 1944).
The colonization enterprise was an international system which intermingled political monopoly and the production and circulation of commodities (McMichael, 1991). In the eyes of profit-seeking colonizers, slaves were deemed as private property receiving the same amount of consideration as the livestock (Reisman, 1998); in this way, slave labor became the first form of expropriated social labor (James, as cited in McMichael, 1991). In the antebellum period, indentured servants were not coming to the country in sufficient quantities to fill in for those who had finished their terms of service; many of the indentured servants escaped before serving their terms and many others expected land or other privileges at the end of their contract. On the account of these problems, the profit-driven white Americans embarked on a search for a cheaper and more tractable labor: blacks. However, the white dominators, trying to conceal their economic interests, appealed to a set of disparaging stereotypes to justify and rationalize the institution of slavery (Williams, 1944).
According to Max Weber, the Protestant ethic represented a set of values, including rationality, hard work and economic gain as an indication of one’s predestination, systematic and regular use of time, and a strict austerity in relation to carnal pleasures and goods, which step by step gave rise to the contemporary capitalist norms that comprised modern societies, particularly American capitalist society (2005). It was in fact the purposive-rationality of these Protestant ideas and customs, intermingled with the notions of race and nation, that defined, differentiated and eventually subjugated minorities in the society and engendered binarisms like predestined/damned and capitalists/laborers. Since predestination was one of the crucial tenets of Protestantism, and especially Calvinism, and since humans couldn’t come to know at the end of the day who was saved and who was damned, assiduity in one’s calling was greatly recommended. As a matter of fact, this spirit of rationalization was the most significant contribution of Protestantism to capitalism (Mocombe, 2009).
Over time, a sect of rich, white, Protestant men, who were themselves marginalized in the feudal social structure of Europe in the medieval period, established the bureaucratic means and structural practices of the American social structure. The raison d’être of this social system was the incessant accumulation of economic interest, capital and profit which finally moved toward the commodification of everything. In the modern American capitalist society, the racial class gendered Protestant values which defined and regulated the dominant social practices had an indelible influence on the way non-Protestant, non-white groups were interpellated by the mainstream white society and also affected the way these subalternized groups came to interpellate and view themselves in their interactions with the means of production and distribution of capital and economic gain; in other words, even the cultural struggle for distinction and recognition was intricately connected to the production and distribution of material goods (Mocombe, 2009).
The rationalization of the Protestant ethic was employed, or better to say exploited, by a group of rich, white, Protestant men who constantly elaborated on the notions of Christian brotherhood, human rights and the priority of the good of the many over the interests of the few. However, these seemingly virtuous and ethical ideas were recursively organized and reproduced in the secular, bourgeois, racial, gendered and capitalist oligarchy that was later to constitute and regulate the sociocultural practices of American society; that is, the concepts of predestination, responsibility, hard work, economic interest, etc. justified the domination of a group of people, who were supposedly predestined to prosper in their economic achievements and rate of profit, over those who were damned, and thus were naturally backward and poor. Indeed, the well-to-do, Protestant, white, male landowners who considered themselves to be the enlightened and progressive power elites of society institutionalized their religious, cultural and mercantile values into laws and practices such as capitalism, individualism, republicanism, systematic labor, slavery codes, miscegenation laws, etc., legitimized by pacts, agreements, and the Constitution of the United States (Mocombe, 2009). In other words, the sociopolitical elites of society had themselves a vested interest in the perpetuation of the hegemonic pattern of domination since they were mostly slave masters and landowners; as a result, they came to regulate social relations and the legal system in a way that depreciated blacks and limited their participation in the society (Greenfield, 2001). According to these legalized practices, the enslaved “damned” Africans, with their physical and behavioral differences, should not be regarded as

ISSN 2039-9340 Mediterranean Journal of Social Sciences Vol. 3 (11) November 2012
137
human as white Protestants given their alleged irrationalism, lasciviousness, savagery, negligence and deviant pigmentation, and so should naturally work for the white elites (Mocombe, 2009).
In this system, individual property rights were exalted to a position approved by divine authority and thus were deemed superior to all other rights, including human rights and the rights of native populations, bonded laborers, and slaves to live freely. In the late eighteenth century, this attitude led to the commodification of Africans who became the structurally differentiated black, non-Protestant, damned commodity, forced to toil as property for the “predestined” elites in order to augment their rate of profit and improve their economic situation. Influenced by the way they were stereotyped as soul-less, fierce and lecherous by the so-called pure, civilized and godly whites, Africans had to abide by their imposed sordid conditions in slavery, since their physical and cultural differences and their subsequent perpetual Otherness did not allow for their predestination or equality (Mocombe, 2009).
To put it concisely, a new ideology and a new method of life based on capitalism gave rise to slavery, which, as a method of production, was often very successful, providing both cheap merchandise and a substantial level of profit. What was of note regarding this new way of life was its uncompromising commitment to rational calculation, to the harnessing of nature and, above all, to the unending quest for the increase of the revenue. In situations such as those prevalent in the Americas where alternative forms of labor were few, resources profuse, and the markets for the produced goods in demand, the attractions of slavery were too irresistible to be neglected; to an entrepreneurial spirit, slavery made sense economically even though it might be socially regressive (Temperley, 1977). This capitalist outlook was enthusiastically embraced in the agricultural South of the United States where the slave labor, greatly needed for effort-intensive activities such as cotton and sugar production, was both the main capital investment and a lucrative ever-present product (Wright, 2003; McMichael, 1991). 4. Social Darwinism, the Black Stereotype and the Justification of Discrimination
… in human life, as in animal and plant life, everywhere and at all times, only a small and chosen minority can exist and flourish, while the enormous majority starve and perish miserably and more or less prematurely. (Ernst Haeckel, as cited in Simpson, 1959)
The Negro, it was almost universally agreed even among the most educated people, was definitely an inferior breed and situated at the very base of the evolutionary tree. (Digby Baltzell, as cited in Washington, 2001) Before the publication of Darwin’s The Origin of Species in 1859 which referred in its subtitle to “The Preservation of Favored Races in the Struggle for Life”, the association between color (and race) and the distribution of mental and physical characteristics had been for long a moot point among many Western thinkers. A great number of these thinkers firmly believed in the idea of European superiority and colored inferiority, a racist supposition which lacked a tenable scientific framework. However, Darwin’s book gave scientific legitimacy and credence to the philosophical and political groundwork of ideas associated with racial hierarchical binarism of white and black (Dennis, 1995). Though Darwin was in the first place concerned with the biological evolution of animal species and almost never dealt with the cultural or social implications of his theories, many nineteenth century thinkers like Alfred Russel Wallace (1823-1913), the co-discoverer of the principle of natural selection, and Herbert Spencer (1820-1903), the coiner of the phrase “survival of the fittest”, reasoned that Darwinist principles on biological evolution could be equally applied to human societies. Wallace believed that in the struggle to sustain life among tribes, those whose members exhibited an inclination to act collectively and showed prudence, self-discipline and a sense of ethics, would be privileged over tribes in which these features were less developed. In his opinion, the former would thrive, resulting in continual psychological and moral improvement, and ultimately, the whole world would comprise merely of one race, and the need for authority or prohibitive laws would disappear. This process that eventuated in utopia would also guarantee the extinction of indigenous “savage” populations such as New Zealand Maoris, Australian aborigines and American and Brazilian Indians, since Europeans, with their allegedly superior mental, moral and physical characteristics, their more disciplined organizations and their greater competence for existence and propagation, would take the upper hand “in the struggle for existence” and would “overrun North America and Australia, extinguishing native populations” just as “the more favoured varieties increase among animals and plants” (as cited in Paul, 2003). Similar to Wallace, Spencer argued that human societies, presumably functioning according to natural selection, were dominated by rivalry and fitness, and developed in the course of time from an undifferentiated and primitive state into one of differentiation and advancement. Accordingly, he reasoned that racial conflict was the main factor conducive to social progress because it necessitated "a continuous over-running of the less powerful or less adapted by the more powerful or more adapted, a driving of inferior varieties into undesirable habitats, and occasionally, an extermination of inferior varieties" (as cited in Dennis, 1995). Such reading of Darwin’s theories was finally translated by the Western advocates of

ISSN 2039-9340 Mediterranean Journal of Social Sciences Vol. 3 (11) November 2012
138
expansionism and colonialism to signify that there was an ultimate cosmic advantage in enslaving and brutalizing blacks (MacCann, 2001). Social Darwinists held that in comparison with the Western civilization, other races had evolved less far, as in Africa, or had developed into degeneracy, as in the East (Childs, 2000). Though the new “scientific” findings were used as a justification to enact discriminating sociopolitical rules against all non-European races, it was Africans who became the easy butt of the social implications of Darwin’s theories. After the first encounter between Europeans and the negroid in the fifteenth century, whites came to stereotype non-whites either as children in an idyllic wilderness, inadequate to rule themselves and in dire need of European authority and administration, or as aggressive brutes and cannibals who must be held in check by the inhibitions of an enlightening civilization (Fredrickson, 2002). In the nineteenth century, the popularity of Darwin’s theories additionally reinforced the extant demeaning stereotypes; the new trend of scientific racism was so strong that in the 1860s many believed that blacks were in fact the “missing link” (what became known as “Zip” at that time) between man and the lesser species (Churchill, 2010). The physiological speculations regarding Negroes were also ubiquitous after the publication of Darwin’s groundbreaking theories. There was the prevalent idea that the size and surface crevices of blacks’ skulls were greatly different from those of Europeans. Physiologists in the second half of the nineteenth century argued that blacks had pointed ears, big mouths, voracious appetites, and such thick epidermis on their hands and legs that they were insensitive to pain. They also assumed that blacks’ bodies matured only to the level of adult sexuality while their minds ceased developing at puberty, a hypothesis which served to explain the alleged blacks’ promiscuity (MacCann, 2001). As apologists for dog-eat-dog capitalism and unfettered economic competition found in Darwinism a scientific justification for their laissez-faire policies (Paul, 2003), the beneficiaries of colonialism also took the most advantage of the dominant scientific trend of the day. In effect, the moral justification for colonialism was based on a discourse of racial and social superiority: if a country had not reached an advanced level of industrialization, it implied a social and cultural retardation and an inferiority on the part of the country’s people. On the basis of this rhetoric, it then became the moral responsibility of the developed nations to enlighten, civilize and humanize the so-called primitive peoples (Childs, 2000). Since morality was ostensibly a consequential factor in this “noble” mission, it was argued that colonization would ultimately increase the level of morality and the number of moral men. In this way, the war of conquest became an inseparable part of the evolutionary process and exploitation was euphemistically called education (Paul, 2003). Claiming that blacks had no qualification to effectively administer a government and were consequently best suited for slavery, many interpreted the institution of slavery within the context of Social Darwinism and reasoned that since slavery allowed superior groups the opportunity to build and develop more sophisticated cultures, it eventually promoted the cause of humanity (Jones, 2010; Dennis, 1995). As a seemingly scientific justification against the anti-slavery movement, they postulated the notion of black retrogression which contented that whites were inherently disciplined and creative while blacks were born imitative and savage; held in captivity, blacks’ imitativeness had made them copy whites’ “civilized” conventions and behaviors; however, once freed from the inhibitions whites had imposed on them, they would inevitably return to their innate savagery (McClymer, 2009). This pernicious racist theory was best captured in the following sentences by the editor of the Charleston News and Courier in 1898: “Everybody knows that when freed from the compelling influence of the white man he reverts by a law of nature to the natural barbarism in which he was created in the jungles of Africa” (as cited in Washington, 2001). With such an overwhelming hegemonic discourse, it is no surprise to note that racist discrimination was easily rationalized, confirmed and reproduced in the post-emancipation United States. 5. Conclusion The qualities that mark a subaltern group as deviant and in need of white control are labile (Brown, 1993). In the slavery era and even after the emancipation, blacks were mostly represented by different degrading images which justified the sociopolitical misdeeds practiced against blacks in the Untied Stats and provided whites with “the comforting shock of unfavorable contrast to the social ‘realities’” (Redding, 1964). The diverse discourses of Protestantism, capitalism and Social Darwinism were employed by white dominators to produce different black stereotypes which sounded to the mainstream American society as logical classification. These stereotypical representations gradually turned into moral hierarchies and colluded to legitimize social hierarchies of domination. As sociologists of deviance and critics of ideology maintain, the process of stereotyping and labeling is a form of social control which not only describes but also constitutes the social reality (Brown, 1993). In the (re)production of demeaning black stereotypes, Protestantism, capitalism and Social Darwinism shared an uncompromising emphasis on the “differences” of the black Other. These white-dominated white-oriented discourses represented the black Other’s culture as backward and degenerate, and thus in dire need of

ISSN 2039-9340 Mediterranean Journal of Social Sciences Vol. 3 (11) November 2012
139
white America’s redress. In this way, the prevalent racism and discrimination were depicted to be the inevitable outcome of “natural” differences between whites and blacks.
References
Bailey, K. K. (1975). Protestantism and Afro-Americans in the old south: Another look. The Journal of Southern History, 41 (4), 451-472. Brown, R. H. (1993). Cultural representation and ideological domination. Social Forces, 71 (3), 657-676. Childs, P. (2000). Modernism. London: Routledge. Churchill, L. B. (2010). What is it? Difference, Darwin, and the Victorian freak show. In J. E. Jones, & P. B. Sharp (Eds.), Darwin in
Atlantic cultures: Evolutionary visions of race, gender, and sexuality (pp. 128-142). New York: Routledge. Dennis, R. M. (1995). Social Darwinism, scientific racism, and the metaphysics of race. The Journal of Negro Education, 64 (3), 243-252. Fredrickson, G. M. (2002). Racism: A short history. New Jersey: Princeton University Press. Gandhi, L. (1998). Postcolonial theory: A critical introduction. NSW: Allen & Unwin. Greenfield, S. M. (2001). Nature/nurture and the anthropology of Franz Boas and Margaret Mead as an agenda for revolutionary politics.
Horizontes Antropológicos, 7 (16), 35-52. Jones, J. E. (2010). Simians, Negroes, and the ‘missing link’: Evolutionary discourses and transatlantic debates on ‘The Negro question’.
In J. E. Jones, & P. B. Sharp (Eds.), Darwin in Atlantic cultures: Evolutionary visions of race, gender, and sexuality (pp. 191-207). New York: Routledge.
Keim, C. A. (2009). Mistaking Africa: Curiosities and inventions of the American mind. (2nd ed.). Boulder: Westview Press. MacCann, D. (2001). White supremacy in children’s literature. New York: Routledge. McClymer, J. F. (2009). Race relations in the United States, 1900-1920. Westport: Greenwood Press. McMichael, P. (1991). Slavery in capitalism: The rise and demise of the U.S. ante-bellum cotton culture. Theory and Society, 20 (3), 321-
349. Mocombe, P. C. (2009). The soul-less souls of black folk. Lanham: University Press of America. Paul, D. B. (2003). Darwin, Social Darwinism and eugenics. In J. Hodge, & G. Radick (Eds.), The Cambridge companion to Darwin (pp.
214-239). Cambridge: Cambridge University Press. Redding, S. (1964). The problems of the Negro writer. The Massachusetts Review, 6 (1), 57-70. Reisman, G. (1998). Capitalism: A treatise on economics. Laguna Hills: TJS Books. Robbins, S. (2007). The Cambridge introduction to Harriet Beecher Stowe. Cambridge: Cambridge University Press. Saillant, J. (1995). Slavery and divine providence in New England Calvinism: The New Divinity and a black protest, 1775-1805. The New
England Quarterly, 68 (4), 584-608. Sernett, M. C. (1999). Introduction. In M. C. Sernett (Ed.), African American religious history: A documentary witness (2nd ed.) (pp. 1-10).
Durham: Duke University Press. Simpson, G. E. (1959). Darwin and ‘Social Darwinism’. The Antioch Review, 19 (1), 33-45. Stevenson, W. R., Jr. (1999). Sovereign grace: The place and significance of Christian freedom in John Calvin's political thought. New
York: Oxford University Press. Stowe, H. B. (2009). Uncle Tom’s cabin: or, life among the lowly. Cambridge: The Belknap Press of Harvard UP. Temperley, H. (1977). Capitalism, slavery and ideology. Past & Present, 75, 94-118. Washington, R. E. (2001). The ideologies of African American literature. Lanham: Rowman & Littlefield Publishers. Weber, M. (2005). The Protestant ethic and the spirit of capitalism. London: Routledge. Williams, E. (1944). Capitalism and slavery. Chapel Hill: The University of North Carolina Press. Wright, G. (2003). Slavery and American agricultural history. Agricultural History, 77 (4), 527-552.


ISSN 2039-9340 Mediterranean Journal of Social Sciences Vol. 3 (11) November 2012
141
The International Words in the Balkan Linguistic Area
Dr. Eliana Paço
Faculty of Foreign languages
University of Tirana E-mail: [email protected]
Doi:10.5901/mjss.2012.v3n11p141
Abstract: In our research, on the basis of Albanian words (of the Dictionary 1980) with the letters A and B in confrontation with above-mentioned languages a statistic analyses is carried out for the words of more or less affinity and in their differences on phonetic, phonologic, morphologic and word-formation levels. Keyword: international words, statistic analyses, affinity, differences, phonetic, phonologic, morphologic, word-formation levels. The international words identified in the languages of the Balkan Language Union (Albanian, Greek, Bulgarian, Rumanian, Serbo-Croatian) belong almost to the majority of Languages of all the world (according to the adopted criterion: they are common in six “great” languages: English, French, German, Italian, Russian and Spanish)1. Although these words are felt as such (similar by the external form and their meanings) in other languages as well as in the languages of the Balkan area, they undergo the particularities of the corresponding languages on phonetic, phonologic, morphologic and word-formation levels. It should be noted that, though they are languages of the same family, they make up four different groups: Greek and Albanian – separate languages, Slav languages and Rumanian as Slav-Romanic.
In some cases, similarities and unimportant differences in pronunciation could be noticed as Alb. (automat), Grk. (aftómato) (alternation u/f and the presence of the terminal o); in other languages it is the same as in Albanian: automat (Rum.), avtomat (Bul.), automat (Serbcr.). As to the word-formation level, there may be affinity or alternations on morphemic structure as well: automatik-e (Alb.), aftomatikós (Gr.), aftomatican (aвтоматичан) (Bul.), automatićeski (Serbcr.). These words can be considered as half – international. Rarely, there are native equivalents for any international words, suh as in Serbcr. nagomet for football, košarka for basketball.
In our research, on the basis of Albanian words (of the Dictionary 1980)2 with the letters A and B in confrontation with above-mentioned languages a statistic analyses is carried out for the words of more or less affinity and in their differences on phonetic, phonologic, morphologic and word-formation levels.
As to reviewing the international words in confrontation with Balkan languages it is important to consider the basic one can start from. One of the ways should be the material quoted out of the bilingual Dictionaries3, and as well as their confrontation with any of the languages recognized as international. In our case we have referred to the Russian language, because it can serve as a representative of a group of languages typologically to a certain degree remote to the Balkan Languages. So the presence of the international words in this language gives more possibility to minimize the degree of subjectivism in the choice of international words among the other lexical units which cannot be considered as such.
The confrontation of international words in Balkan Languages is carried out on the basis of those quoted out of The Dictionary of Albanian Language (1980). The latter, being compared with Russian equivalents4, are confronted and verified with other languages, firstly with the corresponding equivalents with Greek and then with Rumanian ones, being closer to Albanian and then continuing with other Slav languages.5 The confrontation aims at determining their typological characteristics based on a statistical analysis. The chosen criterion of their similarity is the similarity in their forms, both phonic and written one, and their content too, i.e. in the similar meanings.
Similarities existing within the groups are to be seen also in the frame of internal alternations, which do not affect at all the identity of international words in different languages (as the elements of the same isoglosses).
Their identification can be possible in such a case apart from the differentiations (alternations), being observed in certain phonemes, because as Akulenko states6 “perception of the word is realized as a whole and within this “wholeness” fade the minute differentiations, existing between two or more units being confronted such as algjebra (Alb.), and algebra (αλγεβρα) (Gr.), kimia (Alb.), kimia (χημεια) (Gr.). Such a phenomenon includes also the cases when units have excessive final elements or lack final elements, or in case these final elements (excessive or lacking) are of word-

ISSN 2039-9340 Mediterranean Journal of Social Sciences Vol. 3 (11) November 2012
142
formation nature. So they can be identified as similar ones not only when the final elements prove to be excessive up to two phonemes such as in Alb. asket and in Greek askitis (άσχητής), in Alb. autobiografik and in Greek aftobiografikós (aυτοβιογραφικος), but also when final different elements are of word-formation nature such as in Alb. automatik-e, in Greek avtomatikós and in Bulg. avtomatićan. Among these alternations of phonemes the most frequent are: k/h: kimia / himia gj/g: gjeografia / geografia In order to be as analytical as possible, there are observed (by confrontation as was stated above) only the international words being quoted out of the letters A and B of the Dictionary of Albanian (1980) as well as on a group of international words identified in a study on them in Albanian7, for each of which the equivalents are found in all the Balkan Languages. On the basis of such a confrontation the following groups of international words are identified and classified: A. 1 Out of a group of international words made up of 560 units, 75 are identified in all the languages, being almost entirely similar in their written forms, depending on alphabet and chiefly in sound forms, including in general their final identical elements: abazhur, aktiv, algjebra, akrobat, binom, aspekt, bar, boks, buldozer (in Alb.). A. 2 Closer to the first groups of international words there is another one which are simple or compound words mostly, adjectives derived from nouns. They have similarities in their basic constituent part and, the other ones are made up of different phonologic-morphologic elements: automat / automato, or different word-formation elements. From the confrontations the following variations can be observed: 1. In one language there are final excessive phonemic-morphologic elements, while there can be other variations in other languages. autograph / autografos balon / balono ballkon / balkóni (μπαλκόνι) fizika / fiziki antilopa/ antilópi (αντιλοπη) academia / akademie 2. In different parts of the words a series of alternations occur, but they do not affect the identifications of the unit. The alternations are: s/z ll/1 u/v d/δ etc. So, out of 560 units more the half of them can be found to have more or less similarities with internal alternations or final excessive elements not affecting their identifications. A. 3. Another group close to the two first ones constitutes a limited number of verbs and verbal nouns, in which the major part is made up of international elements and the word-formation part is mixed with native and foreign elements. These partial differentiation do not affect their identification, although anyhow their hybrid character can be noticed. As it was mentioned above, they can be named half-international words: automat/izoj/ automat/izim: -izoj/ -izim (Alb.) automat/izirati/ automat/iziranje: -izirati / -iziranje (Srbcr.) B. Another major group (almost half of them) is made up of 250 international words which occur in various proportions in various languages of this linguistic area. As far as this group of international words is concerned, the following cases may be noticed: 1. Generally, some of these unit are absent in one of the languages representing a separate group. 2. They can be absent in separate languages. Here, one can notice several special cases. a) the unit may be absent in one of the languages (these are rare cases). b) one foreign unit may occur parallel to the native one as a synonym: b1 foreign unit may be primary; b2 native unit may be secondary.

ISSN 2039-9340 Mediterranean Journal of Social Sciences Vol. 3 (11) November 2012
143
As to the case 1. based on the confrontation of this group in all languages in question, a small number of international words are met in Greek. For most of them the native equivalents exist. Whereas here many international words may be absent in the most of languages of their areas these unit are conceived as an international fund, as it is in Alb.: autor, automobil, agjent, agronom, adresë, akt, aktor, aktiv-i, altar, aksion, albumine, alveolë, alternativë, antenë, apel, aparat, argument, artist: in Grk.: δημιουργος, αβτοκινιτο, πρακτορας, γεογονος, διευθυνση, πραξη.
As to the case 2.a very small number of international words may be absent in any other language, but they can be seen as separate cases. So, for example, the word ampulë in Rum, cannot be found, and instead there is fiola. As it was mentioned above in Srbcr there are not two English words which are recognize as international: football and basketboll: instead of them there are nagomet and košarka.
References J. Kole, (1989) “Mbi fjalët ndërkombëtare në gjuhën shqipe”, në “Studime mbi leksikun.... në gjuhën shqipe” (“On the international words
in the Albanian” in Studies on lexison ...in Albania), III, Tirana “Fjalor i gjuhës së sotme shqipe” (1980) (“Dictionary of the prezent-day Albanian Language”), Tirana Th. Kacori, “Fjalor bullgarisht-shqip” (“Bulgarian-Albanian Dictionary”), Sofia, 1959; G.Papafili, “Fjalor greqisht-shqip” (“Greek-Albanian Dictionary”), Athens, 1990; V.Kovaçi “Fjalor rumanisht-shqip” (“Rumanian-Albanian Dictionary”), Albin 1999, A.Zajmi, “Fjalor serbo-kroatisht-shqip” (“Srpskohrovatsko-Albanski Rečnik”), Pristine, 1974. “Fjalor rusisht-shqip” (“Russian-Albanian Dictionary”), Moskva, 1954 “Greek-Russian Dictionary”, Moskva, 1959; “Russko-Ruminskij Slovar”, Moskva, 1967; “Russko-Bolgarskij Slovar”, Moskva 1972; “Russko-Serbskochrovatskij Slovar”, Moskva 1954. V.Akulenko, (1972) “Voprosi internacionalizacii slovarnogo sostava jazyka”, Charkov.


ISSN 2039-9340 Mediterranean Journal of Social Sciences Vol. 3 (11) November 2012
145
Optimizing the Advantages of Monolingual Dictionary Utilization
by Thai EFL Students
Win Jenpattarakul
Assistant Professor, Language Institute Bangkok University, Thailand
E-mail: [email protected]
Doi:10.5901/mjss.2012.v3n11p145
Abstract The purposes of this research were to 1) investigate the use of dictionary of second-year students majoring in English at Bangkok University 2) compare the use of dictionary between the achievers and underachievers. The instruments used for collecting data were a questionnaire and an in-depth interview. The population was 40 English major students from Humanities faculty. The data were statistically analyzed in terms of mean and standard deviation. A t-test analysis was used to find the difference between the achievers and underachievers on the use of dictionary. For the in-depth interview, six achievers and six underachievers are randomized through simple random sampling technique to give their opinions on three questions provided, and the data were collected to assure the results of the study. The results of this study showed that the overall usage of dictionary of Bangkok University students was at a medium level, and significant differences existed in dictionary usage between the achievers and underachievers. The findings of this research would let the teachers know the students’ problems and purposes of using dictionary, so that the teachers can train the students to practice using dictionary systematically so as to make the best use of dictionary. Pedagogical implications into reading comprehension and vocabulary acquisition were suggested. Keywords: Reading comprehension, vocabulary acquisition 1. Introduction Hong (2010) claimed that incidental vocabulary learning was regarded as an integral part of L2 vocabulary learning because it includes three vocabulary learning strategies – glossing, guessing from context, using dictionary and so on. Among them, although dictionary gives a wealth of information to learn English and it is one of the mainstays of any language researchers, it is used as a last resort after other vocabulary learning strategies fail (Harmer, 2001). As stated by (Li & Lou, 2012), in the process of English learning, a high-quality dictionary is a good friend and teacher for EFL learners. The study of dictionary use in EFL learning is one of the important areas of applied linguistics research. Likewise, Thornbury (2008) also endorsed that dictionary is unequalled in that it is a source of words and of information about words. As a result, in a dictionary, the students will find information such as the different meanings that words have, how they are pronounced, what other words they collocate with, and when they can be used. It also gives examples of the words in phrases and sentences so that students get a very good idea of how they themselves can use the word (Harmer, 2001). Furthermore, other perspectives of dictionary utilization in terms of advantages, what good dictionary should have, dictionary use strategies, and the argument of how monolingual dictionary outperforms bilingual dictionary, are presented as follows: 1. Nation (2008) points out that dictionary can help the learners in three major ways : 1) They can help learners understand words that they meet in reading and listening. 2) They can help learners find words that they need for speaking and writing. 3) They can help learners remember words. In addition, he also suggested that good dictionary should contain: ● plenty of words ● clear understandable definitions ● many example sentences ● information about grammar and collocations of the word ● the pronunciation of the word ● the spelling of inflected and derived forms ● information about constraints on the use of the word ● frequency information ● information about related words and word parts

ISSN 2039-9340 Mediterranean Journal of Social Sciences Vol. 3 (11) November 2012
146
2. Nation (1990) wrapped up Scholfield (1982)’s seven-step dictionary use strategy as follows: ● Locate the words or phrases you don’t understand. ● If the unknown word is inflected, remove the inflection to find the form to look up ● Search for the unknown word in the alphabetical list. ● If you can’t find at least one main entry for the unknown word, try looking in the addendum, look at nearby entries if the unknown word might be an irregular form, look up parts of the word or phrase. ● If there are several senses or homographic entries, reduce them by elimination. ● Understand the definition and integrate it into the context where the unknown word was met. ● If none of the senses or entries seems to fit, attempt to infer one from the sense you have. If more than one fits, see further context clues in the passage to help you choose. 3. Li and Zhon (2001) classified dictionary in a different ways as follows: 1. Contents: philological dictionary, encyclopedic dictionary, and special dictionary. 2. Scope of words collected and the information of the vocabulary provided: general- purposes dictionary and specialized dictionary. 3. Language involved: monolingual dictionary, bilingual dictionary, and multi-lingual dictionary. 4. History periods involved: diachronic dictionary and synchronic dictionary. 5. Size: unabridged dictionary, desk dictionary, and pocket dictionary. 6. Service objects: for foreigners and for natives. 7. Arrangement of entries: systematic dictionary and alphabetical dictionary. 8. Medium: paper dictionary and electronic dictionary. Furthermore, the electronic dictionary can be divided into three kinds: pocket dictionary, CD-ROM dictionary, and online dictionary. The paper dictionary and electronic dictionary (pocket dictionary) are most commonly used by the students in the classroom. 4. The opinions and discussions of numerous researchers who confirm that monolingual dictionary outperforms bilingual dictionary in the aspects of reading comprehension and vocabulary learning are introduced by Laufer & Aviad (2006) who stated that learners often admit what lexicographers and language teachers have known for a long time that monolingual dictionary provide more detailed and precise information about words looked up than bilingual dictionary. Their idea was supported by Scholfield (2012) claiming that there is the familiar argument that learners need to get into the habit of thinking in the target language. They will not be efficient users of English if they operate always via an extra step of translating into their first language, which the use of bilingual or semi-bilingual dictionaries is likely to encourage. In the same manner, rather than give a definition, bilingual dictionary gives translation. The use of such dictionary hinders the learners in developing the skill of using paraphrase to make up for words they don’t know (Nation, 1990). In addition, Harmer (2001) discussed the disadvantages of bilingual dictionary and suggested the students to use monolingual dictionary. He stated that many students buy themselves bilingual dictionaries or electronic translators because they fervently hope that they will find an instantly usable translation of a word they know in their language. There is every good reason for them to want this since, at least in earlier stages, people tend to translate in their heads when they are learning in a foreign language, and the idea of a one-to-one correspondence between words in two languages is immensely attractive. He further claims that there is nothing wrong with bilingual dictionary (or electronic translations) of course. When they work well they provide just what the students are looking for. But all too often they fail to show the students how words are used in the foreign language, providing simple answers for what is , in effect, considerably more complex. Sometimes, for example, a word in L1 may have six or seven equivalencies in the L2; if these equivalencies are just offered as a list of words they provide the students with no information about which one to choose – and when. Sometimes there are restrictions on the use of a word in L1 which do not in L2. Unless these are given, the information is not complete. Many bilingual dictionaries also fail to give sufficient information about grammatical context, appropriateness, and connotation. This does not mean that all bilingual dictionaries are bad or that students should never use them. There are some excellent samples available now and whether we like it or not, students will always use them, especially at low levels. What we can do is show them something different which is just as good - and in many ways better; the monolingual dictionary. With regard to the use of dictionary in second language, numerous researches whose objectives and findings were significant to reading comprehension and vocabulary learning have been continuously conducted. Five pieces of studies revealed the advantages of using dictionary. Cited in Gu (2003), two researches were concluded as follows: Firstly, Lippescu and Day (1993) experimented with 293 Japanese EFL students who were randomly assigned to a treatment group (using dictionary) and a control group (no dictionary) and were asked to read a short story in class. The treatment
ISSN 2039-9340 Mediterranean Journal of Social Sciences Vol. 3 (11) November 2012
147
used a bilingual English-Japanese dictionary of their own choice, and the control group were not allowed to use any dictionaries. Neither group were told the multiple-choice vocabulary test that was administered immediately after reading. Result suggested a clear advantage for the dictionary group in vocabulary learning through reading, but the dictionary group took almost twice as long to read the passage as did the control group. Secondly, Summers (1988) carried out the research showing the usefulness of a dictionary for ESL/EFL students and reported the results of three experiments done on the effectiveness of the Longman Dictionary of Contemporary English both in reading comprehension and in vocabulary learning. The first two experiments focused on reading comprehension and found that comprehension was significantly improved by the use of dictionary. The third experiment asked participants to produce nine of the tested words in sentences. Results suggested that mix of definition plus example in the dictionary entry was the most successful, and that the use of dictionary in all conditions tested was more conductive to the successful production of new words in sentences. What’s more, Garcia (2012) ‘s study showed that dictionary is an important tool in the solution of lexical problems in writing and that the subjects, regardless of their proficiency level, use “sophisticated” look-up strategies. The findings were also in line with the results of studies of Prichard (2008) and Summers (1988) cited in Li & Lou (2012) confirming that dictionary usage can lead to improved comprehension and vocabulary development. Besides, some researches find out the obstacles and problems in using dictionary. Rao (2012) implemented the study with the purpose to find out the extent to which the students of electrical engineering of University of Management and Technology in Pakistan possess the necessary skills to be able to use the EFL learner dictionary efficiently in situations of linguistic and pragmatic failure. The findings of the study suggested that most of the students lack the necessary dictionary using skills to make the most of the information provided in the dictionary which, of course, underscores the need to teach the students on how to use the dictionary, the kind of dictionary most suitable for them and integrating the dictionary with the language class. Such a measure is expected to improve the linguistic and communicative competence of the learners and will make them confident and self reliant in their study. Similarly, Al-Zubaidi & Manan (2011) suggested the results of their study that: the respondents were poor users of monolingual dictionary, they rarely consulted the monolingual dictionary, their knowledge of the language learning resources in the monolingual dictionary is limited, most perceived their monolingual skill as average, and there was no instruction in monolingual dictionary when they were at tertiary education and previously when they were at school. The last research which illustrated the obstacles and problems in using dictionary was reported by Alhaysony (2011) who examines the difficulties that female Saudi EFL students at the university level in Saudi Arabia face while using dictionary. The participants in this study were 132 fourth-year students majoring in English. Analysis of the data showed the difficulties that the students reported facing when they use dictionary. The results suggested that failure to locate the right entry is a common problem among the students. In addition, low proficiency students failed many times to determine the part of speech of the word to look up. This led to incorrect expectations at the sentence and word level and problems with other words in the definitions. Furthermore, not finding the entry, despite it being there, was the most common reason for unsuccessful look up. The last group of researches explained the habit, purpose and preference of the students to use dictionary. Laufer (1992-1993) cited in Nation (2006) compared example sentences made by lexicographers with those chosen from a corpus. She found that lexicographers’ examples were better for comprehension, similar to corpus based examples for production. Her study also suggested that understanding corpus based examples required a larger vocabulary size. Later, in 1993 she found that examples alone did not provide as much help for comprehension as a definition. A definition plus examples gave greater help than either of these sources alone. Nation (2006) concluded the study of Cumming, Cropp and Sussex (1994). In the experiment, they compared the effect of phrasal definition, sentence definitions, phrasal definitions with an example sentence, and sentence definitions with an example sentence. No difference was found on a production measure (write a sentence using the word) and a comprehension measure (which of six sentences using the word are correct). Students indicated a clear preference for having examples with definitions and they favored the sentence definition format. Neubach and Cohen (1988) cited in Gu (2003) studied how six EFL students at the Hebrew University of Jerusalem used the dictionary while reading. Verbal report protocols and interview data were obtained from these students. They listed a number of interesting strategies these students used, and concluded that generally advanced students do not need the dictionary so much, while weak ones cannot use it to their advantage. Specifically, high proficiency students went into their dictionaries with correct expectations at both the sentence and the word levels, while the intermediate learners did not always determine the part of speech of the word being looked up, had frequently wrong expectations of the word as well as problems with other words in the definition when a monolingual dictionary was used. And the low proficiency students were frustrated for not being able to get the right definition from dictionary and refrained from using it.

ISSN 2039-9340 Mediterranean Journal of Social Sciences Vol. 3 (11) November 2012
148
Dynamic trends of dictionary using was investigated by Li & Lou (2012) who surveyed the diachronic trends of English major seniors in their choice of dictionary in the course of English learning and reported that the most-often-used dictionaries are paper dictionary and electronic one. To sum up, according to extensive literature review involving the advantages of dictionary, the obstacles and problems in using dictionary, and habit, purposes and preference of the students to use dictionary, it is obvious that dictionary usage is instrumental in reading comprehension and lexis acquisition if the students gain an insight into dictionary usage. Therefore, this research would like to investigate what dictionary use strategies and how frequently the students employ as well as whether or not different groups of students (achievers and underachievers) affect the usage of dictionary. The findings of this research would let the teachers know the students’ problems and purposes of using dictionary, so that the teachers can train the students to practice using dictionary systematically so as to make the best use of dictionary. Pedagogical implications into reading comprehension and vocabulary acquisition were suggested as well. 2. Definitions of Terms 2.1 Achievers refer to the second-year students majoring in English at Bangkok University who got grade A, B+, and B in Fundamental English II in the academic year of 2012. 2.2 Underachievers refer to the second-year students majoring in English at Bangkok University who got grade C+, C, D+ and D in Fundamental English II in the academic year of 2012. 2.3 Purposes of Dictionary Use were based on Nation (2006) and Harvey & Yuill (1997). The purposes of dictionary use are to: 1. confirm the meaning and see example sentences. 2. check spelling, inflection, and derived form. 3. find out about grammar of the word and check grammatical correctness. 4. consider pronunciation. 5. find collocation and expression. 6. check etymology and word parts. 7. confirm guessing from context. 8. check the constraints or register of the word. 9. look for related word. 10. look up frequency information. 3. Purposes of the Study This study aims to:
• investigate the usage of dictionary of the second-year students majoring in English at Bangkok University. • compare the usage of dictioanry between the achievers and underachievers.
4. Research Questions 1. What is a dictionary usage of the second-year students majoring in English at Bangkok University? 2. Do the achievers and underachievers have different dictionary usage? 5. Research Methodology 5.1 Research Design This research is a survey design. The population of this study was 40 second-year students majoring in English and enrolling in intermediate English course at Bangkok University. In this study, the independent variable is two groups of the students (achievers and underachievers) while the dependent variable is dictionary use.

ISSN 2039-9340 Mediterranean Journal of Social Sciences Vol. 3 (11) November 2012
149
5.2 Instrument The instruments used for collecting data were a questionnaire and an in-depth interview. The questionnaire consists of two parts. The first part is about the respondent’s background and the second part is about purposes of dictionary use proposed by Nation (2006) and Harvey & Yuill (1997). This part consists of 10 items in the form of Likert rating scales ranging from very frequently, frequently, sometimes, rarely, to never. The congruence index of the questionnaire was 0.91 and Cronbach’s Coefficient Alpha was used to calculate the reliability of the questionnaire. It was found that the reliability of this questionnaire was 0.96. Besides, the in-depth interview was conducted to elicit the further information about dictionary use. 5.3 Data Analysis 5.3.1 Percentage was used to demonstrate the background information of the students and mean and standard deviation were employed to analyze the level of dictionary use. The computed weighted means of dictionary use were interpreted in the form of range as shown below.
Mean range Level of dictionary use Meaning 4.50-5.00 very extensive using dictionary with most frequency 3.50-4.49 extensive using dictionary with much frequency 2.50-3.49 medium using dictionary with medium frequency 1.50-2.49 little using dictionary with little frequency 1.00-1.49 very little using dictionary with very little frequency
5.3.2 A t-Test analysis was used to compare the mean scores of the opinions on dictionary use of the achievers and underachievers. 6. Result Table 1: The result of dictionary use by Bangkok University students
Table 1 shows that the overall use of dictionary was ( = 3.14) which could be interpreted that the students use dictionary moderately. The three most frequently used items were check spelling, inflection, and derived form ( = 3.28), look for related word ( = 3.28), and confirm the meaning and see example sentences ( = 3.25) respectively. These items were at a medium level.
ΧΧ
Χ Χ
Dictionary Use Purposes
S.D. Level
1. confirm the meaning and see example sentences. 3.25 .954 medium 2. check spelling, inflection, and derived form. 3.28 .987 medium 3. find out about grammar of the word and check grammatical correctness.
3.08 1.095 medium
4. consider pronunciation. 3.00 1.132 medium 5. find collocation and expression. 3.18 1.059 medium 6. check etymology and word parts. 3.08 1.118 medium 7. confirm guessing from context. 3.13 1.017 medium 8. check the constraints or register of the word. 3.18 .931 medium 9. look for related word. 3.28 1.062 medium 10. look up frequency information. 3.00 1.177 medium
Total 3.14 1.049 medium
Χ

ISSN 2039-9340 Mediterranean Journal of Social Sciences Vol. 3 (11) November 2012
150
Table 2. The result of the dictionary use between the achievers and underachievers
Dictionary Use Purposes Achievers
Underachievers
Statistical test
S.D.
S.D. p t
1. confirm the meaning and see example sentences.
4.18
.405 2.9 .860 .000 4.735
2. check spelling, inflection, and derived form.
4.36 .809 2.86 .693 .000 5.846
3. find out about grammar of the word and check grammatical correctness.
4.27 .467 2.62 .903 .000 7.846
4. consider pronunciation. 4.36 .674 2.48 .785 .000 7.015 5. find collocation and expression. 4.45 .522 2.69 .761 .000 7.061 6. check etymology and word parts. 4.55 .522 2.52 .688 .000 8.836 7. confirm guessing from context. 4.27 .647 2.69 .761 .000 6.103 8. check the constraints or register of the word.
4.36 .505 2.72 .591 .000 8.125
9. look for related word. 4.64 .505 2.76 .689 .000 8.209 10. look up frequency information. 4.36 .924 2.48 .785 .000 6.448
Total 4.38 .325 2.67 .551 .000 9.627 Table 2 shows that achievers and underachievers had different levels of dictionary usage. That is, the achievers had an extensive level of dictionary usage ( =4.38) while underachievers had a medium level of dictionary usage ( =2.67). It was also found that there was a statistically significant difference between achievers and underachievers in the overall dictionary usage at the level of .05. In general, the mean of the achievers was higher than that of the underachievers. 7. Discussion of the Findings 7.1 Discussion of research question 1: What is a dictionary usage of the second-year students majoring in English at Bangkok University? According to table 1, the overall use of dictionary was ( = 3.14) which could be interpreted that the students use dictionary moderately. The three most frequently used items were check spelling, inflection, and derived form ( = 3.28), look for related word ( = 3.28), and confirm the meaning and see example sentences ( = 3.25) respectively. These items were at a medium level whereas the least frequently used strategies were consider pronunciation, look up frequency information, find out about grammar of the word and check grammatical correctness, and check etymology and word parts. As stated in the result, the three dictionary use strategies which were used most by the students are discussed accordingly. The students always used dictionary to check spelling, inflection, and derived form because they knew that poor spelling can affect their writing and the readers will interpret poor spelling as a sign of lack of knowledge Nation (2006). In addition, Moseley (1994) cited in Nation (2006) claiming that even the learners of English as the first language found the irregularity in the English spelling system difficult. In terms of looking for related word which was placed the top two used dictionary strategies, the students are on the right track because this dictionary strategy is in consistent with (Nation, 2008) in that the students realized that if the related word is a known word, then this will make learning the new form and meaning much easier. Here are some related words (divide, division, divisive), (dictate, dictation, dictator, diction, dictum). He further stated that looking for related words help vocabulary learning because it relates unknown words to known words and draws attention to word parts. Regarding to the strategy of confirming the meaning and see example sentences, the students use this strategy frequently because they knew that reading example sentences in a dictionary will increase knowledge about the word, and forming a visual picture in their mind of the meaning of the sentence will help that word and its meaning be remembered. The visual picture helps because it means that the information about the word will be stored both linguistically and pictorially and these two ways will be linked (Nation, 2008).
Χ Χ
Χ Χ
ΧΧ
Χ Χ

ISSN 2039-9340 Mediterranean Journal of Social Sciences Vol. 3 (11) November 2012
151
On the other hand, four dictionary use strategies which the students use least are consider pronunciation, look up frequency information, find out about grammar of the word and grammar correctness, and check etymology and word parts. For the strategy of considering pronunciation, the students use this item less because they have to read phonetic script which is difficult and unfamiliar to the students. In addition, this skill requires considerable practice (Nation, 2006). Another item which is used least by the students is checking frequency information. The possible explanation is because the students have never been introduced before, so they don’t know the benefit of the word frequency as explained by Collin Cobuild English Dictionary (2006): frequency information will help the students immediately see how significant the word is. Word frequency is of immense importance to learners because it makes up of 95% of all spoken and written English. This frequency information therefore will be an invaluable aid to the students to use natural English. With regard to the strategy of finding out about grammar of the word and check grammar correctness. When interviewed, the students responded that their grammar knowledge is limited, so they are not interested in this benefit of the dictionary. Nation (1990) suggested that grammar in dictionary can help the students to correct errors in writing and eventually prevent such errors. Collin Cobuild English Dictionary (2006) explained that three types of grammar information are normally given in its dictionary: 1. The word class of the word: e.g. VERB, N-COUNT, ADJ, QUANT 2. Restrictions or extensions to its behavior, compared to other words of that word class: e.g. usu passive, usu sing,
also no determiner 3. The pattern that the word most frequently occurs in: e.g. Vn, N of n, ADJ that, ADV with v For the strategy of checking etymology and word parts, the students gave an opinion that they do not want to spend time to see history of a word in a dictionary. In this case, the students miss the benefits of this strategy as recommended by Nist & Simpson (2001). They claim that etymology or history of word will provide interesting and useful information to help the students understand and remember new words encountered in reading. Furthermore, Nation (2006) presented that the value of etymology for the learners is that it is interesting subject in its own right, but more interestingly, it can help make some words more memorable. The last dictionary use strategy which is least frequently used by the students is confirming guessing from context. This is due to the fact that the students will use dictionary to find the common underlying meaning of the word as the first priority. However, they don’t use the technique of guessing the word from context very often although it is the most important of all vocabulary learning strategies (Nation, 2008). As a result, the dictionary is not needed to confirm their guessing. 7.2 Discussion of research question 2: Do the achievers and underachievers have different dictionary usage? Based on the findings, it was also found that there was a statistically significant difference the between achievers and underachievers in the overall dictionary usage at the level of .05. In general, the mean of the achievers was higher than that of the underachievers. This may be explained by the fact that the characteristic of the underachievers was hardly to use any language learning strategies at all, including never using any sort of dictionary while the achievers had gone from using bilingual dictionary to using monolingual dictionary and made some use of information in such dictionary beyond just the definitions (Scholfield, 2012). This is also confirmed by Garcia (2012) stating that the most linguistically proficient users will use dictionary more competently. However, some researches’ findings were in contrast with those of this research. Neubach and Cohen (1988) cited in Gu (2003) argued that advanced students do not need the dictionary so much, while the weak ones cannot use it to their advantage. High proficiency students use dictionary to correct expectations at both sentence and the word levels while the low proficiency students were frustrated for not being able to get the right definition from the dictionary and refrained from using it. In the same manner, Prichard (2008) claimed that more proficient learners get less from dictionary use because they thought that it takes long time to read when using dictionary. 8. Implication for Teaching Dictionary Use to the Students Dictionary is an essential resource for language learners. If the learners get some systematic guidance and practice in its use, they can get maximum benefits from it (Nation, 2008). As a result, what the teacher should do are: 1) Since now there are a number of Internet, CD-ROM, DVD-based dictionaries – still the wealth of information can be extremely daunting to some students, the teacher should put dictionary training into lesson sequences, so that the students will see how to use them and what the benefits of such use are (Harmer, 2001).

ISSN 2039-9340 Mediterranean Journal of Social Sciences Vol. 3 (11) November 2012
152
2) To put the dictionary use strategies into practice, the teacher should provide easy access to good dictionary to the students. That is, the teacher should suggest how to select good dictionary which should contain the good following advantages stated by Nation (2008). ● Plenty of words ● Clear understandable definitions ● Many example sentences ● Information about grammar and collocations of the word ● The pronunciation of the word ● The spelling of inflected and derived forms ● Information about constraints on the use of the word ● Frequency information ● Information about related words and word parts 3) As the consultation of dictionary has a positive impact on vocabulary learning and reading comprehension (Xu, 2010), the teacher should motivate and train the students from other majors other than English major to use monolingual dictionary because most monolingual dictionaries use a controlled defining vocabulary of around 2,000 words (Nation, 2008). In fact, those students will have no difficulty in understanding the definitions in monolingual dictionary as their vocabulary size exceeds 2,000 words.
Reference
Alhaysony, M. (2011). Dictioanry difficulties encountered by Saudi female English-major students. European Journal of Scientific Research, 65(1), 109-120.
Al-Zubaidi, K. O., Manan, A. A. (2011). Why the English monolingual dictionary is underutilized among students. Theory and Practice in Language Studies, 1(11), 1541-1548.
Collin Cobuild English Dictionary (2006). London: HarperCollins Publisher Ltd. Garcia, S. S. (2012). Dictionary use in L1 writing. PhD dissertation, University of Essex, UK. Gu, P.Y. (2003). Vocabulary learning in a second language: Person, task, context and strategies. TESL-Ej, 7(2). Harmer, J. (2001). The practice of English language teaching. England : Pearson Education limited. Harvey, K. & Yuill, D. (1997). A study of the use of monolingual pedagogical dictionary by learners of English engaged in writing. Applied
Linguistics, 18, 253-278. Hong, Xu. (2010). Review of effects of glosses on incidental vocabulary learning and reading comprehension. Chinese Journal of
Applied Linguistic (Bimonthly), 33(1), 56-73. Laufer, B., & Aviad, T.L. (2006). Examining the effectiveness of bilingual dictionary plus- a dictionary for production in a foreign
language. International Journal of Lexicography, 19(2), 135-155. Li, L., & Lou, X. (2012). A survey on English majors’ dynamic trends of dictionaries using. Open Journal of Modern Linguistics, 2(2), 79-
83. Nation, I.S.P. (2008). Teaching vocabulary (strategies and techniques). Boston: Heinie. Nation, I.S.P. (2006). Learning vocabulary in another language. Cambridge : Cambridge University Press. Nation, I.S.P. (1990). Teaching and learning vocabulary. New York : Newbury House Publishers. Nist, S.L., Simpson, M.L. (2001). Developing vocabulary for college thinking. USA: Pearson Education Company. Prichard, C. (2008). Evaluating L2 readers’ vocabulary strategies and dictionary use. Reading in a Foreign Language, 20(2), 216-236. Rao, A.N. (2012). Dictionary using habits of electrical engineering students in Lahore, Pakistan. Language in India, 12(4), 17-26. Scholfield, P. (2012) Why shouldn’t monolingual dictionary be as easy to use as bilingual or semi-bilingual ones? Retrieved September,
2012 from http://www.etni.org.il/monodict.html. Thornbury, S. (2008). How to teach vocabulary. England: Pearson Education Limited. Xu, X. (2010). Study on the effect of dictionary use on second language incidental vocabulary acquisition-an empirical study of
college English vocabulary learning strategy. Journal of Language Teaching and Research, 1(4),519-523.

ISSN 2039-9340 Mediterranean Journal of Social Sciences Vol. 3 (11) November 2012
153
An Assessment of Parental Knowledge, Belief and Attitude toward Childhood Immunization among Minorities in Rural Areas of District Faisalabad, Pakistan
Muhammad Asim
Department of Sociology, Government College University Faisalabad, Pakistan
Correspondence Email: [email protected]
Nazia Malik
Assistant Professor, Department of Sociology, Government College University Faisalabad, Pakistan.
Email: [email protected]
Haroon Yousaf
Institute of Agri. Extension and Rural Development, University of Agriculture Faisalabad, Pakistan
Iram Gillani
Department of Sociology and Anthropology,
Arid Agriculture UniversityRawalpindi, Pakistan
Nazeen Habib
Lecturer, Department of sociology and Rural Development AJK University Muzafarabad, Pakistan
Doi:10.5901/mjss.2012.v3n11p153
Abstract Childhood immunization protects children from a variety of serious and potentially fatal and life threatening communicable diseases. Now immunization of children has been one of the securest and most efficient measures against avertable diseases in all over the world including Pakistan. In many societies where more than one racial, ethnic and religious minorities group exist, and one group is Inclined to dominant the others. This generally conduces to social and economic disfavor for the secondary groups. That’s why this study was designed to explore the gap toward health facilities and assess the parental knowledge, belief and attitude toward childhood immunization. A sample of 160 Christian minorities was selected conveniently from District Faisalabad through multistage sampling techniques. Majority of the respondents 95% were aware of child immunization, and 81.3% respondents agreed that child immunization were impotent for the children for their healthy future. 85% of the respondents were in the opinion that childhood immunization is more beneficial than harmful, and 90% of the respondents confessed that child immunization is not prohibited in our religion. Key words: Immunization, religious, minorities, adoption, vaccinators and awareness 1. Introduction Healthy and well-nourished children are best to learn and develop in different ways and in different outlooks. Immunization is a safe and effective method of preventing many severs infectious diseases. The word immunity refers to the body's capacity to defend itself against a particular disease or infection. Immunization is the procedure whereby a person is made immune or opposed to an infectious diseases and different type of maladies, typically by the direction of a vaccination. Vaccination arouses the body’s own immune system to defend the individual against the following communicable diseases such as diphtheria, pertussis, measles, tetanus, Hepatitis’s B, polio and tuberculosis (WHO, 2010).Every year millions of the children around the globe are being saved from diseases and demises because of

ISSN 2039-9340 Mediterranean Journal of Social Sciences Vol. 3 (11) November 2012
154
immunization. Vaccines have wiped out smallpox, abolished wild polio virus in the developed nations, and significantly abridged the number of cases of measles, diphtheria, pertussis and other communicable diseases in the underdeveloped societies. Vaccines secure and provide effective defence system against transferable diseases (CDC, 2009).In Pakistan, expanded program on immunization was going ahead in the year of 1978 with the ultimate purpose of declining morbidity and mortality rooted by six vaccine avertable diseases by untiring efforts on the part of the governments of Pakistan. In addition, vaccination against Hepatitis B was included in EPI in July 2001. In 1980, Polio’s third coverage was just 2% which was improved to 54% by the efforts of the government of Pakistan in 1990. However, after the tumble of 26 years, mortality from the vaccine escapable diseases is still high in Pakistan. It is noted that in Pakistan the child mortality is higher then other underdeveloped countries (Mangrio, et al. 2008). The researchers were particularly interested to assess the parental knowledge, belief and attitude toward child immunization, because adoption of immunization is directly associated with attitude and belief system of the mothers. Researchers were also interested to explore the minorities’ attitude about the childhood vaccination, because many parts of the world minorities groups are marginalized in health sector. If we talk about the developed countries such as U.S.A and other Western countries there are also a huge disparity are found. Immunization adoption rates among minorities are lower than whites in USA. Large inequalities and disparities exist between minorities and the rest of American citizens in major part of health sector. Infant mortality is measured a worldwide indicator of a nation’s health status. Compared with the national average in 1996 of 7.2 deaths per 1,000 live births, the largest discrepancy is among blacks with a death rate of 14.2 per 1,000 in 1996 which is almost 2½ times that of white infant (6 deaths per 1,000 in 1996). American Indians as a whole have an infant death rate of 9 deaths per 1,000 in 1995, but some Indian inhabitants have an infant mortality rate almost twice that of the overall national mortality rate (United States, 1999).Hispanic populations have lower childhood immunization adoption rates that if we compare other US national citizens such as non-Hispanic white and Asian populations; the Hispanic rate transcended only the African-American rate (CDC,2002).In 1996 to data was available on adoption rate of immunization by race and ethnicity among US children. In 1996 showed clear disparities in minorities’ population: white 89%, black 76%, and Hispanic 74%, with a 13% difference between rates for white and black children and a 15% difference between white and Hispanic children. In 1999, rates were similar across the groups: white 88%, black 81%, and Hispanic 87%, with a 7% difference between rates for white and black children, and a 1% difference between white and Hispanic children. This data indicate that in 1999 the gaps between blocks of the nation are decreased (Szilagyi, et al. 2002).Regarding the availability of medical facilities, White children have access to doctors at twice the rate of minority children due to the massive discrepancy in health care sector. Black and Hispanic children are mostly found in emergency rooms and hospital outpatient departments (Susan, et al. 2004). In the United States, African-Americans have been particularly marginalized and experience higher than average death rates and morbidity. African Americans have higher risk of death from almost every major cause than do whites (Weeks, 2005). Now, we talk about Pakistani’s (National) perspective in the health sector.Pakistanis a very diverse society with a verity ofracial and religious minorities. Pakistan is an Islamic state where relatively 3.72% people belong to a variety of minority groups. Some people argued that, the religious minorities have to face societal discrimination in various walks of life in Pakistan. They are socially and economically not offered equal opportunities in many field of life. The minorities have no access to appropriate health facilities. Socio-economic problems of the minorities in Pakistan, causes of social discrimination against minorities, non-Muslims in an Islamic state, forms and manifestation of social discrimination against minorities in Pakistan, legal and constitutional discrimination against minorities, and a critical review of the steps of the government for the welfare of the minorities (Michel, 2007). 2. Methods and Materials This study was designed to assess the parental knowledge, belief and attitude towards childhood immunization. The researches use a statistically suitable sample of 160 respondents to study the perception about childhood immunization of the respondents in Faisalabad. There are eight towns in District Faisalabad namely Jinnah Town, Lyallpur Town, ChackJhummara Town, Samundari Town, Iqbal town, Jaranwala Town, Madina Town and TandliaWala Town. At the first stage LyallpurTown was selected randomly out of eight Towns. There are thirty seven Union Councils in Lyalpur Town. Sixteen Union Councils are existing in rural areas out of thirty seven Union Councils. The second stage five Union Councils were selected randomly out of sixteen rural Union Councils. At the third stage thirty two (Christian minorities) respondents from each Union Council were selected by using convenient sampling technique. The sample size was consisted of 160 respondents. Data were collected through face to face interview with the help of a well-designed interview schedule. Before actual data collection questionnaire was pre- tested to examine the work ability and sensitively of the questionnaire. Descriptive analysis such as frequency distribution, percentage distribution and cross tabulation was made by using SPSS to describe the relationship between dependent and independent variable.

ISSN 2039-9340 Mediterranean Journal of Social Sciences Vol. 3 (11) November 2012
155
3. Result and Discussion In this study all the respondents were mothers, who had at least one child, because the respondents, having children, have practical experience about child immunization. Majority of the respondent 51.2% were belonging to the young age group 18-30 years, whilst the 4.4% respondents belong to the 41 and above year of age group. The mean age was 31.45 years with 7.56 S.D. also depicted that the younger age group. Majority of the respondents 63.1% were illiterate. This shows that minorities group in Pakistan mostly are illiterate, while the only 9.4% respondents had ten year and above school education. The mean education was 4.9 year schooling with S.D. 2.03 years. Due to the low education, majority of the respondents 75.6% had ≤ 10000 rupees monthly household income and mean income was 90542 rupees. Data indicates that majority of the respondents 56.9% belong to the joint family system and 84.4% were associated with catholic sect. Table: 1 Socio economic characteristics of the respondents
Age of the respondents Frequency Percentage Mean Standard Dev. 18-30 82 51.2 26.82 3.21 31-40 71 44.4 36.90 4.45 41 and above 7 4.4 45.32 2.86 Total 160 100.0 31.45 7.56 Education of the respondents Frequency Percentage Illiterate 101 63.1 Primary 25 15.6 Middle 14 8.8 Matric 5 3.1 Matric and above 15 9.4 Total 160 100.0 Mean = 4.9 Standard Deviation = 2.03 Household monthly Income (Rs) Frequency Percentage Mean Standard Dev. Up to 10000 121 75.6 70525 1500.77 10001-15000 30 18.8 12956 2102.42 15000 and above 9 5.6 16575 2524.35 Total 160 100.0 90542 3025.12 Family Type Frequency Percentage Nuclear 33 20.6 Joint 91 56.9 Extended 36 22.5 Total 160 100.0 Sect of the respondents Catholic 135 84.4 Protestant 25 15.6 Total 160 100
Table 2indicates perception and belief about childhood immunization of the respondents. Majority of the respondents 61.9% and 19.4% agreed and strongly agreed that child immunization is important to their children respectively, while the 13.1% and 5.6% respondents were disagreed and strongly disagreed about this statement that “child immunization is important to their children” respectively. Similar study conducted by Zagminas et al. (2007)were of the opinion that majority of parents 89.0% in the favored that children's vaccination is essential, and 88.6% respondents were in the

ISSN 2039-9340 Mediterranean Journal of Social Sciences Vol. 3 (11) November 2012
156
opinion that children should be vaccinated regularly according to schedule for the betterment of their future survival. Data exhibited that majority of the respondents 65.6% disagreed and 24.4% strongly disagreed that child immunization is prohibited in our religion, whilst a small proportion were in the opinion that child immunization is prohibited in our religion. The repudiator people argued that child immunization is against the volition of God. It looks as it is the intervention of nature’s will because the Creator, God does batter for its creation. This was the traditional and orthodox approach of some religious extremist people. NFHS (2006) survey pointed out that religious affiliation and adoption of child immunization in India was higher among Christians and Sikhs. Muslim households had lower complete vaccination coverage and they were higher non-vaccination families than Hindu families. In the light of this survey, religion plays an important role in adoption of childhood immunization. Another scholar Antai (2009) conducted his research, “The role of mother's religious affiliation and child immunization status in Nigeria”; he found that the religion plays a key role in the risk of non-immunization. He further argued that religion was importantly associated with the reduced risk of full immunization and belief system. Data indicated that majority of the respondents 63.1% claimed that when they immunized their children, they observed some type of side effects such as fever, rashes, pain and swelling. 26.9% respondents were in the opinion that our children had experienced the relapse of the communicable diseases in spite of fully vaccinated. A majority of the respondents 70.6% respondents agreed that timing of vaccination is very important on the other hand 29.4% respondents were not bother about the timing of vaccination due to the illiteracy and orthodox thinking. One of the scholars Strobino, (1996) finds out that mothers who perceived the timing of vaccination were more likely to be immunized their children than that of care takers who thought that it did not matter of grave concern. Table 2: Distributing of respondents along with mean and standard deviation regarding perception and belief about childhood immunization
No Attitudinal Statements
Strongly Agreed F %
Agreed F %
Disagreed F %
Strongly Disagreed F %
Mean Std. Dev.
1 Do you think child immunization are important (31) 19.4 (99) 61.9 (21) 13.1 (9) 5.6 2.68 0.45
2 Immunization is more beneficial than harmful (29) 18.1 (105) 65.6 (15) 9.4 (11) 6.9 2.84 0.47 3 Vaccine for child immunization are save (52) 32.5 (71) 44.4 (20) 12.5 (17) 10.6 2.88 0.51 4 Child Immunization is prohibited in religion (9) 5.6 (7) 4.4 (105) 65.6 (39) 24.4 1.73 0.26 5 Found side effects after immunization of
children (20) 12.5 (101) 63.1 (30) 18.8 (9) 5.6 2.70 0.39
6 Found any relapse of the disease which you under go for immunization (11) 6.9 (32) 20 (100) 62.5 (17) 10.6 2.07 0.26
7 Timing of vaccination did not matter (15) 9.4 (32) 20 (103) 64.4 (10) 6.2 2.15 0.28 8 Do you think immunizations are keeping
your children healthy (91) 56.9 (41) 25.6 (15) 9.4 (13) 8.1 3.24 0.54
Scale: 1= Strongly Disagree, 2= Disagree, 3= Agree, 4= Strongly Agree A large majority of the respondents 56.9% strongly agreed and 25.6% agreed that immunization is keeping our children healthy and salubrious, whilst the 17.5% respondents were not agreed with this opinion. Researchers also asked the respondents that immunization is more beneficial than harmful majority of the respondents18.1% and 65.6% strongly agreed and agreed respectively with this statement. A considerable majority of the respondents 76.9% agreed that immunizations were safe for their children; however, 23.1% respondents were afraid of its consequences. Similar result was found by Zagminas et al. (2007) who identified that80.7% respondents reported that immunization was more beneficial than hazardous; Two-third of respondents 66.7% agreed that vaccines for children's immunization were safe for their physical growth.

ISSN 2039-9340 Mediterranean Journal of Social Sciences Vol. 3 (11) November 2012
157
Table 3: Distribution of the respondents along with mean and standard deviation regarding the knowledge and attitude toward childhood immunization
No Perception Categories To a Great
Extent To a Some
Extent Not at all Mean Std. Dev. F % F % F %
1 Satisfaction toward the immunization practices launching by the government 35 21.9 72 45 53 33.1 1.76 0.22
2 Face any negative reactions from family member regarding child immunization 5 3.1 8 5 147 91.9 1.00 0.21
3 Sex preference regarding child immunization 15 9.4 21 13.1 124 77.5 1.14 0.19
4 In your opinion, fears of temporary side effects play any huddles for adoption of vaccination. 25 15.6 65 40.6 70 43.8 1.58 0.24
5 Awareness about childhood immunization 29 18.1 123 76.9 8 5 2.03 0.36
6 How much knowledge about the name of common diseases 17 10.6 40 25 103 64.4 1.29 0.33
7 Have you know about the begging and completion period of childhood immunization 49 30.6 71 44.4 40 25 1.95 0.26
Scale: 1= Not at all, 2= To a some extent, 3= To a great extent Table 3 shows the knowledge and attitude of the mothers towards childhood immunization. Data shows that majority of the respondents 66.9% were aware of childhood immunization21.9% of the respondents were satisfied to a great extent, 45% to some extent and 33.1% respondents were not satisfied about the immunization practices launching by the government. Respondents argued that government should take necessary steps for improving the immunization as well as other basic medical facilities which are also necessary for our children. The finding of the study carried out by Asim, et al. (2010) is also in consonance to the findings of the present study. They also found that 52% respondents were somewhat satisfied with the existing immunization practices. They highlighted the need of providing vaccine at their door steps through qualified and well experienced staff. Data showed that majority of the respondents 91.9% professed they had no any reactions from our family members regarding the childhood immunization, whilst the lingering respondents 8.1% had somewhat obstacles toward their elders and other members of family regarding childhood immunization. These findings are lined up with Ambe, et al.(2001)when cross-sectional survey was conducted in Konduga, Nigeria. They found that 4% were not allowed to go for immunization by their husbands and other family members. In many developing and male dominant societies the people give preference their son over their daughters almost in every field of life. This phenomenon was also studied in this research. Data indicated that a large majority of the respondents 77.5% had no any sex preference in the matter of child immunization. The residual respondents had somewhat views about gender preference in adoption of immunization. NFHS (2006) survey explored the gender gap in child immunization. The vaccination rate was higher for boys 45.3% than for girls 41.5% in Indian community. Researchers also found the fear of temporary side effects played an important role in adoption of immunization to children. Half of the respondents 15.6% great extent and 40.6% some what extent were in the opinion that fear of side effects does affect our perception not to adopt the immunization to the children. One thing is to be noted here, two babies had been died due to the lethal vaccine injection in those days when the researchers were collecting the data on field. That’s why some respondents had some reservations about the reliability and efficacy about immunization. Data demonstrates that 5% of the respondents had no any awareness about childhood immunization, in this way 64.4% of the respondents had no knowledge about the name of common diseases and 10.6% of the respondents had awareness to a great extent about the name of common diseases. These respondents were cognized the major types of immunization avertable diseases’ names. Similar finding pointed out by Awodele, et al. (2010) who found that most of the mothers (99.1%) had very positive attitudes towards immunization and 55% and above were commonly knowledgeable about symptoms of vaccine avoidable diseases. (87.0%) had a satisfactory level of knowledge about childhood immunization in rural Nigeria. Awodele, et al. (2010) assessed the knowledge and attitude of mothers attending antenatal clinic in Lagos University Teaching Hospital in Nigeria, towards childhood immunization. The results showed that almost all (93.8%) the respondents were aware of immunization and that immunization could prevent childhood illness (98.1%). Although majority of the mothers were aware of the existence of immunization services, their knowledge of immunization schedule of vaccine preventable diseases is low and poor. Another study Angelillo, et al.(1999) also evaluated knowledge, attitudes, and behavior of mothers regarding the immunization in Cassino and Crotone, Italy. Overall, 57.8% of mothers were aware about all four compulsory vaccinations for infants (poliomyelitis, tetanus, diphtheria, hepatitis B). They further argued that knowledge

ISSN 2039-9340 Mediterranean Journal of Social Sciences Vol. 3 (11) November 2012
158
was significantly greater among those mothers who had higher education and among those who were older at the time of the child's birth. 17% of the respondents had great extent awareness about the name of common diseases. Majority of the respondents 74% had some extent awareness about the beginning and completion period of immunization. Data of table 4 shows that the mothers were not consulted with other mothers about the childhood immunization. Majority of the respondents 71.9% were never discussed with neighbors and other mothers about child immunization and majority of the respondents 67.5% had never visit basic health unit (BHUs) for getting government medical facilities. Table 4: Distribution of the respondents along with mean and standard deviation about their habits regarding Immunization
No
Attitudinal Statements Frequently Rarely Never
Mean Std. Dev.
F % F % F % 1 Consulting with neighbors about child
Immunization 13 8.1 32 20 115 71.9 1.16 0.19
2 Visit BHUs for acquiring medical facility 17 10.6 35 21.9 108 67.5 1.21 0.25 Scale: 1= Never, 2= Rarely, 3= Frequently Table 5: Distribution of the respondents regarding feel temporary side effects of different types of immunization vaccination
Table 5 data shows the different types of immunization vaccination and their temporary side effects. Almost 50% and above respondents reported that each vaccine (BCG, Polio, DPT and Measles) caused by the mild fever. A large majority of the respondents 69.4% and 89.4% described that BCG vaccine was the main cause of pain, swelling and pus. In short, all types of vaccines have some type of mild side effects which were found out by the respondents to their children. The present finding supported by the Ahmed, (2010) who found that some vaccinations carry the risk of certain side effects, whereas the benefits of vaccinations are far outweighed the risks. Vaccinated child may experience pain, swelling or redness at the injection site. These side effects diminish after a few days. According to the Centers for Disease Control and Prevention (CDC), a temperature of 99.9 F or higher is a common side effect of vaccination. One of other scientists was also consonance with present research Goss, (2010)who perceived that some adverse reactions of vaccinations are placid such as tenderness, soreness, swelling, redness or itchiness at the site of injection and some other immunization. These reactions occur immediately after a child is given a shot. According to the CDC, side effects are possible from any vaccine. As an example, a common shot for children is DTP, which immunizes against diphtheria, tetanus and pertussis (also known as whooping cough). The CDC reports that 25 percent and above children who get the shot experience these mild reactions or develop a mild fever. Some children will also cry inconsolably, become tired or lose their Appetency. The CDC says that over 30 percent of children who are injected with the DTP vaccine become grumpy.
Name of the Diseases
BCG T
Polio
T
DPT/COMBO
T
Measles
T Yes No Yes No Yes No Yes No
F % F % F % F % F % F % F % F %
Fever 81 50.6 79 49.4 100 75 46.9 85 53.1 100 76 47.5 84 52.5 100 105 65.6 55 34.4 100
Rash/Itchiness 51 31.9 68.1 53.1 100 21 13.1 139 86.9 100 51 31.9 109 68.1 100 69 43.1 91 56.9 100
Pain/ Swelling 111 69.4 49 30.6 100 26 16.3 134 83.7 100 57 35.6 103 64.4 100 83 51.9 77 48.1 100
Pus/Boil/Scar 143 89.4 17 10.6 100 5 3.1 155 96.9 100 52 32.5 108 67.5 100 35 21.9 125 78.1 100

ISSN 2039-9340 Mediterranean Journal of Social Sciences Vol. 3 (11) November 2012
159
4. Conclusion It is concluded that the knowledge of mothers about vaccination is not absolutely sufficient, while negative attitude (fear of mild side effect, social cultural values) significantly affects the immunization status. Majority of the respondents were in the opinion that child immunization is save then sever harmless, important for child survival, beneficial and it keeps our children healthy from different type of maladies. Some of the respondents have negative attitude, due to the lack of awareness and knowledge about childhood immunization. So it is suggested that more efforts should be made to enhance the knowledge about vaccination and to eradicate the negative attitude and belief system toward the childhood immunization by the community and volunteer participants.
Reference
Ahmed, R. 2010. Adacel Vaccine Side Effects. Publish online. Assessed Date. 29/06/2012.http://www.livestrong.com/article/205223-adacel-vaccine-side-effects/
Ambe, J.P., B. A. Omotara, M. M. Baba.2001. Perceptions, beliefs and practices of mothers in sub-urban and rural areas towards measles and measles vaccination in Northern Nigeria.31 (2):89-90
Angelillo, I.F. G. Ricciardi, P. Rossi, P. Pantisano, E. Langiano, and M. Pavia.1999. Mothers and Vaccination: Knowledge, Attitudes, and Behavior in Italy. Bulletin of the World Health Organization. 77 (3): 224-229.
Antai, D. 2009. Faith and Child Survival: The Role of Religion in Childhood Immunization in Nigeria. Journal of Biosocial Science. 41(1):57-76
Asim, M., F. Tanwir, S. Hussain, A. R. Shahzad and D. Shawar. 2010. An Assessment of Adoption Level of Mothers Regarding Immunization of their Children among Minorities in Rural Areas of District Faisalabad. Pakistan Journal of Life and social Sciences. 8(2): 106-110
Awodele, O., I. A. Oreagba, A. Akinyede, D. F. Awodele and D. C. Dolapo. 2010. The knowledge and Attitude towards Childhood Immunization amongst Mothers Attending Antenatal Clinic in Lagos University Teaching Hospital. Tanzania Journal of Health Research. 12 (3): 172-177
Cau, B., Arusyak, S and Victor, A. 2010. Religion, child mortality and health in Mozambique. Center for Population Dynamics, Arizona State University. Available at http://paa2010.princeton.edu/download.aspx?submissionId=102021.
CDC. 2009. NationalCenter for Immunization and Respiratory Diseases (CDC). Department of Health and Human Services.http://www.cdc.gov/vaccines/events/niam/default.htm
CDC. 2002. Centers for Disease Control and Prevention. Estimated Vaccination Coverage with Individual Vaccines and Vaccination Series among Children 19–35 Months of age by Race/Ethnicity: US, National Immunization Survey, Q1/2002-Q4/2002.
http://www.cdc.gov/nip/coverage/NIS/02/tab30_race_nat.xls. Goss, V.H. 2010. Side Effects of Children's Vaccines. Available on this cite. Assessed date 29/06/2012.
http://www.livestrong.com/article/69024-side-effects-childrens-vaccines/ Mangrio, N.K., M. M. Alam, B. T. Shaikh. 2008. Is Expanded Program on Immunization Doing Enough? Viewpoint of Health. Journal of
Pakistan Medical Association. 58(2):64-67 Michel, S. 2007. Socio-Economic Discrimination against Minorities in Pakistan. Journal of business strategies.Greenwich University,
Karachi.1(1):91 NFHS. 2006. National Family Health Survey (NFHS-3). International Institute for Population Sciences Deonar, Mumbai 400 088. Strobino, D,. V. Keane , E. Holt , N. Hughart, B. Guyer. 1996. Parental attitudes do not explain underimmunization.Pediatrics.
98(6):1076-83. Szilagyi P. G., S. Schaffer, L. Shone, R. Barth, et al. 2002. Reducing Geographic, Racial, and Ethnic Disparities in Childhood
Immunization Rates by Using Reminder/Recall Interventions in Urban Primary Care Practices. Pediatrics. 110 (5):pp. 58 United States.1999. United States Department of Health and Human Services. The Initiative to Eliminate Racial and Ethnic Disparities in
Health. Available http://raceandhealth.hhs.gov/home.htm. Weeks. R. J. 2005. Population, An Introduction to Concepts and Issues. Eight Edition. Wadsworth Thomson Learning. WHO. 2010. World health organization (WHO). Available at this cite. Assessed date 22/06/2012.
http://www.who.int/topics/immunization/en/ Zagminas, K., G. Surkiene, N. Urbanovic and R. Stukas.2007. Parental attitudes towards children's vaccination. 43(2):161-9.


ISSN 2039-9340 Mediterranean Journal of Social Sciences Vol. 3 (11) November 2012
161
Learners’ Satisfaction on CALL
Nuttanuch Munsakorn
Bangkok University, Thailand Email: [email protected]
Doi:10.5901/mjss.2012.v3n11p161
Abstract: The study investigated the students’ satisfaction on CALL as classified by their gender, and computer literacy. A questionnaire is used for collecting data. Proportional stratified random sampling was employed to formulate a sample of 400 BU students. These students answered through the questionnaire which asked about their satisfaction on CALL in a form of Likert’s five-rating scale. The data were statistically analyzed in terms of mean and standard deviation, t-test, One-Way Analysis of Variance. The results of this study showed that the overall student’s satisfaction of Bangkok University was at very high level, and significant differences existed in student’s satisfaction on CALL of two independent variables: gender and computer literacy. The findings of this research would help the instructors to improve the process and material for language teaching with CALL. Keywords: CALL, student’s satisfaction 1. Introduction Computer and Internet are so widespread today that people feel outdated if not using these technologies (Moras, 2001). Computer technology has made tremendous progress in the world of communication to benefit people in every part of their life Muhamad (2012). One of the benefits of computer has been used to help the teachers and students in teaching learning processs (Muhamad, 2010), so that in all educational system, the use communication and technology has certain place (Language Laboratory) (Indrawati, 2008). Indeed, a computer is a tool and medium that facilitates student in language learning. With innovative technologies, lecturere at tertiary level develops new and exciting means of intergreting language practice including speaking, writing, reading, and listening. Like other institutions, Bangkok University, Thailand, as a result of the global interest in using computers for interactive multimedia learning, had undergone some reformations in language teaching and learning style in the past few years. The power of computer in language teaching has become an compelling alternative to expand the eduactional opportunities available to the students ans has eventually been rapidly expnded. Owing to the tremendous change of the teaching style using computer-assisted language learning (CALL), the administrators of Language Institute of Bangkok University are determined to investigate the student’s satisfaction on CALL regarding the content and evaluation, computer equipment, learning environment, and the service of CLL technicians. The result of the study could be used as a guideline for adapting and improving the computer language lab operation in the future. 2. Previous Studies Many studies found that the use of computers in language teaching appears to increase interaction with a variety of interesting, enjoyable and useful materials and tasks, which sustain and enhance the student’s interest. (Ayres, 2002; Muenier, 1999; Adair-Hauck, Laurel, Willingham-McLain and Youngs, 1999; Warschauer, 1996, Strambi, 2001; Echavez-Solano, 2003; Holmes, 1998 cited in Lim and Shen, 2006). It is reiterated by Patel (2012), who stated that numerous studies have been done to assese the impact of CALL on learning mainly on the development of four skills: speaking, listening, writing, and reading or on motivation. Additionally, Gonglewiski (2007) cited in Nabah et al., (2008) asserted that computer-mediate instruction can provide a valuable langauge learning experince. Salaberry (2001) further gave opininon about how technological advances have affected language teaching and learning at various points in history. For this reason, this article will put an emphasis on the potentials of CALL in language learning. The possibilities of CALL as a tool could include increasing language learners’ self esteem, language proficiency and overall academic skills. The findings of these aspects have been summarized and echoed as the follows: By comparing CALL-based teaching with traditional teaching method, Abdulrasool (2007) found that the impact of computer assisted instructions on learning effectiveness in computer-aided design and manufacturing modules plays and

ISSN 2039-9340 Mediterranean Journal of Social Sciences Vol. 3 (11) November 2012
162
integral part to mechanical engineering related courses. The analysis of the data indicates that groups exposed to computer assisted instructions performed better than the group taught using traditional teaching method.
Nutta (1998) cited in Patel (2012) investigated the effect of computer-based vs teacher-directed instruction on the acquisition of ESL. The results showed that computer-based students reached better scores than the teacher-directed students. The researcher noted that computer-based instruction can be effective method of teaching L2 grammar.
Another research was conducted by Hui et al. (2008) who comapred the effectiveness and satisfaction associated with technology-assisted learning with that of face-to-face learning. The evidence suggests that technology-assisted learning better supports vocabulary learning than face-to-face learning but is comparatively less effective in developing listening comprehension skills.
In terms of the impact of CALL on academic skills development, Sullivan and Pratt (1996) conducted an action research to explore the effect of CALL on writing by comparing students in two ESL writing environments: a networked computer-assisted classroom and a traditional oral classroom. The findings showed the positive effects for the use of networked computers in writing classrooms which means writing quality improve in the computer-assisted classroom.
The research focusing on speaking skill was conducted by Warchauer and Healey (1998) who echoed the students’ opinion that the teacher's role was minimized in the computer-assisted classroom, while the opposite was found in the oral classroom. He also concluded that the students can "speak" at once without having to seize the floor.
In view of the student’s reflection on CALL, Yang and Chen (2007) explored the participant views regarding the integration of Internet tools in language learning activities. The subjects were 44 male students and their teacher who together joined a technology-enhanced language learning (TELL) project in Taiwan known as “Advanced Joint English Teaching” (AJET). This study found that AJET project provided the students with an opportunity to experience new technologies; learners experienced the pleasure of learning and thus increased their learning possibilities. It is concluded that the students liked and approved of learning English using the Internet. The research has also shed light on students’ attitude and motivation in the study of conducted by Peterson (2010) who indicated that there are important benefits to using a local area network (LAN) as a means of encouraging discussion among students.
In the same line with, Lim and Shen (2006) further stated that the students in the CALL-based English class were more positive in their perceptions of their learning environment than were those in the traditional English class. Additionally, the study indicated that computer technology had a positive impact on students’ perceptions of their learning environment, especially in relation to learning materials and tasks, and with regard to interaction and collaboration with the tutor and other students.
Besides, the evidence of the study of Hui et al. (2008) who compared the effectiveness and satisfaction associated with technology-assisted learning with that of face-to-face learning, revealed that technology-assisted learning better supports vocabulary learning than face-to-face learning but is comparatively less effective in developing listening comprehension skills. They also concluded that a supportive learning community can make technology-assisted learning easier for students and increase their learning satisfaction.
Switch to student’s anxiety in language learning, Roed (2003) discovered that a virtual learning environment may constitute a more relaxed and stress free atmosphere than a classroom. The rsesearcher also confirmed that the low level of inhibition and social anxiety, in particular, would be advantageous in foreign language learning, as it would result in increased language production.
Likewise, Kataoka, (2000, cited in Gong 2002) proved that many learners feel more confident when they practice speaking using computers than in a face-to-face setting. Additionally, the learners feel free to pronounce without feeling embarrassed by their errors. It is clearly proved that CALL can reduce student’s anxiety, leading to enhanced language learning efficiency.
Another line of the study conducted by Lim and Shen (2006) revealed that the students in the CALL-based English class were more positive in their perceptions of their learning environment than were those in the traditional English class. Additionally, the study indicated that computer technology had a positive impact on students’ perceptions of their learning environment, especially in relation to learning materials and tasks, and with regard to interaction and collaboration with the tutor and other students.
Khamkhien (2012) explored the using of CALL in English classroom in Thailand. The objective of this article is to encourage Thai English teachers to maximize the opportunities offered by technological advances. He reviewed many researches investigated impact of CALL in Thai context. In conclusion, pedagogical implications into teaching English with CALL as a tool are suggested.
With an extensive literature review, this research is one of among other previous studies which is aimed at investigating the students’ satisfaction on CALL and comparing the students’ satisfaction on CALL as classified by their gender and computer literacy. It is hypothesized that (1) male and female students have different satisfaction on CALL, and (2) students with different computer literacy have different satisfaction on CALL.

ISSN 2039-9340 Mediterranean Journal of Social Sciences Vol. 3 (11) November 2012
163
3. Research Methodology This research is a survey design. The samples in this study were 400 first-year students enrolled in EN111, EN112, EN 211, and EN 212 courses. They were selected from Stratified Random Sampling technique. The estimated sample size was based on Taro Yamane table. A 95% of confidence level was selected with a precision rate of + 5%. In this study, the dependent variables are two groups of genders (male and female) and three levels of computer literacy (low, medium, and high).
To implement this study successfully, a questionnaire was used for collecting data. The data were collected from 400 first-year Bangkok University students. The questionnaire consists of two parts. The first part is about the respondent’s background and the second part is based on student’s satisfaction on CALL divided into 4 groups. All questionnaires were given to the samples and taken back by the researcher’s assistance. The data got from the questionnaires were statistically analyzed through the following statistical device: (1) Percentage was used to demonstrate the background information of the students. Mean and standard deviation were employed to analyze the level of the students’ satisfaction on CALL. Then, the computed weighted means of the students’ satisfaction were interpreted in the form of range; 4.51-5.00 = very high, 4.50-3.51 = high, 3.50-2.51 = moderate, 2.50-1.51 = low, 1.50-1.00 = very low. (2) A t-test analysis was used to compare the mean scores of two groups of genders. One-way analysis of variance (ANOVA) was employed to test the mean scores of the students’ satisfaction on CALL in terms of computer literacy. 4. Results Table 1: Mean and standard deviation of the BU students’ satisfaction on CALL shown in four aspects
Student’s satisfaction on CALL S.D. Level
1. Content and Evaluation 3.60 0.46 High 2. System and Computer Equipment 3.48 0.63 High
3. Place and Service Time 3.43 0.70 High 4. Service of Computer Language Laboratory Technician 3.37 0.65 High Total 3.51 0.46 High
Table 1 showed that the average mean of satisfaction of BU students on CALL was at a high level (3.51). The three most aspects with which the students are satisfied were content & evaluation (3.60), system & computer equipment (3.48), and place & service time (3.43) respectively. Among three aspects, most students expressed that they are satisfied with content & evaluation at a high level. Table 2: A comparison of mean scores of BU students’ satisfaction on CALL classified by gender
Student’s satisfaction on CALL Samples N S.D. Df t Sig 1. Content and Evaluation Gender Male 218 3.58 0.47 398 -1.15 0.25
female 182 3.63 0.45 390.91 2. System and Computer Equipment Gender Male 218 3.50 0.65 398 0.51 0.61
female 182 3.47 0.61 391.98 3. Place and Service Time Gender Male 218 3.44 0.72 398 0.34 0.73
female 182 3.42 0.67 394.30 4. Service of Computer Language Laboratory Technician
Gender Male 218 3.34 0.67 398 -0.99 0.32 female 182 3.41 0.63 393.10
Total Gender Male 218 3.49 0.48 398 -0.70 0.48 female 182 3.53 0.45 392.34
*p < 0.05 This study found striking outcome in satisfaction on CALL of BU students classified by gender because there was no statistically significant difference between males and females in terms of overall satisfaction (p < 0.05). As table 2 indicates, among BU students, males and females had the same level of satisfaction on CALL. This is, both males and
Χ
Χ

ISSN 2039-9340 Mediterranean Journal of Social Sciences Vol. 3 (11) November 2012
164
females had a high level of satisfaction (3.53, 3.49) respectively. It was also found that males had more satisfaction than females on two aspects (system & computer equipment and place & service time), while females had more satisfaction than males on two aspects (content & evaluation and service of CLL technicians). Table 3: Analysis of variance and standard deviation of BU students’ satisfaction on CALL classified by computer literacy shown in four aspects
Student’s satisfaction on CALL
Variance Df SS MS F Sig
Computer Literacy
Low Medium High
S.D.
S.D.
S.D.
1. Content and Evaluation
Between Groups Within Groups Total
2 397 399
0.37 85.02 85.38
0.18 0.21
0.86 0.43 3.50 0.42 3.65 0.53 3.59 0.45
2. System and Computer Equipment
Between Groups Within Groups Total
2 397 399
0.01 160.52 160.53
0.01 0.40
0.01 0.99 3.51 0.59 3.49 0.65 3.48 0.63
3. Place and Service Time
Between Groups Within Groups Total
2 397 399
0.06 193.89 193.94
0.03 0.49
0.06 0.95 3.37 0.60 3.43 0.75 3.43 0.69
4. Service of Computer Language Laboratory Technician
Between Groups Within Groups Total
2 397 399
1.24 169.08 170.32
0.62 0.43
1.45 0.24 3.43 0.66 3.48 0.72 3.34 0.64
Total
Between Groups Within Groups Total
2 397 399
0.25 85.13 85.38
0.13 0.21
0.58 0.56 3.47 0.45 3.56 0.53 3.50 0.44
*p<0.05 The results from applying the ANOVA revealed that no difference was found. That is, students from three groups: low, moderate, and high level of computer literacy, did not express their satisfaction differently on CALL. Table 3 shows that students with moderate and high level of computer literacy had the overall satisfaction on CALL at a high level (3.56, 3.50) respectively, while students with a low level of computer literacy had the overall satisfaction on CALL at a moderate level (3.47). 5. Discussion and Conclusion These findings points out that most students expressed that they were satisfied with CALL in three aspects; (1) content & evaluation, (2) system & computer equipment, and (3) place & service time. It is clear that the students echoed their positive feelings on CALL. However, they reflected that they had less satisfaction on the service of computer language laboratory technician. In this case, CLL technicians are considered as instructors in CLL at Bangkok University. It is general assumed that CLL technicians should have enough basic technological knowledge to take care of the students who may need help while dealing with CALL. This assumption is supported by Khamkhien (2012) who claimed that Thai English teacher should be familiar with technological options in language learning environment.
It is interesting to find that male and female students with different levels of computer literacy had the same attitudes expressed on satisfaction on CALL. That is, most students echoed their positive attitudes on CALL even they have different gender and levels of computer literacy. The purpose of teaching and learning English at Bangkok University student doesn’t focus on only learning, so the free-stress atmosphere is created in classroom. This is related to Roed (2003) and Kataoka (2000 cited in Gong 2002) claimming that students feel more confident when they practice speaking using computers than in a face-to-face setting.
When comparing the results of this study with those of the previous related literature, we find that this study is consistent with many practical studies which were conducted before. It is consistent with Yang and Chen (2007) who proved experimentally that the students liked and approved of learning English using the Internet in language learning. It
Χ Χ Χ

ISSN 2039-9340 Mediterranean Journal of Social Sciences Vol. 3 (11) November 2012
165
is also consistent with Hui et al. (2008) who revealed that a supportive learning community can make technology-assisted learning easier for students and increase their learning satisfaction. To sum up, CALL program and computer language laboratory of Bangkok University provided for students should be improved appropriately to meet BU students’ satisfaction. The improvement should encompass the content and evaluation, computer system and equipment, learning environment: palce and service time, and the service of CLL technicians in order to facilitate language learning of the students.
References Abdulrasool, and et al. (2007) Effectiveness of Computer Assisted Laboratory Instructions: Learning OutcomesAnalysis. International
Journal of Learning.14 (8). pp. 197-209. ISSN 1447-9494. Gong, J. (2002). The employment of CALL in tecahing second/foreign language speaking skills. Post-script. 3(1).
http://www.edfac.unimelb.edu.au/insight/pscript.shtml. Hui and et al. (2008). Technology-assisted learning: a longitudinal field study of knowledge category, learning effectiveness and
satisfaction in language learning. Journal of Computer Assisted Learning. 24(3). 245-259. Doi: 10.1111/j.1365-2729.2007.00257.x.
Khamkhien, A. (2012). Computer assisted language learning and English language teaching in Thailand: Overview. Mediterranean Journal of Social Sciences. 3 (1). Doi: 10.5901/mjss.2012.03.01.55.
Lim and Shen. (2006). Integration of computers into an EFL reading classroom. Recall. 18(2). 212-229. doi. http://dx.doi.org/10.1017/S0958344006000528.
Moras, S. (2001). Computer-assisted language learning (CALL) and the internet. Karen’s Linguistics Issues. http://www3.telus.net/linguisticsissues/CALL.html.
Nabah, A. et al. (2009). The effect of computer assisted language learning in teaching English grammar on the achievment of secondary students in Jordan. The Internationa Arab Journal of Information Technology. 6(4). 431-439.
Patel, T. (2012). Impact of CALL materials in teaching English grammar at higher secondary level. Research paper. ELT Weekly. 4(17). http://www.eltweekly.com/elt-newsletter/2012/04/vol-4-issue-17-research-paper
Peterson, M. (2010). Computerized Games and Simulations in Computer-Assisted Language Learning: A Meta-Analysis of Research. 41(1). 72-93. doi: 10.1177/1046878109355684
Roed, J. (2003). Computer Assisted Language Learning. Language Behaviour in a Virtual Environment. 16(2-3). Doi:10155-172.1076/call.16.2.155.15880.
Saito, Y. and et al. (1996). Foreign Language Anxiety and Language Performance: A Study of Learner Anxiety in Beginning, Intermediate, and Advanced-Level College Students of Japanese. American Council on the Teaching of Foreign Languages. Foreign Language Annals. 29(2). 239-249. doi: 10.1111/j.1944-9720.1996.tb02330.x
Salaberry, M. R. (2001). The Use of Technology for Second Language Learning and Teaching: A Retrospective The Modern Language Journal. Blackwell Publishers Ltd. 85(1). 39056. doi: 10.1111/0026-7902.00096
Suharyadi, M. (2010). The impact of computer assisted language learning (CALL) in language teaching. Post graduated paper. http://www.emsuharyyadi.wordpress.com/2010/03/11/the-impact-of-computer- assisted-language-learning.
Sullivan, N., and Pratt, E. (1996). A comparative study of two ESL writing environments: A computer-assisted classroom and a traditional oral classroom. System, 24(4), 491-501.
Warschauer, M., and Healey, D. (1998). Computers and language learning: An overview. Language Teaching. 31. 57-71. Yang and Chen. (2007). Technology-enhanced language learning: A case study. 23(1). 860–879.
http://dx.doi.org/10.1016/j.chb.2006.02.015.


ISSN 2039-9340 Mediterranean Journal of Social Sciences Vol. 3 (11) November 2012
167
Construct Validity Examination of Life Skills for Primary School Students in Iran
Fatemeh Parasteh Ghombavani (Corresponding Author)
Islamic Azad University, South Tehran Branch, Tehran - Iran
Faculty of Educational Studies, University Putra Malaysia E-mail: [email protected]
Nor Hayati Alwi
Faculty of Educational Studies, University Putra Malaysia, Malaysia
E-mail: [email protected]
Ibrahim Ghadi
Faculty of Educational Studies, University Putra Malaysia E-mail: [email protected]
Rohani Ahmad Tarmizi
Faculty of Educational Studies, University Putra Malaysia
E-mail: [email protected]
Doi:10.5901/mjss.2012.v3n11p167 Abstract: This study addressed the issue of assessing the psychology properties of the construct validity for the life skills instrument. The life skills instrument consists of 31 Likert-type items measuring ten skills in five areas, namely self-awareness and empathy, interpersonal relationship and communication, creative thinking and critical thinking, decision-making and problem solving, coping with stress and emotion. The study involves 215 primary school students in Iran. The findings showed that the Life skills have satisfactory construct validity with five factors extracted and confirmed by confirmatory factor analyses. The Cronbach’s alpha values are supported construct validity, which the results indicates high validity and reliability for the instrument to measure life skills. Keywords: Construct validity; Confirmatory factor analysis; Life skills. 1. Introduction World Health Organization (WHO) in 1997 reported that life skills are abilities that fortify students’ overall development and reinforce their ability to encounter difficulties in life. Investigation of the life skills field suggests that there are some abilities that help children or adolescents for the promotion of the health and well-being that it is at the heart of skills-based initiatives.
Life skills that have been given attention in education for both primary and secondary levels are: effective communication, interpersonal relationship skills, self-awareness, empathy, decision making, problem solving, creative thinking, critical thinking, coping with emotions and coping with stress (WHO, 1999; Mangrulkar et al., 2001; Kord-Noghabi & Pasha Sharifii, 2008). Lou, Wang, Tu and Gao, (2008) postulate that capability of young people can be increased by these skills and thus, they can take responsibility for making healthier choices, resisting negative pressures, and avoiding risk behaviours. Therefore, life skills are a fundamental issue and expected to be taught at all levels and all ages of students. Integrating life skills in educational training can potentially help individual to change their way of life and promote healthy life (ESCAP, 2009).
This life skills training process can teach young students how to use daring behaviour, how to make decision and how to think critically. To achieve the desired results, all skills must be learned by the students (Botvin & Griffin 2004).
Based on need on youth and changes in society, the education system and curricula in Iran have been reformed in the past two decades. Educational system efforts to provide students to challenge with their everyday life based on some

ISSN 2039-9340 Mediterranean Journal of Social Sciences Vol. 3 (11) November 2012
168
plans and curriculum which emphasis has been placed in the past few years such as life skills training (Iran Chamber Society (ICS), 2001).
However, it is worth mentioning that life skill goals as well play an important part in Iran’s educational system at primary level. Education of Islamic life skills is a set of skills required for living in Islamic society. These skills are based on people can observe and response the values and norms of society and individual needs and able to confront and solve their problems by using religious teachings.
Life skills programs effectively teach some skills that help to enhance personal and social competencies (Botvin & Griffin, 2004). He expresses that training of life skills program can decrease health risk behaviours of students (Botvin, 2002). 2. Literature Review Many problems such as health and social problems, the big concern of the third millennium, is spreading out quickly. Health and social problems such in the Islamic Republic of Iran has shifted from low level to concentrated level of incidence (Report of Ministry of Health, Treatment & Medical Education, 2006, cited in Ministry of Education of the I.R. of Iran, 2008). The first serious discussions and analyses of life skills emerged by Botvin in 1979. This approach aims to assist young people to regain control over their behavior while taking informed decisions that can lead to positive behaviors and values. The WHO in 1993 has developed a set of life skills to be included within school-based programs. These life skills are intended to help young people to make healthy lifestyle choices and to reach optimal physical, social, and psychological well-being. WHO (1993) considers the life skills to be most generally essential abilities and skills, but each is dependent on cultural influences.
Education based on life skills attention to developing knowledge, attitudes, and all skills that related to health and social issues (WHO, 1993). In addition, it can be provide opportunities for students to practice and interpersonal skill with using interactive education and learning methods (Adewale, 2011). This type education aid students to promote personal and social development, the prevention of health and social problems, and the protection of human rights (WHO, 1993).
Botvin et al. (1990), Botvin and Kantor (2000), and Botvin et al. (2003) have developed a life skills training curriculum for preventing substance abuse for middle or junior high school students. Program accomplishments of life skills training in some countries have immediate and dramatic positive effects on children, youth, and adults. Several attempts have been made to training life skills. For instance Life Skills Project being conducted in the Armenian education system as component of an overall effort in education reform (Ministry of Education and Science of Armenia, 2001). In other study life skills as an issue is intended to encourage pupils’ all round development in Iceland Ministry of Education, Science and Culture, in order to enable them to better deal with the demands and challenges of everyday life (Ministry of Education of Iceland, 2004). In another study, Ministry of education and training in Vietnam (2006) conducted life skills education that referred to individual’s ability (knowledge, values, attitude, and skills) to perform life functions and to fully participate in daily life. To measuring life skills in adolescents, Sharma (2003) used a survey to assess the level of life skills in adolescents of a secondary school at Katmandu. Sharma, based on WHO’s definition, prepared a questionnaire in English with several questions to test life skills. The Likert’s technique of summated rating has been chosen in this study. According to the finding, little over half 51% adolescents were higher level of life skills. In addition, another interesting result related to life skills’ awareness of teachers that in their knowing, life skills is equal with vocational training and livelihood skills. Several studies investigating life skills have been carried out on Islamic Republic of Iran. The main purpose of these researches was to assess life skills education at youth attitudes towards problem society and positive effect on the personality factors thought their thinking. 3. Research Method 3.1 Participants & Sampling Cluster sampling technique used in this study. The subjects of this study were fifth grade primary school girls who enrolled in the public schools in Tehran in academic year 2010-2011. Tehran is capital city of Iran and Iran’s largest urban area and city. In addition, Tehran is multi-cultural, which it is home to diverse ethnic and linguistic groups from all over the country and represents of ethnic/linguistic composition of Iran. Most of economic center, public sector and large industrial firms, government ministries are located in Tehran. Moreover, Tehran is most important educational center of Iran, therefore, the investigation relevant to the education and program, this city finding the best model for the study. Furthermore, in Islamic Republic of Iran, girls are separated in their educations from the boys, and based on rule of

ISSN 2039-9340 Mediterranean Journal of Social Sciences Vol. 3 (11) November 2012
169
Tehran Education Organization, applying women teachers in boys’ schools is forbidden in high school and use of these teachers in primary schools are special regulations. There are nineteen educational districts in Tehran. Then, second and fifth districts were selected randomly. From the list of schools, three schools selected randomly, that were in districts. The participant of this research contains 215 fifth grade primary school girls in Tehran. The range of students’ age was between 10 and 12. 3.2 Instrument To test life skills, several questions were developed based on the WHO's definition. In present study, life skills questionnaire (LSQ) used to measure life skills of adolescents. This questionnaire made by researcher that the design of the questionnaires was based on Sharma (2003) research. In this study, students were asked each question and give their opinion on each of those in a five-point scale as to whether it will be able to assess the particular life skill under study. Sharma were maintained three questions for each component of life skills (except for self-awareness, which had four questions). In this study, some items modified based on culture and suggestion of Tehran Ministry of Education. According to mentioned to some special words in the items seven and sixteen (AIDS and smoking), these two items were omitted and items five and eight were separated in order to questions being equal. Based on WHO (1997), subscales of life skills can be paired into five main areas and 31 questions of this questionnaire assess these subscales: self-awareness and empathy (Q1-7), communication and interpersonal relationships (Q8-14), creative thinking and critical thinking (Q15-19), decision-making and problem solving (Q20-25), coping with stress and emotion (Q26-31). 3.3 Content Validity In this study, a questionnaire has been validated by a panel of judges who are lecturers in the field of curriculum and instruction, and supervisory committee. Of course, as it mentioned before, it was based on standard questionnaire that used in an article. All these experts are lecturers at University Putra Malaysia who validated the suitability of the research questionnaire and test to be used in the Iran context. This panel was selected based on their experiences in the field of education, their knowledge in research work as well as their familiarity with the subject. Life skills instrument survey disseminated to three critical thinking experts in the Faculty of Education, University Putra Malaysia for validation. The validators’ response revealed that the life skills are a highly suitable instrument. The researcher made relevant improvements based on comments from the validators. 3.4 Construct Validity Construct validity involves an explanation of clearly specified conceptual limitations (Newman, 2002). In addition, it concerned with the essential elements rather than with the scores of instrument produces (Salkind, 2000). Based on theoretical considerations, this validity stresses a logical analysis and it can check the relationships predicated. 3.4.1 Convergent Validity To test construct validity, convergent validity is used. In fact, construct validity refers to a theoretical viewpoint of identify phenomenon (Wiersma, 2000). Generally, construct is a complex concept with several interrelationships in the factors (Van Dalen, 1973). According to Fornell & Larcker (1981), factor loading, Composite Reliability (CR) and Average Variance Extracted (AVE) was assessed convergent validity in this study. To estimate factor loading of variables, Confirmatory Factor Analysis (CFA) is conducted, because it can show the level of regression path of latent to its indicators. In this study, all of latent variables in each area had at least five items. Acceptable value for factor loading is more than 0.5 and it is good indicator if it is equal to 0.7 and above (Hair et al., 2010). According to Bollen and Long, (1993) and Garson (2011), to test reliability, Cronbach's alpha can be used and acceptable value is 0.7 and above. It refers to another guideline to review convergent validity. CR is calculated by
𝐶𝐶𝐶𝐶 = (∑ 𝜆𝜆𝑦𝑦𝑦𝑦 )𝑛𝑛𝑦𝑦=1
2
(∑ 𝜆𝜆𝑦𝑦𝑦𝑦 )𝑛𝑛𝑦𝑦=1
2+(∑ 𝑉𝑉𝑉𝑉𝑉𝑉 (𝜀𝜀𝑦𝑦𝜌𝜌𝑦𝑦=1 ))
(1)
𝐶𝐶𝐶𝐶 = Indicates composite reliability 𝜆𝜆𝑦𝑦= The standardized factor loading 𝑉𝑉𝑉𝑉𝑉𝑉(𝜀𝜀𝑦𝑦)= Variance due to the measurement error

ISSN 2039-9340 Mediterranean Journal of Social Sciences Vol. 3 (11) November 2012
170
Finally, to check construct validity, AVE is conducted. AVE is measured the level of variance capture due to error's measurements by a construct versus. The acceptable value is 0.5 and above and when the value of AVE is more than 0.7, it will be considered very good (Hair et al., 2010). It is calculated by
𝐴𝐴𝑉𝑉𝐴𝐴 = ∑ 𝜆𝜆𝑦𝑦2𝑛𝑛
𝑦𝑦=1 𝑛𝑛
(2) AVE =Average variance extract 𝜆𝜆𝑦𝑦 = The standardized factor loading n = Number of items 3.4.2 Discriminant Validity To ensure about significant variance among different variables, discriminant validity were test. It can indicate differentiate between two construct in the same model. In addition, two common ways were used to assess discriminate validity. In this time, if the correlations of two latent variables go above 0.9, there is significant overlapping constructs (Hair et al., 2010). Moreover, there is comparing AVE with squared correlation between two constructs to assess discriminate validity. In other way, to check this validity, the level of square root of AVE should be greater than the correlations involving the constructs (Fomell & Larcker, 1981). 3.5 Data Analysis To analyze of data in this study, three statistical procedures were employed using SPSS in analyzing the data. The procedures of data analyses include: 1. Descriptive analyses used to obtain the distribution of percentage of respondents’ age based on demographic variables. 2. Confirmatory factor analysis (CFA) using the AMOS data-fitting program was applied to further confirm the construct validity of items and constructs used in the main study. 3. Reliability analysis using Cronbach’s alpha. 4. Results The range of ages respondent in this study were 31 in 10 year (14.4%), 150 in 11 (69.8%) and 34 in 12 (15.8%). The results of the CFA for the adapted life skills instrument as shown in Figure 1 that shows a good fit between the data (N=215) and the measurement model. The measurement model has Chi square= 262, P<.05. The ratio of the minimum discrepancy to its degree of freedom, CMIN/df was 3.8. The data exposed that for the revised measurement model, the fit statistics is good compared to the hypothesized measurement model. All of the fit indicators (Table 1), the GFI = .870, CFI = .903 and TLI = .902 fulfill the threshold of .90, the standard deemed important for model fit. However, the root mean square of approximation (RMSEA = .069) indicated a good fit of the hypothesized model. Consequently, this model has to be revised of good fit based on goodness of fit indices. Table 1. Goodness-of-fit indices of the CTD measurement model
Fit Index Recommended Value
(Hair et al., 2010) CTD Model
𝑥𝑥2/df ≤ 3 262 RMSEA ≤ 0.08 .069
GFI ≥0.9 .870
RMR <0.5 .067
NFI ≥0.9 .900
CFI ≥0.9 .903 TLI ≥0.9 .902
PNFI The higher ,the better .801

ISSN 2039-9340 Mediterranean Journal of Social Sciences Vol. 3 (11) November 2012
171
Measurement model of life skills represents the five influential. These latent variables indicated by five to ten observed variables. Figure 1 are presented five life skills latent variables and their indicators with standardized factor loading of them. These constructs are self-awareness and empathy, interpersonal relationship and communication, creative and critical thinking, decision making and problem solving, cope with stress and emotion. Figure 1. Life skills Model
After removing low factors loading indicator, the standardized factor loading of all items on their constructs are more than the acceptable level (> 0.5) that it shows in Table 2. In addition, AVE and CR were checked to test of convergent validity moreover factor loading. The results indicated that all components have the acceptable level of AVE between a range of 0.770 to 0.900 (Self-awareness and empathy =0.722, Interpersonal relationship and communication =0.770, Creative thinking and critical thinking=0.775, Decision-making and problem solving = 0.847, Coping with stress and emotion =0.900). Likewise, good level of composite reliability were observed in all the components of life skills (more than 0.7); Self-awareness and empathy =0.939, Interpersonal relationship and communication =0.951, Creative and critical thinking=0.932, Decision-making and problem solving = 0.965, Coping with stress and emotion =0.973. Hence, based on factor loading, AVE, and CR, three conditions for convergent validity were met. As a final point, all of Cronbach’s alphas were more than 0.7 in the acceptable level.
Self awareness & empathy
.50
Item1 e1 .71
.73
Item3 e2 .85 .81
Item4 e3 .90 .83
Item5 e4 .91
.78
Item6 e5
.88
.67
Item7 e6
.82
Communication & interpersonal relationship
.29
Item8 e7 .76
Item10 e8 .89
Item11 e9 .91
Item12 e10 .90
Item13 e11 .89
Item14 e12
.54 .87 .94
.95
.95
.94
Creative thinking & critical thinking
.58
Item16 e13 .81
Item17 e14 .88
Item18 e15 .83
Item19 e16
.76 .90 .94
.91
Decision- making & problem solving
.55
Item21 e17 .94
Item22 e18 .95 Item23 e19 .96
Item24 e20 .85
Item25 e21
.74 .97 .97
.98
.92
Coping with stress & emotion
.91
Item28 e22 1.00
Item29 e23 .92
Item30 e24 .76
Item31 e25
.96 1.00
.96 .87
.60
.61
.47
.35
.75
.55
.29 .74
.18
.16
.49
.33
.53

ISSN 2039-9340 Mediterranean Journal of Social Sciences Vol. 3 (11) November 2012
172
Table 2. Cronbach’s Alpha, Factor loading, and Convergent Validity
Moreover, AVE of each variable with the square construct correlation between any two constructs is compared to test of discriminant validity. In fact, the square construct correlations should be smaller than AVE that it illustrated in the Table 3. this table shows comparing the AVE of components of life skill and square construct correlation that AVE of constructs are greater than square correlation between them. Table 3. Discriminant Validity
Self-awareness
& Empathy Interpersonal relationship & communication
Creative thinking & critical thinking
Decision making & Problem solving
Coping with Stress & Emotion
Self-awareness & Empathy
.722*
Interpersonal relationship & communication
.364 .770*
Creative thinking & critical thinking
.373 .561 .775*
Decision making & Problem solving
.220 .300 .540 .847*
Coping with Stress & Emotion
.121 .087 .030 .025 .900*
Notes:*Diagonal elements report the AVE and other matrix entries report the squared correlation estimation between them.
Cronbach`s Alpha
Construct Items Factor loading
AVE CR
.938
.950
.929
.960
.975
Self-awareness & Empathy
Interpersonal Relationship & communication
Creative thinking & Critical thinking
Decision making & Problem solving
Coping with
stress & Emotion
Item1 Item 3 Item 4 Item 5 Item 6 Item 7
Item 8 Item 10 Item 11 Item 12 Item13 Item14
Item 16 Item 17 Item 18 Item 19
Item 21 Item 22 Item 23 Item 24 Item 25
Item 28
Item 29 Item 30 Item 31
.71
.85
.90
.91
.89
.82
.54
.87
.94
.95
.95
.94
.76
.90
.94
.91
.74
.97
.97
.98
.92
.96 1.00 .96 .87
.722
.770
.775
.847
.900
.939
.951
.932
.965
.973

ISSN 2039-9340 Mediterranean Journal of Social Sciences Vol. 3 (11) November 2012
173
As results, testing convergent validity and discriminant validity have shown a good construct validity and reliability. 5. Conclusions and Implications In conclusion, to validate the items and constructs related with items of this questionnaire, adapted life skills underwent the process of confirmatory factor analysis. Results of the studied instrument showed appropriate construct validity. It means in assessing student’s life skills, the items in five subscales were valid. Moreover, the results of reliability analysis indicated that this instrument has a good reliability. Implication that highlighted from this study is methodological approach where it revealed the usefulness of CFA in validating the items (self-awareness & empathy, interpersonal relationship & communication, creative and critical thinking, decision making & problem solving, coping with stress & emotion) and constructs of items consisted in the adapted life skills. Accordingly, researchers can conclude that this instrument was suitable to use for assessing life skills in primary school in Iran. Future research can survey the actual processes going on during the learning activities by using qualitative method in analyzing the items. This is due to the importance of the life skills students’, which has a significant impact on quality of the living in the society and their success in all ten subscales of life skill.
References Adewale, J.G. (2011). Competency level of Nigerian Primary 4 pupils in life skills achievement test. Education, 39(3), 221-232. Bollen, K. A., & Long, J. S. (1993). Testing structural equation models: Newbury Park, CA: Sage. Botvin G. (1979). Life Skills Training: Teacher's Manual. New York: American Health Foundation. Botvin, G. J. (2002). Planning workbook, a guide for implementing. life skills training program. National Health Promotion Associated,
Inc. Botvin, G. J., Baker, E., Dusenbury, L., Tortu, S., & Botvin, E. M. (1990). Preventing adolescent drug abuse through a multimodal
cognitive–behavioral approach: Results of a three-year study. Journal of Consulting and Clinical Psychology, 58, 437–446 Botvin, G.J., & Griffin, K.W. (2004). Life skills training: empirical findings and future directions. Journal of Primary Prevention, 25 (2), 211-
232. Botvin, G.J., Griffin, K.W., Paul, E., & Macaulay, A.P. (2003). Preventing tobacco and alcohol use among elementary school students
through Life Skills Training. Journal of Child & Adolescent Substance Abuse, 12, 1-17. Botvin, G. J., & Kantor, L. W. (2000). Preventing alcohol and tobacco use through Life Skills Training. Alcohol Research and Health, 24,
250–257. Economic and Social Commission for Asia and the Pacific (ESCAP). (2009). Strengthening Life Skills for Positive Youth Health Behavior.
An overview and discussion paper. United Nations. Fornell, C., & Larcker, D. F. (1981). Evaluating structural equation models with unobservable variables and measurement error. Journal
of marketing research, 18(1), 39-50. Hair, J. F., Black, W. C., Balin, B. j., & Anderson, R. E. (2010). Multivariate data analysis: Maxwell Macmillan International Editions. Garson, G. D. (2011). Structural Equation Modeling. [Online] Available: http://faculty.chass.ncsu.edu/garson/PA765/structur.htm (May 10, 2011) Iran Chamber Society (ICS). (2001). The Iranian educational system, a brief review of Iranian education system. [Online] Available:
http://www.iranchamber.com/education/articles/educational_system.php (May 15, 2012) Kord-Noghabi, R,. & PashSharifi, H. (2008).Preparation and compilation of a life skills curriculum for students in the high school period.
Quarterly Journal of Educational Innovations, 24, 47-56. Lou, C., Wang, X., Tu, X., & Gao, E. (2008). Impact of life skills training to improve cognition on risk of sexual behavior and contraceptive
use among vocational school students in shanghai, China. Journal of Reproduction & Contraception, 19(4), 239-251. Mangrulkar, L., Whitman, C. V., & Posner, M. (2001). Life skills approach to child and adolescent healthy human development. Pan
American Health Organization. Health and Human Development Programs (HHD), a division of Education Development Center, Inc. (EDC).
Ministry of Education and Science of Armenia. (2001). Life skills project implementation in the Armenian education system. A project sponsored by UNICEF and the Ministry of education and science. Yerevan, Armenia.
Ministry of Education of Islamic Republic of Iran. (2008). National report on development of education in the I.R. of Iran with an emphasis on inclusive education a way to the future. Devised by: Bureau of International Scientific Cooperation.
Ministry of Education and Training in Vietnam. (2006). Life skills mapping in Vietnam. National Institute for education strategy and curriculum (Viet Nam). Hanoi, UNESCO, 76 p., Bibl.: p. 63-65.
Ministry of Education of Iceland. (2004). National curriculum guide for compulsory school. life skills. Ministry of Education, Science and Culture. Iceland.
Newman, T. (2002). Vital statistics. Community Care, 18-24. Salkind, N. (2000). Exploring research (Vol. 4th edition): Prentice Hall (Upper Saddle River). Sharma. S. (2003). Measuring life skills of adolescents in a secondary school of Kathmandu: an Experience. Kathmandu University
Medical Journal, 1 (3), 170-176.

ISSN 2039-9340 Mediterranean Journal of Social Sciences Vol. 3 (11) November 2012
174
Van Dalen, D. B. (1973). Understanding educational research: An introduction: McGraw-Hill. Wiersma, W. (2000). Research Methods in Education :An Introduction: Allyn and Bacon. World Health Organization (WHO). (1993). Life Skills Education for Children and Adolescents in Schools. Programme on Mental Health.
Geneva. World Health Organization (WHO). (1997). Life Skills Education in Schools. Program on Mental Health. Division of mental health and
prevention of substance abuse. World Health Organization. Geneva World Health Organization (WHO). (1999). Partners in Life Skills education. Geneva: United Nations Inter-Agency Meeting.

ISSN 2039-9340 Mediterranean Journal of Social Sciences Vol. 3 (11) November 2012
175
The Impact of Economic Conditions on Traditional and new Categories of Property
Crimes – An Exploratory Research in European Countries –
Silvia Bartoletti
La Cattolica University, Milan, Italy
Doi:10.5901/mjss.2012.v3n11p175
Abstract The goal of this paper is to evaluate at a macro level the link that exists between different types of property crimes (theft, burglary, fraud, offences against the computer) and economic indicators in the 27 countries of the European Union. Crimes selected belong to ‘old’ and ‘new’ categories of property crimes. They are collected from the ‘the European Sourcebook of crime and criminal Justice statistics’ while the economic indicators are collected from two European surveys, EU-SILC and LFS. Variables related to the population structure (‘age’ and ‘gender’) are added in the analysis. Statistical techniques (correlation and multiple regression analysis) will be useful to build a framework of indicators which contributes to a better understanding of the interactions between criminality and economic indicators. A parameterized model, function of the main factors of crime, will help to understand old and new categories of property crime and their potential directions in Europe.
1. Background Several theories (social disorganization, opportunity, strain etc.) have examined the impact that poverty may have on crime; in particular, the link between ‘unemployment’ and ‘crime’ has been the object of several scholarly works and discarding results: some studies have found significant results of unemployment rates on crime, some others weak or less consistent outcomes.
Gottfredson and Hirschi (1990) have doubts about the association between unemployment and crime, while Becker (1968) and Ehrlich (1973) believe that unemployment is deeply associated with crime because utility from legitimate work decreases the opportunity costs of illegitimate work.
Cantor and Land (1985) analyse the relationship between annual unemployment rates and crime rates in the United States. They observe that unemployment may have a double contrasting role: it may reduce the opportunities to violate the law, (e.g. unemployed persons usually spend much time at home, so it is more difficult for offenders to commit burglary), but at the same time, it may increase the motivation to commit crime (e.g. the increase of the unemployment rate may increase the proportion of people that, to get money, commit criminal activities).
Greenberg (2002) criticizes the use of the indicator ‘unemployment rate’, observing that the method used to collect it, may generate systematic bias in the analysis. In fact, unemployment rate as it is collected nowadays, reveals some gaps; firstly, it leaves out workers that have dropped out of the labour force; secondly, it leaves out part time workers that desire full-time jobs.
Some studies add structural components to the economic aspects. In particular, South and Messner (2000) observe that ‘the primary demographic characteristics of age and gender are among the most powerful and robust individual-level risk factors for criminal offending and victimization’(South & Messner 2000 p. 84)
The demographic features have been the purpose of many studies (Greenberg, 1985; Hirschi & Gottfredson, 1983; Steffensmeier, Allan, Harer M.D. & Streifel, 1989). Sometimes they have been crossed with economic conditions (Imrohoroglu, Merlo & Rupert, 2004).
For example, Britt (1997) analyses the relationship ‘crime-unemployment’ introducing the component ‘age’. He takes into account arrest data for the United States from 1958 to 1995 and its correlation with age. Results show that unemployment has a broad motivational effect on property crime, in particular among young people. 2. The current study The goal of this explorative work is to evaluate at a macro level the relationship between four types of property crimes (theft, burglary, fraud, offences against the computer) and economic indicators in the 27 countries of the European Union. Types of crimes selected belong to ‘traditional’ and ‘new’ categories of property crimes. In particular, this work wants to examine the impact that economic conditions may have on old and new types of property crimes in Europe.

ISSN 2039-9340 Mediterranean Journal of Social Sciences Vol. 3 (11) November 2012
176
In this work, the dimension of population structure is examined including some demographic indicators related to ‘age’ and ‘gender’. This aim is supported by some considerations: - most studies use micro level data (e.g. longitudinal analysis) and focus on the United States or a few European countries. Studies that apply a macro approach in the 27 countries of the European Union are seldom used; - publications generally focus on the relationship between ‘economic conditions’ and ‘traditional property crimes’ like ‘theft’ or ‘burglary’, while crimes like ‘fraud’ or ‘offences against the computer’ are less investigated. However, currently, these crimes are collected at European level and can be explored. This objective permits to propose a table ‘property crime - economic indicators’ that identifies for each type of crime selected the indicators that are relevant for it in Europe, the sign (positive or negative) and the type (linear or non linear ) of this link. After that, it contributes to a better understanding of the interactions between criminality and economic indicators. This can help to build a framework of indicators which can be relevant for today and for the future to be monitored in order to understand traditional and new categories of property crime and their potential directions. 3. Data and methods Crime data used in this work have been picked up from ‘the European Sourcebook of crime and criminal Justice statistics’. It collects data on crime and criminal justice trying to offer comparative crime data on many European countries on a variety of subjects bypassing some of the problems caused by differences in counting rules used to report crimes (Aebi, 2008, 2010), offences legal definition (CEPEJ, 2010), the degree of influence on underreporting crimes.
Property crimes selected are: ‘burglary’, ‘theft’, ‘fraud’, ‘offences against the computer’. Crimes have been collected as ‘offences per 100.000 population’. Standard definitions are reported in Appendix A1.
In this paper, ‘burglary’ and ‘theft’ are named ‘ traditional’ or ‘old property crimes’ because, in the past years, they have been the object of several scholarly works and they have been collected at European level from 1998. ‘Fraud’ and ‘offences against the computer’ are named ‘new property crimes’. The latter is a new property crime because it has been criminalized just recently, while fraud is inserted in the category ‘new property crimes’ because it has not been often included in scholarly works and just recently it has been collected at European level obtaining comparable data.
The social indicators1 that belong to the economic area have been collected from two European surveys, the Labour Force Survey (LFS)2 and the European Union Statistics on Income and Living Conditions (EU-SILC) 3
Population composition is included in this work. Data is collected from Eurostat database
. EU-SILC collects data on income, poverty, social exclusion and living conditions while LFS is a sample survey among
private households, which provides detailed data on employment, unemployment, inactivity. The economic indicators selected are: ‘unemployment rate’; ‘number of persons employed part time’; ‘employment
female aged 15-64’; ‘people at risk-of-poverty threshold’; ‘Gini coefficient’; ‘income quintile share ratio’; ‘material deprivation’ (Appendix A2). ‘Unemployment rate’, ‘employment female aged 15-64’, ‘the number of persons employed part time’, are indicators related to labour market, while others are related to the poverty theme.
Poverty may be measured like ‘absolute’ or ‘relative’. There are theories that say that the second one is more relevant to explain crime because it gives information on economic inequality (Allen 1996). Economic indicators chosen in this paper represent both dimensions.
4
The period selected is 2004-2007. This study wants to privilege the spatial dimension respect to the temporal dimension because it wants to test the relationship between ‘economic conditions’ and ‘property crimes’ at a macro level
. The demographic indicators selected are: ‘women per 100 men’; ‘proportion population aged 65 and over of total population’; ‘proportion population aged 15-24 of total population;’ ‘old age dependency ratio’ (Appendix A2). The analysis units are the 27 countries that belong to the European Union: Austria, Belgium, Bulgaria, Cyprus, Czech Republic, Denmark, Estonia, Finland, France, Germany, Greece, Hungary, Ireland, Italy, Latvia, Lithuania, Luxemburg, Malta, Netherlands, Poland, Portugal, Romania, Slovakia, Slovenia, Spain, Sweden and the United Kingdom.
1 Social indicators collect information on many aspects of everyday life and cover several thematic areas. In this paper, for brevity , social indicators that belong to economic area are called ‘economic indicators’, social indicators that belong to demographic area are called ‘demographic indicators’. The definition ‘social indicators’ include ‘economic indicators’ and ‘demographic indicators’. 2 Data available at: http://epp.eurostat.ec.europa.eu/portal/page/portal/employment_unemployment_lfs/publications/results 3 Data available at: http://epp.eurostat.ec.europa.eu/portal/page/portal/microdata/eu_silc 4 Data available at: http://epp.eurostat.ec.europa.eu/portal/page/portal/statistics/themes

ISSN 2039-9340 Mediterranean Journal of Social Sciences Vol. 3 (11) November 2012
177
in the 27 countries of European Union. Comparable data for property crimes and indicators selected are available from 2004 at European level. Pearson coefficient (r) will be used to measure the degree of association between variables. This can help to build a framework of indicators which can be relevant for today and for the future to be monitored in order to understand property crime and its potential directions. The correlation analysis highlights partial correlations between variables but in general, social phenomena are complex and many factors interact at the same time. Multiple regression analysis will be used because it permits to examine the relationship between one dependent variable (crime) and one or more independent variables Xi (social indicators), it will test which set of social indicators are influencing criminal behaviour (Rizzi, 1992). It can help to contribute to a better understanding of the interactions between property crimes and social indicators and analyse the link that exists between dependent variable (crime) and explicative variables (social indicators), the sign (positive or negative) of this link, the type (linear or non linear). Just to theorise, the equation is:
equation (1) Y = β0 + β1 X1 + … + βm Xm + ε
where Y represents the value of crime rate; β0 represents constant; X1 through Xm represent the social factors influencing the criminality; β1 through βm represent the regression slopes for the social indicators X1 through Xm; ε represents the error term. 4. Discussion 4.1. The ‘economic conditions – property crimes’ link The dispersion of economic indicators shows diversities within countries and between groups of countries. There are differences in the labour force and the poverty rate. Southern (Spain) and Eastern countries (Bulgaria, Estonia, Latvia, Lithuania) record the highest unemployment and poverty rate in Europe (EU-SILC 2011).
There is also heterogeneity in the number of part time contracts and percentage of females employed: Northern countries (Netherland, United Kingdom, Denmark, Germany, Sweden) register high values, the rest of Europe has low values (LFS 2011).
A preliminary elaboration on crimes correlation (results are in Appendix B3) shows that traditional property crimes are significantly correlated between them (R = 0.79), and new property crimes are correlated between them (R = 0.70). Fraud and theft that belong respectively to ‘new’ and ‘old’ property crimes, are highly correlated (R = 0.75).
In table 1 economic indicators are crossed with property crimes. Four-years data have been reported because the one-year correlation may be attributed to casual factors; four-year correlation more rarely. Given the small sample size, statistical significance is reported at the .05 as well as the .01 level.
Table 2. Bivariate correlation between economic indicators and property crimes in European countries (years 2004-2007)
* Significance 0.05 level **Significance 0.01 level Results highlight that economic indicators related to poverty are highly correlated to traditional property crimes, not correlated to new property crimes.
Correlations Parameter theft burglary fraud offences against computer 2004 2005 2006 2007 2004 2005 2006 2007 2004 2005 2006 2007 2004 2005 2006 2007 unemployment Pearson Correlation -0,32 -0,33 -0,31 -0,28 -0,39 -0,41 -0,51** -0,58** -0,06 0,00 0,08 0,12 0,07 0,21 0,31 0,43 Sig. (2-tailed) 0,13 0,11 0,14 0,22 0,09 0,06 0,01 0,01 0,79 0,99 0,72 0,63 0,80 0,42 0,02 0,13 part time Pearson Correlation 0,73** 0,76** 0,78** 0,72** 0,81** 0,84** 0,85** 0,72** 0,34 0,43* 0,44* 0,46* 0,52* 0,60** 0,64** 0,57* Sig. (2-tailed) 0,00 0,00 0,00 0,00 0,00 0,00 0,00 0,00 0,12 0,05 0,04 0,05 0,03 0,01 0,00 0,03 female employment Pearson Correlation 0,71** 0,70** 0,66** 0,64** 0,76** 0,77** 0,77** 0,72** 0,51* 0,49* 0,46* 0,44 0,22 0,2 0,23 0,24 Sig. (2-tailed) 0,00 0,00 0,00 0,00 0,00 0,00 0,00 0,00 0,03 0,03 0,05 0,06 0,46 0,49 0,43 0,4 poverty Pearson Correlation 0,59* 0,64** 0,66** 0,65** 0,72** 0,52* 0,53** 0,54* 0,42 0,43* 0,39 0,44 0,30 0,42 0,37 0,36 Sig. (2-tailed) 0,04 0,00 0,00 0,00 0,01 0,02 0,01 0,03 0,17 0,05 0,07 0,06 0,40 0,10 0,13 0,21 Gini coefficient Pearson Correlation -0,63* -0,40* -0,59** -0,59** -0,68* -0,22 -0,42* -0,38 -0,49 -0,32 -0,4 -0,43 -0,29 -0,24 -0,26 -0,04 Sig. (2-tailed) 0,02 0,05 0,00 0,00 0,02 0,31 0,05 0,13 0,09 0,14 0,06 0,06 0,38 0,36 0,27 0,89 income Pearson Correlation 0,26 0,43 0,27 -0,02 -0,57* -0,39 -0,53** -0,59** -0,45 -0,32 -0,35 -0,41 -0,27 -0,26 -0,25 -0,07 Sig. (2-tailed) 0,37 0,03 0,18 0,94 0,04 0,06 0,01 0,01 0,12 0,14 0,1 0,08 0,43 0,31 0,31 0,82
material deprivation Pearson Correlation -0,79** -0,69** -0,70** -0,66** -0,81** -0,47* -0,50* -0,59** -0,56 -0,42 -0,4 -
0,45* -0,12 -0,28 -0,31 -0,31 Sig. (2-tailed) 0,00 0,00 0,00 0,000 0,00 0,04 0,02 0,01 0,07 0,06 0,07 0,05 0,75 0,31 0,21 0,29

ISSN 2039-9340 Mediterranean Journal of Social Sciences Vol. 3 (11) November 2012
178
Unemployment rate is inversely correlated to burglary (p-value < 0.05). Opportunities theory may help to explain this outcome: high unemployment rate means high proportion of people that spend time at home and this factor may reduce burglary rate (Cohen & Felson, 1979). Another aspect to consider is that in general unemployed persons provide a supplementary protection for their property and this aspect reduce property crimes.
The number of persons employed part-time is positively correlated to all types of crimes, traditional and new offences (p-value < 0.05): part time jobs decrease the legal income for family and may have a crucial role in producing motivated offenders.
Female employment is positively correlated to fraud (p-value < 0.05), theft and burglary (p-value < 0.01). Unemployed women supervise their home and their neighborhood, while employed women spend less time at home: this factor may increase property crime rates (Cohen & Felson, 1979).
‘Unemployment’, ‘female employment’ and ‘part time’ are factors that imply the absence or the presence of guardians, and they may have effect on crime.
The indicator ‘people at risk-of-poverty threshold’ well describes the ‘relative poverty’ and is positively correlated to theft (p-value < 0.01) and burglary (p-value < 0.05). Aebi and Linde (2010) observe ‘in contemporary developed societies, the population is confronted with an anomic situation in which the material goods offered are unlimited, but the economic resources are limited. This situation would generate strain or stress that could lead to delinquency’. (Aebi & Linde 2010 p. 265)
‘Gini coefficient’, ‘income quintile share ratio’ and ‘material deprivation’ are negatively correlated to traditional property crimes like burglary and theft. In particular, ‘Gini coefficient’ is highly correlated to theft, ‘income quintile share ratio’ is highly correlated to burglary; ‘material deprivation’ well- describes both. 4.2 The ‘demographic indicators- property crimes’ link Previous research shows that variables like ‘gender’ and ‘age’ are necessary to examine how the structure of the community may influence crime rates; they are central elements, so they are included in this paper. Demographic indicators collected nowadays by Eurostat permit to make some considerations on the relationship ‘property crimes –population structure’. Descriptive statistics highlights some differences between countries in terms of demographic features. In Italy, there is the highest percentage of population aged 65 and over (30.2% in 2007). In general, Southern countries are older and have a higher dependency rate than Northern European countries (Eurostat 2010). The number of ‘women per 100 men’ is extremely high in Northern countries (Sweden, Denmark, Finland) and in Italy: a high number of females could show a large pool of potential victims. In Italy, the high number of females is caused by the high proportion of elderly, in fact, the age pyramid shows that women arrive at old age more frequently than men. (Livi Bacci, 1999) Elaborations on demographic indicators show that the indicators ‘women per 100 men’, ‘old population’ and ‘old age dependency ratio’ are highly correlated (p-value <0.05) (results are in Appendix B4). In table 2 bivariate correlation has been reported. Table 2. Bivariate correlation between demographic indicators and property crimes in European countries (years 2004-2007)
* Significance 0.05 level **Significance 0.01 level Theft and burglary are highly correlated to the proportion population aged 15-24 (p-value <0.05): young people have high probability in becoming offenders. This result is supported by many theories and several scholarly works that say that
Correlations Parameter theft burglary fraud offences against computer 2004 2005 2006 2007 2004 2005 2006 2007 2004 2005 2006 2007 2004 2005 2006 2007 women Pearson Correlation 0,48 0,4 0,42* 0,30 0,27 0,25 0,26 0,30 0,11 0,01 0,04 0,37 -0,13 -0,11 -0,04 0,23
Sig. (2-tailed) 0,14 0,06 0,05 0,19 0,45 0,28 0,26 0,24 0,74 0,98 0,85 0,12 0,74 0,71 0,87 0,43 old population Pearson Correlation 0,25 0,27 0,28 0,24 -0,14 0,02 0,04 0,18 0,31 0,36 0,41* 0,52* 0,42 0,45 0,46* 0,61*
Sig. (2-tailed) 0,24 0,2 0,19 0,3 0,56 0,94 0,86 0,48 0,15 0,09 0,05 0,02 0,09 0,07 0,05 0,02 young population Pearson Correlation -0,66** -0,61** -0,58** -0,44* -0,47* -0,48* -0,46* -0,44 -0,39 -0,36 -0,34 -0,50* -0,39 -0,39 -0,39 -0,45
Sig. (2-tailed) 0,00 0,00 0,00 0,04 0,04 0,02 0,03 0,08 0,06 0,10 0,11 0,03 0,12 0,12 0,10 0,10 dependency Pearson Correlation 0,32 0,36 0,36 0,31 -0,1 0,08 0,09 0,24 0,32 0,39 0,43* 0,57** 0,44 0,48* 0,50* 0,64**
Sig. (2-tailed) 0,13 0,08 0,09 0,17 0,67 0,73 0,69 0,36 0,14 0,06 0,04 0,01 0,08 0,05 0,03 0,01

ISSN 2039-9340 Mediterranean Journal of Social Sciences Vol. 3 (11) November 2012
179
crime tends to peak in young age (Steffensmeier, Allan, Harer M.D. & Streifel, 1989). Fraud and offences against the computer are highly correlated to the ‘proportion population aged 65 and over’ and
to the ‘old age dependency ratio’ (p-value <0.05). This result can be explained recalling the Cohen and Felson’s opportunities theory: a population composed by old persons is a population where crime categories like fraud or offences against the computer have a high probability to have success. Old people are more likely than young victims because they are not useful with tools like computers, so they have a high probability to be victimized.
Cohen & Felson (1979) say that there are persons at a high risk of being victimizes because they are less able to resist motivate offenders for features linked to ‘age’. 4.3 Multivariate Results This phase contributes to a better understanding of the interactions between criminality, economic and demographic factors so to identify social indicators that influence different types of property crimes. A stepwise regression has been used; it includes variables like forward selection procedure and then tests the model on the basis of backward elimination procedure. Crime is a multifaceted phenomenon and it can be adequately investigated using a large set of explaining variables. In table 3 explanatory variables are added in the model: R is the determination coefficient; R Square permits to evaluate how well the model fits reality; R Square Change explains how much R Square increases, inserting a new variable in the regression equation; Significance F depends on the results of the regression analysis and the confidence level chosen. In this elaboration a confidence level of 95% has been chosen, if Significance F is <0.05, then the null hypothesis is rejected (there is a statistically significant association between X and Y). While, if Significance F is >0.05, then the null hypothesis is accepted (there is not statistically significant association between X and Y). Table 3. Regression model summary for property crimes in European countries– year 2007
Crime Predictor Model R R Square
Adjusted R Square
Std. Error of the
Estimate R Square Change
F Change
Sig. F Change
Theft
Predictors: (Constant), part time 1 0,72 0,51 0,49 1122,19 0,51 19,91 0,00
Predictors: (Constant), part time, Gini coefficient 2 0,84 0,71 0,68 884,43 0,20 12,59 0,00
Predictors: (Constant), part time, Gini coefficient, poverty 3 0,89 0,80 0,76 759,59 0,09 7,40 0,01
Predictors: (Constant), part time, Gini coefficient, poverty, female employment
4 0,92 0,85 0,81 678,74 0,05 5,29 0,03
Burglary Predictors: (Constant), female employment 1 0,72 0,52 0,49 259,17 0,52 16,24 0,01
Fraud
Predictors: (Constant), dependency 1 0,57 0,33 0,29 197,37 0,33 8,25 0,01
Predictors: (Constant),dependency, income
2 0,74 0,55 0,49 166,13 0,22 7,99 0,01
Offences against
computer
Predictors: (Constant), dependency 1 0,64 0,41 0,36 13,75 0,41 8,38 0,01
Results presented in table 3, largely confirm the results of bivariate analysis. The parameterized model is an equation function of the main factors of crime that can be used as ‘predictors’. The model is particularly good for theft (R square = 0.85, p-value <=0,01), while it is not enough convincing for burglary, fraud, offences against the computer. In this case, the significance is not sufficient to explain and predict crimes, but it can be useful to give some suggestions on the social indicators to monitor.
ISSN 2039-9340 Mediterranean Journal of Social Sciences Vol. 3 (11) November 2012
180
This model reveals significant effects of ‘female employment’ on traditional property crimes. In addition, ‘part time’, ‘Gini coefficient’, ‘poverty’ are significant for theft. These predictors have low multicollinearity between them. Increase in theft is associated with a decline in ‘Gini coefficient’ and increase in ‘female employment’ and ‘part time’, while the increase in burglary is associated with the increase in ‘female employment’. These effects are consistent with the opportunity interpretation: whereby decrease in unemployment increases criminal opportunities as homes are left unguarded, whereby increase in female employment increases criminal opportunities because homemakers had the guardianship responsibilities (Cantor & Land, 1985; Cohen & Felson,1979). However, indicators that are significant in bivariate correlation, may become not significant in a multiple regression model (e.g. ‘material deprivation’ for theft, ‘part time’ for burglary). Economic conditions have a secondary effect on fraud, no effect on offences against the computer, while the population structure is the main element to predict new property crimes. ‘Old age dependency ratio’ is positively correlated to fraud and offences against computer. It means that old people are at higher risk of becoming victims of new property offences: they can be victims of fraudulent practices in particular if they are dependent on care or are otherwise disadvantaged or vulnerable or without relationships to protect themselves and their property (Hirshi, 1969). Ending, the model highlights two important elements to monitor that can help to predict property crimes: firstly, rising ‘female employment’ increases traditional criminal opportunities; secondly, rising ‘old population’ increases elderly vulnerability as victims. 5. Conclusions Bivariate results show that traditional property crimes (theft, burglary) are positively correlated to the ‘number of part time contracts’, ’female employment’ and the ‘proportion of young population,’ while they are negatively correlated to ‘Gini coefficient’. New property crimes (fraud, offences against the computer) are positively correlated to the ‘number of part time contracts’, the ‘proportion of old population’ and ‘old age dependency ratio’.
These elaborations highlight some significant outcomes. Firstly, traditional property crimes are both linked to economic indicators that well explain the poverty and the labour dimension, while new property crimes are linked to economic indicators that well describe the labour dimension. Secondly, traditional property crimes are linked to the proportion of young age population, while new property crimes are linked to the elderly indicators (‘proportion of old age population’ and ‘old age dependency ratio’).
The focal point is that while traditional property crimes are correlated to the offender dimension, new property crimes are correlated to the victim dimension.
Economic and demographic indicators interact in the regression model. It highlights the most significant social indicators for each crime category.
There are factors that have a double effect: on one hand, they may increase criminal opportunities, on the other hand, they may decrease crime. The use of multiple statistics helps to discover these effects and combine several factors. The equilibrium changes. Social indicators that are significant in bivariate correlation disappear in multiple models a cause of multicollinearity.
Old property crimes are related to economic conditions; new property crimes are related to the population structure (‘dependency’ in particular). The economic dimension survives in fraud (‘income’ as predictor), but it totally disappears in offences against the computer.
The regression model confirms and draws attention to the contrast between offender on one hand and victim, on the other hand. The first is related to motivations and features that behave a person to commit a crime with a high degree of probability; the latter is related to those features that identify a person as particularly vulnerable to crime. The mean volume of delinquency may take advantage in the high proportion of potential victims (Farrington, 1986). Economic conditions are strong indicators to monitor, describe and predict traditional property crimes at European level but they are poor indicators for new property crimes. Population structure is the first point to provide indications on new property crimes, but it is necessary to address the analysis through new directions because other factors may be associated with new property crimes.

ISSN 2039-9340 Mediterranean Journal of Social Sciences Vol. 3 (11) November 2012
181
APPENDIX APPENDIX A –Definitions A1 - Offences selected for the analysis
CRIME DEFINITION Theft According to the standard definition, theft means depriving a person/organisation of property without force with the
intent to keep it. Where possible, the figures include: – minor (e.g. low value) theft (even if subject to proceedings outside the criminal justice system); – burglary; – theft of motor vehicles; – theft of other items; – attempts; but exclude: – embezzlement (including theft by employees); – robbery (see above); – receiving/handling stolen goods.
Burglay According to the standard definition, burglary means gaining access to a closed part of a building or other premises by use of force with the intent to steal goods. Where possible, the figures include: – theft from a factory, shop, office, etc.; – theft from a military establishment; – theft by using false keys; – attempts; but exclude: – theft from a car; – theft from a container; – theft from a vending machine; – theft from a parking meter; – theft from a fenced meadow/compound.
Fraud According to the standard definition, fraud means deceiving someone or taking advantage of someone’s error with the intent to unlawfully gain financial benefits, thereby causing the deceived person to enter any operation that will be damaging to his/her or a third person’s financial interests. Where possible, the figures include: – minor (e.g. low value) fraud (even if subject to proceedings outside the criminal justice system); – attempts; but exclude: – receiving/handling stolen goods; – money laundering; – forgery of documents, passports etc.; – forgery of money/payment instruments; – tax and customs offences; – subsidy fraud; – fraud involving welfare payments; – computer fraud (i.e. deception of a computer instead of a human being); – consumer goods or services; – breaching of trust/embezzlement.
Offenses against computer
According to the standard definition, offences against the confidentiality, integrity and availability of computer data and systems comprise unauthorised entry into electronic systems (computers) or unauthorised use or manipulation of electronic systems, data or software. Where possible, the figures include: – illegal access (i.e. intentional access to a computer system without right, e.g. ‘hacking’); – illegal interception (i.e. interception without right, made by technical means, of non-public transmissions of computer data); – data interference (i.e. damaging, deletion, deterioration, alteration or suppression of computer data without right); – system interference (i.e. serious hindering without right of the functioning of a computer system); – misuse of devices (i.e. production, sale, procurement for use, import, or distribution of a device or a computer password/access code); – computer fraud (i.e. deception of a computer instead of a human being); – attempts; but exclude: – illegal downloading of data or programs.
Source: adapted from Aebi M. et al (2010), European Sourcebook of Crime and Criminal Justice Statistics, WODC, Den Haag.

ISSN 2039-9340 Mediterranean Journal of Social Sciences Vol. 3 (11) November 2012
182
A2 - Social indicators selected for the analysis
Social indicator Definition Code
unemployment rate Unemployed persons as a percentage of the labour force. The labour force is the total number of people employed and unemployed. unemployment
employment female 15-64 The number of women aged 15 to 64 in employment divided by the total population of the same age group.
female employment
persons employed part time Number of persons employed part time. part time
people at risk-of-poverty threshold The threshold is set at 60 % of the national median equivalised disposable income (after social transfers). It is expressed in Purchase Parity Standards (PPS) in order to take into account differences in cost of living across EU Member States.
poverty
Gini coefficient The relationship of cumulative shares of the population arranged according to the level of equivalised disposable income, equivalised total disposable income received by them.
Gini coefficient
income quintile share ratio The ratio of total income received by the 20 % of the population with the highest income (top quintile) to that received by the 20 % of the population with the lowest income (lowest quintile).
income
material deprivation the indicator is defined as the percentage of population with an enforced lack of at least three out of nine material deprivation items in the 'economic strain and durables' dimension.
material deprivation
women per 100 men number of women per 100 men women proportion population aged 65 and over of total population
number of population aged 65 and over divided by total population old people
proportion population aged 15-24 of total population
number of population aged 15-24 divided by total population young people
old age dependency ratio number of persons of an age when they are generally economically inactive over the number of persons of working age dependency
Source: adapted from Eurostat, data available at: http://epp.eurostat.ec.europa.eu/portal/page/portal/statistics/themes
B1 - Economic indicators summary statistics in European countries – year 2007
Social indicator N Mean Median Std. Deviation Minimum Maximum
unemployment 27 6,4 6,1 2,0 3,6 11,1 part time 27 14,3 11,8 9,9 1,7 46,8 female employment 27 59,1 60,6 8,5 35,7 73,2 poverty 27 7498,9 7871,0 3555,6 1726,0 16108,0 Gini coefficient 27 29,7 29,8 4,3 23,2 37,8 income 27 4,8 4,4 1,2 3,3 7,8 material deprivation 27 20,9 14,3 16,6 3,0 72,4
B2 - Economic indicators summary statistics in European countries – year 2007
Social indicator N Mean Median Std. Deviation Minimum Maximum
women 27 18,27 17,30 6,00 8,70 34,40 old population 27 15,81 16,00 2,19 10,90 19,90 young population 27 13,24 12,80 1,64 10,20 15,90 dependency 27 23,25 24,10 3,61 15,80 30,20

ISSN 2039-9340 Mediterranean Journal of Social Sciences Vol. 3 (11) November 2012
183
B3 - Crimes Correlation in European countries – year 2007
Correlations Parameter (1) (2) (3) (4) 1. theft Pearson Correlation 1 0,79** 0,75** 0,31
Sig. (2-tailed) . 0,00 0,00 0,28 2. burglary Pearson Correlation
1 0,46 -0,05
Sig. (2-tailed)
. 0,08 0,88 3. fraud Pearson Correlation
1 0,70**
Sig. (2-tailed)
. 0,01 4. offences against computer Pearson Correlation
1
Sig. (2-tailed) .
*Significance 0.05 level **Significance 0.01 level B4 - Social indicators Correlation in European countries – year 2007
Correlations Parameter (1) (2) (3) (4) (5) (6) (7) (8) (9) (10) (11) 1. unemployment Pearson
Correlation 1 -0,34 -0,44* -0,40* 0,10 0,14 0,26 0,05 0,17 0,01 0,14 Sig. (2-tailed) . 0,08 0,02 0,04 0,61 0,49 0,19 0,81 0,41 0,96 0,49
2. part time Pearson Correlation 1 0,49** 0,65** -0,26 -0,31 -0,62** 0,28 0,09 -0,43* 0,18 Sig. (2-tailed) . 0,01 0,00 0,18 0,12 0,00 0,16 0,64 0,02 0,36
3. female employment
Pearson Correlation
1 0,27 -0,13 -0,17 -0,26 0,32 0,08 -0,05 0,13
Sig. (2-tailed)
. 0,17 0,50 0,40 0,19 0,10 0,67 0,80 0,52
4. poverty Pearson Correlation
1 -0,43* -0,52** -0,77** 0,03 -0,04 -0,52** 0,06
Sig. (2-tailed)
. 0,02 0,01 0,00 0,90 0,85 0,01 0,77
5. Gini coefficient Pearson Correlation
1 0,97** 0,54** 0,15 0,23 0,24 0,18
Sig. (2-tailed)
. 0,00 0,00 0,47 0,25 0,22 0,36
6. income Pearson Correlation
1 0,64** 0,21 0,27 0,22 0,21
Sig. (2-tailed)
. 0,00 0,30 0,18 0,27 0,29
7. material deprivation
Pearson Correlation
1 0,02 -0,04 0,49** -0,12
Sig. (2-tailed)
. 0,94 0,85 0,01 0,55
8. women Pearson Correlation
1 0,41** -0,35 0,46*
Sig. (2-tailed)
. 0,03 0,07 0,02
9. old population Pearson Correlation
1 -0,58** 0,99**
Sig. (2-tailed)
. 0,00 0,00
10. young population
Pearson Correlation
1 -0,62**
Sig. (2-tailed)
. 0,00
11. dependency Pearson Correlation
1
Sig. (2-tailed) . *Significance 0.05 level **Significance 0.01 level

ISSN 2039-9340 Mediterranean Journal of Social Sciences Vol. 3 (11) November 2012
184
References
Aebi, M.F., Aubusson de Cavarlay, B., Barclay, G., Gruszczynska, B., Harrendorf, B., Heiskanen, M., et al. (2010). European sourcebook of crime and criminal justice statistics – 2010. 4th edition. Den Haag: Boom Juridische Uitgevers. Available online at: ttp://english.wodc.nl/onderzoeksdatabase/europeansourcebook-4e-editie.aspx?cp=45&cs=6796.
Aebi M. F., Linde A. (2010). Is There a Crime Drop in Western Europe?, European Journal on Criminal Policy and Research. Vol. 16 pp. 251–277.
Aebi, M.F. (2008). Measuring the influence of statistical counting rules on cross-national differences in recorded crime. Aromaa K. and Heiskanen M. (Eds.). Crime and criminal justice systems in Europe and North America 1995-2004. pp. 196-214. Helsinki: HEUNI. Available online at: http://www.heuni.fi/43087.htm.
Ahearn E., (2008). The Effect of Divorce and Unemployment on Crime in the 25 Most Populated US States. Available online at: http://econ651spring2008.wikispaces.com/file/view/Regression+Analisys_update_+03.03.08.doc
Allen R.C. (1996). Socioeconomic Conditions and Property Crime: A Comprehensive Review and Test of the Professional Literature. The American Journal of Economics and Sociology. Vol. 55, No. 3 (Jul., 1996), pp. 293-308.
Altindag D.T. (2011). Crime and Unemployment: Evidence from Europe. Economic Papers. Department of Economics, Louisiana State University.
Aureli E. (2002). Lezioni di statistica sociale, Fonti, strumenti e metodi. CISU, Roma. Aureli E. (2002). Lezioni di statistica sociale, Dati e indicatori. Vol.1-2,CISU, Roma. Becker G.S. (1968). Crime and punishment: an economic approach. Journal of political economy. Vol. 106, pp. 407-443. Bolasco S. (1999). Analisi multidimensionale dei dati. Carocci. Britt C. (1997). Reconsidering the Unemployment and Crime Relationship: Variation by Age Group and Historical Period. Journal of
Quantitative Criminology. Vol. 13, pp. 405-428, Springer. Cantor D., Land, K. C. (1985). Unemployment and crime rates in the post-World War II United States: A theoretical and empirical
analysis. American Sociological Review. Vol. 50, pp. 317-332. Cohen L. E., Felson M. (1979). Social change and crime rate trends: a routine activity approach. Urbana American Sociological Review.
Vol. 44 (August), pp. 588-608. Dzemydiene D., Rudzkiene V. (2003). Data Analysis Strategy for Revealing Multivariate Structures in Social-Economic Data
Warehouses. Informatica. Vol. 14, No. 4, pp. 471–486. Ehrlich I. (1973). Participation in Illegitimate Activities: A Theoretical and Empirical Investigation. Journal of Political Economy. Vol.
81(3), pp. 521-565. Entorf H., Spengler H. (2002). Crime in Europe – causes and consequences. Springer, Heidelberg. European Commission for the Efficiency of Justice (CEPEJ) (2010) - Evaluation report of European judicial systems Efficiency and
quality of justice. European Union Statistics on Income and Living Conditions (2011). Data available online at: http://epp.eurostat.ec.europa.eu/portal/page/portal/microdata/eu_silc European Union Statistics on Income and Living Conditions (2006). Available online at:
http://www.cso.ie/releasespublications/documents/eu_silc/current/eusilc.pdf Eurostat (2011). Unemployment statistics. Available online at:
http://epp.eurostat.ec.europa.eu/statistics_explained/index.php/Unemployment_statistics. Eurostat (2010). Eurostat yearbook. Available online at:
http://epp.eurostat.ec.europa.eu/portal/page/portal/publications/eurostat_yearbook_2010 Fabbris L. (2003). Statistica multivariata analisi esplorativa dei dati. The Mc Graw – Hill Companies. Farrington D. P., (1986). Unemployment, School Leaving, and Crime. British Journal of Criminology, Delinquency and Deviant Social
Behaviour. Vol. 26:4, p.335-356. Felson M. (1993). Social indicators for Criminology. Journal Research in crime and delinquency. Vol. 30 n. 4, pp. 400-411. Greenberg D.F. (2001). Time Series Analysis of Crime Rates. Journal of Quantitative Criminology. Vol. 17, pp. 291-327. Greenberg D.F. (1985). Age, Crime, and Social Explanation. American Journal of Sociology Vol. 91, No. 1, pp. 1-21. Gottfredson M., Hirschi T. (1990). A general theory of crime. Stanford University Press, Stanford, CA. Hagan E.F. (2002). Research methods in criminal justice and criminology. Boston, Allin and Bacon. Hirschi T. (1969). Causes of delinquency. Berkley, University of California Press. Hirschi T., Gottfredson M. (1983). Age and the Explanation of Crime. American Journal of Sociology Vol. 89, No. 3, pp. 552-584. Imrohoroglu A., Merlo A., Rupert P. (2004). What Accounts for the Decline in Crime? International Economic Review. Vol. 3(08), pp. 707-
729. Kapuscinski C.A., Braithwaite J., Chapman B.(1998). Unemployment and Crime: Toward Resolving the Paradox. Journal of Quantitative
Criminology, Vol. 14, No. 3, pp. 215-243. Killias M., Aebi M. F. (2000). Crime trends in Europe from 1990 to 1996: how Europe illustrates the limits of the American experience.
European Journal on Criminal Policy and Research Vol. 8: pp. 43–63. Labour Force Survey (2011 ). Data available online at:
http://epp.eurostat.ec.europa.eu/portal/page/portal/employment_unemployment_lfs/publications/results Labour market statistics (2011). European Commission. Available online at: http://epp.eurostat.ec.europa.eu/cache/ITY_OFFPUB/KS-32-11-798/EN/KS-32-11-798-EN.PDF

ISSN 2039-9340 Mediterranean Journal of Social Sciences Vol. 3 (11) November 2012
185
Levitt S. D., Lochner L. (2001). The Determinants of Juvenile Crime, in Risky Behavior among Youths: An Economic Analysis, pp. 327-374.
Livi Bacci M., (1999). Introduzione alla Demografia. Loescher, Torino. Micheli G., Manfredi P. (1996). Matematica della popolazione. ed. Franco Angeli. Noll H. H. (2004). Social Indicators and Quality of Life Research: Background, Achievements and Current Trends, in Advances in
Sociological Knowledge Over Half a Century. N. Genov, Verlag für Sozialwissenschaften. Paternoster R., Bushway S.D. (2001). Theoretical and Empirical Work on the Relationship Between Unemployment and Crime. Journal
of Quantitative Criminology, Vol. 17, No. 4, pp.391-407. Rizzi A. (1992). Inferenza Statistica. UTET Università, Roma. Rosenfeld R. (2009). Crime is the Problem: Homicide, Acquisitive Crime, and Economic Conditions, in Journal of Quantitative
Criminology Vol. 25, pp. 287-306. Rosenfeld R., Messner S. F., (2009). The crime drop in comparative perspective: the impact of the economy and imprisonment on
American and European burglary rates. The British Journal of Sociology Vol. 60 Issue 3, pp. 445-461. Smith M. D., Devine J. A., Sbeley J. F. (1992). Crime and unemployment: Effects across age and race categories. Sociological
Perspectives Vol. 35, pp. 551-572. Steffensmeier D. J., Allan E.A., Harer M.D., Streifel C. (1989). Age and the Distribution of Crime. American Journal of Sociology, Vol.
94, No. 4, pp. 803-831. Van Dijk J. et al (2005). The Burden of crime in the EU – Research report: a comparative analysis of the European crime and safety
survey. EUICS. Von Hofer H. (2000). Crime Statistics as Constructs: The Case of Swedish Rape Statistics. European Journal on Criminal Policy and
Research Vol. 8/1, pp. 77-89. Vettori B. (2010). Le statistiche sulla criminalità in ambito internazionale europeo e nazionale : fonti e tecniche di analisi con SPSS. LED,
Milano.


ISSN 2039-9340 Mediterranean Journal of Social Sciences Vol. 3 (11) November 2012
187
Speech Act of Responding to Compliments:
A Study of Verbal Politeness Strategies of Spanish and Italians
Pilar Robles Garrote
Sapienza University of Rome, Italy Faculty of Philosophy, Letters, Humanistic Sciences, and Oriental Studies
Email: [email protected]
Doi:10.5901/mjss.2012.v3n11p187
Abstract: This paper aims to provide empirical data relating the verbal politeness strategies used by Italian and Spanish speakers to one of the speech acts: complimenting. More specifically, the objective of the present study is to classify and contrast the different resources used in the responses to the compliments analyzed, taking as independent variable the nationality of the participants. The data for the investigation was collected by carrying out a corpus of 400 responses to compliments obtained from a questionnaire in which 100 Italian and Spanish participants had to react to compliments in various everyday situations. Afterwards, the responses were classified according to the different strategies and the percentage of the presence or absence of the diverse typologies was determined from the answers obtained. The results reveal that both Spanish and Italian informants utilize as a preferential resource the acceptance of the compliment, but it is observed that there are some differences in the selection of variants of this superstrategy. Keywords: sociolinguistics, speech acts, compliment responses, verbal politeness strategies, foreign language teaching 1. Introduzione L’apprendimento delle lingue straniere in genere persegue uno scopo prevalentemente comunicativo, di rapporto interculturale, che coinvolge, oltre la conoscenza delle regole grammaticali, anche la consapevolezza dei codici linguistici inerenti alle regole di cortesia con cui le persone interagiscono tra loro. Nel caso delle lingue affini, a prima vista, si potrebbe presupporre che non esistono grandi problemi comunicativi, tuttavia possono sorgere alcune confusioni dovute non a errori grammaticali nel discorso, bensì a errori pragmatici, che evidenziano le differenze culturali tra gli interlocutori. La conoscenza delle particolarità interculturali in quanto alla cortesia verbale, pertanto, risulta molto importante per un adeguato sviluppo della competenza comunicativa1
Gli errori di tipo pragmalinguistico possono danneggiare seriamente il contatto sociale tra emittente e ricevente. Così, ad esempio, l’uso incorretto del congiuntivo da parte di un interlocutore di madre lingua diversa della spagnola non influisce negativamente nel rapporto di interazione con l’interlocutore, tuttavia, non rispettare le regole di cortesia verbale contiene una potenziale minaccia per quel rapporto
e per portare a buon fine i rapporti sociali, poiché l’ignoranza di queste può provocare dei fraintendimenti che porterebbero alla distorsione della comunicazione tra i parlanti di diverse culture. In effetti, secondo Haverkate (1996:45):
2
Guil (2007:34) avverte che le divergenze tra le lingue e le culture affini, essendo molto più sottili di quelle tra le culture molto distanti, sono più difficili da individuare. A questo proposito, l’autrice ci ricorda che tra la cultura italiana e quella spagnola c’è una grandissima affinità nata da contatti storici molto frequenti che “provoca negli utenti di tutte e due le comunità culturali una percezione di vicinanza, sia linguistica che culturale, che ha il rischio di favorire l’applicazione dei
.
1 Secondo Canale e Swain (1980) la competenza comunicativa consta di cuattro sottocompetenze: la linguistica, la sociolinguistica, la discursiva e la strategica. Questo studio si occupa della competenza sociolinguistica, chiamata anche “competenza socioculturale” da Miquel (2004). 2 “Errores de tipo pragmalingüístico pueden perjudicar seriamente el contacto social entre emisor y receptor. Así, por ejemplo, el empleo incorrecto del subjuntivo por un hablante no nativo del español no influye negativamente en la relación interaccional con el interlocutor; faltar a las normas de cortesía verbal, en cambio, encierra una amenaza potencial de esa relación”. (Haverkate, 1996:45).

ISSN 2039-9340 Mediterranean Journal of Social Sciences Vol. 3 (11) November 2012
188
propri schemi interpretativi all’altra realtà culturale” (Calvi 1995, 2004, citato da Guil, 2007)3
Malgrado i numerosi studi che negli ultimi tempi hanno affrontato l’argomento della cortesia verbale, sembra chiaro che serva ancora un approfondimento esaustivo e globale su questi aspetti dell’ambito della pragmatica utili a fornirci dei dati empirici che ci permettano di individuare le differenze che possono provocare confusione in questo senso, per poi portare in aula la riflessione sulla propria identità sociale. In questo lavoro cerchiamo di analizzare alcune abitudini di italiani e spagnoli riguardo la cortesia verbale accennando al complimento, uno degli atti linguistici definiti nella tassonomia di Haverkate (1994) più frequenti nelle culture mediterranee, e di studiare concretamente le diverse strategie usate per rispondere ai complimenti nelle diverse situazioni della vita quotidiana. Fare un complimento consiste nello stemperare gli atti linguistici che potrebbero minacciare l’immagine pubblica
. In altre parole, quando si tratta di culture così vicine è facile cadere nella comodità della traduzione letterale sia della lingua che delle abitudini sociali in cui si manifestano le formule di cortesia, compromettendo a volte le relazioni interpersonali a causa della predisposizione generale a presupporre la somiglianza interculturale. Tale atteggiamento impedisce l’individuazione, nel confronto di certi comportamenti sociali, di falsi amici che, oltre ad investire il più evidente aspetto lessicale, coinvolgono anche l'ambito socioculturale.
4 (Choi, 2008:169) e dalla prospettiva della teoria della cortesia, presuppone un chiaro esempio di cortesia positiva secondo il modello di Brown & Levinson (1987): “Il parlante, quando emette un complimento, cerca di stabilire un territorio emotivamente comune con il suo interlocutore, facendolo sentire bene, e ciò corrisponde alla prima strategia della cortesia positiva” (Ibidem). 5 Così il complimento agisce come un rinforzo di solidarietà tra interlocutori (Manes, 1983), ma la risposta a questo atto linguistico “rappresenta un dilemma per il parlante, giacché deve sostenere due principi conversazionali diametralmente opposti: non contraddire l’interlocutore e nello stesso tempo evitare l’autoelogio” (Siebold, 2008:121).6
Purtroppo nella letteratura in sociolinguistica specializzata su questo argomento, si trovano ancora pochissimi lavori di ricerca che comparano la cultura spagnola o la italiana con altre culture e i dati forniti da questi studi danno informazioni su entrambe le culture in modo separato
7
. Questo lavoro non ha la pretesa di fare una generalizzazione sui comportamenti in queste due culture, ma di compiere un primo avvicinamento empirico in questo campo che mostri dei dati invece di presupporre delle somiglianze culturali. Nelle pagine seguenti vedremo le strategie utilizzate dai partecipanti italiani e spagnoli per affrontare il dilemma delle risposte ai complimenti (da qui in avanti RC).
2. Metodologia Il presente studio nasce da un esercizio svolto durante una lezione di lettorato di lingua spagnola presso l’Università degli Studi La Sapienza di Roma, nella quale si richiedeva una breve riflessione sull’importanza della cortesia verbale nell’apprendimento delle lingue straniere, nel caso specifico dello spagnolo. Nell’esercizio gli studenti dovevano rispondere a un questionario di struttura tripartita che comprendeva un test di risposta multipla sulle abitudini sociali, un piccolo questionario a risposte aperte in cui si doveva rispondere a diversi complimenti e un sondaggio d’opinione sulla cortesia verbale. Dato l’interesse suscitato tra gli studenti e la scarsità di studi comparativi di questo tipo tra la cultura italiana e quella spagnola nella letteratura specializzata in sociolinguistica, si è deciso di ampliare il numero dei partecipanti, aggiungendo anche degli informanti di nazionalità spagnola, al fine di avere un campione congruo e poi confrontare i risultati ottenuti. Per la natura di questo studio abbiamo preso come dati da analizzare unicamente quelli ottenuti dalla seconda parte del suddetto questionario, benché si commentino brevemente anche i dati ottenuti dal sondaggio sulla cortesia verbale.
3 “Precisamente esta afinidad provoca en los usuarios de ambas comunidades una percepción de vecindad, tanto lingüística como cultural, que tiene el peligro de favorecer la aplicación de los propios esquemas interpretativos a la otra realidad cultural” (Calvi, 1995, 2004). 4 Goffman (1967) sostiene che abbiamo un’immagine propria e una pubblica (face) vincolata al prestigio sociale e alla richiesta di riconoscimento dell’essere umano da parte della società. Secondo questo autore l’individuo deve cercare di proteggere la propria immagine sociale e quella dell’interlocutore per mantenere un equilibrio sociale. 5 “El hablante, al emitir un cumplido, lo que intenta es establecer un territorio emocionalmente común con su interlocutor, haciéndole sentirse bien, lo cual corresponde a la primera estrategia de la cortesía positiva" (Choi, 2008:169). 6 “La respuesta a un cumplido representa un dilema para el hablante, puesto que tiene que acordar dos principios conversacionales diametralmente opuestos, como son los principios de no contradecir al interlocutor y al mismo tiempo evitar el autoelogio” (Siebold, 2008:121). 7 Studi sulle risposte ai complimenti con partecipanti spagnoli ovvero italiani sono quelli effettuati da: Lorenzo-Dus (2001) spagnoli e inglesi; Corbacho (2005) spagnoli in lingua spagnola (L1) e inglese (L2); Siebold (2008) spagnoli e tedeschi; Choi (2008) spagnoli e coreani; Alfonzetti (2009) italiani; Gommans (2010) italiani e olandesi.

ISSN 2039-9340 Mediterranean Journal of Social Sciences Vol. 3 (11) November 2012
189
2.1. Domande di ricerca e ipotesi In questo lavoro si è tentato di verificare quali sono le diverse strategie di RC usate dai partecipanti italiani e spagnoli, nonché di scoprire se ci sono delle coincidenze tra le risorse usate nelle risposte dei due gruppi di studio ed evidenziare le somiglianze o differenze riscontrate. Nonostante le culture mediterranee abbiano una percezione simile della cortesia verbale e una tendenza verso la cortesia di carattere positivo (Sifianou, 1999 citato da Haverkate, 1996), in questo studio si parte dall’ipotesi che esistono delle variazioni nelle strategie scelte nelle RC, che dipendono dalle caratteristiche idiosincrasiche inerenti alla cultura dei campioni. Per inquadrare la direzione di questo studio sociolinguistico, sono state definite le seguenti domande di ricerca: a) Quali strategie usano i partecipanti italiani e gli spagnoli per rispondere ai complimenti? b) Se ci sono delle strategie comuni, ci sono delle differenze nella frequenza di utilizzo in quanto ai diversi tipi di complimenti? 2.2. Metodologia di ricerca e strumenti di rilevazione dei dati Sebbene la natura di questo studio sia di carattere qualitativo, la raccolta dei dati è stata svolta attraverso una metodologia di ricerca quantitativa per la quale si è utilizzato un questionario di domande aperte, prendendo come modello di base quelli usati negli studi di Blum Kulka, House e Kasper (1989), utilizzati posteriormente in molti lavori di ricerca sulla cortesia verbale 8 . Nel questionario sono state presentate quattro situazioni comunicative della vita quotidiana a cui i partecipanti hanno dovuto reagire anonimamente, creando un corpus di 400 RC che è servito come base per l’analisi delle diverse strategie di RC in relazione ad una sola variabile indipendente: la nazionalità degli informanti9
- L’aspetto fisico
. Nella Figura 1 si descrivono le situazioni proposte, in cui i partecipanti hanno dovuto rispondere a diversi complimenti riferiti a quattro particolari concetti:
- Ciò che si possiede - Le abilità personali - Il risultato/prodotto di un’abilità personale
Anche se i due ultimi tipi di complimenti sembrano molto simili, appartengono a due categorie diverse perché il risultato di un’abilità personale non sempre dipende da quest’ultima e, pertanto, le reazioni ai complimenti di questi due tipi potrebbero essere diverse10. Figura 1
SITUAZIONE 1 (aspetto fisico)
Arrivi in ufficio e un tuo collega di lavoro ti dice che oggi sei bellissima. Che cosa le rispondi?
SITUAZIONE 2 (ciò che si possiede)
Stai parlando con la tua vicina di casa e lei ti dice che le piace moltissimo la tua camicia. Che cosa le rispondi?
SITUAZIONE 3 (abilità personale)
Hai cominciato un corso di francese di livello intermedio e uno dei tuoi compagni di classe ti dice che parli molto bene in quella lingua. Che cosa gli rispondi?
SITUAZIONE 4 (risultato di un’abilità)
Un tuo amico è a cena da te e ti dice che il piatto che hai preparato è veramente delizioso. Che cosa gli rispondi?
A complemento di questo studio e al fine di motivare la riflessione didattica, si è domandato agli informanti che cosa
8 Questi autori utilizzarono una tecnica chiamata “The Discourse Completion Test: DCT” (Test per il completamento del dialogo), che consiste nella presentazione di diverse situazioni simulate a cui gli informanti devono reagire in forma scritta. 9 Il presente lavoro si concentra sulla classificazione delle diverse strategie usate dagli informanti unicamente in relazione alla nazionalità, ma in future ricerche di queste caratteristiche sarebbe interessante studiare anche variabili indipendenti come il sesso, l’età o il luogo di residenza. 10 Nel caso dell’ultima situazione proposta nel questionario, l’abilità personale sarebbe cucinare, ma l’oggetto di lode non è l’abilità come cuoco, ma il piatto risultante dalla preparazione. Per esempio, potrebbe darsi che un bravissimo cuoco prepara un piatto che non viene bene (l’abilità di solito c’è, ma il risultato in questo caso non è buono) ovvero che una persona che non sa cucinare prepara un piatto delizioso dopo aver seguito una ricetta (l’abilità solitamente non c’è, ma il risultato in questo caso è buono).

ISSN 2039-9340 Mediterranean Journal of Social Sciences Vol. 3 (11) November 2012
190
intendessero con il termine ‘cortesia’ e si è somministrato loro un sondaggio d’opinione11
con una scala Likert di 5 punti, in maniera tale da ottenere alcuni dati relativi all’approccio dei partecipanti verso questo aspetto.
2.3. Campione e partecipanti Il campione analizzato era composto da un corpus di 400 RC date da 100 informanti, uomini e donne, di nazionalità italiana e spagnola (49 spagnoli e 51 italiani) di età compresa tra i 20 e i 50 anni. Il corpus analizzato è stato composto dalle RC ottenute dalle reazioni degli informanti alle quattro situazioni proposte, risultando una somma totale di 196 risposte dei partecipanti spagnoli e 204 risposte dei partecipanti italiani. 2.4. Procedimento Una volta compilati tutti i questionari, le risposte sono state separate in base alla nazionalità dei partecipanti al fine di confrontare i risultati dei due gruppi di studio in piani separati, per procedere sucesivamente all’osservazione e all’analisi delle RC e alla formulazione delle conclusioni. In seguito tutte le risposte sono state classificate in quanto alle diverse strategie utilizzate e, infine, sono state conteggiate le RC in ogni categoria. Le diverse strategie di RC utilizzate dagli informanti vengono categorizzate nelle quattro superstrategie12
Negli studi precedenti sulle RC in cui si è studiato il comportamento di soggetti italiani o spagnoli in modo separato, la superstrategia predominante per entrambi è sempre stata quella di accettare, ma secondo Matte Bon (2004) “un italiano tollera i complimenti meglio di uno spagnolo e li accetta perfino con un “grazie” in contesti in cui uno spagnolo tenderebbe a rifiutarli o a giustificarsi”
che si spiegano di seguito: SUPERSTRATEGIA 1: Accettare - Ringraziare: Si accetta il complimento solamente ringraziando - Accettare e dare spiegazioni sul complimento - Esprimere accordo - Esprimere gioia sull’opinione dell’interlocutore - Scherzare: strategia per deviare l’attenzione del complimento SUPERSTRATEGIA 2: Restituire - Restituire il complimento - Offrire l’oggetto di lode SUPERSTRATEGIA 3: Deviare - Dare spiegazioni senza accettare o rifiutare chiaramente - Dubitare del complimento SUPERSTRATEGIA 4: Rifiutare - Rifiutare il complimento direttamente - Togliere valore all’oggetto di lode: si rifiuta indirettamente mitigando la risposta. È doveroso chiarire che nella tassonomia di Chen (1993) la strategia spiegare è considerata unicamente una variazione della superstrategia deviare; tuttavia, nel corpus analizzato si è rilevato un numero considerevole di risposte che accettano il complimento aggiungendo delle informazioni sull’oggetto di lode e, pertanto, non formano parte della superstrategia deviare, ma di quella accettare. È per questo motivo che questa categoria è stata inserita anche nella prima superstrategia.
13
11 Nel sondaggio si doveva indicare il grado di accordo/disaccordo sulle seguenti affermazioni: 1. Conoscere le norme di cortesia di altre culture è importante. 2. Mi interessa conoscere le abitudini delle altre culture. 3. Conoscere le regole di cortesia di altre culture risulta utile per evitare confusioni. 4. L’ignoranza di alcune differenze di comportamento in una cultura può provocare degli approcci negativi verso i nativi di quella cultura. 12 Classificazione delle strategie di cortesia verbale nelle RC di Chen (1993:53) con alcune modifiche per le caratteristiche delle risposte del campione. 13 “El italiano tolera mejor los cumplidos que el español, e incluso los acepta con un “grazie” en contextos en los que el español tendería a rechazarlos o a justificarse” (Matte Bon, 2004:14)
. Di seguito si riportano i risultati del confronto tra queste due culture latine paragonando le strategie di RC usate dai campioni nelle stesse situazioni.

ISSN 2039-9340 Mediterranean Journal of Social Sciences Vol. 3 (11) November 2012
191
3. Analisi dei risultati 3.1 Tassonomia delle risposte I dati contenuti nelle Figure 2 e 3 quantificano le risposte di tutti i partecipanti classificando ognuna di queste in quanto alla tipologia del complimento a cui rispondono e alle diverse superstrategie e strategie anteriormente descritte.
3.2 Confronto delle strategie usate dai partecipanti italiani e spagnoli Come si può vedere nella Figura 4, i dati forniti dal corpus di RC mettono in evidenza che spagnoli e italiani hanno reagito alle situazioni proposte in un modo molto simile, anche se con delle differenze che verranno in seguito
Figura 2: Classificazione delle risposte dei partecipanti italiani
SUPERSTRATEGIA
Aspe
tto fi
sico
Ciò
che s
i pos
siede
Abilit
à pe
rson
ale
Prod
. abi
lità
pers
onal
e
TOTA
LE
1. Accettare 39 40 24 48 151
Ringraziare 34 11 7 18 70 Esprimere accordo 1 1 - - 2 Esprimere gioia 1 - 1 14 16 Accettare e dare spiegazioni 1 28 16 12 57
Scherzare 2 - - 4 6
2. Restituire 8 4 2 - 14
Restituire il complimento 8 4 2 - 14
Offrire l’oggetto di lode - - - - -
SUPERSTRATEGIA
Aspe
tto fi
sico
Ciò
che s
i pos
siede
Abilit
à pe
rson
ale
Prod
. abi
lità
pers
onal
e
TOTA
LE
3. Deviare - 6 4 1 11 Dare spiegazioni - 6 2 1 9 Dubitare - - 2 - 2
4. Rifiutare 4 1 21 2 28 Rifiutare il complimento 4 - 9 1 14
Togliere valore all’oggetto di lode - 1 12 1 14
TOTALE 51 51 51 51 204
Figura 3: Classificazione delle risposte dei partecipanti spagnoli
SUPERSTRATEGIA
Aspe
tto fi
sico
Ciò c
he si
poss
iede
Abilit
à per
sona
le
Prod
. abi
lità
pers
onale
TOTA
LE
1. Accettare 35 34 19 39 127
Ringraziare 24 7 8 16 55 Esprimere accordo 1 2 - - 3 Esprimere gioia - - 1 7 8 Accettare e dare spiegazioni 4 23 10 14 51
Scherzare 6 2 - 2 10
2. Restituire 4 1 4 4 13
Restituire il complimento 4 1 4 - 9 Offrire l’oggetto di lode - - - 4 4
SUPERSTRATEGIA
Aspe
tto fi
sico
Ciò c
he si
poss
iede
Abilit
à per
sona
le
Prod
. abi
lità
pers
onale
TOTA
LE
3. Deviare 1 6 5 5 17 Dare spiegazioni - 6 3 5 14 Dubitare 1 - 2 - 3
4. Rifiutare 9 8 21 1 39 Rifiutare il complimento 8 1 12 - 21 Togliere valore all’oggetto di lode 1 7 9 1 18
TOTALE 49 49 49 49 196

ISSN 2039-9340 Mediterranean Journal of Social Sciences Vol. 3 (11) November 2012
192
prospettate. La superstrategia predominante in entrambi i gruppi di studio è l’accettazione, anche se la percentuale del campione italiano (74%) è 9 punti più alta rispetto a quello spagnolo (65%). La seconda superstrategia più usata è stata rifiutare con una differenza di 6 punti (14% italiani e 20% spagnoli), la terza deviare (5% italiani, 9% spagnoli) e in fine restituire è risultata la superstrategia meno scelta con un 7% nei due campioni.
Di seguito si presenta la classificazione generica di tutte le varianti di queste superstrategie, organizzate in relazione alla frequenza di utilizzo, alle quali si aggiunge qualche esempio relativo alle risposte dei partecipanti.
Strategie dei campioni italiani 34 % Ringraziare : “Grazie” , “Grazie mille”, “Grazie, sei molto gentile”. 28 %
Accettare e dare spiegazioni: “Grazie. L’ho comprata in questo negozio”, “Grazie, me l’ha regalata il mio ragazzo”, “Grazie, mi piace tanto cucinare”.
8 % Esprimere gioia: “Mi fa piacere che ti piace”, “Sono contento”.
7 %
Restituire il complimento: “Grazie, anche tu stai benissimo”,, “Anche la tua è molto carina” “Grazie, anche tu sei molto bravo”. Togliere valore all’oggetto di lode: “Mica tanto”, “Si può fare di meglio”, “Non costava tanto”, “Ancora ho tanto da imparare”, “Questa? Ce l’ho da tanto tempo”. Rifiutare il complimento: “Che dici! Non è vero”, “Grazie, ma sinceramente non lo credo”.
4 % Dare spiegazioni: “L’ho studiato a scuola”, “Mi piace tanto questa lingua”, “Mia madre è francese”. 3 % Scherzare: “Io sono sempre bello ;)”14, “Grazie, mia madre cucina molto bene”
1 % Esprimere accordo: “Ti piace? Anche a me” Dubitare: “Pensi?”
Strategie dei campioni spagnoli
28 % Ringraziare: “Gracias”, “Muchísimas gracias, guapo”. 27 %
Accettare e dare spiegazioni: “Gracias. La compré en la tienda...”, “Gracias, la he comprado en las rebajas”, “Es nueva, gracias”, “Esta receta me la enseñó…”.
11 % Rifiutare il complimento: “No es cierto”, “Si hablara tan bien estaría en un curso superior”, “¡Qué va! Ya me gustaría”.
9 % Togliere valore all’oggetto di lode: “No será para tanto”, “Será que me ves con buenos ojos”, “No es nada del otro mundo, es normalita”.
7 % Dare spiegazioni: “El truco es...”, “Pues me he puesto lo primero que he pillado en el armario”, “¿Te gusta? Es de Zara”.
5 % Scherzare15: “Se agradece el piropo, pero ¿Sólo hoy?”, “Ya veo que hoy no te has puesto las gafas” Restituire il complimento: “Gracias, tú también”, “Tú también lo haces muy bien”.
4 % Esprimere gioia: “Me alegro de que te guste”. 2% Offrire l’oggetto di lode: “Si te ha gustado puedes repetir”, “¿Quieres más?”.
1% Esprimere accordo: “Gracias... sí, hoy me siento guapa”. Dubitare: “¿En serio?”.
14 Il campione non dice esplicitamente che la risposta è ironica, ma alla fine di questa include un’icona per fare capire in modo grafico che sta scherzando. 15 In questa categoria uno dei partecipanti, oltre a rispondere, ha spiegato il motivo di aver scelto lo scherzo come strategia: “se lo agradezco y lo acompaño de alguna broma para no parecer presumido” (ringrazio e inserisco qualche scherzo per non sembrare presuntuoso). Sebbene accada sul piano dell’inconsapevolezza, il soggetto mantiene la tendenza a curare la propria immagine positiva per non cadere in un comportamento non accettato socialmente e cerca strategie per camuffare l’accettazione del complimento, mantenendo così ciò che Leech (1983) ha denominato “massima di modestia”.

ISSN 2039-9340 Mediterranean Journal of Social Sciences Vol. 3 (11) November 2012
193
Volendo effettuare una lettura globale della frequenza delle diverse strategie nelle RC, emerge che, sebbene ci siano delle variazioni nelle posizioni e nei valori numerici, le due più usate sono sempre varianti della superstrategia principale, accettare. Così ringraziare sarebbe la scelta primaria sia per gli italiani (34%) che per gli spagnoli (28%) e dopo di questa accettare e dare spiegazioni (28% italiani, 27% spagnoli). Dalla terza posizione in poi, invece, i dati evidenziano che le scelte delle strategie più frequenti dei partecipanti sono diverse; per esempio, come terza strategia gli italiani hanno usato di più esprimere gioia (8%), una delle varianti di accettare, mentre gli spagnoli hanno preferito in una percentuale più alta rifiutare i complimenti (11%). I risultati generali mostrano inoltre che i due gruppi coincidono anche nelle le due strategie meno usate, cioè, esprimere accordo e dubitare (entrambi 1%). Nonostante la superstrategia più utilizzata dai due gruppi sia stata accettare, si osserva che quando lo studio si concentra sui diversi oggetti di lode ci sono delle variazioni, in alcune occasioni molto marcate, nelle strategie usate dai campioni. Di seguito si espongono i risultati ottenuti in quanto ai diversi tipi dei complimenti.
Fig 5. Complimenti sull’aspetto fisico
Nel grafico della Figura 5 si osserva che, per quanto riguarda i complimenti sull’aspetto fisico, le percentuali della superstrategia accettare sono abbastanza simili (76% italiani e 71% spagnoli), essendo solo 5 punti più alta la percentuale degli italiani. In questa categoria entrambi i gruppi hanno utilizzato ringraziare come strategia predominante tra quelle derivate dalla principale. Restituire è stata la seconda strategia più scelta dagli italiani (16%) e rifiutare dagli spagnoli (18%), un numero di risposte 10 punti più alto di quelle degli italiani (8%), che invece hanno preferito rifiutare come terza scelta, mentre gli spagnoli hanno usato la funzione restituire (8%). Da rilevare il fatto che in questa categoria gli informanti italiani non hanno usato deviare a differenza degli spagnoli (2%).
Fig 6. Complimenti su ciò che si possiede
In relazione ai complimenti su ciò che si possiede, riportati nel grafico della Figura 6, in generale si mantiene la stessa tendenza riscontrata nei complimenti sull’aspetto fisico. Vediamo che la superstrategia accettare continua ad essere la preferita nelle risposte (78% italiani e 69% spagnoli) e gli italiani sono quelli che la usano più frequentemente, anche se in questo caso la differenza è più grande: 9 punti. Invece, la seconda superstrategia più usata dagli italiani sarebbe deviare (12%) e dagli spagnoli rifiutare (16%). Al terzo posto gli italiani hanno preferito restituire (8%) e gli spagnoli deviare (12%), al contrario che nell’ultima superstrategia, dove gli italiani hanno scelto rifiutare e gli spagnoli restituire, entrambi con un 2%.

ISSN 2039-9340 Mediterranean Journal of Social Sciences Vol. 3 (11) November 2012
194
Fig 7. Complimenti sulle abilità personali
I dati ottenuti dalle RC sulle abilità personali sono, senza dubbio, quelli più particolari di questa indagine. Il grafico della Figura 7 rivela che nei complimenti di questo tipo ci sono delle grosse differenze per quanto riguarda la scelta delle quattro superstrategie. La superstrategia accettare continua ad essere la più usata dagli italiani, ma in una percentuale significativamente inferiore in confronto alle altre tipologie di complimenti (una differenza di 30 punti circa). Gli spagnoli in questo caso hanno invece tolto il primo posto all’accettazione utilizzando il rifiuto come strategia più usata (43%), seguita da accettare con un 39%. L’opzione più diffusa dopo quest’ultima è stata deviare con un 8% per gli italiani e un 10% per gli spagnoli, mentre la strategia meno usata dagli italiani è stata restituire con un 4%, in confronto all’8% degli spagnoli. In questo tipo di RC si sono trovate tante risposte combinate del tipo “Grazie, ma devo migliorare”, in cui dopo il ringraziamento si toglie valore all’oggetto di lode, eclissando così il vero valore dell’accettazione. Per cercare di risolvere il dilemma di cui parlavamo all’inizio, entrano in gioco ancora una volta le regole sociali specifiche di queste due culture riguardo all’immagine pubblica: per rifiutare il complimento (e mantenere la propria immagine positiva) senza contraddire l’interlocutore (evitando contemporaneamente di danneggiare l’immagine positiva di questo) si mitiga l’impatto del rifiuto attenuandolo con un ringraziamento precedente.
Fig 8. Complimenti sui risultati prodotti dalle abilità personali
La Figura 8 mostra che anche nelle RC sui prodotti risultanti dalle abilità personali, le percentuali differiscono dalla media generale. La quasi totalità degli italiani ha scelto accettare come strategia preferita (96%) e un numero insignificante ha utilizzato deviare (2%) o rifiutare (4%) come risposta al complimento. Le risposte degli spagnoli, invece, non sono state così accentuate (con una percentuale di 16 punti più bassa degli italiani) e benché ci sia un chiaro predominio dell’accettazione rispetto agli altri tipi di complimento (80%), un 10% devia la risposta dando spiegazioni sull’oggetto di lode, ma senza accettare il complimento direttamente. Soltanto i campioni spagnoli hanno scelto offrire l’oggetto di lode (8%) come variante di restituire e solamente nel caso dei complimenti per il risultato di un’abilità personale. La superstrategia meno usata dai due campioni è stata rifiutare (4% italiani, 2% spagnoli). 3.3. Alcune considerazioni degli informanti sulla cortesia Il sondaggio d’opinione sulla cortesia compilato dagli informanti evidenzia che tutti, senza eccezione, mostrano un approccio molto positivo verso l’apprendimento di questo aspetto della pragmatica, considerandola necessaria nei rapporti sociali, poiché aiuta a promuovere e mantenere la cordialità tra le persone. Si mostra di seguito un piccolo esempio delle risposte date dagli informanti alla domanda “che cos’è per te la cortesia?”: “La cortesia è una qualità importante nelle persone perché le rende più cordiali e socievoli”, “regole d’educazione e rispetto”, “gentilezze che rendono la vita più piacevole”, “trattare gli altri in modo educato”, “modi di fare gradevoli”, “norme sociali”, “rispetto verso gli altri”, “buone parole”, “trattare bene le persone”, “fare sentire a proprio agio”, “empatia”, “ringraziare e chiedere scusa”, “sapersi comportare per vivere in armonia”, ecc.

ISSN 2039-9340 Mediterranean Journal of Social Sciences Vol. 3 (11) November 2012
195
In quanto alle domande riferite alle regole di cortesia delle altre culture, i dati ottenuti evidenziano una buonissima disposizione dei partecipanti verso questo aspetto. La grande maggioranza di questi ha manifestato un grande interesse a conoscere le abitudini sociali di altre culture, considerando importante la consapevolezza delle relative norme di cortesia per evitare confusioni tra le persone di diverse culture.
In questo studio non si è parlato delle strategie proprie del linguaggio non verbale, dato il limite derivato dall’utilizzo di un questionario come metodo di raccolta dei dati16, ma è chiara la rilevanza anche di questo aspetto nell’uso della cortesia, poiché i gesti, il tono della voce, la posizione del corpo, ecc. possono rinforzare o attenuare l’approccio dell’interlocutore e anche cambiare il significato del messaggio, dando nuove sfumature al senso delle parole. Infatti, alcuni degli informanti hanno voluto completare le loro risposte dando delle spiegazioni sul linguaggio non verbale che avrebbero usato per reagire alle situazioni proposte al fine di potenziare il ringraziamento “Rispondo “grazie” con un sorriso”, ovvero per mitigare il rifiuto al complimento “Gli dico: “grazie, ma non lo credo” (in modo gentile)”17
.
4. Conclusioni ed implicazioni didattiche I risultati di questo studio, così come quelli di precedenti ricerche, mostrano che in linea generale sia gli informanti spagnoli che quelli italiani scelgono prevalentemente strategie di accettazione e ringraziamento, seppur constatando che la predisposizione ad accettare i complimenti è più alta nei campioni italiani mentre gli spagnoli hanno una tendenza superiore al rifiuto. Sebbene la lettura globale dello studio indichi che le strategie dei campioni spagnoli e italiani rispondono alle regole di cortesia positiva appartenenti alle culture mediterranee, come affermava Sifianou (1999), si è osservato che quando il complimento ricade sulle proprie abilità personali c’è una divisione importante tra accettare e rifiutare in entrambi i gruppi di studio. Tuttavia, se il complimento non ricade direttamente sulle abilità ma sul risultato visibile di quelle abilità, si mantiene la superiorità dell’accettazione come superstrategia predominante. La motivazione dei risultati in questo tipo di complimento potrebbe essere relazionata con la percezione di una minaccia all’immagine pubblica perché si parla di concetti più astratti 18
In conclusione, è opportuno evidenziare che la riflessione sulla propria identità sociale in confronto ad altre realtà socioculturali favorisce le attitudini di solidarietà e tolleranza, giacché aiuta a capire meglio e a rendersi conto che la maggior parte dei comportamenti relativi alla cortesia si apprendono nel contesto sociale ed hanno un impatto diretto sulle relazioni interpersonali. Data l’importanza della consapevolezza delle regole culturali e del contesto sociale, la conoscenza delle implicazioni nell’uso della cortesia verbale nell’apprendimento delle lingue straniere risulta indispensabile; in considerazione di ciò, in questo studio si sostiene la necessità di integrare contenuti didattici che riguardino questo aspetto della sociolinguistica nei programmi di insegnamento delle lingue straniere, poiché “una classe di lingua costituisce uno spazio idoneo per sviluppare riflessioni ed esercizi di sensibilizzazione sui diversi atteggiamenti quotidiani propri di una cultura” (Guil, 2009:295).
che vengono valutati dal criterio personale sulle proprie capacità, mettendo più a rischio l’immagine positiva, mentre i prodotti risultanti dalle abilità personali, essendo più concreti, hanno una carica soggettiva più leggera. Comunque, non sono presenti sufficienti evidenze empiriche tali da formulare affermazioni categoriche, ma si ritiene possa essere interessante estrapolare i dati qui ottenuti per approfondire in uno studio successivo le motivazioni per cui le percentuali corrispondenti all’accettazione e al rifiuto di entrambi i gruppi sono così differenti in questo tipo di complimento.
19
Bibliografia Alfonzetti, G. (2009). I complimenti nella conversazione. Roma: Editori Reuniti University Press. Blum-Kulka, S.; House, J & Kasper, G. (1989). Cross-cultural pragmatics: requests and apologies, Norwood, NJ, Ablex. Brown, P. & Levinson, S. (1987). Politeness: some universals in language usage. Cambridge, Cambridge University Press. Canale, M. & Swain. M. (1980) Theoretical Bases of Communicative Approaches to Second Language Teaching and Testing. In Applied
Linguistics. Nº 1, pp 1-47. Chen, R. (1993). Responding to compliments. A contrastive study of politeness strategies between American English and Chinese
speakers. In Journal of Pragmatics, pp. 49–75.
16 Anche se il presente studio non riguarda questo aspetto, si ritiene importante che in future ricerche si consideri di effettuare un’analisi dei dati quantitativi qui studiati con altri ottenuti attraverso differenti metodologie di ricerca. 17 Risposta tradotta di uno dei campioni spagnoli:“Le digo que gracias pero que no me lo creo (en plan bien)”. 18 La valutazione delle abilità personali (cucinare, ballare, cantare, ecc.) è più generale poiché non riguarda soltanto il risultato di un momento concreto che potrebbe variare per diversi motivi, ma anche una visione complessiva dell’abilità. 19“Una clase de lengua constituye un espacio idóneo para desarrollar actos de reflexión y ejercicios de sensibilización a los diferentes comportamientos cotidianos propios de una determinada cultura” (Guil, 2009:295).

ISSN 2039-9340 Mediterranean Journal of Social Sciences Vol. 3 (11) November 2012
196
Choi, H. J. (2008): Pragmática intercultural: el acto de habla del cumplido en las culturas española y coreana. Tesi di Dottorato (PhD), Universidad Complutense de Madrid, Facultad de Filología. Disponibile in http://eprints.ucm.es/8311/ [Data di consultazione: 10/11/2011]
Fernández Corbacho, A. (2005). Las respuestas a cumplidos como fenómeno lingüístico. Análisis contrastivo de español (L1) e inglés (L2). In Acta Universitatis Palackianae Olomucensis. Katedra Romanistiky, Univerzita Palackého v Olomouc. Pp. 57-65.
Goffman, E. (1967). Interaction ritual. Essays on face-to-face behavior. New York, Doubleday. Haverkate, H. (1994). Cortesía Verbal: estudio pragmalingüístico. Madrid: Gredos. Haverkate, H. (1996). Estrategias de cortesía. Análisis intercultural. In Actas del VII Congreso ASELE. Gommans, L.J.P (2010): Fare e ricevere complimenti: una ricerca comparativa tra Olanda e Italia. Tesi di Master, Universiteit Utrecht.
Disponibile in http://igitur-archive.library.uu.nl/student-theses/2010-0217-200319/UUindex.html [Consultato il 21/11/2011] Guil Povedano, P. (2007). Cortesía lingüística en el aprendizaje-enseñanza del italiano L2. In Cuadernos de Filología Italiana. Vol. 14,
pp. 33-58. Disponibile in: http://dialnet.unirioja.es/servlet/articulo?codigo=2502270 [Data di consultazione: 21/11/2011] Guil Povedano, P. (2009). La vertiente social de la cortesía: castellano-italiano. Pedro Ladrón de Guevara et al. (eds.). Homenaje al
profesor Trigueros Cano. Murcia: Universidad de Murcia, Servicio de Publicaciones, pp. 277-295. Leech, G. (1983). Principles in Pragmatics. London: Longman. Lorenzo-Dus, N. (2001). “Compliment responses among British and Spanish university students: A contrastive study”. Journal of
Pragmatics. 33, pp. 107-127. Manes, J. (1983). Compliments: a mirror of cultural values. In Wolfson, N. y Judd, E. (eds.), Sociolinguistics and language acquisition,
Rowley, MA, Newbury House, pp. 96-102. Matte Bon, F. (2004). Análisis de la lengua y enseñanza del español en Italia. In Revista RedELE, número 0. Disponibile in:
http://www.sgci.mec.es/redele [Data di consultazione: 11/11/2011] Miquel, L (2004) “Lengua y cultura desde una perspectiva pragmática: algunos ejemplos aplicados al español” Revista electrónica de
didáctica de Español Lengua Extranjera RedELE nº 2. Disponibile in http://www.educacion.gob.es/redele/revistaRedEle/2004/ tercera.html [Data di consultazione: 11/10/2011]
Siebold, K. (2008): Actos de habla y cortesía verbal en español y en alemán: Estudio pragmalingüístico e intercultural. Frankfurt am Main: Peter Lang.

ISSN 2039-9340 Mediterranean Journal of Social Sciences Vol. 3 (11) November 2012
197
A Comparative Analysis Between The Hairy Ape and Emperor Jones
by Eugene O'Neill from Expressionism Viewpoint
Zahra Yousefi Nezhad (Corresponding Author)
MA in English Literature, Islamic Azad University-Arak Branch, Arak, Iran Email: [email protected]
Moussa Ahmadian
Associated professor, Department of English Language and Literature,
Faculty of Arts and Humanities, Arak University, Email: [email protected] [email protected]
Doi:10.5901/mjss.2012.v3n11p197
Abstract: Expressionism in literature was a revolutionary movement against realism and naturalism. As a twentieth century movement, it is the subject of the inner world. Like most artistic movements, it is applied to lots of art forms including Paintings, Architecture, Cinema, and Music. Dramatists like Elmer Rice and Eugene O'Neill introduced Expressionism to American Literature. This paper is a comparative study of O'Neill's The Hairy Ape and Emperor Jones based on expressionism viewpoint. Its aim is to find the expressionistic features and to compare the similarities and differences between these two works. The features and principles of expressionism in drama include: structure (for example, one-act play), main focus on protagonist and his inner conflicts, tragic ending, unnamed minor characters, employing music and light (as two prominent features of expressionism), applying symbols and colors, monologue and soliloquy or telegraphic dialogue, etc. In this paper, these were features of analysis. The research revealed the fact that there are similarities and differences between the two pieces of drama in question. Although the two plays, Emperor Jones and The Hairy Ape written by one author (Eugene O'Neill) and in one period of his life (1920-1921), and both are known as expressionist works, still there are some differences in applying expressionistic features. The similarities and differences are discussed followed by some suggestion for further research. Keywords: Expressionism, Drama, Emperor Jones, The Hairy Ape, Eugene O'Neill 1. Introduction Expressionism is a modern movement started in the twentieth century. The movement shifted the writers' attention from the external world to human internal reality. To make Expressionism more clear, it should be better to define the term's etymology. The term Expression consists of two parts, the prefix "ex" meaning out and "pression" meaning crush and push. This has lots of meanings in European languages such as: assert, declare, or representing one's mode; also it is synonym for inner mode and finally means press like squeezing a fruit to get nectar. The term expressionism indeed has these last meanings. (Seyed Hosseini, 2006).
As a literary movement of the beginning of twentieth century, it draws the writers attention in almost all literary genres, especially poetry and drama. O'Neill is one of those modern playwrights who was influenced by this movement. He wrote Emperor Jones in 1920 and The Hairy Ape in 1921 based on this art movement. O'Neill won the Nobel Prize in 1936. This paper aims to make a comparison between O'Neill's The Hairy Ape and Emperor Jones from the view point of expressionism to see the extent to which features of expressionism can be traced in each of the two plays. First a method of analysis based on the features and principles of expressionism is established. Then two intended plays will be compared according to the model to find out the similarities and differences. Next, the specified similarities and differences will be discussed. 2. Background There were two journals in Germany which published Expressionism works (poetry and prose) Der Strum (The Storm, appears in 1910) and the second, Die Aktion (The Action in 1911). They enter prose to expressionism. In expressionism, the most influential literary form of writing was drama. The expressionism theatre started in Germany and walked to

ISSN 2039-9340 Mediterranean Journal of Social Sciences Vol. 3 (11) November 2012
198
American stage afterward. In 2009, Walker explains: "German Expressionism predate the development of the American stage unitl many of the American plays, had been written and in some instances already produced." (p.5) Manuel (2005) has done a research project reviewing Emperor Jones from the viewpoint of expressionism which is similar to this paper's model, but there is no comparison to other works by O'Neill. Another study is O'Neill's "the Emperor Jones and Modernism's encounter with Africa" written by Gabriele Poole (1996). He paid particular attention to meta-textual relationship between black discourse and the play's expressionistic form. None of the above mentioned studies aims to do a comparative analysis between the works of these pioneers, particularly O'Neill from the view point of expressionism. The question is "What are the similarities and differences between The Hairy Ape and Emperor Jones by Eugene O'Neill as two expressionistic plays?" To reach the goal of this paper, firstly it is necessary to observe the features and principle of expressionism drama. Then the mentioned feature will help in reviewing the extended works here O'Neill's The Hairy Ape and Emperor Jones with this model. The following table shows features and principles of expressionism. The features are mainly taken from Yeganeh (2002) and Styan (1981) in the table, other sources include: Abrams (2005), Dukes (1924) and Grande (1948). These features and principles can be sources for the analysis of The Hairy Ape and Emperor Jones. Table 1. Features and principles of Expressionism
Features of Expressionism Principles of Expressionism
1 Dreamlike / Nightmarish atmosphere Nightmarish atmosphere intensify the inner conflict of the protagonist
2 & 3
Non-realistic distorted lighting and costumes The human spirit was the basic shaper of reality. Therefore, surface appearance was important only because it reflected an inner vision. To portray these views dramatist used distorted stage sets, lighting and costumes
Distortions in the stage set
4 Pauses and silence of unusual length in dialogues, short jerky speeches, staccato, telegraphic sentences.
Dialogues may suddenly change from prose to hymnic poetry interrupting the action completely. They might change to gesture, or even to pantomime
5 Monologue. Sometimes a whole scene is a monologue. Characters do not talk to but talk about each other or in the absence of each other
Characteristic of its language: repetition, variation, echoes, and clash of single words. Monologues used to show the loneliness of the character, characters which detached from society.
6 Soliloquy In late 18th and 19th Century, soliloquy became "out of fashion" when drama shifting toward realism but Expressionism which rose as a movement opposed to realism used it as one of its main features.
7 The protagonist (usually representing a group or class) was the victim of a nightmarish industrial society.
Dramatists often show the influence of modern psychology by revealing the inner frustrations. They show characters in the grip offer.
8 Typification in characterization, exaggerated caricature characters Symbolic characters
Character lost their individuality. They reduced in type. They represent social group
9 Film-like sequence Structure of the play was split into a lot of episodic scenes in film-like sequence.
10 Alone/ alienated characters The dramatists try to penetrate the surface of reality, to penetrate man's soul
11 Using music, sound effect Chorus, masks, dances
One feature which helps to intensify and reveal inner mind is using music and sound effect. Also The artists seek the expedients of the classical art of the theatre like choruses and masks.
12 Distorted objects, primitive or exaggerated characters.
Expressionists accomplish their aim through distortion, exaggeration, primitivism, and fantasy.
13 Machine-like movements, representing industrialization and mechanized people
Prominent theme is the industrial society captivated human soul and turn people into a machine and there is no way to escape.

ISSN 2039-9340 Mediterranean Journal of Social Sciences Vol. 3 (11) November 2012
199
3. Analysis and Discuss Now, using the above model, the two plays by O'Neill The Hairy Ape and the Emperor Jones will be read and analyzed. Expressionism Analogy between The Hairy Ape and The Emperor Jones In Scene III of The Hairy Ape, O'Neill describes Yank. "…Pounding on his chest, gorilla-like…" (p. 20). Also, Mildred calls him "the filthy beast" (p.21) which makes Yank feels insulted. From the beginning, the descriptions and situation tends to make Yank feels that he is really a hairy ape. As in the last scene, at the zoo, he feels brotherhood with the gorilla in the cage. The title of the play is directly about the protagonist of the play. This is exactly the same as the second play (Emperor Jones). The title of The Emperor Jones refers to the protagonist. Both plays consist of eight scenes. According to Table1, Structure of the expressionistic plays splits into a lot of episodic scenes. In The Emperor Jones with the exception of scene I (which is not as short as others), all the scenes are quite short. O'Neill uses soliloquy and monologue for protagonist from scene two until the death of Jones (the first and the last scenes serve as frame). In the first drama, The Hairy Ape, O'Neill used long monologue especially in scene eight. Also, in other scenes such as scenes one and six there are monologues.
Physically, both protagonists of the plays are similar. In portraying Yank, O'Neill describes him heftier than other characters, and writes: "He seems broader, fiercer, more truculent, more powerful, more sure of himself than the rest." (The Hairy Ape, Scene I). He is more powerful among other workers in the ship. Jones, the protagonist of Emperor Jones is also: "a tall powerfully-build, full-blood Negro". O'Neill highlights the protagonist of the two plays not only by focusing on their action but also with showing enlargement and strength of the protagonists. As caricaturists enlarge, exaggerate or distort prominent qualities and features of a figure. They are untidy characters. Yank, contrary to his co-workers, does not take a bath. He is untidy and careless to his appearance. This is perhaps because of the situations which he had after Mildred's insult. The situation in Jungle gives the neat Emperor a nasty look.
Gupta (2001:33) writes about the physical similarities between these two protagonists: "He (Yank) resembles Brutus Jones in the primitiveness of his nature, but whereas the primitiveness of Jones is spiritual that of Yank is entirely physical". Perhaps Gupta underestimates describing the process of Jones dress and claims this is just spiritual. O'Neill purposefully emphasizes on Jones's dress in each scene.
One of the common characteristics of expressionism used by lots of expressionist dramatis (As Elmer Rice and Georg Kaiser)1
1 See Yassami (2010)
Usually the plays end in tragic form.
14 Distorted objects and actions in order to represent them as they appeared in the inner mind
The realists have a weakness for asking questions about life. The expressionists have a preference for answering them. The difference is fundamental. It is the difference between the study of a phenomenon and the presentation of an idea. The realists are interested in ideas only insofar as they produce phenomena, and the expressionists are interested in phenomena only insofar as they interpret thought. Hence "an expressionist play appears distorted, overwrought, neurotic, or even insane to mind of the realist (Dukes, 120).
15 Foreshadowing, Denouement
"One technique, common to all dramatists, but often invoked by the expressionist, is the use of the denouement as the dramatic recall. Dramatic recall points back to the objects, circumstances, or motifs which have been prepared for by the process of foreshadowing." (Grande, 24)
16 Tragic death, or ending for the main character As a character is representative of a group, his suffering is agonizing of a class.
17 exploring themes such as poverty, corruption, loneliness and sorrow
Expressionists address the human condition as they saw it. They often saw human condition as empty half of the glass.
18 anonymous human types There are at most one individual character.(mostly the main character) Others are typified characters which created by using numbers, role and job for naming characters.

ISSN 2039-9340 Mediterranean Journal of Social Sciences Vol. 3 (11) November 2012
200
Auctioneer (Emperor Jones). Also dramatists use more ambiguous names as the people of The Fifth Avenue, Voices… . This technique is like a painting which depicts and concentrates on one figure, and makes the others vague, put them on shadow, used indefinite forms and no details of them.
Yank is not a nice or polite character. He is rude. He lacks the rules of etiquette. In the Fifth Avenue, he is offensive toward men and women. He tells the secretary in I.W.W. that he aims to explode steel factory with dynamites. So like Yank, Jones is not a favorite emperor of people. Even the people once made an attempt on Emperor's life. Jones's cruelty and injustice imply for the killing Jeff. Jones is mischievous, deceiving Negros by creating the false superstitious of silver bullet. All the characteristics along with denying his race at the beginning make Jones an unpleasant character.
These plays are tragedy in one act. They end in tragic death of the protagonists. The journey of both characters (Yank and Jones) leads to their tragic death. Actually, they kill themselves whether knowingly leading to self-annihilation or their societies put them on the way of death. Yank is killed in the cage by gorilla, when the gorilla gives him a murderous hug Yank. Jones is killed by Lem's soldiers. There is nothing about Lem or gorilla before the last scenes. O'Neill creates them firstly, to be the killers of the first character, and secondly, to show they murdered to whom they thought belong. Yank thought he belongs to the group of apes while it was wrong, as Jones accepts his race when it was too late. Also, Jones is his own greatest enemy. According to Gabriel Poole (1996): "Jones’ pride is the hubris of a tragic hero who views his superiority as indisputable. Jones may indeed be his own greatest enemy. That is the fate of tragic heroes. They succumb not to other people’s fatal flaws, but their own." (p. 24) The theme of distinction whether class distinction or racism (as a distinction between white and colored) is common in both plays, as explained for each under the title of themes. Lem, a minor character in the second play, as a negro is described (a heavy-set, ape-faced, old savage of the extreme African type). Being in jail for both characters (Yank and Jones) happens. It reveals in the Emperor Jones that he has killed his jailor; Yank wished to destroy the steel factory, he told the secretary: "Dynamite! Blow it often all the cages, all the factories, steamers, buildings, jails- the Steel Trust and all that make it go" (The Hairy Ape: 226).
Music in expressionistic dramas acts like a character. There is meaning behind music. O'Neill has subtly used music in both plays, for example, the beating of the drums in Emperor Jones, or the chorus of monkeys after Yank's death in The Hairy Ape. Music appears as expressionistic means in these plays. The Tom-Tom of natives drum which is sign of revolution and war reminds the heart beats of Jones. They increasingly became quicker and louder throughout the climax. After death of Jones, the drums stopped. The rhythmic shoveling of stockers in the ship is another expressionistic music. It implies the mechanical action of the stockers. The whistle sound to stop or terminate the work develops the idea of assuming them as machine or robots. Even the "Voices" responding the last word of Yank emphasizes that O'Neill treated them like machines.
Expressionist dramas devise symbols. O'Neill in both plays includes lots of symbols. Rodin the thinker, steel, ape in The Hairy Ape, silver bullet, white stone, formless fears in the Emperor Jones. This technique enriches the meaning beneath layers of expressionistic plays. The symbols in these plays are in a way related to the main characters. White stone which is a sign for hidden foods of Jones in jungle; Rodin, the thinker, which is the process of self-knowing of Yank's connected to the protagonists of both plays.
The atmospheres of the plays are gloomy and dark, terrifying, and stressful. Lighting as a notable characteristic of expressionism, symbols, rhythmic music of drums beat heightened the stressful atmosphere and bold Jones's fright. As "the rhythmic sound [of drums] helps the audience to share the emotion of terrified Negro" (Blackburn, 1941:114), the dark jungle has intensified this feeling. Gloomy atmosphere, using Music, lighting, symbols, long monologue, stage direction, typified characterization, explore and dig in subconscious of the protagonist, and focusing on them are expressionistic features which were applied to these play.
Some differences in expressionistic features can be revealed in the plays, one of them is the theme. The theme of reaction against modern bourgeois class is applied to The Hairy Ape. The miseries which lead Yank (symbolized the working class) to death brought to him by Mildred and steel factory (symbolized the bourgeois class in industrialization, and capitalism), contrary to the tragic flaw of Jones which is mostly back to his own actions. Plot in Emperor Jones is not quietly in order. Using memories, dream sequences and shift in time are characteristics of Expressionistic works' plots. O'Neill employed this technique as visions of Jones in darkness. One obvious example is the vision of Jeff and monologue of Jones about killing him while they were playing. All the actions of Emperor Jones happened in one day which is the last day of Jones life, while The Hairy Ape happened within some months.
is creating anonymous characters. To label them, dramatists use numbers (like Second Engineer in The Hairy Ape), the role or job which they hold in the play (Like Prisoners, secretary in IWW (The Hairy Ape), Prison guard,

ISSN 2039-9340 Mediterranean Journal of Social Sciences Vol. 3 (11) November 2012
201
3.1 Highlighting two Prominent Expressionistic Features: Typification and Monologue Literary speaking typification means representation of a type character. Carl Dahlström (1980:66) writes: "Typification is a necessity in Expressionistic drama…". According to Table1, characters lose their individuality and reduce to a type. For example, in this play, the audience in the first sight will recognize Mildred as the rich, stock character who wants to show her generosity with helping poor. The phrase "other half" in scene II, or "filthy Beast" (addressing Yank) in scene III are representative of the fact that she draw a line between the bourgeois class and other half.
In creating the characters of the play, O'Neill uses typification. Yank, the main character, is type of a primitive or as he used the word in the play in describing protagonist "Neanderthal Man". Primitivism is also an expressionist feature (refer to Table1, No.11). As a typified character, Yank symbolizes a universal struggle of man toward his fate. Mildred and her aunt are also type characters. O'Neill represents the aunt as a caricaturistic character. Her behavior is artificial. Even in creating the people in The Fifth Avenue, the writer uses Typification technique. These people portrayed as robots who just repeat the word beg your pardon and take their way. Other elements coming from "Ausstrahlungen des Ichs" are the monologue and the aside, elements that fell greatly into dispute in the naturalistic period. Both the monologue and the aside are quite legitimate and genuine elements of Expressionistic drama. The inclusion of these two elements is determined by a philosophy of drama, whereas their exclusion is occasioned by the attempt to reproduce observed objective reality, a mechanics of drama. (Dahlström, 1980:66) The main character has long monologues. Conversations to other characters in the ship's forecastle are more like monologue than dialogue. In Scene one, the worker repeats Yank's words in a chorus and mockingly. Scene four is "plainly the mind of Yank audibly sensible in a long monologue punctuated by the chorus of sailors who repeated his last word: all love, all law, all governments, all gods" (The Hairy Ape: 87). In the prison and in The Fifth Avenue, the situations are almost the same; it means monologue is more dominant than dialogue. And the last scene of the play which sets in the zoo is two pages of soliloquy by Yank. In the last four scenes, O'Neill uses long monologue apart from stage directions, scene eight is just a monologue. Mudanjiang (2009:11) writes about Monologue employed by O'Neill: "Monologue is another device frequently employed by O'Neill. Traditionally, monologue is not paid enough attention to by playwrights in the world of drama history who emphasize on characterization. O'Neill develops it and makes some improvements on it. Especially, in the last four expressionist scenes, there are large paragraphs of monologue in each scene." 3.2. Language in The Hairy Ape O'Neill's language in The Hairy Ape is offensive, clipped and abounding in repetition. Certain Expressions like "I belong", "I'll fix her", "I'm the end" and "that's me" are often repeated. These clipped and truncated phrases effectively belong to the reader "a sense of the storm and stress" (Uma, 2010:263). According to Table1, a principle of expressionism is Characteristic of its language which is: repetition, variation, echoes, and clash of single words. Clash of "I belong", "they don't belong", addressing to the first class, are heard repeatedly through the play. This language is another document of using expressionism features in the play. In the first scene, Yank's monologues as Grande (1984:83) describes "are the voice of the entire crew, they are colloquial, realistic, crude, often vulgar." O'Neill chose such a language for the protagonist to show his inferiority and the class distinctions. The statement of the first class in the fifth avenue is "Beg your pardon" aside from the mechanical repetition of this sentence by all the churchgoers, it can show their differences by just the use of language. 3.3 Themes in The Hairy Ape In the modern industrial world, Yank loses his identity. He is in search of his belongingness and identity. People's action in the play is mechanical, fierce with no sympathy. One obvious example is Scene Five which describes churchgoers in the Fifth Avenue, with mechanical movements. They even do not notice the struggle of Yank with a gentleman. The play shows the dehumanizing cruel society. O'Neill as an expressionist tries to show the human conditions, loneliness of the characters and sorrow. Struggle of Man Towards his Fate: Another theme is obviously the struggle of man toward his fate. Eventually, Yank failed; his failure shows universal notion of man's failure in modern world. This theme has given the tragic concept to the
ISSN 2039-9340 Mediterranean Journal of Social Sciences Vol. 3 (11) November 2012
202
play. After insulted by Mildred, Yank struggles to find his belonging everywhere. "O'Neill concluded that he had dramatized a universal theme: the subject here is the same ancient; the one that always was and will always be the one subject for drama, and that is man and his struggle with his own fate" (Grassner, 1965:20). Class Distinction/Conflict: The other notable theme is class distinction or conflict. In Scene Five, Yank and Long in The Fifth Avenue notice windows of jeweler and furrier stores. Long became angry for the prices, they were almost equal to their voyages, even the prices were equal to one year feeding of a family. Yank seems impressed by the diamonds and monkey furs but admits they do not belong. Long told him before that he should be angry with the whole bourgeois class not just Mildred. This was only one example for the theme of class conflict; of course, there are more examples in the play. 3.4 Highlighting two expressionist features: Monologue/soliloquy and adhering music Jones is full of fear in the jungle for six scenes. No one really exists to talk to him. He speaks a long monologue. There are some visions of his mind but none of them speaks. Jeff does a mechanical movement, the prison guard pantomimes so as others like auctioneer. This is just a speech of Jones in all scenes (except the first and the last scene which are as a cover of book or frame of a picture). The soliloquy and monologue are expressionistic features mentioned in Table1. Jones tries to calm down with talking to himself through Tom-Tom of drums, formless fears, guilt feeling of killing Jeff, fear of Guard and become a prisoner or slave.
One of the distinguishing points between expressionist plays and others is the subtle use of music, colors and lightening. The sound of tom-tom can be heard in almost all scenes of the play, started in the very beginning to the death of Jones. It increases the stressful, intense atmosphere, revealing Jones's stresses and impacts on audience. The sound of drums can be representative of Jones' heart beat which beats faster gradually as the play continues. Lazzaris (2009:50) explains about this expressionistic feature: Other important aspects of expressionism present in the 1920s American expressionist plays are the use of sound cues, echoes, music, and lighting to express the protagonists' inner truth. The dramatic action centered in the protagonist provides the audience the chance to perceive the subjective point of view of the main character. This aspect can be noticed especially in Emperor Jones- sound cues, echoes, music, drums beats are present along the play and increase as Jones goes crazier. The sound of drums shows O'Neill's creativity in theatre. They are innovative not only because this is the use of music in expressionistic plays but also they show primitive object of starting a revolution. As primitive object increases and enriches, the value of expressionistic theme of primitivism of the play. The sound helps to create sympathy between the audience and the scared and run away Jones. 3.5 Themes in Emperor Jones Primitivism and Atavism2
Jones has a dual identity, gradually as the play goes ahead, his negroid characteristics dominant on white qualities. The primitive forms hidden in his subconscious gradually reveals. O'Neill purposefully emphasizes on Jones dress in each scene. In the opening of the play, the emperor Jones wears a light blue uniform coat sprayed with brass button and gold chevrons on his shoulders…his pants are bright red with a light blue stripe down the side…and patent leather laced boots. In Scene Two, he takes off his shoes. In Scene Three, he mops his face on his sleeve. He has lost his panama hat. In Scene Four, his uniform is ragged and torn…he tears off his coat and flings it away from him, revealing himself
: Primitivism and its sub-section, Atavism, are two expressionistic common themes. In the play by another expressionistic feature which is music, intensify the theme of primitivism. Drums tom-tom as a primitive element indicates war or rebel. The fear of darkness or death is in subconscious of all human. This aspect of human life is depicted frequently as Grande writes: Atavism in various phases was a subject frequently developed in expressionistic plays. The method is also clearly expressionistic, the presentation concretely of phenomena twisted by a mind under the influence of passion. In six scenes which form Brutus Jones' nightmare of wandering we are not presented with objective events but with the delusions of his fear-obsessed mind. What he thinks we see (p.64)
2 Atavistic: related to the attitudes and behaviour of the first humans: an atavistic urge/instinct/fear.

ISSN 2039-9340 Mediterranean Journal of Social Sciences Vol. 3 (11) November 2012
203
stripped to the waist. In Scene Five, his pants are in tatters, his shoes cut and misshapen. In Scene Six, his pants have been so torn away that what is left of them is no better than a breech cloth. Jones first wears as European but progressively comes to negroid and primitive form of wearing. (Emperor Jones: 3, 12, 14, 15) Apart from Jones cloth, another noticeable example of primitivism and atavistic theme of the play is in creating Witch-doctor character by O'Neill. The vision of a witch with almost naked shows primitive believes of Jones. Witch's equipment such as bones, antelope horns, with his stained body reminds us of primitive man. In scene seven, under stage direction, O'Neill describes him: … naked except for the fur of some small animal ties about his waist, its bushy tail hanging down in front. His body stained all over a bright red. Antelope horns are on each side of his head, branching upward. In one hand he carries a bone rattle, in the other a charm stick with a bunch of white cockatoo features tied to the end (Emperor Jones: 16) Struggle of Man towards his Fate: Another theme is the struggle of man toward his fate. Jones from the beginning of the play starts a struggle. In each scene, he toils to escape and tries to overcome his fear. Every bullet which is shot is a symbol of his useless effort. This struggle induces the sympathy of the audiences that makes the protagonist's death more impressive. Race and Racism: Racism is not an expressionistic theme, but what makes it significant in this play is Jones desire to be a white instead of a black man. This makes an internal conflict for Jones. Also, the use of color -as the white stone in scene two- both is expressionistic and intensify racism theme -as a symbol of white people. Food which is the basic need of life in scene two is under white stones. It can be perceived that the white captures all necessities of negro people. Colonization of white is the subsection of this theme. The inner conflict of Jones whether accepts his race or denies it and remain emperor is recurrent through all scenes. Mendelssohn writes: "Jones's desire to associate himself with white culture stems from his conflicting feelings of being both colonizer and colonized. Jones uses language as a means of controlling and reinforcing the hierarchy of social relations within his colony…by internalizing the language of the colonizers, John has been intellectually colonized." (Mendelssohn: 1999:20) 3.6 The Similarities and Differences in between O'Neill's The Hairy Ape and Emperor Jones Based on Expressionism Viewpoint are Illustrated in Tables 2 and 3. Table 2. Similarities between O'Neill's The Hairy Ape and Emperor Jones
Features of Expressionism The Hairy Ape Emperor Jones
1 Nightmarish /gloomy/ somber. Atmosphere
The gloomy atmosphere of The Hairy Ape started from scene three in confrontation of Mildred with Yank.
The atmosphere of the jungles is nightmarish. Formless fears and throb of drums intensify the nightmarish atmosphere
2 Showing the inner feelings and unconscious of the protagonist
Yanks as the protagonist resented by Mildred's offence. His feelings and search for somewhere who belongs repeated throughout the play
The play shows the inner feelings and unconscious of Jones as the protagonist. One example is the fear of being slave which represents in face to auctioneer
3 Monologue/ Soliloquy Yank's monologue in Scenes 1,6, and 8 Jones monologue in Scene 2-7
4
Typification in characterization, exaggerated caricature characters Symbolic characters
Yank is the typified character; Mildred's Aunt is caricature character. Mildred symbol of bourgeois class and Yank of Working class
Henry Smithers is a typified character. He is a white trader symbol of colonizer.
5 Alone/ alienated characters Yank is alone after Fifth Avenue. He just hears some voices in prison.
Jones is alone after leaving the palace till his death. He just visits some visions
6 Using music, sound effect
O'Neill describes the worker shoveling in rhythmic motion. The setting of the stokehole shows using sound effect. "Tempo is connected with expressive violence disharmonious sound" (Mudanjiang ,6)
Tom-Tom of drums continues through the play, this music accelerates gradually reaches to its highest tempo in climax and ceased when Jones die.

ISSN 2039-9340 Mediterranean Journal of Social Sciences Vol. 3 (11) November 2012
204
7 primitive or exaggerated characters
Yank is a primitive character (for more explanation refer to 4.10)
Jones and Witch-doctor are primitive characters (more explanation in chapter 4. part 10)
8 Foreshadowing This sound effect in scene three can perceive as foreshadowing of the disagreeable and undesirable confrontation with Mildred and the events after it.
John's death foreshadows several times. For example, the emperor runs at sunset which is end of the day, that implies this is the end of his life.
9 Tragic death, or ending for the main character
The play end with tragic death of Yank. Jones's tragic death is similar to Yank's ending.
10 Mechanical Movements People of the Fifth avenue acts like robots with a predefined phrase of "beg your pardon"
Mechanical movements of Jeff in scene three of the play.
11 Using symbols Roding the thinker, ape and Steel Formless fears, Silver bullet, white stones
12 Exploring theme of poverty
The poverty of working class appears in the Fifth Avenue where Yank and Long looks at the price of Monkey fur and jewelries which were equal to the salary of one month hard work in the ship's stokehole
Jones deceives people and tells them just a silver bullet kills him. Negro people could not afford a silver bullet. Which intensify the theme of poverty of negros in the play
Table 3. Differences between O'Neill's The Hairy Ape and Emperor Jones
Features of Expressionism The Hairy Ape Emperor Jones
1 characters especially the protagonists are victim of industrial society
Yank is a victim of industrial society which creates a huge gap between two classes and makes a serious condition for the working class
Jones is not the victim of industrial society
2 Mechanized people People of the Fifth Avenue are mechanized people behave as robots. They do not notice to the fight of Yank to gentleman, as if they even do not see anything
In Emperor Jones this feature of expressionism does not apply by O'Neill
3 wearing mask dances
In The Hairy Ape this feature of expressionism does not apply by O'Neill
In scene seven the Witch-Doctor began to dance and chant (Emperor Jones, 16)
4 Short scenes Except the last scene (scene eight is short) other scenes are not short.
The play consists eight short scenes
5 Plot sequence is dreamlike or contains flash back
In The Hairy Ape this feature of expressionism does not apply by O'Neill
Plot sequence are contains flash back, when Jones visit Jeff in scene three he remember as a flash back that he once killed Jeff
4. Conclusion In this paper, two plays of O'Neill The Hairy Ape and Emperor Jones were analyzed based on features and principles of expressionism. The comparison concludes that they are similar in some features and principles of expressionism, however, some differences could be found in the plays expressionistic features and principles. Although both plays have written by one author, Eugene O'Neill, and almost in one span of his life (1920-1), the differences show O'Neill's intelligence in writing expressionist plays. He has influences on expressionist plays.
References Abrams, M.H. (2005). A Glossary of Literary Terms. (8th ed.) Thomson Wadsworth. Blackburn, C. (1941). Continental Influenced on Eugene O'Neill's Expressionistic Dramas. American Literature. 13.109-133. Dukes. A (1924) The Youngest Drama: studies of fifty dramatists. Chicago: C. H. Sergel. Dahlström, C.E.W.L. (1980). Strindberg's Dramatic Expressionism. (2nd ed.). USA: Arno Press. Grande, L.M. (1948). Expressionism in the plays of Eugene O'Neill. Master's Thesis, Loyola University Chicago Grassner, J. (1965). Eugene O'Neill (Pamphlets on American Writers).USA: University of Minnesota press. Gupta, M. (2001). The Plays of Eugene O'Neill- A Critical Study. Atlantic Publishers and Distributors. ISBN 81-269-0000-8. Lazzaris, F. (2009). Expressionistic Aspects in Some Works by Tennessee Williams and by Other American Authors. Rio. Porto Alegre.

ISSN 2039-9340 Mediterranean Journal of Social Sciences Vol. 3 (11) November 2012
205
Manuel, C. (2005). A Ghost in the Expressionist Jungle of O'Neill's "the Emperor Jones". Journal of African American Review, 39,67-85. Mendelssohn, M. (1999). Reconsidering Race, Language and Identity in the Emperor Jones, University of Cambridge. The Eugene
O'Neill's Review. 23, 19-30. Mudanjiang, M. (2009). Eugene O'Neill's The Hairy Ape: An Expressionistic Study. Beijing Normal University. Tutor Professor Zhao. O'Neill, E. (1920) The Emperor Jones. [Online] Available (2001):http://www.blackmask.com O'Neill, E. (1921) The Hairy Ape, a Comedy of Ancient and Modern Life In Eight Scenes. [Online] Available:
http://www.fullbooks.com/The-Hairy-Ape.html Poole, G. (1996). 'Blasted Niggers': The Emperor Jones and Modernism's Encounter with Africa. Eugene O'Neill Review, 18, 21-37. Seyed Hoseini, R. (2006). Literary Schools.(2nd ed.) Tehran: Negah Press. Styan, J.L. (1981). Expressionism and Epic Theatre, Modern Drama in Theory and Practice. Cambridge: Cambridge UP. Uma, J. (2010). Eugene O'Neill's The Hairy Ape an American Expressionistic Play. Language in India Strength for Today and Bright
Hope for Tomorrow. 10, 258-264. ISSN: 1930-2940 Walker, Julia A. (2009). Expressionism and Modernism in the American Theatre Bodies, Voices.Words. (2nd ed.) Cambridge: Cambridge
University Press. Yassami. F. (2010) Expressionism and Expressionist Theatre A comparative study of Elmer Rice's "The Adding Machine" and Georg
Kaiser's "From Morn to Midnight". BoD (Books on Demand) Publication. Yeganeh, F. (2002). Literary Schools. (7th ed.) Tehran: Rahnama Publication.


ISSN 2039-9340 Mediterranean Journal of Social Sciences Vol. 3 (11) November 2012
207
Privatization and Firm Performance:
An Empirical Study of Selected Privatized Firms in Nigeria
Dr. Yahya Zakari Abdullahi
Department of Economics, Faculty of Social Sciences, Usmanu Danfodiyo University, Sokoto, Nigeria
E-mail: [email protected]
Dr. (Mrs) Hussainatu Abdullahi
Department of Economics, Faculty of Social Sciences Usmanu Danfodiyo University, Sokoto, Nigeria
E-mail: [email protected]
Dr. Yelwa Mohammed
Department of Economics, University of Abuja, Abuja-Nigeria
Email: [email protected]
Doi:10.5901/mjss.2012.v3n11p207 Abstract The aim of this study is to investigate the financial and operational efficiency of the privatized firms in Nigeria. Data for this study comes from secondary sources; specifically, Fact Book from the Nigerian Stock Exchange, Offer Prospectuses, as well as published annual reports and financial statements of the privatized firms. Our sampled firms are drawn from manufacturing, oil marketing, banking and insurance sub-sectors of the Nigerian economy. The period of analysis covers 5 years before, and 5 years after privatization. To test our predictions, we follow the techniques of Megginson et al. (1994) in order to determine post privatization performance changes. We calculate the mean value of each variable for each firm over the pre and post privatization periods, we then use the T- test and the Wilcoxon sign rank test as principal methods of testing for significant changes in the variables. Results obtained from this study are mixed. Whereas some companies in our sample show improvements in some indicators, other companies have shown decline in some indicators after privatization. However, in spite the mixed results, the overall picture shows improvement in profitability for at least half of the firms in our sample. Overall, we may conclude that our results provide little evidence that privatization has caused significant improvement by all indicators. Keywords: Privatization, Firm Performance, Nigeria 1. Introduction 1.1. Background to the Study The structure of Nigerian economy has witnessed a lot of changes since independence. During the 1960s, agriculture was the backbone of the economy. The early 1970s earned for Nigeria huge crude oil revenue at a level that was never anticipated. This resulted into more active government involvement in wide-diversified investments in areas that span both traditional public sector and exclusive private sector businesses, which include agriculture, mining, manufacturing, banking, insurance and commerce. An industrialization strategy based on import substitution was formulated. Payments for raw materials started to feature remarkably on own import bill at an alarmingly increasing rate. Inflation was also imported and induced locally in the face of an ever-expanding government expenditure faced by the challenges of an ephemeral illusion of the rising standard of living.
The 1980s however, began to expose a different market facing oil as its price commenced a downslide movement. Earnings could no longer support the level of food and other imports which drastically reduced with worsening effect on inflation. Consequently, the expenditure level of good governance and other public services became incompatible with

ISSN 2039-9340 Mediterranean Journal of Social Sciences Vol. 3 (11) November 2012
208
resources available to various governments. However, public enterprises that were established and supported during the oil boom era continued to rely on subventions from government. The large share of public finances which the enterprises continued to absorb without commensurate beneficial results reduced funds available for social services. Obadan and Ayodele (1998), note that financial support for public enterprises has “crowded out” private sector borrowing which inevitably, has undermined the development of the private sector. The only solution under the circumstance was to propose economic stabilization measures aimed at salvaging the economy from total collapse.
In 1986, the government said that it is committed to make 1986 Budget a blue print of our national efforts at restructuring the economy. One of the strategies of achieving this is the privatization approach, which is part of the larger reform package called Structural Adjustment Program (SAP). Our experience in Nigeria has raised doubts in the public sector’s ability to effect the highest level of efficiency in non-strategic and commercially-oriented enterprises. The decision to privatize some government enterprises is based on the fact that government had for a long time monitored the performance of these enterprises, most (if not all) have constituted an unnecessary burden on government resources. In spite of low rate of return on investment in government parastatals, they still call for funds from the treasury on annual basis (Federal Republic of Nigeria, 1986). There was therefore the tendency to feel that government grants, subventions and subsidies to the parastatals were free gifts which nobody was expected to account for. As a result most of the parastatals accumulated unaudited accounts for upwards of six years and above. This became a major source of concern for international lending agencies such as the World Bank.
In order to introduce more accountability in the management of these parastatals, government was forced to reconsider its public sector stance especially as it relates to organization, management, regulation and ownership structure (Iwayemi, 1995). Specifically, the government argued that there was the need to lessen the dominance of unproductive investment in the public sector in the light of dwindling oil revenue and suffocating external debt. It was also envisaged that a carefully planned privatization program would be an effective strategy for improving operational efficiency, broadening share-ownership, attracting foreign investment and reducing the role of the state in areas where the private sector has the capability of operating efficiently (Jerome, 1996).
It has been argued strongly that ownership is a significant determinant of successful financial and operational performance (Hanke, 1987; Cook and Kirkpatrick (1988); Commander and Killick, 1988). It was also assumed that for productive efficiency to be attained, introduction of a reward system is necessary, so that at the end, all the stakeholders would benefit from productive efforts. Therefore, the major objective of privatization is to enhance the productive efficiency of enterprises in such away that the welfare of all the stakeholders would be maximized. Privatization is thus expected to impact positively on income, wealth, employment, share prices, etc. of all the stakeholders of privatized firms.
Another issue that is worthy of note, is the budgetary drag of public enterprises and the belief that privatization will reduce or eliminate budget deficit. For instance, public enterprises accounted for 20.5 per cent of Nigeria’s external debt in 1990. Government subvention constituted 15.89 per cent of the total investment in public enterprises, while loans and equity shareholding accounted for 35.21 per cent and 48.89 per cent, respectively (TCPC, 1993). It has been argued that, efficiency improvement in privatized enterprises would have positive impact on the public treasury in terms of tax revenue and elimination of subsidy. Over ten years into the privatization program in Nigeria, an assessment of its impacts on economic and financial efficiency and profitability is thus essential. These are the core issues which this research intends to explore. 1.2. Objectives of the Study 1.2.1 Broad Objective The broad objective of this study is to investigate the financial and operational efficiency of the privatization of public enterprises in Nigeria. 1.2.2 Specific Objectives The study seeks to evaluate the Nigerian privatization process by analyzing the performance of selected privatized enterprises (using “before” and “after’ approach) in terms of their financial and operational efficiency and other related impacts and based on the findings, propose policy for successful implementation of privatization program in Nigeria. However, this research intends to specifically examine the impacts of privatization on the selected enterprises using the following parameters: profitability, operating efficiency, capital investment, output, employment, leverage, dividend payout and earning per share

ISSN 2039-9340 Mediterranean Journal of Social Sciences Vol. 3 (11) November 2012
209
2. Literature Review 2.1 Review of Related Empirical Studies Privatization has been part of government policy toolkits since the past two decades. This provided enough time for academic researchers to generate a wide range of empirical studies on the effects of divestment on the post privatization financial and operating performance of former state-owned enterprises (SEOs). We shall examine some of these empirical studies in the following paragraphs.
The study conducted by Megginson, et. al. (1994) compared pre and post privatization financial and operating performance of 61 firms that experienced full or partial privatization through public share offerings from 32 industries in 18 countries (6 developing and 12 developed) between 1961 and 1990. They used several financial indicators such as profitability, sales, operating efficiency, capital investment, leverage ratios and dividend pay-out figures. The study documents strong performance improvements achieved without sacrificing employment security. Specifically, after being privatized, firms increase real sales, become more profitable, increase their capital investment spending, improve their operating efficiency and increase their work forces. Furthermore, these companies significantly lower their debt levels and increase dividend payout. Finally, they document significant changes in the size and composition of corporate boards of directors after privatization. Although, the study has been able to obtain comparable data from a large sample of firms from different countries, unfortunately, the study is limited to only OECD and other developed countries which used Initial Public Offering (IPO) as the main method of privatization. One may argue that, since most of the samples are drawn from developed economies and that IPO is usually applied to high quality candidates, then the positive findings might not be applicable to non- industrialized countries, or firms divested by methods other than public share issuing. In short, this has limited applicability to developing countries such as those in Africa.
Juliet D’Souza and William Megginson (1999) compare the pre- and post privatization financial and operating performance of 85 companies from 28 countries (15 industrialized and 13 non-industrialized) that experience full or partial privatization through public share offerings for the period from 1990 through 1996. The study documents significant increases in profitability, output, operating efficiency, and dividend payments – and significant decreases in leverage ratios- for all the sampled firms after privatization and for most sub- samples examined. Capital expenditures increase significantly in absolute terms, but not relative to sales. Employment declines but insignificantly. By and large, findings from this study strongly suggest that privatization yields significant performance improvements.
In another single industry study, D’ Souza and Megginson (1998), examines performance changes following the privatization by share offering of 17 national telecommunication companies for the period from 1981 through 1994. They find persuasive evidence that profitability, output, operating efficiency, and capital investment spending, the number of access line (a proxy for units of physical output), and average salary per employee all increase significantly after privatization. Leverage declines significantly, and employment declines significantly.
Another influential study partly because of the rigor of its methodology and partly because it was sponsored by the World Bank is that of Galal et. al (1992). They compare the actual post privatization performance of 12 large firms- mostly airlines and regulated utilities- in Britain, Chile, Malaysia, and Mexico to predict the performance of these firms had they not been divested. The authors document net welfare gains in 11 out of the 12 cases considered which equal, on average, 26 percent of the firm’s pre-divestiture sales. Furthermore, they document no case where workers as a class were made worse off and three cases where made significantly better off. The most important aspect of this study is the great care which the authors try to take in order to isolate the effect of just the privatization itself. They determine whether the transfer to private ownership increased efficiency- and, if so, how the cost and benefits of adjustment were allocated.
Dewenter K. and P. Malatesta (1998) use regression and time series methods to compare the pre- versus post privatization performance of 63 large, high-information companies divested during the period 1981 to 1993. These authors examine performance changes over both short time frame around privatization, comparing events (-3 to -1) with (+1 to +3), as well as examining a longer period, comparing events years (-10 to -1) with (+1 to +5). They document significant post privatization increases in profitability (using net income) and significant decreases in leverage and labor intensity (employees/sales) over the period immediately after privatization. However they also find that operating profits increase prior to divestiture and may actually decrease somewhat afterward. Their results confirm the findings of Boardman and Vining (1989). The only difference is that they document profitability that is not only statistically significant but it is large. They also provide support for the view that government firms are less efficient than private firms at least to the extent that profitability and efficiency can be equated.
Narjess Boubakri, et. al. (2004) examine the post-privatization performance of newly privatized firms in Asia and document how the private ownership structure evolves overtime. The authors show that privatization leads to increase in profitability, efficiency, and output in former state-owned firms from Asia. Employment increases but insignificantly.

ISSN 2039-9340 Mediterranean Journal of Social Sciences Vol. 3 (11) November 2012
210
Compared to the related literature on the effects of privatization in developing countries, results from this study indicate that performance improvements in Asia where most firms are partially privatized are less significant than those documented in other studies. This study finds that higher improvements are associated with certain aspects of corporate governance and the economic environment: For example, a friendly institutional environment, lower political risk, more developed stock markets and involvement of foreign investors, are important determinants of performance improvements after privatization. Finally, the study shows that governments generally do not relinquish control and private ownership concentrates overtime, but by far less than what is observed elsewhere in developing countries.
Zuobao Wei, et. al. (2003) examines the pre- and post privatization financial and operating performance of 208 firms privatized in China during the period 1990-1997. The full sample results show significant improvements in real output, and sales efficiency, and significant declines in leverage following privatization, but surprisingly, no significant change in profitability. Further analysis by the authors shows that, privatized firms experience significant improvements in profitability compared to fully state-owned enterprises during the same period. Firms in which more than 50% voting control is conveyed to private investors via privatization experience significantly greater improvements in profitability, employment and sales efficiency compared to those that remain under the state’s control. The authors conclude that, privatization works in China, especially when control is passed to private investors.
In a study on partial privatization and firm performance in India, Gupta N. (2004) uses data from Indian state-owned enterprises and found that partial privatization has a positive impact on profitability, labor productivity and investment spending. On the other hand, he found no evidence that firms are chosen for privatization because of unusually bad performance in the previous year. His analysis confirms the argument that the most profitable enterprises are usually the first to be privatized as with the case in Indian oil and gas companies. He also documents that privatization and competition are not substitutes in their impacts on firm performance. His results supports the hypothesis that partial privatization address managerial rather than the political view of inefficiency in state-owned enterprises.
An empirical study by LaPorta and Lopez-de- Silanes (1999), tests whether the performance of a sample of 218 Mexican SOEs privatized though June 1992 improves after divestiture. The authors compare the profitability, employment, and efficiency levels of the privatized firms to an industry matched control group, and find that the former SOEs rapidly closed the yawning performance gap that had existed prior to divestment. Output increases by 54.3 percent, (in spite of a reduced level of investment spending), sales per employee roughly double, and privatized firms reduced blue- and white-collar employment by half.
From the above review, we have seen that privatization has produced mixed results, but most of the research conducted reveal strong performance improvements as a results of privatization. Only a few studies have indicated dismal performance after privatization. However, it is important to note that some of these successes are not achieved entirely as a result of privatization. As Dewenter and Malatesta (2001) have shown, governments efficiently restructure at least some firms before selling them. For example Japan National Railway reduced its workers its workforce by approximately 200,000 and was split into seven separate rail companies before any share was sold to investors. If government restructure firms and improve their performance before privatization, then improvements cannot be attributed to change in ownership. Rather, the political impetus behind privatization first impels governments firms to operate more efficiently. If this is the case, then what is the role of privatization? George Y. (1986) is of the view that while policy changes (in the form of restructuring) can improve performance of government owned enterprises, such improvements may dissipate overtime without the added discipline of private ownership. There is therefore the need for privatization not only to achieve efficiency gains but to sustain them in the face of changing political, social and economic circumstances. 3. Methodology The theoretical model of Boycko, et al (1993), supports many of the goals of privatization, such as increasing in operating efficiency, revenue, profitability, rate of return on capital employed, changes in employment levels, wages and in workers’ overall welfare. However, their model predicts a decline in output as a result of privatization. The model used by Megginson et al (1994) goes a step further, although using the same model by Boycko, et al (1993).This study shall employ the same methodology to assess, efficiency profitability as well as distributional impacts of privatization in Nigeria. We compare the performance of the privatized companies mainly in the manufacturing sector from 1986 to 2000. The T-test and the Wilcoxon signed–rank test would be employed as our principal method of testing for significant changes in the variables. It tests whether the average difference in variable values between pre and post privatization period is zero. Our sampled firms are drawn mainly from manufacturing sector of the economy, and the sample size contains 10 firms. We shall examine the impacts of privatization at the enterprise level. The period of analysis covered is seven years prior to and seven years after privatization for each firm in the sample. The data we intend to use in this study shall be derived from secondary sources; specifically, Fact Book from the Nigerian Stock Exchange which contains data on each

ISSN 2039-9340 Mediterranean Journal of Social Sciences Vol. 3 (11) November 2012
211
company’s financial and operational performance before and after privatization. Also published Annual Reports, Offer Prospectus and Financial Statements of privatized companies shall serve as our major sources of data. 3.1. Estimation Procedures To test our predictions we follow the techniques of Megginson et al (1994) in order to determine post-privatization performance changes, we utilize a matched pair methodology (i.e. compare pre – and post – privatization results). We begin by calculating performance measurement proxies for every firm for the ten-year period, with five years before and five years after privatization. Then we develop a performance “time line” that reflects operating results from the last five years of public ownership through the first year as a privatization entry. We next calculate the mean value of each variable for each firm, over the pre – and post – privatization periods (pre – privatization years –5 to – 1 and post privatization years +1 to +5) we therefore exclude year O (zero) from our mean calculations: Having computed our mean, we use the T-test and the Wilcoxon sign-rank test as our principal methods of testing for significant changes in the variables. The procedure tests whether the average difference in variable values between pre and post–privatization samples is zero. We compute ratios using current-year “flow” measures such as sales, capital, dividends, operating profits and net income; others include total assets and common equity,
Testable Predictions of Performance Indicators Characteristics Proxies Predicted Relationship P (1) Return on Sales (ROS) = Net Income ÷ Sales ROSA > ROSB Profitability Return on Assets (ROA) = Net Income ÷ Total Assets ROAA > ROAB Return on Equity (ROE) = Net Income ÷ Equity ROSA > ROSB P (2) Sales Efficiency (SALEFF) = Sales ÷ Number of Operating Employees SALEFFA > SALEFFB Efficiency Net Income Efficiency (NIEFF) = Net Income ÷ Number of Employees NIEFFA > NIEFFB P (3) Capital Expenditure to Sales (CESA) = Capital Capital Expenditure ÷ Sales CESAA > CESAB Investment Capital Expenditures to Assets (CETA) = Capital Expenditures ÷ Total Assets CETAA > CETAB P (4) Output Real Sales (SAL) = Nominal Sales ÷ Consumer Price Index SALA > SALB P (5) Employment Total Employment (EMPL) = Total Number of Employees EMPLA < EMPLB P (7) Leverage Debt to Assets (LEV1) = Total Debt ÷ Total Assets LEVA < LEVB Long-Term Debt to Equity (LEV2) = Long- Term Debt ÷ Equity LEV2A < LEV2B P (8) Payout Dividends to Sales (DIVSAL) = Cash
Dividends ÷ Sales DIVSALA> DIVSALB Dividend Payout (PAYOUT) = Cash
Dividends÷ Net Income PAYOUTA >PAYOUTB P (9) Earnings Profit (Loss) before tax and unrealized exchange per Share gains (loss) ÷ number of shares in issues as at date of prospectus EPSA > EPSB Source: Megginson et al. (1994)

ISSN 2039-9340 Mediterranean Journal of Social Sciences Vol. 3 (11) November 2012
212
4. Analysis and Interpretation of Results 4.1. Changes in Profitability State-owned enterprises are often chronically unprofitable, this is partly because they are charged with objectives (such as maximizing employment) other than the objective of profit maximization. Privatization therefore, is designed to substitute the single objective of profit maximization with the many other objectives. It is also expected to enhance the development of capital market and focus employees on raising revenues and lowering costs. Also, government withdraws its guarantee to the enterprises debts after privatization, which exposes them to the real threat of bankruptcy which leads to their liquidation. This inevitably makes enterprises to promote greater emphasis on profit maximization. Table 1. Profitability Name of Firm Variable Mean Mean Mean T-test Wilcoxon test Before After Change (-) Ashaka ROS 0.1294 0.1625 0.0331 0.2643 0.405 ROA 0.1538 0.2503 0.0965 0.1411 0.135 ROE 0.3091 0.2731 (0.036) 0.6428 0.730 Portland ROS 0.2335 (0.0409) (0.2744) 0.0029 0.000 ROA 0.3675 (0.0266) (0.3942) 0.0036 0.135 ROE 0.3752 (0.1024) (0.4776) 0.0115 0.146 Flour Mills ROS 0.0508 0.0321 (0.0188) 0.0131 0.647 ROA 0.1011 0.0992 (0.0019) 0.8988 0.647 ROE 0.2242 0.2333 0.0093 0.8647 0.647 UNTL ROS 0.0570 0.5779 0.0008 0.9338 0.730 ROA 0.0076 0.0838 0.0076 0.5988 0.730 ROE 0.0977 0.1081 0.0103 0.5973 0.730 UNIC ROS 1.7188 0.0941 (1.6248) 4.0421+ 1.826++ ROA 0.1067 0.0824 (0.0243) 0.2847 0.135 ROE 0.3495 0.1664 (0.1830) 0.0252 0.146 Royal Ins ROS 3.5222 0.3169 (3.2052) 0.0016 0.146 ROA 0.1094 0.0704 (0.0389) 0.0025 0.135 ROE 0.9564 0.0869 (0.8695) 1.4498+ 2.023++ Unipetrol ROS 0.0325 0.0139 (0.0186) 0.035 0.647 ROA 0.4031 0.1203 (0.2828) 0.039 0.647 ROE 0.4572 0.2565 (0.2006) 0.2815 0.135 National Oil ROS 0.0029 0.04469 0.0417 0.2344 0.365 ROA 0.0251 0.2485 0.2234 0.4536 0.365 ROE (3.16) 0.2602 3.4203 0.3255 0.135 UBA ROS 0.0481 0.1122 0.064 0.0581 0.000 ROA 0.0055 0.0187 0.0132 0.0198 0.826 ROE 0.1167 0.2207 0.1167 0.1413 0.135 NAL ROS 0.1953 0.2307 0.0354 0.3314 0.826 ROA 0.0267 0.0407 0.014 0.0367 0.135 ROE 0.1721 1.4091 1.2369 0.0075 0.146 Source: computations by author (*, + = significance at 5%; ++ = significance at 10%)

ISSN 2039-9340 Mediterranean Journal of Social Sciences Vol. 3 (11) November 2012
213
We measure profitability using three ratios: return on assets (ROS); return on assets (ROA) and return on equity (ROE) for the selected ten companies. Four of the companies, UNTL, National Oil, UBA and NAL have shown positive improvements after privatization using the three ratios. On the other hand, four other companies, Portland cement, UNIC insurance, Royal insurance and Unipetrol have shown negative performance using the three rations. ROS and ROA have improved for Ashaka cement while ROE declined after privatization. For instance, ROS and ROA have increased by about 3% and 9% respectively. In the case of Flour mills, ROS and ROA have declined after privatization while ROE shows an improvement after privatization. For example, ROS declined from about 5% to about 3% while ROA recorded a slightly negative change from 10% to 9%. Only National Oil has recorded significant increases using the three ratios at 5% level, while NAL recorded a significant increase in ROE also at 5% level. ROS and ROE measures show significant changes for UNIC and Royal insurance at 5% level respectively.
The overall results are mixed and sometimes contrary to expectations. While some variables tested positive, some have tested negative for the same company. However, we may not draw any conclusions to the fact that all the firms in our sample have become more profitable after privatization. It is also important to note that most of the firms that recorded improvements after privatization were already profitable firms even before privatization, but their performance after privatization for all the three ratios have shown that they are set on the path of more profits in the future. 4.2. Efficiency Changes By throwing state-owned enterprises to competition, government clearly hopes that these firms will employ their human and financial resources more efficiently. The shareholders (including employees) in a private company capture most of the benefits of efficiency improvements, but they also suffer most if efficiency is not improved. In removing the non economic objectives of the firms, government explicitly state that the trade off it expected is increased operating and financial efficiency. Table 2. Operating Efficiency Name of Firm Variable Mean Mean Mean T-test Wilcoxon Before After Change test (-) Ashaka SALEFF 2079.6 9735.89 7656.28 0.0022 0.135 NIEFF 274.38 1722 1447.61 0.0119 0.405
Portland SALEFF 5609.34 13068.96 7459.62 2.3651* 1.826++ NIEFF 1292.8 (598.75) (1891.56) 0.0509 0.135
Flour Mills SALEFF 2851.91 7907.22 5055.31 0.0038 0.095 NIEFF 142.28 262.42 120.14 0.0653 0.095
UNTL SALEFF 1533.6 2189.13 512.19 0.0396 0.135 NIEFF 91.59 124.97 33.37 0.1446 0.674
UNIC SALEFF 4.576 876.98 872.4 0.00014 0.095 NIEFF 6.813 83.006 76.19 0.0006 0.095
Royal Ins SALEFF 5.687 823.68 818 8.707* 1.826++ NIEFF 19.35 272.19 252.843 0.0016 0.674
Unipetrol SALEFF 21260.55 79502.66 58242.11 0.0328 0.095 NIEFF 707.16 947.58 240.42 0.485 0.124
National Oil SALEFF 34195.87 96284.54 62088.67 3.488* 0.826 NIEFF 352.39 4289.52 3937.12 0.0114 0.135
UBA SALEFF 283.05 2800.21 2517.16 0.0047 0.095 NIEFF 9.477 346.63 337.15 0.0436 0.135
NAL SALEFF 1013.29 6456.5 5443.2 3.868* 1.826++ NIEFF 194.39 1487.98 1293.58 9.138* 1.826++ Source: computations by author (*, + = significance at 5%; ++ = significance at 10%)

ISSN 2039-9340 Mediterranean Journal of Social Sciences Vol. 3 (11) November 2012
214
The efficiency measures we employ include inflation-adjusted sales per employee (SALEFF) and net income per employee (NIEFF). SALEFF show significant changes at 5 per cent level in Portland cement, Royal insurance, National Oil and NAL merchant bank, while NIEFF shows significant changes at 5 per cent level in UNTL, NAL and Unipetrol. Except the NIEFF in UNTL which have recorded a decline, the results show positive increases following privatization in all the ten companies considered. The results somehow agree with the general expectations of our hypothesis. 4.3. Changes in Capital Investment The general expectation is that, greater emphasis on efficiency and profitability will make newly privatized firms increase their capital investment spending. Firms should increase capital expenditure after divestiture because they are no longer tied to government’s bureaucratic procedures and that they have greater access to private debt and capital market. Moreover, if privatization is accompanied by deregulation and market opening, former SOE’s will face very large investment spending needs in order to become more competitive with other private firms. In addition, years of financial stress often lead firms to defer routine maintenance which must also be made good after privatization. The removal of government control of the SOE also reduces or eliminates the government’s ability to bribe or force SOE managers to produce politically attractive, but economically wasteful goods (Megginson et al, 1994). Finally, to the extent that privatization promotes entrepreneurship, former public firms will have the incentives and the means to invest in growth options such as launching new products and searching for new markets. Table 3. Capital Investment Name of Firm Variable Mean Mean Mean T-test Wilcoxon test Before After Change (-) Ashaka CESA 0.036 0.065 0.0285 0.0096 0.135 CETA 0.412 0.096 0.0552 0.014 0.405 Portland CESA 0.0062 0.1707 0.1646 0.1561 0.674 CETA 0.0095 0.1292 0.1196 0.166 0.674 Flour Mills CESA 0.0081 0.0316 0.235 0.1994 0.674 CETA 0.0164 0.10 0.083 0.0087 0.135 UNTL CESA 0.0042 0.0405 0.0363 0.0243 0.095 CETA 0.0053 0.0575 0.0521 0.0146 0.095 UNIC CESA 2.8102 0.0595 (2.751) 0.0057 0.095 CETA 0.139 0.0567 (0.823) 0.1587 0.365 Royal Ins CESA 1.1124 0.0323 (1.08) 0.0002 0.095 CETA 0.0384 0.0073 (0.031) 0.0081 0.095 Unipetrol CESA 0.0163 0.0306 0.0143 0.3636 0.135 CETA 0.1895 0.1934 0.0038 0.9628 1.095+ National Oil CESA 0.0023 0.0124 0.0101 0.0444 0.135 CETA 0.0203 0.0460 0.2565 0.143 0.674 UBA CESA 0.1407 0.0666 (0.0741) 0.0319 0.095 CETA 0.0593 0.1085 (0.0485) 0.3337 0.135 NAL CESA 0.0766 0.0162 (0.0604) 0.0676 0.135 CETA 0.0097 0.0028 (0.0068) 0.0299 0.095 Source: computations by author (*, + = significance at 5%; ++ = significance at 10%)

ISSN 2039-9340 Mediterranean Journal of Social Sciences Vol. 3 (11) November 2012
215
We compute capital investment intensity using two proxies, capital expenditures divide by sales (CESA) and capital expenditures divide by total assets (CETA). Six out of ten firms in our sample have shown improvement in both indicators, However, UNIC, Royal, UBA and NAL have shown a reduction in both CESA and CETA during the post privatization period. In our entire sample, Portland cement has shown high increases in capital expenditure where it recorded increase from 0.6 per cent to 17 per cent, 0.9 per cent to 12 per cent for CESA and CETA respectively. This is significant at 10 per cent level for both CESA and CETA. UNIC insurance shows high reduction in CESA; which falls to less that 10 per cent during the post privatization period. Flour mills and Unipetrol have recorded significant improvement at 10 per cent in CESA, while National Oil recorded significant at 10 per cent level in CETA. 4.4. Changes in Output Governments hope and expect that real sales will increase after privatization because newly privatized firms now have better incentives, more flexible financing opportunities, increased competition and greater scope for entrepreneurial initiatives. On the other hand, Boycko, Shleifer and Vishny (1993) argue that effective privatization will lead to reduction in output, since government can no longer entice managers (through subsidies) to maintain inefficiently high output levels. Table 4. Output Name of Firm Variable Mean Mean Mean T-test Wilcoxon test Before After Change (-) Ashaka SAL 1467.95 1710.28 242.32 0.3352 0.356 Portland SAL 3666.25 2978.09 (688.16) 0.0529 0.095 Flour Mills SAL 578.9 683.27 104.37 0.3071 0.135 UNTL SAL 3622.75 3548.71 (74.03) 0.8862 0.365 UNIC SAL 24.32 201.78 177.45 1.796* 1.753+ Royal Ins SAL 25.07 72.28 47.21 2.486* 2.023+ Unipetrol SAL 5120.62 9105.74 5034.44 0.0259 0.135 National Oil SAL 4071.3 4551.88 (568.73) 0.4161 0.365 UBA SAL 3839.86 3347.58 (492.27) 0.4077 0.365 NAL SAL 745.25 530.17 (215.83) 0.0233 0.135 Source: computations by author (*, + = significance at 5%; ++ = significance at 10%) We test these two competing predictions by computing he average inflation-adjusted sales level for the pre-privatization period and comparing it with the post privatization period for the ten firms in our sample. Five companies have recorded positive increase in output during the post privatization period, namely; Ashaka, Flour Mills, UNIC, Royal insurance and Unipetrol. This result is in line with the first argument. On the other hand, the remaining five companies have recorded a reduction in output in the post privatization period. These are Portland cement, UNTL, National Oil, UBA and NAL. This supports the second theoretical postulation. 4.5. Leverage Changes In order to place greater priority on improving the financial soundness of the newly privatized firms, leverage ratios are expected to drop after privatization. There are several reasons why leverage should decline after privatization, for one thing, SOEs traditionally have extremely high debt levels at least partly because they cannot sell equity to private investors, and thus the only equity available to the firms are capital injections and retained earnings (Megginson et al

ISSN 2039-9340 Mediterranean Journal of Social Sciences Vol. 3 (11) November 2012
216
1994). Leverage ratio measures long term financial position of a firm and the extent to which the firm relied on debt to finance assets. It establishes the relationship between funds supplied by owners of a firm and those provided by creditors of a firm. Table 5. Leverage Name of Firm Variable Mean Mean Mean T-test Wilcoxon test Before After Change (-) Ashaka LEV1 0.518 0.9177 0.3996 0.0023 0.674 LEV2 0.0298 0.0007 (0.0291) 0.1853 0.365 Portland LEV1 0.9852 1.0728 0.0876 0.1435 0.675 LEV2 0.0115 1.0132 1.0017 0.0073 0.095 Flour Mills LEV1 4.4761 0.7787 (4.0282) 7.3403* 1.826++ LEV2 9.5584 0.0062 (8.6334) 5.8751* 1.841++ UNTL LEV1 0.0445 0.7787 0.7342 6.2389* 1.826++ LEV2 0.0594 0.0062 (0.0532) 0.0807 0.135 UNIC LEV1 1.9495 0.0255 (1.9240) 4.003* 1.826++ LEV2 1.6598 0.0728 (1.5871) 2.658* 1.841++ Royal Ins LEV1 0.4104 0.2095 (0.2007) 4.5664* 1.826++ LEV2 0.2975 0.0046 (0.2929) 2.0985* 1.841++ Unipetrol LEV1 1.1401 1.7012 0.5611 0.4721 0.675 LEV2 0.5194 0.1064 (0.4130) 0.0027 0.095 National Oil LEV1 0.4518 0.3901 (0.0617) 0.8317 0.675 LEV2 2.7264 0.0503 (2.6761) 0.3145 0.675 UBA LEV1 0.246 0.0453 (0.0201) 0.4071 0.135 LEV2 0.0799 0.0028 (0.0771) 0.0001 0.095 NAL LEV1 0.0841 0.1577 (0.6836) 9.9653* 1.826++ LEV2 0.042 0.0034 (0.0386) 0.1848 1.214++ Source: computations by author (*, + = significance at 5%; ++ = significance at 10%) We measure leverage by using the total debt to total assets (LEV1) and by long term debt to equity ratio. Although our results are mixed, but majority of the firms considered conform to expectation. A few of them did not. Six of the companies considered have recorded reduction in both LEV1 and LEV2; namely, Flour Mills, UNIC, Royal insurance, National Oil, UBA and NAL. Also LEV2 has fallen for Ashaka, UNTL and Unipetrol, while LEV1 has not fallen. This is contrary to expectation. 4.6. Changes in Employment The great fear which most governments have expressed is that, the objectives of efficiency and profitability as a result of privatization can only be achieved at the cost of large scale job losses. In other words, people expect large declines in employment levels following privatization. We examine this by computing the average employment levels for the pre-privatization and post privatization periods in order to ascertain whether employment has actually fallen after privatization. Seven companies record reduction in employment in the post privatization period. Ashaka cement’s staffing strength fell from 1632 to 785.4 on the average. Portland cement and Flour Mills also recorded reduction from 1525.6 to 964 from 461.2 to 417.4 respectively. Also UNIC and Royal insurance record a reduction on the average from 704 to 540 from 489 to 248 respectively. National Oil and UBA have also recorded a decline from 413.6 to 221.4; from 4410 to 3900

ISSN 2039-9340 Mediterranean Journal of Social Sciences Vol. 3 (11) November 2012
217
respectively. These results conform to expectation. On the other hand, three companies have recorded increase in employment in the post privatization period. UNTL recorded increase (on average) from 5498.6 to 7031.4, Unipetrol increased from 529.4 to 588.8 and NAL increased it employment from 235.8 to 257.8 during the post privatization period. This is contrary to our hypothesis. In our sample, Ashaka, Portland, UNIC, Royal insurance and National Oil have recorded significant decreases at 5 per cent level. Table 6. Employment Name of Firm Variable Mean Mean Mean T-test Wilcoxon test Before After Change (-) Ashaka EMPL 1632 785.4 (846.6) 5.5* 1.826 ++ Portland EMPL 1525. 964 (561.6) 1.6375* 1.841++ Flour Mills EMPL 461.2 417.8 (43.4) 0.0025 0.135 UNTL EMPL 5498.6 7031.4 1532.8 0.0782 0.154 UNIC EMPL 704 540 (164) 7.462* 1.826++ Royal Ins EMPL 489 248 (241) 1.117* 1.841++ Unipetrol EMPL 529.4 588.8 59.4 0.0588 0.095 National Oil EMPL 413.6 221.4 (192.2) 2.096* 1.826++ UBA EMPL 4410 3900 (510) 0.0042 0.135 NAL EMPL 235.8 257.4 21.6 0.0675 0.674 Source: computations by author (*, + = significance at 5%; ++ = significance at 10%) 4.7. Changes in Dividend Payouts There is a strong expectation that dividend should increase after privatization. This is because unlike government, private investors generally demand dividend and dividend payouts are a classic response to the atomized ownership structure to which most privatization programs lead (Megginson et al; 1994). It is also expected that earnings per share will increase after privatization since profits are expected to rise. Table 7. Dividend Payout Name of Firm Variable Mean Mean Mean T-test Wilcoxon test Before After Change (-) Ashaka DIVISAL 0.0357 0.0708 0.0351 0.1092 0.135 PAYOUT 0.2969 0.4368 0.1399 0.1787 0.654 Portland DIVISAL 0.0246 0.0053 (0.0192) 0.0228 0.405 PAYOUT 0.12 2.4025 2.2825 0.3699 0.356 Flour Mills DIVISAL 0.1453 0.0376 (0.1076) 0.0096 0.135 PAYOUT 3.1075 1.4410 (1.666) 0.2202 0.944 UNTL DIVISAL 0.0151 0.010 (0.0051) 0.2967 0.135 PAYOUT 0.2779 0.1991 (0.0789) 0.4384 0.345 UNIC DIVISAL 0.9304 0.0248 (0.9055) 0.0006 0.095

ISSN 2039-9340 Mediterranean Journal of Social Sciences Vol. 3 (11) November 2012
218
PAYOUT 0.5234 0.2582 (0.2652) 0.0654 0.365 Royal Ins DIVISAL 0.1765 0.1546 (0.0219) 0.8226 0.944 PAYOUT 0.0473 0.4694 0.4221 0.0008 0.135 Unipetrol DIVISAL 0.0134 0.0117 (0.0017) 0.6937 0.944 PAYOUT 0.4382 0.7409 0.3026 0.2134 0.546 National Oil DIVISAL 0.0194 0.0211 0.0015 0.8697 1.069+ PAYOUT 0.3712 0.4788 0.1075 0.8293 1.069+ UBA DIVISAL 0.0146 0.0308 0.0162 0.073 0.135 PAYOUT 0.7963 0.4364 (0.3599) 0.4415 0.944 NAL DIVISAL 0.0381 0.0706 0.0325 0.1391 0.356 PAYOUT 0.1996 0.3095 0.1099 0.2511 0.436 Source: Computations by author (*, + = significance at 5%; ++ = significance at 10%) We examine these using total dividend payments divided by sales (DIVISAL) and dividend divide by net income (PAYOUT) and changes in earning per share (EPS) following privatization. EPS has shown substantial improvement in all the companies except in Portland, UNTL and NAL where EPS ratios have fallen. It is important to not that EPS did not record substantial increase in UNIC and Royal insurance. DIVISAL and PAYOUT ratios have increased in only three out of the ten companies considered, namely; Ashaka, National Oil and NAL. This implies that investors are better off in these companies. On the other hand, both DIVISAL and PAYOUT have decline in Flour Mills, UNTL and UNIC insurance. Although, this may be attributed to the internal policies of the companies, it is contrary to our hypothesis. Table 8. Earnings Per Share Name of Firm Variable Mean Mean Mean T-test Wilcoxon test Before After Change (-) Ashaka EPS 2.17 4.44 2.27 0.088 0.944 Portland EPS 4.26 1.05 (3.21) 0.0028 0.095 Flour Mills EPS 0.16 1.46 1.29 0.0019 0.135 UNTL EPS 8.17 1.24 (6.93) 0.1329 0.645 UNIC EPS 0.54 0.60 0.06 0.6992 1.509+ Royal Ins EPS 0.53 0.71 0.17 0.3103 0.645 Unipetrol EPS 4.05 7.21 4.05 0.1208 0.944 National Oil EPS 0.75 7.92 7.17 0.0324 1.826+ UBA EPS 0.86 3.46 2.59 0.0768 0.509 NAL EPS 2.07 0.84 (1.23) 0.0115 0.453 Source: computations by author (*, + = significance at 5%; ++ = significance at 10%) 5. Conclusion Despite mixed results, the overall results show improvement in profitability for most of the firms in our sample. Even some of the firms that have recorded reduction in profitability after privatization, if we take other measures into consideration, they are set towards higher profitability in the future. The operational efficiency measures statistically significant change at 5 per cent for most of the firms in our sample. This study also reveals an improvement in capital spending for the six firms in our sample using the two indicators during the post-privatization period. We obtain mixed result in output

ISSN 2039-9340 Mediterranean Journal of Social Sciences Vol. 3 (11) November 2012
219
changes, five firms recorded positive changes, while three firms recorded a reduction in output after privatization. With regards to changes in leverage, in spite mixed results, most firms in our sample have recorded a decline in leverage after privatization. However the cost of borrowing remained high despite access to pubic equity markets. On employment changes, privatization has led to reduction in the number of workers in most of the privatized firms.
We also observe increase in earning per share, whereas dividend has shown substantial decline after privatization in most of the companies considered. This means that shareholders are not better off with privatization. On labor income and welfare, results have shown substantial increase in labor income after privatization in all the firms in our sample. The share of workers income in the firm’s value added shows a significant improvement in all the firms in our sample except for UNIC insurance where the ratio was 29.2% before privatization and 35.7% after privatization. Overall our results provide little evidence that privatization has caused a significant improvement by all indicators.
References
Adi, S and T. Andreyeva (2002): “Company Performance in Ukraine: is this a market economy?” Economic Systems 26: 83-98 Akamiokhor, A. (1986), “Modalities for Successful Privatization: The Role of Exchange Commission CBN Bullion: Vol. 10. No 2.
April/June 1986. Alexander P. (2003): “Ownership Concentration and Performance in Ukraine’s Privatized Enterprises”. International Monetary Fund
(IMF) Staff Papers: Vol. 50, No. 1. Barberis, N., M. Boycko, A. Shleifer and N. Tsukanova (1996): “How Does Privatization Work? Evidence from the Russian Shops”:
Journal of Political Economy. 104: 764-790. Baumol, W. (1980): ‘Public Enterprises in a Mixed Economy’. New York, St. Martins Press Bhaskar V. and M Khan (2001): “Privatization and Employment: A Study of the Jute Industry in Bangladesh”. American Economic
Review: 85:1. Boardman and A. R. Vining (1989): ‘Ownership and Performance in Competitive Environments: A Comparison of the Performance of
Private, Mixed and State-owned Enterprises. Journal of Law and Economics 32: 1-33. Bos, D. (1986): ‘Public Enterprise Economics’, Elsevier, Amsterdam Boubakri, N and J. C. Cosset (1998): “The Financial and Operating Performance of Newly Privatized Firms: Evidence from Developing
Countries”. Journal of Finance 53 Boubakri, N., J. Cosset and O. Guedhami (2004): “Privatization, Corporate Governance and Economic Environment: Firm-level Evidence
from Asia”. Pacific-Basin Finance Journal 12: 65-90. Boutchkova, M. and W. Megginson (2000): “Privatization and the Rise of Global Capital Markets,” Financial Management 29: 31-76. Boycko, M. Andrei, S. and Robert W. Vishny (1996): “A Theory of Privatization”. The Economic Journal 106 (March), 309-319. Brett, A.E. (1988): ‘States, Markets and Private Power: Problems and Possibilities’, pp. 47-67 in Cook and Kirkpatrick (eds.)
Privatization in LDCs New York. Briggs, A., (1961): “The Welfare State in Historical Perspective,” Archives European Sociologie 2.2: 221-159. Claessens, S., S. Djankov and G. Pohl (1999): “Ownership Concentration and Corporate Performance in the Czech Republic”, Journal of
Comparative Economics Vol. 27(2): 498- 513. Commander, S. and Killick, T. (1998): ‘Privatization in developing Countries: A Survey of Issues’, pp. 91- 124, in privatization in LDCs.
(ed), Cook and Kirkpatrick. Cook, P. C. and Kirkpatrick (1998) Privatization in Less Developed Countries: An Overview, in privatization in, ibid. D’Souza, J. and W. L. Megginson (1998): “Source of Performance Improvements in Privatized Firms: Evidence from the
Telecommunications Industry”. Working Paper, University of Oklahoma. D’Souza, J. and William L. Megginson (1999): “Financial and Operating performance of Privatized Firms during the 1990s”: Journal of
Finance, Vol. 54. No 4. David Sappington E. M. and J. E. Stiglitz (1987): “Privatization, Information and Incentives,” Journal of Political Analysis and
Management 6: 568- 582. Davis, J., R. Ossowski, T. Richardson and S. Barnett (2000): “Fiscal and Macroeconomic Aspects of Privatization,” IMF Occasional
Paper 194. Dewenter K. L. and P. H. Malatesta (2001): State-Owned and Privately Owned Firms: An Empirical Analysis of Profitability, Leverage,
and Labor Intensity. American Economic Review Vol. 91: 1, pp. 320-334. Dewenter, K and P. Malatesta (1997) ‘Public Offerings of State-Owned and Privately-Owned Enterprises: An International Comparison’.
Journal of Finance 52(4): 1659-1679. Eckel, C., D. Eckel, and V. Singal (1997): “Privatization and Efficiency: Industry Effects of the Sale of British Airways”. Journal of
Financial Economics 43: 275-298. Eric Berglof and Gerard Roland (1998): “Soft Budget Constraints and Banking in transition Economies,” Journal of Comparative
Economics 26: 18- 40. Federal Republic of Nigeria (1986): The Structural Adjustment Program for Nigeria, July 1986 – June 1988. Frydman, R., Gray, C., M. Hessel, and A. Rapaczynski (1997): “Private Ownership and Corporate Performance: Some Lessons
Transition Economies”. World Bank, Working Paper 26. Frydman, R., M. Hessel and A. Rapaczynski (2000): “Why Ownership Matters: Entrepreneurship and the Restructuring in Central

ISSN 2039-9340 Mediterranean Journal of Social Sciences Vol. 3 (11) November 2012
220
Europe,” C. V Starr Centre for Applied Economics, Working Paper. New York University Galal, A., L. Jones, P. Tandom and I. Vogelsang (1992): ‘Welfare Consequences of Selling Public Enterprises’. The World Bank,
Washington D. C. Hanke, S. (1987): Introduction in S. Hanke (ed), Privatization and Development, San Francisco Institute of Contemporary Studies. Hemming, and Mansoor, A. (1988): “Is Privatization the Answer?” Finance and Development, pp. 31-32. Henry, H. and R. Kraakman (2000): “The End of History for Corporate Law,” Working Paper NYU and Harvard Law School. IMF (1986): World Economic Outlook, Washington D.C. Iwayemi, A., (1995): “Macroeconomic Policy Issues in an Open Developing Economy: A Case Study of Nigeria”, NCEMA. Ibadan Jackson, P, M. and Palmer, A.J. (1988): ‘The Economics of International Organizations, the of Parastatals in LDCs’, in Cook and
Kirkpatrick (eds.) Privatization in …op. cit. Janos Kornai (1998): “Individual Freedom and Reform of the Socialist Economy,” European Economic Review 32: 233- 267. ____. (1993): “The Evolution of Financial Discipline under the Post-socialist System,” Kyklos 46(3): 315- 336. ____. (2000): “Ten Years after ‘The Road to a Free Economy’: The Author’s Self Evaluation,” Working Paper, Harvard University. Jerome, A., (1996): “Privatization of Public Enterprises in Nigeria: Expectation Illusions and Reality”, in Ariyo, A. (ed), Economic Reform
and Macroeconomic Management in Nigeria, Ibadan. Ibadan University Press Kelly Olds (1994): “Privatizing the Church: Disestablishment in Connecticut and Journal of Political Economy: 102: 2. La Porta, R. and F. Lopez-de-Silanes (1999): “Benefits of Privatization: Evidence from Mexico”. Quarterly Journal of Economics. Vol.
114: 1193-1242. Laffont, J. and J. Tirole (1993): A Theory of Incentives in Procurement and Regulations. Cambridge, MA: MIT Press. Lesser, B. (1991): “When Government Fails, Will Market Do Better?” The Privatization/Market Liberalization Movement in Developing
Countries”, in Canadian Journal of Development Studies (1): 159-172. Martin, S. and D. Parker (1995): “Privatization and Economic Performance throughout the UK Business Cycle”. Managerial and Decision
Economics 16, 225-237. Megginson W. L. and Jeffry M. Netter (2001): “From State to Market: A Survey of Empirical Studies on Privatization”. Journal of
Economic Literature Vol. 39: 321-389. Megginson, W. L., Nash, R. C. and Randenborgh, M. Van (1994): “The Financial and Operating Performance of Newly Privatized Firms:
An International Empirical Analysis”. Journal of Finance: 49(2): 403 - 452. Megginson, W. L., Nash, R. C. and Randenborgh, M. Van (1994): “The Financial and Performance Newly Privatized Firms: An
International Empirical Analysis” Journal of Finance 49(2): 403-452. Mike, I. O., T. A Jerome and A. V. Agba, (2001): “Poverty Implications of Privatization and Liberalization in Nigeria”. NCEMA Policy
Analysis Series, Vol. 7, No. 2. Nandini Gupta (2004): “Partial Privatization and Firm Performance”. Journal of Finance (forthcoming) Ndonkgo, W. (1991): “Commercialization as an Alternative to Privatization: Prospects and Problems”, African Development. Newbery, D. and M. G. Pollitt (1997): “The Restructuring and Privatization of Britain, CEGB- Was It Worth It?” Journal of Industrial
Economics Vol. 45: 269-303. Obadan, M. I., and A. Ayodele (1998): Commercialization and Privatization Policy in Nigeria Ibadan, Nigeria. Pohl, G., R. Anderson and S, Djankov (1997): “Privatization and Restructuring in Central and Policy Options”. World Bank Technical
Paper No. 368. Qian, S and William H. S. Tong (2003) ‘China Share Issue Privatization: The Extent of Its Success’. Journal of Financial Economics 70:
183- 222. Qian, S. and Wilson H. S. Tong (2002) ‘Malaysia Privatization: A Comprehensive Study’. Financial Management. Winter: 79-105. Ramamurti, R., (1997) Testing the Limits of Privatization: Argentine Railroads, World Development 25: 1973- 1993. Saul, E. and A. Rosevear (1999): “Enterprise Performance and Ownership: The Case of Ukraine”. European Economic Review 43: 1125-
1136. Sheshinski, E., and L. F. Lopez-Calva (1999): “Privatization and its benefits: Theory and Evidence,” HIID Discussion Paper 698, Harvard
University. Shirley, M. and P. Walsh (2000): “Public versus Private Ownership: The Current State of the Debate,” Working Paper, World Bank. Washington DC. Shleifer, A., (1998): “State versus private Ownership,” Journal of Economic Perspectives 12: 133- 150 Stiglitz, J., (1998): “The Private Uses of Public Interests: Incentives and Institutions,” Journal of Economic Perspectives 12: 3-22 TCPC (1993): The Presidency, “Technical Committee on Privatization and Commercialization” Final Report, Vol. 1; (Main Report). Usman, S. (1989): ‘Privatization and Economic Growth, the Nigerian Case Experience’. Vieteljares Berichte, 116:181-186. World Bank (1981): ‘Accelerated Development in Sub-Saharan Africa; an Agenda for Action’, Washington D.C. Xiaowen, T. (2001): “Privatization and Economic Performance: Evidence from Chinese Provinces”. Economic Systems 25: 65-77. Yarrow George (1986): “Privatization in Theory and Practice” Economic Policy, Vol. 2: 324- 364 Zuobao, W. and O, Varela (2003) ‘State Equity Ownership and Firm Market Performance: Evidence from China’s newly privatized Firms’.
Global Finance Journal 14: 65-82. Zuobao, W., O. Varela, J. D’Souza and M. K. Hassan (2003) The Financial and Operating Performance of China’s Newly Privatized
Firms. Financial Management. Summer: 107-126.

ISSN 2039-9340 Mediterranean Journal of Social Sciences Vol. 3 (11) November 2012
221
An Investigation of Pakistani L2 HI Writers’ Perceptions of Previous Writing Experience in L2: Implications for Literacy Development in Pakistan for HIC
Ghulam Haider
Department of Special Education University of the Punjab, Lahore
email:[email protected]
Doi:10.5901/mjss.2012.v3n11p221
Abstract: Writing, unlike speaking, is not an ability we acquire naturally, even in our first language - it has to be taught. Unless L2 HI Writers learners are explicitly taught how to write in the new language, their writing skills are likely to get left behind as already their speaking skills are not naturally developed. But teaching writing is not just about grammar, spelling, or the mechanics of the Roman alphabet. Learners also need to be aware of and use the conventions of the genre in the new language. Case studies in second language (L2) writing with hearing students also reveal how difficult it is for non-native English-speaking (NNES) students to write in English despite their time and effort invested in writing and high English language test scores. Present study explored H.I students’ needs and perceptions that would eventually lead to offer the right assistance. Extending the line of previous research, this study investigated the H.I students’ perceptions and views of an academic writing course designed by the Punjab Text Book Board. Keywords: Writing difficulties, Perceptions about L2, teaching of writing in L2, written expression, difficulties faced by Hearing Impaired Children, Process Approach in Writing. 1. Introduction Writing especially in English which is taught as Second Language in Pakistan, seems to be one of the biggest challenges that many students face but it is often posited that the reading and writing of English are difficult for deaf children because they are tempting to read and write a language they “don’t know” (Mayer.1999).Writing is also one of the criteria used to measure progress and make major academic decisions (Leki, 2007). Writing has always been seen as an important skill for the achievement of academic grades in schools. Case studies in second language (L2) writing with hearing students also reveal how difficult it is for non-native English-speaking (NNES) students to write in English despite their time and effort invested in writing and high English language test scores (Belcher & Connor, 2001; Connor, 1999; Leki, 2007; Spack, 1997).
Writing is certainly an important element of learning English as a second language. This importance is eventually derived from the fact that it reinforces grammatical structures, vocabulary and idioms that we have been teaching to our students. Because many L2 writers, even those who possess adequate sentence-level knowledge of grammar and vocabulary, have difficulties writing well-organized essays just as Kaplan found in his L2 writing classes (Kaplan, 1966). Contrastive rhetoric (CR) has discussed this issue and explored written discourse beyond the sentence level or organization patterns of written texts. According to Matsuda, (2003)Kaplan’s attempted to look into L2 texts to find out why NNES students write with a “written accent” at the discourse level. After a careful examination of essays written by L2 writers, Kaplan (1966, 1987) reported that different cultures and languages have their preferred ways of organizing texts and those culture-specific rhetorical preferences transfer to L2 writing making L2 texts look different from L1 texts written by native English speakers. That is why it is claimed that writing should receive more attention in ESL classes in order to prepare learners to cope with the academic demands. Undoubtedly, the purpose of teaching writing skill in Pakistan is to prepare learners to attain a better academic achievement and produce a well-structured piece of writing which is recognized and accepted in their academic departments. Exposing the learners to the writing process itself is then a better way for achieving this goal. Writing skills can be developed when the learners' interests are recognized and when they are exposed to situations where they can produce authentic piece of writing. Consequently, a writing program is expected to be structured in such an effective way to meet the expectations and needs of the learners. The literature has exposed a number of researchers addressed the need for ESL students (Hinkel, 2004; Hyland, 2004; Ferris and Hedgcock, 2005). The Lahore Board syllabus of Inter class’s English writing was found to mainly address classroom genres such as compare and contrast, cause and effect, and problem-solution, but it neglected writing for occupational

ISSN 2039-9340 Mediterranean Journal of Social Sciences Vol. 3 (11) November 2012
222
purposes such as helping students to develop competence in the specific genres that can assist them in their academic study, workplace and their lives in general.
Writing is really seen as a process of discovery as the writers try to find their way while they are struggling to think, compose and put their ideas together. In that way, it is not looked at as a static process but as a cognitive, social and dynamic one. Olive, Favart, Beauvais and Beauvais (2009) in their study to investigate the cognitive effort of students while writing, found that the cognitive effort interacted with genres. They indicated that students’ cognitive writing effort decreased or increased when they were writing certain types of texts such as argumentative and narrative texts. During the process of writing you may discover an idea which is new to you and you have never thought of before. Zamel (1983) argued that writers discover and formulate ideas as they go through the process of writing. Worldwide, it is common knowledge that deaf children struggle with language and reading/writing although the fairly recent development of equipment such as digital hearing aids and cochlear implants has made a significant difference to those who have access to such technology. However, these developments too have introduced many challenges, notably the ongoing battle between those advocating the teaching of spoken language and those recommending that deaf children learn sign language. For example, according to Woll (1998, 58), “how normal development can be best achieved, and which language or languages should be learnt, is a continuing source of controversy.” Another challenge is that in order for the acquisition of either spoken language or sign language to be most successful, detection and intervention for the deaf child needs to happen as early as possible (cf. Marschark 1993, 17; Pauw 2002, abstract; Schröder 2004, abstract). Many developed countries, such as the United States, have made strides towards early detection and intervention with universal newborn hearing screening (UNHS) (Downs 2007, 161).
However, in Pakistan, a developing country, advanced technology, such as cochlear implants, is not available to many, and UNHS is still not a reality countrywide. Instead of deafness being identified by screening, in Pakistan most identification of hearing loss happens passively when parents become concerned that there is something wrong with their child. In addition, deafness may go undetected for some considerable time. In Pakistan sometimes deafness is only diagnosed when the child is between four and eight. As a child develops language best in the first two years of life, late diagnosis means that many Deaf children start Grade R with “little or no language” and the “average Deaf school-leaver leaves school with a reading age of 8”. Consequently, three quarters of Deaf people are “functionally illiterate” and 70% do not have work.
The writing levels that children develop while at school determine their academic and career potential after completing their education, it is necessary to establish the extent of the challenges facing deaf children. The lack of research on the written English abilities of deaf learners in Pakistan is also an issue that demands attention. Due to these deficiencies an entire grade of deaf learners fail every to pass their final year at school.
Thus, a genuine writing task should place a learner in situations that require authentic use of language to communicate. The Compulsory English Syllabus of Punjab Text Book Board for HSSC has failed to prepare H.I students to cope with such demands. Students in Pakistani community are expected to be able to produce an acceptable academic text by the time they start their academic courses in their colleges without exception of hearing impairment and without hearing impairment. However, many of them are found to fail to meet their examiners’ requirements in producing an appropriate piece of writing which is both linguistically and communicatively valued by experts. Thus, exploring H.I students’ needs and perceptions will eventually lead to offer the right assistance. Extending the line of previous research, this study investigated the H.I students’ perceptions and views of an academic writing course designed by the Punjab Text Book Board. 2. The Purpose of the Study L2 writing is a complex process which involves various factors such as the writer, the writing process, sociocultural contexts, the text as a final product, and so on. Researchers for example; (Hinkel, 2004; Hyland, 2004; Ferris and Hedgcock, 2005) studied mostly texts, the final products, to find out why L2 texts differ from those written by native speakers. In these studies culture was viewed as the main source of the difference. However, culture is a complex notion to define and it might be dangerous to base a study on an uncertain concept. Thus, increasingly, there is need to look into more concrete evidence than culture to explain writing differences. Writing has been seen as the most challenging skill for number of Pakistani H.I students who have been studying English (compulsory) as part of the requirements of the HSSC. Hearing impaired children are always in the difficult position of having to learn the written form of English when they have only limited or partial access to the primary spoken code. Yet deaf students are required to read and write on a regular basis (Mayer,1999) although the products and processes of all this activity have been widely studied, the attention to the H.I students’ perceptions of writing in English as Second Language has been less well investigated.

ISSN 2039-9340 Mediterranean Journal of Social Sciences Vol. 3 (11) November 2012
223
Hence, the main objective of the present study was to investigate H.I students’ perceptions of writing in English as Second Language.
As shown in previous studies, it is important for L2 educators to know their students perception of L2 Writing for effective teaching and learning. Writing is mostly learned in school, unlike other language skills. Since yet no research has investigated the perception of Pakistani H.I writers about L2 writing,the main objective of the present study was to investigate students’ perceptions of writing in English as Second Language through a questionnaire with the following research question: 3. Research Questions How do students with hearing impairment perceive writing in English? 4. Literature Review In the past much of the research on the language development of children who are deaf or hard of hearing consisted of analysis of their written language productions (Kretchmer & Kretsschmer,1978;Moores,2001;Paul,1998;Quigley & Kretsschmer,1982; Rose,McAnally & Qigley,2004, cited in Paul,2009).
According to Chomsky (1988, 2006) language performance or production does not provide a complete accurate picture of language competence. Likewise the studies for example(Everhart & Marschark,1988; Marschark,2005,2007,cited in Paul,2009; Marschark,2007;Marschark,Lang & Albertini,2002; Moores,2001,2006; Rose et al,. 2004;Schirmer,1994,2000;Stewart & Clarke,2003 Stewart & Kluwin,2001) discussed educational issues including language and literary involving children with hearing impairment. Researchers for example (Moores,2001,2006 and Paul,1998) stressed upon the fact that lower writing skills are reflective of their ( deaf students) reading skills. On the other hand Marschark,(2005,2007) pointed out that the situation is much more complex than reading writing connection.
A compelling way to illustrate the writing problems of a number of deaf or hard of hearing students is to present a sample of their written language productions (Paul, 1999). These samples are drawn from the studies for example (Qigley & Kretchmer, 1982; Quigley, Wilbur,Powr,Montanelli & Steinkamp,1976).
Despite a big variety of studies there is a tremendous amount of ambiguity involved in understanding and answering the questions about the perception of HI ESL student writers about writing in L2. Writing is not a unitary skill (Paul, 1999, pp, 322).
Researchers for example (Adams, 1990; Snow, Burns & Griffin, 1998; Tierney & Pearson, 1983) stress upon the view that reading and writing share underlying processes.
Researchers (Adams, 1990; Chall, Jacobs, & Baddwin, 1990; McGuinness, 2004, Snowling & Hulme, 2005; Treiman, 2006) have demonstrated that poor readers are also poor writers.
Researchers (Moores, 2001, 2006; Paul, 1998; Rose et al., 2004) have reported that students with severe to profound hearing impairment are poor writers because they are poor readers.
Writing is not merely a representation of an individual thought (Paul, 1999). This is the supported by Vygostky,1962; Paul,1998; Williams,1994,2004;Aram,Korat & Levin,2006;Graves,1994;Sulzby & Teal,1987,2003).
Furth the studies of (Bereiter & Scardamalia,1983,1987;Czerniewska,1992) discussed natural instructional approach(Paul,1999).
The emphasis of these and other contemporary approaches to writing is on generating meaning(rather than correctly recording or transmitting what already exists)………(Laine & SCHULTZ,1985,PP,16,CITED IN Paul,1999,pp,328).
In short a big number of studies on writing with deaf or hard of hearing learners (mentioned above) have revealed that deaf or hard of hearing students have lower performance on written language than younger hearing students and their writings vary greatly from standard English. Using a transformational grammar framework, the findings have revealed that a number of deaf or hard of hearing students have great difficulty in understanding and producing complex structure in writing(Paul,1999,pp,356).
All of the above mentioned studies have comprehensively discussed writing, perspective on writing two major aspects of writing but none has discussed the perception of HIC towards writing in L2. So the major objective of this literature review was to provide a discussion of the development of writing and to relate this to the perception of HIC toward writing. As in the words of Paul(1999) writing is even more difficult than reading for a number of these individuals. And if it is in L2 it becomes even more difficult and complex process for such individuals.
ISSN 2039-9340 Mediterranean Journal of Social Sciences Vol. 3 (11) November 2012
224
5. Methodology Participants A total of 100 higher secondary school 1st year students responded the questionnaire. Twenty respondents were excluded from the study because they did not complete the questionnaire. The final data used for analysis came from 80 participants, of whom 52 (65%) were males and 28 (35%) were females. They were recruited from the same school and represented those students with no missing values. Most of the students had reached 17 years of age and had been learning English language for 11 years, since primary school, class one by the time the questionnaire was administered. Procedure Questionnaire Development The pilot study. The first draft of the questionnaire was adapted from Kobayashi and Rinnert’s (2001) study and piloted during summer holidays in 2009 with 50 higher secondary school HIC 1ST Year students Lahore, Pakistan. The data gathered from the questionnaire containing 47 Likert-scale question items and seven open-ended questions was analyzed both quantitatively and qualitatively. Principal components analysis (PCA) was conducted to explore the underlying patterns in the questionnaire (Brown, 2001). After running PCA several times with different numbers of components to get the clearest pattern without any complex items, a five-factor solution was chosen. The scree plot also supported the five factor analysis. Based on the PCA, a final version of the questionnaire was developed. Some items were dropped because they did not seem to work with the HI students in the pilot study, given that they either yielded low mean scores or did not load on any factor. Some of the eliminated items were focus on handwriting, neatness, and spelling, writing poems or novels, and individual conferences with teacher. Answers to open-ended questions led to slight modifications as well. Finally, interviews with a ESL teacher, also helped refine the original questionnaire in modifying or discarding bad items. The questionnaire The final version of the questionnaire comprised a total of 39 closed-ended items organized into four subsections: reading and writing; text types; writing processes; and assessment criteria. Seven check-list types of questions and open-ended questions were included. The open-ended items consisted of student other comments for each of the four subscales of the closed-ended items, together with types of teacher feedback, frequency of short/longer pieces of writing, writing in other subject matters, and writing instruction inside/outside of school (see Appendix A). Procedure After the approval of initial research design by an expert ESL Teacher the researcher contacted a Higher Secondary Special Children (HI) School in Lahore, Pakistan and got consent from the school principal. Then the researcher showed all the materials (including the questionnaire and letters to the principal, teachers, and students) to the school for ethical considerations. The questionnaire was administered to 200 1st year students during a regular homeroom class period in September, 2009. It took approximately 40 minutes for students to complete the questionnaire. A total of 100 copies of the questionnaires were received and the final complete set of 80 respondents was analyzed. 6. Results The results of this study are presented in two main sections: the responses to Likert-scale items and the responses to open-ended items. The quantitative data from Likert-scale items is presented in the following order: descriptive statistics, reliability estimates, and principal component analyses. The qualitative data from open-ended items is described in terms of the subsections that correspond to sections of the questionnaire as follows: student other comments for each of the four subsets of closed-ended questionnaires (reading and writing, types of writing at different grade levels, the writing process, and assessment criteria), types of teacher feedback, amount of writing, writing in other subject matters, and writing instruction inside/outside of school. Reading and writing In order to investigate how writing is taught in L2 classes, nine general questions about reading and writing were asked. Study results showed that, the two activities that the students were most frequently engaged in were reading/learning structures and language features of modern literary works and old/middle classics with high means of 2.31 and 2.28, respectively. The most common choice for both items was 3 (Often): 85% of the 80 (n=68) students responded that they did not learn text structures and language features of modern literary works and 15% answered they learn text structures

ISSN 2039-9340 Mediterranean Journal of Social Sciences Vol. 3 (11) November 2012
225
and language features of old/middle classics. Aspects of writing that were sometimes taught included considering authors’ purposes and perspectives, evaluating content, and learning grammar and mechanics. Finally, activities related to writing texts such as learning how to organize texts and writing various types of texts are perceived as rarely taught. Text types Results show the types of texts that students usually write in L2 classes from grade 1 to grade 11. Diary seems to be the most frequently written genre in Pakistani Special schools with a mean score of 2.02 (note that 2 means sometimes on the Likert scale in the questionnaire). The mean scores of the other text types range from 0.51 to 1.79. Book reports, argumentative essay, summary, report, news report, and personal letter seem to be written once in a while with means ranging from 1.41 to 1.79. Text types that are rarely written include critique, travel narrative, reflection, explanation, and biography (autobiography) with very low mean scores ranging from .51 to 1.00. Writing processes According to the results, all nine items in this part had substantially lower means than those in the other three parts (Note that all nine items were positively skewed with a mode of 1 (Rarely). Identifying the audience and purposes of texts before writing is ranked first followed by revising (content, organization, editing, etc) and organizing ideas. The next three items were all related to actual writing: How to write appropriately for the intended audience and purposes, how to write a paragraph, and how to choose appropriate words or expressions. Self/peer feedback, how to generate ideas, and how to connect paragraphs using transitional devices seemed to be rarely taught in L2 classes in grades 1 through 11 with mean score(1.49, maximum and 1.19 minimum). Assessment criteria Results indicated that more than 90% of the respondents answered that formulating one’s own opinions (persuasiveness) and clarity of main ideas are the important criteria in assessment with mean score (2.53). Ability to express personal impressions/feelings, logical organization of content, accuracy of information presented in content, accuracy in language use (grammar and word choices), and ability to write for the audience and purposes are perceived as moderately important. Effective use of stylistic strategies (e.g., imagery, metaphor, emphasis) and using information from outside sources (Citations) are perceived least important with low means and modes. Student Other Comments on the Four Subsets of Closed-ended Items Reading and writing (Literacy) A total of 12 students (15 % of the 80 candidates) commented on reading and writing. Some of them added some reading and writing activities that were not provided on the questionnaire: ‘tips for college entrance essay exams, ‘making class newsletter’, ‘reading literary works of their choice’, and ‘keeping small-group diaries’. Three respondents expressed their wish to learn more about grammar. 25 students mentioned few opportunities to write: ‘no opportunity to write’, ‘no composition’, and ‘learning about writing without actual writing’. Other comments on reading included: ‘two much emphasis on literature’, ‘reading only for exams’, and ‘no real reading’. Text types A total of 09 respondents (11%) commented on the text types. Three respondents said that they had written such text types that were not on the questionnaire as ‘newspaper reviews’, ‘free writing on given topics’, ‘speech scripts’, ‘poetry’, ‘advertisement’, and ‘short stories’. Four respondents mentioned that some types, for example, diaries and letters, were assigned more often as homework than as class activities. The rest of the comments are as follows: ‘Diaries and letters are easy to write, but reports and travel narratives are difficult to write’, ‘I didn’t get any feedback on my writing from the teacher’, and ‘Writing is supposed to be emphasized more in high school rather than in elementary school.’ Types of writing at different grade level A total of 55 students (69%) responded to the elementary school section and 19 (23%) students to the middle school section. Only 13 (15%) students responded to the high school section. Diaries and explanations appeared to be the two most frequently written text types at the elementary school level. In middle school, paragraph writing, letters, applications, and summaries are the most familiar types to the respondents. Similarly, paragraphs, letters, applications essays, and summaries are frequently written in high school. In terms of the number of text types that students learn, there was not so much difference among the three grade levels with eight types in elementary school, 10 in middle school, and nine in high school.

ISSN 2039-9340 Mediterranean Journal of Social Sciences Vol. 3 (11) November 2012
226
Writing Processes Only nine students responded to this section. Four students said that they learned ‘grammar’ and ‘strategies for writing an interesting introduction’. The rest five respondents said that they did not learn anything about writing processes their L2 classes. Assessment criteria A total of 08 students wrote additional assessment criteria such as ‘neat handwriting’, ‘meeting page limit requirements’, ‘meeting due dates’, ‘creativity’, ‘originality’, ‘making persuasive arguments with appropriate examples ’, and ‘cheating’ here the meant plagiarism by cheating. Types of Teacher Feedback In this section, the students were allowed to choose all options that applied. Of the comments 150 made by students, 90 (60%) were final grades, followed by credit/non-credit type of feedback n=20(14%). Comments on content, direct error correction and overall comments on strengths and/or weaknesses do not seem to be major types of teacher feedback in Korean language arts classes. Some of the student comments in the other category are as follows: My teachers don’t write any comment on my assignment, he just awards marks. (Participant 25) Since my class 1 none of my teachers wrote any sentence on my paper except marks. (Participant 16) I think teachers always give importance to grammar and correct sentences or hand writing (Participant 10) I once asked my teacher to write a sentence on my paper he smiled and ignore. (Participant 55) Amount of Writing Results showed the overall patterns in the frequency of writing, regardless of length. The average number of short writing pieces (less than 2 pages) each school year in elementary school is much greater than that in high school: n=55 (68%) respondents answered that they wrote more than 3 pieces of short writing in elementary school whereas only n=10 (13%) did for grade 10 and n= 12 (15%) for grade 11 . Similarly, the average number of longer pieces of writing (more than 3 pages) in elementary school is lesser than that in high school, n= 65 respondents (81%) answered that they did not write more than 3 pieces of longer writing in elementary school whereas most of the respondents did not seem to write anything longer than 3 pages during regular classes in grades 10 and 11 (notice more than half of the respondents chose ‘Never’ for grades 10 and 11, 45 (56%) and 49 (61%) respectively). These results indicated that writing is not an important class activity in grades respectively. Interestingly the number of the respondents who chose ‘never’ for each grade level considerably increased from high school to inter classes . Writing in Other Subject Matters A total of 80 participants responded they had more writing assignments from Urdu language than English classes. The subjects include math, social studies, science and Islamiat,. The text types of homework assignments included explanations, summaries, paragraph writing, and essays. The respondents perceived that the purpose of the homework assignments was to engage them in the content areas or to complete the syllabus by assigning them home assignment. Writing Instruction Inside/Outside School
The results showed that 90% of the students answered that they had not taken any special writing classes in school because school did not provide them any special class for writing in L2. 80 percent said that they learned essay writing outside school either at academies or with tutors. The students commented that the course contents of English Compulsory in school and in academies are more or less the same. 7. Discussion In this section the findings from the present study were discussed as follows: (a) instructional practices in L2 classes in terms of reading and writing, text types, writing processes, and assessment criteria, and (b) whether there are any noticeable instructional practices regarding writing that L2 writing educators for HIC at the post-secondary level need to know. HI Students’ Perceptions of L2 Writing Reading and writing The results showed that reading literature is much more emphasized than writing in English classes. The two

ISSN 2039-9340 Mediterranean Journal of Social Sciences Vol. 3 (11) November 2012
227
predominant class activities are related to reading, not writing: learning textual structure and language features of old and modern Korean literature such as poetry, novel, short story, drama, and nonfiction and learning reading skills for interpreting the author’s purpose and main ideas of texts.
Literature, reading skills and non literary genres are included in English compulsory syllabus for intermediate classes but focus is on reading skills in general. The examination board has designed an objective subjective paper pattern for intermediate exam. verbal section consists of a reading section, with varying types of reading comprehension questions, including grammar, language usage, and questions about short and long reading passages, but does not have a writing section. Perhaps it makes more sense for both teachers and students to spend more time reading than writing.
These reading-oriented classroom practices are dominant. It is interesting, however, that nonliterary genres such as summaries, letter writing, essays, application writing, dialogues and explanation with reference to the context, are not an important part of reading activity; rather, they are frequently assigned as writing homework without instruction or guidelines. As one student responded, ‘applications and letters are easy to write, but paragraphs and essays are difficult. I don’t know how to write them’. Perhaps students need instruction on nonliterary genres in order to write those texts.
As for writing, the students have few opportunities to generate texts, except diaries. They learn specific writing skills such as text organization. Even though the students have little experience of writing, they can still develop schemata for writing through reading. In the case of the students in the present study, it is likely that they have acquired the habit of cramming for all of the literary genres but know little about nonliterary genres. It might be said they find it difficult to convert construct idea into a real word. Lunsford (1979) references Vygotsky and Piaget, summarizing that students form concepts from day to day learning but can not think scientifically about these concepts by separating themselves, defining them, and drawing inferences on them. With regard to academic writing at the higher-secondary level, if the students transfer their cramming habits to literary genres and experience of composing personal writing to academic writing L2, they would probably have difficulties dealing with academic writing demands in terms of organization, textual structures, language features, among others. In Pakistan there is still need to explore the negative impacts of L1 on L2. I intend to explore the impacts of L1 on L2 while writing. The text books and past papers indicate that literary genres are not the typical types of texts required at higher secondary school level in Pakistan. Considering the importance of writing at the higher-secondary level, this lack of schemata for academic genres can be a serious disadvantage to students in their academic lives. Therefore, our English course for intermediate needs to familiarize the students with textual structures and language features of nonliterary genres so that they can develop enough schemata for those texts to handle academic writing. Text types The results show that the students have done little writing in L2 (English) classes they were not exposed to various types of texts. The only text type that the students reported as writing sometimes is a diary; the other text types are rarely written. Paragraphs, essays, summaries, and letters are written more often than others. Only 03 students added in the other comments section of the questionnaire some other text types that are not included on the questionnaire, such as newspaper reviews, free expressive writing, speech scripts, poetry, advertisements, and short stories. All those text types except argumentative essays are usually assigned as homework and the purpose of the assignments is to either police students, i.e., checking whether students did assigned reading or have students practice sentence-level accuracy. The result indicated that L2 essay is the most important text type for the students in this study. There is no arrangement for essay writing skills in schools. Of the 80 respondents in the study, 74(90%) said they did not take extra writing courses in school to learn essay writing in L2 and only 4 (5%) answered that they learnt writing in Academies. A L2 teacher interviewed for this study also reported that he provided tips for writing clear, logical essays in his regular classes as well as in specialized classes after school. This is an interesting finding that is opposite to previous research findings that Asian students, including Korean students, do not receive explicit writing instruction and have little experience with argumentative essays (Carson, 1992; Eggington, 1987; Hinds, 1990; Liebman, 1992). Writing processes The students appear to think that they have learned little about the writing process as shown in the much lower mean scores of the nine closed-ended items in this subscale than those of the other subscales. Only one of the students had anything to add in the other comments section of the questionnaire related to the writing process. He pointed out that he could not remember learning anything about the process in L2 (English) classes. This lack of instruction on the writing process may be caused by the underlying assumption among teachers and students that writing expertise is not something to be accomplished through training. Moreover, writing is seen as generating a text as a final product for homework or grades once or twice a term. Writing as a product approach seems to make the teacher and students concerned more about accuracy than fluency or improvement in the whole process of writing. Results clearly showed that

ISSN 2039-9340 Mediterranean Journal of Social Sciences Vol. 3 (11) November 2012
228
classroom instructions are more focused on accuracy, such as grammar and editing, than the process, such as writing multiple drafts, giving and receiving feedback from peers and the teacher, revision, etc. This product-oriented approach to writing is also found in the types of teacher feedback on student writing: most of the comments reported (e.g., final grades, credit/non-credit, and error correction) are directly related to final grades rather than for revision or multiple drafts. The aforementioned lack of writing experience is also shown in the low mean scores of the two items directly related to producing texts, especially essays: how to generate ideas and how to connect paragraphs using transitional devices. Even though the students occasionally write diaries, book reports, summaries, and reports, generating ideas and making coherent organization are not necessary skills in composing such texts. The results revealed students’ interest in essay writing: three items regarding paragraph and text organization and two items regarding the audience and purpose. This is an important change in the attitude toward writing, although the awareness of the audience, purpose, and logical organization does not necessarily guarantee improvement in text quality (Casanave, 2004). Assessment criteria The descriptive statistics showed that the two most important criteria for the teacher are persuasiveness of arguments and clarity of the main idea. The next important criterion, ability to express personal impressions and feelings, reflects instructional practices that are focused on literature and personal writing. The least important criterion is how to use outside sources (citations). Considering high school students do not write research papers (note that of the 80 who responded to the amount of writing item, 53 (66%) students reported they never wrote anything longer than three pages in inter class part-1), there is no need to teach or learn using outside sources properly to avoid plagiarism. The results showed similar pattern in that ‘Ability to write for the intended audience and purposes’, ‘Accuracy of information included in content’, and ‘Clarity of main ideas’ load heavily on component three (i.e., ‘Assessment criteria’). This pattern makes sense because most of the writings the students have done in high school are informative writing, such as reports, class newsletters, and summaries. The other items that load moderately on this component include ‘Logical organization of content’, ‘Ability to express personal impressions well’, ‘Persuasiveness’, and ‘Using information from outside sources’. It is interesting that the students seem to view citation as a matter of accuracy rather than a way of adding authority to their writing by using outside sources or giving credits to other people’s ideas. In sum, the result gives a nice picture of L2 (English) classes: interest in essay writing due to marks oriented exams, emphasis on essay writing, and concern for accuracy. Writing experiences outside the school The qualitative data from the other comments sections and the open-ended items suggest that the students want more opportunities to write and have a practical need for learning how to write argumentative writing. However, most of the writing is assigned as homework without any clear guidelines or instruction. Also, the purpose of teacher feedback is not to improve writing in subsequent drafts, but to correct mistakes in grammar and mechanics. Some students may want more detailed feedback to improve their writing as a student mentioned. Although regular L2 (English) classes do not seem to provide what the students need due to many constraints such as large class size, test-driven curriculum, and teacher training, some of the students have received coaching on essay writing in Academies or at home from tutors. Essay writing competitions held by the provincial government in Punjab and education board in the area where this study was conducted may trigger this interest in essay writing inside and outside of school. Noticeable Instructional Practices in L2 (English) classes in Pakistan First, reading old and modern literature is the predominant activity for writing skills, however, is not considered important because the exams measure only crammed ability of the students, not writing skills. Perhaps this lack of immediacy is the reason for little emphasis on writing in Pakistan. The high school students in this study have received little instruction on writing in general and had few opportunities to write various types of texts except personal writing, such as diaries.
Second, in regard with text types for reading, nonliterary genres are not taught whereas literary genres are stressed without considering textual structures and language features along with reading skills to understand the content. Nonliterary types of texts, such as reports, summaries, book reviews, reactions, and short essays, are assigned as writing homework. Thus, the students seem to deal with such writing demands just by doing without instruction or careful guidelines. If this finding is valid, it is likely that Pakistani higher secondary school HI students develop schemata for literature and personal writing and use those schemata when they write mostly nonliterary academic genres in college and university settings.
Third, little instruction seems to be provided on the writing process. The students seem to know the overall writing process from planning to generating texts to revising drafts. But they are not familiar with peer feedback, how to write a

ISSN 2039-9340 Mediterranean Journal of Social Sciences Vol. 3 (11) November 2012
229
paragraph, how to generate ideas, and how to connect paragraphs using transition words and phrases. Thus, it is likely that they have difficulty generating ideas at the beginning stage of writing or their ideas might be shallow. In terms of textual organization, their essays may not look logical because each paragraph is not well-organized with thesis statement and supporting ideas and overall essays may not be coherent due to inappropriate use of transition words. Also, they may not feel comfortable giving and receiving peer feedback and think that revision is editing at the sentence level, such as correcting grammar mistakes and word choices, rather than improving texts at the discourse level, such as organization and coherence.
Fourth, due to the lack of knowledge about the writing process, the students are not aware of envisioning the audience at the planning stage of writing. Writing for different audience expectations is not emphasized in textbooks designed for SSC & HSSC it seems that the teacher might be the only real audience for students.
Fifth, as for assessment criteria, two criteria are noteworthy: persuasiveness as the most important criterion and using outside sources as the least important criterion. It is interesting that both students and teachers seem to value persuasiveness and clarity of main ideas because the two are only indirectly related to the genres that the students frequently read and write (e.g., literature and personal writing). It is in essays that persuasiveness and clear argumentation play important roles. Also interesting is the finding that using outside sources properly is out of the question in Pakistani L2(English) classes. As presented previously, the students had no experience of writing anything longer than three pages, let alone research papers in which citation is a necessary skill. Although several students made comments on plagiarism in the assessment criteria section, most high school students are not familiar with plagiarism. They probably need to learn about several issues regarding plagiarism: intellectual property, academic integrity, how to use the language and ideas of other people properly, citation skills, and so on. They are probably aware of only cheating and use of unfair means in exams.
Finally, essay writing is especially taught in schools even in extra classes because essay writing pertains maximum number in question paper. Teaching of essay writing needs explanation because in a typical Pakistani class room teachers provide some basic instructions on essay being taught and then ask the students to cram it. Students cram the content and reproduce it without something new this so called activity is called essay writing instruction. In school as well, at home or at academies tutors ask the students to cram the content. Further the teacher translates the content for the ease of the students and students cram all these information. The attainment of grades in exams seems to lie at the very heart of this unusual interest in essay writing inside and outside of school. But this also some negative aspects because this movement has promoted cramming as well. The more stress on grades, the more cramming practices.
8. Conclusion The purpose of this study was to describe Pakistani higher secondary school HI students’ L2 (English) writing experiences in school to better understand their knowledge about writing developed throughout formal schooling. The more L2 writing researchers and teachers know about their HI students’ educational backgrounds, the better decisions they can make in the classroom. Just as small drop of water in a vast sea of research and practice, it is hoped that this study can help L2 educators and HI students to better understand L2 writing. Limitations and Suggestions for Future Studies First, the results of this study may not reveal the whole picture of instructional practices in L2 (English) classes without other sources of information such as teachers’ perceptions or classroom observation.
Also, the questionnaire used in this study needs to be improved in order to get better results in future studies. The questionnaire was adapted from Kobayashi and Rinnert (2002) after a pilot study with a similar population to those in the main study. The questionnaire was initially developed for Hearing Students. But I adopted it for HI students.Several questions need to be modified to get a better percentage of variance. For example, the respondents had to remember what they had experienced in elementary school to answer most of the questions in the questionnaire.
Lastly, as many researchers in CR studies suggest, the results of this study should be interpreted without making stereotypes and overgeneralization because the sampling was not random or representative of the full population of higher secondary school HI students in Pakistan. It is not clear whether the writing instruction that the participants have received represent the average L2 (English) classes in Pakistan. Thus, for an improvement in the future, questionnaires need to be administered to a representative, random (stratified) sample of higher secondary school HI students in the country, including different geographical areas, different socioeconomic-level schools (public, private, high-achievement, vocational, etc.).

ISSN 2039-9340 Mediterranean Journal of Social Sciences Vol. 3 (11) November 2012
230
Implications Although the findings of this study may not provide a clear cut description of Pakistani L2 (English) HI writers, some of the findings might help L2 educators expand their understanding of L2 writing and improve English writing pedagogy (Connor, 2002; Silva, 1993). Implications for English writing pedagogy at the higher secondary level are discussed below:
First, the findings suggest that Pakistani L2 (English) HI writers, are not familiar with nonliterary genres in terms of textual structures and language features. Considering that most of the academic writing is nonliterary genres, lack of schemata for such genres can be a serious disadvantage in their academic lives. Thus, L2 writing instructors need to teach different textual structures and language features of academic genres explicitly using various strategies, including sample texts and class discussions, or, at least, they need to provide students with ample opportunities to read a variety of academic genres so that they can develop schemata for academic writing (Hyon, 1996; Johns, 2003; Swales & Lindemann, 2002). Also, L2 writing teachers who are aware of CR approaches are likely to raise students’ awareness of textual organization (Leki, 1991; Casanve, 2004). More direct instruction and guide on textual organization expected in the academia would benefit L2 writers, as shown in Oi and Kamimura (1995) and Yoshimura (2002).
Second, Pakistani L2 (English) HI writers, will benefit from learning specific strategies and skills in the following areas: generating ideas, paragraph organization, coherence, peer feedback, and revision. L2 instructors need to provide detailed instruction on those areas, e.g., strategies to generate ideas, how to organize a logical paragraph with a thesis statement and supporting ideas, how to make texts coherent by using transition words and phrases, and how to use peer feedback to revise drafts. Coherence seems to be the area to which L2 instructors pay more attention than the others because, as discussed previously, Pakistani L2 (English) HI writers do not know the importance of envisioning the audience before writing that is why they do not try to learn how to organize texts to meet the expectations of different audiences. Their awareness of audience expectations may not be useful without specific skills or strategies to make texts coherent (Hyland, 1999).
Third, there seems to be a clear need for teaching Pakistani L2 (English) HI writers, how to use outside sources properly in academic writing. L2 writing instructors should teach strategies to avoid plagiarism and familiarize students with important issues regarding plagiarism, such as intellectual property, academic integrity, how to use the language and ideas of other people properly, citation skills, and so on.
Lastly, L2 writing instructors need to develop lessons on the basis of Pakistani L2 (English) HI writers,’ experience with essay writing in their L1.
As Cumming (1989) pointed out, L1 experiences are not necessarily considered as negative transfer to L2 acquisition, but as resources for writing teachers to draw on when designing a course or developing a teaching method. If writing teachers are aware of their students’ previous writing experiences, they can build on the students’ knowledge rather than teaching from scratch and help L2 writers make a smooth transition into academic writing (Carson, 1998). Also, it is good to know on the part of L2 writers that observed differences in L2 texts are not caused by only personal unpreparedness but by various other sources, such as L1 educational background and previous writing experience.
References
Atkinson, D. (1999). TESOL and culture. TESOL Quarterly, 33, 625-653. Atkinson, D. (2004). Contrasting rhetorics/contrasting cultures: Why contrastive rhetoric needs a better conceptualization of culture.
Journal of English for Academic Purposes, 3, 277-289. Brown, J. D. (2001). Using surveys in language programs. New York: Cambridge University Press. Caron, J. (1992). Becoming biliterate: First language influences. Journal of Second Language Writing, 1, 37-60. Carson, J. (1998). Cultural backgrounds: What should we know about multilingual students? TESOL Quarterly, 32(4), 735-740. Connor, U. (1996). Contrastive rhetoric: Cross-cultural aspects of second-language writing. New York: Cambridge University Press. Connor, U. (1999). Learning to write academic prose in a second language: A literacy autobiography. In G. Braine (Ed.), Non-native
educators in English language teaching. Mahwah, NJ: Lawrence Erlbaum Associates. Connor, U. (2002). New directions in contrastive rhetoric. TESOL Quarterly, 36, 493-510. Connor, U. (2003). Changing currents in contrastive rhetoric: Implications for teaching and research. In B. Kroll (Ed.), Exploring the
dynamics of second language writing (pp. 218-241). New York: Cambridge University Press. Connor, U. (2004). Intercultural rhetoric research: Beyond texts. Journal of English for Academic Purposes, 3, 291-304. Connor, U. (2008). Introduction. In U. Connor, E. Nagelhout, & W. V. Rozycki (Eds.), Contrastive rhetoric: Reaching to intercultural
rhetoric (pp. 1-8). Philadelphia, PA: John Benjamins Publishing Company. Costello, A., Osborne, J. (2005). Best practices in exploratory factor analysis: Four recommendations for getting the most from your
analysis. Practical Assessment Research & Evaluation, 10(7). Retrieved December 1, 2008, from http://pareonline.net/getvn.asp?v=10&n=7.
Cumming A. (1989). Writing expertise and second language proficiency. Language Learning, 39, 81–141.

ISSN 2039-9340 Mediterranean Journal of Social Sciences Vol. 3 (11) November 2012
231
Eggington, W. G. (1987). Written academic discourse in Korean: Implications for effective communication. In U. Connor, & R. B. Kaplan (Eds.), Writing across languages: Analysis of L2 text (pp. 153-168). Reading, MA: Addison-Wesley.
Grabe, W., & Kaplan, R. B. (1989). Writing in a second language: Contrastive rhetoric. In D. Johnson, & D. Roen (Eds.), Richness in writing: Empowering ESL students (pp. 263-283). New York: Longman.
Hamp-Lyons, L. (2003). Writing teachers as assessors of writing. In B. Kroll (Ed.), Exploring the dynamics of second language writing (pp. 162-189). New York: Cambridge University Press.
Hinds, J. (1987). Reader versus writer responsibility: A new typology. In U. Connor & R.B. Kaplan (Eds.). Writing across languages: Analysis of L2 text (pp. 141-152). Reading, MA:Addison-Wesley.
Hinds, J. (1990). Inductive, deductive, quasi-inductive: Expository writing in Japanese, Korean, Chinese, and Thai. In U. Connor, & A. M. Johns (Eds.), Coherence in writing: Research and pedagogical perspectives (pp. 87-109). Alexandria, VA: TESOL.
Holliday, A. (1999). Small cultures. Applied Linguistics, 20, 237-264. Horowitz, D. (1986). What professors actually require: Academic tasks for the ESL classroom. TESOL Quarterly, 20, 445-482. Hyland, K. (1999). Talking to students: Metadiscourse in introductory coursebooks. Journal of English for Specific Purposes, 18, 3-26. Hyon, S. (1996). Genre in three traditions: Implications for ESL. TESOL Quarterly, 30, 693-722. Johns, A. M. (2003). Genre and ESL/EFL composition instruction. In B. Kroll (Ed.), Exploring the dynamics of second language writing
(pp. 195-217). New York: Cambridge University Press. Kachru, Y. (1995). Contrastive rhetoric in World Englishes. English Today, 11, 21–31. Kaplan, R. B. (1966). Cultural thought patterns in inter-cultural education. Language Learning, 16, 1-20. Kaplan, R. B. (1987). Cultural thought patterns revisited. In U. Connor, & R. B. Kaplan (Eds.), Writing across languages: Analysis of L2
text (pp. 9-21). Reading, MA: Addison-Wesley. Kobayashi, H., & Rinnert, C. (2002). High school student perceptions of first language literacy instruction: Implications for second
language writing. Journal of Second Language Writing, 11, 91-116. Kubota, R. (1998). An investigation of L1-L2 transfer in writing among Japanese university students: Implications for contrastive rhetoric.
Journal of Second Language Writing, 7, 69-100. Leki, I. (1991). Twenty-five years of contrastive rhetoric: Text analysis and writing pedagogues. TESOL Quarterly, 25, 124-143. Leki, I. (1992). Understanding ESL writers: A guide for teachers. Portsmouth, NH: Boynton/Cook Publishers. Leki, I. (2007). Undergraduates in a second language: Challenges and complexities of academic literacy development. New York:
Lawrence Erlbaum Associates. Leki, I., Cumming, A., & Silva, T. (2008). A synthesis of research on second language writing in English. New York: Routledge. Liebman, J. (1988). Contrastive rhetoric: Students as ethnographers. Journal of Basic Writing, 7(2), 6-27. Liebman, J. (1992). Toward a new contrastive rhetoric: Differences between Arabic andJapanese rhetorical instruction. Journal of
Second Language Writing, 1, 141-165. Liebman-Kleine, J. (1986). Towards a contrastive new rhetoric: A rhetoric of process. (ERIC Document Reproduction Service No. ED
271 963). Retrieved January 27, 2009, from ERIC database. LoCastro, V. (2008). “Long sentences and floating commas” Mexican students’ rhetorical practices and the sociocultural context. In U.
Connor., E. Nagelhout., & W. V. Rozycki (Eds.), Contrastive rhetoric: Reaching to intercultural rhetoric (pp. 195-217). Philadelphia, PA: John Benjamins Publishing Company.
Matsuda, P. K. (1997). Contrastive rhetoric in context: A dynamic model of L2 writing. Journal of Second Language Writing, 6, 45-60. Matsuda, P. K. (2003). Second language writing in the twentieth century: A situated historical perspective. In B. Kroll (Ed.), Exploring
the dynamics of second language writing (pp. 15-34). New York: Cambridge University Press. Mauranen, A. (2001). Descriptions or explanations? Some methodological issues in contrastive rhetoric. In M. Hewings (Ed.),
Academic writing in context: Implications and applications. Edgbaston, UK: University of Birmingham Press. Melzer, D. (2003). Assignments across the curriculum: A survey of college writing. Language and Learning across the Disciplines, 6, 86-
110. Mohan, B., & Lo, W. (1985).Academic writing and Chinese students: Transfer and developmental factors. TESOL Quarterly, 19 515-534. Moreno, A. I. (2008). The importance of comparable corpora in cross-cultural studies. In U. Connor., E. Nagelhout., & W. V. Rozycki
(Eds.), Contrastive rhetoric: Reaching to intercultural rhetoric (pp. 25-44). Philadelphia, PA: John Benjamins Publishing Company.
Ostler, S. E. (2002). Contrastive rhetoric: An expanding paradigm. In J. Flowerdew (Ed.), Academic discourse (pp. 167-181). London: Longman.
Scarcella, R. (1984). How writers orient their readers in expository essays: A comparative study of native and non-native English writers. TESOL Quarterly, 18, 671-688.
Silva, T. (1993). Toward an understanding of the distinct nature of L2 writing: The ESL research and its implications. TESOL Quarterly, 27, 657-677.
Spack, R. (1997). The acquisition of academic literacy in a second language. Written Communication, 14, 3-62. Swales, J. M., & Lindemann, S. (2002). Teaching the literature review to international graduate students. In A. M. Johns (Ed.), Genre in
the classroom: Multiple perspectives (pp. 105-119). Mahwah, NJ: Lawrence Erlbaum Associates. Uysal, H. (2008). Tracing the culture behind writing: Rhetorical patterns and bidirectionaltransfer in L1 and L2 essays of Turkish writers
in relation to educational context. Journal of Second Language Writing, 17, 183-207.

ISSN 2039-9340 Mediterranean Journal of Social Sciences Vol. 3 (11) November 2012
232
APPENDICES (A)
Higher Secondary School Students’ Perception of L2 (English) Writing Questionnaire Dear students! This questionnaire is part of a study exploring HSS Students’ Perception about L2 (English) writing in Pakistan. It should take about 15 minutes to answer all questions and the results will remain completely confidential and anonymous. Please do not put your name on the questionnaire.
Thank you very much. 1-Background Information
Gender □ Female □ Male
Have you ever lived/studied abroad?
□ No □ Yes (Please specify)___________(month)/________(year)
What kind(s) of writing do you usually do? (Check all that apply)
□ Journals/diaries □ Email □ Blog □ Text messages □ Messenger □ Memos □ Other (Please specify): _________________________________________
2-Writing processes How often do you receive instruction on the following areas in English writing classes? 0: Never 1: Rarely 2: Sometimes 3: Often
22. Identifying the audience and purposes of texts before writing 0 1 2 3
23. How to generate ideas (e.g., observation, interview, discussion) 0 1 2 3
24. How to organize ideas 0 1 2 3
25. How to write a paragraph (e.g., a topic sentence and supporting ideas) 0 1 2 3
26. How to connect paragraphs using transition devices 0 1 2 3
27. How to choose appropriate words or phrases 0 1 2 3
28. How to write appropriately for the intended audience and purposes 0 1 2 3
29. Self/Peer feedback 0 1 2 3
30. How to revise (e.g., content, organization, spelling, editing) 0 1 2 3 Other (Please specify):
2-Reading and writing How often do you do the following activities in your English writing classes? (Please choose one). 0: Never 1: Rarely 2: Sometimes 3: Often
1 Learn new vocabulary 0 1 2 3 2 Learn grammar and mechanics 0 1 2 3 3 Learn how to organize texts 0 1 2 3 4 Read/learn text structures and language features of old/middle classics 0 1 2 3
5 Read/learn text structures and language features of modern literary works 0 1 2 3
6 Read/learn text structures and language features of nonliterary genres 0 1 2 3
7 Develop an understanding of the author’s purposes, perspectives, and the context 0 1 2 3

ISSN 2039-9340 Mediterranean Journal of Social Sciences Vol. 3 (11) November 2012
233
8 Learn to analyze/evaluate the content of reading 0 1 2 3 9 Write various types of texts for different audience, purpose, and function 0 1 2 3 Other (Please specify):
3-Types of writing How often do you do the following kinds of writing in your English language classes? 0: Never 1: Rarely 2: Sometimes 3: Often
10. Journals (Diaries) 0 1 2 3 11. Letters 0 1 2 3 12. Book reports 0 1 2 3 13. Travel narratives 0 1 2 3 14. Explanations 0 1 2 3 15. Biography (Autobiography) 0 1 2 3 16. News reports (Class newsletters) 0 1 2 3 17. Summaries 0 1 2 3 18. Reports 0 1 2 3 19. Critiques 20. Reflections 21. Argumentative essays Other (Please specify):
What type of writing did you do most frequently in each of the following schools?
Elementary school Middle school High school
4-Assessment criteria How important do you think the following features are in assessment? 0: Not at all important 1: Not very 2: Moderately 3: Very important
31. Accuracy in language use (e.g., grammar and word choices) 0 1 2 3
32. Clarity of main ideas 0 1 2 3 33. Ability to express personal impressions/feelings 0 1 2 3 34. Logical organization of content 0 1 2 3 35. Accuracy of information presented in content 0 1 2 3 36. Formulating one’s own opinions (Persuasiveness) 0 1 2 3
37. Effective use of stylistic strategies (e.g., imagery, metaphor, emphasis) 0 1 2 3
38. Ability to write for the intended audience and purposes 0 1 2 3 39. Using information from outside sources (Citations) 0 1 2 3 Other (Please specify):
Which feature do YOU think is most important in assessing writing? Please specify:

ISSN 2039-9340 Mediterranean Journal of Social Sciences Vol. 3 (11) November 2012
234
40. What type(s) of comments do you receive from your English language teachers? (Check all that apply) □ Grades or marks □Corrective feedback on word choices, grammar, punctuation, etc. □ Comments on the content □Comments on overall strengths or weaknesses □ Other (Please specify): ____________________________________________________
Name of the class(es): Please specify what you learned:
41. Do you think writing plays an important role in academic success in our country?
□ Yes □ No Why (Please specify): Why (Please specify):
42. How many pieces of short writing (less than 3pages) a year on average do you do in your English language classes?
Elementary □ None □ 1~2 □ 3~4 □ 5 or more Middle □ None □ 1~2 □3~4 □5 or more 10th grade □None □ 1~2 □ 3~4 □5 or more 11th grade □ None □1~2 □ 3~4 □ 5 or more
43. How many pieces of longer writing (more than 3 pages) a year on average do you do in your English language classes?
Elementary □ None □1~2 □3~4 □5 or more Middle □ None □ 1~2 □ 3~4 □ 5 or more 10th grade □ None □ 1~2 □ 3~4 □ 5 or more 11th grade □ None □ 1~2 □ 3~4 □ 5 or more
44. Please specify the types of writing you have done in subject courses other than your English language classes (e.g. social studies, science, Urdu, Punjabi etc).
Subject Grade Topic/Content Number of pages
45. Do you receive instruction on writing in any other classes in your schools other than English writing classes? (e.g., an extracurricular writing class)
□ No □ Yes (Please specify)

ISSN 2039-9340 Mediterranean Journal of Social Sciences Vol. 3 (11) November 2012
235
Socio Economic Impact of Water Crisis on Agrarian Community
in District Faisalabad, Pakistan
Muhammad Asim
Department of Sociology, Government College University Faisalabad, Pakistan Correspondence Email: [email protected]
Ali Hassan Vains
Institute of Agri. Extension and Rural Development,
University of Agriculture Faisalabad, Pakistan
Haroon Yousaf
Institute of Agri. Extension and Rural Development, University of Agriculture Faisalabad, Pakistan
Muhammad Azam Ramzan
Institute of Agri. Extension and Rural Development,
University of Agriculture Faisalabad, Pakistan
Doi:10.5901/mjss.2012.v3n11p235 Abstract: Agriculture plays a pivotal role in the national economy of Pakistan. 65% of total population of Pakistan is living in villages and their major source of livelihood depends upon agriculture. Pakistan has the largest world irrigation system its irrigation strength three times more than that of Russia. But unfortunately, Pakistani farmers are facing serious water shortage problem in these days. The main objectives of the present study were to explore the effects of scarcity of canal water on the yield of different type of major crops and assess the affect of ground water on crops and its socio economic implication on the farmers’ lives. A sample of 160 household farmers was selected through multistage sampling techniques. Specifically through this study, farmers’ survival due to the shortage of irrigation water highly depends upon tube well water. Due to this phenomenon not only farmers have to pay lot of money in the form of fuel but also tube well water negatively affects the crops yield. The researchers also found out the socio economic problems due to the water crises such as irrigation water disputes, less cultivation, lack of interest of livestock and these notions also badly affect their crops yield as well as their socio economic condition. Key words: farmers, irrigation, water disputes, crops and yield 1. Introduction Water resources system is the life line for Pakistan. It is a source of life and energy. It is the most critical factor of production in Pakistan's agriculture resources. Pakistan is an agriculture country and water is the back bone of economy of the country. Pakistan has the marvelous and contiguous irrigation system that currently irrigates over 16.23 million hector of land, out of 36.00 million of cultivate land available. Out of 16.23 million hectors, 11.42 million hectors are irrigated by cannels and 4.03 by tube well and rest of 0.78 hectares by miscellaneous systems (WAPDA, 2009). During the last fifty years, water used for irrigation has increased due to increase in cropping intensities. The success of sustained agriculture in arid and semi-arid regions of the world depends on availability of the water (Ullah et al., 2001). Global population growth is expected to increase the demand for cereals including wheat by 1.27% annually between 2000 and 2025 (Rosegrant and Cai, 2000). To meet the projected demand for food, irrigated agriculture will require an increase of 17% in freshwater resources (Seregeldin, 1999). According to the World Bank and Asian Development Bank of Pakistan repotted that Pakistan is one of the most “water stressed” countries in the world; it is likely to face an acute

ISSN 2039-9340 Mediterranean Journal of Social Sciences Vol. 3 (11) November 2012
236
water shortage over the next five years due to lack of water availability for irrigation, industry and human consumption. India got the right to fully utilize water from the three eastern rivers; Ravi, Bias and Sutlej, while Pakistan was to utilize water from the three western rivers; Indus, Chenab and Jhelum under the Indus Water Treaty (IWT). Many intellectuals and economist argued that, if Indian’s strategy of building dams on Chenab and Jhelum rivers, then there would be serious implications for Pakistan’s agriculture and national security (Sharif, 2010). Pakistan is one of those 17 countries, which can face water shortage problems in the near future. According to World Bank report, Pakistan needs to build new reservoirs urgently, citing the dearth of water in the near future. (Pakeezahs, 2010). In Pakistan, growers mostly face two problems; the efficiency of water use in crops is low under the existing irrigation practices and shortage of irrigation water which significantly affects the crop yield (Cassman, 1999). At present, per acre yields of various corps were far less than the international standards despite a very favorable combination of climate, temperature, soil and water resources. Some thinker claimed that this crisis is not brought either by nature nor by India; it is home made and we have no option except to find ways and means to face it off (Mujtaba, 2010). The Government of Pakistan’s Vision for the welfare, poverty alleviation and well being of people is being come true through GDP enhancement. Water is a key source for GDP growth and poverty alleviation; therefore, the water sector gained major focus throughout the last decade. In this context government is giving special attention toward augmentation of water resources, Protection of infrastructure from onslaught of floods, significantly enhanced public sector investment and construction of small & medium dams (GOP, 2010). Many parts of the world are confronted with water scarcity, for both irrigation and human needs. Since 1950, the amount of irrigated land in Pakistan has tripled to increase agricultural production; land is not a limiting factor as there is more cultivable land available that can ever be properly irrigated. Agriculture is the main stay of Pakistan's economy, contributing 35 percent to the gross domestic product and providing 60 percent of the labor force. Moreover, nearly 60 percent of the total export of the country originates from agriculture (Alam, 2000). Irrigation has been practiced for at least 4,000 years, primarily because it allows for increased in production. It is projected that around 5 percent of agricultural land globally (264 million ha) is irrigated, with South Asia (35%), Southeast Asia (15%) and East Asia (7%) exhibiting a high dependency on irrigation water. China and India constitute 39 percent of the global irrigated area and Western Europe and United States have 13 percent, while sub-Saharan Africa and Oceania have less than 1 percent of their agricultural land irrigated (Galbraith, et al. 2005). 2. Importance of study Agriculture is the back bone of Pakistan’s economy and agriculture needs water as we need air to breath, but now a days Pakistan is facing crucial circumstances in this regard. India is continuously occupying all the important rivers of Pakistani farmers due to the shortage of irrigation water, if there is scarcity of irrigation water, there will be socio-economic implications. Our purpose of conducting this study was to explore the socio-economic implications on the life of the farmers due to water shortage. 3. Material and Methods Sociology is the scientific study of behavior, attitude and perception of human being in various social setups. The present study was conducted in rural areas of Faisalabad, Pakistan. There are four rural towns in Faisalabad district i.e. Chak Jhumra Town, Samundri Town, jaranwala Town and Tandaliwala Town. A sample of 160 respondents was selected systematically from Faisalabad through multistage sampling techniques. At the 1st stage one Town names Samundri Town out of four rural towns selected randomly. Then, from the total 27 union councils (U.C) of Samundri Town 4 U.C. were selected randomly at the 2nd stage. At the 3rd stage two villages were selected randomly from each union council, and the 4th stage 20 respondents were selected each village by using systematic random sampling. A well structured questionnaire consisting of open and closed ended questions was prepared. Descriptive analysis such as frequency distribution percentage distribution, mean and standard deviation was made by using SPSS to describe the data. 4. Result and Discussion In Pakistan both male and female have hefty and active role in agricultural development. In this study 77.6% of respondents were males and 22.4 were females in which simple majority 60% of the respondents were married. Most of the respondents 43.7% belonged to 46+ years age group and 39.6% respondents belonged to less than 35 years of age. Data regarding the family system revealed that most of the respondents 75.6% were living in the joint family system, whilst, 24.4% of respondents were living in nuclear family system. In joint family system matters are mostly headed by the males and they are responsible for the fostering of the dependents. Rural women of the joint families were occupied in

ISSN 2039-9340 Mediterranean Journal of Social Sciences Vol. 3 (11) November 2012
237
the home based work as well as agricultural activities. More than one fifth of the respondents 23.1% had above 11 years school education and 39.4% of the respondents were illiterate. Rate of women education is relatively low as compared to male. Women were 60% illiterate, if we compare with male 50.1%. This phenomenon shows that in rural area of Pakistan the education of women were not properly addressed and female were more illiterate than that of man. Momsen (2010) also investigated that women education in all developing countries is lower than man. In South Asia the figure were 66% of female adult literacy and 79% of male youth literacy. Amin, et al. (2010) also has consonance with present findings, he found that majority of the rural people live in joint family system in Pakistan and women participation in agricultural and livestock responsibilities were higher than those of male, but in our male dominant society women works were not only be acknowledged but also they were not given to proper weight. Table 1: Socio-economic characteristics of the respondents
Age of the Respondents Frequency Percent Mean Std. Dev. Less than 35 59 36.9 30.33 3.45
35-45 31 19.4 41.52 3.18 46+ 70 43.7 52.85 4.55
Total 160 100.0 47.85 7.62 Education of the Respondents
Illiterate 63 39.4 1-5 32 20.0 4.12 0.45
6-10 28 17.5 8.82 1.45 11+ 37 23.1 11.88 2.12
Total 160 100.0 8.22 2.06 Household Annual Income (R.s)
≤ 100,000 31 19.4 87,832 7,124 100,001 to 150000 39 24.4 141,687 6,542
≥150,001 90 56.2 175,896 9,858 Total 160 100.0 139,845 12,458
Marital Status of the Respondents Married 127 79.4
Unmarried 33 20.6 Total 160 100.0
Type of Family Nuclear 121 75.6
Joint 39 24.4 Total 160 100.0
Data reveals that 70% of the population acquired 60,000 and above profit in rupees (local currency) per acre, when the researchers asked the lodger farmers how many amount they had to pay for per acre in the form of rent. The mean rent was 26,000 rupees per acre. In this way total income per acre was round about 34,000 rupees. Data indicates that 30% farmers had no access to their own land; they cultivate crops as a lodger and sharecroppers. Zadi (2011) pointed out that 67% of household in Pakistan had no access to land. The problem in Pakistan is not just low levels of land holdings but also highly unequal land distribution leading to a class of “land haves and have-nots”. Data reveals that majority of the respondents were small farmers such as 67.2% farmers had (1-10) acre land for cultivation, while 3% farmers had 25 plus acre for cultivation. Anonymous (2005) also demonstrated these facts that about 1.7% of the farms comprised of more than 25 percent of the total agricultural land. Many owners of large holdings were absentee landlords, contributing little to production but extracting as much as possible from the sharecroppers who farmed the land. About 39% of the land was cultivated by tenants, including sharecroppers. The major source of irrigation water is canal system in Pakistan but the shortage of canal water compelled the farmers move towards tube well water. Data shows that 88.1% of the respondents claimed that irrigation water did not fulfill our required demand and now, we feel absolute water shortage for agricultural production. Wang et al. (2007) also found out that the most obvious response by farmers to increase water shortages was to dig tube-wells. According to International statistics, the installation of tube-wells began in the late 1950s around the globe. (Anonymous2, 2012) concluded that In Pakistan the total water channels available to agriculture came from three major sources i.e. surface water from the rivers, rainfall and the earth water, and also some what from sewage water and sea water. Ground water is the second major source for irrigation. About 75% farmers irrigated through canals,

ISSN 2039-9340 Mediterranean Journal of Social Sciences Vol. 3 (11) November 2012
238
l9% through tube wells, 2% through wells and remaining 4% through tanks and other sources. Because of shortage of water a large majority 85.8% of the respondents argued that their income was badly affected, due to the scarcity of irrigation water. The farmers were compelled to use modern water saving techniques and modern land leveling methods in the fields. Data exhibited that about 35% of the respondents used water saving techniques such as drip irrigation, mulching plant in blocks rather than rows, control weeds, traditional methods and group plants with similar water needs. Whilst majority of the respondents 65% had no any interest and motivation about the saving irrigation water. Wang et al. (2008) identified that although water-saving technologies for agriculture had been emphasized by many policymakers and researchers, the adoption rate was still very low. Despite a relatively high initial level of adoption (35% in the 1950s), in 2004, only 52% of villages adopted traditional water-saving technologies in China. It has also been found that 76.1% of the respondents tried to use laser land leveling for saving water. Only 30% of the farmers attended the extension meetings for keeping them update for modern and innovational techniques. A majority of the farmers 70% had no any interest in such types of government awareness initiatives. Table 2: perception of the respondents with regard to shortage of irrigation water
No Response categories Yes No Total Freq. %age Freq. %age Freq. %age
1 Feel water shortage for your crops 141 88.1 19 11.9 160 100 2 Low income due to water shortage 121 85.8 28 14.2 141 100 3 Adopt water saving techniques 56 35 104 65 160 100 4 Use Precision land leveling 123 76.1 37 23.9 160 100 5 Attend extension education meetings 48 30 112 70 160 100 6 Satisfaction with the amount of canal water 43 26.9 117 73.1 160 100 7 Ground water is suitable for your crops 128 80 32 20 160 100
8 Face water disputes with other farmers due to water shortage 65 40.6 95 59.4 160 100
Regarding the satisfaction about the amount of canal water data exhibited that 26.9% of the respondents were satisfied and majority of the respondents 73.1% were not satisfied about the amount of canal water. These results are analogous with Wang et al. (2008) who observed that most villages in Northern China were facing acute water shortages, and the farmer’s outlook was not satisfactory. Survey results demonstrated that in 2005, 70% of the farmers reported that they were facing water shortage, whilst 16% of villages were facing severe water shortage problems. They also found that now water shortages had become more serious in the past decade. Survey results showed that from 1995 to 2004, the degree of water shortage continued to increase. The researchers also found that a huge majority of the farmers 80% told that, ground water was not suitable for their crops but we had to use for our survival because we had no any other option without it. About 54% farmers claimed that ground water had negative affect on crops while 24% farmers reported that ground water had positive affect on crops. One of the researchers Mir, (2008) found that there were total 565,000 tube wells in Pakistan; nearly 70 percent were now pumping solid water or salty water, because sweet water has been exhausted. He further argued that many water experts had warned the government that the exploitation of fossil water could lead to a disaster. More than one third 36% farmers had water disputes with other farmers due to the water shortage and these disputes were often resolved by the local political leaders and Numberdar (Traditional authority). Table 3: Distribution of the respondents according to their sources of irrigation and land
Source of Irrigation Frequency Percentage Canal 48 30.0
Tube well 13 8.1 Canal and Tube well 99 61.9
Total 160 100.0 Tube well Status
Owned 100 62.5 Shared 60 37.5 Total 160 100.0
Cultivated land 1-5 85 53.1

ISSN 2039-9340 Mediterranean Journal of Social Sciences Vol. 3 (11) November 2012
239
6-11 38 23.7 12-17 31 19.4 18+ 6 3.8
Total 160 100.0 Table 4: Distribution of the respondents according to the effect of water crises on their yield
Impact of water crisis on the yield of major crops
Decreased Increased Unaffected Total Freq. %age Freq. %age Freq. %age
Wheat 123 76.9 27 16.9 10 6.3 160 Rice 139 86.9 19 11.9 2 1.3 160
Sugarcane 127 79.4 27 16.9 6 3.8 160 Cotton 139 86.9 19 11.9 2 1.3 160
Data exhibits that 30% respondents utilized only canal water, 8.1% farmers irrigated their land by only tube well water. In some areas the farmers had not any access of cannel water, that’s why farmers of those areas cultivated their crops on tube well water. Whilst, half and above farmers 61.9% were used both canal and tube well water for their agricultural survival. These findings line up with Anonymous3 (2002) who reported that 45 million acre feet of water were added to the irrigation system from the ground water in the country. He further argued that during the last three years massive pumping out of ground water had taken place. In the past, a tube well which used to work for four hours, now pumps water out 20 hours a day," he said that this practice is unsustainable. Majority of the farmers 62.5% had their own tube well while 37.5% farmers had shared tube well connections. Regarding the cultivation of the land in acres, data showed that more than half of the respondents 53.1% farmers cultivate (1-5) acres of land, while 3.8% of the farmers cultivate 18 and plus acre land. This data shows that majority of the respondents had less area for cultivation and in real sense in Pakistan majority of the people have small pieces of land. A large majority 75% and above farmers claimed that due to the water shortage their major crops like wheat, rice, sugarcane and cotton had decreased their yield and they suffer lot of socio economic burden. Similar result found by (Anonymous2, 2012) who explained that the major crops grown were wheat, rice, cotton, maize and sugarcane in Pakistan. These crops covered about 63 per cent of the total cropped area. Production of three important crops rice, cotton and sugarcane as well as 90 per cent of wheat and most of maize is virtually confined to irrigated areas due to the shortage of water these major crops affected badly. 5. Conclusion Water scarcity is a matter of grave concern in Pakistan that affects everyone’s life directly or indirectly. It is obvious that Pakistan has experienced bad strategies, bad governance, and corruption in its water management and usage system. Pakistan’s large and rapid growing population and the country’s existing water shortage might lead to the hunger and famine in the near future. There is need to develop all the available water resources by making small/medium and large storage reservoirs and then use this available water with out wasting a drop of water. Government should give the incentives to the farmers who have not enough investment for their agricultural purposes for enhancing the production per acre. It is also suggested that government should introduce some policies for the betterment and rehabilitation of the farmers which can reduce or minimize the rural to urban migration of the farmers.
References
Amin, H., T. Ali, M. Ahmad and M. I. Zafar. 2010. Gender and Development: Roles of Rural Women in Livestock Production in Pakistan. Pakistan Journal of Agriculture Science. 47(1), 32-36
Alam, S. M., M. A. Khan and R. Ansari. 2000. Water crisis in Pakistan agriculture nuclear Institute of agriculture Tandojam, Pakistan. Anonymous. 2005. Pakistan Farm Ownership and Land Reform. The Library of Congress Country Studies and the CIA World Fact book.
Available at. Assessed Date 16/05/2012. http://www.photius.com/countries/pakistan/geography/pakistan_geography_farm_ownership_and_l~10400.html
Anonymous2. 2012. Water crisis in Pakistan agriculture. National News. Wed, 25/04/2012. Accessed Date 24/5/2012. http://waterinfo.net.pk/cms/?q=taxonomy/term/5
Anonymous3. 2002. Pakistan: Focus on water crisis. Humanitarian news and analysis. Available at. http://www.irinnews.org/printreport.aspx?reportid=17867
Blanke, A., Rozelle, S., Lohmar, B., Wang, J. and Huang, J. 2007. ‘Water saving technology and saving water in China’, Agricultural Water Management, 87:139–50.

ISSN 2039-9340 Mediterranean Journal of Social Sciences Vol. 3 (11) November 2012
240
Cassman, K. G. 1999. Ecological intensification of cereal production systems for yield potential, soil quality and precision agriculture. Proceedings of the National Academy of Sciences, USA (96): 5952–5959.
Galbraith, H., P. Amerasinghe and A. H. Lee. 2005. The effects of agricultural irrigation on wetland ecosystems in developing countries: A literature review. CA Discussion Paper 1 Colombo, International Water Management Institute, Sri Lanka.
GOP. 2010. Government of Pakistan. Economic Survey of Pakistan. Economic advisor wing. Finance division, Islamabad. Mir, J. A. 2008. Water Crisis and Smart Consumption. Assessed date. 22/05/2010. http://asifjmir.blogspot.com/2008/10/water-crisis-and-
smart-consumption.html Momsen, J. 2010. Gender and Development. 2nd Edition. Routledge Taylor & Francis Group. Mujtaba, R. 2010. Nature of irrigation crisis and a potential way out– part I. Posted on 17. May, 2010. Pakeezahs. 2010 .Water crisis in Pakistan: World water day. Iqbal-o-Jinnah ka Pakistan. Rosegrant, M. W. and X. Cai. 2000. Modeling water availability and food security. A Global Perspective: The IMPACT-Water model.
Working draft, International Food Policy Research Institute, Washington, DC. USA. Seregeldin, I. 1999. Looking ahead: water, life and the environment in the 21st century. Journal of International Water Resource
Development. 15(2): 17–27. Sharif, M. 2010. The water crisis and its implications for Pakistan. Available on this site. http://www.opfblog.com/10280/the-water-crisis-and-its-implications-for-pakistan/ Ullah, M. K., Z. Habib and S. Muhammad. 2001. Spatial distribution of reference and potential evapotranspiration across the Indus basin
irrigation systems. Lahore, Pakistan. International water management institute, working paper 24. Wang, J., J. Huang, A. Blanke, Q. Huang, and S. Rozelle. 2007. ‘The development, challenges and management of groundwater in rural
China’, in M. Giordano and K.G. Villholth (eds), The Agricultural Groundwater Revolution: opportunities and threats to development, Comprehensive Assessment of Water Management in Agriculture Series, Cromwell Press, Trowbridge: 37–62.
Wang, J., J. Huang, S. Rozelle, Q. Huang and L. Zhang. 2008. Understanding the Water Crisis in Northern China: What Government and Farmers are doing? Available at this cite.
http://faculty.apec.umn.edu/qhuang/papers/Understanding%20the%20Water%20Crisis%20in%20Northern%20China.pdf WAPDA. 2009. Water and power development authority Pakistan, Annual Report 2009. Zadi, M. 2011. Poverty in Pakistan. The Dawn. 17th October, 2011. Available at. http://dawn.com/2011/10/17/poverty-in-pakistan/

ISSN 2039-9340 Mediterranean Journal of Social Sciences Vol. 3 (11) November 2012
241
Housing Market Constraints in the West African Region
Basirat A. Oyalowo
University of Lagos, Akoka Lagos Nigeria
Doi:10.5901/mjss.2012.v3n11p241 Abstract: This study examines the constraints limiting lending institutions’ participation in housing finance supply in the West African region. It also recommends actions necessary for addressing these constraints. It is based on regression analysis of secondary data related to factors necessary for lending institutions’ participation in formal housing finance supply. The ratio of the private credit to GDP of West African countries between 2008 and 2010 is regressed against the independent variables Inflation rate, procedures to register property, time to register property, cost to register property, strength of legal right index and depth of credit information system. The private to credit ratio is used as a proxy for the mortgage to GDP ratio due to lack of access to data for most of the West African countries. The regression analysis showed that two factors: ‘depth of credit information system’ and ‘strength of legal right index’ are statistically significant to explain the lack of depth of the private credit to GDP ratios in the region. It is concluded that the housing market across several West African countries could be strengthened if the governments act to substantially improve the legal strength of lenders is increased through stronger foreclosure laws, and where lenders can effectively access, collect, share and disseminate credit information on prospective borrowers in the region. This can be addressed by setting up institutions to convert credit information from informal thrift and savings societies which are active in the region, to formal private and public credit bureaus. Keywords: Housing, housing finance, housing market, Housing supply ,West Africa, 1. Introduction It is evident from the literatures that national governments in both developed and developing countries are increasingly transferring responsibility for housing finance and provision -for even low income groups -to formal, wholly private and/or quasi-private institutions (Malpass & Victory 2010, Ronald 2010, Nubi 2010). These institutions operate with various structures and access funds through a variety of means. Wholly private institutions could be structured as savings and loans corporations, building societies, mutual savings banks, credit financiers, pension funds and life insurance companies. Quasi-private institutions are government sponsored and are structured to access market funds at favorable rates in return for which they operate according to government influenced policies. However, there are also wholly owned public institutions that have been mandated to provide housing finance for specific customers at government specified terms. These generally operate as specialized housing financial institutions and are usually few in number relative to the general population they serve (See Renaud 1984 for an historical account of these structures globally). Apart from those that obtain direct government funds, these organizations access funds from two principal systems (Renaud 1984): mobilization of funds directly from the general public and indirect mobilization of funds through capital market instruments such as securities and bonds. In the former system otherwise referred to as the ‘British-US model’ (Renaud 1984) or ‘deposit taking’ system (Lea 1998); the institution provides a bundled service of originating, servicing and retiring the loans. It does this by seeking savings from households and corporations for onward distribution to qualified loan-seeking households. This method is popular in Britain, Malaysia, Thailand and Latin America (Lea 1998). Where funds is mobilized through the capital market (as widely done in the US), wholesale organizations are established to facilitate flow of funds to a primary mortgage sector (the deposit taking institutions). These wholesale organizations do not lend directly to the general public but act as liquidity windows, rediscounting or secondary mortgage instruments. They ensure, through the sales and refinancing of general obligation bonds and residential backed securities in the capital market, that primary market lenders can access funds. With these structures, the challenge of managing the financial flows to and from households; and between institutions and the regulatory frameworks set up to manage the risks associated with expanding investment on real estate’ (Forrest 2008:6) have been mastered; and several products have been designed in response to the effective demand of various income classes. However, in most developing countries, housing finance is not formalized and market-driven (Centre for Affordable Housing Finance in Africa (2011), Tomlison (2007)), with the result that even high-income lenders resort to self-build as

ISSN 2039-9340 Mediterranean Journal of Social Sciences Vol. 3 (11) November 2012
242
there is limited housing for sale in the open and resale market, dearth of mortgage finance systems and generally weak depth of financial markets (Chiquier, Hassler & Lea 2004). In these countries, the supply of funds by lending institutions to households and homebuilders and secondly, the ability of the national macro-economic policy to guarantee the mobilization of funds to the lending institutions remain critical challenges that has led to their limited participation in housing finance markets (Chiqiuer et al2004, Erbas and Nothaft 2005, Okoroafor 2007, Nubi 2010).
This study examines the constraints limiting lending institutions’ participation in housing finance supply in the West African region. It also examines how governments across West Africa can tackle these constraints. However, it is acknowledged that West Africa countries are not entirely homogenous in governance and historical background. For instance, the most populous country in Africa (Nigeria) is situated within West Africa. Ghana is a promising economy currently recording some measure of political stability. Liberia, Sierra Leone and Cote d’Ivoire have witnessed varying degrees of civil conflicts that had truncated their development in the last decade but are now recording positive recovery reforms; Sierra Leone, as at 2007/2008 had the lowest human development index (UNDP 2010). However, a heritage of common developmental challenges permits the use of these countries as a case-study. The focus on West Africa also comes from the need to fill the geographical imbalance in the research and reportage of housing problems in the developing world generally.
The structure of the paper is as follows: the general criteria for lending participation on housing markets are discussed after this introduction. A few housing demand and supply indicators in West Africa are presented in the third section. The study methodology is highlighted in section four. A discussion follows in section 5 where the results of the regression analysis carried out for the study is presented. Section 6 concludes. 2. Criteria for Lending Institutions Participation in Housing Markets Past research in the area of comparative housing finance systems include Warnock & Warnock’s (2008) analyses of the determinants of housing finance in sixty two countries. Although the sample consisted of both developed and developing countries; only one West African country was featured (Ghana). Their study showed that factors such as ability to value property, information on the credit worthiness of borrowers, macro-economic stability and ability to secure collateral are responsible –with various degrees of seriousness-for depth of mortgage markets in particular and the financial markets in general. Erbas & Nothaft (2005) focused on five Middle East and North African countries; presenting a case for the introduction of mortgage suppliers in the region. Djankov, McLeish & Shleifer (2006) investigate cross-country determinants of private credit using data on legal credit or rights and private and public credit registries in 129 countries between 1978 and 2003. Chiquier & Lea (2004) review the experience in developing mortgage securities in emerging countries with case-studies of eight emerging economies spread across Latin America, Asia, Eastern Europe and the Middle East. Butler, kravkova and Safavian (2009) articulates regulatory efficiency in the mortgage registration and title transfer process as well as ease of foreclosure in 42 countries and maintains that the size of housing finance markets depends on land rights, income distribution, macro-economic stability, financial market depth, urban planning policies and the availability of other sources of long-term finance. Renaud (2004) examines the constraints on mortgage finance in emerging economies and identifies five structural factors determining market efficiency. These are market size, macro-economic stability, degree of development of financial market infrastructure, legal and structural path dependency in the development of this financial infrastructure and the feasibility of domestic risk-based pricing for medium and long term financial instruments. Other factors, such as savings and deposit structures, capital market sophistication and government liquidity windows (secondary market structure) are necessary to promote the mobilization of funds (Renaud 1984) for the housing finance institutions. For the purpose of this study, five institutional factors (selected due to availability of data) shall be examined for the West African region. These are: Strength of mortgage lending, strength of the financial market, access to credit information, ease of registration of Property and ability to secure collateral by lenders. Strength of mortgage lending The ability to utilize personal savings for formal housing finance is dependent on the level and distribution of per capita income in each country. Where per capita income is low, savings at all income levels will be lower compared to if the per capita income is high. Where per capita income is high, but unevenly skewed amongst the population, the strength of mortgage lending in the country determines the ability of financial institutions to gather these savings and thereafter disburse effectively across all geographical locations of the country. Where per capita income is high and evenly spread across the nation, savings would be concurrently higher. The predominance of any of these scenarios in a country would

ISSN 2039-9340 Mediterranean Journal of Social Sciences Vol. 3 (11) November 2012
243
affect the extensiveness and diversification potential of institutions that can be developed to support the housing finance system (Renaud 1984). It would also affect the level of development of financial instruments (such as mortgages) that could be utilized to offer loan facilities for housing at reasonable terms. The aggregate domestic savings and the methods chosen to mobilize resources could therefore constitute macro-economic constraints of significance to the potential growth of housing finance institutions. A high per capita income which is ideally evenly spread with high aggregate domestic savings are therefore important conditions for the successful agglomeration of funds by mortgage lenders in particular. Strength of the financial market To have appreciable macro-economic impact, it has been argued that a nation’s housing finance policy should be firmly imbedded in its financial sector ( Lea 1998, Warnock & Warnock 2008). A well-functioning housing finance system could emerge from this. The emerging system would have the capacity to promote long-term liability, ability to value properties and to seize it in the case of default, inform on the credit worthiness of potential borrowers. To achieve this, macro-economic stability and factors to promote the mobilization of funds (savings and deposits, capital markets, a government liquidity window or secondary market) should exist. The vibrancy of a nation’s capital market in particular-as suppliers of long term capital- can also be seen as an indicator of the maturity of its financial system. Similarly, the existence and extent of sophistication of these capacities contribute to the depth of a country’s financial system. Macro-economic stability Stable macroeconomic conditions where inflation rates are low and stable over time, with a balanced distribution of income and single digit interest rates are pre-requisites for market driven housing finance systems. This would facilitate the development of finance products that could be suitable for various income classes, and also reduce the risk that borrowers would default. Where inflation is high and volatility of the macro-economy is also high, lenders are predisposed to offering discriminatory, variable rate loans in order to protect themselves from interest rate risks. Access to Credit Information Formal lending organizations require access to information on potential borrowers in order to objectively verify their repayment capacity and the soundness of their collateral. Credit information could be accessed from private credit bureaus or public registries or both. These registries should possess credit information on every adult. In a matured regulatory system these credit registries can verify and share borrower credit history information and thus have enhanced risk taking capacities. This also facilitates the development of various products to suite various classes of borrowers (The World Bank 2009). Ease of Registration of Property The ability to secure property relates to the ability of lenders to repossess mortgaged property in the case of default, increasing their legal strength and providing an incentive for continuous lending activities. Two broad indicators could be used to measure this in a country: the quality of the property registration system and the legal strength of lenders to act in case of defaults. A formal land registration process also allows legal titling of properties which is important for borrowers seeking loans and also for lenders seeking repossession, foreclosure and resale. However, a lengthy, costly, complex and bureaucratic property transfer process reduces the ability of lenders to participate in the housing finance market by reducing the number of mortgageable properties, while also constraining property transfer processes. Ability to secure collateral by lenders The ability of lenders to secure a credible collateral against defaults, their ability to legally, easily and promptly seize the collateral and institute foreclosure proceedings in the event of default is an important hedge in the mortgage lending process. Warnock & Warnock’s (2008) study showed that across developed countries, the variation in the strength of the legal right to secure a foreclosure accounted for the depth of the housing finance system, even though all the countries tended to exhibit low macroeconomic volatility and extensive credit information systems. Butler et al (2009) made a

ISSN 2039-9340 Mediterranean Journal of Social Sciences Vol. 3 (11) November 2012
244
similar conclusion, noting that ease of foreclosure is one of the most significant factors accounting for regulatory efficiency in housing finance markets. 3. Housing Demand and Supply Indicators in West Africa Housing need in West Africa can be estimated by the proportion of the urban population living in substandard housing in slum settlements as a result of various factors ranging from poverty to lack of access to alternatives. As shown in figure 1 below, As at 2005 estimates, slum population as a proportion of urban population range from 42% in Senegal, to 50% in Guinea, 70% in both Togo and Nigeria and 98% in Sierra Leone (ECA, AU & ADBG 2009).
Source: Source: Economic Commission for Africa, Africa Union & Africa Development Bank Group (2009) Kihato (2009) further shows the financial extend of demand for housing finance as shown in table 1 below. The funds required for satisfying urban housing demand across West Africa ranges between ten million US dollars in Gambia and 1.5 trillion in Nigeria. This shows the financial implication of the housing need and also indicates that there is a potential investment outlet in the housing sector in the region. Table 1: Financial Estimate of Housing Need across some West African Countries
Country Population
Estimated minimum demand Urban demand for finance ($)
1 Nigeria 144 700 000 2 039 355 1 427 548 847.20
2 Cote d'Ivoire 18 900 000 440 062 308 043 400.00
3 Ghana 23 000 000 315 161 220 612 933.33
4 Togo 6 400 000 188 707 118 885 656.96
5 Mali 12 000 000 95 552 66 886 500.00
6 Senegal 12 100 000 91 989 64 392 328.00
7 Benin 8 800 000 87 442 61 209 727.46
8 Liberia 3 600 000 63 707 44 594 655.00
9 Burkina Faso
14 400 000 62 140 43 497 801.29
10 Niger 13 700 000 52 577 36 804 022.50
11 Gambia 1 700 000 15 052 10 536 420.45
Source: Kihato (2009) However, while the housing need has been established to be in existence in the region (table 1) above, the effective demand required to satisfy the need may not be sufficient to provide an incentive for market participation.
0%
50%
100%
150%
Gam
bia
Guin
eaCo
te …
Burk
ina …
Togo
Mal
iN
iger
iaBe
nin
Nig
erGu
inea
…Si
erra
…Se
nega
l
Fig 1: Slum Population as a Percentage of the Urban Population
Percentage Slum Population

ISSN 2039-9340 Mediterranean Journal of Social Sciences Vol. 3 (11) November 2012
245
In table 2 below, it is shown that across West Africa, the cheapest housing built by a public sector organization is not affordable to its citizens. Table 2: Housing Market indicators across selected West African countries
Source: Centre for Accessible Housing Finance in Africa (2011) The table also shows that there is a high rate of dependent population, who live so much under the poverty line, as high as 75% in Benin, 85% in Niger and 83% in Nigeria. If the monthly repayment mortgage is compared to the earning capacity across the countries, it is evident that the effective demand necessary to meet the housing need identified in table 1 is minimal. This might be due to the basis of employment opportunities available. Available data (table 3) shows the distribution of employment across the agriculture, industry and services sector in sub-Saharan Africa (of whichWest Africa is a part) and indicates that most of those employed are in the informal (Agricultural) sector. Table 3: Average Sectorial Share in Employment: World and Africa (1998-2008).
Sector Agriculture Industry Services World 36.7 21.7 41.5 North Africa 34.2 35.6 44.6 Sub-Saharan Africa 64.1 9.8 26.0
Source: Economic Commission for Africa, Africa Union & Africa Development Bank Group (2009) The informal sector is characterized by lower incomes, limited protection, and frequent spells of unemployment and lack of access to institutions that shape policies (UNECA 2010). Lower incomes in a largely informal economy could often result in lower propensity to save in the formal sector. This affects the potential volume of savings available for future lending activities. The bulk of the demand base of West African countries (like many emerging nations) is from these small-scale producers and enterprises which are non-corporate, unlicensed and unregistered business concerns with farmers, often artisans, trades people as main actors (Todaro & Smith 2004). They require access to typically small loans for both business and housing needs, but do not necessarily possess quality collateral, operate on the margin in small scale, and have little or no verifiable credit history to access finance in the formal financial sector. These people who in countries like Nigeria constitute 57% of the urban workforce; in Burkina Faso are 82%, in Cote D’Ivoire are 42%; Mali (60%), Niger (81%), Ghana 38% of the working male population (African Economic Outlook 2010, Okunlola 2007, UN-Habitat 2007) do not generally satisfy the lending requirements by formal lending institutions, even though other factors such as a significant annual growth rate, high slum population indicative of high urban housing need both indicate present and future need for finance that could be met by the private sector. 4. Study Methodology In the analysis that follows, statistical means is employed to determine the most significant deterrent factors to the participation of formal lenders in the West African region. To do this, the private credit to GDP ratio is utilized as the dependent variable while inflation, depth of credit information, property registration index, and depth of legal strength are used as independent variables. While it is recognized that the ratio of mortgage debt to GDP is a more appropriate measure of access to formal sector funds in the mortgage market of any country; this data was not available for most of the West African countries (studies such as Warnock & Warnock 2008 had similar limitations). Therefore, the depth of
Country Cheapest House(USD) Monthly Repayment for cheapest Mortgage loans
(USD)
% of population earning below $60/month
Housing need per annum
Benin 14,130 22 75.3 n/a Gambia 31,000 1,500 56.7 n/a Ghana 16,447 250 53.6 65,000 Niger 12,889 60.18 85.6 40,000 Nigeria 16,700 200 83.9 720,000 Senegal n/a n/a 60.4 200,000

ISSN 2039-9340 Mediterranean Journal of Social Sciences Vol. 3 (11) November 2012
246
private credit to GDP ratio is used as a proxy. The rationale is that the ratio captures all the private sector debts in the market: of which mortgage debts are a component. Its use as a proxy would therefore give an insight into the upper limit of the mortgage market and its contribution to the national GDP. Data is gathered for these factors from a variety of sources, principally the Doing Business Reports of the World Bank and the African Economic Outlook database between 2008 and 2010 and Djankov et al (2007) (see table 4 below), averaged and subjected to regression analysis. Three ‘comparable’ countries with significant private credit to GDP rations are also introduced to further illustrate the importance of the independent variables. These are Uruguay, Malaysia and South Africa. The proposition being tested is that these three ‘comparable’ countries possess significant private credit to GDP ratios because they had more matured mortgage markets (based on the afore-mentioned criteria) and that should West African countries improve on their ratings in these factors; the ratio of private credit to GDP ratio would be higher. Because all the independent variables also relate to the institutional factors necessary for lenders to be active in the housing market; the higher ratio of private credit to GDP could be attributed to higher lending activities in the housing market. Table 4. Average ratings of West African countries on the independent variables over the 2008-2010 period.
Table 4 above presents data on private debt outstanding expressed as a share of nominal GDP. All data are for the 1999–2010 period, but not all years are available for all countries. Average Private Credit to GDP (PC/GDP) for the 1999–2003 period is used as the dependent variable. The independent variables are Inflation rate with the available period from 2009 to 2012. Procedures to register (PREG), time to register property (in days-TREG) and cost to register property (CREG) -measured as a percentage of property value- are all for the period of 2008 to 2010 and collectively make up the ease of registration of property index. Similarly, strength of legal right (LRT) and credit information index which measures percentage of adults covered by a public credit information bureau (CInfoP) and by a private credit information bureau (CInfoPr) were collected over the 2008 to 2010 period.
Country PC/GDP Inflation PREG(6.5) TREG(days). CREG (%) CInfoP (%) CInfoPr (%) LRT (3.73)
Benin 0.12 3.67 83.93 11.7 2.95 9.73 1 3.33 Burkina Faso 0.12 6 69 11.87 2.68 2.2 1 3.33 Cote d’Ivoire 0.14 6.33 62 14.9 4.08 2. 8 1 3 Gambia 0 5 371 5.6 5.43 0.0 0 4.67 Ghana 0.12 5 34 1.2 10.68 0.0 0 6.33 Guinea 0.04 6 104 14.37 10.55 0.1 0.03 3.33 Guinea Bissau 0 9 211 6.13 1.58 0.7 1 3 Liberia 0 12 50 14.27 6.13 0.2 0.67 4 Mali 0.17 5 29 20.5 2.43 3.57 1 3 Mauritania 0.2 4 49 5.2 4.75 0.2 1 3.33 Niger 0.05 4.33 34 10.33 3.68 0.93 1 3 Nigeria 0.15 13.67 82 21.67 11.58 0.03 0 8 Senegal 0.19 6 120.67 20.23 1.13 4.27 1 3 Sierra Leone 0.03 7.33 185.67 13.4 11.2 0.0 0 5 Togo 0.16 5 295 13.47 3.23 2.67 1 3 Regional Averages
3.76 6.5 118 112.32 1.58% 0.65% 3.73
Comparable countries Malaysia 2.33 5 144 3.2 48.63 27.33 10 Uruguay 3.45 8.3 66 7.1 15.77 96.33 4 South Africa 5.5 6 24 8.8 0 57.2 10 Averages 3.76 6.43 78 6.37 21.47 60.29 8

ISSN 2039-9340 Mediterranean Journal of Social Sciences Vol. 3 (11) November 2012
247
Table 5: Summary Statistics
N Mean Standard dev. Minimum Maximum West-African Countries GDP(Y) 12 0.1242 0.5712 0.03 0.20 Inflation(X1) 15 5.4728 3.6991 1.13 11.58 Procedure of reg.(X2) 15 6.5543 2.8946 3.67 13.67 Time to reg.(X3) 15 118.6827 102.8786 29 371 Cost of reg.(X4) 15 12.4813 5.6606 3.60 21.67 Legal rights.(X5) 15 3.9467 1.4808 3 8 Public reg.(X6) 15 1.8313 2.6286 0 9.73
Credit info.(X7) 15 0.6667 0.4544 0 1 Country size.(X8) 15 39716.2667 95861.4942 2266 384084
Table 6: Main Regression Results
Variables T– Statistic Standard Error Significant (P-value)
Inflation 0.254 0.047 0.681 Procedure-to registration -0.413 0.037 0.816 Time to reg. 0.362 0 0.708 Cost to reg. 0.639 0.013 0.741 Legal rights 0.781 0.126 0.492 Public reg. -0.513 0.011 0.643 Credit info. 0.604 0.610 0.588 Country size -0.276 0 0.801 N 15 Adjusted R2 -0.404
The presence of multi-co linearity in the data necessitated a reduction of independent variables, in order to determine the highly significant ones. The resulting adjustment showed that legal rights and credit information systems appeared to be the two most significant factors. A model specification is generated on this basis. Table 7 Regression Results After Adjustment: West African countries.
Variables T– Statistic Standard Error Significant (P-value)
Legal rights 2.459 0.015 0.036 Credit info 3.111 0.054 0.013 N 12 Adjusted R 0.414
4.1 Model Specification for West African Countries. Y = Bo + B1X1 + B2X2 +B3X3 + B4X4 + B5X5 + B6X6 + B7X7 + B8X8 + e. Where; Y = Private credit to GDP. X1 = Inflation rate. X2 = Procedures to register. X3 = Time to register property (days).
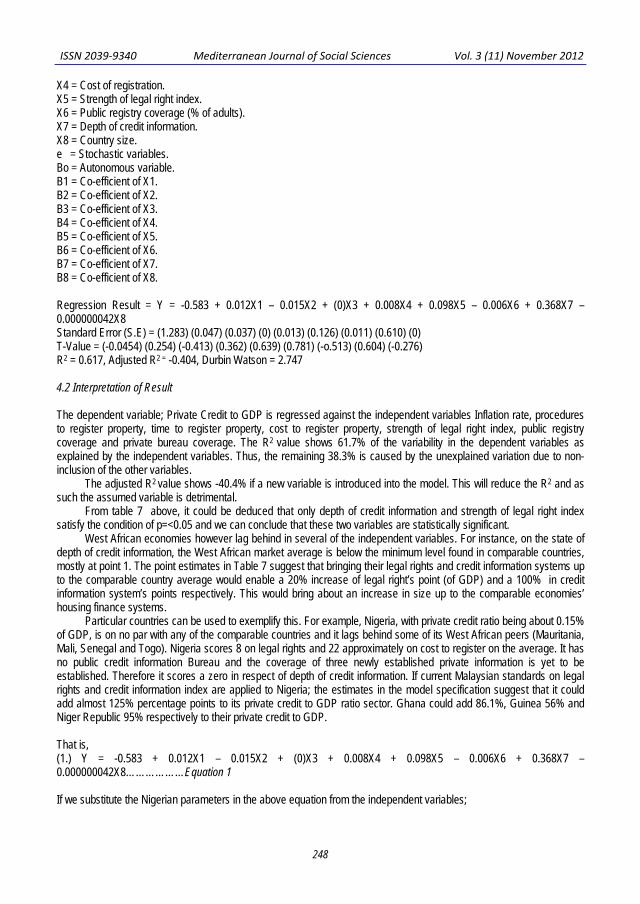
ISSN 2039-9340 Mediterranean Journal of Social Sciences Vol. 3 (11) November 2012
248
X4 = Cost of registration. X5 = Strength of legal right index. X6 = Public registry coverage (% of adults). X7 = Depth of credit information. X8 = Country size. e = Stochastic variables. Bo = Autonomous variable. B1 = Co-efficient of X1. B2 = Co-efficient of X2. B3 = Co-efficient of X3. B4 = Co-efficient of X4. B5 = Co-efficient of X5. B6 = Co-efficient of X6. B7 = Co-efficient of X7. B8 = Co-efficient of X8. Regression Result = Y = -0.583 + 0.012X1 – 0.015X2 + (0)X3 + 0.008X4 + 0.098X5 – 0.006X6 + 0.368X7 – 0.000000042X8 Standard Error (S.E) = (1.283) (0.047) (0.037) (0) (0.013) (0.126) (0.011) (0.610) (0) T-Value = (-0.0454) (0.254) (-0.413) (0.362) (0.639) (0.781) (-o.513) (0.604) (-0.276) R2 = 0.617, Adjusted R2 = -0.404, Durbin Watson = 2.747 4.2 Interpretation of Result The dependent variable; Private Credit to GDP is regressed against the independent variables Inflation rate, procedures to register property, time to register property, cost to register property, strength of legal right index, public registry coverage and private bureau coverage. The R2 value shows 61.7% of the variability in the dependent variables as explained by the independent variables. Thus, the remaining 38.3% is caused by the unexplained variation due to non-inclusion of the other variables.
The adjusted R2 value shows -40.4% if a new variable is introduced into the model. This will reduce the R2 and as such the assumed variable is detrimental.
From table 7 above, it could be deduced that only depth of credit information and strength of legal right index satisfy the condition of p=<0.05 and we can conclude that these two variables are statistically significant.
West African economies however lag behind in several of the independent variables. For instance, on the state of depth of credit information, the West African market average is below the minimum level found in comparable countries, mostly at point 1. The point estimates in Table 7 suggest that bringing their legal rights and credit information systems up to the comparable country average would enable a 20% increase of legal right’s point (of GDP) and a 100% in credit information system’s points respectively. This would bring about an increase in size up to the comparable economies’ housing finance systems.
Particular countries can be used to exemplify this. For example, Nigeria, with private credit ratio being about 0.15% of GDP, is on no par with any of the comparable countries and it lags behind some of its West African peers (Mauritania, Mali, Senegal and Togo). Nigeria scores 8 on legal rights and 22 approximately on cost to register on the average. It has no public credit information Bureau and the coverage of three newly established private information is yet to be established. Therefore it scores a zero in respect of depth of credit information. If current Malaysian standards on legal rights and credit information index are applied to Nigeria; the estimates in the model specification suggest that it could add almost 125% percentage points to its private credit to GDP ratio sector. Ghana could add 86.1%, Guinea 56% and Niger Republic 95% respectively to their private credit to GDP. That is, (1.) Y = -0.583 + 0.012X1 – 0.015X2 + (0)X3 + 0.008X4 + 0.098X5 – 0.006X6 + 0.368X7 – 0.000000042X8………………Equation 1 If we substitute the Nigerian parameters in the above equation from the independent variables;
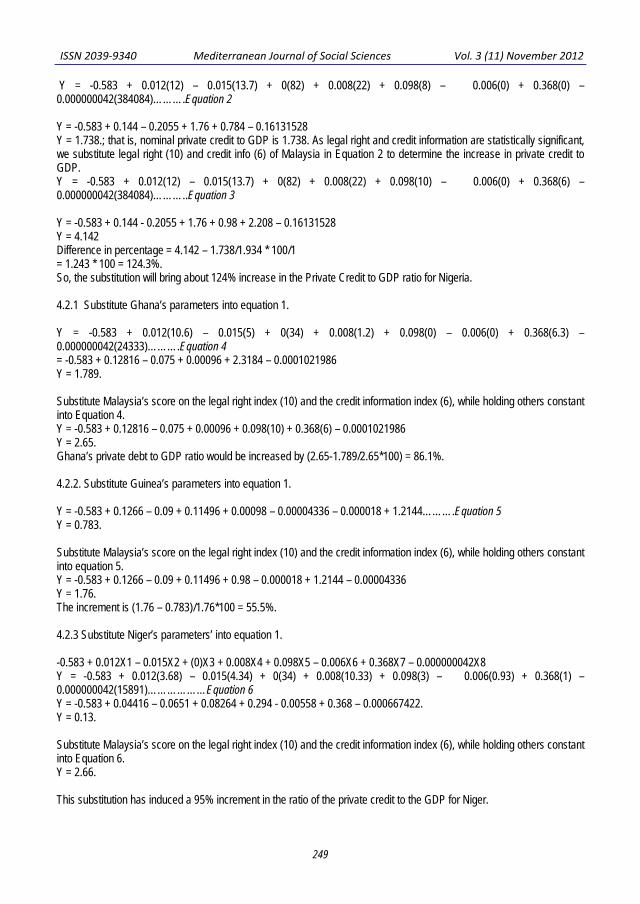
ISSN 2039-9340 Mediterranean Journal of Social Sciences Vol. 3 (11) November 2012
249
Y = -0.583 + 0.012(12) – 0.015(13.7) + 0(82) + 0.008(22) + 0.098(8) – 0.006(0) + 0.368(0) – 0.000000042(384084)……….Equation 2 Y = -0.583 + 0.144 – 0.2055 + 1.76 + 0.784 – 0.16131528 Y = 1.738.; that is, nominal private credit to GDP is 1.738. As legal right and credit information are statistically significant, we substitute legal right (10) and credit info (6) of Malaysia in Equation 2 to determine the increase in private credit to GDP. Y = -0.583 + 0.012(12) – 0.015(13.7) + 0(82) + 0.008(22) + 0.098(10) – 0.006(0) + 0.368(6) – 0.000000042(384084)………..Equation 3 Y = -0.583 + 0.144 - 0.2055 + 1.76 + 0.98 + 2.208 – 0.16131528 Y = 4.142 Difference in percentage = 4.142 – 1.738/1.934 * 100/1 = 1.243 * 100 = 124.3%. So, the substitution will bring about 124% increase in the Private Credit to GDP ratio for Nigeria. 4.2.1 Substitute Ghana’s parameters into equation 1. Y = -0.583 + 0.012(10.6) – 0.015(5) + 0(34) + 0.008(1.2) + 0.098(0) – 0.006(0) + 0.368(6.3) – 0.000000042(24333)……….Equation 4 = -0.583 + 0.12816 – 0.075 + 0.00096 + 2.3184 – 0.0001021986 Y = 1.789. Substitute Malaysia’s score on the legal right index (10) and the credit information index (6), while holding others constant into Equation 4. Y = -0.583 + 0.12816 – 0.075 + 0.00096 + 0.098(10) + 0.368(6) – 0.0001021986 Y = 2.65. Ghana’s private debt to GDP ratio would be increased by (2.65-1.789/2.65*100) = 86.1%. 4.2.2. Substitute Guinea’s parameters into equation 1. Y = -0.583 + 0.1266 – 0.09 + 0.11496 + 0.00098 – 0.00004336 – 0.000018 + 1.2144……….Equation 5 Y = 0.783. Substitute Malaysia’s score on the legal right index (10) and the credit information index (6), while holding others constant into equation 5. Y = -0.583 + 0.1266 – 0.09 + 0.11496 + 0.98 – 0.000018 + 1.2144 – 0.00004336 Y = 1.76. The increment is (1.76 – 0.783)/1.76*100 = 55.5%. 4.2.3 Substitute Niger’s parameters’ into equation 1. -0.583 + 0.012X1 – 0.015X2 + (0)X3 + 0.008X4 + 0.098X5 – 0.006X6 + 0.368X7 – 0.000000042X8 Y = -0.583 + 0.012(3.68) – 0.015(4.34) + 0(34) + 0.008(10.33) + 0.098(3) – 0.006(0.93) + 0.368(1) – 0.000000042(15891)………………Equation 6 Y = -0.583 + 0.04416 – 0.0651 + 0.08264 + 0.294 - 0.00558 + 0.368 – 0.000667422. Y = 0.13. Substitute Malaysia’s score on the legal right index (10) and the credit information index (6), while holding others constant into Equation 6. Y = 2.66. This substitution has induced a 95% increment in the ratio of the private credit to the GDP for Niger.

ISSN 2039-9340 Mediterranean Journal of Social Sciences Vol. 3 (11) November 2012
250
This model therefore shows that the private depth to GDP (of which the depth of mortgage depth is a component) in these West African countries can be improved substantially if the legal strength of lenders is improved, and lenders can effectively access, collect, share and disseminate credit information on prospective borrowers in the region. 5. Discussion The ability of any country to effectively and efficiently utilize the systems and structures of market driven institutions for housing finance depends on the level of sophistication of its financial system, stability of the political economy and the macro-economic conditions under which they will be required to operate (Chiquier, Hassler & Lea 2004). The functions which these institutions would perform for the housing market and the entire national economy are important, more so in developing countries where the need for housing finance affects a predominantly large section of the population.
Renaud (1984) and Forrest (2008) identifies a few of these functions: They are expected to mobilize household savings and investor funds into mainstream housing finance mechanisms such as primary mortgage banking and secondary market investments. They are also expected to drive the savings culture across all income groups so as to increase the volume of financial savings into the national economy and then take charge of the allocation of the supply of loan-able funds to loan-seekers. Macro-economic stability which also generates employment in the formal sector are important criteria to actualize this function.
The market allocates funds between and within various sectors of the economy: lending institutions are expected to provide policy control for the allocation of funds to the housing sector, to reallocate funds from surplus to relatively deficit areas by developing products that will ensure that all income strata of the economy are well served. In addition, they are also expected to facilitate the flow of international and domestic funds into the sector. The need for flexibility in the legal framework to ensure ease of foreclosure proceedings-for instance- enhances the profile of housing as an alternative investment outlet.
As the channel of financial infrastructures improves, housing systems would be able to operate within a globally integrated financial market, which offers opportunities for global competition. Housing finance institutions are therefore expected to connect with global financial systems to improve their own competitiveness, while ensuring that relevant global standards (such as Property Valuation and Asset Accounting conventions) governing their operations are adhered to. Risk management strategies are paramount services to protect the market from shocks that could cause financial loss to investors and home-owners: this is an important duty given the increasingly globalized nature of real estate markets. In particular, risk management would also ensure that asset deflation or inflation, interest rate changes and investment flows into the housing sector are appropriately managed (Forrest 2008).
Most of these functions can be achieved through policy liaisons with government regulatory agencies. This is because the role of government in the housing market is still fundamental, despite the neo-liberal recommendation for government withdrawal from direct provisioning of key social infrastructures. When government participates directly in the housing market, it has the capacity to initiate, develop and nurture the institutions that ensure the efficient workings of the market. Synergized, the activities of government as ‘enabler’ and the private sector, as ‘provider’ should ensure that there is wider access to housing finance, increased housing supply, growth and development of the construction and real estate industry, increased employment opportunities, urban development and general national economic development. However, there are specific areas where the instrumentality of government is needed to strengthen the market.
Todaro & Smith (2009) recommend a series of ‘dynamic incentives’ to address the inappropriate credit history such as microfinance, ROSCAs, village lending and group lending. As these credit systems are inculcated in the culture of West Africans, it is possible for the government to link up their activities with the formal sector by creating opportunities for their registration, collecting credit information from them about their participants, while also incentivizing the process through the provision of loan insurance and guarantees. Loan insurance and guarantees also serve to incentivize the fund providers towards finance provision, and is provided by governments in developed countries to ensure that a cushioning effect can be had in case of default.
The regulation of financial institutions to ensure that activities such as lending criteria setting, governance and risk profiling is to be done by government and its agencies. Governments could also strengthen the market by creating (or facilitating the creation of) new institutions that would be designed to use resources available in the informal sector –such as credit information from thrift societies- and convert them to a form useful for the formal sector.
Macro-economic stability requires continuity in governance, which ensures that policy formulation, consolidation and implementation are more efficiently carried out. Continuity in governance does not however mean perpetuity in political offices; but rather requires that macro-economic stability is taken as a strategic goal for which co-ordinated set of action

ISSN 2039-9340 Mediterranean Journal of Social Sciences Vol. 3 (11) November 2012
251
plans are required. These strategies include employment generation, promotion of savings culture, and enhanced human capital development amongst others.
The legislative processes for foreclosure could also be loosened to ensure lenders have quick access to collaterals in case of default, while also protecting borrowers’ rights. It has been suggested (Todaro & Smith 2009) that non-court based procedures be utilized in the ascertainment and enforcement of foreclosure rights to quicken the process and also reduce costs.
To have appreciable macro-economic impact, it has been argued that a nation’s housing finance policy should be firmly imbedded in its financial sector (Lea 1994, Warnock & Warnock 2008, Renaud 2004). This position is advocated as a means of mainstreaming policies, reducing government direct intervention and hence ensuring that housing subsidies and direct provision do not distort the macro-economy. However, there is a need to ensure that the demand base of the people in the region is increased through more formalized employment generation activities. This could enhance the volume of savings in the macro-economy.
In well-functioning, market led housing finance system, the capacity to promote long-term liability (that is ability to value properties and to seize it in the case of default, inform on the credit worthiness of potential borrowers and macro-economic stability and factors to promote the mobilization of funds e.g savings and deposits, capital markets, a government liquidity window or secondary market) exist. All these are tied to the depth of each country’s financial system. Developed economies in North America, Western Europe, Australasia and Japan- despite the subprime crisis- have proven to master the complexities of the system; and have achieved a measure of economies of scale and development depth of both domestic financial markets and international demand mechanism, to the extent that their housing markets are tailored to the needs of the people and specific to each income strata in the society. Mainstream housing finance work for people who are able to operate in the financial markets; and other products are developed for people who are not able to. In the market, people who need help to operate in the market are helped through government mediated funds to achieve this. 6. Conclusion A significant proportion of the population in the West African region can be classified as sub-prime for lending purposes, earning below $60 per day. In addition to this high subprime market base, the region’s housing markets are also characterized by lack of depth of the mortgage market, especially in the area of lack of credit information systems and low levels of legal rights for lenders. The need for government intervention is necessary in several areas. The need for facilitating the setting up of private credit information bureaus while creating intermediaries to convert information from informal organizations to be used in the formal sector is one such area. The need for the government to also ensure macro-economic stability is increasingly important to ensure that a critical mass is generated for promoting savings and lending, at least at the primary mortgage level. It is also possible for governments across the West African region to develop non-court procedures for foreclosures to strengthen legal rights. However, given that the predominant proportion of people in the West African region are in the sub-prime sector, the development of alternative routes to formal housing finance, through intermediary organizations that are culture centered (and so familiar to the people they are meant to serve) is considered a pragmatic step forward in the debate of how government could provide housing finance to its people within the limits of market driven reforms.
References
African Economic Outlook (2012). Data and Statistics. Available at www.Africaneconomicoutlook.org Butler, S., kravova, M. & Safavian, M. (2009). Mortgage registration and foreclosure around the globe: Evidence from 42 Countries.
Housing Finance International, June (2009), pp.19-29 Centre for Affordable Housing Finance in Africa (2011). 2011 YearBook. Housing Fiannce in Africa. South Africa: Centre for Afordable
Housing Finance in Africa Chiquier, L., Hassler,O., & Lea, M. (2004). Mortgage securities in emerging markets’ financial sector operations and policy department.
Working Paper 3370, The World Bank Policy Research, August 2004. Djankov, McLiesh, C. & Shleifer, A.( 2005?). Private credit In 129 countries. Working Paper 11078, National Bureau Of Economic
Research, available at: http://www.nber.org/papers/w11078 . Economic Commission for Africa, Africa Union & Africa Development Bank Group (2009). Assessing Progress in Africa toward the
Millennium Development Goals. Addis Ababa.:Economic Commission for Africa, Africa Union & Africa Development Bank Group Erbas, N. and Nothaft, F. (2005). Mortgage markets in Middle East and North African countries: Market development, poverty reduction,
and growth. Journal of Housing Economics 14, pp.212–241.

ISSN 2039-9340 Mediterranean Journal of Social Sciences Vol. 3 (11) November 2012
252
Forrest, R. (2ira008). Risk, governance and the housing market.. Housing Finance International.Vol. xxiii, 3-13. Genworth Financial (2008). “Public/private partnership in housing finance: expanding access and ensuring financial system stability,” in
International Conference on Housing Finance in Emerging Markets: Lessons for development from the sub-prime crisis 2008, World Bank Headquarters Washington D.C, May 2&-30
International Monetary Fund (2008). World economic outlook: Housing and the business cycle. Washington: IMF. Lea, M. (1998). The applicability of secondary mortgage markets to developing countries. In Lea,M. (Ed.), Secondary Mortgage
Markets: International Perspectives. USA: International Union for Housing Finance. Okoroafor , P. (2007). Critical issues in the development of viable housing finance industry in Nigeria. In 2nd Emerging Urban Africa
International Conference & Exhibition of Housing Finance in Nigeria, 17 October-19 October 2007, Abuja. Okunlola 2007 The Informal Economy in Lagos, Nigeria In Urban Informal Economy. UN-habitat vol. 13 no 2.pp12 Malpass, P. & Victory, C. (2010). The modernization of social housing in England. International Journal of Housing Policy, vol.10 No. 1,
pp.3-18. Nubi, T. (2010). Towards a sustainable housing finance in Nigeria: The challenges of developing adequate housing stock and a road
map. Housing Finance International, Summer 2010. pp. 22-29 Ronald, R. (2010). Housing policy realignment in East Asia. Housing Finance International, Summer 2010. pp.37-43. Todaro, P.T. and Smith, S.C. (2009). Economic development (10th ed). Essex: Pearson Education Limited UN Habitat (2007). ‘State of the world’s cities 2005 in urban informal economy.’ Habitat Debate, vol.13 No. 2 , pp. 9. UNECA (2010). Economic Report on Africa 2009. Addis Ababa: UNECA UNHDP (2010). Human Development Report 2010. The Real Wealth of Nations. Available at
http://hdr.undp.org/en/reports/global/hdr2010/ World Bank (2008). Doing Business Report: West Africa Regional Report. Washington: The World Bank World Bank (2009). Doing Business Report: West Africa Regional Report. Washington: The World Bank World Bank (2010). Doing Business Report: West Africa Regional Report. Washington: The World Bank Warnock, V.C. and Warnock, F. E.(2008). Markets and housing finance. Journal of Housing Economics 17, pp.239–251

ISSN 2039-9340 Mediterranean Journal of Social Sciences Vol. 3 (11) November 2012
253
Latin Lesson Lectio Aulae
Dr. Eliana Paço
Facoltà di Lingue Straniere
Università di Tirana e-mail: [email protected]
Doi:10.5901/mjss.2012.v3n11p253
Abstract. Latin language in Albania is a rare language studied and confined just at the Faculty of Medicine, Faculty of History and Philology (Department of Albanian language and Literature and Department of History), Faculty of Foreign Languages. Several researchers and linguists, such as I. Zamputi, P. Gjeci, K. Cipo, R. Andoni, H. Subashi, K. Qiriazati, E. Paço and N. Basha have undertaken serious attempts at designing the programs on Latin language teaching targeted at students of the Faculties due to the needs that Latin learning poses in this domain. The texts have been designed in terms of the theoretical and practical aspects, students’ needs and in line with a better acquisition of the other courses related to Latin and Old Greek languages learning. This article will lay an emphasis on the different methods of Latin teaching, aspects of an accurate translatability of the medical terminology and some suggestions related to different kinds of exercises used at school aiming at a better acquisition of the courses related and dependent on Latin learning incorporated at the Faculty of Medicine. Key words: Latin language, curricula, teaching, terminology, etc. Il greco e il latino sono le lingue della civiltà europea, il greco ha modellato con le splendide forme plastiche della sua struttura complessa e multiforme l’espressione, nelle catene del discorso verbale, di quel logos, attinto ad un iperuranio profondarsi soprasensibile dell’umano nell’Assoluto; il latino accogliendo l’eredità spirituale dell’Ellade, ha vinto il naturale impedimento della propria egestas, piegando i suoi moduli lessicali e sintattici a tal punto da conformarli perfettamente ai contenuti altissimi di cui intendeva farsi veicolo. Anche là dove, dunque, la forza dell’irreparabile tempus travolgeva il latino dell’uso quotidiano, trasformandolo nei nuovi modelli delle nascenti lingue romanze, esso continuò a rappresentare il mezzo privilegiato, quando anche non unico, della trasmissione culturale per secoli: uno strumento comunicativo che, rompendo gli argini costrittivi e vincolati dello spazio e del tempo univa in un unica, res publica litteraria et philosophica, sincronicamente, uomini viventi nelle regioni più diverse, informati a leggi, costumi, usanze, idee talora profondamente differenti tra loro; e diacronicamente permetteva di penetrare nelle “corti degli antichi uomini”, coi quali risultava facile e spontaneo instaurare un dialogo fecondo e costruttivo, perché la linfa da loro trasmessa ricevesse nuovo vigore nel passare attraverso il tronco da essa sviluppatosi.
Certi di questo fondamentale valore delle lingue classiche come chiave indispensabile per aprire i tesori della letteratura, della filosofia, del diritto, delle scienze matematiche, fisiche, chimiche, e naturali che lo spirito umano ha saputo scoprire e costruire nel progressivo affermarsi del suo secolare svolgimento, riteniamo che il latino non possa essere riservato, come qualcuno prospetta, ad un curriculum specializzato, destinato a formare solo i futuri antichisti, ma costituisca un patrimonio indispensabile della civiltà occidentale, da cui nessun uomo di cultura può prescindere; né si può veramente pensare di avere gli strumenti per accedere alle radici storiche della civiltà Occidentale. Senza un buon apprendimento del latino non si possono intendere i testi originali che ci hanno tramandato la storia nei secoli. Eppure la situazione che caratterizza l’insegnamento del latino, che è un insulso grammaticalismo fino a se stesso, ossessiva onnipresenza del vocabolario, costituisce tuttora un ostacolo quasi insormontabile per i nostri studenti, che si allontanano da quella disciplina di straordinario valore formativo e culturale.
Le ricerche promosse e le sperimentazioni effettuate già in altri paesi, dimostrano come, in breve tempo, si possano condurre i giovani studiosi alla compressione diretta e senza difficoltà di testi di autore, sfruttando tutte le possibilità offerte dalla più recente glottodidattica. Sembra infatti che troppo spesso si dimentichi che il latino in fin dei conti è una lingua e tale va insegnata. Da noi ci si deve tramandare la sua particolare condizione di fissità all’interno di un corpus, che permette agli studenti, di condividere la possibilità dell’apprendimento delle lingue moderne. Per i docenti del latino, ciò, significa, che devono utilizzare delle strade e dei metodi che vanno mutatis mutandis, e che gli consentono delle discipline linguistiche e di ottenere più che soddisfacenti risultati.
Se il futuro ha le radici antiche, questa ci costringe di trovare nuovi approcci alla memoria storica come un’esigenza e come una necessità imprescindibile da un’epoca in cui la volgarità espressiva va sempre più a coniugarsi con una

ISSN 2039-9340 Mediterranean Journal of Social Sciences Vol. 3 (11) November 2012
254
mentalità mercantile e pragmatica che tutto pervade e recide crudelmente i legami con quanto di altissima civiltà l’Europa ci ha nei secoli prodotto e tramandato. La lezione del latino ha svolto bene il suo compito di trasmissione dell’umano sapere, quando gli studenti saranno in grado di capire il testo e di tradurre i testi facili senza usare il dizionario, e quando alla meticulosa necessitas si passa nella libera curiositas, e si è stimulata la gioia di una tradizione progressiva di nuovi straordinari orizzonti.
Il latino è difficile, ma questo non vuol dire abolirlo, anziché ci si vuole dare un incremento a questo studio di rendere attraente il cammino del suo apprendimento. Non è raro che si senta parlare di metodi nuovi, facili, pratici ed attraenti dell’apprendimento del latino, e ciascuno di essi, frutto di diligente impegno porta con sé qualche cosa che può giovare e che rinfresca l’interesse intorno a esso. Ora noi sappiamo che cos’è il latino e che cosa si ottiene con l’apprendimento di esso. Si tratta di nozioni elementari. Ma proprio le nozioni elementari, quando si va a ricercarne il fondamento vero, finiscono per apparire assai complicate e difficili. Il latino è una lingua difficile, ma che cosa è difficile nel latino? È solo la linguistica, colla storia della letteratura e della cultura romana classica, che può dare spiegazioni a questa difficoltà e aiutare ad essere assorbito in un modo giusto didattico questa materia mal conosciuta.
Anche gli studenti sanno che il latino è la lingua degli antichi romani, della cultura, della poesia, della scienza, in tutto il mondo occidentale e che dal latino sono derivate le lingue romanze direttamente la lingua italiana, e per di più ci sono anche tanti influssi nella lingua albanese, influssi che, sono introdotti secondo le classi della società, le professioni e le condizioni civili e secondo gli stessi temperamenti umani. È da notarsi che, la difficoltà del latino viene anche perchè gli scrittori latini non seguono una linea diretta letteraria, ma sono state modificate da uno scrittore a un altro scrittore e, attraverso gli scrittori nel popolo. Questo ha dato un’evoluzione linguistica che, è la prima ragione della difficoltà del latino. La difficoltà del latino si aumenta anche dalla tradizione teorica dello svolgimento di questa lingua e dalla preoccupazione superflua dalla parte di chi lo impara.
Nel potenziamento del linguaggio operato dagli autori latini si insinua un nuovo ordine di difficoltà per gli studenti e per i lettori moderni. Nel latino le parole e le frasi hanno tanti significati diversi, anche il vocabolario latino ci offre spesso, per una parola una serie di interpretazioni spesso assai differenti tra loro, ciò sta nel fatto che il classicismo, nella sua economia dei mezzi, e nel suo modo di dire le cose nel modo assai concise, fa chiarire ciascuna parola della frase con le altre che si associano. È chiaro che, per orientarsi nella materia così vasta e difficile ci occorre una certa preparazione che impiega molto tempo che non è facile trovare nei giorni d’oggi. Perchè gli scrittori latini sono lontani da noi per il tempo, per il loro mondo ideale, per le condizioni sociali e civili, per le materie elevate che hanno trattato, per la storia e per la politica delle loro età, per la loro filosofia morale e ideale, per le loro fantasie poetiche e per il loro patriottismo, rende e appare di una difficoltà enorme lo studio del latino. Autori facili ci sono, ma di una facilità assai relativa. Il latino, per impararlo bene, è necessario studiarlo bene, perchè si tratta di una lingua di un fase molto antica e prevalentemente sintetica e che si studia in base di un’alta letteratura degli scrittori assai diversi tra loro.
Per portare un modesto aiuto di penetrare nella linguistica e per dare il modo di servirsene del latino anche in Albania sono pubblicati e scritti pochi libri, soprattutto testi di grammatiche e alcuni dizionari indispensabili (Lacaj, H. 1964; Prifti, St. 1965; Shoshi, G. 1968-1985; Popoviq, R.Prishtine, 1970, 1973; Sedaj, E. Prishtine 1978; Qirjazati, K.1967, 86.)
I legami stretti che sono stati tra Albania e la penisola italica, ha giustificato l’insegnamento del latino da tempo. Fino al tardo medioevo, nei diversi campi sociali si comunicava tramite la lingua latina, e si scriveva solo nel latino. Dopo il XV secolo, quando l’Albania viene occupata dall’Impero turco, è cambiato anche la lingua dei documenti scritti, viene cambiata anche la comunicazione nei diversi campi sociali. Anche se esisteva la lingua albanese, nei campi diplomatici a quei tempi si usavano queste due lingue. Ma, sono stati degli scrittori albanesi che fino al XVII secolo hanno continuato a scrivere nella lingua latina, come Marin Barleti, e nella lingua turca, come i fratelli Frashëri. La ragione principale di scrivere in queste lingue era la possibilità di essere pubblicate. Con la lingua latina, gli albanesi sono sentiti più vicini alla loro lingua. Il latino è rimasta una lingua più preferita e ha continuato ad essere imparata fino ad oggi nelle nostre scuole. Ci sono anche degli anni della sospensione dell’apprendimento del latino, ma l’esistenza dei numerosi documenti scritti, l’indispensabilità della medicina, delle scienze di natura, della scienza di fisica, delle letture e delle scienze psichiche giustificano la continuazione del latino.
Oggi la lingua latina, oltre la necessità per lo studio dei documenti storici, si svolge come una materia importante nella Facoltà di Medicina, per aiutare gli studenti di capire le materie specifiche della medicina; perché come si sa nel 1895 l’Associazione Anatomica tedesca, al Convegno di Basel, approvò l’elenco dei termo - elementi anatomici, conosciuti come la nomenclatura di Basel (BAA). Ivi sono fissate delle regole per la nomina delle parti del corpo umano e per il modo della loro abbreviazione. Si insegna anche nella Facoltà della Storia e Filologia, indirizzi in Lingua e Letteratura albanesi e Storia, per aiutare gli studenti ad approfondire gli studi sull’etimologia del lessico, a trovare delle spiegazioni nei fenomeni simili della grammatica storica, e nella storia per arrivare a tradurre dei documenti storici e nella

ISSN 2039-9340 Mediterranean Journal of Social Sciences Vol. 3 (11) November 2012
255
Facoltà delle Lingue Straniere si svolge per conoscere il latino classico, gli autori classici, la storia della letteratura latina il suo proseguimento nei secoli sempre alla necessità di approfondire lo studio della lingua italiana.
Il latino che si sviluppa nelle facoltà sopraccitate, viene svolto sotto l’aspetto grammaticale, per acquisire delle conoscenze della morfologia e del lessico letterario, perché il tempo è insufficiente. Oltre alle conoscenza della morfologia, agli studenti vengono dati anche dei pezzi tratti da autori latini per fargli conoscere un po’ di lessico, i quali vengono scelti in base ad un programma prestabilito. Essendo una lingua che ha perso l’attitudine comunicativa, per questa ragione gli studenti devono imparare tutto a memoria. Questa cosa crea delle difficoltà ma ha anche un lato positivo, perché così rende acuta la memoria degli studenti e aiuta loro ad imparare con grande facilità altre lingue straniere. Non senza ragione i filosofi contemporanei hanno paragonato il latino ad un’equazione algebrica della mente umana. Ma come di ogni altra cosa, il televisore, il computer, l’internet, e altri strumenti dello sviluppo tecnologico, hanno diminuito lo zelo degli studenti per stare sui libri, e si può perfino considerare come una cosa “fuori dal comune” pretendere di acuire la memoria imparando il latino. Per essere reali questa lingua è sempre stata e continuerà ad esserlo una fonte d’ispirazione per tutte le lingue vive, e sarà utile che sia conosciuta ed imparata per il loro bene. Essendo considerata come una specie di affilatoio della memoria, essa aiuterà loro a saper affrontare le varie difficoltà della vita.
Acquisire e arrivare ad utilizzare bene il lessico latino non è facile. Anche se nelle ore delle lezioni si apprendono le prime conoscenze della grammatica latina, il campo morfologico, il nome, l’aggettivo, il pronome, il verbo e l’avverbio, pure questi risultano molto difficili. È necessario fare una corretta analisi grammaticale del testo, quindi stabilire con correttezza le forme del caso, persona, tempo, numero e modo verbale ecc., in modo da realizzare una traduzione che si avvicini il più possibile al vero contenuto. L’assenza di un dizionario nomenclatore latino – albanese, o di un’altra lingua, a disposizione degli studenti, rende difficile lo svolgimento delle ore delle lezioni. Capita quindi che per un’ora intera di lezione parli per la maggior parte il professore, il che porta ad una bassa partecipazione da parte degli studenti. In latino, trattandosi di una lingua che contiene il caso e le desinenze verbali, diventa difficile trovare rapidamente la parola nel dizionario, se non conosciamo bene la sua forma iniziale, perché la forma che appare nel contesto non è detto che sia la stessa che appare nel dizionario. I nomi, i pronomi e gli aggettivi si presentano nel caso nominativo singolare, e il verbo nella prima persona del presente, del passato prossimo, del supino e dell’infinito. Questa è un’altra difficoltà di questa lingua che richiede una buona assimilazione delle desinenze. Per non dire poi che si può trovare il significato della parola nel vocabolario, invece nel contesto può assumere un’altro significato, p.es. itinearum dux, letteralmente significa il comandante dei viaggi, infatti in questo contesto significa cicerone (guida), oppure duce lacedaemonio significa sotto al comando di Lacedaemonio. Queste e altre sono alcune delle difficoltà che si possono scontrare in questa lingua. Per assimilare in modo armonico la grammatica latina ci si lavora su alcuni testi letterari che vengono scelti proprio per servire alla pratica della grammatica data. Lo sviluppo di tali testi semplici mantiene viva l’attenzione, la curiosità, più che sviluppare un’ora solamente di grammatica. Attraverso questi testi, che ci raccontano storie dell’antichità, le sentenze più preferite per impararsi a memoria, l’ora di lezione passa con un ritmo piacevole. Un ruolo importante per l’assimilazione di questa materia, in modo che essa lasci le sue tracce negli studenti, assume la comunicazione reciproca e simmetrica tra gli studenti e i docenti, se no quello che è alter si trasforma in alienusi (straniero). In ogni ora di lezione gli studenti si interrogano oralmente, per rendere attiva la materia e presente ogni studente nel suo apprendimento. Con tutti gli sforzi dei docenti del latino per rendere il più attraente e interessante possibile questa materia, che essa si assimili al meglio dagli studenti, questa resta ugualmente una materia difficile e molto astratta.
Con il passare degli anni, dopo essersi laureati, si notano degli sforzi da parte di coloro che entrano a far parte dei cerchi intellettuali, di fare uso di locuzioni o parole latine, ma la vaga conoscenza di questa lingua li fa colti davanti agli occhi altrui, che non ne conoscono il significato, e li rende ridicoli davanti agli occhi di chi conosce bene questa lingua. La ricca esperienza negli anni dell’insegnamento di questa materia possiamo dire che lo studente mette in atto le sue capacità e le si presenta con esattezza e con chiarezza sempre se riesce a metterli in atto nel modo giusto e come si deve.
Bibliografia AA.VV. (1925). Fjalor latinisht-shqyp, Shkodër. AA.VV. (1938). Sintaksa e gjuhes latine, Shkodër. AA.VV. (1939). Ushtrime te gjuhes latine, Shkodër. AA.VV. Gramatika latine,1-2, Tiranë 1938-39, Atti del Convegno Internazionale "Docere" sulla didattica del latino e del greco. Napoli – Montella, 24.04.-01.05. 1998. Bardhi, . (1635). Fjalor latinish epirotishte. Fishta, F.e Lacaj, H. (1942). Fjaluer latinisht shqip, Tiranë.

ISSN 2039-9340 Mediterranean Journal of Social Sciences Vol. 3 (11) November 2012
256
Lacaj, H. (1967, 2004). Fjalor latinisht- shqip, Tiranë. Lipparini, G. (1942). Gramatika latine, Tiranë. Scheindler, A. (1933). Gramatika latine, Shkodër. Schultz, F. (1922). Gramatika latine, Shkodër. Trombetti, A. (1923). Elementi di glottologia, Bologna Viezzali, L. (1942). Kah latinishtja analize logjike, Shkodër.

ISSN 2039-9340 Mediterranean Journal of Social Sciences Vol. 3 (11) November 2012
257
Developing Infrastructure in Nigeria: Why is the Cost so High?
Patience Tunji – Olayeni
Department of Building Technology,
Covenant University, Ota – Ogun State, Nigeria Corresponding author: [email protected]
Philip Olayemi Lawal
Department of Quantity Surveying,
Caleb University, Imotan - Lagos state, Nigeria
Lekan Murtala Amusan
Department of Building Technology, Covenant University, Ota – Ogun State, Nigeria
Doi:10.5901/mjss.2012.v3n11p257
Abstract The total cost of infrastructure in normal circumstances is expected to be the sum of the cost of materials, labor, site overheads, equipment/plant, head office cost and profit but in many parts of the world particularly in Nigeria, there are other costs to be allowed for. This study seeks to investigate and report the other costs to be allowed for, which are the reasons why the cost of infrastructure is so high. A sample of 70 respondents comprising of construction clients, consultants and contractors were randomly selected and data were gathered using a set of questionnaire to identify the reasons for high cost of infrastructure. Spear man rank order correlation was used to analyze the study hypothesis. The findings revealed cost of materials, incorrect planning, wrong method of estimation, contract management and fluctuation of material prices as the five most important factors affecting cost of infrastructure. It was also found that construction clients, consultants and contractors do not generally agree on the severity rank of the factors affecting cost of infrastructure in Nigeria. While it is recommended that the government should develop adequate frameworks for monitoring and controlling cost of infrastructure, consultants especially cost experts should ensure that they make use of accurate estimating methods and that contractors should employ adequate planning and scheduling techniques because proper planning and scheduling is the key to utilizing project resources and minimizing wastes. Keywords: cost, consultants, contractors, infrastructure, Nigeria, 1. Background of the study The global construction industry is facing a great challenge to cut cost. This is because of the reports of escalating costs of construction of all types all over the world.
Furthermore, the dwindling economic fortunes of nations around the world have geared up participants in the construction sectors (the client in particular) to take up the challenge of ensuring efficient use of their resources to obtain value for money in terms of performance (Mendelson and Greenfield, 1996).
In Nigeria, the problem of high construction cost is becoming obvious (Okpala and Aniekwu, 1988; Elinwa and Buba, 1999, Omoregie and Radford, 2006). Consequently, substantial increases are being observed in projects. This substantial increases has negative implications for the major stake holders in the industry including loss of client confidence in consultants, added investment risks, inability to deliver value to clients, and disinvestment in the construction industry; thereby undermining the industry’s viability and sustainability (Mbachu and Nkado, 2004).
The total cost of infrastructure in normal circumstances is expected to be the sum of the following cost: materials, labor, site overheads, equipment/plant, head office cost and profit but in many parts of the world particularly in Nigeria, there are other costs to be allowed for. This study seeks to investigate and report the other costs to be allowed for, which are the basic reasons why cost of infrastructure is relatively high in Nigeria. The study aims at answering the following research questions:

ISSN 2039-9340 Mediterranean Journal of Social Sciences Vol. 3 (11) November 2012
258
• What are the main factors affecting cost of infrastructure in Nigeria? • What is the severity rank of the factors affecting cost of infrastructure amongst clients, consultants and
contractors? It also seeks to analyze the hypotheses: H1: Contractors and Clients do not generally agree on the severity rank of the factors affecting cost of infrastructure in Nigeria. H2: Clients and Consultants do not generally agree on the severity rank of the factors affecting cost of infrastructure in Nigeria. H3: Consultants and Contractors do not generally agree on the severity rank of the factors affecting cost of infrastructure in Nigeria. 2. Review of related works 2.1. Construction cost factors Although cost is a major determinant of project success, most infrastructure projects exceed their initial cost of construction. Several factors have been reported in the literature as affecting cost of infrastructure. Frimpong, Oluwole and Crawford (2003) reported that payment difficulties, poor contractor management, material procurement, poor technical performances and escalation of material prices were the main factors causing delays and cost overruns in construction of ground water projects in Ghana.
Memon, Rahman and Abdul - Azis (2011) revealed poor design, unrealistic contract duration, lack of experience, inadequate planning and scheduling, poor site management and supervision and mistakes during construction as the most significant factors leading to construction cost overruns.
In Nepal, monopoly control of the market by some suppliers, work stoppages in factories, lack of industrialized materials, fluctuating demands forcing suppliers to wait for accumulation of orders and difficulty in importing raw materials from other countries are the main factors affecting cost of construction (Manavazhi and Adhikari, 2002).
In a study of the Nigerian construction industry, Omoregie and Radfort (2006) sampled the opinions of Contractors, Consultants and Clients and they discovered 15 factors responsible for project delays and construction cost escalation. Price fluctuation was revealed as the most severe cause of project cost escalation. Ogunlana et al (1996) reported that the mode of financing and payment of completed works is also responsible for cost escalation in Nigeria. Moreover, government deregulation policies aimed at liberalizing the economy since 1986 contributes significantly to additional cost of construction (Aibinu and Jagboro, 2002). 40 factors affecting cost of infrastructure were identified from the literature. See table 1 Table 1: Construction cost factors Construction cost factors References
1.Absence of construction cost data Elinwa and Silas (1993) AL– Khaldi (1990)
2.Additional work Mansfield,Ugwu and Doran (1994) Elinwa and Silas (1993)
3.Bureaucy in tendering method Elinwa and Silas (1993) 4. Contractor’s cartel Omole (1986) 5.Contract management Mansfield ,Ugwu and Doran(1994)
Ogunlana, Krit and Vithool (1996 ) 6.Contractual procedures Elinwa and Silas (1993)
AL– Khaldi (1990) 7. Cost of materials Elinwa and Silas (1993) 8.Currency exchange AL– Khaldi (1990) 9.Disputes on site Aibinu and Jagboro (2002) 10.Duration of contract period Aibinu and Jagboro (2002) 11.Economic stability Elinwa and Silas (1993) 12.Fluctuation of prices of materials Omoreigie and Radford (2005)

ISSN 2039-9340 Mediterranean Journal of Social Sciences Vol. 3 (11) November 2012
259
13. Fraudulent practices and kickbacks Hussain (1999), TELL (2002) 14.Frequent design changes Asamoah (2002) 15. Government policies Omole (1986) 16. High cost of labor Elinwa and Silas (1993) 17. High cost of machinery Elinwa and Silas (1993) 18. High cost of machinery maintenance AL– Khaldi (1990) 19.High cost of transportation Elinwa and Silas (1993) 20. High interest rates charged by banks AL– Khaldi (1990) 21.Inadequate labor availability Elinwa and Silas (1993)
AL– Khaldi (1990) 22.Inadequate production of raw materials Eyo – Ita – Eyo (2001) 23.Incorrect Planning Elinwa and Silas (1993) 24. Insurance cost AL– Khaldi (1990) 25.Labour nationality AL– Khaldi (1990) 26.Lack of coordination between designers and contractors AL– Khaldi (1990) 27.Lack of productivity standard AL– Khaldi (1990) 28.Level of competitors AL– Khaldi (1990) 29.Long period between design and tendering time Elinwa and Silas (1993) 30. Mode of financing bond and payments Frimpong Oluwoye and Crawford (2003) 31.Number of competitors AL– Khaldi (1990) 32.Number of construction going on at the same time Elinwa and Silas (1993) 33.Previous experience of contractor AL– Khaldi (1990) 34. Political interferences Omole (1986) 35.Poor financial control on site Ogunlana, Krit and Vithool (1996) 36. Relationship between management and labour Elinwa and Silas (1993) 37. Social and cultural impacts AL– Khaldi (1990) 38. Supplier and cultural impacts Manavazhi and Adhikari (2002) 39. Supplier manipulation Elinwa and Silas 1993) 40. Wrong method of estimation Mansfield ,Ugwu and Doran (1994) 3. Methodology The study utilized a descriptive survey design. The sample was made up of 70 respondents comprising construction clients, consultants and contractors. Respondents were randomly selected and data were gathered using a set of questionnaire to determine the main factors affecting cost of infrastructure in Nigeria. The measurement of items in the survey questionnaire was based on a 5 point Likert scale with 1 representing “Not severe effect” and 5 representing “Extremely severe effect”. The collected data were analyzed using the IBM SPSS statistics. Table 2. Response Rate Clients Consultants Contractors Total No. Distributed 16 22 32 70 No. Received 9 15 28 52 Percentage 56.25% 68.18% 87.5% 74.29% N = 70 3.1 Data Analysis The hypotheses were tested using Spear man rank order correlation with a confidence level of 95% (0.05). 3.2 Results Table 3 shows that cost of materials (3.90), incorrect planning (3.73), wrong method of estimation (3.23), contract management (3.00) and fluctuation of prices of materials (2.75) are the five most important factors affecting cost of construction.

ISSN 2039-9340 Mediterranean Journal of Social Sciences Vol. 3 (11) November 2012
260
Table 3 Main factors affecting cost of infrastructure in Nigeria
S/N FACTOR N MEAN RANK Cost of materials 52 3.90 1 Incorrect planning 52 3.73 2 Wrong method of estimation 52 3.23 3 Contract management 52 3.00 4 Fluctuation of prices of materials 52 2.75 5 Previous experience of contractor 52 2.75 5 Absence of construction cost data 52 2.73 7 Additional cost 52 2.60 8 Project financing 52 2.56 9 High cost of transportation 52 2.54 10 Poor financial control on site 52 2.52 11 Economic stability 52 2.50 12 Fraudulent practices and kickbacks 52 2.44 13 Inadequate labor availability 52 2.44 13 High cost of machinery 52 2.42 15 Inadequate production of raw materials 52 2.40 16 Contractual procedures 52 2.40 16 High cost of machinery maintenance 52 2.40 18 Bureaucracy in tendering method 52 2.38 19 Duration of contract period 52 2.37 20 Supplier manipulation 52 2.37 20 Disputes on site 52 2.35 22 High cost of labor 52 2.33 23 Government policies 52 2.27 24 Relationship between management and labor 52 2.19 25 Currency exchange 52 2.19 25 Frequent design changes 52 2.17 27 High interest rate charged by banks 52 2.17 27 Social and cultural impacts 52 2.13 29 Lack of coordination between designers and contractors 52 2.13 29 Long period between design and tendering time 52 2.08 31 Contractor’s cartel 52 2.04 32 Model of financing bond and payments political interferences 52 1.92 33 Number of competitors 52 1.87 34 Lack of productivity standard 52 1.86 36 Number of construction going on at then same time 52 1.79 37 Level of competitors 52 1.71 38 Insurance cost 52 1.71 38 Labor nationality 52 1.50 40
Valid N (list wise) Table 4 reveals 15 most important factors affecting cost of infrastructure as perceived by clients, consultants and contractors. Clients, consultants and contractors rank cost of materials (3.67, 4.00, and 4.00 respectively) as the most important factor affecting cost of construction. Clients and contractors ranked incorrect planning (3.44, 3.89 respectively) as the second most important factor affecting construction cost. Consultants ranked wrong method of estimation (3.73) as the second most important factor. There was also a difference in the third most important factor as perceived by the three parties. It was poor financial control on site (3.33), incorrect planning (3.47) and contract management (3.54). When the overall averages of the groups were taken, cost of materials came first followed by incorrect planning and wrong method of estimation.

ISSN 2039-9340 Mediterranean Journal of Social Sciences Vol. 3 (11) November 2012
261
Table 4. Mean score and rank for the 15 most important factors affecting cost of infrastructure as reported by the different groups.
The hypotheses was set up to test if there is any agreement on the severity rank of the factors affecting cost of infrastructure in Nigeria as opined by the different groups. Table 5 shows the result of the computation of Spearman’s rank correlation coefficient, the t- values, and null hypotheses for the severity rank of the factors affecting cost of infrastructure in Nigeria by the different groups in the construction industry. Table 5. Test of agreement on the severity rank of the factors affecting cost of infrastructure
S/N Stakeholder Rs t – cal t - tab Accept H0 1 Contractors/Clients 0.46 2.38 1.38 Accept 2 Clients/Consultants 0.36 1.73 1.38 Accept 3 Consultants/Contractors 0.59 3.29 1.38 Accept
Rs - Spearman rank order correlation, T – cal t – calculated, T – tab t – tabulated, Ho - null hypotheses. 4. Discussion of Findings The most important factor affecting cost of infrastructure as opined by clients, consultants and contractors is cost of materials (see table 3). This is in consonance with the findings of Abdulaziz and Al – Juwairah (2002) where cost of materials was found to be the most significant factor contributing to construction cost in Saudi Arabia. Cost of construction material is high in Nigeria. This may be because Nigeria still has challenges especially with power. As a result, the building material industry is grounded and the few building material companies available are not running at full capacity. This results in shortages and affects material planning and coordination (Ogunlana, Krit and Vithool, 1996) which ultimately affects construction cost.
The second most important factor affecting cost of infrastructure in Nigeria is incorrect planning. This result is similar to those of Menon, Rahman and Abdul-Aziz (2011) who discovered that inadequate planning and scheduling contributes significantly to construction cost overruns in Malaysia.
Wrong method of estimation and poor contract management were found to be the third and fourth most important factors affecting cost of infrastructure in Nigeria. Mansfield, Ugwu and Doran (1994) reported that wrong method of estimation and poor contract management were also responsible for cost overruns in Nigerian construction projects.
The fifth most important factor affecting cost of infrastructure as discovered in this study was fluctuation of prices of material. This result bears some semblance with the findings of Omoregie and Radford (2006) who revealed price fluctuation as a severe cause of project cost escalation in Nigeria. (See table 2 for results)
Table 5 reveals the test results for the agreement on the severity rank of the factors affecting cost of infrastructure. Since T – cal 2.38, 1.73, 3.29 is greater than t – tab of 1.38 at p < 0.05, there is sufficient information to accept hypothesis:
S/N Factors affecting construction cost Average Client Consultant Contractor Mean Rank Mean Rank Mean Rank Mean Rank 1 Cost of materials 3.90 1 3.67 1 4.00 1 4.00 1 2 Incorrect planning 3.73 2 3.44 2 3.47 3 3.89 2 3 Wrong method of estimation 3.23 3 2.56 6 3.73 2 3.25 4 4 Contract management 3.00 4 2.56 6 3.13 4 3.54 3 5 Fluctuation of prices of materials 2.75 5 2.78 5 3.07 6 2.93 6 6 Previous experience of contractor 2.75 5 3.22 4 2.60 9 3.07 5 7 Absence of construction cost data 2.73 7 2.33 8 3.13 4 2.61 15 8 Additional cost 2.60 8 2.33 8 2.73 7 2.86 8 9 Frequent design change 2.56 9 2.11 13 2.60 9 2.86 8 10 Inadequate raw materials 2.54 10 2.33 8 2.27 14 2.68 12 11 Poor financial control on site 2.52 11 3.33 3 2.53 11 2.79 11 12 Economic stability 2.50 12 2.33 8 2.33 13 2.82 10 13 Fraudulent practices and kick backs 2.44 13 2.11 13 2.40 12 2.89 7 14 Supplier manipulation 2.44 13 2.11 13 2.27 14 2.64 14 15 Currency exchange 2.42 15 2.22 12 2.68 8 2.68 12

ISSN 2039-9340 Mediterranean Journal of Social Sciences Vol. 3 (11) November 2012
262
H1: Contractors and Clients do not generally agree on the severity rank of the factors affecting cost of infrastructure in Nigeria H2: Clients and Consultants do not generally agree on the severity rank of the factors affecting cost of infrastructure in Nigeria H3: Consultants and Contractors do not generally agree on the severity rank of the factors affecting cost of infrastructure in Nigeria Although the three parties do not generally agree in the ranking order of factors affecting cost of infrastructure, there is a higher agreement between contractors and consultants than between the others. This result is at variance with the findings of Abdulaziz and Al – Juwairah (2002) who found that there is a greater agreement between clients and contractors on the factors affecting cost of infrastructure. 5. Conclusion Since the main factor affecting cost of infrastructure in Nigeria is cost of materials. It is suggested that the government should develop adequate frameworks for improving power so that the construction materials industry can thrive and the cost of materials can be scaled down. The government should influence the fiscal policies so that prices of materials can be relatively stable.
Moreover, contractors should use adequate planning and scheduling techniques because as Fisk (1999) noted proper scheduling is the key to utilizing project resources, if not, the project cost will increase. In addition, Quantity Surveyors should ensure that proper estimation methods are used for preparing estimates and updated price information is used to avoid mistakes. Lastly, contractors should improve on contract management practices because it has been observed that most contractors in Sub – Saharan Africa lack management skills and have less regard for contract plans, cost control and resource allocation (Frimpong, Oluwole and Crawford, 2003).
References Aibinu, A.A. and Jagboro, G.O. (2002) The Effects of Construction Delays on Projects delivery in the Nigerian Construction Industry.
International Journal of Project Management 20, 593 – 599 Al-Khadi, Z.S. (1990). Factors affecting the accuracy of construction cost estimating in Saudi Arabia. Masters thesis, King Fahd
University of Petroleum and Minerals, 1990. Bubshait, A.A and Al-Juwairah, Y.A. (2002) Factors contributing to construction costs in Saudi-Arabia. Cost Enginering , 44 (5), 30-34 Elinwa, U., and Buba, S., (1993): Construction Cost Factors in Nigeria. Journal of Construction Engineering and Management. 119, (4)
698-714. Fisk, E.R. (1997) Construction Project Administration, 5th Edition. Prentice Hall, New Jersey Frimpong, Y., Oluwoye, J. and Crawford, L. (2003) Causes of Delays and Cost Overruns in Construction of Ground water Projects in
Developing Countries; Ghana as a case study. International journal of project Management 21, 321 – 326 Manavazhi, M.R. and Adhikari D.K. (2002) Material and equipment procurement delays in Highway projects in Nepal. International
Journal of Project Management 20, 627 – 632. Mansfield, N.R. , Ugwu, O.O. and Doran, T. (1994) Causes of delay and cost overruns in Nigeria construction Projects. International
Journal of Project management 12 (4) 254 – 260. Mbachu J.I.C. and R.N. Nkado. (2004) Reducing Building Construction Costs; the Views of Consultants and Contractors. Proceedings of
the international construction research conference of the royal institute of chartered surveyors, held at Headingley cricket club, Leeds. 7th – 8th September.
Memon, A.H., Rahman, I.A and Abdul – Aziz A.A. (2011) Preliminary study on causative factors leading to construction cost overruns. International Journal of sustainable Construction Engineering and Technology, 2 (1), 57-71.
Mendelson, S. and Greenfield, H. (1996): Taking value engineering into the twenty- first century. International Journal of Cost Estimation, Cost/Schedule Control and Project Management, 37 (8)
Ogunlana, S., Krit, P. and Vithool, J. (1996) Construction delays in a fast growing economy; comparing Thailand with other economies. International Journal of Project Management 14 (1) 37 – 45
Okpala and Aniekwu, A.N. (1988). Causes of high costs of construction in Nigeria. Journal of construction engineering and management, ASCE, vol 114 (2), 233-234.
Omoregie A. and Radford D. (2006) Infrastructure Delay and Cost Escalations: Causes and Effects in Nigeria. Proceedings of the sixth international postgraduate research conference, Delft University of Technology and TNO, the Netherlands. 3rd-7th April
Omole A.O. (1986): Causes of the High Cost of Building and Civil Engineering Construction in Nigeria. The Nigerian Quantity Surveyor. 1(2), 6

ISSN 2039-9340 Mediterranean Journal of Social Sciences Vol. 3 (11) November 2012
263
Causal Relationship Model of Environmental Education
and Psychological Trait
Dr. Nongnapas Thiengkamol
Department of Environmental Education Faculty of Environment and Resource Studies
Mahasarakham University, Mahasarakham 44150, Thailand
Doi:10.5901/mjss.2012.v3n11p263 Abstract: Environmental education and psychological trait play important roles for global citizen to take responsible for their behaviors change through inspiration of public consciousness in daily life activity. This might be an successful environmental behavioral change to decrease the greenhouse gases by raising awareness, adjusting attitude and belief, increasing skill and participation with practice in daily living to accomplish sustainable development.The populations will be undergraduate students of academic year 2011 of Mahasarakham University. The Multi-stage random sampling was used to collect the sample for 450 undergraduate students. The questionnaire was employed as instrument for data collecting. LISREL was used for model verification. Results illustrated that considering on structural model confirmatory factors of EE and TRAIT were able to explain the variation of endogenous factors of Inspiration of Public Consciousness (MIND) to caused Environmental Behaviors for Global Warming Alleviation (BEH) with 89.00 percents. Therefore, the equation 1, can be written as following: BEH = 0.32 MIND + 0.29 TRAIT + 0.75 EE ……………………..(1) (R2 = 0.89) Moreover, considering on structural model confirmatory factors of EE and TRAIT were able to explain the variation of endogenous factors of Inspiration of Public Consciousness (MIND) with 97.0 percents. Therefore, the equation 2, can be written as following: MIND = 0.67 TRAIT + 0.58 EE …………………………………..(2) (R2 = 0.97) Key Words: Causal Relationship Model / Environmental Education / Psychological Trait / Global Warming Alleviation 1. Introduction Over the world, global warming is accepted as critically environmental matters since the increasing in the average temperature of Earth’s atmosphere and oceans is still rapidly persistent. This event is recognized by the international science academies from all the major industrialized countries. There was no objection by any global scientific organizations at national or international reputations. Principally, the majority of scientists specify that the warming in current decades has been caused first and primary by human being activities that have increased the quantity of greenhouse gases in the atmosphere such as deforestation, fossil fuel combustion and destroyed biodiversity in forest and ocean by over harvesting (United States National Academy of Sciences., 2008, National Research Council of USA., 2010, & Thiengkamol, 2011e).
Even though, there has been international mitigation effort for greenhouse gases such as the Kyoto Protocol. It searches to stabilize greenhouse gas concentration to prevent a “dangerous anthropogenic interference” (UNFCCC, 2005). However, at international level as of May 2010, 192 states members of the UNFCCC had ratified the protocol. The only members of the UNFCCC that were asked to sign the treaty but have not yet ratified it are the USA and Afghanistan (UNFCCC, 2011). This might indicated that if there was no real collaboration from every country in the world, particularly, the power country likes as USA does not act as good role model for other countries to ratify the protocol. It might be failure for greenhouse gases reduction to achieve global warming alleviation.
Presently, environmental information on climate change with global warming has become essential matter for general people who have been directly impacted by different disasters such as earth quake, flood, and drought. Additionally these have caused changing natural system, ecological system, biodiversity loss, new vector of disease born, and species migration, as a final point, it caused directly to human life quality. However, the environmental problem solving will be not successful if individual does not realize to take responsibility to participate seriously. From different studies of Thiengkamol and her colleagues, it was found that most the people have not enough knowledge and

ISSN 2039-9340 Mediterranean Journal of Social Sciences Vol. 3 (11) November 2012
264
understanding, lack of consciousness, awareness, and attitude to practice proper behavior including realizing that they take very important parts to take responsibility for conservation of natural resources and environment, especially with public consciousness or public mind (Thiengkamol, 2011a, Thiengkamol, 2011b, Thiengkamol, 2011c, Thiengkamol, 2011g, Thiengkamol, 2011h, Thiengkamol, 2011i, Thiengkamol, 2012a, Thiengkamol, 2012b, Thiengkamol, 2012c, Jumrearnsan, and Thiengkamol, 2012, Saenpakdee, and Thiengkamol, 2012, Sukserm, et al., 2012, Sukwat, et al., 2012, Wattanasaroch, et al., and Ruboon, et al., 2012).
The Tenth National Economic and Social Development Plan of Thailand (B.E. 2550-2554), it also included the participation of every sectors in Thai society and aimed to set Thai citizen as center of development in order to meet sustainable economic and society based on the moral and ethics for living and natural resources and environment conservation for developing the better quality of life of Thai people in numerous aspects. This was in the line with the sustainable development principle which is in accordance to concept of conference of environment and development of United Nation since 1992 (Office of National Economic and Social Development Plan, 2010, WCED, 1987, Volker, 2007, Watkinson, 2009, &Thiengkamol, 2011e).
Considering on the intention of psychologists tried to understand on human behavior by developing a variety of concepts, theories and models with focal point on explanation how individual perceived and evaluated the stimulants before making decision to convey his behavior. On the other hand, study on human behavior, it can’t be neglected the psychological trait and trait theorists are principally interested in the quantity of traits, which can be defined as habitual patterns of behavior, thought, and emotion together with psychological health and physical health which are inherited trait from parents. The various debates over that whether nature (genetic) or nurture (environment), or both contribute are significantly to our complete expressions (Kassin, 2003, & Pearson, 2006).
In accordance with this perspective, traits are relatively steady over time, differ across individuals, and these influence behavioral expressions. Conversely, in studying of human geography, it revealed that both physical and biological features are the stimulants to make people convey their behaviors in diverse approaches of place, surrounding people, and experience. These are unable to ignore since the human and environment are deeply and tightly associated to each other, while environment also can play a role as stimulant to cause human to carry out different activities. Hence, the human behavior was expressed by psychological trait and it also related to make a change of environmental behavior (Suwan, 2006). The ability of understanding about behavioral occurrence or expression of human, especially, psychological traits that might pilot to predict and control the undesirable behavior or promote and build the desirable behaviors for environmental conservation for global warming alleviation (Thiengkamol, 2012c).
Concerning to another essential factor, the inspiration of public consciousness or public mind also should not be neglected. Public mind or public consciousness was defined by different perceptions or considerations of people, however in Thai society gave various meaning such as National Research Council of Thailand giving definition of public mind that take notice and participate in the public issues with providing advantage to country with consciousness and holding the system of morality and ethics together with indignity for good action and emphasizing on being neat, economizing, and balance between human and nature.
Additionally, Thiengkamol mentioned that public consciousness or public mind based on inspiration is occurred from insight of people and inspiration is different from motivation because inspiration needs no rewards. Inspiration of public consciousness or public mind, especially, for natural resources and environment conservation, one will not receive any reward, admiration or complement for their action to protect and conserve natural resources and environment. Inspiration might occur from appreciation in a person as role model or idle, events, situations, environment, media perceived such movies, book, magazine, and internet (Thiengkamol, 2009b, Thiengkamol, 2009c, Thiengkamol, 2011a, Thiengkamol, 2011e, Thiengkamol, 2011i, and Thiengkamol, 2012c).
It was obviously seen that there was few researches done on environmental behavior for global warming alleviation affecting by environmental education based on psychological trait covering physical health, psychological health, self-confidence, mercy and kindness, achievement motivation, and goal of life. Currently, it is very rarely and there is no research is holistically integrative done about environmental education when it compared with other aspects of relating factors affecting to environmental behaviors.
Therefore, this research was designed to study by covering all factors relating as mentioned above, it would be able to develop a model of environmental behaviors that are affected by environmental education and psychological traits based on inspiration of public consciousness.
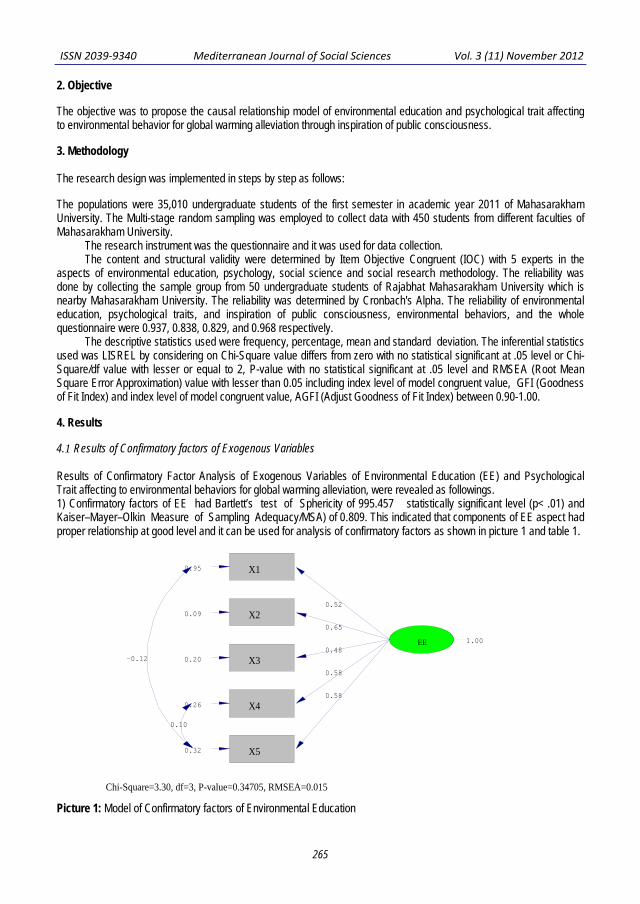
ISSN 2039-9340 Mediterranean Journal of Social Sciences Vol. 3 (11) November 2012
265
2. Objective The objective was to propose the causal relationship model of environmental education and psychological trait affecting to environmental behavior for global warming alleviation through inspiration of public consciousness. 3. Methodology The research design was implemented in steps by step as follows: The populations were 35,010 undergraduate students of the first semester in academic year 2011 of Mahasarakham University. The Multi-stage random sampling was employed to collect data with 450 students from different faculties of Mahasarakham University.
The research instrument was the questionnaire and it was used for data collection. The content and structural validity were determined by Item Objective Congruent (IOC) with 5 experts in the
aspects of environmental education, psychology, social science and social research methodology. The reliability was done by collecting the sample group from 50 undergraduate students of Rajabhat Mahasarakham University which is nearby Mahasarakham University. The reliability was determined by Cronbach's Alpha. The reliability of environmental education, psychological traits, and inspiration of public consciousness, environmental behaviors, and the whole questionnaire were 0.937, 0.838, 0.829, and 0.968 respectively.
The descriptive statistics used were frequency, percentage, mean and standard deviation. The inferential statistics used was LISREL by considering on Chi-Square value differs from zero with no statistical significant at .05 level or Chi-Square/df value with lesser or equal to 2, P-value with no statistical significant at .05 level and RMSEA (Root Mean Square Error Approximation) value with lesser than 0.05 including index level of model congruent value, GFI (Goodness of Fit Index) and index level of model congruent value, AGFI (Adjust Goodness of Fit Index) between 0.90-1.00. 4. Results 4.1 Results of Confirmatory factors of Exogenous Variables Results of Confirmatory Factor Analysis of Exogenous Variables of Environmental Education (EE) and Psychological Trait affecting to environmental behaviors for global warming alleviation, were revealed as followings. 1) Confirmatory factors of EE had Bartlett’s test of Sphericity of 995.457 statistically significant level (p< .01) and Kaiser–Mayer–Olkin Measure of Sampling Adequacy/MSA) of 0.809. This indicated that components of EE aspect had proper relationship at good level and it can be used for analysis of confirmatory factors as shown in picture 1 and table 1.
Picture 1: Model of Confirmatory factors of Environmental Education
X1 0.95
X2 0.09
X3 0.20
X4 0.26
X5 0.32
1.00
Chi-Square=3.30, df=3, P-value=0.34705, RMSEA=0.015
0.52
0.65
0.48
0.58
0.58
-0.12
0.10
EE
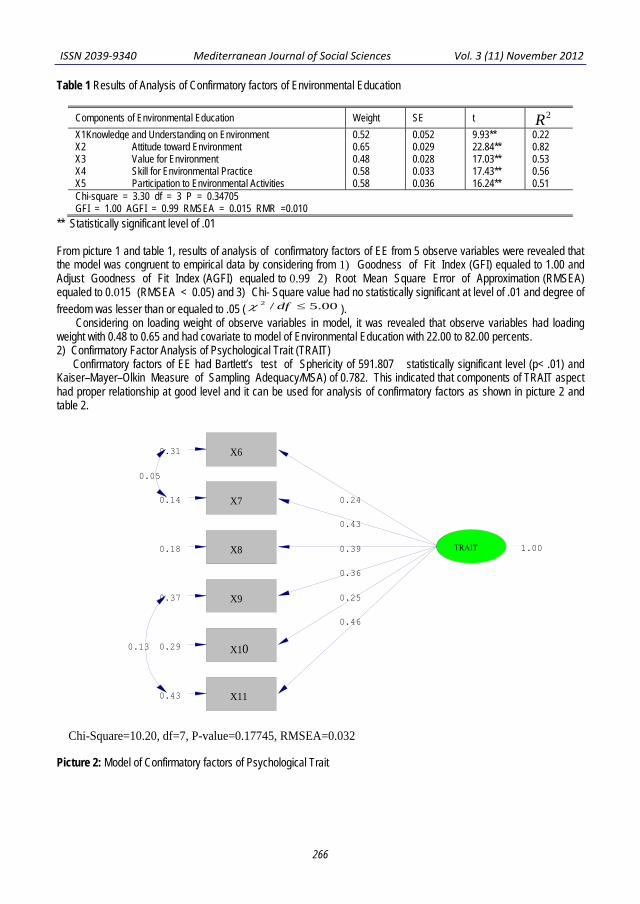
ISSN 2039-9340 Mediterranean Journal of Social Sciences Vol. 3 (11) November 2012
266
Table 1 Results of Analysis of Confirmatory factors of Environmental Education
Components of Environmental Education Weight SE t 2R X1Knowledge and Understanding on Environment 0.52 0.052 9.93** 0.22 X2 Attitude toward Environment 0.65 0.029 22.84** 0.82 X3 Value for Environment 0.48 0.028 17.03** 0.53 X4 Skill for Environmental Practice 0.58 0.033 17.43** 0.56 X5 Participation to Environmental Activities 0.58 0.036 16.24** 0.51 Chi-square = 3.30 df = 3 P = 0.34705 GFI = 1.00 AGFI = 0.99 RMSEA = 0.015 RMR =0.010
** Statistically significant level of .01 From picture 1 and table 1, results of analysis of confirmatory factors of EE from 5 observe variables were revealed that the model was congruent to empirical data by considering from 1) Goodness of Fit Index (GFI) equaled to 1.00 and Adjust Goodness of Fit Index (AGFI) equaled to 0.99 2) Root Mean Square Error of Approximation (RMSEA) equaled to 0.015 (RMSEA < 0.05) and 3) Chi- Square value had no statistically significant at level of .01 and degree of freedom was lesser than or equaled to .05 ( 00.5/2 ≤dfχ ). Considering on loading weight of observe variables in model, it was revealed that observe variables had loading weight with 0.48 to 0.65 and had covariate to model of Environmental Education with 22.00 to 82.00 percents. 2) Confirmatory Factor Analysis of Psychological Trait (TRAIT) Confirmatory factors of EE had Bartlett’s test of Sphericity of 591.807 statistically significant level (p< .01) and Kaiser–Mayer–Olkin Measure of Sampling Adequacy/MSA) of 0.782. This indicated that components of TRAIT aspect had proper relationship at good level and it can be used for analysis of confirmatory factors as shown in picture 2 and table 2. Picture 2: Model of Confirmatory factors of Psychological Trait
X6 0.31
X7 0.14
X8 0.18
X9 0.37
X10 0.29
X11 0.43
1.00
Chi-Square=10.20, df=7, P-value=0.17745, RMSEA=0.032
0.24
0.43
0.39
0.36
0.25
0.46
0.05
0.13
TRAIT

ISSN 2039-9340 Mediterranean Journal of Social Sciences Vol. 3 (11) November 2012
267
Table 2 Results of Analysis of Confirmatory factors of Psychological Trait
Confirmatory factors of Psychological Trait Weight SE t 2R X6 Physical Health 0.24 0.035 6.94** 0.16 X7 Psychological Health 0.43 0.028 15.14** 0.57 X8 Self-Confidence 0.39 0.029 13.71** 0.46 X9 Mercy and Kindness 0.36 0.037 9.71** 0.25 X10 Achievement Motivation 0.25 0.031 8.02** 0.17 X11 Goal of Life 0.46 0.040 11.45** 0.34 Chi-square = 10.20 df = 7 P = .17745 GFI = 0.99 AGFI = 0.98 RMSEA = 0.032 RMR = .0093
** Statistically significant level of .01 From picture 2 and table 2, results of analysis of confirmatory factors of TRAIT from 6 observe variables were revealed that the model was congruent to empirical data by considering from 1) Goodness of Fit Index (GFI) equaled to 0.99 and Adjust Goodness of Fit Index (AGFI) equaled to 0.98 2) Root Mean Square Error of Approximation (RMSEA) equaled to 0.032 (RMSEA < 0.05) and 3) Chi- Square value had no statistically significant at level of .01 and degree of freedom was lesser than or equaled to .05 ( 00.5/2 ≤dfχ ). Considering on loading weight of observe variables in model, it was revealed that observe variables had loading weight with 0.24 to 0.46 and had covariate to model of Psychological Trait with 16.00 to 57.00 percents. Results of Confirmatory Factor Analysis of Endogenous Variables Results of Confirmatory Factor Analysis of Endogenous Variables of Inspiration of Public Consciousness influencing to environmental behaviors for global warming alleviation, was revealed as followings. Confirmatory Factor Analysis of Endogenous Variables of Inspiration of Public Consciousness (MIND) Confirmatory Factor of Inspiration of Public Consciousness (MIND) had Bartlett’s test of Sphericity of 579.893 statistically significant level (p< .01) and Kaiser–Mayer–Olkin Measure of Sampling Adequacy/MSA) of 0.656. This indicated that components of EE aspect had proper relationship at good level and it can be used for analysis of confirmatory factors as shown in picture 3 and table 3.
Picture 3: Model of Confirmatory factor of Inspiration of Public Consciousness
Y7 0.36
Y8 0.53
Y9 -0.23
Y10 0.35
1.00
Chi-Square=0.00, df=0, P-value=1.00000, RMSEA=0.000
0.62
0.26
0.81
0.31
0.27
-0.20 MIND

ISSN 2039-9340 Mediterranean Journal of Social Sciences Vol. 3 (11) November 2012
268
Table 3 Results of Analysis of Confirmatory factors of Inspiration of Public Consciousness
Confirmatory factors of Inspiration of Public Consciousness Weight SE t 2R Y7 Person as Role Model 0.62 0.074 8.32** 0.51
Y8 Impressive Event 0.26 0.047 5.54** 0.11
Y9 Impressive Environment 0.81 0.097 8.34** 1.00
Y10 Public Mind Performance 0.31 0.047 6.54** 0.21
Chi-square = 0.00 df = 0 P = 1.0000 GFI = 1.00 AGFI = 1.00 RMSEA = 0.000 RMR = .000
** Statistically significant level of .01 From picture 3 and table 3, results of analysis of confirmatory factors of MIND from 4 observe variables was revealed that the model was congruent to empirical data by considering from 1) Goodness of Fit Index (GFI) equaled to 1.00 and Adjust Goodness of Fit Index (AGFI) equaled to 1.00 2) Root Mean Square Error of Approximation (RMSEA) equaled to 0.000 (RMSEA < 0.05) and 3) Chi- Square value had no statistically significant at level of .01 and degree of freedom was lesser than or equaled to .05 and 00.5/2 ≤dfχ . Considering on loading weight of observe variables in model, it was revealed that observe variables had loading weight with 0.26 to 0.81 and had covariate to model of Inspiration of Public Consciousness with 11.00 to 100.00 percents. Confirmatory Factor Analysis of Endogenous Variables of Environmental Behaviors for Global Warming Alleviation (BEH) Confirmatory Factor of Environmental Behaviors for Global Warming Alleviation (BEH) had Bartlett’s test of Sphericity of 834.218 statistically significant level (p< .01) and Kaiser–Mayer–Olkin Measure of Sampling Adequacy/MSA) of 0.832. This indicated that components of BEH aspect had proper relationship at good level and it can be used for analysis of confirmatory factors as shown in picture 4 and table 4. Picture 4: Model of Confirmatory factors of Environmental Behaviors for Global Warming Alleviation (BEH)
Y1 0.16
Y2 0.32
Y3 0.29
Y4 0.52
Y5 0.49
Y6 0.20
1.00
Chi-Square=11.08, df=7, P-value=0.13517, RMSEA=0.036
0.59
0.40
0.21
0.34
0.76
0.60
0.04
0.07
BEH

ISSN 2039-9340 Mediterranean Journal of Social Sciences Vol. 3 (11) November 2012
269
Table 4 Results of Analysis of Confirmatory factors of Environmental Behaviors for Global Warming Alleviation
Confirmatory factors of Environmental Behaviors for Global Warming Alleviation Weight SE t 2R Y1 Consumption Behavior 0.59 0.029 19.95** 0.69
Y2 Energy Conservation 0.40 0.032 12.67** 0.34
Y3 Waste Management 0.21 0.028 7.41** 0.13
Y4 Traveling Behavior 0.34 0.039 8.81** 0.18
Y5 Recycling Behavior 0.76 0.044 17.01** 0.54
Y6 Knowledge Transferring and Supporting for Environmental Conservation 0.60 0.031 18.96** 0.64
Chi-square = 11.08 df = 7 P = 0.13517 GFI = 0.99 AGFI = 0.98 RMSEA = 0.000 RMR = 0.036
** Statistically significant level of .01 From picture 4 and table 4, results of analysis of confirmatory factors of BEH from 6 observe variables were revealed that the model was congruent to empirical data by considering from 1) Goodness of Fit Index (GFI) equaled to 0.99 and Adjust Goodness of Fit Index (AGFI) equaled to 0.98 2) Root Mean Square Error of Approximation (RMSEA) equaled to 0.000 (RMSEA < 0.05) and 3) Chi- Square value had no statistically significant at level of .01 and degree of freedom was lesser than or equaled to .05. 00.5/2 ≤dfχ . Considering on loading weight of observe variables in model, it was revealed that observe variables had loading weight with 0.21 to 0.76 and had covariate to model of Environmental Behaviors for Global Warming Alleviation with 13.00 to 69.00 percents. 4.3 Results of Effect among Variables in Model in Terms of Direct Effect 1) Confirmatory factors of Environmental Education (EE) had direct effect to Inspiration of Public Consciousness (MIND) and Environmental Behaviors for Global Warming Alleviation (BEH) with statistically significant at level of .01 with effect of 0.58 and 0.75. Moreover, confirmatory factors in aspect of Environmental Education (EE) had indirect effect to Environmental Behaviors for Global Warming Alleviation (BEH) with statistically significant at level of .01 with effect of 0.19. 2) Confirmatory factors of Psychological Trait (TRAIT) had direct effect to Inspiration of Public Consciousness (MIND) and Environmental Behaviors for Global Warming Alleviation (BEH) with statistically significant at level of .01 with effect of 0.67 and 0.29. Moreover, confirmatory factors in aspect of Psychological Trait (TRAIT) had indirect effect to Environmental Behaviors for Global Warming Alleviation (BEH) with statistically significant at level of .01 with effect of 0.21. Confirmatory factors of Inspiration of Public Consciousness (MIND) had direct effect to Environmental Behaviors for Global Warming Alleviation (BEH) with statistically significant at level of .01 with effect of 0.32. Considering on structural model confirmatory factors of EE and TRAIT were able to explain the variation of endogenous factors of Inspiration of Public Consciousness (MIND) to caused Environmental Behaviors for Global Warming Alleviation (BEH) with 89.0 percents. Therefore, the equation 1, can be written as following. BEH = 0.32 MIND + 0.29 TRAIT + 0.75 EE ……………………..(1) (R2 = 0.89) Equation (1) factors that had the most effect to Environmental Behaviors for Global Warming Alleviation (BEH) was Environmental Education (EE), subsequences were Inspiration of Public Consciousness (MIND) and Psychological Trait (TRAIT) and these were able to explained the variation of Environmental Behaviors for Global Warming Alleviation (BEH) with 89.0 percents. Moreover, considering on structural model confirmatory factors of EE and TRAIT were able to explain the variation of endogenous factors of Inspiration of Public Consciousness (MIND) with 97.0 percents. Therefore, the equation 2, can be written as following. MIND = 0.67 TRAIT + 0.58 EE …………..……..…………………..(2) (R2 = 0.97)

ISSN 2039-9340 Mediterranean Journal of Social Sciences Vol. 3 (11) November 2012
270
Equation (2) factors that had the most effect to Inspiration of Public Consciousness (MIND) was Environmental Education (EE), subsequences was Psychological Trait (TRAIT) and these were able to explained the variation of Environmental Inspiration of Public Consciousness with 97.0 percents.
Picture 5: Model of Direct and Indirect Effect of EE TRAIT through MIND Affecting to BEH 5. Discussion The findings indicated that environmental education had direct affecting to inspiration of public consciousness and environmental consumption behavior for global warming alleviation with highly with statistically significant at level of .01 with effect of 0.58 and 0.75. Additionally, Moreover, when considering on weight of loading of observe variables of Skill for Environmental Practice (X4), and Participation to Environmental Activities (X5) was congruent to different studies of Thiengkamol, N. (2004, 2005a, 2005b, 2010b, 2011a, 2011b, & 2011c) that the results illustrated that the participants of Participatory Appreciation Influence Control (PAIC) training process with the integration of focus group discussion and brain storming would perform better environmental behaviors whether consumption behavior, energy consumption, recycling behavior, traveling behavior and knowledge transferring and supporting for environmental conservation after they had real practice via different activity participation for environmental conservation. Nevertheless, confirmatory factors of Psychological Trait (TRAIT) had direct effect to Inspiration of Public Consciousness (MIND) and Environmental Behaviors for Global Warming Alleviation (BEH) with statistically significant at level of .01 with effect of 0.67 and 0.29. This result is congruent to the concept of psychologists about psychological trait also an important factor that affected to mind and behavior of people and research of Thiengkamol, (2012c). It might be concluded that environmental education determined by observe variables of Knowledge and Understanding on Environment (X1), Attitude toward Environment (X2), Value for Environment (X3), Skill for Environmental practice (X4), and Participation to Environmental Activity (X5) and Psychological Trait (TRAIT) composing of Physical Health (X6), Psychological Health (X7), Self-Confidence (X8), Mercy and Kindness (X9), Achievement Motivation (X10), and Goal of Life (X11) affecting to Behavior for Global Warming Alleviation (BEH) covering of
-0.04
1.03
0.98
0.42 0.26 0.46 0.64
0.58
0.29
0.32
X3
Y10
0.79
Chi-Square=235.78, df=196, P-value=0.210, RMSEA=0.034
1.00
1.00
0.97
0.26
EE
X5
TRAIT MIND
X1 X2
0.16
0.22
X4
0.15
X6 X7 X8 X9 X10 X11
0.20 0.30 0.30 0.49 0.19
0.61
0.33
0.23
0.23
0.26
0.32
0.37
0.67
0.75 BEH
Y1 0.10
Y2 0.33
Y3 0.29
Y4 0.55
Y5 0.56
Y6 0.14
Y7 0.33
Y8 0.23
Y9 0.23
0.79
0.49 0.25 0.38 0.88 0.81

ISSN 2039-9340 Mediterranean Journal of Social Sciences Vol. 3 (11) November 2012
271
Consumption behavior (Y1), Energy conservation (Y2), Waste disposal (Y3), Traveling behavior (Y4), Recycling behavior (Y5), and Knowledge transferring and supporting for environmental conservation (Y6).
The exogenous factors of Environmental Education (EE) and Psychological Trait were able to explain the variation of endogenous factors of Inspiration of Public Consciousness (MIND) to caused Environmental Behaviors for Global Warming Alleviation (BEH) with 89.0 percents and the variation of endogenous factor of Inspiration of Public Consciousness (MIND) with 97.0 percents. The model of EE and TRAIT affecting to BEH through Inspiration of Public Consciousness was verified the proposed model was fitted with all observe variables according to criteria of Chi-Square value differs from zero with no statistical significant at .05 level or Chi-Square/df value with lesser or equal to 2, P-value with no statistical significant at .05 level and RMSEA (Root Mean Square Error Approximation) value with lesser than 0.05 including index level of model congruent value, GFI (Goodness of Fit Index) and index level of model congruent value, AGFI (Adjust Goodness of Fit Index) between 0.90-1.00.
Therefore, it might be concluded that environmental education and psychological trait play very important roles to create the environmental behavior of consumption behavior, energy conservation, waste management, traveling behavior, recycling behavior , and knowledge transferring and supporting for environmental conservation, therefore environmental education should introduced by integration in every subjects in the school. Additionally, inspiration of public consciousness in aspects of person as role model, impressive event, impressive environment, and public mind performance should be paid attentions, particularly, in aspect of role model, the parents and teacher or even though movie star or political man should act as role model and express their public consciousness to inspire their children, students, and young generations. These results were congruent to concepts proposed by Thiengkamol (2009b, 2009c, & 2011e) and researches of Thiengkamol, (2012c) and Jumrearnsan, & Thiengkamol, (2012).
References
Jumrearnsan, W., and Thiengkamol, N. (2012). Development of an Environmental Education Model for Global Warming Alleviation. The Social Sciences, 7: 65-70.
Kassin, S. (2003). Psychology. USA: Prentice-Hall, Inc.National Research Council of USA. (2010). Advancing the Science of Climate Change. Washington, D.C.: The National Academies Press.
Office of National Economic and Social Development Plan. (2010). The Tenth National Economic and Social Development Plan B.E. 2550-2554. Retrieve from http://www.nesdb.go.th/Default.aspx?tabid=90
Pimdee, P., Thiengkamol N,, Thiengkamol T., (2012) Psychological Trait and Situation Affecting through Inspiration of Public Mind to Energy Conservation Behavior of Undergraduate Student, Mediterranean Journal of Social Sciences Vol 3 (3)
Pearson, H. (2006). “Genetics: what is a gene?” Nature 441 (7092): 398–401. Ruboon, O., Thiengkamol, N, Thiengkamol, T, & Kurukodt, J. (2012). Model of Environmental Education Teacher with Inspiration of
Environmental Conservation for Global Warming Alleviation. European Journal of Social Sciences, 31 (1) : 92-102 Saenpakdee, A., and Thiengkamol, N. (2012). Formulation of Community Forest Act for Thailand. Journal of the Social Sciences, 7
(1):71-76. Sukserm, T., Thiengkamol, N., and Thiengkamol, T., (2012). Development of the Ecotourism Management Model for Forest Park.
Journal of the Social Sciences, 7 (1):95-99. Sukwat, S. Thiengkamol, N., Navanugraha, C. and Thiengkamol, C. (2012). Development of Prototype of Young Buddhist Environmental
Education. Journal of the Social Sciences, 7 (1):56-60. Suwan, M. (2006). Management of Environment: Principle and Concept. Bangkok: Odian Store. Thiengkamol, N. (2004). Development of A Learning Network Model for Energy Conservation. Doctoral Dissertation of Education
(Environmental Education) Faculty of Graduate Studies, Mahidol University, Thailand. Thiengkamol, N. (2005a). Strengthening Community Capability through The Learning Network Model for Energy Conservation. Journal
of Population and Social Studies, 14 (1), 27-46. Thiengkamol, N. (2005b). Development of Health Cities Network for Mekong Region. In Proceedings of the International Conference
“Transborder Issues in the Grate Mekong Sub-Region” Ubon Ratchathani, Thailand, 30 June-2 July 2005 (pp.111-119). Ubol Ratchathani: Nevada Grand Hotel.
Thiengkamol, N. (2009b). The Great Philosopher: the Scientist only know but Intuitioner is Lord Buddha. Bangkok: Prachya Publication. Thiengkamol, N. (2009c). The Happiness and the Genius can be Created before Born. Bangkok: Prachya Publication. Thiengkamol, N. (2010b). Urban Community Development with Food Security Management: A Case of Bang Sue District in Bangkok.
Journal of the Association of Researcher, 15 (2), 109-117. Thiengkamol, N. (2011a). Holistically Integrative Research (2nd ed.). Bangkok: Chulalongkorn University Press. Thiengkamol, N. (2011b). Development of Energy Security Management Model for Rural Community through Environmental Education
Process. In Proceedings of the 1st EnvironmentAsia International Conference on “Environmental Supporting in Food and Energy Security: Crisis and Opportunity” Bangkok, Thailand, 22-25 March 2011 (pp.11). Bangkok: Rama Garden Hotel.

ISSN 2039-9340 Mediterranean Journal of Social Sciences Vol. 3 (11) November 2012
272
Thiengkamol, N. (2011c). Development of Food Security Management Model for Undergraduate Student Mahasarakham University through Environmental Education Process. In Proceedings of the 1st EnvironmentAsia International Conference on “Environmental Supporting in Food and Energy Security: Crisis and Opportunity” Bangkok, Thailand, 22-25 March 2011 (pp.12). Bangkok: Rama Garden Hotel.
Thiengkamol, N. (2011e). Environment and Development Book. (4th ed.).Bangkok: Chulalongkorn University Press. Thiengkamol, N. (2011i). Development of Model of Environmental Education and Inspiration of Public Consciousness Influencing to
Global Warming Alleviation. European Journal of Social Sciences, 25 (4):506-514. Thiengkamol, N. (2012c). Model of Psychological Trait Affecting to Global Warming Alleviation. European Journal of Social Sciences, 30
(3), 484-492. United Nations Framework Convention on Climate Change (UNFCCC). (2005). Retrieved from
http://unfccc.int/essential_background/convention /background/items/1353.php.. United Nations Framework Convention on Climate Change (UNFCCC). (2011). “Kyoto Protocol: Status of Ratification”. Retrieved
from http://unfccc.int/kyoto_protocol/ status_of_ ratification/items/2613.php United States National Academy of Sciences. (2008). Understanding and Responding to Climate Change. Retrieved from
http://americasclimatechoices.org/climate_change_ 2008 _final.pdf Volker., H. (2007). Brundtland Report: A 20 Years Update. Retrieve fromhttp://www.sd-network.eu/pdf/doc_berlin/ESB07_ Plenary_
Hauff.pdf. Wattanasaroch, K., Thiengkamol, N., Navanugraha, C. and Thiengkamol, C (2012). Development of Green Dormitory Standard for
Mahasarakham University. Journal of the Social Sciences, 7 (2):90-95. Watkinson, J. (2009). WCED (1987) – Copenhagen (2009): Will we ever take the environment seriously? Retrieve from http://myliberaldemocratpoliticalramblings.wordpress.com/2009/08/27/wced-1987-copenhagen-2009-will-we-ever-take-the-environment-
seriously/World Commission on Environment and Development (WCED). (1987). Our Common Future. Oxford: Oxford University Press. The Brundtland Report. United Nations World Commission on Environment and Development. Retrieve from http://en.wikisource.org/wiki/Brundtland_Report

ISSN 2039-9340 Mediterranean Journal of Social Sciences Vol. 3 (11) November 2012
273
The Impact of Phasing-out Textile Quota on the Egyptian Textile
and Clothing Sector (Case studies from Alexandria)
Hanan Abouel-Farag
Assistant Lecturer of Economics Damanhour University, Egypt
El-Sayeda Moustafa
Professor of Economics Alexandria University, Egypt
Ahmed Mandour
Professor of Economics
Alexandria University, Egypt
Doi:10.5901/mjss.2012.v3n11p273
Abstract: Quantitative restrictions on “Textile and Clothing” (T&C) trade were completely removed in January 2005. Consequently, Egyptian T&C exporters have lost the quasi-guaranteed market access to the “European Union” (EU) and “United States” (US) markets and they became subject to fierce competition in global market. This research aims to empirically investigate the effect of quota abolishment on the Egyptian T&C sector during the period 1995-2008. Quota phase-out had a negative effect on exports especially to the EU market. However, liberalizing T&C trade was not the only factor causing the declining trend of exports, as several domestic and international challenges facing the sector led to reduced competitiveness. Those results were proved by a number of case studies using some of the T&C companies in Alexandria as a sample. The results of this research provide guidelines for a development strategy to flourish the sector. Keywords: Egypt; quota phase-out; textile and clothing 1. Introduction Egypt is one of the main T&C players in the Mediterranean Region, it has a vertically integrated textile industry; the whole production process, from the cultivation of cotton to the production of yarns, fabrics and ready-made garments, is carried out domestically. Moreover, Egypt enjoys comparative advantages over other textile producers in the Mediterranean Region due to the availability of high quality cotton and low cost labor. Egypt’s textiles workers, for example, earn only 47% and 36% of the salaries of their Tunisian and Moroccan counterparts, respectively (Ministry of Investment, 2008).
The strategic nature of the textile industry in Egypt is derived from its large size in terms of production, employment and exports’ earnings. The T&C sector contributed about 26.4 % to Egyptian industrial production in 2008. It is the largest industrial employer in the country, accounting for about 27% of total manufacturing employment in 2006. Egypt exported about $ 1.2 billion of T&C products in 2006/07, accounting for 10% of the country’s non-oil exports of that year (Ministry of Trade and Industry, 2008).
Both of the US and the EU are Egypt’s main export partners; their combined share of Egypt’s T&C exports had reached 86% in 2004, this explains why phasing-out quotas imposed under the “General Agreement on Tariffs and Trade” (GATT) presents a great challenge to Egyptian exporters.
This paper investigates the impact of the “Agreement on Textiles and Clothing” ATC’s lapse on the Egyptian T&C exports by analyzing the evolution of T&C exports during the ATC period and evaluating performance after trade liberalization. In addition, nine case studies were conducted using public and private companies in Alexandria, together with a set of interviews with key informants in the sector in order to reveal changes in the performance of those companies after quota’s phase-out and highlight the major challenges facing them.

ISSN 2039-9340 Mediterranean Journal of Social Sciences Vol. 3 (11) November 2012
274
2. Background Trade in T&C has long been restricted in developed countries and remained outside of the normal GATT discipline for decades until the Uruguay Round (1986-1994), when the ATC was reached to phase out quotas; setting a timetable for a gradual elimination of T&C quotas over a 10-year transition period ending on January 1, 2005.
A number of studies were done to analyze the effect of quota abolishment on T&C exports of Arab countries. Two studies were conducted to evaluate the early impact of quota abolishment on the T&C sector in Egypt, Jordan, Morocco and Tunisia (MENA-4), with a focus on Egypt (World Bank, 2006; Egyptian Centre for Economic Studies, 2006). Both studies showed that one year after expiration of the quota system, the T&C sectors of all MENA-4 countries lost ground in the EU market. Nonetheless, in the US market, Egypt (and Jordan) experienced impressive export performances after quota removal; this was largely attributed to signing the “Qualified Industrial Zones” (QIZ) protocol between Egypt, US and Israel. However, QIZ benefits would diminish over time due to the proliferation of free trade agreements that the US is signing, this implies that the preferential treatment of Egyptian exports will be eroded. Moreover, the QIZ does not solve the main supply-side problems of the industry, which range from the poor cotton pricing policy to the lack of investments and ill marketing strategy.
According to Magdner (2005), T&C industry in Egypt has several strengths that could play a major positive role in Egypt’s economic development; however, its neighboring countries; Morocco and Tunisia - with much smaller economies and labor forces - are exporting significantly more T&C products than Egypt. Other countries as well, particularly China, pose a more competitive threat especially after quota phase-out.
Most of the studies conducted to analyze the impact of ending the T&C quotas on Egypt’s exports’ performance focused their evaluation only on the first year of the free trade era. Those studies didn’t empirically examine the major problems facing T&C producers in Egypt. The policy options suggested by most of those studies were general and did not explain the relevant tools for their application. Furthermore, almost all of the conducted researches did not differentiate between the trends of exports of textile products and clothing products, although both industries vary in nature and in the export performance. 3. The impact of quota elimination on the Egyptian T&C exports This section investigates the impact of the ATC’s lapse on the Egyptian T&C exports by analyzing the evolution of T&C exports during the ATC period and evaluating performance after trade liberalization (1995-2007). Since the “Central Agency for Public Mobilization and Statistics”, Egyptian official statistical agency, had changed the way of collecting data and added “Free Trade Area” FTA’s exports to the recorded data sets starting from the year 2008, the analysis will end in 2007 as the data comparison for the years before and after this year would be misleading. To give an accurate analysis of the effect of quota abolishment, raw materials exports (raw cotton and raw linen) were excluded as they were not covered by the ATC. Moreover, the EU (15) is the focus of this study, as the EU enlargement started in 2004. 3.1. Egypt’s export performance during the ATC period (1995-2004) Annual fluctuations in the export value of T&C products moved in tandem with total non-oil exports during 1996-2004, although falls were more acute for T&C products. The overall performance of T&C exports since 1996 had been weak, showing a negative “Compound Annual Growth Rate” CAGR of 2.5% over the period 1996-2004. This was very modest in comparison to total non-oil exports, which grew at a CAGR of 8.5% over the same period. Also, T&C exports experienced a fall in their relative importance in Egypt’s foreign trade, to comprise only 11% of non-oil exports in 2004, down from 36% in 1996. Over the period 1995-2004, textile exports (including spinning, weaving, knitting, furnishing, floor covering, and home textiles) exceeded that of clothing as shown in Figure 1. However, there was a significant increase in the share of clothing exports in total T&C exports; from 30% in 1995 to 46% in 2004, despite the decline in both of them.

ISSN 2039-9340 Mediterranean Journal of Social Sciences Vol. 3 (11) November 2012
275
Figure 1. The Evolution of T&C Exports to the World (1995-2004)
Source: International Trade Point, Egypt. The EU is Egypt’s number one textile export destination followed by the US, in contrast, the US is the largest trading partner for clothing exports as shown in Figure 2. This confirms the important differences between the EU and the US markets as the EU market requires a higher degree of customization of their orders to the needs of customers with several fashion adjustments even within a single season and the Egyptian clothing exporters are not in pace with those changes (World Bank, 2006). Figure 2. The Evolution of T&C Exports to the World, EU and US (1995-2004)
Source: International Trade Point, Egypt.
million $ million $

ISSN 2039-9340 Mediterranean Journal of Social Sciences Vol. 3 (11) November 2012
276
During the first two stages of the ATC (1995-2001) in addition to the year 2002, Egyptian T&C exports to the world suffered from three slumps; In 1996, textile exports decreased by 25.6%, while clothing exports decreased by 5.6%. This decline was partly a response to the lifting of pricing restrictions on raw cotton in 1996 as part of Egypt’s “Economic Reform Program”, this led to an increase in cotton prices, and since cotton is the main raw material for T&C production in Egypt, the price of T&C products increased (WTO, 1999). Exports started recovery in 1997 - it approached the level of 1995 - as the government established the “Cotton Stabilization Fund” in 1996/1997 to face cotton world price volatility (Metwally & Elsayed, 2005).
In 1999, textile exports decreased by 19.4% and clothing exports decreased by 16%, the main reason for such decline was the “Asian Financial Crisis” and its delayed effect on Russia and Brazil. The crisis exerted a downward pressure on prices and heightened competition by diverting exports that would otherwise be going to Asia, Russia and Brazil to the EU and the US markets (Burr, MacDonald et. al., 1999).
T&C exports reached its minimum level in 2002, one reason for such decline was the September 11, 2001 attacks on the US that caused a sharp decline in world’s trade, and consequently T&C exports were negatively affected (WTO Website). Also, China’s accession to the WTO in December 2001 improved Chinese market access to the EU and the US markets substantially, resulting in intensifying competition in those markets (Refaat, 2006).
The same factors affected T&C exports to the EU and US markets, those two market’s combined share of Egypt’s textile and clothing exports during the period 1995-2002 was 84% and 92.7% respectively. It is noteworthy mentioning that such trend was not affected by the different stages of quota phase-out because none of the integrated quotas affected the Mediterranean countries until the end of the year 2001, the integrated products were either of little importance to the major importers (EU and US) or were not originally restrained by quotas (Kheir-El-Din and Abdel-Fattah, 2008).
The competitiveness of Egypt’s exports was prompted by the devaluation of the Egyptian pound in 2003 58F
1 (Ministry of Finance, 2004), therefore, T&C exports increased by 12%. Textile exports to the EU market increased by 17% while that of clothing increased by only 8%, the situation was reversed for the US market as T&C exports increased by 7% and 15%, respectively.
A fundamental change in Egypt’s T&C exports to the EU market took place after the implementation of Egypt-EU Association Agreement” in January 2004. The agreement resulted in the elimination of quantitative restrictions on Egyptian T&C exports before the date set for elimination by the ATC prior to the elimination of quotas on exports from other countries, especially the Asian countries (this effort was part of a broader Euro-Mediterranean partnership, which aims to establish a free trade area between the EU and 12 countries around the Mediterranean by 2010). Therefore, EU imports from Egypt increased by 8.4% for clothing and 10% for textile products. However, total T&C exports experienced a slight decrease in 2004 as the increase in exports to the EU was more than offset by the decrease in exports to the US (textile exports to the US decreased by 30% and clothing exports decreased by 13%). This may be attributed to the severe competition that characterized the world market during the last year of the ATC. It is noteworthy mentioning that quotas on restricted products in the EU and the US markets had been persistently under-utilized. The average fill rate did not exceed 50% for almost all the products, revealing that quotas were not a real constraint for the Egyptian T&C exports; however, the quota system had shielded Egypt from competition with stronger competitors for whom quota was constraining. 3.2. The impact of quota elimination on the Egyptian T&C exports excluding QIZ (2005-2007) Egyptian T&C exports decreased by 10% during the first year after quota phase-out and continued to decrease in 2006 as shown in Figure 3, the combined share of EU and US markets in Egypt’s T&C exports had reached 76% in 2005 down from 86% in 2004.
Figure 4 shows that textile exports to the EU decreased by 14% in 2005; but part of this decline was intended in order to enhance competitiveness in the EU market that enjoyed lower prices of both cotton yarns and fabrics by 7% and 5%, respectively (Textile Consolidation Fund, 2006). In contrast, textile exports to the US market increased slightly in 2005 and then it decreased at an increasing rate in 2006 and 2007 (it reached $32 million in 2007 compared with $47 million in 2004).
1 In January 2003, the Central Bank of Egypt announced the float of the Egyptian pound; therefore, the Egyptian pound was allowed to be freely determined by market forces. That resulted in about 30% devaluation in the value of the Egyptian pound compared with the previous year; in June 2002, the buying price was 462.0706 PT/$, while in June 2003, it become 603.2290 PT/$ (Central Bank of Egypt, 2004).

ISSN 2039-9340 Mediterranean Journal of Social Sciences Vol. 3 (11) November 2012
277
Clothing exports were severely affected by quota phase-out as it decreased by 34% to each of the EU and US markets in 2005; this decline resulted mainly from the intensified competition in world market during the first year of free trade. Recovery of clothing exports started in 2007, especially exports to the EU, as it increased by 60% as shown in Figure 4. This increase came as a result of the government's efforts to improve the competitiveness of the sector, mainly, reducing tariffs on imported yarns and fabrics. In addition, between 2000 and 2006, the EU offered a financial assistance of £80 million to help restructuring the sector, retrain workers, privatize and modernize the public sector spinning and weaving companies in Egypt (Ministry of Trade and Industry, 2007). On the contrary, Egyptian non-QIZ T&C exports to the US decreased as most US T&C imports from Egypt were handled through the QIZ protocol as shown in the next section. Figure 3. The Value of T&C Exports to the EU, US and Other Markets (2004-2007)
Source: International Trade Point, Egypt.
Figure 4. Percent Change in T&C Exports to the EU and US Markets (2005-2007)
Source: International Trade Point, Egypt.
-40%
-20%
0%
20%
40%
60%
80%
2005 2006 2007
Textile
-40%
-20%
0%
20%
40%
60%
80%
EU US
2005 2006 2007
Clothing

ISSN 2039-9340 Mediterranean Journal of Social Sciences Vol. 3 (11) November 2012
278
3.3 The impact of the QIZ protocol on the Egyptian T&C exports (2005-2008)
The QIZ protocol between Egypt, Israel and the U.S. was signed on December 14, 2004, providing non-reciprocal duty-free access to the U.S. market for products manufactured in specific industrial zones. These products must fulfill certain specific “rules of origin value added criterion”; where a 35% of the value added must be produced in Egypt, Israel (and/or West Bank and Gaza) and the US. An obligatory minimum of 11.7% - which was reduced to 10.5% in 2008 - out of the 35% must be produced in Israel (Ghoneim, 2009). QIZ represented an unprecedented opportunity to gain duty-free access to the U.S. market. Since the protocol entered into force in February 2005, it has played an important role in the growth of Egypt’s T&C exports to the US market as shown in Figure 5.
It is obvious that the QIZ agreement had allowed Egyptian T&C manufacturers to escape the worst effects of quota abolishment. The value of QIZ T&C exports in 2007 ($688 million) exceeded the total value of Egyptian T&C exports - excluding QIZ - to the rest of the world in the same year ($481.5 million). However, the sustainability of such export's growth is doubtful, as the T&C industrial base experienced very little benefits from QIZ which could be confirmed by three facts;
a) Examining the product structure of QIZ T&C exports revealed that clothing exports enjoyed the lion’s share, accounting for 90%, on average, between 2005 and 2008. Moreover, four products only accounted for 80% of the clothing exports, these products were led by pants (50%), followed by T-shirts, shorts and shirts (QIZ Unit).
b) Examining the concentration ratio of exporters within the QIZ indicated no significant entry of new comers. Despite the fact that the geographical coverage of QIZ eligibility had expanded significantly from only seven industrial zones in 2005 to 16 zones in 2009, only six of these zones accounted for 80% of all QIZ exports and five of them were among the original seven at the beginning of the implementation of QIZ protocol. This is also confirmed by the fact that out of the 800 registered companies, only a little over 200 - the larger companies - are actually exporting (Nugent and Abdel Latif, 2009).
c) The preferential treatment of Egyptian exports through the QIZ is likely to be eroded over time due to the widening network effect of the US “Free Trade Arrangements” (FTAs).
Figure 5. QIZ T&C Exports (2005-2008)
4. Empirical study of the T&C industry in Alexandria Alexandria is Egypt's largest seaport and a major industrial centre, accounting for about 40% of the total industrial output. Its port serves about 80% of Egypt's total imports and exports. The most important industries located in Alexandria include textiles, metals, cement, petrochemicals and food processing operations. T&C industry is one of the most important industries in Alexandria with a dominant private sector and few public sector companies (Industrial Development Authority, 2011). This section empirically investigates and analyzes the export performance of a number of T&C companies in Alexandria and shed light on the major problems facing the industry.
Source: QIZ Unit, Ministry of Trade and Industry, Cairo, Egypt.

ISSN 2039-9340 Mediterranean Journal of Social Sciences Vol. 3 (11) November 2012
279
4.1. Scope, limitations and methodology This research focuses on T&C exporters in Alexandria, especially those that are exporting to the EU and/or the US markets. The study covers the period 2002 to 2008 so as to be able to grasp the effect of quota phase-out on the exports of those companies. The empirical work faced a number of obstacles, mainly; a) Unavailability of central database about T&C companies in Alexandria. b) Resistance of private companies to reveal export data (for sake of competition). c) Almost all companies that agreed to fill the questionnaire have no computerized itemized database.
Different sources of evidence (questionnaires, personal interviews, direct observation and external data sources) were utilized to explore the phenomena under study through the use of a replication strategy. The consistency of findings of the studied companies further strengthened the generalization and reliability of research results. Semi structured questionnaire was considered appropriate as this type of questionnaire comprises a mixture of closed and open questions. There are 84 T&C companies registered in ‘Alexandria International Trade Point’, the researcher contacted the largest 81% of those companies (68 companies). After excluding non-exporting companies and those that had wrong contact information, only nine companies out of 19 accepted to fill the questionnaire. 4.2. Analysis of the results of the case studies 4.2.1. Public sector companies There are three large public sector T&C companies in Alexandria, two of which (Stia and El-siouf)2 are exporting 15% to 25% (on average) of their production. After quota phase-out, El-siouf’s exports decreased by more than 40% in 2005 (compared with 2004) as the EU is the company’s sole export market. The reason behind that sharp decline in El-siouf’s exports is mainly the stiff competition of South-East Asian countries in addition to the increase in the Egyptian cotton prices. By examining Table. 1, it is clear that exports of Stia Company did not suffer much in year 2005 (decreased by 6.2%3
), the reason is that Stia is a QIZ Company, which helped to alleviate some of the negative effects of quota phase-out. The decrease in Stia's exports to the EU and the US combined was only 2.2%, while the rest was due to the decline in exports to the rest of the world including Arab Countries and Russia. The deterioration of those two large public companies' exports continued throughout the period (2006-2008) - as shown in Table 1 - due to internal problems facing T&C exporters in Egypt; sinking level of skills of both workers and technicians. Table 1. The Percentage Change in the Value of Exports of Public Companies (2005-2008)
2005 2006 2007 2008 El-siouf - 41% -29% -1% -2%
Stia -6.2% -14% -21% -9% It is worth noting here that the environmental regulations didn’t pose a problem for both companies; as Stia has obtained the Eco-tex certificate while El-siouf needs no certificates since it produces un-dyed yarns and fabrics, whereas most environmental certificates concerns chemical products used in dyeing. Moreover, both companies benefited from the “Export Development Fund” subsidy program (a government body that supports a number of sectors with an export subsidy that conform with the WTO “Agreement on Subsidies and Countervailing Measures”,), however, they didn’t benefit from the four international agreements of the “Greater Arab Free Trade Area” (GAFTA), the “European Free Trade Association” (EFTA) and the “Common Market for Eastern and Southern Africa” (COMESA), in addition to the “Free Trade Agreement” (FTA) with Turkey. As new investments in public sector companies were limited after the implementation of the ‘Economic Reform Program’ in the early nineties, productivity in those companies dwindled, thereby reducing competitiveness. 2 In 2004, Stia and El-siouf Companies had 4478 and 4142 workers respectively, those numbers experienced a high decrease in 2006 as it reached 3388 in Stia (24% decrease) and 3699 in El-siouf (11% decrease). This was highly attributed to the early retirement policy of most public sector companies which was used as an income support policy. 3 As Stia company records data by financial year, therefore, the researcher compared exports of 2005/2006 with 2003/2004. The financial year 2004/2005 data was not used as during the first half of that year the quota system was still in force.

ISSN 2039-9340 Mediterranean Journal of Social Sciences Vol. 3 (11) November 2012
280
Moreover, the low prices of imported yarns and fabrics (especially from Asian producers) endangered domestic industry in two ways: a) The domestic demand for Egyptian yarns and fabrics decreased causing a reduction in sales revenue, worsening the financial position of those companies. b) The reputation of Egyptian T&C products was badly affected as they were not made from high quality Egyptian cotton. Consequently, imposing safeguard measures on the imports of those products is considered crucial. 4.2.2. Privatized companies There are three T&C privatized companies in Alexandria; Alexandria Spinning and Weaving Company (SpinAlex), Arab Polivara Company and El Nasr T&C Company (Kabo)4
, those companies were privatized in the years 1997 and 1998. SpinAlex produces yarns only; Polivara produces yarns and fabrics, while Kabo produces knitted wear. Almost all the exports of SpinAlex and Polivara are directed to the EU market, while Kabo exports find their ways to the EU, US and Arab countries (the average combined share of the EU and US markets in Kabo’s exports is 60%). The percentage decline in the value of exports after quota phase-out varies dramatically among the three companies as shown in Table 2. Table 2. The Percentage Change in the Value of Exports of Privatized Companies (2005-2008)
2005 2006 2007 2008 SpinAlex -4% -2% +4% -4% Polivara -11% -15% -34% -3.5% Kabo -80% -18% +130% not available
In 2005, there was a slight decrease in the value of exports of SpinAlex but soon it recovered in 2007. Polivara experienced 11% decrease in exports which intensified to reach 34% decrease in 2007; this was attributed to three main reasons; increasing global competition, successive increase in cotton prices and the reduced productivity and product quality that resulted from the old machines. In 2008, exports of both companies decreased again, but it was not decisive whether that decrease resulted from the poor performance of both companies or because of the decreasing world demand after the 2008 financial crisis.
The situation in Kabo was unstable as the year 2005 witnessed major changes in the company's management which caused operational problems, consequently, exports decreased by 80% in 2005. With the new management board, the company’s performance started to improve in the following years, moreover, the company benefited from several governmental supported programs - through the ‘Industrial Modernization Center - that provided the company with financial assistance for training workers and purchasing new machines. In 2006, the company received export subsidy from the ‘Export Development Fund’ which contributed to exports' increase in 2007.
Environmental related trade barriers had no negative effects on the three companies, as each of them had acquired two or more environmental certificates (by governmental financial assistance) which facilitated their entry to different markets, especially the EU.
Although the three companies export little quantities to Arab countries, African countries and Turkey, they view Egypt-Turkey FTA as a promising agreement and hope to ripe more of its benefits in the near future. 4.2.3. Private sector companies For the private sector companies, we work on four companies; two of which are partnership companies (Cotton Club and American Group) , employing 526 and 300 workers, respectively (in 2006), while the other two are joint-stock companies (Dyetex Group and Kangaro). Cotton Club exports its whole production to the EU market while American Group exports - about 60% of its total production - to both the EU and the US markets (80% to the US and 20% to the EU on average). The export performance of both partnership companies was fluctuating during the period 2004-2008 as shown in the Table 3. This fluctuation was largely attributed to the intensified competition in the EU and US markets and the
4 In 2006, the number of workers in Spinalex reached 2800, it was a little more than 4800 workers in both Polivara and Kabo Companies (those numbers were slightly stable between 2004 and 2006).

ISSN 2039-9340 Mediterranean Journal of Social Sciences Vol. 3 (11) November 2012
281
unawareness of other market opportunities. Also, the 2008 global financial crisis resulted in decreasing exports. It is noteworthy mentioning that the increase in American Group’s exports in 2005 resulted from the existence of long-term export contracts for a number of orders from the previous year. Table 3. The Percentage Change in the Value of Exports of Private Companies (2005-2008)
2005 2006 2007 2008 Cotton Club -9 % +11% -8% -8%
American Group +10 % 0% 0% -10% Dyetex not available +21% +11.7% +5.6%
The Dyetex Group5
5 Dyetex Group is the second largest joint-stock clothing company in Alexandria - after Kabo Company - employing over 4000 workers.
is one of the largest joint-stock companies in Egypt that exports its whole production to the EU and the US markets, while the Kangaroo Company exports its whole production to the US market. Dyetex was able to maintain a relatively good export performance after quota phase-out as the value of its exports increased at an average annual rate of 17%, however, the annual growth rate was decreasing as shown in Table 3. The Kangaro Company’s exports achieved a stable growth rate of about 5% on average per year during the period 2004-2008.
According to the interview’s results of both the American Group and Dyetex, if it was not for the QIZ agreement, the phase-out of quota system would have caused a more significant negative effect on exports. Cotton Club was not registered as a QIZ company until 2011 and this was considered an opportunity to export to the US in the following years.
High prices of imported inputs and the scarcity of skilled labor represented the major problems facing those companies. For some companies such as Dyetex, the high turnover rates of skilled labor in addition to the weak work commitment highly intensified the problem by lowering productivity.
The studied companies generally comply with environmental standards and labor rights provisions, the only challenge facing Dyetex in this regard was the overtime limits for skilled labor. None of the four companies benefited from any of the regional international agreements mentioned before. Moreover, they did not take advantage of the subsidized training programs and tariff reductions on machinery and spare parts that took place in 2007. This was largely attributed to the unawareness of those agreements and reforms. Only the American Group benefited from governmental subsidized accounting software and Cotton Club benefited from the export subsidy program. Recently, the Cotton Club company developed some production lines and established a water refining unit, while the American Group company offered a number of training programs for its workers. 5. Analysis of the problems facing the T&C companies In order to gain a broader understanding of the factors affecting the trend of Egyptian T&C exports and the challenges facing T&C producers, a number of interviews were conducted with some of the key players in the T&C industry in Egypt. We were able to gain the following insights. 5.1. Problems concerning the cotton sector According to the studied cases, the low production and the high price of Egyptian cotton was the major problem facing T&C producers, the cotton cultivated area decreased by 32% over 10 years period (1997-2008), the reasons behind that are discussed below:
Generally, the growing expenses of fertilizers, pest-control operations and the long nine-month cotton cultivation cycle led to a decrease in the planted area in favor of other profitable crops as vegetables. Also, some cotton growers postponed planting cotton for three months - after its optimal planting dates - in order to use the land in producing other crops during this period (to make more profit), which caused a reduction in cotton productivity.
Egypt’s cotton crisis began in 1996 when the government gave up the responsibility of allocating the cultivated area for cotton, buying crops from farmers, and selling the cotton at a subsidized price to domestic mills. During the period 1996-2004, the government cotton pricing policy discouraged farmers from growing cotton; ensured minimum prices became uncertain and most often those prices were announced too late (after the time of starting cotton plantation) for the farmer to decide whether to plant cotton or not.

ISSN 2039-9340 Mediterranean Journal of Social Sciences Vol. 3 (11) November 2012
282
Liberalizing cotton trade in 2004 (under agreements signed between Egypt and the WTO) had left farmers without any protection against global market fluctuations. Farmers became subject to exploitation of domestic cotton traders who usually buy the cotton crop from farmers at low prices to sell it to local producers or export it at a much higher prices. Consequently, farmers didn’t gain much even at times when world cotton prices were rising.
At the same time Egyptian government reduced subsidies directed to cotton growers, the US subsidy program for pima cotton (the primary competitor for Egyptian cotton) has resulted in a reduction in demand for Egyptian long-staple cotton.
The net effect of all such factors was forcing many Egyptian yarn companies to reset their machines to process medium and short staple cotton (imported from Greece and Sudan) to face the shortage of the Egyptian extra-long and long staple cotton in the last few years. This affected Egyptian T&C exports negatively, as the products have lost the comparative advantage of being made of Egyptian cotton. 5.2. Other problems concerning the T&C sector Lack of cheap raw materials, capital investments, skilled labor and adequate subsidies are problems mitigating the performance of T&C industry in Egypt;
a) Unavailability of cheap raw materials, mainly cotton, is a problem hindering the competitiveness of all types of companies producing in this sector.
b) Insufficient capital to replace depreciated machines is a problem facing mainly the public sector companies. Consequently, most public sector textile companies are suffering great losses and are highly indebted. Privatized joint-stock companies, on the other hand, are struggling with "the principle - agent problem".
c) The shrinking supply of skilled labor across the different stages of the production chain is mostly due to insufficient training programs and its high cost. High turnover rate among the existing skilled labor is another obstacle threatening the T&C sector; skilled labor in T&C companies seeks higher wage jobs either inside or outside Egypt. Consequently, some T&C producers - especially foreign companies inside Egypt – tend to employ workers from Asia.
d) Companies working in this sector complain from weak levels of subsidies directed to their sector while competitors in India, for instance, are highly subsidized at each stage of production. Moreover, the existing subsidies are directed towards large companies which had acquired quality certificates. Adding to the above problems, textile producers consider smuggling low cost fabrics from Asian countries as another key problem threatening their existence. Furthermore, discrimination among domestic and foreign investors in terms of facilitating business environment is another major constraint that discourages many small-scale Egyptian businessmen. 6. Conclusion Egyptian T&C exports experienced a generally declining trend with several fluctuations during the period 1995-2004 due to some internal and external problems, in parallel with the lack of strategies to augment performance and increase awareness of the intensified competition that usually prevail in a quota-free market. After quota abolishment, Egyptian T&C exports experienced a poor performance (excluding QIZ exports). Only in 2007, T&C exports approached its level in 2004, which was highly attributed to tariffs' reduction on imported raw materials (yarns and fabrics) that took place in 2007. In the US market, the QIZ protocol secured Egyptian T&C exports’ access to this market after 2005. Actually, the QIZ exports more than offset the sharp decline in the non-QIZ exports. However, a limited number of producers have benefited from the tariff free treatment, moreover, the growing array of bilateral agreements signed by the US threaten to erode the preferential access provided to Egyptian exporters relative to competitors. The domestic problems facing the T&C sector had a great effect on export’s performance. The high price of Egyptian raw cotton was triggered by other problems such as; the high cost of cotton cultivation and decline in its relative profitability that eventually led to the decline in land allocated for cotton production. Moving up the supply chain, several problems hamper the growth of the textile sector. The public sector textile companies have a lot of inherent problems; the old machinery, outdated technology and over employment of low-skilled labor. Consequently, almost all clothing exporters import raw materials from abroad, i.e. losing the competitive advantage of using high quality Egyptian cotton. Also, the clothing sector suffers from low labor productivity and lack qualified middle and upper management personnel, in addition, the limited marketing and R&D capabilities enhanced the sector’s troubles.

ISSN 2039-9340 Mediterranean Journal of Social Sciences Vol. 3 (11) November 2012
283
Furthermore, smuggling T&C products to Egypt exposed textile producers to unfair competition at the national level. At the global level, the very high subsidies directed to the T&C producers in Asia (especially in India) render competition unfair. 7. Recommended policies Reviving the T&C sector starts with the development of a national plan that determines the role of each stakeholder in the sector, in addition to putting outlines for the cotton cultivation development strategy. The government must develop a supreme council for the T&C industry in order to put the details of this plan and monitor its implementation. This council has to act as a connection point between companies (especially small and medium enterprises) on one side and training centers, research institutes and government bodies on the other side. A guide for the development of this national plan is presented below. 7.1. The cotton sector development strategy As cotton is the major raw material for the Egyptian T&C industry, increasing its production would have a great role in increasing competitiveness of the sector’s exports. There are several strategies that will serve in achieving this goal including; a) Strengthening the role of the cotton research centers. b) Subsidizing good strains of cotton seeds, fertilizers and pesticides with free advisory services for farmers. c) Reviving the cotton price stabilization fund to protect cotton farmers and manufactures against risks of extreme world price fluctuations.
In the long-run, great emphasis should be directed towards planting short- staple cotton in the new reclaimed land in the desert - through cooperation with research initiatives - this allows mechanization of cotton farming which increases productivity. In addition, expanding organic cotton cultivation is recommended as demand for products made of organic cotton has increased dramatically in the last few years. 7.2. The textile sector development strategy There is an urgent need for restructuring public sector textile companies; this is not necessarily associated with the conventional privatization processes that proved to be inefficient in many cases. The public private partnership is considered an innovative option because it allows benefiting from private sector efficiencies, at the same time, it allows the government to promote economic and social development goals. Concerning joint-stock companies, various mechanisms have to be used to align the interests of the agent in solidarity with those of the principal including management stock ownership programs. Combating smuggling needs tougher laws, in addition to using new technology to facilitate the mission (e.g. using the satellite surveillance system that was recently applied in Turkey). Applying temporary safeguard measures on all imports of yarn and fabrics is necessary in the long-run so as to support the modern domestic T&C industry. 7.3. The clothing sector development strategy Although, Egypt has an abundance of inexpensive labor, the low productivity rates eroded its competitive advantage. Addressing this problem starts with filling the gap between demand and supply of skilled labor through enhancing technical and vocational training to generate a pool of skilled productive workers. This can be achieved by strengthening the role of the existing training and modernization centers through increasing awareness - especially among small and medium enterprises - about the programs on offer and introducing a credible monitoring system to ensure higher levels of transparency and accountability of the institutions that offer subsidized training and modernization services. Another recommendation to reduce turnover rate among skilled workers is to develop compensations packages that includes long-term incentives, profit-sharing programs, improving health care and working conditions, and other fringe benefits.

ISSN 2039-9340 Mediterranean Journal of Social Sciences Vol. 3 (11) November 2012
284
Upgrading clothing design and marketing policy could significantly enhance Egypt's competitiveness. Entering into strategic alliances with internationally operating clothing companies, retailers and brand companies may be an excellent option.
References
Afifi T. (2007). The applicability of the Egyptian trade agreements in the light of the complex rules of origin, Workshop on ‘Commodities,
rules of Origin, development and legal dimensions of the European Union/ Africa Economic partnership debates’, Nordic Africa Institute-Uppsala, Sweden, September 7-8, 2007.
Burr, Pete, MacDonald, Stephen, Meyer, Leslie and Skelly and Carol. (1999), USDA perspective on the outlook for cotton, Agricultural Outlook Forum 1999, United States Department of Agriculture, Agricultural Outlook Forum paper No. 32949.
Central Bank of Egypt. (2004, June 30). External position of the Egyptian economy, Quarterly Report, Cairo- Egypt El-Haddad, A. (2010). Effects of the global crisis on the Egyptian textiles and clothing Sector: a blessing in disguise?, Egyptian Center
for Economic Studies Working Paper 156. Ghoneim A. and M. Pigato. (2006). Egypt after the End of the multi-fiber Agreement: A comparative regional analysis, Egyptian Centre
for Economic Studies Working Paper No. 114. Ghoneim A. (2009). Impact of qualifying industrial zones on Egypt: A Critical Analysis, paper presented at the UNCTAD Meeting,
Geneva, May 7-9. Industrial Development Authority. (2011). The industrial development in Alexandria. Available: http://www.ida.gov.eg/ PDF
En/alexandria_En.pdf (July 10, 2011) International Trade Point, Egypt. World trade statistics with Egypt. Available: http://www.tpegypt.gov.eg/Eng/TradeStatistics.aspx
(November 22, 2010) Kheir-El-Din H. and M. Abdel-Fattah (2008). Textiles and clothing in the Mediterranean Region: opportunities and challenges of returning
textiles and clothing to GATT disciplines. Available: http://www.econturk.org/ Turkisheconomy/erf4.pdf (October 22, 2010) Magder D. (2005). Egypt after the Multi-Fiber Arrangement: Global Apparel and Textile Supply Chains as a Route for Industrial
Upgrading, Institute for International Economics Working Paper series No. WP05-8A. Metwally, Sayed. (2005). Spinning, weaving and ready-made garment industry in Egypt between the present and the future, Paper
presented at the Symposium ‘The Effect of GATT on Textile Industry and Workers’, Arab and African research center, April 9-10. Ministry of Trade and Industry. (2008, December). Half-Year Report, Vol. 4, Cairo- Egypt. Ministry of Trade and Industry. (2007, March). Egypt-EU economic relations report, Quarterly Report, Cairo- Egypt. Ministry of Trade and Industry. (2006, June). Quarterly Report, Vol. 5, Cairo- Egypt. Ministry of Trade and Industry. Egypt – EU Association Agreement. Available: http://www.tas.gov.eg/NR/rdonlyres/BD477EE4.../
EUEgyptrevisedEnglish3.doc (October 25, 2010) Ministry of Trade and Industry, QIZ Unit, Egypt. Imports / Exports - QIZ Egypt. Available: http://www.qizegypt.gov.eg/ (December 10,
2010) Ministry of Finance. (2004). Egyptian economic monitor, Vol. 1, No. 2, Cairo- Egypt. Refaat A. (2006). Assessing the Impact of the QIZ Protocol on Egypt's Textile and Clothing Industry, Working Paper No. 113, The
Egyptian Centre for Economic Studies, Cairo- Egypt. Textile Consolidation Fund (2005; 2006; 2007). Quarterly Report, 1st quarter, Commercial Research Unit, Cairo- Egypt. The Egyptian Textile Magazine. (2010, June 1). Smuggling knocks textile and yarns industry on the head. UNCTAD. (2003). Market entry conditions affecting competitiveness and exports of goods and services of developing countries: large
distribution networks, taking into account the special needs of LDCs, Paper TD/B/COM.1/EM.23/2 presented at UNCTAD Expert Meeting, New York and Geneva, November 26-28.
World Bank. (2006). Morocco, Tunisia, Egypt and Jordan after the End of the multi-fiber agreement, Social and Economic Development Sector Unit, Middle East and North Africa Region, Report No. 35376 MNA.
WTO. (2009). The world trade organization in brief. Available: http://www.wto.org (January 20, 2011)

ISSN 2039-9340 Mediterranean Journal of Social Sciences Vol. 3 (11) November 2012
285
What Inhibits Manufactured Exports in Sub-Saharan Africa: Firm Level Evidence?
Ogujiuba Kanayo *
Stiegler Nancy
Department of Statistics and Population Studies, University of Western Cape, CPT; South Africa
* Corresponding author: Email [email protected]
Amakom Uzochukwu
Department of Economics Nnamdi Azikiwe University, Awka, Anambra State, Nigeria
Doi:10.5901/mjss.2012.v3n11p285
Abstract. The poor performance of many less developed and developing countries including African economies have been attributed to low growth of exports in general and manufactured exports in particular. In trying to remedy the situation, Sub-Saharan Africa (SSA) economies including Nigeria have adopted different strategies to woo foreign investors in the form of foreign direct investment (FDI) due to insufficient domestic investment that can propel the economic growth process.This study attempts to investigate constraints to manufactured export using firm level evidence from seven SSA economies (Kenya, Nigeria, Tanzania, Cameroon, Mauritius, and South Africa). Employing probit regression and ordinary least squares (OLS), the study found that output per labour, raw materials per labour and indirect cost were the major constraints to manufactured exports. Also, high production and transaction costs (indirect costs) were found to constitute the constraints for exporting both in SSA at large. Based on findings, there is need for provision of export incentives, which may come in two parts: measures designed to increase firm-level efficiency as this would help firms to attain certain level of international competitiveness necessary for sustainable exporting; and measures designed to reduce the transaction and production costs associated with exporting. Key Words: Manufactured Exports, Firm, Sub-Saharan Africa (SSA) 1. Introduction Export-Oriented Industrialization (EOI) is a trade and economic policy with main objective of speeding-up the industrialization process through export of goods for which the country has a comparative advantage. Export-led growth sometimes requires opening domestic markets to foreign competition in exchange for market access in other countries. Reduced tariff barriers, official variation of exchange rate (devaluation of national currency), and government support for exporting sectors are all examples of policies usually adopted to promote EOI, and ultimately economic growth and development. EOI was particularly the characteristic of the development of the national economies of Japan, South Korea, Taiwan and Singapore in the Post World War II period as well as China in the last two decades. Nevertheless, the poor performance of many developing countries especially Sub-Saharan African (SSA) economies has been attributed to the low growth of exports in general and manufactured exports in particular (Soderbom and Teal 2002). The three most successful exporting countries in Africa have been South Africa, Botswana and Mauritius. In Botswana, rapid export growth followed the discovery of diamonds; South Africa has been involved in exporting both light and semi-heavy manufactured equipments while in Mauritius manufacturing exports played a major role. This low growth of exports has been explained by Harrol, Jayawickrama and Bhattasali (1996), stating that in Africa, the decrease in the share of GDP does not reflect any fundamental transformation of the production structure, or major steps towards industrialisation. According to the trio, in the 1960s, Africa’s agricultural production increased at 2.7 percent a year-about the same as population growth. From 1970 to 1985, agricultural growth slowed to an average of 1.4 percent a year, about half the rate of population growth but in South Asia, the lower relative importance of agriculture reveals the path of successful structural transformation and industrialisation. In Asia, increased agricultural productivity permitted the

ISSN 2039-9340 Mediterranean Journal of Social Sciences Vol. 3 (11) November 2012
286
movement of labour into manufacturing, without a fall in agricultural output. Indeed, a comparison across developing regions suggests that the largest decrease in agriculture’s share of output and employment were observed in countries where agricultural output and productivity have increased the most as a result of private investment. 1.1 Challenges of Manufactured Exports in Sub-Saharan Africa There is no doubt that manufactured exports remain one of the most powerful engines for economic growth because it acts as a catalyst to transform the economic structure of countries, from simple, slow-growing and low-value activities to more productive activities that enjoy greater margins driven by technology and having higher growth prospects (Albaledjo, 2003). Unfortunately, a look at the manufactured export per capita in SSA as shown in figure 1.1 below reveals that SSA economies are yet to meet with some of their counterparts in Middle East and North Africa (MENA) and South Asia (SA) 1
Source: Soderbom et al 2004 The situation is worse when SSA is compared to South Asia (SA) and Middle East and North Africa (MENA) regions in terms of FDI Inflows, industrial value added (% of GDP) and gross capital formation (% of GDP) as depicted in figures 1.2 &1.3 below. Figure 1.2 reveals an upward trend and almost moving at the same pace for the three regions in terms of FDI Inflows for the period 1970-2007. On the contrary when it comes to industrial value added (% of GDP) and gross capital formation (% of GDP) as reflected in figures 1.3, the opposite is the case for SSA region.
regions .
Source: Authors’ Computation using data from Word Development Indicators (WDI) 1 Average manufactured export per capita in East Asia in 2004 was more than US$1500.
Figure 1.1: Manufactured Exports Per Capita at $US (1995 Prices)
0
100
200
300
400
500
600
700
800
900
1000
Mauritius
South Africa
Zimbabwe
Ghana
Kenya
Cameroon
Zambia
Tanzania
Nigeria

ISSN 2039-9340 Mediterranean Journal of Social Sciences Vol. 3 (11) November 2012
287
A look at figure 1.3 suggests a decrease in industrial value added (% of GDP) for the SSA for the period 1990-2007 contrary to increase in FDI inflow within the same period unlike the MENA and SA regions that recorded an increasing trend in industrial value added (% of GDP) at the same period.
Source: Authors’ Computation using data from Word Development Indicators (WDI). Comparing the ratio of manufactured exports to GDP, the average (6 per cent) is just over half of the average for the low-income countries confirming that in SSA, manufactured export performance is particularly poor, hence may be one of the sources of stagnation other things being equal. Figure 1.3 above presents the picture of SSA industrial value added and gross capital formation (% of GDP) when compared to South Asia and MENA regions even with increase in FDI inflows (Figure 1.2). Then the BIG question remains what constrains manufactured export in Africa? In the words of Almedia and Fernades (2006), while most of the firms improve their technology by simply initiating or adapting existing production techniques to local conditions, other firms are truly engaged in the creation of new technologies. The former is mostly found in the developing countries while the later are clearly in the highly industrialized countries. This implies that exporters acquire from their foreign customers, information on how to improve the manufacturing process, decrease production costs, improve product design, and upgrade product quality. This information, as argued, gives exporters a performance edge and that has been the case with countries like Argentina, Brazil, Colombia, Indonesia, and Vietnam where manufacturing accounts for 30% to 55% of merchandise exports while in Hungary, Mexico, Pakistan, the Philippines, and Turkey, manufacturing accounts for more than 80% of merchandise exports. However appealing these arguments may be, skeptics reject them. When Clerides et al. (1998) linked exporting to productivity they broached a debate between those who believe that exporting is truly good for firms because it increases their efficiency and those who attribute most of the positive correlation between exporting and productivity to self-selection. Evidence in favor of learning by exporting, i.e. additional productivity gains from exporting, has been found by Aw et al. (2000) in Korea, Girma et al. (2003) in UK, De Loecker (2005) in Slovenia, and Van Biesbroeck (2005) in Cote-d’Ivoire. But its potential benefits are even greater today due to rapid technological change, sweeping liberalization and the increased internationalization of production. Manufacturing has become the main means for developing countries to benefit from globalisation and be able to bridge the income gap with the industrialized world as is the case with China, Vietnam and India. This is clearly evident in the rapid development of Asian Tigers. South Korea’s 25% of GNP derives from manufacturing industry, which has recently broadened its scope to become very successful in high-tech precision manufacturing in the consumer electronics, multimedia computers/notebooks, aerospace and defense markets. China's surging trade surplus is driven by continued increases in high-tech exports. Manufacturing sector exhibits a ‘pull effect’ on the other sectors of the economy by stimulating the demand for more and better services in banking, insurance, communications and transport. An insight into the sector benefits implies that if Nigerian manufacturing sector is vibrant just like that of China or other developing economies, it can stimulate a more productive agricultural sector, making use of technological advances and a boost in human capital. The industrial sector has been confirmed the main vehicle for technological and human development. Today, the sector represents the hub of technical progress, not just in developed countries but also in developing ones. A good example is in countries like Argentina, Brazil, Colombia, Indonesia, and Vietnam where manufacturing accounts for 30% to 55% of merchandise
Figure 1.3: Industrial Value Added (% of GDP)
0
5
10
15
20
25
30
35
40
45
50
1970
1972
1974
1976
1978
1980
1982
1984
1986
1988
1990
1992
1994
1996
1998
2000
2002
2004
2006
MENA
SA
SSA

ISSN 2039-9340 Mediterranean Journal of Social Sciences Vol. 3 (11) November 2012
288
exports while in Hungary, Mexico, Pakistan, the Philippines, and Turkey, manufacturing accounts for more than 80% of merchandise exports (Hanson and Roymond 2007). Industry uses technology in many forms and at different levels to increase returns to investment, by shifting from low to high productivity activities. This entails a process of constant technological upgrading and learning. Apart from that, skills are a potential determinant of manufacturing exports and investment (Soderbom and Teal, 2001). According to the duo, both dimensions of skills should increase the return on physical capital and thus, the incentive to invest and export and this can be achieved through technological progress thereby making manufacturing a catalyst to technological progress and the main means to achieve higher and more sustainable industrial margins.
Apart from the above functions and features, manufacturing is less exposed to external shocks, price fluctuations (like Nigerian oil prices), climatic conditions (agricultural products) and unfair competition policies. Most SSA economies are very unstable due to their dependence on primary goods like oil and agricultural products. Economic growth has often coincided with peaks in oil prices but in the longer run however, primary goods exports face declining terms of trade due to their low value added to manufactured goods (Prebisch-Singer hypothesis), and the constant fluctuations in world prices. In addition, unfair competition policies have distorted primary goods markets around the world. For instance, subsidized farming in developed countries has closed down market prospects for primary goods exporters from poor nations.
Consequences of a prolonged poor state of manufacturing exports in SSA have resulted to among others: unrestricted influx of commodities into the already flooded Nigeria and regional markets; serious de-industrialization and collapse of fledgling local industries; job loses, factory closures and massive unemployment of teeming new graduates; jeopardizing of local industrialization policy and efforts; negative impacts on balance of payments; exacerbation and loss of control of exchange rates; uncontrollable interest rate regime; diminishing external reserves; nose-diving of the GDP; debt stock, and above all poverty escalation, among others. 2. Brief Theoretical and Empirical Literature Nevertheless, much of the literature on international entrepreneurship emphasizes the importance of exporting as a learning process, consistent with the notion of absorptive capacity and the resource-based view of the firm (Cohen and Levinthal, 1989; Barney, 1991; Teece et. al., 1997, Söderbom, & Teal 2001; Söderbom, & Teal 2002; Bigsten, Collier, Dercon, Fafchamps, Gauthier, Gunning, Oduro, Oostendorp, Pattillo, Söderbom, Teal &. Zeufack 2004). The process of going international is perceived as a sequence of stages in the firm’s growth trajectory, which involves substantial learning through internal and external channels, so as to enhance its competency base and performance. Thus, the learning-by-exporting proposition is consistent with this literature on business internationalization. Indeed, positive learning effects for firms engaged in exporting have been identified, particularly where different econometric methodologies are adopted (e.g. Kraay, 1999; Castellani, 2002; and Hallward-Driemeier et. al., 2002). What is more, a strand of the literature also documents evidence on the co-existence of selection and learning effects, such as Baldwin and Gu (2003), Girma et. al (2004) and Greenaway & Yu (2004). 3. Modeling Export Function Using Cobb-Douglas Production Function The analysis here is based on the standard production theory, in other words, the Cobb-Douglas production function as shown in the theoretical framework above with the assumption that the relationship between inputs and output can be approximated by a production function that is known to the firm. The study writes the production function in general notation as )( ititit ZFAY = ……………………………….………………………………………….. (1) Where Yit is the level of output, Ait is total factor productivity (TFP) and Zit is an n order vector of inputs, where the study assumes that F: is continuous, strictly increasing and quasi-concave. The latter two assumptions are readily testable but were not tested in the present study. Factor demand is linked to the firm’s technology and factor prices. Empirical studies based on firm level data, both from developed and developing countries, typically report substantial variation in factor intensities across firms2
2 Two possible mechanisms generating such differentials have been extensively discussed in the literature (e.g. Little, Mazumdar and Page, 1987).
. In the first case, large firms choose more capital per employee than small ones because capital is relatively cheaper hence technology is kept constant (homothetic), while the relative price of capital decreases with size, so factor prices vary with firm size and large firms choose more capital per employee than small ones. In the second

ISSN 2039-9340 Mediterranean Journal of Social Sciences Vol. 3 (11) November 2012
289
case, a non-homothetic technology can lead to factor choices varying while factor prices are constant. Again, large firms have higher capital-labour ratios, but this is caused by the non-homothetic technology rather than by heterogeneous factor prices. 3.1 Technical Efficiency Equation (1) above represents the ‘frontier’, production function in that it defines the maximum output attainable for firm i at time t, given the technology Ait and the input set Zit. Firms that use Ait and Zit inefficiently, however, will not achieve their maximum potential output. The ratio between actual and potential output is conventionally defined as the level of technical inefficiency, where firms that use Ait and Zit efficiently will have an inefficiency score of unity, and inefficient firms will have scores in the (0, 1) interval. There has been a continuing development of methods over the past 50 years to compute inefficiency scores, with the two principal methods being stochastic frontiers, which is based on econometric methods, and data envelopment analysis (DEA) 3
iteUZFAY iititit.).(=
, relying on mathematical programming. Stochastic frontiers accommodate statistical noise in the dependent variable by means of introducing a residual, while typically treating inefficiency as a random parameter. A general class of such models is presented in Battese and Coelli (1992); another general form is that proposed by Battese and Coelli (1993). One unattractive feature of these random effects models is that the inefficiency term typically is assumed to be uncorrelated with the explanatory variables in the frontier production function. If the inefficiency terms are in fact, correlated with firm attributes, the estimated parameters and the inefficiency scores from such models will be biased (Tybout, 1992). Given that both the inefficiency term and the residual are unobservable, there are substantive identification issues that need to be addressed. With cross-section data, it is not possible to separate the residual from inefficiency without making parametric assumptions about the distribution of the residual and the inefficiency term, which is unattractive. If panel data are available, and if it is reasonable to assume that inefficiency is approximately constant over the time-span during which the firm is observed, then the study can model inefficiency as a time invariant, firm specific effect. Contrary to most studies in the area, this study makes no assumptions about the distribution of inefficiency, and also allows the inefficiency term to be freely correlated with the arguments of the production function. Defining the inefficiency term as Ui = exp(-µi) and the residual as εit the study rewrites the production function as:
…………………………………………………….…………………………… (2) In the empirical analysis, the study allowed for correlation between €it and the arguments of F, caused by, for instance, measurement errors of the kind discussed above. 3.2 The Export Function In order to translate (2) into an expression suitable for econometric analysis, the study adopted an explicit functional form of the production function F, which provides a reasonably close approximation of the real technology. One flexible form which has been used extensively in studies estimating cost and production functions, is the second-order transcendental logarithmic (‘translog’) production function (Christensen et al., 1971; Berndt and Christensen, 1973), which the study writes as
,21
mitkitkmmkjitjjit InInInInF ΧΧΣΣ+ΧΣ= ββ …….. srrs ββ = for all s, r ………(3)
where Xj is the jth input in the production process, j=1,2,…, J, Xk and Xm represent input processes for export and import while βrs denotes parameters to be estimated. The translog specification is attractive, because it nests or approximates a number of popular models in the literature, and for our purposes, it is especially useful because output and substitution elasticities are allowed to vary with the levels of the inputs, hence homotheticity is not imposed. The following shows three key parameter restrictions on (3) which the study tests for in the empirical analysis: In the empirical analysis, if the study was intended in detail derivation of the production function, the study would have used two definitions of the dependent variable in the production function, namely gross output and value-added4
3 While DEA is attractive, in that it does not require any parametric assumptions about the functional relationship between inputs and output, a significant disadvantage of this procedure is that the computed inefficiency scores are very sensitive to measurement errors, either in output or the input variables. Therefore, in the researcher’s view, DEA is not very well suited to survey data sets and was not used in this study. 4 Value-added production functions appear to be more common in the literature, however research by Basu and Fernald (1995) show that adopting a value added production function can yield misleading results if there is imperfect competition or increasing returns to scale.
but

ISSN 2039-9340 Mediterranean Journal of Social Sciences Vol. 3 (11) November 2012
290
since the study focus is on export function, it will made use of the production function with value added as the dependent variable. In the output production function, the study used four inputs: labour, denoted L, physical capital, K, raw material inputs, M, and indirect inputs, I. Because value-added is defined as output minus costs for raw material and indirect inputs, the study uses only labour and capital as inputs in the value-added specification.
,0=Σ kmik β m = 1,2, ….j, (homotheticity); ……………………………………………………...…… (4a) m = 1,2,…,j (Constant returns to scale); …………………..… (4b) βkm = 0 k = 1,2,…..,j; m =1,2,….,j, (Cobb-Douglas Form) .......(4c)
From all the reviewed literature, the study found that exporters and non-exporters are, on average, different in that exporters are bigger; produce more output per employee, more capital-intensive and more likely to be foreign-owned hence this study specifies the 5b to ascertain such claims. There are differences by country and sector, regional and international exporters. However, these differences may be due to other factors and not exporting. For example, more productive firms may be more capital-intensive, and more capital-intensive firms may be more likely to export and more capital intensive firms in developing countries especially Africa always have some foreign affiliation, and thus the relationship between productivity and exporting is because of this. This study therefore, employed control for inputs and sector specific factors including ownership (foreign or national firm) by estimating production and export functions using equation (4c) the Cobb-Douglas Production form which gives equation (5a) and (5b) thus:
ititititititiit sdmLkaY ηθδθδαβα +++++++−++= 0))(1( ……………………… (5a)
itititititititiitit sdmLkaY ηθδθδαβαχ +++++++−+++= 0))(1( …………… (5b) where: Yit is log gross output per employee Xit is whether firm exports or not ai is the vector of firms’ specific characteristics including ownership or affiliation of the firm Kit is the log of capital stock per employee Lit is the log of the level of employment (hours of labour) Mit is the log of the level of raw materials used in the production process 0it is the log of other indirect costs such as electricity, water, transportation, etc. sdit is the sub-sectoral dummies (these are the sub-sectors in SSA manufacturing sector) as well as country dummies. ηit is the standard disturbance with mean zero and variance;
itηδη .2 ; is the residual or part of the log of employee not explained by firm specific characteristics, export participation and inputs. The results therefore can be interpreted as the productivity of the firm once all these factors are accounted for, while differences in productivity was the result of unobserved characteristics of the firm such as skills, technology, market structure, or managerial ability. Equation (5a) and (5b) above yield the required production and export functions in Africa from the micro perspective. While equation 5a was derived through Ordinary Least Squares (OLS) regression, equation 5b was derived through a Probit regression technique since the dependent variable takes the value 0 or 1 (binary nature). The Probit model overcomes the drawback of ordinary linear probability because it is based on the cumulative logistic probability function, which is easier to use computationally (Pindyck and Rubinfeld, 1998: 308). Meanwhile, the sign of the variables from the probit regression analysis determines whether the variable(s) is/are export potentials or constraints. Production and Export Functions in SSA’s Manufacturing Sector Productivities and Export Coefficients in Selected African Countries using Firm Level Data This study made efforts to develop a production and export functions using the Cobb-Douglas as appeared in 5a and 5b above towards finding major constraints to export of manufacturers among SSA countries and the effect of foreign ownership on the propensity to export. Three equations; Production Function, Probit Export (Regional), Probit Export (International) were estimated simultaneously, using maximum likelihood. Dummy variables for time were included in all the regressions. The numbers in parenthesis are t-statistics based on standard errors robust to hetroskedacticity and
{ }{ 1
,0=Σ=Σ
kk
kmk
ββ

ISSN 2039-9340 Mediterranean Journal of Social Sciences Vol. 3 (11) November 2012
291
intra-firm autocorrelation. Significance at the 1 percent and 5 percent level were indicated by **, *. $ is the estimated correlation between residuals in equation 1. Table 1.1: Firm-Analysis of Productivity and Exporting in Selected African Countries
(1a) Prod. Function
(1b) Export Probit
(1c) Export Probit
(2) In Capital/Employment
Regional International In Capital/Employment 0.04 0.16 0.10 (4.31)** (4.02)** (2.32)* In Raw Material/Employment
0.67 -0.17 -0.32
(43.31)** (4.76)** (2.19)* In Indirect Costs/Employment
0.18 -0.75 -0.87
(14.43)** (3.28)** (2.84)** In Employment 0.02 0.33 0.34 0.49 (2.35)* (5.52)** (6.13)** (12.02)** Firm Age/100 0.12 -0.10 -0.10 0.01 (1.80) (0.27) (0.23) (3.37)** Food -0.01 -0.26 -0.85 0.59 (0.13) (1.21) (4.27)** (2.94)** Metal 0.00 0.24 -1.47 0.18 (0.04) (1.25) (7.38)** (0.90) Textile, SSA 0.09 0.36 -0.93 0.19 (1.48) (1.35) (3.39)** (0.83) Garment, SSA 0.04 0.16 -0.49 0.69 (0.81) (0.67) (2.00)* (2.94)** Textile, South Africa -0.07 0.37 0.351 0..37 (0.94) (0.40) (2.59)** (3.04)** Furniture 0.04 -0.23 -1.13 -0.55 (0.73) (0.86) (4.87)** (2.63)** Kenya -0.10 0.021 1.39 (3.16)** (3.57)** (9.76)** Cameroon -0.34 -0.65 -0.56 -0.09 ((2.23)* (2.3)* (2.09)* (0.97) Tanzania -0.08 0.27 0.59 (2.57)* (1.40) (3.51)** Nigeria -0.10 -0.82 -0.71 1.01 (2.45)* (3.27)** (2.39)* (4.68)** Mauritius 0.26 0.69 0.90 0.87 (3.21)** (2.18)* (4.21)** (3.65)** South Africa 0.22 0.93 0.92 0.90 (3.71)** (3.79)** (3.07)** (3.30)** Residual Correlations$: 0.08 0.05 0.46 (2.38)* (1.43) (7.04)** Log Likelihood value -2679.20 Sample Size 4,029 R2 0.87
Source: Authors’ Computation

ISSN 2039-9340 Mediterranean Journal of Social Sciences Vol. 3 (11) November 2012
292
4. Results and Discussion of Findings To have a better understanding of the constraints of exports in SSA using a six country sample, a probit regression (columns 1b and 1c) was applied in modeling the decision to export as a function of technical efficiency (output per worker), materials per worker, indirect cost, firm age, dummy variables for industry, location and foreign ownership (foreign direct investment), and size measured as the number of employees. The probit result as reported in Table 1.1 (columns 1b and 1c) above suggests that larger firms are more likely to export than smaller ones. This finding supports the findings of some other studies. There is a positive and significant relationship between exports and efficiency from the capital/employment coefficient implying that firms that are more efficient are more likely to export from the results. The major constraints to export propensity for African firms from the result were output per labour, raw material per labour and indirect costs. Other variables such as employment level, physical capital, and output growth, capital per worker and output per worker were potentials for export among SSA firms. This result corroborated with the findings from UNIDO 2004 for Nigeria. The results further reveals that South Africa and Mauritius firms have the highest propensity to export both regionally and internationally everything else equal, followed by Kenya firms for regional export only. In the case of international export, Kenya and Tanzania firms were dropped from the list5
Even with high cost of doing business, the study result reveals that Nigerian firms would be competitive abroad, at least to the same extent as firms in Tanzania and Kenya. Based on the above finding, there is need for provision of export incentives. Some of these costs are induced by unstable government policies. There is strong evidence that sound economic policies help economic development, while poor policies result in an array of constraints from which escape is
. There is no significant difference in the underlying export propensity for Nigeria and Cameroon for regional and international export.
Finally, the estimated ρac, which measures the correlation between the unobserved component of productivity and the unobserved component driving international exports, is positive and highly significant for the production function and international export. This indicates that, even conditional on factor inputs and control variables, international exports and productivity are correlated. This is consistent with having a link between unobserved efficiency and exporting. It was also noted that while there is a positive correlation between efficiency and exporting regionally, this was not significant.
The case of SSA economies – high production and transaction costs in other words, high cost of doing business as a result of poor infrastructure or inefficiency of institutions constituted the indirect cost component and this was found to be stifling SSA’s manufactured exports. This is true for a country like Nigeria. A telling indicator to this is the alarm recently raised by the Bureau for Public Enterprises (BPE), indicating that Nigeria loses N340bn (over US$2 billion) yearly to power outages. This has been observed to have the greater part of the incidence borne by the manufacturing sector (The Guardian May 5, 2005:17 and 63). This is a very significant constraint to manufacturing export as electricity costs constitutes more than 50 percent of the indirect costs in the Nigeria data. Exports may be constrained because SSA firms are inefficient or less productive than their international competitors.
The coefficients for Nigeria in terms of export propensity was -0.82 for regional export and -0.71 international exports which implies that Nigerian manufactured regional and international exports are lower than those of Mauritius, and South Africa. Such results suggest that Mauritius .and South Africa fared better than Nigeria in terms of manufactured exports for the period under study from firm level evidences both for regional and international exports. On the other side, Nigeria’s manufactured export is almost at par with Cameroon for regional and international exports. The central question then, is whether Nigerian firms are productive enough to be able to compete in the international market. The comparative productivity analysis in Table 1.1, revealed that Nigerian firms are not atypically unproductive than Tanzania or Kenyan firms yet when it comes to exporting they appear a long way behind firms with similar characteristics in these other SSA countries. 4.1 Policy Implication and Conclusion One of the major constraints to manufacturing exports in Africa is indirect cost. The most recurrently cited item that increases the volume of indirect costs was physical infrastructure, which includes electricity, road networks, communication, water, etc. Putting the above mentioned physical infrastructures in place will reduce the cost of doing business, and hence promote the competitive level of “made in” Africa commodities. This has been recommended by most studies, including the Regional Programme Enterprises Development (RPED) study by the World Bank. According to ITC (2004), poor road network has greatly increased transportation cost especially in Nigeria where it has been noted that the cost of transportation of some exportable leather commodities from Kano to Lagos (both within Nigeria) is equivalent to the cost of transportation of some imported commodities from Amsterdam (Belgium) to Lagos (Nigeria).
5 insufficient data on the required variable

ISSN 2039-9340 Mediterranean Journal of Social Sciences Vol. 3 (11) November 2012
293
difficult, if not impossible. Policies that can reduce indirect costs will be an asset to SSA manufacturing sector. This, aside from reducing both the production and transaction costs may also increase profitability, which will increase the fund at the disposal of the firms. With such funds, firms should be able to invest more in Research and Development (R&D), which is currently non-existent among most firms because they barely break even at the end of every fiscal year. Clearly improving macroeconomic policy, reducing the level of risk and the size of transaction costs are key ingredients of policy.
References Albaledjo, M. (2003). Industrial realities in Nigeria: From bad to worse. Queen Elizabeth Working Papers No. 10 Almedia, R. and A. M. Fernades (2006). Opennes and technological innovations in developing countries: Evidence from firm-level
surveys. The World Bank Policy Research Working Paper Number 3985. Aw, B.Y., S. Chung, and M. Roberts (2000). Productivity and turnover in the export market: Micro evidence from Taiwan and South
Korea. The World Bank Economic Review. Barney, J (1991) Firm resources and sustained competitive advantage, Journal of Management, 17, 99-120. Battese, G.E. and Coelli, T.J. (1992). Frontier production functions, technical efficiency and panel data: With application to Paddy
Farmers in India, Journal of Productivity Analysis 3, 159-169. Battese, G.E. & Coelli, T.J. (1993). A Stochastic frontier production function incorporating a model of technical inefficiency effects.
Working Paper in Econometrics and Applied Statistics 69. Department of Econometrics, University of New England, Armidale. Berndt, E and Christensen, L. (1973), The translog function and the substitution of equipment, structures, and labor in U.S.
Manufacturing 1929-1968, Journal of Econometrics, 1, pp 81-114. Bigsten, A., P. Collier, S. Dercon, M. Fafchamps, B. Gauthier, J. W. Gunning, A. Oduro, R. Oostendorp, C. Pattillo, M. Söderbom, F. Teal and A. Zeufack (2004). Do African firms learn by exporting? The Journal of Development
Studies, Vol.40, No.3, pp.115–141 Christensen, L., Jorgenson, D., and. Lau, L. (1971), Conjugate duality and the transcendental logarithmic production function,
Econometrica, 39, pp 255 Clerides, S.K., S. Lach and J.R. Tybout. (1998). Is learning by exporting important, micro-dynamic evidence from Colombia, Mexico and
Morocco, Quarterly Journal of Economics 113, 903-48. Cohen, W. M & Levinthal, D. A. (1989). Administrative Science Quarterly, 35 (1), Special Issue: Technology, Organizations, and
Innovation, pp. 128-152. De Loecker J. (2005). Performance on exports: Continuous productivity improvements or capacity utilization, LICOS Discussion Papers
16305, LICOS - Centre for Institutions and Economic Performance, K.U.Leuven. Girma, S., D. Greenaway, and R. Kneller (2003). Entry to export markets and productivity: A Microeconometric analysis of matched
firms. Mimeo, University of Nottingham. Girma, S., Greenaway, D. and Kneller, R. (2004). ‘Does Exporting Lead to Better Performance? A Microeconometric Analysis of
Matched Firms’. Review of International Economics, 12(5), pp. 855-866. Greenaway, R. D. & Yu, J. (2004). Exports, Restructuring and Industry Productivity Growth. Leverhulme Centre for Research on
Globalization and Economic Policy. Nottingham University. Gu, L., (2003). Comment on climate and management contributions to recent trends in US agricultural yields. Science, 300, 1505b. Hallward-Driemeier, M., G. Iarossi, and K.L. Sokoloff, (2002). Exports and manufacturing productivity in East Asia: A comparative
analysis with firm-level data. NBER Working Paper 8894. Hanson, G. H. & Raymond R. (2007). “China and the Manufacturing Exports of Other Developing Countries” NBER Working Paper
Series Number 21. Harrol, P., M. Jayawickrama, and D. Bhattasali (1996). Practical lessons for Africa from East Asia in industrial and trade policies.
Washington, D.C. World Bank Discussion Papers, Africa.Technical Department Series Number 310. Pindyck, R.S and D. L. Rubinfield, (1998). Econometric Models and Economic Forecasts, Fourth Edition, Singapore, McGraw-Hill Book
Co. Söderbom, M. & Teal, F. (2001). Can African manufacturing firms become more successful exporters, Center for the Study of African
Economies (CSAE)/UNIDO Working Paper No. 4, Oxford: Department of Economics, University of Oxford. Söderbom, M. & Teal, F. (2002). Are manufacturing exports the key to economic success in Africa, Paper prepared for the Third United
nations conference on the least developed countries, Brussels 14-20 May. Teece, D, J. Pisano, G. & Shuen, A. (1997) Dynamic capabilities and strategic management. Strategic Management Journal, 18 (7), 507
– 533. The Guardian, May 5, 2005: 17, 63. Tybout, J. R. (1992). “Making noisy data sing: Estimating production technologies in developing countries”. Journal of Econometrics 53,
25-44.


ISSN 2039-9340 Mediterranean Journal of Social Sciences Vol. 3 (11) November 2012
295
The Indigenous Knowledge of Illuminated Boat Procession
of the Thai-Lao Ethnic Group in Mekong Sub-region
Pinit Intirard
Ph.D. Candidate Student of Regional Development Strategies Program, Surindra Rajabhat University.
Prof. Dr. Sombat Kanajakit
Major Advisor, Regional Development Strategies Program,
Surindra Rajabhat University.
Assoc. Prof. Dr. Achara Phanurat
Co-Advisor, Regional Development Strategies Program, Surindra Rajabhat University.
Dr. Kunnika Jitakoom Udomthawee
Co-Advisor, Regional Development Strategies Program,
Surin Rajabhat University.
Doi:10.5901/mjss.2012.v3n11p295 Abstract: The research design was mixed methods of quantitative and qualitative approaches. The qualitative research was In-Dept Interview with 60 peoples comprised 40 Thais, and 20 Laos and quantitative research was survey research with 520 peoples of Thai-Lao ethnics group who involved in Illuminated Boat Procession (IBP). The content from qualitative research was analyzed to construct the questionnaire for quantitative research. Factor analysis was used for determination the component factors. The objectives of this research were to study conservation of Buddhism Srikotrabun culture relate to IBP and to analyze component factor of conserving IBP of Thai-Lao Ethnic Group in Mekong Sub-region. The results indicated that ten factors were as the followings: 1) Indigenous wisdom of IBP is secret codes for merit-making, and a knowledge center of three worlds (heaven, human and nether). 2) Local hydrographic knowledge related to geographical knowledge through practices of the Lord Buddha’s worship and the ancestral worship. 3) The art of IBP passed from generation to generation via fundamental education. 4) Illuminated boat body of fire knowledge based on light and water that reflect dharma principles in human realm, the universe, god realm and the river god. 5) Physical knowledge of earth, water, air, and fire that related to the elimination of misery existed in all three realms: heaven, human and hell. 6) The lighted boat engineering and technology are wisdom related to aquatic plant and animal ecology. 7) During the festival, it is believed that motherhood and living creatures were born from the theories of physical science and wind folklore. 8) IBP is similar to the energy and chemical circulation in the living creatures’ food chain. 9) IBP refers to philosophy and practices related to beliefs associated with Karma in Spirituality, Brahmanism, and Buddhism, and to protect ethnic and ecosystem. 10) The lighted boat construction is the procedure of merit practice, forgiving, and sacrificing connected to intellectual pathway. Keywords: The Indigenous Knowledge / Illuminated Boat Procession / Thai-Lao Ethnic Group / Mekong Sub-region, 1. Introduction Indigenous knowledge is the accumulated knowledge and the expression of cultural diversity, and is worth preserving for next generations. Indigenous Knowledge is a valuable resource which is adaptable in facing present and future challenges. Thai-Lao ethnic group refers to a group of Thai people who live along Mekong River Basin and speak Laos. The area where the Thai-Lao ethnic group lives has long been regarded as the prosperous “Srikotrabun Kingdom”, centered on the Mekong River basin. The resources from the Mekong river basin provide both income and sustenance to

ISSN 2039-9340 Mediterranean Journal of Social Sciences Vol. 3 (11) November 2012
296
over 60 million people who are leading subsistence agricultural lifestyles. The land yields petroleum, minerals, timber and coal, while water from various rivers supports agriculture and fisheries. The river has also provided a means of transportation, shipments and many more activities along 4,880 kilometers for thousands of years. The river originates in Qinghai province, China or on the Tibetan Plateau and flows through Chinese province of Yunnan, continuing a long southward journey, creating the international border between Laos and Myanmar, as well as between Laos and Thailand. Flowing through Laos, Cambodia, and Vietnam, it drains into the South China Sea to the south of Ho Chi Minh City. (Kasetsiri & Kumkoon, 2010). The Thai-Lao Ethnic group in Srikotrabun cultural area follows and adheres to the old tradition, called “Heed Sib Song Klong Sib See” (the twelve month tradition and the fourteen ways of life) as they believe the power of tradition creates customs within cultures and society (. This tradition has long been passed down through generations and has become distinctive in that society. The tradition of fire-worship, the old tradition that has still been carried on towards today, is known as the local wisdom and cultural heritage that has a direct link to beliefs and folk knowledge about the four elements; earth, water, air and fire. The examples of such tradition are including, “the second lunar month fire-worship” or the so-called “Yi Peng” of Lanna culture, the Illuminated Boat Procession held in Nakhon Phanom Province, Thailand and in Suwannaket Province, Lao PDR (Phanurat, 2011). The Illuminated Boat Procession or Lai Ruea Fai (or Huea Fai festival in I-san Language) is also a part of Heed Sib Song tradition, in which Lai Ruea Fai is held from the full moon day to the first day of the waning moon of the 11th lunar month at the end of the Buddhist Lent (Saratassananun, 1986). The festival is celebrated in the areas surrounded by rivers or streams. Besides Thailand, this long-practiced custom is also found in many other countries, such as India, Vietnam, China, Cambodia and Myanmar. The evidence shows that the ritual practices are similar among these countries, which are based on beliefs such worshipping Buddha’s footprints, worshipping the relics of the Buddha in heaven, rain pleading ceremony, a tradition related fire burning misery , expressing apologies or asking for forgiveness from and show respect to the river goddess, and such. Most of these rituals are based on Buddhism beliefs (Ketkaew, 1978). In the past, the illuminated boats were simply made from banana stems and bamboo trees, decorated with flowers, joss sticks and candlelight. After that, people will make a wish and float their decorated boats on the river (Saratassananun, 1987). At the present time, the new technology has been highly involved in the boat assembling process, therefore contemporary versions of the illuminated boats have become impressively constructed and decorated. Against the darkness of the moonlight, the sight of the illuminated boats lining up in the middle of the Mekong River, with the flickering light from candles and the firework displays that are launched simultaneously, is mesmerizing. This dazzling event creates an impressive scene for viewers (Santaweesuk, 1996). Today, the spectacular illuminated boat procession can be seen in several provinces in the Northeastern part of Thailand that are located on the Mekong River, such as Srisaket, Sakonnakorn, Nong Khai, Loei, Ubon Ratchathani, Nakorn Phanom, and MahaSarakam provinces. The beliefs and practices of the ceremony vary among these provinces (Krongkaew, 1981). However, the most well-known one is held in Nakorn Phanom province. According to Preeya Santaweesuk (1996:144), the tradition of fire-boats has been passed down through generations for more than 532 years. Its origin was associated with the beliefs of two religions-Brahmanism and Buddhism. This research focuses on the study of Buddhism Srikotrabun culture relate to illuminated boat process of Thai-Lao Ethnic group in Thailand and Laos Ethnic group in Khammouane province, Lao PDR, particularly, on the history, beliefs, the conduct of a ceremony, the evolution of the lighted boats, and the differences in practices between the two countries. Even in Lao PDR, there was none of the documents that has ever explained this ceremony background in detail. Furthermore, this thesis also analyzes the factors regarding the illuminated boat procession, in order to preserve and protect Buddhism in Srikutrabun cultural area, Thailand. The results of this study will be applied to write policy proposals on a topic related to connection building among education, religion and culture in schools, as well as, to create a greater understanding of such indigenous knowledge, which leads to chances of beginning a new phase of development that will enhance the integrity of the ecosystem in the Mekong River basin. 2. Objectives 2.1 To study preservation of Buddhism Srikotrabun culture relate to IBP. 2.2 To analyze component factor of preserving IBP of Thai-Lao Ethnic Group in Mekong Sub-region. 3. Methodology 3.1 Qualitative research was used for data collection from In-Depth Interview form with 60 peoples comprised 40 Thais were from Muang and Tha-Uthen districts, Nakorn Phanom province in Thailand, 20 Laos were from Muang-Tha-Kak, Khammouane province in Lao PDR. The interviewees were from a broad range of groups- consisting of senior or folk

ISSN 2039-9340 Mediterranean Journal of Social Sciences Vol. 3 (11) November 2012
297
wiseman, the committees arranging the annual illuminated boat procession, manipulators of fire boat assembling, fire boat assemblers and the participants from the fire boat festival. 3.2 Quantitative research was survey research with 520 peoples of Thai-Lao ethnics group who ethnic group who live in Srikotrabun area, consisting of 200 students, 150 university students, 50 seniors aged 35-45 years old who have participated in the fire boat festival, 20 institutional committees, 20 village headmen and 80 teachers. 4. Results The results showed that, the IBP has over 550 years of history. This festival has been celebrated since the year 1461 (Weerawong, 1986 : 39,42). It reflects Buddhist origins, Brahmanism as well as animistic beliefs and worship of ancestors, thus leading to customary social and religious practices. For instance, to worship Buddha’s Footprints at Nummatanatee River Banks, to pay homage to Lord Buddha, to pay respect to the Triple Gem (Phra Buddha, Lord Buddha, Phra Dhamma) and the Five Buddhas, to worship the Naga (the Mythical Serpent God associated with water that dwells in three realms), to cast away one’s grief, misery and ill-fortunes by setting the fireboats adrift, to express apologies and show respect to the river goddess, to worship ancestors and to use lanterns as a symbol of worship (Santaweesuk, 1996, and Trirayatha, interview, October 8th, 2011). In the past, the places used to conduct ceremonies were areas along the river. The local authorities then would arrange ceremony, by handing responsibility to some people to deal with boat building and prescribing procedures for conducting the ceremony. In the morning, people get up early to give food to the monks or to “Tak Bat Phra”. After that, local people would gather up listening to the monks’ sermons. The next activity was to worship the King’s relics at Buddhist centers along both sides of Mekong River at Wat Phra That Phanom. A beautiful dance moves were to be performed in order to worship Phra That Phanom. In the afternoon, two ceremonies were held, the on land float-pulling ceremony and the Bee’s Wax Castle Parade. At night, the fire boats were launched in the Mekong River and illuminated in a spectacular display. This illuminated boat procession in Thailand has continuously been carried down from several generations. However, in Lao PDR, the evidence has shown that, there had been a discontinuation of this event due to some political problems. Once the situations had settled, the ceremony was revived and from then onwards, the fire boat festival in Laos continued to be practiced once every year and it continues to this day. Traditionally, when it was several days prior to the Ork Phansa period, the monks would inform and invite local people to come together helping each other build and decorate the boats. The fire boats were made of natural materials such as bamboo, banana tree trunks, or other buoyant materials with a length of around 8-10 metres. The boats were decorated with materials that could be easily found in the vicinity, such as flowers, incense sticks, candles and lanterns. At approximately 11.00 am, the second meals were provided to the monks and were also given, as a treat, to those people who were engaged in the boat assembling process. In the afternoon, the locals dressed up and performed their traditional folk dances. The cultural performances and street processions created joyful moments for all. During the night time, these locals would place their homemade desserts and some other items that they want to donate onto their boats, then, lit them up with ข้ีกระบอง as an inflammable component, which had already been placed inside the boat. In some places, people attach ข้ีไต ้around the boat instead and lit them up. After that, the boats were set alight and floated down the Mekong River. The procession is celebrated on the 15th day of the waxing moon to the first day of the waning moon in the 11th lunar month of the Buddhist calendar (Poanharad, Interview. 2011: October 8th). In Thailand, there are three types of illuminated boats: Ancient Illuminated Boat, On Land Illuminated Boat and Modern Illuminated Boat. However, there is no evidence for the existence of on land illuminated boats in Lao, PDR, which are the boats used for the parade. The boats contain sweets, the so-called Khao Tom Mud-stuffed fried sticky rice, objects to be donated inside and the tiny ancient boat (See Picture 1). The illuminated boat procession has been a part of the Thai-Lao Ethnic group in Mekong River since 1461 (Traiyata, interview. 2011: October, 8th). The rituals have changed over time due to changing environment and an advancement of technology. A rapid change in technology, such as engineering, design & architecture, together with the indigenous knowledge that has been passed down through generations, altered the illuminated boats’ design, shape and size. The boats are spectacularly designed, larger in size, and varied in shapes. In order to make one of these lighted boats, it costs over thousand baht. A change in technology and cultural evolution has shaped the illuminated boat procession along the Mekong River Basin as it is today. The unique festival reflects the Buddhist merit-making rituals, cultural identity, indigenous culture, folk knowledge and skills of Nakorn Phanom local people. There are various methods to preserve and pass on this cultural heritage for future generations. The recommended method is to incorporate such indigenous culture into the school curriculum as a way to promote cultural-appreciation among younger generation. The Khammouane community started the idea of making the Modern Illuminated boats in 2006, with merely 5-7 boats initially (Kumpunya, Interview. 2011: October 9th). The sizes of

ISSN 2039-9340 Mediterranean Journal of Social Sciences Vol. 3 (11) November 2012
298
the boats in the Khammouane community were not as large as those in Thailand, indicating the early stages in technological development. Nevertheless, there’s an emerging tendency to share or transfer the technological know-how between the two communities along the Mekong River Basin. The findings indicate the differences of the festival’s characteristics between the two communities which are as follows: 1) The illuminated boat procession in Thailand is organized by local authorities and is more systematized than the procession in Lao PDR. 2) The information of the fire-boat event is widely and more effectively communicated within people in the Thai community. The festival is grandly celebrated and the cost of organizing is considerably higher than the ones of Laos. 3) The illuminated boat procession in Khammouane community is similar to that of Loy Krathong festival in Thailand. In addition, the lighted boats in Laos, are designed similarly to the floating baskets that are set alight and floated down the river, on the full moon of the 12th month of the traditional Thai lunar calendar (Picture 1, A-B) 4) There’s little evidence showing that the land-based parades of lights are practiced in Lao, PDR. There are few on-land illuminated boat processions, but they are not made for being set afloat down the Mekong River. 5) The modern illuminated boats in Thailand have been around since 1983 whilst the ones in Lao PDR have been around since 2006. 6) The sizes of the modern illuminated boats of the Khammouane community are 2-3 times smaller than those of Thai community (Picture 1, E-F) 7) Laos still lacks support from their government and local authorities. Hence, it is more difficult to preserve and maintain such traditional culture practices. In contrast, Thailand has more support from its government and local authorities in the conservation of IBP. 8) The binding bamboo strips or 4-6 long-tail boats were used to build the base of the modern illuminated boats as to create a buoy. Some people use woods and bamboos with 200 litre fuel tanks attached as their floatable base. (Picture 2, A-B) The interesting part is that, the bases of the lighted boats in Laos resemble those of Thai lighted boats that were structured in 1983. 9) The lamps for boat decorations in Khammouane community, were made of energy drink bottles, while coffee drink bottles were applied in Thai’s illuminated boats. (Picture 2, C-D) 10) The decorated lamps in the illuminated boats of the Lao community have a longer distance than the ones decorated in Thai illuminated boats. 11) The cerebration of the traditional illuminated boats procession in the Khammouane district has been practiced in a simple, plain and easy way. There are not as many animated images decorated on the boats, unlike the ones in Thailand. The reason behind is that, there are more intense competitions in Thailand. 12) The preparation time it takes to perform such traditional event takes approximately 1 week in Khammouane district but 1 month in Thailand. Table 1 shows the number of variables and the weights associated with those factors. Table 1 Factors related to the Conservation of the IBP in Thailand.
Factors Number of Variables Weight 1) Indigenous wisdom of illuminated boat procession is secret codes for merit-making, and a knowledge center of three worlds (heaven, human and nether).
22 0.723-0.332
2) Local hydrographic knowledge related to geographical knowledge through practices of the Lord Buddha’s worship and the ancestral worship.
7 0.716-0.358
3) The art of Illuminated Boat Procession passed from generation to generation via fundamental education.
6 0.783-0.404
4) Illuminated boat body of fire knowledge based on light and water that reflect dharma principles in human realm, the universe, god realm and the river god.
6 0.708-0.486
5) Physical knowledge of earth, water, air, and fire that related to the elimination of misery existed in all three realms: heaven, human and hell.
4 0.702-0.371
6) The lighted boat engineering and technology are wisdom related 5 0.645-0.411

ISSN 2039-9340 Mediterranean Journal of Social Sciences Vol. 3 (11) November 2012
299
to aquatic plant and animal ecology. 7) During the festival, it is believed that motherhood and living creatures were born from the theories of physical science and wind folklore.
3 0.651-0.422
8) The illuminated boat procession is similar to the energy and chemical circulation in the living creatures’ food chain.
1 0.689
9) The illuminated Boat Procession refers to philosophy and practices related to beliefs associated with Karma in Spirituality, Brahmanism, and Buddhism, and to protect ethnic and ecosystem.
4 0.727-0.387
10) The lighted boat construction is the procedure of merit practice, forgiving, and sacrificing connected to intellectual pathway.
2 0.724-0.508
5. Discussion The practices of illuminated boat procession of Srikotrabun Kingdom in Thailand and Lao PDR, has over 550 years of history. Through cultural rituals and words of mouth, knowledge has been passed on from generation to generation, forming the indigenous knowledge. Historically, the illuminated boat procession was originated in the era of Jao Fah Ngum and King Chaiyachetta, the Kings of Laos. During that time, the Heed Sib Song Klong Sib See tradition was the most booming then. The customs have been annually practiced in the 11th lunar month (or heed 11). The ceremonies which are held in the 12th lunar month, usually involve rice protecting rituals. Since the 12th lunar month is the harvesting season, the farmers generally pray and give offerings to ancestral and wandering spirits to ask them to protect and nurture their rice crop towards a plentiful harvest. The rituals have been in practice until today due to the belief that Mae Posop or the Rice Mother exists, thus paying homage to her, the farmers will gain protection of their rice fields throughout the crop season and that the harvest will be abundant and free from harm throughout the year (Chaiyawinit, 1988). The modern illuminated boats vary in shape and form. They do not only reflect cultural identity, indigenous culture and indigenous knowledge, but limitless artistic imaginations were also drawn out from various styles of the lighted boats. The scene of the lights decorated on the boats shows different cultural imaginations, which can be characterized into 4 distinct groups as follows: 1. The group containing lighted boat decorations which reflect Buddhist motifs, important ancient ruins within the province and throughout the country such as Phra That Phanom, Phra That Tha Uten, Phra That SriKotrabong, The Lord Buddha, etc. 2. The group containing lighted boat decorations which reflect the institution of the monarchy such as the Suphannahonsa or golden swan, the personal barge of the king, the portraits of the King, H.M. the King 84 years celebration logo, His Majesty’s accomplishments, etc. 3. The group containing lighted boat decorations which reflect social status, governance and politics, and economy such as the Thai-Lao Friendship Bridge, the Philosophy of Sufficiency Economy, the Thai People, Occupation, Important historical events i.e. the opening ceremony of Thai-Lao Friendship Bridge on 01/11/2011, etc. 4. The group containing lighted boat decorations which reflect sacred symbols such as gods, angels, the Naga, etc. The differences of the ceremony practices and types of Illuminated boat procession between Thailand and Lao PDR show the continuity in the tradition as it has been practiced for centuries. However, there’s the evidence showing that the Lao-ethnic group had once discontinued their rituals due to the effect from political problems in the country, therefore, Lao Ethnic group still lags behind in the progress of modernizing the ceremonial practices. Nonetheless, there has been an exchange in the technological and traditional knowledge between the Thai-Lao ethnic group and the Lao ethnic group. In addition, the evidence has also shown the tendency towards greater future progress in the practices of the Illuminated boat procession in the Lao-ethnic group, if the government or local authorities have provided more supports. The ten factors related to conservation of the IBP in Thailand indicated some traditional activities performed by local people on the 15th day of the waxing moon to the first day of the waning moon in the 11th lunar month. On the event day, the senior people would gather up helping each other make the lighted boats which composed of cut or sliced banana trunks (as a base of the boat), filled with three pieces of betel nuts, cigarettes, candles and incense sticks, and flowers. These materials have been used to show homage/respect to the Naga and the river goddess. According to Buddhism beliefs, heaven is a place for deities/gods, and the Lord Buddha. Human world is a place where ancestors reborn and live in, and the nether world (or one of the regions of hell) is the place where the evil spirits, ghosts, gods and the Naga may lodge.

ISSN 2039-9340 Mediterranean Journal of Social Sciences Vol. 3 (11) November 2012
300
The IBP, nowadays are elaborately adorned with lights, which demonstrate the belief that the fire and water can burn and wash away misery and all the bad lucks in life. The lights decorated on the boats are compared as the shining light in your mind, guiding you towards the noble path and that your life would be filled with prosperity and happiness. The ceremony aims to guide you to understand the core teachings of the Lord Buddha. Moreover, the IBP has also shown the relationship between the four great elements (earth, water, air, and fire) and the living creatures. It was believed that the earth element gave humans (and other living creatures) plants and food. The water element was a source of fish, crabs, and shrimps. Air (or wind) provided air for breathing. The senior people in the past often said that if there’s no air, then the living creatures would all die. Lastly, the fire element, provides a guiding light in humans’ lives or refers to the element which brings warmth and visibility. These four primary elements are essential for human and other living creatures’ lives, thus this field of mysticism is worth preserved and shared for future generations. The ritual of the Illuminated boat procession explains a balance between traditional and technological knowledge. As the technology grows, there’s limited capacity for elders to pass on traditional knowledge to the young. Once these elders pass away, all the valuable traditional knowledge will also be diminished. Therefore, it is important to find ways of preserving this knowledge. The traditional knowledge can be used in science, which means that the two knowledge bases will be in contact with each other if practitioners attempt to weave them together. One of the most effective ways to preserve the valuable Illuminated boat tradition is to embed it in the school curriculums, so that the knowledge will be transmitted through oral teachings and stories, ensuring that the societal norms, religious values and belief systems are transferred to the next generations.
Reference Chaiyawinit, K. (1988). Local religious beliefs in traditional literature. Thesis, Master of Arts, Srinakharinwirot University. Duangdee, P. (200). Kasetsiri, C. and Kumkoon, A. (2010). Mekong River : From Taju-Lanchang, Tonlethom to Kaew Long. 3 rd, edtion. Samutharaprakarn :
Toyota Foundation, Thailand. Ketkaew, B. (1978). The Illuminated Boat Procession. Nakhon Pathom: Silapakorn University, pp. 2: 49-56. Krongkaew, K. (1981). The study of Illuminated Boat Procession . Traditional Culture , 1-31. Kumkoon, C. K. (2010). The Mekong: from Dza Chu-Lancang-Tonlethom to Cuu Long. Bangkok: Thailand Toyota Foundation, 2nd
Edition. Phanurat, A. (2011). Ecosystem. Surin: Surinda Rajabhat University. Santaweesuk, P. (1996). The Illuminated Boat Procession in Nakorn Phanom Province. Mahasarakham : Master of Arts, Mahasarakham
University . Saratassananun, S. (1987). Heed Sib Song Klong Sib See. 4th Edition. Cultural Arts Center of Loei University. Weerawong, S. (1986). Heed Sib Song, translated by Udon Pornprasert and Pichai Sripufai.
Interviewing
Poanharatch, K. (2011, October 11). (P. Intirard, Interviewer) Seeporn Kumpunya, L. P. (2011, October 11). (P. Intirard, Interviewer) Traiyata, D. (2011, October 7). (P. Intirard, Interviewer) Ubonratchathani: Vittaya Publisher.

ISSN 2039-9340 Mediterranean Journal of Social Sciences Vol. 3 (11) November 2012
301
Appendix
Picture 1: Various types of the illuminated boats found in the Thai-Lao Ethnic group community. Picture A, illustrates important materials needed for making the ancient illuminated boats. Picture B, shows the ancient illuminated boat of Khammouane local people, Lao PDR, resembles Krathong of the well-known Thai festival (Loy Krathong). Picture C, is the example of the on-land illuminated boats and picture D,. presents the materials used for decorations within the on-land illuminated boats, while there is no on-land illuminated boats found in Lao PDR. Picture E, Shows the style of modern illuminated boat decorations in Nakorn Phanom province. Picture F, shows the style of illuminated boat decorations in the Khammouane community. As the pictures clearly show that, the Thai modern illuminated boat is much larger in size and is more elaborately designed than that of Laos. The distance between each bamboo is around 1.5x2 square meters.

ISSN 2039-9340 Mediterranean Journal of Social Sciences Vol. 3 (11) November 2012
302
Picture 2: The differences in shapes and forms of the illuminated boats between Thai’s (Left) and Khammouane communities (Right). Picture A, the base of the lighted boats in Thailand was made of bundles of bamboo stalks bind with ropes and the 200 liters fuel tanks, as a buoyant material. Picture B, the base of the lighted boats in Khammouane province was made of a long-tailed boat. Picture C, the Thai lanterns were made of coffee cans. Picture D, the Khammouane lanterns were made from the cans of energy drinks. Picture E, shows the modern and on-land illuminated boats that were set alight and floated on the river together. The modern illuminated boats are large in size, decorated with a dazzling array of the animated scenes and more neatly designed than the ancient ones. Picture F, shows the shape and form of the modern illuminated boats in Khammouane province, Lao PDR.
C
D
E
F
A
B

ISSN 2039-9340 Mediterranean Journal of Social Sciences Vol. 3 (11) November 2012
303
Development of Hospital Environmental Management Model through PAIC Process
Nipaporn Jongwutiwes
Department of Environmental Education
Faculty of Environment and Resource Studies Mahasarakham University, Mahasarakham 44150, Thailand
Nongnapas Thiengkamol
Major Advisor, Department of Environmental Education
Faculty of Environment and Resource Studies Mahasarakham University, Mahasarakham 44150, Thailand
Email: [email protected]
Tanarat Thiengkamol
Co- Advisor, School of Management, Assumption University, Hua Mak Campus, 592/3 Ramkhamhaeng 24,
Hua Mak, Bangkok 10240, Thailand
Doi:10.5901/mjss.2012.v3n11p303 Abstract:The most importance of hospital environmental management must be pay attention on worker behavior in their everyday practicing at hospital. Therefore, the most rapid and cheapest mean is to challenge the worker to collaborate energy effectively utilization, waste management, wastewater management and landscape architectural environment via the human resource strengthening with the worker based on the concept positive thinking like as owner. Environmental education concept is pertinent to sustainable principles that covers knowledge and understanding, awareness, attitudes, values, and belief, responsibility, participation, and skill necessary to build a sustainable hospital management. The objective of this research was to develop hospital environmental management in Roi-Et Province through PAIC Process. The integrative research will be done with quantitative in terms of survey research and participatory action research with Participatory Appreciate-Influence-Control technique (PAIC) ) and qualitative focus group discussion. Populations are all hospital workers. The sample was selected according to purposive sampling technique. The PAIC was implemented with hospital workers integrating with SWOT Analysis and brain storming in the process. During training, Three Dimensional Evaluation (TDE) covers self-evaluation, friend-evaluation, and facilitator evaluation. One -Way-ANOVA, and t-test were used for data analysis. The research results illustrated that before and after PAIC process implemented, the mean scores of posttest of knowledge of environmental education principles, energy conservation, waste water management, solid and infectious waste management, green landscape and training achievement were higher than pretest with statistical significance (p< .01, p< .01, p< .01, p< .01, p< .01, and p< .01 ). Three Dimensional Evaluations were employed for determination the perceptions of 32 hospital workers in three aspects evaluation covering Self-evaluation, Friend-evaluation, and Facilitator-evaluation by using One-way ANOVA in order to investigate the participation of hospital workers showed that there were no difference of mean scores about participation in training process through brain storming with statistical significance (p>.05). Key Words: Development / Hospital /Environmental Management / PAIC Process 1. Introduction Environment and development are the conflict philosophies but human beings can not escape from the real situations that are facing in the present, therefore, we must take the responsibilities of our activities in daily living that cause the environmental problem. In order to solve environmental together with real participation, we would overcome the noise pollution, air pollution, land degradation, fresh water shortage for consumption, deforestation, solid waste accumulation, toxic chemicals, and hazardous wastes, increased of green house gases that are important factors of global climate change and ozone depletion in stratosphere atmosphere including degrading of non-renewable natural resources with

ISSN 2039-9340 Mediterranean Journal of Social Sciences Vol. 3 (11) November 2012
304
rapid rate. In addition, loss of biodiversity affects to balance of Ecosystem. These environmental problems have impacted to whole biosphere because one thing changes and then affects to others like as chain reaction (Thiengkamol, 2011e). In accordance with the population growth, the more population grow the more poverties are because of the imbalance of equality in change of income gaining, it builds pressures to natural resources. The United Nations, predicted that in the last half of twenty first century, ninth of tenth of world population would be in the poorest countries of the world. Those poor people will lack of fresh water for consumption including lacking of other natural resources. The unstable status of agriculturists, the chance of dearth will occur together with natural resource degradation due to soil erosion (Thiengkamol, 2011e). This extends the gap between the rich and the poor wider. Even though, the cost of health care is also higher, consequently the high rate of death in some region of the world. The attempt to overcome the poverty through the birth control is not really successful because most of poor people often lack of knowledge due to illiteracy (Thiengkamol, 2011e). Currently, the situation of pollutions, the pollutants are released and accumulated in the environment such as heavy metal in the water resources or toxic gases in the air. These cause the deprivation of environmental quality to affect to human health and life and other living organism. The environmental diseases become more vigorous at present. Such as lead toxicity, silicosis from construction activity, flu occurred from air pollution, headache, cancer, migraine, heart disease, and skin disease are commonly found in people who lived in the degraded environment (Thiengkamol, 2011e). The decrements of waste and toxic substances in the environment are important parts to effectively maintain environment and natural resources, therefore, it is essential to give knowledge and understanding and to raise awareness and public consciousness for everyone to participate in waste decreasing by recycling and toxic substance decreasing, particularly, Thailand as agricultural country, the agriculturists should minimize to use insecticide, herbicide, and pesticide because it is obviously seen from heath reports that numerous people got health problems of liver cancer and other toxicity disease due to the utilization of these chemical substances (Thiengkamol, 2011e). The meaning of “Environmental Management” was given by Zhongsuntharawong (Zhongsuntharawong, 2003), that referred to the process of work plan arrangement or activity to allocate the utilization of natural resources in order to respond the requirement of human being to accomplish the highest goal of development. It is a stability of economic, social and maintenance of good environmental quality based on the principle of maximization of utilization with sustainability and caused a less damage to environment as most as possible. Punjasuwan, J., (2005), compiled and gathered the meaning of “Environmental Management” that referred to method of implementation or way of practice systemically for sustaining environment as long as possible through prevention, conservation, and improvement to maintain the good environment. He also suggested that the best way of natural resources and environmental management is prevention, which is process or action to diminish and eliminate the environmental impact before causing damage to humans. EPA New England, issued check list of hospital environmental assessment in accordance with the different acts such as Resource Conservation and Recovery Act, Clean Air Act, Federal Insecticide, Fungicide & Rodenticide Act, Clean Water Act, Toxic and Substances Control Act. In addition, solid waste with recycling concept, toxic waste and infectious waste management, energy and water conservation, and environmental topic training courses for workers such as general compliance, Clean Air Act (CAA), solid waste recycling, energy management systems, Resource Conservation and Recovery Act- hazardous waste (RCRA), Spill Prevention Control Countermeasure Plans (SPCC), red bag waste reduction, energy conservation, universal waste, EPA Audit Program, resource management, green buildings, mercury, water conservation, Environmental Management System (EMS), Integrated Pest Management, and green purchasing also are paid attention as well (EPA, 2004) . In during 5 decades of social and economic development of Thailand, governments announced different policies of environmental quality promotion and maintenance to prevent and solve the environmental problem but there is only governmental sector took the role but it lacked of real participation of all sectors, especially the people participation. Therefore, it might be needed to give environmental conservation knowledge through all systems of educations covering formal, non-formal, informal and lifelong education process based on concepts of environmental education that included lacked of knowledge and understanding, awareness, consciousness, attitude and belief to practice themselves towards environment and natural resource protection because they do not realize that they are an important part to take a responsibility for natural resource and environmental conservation (Thiengkamol, 2011e). In Thailand, there is having no specific for hospital environmental management (HEM) clearly but some of them applied the Theoretically, ISO 14001 could serve as a comprehensive framework for significantly improving performance in an organization with minimal environmental management capacity, especially according to legal compliance or as a set of common sense guidelines for enhancing performance in an organization to effectively implement for environmental quality maintenance for well being of human. The most common of environmental problems included 6 aspects including

ISSN 2039-9340 Mediterranean Journal of Social Sciences Vol. 3 (11) November 2012
305
energy consumption, waste water management, solid waste management, green area increment, safety, and facilities (Wattanasaroch, & Thiengkamol, 2012). Therefore, the environmental education principle for hospital workers should be introduced to them to practice until it becomes a part of their habit in daily living. In order to educate people to gain more knowledge and understanding on natural resource and environmental conservation, it need to use environmental education process through Participatory-Appreciation-Influence-Control (PAIC) training technique, which comprises of the similar features in terms of stimulation of awareness and consciousness raising, attitude and practice changing, inspiration on and public mind creation and participation through the focus group discussion and brain storming process integrating during PAIC training process implementation. Hospital environmental management, it also required the knowledge of HEM based on principle of environmental management system and environmental education principle to integrate into the training process of PAIC in order to meet the better practice and behavior of environmental conservation (Thiengkamol, 2010b, Thiengkamol, 2011a, Thiengkamol, 2011e, Thiengkamol, 2011g, Thiengkamol, 2011h, Thiengkamol, 2012, & Arunsrimorakot, 2005). Even though, Roi-ed Thonburi Hospital is operated with ISO 14000 but the most importance of hospital environmental management must be pay attention on worker behavior in their everyday practicing at hospital. Therefore, the most rapid and cheapest mean is to challenge the worker to collaborate energy effectively utilization, waste management, wastewater management and landscape architectural environment via the human resource strengthening with the worker based on the concept positive thinking like as owner. Environmental education concept is pertinent to sustainable principles that cover knowledge and understanding, awareness, attitudes, values, belief, responsibility, participation, and skill to make proper decision for solving the facing environmental problem correctly and repeatedly until it becomes permanent behavior in everyday living that leads to successful management to build a sustainable hospital management with minimization of energy and water utilization and management of waste water and solid with effectiveness and safety including get rid of risk and increasing security for patient and workers (Thiengkamol, N., 2010, Thiengkamol, N., 2011a, & Thiengkamol, N., 2011b).
2. Objective The objective of this research was to develop hospital environmental management in Roi-Et Province through PAIC Process. 3. Methodology The research design was implemented in steps by step as follows: Construction of handbook for water conservation through environmental education principles including knowledge and understanding of environmental behavior, waste water management, solid and infectious waste management, energy conservation, green landscape and security management (Charoensilpa, & Thiengkamol, 2012, UNESCO, 1978, InWent-DSE-ZEL, 2002, Thiengkamol, 2004, Thiengkamol, 2009a, Thiengkamol, 2009b, Thiengkamol, 2011a, Thiengkamol, 2011e, & Wattanasaroch, & Thiengkamol, 2012). 2) The research tools composed of test, questionnaire and evaluation form. The test was used for determining their knowledge and understanding of environmental behavior, waste water management, solid and infectious waste management, energy conservation, green landscape and security management. 3) The evaluation form of Three Dimensions, Four Dimensions were constructed to assess the participant practice during PAIC implemented. 4) 32 hospital workers were selected with purposive sampling from workers of Roi-ed Thonburi Hospital. They would be recruited according to the setting criteria (willingness, time, devotion, commitment, and participation). 5) The 32 participants were employed for testing of environmental education principles including knowledge and understanding of environmental behavior, waste water management, solid and infectious waste management, energy conservation, green landscape and security management. The systematic operation of 32 participants were trained with PAIC. The focus group discussion included brain storming and Training of Trainer (TOT) (Langly, 1998, Weiss, 1993, Sproull, 1988, InWent-DSE-ZEL., 2002, Thiengkamol, 2004, Thiengkamol, 2005b). The Three Dimensional Evaluation (TDE) was used to determination the congruence of three aspects evaluation, Self-evaluation, Friend-evaluation, and Facilitator-evaluation for training participation (Thiengkamol, 2004, Thiengkamol, 2005a, Thiengkamol, 2008, Thiengkamol, 2011a, Thiengkamol, 2011b, Thiengkamol, 2011c and Thiengkamol, 2011e).

ISSN 2039-9340 Mediterranean Journal of Social Sciences Vol. 3 (11) November 2012
306
4. Results 4.1 General Characteristics of Sample Group The sample group of this study was 32 hospital workers that were selected by purposive sampling technique from hospital workers of Roi-ed Thonburi Hospital. The selected sample was workers who were interested in environmental conservation activities. Most of them were female with 78.12%, studied at high school level with 75.00% , work position as nurse aid with 46.87%, marriage status with 71.88%, average of age with 30.62 years and average of work duration with 5.56 years as shown in table 1. Table 1 Demographic Characteristics of Sample Group
Characteristics
Hospital Worker
Frequency Percent Sex Male Female
7 25
21.88 78.12
Education Level Primary School Level Secondary School Level High School Level Bachelor Higher than Bachelor
1 3 24 4 0
3.12 9.38 75.00 12.5 0
Work Position Nurse Nurse Aid Receptionist Account Labor Worker
4 15 3 2 8
12.5 46.87 9.38 6.25 25.0
Marital Status Marriage Single Divorce/Separate/widow
23 7 2
71.88 21.87 6.25
Average of age = 30.62 years Average of work duration = 5.56
Total 32 100
4.2 Results of Pretest and Posttest with PAIC technique PAIC technique was trained for hospital workers about knowledge of water conservation. The research results revealed that before and after PAIC training process implemented, the mean scores of posttest knowledge of environmental education principles, energy conservation, waste water management, solid and infectious waste management, green landscape and training achievement were higher than pretest with statistical significance (p< .01, p< .01, p< .01, p< .01, p< .01, and p< .01,), as illustrated in table 2.
Table 2 Pretest and Posttest of Sample Group
Experimental Group Number Mean S.D t Sig Pretest of Knowledge of EE 32 5.65 0.55 3.458 .00**
Posttest of Knowledge of EE 32 6.09 0.39
Pretest of Energy Conservation 32 3.06 0.99 3.749 .00**
Posttest of Energy Conservation 32 3.78 0.42
Pretest of Waste Water Management 32 2.59 0.79 9.188 .00** Posttest of Waste Water Management 32 3.94 0.25

ISSN 2039-9340 Mediterranean Journal of Social Sciences Vol. 3 (11) November 2012
307
Pretest of Solid and Infectious Waste Management
32 3.00 1.01 4.605 .00**
Posttest of Solid Infectious Waste Management
32 3.81 0.59
Pretest of Green Landscape and Security Management
32 4.06 0.91 4.190 .00**
Posttest of Green Landscape and Security Management
32 4.91 0.53
Pretest of Training Achievement 32 18.37 2.72 8.742 .00**
Posttest of Training Achievement 32 22.53 1.04
** Significant Level at .01 4.3 Results of Three Dimensional Evaluations for Participation Three Dimensional Evaluations were employed for determination the perceptions of 34 hospital workers in three aspects evaluation, Self-evaluation, Friend-evaluation, and Facilitator-evaluation by using One-way ANOVA in order to investigate the mean scores difference of three group. The results of One-way ANOVA showed that there were different of mean scores about participation in training process through brain storming with statistical significance (p>.05) as illustrated in table 3. This meant that the perceptions of hospital workers about themselves, their friends in the group and their facilitators were no different for their participation during the focus group discussion during training process as presented in table 3. Table 3 Three Dimension Evaluation of Sample Group Participation
Source of Variation Sum of squares df Mean Square F Sig.
Between Group Within Group Total
44.771 961.719 1006.490
2 93 95
22.385 10.341
2.165 .121
** Significant Level at .01 TDE was used to evaluate the participation of participant, the finding revealed that the mean scores of Self-Evaluation and Friend-Evaluation, Friend Evaluation and Facilitator Evaluation, and Self-Evaluation and Facilitator-Evaluation showed no statistical difference , and between showed statistical difference (p>.05, p>.05, and p>.05) respectively as illustrated in table 4. Table 4 Scheffe’ Analysis of Each Pair Comparisons
Each Pair of Variables Mean Diff(I-J)
Std. Error
Sig.
95% Confidence Interval
Lower Bound Upper Bound
Self-Eva. and Friend-Eva. -.62500 .80394 .740 -2.6250 1.3750 Self-Eva. and Facilitator-Eva. -1.65625 .80394 .126 -3.6562 .3437 Friend-Eva. and Facilitator-Eva. -1.03125 .80394 .422 -3.0312 .9687
* Significant Level at .05 Considering on mean scores of Three Dimensional Evaluation, the total mean scores of 5 aspects of evaluation items covering Participation in Asking Questions, Participation Asking Questions, Participation in Discussing, Participation in Activity Doing, and Participation in Activity Evaluating during focus group discussion with brain storming process, the findings discovered that 5 aspects of participations and total mean scores of Self Evaluation were lower than Friend Evaluation and Facilitator Evaluation as presented in table 5. Therefore One-Way ANOVA was employed to analyze the differences of mean scores of three aspects, it was found that there were no difference with statistically significant at level of .05 as presented in table 4.

ISSN 2039-9340 Mediterranean Journal of Social Sciences Vol. 3 (11) November 2012
308
Table 5 Mean Scores of Three Dimensional Evaluations
Evaluation Items Self Evaluation Friend Evaluation Facilitator Evaluation
X S.D. Level X S.D
Level X S.D Level
1. Participation in Asking Questions 3.79 .66 high 3.9 .64 high 4.04 .68 high 2. Participation Asking Questions 3.82 .66 high 3.98 .72 high 3.98 .69 high
3. Participation in Discussing 3.98 .72 high 4.15 .69 high 4.23 .56 high 4. Participation in Activity Doing 4.15 .74 high 4.16 .66 high 4.18 .55 high
5. Participation in Activity Evaluating
4.12 .59 high 4.23 .63 high 4.02 .72 high
Total 3.97 .62 high 4.08 .64 high 4.09 .42 high
5. Discussions The results indicated that the hospital workers had knowledge of water conservation through environmental education process covered knowledge and performance of environmental education, global warming, environmental education characteristics, inspiration of environmental conservation and environmental behavior after participating in the PAIC training. These were congruent to a variety of studies of Thiengkamol, N., (2004, 2005a, 2005b, 2010b, 2011b, 2011c, 2011g, 2011h, 2011i: in press & 2012). It might be explained that the training with PAIC technique is able to raise knowledge in various issues and for different target groups and it can be used for stimulation the knowledge and understanding of environmental behavior, waste water management, solid and infectious waste management, energy conservation, green landscape and security management after participating in the PAIC training through genuine practicing behavior in their daily life activities for environmental conservation. The findings are also pertinent to the results from the study of to different studies of Thiengkamol, and Thiengkamol colleagues (2004, 2005a, 2005b, 2010b, 2011b,2011c, & 2011a) and researches of Sukwat, & Thiengkamol, 2012, & Wattanasaroch, & Thiengkamol, 2012, & Jumrearnsan, & Thiengkamol, 2012 that the participation is affected HEM to meet sustainable development through environmental education process covered knowledge and understanding of environmental behavior, waste water management, solid and infectious waste management, energy conservation, green landscape and security management. The results of TDE of 32 participants were employed for determination of the congruence of three aspects evaluation, Self-evaluation, Friend-evaluation, and Facilitator-evaluation. The mean scores three aspects were no difference among three aspects (p>.05, p>.05, and p>.05). The mean scores of Self-Evaluation was lower than mean scores of Friend-Evaluation and Facilitator-Evaluation, so it indicated that the participants evaluated themselves lower than friend and facilitator because they are humble persons that are general style of Thai children. Additionally, TDE was used to evaluate the participation of secondary school students, it was found that the mean scores of Self Evaluation, Friend Evaluation and Facilitator Evaluation were at high level as illustrated in table 5. It might be concluded that hospital workers during training process as illustrated in table 5 paid attention for training process participation at very good level. The result of training was pertinent to different studies of Thiengkamol, (2004, 2005a, 2005b, 2010b, 2011b,2011c, & 2011a) and researches of and Thiengkamol colleagues such as Sukwat, & Thiengkamol, 2012, & Wattanasaroch, & Thiengkamol, 2012. Furthermore, it was found that PAIC training is effective for training with integration of brain storming process to develop a shared vision, action plan and projects in different issues of training such as energy conservation, urban community food security management, environment and natural resource conservation, development of health cities network for Mekong Region, development of women’s political participation in Pattaya City, community strengthening, environmental management in dormitory, and soil and water conservation (Thiengkamol, 2004, Thiengkamol, 2005a, Thiengkamol, 2005b, Thiengkamol, 2010b, Thiengkamol, 2011b, Thiengkamol, 2011a, Wattanasaroch, & Thiengkamol, 2012, & Sukwat, & Thiengkamol, 2012). During, the PAIC training implemented, focus groups discussion and brain storming were integrated, therefore, it is obviously seen that after training they had intended to run 4 pilot projects from 6 projects. They search the way to maintain the four pilot projects with different ideas being suggested during this brain storming process in order to meet their intentions of water conservation to prevent fresh water shortage and in order to alleviate global warming, especially in accordance with the action plan of “Energy Conservation” across the Northeastern region. The four pilot projects including the first project was “Monitoring Waste Water Management”, the second project was “Monitoring Infectious Waste Management”, the third project was “Build Green Landscape” and the fourth was “Training for Risk Prevention”.

ISSN 2039-9340 Mediterranean Journal of Social Sciences Vol. 3 (11) November 2012
309
Additionally, the result was congruent to numerous studies of Thiengkamol, (2005a, 2005b, 2010b, 2011b, 2011c), and Thiengkamol colleagues Wattanasaroch, & Thiengkamol, 2012, Sukwat, & Thiengkamol, 2012, Jumrearnsan, & Thiengkamol, 2012, Saenpakdee, & Thiengkamol, 2012, Sukserm, & Thiengkamol, 2012, and study of Jansab, 2006.
References Arunsrimorakot, S. (2005). Development of Document of Environmental Management ISO14001: 2004 for Industrial Factory. Faculty of
Environment and Resource Studies. Mahidol Unviversity, Nakhon Prathom Province Bicknell, J., D. Dodman, et al., Eds. (2009). Adapting Cities to Climate Change: understanding and addressing the development
challenges. London: Earthscan. Bindoff et al. (2007). Chapter 5, Introductory Remarks. Retrieved fromhttp://en.wikipedia.org/wiki/Current_sea_ level_rise#
CITEREFIPCC_AR4_WG12007 Charoensilpa, D. and Thiengkamol, N. (2011: in press). Development of Environmental Education Characteristics. Journal of the Social
Sciences. EPA New England. (2004). Hospital Environmental Assessment Template:An environmental compliance and pollution prevention tool.
Retrieved from http://www.epa.gov/region1/healthcare/pdfs/EPAHospitalTool.pdf InWent-DSE-ZEL. (2002). Regional Training Course “Advanced Training of Trainer”. Grand Jomtien Palace. Pattaya City. Thailand. Jansab, S. (2006). Strategies for the Development of Women’s Political Participation in Pattaya City. Thesis of Master of Art Master of
Art (Women Studies), Office of Women and Youth Studies of Thammasart University. Jumrearnsan, W., & Thiengkamol, N. (2012). Development of an Environmental Education Model for Global Warming Alleviation. The
Social Sciences, 7: 65-70. Langly, A. (1998). “The Roles of Formal Strategic Planning” Long Range Planning. Vol. 21, No.1. Pimdee, P., Thiengkamol N,, Thiengkamol T., (2012) Psychological Trait and Situation Affecting through Inspiration of Public Mind to
Energy Conservation Behavior of Undergraduate Student, Mediterranean Journal of Social Sciences Vol 3 (3) Punjasuwan, J. (2005). Management of Natural Resources and Environment. Bangkok: Odean Store. Saenpakdee, A. & Thiengkamol, N. (2012). Formulation of Community Forest Act for Thailand. The Social Sciences, 7: 71-76. Sproull, N.L. (1995). Handbook of Research Method: A Guide for Practitioners and Scientific teachers in the Social Science. (2nd ed.).
Metuchen, NJ: Scarecrow Press. Sukwat, S., & Thiengkamol, N. (2012). Development of Prototype of Young Buddhist Environmental Education. The Social Sciences, 7:
56-60. Sukserm, T., & Thiengkamol, N. (2012). Development of the Ecotourism Management Model for Forest Park. The Social Sciences, 7:
95-99. Sutayasue, U. ( 2010). Global Warming. Retrieved fro http://www.thaigoodview.com/library/teachershow/usa_ s/global_Warming
/aboutme.httm Thiengkamol, N. (2004). Development of A Learning Network Model for Energy Conservation. Doctoral Dissertation of Education
(Environmental Education) Faculty of Graduate Studies, Mahidol University, Thailand. Thiengkamol, N. (2005a). Strengthening Community Capability through The Learning Network Model for Energy Conservation. Journal
of Population and Social Studies, 14 (1), 27-46. Thiengkamol, N. (2005b). Development of Health Cities Network for Mekong Region. In Proceedings of the International Conference
“Transborder Issues in the Grate Mekong Sub-Region” Ubon Ratchathani, Thailand, 30 June-2 July 2005 (pp.111-119). Ubol Ratchathani: Nevada Grand Hotel.
Thiengkamol, N. (2009a). The Great Philosopher: the Scientist only know but Intuitioner is Lord Buddha. Bangkok: Prachya Publication. Thiengkamol, N. (2009b). The Happiness and the Genius can be Created before Born. Bangkok: Prachya Publication. Thiengkamol, N. (2010b). Urban Community Development with Food Security Management: A Case of Bang Sue District in Bangkok.
Journal of the Association of Researcher, 15 (2), 109-117. Thiengkamol, N. (2011a). Holistically Integrative Research (2nd ed.). Bangkok: Chulalongkorn University Press. Thiengkamol, N. (2011b). Development of Energy Security Management Model for Rural Community through Environmental Education Process. In Proceedings of the 1st EnvironmentAsia International Conference on
“Environmental Supporting in Food and Energy Security: Crisis and Opportunity” Bangkok, Thailand, 22-25 March 2011 (pp.11). Bangkok: Rama Garden Hotel.
Thiengkamol, N. (2011c). Development of Food Security Management Model for Undergraduate Student Mahasarakham University through Environmental Education Process. In Proceedings of the 1st EnvironmentAsia International Conference on “Environmental Supporting in Food and Energy Security: Crisis and Opportunity” Bangkok, Thailand, 22-25 March 2011 (pp.12). Bangkok: Rama Garden Hotel.
Thiengkamol, N. (2011e). Environment and Development Book. (4th ed.).Bangkok: Chulalongkorn University Press. Thiengkamol, N. (2011f). Nurture Children to be Doctors. Bangkok: INTELLUALS. Thiengkamol, N. (2011g). Development of Energy Security Management for Rural Community. Canadian Social Science, 7 (5), October
31, 2011. Thiengkamol, N. (2011h). Development of a Food Security Management Model forAgricultural Community. Canadian Social Science, 7
(5), October 31, 2011.

ISSN 2039-9340 Mediterranean Journal of Social Sciences Vol. 3 (11) November 2012
310
Thiengkamol, N. (2012). Development of a Prototype of Environmental Education Volunteer. The Social Sciences, 7: 77-82. Thiengkamol, N. (2011i: in press). Development of Food Security Management for Undergraduate Student Mahasarakham University.
EUROJOURNALS. The Royal Society. (2005). “A guide to facts and fictions about climate change”. Retrieved from
ttp://royalsociety.org/uploadedFiles/Royal_Society_Content/News_and_Issues/Science_Issues/Climate_change/climate_facts_and_fictions.pdf
Wattanasaroch, K. and Thiengkamol, N. (2011). Training ISO 14001 to Develop Green Dormitory for Mahasarakham University. Process. In Proceedings of the 1st EnvironmentAsia International Conference on “Environmental Supporting in Food and Energy Security: Crisis and Opportunity” Bangkok, Thailand, 22-25 March 2011 (pp.12). Bangkok: Rama Garden Hotel.
UNESCO. (1978). Intergovernmental Conference on Environmental Education Organized by UNESCO in Cooperation with UNEP Tbilisi (USSR) 14-16 October1977. Final Reports. Paris: UNESCO.
Weiss, J. W. (1995). Organizational Behavior and Change: Managing Diversity, Cross Cultural Dynamics and Ethics. Anaheim, CA: West Publishers.
Zhongsuntharawong, C. (2003). Human and Environment. Bangkok: Chulalongkorn University Press.

ISSN 2039-9340 Mediterranean Journal of Social Sciences Vol. 3 (11) November 2012
311
Development of Food Security Management Model through PAIC Process
Kruemas Tumpracha
Department of Environmental Education
Faculty of Environment and Resource Studies Mahasarakham University, Mahasarakham 44150, Thailand
Nongnapas Thiengkamol
Major Advisor, Department of Environmental Education
Faculty of Environment and Resource Studies Mahasarakham University, Mahasarakham 44150, Thailand
Chatchai Thiengkamol
Co- Advisor, Director of Research In Motion Co., Ltd.
Bangkok 10900, Thailand
Doi:10.5901/mjss.2012.v3n11p311 Abstract: During the past few decades, Thailand has agricultural development policy that has emphasized on the nation’s food security and export income. It is also a food surplus country at the macro level, but at the household level remains a problem in food security. According FAO, food security refers availability, accessibility and utilization, especially, nutritional knowledge and understanding. But in the educational institute like as school, it should pay attention to quantity, quality, safety, and good taste which is the concept Ministry of Public Health of Thailand. Therefore, the upper secondary school students in Northeastern Region, lack of nutritional knowledge, attitude, awareness, value and behavior. The objective of this research was to develop food security management model for upper secondary school student.The integrative method research was done participatory action research with Participatory Appreciate-Influence-Control technique (PAIC) and qualitative with focus group discussion. Populations were upper secondary school students of academic year 2012 of Kalasin Province. The sample was selected according to purposive sampling technique. The questionnaire and evaluation forms were be used as tool for data collection. PAIC was implemented with the integration of SWOT analysis and brain storming during the training process. One -Way-ANOVA, and t-test were used for data analysis. The research results illustrated that before and after PAIC process implemented, the mean scores of posttest of environmental education process covered knowledge of food security management, nutritional knowledge, proper consumption behavior, and training achievement were higher than pretest with statistical significance (p< .01, p< .01, p< .01, and p< .01). Three Dimensional Evaluation was employed for determination the perceptions of 48 upper secondary school students in three aspects evaluation of Self-evaluation, Friend-evaluation, and Facilitator-evaluation by using One-way ANOVA in order to investigate the participation of upper secondary school students showed that there were no difference of mean scores about participation in training process through brain storming with statistical significance (p>.05). Key Words: Food Security Management / PAIC Process 1. Introduction According to the United Nations Food and Agriculture Organization’s (FAO’s) widely accepted definition, “Food security” means that food is available at all times; that all persons have means of access to it; that it is nutritionally adequate in terms of quantity, quality and variety; and that it is acceptable within the given culture. Only when all these conditions are in place can a population be considered “food secure.” In addition to, food security may be defined as access by all people at all times to the food required for a healthy life; at the household level, at issue is the household’s ability to secure enough food to ensure adequate dietary intake for all of its members (Von Braun et al., 1993). The concept of food security has been undergoing an evolutionary change during the last 50 years. In the 1950s, food security was considered essentially in terms of production. It was assumed that adequate production would assure

ISSN 2039-9340 Mediterranean Journal of Social Sciences Vol. 3 (11) November 2012
312
adequate availability of food in the market as well as in the household. In the 1970s, it became clear that availability alone did not lead to food security, since those who lacked purchasing power were not able to have access to balanced diets. Purchasing power again is related to jobs or livelihood opportunities. Moreover, recently, it is becoming evidence that even if availability and access are satisfactory, the biological absorption of food in the body is related to the consumption of clean drinking water as well as to environmental hygiene, primary health care and primary education. Additionally, there are micro and macro issues cause food insecurity such as political instability, poor economic government, poverty, and lack of sustainable household income (GECAFS, 2008).
Despite remarkable success in economic growth and poverty reduction in Asia, many Asia-Pacific countries have faced with problems of food insecurity. During 2003-2005, 541.9 million people in this region were undernourished even through many countries do have policies for ensuring an adequate availability of basic food products, particularly staple food grains. Each country in the region has enhanced food accessibility with minimum food requirement at the household level (FAO, 2009, & Thiengkamol, 2009c).
Over the last 50 years, the main global food issues have been famine, chronic hunger and protein-energy malnutrition (PEM). These problems interact with other problems and, as they retreat, expose new problems. Hence, attention is paid increasingly to nutrition security. Although undernourishment still contributes to the deaths of 6 million children each year, other goals cannot be brushed aside: anemia increases the mortality risk for more than 1.5 billion people worldwide; obesity (Body Mass Index: BMI >27.5) affects about a third of adults in the United States and will help kill at least another third. Paradoxically, nutrition problems of late development, such as obesity, are genetically and behaviorally rooted in those of underdevelopment, such as PEM. Moreover, a growing majority of countries are seriously affected by both sets of problems (FAO, 2001).
Thailand has agricultural development policy based on increases in productivity and incomes is a key driver to achieve national and household food security, moreover export of surplus production for the global food security has also emphasized as well. The production of food in Thailand, particularly rice, has enormously increased far more than the domestic demand therefore the surplus production is exported. While it is a food surplus country at the macro level, food accessibility at the household level remains a problem, particularly remote rural areas (Isvilanonda, & Bunyasiri, 2009, Theingkamol, 2011b; Theingkamol, 2011c , Theingkamol, 2009c).
Food availability and accessibility have been impacted by the global economic crisis, climate change and the expansion at the production of food-fuel crops. Additionally, the rise of global food price in recent years has induced a sharp increase in the domestic food price, causing a high inflation rate, especially, for the poor, food constitutes is considerable as an important portion of expenditure of household income. The high food price and inflation rate directly affect their livelihood status (Isvilanonda, & Bunyasiri, 2009, & Theingkamol, 2009c).
The household food poverty line, on average in 2007 was at 779 baht (22.58 US$)/person/month, or approximately 54 percent of the total poverty line. Using the official food poverty line, it was found that 416,410 people in Thailand or 0.65 percent of the population were affected by food poverty. The problem of food poverty in Thailand is highly concentrated in the rural North and Northeast. Even though the poorest subsistence farmers generally consume more than half of their own production but all their food needs cannot be met by their production. For example, while purchased rice expenditures of the poorest subsistence farmer accounted for 12 percent of total rice expenditures, purchased meat and vegetable expenditures accounted for 92 percent of total meat expenditures and 86 percent of total vegetable expenditures respectively. Overall purchased food expenditures of the poorest subsistence farmers accounted for 59 percent of total food expenditures and 47 percent of the total money income. Where prices of other foods, such as meat increase dramatically relative to staple grains, some farmers cannot afford to purchase what they do not produce (Isvilanonda, & Bunyasiri, 2009).
Considering on food stability, vulnerable households have not accessed to adequate food at all times even though Thailand has action plan to greatly reduced food poverty during 1988-2007. The numbers of people were affected by food poverty increased during 1998-2000 (in the wake of the financial crisis in 1997) and during 2004-2006 because of food price inflation) (Isvilanonda, & Bunyasiri, 2009).
It’s also not clear whether current research on food insecurity reflects students’ experiences. Current research suggests that there are psychological, social and physical consequences of food insecurity. It is not clear whether food insecure students experience these consequences or if there are additional consequences unique to students. There was a research tried to explore the food insecurity experience of postsecondary students in Canada with the research objectives of document the severity of food insecurity in first-time and repeat users, describe the factors that explain the clients’ usage level and identify strategies that Campus Food Bank clients use for coping with food insecurity including describe the relationship between Campus Food Bank clients’ well-being including health and academic performance) and food insecurity (Krista, 2007). This indicated that even though in the developed country, it also has problem of food

ISSN 2039-9340 Mediterranean Journal of Social Sciences Vol. 3 (11) November 2012
313
insecurity that might be due to their consumption behavior or their knowledge and understanding of nutritional component requirement of body.
Therefore, to develop people, especially, new generations to have proper consumption behavior by minimizing ready-to-eat food such as potato chip, fried chicken, fried beef, and unwell cooking, it needs to cultivate them with environmental education process through different channels of educational system whether with Formal Education System, Non-Formal Education System, Informal Education System, and Lifelong Education System (Chotechuan, 2006, & Thiengkamol, 2011e). Particularly, the youths who are students by providing teaching and learning process with various activities to raise their knowledge and understanding, awareness, positive attitude, public consciousness and responsibility for natural resources and environment conservation including water resources, it will lead to success mean of active learning process through brain storming of group dynamic activities. Therefore, it will assist them to aware the importance of food security and it will a good process for attitude and behavior changing to conserve natural resources and environment conservation to meet food security (Thiengkamol, 2011e, UNESCO, 1978, Thiengkamol, 2011g, Thiengkamol, 2011h, Thiengkamol, 2011i, Thiengkamol, 2011j, Thiengkamol, 2012a, &Thiengkamol,2012b).
As mentioned above, particularly, for Northeastern region, most of people prefer to eat unwell cooking beef and fish, the problems of food insecurity, it is because of lacking knowledge and understanding, awareness, positive attitude, public consciousness and responsibility for consumption behavior changing to practice in accordance with awareness of better nutritional composition (Thiengkamol, 2009c, & Thiengkamol, 20111e). Moreover, over consumption without economization by following capitalism concept and materialism, they should turn back to traditional Thai food that contains various herbs and vegetables to meet healthier. This research emphasized on development of food security management through PAIC process for upper secondary school student under the Office of Kalasin Educational Area Zone 24 to encourage them with proper consumption behavior change in their daily living (Thiengkamol, 2011a). 2. Objective The objective of this study was to develop a prototype of food security management model for secondary school student of Kalasin Province through PAIC Process. 3. Methodology The research design was implemented in steps by step as follows: 1) Construction of handbook for food security through environmental education process covered knowledge of food security management, nutritional knowledge, and proper consumption behavior (UNESCO, 1978, InWent-DSE-ZEL, 2002, Thiengkamol, 2004, Thiengkamol, 2009a, Thiengkamol, 2009b, Thiengkamol, 2009c, Thiengkamol, 2011a, Thiengkamol, 2011e). 2) The research tools composed of test, questionnaire and evaluation form. The test was used for determining their environmental education process covered knowledge of food security management, nutritional knowledge, and proper consumption behavior. 3) The evaluation form of Three Dimensions was constructed to assess the participant practice during PAIC implemented. 4) 48 secondary school students were selected with purposive sampling from secondary school students under the Office of Kalasin Educational Area Zone 24. They would be recruited according to the setting criteria (willingness, time, devotion, commitment, and public mind). 5) The 48 participants were employed for testing knowledge of food security management, nutritional knowledge, and proper consumption behavior. The systematic operation of 48 participants was trained with PAIC. The focus group discussion included brain storming and Training of Trainer (TOT) (Langly, 1998, Weiss, 1993, Sproull, 1988, InWent-DSE-ZEL., 2002, Thiengkamol, 2004, Thiengkamol, 2005b). The Three Dimensional Evaluation (TDE) was used to determination the congruence of three aspects evaluation, Self-evaluation, Friend-evaluation, and Facilitator-evaluation for training participation (Thiengkamol, 2004, Thiengkamol, 2005a, Thiengkamol, 2008, Thiengkamol, 2011a, Thiengkamol, 2011b, Thiengkamol, 2011c and Thiengkamol, 2011e).

ISSN 2039-9340 Mediterranean Journal of Social Sciences Vol. 3 (11) November 2012
314
4. Results 4.1. General Characteristics of Sample Group The sample group of this study was 48 secondary school students that were selected by purposive sampling technique from secondary school students under the Office of Kalasin Educational Area Zone 24 in the academic year of 2011. The selected sample was student who were interested in food security management and proper consumption behavior to participate food security management and environment conservation. Most of them were female with 67.67%, studied at level five with 35.42 % as shown in table 1. Table 1 Demographic Characteristics of Sample Group
Characteristics
Secondary School Student
Frequency Percent Sex Male Female
16 32
33.33 67.67
Education Level Level 4 Level 5 Level 6
15 17 16
31.25 35.42 33.33
Total 48 100
4. 2. Results of Pretest and Posttest with PAIC technique PAIC technique was trained for secondary school students about knowledge of water conservation. The research results revealed that before and after PAIC training process implemented, the mean scores of posttest environmental education process covered knowledge of food security management, nutritional knowledge, proper consumption behavior, training achievement were higher than pretest with statistical significance (p< .01, p< .01, p< .01 and p< .01), as illustrated in table 2.
Table 2 Pretest and Posttest of Sample Group
Experimental Group Number Mean S.D t Sig Pretest of Knowledge of Food Security Management 48 15.42 2.65 8.983 .00**
Posttest of Knowledge of Food Security Management 48 19.71 2.75
Pretest of Nutritional Knowledge 48 14.62 2.34 7.888 .00** Posttest of Nutritional Knowledge 48 18.94 2.56
Pretest of Proper Consumption Behavior 48 15.52 3.66 10.123 .00**
Posttest of Proper Consumption Behavior 48 19.23 2.84
Pretest of Training Achievement 48 44.85 3.63 15.656 .00** Posttest of Training Achievement 48 57.68 3.75
** Significant Level at .01 5. Results of Three Dimensional Evaluations for Participation Three Dimensional Evaluations were employed for determination the perceptions of 48 secondary school students in three aspects evaluation, Self-evaluation, Friend-evaluation, and Facilitator-evaluation by using One-way ANOVA in order to investigate the mean scores difference of three group. The results of One-way ANOVA showed that there were different of mean scores about participation in training process through brain storming with statistical significance (p>.05) as illustrated in table 3. This meant that the perceptions of secondary school students about themselves, their friends in

ISSN 2039-9340 Mediterranean Journal of Social Sciences Vol. 3 (11) November 2012
315
the group and their facilitators were no different for their participation during the focus group discussion during training process as presented in table 3. Table 3 Three Dimension Evaluation of Sample Group Participation
Source of Variation Sum of squares df Mean Square F Sig.
Between Group Within Group Total
1.750 53.580 55.330
2 141 143
.875
.380 2.302 .235
** Significant Level at .01 TDE was used to evaluate the participation of participant, the finding revealed that the mean scores of Self-Evaluation and Friend-Evaluation, Friend Evaluation and Facilitator Evaluation, and Self-Evaluation and Facilitator-Evaluation showed no statistical difference , and between showed statistical difference (p>.05, p>.05, and p>.05) respectively as illustrated in table 4. Table 4 Scheffe’ Analysis of Each Pair Comparisons
Each Pair of Variables
Mean Diff(I-J)
Std. Error
Sig.
95% Confidence Interval
Lower Bound
Upper Bound
Self-Eva. and Friend-Eva. -1.25142 .75451 .094 -3.2023 -.1515 Self-Eva. and Facilitator-Eva. -1.81251 .75451 .068 -3.2233 -.2335 Friend-Eva. and Facilitator-Eva. -.56256 .75451 .878 -1.4567 1.2312
* Significant Level at .05 Considering on mean scores of Three Dimensional Evaluation, the total mean scores of 5 aspects of evaluation items covering Participation in Asking Questions, Participation in Answering Questions, Participation in Discussing, Participation in Activity Doing, and Participation in Activity Evaluating during focus group discussion with brain storming process, the findings discovered that 5 aspects of participations and total mean scores of Self Evaluation were slightly lower than Friend Evaluation and Facilitator Evaluation as presented in table 5. Therefore One-Way ANOVA was employed to analyze the differences of mean scores of three aspects, it was found that there were no difference with statistically significant at level of .05 as presented in table 4. Table 5 Mean Scores of Three Dimensional Evaluations
Evaluation Items Self Evaluation Friend Evaluation Facilitator Evaluation
X S.D. Level X S.D
Level X S.D Level
1. Participation in Asking Questions 3.74 .65 high 3.89 .75 high 4.03 .68 high 2.Participation in Answering Questions 3.78 .66 high 3.97 .74 high 3.95 .67 high 3. Participation in Discussing 3.98 .78 high 4.35 .68 high 4.36 .63 high 4. Participation in Activity Doing 4.16 .71 high 4.45 .66 high 4.55 .64 high 5. Participation in Activity Evaluating 4.14 .75 high 4.33 .75 high 4.23 .75 high Total 3.98 .65 high 4.20 .68 high 4.22 .69 high
6. Discussions The results indicated that the upper secondary school students had environmental education process covered knowledge of food security, nutritional knowledge, and proper consumption behavior after participating in the PAIC training. These were congruent to a variety of studies of Thiengkamol, N., (2004, 2005a, 2005b, 2010b, 2011b, 2011c, 2011g, 2011h,

ISSN 2039-9340 Mediterranean Journal of Social Sciences Vol. 3 (11) November 2012
316
2011i, 2011j, 2012a & 2012b). It might be explained that the training with PAIC technique is able to raise knowledge in various issues and for different target groups and it can be used for stimulation the knowledge and performance of environmental education, global warming, environmental education characteristics, inspiration of environmental conservation and environmental behavior after participating in the PAIC training through genuine practicing behavior in their daily life activities for global warming alleviation. The findings are also relevant to the results from the study of to different studies of Thiengkamol, (2004, 2005a, 2005b, 2010b, 2011a, 2011b, 2011g, 2011h, 2012a, 2012b) and researches of Thiengkamol colleague, Sukserm, et al, 2012, Saenpakdee, and Thiengkamol, 2012, Sukwat, et al, 2012, & Wattanasaroch, & Thiengkamol, 2012. Furthermore, it was found that PAIC training is effective for training with integration of brain storming process to develop a shared vision, action plan and projects in different issues of training such as energy conservation, urban community food security management through environmental education process covered knowledge of food security, nutritional knowledge, environment and food.
The results of TDE of 53 participants were employed for determination of the congruence of three aspects evaluation, Self-evaluation, Friend-evaluation, and Facilitator-evaluation. The mean scores three aspects were no difference among three aspects (p>.05, p>.05, and p>.05). The mean scores of Self-Evaluation was lower than mean scores of Friend-Evaluation and Facilitator-Evaluation, so it indicated that the participants evaluated themselves lower than friend and facilitator because they are humble persons that are general style of Thai children. Additionally, TDE was used to evaluate the participation of upper secondary school students, it was found that the mean scores of Self Evaluation, Friend Evaluation and Facilitator Evaluation were at high level as illustrated in table 5. It might be concluded that secondary school students during training process as illustrated in table 5 paid attention for training process participation at very good level. The result of training was pertinent to different studies of Thiengkamol, (2004, 2005a, 2005b, 2010b, 2011b,2011c, & 2011a) and researches of and Thiengkamol colleagues such as Sukwat, & Thiengkamol, 2012, & Wattanasaroch, & Thiengkamol, 2012. Furthermore, it was found that PAIC training is effective for training with integration of brain storming process to develop a shared vision, action plan and projects in different issues of training such as energy conservation, urban community food security management, environment and natural resource conservation, development of health cities network for Mekong Region, development of women’s political participation in Pattaya City, community strengthening, environmental management in dormitory, and soil and water conservation (Thiengkamol, 2004, Thiengkamol, 2005a, Thiengkamol, 2005b, Thiengkamol, 2010b, Thiengkamol, 2011a, Thiengkamol, 2011b, Wattanasaroch, & Thiengkamol, 2012, & Sukwat, et al, and Thiengkamol, 2012a).
During, the PAIC training implemented, focus groups discussion and brain storming were integrated, therefore, it is obviously seen that after training they had intended to run 4 pilot projects from 6 projects. They search the way to maintain the four pilot projects with different ideas being suggested during this brain storming process in order to meet their intentions of environmental education process covered knowledge of food security, nutritional knowledge, environment and food, especially in accordance with the action plan of “Food Security Management” across the Northeastern region. The four pilot projects including the first project was “Decreasing Junk Food Consumption”, the second project was “Cultivation Plants for Household Consumption”, the third project was “Nutritional Knowledge Transferring” and the fourth was “Better Food Consumption Practice”. Additionally, the result was congruent to different studies of Thiengkamol, (2005a, 2005b, 2010b, 2011b, 2011c, 2011g, 2011h, 2012a and 2012b), and Thiengkamol colleagues, Wattanasaroch, & Thiengkamol, 2012, Sukwat, et al, 2012, Saenpakdee, & Thiengkamol, 2012, Sukserm, et al, & Thiengkamol, 2012, and study of Jansab, 2006.
References
Krista Rondeau, RD. (2007). Hunger on Campus: Understanding Food Insecurity in Post-Secondary Students. MSc Candidate, Centre
for Health Promotion Studies, School of Public Health, University of Alberta, Edmonton, Alberta. Chotechuan, P. (2006). Knowledge on potential carcinogen in ready-to-eat food and Food behaviors secondary school students. Thesis
of Master of Science (Community Health), Faculty of Graduate Studies of Mahidol University. FAO. (2001). The State of Food and Agriculture 2000. Retrieved fromhttp://www.fao.org/docrep/x4400e/x4400e11.htm FAO. (2009). Statistical Year Book. Retrieved from http://www.fao.org/economic/the-statistics-division-ess/publications-studies/statistical-
yearbook/fao-statistical-yearbook-2009/en/ Global Environmental Change and Food Systems (GECAFS). (2008). A food-secure future for those most vulnerable. Retrieved from
http://www.gecafs.org/ Hair, J.F., Anderson, R.E., Tataham, R.L., Black, W.C. (1998).Multivariate Data Analysis. New Jersey : Prentice Hall. InWent-DSE-ZEL. (2002). Regional Training Course “Advanced Training of Trainer”. Grand Jomtien Palace. Pattaya City. Thailand.

ISSN 2039-9340 Mediterranean Journal of Social Sciences Vol. 3 (11) November 2012
317
Isvilanonda, S. and Bunyasiri, I. (2009). Food Security in Thailand: Status, Rural Poor Vulnerability, and Some Policy Options. A paper presented at the international seminar on “Agricultural and Food Policy Reforms: Food Security from the Perspective of Asian Small-scale Farmers” heldin Seoul on 24-28 August 2009.
Jansab, S. (2006). Strategies for the Development of Women’s Political Participation in Pattaya City. Thesis of Master of Art Master of Art (Women Studies), Office of Women and Youth Studies of Thammasart University.
Langly, A. (1998). “The Roles of Formal Strategic Planning” Long Range Planning. Vol. 21, No.1. Office of Natural Resources and Environmental Policy and Planning. (2009). Report the Situation of Environmental Quality. Bangkok:
Bejapol. Pimdee, P., Thiengkamol N,, Thiengkamol T., (2012) Psychological Trait and Situation Affecting through Inspiration of Public Mind to
Energy Conservation Behavior of Undergraduate Student, Mediterranean Journal of Social Sciences Vol 3 (3) Saenpakdee, A. & Thiengkamol, N. (2012). Formulation of Community Forest Act for Thailand. The Social Sciences, 7: 71-76. Sariwat,L. ( 2010). Psychological Work in Community. Bangkok: Se-education Limited. Sproull, N.L. (1995). Handbook of Research Method: A Guide for Practitioners and Scientific teachers in the Social Science. (2nd ed.).
Metuchen, NJ: Scarecrow Press. Saenpakdee, A., and Thiengkamol, N. (2012). Formulation of Community Forest Act for Thailand. Journal of the Social Sciences, 7
(1):71-76. Sukwat, S. Thiengkamol, N., Navanugraha, C. and Thiengkamol, C. (2012). Development of Prototype of Young Buddhist
Environmental Education. Journal of the Social Sciences, 7 (1):56-60. Sukserm, T., Thiengkamol, N., & Thiengkamol, N. (2012). Development of the Ecotourism Management Model for Forest Park. The
Social Sciences, 7: 95-99. Thiengkamol, N. (2004). Development of A Learning Network Model for Energy Conservation. Doctoral Dissertation of Education
(Environmental Education) Faculty of Graduate Studies, Mahidol University, Thailand. Thiengkamol, N. (2005a). Strengthening Community Capability through The Learning Network Model for Energy Conservation. Journal
of Population and Social Studies, 14 (1), 27-46. Thiengkamol, N. (2005b). Development of Health Cities Network for Mekong Region. In Proceedings of the International Conference
“Transborder Issues in the Grate Mekong Sub-Region” Ubon Ratchathani, Thailand, 30 June-2 July 2005 (pp.111-119). Ubol Ratchathani: Nevada Grand Hotel.
Thiengkamol, N. (2009a). Environment and Development Book 2 (Food Security). Bangkok: Chulalongkorn University Press. Thiengkamol, N. (2009b). The Great Philosopher: the Scientist only know but Intuitioner is Lord Buddha. Bangkok: Prachya Publication. Thiengkamol, N. (2009c). The Happiness and the Genius can be Created before Born. Bangkok: Prachya Publication. Thiengkamol, N. (2010b). Urban Community Development with Food Security Management: A Case of Bang Sue District in Bangkok.
Journal of the Association of Researcher, 15 (2), 109-117. Thiengkamol, N. (2011a). Holistically Integrative Research (2nd ed.). Bangkok: Chulalongkorn University Press. Thiengkamol, N. (2011b). Development of Energy Security Management Model for Rural Community through Environmental Education
Process. In Proceedings of the 1st EnvironmentAsia International Conference on “Environmental Supporting in Food and Energy Security: Crisis and Opportunity” Bangkok, Thailand, 22-25 March 2011 (pp.11). Bangkok: Rama Garden Hotel.
Thiengkamol, N. (2011c). Development of Food Security Management Model for Undergraduate Student Mahasarakham University through Environmental Education Process. In Proceedings of the 1st EnvironmentAsia International Conference on “Environmental Supporting in Food and Energy Security: Crisis and Opportunity” Bangkok, Thailand, 22-25 March 2011 (pp.12). Bangkok: Rama Garden Hotel.
Thiengkamol, N. (2011e). Environment and Development Book. (4th ed.).Bangkok: Chulalongkorn University Press. Thiengkamol, N. (2011f). Nurture Children to be Doctors. Bangkok: INTELLUALS. Thiengkamol, N. (2011g). Development of Energy Security Management for Rural Community. Canadian Social Science, 7 (5), October
31, 2011. Thiengkamol, N. (2011h). Development of a Food Security Management Model for Agricultural Community. Canadian Social Science, 7
(5), October 31, 2011. Thiengkamol, N. (2011i). Development of Model of Environmental Education and Inspiration of Public Consciousness Influencing to
Global Warming Alleviation. European Journal of Social Sciences, 25 (4):506-514. Thiengkamol, N. (2011j). Model of Psychological State Affecting to Global Warming Alleviation. Canadian Social Science, 7 (6):89-95,
December 31, 2011 Thiengkamol, .N. (2012a). Development of A Prototype of Environmental Education Volunteer. Journal of the Social Sciences, 7 (1):77-
81. Thiengkamol, N. (2012b). Development of Food Security Management for Undergraduate Student Mahasarakham University. European
Journal of Social Sciences, 27 (2):246-252. UNESCO. (1978). Intergovernmental Conference on Environmental Education Organized by UNESCO in Cooperation with UNEP Tbilisi
(USSR) 14-16 October1977. Final Reports. Paris: UNESCO. Von Braun, J.; McComb, J.; Fred-Mensah, B.K.; Pandya-Lorch, R. (1993). Urban food insecurity and malnutrition in developing
countries. International Food Policy Research Institute, Washington, DC, USA. Wattanasaroch, K. and Thiengkamol, N. (2012). Training ISO 14001 to Develop Green Dormitory Standards. The Social Sciences, 8: 98-
110.

ISSN 2039-9340 Mediterranean Journal of Social Sciences Vol. 3 (11) November 2012
318
Weiss, J. W. (1995). Organizational Behavior and Change: Managing Diversity, Cross Cultural Dynamics and Ethics. Anaheim, CA: West Publishers.

ISSN 2039-9340 Mediterranean Journal of Social Sciences Vol. 3 (11) November 2012
319
Causal Relationship Model of Four Noble Truths
Dr. Nongnapas Thiengkamol
Department of Environmental Education
Faculty of Environment and Resource Studies Mahasarakham University, Mahasarakham 44150, Thailand
Doi:10.5901/mjss.2012.v3n11p319
Abstract: The objective was to propose the structural model of four noble truths affecting to environmental behavior for global warming alleviation through inspiration of public consciousness.The populations were 37,156 undergraduate student of Mahasarakham University in first semester of academic year of 2012. The Multi-stage simple random sampling technique was employed to collect the sample for 400 undergraduate students. The research instrument was the questionnaire and it was used for data collecting. LISREL was used for model verification. Results illustrated that structural model of confirmatory factors of Four Noble Truths (FNT) was able to explain the variation of endogenous factors of Inspiration of Public Consciousness (INS) to caused Environmental Behaviors for Global Warming Alleviation (BEH) with 89.0 percents as following. BEH = 0.45 FNT + 0.53 INS ……………………..(1) (R2 = 0.89) Equation (1) factors that had the most effect to Environmental Behaviors for Global Warming Alleviation (BEH) was Inspiration of Public Consciousness (INS) and subsequence was Four Noble Truths (FNT). These were able to explain the variation of Environmental Behaviors for Global Warming Alleviation (BEH) with 89.00 percents. Key Words: Causal Relationship Model / Four Noble Truths / Inspiration of Public/Consciousness / Environmental Behavior 1. Introduction Global warming is known as seriously environmental issues because the rising in the average temperature of Earth’s atmosphere and oceans is still rapidly persistent. This result is realized by the national science academies of all the major industrialized countries and is not disputed by any scientific body of national or international standing. Particularly, the majority of scientists specify that the warming in current decades has been caused first and foremost by human being activities that have enlarged the amount of greenhouse gases in the atmosphere such as deforestation, fossil fuel combustion and destroyed biodiversity of ocean by over harvesting fishery (United States National Academy of Sciences., 2008, National Research Council of USA., 2010, & Thiengkamol, 2011e).
Currently, environmental information on climate change with global warming has become hot issue for general people who are directly impacted by the earth quake, flood, and drought, furthermore it also affected to natural system, ecological system, biodiversity loss, new vector of disease born, species migration, and so on. However, the environmental problem can’t absolutely separate from individual level. The main of cause is revealed that the people have not enough moral and public consciousness for practicing appropriately environmental behavior including realizing that they take very important parts to adequately take responsibility for conservation of natural resources and environment (Thiengkamol, 2004, Thiengkamol, 2005a, Thiengkamol, 2005b, Thiengkamol, 2011e, Thiengkamol, 2011g, Thiengkamol, 2011h).
The path to the cessation of suffering is the fourth noble truth is middle path the end of suffering that is a gradual path of self-improvement and is described more detailed in the Eightfold Path. It is the middle way between the two extremes of excessive self-indulgence (self-gratification) and excessive self-mortification (simplicity); and it leads to the end of the cycle of rebirth. The last quality distinguishes it from other paths which are merely “wandering on the wheel of becoming”, because these do not have a final object. The path to the end of suffering can extend over many lifetimes, throughout which every individual rebirth is subject to karmic conditioning. Craving, ignorance, delusions, and its effects will disappear gradually, as progress is made on the path. Noble Eightfold Path; that is, right view, right intention or right thought, right speech, right action or behavior, right livelihood, right effort, right mindfulness and right concentration or meditation (Wikipedia, 2012).
Thiengkamol stated that if one is really understand Four Noble Truths, one would live with sufficiency way of life by practice his or her daily activity in careful way of natural resources consumption whether in term of food consumption

ISSN 2039-9340 Mediterranean Journal of Social Sciences Vol. 3 (11) November 2012
320
behavior, energy utilization, waste management, recycling behavior, traveling behavior and knowledge giving behavior to the others. Beside they also concern for every step of living with right view, right thought, right speech, right behavior, right livelihood, right effort, right mindfulness, and right meditation (Thiengkamol, 2009a, & Thiengkamol, 2012e). Particularly, majority of Thai people are Buddhist but because globalization threat during two decades, Thai people also has been trapped the economic development since 1992 of the 7th National Development Plan that government emphasized for economic growth until they faced with economic crisis 1997, therefore they turned back to consider for their root of Buddhism of Middle Paths concept (NESDB, 2004a, NESDB, 2004b, NESDB, 2007, & Thiengkamol, 2007) .
Additionally, the concept of Thai lifestyle with Middle Path of Buddhism was reintroduced to accomplish self-dependent after economic crisis in 1997-1998, particularly, economy sufficiency is aim to living with adequate status according to personal status by adopting the Sufficiency Economy Philosophy from remarks made by His Majesty King Bhumibol Adulyadej throughout his 58 years of the throne (NESDB, 2004a). Sufficiency Economy Philosophy directs the livelihood and behavior of people at all levels, from the family to the community to the country for local and nation development and administration. This perception is identical to “Middle Path” that is one of four Buddhism principles of “Four Noble Truth” for problem solving of Buddhist people. Sufficiency means moderation and reasonableness, together with the need to build a reasonable immune system against shocks from the outside or from the inside. Intellect, consideration, and extreme care should be utilized to assure that all plans and every step of their implementation are based on body of knowledge. Concurrently, they must build up the spiritual underpinning of all people in the nation, predominantly state officials, scholars, and business people at all levels, therefore they are conscious of moral integrity and honesty, for this reason they struggle for the suitable wisdom to live life with tolerance, diligence, self-awareness, intelligence, and contemplation. In conclusion, it should sustain the balance and be ready to manage rapid physical, social, environmental, and cultural changes from the outside world (Krongkaew, 2003, & Thiengkamol, 2007).
Accordingly, Thiengkamol mentioned on public consciousness or public mind based on inspiration from insight and inspiration different from motivation because inspiration needs no rewards. Inspiration of public consciousness or public mind, especially, for natural resources and environment conservation, one doesn’t receive any reward, admiration or complement for ones act for natural resources and environment conservation. Inspiration on might occur due to appreciation in a person as role model or idle, events, situations, environment, media perceived such movies, book, magazine, and internet. (Thiengkamol, 2009a , Thiengkamol, 2009b , Thiengkamol, 2011a, & Thiengkamol, 2011e).
It was obviously seen that there was no research done on environmental behavior for global warming alleviation affecting by Four Noble Truths through inspiration of public consciousness covering person as role model, impressive event, impressive environment, and media perceiving (Thiengkamol, 2011i, Thiengkamol, 2011j, Ruboon, et al, 2012, Pimdee, et al, 2012, & Gonggool, et al, 2012). Presently, it is very seldom and there is no research is holistically integrative conduct on four noble truths when it compared with other aspects of relating factors affecting to environmental behaviors.
Therefore, this research was designed to study by covering all factors relating as mentioned above, it would be able to develop a model of environmental behaviors for global warming alleviation that are affected by four noble truths through inspiration of public consciousness. 2. Objective The objective was to propose the structural model of four noble truths affecting to environmental behavior for global warming alleviation through inspiration of public consciousness. 3. Methodology The research design was implemented in steps by step as follows: 3.1 The populations were 37,156 undergraduate students of the first semester in academic year 2012 of Mahasarakham University. The Multi-stage random sampling was employed to collect 400 students from different faculties of Mahasarakham University. 3.2 The research instrument was the questionnaire and it was used for data collecting. The content and structural validity were determined by Item Objective Congruent (IOC) with 5 experts in the aspects of environmental education, psychology, social science and social research methodology. The reliability was done by collecting the sample group from 50 undergraduate students of Rajabhat Mahasarakham University which is nearby Mahasarakham University. The

ISSN 2039-9340 Mediterranean Journal of Social Sciences Vol. 3 (11) November 2012
321
reliability was determined by Cronbach's Alpha. The reliability of four noble truths, inspiration of public consciousness, environmental behavior and the whole questionnaire were 0.954, 0.962, 0.964 and 0.976 respectively. 3.3 The descriptive statistics used were frequency, percentage, mean and standard deviation. The inferential statistics used was LISREL by considering on Chi-Square value differs from zero with no statistical significant at .05 level or Chi-Square/df value with lesser or equal to 2, P-value with no statistical significant at .05 level and RMSEA (Root Mean Square Error Approximation) value with lesser than 0.05 including index level of model congruent value, GFI (Goodness of Fit Index) and index level of model congruent value, AGFI (Adjust Goodness of Fit Index) between 0.90-1.00. 4. Results 4.1 Results of Confirmatory factors of Exogenous Variables Results of Confirmatory Factor Analysis of Exogenous Variables of Four Noble Truths (FNT) affecting to environmental Behaviors for global warming alleviation (BEH), were revealed as followings. Confirmatory Factor Analysis of Exogenous Variables of Four Noble Truths (FNT) Confirmatory factors of FNT had Bartlett’s test of Sphericity of 1877.339 statistically significant level (p< .01) and Kaiser–Mayer–Olkin Measure of Sampling Adequacy/MSA) of 0.824. This indicated that components of FNT aspect had proper relationship at good level and it can be used for analysis of confirmatory factors as shown in picture 1 and table 1. Picture 1: Model of Confirmatory factors of Four Noble Truths
X1 0.32
X2 0.12
X3 0.12
X4 0.33
X5 0.39
X6 0.57
X7 0.28
X8 0.29
X9 0.32
FNT 1.00
Chi-Square=18.97, df=14, P-value=0.31743, RMSEA=0.035
0.29 0.52 0.64 0.52 0.59 0.82 0.51 0.33 0.61
0.02 -0.16 -0.21
-0.10
0.21
0.09
0.07 0.10
0.12
-0.09 -0.09 -0.07
0.15

ISSN 2039-9340 Mediterranean Journal of Social Sciences Vol. 3 (11) November 2012
322
Table 1 Results of Analysis of Confirmatory factors of Four Noble Truths
Confirmatory factors of Psychological Trait Weight SE t 2R X1 Holistic View FNT 0.28 0.032 18.87** 0.29 X2 Middle Path 1: Right View 0.50 0.026 18.74** 0.56 X3 Middle Path 2: Right Thought 0.55 0.028 16.99** 0.61 X4 Middle Path 3: Right Speech 0.42 0.033 16.77** 0.53 X5 Middle Path 4: Right Behavior 0.67 0.041 15.58** 0.69 X6 Middle Path 5: Right Livelihood 0.81 0.050 16.54** 0.92 X7 Middle Path 6: Right Effort 0.44 0.032 17.84** 0.54 X8 Middle Path 7: Right Mindfulness 0.26 0.031 17.52** 0.29 X9 Middle Path 8: Right Meditation 0.53 0.039 15.57** 0.54 Chi-square = 18.97 df = 14 P = 0. 31743 GFI = 0.99 AGFI = 0.97 RMSEA = 0.035 RMR =0.011
** Statistically significant level of .01 From picture 1 and table 1, results of analysis of confirmatory factors of FNT from 9 observe variables were revealed that the model was congruent to empirical data by considering from 1) Goodness of Fit Index (GFI) equaled to 0.99 and Adjust Goodness of Fit Index (AGFI) equaled to 0.97 2) Root Mean Square Error of Approximation (RMSEA) equaled to 0.035 (RMSEA < 0.05) and 3) Chi- Square value had no statistically significant at level of .01, and Chi- Square value was divided by degree of freedom was lesser than or equaled to 5.00 ( 00.5/2 ≤dfχ ). Considering on loading weight of 9 observed variables in model, it was revealed that observed variables had loading weight with 0.28 to 0.81 and had covariate to model of Four Noble Truths (FNT) with 29.00 to 92.00 percents. 4.2 Results of Confirmatory factors of Endogenous Variables Results of Confirmatory Factors Analysis of Endogenous Variables of Inspiration of Public Consciousness influencing to Environmental Conservation Behaviors was revealed as followings. Confirmatory Factors Analysis of Endogenous Variables of Inspiration of Public Consciousness (INS) Confirmatory Factors of Inspiration of Public Consciousness (INS) had Bartlett’s test of Sphericity of 1280.480 statistically significant level (p< .01) and Kaiser–Mayer–Olkin Measure of Sampling Adequacy/MSA) of 0.846. This indicated that components of Inspiration of Public Consciousness (INS) aspect had proper relationship at good level and it can be used for analysis of confirmatory factors as shown in picture 2 and table 2. Picture 2: Model of Confirmatory factor of Inspiration of Public Consciousness (INS)
Y7 0.15
Y8 0.12
Y9 0.05
Y10 0.12
INS 1.00
Chi-Square=1.84, df=1, P-value=0.17496, RMSEA=0.046
0.60
0.62
0.71
0.62
-0.05

ISSN 2039-9340 Mediterranean Journal of Social Sciences Vol. 3 (11) November 2012
323
Table 2 Results of Analysis of Confirmatory factors of Inspiration of Public Consciousness
Confirmatory factors of Inspiration of Public Consciousness Weight SE t 2R
Y7 Person as Role Model 0.67 0.029 20.39** 0.78 Y8 Impressive Event 0.64 0.030 21.04** 0.76 Y9 Impressive Environment 0.55 0.029 22.34** 0.60 Y10 Media Receiving 0.61 0.028 21.69** 0.75 Chi-square = 1.84 df = 1 P = 0.17496 GFI = 1.00 AGFI = 0.98 RMSEA = 0.046 RMR = .0030
** Statistically significant level of .01 From picture 2 and table 2, results of analysis of confirmatory factors of INS from 4 observed variables was revealed that the model was congruent to empirical data by considering from 1) Goodness of Fit Index (GFI) equaled to 1.00 and Adjust Goodness of Fit Index (AGFI) equaled to 0.98, 2) Root Mean Square Error of Approximation (RMSEA) equaled to 0.046 (RMSEA < 0.05), and 3) Chi- Square value had no statistically significant at level of .01, and Chi- Square value was divided by degree of freedom was lesser than or equaled to 5.00 ( 00.5/2 ≤dfχ ). Considering on loading weight of 4 observed variables in model, it was revealed that observed variables had loading weight with 0.55 to 0.67 and had covariate to model of Inspiration of Public Consciousness (INS) with 60.00 to 78.00 percents. Confirmatory Factors Analysis of Endogenous Variables of Environmental Conservation Behaviors (BEH) Confirmatory Factors of Inspiration of Environmental Conservation Behaviors (BEH) had Bartlett’s test of Sphericity of 1409.304 statistically significant level (p< .01) and Kaiser–Mayer–Olkin Measure of Sampling Adequacy/MSA) of 0.883. This indicated that components of Environmental Conservation Behaviors (ECB) aspect had proper relationship at good level and it can be used for analysis of confirmatory factors as shown in picture 3 and table 3. Picture 3: Model of Confirmatory factors of Environmental Behaviors (BEH)
Y1 0.24
Y2 0.26
Y3 0.15
Y4 0.23
Y5 0.15
Y6 0.21
BEH 1.00
Chi-Square=4.94, df=4, P-value=0.29356, RMSEA=0.024
0.55
0.48
0.51
0.44
0.45
0.62
0.11
-0.04
-0.10
0.06
0.02

ISSN 2039-9340 Mediterranean Journal of Social Sciences Vol. 3 (11) November 2012
324
Table 3 Results of Analysis of Confirmatory factors of Environmental Behaviors
Confirmatory factors of Environmental Behaviors Weight SE t 2R Y1 Consumption Behavior 0.55 0.032 14.45** 0.57 Y2 Energy Conservation Behavior 0.48 0.032 13.75** 0.49 Y3 Recycling Behavior 0.51 0.032 18.89** 0.63 Y4 Waste Management Behavior 0.44 0.032 17.78** 0.52 Y5 Travelling Behavior Y6 Knowledge Transferring for Environmental Conservation
0.45 0.62
0.028 0.028
18.51** 19.03**
0.55 0.65
Chi-square = 4.94 df = 4 P = 0.29356 GFI = 1.00 AGFI = 0.98 RMSEA = 0.024 RMR = 0.0055
** Statistically significant level of .01 From picture 3 and table 3, results of analysis of confirmatory factors of Environmental Behaviors (BEH) from 6 observed variables was revealed that the model was congruent to empirical data by considering from 1) Goodness of Fit Index (GFI) equaled to 1.00 and Adjust Goodness of Fit Index (AGFI) equaled to 98, 2) Root Mean Square Error of Approximation (RMSEA) equaled to 0.000 (RMSEA < 0.05) and 3) Chi- Square value had no statistically significant at level of .01, and Chi- Square value was divided by degree of freedom was lesser than or equaled to 5.00 (
00.5/2 ≤dfχ ). Considering on loading weight of 6 observed variables in model, it was revealed that observed variables had loading weight with 0.44 to 0.62 and had covariate to model of Environmental Behaviors (BEH) with 52.00 to 65.00 percents. 4.3 Results of Effect among Variables in Model in Terms of Direct Effect 1) Confirmatory factors of Four Noble Truths (FNT) had direct effect to Environmental Behaviors for Global Warming Alleviation (BEH) with statistically significant at level of .01 with effect of 0.45. Moreover, confirmatory factors in aspect of Four Noble Truths (FNT) had indirect effect to Environmental Behaviors for Global Warming Alleviation (BEH) with statistically significant at level of .01 with effect of 0.224. 2) Confirmatory factors of Inspiration of Public Consciousness (INS) had direct effect to Environmental Behaviors for Global Warming Alleviation (BEH) with statistically significant at level of .01 with effect of 0.64. 3) Confirmatory factors of Four Noble Truths (FNT) had direct effect to Inspiration of Public Consciousness (INS) with statistically significant at level of .01 with effect of 0.35. 4) Considering on structural model confirmatory factors of Four Noble Truths (FNT) was able to explain the variation of endogenous factors of Inspiration of Public Consciousness (INS) to caused Environmental Behaviors for Global Warming Alleviation (BEH) with 89.0 percents as following. BEH = 0.45 FNT + 0.64 INS ……………………..(1) (R2 = 0.89) Equation (1) factors that had the most effect to Environmental Behaviors for Global Warming Alleviation (BEH) was Inspiration of Public Consciousness (INS), subsequence was Four Noble Truths (FNT). These were able to explain the variation of Environmental Behaviors for Global Warming Alleviation (BEH) with 89.00 percents.

ISSN 2039-9340 Mediterranean Journal of Social Sciences Vol. 3 (11) November 2012
325
Picture 5: Model of Direct and Indirect Effect of FNT through INS Affecting to BEH 5. Discussion The findings indicated that confirmatory factors of Four Noble Truths (FNT) had direct effect to Environmental Behaviors for Global Warming Alleviation (BEH) with statistically significant at level of .01 with effect of 0.35, and had in direct effect to Environmental Behaviors for Global Warming Alleviation (BEH) with statistically significant at level of .01 with effect of 0.45, in direct effect to Environmental Behaviors for Global Warming Alleviation (BEH) with statistically significant at level of .01 with effect of 0.224. Moreover, Four Noble Truths (FNT) had direct effect to Inspiration of Public Consciousness (INS) with statistically significant at level of .01 with effect of 0.35 It might be concluded that Four Noble Truths (FNT) composing of Holistic View FNT (X1), Middle Path 1: Right View (X2), Middle Path 2: Right Thought (X3), Middle Path 3: Right Speech (X4), Middle Path 4: Right Behavior (X5), Middle Path 5: Right Livelihood (X6), Middle Path 6: Right Effort (X7), Middle Path 7: Right Mindfulness (X8), and Middle Path 8: Right Meditation (X9) affecting to Environmental Behavior for Global Warming Alleviation (BEH) covering of Consumption Behavior (Y1), Energy conservation (Y2), Waste disposal (Y3), Travelling Behavior (Y4), Recycling Behavior (Y5), and Knowledge transferring and supporting for environmental conservation (Y6) (Thiengkamol, 2011g, Thiengkamol, 2011h, Thiengkamol, 2011i, Thiengkamol, 2011j, Thiengkamol, 2012b, Thiengkamol, 2012c, & Thiengkamol, 2012d) . The exogenous factors of Four Noble Truths (FNT) were able to explain the variation of endogenous factors of Inspiration of Public Consciousness (INS) to caused Environmental Behaviors for Global Warming Alleviation (BEH) with 89.00 percents. The model of FNT affecting to BEH through INS was verified the proposed model was fitted with all observe variables according to criteria of Chi-Square value differs from zero with no statistical significant at .05 level or Chi-Square/df value with lesser or equal to 2, P-value with no statistical significant at .05 level and RMSEA (Root Mean Square Error Approximation) value with lesser than 0.05 including index level of model congruent value, GFI (Goodness of Fit Index) and index level of model congruent value, AGFI (Adjust Goodness of Fit Index) between 0.90-1.00. Therefore, it might be concluded that Four Nobel Truths play very important roles to create the environmental behavior of consumption behavior, energy conservation, waste management, travelling behavior, recycling behavior, and knowledge transferring and supporting for environmental conservation, therefore Four Nobel Truths should be reintroduced again in the school. However, Four Noble Truths is an essential factor for Thai peoples who are Buddhist;
0.01 FNT BEH
PM
Y7 0.10
Y8 0.17
Y9 0.12
Y10 0.06
Y1 0.13
Y2 0.17
Y3 0.24
Y4 0.39
Y5 0.24
Y6 0.32
Chi-Square=274.15 df=151, P-value=0.37621, RMSEA=0.023
0.55 0.48 0.51 0.44 0.45 0.62
0.01
0.67
0.64
0.55
0.61
0.64
0.45
0.35
-0.02
-0.07 0.13 0.08 0.17 0.13
X1 0.33
X2 0.12
X3 0.13
X4 0.32
X5 0.39
X6 0.58
X7 0.28
X8 0.30
X9 0.32
0.29 0.55 0.64 0.52 0.59 0.82 0.51 0.33 0.61
0.12
0.15
INS
BEH

ISSN 2039-9340 Mediterranean Journal of Social Sciences Vol. 3 (11) November 2012
326
even through there is few content in curriculum at present when compare to the past 3 decades before, therefore, the young generations should be received more content of Buddhism since the Four Nobel Truths principle is pertinent to various principles of sustainable development. These results were congruent to concepts proposed by Thiengkamol (2009a, 2009b, & 2011e).
References
Gonggool, D., Thiengkamol, N., & Thiengkamol, C. (2012). Development of Environmental Education Volunteer Model through Inspiration of Public Consciousness for Sustainable Development. European Journal of Social Sciences, 32 (1):150-160.
Krongkaew, M. (2003). The Philosophy of Sufficiency Economy. Retrieved from http://kyotoreview.cseas.kyoto-u.ac.jp/issue/issue3/article_292.html
National Economic and Social Development Board (NESDB). (2004a). What is Sufficiency Economy? Bangkok, Thailand: NESDB. National Economic and Social Development Board (NESDB). (2004b). Q & A About Sufficiency Economy Philosophy. Bangkok,
Thailand: NESDB. National Economic and Social Development Board (NESDB). (2007). The Tenth Economic and Social Development Plan (2007-2011).
Retrieved from http://www.nesdb.go.th/Default.aspx?tabid=402 National Research Council of USA. (2010). Advancing the Science of Climate Change. Washington, D.C.: The National Academies
Press. Pimdee, P., Thiengkamol, N., & Thiengkamol, T. (2012). Causal Relationship Model of Electrical Energy Conservation. European
Journal of Social Sciences, 32 (3):306-315. Pimdee, P., Thiengkamol N,, Thiengkamol T., (2012) Psychological Trait and Situation Affecting through Inspiration of Public Mind to
Energy Conservation Behavior of Undergraduate Student, Mediterranean Journal of Social Sciences Vol 3 (3) Ruboon, O., Thiengkamol, N., Thiengkamol, T., & Kurokodt, J. (2012). Model of Environmental Education Teacher with Inspiration of
Environmental Conservation for Global Warming Alleviation. European Journal of Social Sciences, 31 (1):92-102. Thiengkamol, N. (2004). Development of A Learning Network Model for Energy Conservation. Doctoral Dissertation of Education
(Environmental Education) Faculty of Graduate Studies, Mahidol University, Thailand. Thiengkamol, N. (2005a). Strengthening Community Capability through The Learning Network Model for Energy Conservation. Journal
of Population and Social Studies, 14 (1), 27-46. Thiengkamol, N. (2005b). Development of Health Cities Network for Mekong Region. In Proceedings of the International Conference
“Transborder Issues in the Grate Mekong Sub-Region” Ubon Ratchathani, Thailand, 30 June-2 July 2005 (pp.111-119). Ubol Ratchathani: Nevada Grand Hotel.
Thiengkamol, N. (2009a). The Great Philosopher: the Scientist only know but Intuitioner is Lord Buddha. Bangkok: Prachya Publication. Thiengkamol, N. (2009b). The Happiness and the Genius can be Created before Born. Bangkok: Prachya Publication. Thiengkamol, N. (2010b). Urban Community Development with Food Security Management: A Case of Bang Sue District in Bangkok. Journal of the Association of Researcher, 15 (2), 109-117. Thiengkamol, N. (2011a). Holistically Integrative Research (2nd ed.). Bangkok: Chulalongkorn University Press. Thiengkamol, N. (2011e). Environment and Development Book. (4th ed.). Bangkok: Chulalongkorn University Press. Thiengkamol, N. (2011g). Development of Energy Security Management for Rural Community. Canadian Social Science, 7 (5), October
31, 2011. Thiengkamol, N. (2011h). Development of a Food Security Management Model for Agricultural Community. Canadian Social Science, 7
(5), October 31, 2011. Thiengkamol, N. (2011i). Development of Model of Environmental Education and Inspiration of Public Consciousness Influencing to
Global Warming Alleviation. European Journal of Social Sciences, 25 (4):506-514. Thiengkamol, N. (2011j). Model of Psychological State Affecting to Global Warming Alleviation. Canadian Social Science, 7 (6):89-95,
December 31, 2011 Thiengkamol, N. (2012a).Development of A Prototype of Environmental Education Volunteer. Journal of the Social Sciences, 7 (1):77-81 Thiengkamol, N. (2012b). Development of Food Security Management for Undergraduate Student Mahasarakham University. European
Journal of Social Sciences, 27 (2):246-252. Thiengkamol, N. (2012c). Model of Psychological Trait Affecting to Global Warming Alleviation European Journal of Social Sciences, 30
(3), 484-492. Thiengkamol, N. (2012d). Model of Psychological Factors Affecting to Global Warming Alleviation. International Proceedings of
Economic Development and Research, 44, 6-12. United States National Academy of Sciences. (2008). Understanding and Responding to Climate Change. Retrieved from
http://americasclimatechoices.org/climate_change_2008_final.pdf Wikipedia. (2012). Four Noble Truths. Retrieved from http://en.wikipedia.org/wiki/Four_Noble_Truths

ISSN 2039-9340 Mediterranean Journal of Social Sciences Vol. 3 (11) November 2012
327
HOL Design with Natural Process of Khmer-Thai Ethnics Group
in Cultural Ecology of Lower Mekong Basin
Prasong Tungprasit
Ph.D. Candidate Student of Regional Development Strategies Program,
Surindra Rajabhat University.
Prof. Dr. Kasem Chunkao
Major Advisor, Regional Development Strategies Program, Surindra Rajabhat University.
Assoc. Prof. Dr. Achara Phanurat
Co-Advisor, Regional Development Strategies Program,
Surindra Rajabhat University.
Dr. Kotchanipha Udomthawee
Co-Advisor, Regional Development Strategies Program, Surin Rajabhat University.
Doi:10.5901/mjss.2012.v3n11p327
Abstract:The research design was mixed methods of quantitative and qualitative approaches. The research design for qualitative research was In-Dept Interview with structural form with 70 peoples comprised 50 Thai, 20 Khmer and 5 experts and quantitative research was survey research with 500 peoples of Khmer-Thai ethnics group who involved in natural dyeing silk. The content from qualitative research was analyzed to construct the questionnaire for quantitative research. Factor analysis was used for determination the component factors. The objectives of this research were to study cultural ecology of herb related to Hol silk cloth handicraft and to analyze component factor of dyeing silk with Hol design with natural process of Khmer-Thai ethnics group. The finding illustrated that there were 58 items were constructed from content analysis of In-Depth Interview and there were 6 components comprising 1) Hol Design with Natural Dyeing to Support Environment and Cultural Ecology, 2) Secret Code of Buddhist and Royal Household Wisdoms Succeeded Transferring of Fasten Dyeing and Hol Cloth Weaving Process, 3) Local Science and Technology Cultivated at Child Age through Family Learning, 4) Sun Energy and Water Mixers with Natural Process Conserve Ecosystem, 5) Content of Environmental Knowledge for Value Change of Chemical Use, and 6) Local Plants and Herbs are Important Raw Material of Sufficient Life with Local Appropriate Technology Key Words: HOL Design / Natural Process / Khmer- Thai Ethnics Group / Lower Mekong Basin / Cultural Ecology 1. Introduction The Mekong is a river in Southeast Asia. It is the world’s 12th-longest river and the 7th-longest in Asia. Its whole length is 4,909 kilometers and in China its length is 2,130 kilometers. It drains an area of 804,381 square kilometers, discharging 475 cubic kilometers of water annually (Liu, et al., 2009). This river runs through China’s Yunnan province, Burma (Myanmar), Laos, Thailand, Cambodia and Vietnam. In 1995, Laos, Thailand, Cambodia and Vietnam established the Mekong River Commission to assist in the management and coordinated use of the Mekong’s resources. In 1996 China and Burma (Myanmar) became “dialogue partners of the MRC and the six countries now work together within a cooperative framework (Wikipedia, 2012, and Kasetsiri, and Kumkoon, 2010). Mekong or Khong River has origin from Himalaya range at Tibetan Plateau (Mekong River Commission. 2005). It runs through Lao and it is named “Khong River”. In Thai language, it is called “Mekong River”. Important characteristics of Mekong River is high bank both sides

ISSN 2039-9340 Mediterranean Journal of Social Sciences Vol. 3 (11) November 2012
328
and flows with curve a long with hill shoulder. It flows from North to South though out the year. The water level in rainy season and drought season will extremely different amount. The speed of current depends on each season. Soil in Mekong River is sand soil. A long the river, there are a lot of islands with different sizes more than a hundred, therefore it is named as “Eastern Danube River” (Kasetsiri, and Kumkoon, 2010). Mekong River is a main blood vessel that nurtures the population more than 60 millions; hence it is as food source and water source for agriculture, transportation, traveling, and other numerous activities. A long with almost 5,000 kilometers, it flows through different geography and contains a large number of branches before flow to the sea (Kasetsiri, and Kumkoon, 2010). Therefore, it causes the diversity and furnish of natural resources, fauna and flourish and induces the unity and diversity of ecosystem of each area (Boonyaratanapalin, 2002). Cultural ecology is the study of human adaptations to social and physical environments. Human adaptation refers to both biological and cultural processes that enable a population to survive and reproduce within a given or changing environment (Joralemon, 2010). This may be carried out diachronically (examining entities that existed in different epochs), or synchronically (examining a present system and its components). The central argument is that the natural environment, in small scale or subsistence societies dependent in part upon it. It is a major contributor to social organization and other human institutions. Cultural ecology represents the “ways in which culture change is induced by adaptation to the environment.” A key point is that any particular human adaptation is in part historically inherited and involves the technologies, economic, practices, and knowledge that allow people to live in an environment as needs of physical and mental aspects. This is an important fundament to explain human behavior. This concept is emphasized on the relationship between culture and environment that it affects to each other and it is difficult to separate from each other in each age. However, each design and characteristics, experiences, familiarities, way of life, tradition and culture might be transferred from generation to generations (Wikipedia, 2012, Wongwipak,1989 & Thakairach, 2001). In conclusion, cultural ecology, it is an attempt to analyze about three factors involve 1) the relationship between environment and technology of production that defines the importance of cultural change, 2) the relationship between technology and human behavior, and 3) the results for explanation the origin and characteristics of culture of different ethnic groups.
Nonetheless, human closely relates to woven thing from birth to grave. The utilization of woven thing is used for covering our body to protect from external environment whether to protect heat from sunlight, insect bite and contact with foreign thing including covering the secret part of body from other seeing. Moreover, it has developed to the step of creation for beautiful design to express the art of inventor for weaving. From historical period, the dress is expressed to craft skill and creation of weaver but it is an evidence of cultural prosperity of ethnic group (Center of Academic Assistant of Community Development Area 11, 2003). Therefore, weaving is a culture that express to the use of benefit from natural resources of human. From the archaeological delving, indicated that weaving culture of human had since before historical age.
Cloth weaving is a culture of ethnic group woman in prior period in Mekong Sub-region that has transferred succeeding since past period through the socialization process via Maternal Linage and it is a basic need of human. Particularly, in ancient age, the technology is not developed; therefore every household needs to weaving cloth for household use. The dress indicates to identity of each ethnic group and indicates to valuable art that should be admired. Beside, weaving is a craft that man perceives as woman work and uses to just for couple selection. Therefore, every woman must be able to weave so she must be taught since she is young. Learning method is natural through looking, observing, and remembering through looking her grandmother, mother or relative until she familiars and absorb weaving knowledge without consciousness. When she grows up if she is taught and learnt from closed person, she will try and practice by herself for a long period, she would get skill with her own creation and competency therefore the cloth results with diversity and variety of beauty according to each ability (Kuptusatien, 2002, Center of Academic Assistant of Community Development Area 11, 2003, and Sriboonnak, 2006).
Silk cloth was recognized that cloth had origin from China about 7,000 years ago. Afterward, it has spreads over the world including Mekong Sub-region. It has been well known and favorable at Cambodia, Northeastern of Thailand, and Burma (Myanmar) (Panichpan, 2004). Silk is a natural protein fiber, some forms of which can be woven into textiles. The protein fiber of silk is composed mainly of fibroin and produced by certain insect larvae to form cocoons. The best-known type of silk is obtained from the cocoons of the larvae of the mulberry silkworm Bombyx mori reared in captivity (sericulture). The shimmering appearance of silk is due to the triangular prism-like structure of the silk fiber, which allows silk cloth to refract incoming light at different angles, thus producing different colors (Panichpan, 2004, and Sutherland, et al, 2012). Silks are produced by several other insects, but generally only the silk of moth caterpillars has been used for textile manufacturing. There has been some research into other silks, which differ at the molecular level (Sutherland, et al, 2012, and Wikipedia, 2012). Many silks are mainly produced by the larvae of insects undergoing complete metamorphosis, but some adult insects such as web-spinners produce silk, and some insects such as raspy crickets produce silk throughout their lives (Walker, et al, 2012). Production process of silk cloth composed of complexity and

ISSN 2039-9340 Mediterranean Journal of Social Sciences Vol. 3 (11) November 2012
329
difficulty by starting with Mulberry tree cultivation, silk thread pulling, dyeing, and design construction. There is hiding with body of knowledge, therefore if one does not deeply study, one could not understand and extend these bodies of knowledge further to use its benefit and adapt to go along with their needs and uses according to period of life. It is well known that silk dyeing is the step that is needed the high handicraft ability and fineness because it is an integration of scientific knowledge occurred from local wisdom that accumulated from different generations and art ability to create a color and design to express for its beauty, charm, durability and serve the demand of use.
Currently, different ethnic groups are still transferring the art of weaving that is identity of their ethnic groups. This is learning process from generations to generations. Art of weaving needs a specially personal ability with creative thinking to invent the new design or to develop old design to be new design with influent and supportive factors of living area. Therefore, weaving is wisdom to use natural resources of various ethnic groups that accumulate, develop, and transfer from generations to generations for a long time.
Hol or Hor is a kind of silk cloth that is accepted as special identity of Khmer Ethnic Group, particularly, Khmer-Thai Ethnic Group in Surin Province. It is silk cloth that is more exceptional color and design than other designs of silk cloth. Hol is Khmer language with meaning of flowing of gold and money, integrity, famous, and prosperity of wearer. It was occurred from wisdom of imagination to sunlight contacts to running and waving water and reflects to cause rainbow color but some ethnic has imagination about Hol cloth design from a stripes of python snake such as a case of Hol woven group in village of Na Haew, Sawai Sub-district, Muang District, Surin Province. Moreover, some might call Hol as “Bambooleaf design”. Considering as holistic picture of cloth design, it might like a forest with channel of valley and stream as well (Phanurat, and Sriboonnak, 1995, Sriboonnak, 2006, Sriboonnak, et al., 1997, and Center of Academic Assistant of Community Development Area 11, 2003). Therefore, the process of Hol silk cloth weaving needs body of knowledge, handicraft ability, skillfulness, neatness, and time consumed, especially, the silk dyeing process with herbs from nature of Khmer-Thai Ethnic Group since they bring natural resources that occurred from diversity and richness of local ecosystem to use. It is a step that depends body of knowledge and wisdom by using scientific method from observation through try and error and real practice from things that is hidden in way of life and community way to apply with body of knowledge and creative thinking in art to construct design and color of silk cloth that is an identity of this ethic group. This is congruent to nature.
From above mentioned reasons, it is interesting to study the process of silk dyeing with herb as Hol design of Khmer-Thai Ethnic Group in order to understand the concept, body of knowledge, and silk dyeing technology with herbs that are natural resources existing in locality with friendly environment. Then gathering, this body of knowledge is in terms of documentary evidences that are able to use for referring and kept as heritage for next generations. Moreover, it should be studied about the connection among environmental factors in community, ecosystem, and weathers that effected to raw material selection for silk dyeing. Therefore, it should deeply study to conserve this body of knowledge to sustain by introducing scientific knowledge and appropriate technology to support and extend from existing wisdom to be an appropriate technology with environmentally friendly concept. 2. Research Objective The objectives of this research were as followings:
• To study cultural ecology of herb related to Hol silk cloth handicraft. • To analyze component factor of dyeing silk with Hol design natural process of Khmer-Thai ethnics group.
3. Methodology 3.1 Qualitative research was used for data collection from In-Depth Interview form with 70 peoples comprised 50 Thai, 20 Khmer and 5 experts. 50 Thai peoples were collected from communities of Surin Province in Northeastern region of Thailand who are involving dyeing silk with natural process of HOL design. 20 Khmer peoples were collected from communities of Siem Reap Province in Northwestern of Cambodia. 5 experts who have local wisdom and are accepted by community of dyeing silk with Hol design natural process, were collected from Khmer-Thai ethnics group communities. 3.2 Quantitative research was survey research with 505 peoples of Khmer- Thai ethnics group who involve in dyeing silk with Hol design natural process.

ISSN 2039-9340 Mediterranean Journal of Social Sciences Vol. 3 (11) November 2012
330
4. Results 4.1 In-Depth Interview The results of In-Depth Interviews with peoples comprised 50 Thai, 20 Khmer and 5 experts with content analysis, the 58 items were constructed for survey research as presented in table 1. Table 1 Content Analysis Results
Item Evaluation 1. Way of life of people who sericulture involves with Mulberry tree and silk worm all a day. 2. Using hand to press silk cocoon or shake silk tube is simple technology. 3. Even though the tree bark used for dyeing consumed time but it is useful more than using chemical color. 4. Herb gives color that is valuable for ecosystem because it gives color, active medical properties, and support for small tree and animal in terms of food and drug. 5. Technology of dried silk cocoon under the sunlight will assist silk thread to silk thread and dyeing. 6. Silk cocoon in period before to be silk worm has high nutritional value and is an important period draw the silk with high quality. 7. Transferring knowledge for sericulture is gradation process from baby to adult. 8. At present there is a development by dressing with cutting branch to shorter three so the leaf will bigger. 9. Silk thread has natural glue therefore; it needs to wash with alkaline water before dyeing with quality. 10. Kapok tree is general apparent in Khmer- Thai Ethnics Group communities, even through Kapok peel is used to make alkaline water for silk dyeing. 11. Alkaline water made with Kapok peel and Spiny amaranth help for better silk dyeing. 12. Alkaline water made (Kabong) is worth not only for silk dyeing and hair washing but it also make people realizes to important of plants and conserve community ecosystem. 13. Silk dyeing, silk thread must immerse in water first for better dyeing before boil it with and color water. 14. Sunlight is an important solar power in dyeing and bleaching process, the weaver pays respect to the Sun with Brahman ritual. 15. Hol silk design dyeing must fasten before dyeing with repeatedly process by using red, yellow and blue colors. 16. Hol patter natural dyeing, the yellow color is used Khae tree, red color used a insect named Laccifer lacca, and blue color is used indigo blue tree. 17. Hol patter natural dyeing process is not only hobby and business but it also a promotion of science and technology. 18. Hol patter weaving and silk worm feeder, it encourages for learning life cycle of silk worm and fly. 19. Silk weaver is housewife who looks after her child as main work but feeding silk worm and weaving supplementary work. 20. Silk thread will have good quality if silk worm feeder is delicate and pays attention to separate the male silk worm from female in the egg laying period. 21. Silk worm feeder must love silk worm like her child by selecting Mulberry leaves to be appropriate for its age. Moreover she must to cut in fine pieces and increases with quantity of leaf. 22. Silk worm likes a baby, feeder must take care it carefully and precaution to prevent it from other insects including smell to disturb it. 23. Feeding silk worm with love, it makes family members to realize the silk value and they will learn together about cultural ecology. 24. Khmer- Thai Ethnics Group give value for Hol patter silk dyeing process and silk cloth will be used for different auspicious ceremony. 25. Hol silk cloth related to various ceremonies from birth to grave and for next incarnation. 26. Silk excrement is worth for both soil furnish for plant and a food for cow and buffalo. 27. Culture of silk and Mulberry tree comes together with rice culture because silk, mulberry tree, cow, buffalo and rice are in cycle of food and the same ecosystem. 28. Hol silk cloth is an ancient design with valuable for education, economic, and social aspects. 29. Cloth wisdom of Royal Household is influence to weaver for carefully make delicate thread silk with fine and thin in order to fasten and dye with fine strip. 30. Hol design natural silk dyeing process gives all of spiritual worth, intelligence, and economy. 31. Hol design natural silk dyeing process is gradually transfer continuous from generations to generations from Khmer-Thai ethnic group.

ISSN 2039-9340 Mediterranean Journal of Social Sciences Vol. 3 (11) November 2012
331
32. Great grandmother teaches grandmother, grandmother teaches mother and mother teaches daughter. The daughter uses it as job to nurture her child, grandchild, and great grandchild. 33. Fastening, dyeing and silk worm feeding is able to train since 9 years old. 34. Hol silk cloth production is created a job dividing systemically. 35. Hol silk designer will deeply learn on natural color use, color mixing with fasten dyeing and ecology of herbs that give color dyeing and sit can be found in community at the edge of field or farm and community forest. 36. Silk twisting is a technology to create a new color on silk cloth. 37. Treat with silk worm and Mulberry tree with deep knowledge; it will get the high quality of silk thread and Hol silk cloth. 38. Dyeing of silk thread, if dyer has deepness about plant and insect a insect for color made, it will get better dyeing and better silk thread quality. 39. Dyeing process with insect named Laccifer lacca for better stain, it is related to some kinds of plants such as Mhued leaf and tamarind, therefore it is accounted as environmental conservation. 40. Crushing, grasping and soaking the silk thread in hot water mixed with acid from leaf with sour taste, it was learning skill about dyeing with natural chemical process. 41. Hol patter natural dyeing process, the whole color in pot is stained or not, it can notice from bubble color is fade until becomes clear. The weaver uses as indicator that learn from technological wisdom at molecular level. 42. Fastening and dyeing Hol with 2 times hot boiling and 2 times cool dyeing is an endeavor of dyer. 43. Dyeing with color from plant is a mean that weaver must learns from wisdom in chemical aspect according to Khmer-Thai ethnic group from their ancestor deeply. 44. Dyeing with hot and cool for better stain, it needs to use both technical wisdom and training experience seriously and long term. 45. Hol patter natural dyeing process, it helps practitioner knows about temperature, growth of bacteria, acid-base and making of dark and light color. 46. Banana, spinach, coconut, Cassia, Kapok and others are raw materials for Hol patter natural dyeing process and it is cultural ecology that weaver learn deeply. 47. Technology of alkaline water and dyeing water with acidic condition in Hol patter natural dyeing process, it is connection with cultural ecology of weaver. 48. The clear water is an important part for Hol patter natural dyeing process, Khmer-Thai ethnic group pays attention to and expresses grateful in various merit tradition. 49. Hol patter natural dyeing process is ever make in Cambodia and South I-san of Thailand
50. Every house in Khmer-Thai ethnic group has banana tree. 51. Weed nearby house such as spinach, and Heliotropium, these are eatable and use drug and involve to silk dyeing with natural chemical process. 52.Mango, coconut, jackfruit, and Kapok trees are cultivated in community and side yard garden, these are involving to natural dyeing process. 53. Sanuan, Sakae, and Jamjuree trees are used for feeding insect named Laccifer lacca to be red color in Hol patter natural dyeing process. 54. Mhued leaf, Purple Bauhinia, tamarind and Bauhinia malabarica roxb are perennial trees stand at edge of field or farm and community forest. These involve to patter natural dyeing process are decreased. 55. Hol cloth will be with stay with Surin people for everlasting. 56. Hol cloth dyeing with chemical substance looks better than Hol cloth dyeing with natural color. 57. Relationship among trees, people, religion and Hol cloth is unity for Khmer-Thai ethnic group life. 58. It should study, conserve, and succeed Hol cloth urgently for young generation of Surin Province, particularly, Hol design natural dyeing process of Khmer-Thai ethnic group origin.
4.1 Survey Research results The questionnaire was used to collect data from 500 peoples of Khmer-Thai ethnics group who involved in natural dyeing silk. Then the factor analysis was employed for component determination. There were 6 components were constructed as presented in table 2, 3, 4, 5, 6 and 7 as followings. Table 2 Component 1: Hol Design Natural Dyeing to Support Environment and Cultural Ecology
No.
Items Factor
Loading
NB
53 Sanuan, Sakae, and Jamjuree trees are used for feeding insect named Laccifer lacca to be red color in Hol patter natural dyeing process.
0.789
Raw material

ISSN 2039-9340 Mediterranean Journal of Social Sciences Vol. 3 (11) November 2012
332
43 Dyeing with color from plant is a mean that weaver must learns from wisdom in chemical aspect according to Khmer-Thai ethnic group from their ancestor deeply.
0.761
Process
54 Mhued leaf, Purple Bauhinia, tamarind and Bauhinia malabarica roxb are perennial trees stand at edge of field or farm and community forest. These involve to patter natural dyeing process are decreased.
0.757
Decrement of raw material source
35 Hol silk designer will deeply learn on natural color use, color mixing with fasten dyeing and ecology of herbs that give color dyeing and sit can be found in community at the edge of field or farm and community forest.
0.713
Learning process
15 Hol silk design dyeing must fasten before dyeing with repeatedly process by using red, yellow and blue colors.
0.678
Production process
58 It should study, conserve, and succeed Hol cloth urgently for young generation of Surin Province, particularly, Hol design natural dyeing process of Khmer-Thai ethnic group origin.
0.672
Study, conserve, and succeeding
9 Silk thread has natural glue therefore; it needs to wash with alkaline water before dyeing with quality.
0.661
Production process
16 . Hol patter natural dyeing, the yellow color is used Khae tree, red color used a insect named Laccifer lacca, and blue color is used indigo blue tree.
0.657
Source of raw material
17 Hol patter natural dyeing process is not only hobby and business but it also a promotion of science and technology.
0.654
Supplementary income
44 Dyeing with hot and cool for better stain, it needs to use both technical wisdom and training experience seriously and long term.
0.713
Body of knowledge
40 Crushing, grasping and soaking the silk thread in hot water mixed with acid from leaf with sour taste, it was learning skill about dyeing with natural chemical process.
0.652
Practical technique
49 Hol patter natural dyeing process is ever make in Cambodia and South I-san of Thailand
0.643
Same ethnic group
51 Weed nearby house such as spinach, and Heliotropium, these are eatable and use drug and involve to silk dyeing with natural chemical process.
0.626
Holistic concept
3 Even though the tree bark used for dyeing consumed time but it is useful more than using chemical color.
0.611
Local and globalization
25 25. Hol silk cloth related to various ceremonies from birth to grave and for next incarnation.
0.589
Raise for sustainability
41 Hol patter natural dyeing process, the whole color in pot is stained or not, it can notice from bubble color is fade until becomes clear. The weaver uses as indicator that learn from technological wisdom at molecular level.
0.548
Explain with scientific process
8 At present there is a development by dressing with cutting branch to shorter three so the leaf will bigger.
0.531
Promotion and development
26 Silk excrement is worth for both soil furnish for plant and a food for cow and buffalo. 0.505
Silk, buffalo, soil and environment
22 Silk worm likes a baby, feeder must take care it carefully and precaution to prevent it from other insects including smell to disturb it.
0.496
Maternal socialization
13 Silk dyeing, silk thread must immerse in water first for better dyeing before boil it with and color water.
0.493
Dyeing technique
39 Dyeing process with insect named Laccifer lacca for better stain, it is related to some kinds of plants such as Mhued leaf and tamarind, therefore it is accounted as environmental conservation.
0.307
Dyeing adjusted with wisdom
From table 2 Component 1: Hol Design Natural Dyeing to Support Environment and Cultural Ecology comprised 23 items, the highest factor loading was Sanuan, Sakae, and Jamjuree trees are used for feeding insect named Laccifer lacca to be red color in Hol patter natural dyeing process with 0.789, subsequences were Dyeing with color from plant is a mean that weaver must learns from wisdom in chemical aspect according to Khmer-Thai ethnic group from their ancestor deeply, and Mhued leaf, Purple Bauhinia, tamarind and Bauhinia malabarica roxb are perennial trees stand at edge of field or farm and community forest. These involve to patter natural dyeing process are decreased with 0.761 and 0.757 respectively.

ISSN 2039-9340 Mediterranean Journal of Social Sciences Vol. 3 (11) November 2012
333
Table 3 Component 2: Secret Code of Buddhist and Royal Household Wisdoms Succeed Transferring of Fasten Dyeing and Hol Cloth Weaving Process
No.
Items
Factor Loading
NB
29 Cloth wisdom of Royal Household is influence to weaver for carefully make delicate thread silk with fine and thin in order to fasten and dye with fine strip.
0.849
Promote and develop
28 Hol silk cloth is an ancient design with valuable for education, economic, and social aspects.
0.782
Study, economic, and social
31 Hol design natural silk dyeing process is gradually transfer continuous from generations to generations from Khmer-Thai ethnic group.
0.720 Local informal education
57 Relationship among trees, people, religion and Hol cloth is unity for Khmer-Thai ethnic group life.
0.712 Hol holistic
30 Hol design natural silk dyeing process gives all of spiritual worth, intelligence, and economy.
0. 711
Ethnic socialization and Identity
37 Treat with silk worm and Mulberry tree with deep knowledge; it will get the high quality of silk thread and Hol silk cloth.
0.690
Socialization
27 Culture of silk and Mulberry tree comes together with rice culture because silk, mulberry tree, cow, buffalo and rice are in cycle of food and the same ecosystem
0.679
Food and Drink
55 Hol cloth will be with stay with Surin people for everlasting. 0.674 Identity as symbol 48 The clear water is an important part for Hol patter natural dyeing process,
Khmer-Thai ethnic group pays attention to and expresses grateful in various merit tradition.
0.646
Pay attention to water as essential factor
24 Khmer- Thai Ethnics Group give value for Hol patter silk dyeing process and silk cloth will be used for different auspicious ceremony.
0.637
Good thing of Hol cloth is subjective
38 Dyeing of silk thread, if dyer has deepness about plant and insect a insect for color made, it will get better dyeing and better silk thread quality.
0.636
Source of raw material
32 Great grandmother teaches grandmother, grandmother teaches mother and mother teaches daughter. The daughter uses it as job to nurture her child, grandchild, and great grandchild.
0.616
Transferring maternal knowledge
34
Hol silk cloth production is created a job dividing systemically
0.603
Family and community management
45 Hol patter natural dyeing process, it helps practitioner knows about temperature, growth of bacteria, acid-base and making of dark and light color.
0. 598
Scientific and technological process
46 4Banana, spinach, coconut, Cassia, Kapok and others are raw materials for Hol patter natural dyeing process and it is cultural ecology that weaver learn deeply.
0.591
Friendly environment living
21 Silk worm feeder must love silk worm like her child by selecting Mulberry leaves to be appropriate for its age. Moreover she must to cut in fine pieces and increases with quantity of leaf.
0.574
Love relationship between man and silk
50 Every house in Khmer-Thai ethnic group has banana tree. 0.548 Important raw material 20 Silk thread will have good quality if silk worm feeder is delicate and pays
attention to separate the male silk worm from female in the egg laying period. 0.536
High technique of silk worm feeding
19 Silk weaver is housewife who looks after her child as main work but feeding silk worm and weaving supplementary work.
0.532
Role of male and female of ethnic group
42 Fastening and dyeing Hol with 2 times hot boiling and 2 times cool dyeing is an endeavor of dyer.
0.520
Love, mind, and attempt
10 Kapok tree is general apparent in Khmer- Thai Ethnics Group communities, even through Kapok peel is used to make alkaline water for silk dyeing.
0.506
Apply raw material for friendly environment
36 Silk twisting is a technology to create a new color on silk cloth. 0.491 Better quality 47 Technology of alkaline water and dyeing water with acidic condition in Hol patter
natural dyeing process, it is connection with cultural ecology of weaver 0.475
Cultural ecology
From table 3 Component 2: Secret Code of Buddhist and Royal Household Wisdoms Succeed Transferring of Fasten Dyeing and Hol Cloth Weaving Process comprised 21 items, the highest factor loading was cloth wisdom of Royal Household is influence to weaver for carefully make delicate thread silk with fine and thin in order to fasten and dye with fine strip with 0.849. Subsequences were Hol silk cloth is an ancient design with valuable for education, economic, and

ISSN 2039-9340 Mediterranean Journal of Social Sciences Vol. 3 (11) November 2012
334
social aspects and Hol design natural silk dyeing process is gradually transfer continuous from generations to generations from Khmer-Thai ethnic group with 0.782 and 0.720 respectively. Table 4 Component 3: Local Science and Technology Cultivated at Child Age through Family Learning
No.
Items
Factor Loading
NB
23 Feeding silk worm with love, it makes family members to realize the silk value and they will learn together about cultural ecology.
0.766
Learning together of family
18 Hol patter weaving and silk worm feeder, it encourages for learning life cycle of silk worm and fly.
0.677
Scientific and technological knowledge
33 Fastening, dyeing and silk worm feeding is able to train since 9 years old.
0.629
Cultivate learning process at child
14 Sunlight is an important solar power in dyeing and bleaching process, the weaver pays respect to the Sun with Brahman ritual.
0.578
Sunlight is a sources of energy for living things
7 Transferring knowledge for sericulture is gradation process from baby to adult.
0.573
Learning process transferring
6 Silk cocoon in period before to be silk worm has high nutritional value and is an important period draw the silk with high quality
0. 553
Supportive for all process
From table 4 Component 3: Local Science and Technology Cultivated at Child Age through Family Learning comprised 6 items, the highest factor loading was feeding silk worm with love, it makes family members to realize the silk value and they will learn together about cultural ecology with 0.766. Subsequences were Hol patter weaving and silk worm feeder, it encourages for learning life cycle of silk worm and fly, and fastening, dyeing and silk worm feeding is able to train since 9 years old with 0.677 and 0.629 respectively. Table 5 Component 4: Sun Energy and Water Mixer with Natural Process Conserve Ecosystem
No.
Items
Factor Loading
NB
11 Alkaline water made with Kapok peel and Spiny amaranth help for better silk dyeing.
0.607 Production Process
12 Alkaline water made (Kabong) is worth not only for silk dyeing and hair washing but it also make people realizes to important of plants and conserve community ecosystem.
0.566 Awareness toward environment
5 Technology of dried silk cocoon under the sunlight will assist silk thread to silk thread and dyeing.
0.440 Sun energy direct effect to production process
From table 5 Component 4: Sun Energy and Water Mixer with Natural Process Conserve Ecosystem comprised 3 items, the highest factor loading was alkaline water made with Kapok peel and Spiny amaranth help for better silk dyeing with 0.607. Subsequences were Alkaline water made (Kabong) is worth not only for silk dyeing and hair washing but it also make people realizes to important of plants and conserve community ecosystem, and technology of dried silk cocoon under the sunlight will assist silk thread to silk thread and dyeing with 0.566 and 0.440 respectively.
Table 6 Component 5: Content of Environmental Knowledge for Value Change of Chemical Use
No.
Items
Factor Loading
NB
56 Hol cloth dyeing with chemical substance looks better than Hol cloth dyeing with natural color.
0.735
Local and globalization
From table 6 Component 5: Content of Environmental Knowledge Change Value of Chemical Use had only 1 item, Hol cloth dyeing with chemical substance looks better than Hol cloth dyeing with natural color with 0.735.

ISSN 2039-9340 Mediterranean Journal of Social Sciences Vol. 3 (11) November 2012
335
Table 7 Component 6: Local Plants and Herbs are Important Raw Material of Sufficient Life with Local Appropriate Technology
No.
Items
Factor Loading
NB
2 Using hand to press silk cocoon or shake silk tube is simple technology. 0.728 Simple technology 1 Way of life of people who sericulture involves with Mulberry tree and silk worm all
a day. 0.601
Way of life 4 Herb gives color that is valuable for ecosystem because it gives color, active
medical properties, and support for small tree and animal in terms of food and drug.
0.582 Herbs of community
52 Mango, coconut, jackfruit, and Kapok trees are cultivated in community and side yard garden, these are involving to natural dyeing process.
0.526 Source of raw material in locality
From table 7 Component 6: Local Plants and Herbs are Important Raw Material of Sufficient Life with Local Appropriate Technology comprised 4 items, the highest factor loading was using hand to press silk cocoon or shake silk tube is simple technology with 0.728. Subsequences were way of life of people who sericulture involves with Mulberry tree and silk worm all a day, and herb gives color that is valuable for ecosystem because it gives color, active medical properties, and support for small tree and animal in terms of food and drug with 0.601 and 0.526 respectively. 5. Discussion It might be concluded that above study reflected to past of Hol cloth production as holistic view of integration of science and art together with learning process and cultivating morality together with natural and environment conservation of locality both in community and community forest. Therefore, it requires collaboration among local community, governmental sector and private sector to conserve cultural ecological knowledge of HOL Design Dyeing Silk Natural Process of Khmer- Thai Ethnics Group to sustain for next generations to accomplish sustainable development. Moreover, it should use this Khmer-Thai ethnic group community as prototype for promotion and conservation of culture and environment for other community and ethnic group.
Reference
Joralemon, D. (2010). Exploring Medical Anthropology. Upper Saddle River, NJ: Prentice Hall. Kasetsiri, C. and Kumkoon, A. (2010). Mekong River : From Taju-Lanchang, Tonlethom to Kaew Long. 3 rd, edtion. Samutharaprakarn :
Toyota Foundation, Thailand. Boonyaratanapalin, M, et al. (2002). Effect of Vitamin Complex, Cholesterol, Lecitin (BHT), Ceolite and Gracilaria fisheri towards Haliotis
Asinina Linnaeus, 1758). Bangkok: Thai National Research Repository. Wongwipak, C. (1989). Cultural Ecology. Bangkok : Silpakorn University. Thakrairach, N. (2001). A Study of Eco-Culture : A Case Study of Khokklang Village, Khaen Subdistrict, Wapipathum District, Mahasarakham Province. Master of Arts (Rural Development Studies), Graduate School.
Mahidol University. Nakhon Prathom Province (Thailand). Center of Academic Assistant of Community Development Area 11. (2003). Cultural Prosperity of Ethnic Group. Retrieved Fromhttp://cddweb.cdd.go.th/cdregion11/
Kuptusatien, R. (2002). Development of Personnel in Tambon Administration Organization in Northeastern in Aspect of Education Administration to Prepare “Representative of Local Administration Organization” as Committee in Commission of Education, Religion, and Culture in Education Area. Khon Kaen : Khon Kaen University.
Liu, S., Lu, P., Liu, D., Jin, P. & Wang, W. (2009). “Pinpointing source and measuring the lengths of the principal rivers of the world”. International Journal of Digital Earth 2 (1): 80-87.
Mekong River Commission (2010). “State of the Basin Report, 2010”. Vientiane : MRC, Laos. Panichpan, V. (2004). Thai Cloth and Textile. Chai Mai: Suilk Worm. Phanurat, A., Sriboonnak, K. (1995). Value of Ethnography Research. Surin: Surindra Rajabhat University. Sriboonnak, K. (2006).Development of performing arts from Kin Heet Ritual of Propir Khmer –Mon Ethnic Group in Mekong Sub Region. Doctor of Philosophy, Regional Development Strategy (in Mekong Sub Region
Group). Graduate School. Surindra Rajabhat University. Sriboonnak, K. et al. (1997). Aesthetics of Life. Bangkok : Third Wave Education. Sutherland, T.D., Young, J.H., Weisman, S, Hayashi, C.Y., and Merritt, D.J. (2010). “Insect silk: one name, many materials”. Annual
Review of Entomology 55: 171–88.

ISSN 2039-9340 Mediterranean Journal of Social Sciences Vol. 3 (11) November 2012
336
Walker, AA., Weisman, S., Church, J.S., Merritt, D.J., Mudie, S.T., Sutherland, T.D. (2012). “Silk from Crickets: A New Twist on Spinning. PLoS ONE 7(2): e30408. doi:10.1371/journal.pone.0030408 Wikipedia. (2012).Cultural Ecology. Retrieved from http://en.wikipedia.org/wiki/Cultural_ecology Wikipedia. (2012). Mekong. Retrieved from http://en.wikipedia.org/wiki/Mekong Wikipedia. (2012). Silk. Retrieved from http://en.wikipedia.org/wiki/Silk

ISSN 2039-9340 Mediterranean Journal of Social Sciences Vol. 3 (11) November 2012
337
Ethnic Personality of Community in the World Heritage Areas
of Sukhothai and Angkor Wat
Miss Arunee Jindarat
Ph.D. Candidate Student of Regional Development Strategies Program, Surindra Rajabhat University
Prof. Dr. Sujrit Pianchob
Major Advisor, Regional Development Strategies Program,
Surindra Rajabhat University
Assoc.Prof. Boonyung Mundee
Co-Advisor, Regional Development Strategies Program, Surindra Rajabhat University
Dr. Benjawan Wongsawadee
Co-Advisor, Regional Development Strategies Program,
Surin Rajabhat University
Doi:10.5901.mjss.2012.v3n11p337 Abstract The research design was mixed methods of quantitative and qualitative approaches. The research design for qualitative research was In-Dept Interview with structural form with 100 peoples comprised 50 Thais, 50 Khmers and quantitative research was survey research with 500 peoples of Thaipuan Ethnic Group who lived in Sukhothai World Heritage Site. The content from qualitative research was analyzed to construct the items for quantitative research. Factor analysis was used for determination the component factors of the desirable personality the Thaipuan Ethnic Group in Sukhothai World Heritage Sites. The objectives of this research were to study desirable personality of the Thaipuan Ethnic Group communities at Sukhothai World Heritage Sites in Thailand and to analyze component factor of desirable personality of the Thaipuan Ethnic Group community at Sukhothai World Heritage Sites in Thailand. The finding illustrated that there were 80 items were constructed from content analysis of In-Depth Interview and there were 6 components comprising 1) Honesty, patience and dedication are personality of the people in the world heritage sites, 2) Sources meditation practice, moral, and giving would be go along with world heritage sites, 3) Experience of building and biological knowledge of the ancestors should be inherited from generation to generation continuously, 4) Creator of the world heritage is the king who practices dharma would be a representative of the personality for his people, 5) Traditional craft literacy is educational mechanism for teaching integrity, 6) World heritage reflects sufficient agriculture as remind the patience and kindness. Key Words: Personality/ Ethnicity / Sukhothai World Heritage Site / World Heritage Site of Angkor Wat 1. Introduction Theoretical concepts of personality by Hilgard and Atkinson (Hilgard and Atkinson, 1962), the history of the Thaipuan and Khmer ethnic, the history of Sukhothai and Ankor Wat World Heritage Site, the concept of culture and personality, the concept of cultural lag, the concept of economic anthropology, theory of cultural ecology of Julian Stewart, theory of cultural diffusion (Edward B.Tylor and Lewis H. Morgan), education philosophy of William C. Bagley, psychology of learning, psychological development of children, education policy (Mikusol, 1984) and related research were concluded and integrated for this study. Study of social and cultural history in the North-East of Thailand since 1868 - 1910 with case study of tropical forest districts Khmer was conducted by using qualitative research methods to collect data from field study. It was found

ISSN 2039-9340 Mediterranean Journal of Social Sciences Vol. 3 (11) November 2012
338
more than documents from Government and was found that before the reign of the Fourth King to the Fifth King of Thailand. These peoples were almost independent self-governing (highly autonomous) by their own leaders (Elite), but later, in 1883, the government of the King of Thailand, commissioner had ruled this area by the administration with the new system. However, they did not satisfy and against by their old believe leaders as Pheebun for instance, therefore, the government of Bangkok was beatable and changed the governor from Mueang to the Province until present. In that time, the GUI (a tribe of Cambodian), Cambodia and Laos were under the administration of Bangkok government. Nevertheless, the nationality, cultural, beliefs and career, also have a similar traditional identity in particular the GUI, their traditional occupations are to catch wild elephants and take care them. These are their old traditional cultures (Natsupa, 1997). Personality traits with the facilities are easily distinguishable, appearance, manner, voice, speech, cognitive skills, and the ability to do activities. The mental characteristics are quite different such as emotions, attitudes, interests, values, ideals, aspirations, goals and the ability to adapt to the environment. These are difficult to observe. The genetic and environmental sources of individual people, affect their ability to adapt to environment, and individual differences.
The meaning of personality mentioned above, if it is analyzed according to the tourism industry concept which is related to the operation, management, production, sales and service, by consideration the personality affecting the operation. It is found that all the characteristics of personality influence to the results with variation of influences. It may give a sense of personality with the tourism industry as a whole person’s physical and mental conditions to be benefit for the tourism industry, both in terms of administration, production and distribution and services in the tourism industry.
One theory about the personality, the relationship between emotions and the ability to know yourself (Self Awareness) is a clever one, because we are conscious or aware of our own behavior depends on how we look at it, we do compare to the environment in the world and how we can control our behavior, the ability to manage and control our life is called personal performance (Self Efficacy).
The high powerful personal have confidence in the corrective behavior of the dialog. However, people with low self-efficacy will be disturbed; they are concerns on the need to interact with the environment which may be beyond the control of that person. Awareness and personal effectiveness will be integrated into the personality.
Human personality is vital to national development. Whether it’s social, economic and political, personality of a man will lead to various aspects of human behavior such as generosity, compassion, honesty, patience and diligence or in contrast, such as corrupt egotist like a downtrodden people, and irresponsible personality, these are very important for developing countries because it affects the development of the country as well. If any person in any country with such a great personality improper or selfish, such an egotist like corruption, exploiting other, lack of responsibility, it will make that country can not be improved.
The world heritage city is the city that occurred from the past to the present such as Sukhothai World Heritage city of Thailand and Angkor Wat World Heritage city of Cambodia. To be the world heritage site must be evaluated with passed the selection criteria for UNESCO. These two world heritage sites are amazing for study because they are the areas where people have lived from the past to the present, therefore, how to have a personality, education, to convey the personality of one generation to another. It is an important issue to that people personality is positive or negative. So these two world heritage sites are interesting to study in terms of personality. Researchers have studied the characteristics of the communities in Sukhothai and Angkor Wat World Heritage and to find out whether such personality characteristics are desirable or not, if it is not, it will not support to develop the countries. To develop a policy for education in order to cultivate and develop properly, it should modify the personality to suit with development of countries in the era of globalization.
The old city has influenced the tourism industry such as Sukhothai Province and Siem Reap Province. These are places in the capital of Thailand and Cambodia. They often have problems regarding the safety of individuals, social problems, political regime, economy, and variety of problems of natural resources and the environment degradation. It has affected to the lifestyle of the people in the community over there. Human life starts from birth to grave in communities that influence to personality. Personality trait is the accumulation of life experience (Hilgard and Atkinson, 1962).
Angkor Wat was constructed from the early to mid 1100s by King Suryavarman II at the height of the Khmer Empire’s political and military power. It was built in the shape of an enormous temple-mountain, and reportedly took some 50,000 artisans, workers, and slaves to complete. It was dedicated to the Hindu god, Vishnu, and is the world’s largest religious building. King Suryavarman II built it as his state temple, although the temple has a west facing orientation, and some scholars have theorized that it was actually his funerary temple. Whatever its original purpose, Angkor Wat is one of the world’s most awe-inspiring and breathtaking architectural accomplishments of all time (Cambodia, 2012).
The Sukhothai Historical Park covers the ruins of Sukhothai, capital of the Sukhothai kingdom in the 13th and 14th centuries (Discovery Asia Thailand’ World, 2012) in what is now the north of Thailand. It is located near the modern city of

ISSN 2039-9340 Mediterranean Journal of Social Sciences Vol. 3 (11) November 2012
339
Sukhothai, capital of the province with the same name. The city walls form a rectangle about 2.0 km east-west by 1.6 km north-south. There are 193 ruins on 70 square kilometers of land. There is a gate in the centre of each wall. Inside are the remains of the royal palace and twenty-six temples, the largest being Wat Mahathat. The park is maintained by the Fine Arts Department of Thailand with help from UNESCO, which has declared it a World Heritage Site. The park has visited by many thousands of visitors for each year, where marvel at the ancient Buddha figures, palace buildings and ruined temples (Gosling, 1991, and Discovery Asia Thailand’ World, 2012).
The protection of the area for Sukhothai World Heritage was first announced in the Royal Gazette on June 6, 1962. In 1976, the restoration project was approved, and in July 1988, the park was officially opened. On December 12, 1990, it was declared a World Heritage Site as part of the Historic Town of Sukhothai and Associated Historic Towns together with the associated historic parks in Kamphaeng Phet and Si Satchanalai (Department of Art of Thailand, 1962). Sukhothai World Heritage Site is an important world heritage site. Because it is a historical city and satellite city that terms and criteria for consideration as a world heritage site, there are historic and country’s cultural attractions, affect to the character of the ethnic community as a way of life of the community of Thaipoun Ethnic Group in Sukhothai World Heritage in Thailand. Khmer Ethnic Group in Angkor Wat World Heritage, is also historic and country's cultural attractions, affect to the character of the ethnic community as a way of life of the community. The differences of both world heritage sites, as a result, the researchers were interested in to study how two ethnics tied to Buddhism as well and whether they have different personalities or not. Even though, they have different environments, such as influence of architectural heritage. The system of service industry of world heritage sites, it may influence the personality of the people in the community who live in that area. Both Sukhothai and Angkor Wat were the capital and have been ruled by the king at the same time. Therefore, the situation in the past, it might shape the personality of the people of the two cities, it is interesting to study (Punpeamrat, 2009), therefore, this study aims to clarify the personality of the Thaipoun Ethnic Group and Khmer in the two world heritage sites. 2. Objective
• To study desirable personality of the Thaipuan Ethnic Group at communities in Sukhothai World Heritage Sites in Thailand
• To analyze component factor of desirable personality of the Thaipuan Ethnic Group community at Sukhothai World Heritage Sites in Thailand.
3. Methodology 3.1 Qualitative research was used for data collection from In-Depth Interview form with In-Dept Interview with structural form with 100 peoples comprised 50 Thaipuans collected from communities at Sukhothai World Heritage Site in Sukhothai Province in Thailand and 50 Khmers collected from communities at Angkor Wat World Heritage in Siem Reap Province in Cambodia. The quantitative research was survey research with 500 peoples of Thaipuan Ethnic Group communities who live at Sukhothai World Heritage Site. 3.2 Quantitative research was survey research with 500 peoples of Thaipuan Ethnic Group who communities who lived in Sukhothai World Heritage Site. 4. Results
4.1 In-Depth Interview The results of In-Depth Interviews with peoples comprised 50 Thaipuans, and 50 Khmers from both of the world heritage sites. The two main findings included genetic and environmental factors as the followings. 4.1.1 Genes (Heredity) or potential congenital (Inborn potentialities) is carried out with babies from birth. 4.1.2 Personality is influenced by the environment around the person. 1) Nature 2) The social

ISSN 2039-9340 Mediterranean Journal of Social Sciences Vol. 3 (11) November 2012
340
Content analysis of personality components related to Thaipuan ethnic group at communities in Sukhothai and Angkor Wat World Heritage Site, then be selected and developed to set the questions, amount of 80 items. Then led to explore the Thaipuan ethnic group by identified the people who lived in the areas of the world heritage community in the old town district, Sukhothai Province, and Khmer at communities in the world heritage Angkor Wat in Siem Reap Province in Cambodia. 4.2 Survey Research results The questionnaire was used to collect data from 500 peoples of Thaipua ethnic group who communities who lived at Sukhothai World Heritage Site. Then the factor analysis was used for component determination. There were 6 components were constructed as presented in table 1 as followings. Table 1 Components of Desirable Personality of the Thaipuan Ethnic Group Communities at Sukhothai World Heritage Sites
Components Number of Variables
Weight
1) Honesty, patience and dedication are personality of the people in the world heritage sites.
15
0.652-0.351
2) Sources meditation practice, moral, and giving would be go along with world heritage sites.
8
0.552-0.370
3) Experience of building and biological knowledge of the ancestors should be inherited from generation to generation continuously.
10
0.584-0.510
4) Creator of the world heritage is the king who practices dharma would be a representative of the personality for his people.
6
0.470-0.316
5) Traditional craft literacy education as a mechanism for public integrity. 5 0.762-0.490 6) World heritage reflects sufficient agriculture as remind the patience and kindness.
5
0.653-0.431
From table 1, the finding indicated that there were 6 components of desirable personality of the Thaipuan Ethnic Group communities at Sukhothai World Heritage Site. The 6 components comprising 1) Honesty, patience is the sacrifice of the people in the world heritage sites with weight between 0.652-0.351, 2) Sources meditation practice, moral, and giving would be go along with world heritage sites with weight between 0.552-0.370, 3) Experience of building and biological knowledge of the ancestors should be inherited from generation to generation continuously with weight between 0.584-0.510, 4) Creator of the world heritage is the king who practices dharma would be a representative of the personality for his people with weight between 0.470-0.316, 5) Traditional craft literacy education as a mechanism for public integrity with weight between 0.762-0.490, and 6) World heritage reflects sufficient agriculture as remind the patience and kindness with weight between 0.653-0.431. 5. Discussion World heritage in the urban context, researchers have been studying and collecting information about Sukhothai Historical District, geography, territory size and location, and topography, climate, populations, natural resources, from the past to the present including forest, water and minerals, occupation of the people in the community, agricultural, trade, craft, education, politics, society, economy, result in disciplinary of personality in sacrificing integrity and patience of the Thaipuan ethnic group. Community context of world heritage in Cambodia, information was collected at the history of the village, the territory, geographic, communication population structure, occupation, density of population, health, natural resources. From the past to present, beliefs of the people in the community, education, politics, economy and society ,the character of the discipline, sacrifice, honesty and tolerance of Khmer ethnic. This is consistent with the theory of Ernest R. Hilgard (Hilgard. 1962) noted that personality means the majority of individuals as a way to adapt to the environment, each of which is a form of expression of different behaviors. It consistent with the personality theory, include with personality theory of Erikson or psychosocial theory. Moreover, it also pertinent tgo personality theory based on the concept of Cheldon who studied about the relationship of human body and the expression of various theories of individual personnel and theory of personal identity of Alfred Adler believe in the influence of heredity and environment affect to a person’s personality. Additionally, he also believed that, in pressure situations will make people with disabilities or people who lack

ISSN 2039-9340 Mediterranean Journal of Social Sciences Vol. 3 (11) November 2012
341
capacity, emphasize the distinctive personality to appear more prominent., then he concluded that the structure of his theory, the formation of personality is the result of what is congenital (Organism), because humans have a long period of being an infant, this will affect the personality of the ethnic of communities in Sukhothai and Angkor Wat World Heritage Site. Content analysis of personality components related to Thaipuan ethnic group at communities in Sukhothai and Angkor Wat World Heritage Site. Content analysis related to ethnic personality in the Kingdom of Thailand and the Kingdom of Cambodia, then be selected and developed to set 80 items. Then led to explore the Thaipuan ethnic group by identified the people who live in the areas of the world heritage community in the old town district, Sukhothai province, and Khmer identified by the communities in the World Heritage Angkor Wat in Siem Reap Province in Cambodia, be a number of 500 people according to criteria and terms of quantitative research methods with Exploratory Factor Analysis technique. It can be summarized as reasonable, in the study factors associated with ethnic personality of Thaipuan ethnic group at community in Sukhothai and Angkor Wat World Heritage Site. 6. Recommendation Indigenous development in the Mekong sub-region, in the perspective of global approach, it can be used as guideline for national development strategies in terms of education policy in the Mekong sub-region countries which consists of 6 countries: Republic of China, Kingdom of Cambodia, Union of Myanmar, Laos, Socialist Republic of Vietnam, and Thailand.
Moreover, the leader of each country should have strategy for promotion and development of world heritage sites including promote community and social level to know and understand for development strategy and distribute to global level.
Reference
Cambodia. (2012). the World Heritage Angkor Wat. Retrieved fromhttp://www.visit-mekong.com/cambodia/angkor-wat/ Department of Art of Thailand. (1962).Announcement of Department of Art: Discovery Asia Thailand World. (2012). Sukhothai Historical Park Travel Guide. Retrieved from
http://www.thailandsworld.com/index.cfm?p=120 Gosling, B. (1991). Sukhothai Its History, Culture, and Art. Bangkok: Asia Books. Hilgard E.R.and Atkinson R.C. (1962). Introduction to Psychology N.Y. : Marcourt Brace and world. Mikusol, P. (1984). I-San Tradition. Bangkok: Tanawich Publishinng. Natsupa, C. (1997). Thai Culture and Process of Social Change. 4th Edition. Bangkok: Chulalongkorn Press. Punpeamrat, K. (2009). Progress of Agriculture. Bangkok: Se-education.


ISSN 2039-9340 Mediterranean Journal of Social Sciences Vol. 3 (11) November 2012
343
The Feminist Analysis of Shirley Jackson’s The Lottery;
A Dominant-Discourse-Control Framework
Dr. Seyed Mohammad Hosseini-Maasoum1
Email:
Department of Linguistics & Foreign Languages, Payame Noor University, I.R. Iran [email protected]
Hoda Davtalab
Department of English, Quchan Branch, Islamic Azad University, Quchan, Iran
Email: [email protected]
Mahnoosh Vahdati
Department of Linguistics & Foreign Languages, Payame Noor University, I.R. Iran Email: [email protected]
Doi:10.5901/mjss.2012.v3n11p343
Abstract: Feminism, originating in late 19th century, is a cover term for a series of movements which seek to define, establish and defend equal rights for women. It focuses on the women's issues and their problems in the society and aims at overcoming their problems. In the three main waves of feminism, many feminists such as Virginia Wolf, Simone de Beauvoir, and Kate Millet aired their views in their popular and famous books. This article deals with the application of feminist criticism to The Lottery by Shirley Jackson, considering Simone de Beauvoir's ideas based on her Second Sex. Many sentences and phrases are quoted through the article to illustrate the women's weakness and the men's power, the notion usually called “men’s control of the dominant discourse” in Beauvoir's words. There are some keys in the story showing that women are not satisfied with their ways of lives and try to change their current situation. Key words: Shirley Jackson, Feminism, The Lottery, Discourse-Control, Simone de Beauvoir. 1. Introduction A literary text can be reviewed from different angels and many literary criticisms can, thus, be applied to a single work. Feminism is almost a new school of thought which is becoming one of the most controversial frameworks for literary criticism. In the last few decades, feminist movements grew rapidly in different parts of the globe. Moreover, gender issues have become more important especially for female authors. It is necessary to mention that, in feminist movements, we deal with three main waves that began from different parts of the world, like France, Canada, United Kingdom and United States. It has been a long time since women were pushed into secondary roles. The Greek Philosopher, Aristotle, states that: “The relation of male to female is naturally that of superior to inferior, of the ruling to the ruled” (Taylor,2011, p.1).While some women rose to higher positions, Aristotle’s sexist view governed for two thousand years and the “dominant discourse” was empowered by men. These “patriarchal” views penetrated into many aspects of human life, including literature. With the passage of time and formation of many feminists' attempts, females sought to gain a more suitable position in society and enjoy rather equal rights. Women started questioning their inferior status and demanding amelioration in their social positions. As a result, feminism emerged and tried to solve women's problems in their families, cities and of course in the entire society. The signs of these issues can be found in a large number of literary works written by different feminist authors. Some of them are about extreme oppression and sexual discrimination against women in the societies where the “dominant discourse” is accredited by men. Therefore, a work is significant when it is been discussed from a feminist point of view. In the feminist criticism of a literary work, the reader has to consider the different issues and aspects of
1 . I should offer my special thanks to Mary Tavannai whose native-like proficiency was an asset in editing the first draft of this paper.

ISSN 2039-9340 Mediterranean Journal of Social Sciences Vol. 3 (11) November 2012
344
women’s behavior. Furthermore, the notions of paramount importance consist of portrayal of the relationship between men and women, the definition of male and female, the constitution of masculinity and femininity, representation of these traits by the story characters and problems of the female gender in the society. In this way the reader may compare the dominant power in the setting of a literary text with the same issues in the present time and the culture of a society. Therefore, the reader is able to recognize both the areas in which women have improved and the ones in which they haven’t achieved any considerable progression. In other words, the audience can make a comparison between the past and the present.
In addition, the readers can find the positive and negative aspects of females’ situations in the time the story was written, comparing issues like women’s employment in two different periods. All these can lead to a better understanding of being a woman in society. Now the following questions are raised: Can the feministic analysis of a literary text be influential in the reader's understanding and interpretation of that work? Will the reader's ideas and perspectives in the story change by using feministic approaches? If the answer is positive, to what extent will it be influential?
Literature reflects the cultural assumptions and attitudes of its period, including attitudes towards women, their expectations, their status and their roles. Knowing feminist aspects of one literary work can facilitate the reader's understanding of the minute aspects of the text, helping him read between the lines. It can extend the reader's worldview and enable him/her to think more deeply about the female characters and their true positions in the literary work. Paying more attention to the dialogues between the characters and considering the setting of the story, the reader will be able to recognize the situation of women in a literary work. Therefore, in this article attempts have been made to show feminist aspects of The Lottery by Shirley Jackson. The researchers try to match different aspects of this story by considering Simone de Beauvoir's ideas and her contemplation of feminism. Hence, Beauvoir's statements in Second Sex have been adopted as the theoretical framework of the present study. 2. Literature Review 2.1. Feminist Literary Criticism Feminist literary criticism is a literary approach informed by feminist theory, and also by the politics of feminism. Its history has been broad and varied, according to some works of nineteenth-century female authors such as George Eliot and Margaret Fuller. It Grew out of women's movement following World War II. This approach analyzes the representation of women in literature and truly discusses the concept of “dominant discourse” which is commanded by males. Though the ideas of individual critics differ, there is general agreement that interpretation of literature involves the critique of patriarchy. Patriarchy is the ideology that privileges masculine ways of thinking and marginalizes women politically, economically and psychologically. Feminist literary criticism before the 1970s was concerned with the politics of women's authorship and the representation of women's condition within literature in the first and second waves of feminism. Female works were not just lost, but deliberately suppressed by male critics who had previously convinced women that their interest in these texts was a sign of immature taste. Among feminist literary critics, we can mention some figures like: Isobel Armstrong, Nancy Armstrong, Barbara Anne K. Mellor, Toril Moi, Felicity Nussbaum, Eve Kosofsky Sedgwick, Hortense Spillers, Gayatri Spivak, Irene Tayler, Marina Bowen, Jennifer Devere Brody, Laura Brown, Margaret Anne Doody, Eva Figes, Sandra Gilbert and Susan Gubar, Annette Kolodny, Anne McClintock, and Warner. James Romesburg (2003) argued that: “The early feminist literary critics (in the 1960's and 70's) debated that men and women had different points of view about literature, and what had been considered as neutral about literature was really the male point of view.” This notion truly shows the discrepancy between men and women’s rights even in literature and also the status of women in contrast to that of men. Mathewson (2001, p.1) believes that literature never leaves women alone nor allows them to participate. It means that literature still has not defined an acceptable position for the women and an equal right for entitling the notion of “dominant discourse” which leads to the equality of rights in the society. Goal (2010, p.4) in her article feminism literary criticism discusses the notion of sexism. Adopting Hook's (1989) idea, “sexism is a particular form of oppression. Though there are also some other forms of oppression, e.g., racism and homophobia. These forms of oppression like sexism require too much effort to dismantle, but feminists’ “objective” is to end only sexism against the idea that women are subject to sexism oppression and that this is wrong” (cited in Goal, 2010).

ISSN 2039-9340 Mediterranean Journal of Social Sciences Vol. 3 (11) November 2012
345
2.2. Social Construction of Gender All feminists believe that there should be equal “rights” for men and women. Therefore, Kolodny (2001) argues: What unites and repeatedly invigorates feminist literary criticism is neither dogma nor method but an acute and impassioned attentiveness to the ways in which primarily male structures of power are inscribed (or encoded) within our literary inheritance: the consequences of that encoding for women - as characters, as readers and as writers; and, with that, a shared analytic concern for the implications of that encoding not only for a better understanding of the past but also for an improved reordering of the present and future (p.98). Thus according to Kolodny, what causes this situation to happen is our own way of thinking and acting toward women’s conditions. The inequality of rights have been rooted somewhere in literature, so it should be found and fixed. As Lorber (1994, p.3) points out gender cannot be equated with biological and physiological differences between men and women. He believes that for individuals, gender means “sameness” and for the society it means “difference”. Many feminists consider ‘woman’ differently. They don’t take woman as a sex term, but as a gender term that depends on social and cultural factors, like their positions in society. They distinguish sex (being female or male) from gender (being a woman or a man), although most ordinary language users appear to treat the two interchangeably. And what feminists should do is to define these two terms properly in order to find the women’s real status in society. In addition Garber (1992, p. 16) added:
“Genders are not attached to a biological substratum. Gender boundaries are breakable, individual and socially organized shifting from one gender to another calling attention to “cultural, social, or aesthetic dissonances”.
Therefore, like other feminists, Garber states that there should be a difference between gender and sex in society. And the only solution for eradicating this inequality is defining these two terms (gender and sex) properly. 2.3. Application of feminism to several literary works As discussed before, the feminist movement is divided into three main waves. The first wave began in 1830 and it lasted through 1920. In these periods women gained the right of vote known as suffrage. The second wave of feminism started during 1960s and continued into 1990s, mainly focusing on social and economic issues, women's employment and also sexual harassment. This wave began in 1990s. In this wave we witness a mixture of the previous two waves (West, 2010). Until now, many critics, authors, philosophers and even some students have attempted to show feministic aspects of a literary work. They practiced feminist criticism as political action, i.e., they set out to reinterpret the literary world and change that world by changing the consciousness of those who read (Rutgers, 1995 p.2). For example A Room of One’s Own written by Virginia Woolf, is viewed as a feminist work and is analyzed from this viewpoint by many groups. As Plain and Sellers (2007, p.66) mentioned, Virginia Woolf is considered as “the founder of modern feminist literary criticism”. They noted that Woolf's A Room of One’s Own constitutes a “modern primer” for feminist criticism, and her influence on later generations of feminists has been immense.
In 1942, Arnold Bennett and David Daiches wrote an analysis for this story. But these two critics have completely different ideas about Woolf's A Room of One’s Own. Bennett believes that Woolf's work is not a feministic work, but Daiches mentions that her work has feministic orientation. He believes that Wolf’s ideas are not just limited to women, but they also include all the people with brilliant minds who don't find any opportunity to show themselves. Therefore, we can claim that both these critics misinterpret Wolf’s ideas (Tetsuo, 2011, p. 2). If we take feminism as a political system of thought, we can claim that Woolf’s A Room of One’s Own is a non-feminism work and a political one. But this is just a hypothesis. In Woolf’s time, feminism was mostly defined as the right for vote but today it is more than that. In our age, feminism means the equal rights and social opportunities for women all around the world.
Feminist movements are not limited to political issues. The suffrage movement must have been as important to literary consciousness as was industrialization or a world war. Women should write in their own names and their names should be recorded in literary canons just like men (Brassier, 2007, p. 174). Wolf believes that only a few women writers have been able to shed the impediments that afflict their sex and write “as women write, not as men write” (Wolf, 1997, p.74). Therefore, there are many ways for people to express themselves and their emotions; however, women use a special kind of writing. We can prove this fact by Shwalter's statement in her linguistic model. She makes a difference between men's and women's writings in terms of “styles, themes, genres, and structures of writing” (cited in Rahaman,

ISSN 2039-9340 Mediterranean Journal of Social Sciences Vol. 3 (11) November 2012
346
2010, p.5). And this difference refers back to the idea of gender and not the sex issue. It shows that women’s concerns are different from those of men’s. Women try to find their place in society and fix it in the best possible way.
The Yellow Wallpaper is another short story which was written by Charlotte Perkins Gilman in 1892. It is a feminist short story in which Perkins shows women's difficulties as well as women's writing. There has been some feminist criticisms for this work. For example, Paula A Treichler (1984, pp.61-77) asserts that “the underlying narrative of The Yellow Wallpaper involves the narrator's confrontation with language, by which she defines patriarchal control and male judgment”. He adds that The Yellow Wallpaper is a “metaphor for women’s discourse”.
Criticizing this story, Deborah Thomas (1998) mentioned that before the twentieth century, men were completely powerful and women were affected by them. Colloquially speaking, husband and wife were one person as long as the law was concerned, and that person was the husband. Women were restricted from owning a property, signing legal documents, entering into contracts, obtaining an education, or keeping her own salary, without her husband’s permission (Condorcet, 1998, xix). Men perpetrated an ideological prison that subjected and silenced women. This ideology called “the Cult of True Womanhood legitimized the victimization of women”. On the other hand, Mitchell (1998, p.141) asserted that The Yellow wallpaper reflects men’s disparaging attitudes. The Yellow Wallpaper is a feminist text, because it promotes new ideas from Gilman and challenges old ideas about women’s position in society.
Papke (1995, p.10) describes his idea about feminist criticism of The Yellow Wallpaper, stating that women are considered just as the “emotional servants” who are in the dominance of their family and their society. She explores that in this story the author has attempted to “throw off women's restrictions”. The female character of Gilman’s story has broken out in triumph over an oppressive set of male characters. She entertains herself with writing and so finds herself alone against the norms of her society.
Violeta (2008) in her feminist criticism about this story asserts that women should be valued and cherished because they are women. Considering this notion, the idea of gender and sex will be raised again. Dolores Moore (2008) mentioned that through the story, we can't find the name of the protagonist or main character who is a woman. She added: In this instance, both Charlotte Gilman and her heroine, for what this woman was, suffered depression and were ordered to take a rest cure. Nothing must happen, just attend to domestic matters, any thinking, painting, writing, any creativity or individual expression. All that is wrong is a little nervous depression; just rest, good food, and gentle exercise will put you right. No, that was far from the truth. The female heroine overcomes oppression in many forms to find her own opportunities for personal choice. The story shows ugly and wrong social conventions that are second-nature to its male characters. It advances Gilman’s plan for change, and it illustrates a woman’s struggle to find equal opportunity in society.
Smith (2010) tries to express “political themes of feminism” by using different literary devices and the fact that the author has used a narrator who is “expressive about her feeling”. Smith believes that the protagonist in this story is dealing with two situations: She is either “insane” or “suffering”. In this story the focus is on the second one. Smith adds that the overall effect in The Yellow Wallpaper is that the reader leaves thinking that the protagonist's husband is more than a little responsible for the conclusion.
Cao Yu (2009) focuses on Jane Austin's story which is called Emma. She stated that since this writer was living in the latest 18th and the early 19th centuries, she dealt with discussing social status between men and women. Therefore, this issue was considered as one of the main conflicts at that time. It seems that men's rights were much more important than women's rights and men were more powerful than women. She believes that this story can be considered as a feminist story, because it deals with “moral equality” for both genders. She also notifies that economic situations can determine women's social status in their society.
In her article presented at a seminar that was held for Emma, Looser (2003) mentions that this novel can be considered as a feminist work. In this seminar some questions were raised considering this novel including: Why Mrs. Elton is given so many lines of dialogue that echo rights of women discourse? What does it mean that she has equally as many lines about the importance of women's submission in marriage? Is Austin presenting Mrs. Elton as a fake liberal, and if so, to what end? What is the importance of Mrs. Elton's many statements on sex roles? What is the connection of politics to ease and elegance? At the end, they reach to the same conclusion: “that the novel suggests it is only in the realm of courtesy that it is possible to have admirable ease and elegance”. But Looser herself still believes the question of Mrs. Elton's supposed feminism that continues to nag.
Batchelor (2008) also believes that this novel is a feminist novel as it “defies social expectations of a woman living in the nineteenth century”. Defending women's rights and seeking equality between the two genders are some reasons for proving this claim. Batchelor mentioned that Emma's power in the novel has broken many boundaries and biases that

ISSN 2039-9340 Mediterranean Journal of Social Sciences Vol. 3 (11) November 2012
347
limit them. Her character in the novel shows a new dimension of a woman's characteristics. In contrast, the lower characteristics of some women in the novel, like Miss Bates and Jane Fairfax, also cause a certain level of pity on the audience.
The woman in Austen’s novel is of the highest rank of society, wealthy, and she lives almost independently from men. Emma Woodhouse defies the social culture code of the time, and serves as a role model to those of her society. She has unusual views on marriage, as she declares that a woman in a position such as hers should not be inclined to marry, even though women who took on such a view were usually frowned upon. Moreover, she acts as the social and intellectual equal of the highest men in society and by this means; Austin tries to show equal rights for both men and women.
Another novel is Awakening (1899) by Kate Chopin. She has bravely applied the attitude of feminism in this novel. Phenix (2007, p.1), in her article, asserted that Chopin defied societal assumptions of her time period, using attitudes of characters in regard to gender, changes in the main character, imagery and Edna's suicide to illustrate her feminist position. At that time women couldn't participate in any social activities and their duties were restricted to cooking, ironing, washing, and they were considered weak creatures. Their legal rights were merged with those of their husbands (and prior to marriage, with their fathers). Until now, different people have analyzed different characteristics of this novel within a feminist frameork. For example, Mercedes (2009) considers feminist analysis on Edna Pontellier's character in Kate Chopin's The Awakening. Based on Mercedes’s statement, “Edna's experimentation with art directly corresponds to her lifestyle and sexual experimentation. Throughout the novel, Chopin utilizes art as a means for Edna to 'cast off' the unpleasant positions as wife and mother she has felt forced to accept. While Edna swims out farther and farther, she thinks of Leonce and the children” (p.9). Chloe Logan (2007) also considers Edna as the ideal character in her article. Critics have different ideas about this character: she is considered as “the motives of the 'fool woman' order of being,” or “her very suicide is in itself a prayer for deliverance from all the evils that beset her, all of her own creating,” and also “the waters of the gulf close appropriately over one who has drifted from all right moorings.”
Society of Chopin's time believed women to be a weak, dependent gender whose position laid nothing above mothering and housework. Just as Edna did not conform to the standards of her peers, Kate Chopin rebelled against her own peers by writing the novel, The Awakening. She uses attitudes of characters in her novel toward gender, changes in Edna and her suicide to express her own feminist attitudes. Chopin was rejected from communities as a result of her strong feminist views and great ability to express them.
Simone de Beauvoir’s second collection of short stories called La Femme Rompue (The Woman Destroyed), which was published in 1967, has been criticized in feminist point of view. In her novel, The Woman Destroyed, Simone de Beauvoir provides an effective psychological illustration of the miscarriage of a woman in marriage. Beauvoir pictures the thoughts and confidences of one beset by inner turmoil, while she also depicts the marriage as it appears from the outside. The protagonist in this story is Monique. Monique's situation in this story is very similar to Beauvoir’s personal experiences. The story can be divided into three parts, each part including a “two-month period during Monique's breakdown”. In the first part we deal with “relatively healthy mind”. But in the second part, we will find her problems. Weinstein (2003, p. XXI) argues that:
Art also gives us access to more wisdom, more harnessing of our resources, a deeper grasp of how extensive those resources are, how much more dimensional our lives are or could be. I am focusing here on feeling, pain and illness as ways to get at life.
2.4. Simone de Beauvoir's (1952) Ideas Scientific and psychological understanding of Beauvoir's personality can be rooted in her indigenous culture. It is obvious that various aspects of a person’s life could change by culture transformation. In her famous book, The Second Sex, Beauvoir talks about her especial points of view. In this book she describes social realities, mental and objective aspects in the form of existentialism to explain the notion of sex and gender (cf. Beauvoir, 2001, p.34). In the first part of her work, she considers sex in relation to naturalism, but in the second part she notices the notion of gender and considers historical, social and personal realities. She indicates that we are not born as a woman but we become a woman and we change into a woman. It shows that society always imposes everything on women and forces them to do something (Yazdkhasti, 2005). In The Second Sex, Beauvoir shows that women are free to choose their destiny as much as men. Furthermore, women do not have to obey what is supposedly dictated to them by nature and convention. Beauvoir considers the theory of gender inequality and believes that men are in one level and women are in another level. She argues that the role of

ISSN 2039-9340 Mediterranean Journal of Social Sciences Vol. 3 (11) November 2012
348
culture is very important in forming a society where there is no difference between these two levels. Therefore, she destroys the idea of being a man or a woman (Rodgers, 1998, p.99). Simone de Beauvoir’s works show that women have historically had their being defined for them as opposed to by them. She also encourages women to recognize their freedom and define their being. She believes that women should free themselves from the enslavement of a society whose rules and obligations are dictated by men. Another theory that Beauvoir talks about is “The other” theory that is tried to be seen as a social problem. She maintains that the female is not male, she becomes “The other” whose existence is defined by men and that women are considered as “secondary” or “nonexistent” players in their society (cited in Bressler, 2007, p.173). Beauvoir rejected the conventional marriage and encourages her young female readers to challenge life. 3. Methodology The present article is a qualitative and descriptive research which seeks to apply feminism to one literary work. Therefore, feminism was studied broadly in this paper and many feminists’ books, articles and ideas were studied to survey with their approaches. Among different feminists, Simone de Beauvoir was selected as the theoretical framework for some special reasons. The first reason is that she speaks naturally and clearly. She has a perfect and reasonable relation with her audience. In addition, she applies feminist aspects and illustrates the patriarchal society very skillfully and alarms women by her fascinating tongue. She confirms all of her statements and gives a solution for the women's problem of “breaking the bonds”. Considering some exemplifications, an attempt has been made to find and illustrate some sentences in the story which are directly related to Beauvoir's ideas. In this way the reader can find practical application of Beauvoir's ideas in a literary piece. 3.1. Literary Analysis 3.1.1. Women in The Lottery: Considering Beauvoir's feministic point of view Up to now, the story of “Lottery” by Shirley Jackson has been studied from many points of view. The approaches of literary criticism vary according to the personal interests of each writer. For instance, some Marxist critics present their views about this story trying to evaluate the theme against their own criteria and ideology. Considering the struggle between old and new and by paying attention to different symbols throughout the story, we can get access to many facts and realities about The Lottery. In the current essay, the focus is on feminist aspects of this story, considering Simone de Beauvoir's ideas in her The Second Sex. Doing this, we should first consider the roles and situations of female characters and find different aspects of their characteristics. In addition, we should consider the relationship of female characters with each other and with other characters and examine any discrepancies between these relations. Then the role of female characters will be reviewed in relation to their male counterparts in the story and there will be men versus women. The paper also underlines the women's jobs in the story. Considering the attitudes of the characters and their specific world views, their orientations and situations are better understandable. In addition, we should find how powerful each female character becomes at the end.
There are some important characters in the story which have special roles in the main theme. Tessie Hutchinson is a woman who arrives late in the lottery. With no doubt we can say she is the most prominent female figure in the story. Mrs. Delacroix is the mother of Dickie Delacroix. Janey Dunbar is the wife of Clyde Dunbar and she draws for her husband. She has a son, whose name is Horace Dunbar. Because he is under sixteen, he is not old enough to draw for his father. Jack Watson is a teenager who draws for himself and his mother. Joe Summers is a coal dealer who conducts the lottery. He has no children. There are also many other characters in the story who are not important to mention in this feminist debate.
Beauvoir believes that not only women should know themselves in the society, but also they should know the definition of a woman. They must answer the question “What is a woman?” But their answer should not be “mankind” (cited in Bressler, 2007, p.173). Feminists have also urged that terms like ‘he’ and ‘man’ contribute to making women invisible – that is, to obscure women’s importance, and distracting attention from their existence (Spender 1985:144).
Throughout the whole story, we deal with some sentences which affirm this issue: “as they went to join their husbands” (Perrine, 1974, p.219), “Soon the women, standing by their husbands” (ibid) or when Mrs. Hutchinson says “Thought my old man was out back stacking wood,…”. Regarding Beauvoir's statements, we can conclude that in these sentences women are considered as “mankind” and by remarking her “existentialist vision” (Habib, 2005, p.682; Bressler, 2007, p.173) women are viewed as creatures whose existence depends on the men's existence, Adam before Eve – in

ISSN 2039-9340 Mediterranean Journal of Social Sciences Vol. 3 (11) November 2012
349
their creation myth as a couple. “Man is defined as a human being and woman as a female; whenever she behaves as a human being she is said to imitate the male”.
Although these kinds of thoughts have been imposed on women since a long time ago, women themselves also accept them. In fact, they accept that they should be always dependent on the opposite gender and obey them, so they can never be autonomous creatures. In a way, they work behind the scene in a patriarchy. They stay in the realm of inferiority, as though it is truly their place in society. Beauvoir challenges this kind of behavior. “To make oneself an object, to make oneself passive, is a very different thing from being an object”2
Beauvoir (2001, p. xxii) believes that men have had their own reasons for perpetuating duality of “Self” and “Other”. She examines the views of women and historical materialism and wants to know why women have been defined as the other. She points out that the body is not a thing but a situation (ibid, pp.30-31). Beauvoir doesn't accept all attempts to
. Therefore, women are imposed on to think of themselves as mankind and their duties are just housework, washing the dishes, bringing up the children…and they are debarred from their rights; what then of women’s eligibility for public functions? This makes men to define women in their own way.
Beauvoir wants women to find their real position in their society and not to allow men behave towards them as secondary creatures. As a result, she puts away generic labels and mentions in the present time “humanity is male and men define women not as herself but as relative to him” (cited in Bressler, 2007, p.173); This has always been a man’s world, and none of the reasons that have been offered in explanation have seemed adequate.
Through the story we can find the concepts of this statement very clearly. “The women, came shortly after their menfolk”, “they went to join their husbands”. Even the words and phrases which are used to describe women's appearances and their behaviors in the story are not pleasant; they are described by some unpleasant words such as “The women, wearing faded house dresses and sweaters…”, “Mrs. Hutchinson came hurriedly along the path to the square, her sweater thrown over her shoulders,…”, “She dried her hands on her apron,…”, “his wife was a scold”, “They greeted one another and exchanged bits of gossip…”.
In contrast, men are described quite pleasantly, even concerning their appearances, their situations and also their occupations. We can find men's absolute “power” through the story. “The lottery was conducted…by Mr. Summers who had time and energy to devote to civic activities”. In this sentence, the important role is given to a man who has “energy” and is considered as the manager of the lottery. He wears “a clean white shirt and blue jeans”, while all the women, as described above, are just householders and they do their works at home: “Wouldn't have me leave my dishes in the sink, now, would you Joe?”
Beauvoir (2001, p. xix) points out that “division of the sexes is a biological fact, not an event in human history and women have no autonomous history. What is clear in The Lottery, is that it shows negative stereotypes of women. Women are addressed by their first names among the villagers, without any title, like: “Tessie,” Mr. Summers said. However, men are addressed by some respectful titles like “Mr. Summers”. Because of these realities in the societies, Beauvoir said that men define what it means to be human, including what it means to be female. She believes that women are considered as the “Other” only because they are not a man. “He is the subject, he is the Absolute- she is the “Other” (Beauvoir, 2001, p. xvi).
But how can we find the notion of “Other” that Beauvoir has mentioned? Is there any clue in the story to show this? Are the women in The Lottery considered as the “Other”? The answer is almost clear. Adopting a completely feminist view, we can find this “Otherness” in many parts of the story: “The girls stood aside, talking among themselves, looking over their shoulders at the boys,…”. It implies that girls could only stand in a corner and look at the boys, but in the following sentences we have some words and phrases that show the freedom of boys in contrast to girls’ limitations. In the story, we can find the differences between the two genders apparently and in Beauvoir's term the fundamental asymmetry of the term “masculine” and “feminine” (Beauvoir, 2001; Habib,2005, p.683).
Therefore these kinds of prejudices are progressed even through the lower age and in childhood and it will be continued. It means one generation passes these kinds of prejudices and false opinions to the next. So the women in the next generations are forced to continue their ancestors' customs and accept them inevitably. In the story when Mr. Dunbar is absent in the lottery and his wife wants to draw, Mr. Summers tells her “Wife draws for her husband? Don't you have a grown boy to do it for you, Janey?” Is it tolerable to accept this idea that a teenager boy who is only sixteen years old can draw, but his mother can’t? To what extent should women tolerate this abjectness and suffering? Is it fair? Is it the culpability of being a woman in the society? Of course this is not the only example trough the story that shows the superiority of boys to their mothers. When Watson's boy raises his hand and says: “I’m drawing for my mother and me”, many people admire him and consider her mother as a blessed woman for having a boy who can draw instead of his father: “Glad to see your mother's got a man to do it”.
2 . (Beauvoir_brainyquote.com)

ISSN 2039-9340 Mediterranean Journal of Social Sciences Vol. 3 (11) November 2012
350
stabilize the condition of women (ibid, p. xxvii). In the story, there is a black box which is a symbol of old traditions. Every year it is used in lottery. Now this black box is very old and there is a suggestion to get a new one. “The black box… had been put into use even before Old Man Warner, the oldest man in town, was born”. Having a feministic view, we can deem this black box as the false traditions and prejudices against women in social customs which are “stabilized” in minds.
The author tries to prepare the situation for some changes in the reader's mind delicately, by saying some sentences about changing the old box (“Every year, after the lottery, Mr. Summers began talking again about a new box…”), and also some whispers in the north village about giving up the lottery (“that over in the north village they're talking of giving up the lottery”). But people, especially men, are not agreeing with these kinds of changes and want to continue following their traditional customs. As mentioned above, if we consider the black box as the symbol of old traditions, the women's weakness is also one of these traditions which are pleasant for men. In the story, when Mr. Adams said to Old Man Warner that people are going to give up the lottery in another village, it is not pleasant for the Old Man Warner, who is the oldest man in the village. He believes that people should protect their customs even if women are suffering and he uses the phrase “Pack of crazy fools”. In addition, they delay making a new box because no one has the ability to change traditions and customs: “no one liked to upset even as much tradition as was represented by the black box”. It indicates that these customs are completely “stabilized” for them, and this is what Beauvoir challenges.
Beauvoir's statement (cited in Bressler, 5007, p.173) that “women must reject the societal constructs that men are the subject or the absolute and women are other”, attracts our attention to the following sentence in the story: “but this also had changed with time”. So Shirley Jackson tries to direct the reader to a new world in which there is some freedom for women and still breaking traditions to some extent. Based on the above quotation, everything would change through the time. Therefore, a revolution, improving the situation of women and affecting all aspects of their lives: their position in the family, society, economy, literature, etc, can also take place through the time.
So the author proceeds towards this aim little by little and finally reaches to the point that a woman allows herself to shout to a man and protest about the result of the lottery: “Tessie Hutchinson shouted to Mr. Summers. You didn't give him time enough to take any paper he wanted. I saw you. It wasn't fair!” Here Beauvoir's statement comes true: “women should break the bonds of their patriarchal society and define themselves if they wish to become a significant human being in their own right, and they must defy male classification as the other.” Although her protests don't lead to a good result, but the important thing, from feministic point of view, is that a woman is situated against a man and expresses her own identity. Therefore, she is trying to challenge the notion of being “the other”. 4. Conclusion Feminism is a movement which is followed by the women who believe their equal humanity is not affirmed on the grounds of reason and justice in society. It is both an intellectual commitment and a political movement that seeks fairness for women and the end of sexism in all forms. Feminist criticism deals exclusively with female characters, women’s issues, and how the female roles in a story, novel or play affect the other characters. In this paper the researchers tried to investigate the feminist aspects of The Lottery considering Simone de Beauvoir's ideas in The Second Sex. At first the roles and situations of female characters were considered and then different aspects of their characteristics were depicted in the story. In addition, the researchers discussed the relationship of female characters with each other and with other characters and examined any discrepancies between these relations. Then the roles of female characters were reviewed in relation to their male counterparts in the story and the ideas of “men versus women” and “dominant discourse” were debated according to The Lottery itself. The paper also underlines the women's jobs in the story. Considering the attitudes of the characters and their specific world views, their orientations and situations are more understandable. In addition, we should find how powerful each female character becomes at the end. There were many occasions in The Lottery where men were considered more aggressive than women. Mrs. Hutchinson, the protagonist in the story, is not respected enough even when she meets her husband who lets her know that the lottery is fair and she should not even complain about it. He just accepts her death as inevitability. In The Lottery, Jackson shows how the actions can be attached to socialism because the characters are expected to sacrifice themselves for the greater good of the community. Beauvoir encourages women to find their real positions in the society and not to allow men behave towards them as secondary creatures. So she puts away generic labels and deals with the present time. She states that humanity is male and men define women not as herself but as relative to him. Having a feministic attitude towards the story can completely change the reader's point of view and his/her understanding of the main theme. It makes space for the women’s voice which was previously muted or drowned out by dominant patriarchal literary-critical practices (Scherman, Sept 2009). By studying the feminist aspects of The Lottery, it will be expected that the previously held assumptions that marginalized the place of women in this story will be unveiled.

ISSN 2039-9340 Mediterranean Journal of Social Sciences Vol. 3 (11) November 2012
351
References
Batchelor,J (2008).” Is Emma a Feminist Novel?”. Dickson College. Beauvoir, S (1952). The Second Sex. New York: Modern Library. Bowlby, R (1997) Feminist destinations and further essays on Virginia Woolf. Britain: Edinburgh University press. Goel, Sh (2010). “Feminist Literary Criticism” in Language in India: Strength for Today and Bright Hope for Tomorrow. Volume 10. Habib M.A.R( 2005). A History of Literary Criticism. USA: Backwell Publishing. Hooks, B. (1989). Talking Back: Thinking Feminist, Thinking Black. Boston: South End Press. Jackson, Shirley. 2003. “The Lottery.” pp. 221-228 in Literature: An Introduction to Fiction, Poetry, and Drama, edited by X.J. Kennedy
and Dana Gioia. New York. Kolodny, A (2001). “Dancing Through the Minefield: Some Observations on the Theory, Practice, and Politics of Feminist Literary
Criticism.” The Norton Anthology of Theory and Criticism. Vincent B. Leitch, ed. New York: W.W. Norton and Company. Landes, Joan, “ The History of Feminism: ( Marie – Jean – Antoine – Nicolas de Caritat, Marquis de Condorcet)”. The Stanford
Encyclopedia of philosophy (winter 2010 edition), Edward N Zalta (ed), URL=<http:// platoplato.Stanford.edu/archives/win 2010/entries /histfem – condorcet/>.
Logan, C. (2007). “Edna Pontellier as The Ideal Character” Looser. D (2003). Persuasions: The Jane Austen Journal. Journal Article. Retrived 2003, from http://www.questia.com/googleScholar
.qst?docId=5006474081 Lorber, J (1994).”The Social Construction of Gender” in Night to his Day. Mathewson, Kristine(2001). “Twain's Women”, Grade Saver LLC Mercedes A. (2009). “A feminist Analysis of Edna Pontellier in Kate Chopin's The Awakening “. Retrieved May 13, 2009, from
http://www.associatedcontent.com/article /1685333/a_feminist_analysis_of_edna_pontellier.html?cat=38 Millet, k (2000). Sexual Politics. Bloomingdale, IL: University of Illinois Press. Phenix, C. (2007). ”Feminism in Kate Chopin's The Awakening“. My 13, 2007. Plain G & Sellers S. (2007). A History of Feminist Literary Critisism. UK: Cambridge University Press. Rahaman, V (2010). About Elaine Showalters Theory of Gynocriticism. India: Lovely Professional University Punjab. Rutgers, Scilis (1995). Vandergrift's Feminist Readings. The State University of New Jersey Smith, N (2010). The Yellow Wallpaper: Gilman’s Technique in Portraying the Oppression of Women. Article Myriad. Retrieved 2002,
from http://www.articlemyriad.com/yellow Taylor, Rupert (2011). Early History of Feminism. http://www.suite101.com/article/early-history-of-feminism Timothy H. Scherman: Feminist Literary Criticism Northeastern University, Web. Sept 2009 Treichler, Paula A. (1984). “Escaping the Sentence: Diagnosis and Discourse in ‘The Yellow wallpaper.’” Tulsa Studies in Women's Literature 3. Vandergrift's Feminist Readings (1995), Rutgers, The State University of New Jersey Weinstein, Arnold (2003). A Scream Goes Through the House: What Literature Teaches Us About Life. New York: Random House. Weir S. (1998). “Wear and Tear, or Hints for the Overworked.” Charlotte Perkins Gilman: “The Yellow Wallpaper.” Ed. Dale M. Bauer.
Boston: Belford Books. http://www.brainyquote.com/quotes/authors/s/simone_de_beauvoir.htm/ http://www1.assumption.edu/users/ady/hhgateway/gateway/approaches.htm l


ISSN 2039-9340 Mediterranean Journal of Social Sciences Vol. 3 (11) November 2012
353
Development of Model of Water Conservation through PAIC Process
Chalermsak Udonboon
Department of Environmental Education
Faculty of Environment and Resource Studies Mahasarakham University, Mahasarakham 44150, Thailand
Nongnapas Thiengkamol
Major Advisor, Department of Environmental Education
Faculty of Environment and Resource Studies Mahasarakham University, Mahasarakham 44150, Thailand
Chatchai Thiengkamol
Co- Advisor, Director of Research In Motion Co., Ltd.
Bangkok 10900, Thailand
Doi:10.5901/mjss.2012.v3n11p353 Abstract: The objective of this research was to develop a model of water conservation for secondary school student. The integrative method research was done with participatory action research with Participatory Appreciate-Influence-Control technique (PAIC). Populations were upper secondary school students of academic year 2012 of Kalasin Province. The questionnaire and evaluation forms were be used as tool for data collection and the sample was selected by purposive sampling technique. PAIC was implemented with the integration of SWOT analysis and brain storming during the training process. The 53 upper secondary school students were selected by purposive sampling technique from Kalasin Pittayasan School, Amphur Muang, Kalasin Province for training with PAIC. One -Way-ANOVA and t-test were used for data analysis.The research results illustrated that before and after PAIC process implemented, the mean scores of posttest of training achievement The research results revealed that before and after PAIC training process implemented, the mean scores of posttest of training achievement on characteristics of Environmental Education Trainer (EET), inspiration of public consciousness, environmental conservation behavior, water conservation, and training achievement were higher than pretest with statistical significance (p< .01, p< .01, p< .01, p< .01, and p< .01). Three Dimensional Evaluations were employed for determination the perceptions of 53 upper secondary school students in three aspects evaluation covering Self-evaluation, Friend-evaluation, and Facilitator-evaluation by using One-way ANOVA in order to investigate the participation of upper secondary school students showed that there were no difference of mean scores about participation in training process through brain storming with statistical significance (p>.05). Key Words: Model of Water Conservation / PAIC Process
1. Introduction The Intergovernmental Panel on Climate Change (IPCC) is a scientific intergovernmental body (IPCC, 2010, & The Royal Society, 2005) charged to review and to assess the most recent scientific, technical and socio-economic information produced worldwide relevant to the understanding of climate change. It affords the globe with a apparent scientific observation on the in progress state of climate change and its potential environmental and socio-economic results, markedly the risk of climate change sourced by human activity. The panel was first established in 1988 by the World Meteorological Organization (WMO) and the United Nations Environment Programme (UNEP), two organizations of the United Nations. The IPCC shared the 2007 Nobel Peace Prize with former Vice President of the United States Al Gore (Wikipedia. 2011).
IPCC observed on impacts of climate change and revealed the new obvious evidences that during five decades. The human activities were most important effect of global temperature rising over all area of the world at average of 1.4-5.8 Celsius degrees. The change of climate has been vigorous and more frequently. The obvious examples of climate change are violent drought, storming, flooding, hurricane, tornado, and earth quake. It has caused tremendously loss of

ISSN 2039-9340 Mediterranean Journal of Social Sciences Vol. 3 (11) November 2012
354
million species of living things due to lost habitats and ecological imbalance including occurring acidity of sea water and changing of ocean currents, therefore, the small glacial age has occurred in European continent and fluctuation of climate in different areas (Sutayasue, 2010).
The risen of global temperature has affected to the ecological system obviously. Such as the rain is not raining according to periodic time and the amount of rain changes, the major change has been caused by deforestation, particularly in the tropical rain forest areas in Asia and Africa continents. Besides the global warming has loosen biodiversity of ecological system, the sea level and temperature in the sea has risen but it also impacted to ecological system of sea shore. Current sea level rise potentially impacts human populations such as those living in coastal regions and on islands and the wider natural environment such as marine ecosystems (Bindoff et al, 2007, & Fischlin, 2011).
Global average sea level rose at an average rate of around 1.8 mm per year over 1961 to 2003 and at an average rate of about 3.1 mm per year from 1993 to 2003. It is unclear whether or not the increased rate observed between 1993 and 2003 reflects an increase in the underlying long-term trend (Dahlman, 2009). However, Sea level rise is one of numerous lines of proof that strongly support the view that the climate has recently warmed (Solomon et al, 2007 & Hegerl et al, 2007). This also has caused the coral bleaching, therefore it has taken long time for recovering, and then it impacted to fishery and tourism industry. For health aspect, the climate change of temperature and humidity have caused the rapid growth of mosquito and increased the vector of malaria and dengue fever infection. Additionally, the water born disease likes as diarrheas disease has increased as well. The poor people have threatened by the climate change because they lack knowledge and good health service perceived.
Moreover, the reports of natural disasters covering volcano eruptions, earthquakes, Tsunamis, various kinds of storms including tornadoes, thunderstorms, floods, droughts, fires, landslides and
mudslides, blizzard and avalanches, and human epidemics and animal diseases have occurred more frequently. The opinions of scientists over the world are congruent that the green house gases are the essential factors of these phenomena of global warming and it is cause of these natural disasters (Kotchasenee, 2010, & Bicknell, et al., Eds. 2009).
The primary green house gases in the Earth’s atmosphere are water vapor, carbon dioxide, methane, nitrous oxide, and ozone. Green house gases to a great extent influence the temperature of the Earth. Earth's surface would be on average about 33 °C (59 °F) colder than at present. Since the beginning of the Industrial Revolution, the burning of fossil fuels has contributed to the increase in carbon dioxide in the atmosphere from 280 ppm to 390 ppm, in spite of the uptake of a great portion of the emissions through various natural “sinks” involved in the carbon cycle. Carbon dioxide emissions come from combustion of carbonaceous fuels such as coal, oil, and natural gas. Carbon dioxide is a product of combustion of carbon, and burning coal also produces carbon monoxide (Lindeburgh, 2006).
Influencing of global warming to Thailand, even though, the climate change is not extremely affected to the agricultural sectors at over all view because most of the agricultural areas are supported by irrigation system but Thailand frequently affected by the floods almost every year, particularly, this year Thai people are facing with violent flood over the country. The Northeastern region is the driest region of the country; therefore it has a chance of water shortage in summer season for food and vegetable cultivation. The shortage of water influenced to economic and social aspects as well. Furthermore, it also impacted to water resources, especially; the river, canal, swamp, and pond would be dried in the summer season. This will affected to the breeding and growth of water plants and animals such as fish, crab, and shrimp. Therefore, the number and diversity of living things will decrease and results in decrement of biodiversity and florist in Great Mekong Region in the Northeastern region of Thailand (Thiengkamol, 2005b).
However, if climate change is still going on, Thailand might face with flood in some part of country and drought in some area such as Northeastern region. Therefore, the natural disasters will be repeated occurring every year. It was revealed that there are various areas will face to floods, landslides and mudslides covering 12 provinces included Chiang Rai, Chiang Mai, Nakhon Sawan, Pa Yao, Pichit, Pitsanulok, Lumpoon, Sukhothai, Chanthaburi, Nakhon Nayok, Prajeenburi, and Trang. Moreover, the villages nearby Cha Phraya River, the main river of country, are also affected. For drought, it is accumulated the vigorous water increment, it was found that 34 percents of villages over the country have faced with risk of water shortage, and drought, particularly, Northeastern region is in the high risk of drought (Office of Natural Resources and Environmental Policy and Planning, 2009). The estimation of water demand of whole country is 57,302.8 million cubic meters per year. For only agricultural sector has water demand of 51,786.2 million cubic meters or 90 percents per year. It forecasted that the total water shortage over the country will be approximately 4,737 million cubic meters per year (Office of Natural Resources and Environmental Policy and Planning, 2009).
From the above, it can be concluded that every region of Thailand will face with water problems in both quantity and quality. Presently, the demand of water consumption has increased in all sectors whether agriculture, industry, and household consumption but the quantity and quality of water is decreased because of water resources were contaminated with toxic substances that drained from community, factory and agriculture.

ISSN 2039-9340 Mediterranean Journal of Social Sciences Vol. 3 (11) November 2012
355
The great problems of degradation of water resources and water shortage as mentioned above, different findings showed that the people are lacking knowledge and understanding, awareness, positive attitude, public consciousness and responsibility for natural resources and environment conservation such as look after water resources, and lack of measurement to control people who lacked of consciousness to maintain and use fresh water effectively (Thiengkamol, 2011e, & Vichaidit, 1994).
Therefore, to develop people, especially, new generations to use water with minimization and realize the value of water resources, it needs to cultivate them with environmental education process through different channels of educational system whether with Formal Education System, Non-Formal Education System, Informal Education System, and Lifelong Education System (Thiengkamol, 2011e). Particularly, the youths who are students by providing teaching and learning process with various activities to raise their knowledge and understanding, awareness, positive attitude, public consciousness and responsibility for natural resources and environment conservation including water resources, it will lead to success mean of active learning process through brain storming of group dynamic activities. In addition, they will learn about the real situation of community and river resources to receive direct experience from direct contact by themselves. This will stimulate them to be good observers, be able to gathering data, discuss among their friends and their teachers including evaluating, decision making for problem solving. Therefore, it will assist them to aware the importance of water resource and it will a good process for attitude and behavior changing to conserve natural resources and environment conservation (Thiengkamol, 2011e, UNESCO, 1978 & Sariwat, 2010).
As mentioned above, the problems of lacking knowledge and understanding, awareness, positive attitude, public consciousness and responsibility for water resource conservation is critical factor of water shortage. Moreover, over consumption without economization is also another essential factor to cause water shortage in sectors of water for consumption, agriculture, industry and tourism industry. This research emphasized on development of a model of water conservation and river conservation for upper secondary school student under the Office of Kalasin Educational Area Zone 24 to encourage them with behavior change in their daily life activities. 2. Objective The objective of this study was to develop a model of water conservation for upper secondary school student under the Office of Kalasin Educational Area Zone 24. 3. Methodology The research design was implemented in steps by step as follows: 1) Construction of handbook for water conservation through environmental education process covered knowledge and performance of environmental education, global warming, environmental education characteristics, inspiration of environmental conservation and environmental behavior (Charoensilpa, Thiengkamol, Thiengkamol, and Kurokote, 2012, UNESCO, 1978, InWent-DSE-ZEL, 2002, Thiengkamol, 2004, Thiengkamol, 2009a, Thiengkamol, 2009b, Thiengkamol, 2011a, Thiengkamol, 2011e). The research tools composed of test, questionnaire and evaluation form. The test was used for determining their knowledge of water conservation through environmental education process covered knowledge and performance of environmental education, global warming, environmental education characteristics, inspiration of environmental conservation and environmental behavior. 3) The evaluation form of Three Dimensions, Four Dimensions were constructed to assess the participant practice during PAIC implemented. 4) 53 upper secondary school students were selected with purposive sampling from secondary school students under the Office of Kalasin Educational Area Zone 24. They would be recruited according to the setting criteria (willingness, time, devotion, commitment, and public mind). 5) The 53 participants were employed for determining on characteristics of Environmental Education Trainer (EET), inspiration of public consciousness, environmental conservation behavior, water conservation, and training achievement. The systematic operation of 53 participants were trained with PAIC. The focus group discussion included brain storming and Training of Trainer (TOT) (Langly, 1998, Weiss, 1993, Sproull, 1988, InWent-DSE-ZEL., 2002, Thiengkamol, 2004, Thiengkamol, 2005b). The Three Dimensional Evaluation (TDE) was used to determination the congruence of three aspects evaluation, Self-evaluation, Friend-evaluation, and Facilitator-evaluation for training participation (Thiengkamol, 2004, Thiengkamol, 2005a, Thiengkamol, 2008, Thiengkamol, 2011a, Thiengkamol, 2011b, Thiengkamol, 2011c and Thiengkamol, 2011e).

ISSN 2039-9340 Mediterranean Journal of Social Sciences Vol. 3 (11) November 2012
356
4. Results 4.1 General Characteristics of Sample Group The sample group of this study was 53 upper secondary school students that were selected by purposive sampling technique from secondary school students under the Office of Kalasin Educational Area Zone 24 in the academic year of 2012. The selected sample was student who selected to study the subject of Environmental conservation activities with interested in participation of river and water conservation. Most of them were female with 67.92%, studied at level four with 89.79% as shown in table 1. Table 1 Demographic Characteristics of Sample Group
Characteristics
Upper Secondary School Students
Frequency Percent Sex Male Female
17 36
32.08 67.92
Education Level Level 4 Level 5
46 7
89.79 13.21
Total 53 100
4.2. Results of Pretest and Posttest with PAIC technique PAIC technique was trained for 53 upper secondary school students about knowledge of water conservation. The research results revealed that before and after PAIC training process implemented, the mean scores of posttest of training achievement on characteristics of Environmental Education Trainer (EET), inspiration of public consciousness, environmental conservation behavior, water conservation, and training achievement were higher than pretest with statistical significance (p< .01, p< .01, p< .01, p< .01, and p< .01), as illustrated in table 2. Table 2 Pretest and Posttest of Sample Group
Training Issues
Posttest Pretest t
p X
S.D. X S.D.
Characteristics of EET 14.56 0.73 10.52 0.65 9.02 .00**
Inspiration of Public Consciousness 18.52 1.21 12.34 1.01 11.85 .00**
Environmental Conservation Behavior 16.48 1.35 14.16 1.57 12.30 .00**
Water Conservation Behavior 16.08 1.82 13.08 2.03 14.18 .00**
Training Achievement 64.42 3.01 48.56 4.02 15.32 .00**
** Significant Level at .01 4.3 Results of Three Dimensional Evaluations for Participation Three Dimensional Evaluations were employed for determination the perceptions of 53 secondary school students in three aspects evaluation, Self-evaluation, Friend-evaluation, and Facilitator-evaluation by using One-way ANOVA in order to investigate the mean scores difference of three group. The results of One-way ANOVA showed that there were different of mean scores about participation in training process through brain storming with statistical significance (p>.05) as illustrated in table 3. This meant that the perceptions of secondary school students about themselves, their friends in the group and their facilitators were no different for their participation in the focus group discussion during training process.

ISSN 2039-9340 Mediterranean Journal of Social Sciences Vol. 3 (11) November 2012
357
Table 3 Three Dimension Evaluation of Sample Group Participation
Source of Variation Sum of squares df Mean Square F Sig.
Between Group Within Group Total
1.530 51.792 53.322
2 156 158
.765
.332 2.302 .104
** Significant Level at .01 The Scheffe was used for analysis of each pair of Three Dimensional Evaluation (TDE) to determine the mean score differences of their participation in the training process of PAIC, it showed that each pair of Self-Evaluation and Friend-Evaluation, Self-Evaluation and Facilitator-Evaluation, and Friend-Evaluation and Facilitator-Evaluation were no statistical difference (p>.05, p>.05 and p>.05) as illustrated in table 4. Table 4 Scheffe’ Analysis of Each Pair Comparisons
Each Pair of Variables Mean Diff(I-J)
Std. Error
Sig.
95% Confidence Interval
Lower Bound Upper Bound
Self-Eva. and Friend-Eva. -1.33811 .60838 .079 -3.1017 -.1945 Self-Eva. and Facilitator-Eva. -1.21245 .60838 .072 -3.1860 -.2889 Friend-Eva. and Facilitator-Eva. -.09434 .60838 .988 -1.5979 1.4092
* Significant Level at .05 Considering on mean scores of Three Dimensional Evaluation, the total mean scores of 5 aspects of evaluation items covering Participation in Asking Questions, Participation in Answering Questions, Participation in Discussing, Participation in Activity Doing, and Participation in Activity Evaluating during focus group discussion with brain storming process, the findings discovered that 5 aspects of participations and total mean score of Self Evaluation was lower than Friend Evaluation and Facilitator Evaluation as presented in table 5. Therefore One-Way ANOVA was employed to analyze the differences of mean scores of three aspects, it was found that there were no difference with statistically significant at level of .05 as presented in table 4. Table 5 Mean Scores of Three Dimensional Evaluations
Evaluation Items Self Evaluation Friend Evaluation Facilitator Evaluation
X S.D. Level X S.D
Level X S.D Level
1. Participation in Asking Questions 3.74 .78 high 3.90 .86 high 4.04 .78 high 2. Participation in Answering Questions
3.78 .74 high 3.98 .82 high 3.98 .99 high
3. Participation in Discussing 3.98 .80 high 4.42 .69 high 4.44 .58 high 4. Participation in Activity Doing 4.16 .74 high 4.26 .72 high 4.52 .54 high 5. Participation in Activity Evaluating 4.14 .81 high 4.28 .73 high 4.02 .82 high Total 3.96 .61 high 4.13 .66 high 4.20 .43 high
During, the PAIC training implemented, focus groups discussion and brain storming were integrated, therefore, it is obviously seen that after training they had intended to run 4 pilot projects from 6 projects. They search the way to maintain the four pilot projects with different ideas being suggested during this brain storming process in order to meet their intentions of water conservation to prevent fresh water shortage and in order to alleviate global warming, especially in accordance with the action plan of “Water Conservation” across the Northeastern region. The four pilot projects including the first project was “Save Tape Water”, the second project was “Monitoring the Water Leakage for My House”, the third project was “Surveying Tape Water Appliance Effectiveness” and the fourth was “Practice Daily Life for Water Conservation”. After four of projects were implemented, the students realized that all activities would be implied to explained, they accomplished the Concept environmental education and global warming alleviation. The PAMEI used for

ISSN 2039-9340 Mediterranean Journal of Social Sciences Vol. 3 (11) November 2012
358
participatory assessment, participatory monitoring, participatory evaluation and participatory impact were approval for projects implementation. 5. Discussions The results indicated that the secondary school students had knowledge of water conservation through environmental education process covered knowledge and performance of environmental education, global warming, environmental education characteristics, inspiration of environmental conservation and environmental behavior after participating in the PAIC training. These were congruent to a variety of studies of Thiengkamol, (2004, 2005a, 2005b, 2010b, 2011b, 2011c, 2011g, 2011h, 2011i: in press & 2012). It might be explained that the training with PAIC technique is able to raise knowledge in various issues and for different target groups and it can be used for stimulation the knowledge and performance of environmental education, global warming, environmental education characteristics, inspiration of environmental conservation and environmental behavior after participating in the PAIC training through genuine practicing behavior in their daily life activities for global warming alleviation. The findings are also pertinent to the results of different studies of Thiengkamol, and Thiengkamol colleagues (2004, 2005a, 2005b, 2010b, 2011b,2011c, 2011a, 2011g, 2011h, 2011i, 2011j, 2012a, & 2012b) and researches of Sukwat, Thiengkamol, Navanugraha, and Thiengkamol, 2012, & Wattanasaroch, & Thiengkamol, 2012, & Jumrearnsan, & Thiengkamol, 2012 that the participation is affected to water conservation and river conservation for global warming alleviation to meet sustainable development through environmental education process covered knowledge and performance of environmental education, global warming, environmental education characteristics, inspiration of environmental conservation and environmental behavior.
The results of TDE of 53 participants were employed for determination of the congruence of three aspects evaluation, Self-evaluation, Friend-evaluation, and Facilitator-evaluation. The mean scores three aspects were no difference among three aspects (p>.05, p>.05, and p>.05). The mean scores of Self-Evaluation was lower than mean scores of Friend-Evaluation and Facilitator-Evaluation, so it indicated that the participants evaluated themselves lower than friend and facilitator because they are humble persons that are general style of Thai children. Additionally, TDE was used to evaluate the participation of secondary school students; it was found that the mean scores of Self Evaluation, Friend Evaluation and Facilitator Evaluation were at high level as illustrated in table 5. It might be concluded that secondary school students during training process as illustrated in table 5 paid attention for training process participation at very good level. The result of training was pertinent to different studies of Thiengkamol, (2004, 2005a, 2005b, 2010b, 2011b,2011c, & 2011a) and researches of and Thiengkamol colleagues such as Sukwat, Thiengkamol, Navanugraha, and Thiengkamol, 2012, & Wattanasaroch, & Thiengkamol, 2012. Furthermore, it was found that PAIC training is effective for training with integration of brain storming process to develop a shared vision, action plan and projects in different issues of training such as energy conservation, urban community food security management, environment and natural resource conservation, development of health cities network for Mekong Region, development of women’s political participation in Pattaya City, community strengthening, environmental management in dormitory, and soil and water conservation (Thiengkamol, 2004, Thiengkamol, 2005a, Thiengkamol, 2005b, Thiengkamol, 2010b, Thiengkamol, 2011b, Thiengkamol, 2011a, Thiengkamol, 2011g, Thiengkamol, 2011h, Thiengkamol, 2012b, Wattanasaroch, & Thiengkamol, 2012, & Sukwat, Thiengkamol, Navanugraha, and Thiengkamol, 2012). Additionally, the results of training achievement was congruent to numerous studies of Thiengkamol, (2005a, 2005b, 2010b, 2011b, 2011c, 2011g, 2011h, 2012a, & 2012b), and Thiengkamol colleagues Wattanasaroch, & Thiengkamol, 2012, Sukwat, Thiengkamol, Navanugraha, and Thiengkamol, 2012, Jumrearnsan, & Thiengkamol, 2012, Saenpakdee, & Thiengkamol, 2012, Sukserm, Thiengkamol, and Thiengkamol, (2012)., and study of Jansab, 2006.
References Bicknell, J., D. Dodman, et al., Eds. (2009). Adapting Cities to Climate Change: understanding and addressing the development
challenges. London: Earthscan. Bindoff et al. (2007). Chapter 5, Introductory Remarks. Retrieved from http://en.wikipedia.org/wiki/Current_sea_level_rise#
CITEREFIPCC_AR4_WG12007 Charoensilpa, D., Thiengkamol, N., Thiengkamol, C., and Kurokote, J. (2012).Development of Environmental Education Characteristics.
Journal of the Social Sciences. 7 (2):71-76. Dahlman, L. (2011). “NOAA Climate Portal: ClimateWatch Magazine: Climate Change: Global Sea Level”. NOAA Climate Services.
Retrieved from http://www.climatewatch.noaa.gov/article/2009/climate-change-sea-level. Fischlin, A. (2011). “Section 4.4.9: Oceans and shallow seas – Impacts”. Chapter 4: Ecosystems, their Properties, Goods and Services.
p. 234. Retrieved from http://www.ipcc.ch/publications_and_data/ar4/wg2/en/ch4s4-4-9.html

ISSN 2039-9340 Mediterranean Journal of Social Sciences Vol. 3 (11) November 2012
359
Hegerl et al. (2007). Executive summary, Section 1.3: Consistency of changes in physical and biological systems with warming, in IPCC AR4 SYR 2007. IPCC. (2011). Organization. Retrieved from http://www.ipcc.ch/organization/organization.shtml
InWent-DSE-ZEL. (2002). Regional Training Course “Advanced Training of Trainer”. Grand Jomtien Palace. Pattaya City. Thailand. Jansab, S. (2006). Strategies for the Development of Women’s Political Participation in Pattaya City. Thesis of Master of Art Master of Art (Women Studies), Office of Women and Youth Studies of Thammasart University. Pimdee, P., Thiengkamol N,, Thiengkamol T., (2012) Psychological Trait and Situation Affecting through Inspiration of Public Mind to
Energy Conservation Behavior of Undergraduate Student, Mediterranean Journal of Social Sciences Vol 3 (3) Jumrearnsan, W. and Thiengkamol, N. (2012). Development of an Environmental Education Model for Global Warming Alleviation.
Journal of the Social Sciences, 7 (1):67-70. Kotchasenee, J. (2010). Human and Environment. Sixth Edition. Bangkok: Chulalongkorn University Press. Langly, A. (1998). “The Roles of Formal Strategic Planning” Long Range Planning. Vol. 21, No.1. Lindeburgh, M. R. (2006). Mechanical Engineering Reference Manual for the PE Exam. Professional Publications, Inc., Belmont: CA. Office of Natural Resources and Environmental Policy and Planning. (2009). Report the Situation of Environmental Quality. Bangkok:
Bejapol. Saenpakdee, A. & Thiengkamol, N. (2012). Formulation of Community Forest Act for Thailand. The Social Sciences, 7: 71-76. Sariwat,L. ( 2010). Psychological Work in Community. Bangkok: Se-education Limited. Sproull, N.L. (1995). Handbook of Research Method: A Guide for Practitioners and Scientific teachers in the Social Science. (2nd ed.).
Metuchen, NJ: Scarecrow Press. Solomon et al. (2007). Technical Summary, Section 3.4 Consistency among Observations, in IPCC AR4 WG1 2007. Sukwat, S. Thiengkamol, N., Navanugraha, C. and Thiengkamol, C. (2012). Development of Prototype of Young Buddhist Environmental
Education. Journal of the Social Sciences, 7 (1):56-60. Sukserm, T., Thiengkamol, N. & Thiengkamol, T. (2012). Development of the Ecotourism Management Model for Forest Park. Journal of
the Social Sciences, 7 (1) : 95-99. Sutayasue, U. ( 2010). Global Warming. Retrieved from
http://www.thaigoodview.com/library/teachershow/usa_s/global_Warming/aboutme.httm Thiengkamol, N. (2004). Development of A Learning Network Model for Energy Conservation. Doctoral Dissertation of Education
(Environmental Education) Faculty of Graduate Studies, Mahidol University, Thailand. Thiengkamol, N. (2005a). Strengthening Community Capability through The Learning Network Model for Energy Conservation. Journal
of Population and Social Studies, 14 (1), 27-46. Thiengkamol, N. (2005b). Development of Health Cities Network for Mekong Region. In Proceedings of the International Conference
“Transborder Issues in the Grate Mekong Sub-Region” Ubon Ratchathani, Thailand, 30 June-2 July 2005 (pp.111-119). Ubol Ratchathani: Nevada Grand Hotel.
Thiengkamol, N. (2009a). The Great Philosopher: the Scientist only know but Intuitioner is Lord Buddha. Bangkok: Prachya Publication. Thiengkamol, N. (2009b). The Happiness and the Genius can be Created before Born. Bangkok: Prachya Publication. Thiengkamol, N. (2010b). Urban Community Development with Food Security Management: A Case of Bang Sue District in Bangkok.
Journal of the Association of Researcher, 15 (2), 109-117. Thiengkamol, N. (2011a). Holistically Integrative Research (2nd ed.). Bangkok: Chulalongkorn University Press. Thiengkamol, N. (2011b). Development of Energy Security Management Model for Rural Community through Environmental Education
Process. In Proceedings of the 1st EnvironmentAsia International Conference on “Environmental Supporting in Food and Energy Security: Crisis and Opportunity” Bangkok, Thailand, 22-25 March 2011 (pp.11). Bangkok: Rama Garden Hotel.
Thiengkamol, N. (2011c). Development of Food Security Management Model for Undergraduate Student Mahasarakham University through Environmental Education Process. In Proceedings of the 1st EnvironmentAsia International Conference on “Environmental Supporting in Food and Energy Security: Crisis and Opportunity” Bangkok, Thailand, 22-25 March 2011 (pp.12). Bangkok: Rama Garden Hotel.
Thiengkamol, N. (2011e). Environment and Development Book. (4th ed.).Bangkok: Chulalongkorn University Press. Thiengkamol, N. (2011f). Nurture Children to be Doctors. Bangkok: INTELLUALS. Thiengkamol, N. (2011g). Development of Energy Security Management for Rural Community. Canadian Social Science, 7 (5), October
31, 2011. Thiengkamol, N. (2011h). Development of a Food Security Management Model for Agricultural Community. Canadian Social Science, 7
(5), October 31, 2011. Thiengkamol, N. (2012a). Development of a Prototype of Environmental Education Volunteer. The Social Sciences, 7: 77-82. Thiengkamol, N. (2012b). Development of Food Security Management for Undergraduate Student Mahasarakham University. European
Journal of Social Sciences, 27 (2):246-252. The Royal Society. (2005). “A guide to facts and fictions about climate change”. Retrieved from http://royalsociety.org/uploadedFiles/Royal_Society_Content/News_and_Issues/Science_Issues/Climate_change/climate_facts_and_ficti
ons.pdf UNESCO. (1978). Intergovernmental Conference on Environmental Education Organized by UNESCO in Cooperation with UNEP Tbilisi
(USSR) 14-16 October 1977. Final Reports. Paris: UNESCO. Vichaidit, T. (1994). Utilization of Water for Consumption. Seminar on Law Formulation on Utilization and Water Resource Conservation
in Celebration of Queen Sirikit of 60 years old. Bangkok: Office of the National Research Council of Thailand, Ministry of Science, technology and Environment.

ISSN 2039-9340 Mediterranean Journal of Social Sciences Vol. 3 (11) November 2012
360
Wattanasaroch, K. and Thiengkamol, N. (2012). Training ISO 14001 to Develop Green Dormitory Standards. Journal of The Social Sciences, 7 (2): 98-110.
Weiss, J. W. (1995). Organizational Behavior and Change: Managing Diversity, Cross Cultural Dynamics and Ethics. Anaheim, CA: West Publishers.
Wikipedia. (2011). Intergovernmental Panel on Climate Change. Retrieved from http://en.wikipedia.org/wiki/Intergovernmental_Panel_on_Climate_Change

ISSN 2039-9340 Mediterranean Journal of Social Sciences Vol. 3 (11) November 2012
361
Development a Prototype Environmental Education Teacher through PAIC Process
Miss On-anong Ruboon
Department of Environmental Education
Faculty of Environmental and Resource Studies Mahasarakham University, Mahasarakham 44150, Thailand
Nongnapas Thiengkamol
Major Advisor, Department of Environmental Education
Faculty of Environmental and Resource Studies Mahasarakham University, Mahasarakham 44150, Thailand
Tanarat Thiengkamol
Co-Advisor, School of Management, Assumption University,
Hua Mak Campus, 592/3 Ramkhamhaeng 24, Hua Mak, Bangkok 10240, Thailand
Jurairat Kurukodt
Co-Advisor, Department of Environmental Education
Faculty of Environmental and Resource Studies Mahasarakham University, Mahasarakham 44150, Thailand
Doi:10.5901/mjss.2012.v3n11p361
Abstract:The objective of this study was to develop a prototype of environmental education teacher through PAIC process. Sample group was selected by purposive sampling technique based on the defined criteria. The methodology was implemented with Participatory-Appreciation-Influence-Control (PAIC) integrated with brain-storming and focus group discussion for developing trainer (TOT) to be a prototype. The research results illustrated that after PAIC process implemented, the mean scores of posttest of knowledge of Environmental Education (EE), knowledge of global warming, characteristics of Environmental Education Teacher (EET), inspiration of environmental conservation, environmental behavior, and training achievement were higher than pretest with statistical significance (p< .01, p< .01, p<.01, p< .01, p< .01, and p< .01) respectively. Furthermore, FDE was used for trainer role play evaluation, it illustrated that Trainer Self-Evaluation, Audience Evaluation, Trainer Friend-Evaluation and Expert Trainer-Evaluation were no differences among four dimensional aspects of evaluation, then the 10 selected scientific teachers with top ten highest scores to be trainers. One-way ANOVA was used investigate the mean scores difference of four groups. The results of One-way ANOVA showed that there were difference of mean scores on role play as trainer in training process (p>.05). The 10 trained scientific teachers would be prototype of EET trainers and the left participants would be facilitators for the second level and they acted as steering committee to organize the second level training with the aid of researcher team. Key Words: Development / Prototype / Environmental Education / Teacher 1. Introduction Currently, Thailand, Ministry of Education has realized to the important of develop a prototype of Environmental Education Teacher (EET), it published a book called “Teacher Friend: Environmental Education Process for school development for teacher of the whole country by providing example of activities with the purpose to build habit of student by raising awareness, perceiving the value of environment and developing the environment based on daily life activities

ISSN 2039-9340 Mediterranean Journal of Social Sciences Vol. 3 (11) November 2012
362
by having appropriate practice (Office of Basic Education Commission, Ministry of Education, 2010). However, the Ministry of Education did not systemically manage.
To meet authentic sustainable development, it needs to develop a prototype of EET, because it should be accepted that teacher is an important and valuable change agents and good role model for their scientific teachers to imitate, therefore preparation of teaching-learning process by using environmental education principle as blueprint for environmental conservation through knowledge and understanding giving, awareness raising, participating, responsibility taking, attitude and behavior changing for scientific teachers in all levels of education and all education systems whether formal, non-formal, informal and lifelong education, is very critical thinking (Thiengkamol, 2011e). Additionally, creating and developing inspiration of environmental conservation are also essential factors to accomplish environmental behavior with integration through environmental education process (Thiengkamol, 2011b, Thiengkamol, 2011c, Thiengkamol, 2011e, Thiengkamol, 2011g, Thiengkamol, 2011h, Thiengkamol, 2011i, Thiengkamol, 2011j, Thiengkamol, 2012a & Thiengkamol, 2012b).
Principally, scientific teachers stayed at school a very long period a day in school, most of scientific teachers and students often consult their teachers more than their parents, therefore, good and visionary teacher can play prominent role in making up a better future to accomplish environmental conservation for their students as well. However, we wish to have teachers who are born to be teacher because they will take roles and functions with spiritual of teachers. This might be a good opportunity to prepare new generations with public consciousness for our future of environment and natural resources conservation by EET through environmental education process in order to meet real sustainable development.
In order to develop prototype of EET, the 14 Environmental Education Characteristics (EECs) and 26 supportive EECs were revealed from the study of Charoensilpa, Thiengkamol, Thiengkamol, & Kurokodt, (2012) are essential characteristic to build EET. These cover as followings: 1) ability to transfer environmental knowledge, 2) to stimulate others to realize the importance of environmental conservation, 3) to have deeply awareness about environment and natural resources, 4) to have public consciousness for environmental conservation, 5) to have positive attitude for environmental conservation, 6) to have value that for environmental conservation be everyone duty, 7) to have a sensitivity of environmental conservation, 8) to wish to take a responsibility for environmental conservation, 9) to participate to environmental conservation activities regularly, 10) consistency of self practice for environmental conservation, 11) ability to make decision correctly for environmental conservation, 12) must practice as a role model of environmental conservation for public perception, 13) to have correct environmental knowledge and 14) understanding to introduce environmental knowledge for others to practice correctly.
The development process of EET is implemented by use Participatory-Appreciate-Influence-Control (PAIC) technique integrating with brain storming and focus group discussion during the training process. This participatory training technique will be able to stimulate their inspiration to have public consciousness to change their awareness, attitude, and practice because during the implementation of PAIC training, they have a change to participate by brain storming to create an imagine and creating ideas across the training process through different activities such as presentations of their project proposed in the focus group discussion and role play as trainer for environment and natural resources conservation. PAIC composes of different features that are similar to environmental education process such as PAIC stimulating voluntary mind, public mind and behavior of the participants on environment and natural resource conservation and PAIC stimulating the participants about the sensitivity, skill, and responsibility to work together in focus group discussion including raising awareness on facing environmental problem. Consequently, training of trainer (TOT), scientific teacher was trained to be a prototype of EET including integration with brain storming and focus group discussion and evaluation of participation with Three Dimensional Evaluation (TDE) and evaluation of role play as a trainer with Four Dimensional Evaluation (FDE). PAMEI will be employed to assess and monitor based on the qualitative and quantitative approaches (Thiengkamol, 2004, Thiengkamol, 2005a, Thiengkamol, 2005b, Thiengkamol, 2010b, Thiengkamol, 2011a, Thiengkamol, 2011b, Thiengkamol, 2011c, Thiengkamol, 2011g, Thiengkamol, 2011h, Thiengkamol, 2011i, Thiengkamol, 2012a & Thiengkamol, 2012b)
Predominantly, Theingkamol gave mentions that the important characteristics of EET should have knowledge and understanding, and awareness and sensitivity about the environment and environmental
challenges on attitude concern for the environmental conservation, skills to monitor and evaluate the environmental problems including knowledge transferring, responsibility taking, skill practicing, public consciousness or public mind performing, and inspiration raising for environmental conservation. Additionally, participation in environmental activities and decision making on environmental problem solving would be emphasized in daily life practice. Teachers are very valuable change agents and role models for student, if they are able to teach student to practices in their daily life activity until it becomes permanently environmental habit or behavior. This might lead to factual sustainable development through practicing of all global citizen (Thiengkamol, 2008, 2009a, 2009b, 2011e, & 2011f).

ISSN 2039-9340 Mediterranean Journal of Social Sciences Vol. 3 (11) November 2012
363
2. Objective The objective of this study was to develop a prototype of environmental education teacher for environmental conservation in order to accomplish sustainable development. 3. Methodology The research design was implemented in steps by step as follows: 1) Construction of handbook for the participatory training: it contains knowledge of Environmental Education (EE), knowledge of global warming, characteristics of Environmental Education Teacher (EET), inspiration of environmental conservation, and environmental behavior (Charoensilpa, Thiengkamol, Thiengkamol, and Kurokodt, 2012, UNESCO, 1978, InWent-DSE-ZEL, 2002, Thiengkamol, N., 2004, Thiengkamol, N., 2011a, Thiengkamol, N., 2011e). 2) The research instruments composed of test, questionnaire and evaluation form. The test was used for determining their knowledge of Environmental Education (EE), knowledge of global warming, and questionnaire was used for determining inspiration of environmental conservation, environmental education teacher characteristics, and environmental behavior. 3) The evaluation form of TDE and FDE were constructed to assess the participant practice during PAIC implemented. 4) 34 scientific teachers were selected with purposive sampling from scientific teachers under the Office of Udonthani Educational Area Zone 3. They would be recruited according to the setting criteria (willingness, time, devotion, commitment, and public mind). 5) The 34 participants were employed for testing of knowledge of Environmental Education (EE), knowledge of global warming, and questionnaire was used for determining inspiration of environmental conservation, environmental education teacher characteristics, and environmental behavior. The systematic operation of 34 participants was trained with PAIC. The focus group discussion included brain storming and Training of Trainer (TOT) (Langly, 1998, Weiss, 1993, Sproull, 1988, InWent-DSE-ZEL., 2002, Thiengkamol, 2004, Thiengkamol, 2005b). TDE was used to determination the congruence of three aspects evaluation, Self-evaluation, Friend-evaluation, and Facilitator-evaluation for training participation. Additionally, FDE was used for evaluating EET on role playing as trainer. FDE covered Trainer Self-Evaluation, Audience Evaluation, Trainer Friend-Evaluation and Expert Trainer-Evaluation (Thiengkamol, 2004, Thiengkamol, 2005a, Thiengkamol, 2008, Thiengkamol, 2011a, Thiengkamol, 2011b, Thiengkamol, 2011c and Thiengkamol, 2011e). 6) The Pretest-Posttest One Group Design was used to test for before and after training process with PAIC. 7) PAMEI technique was employed for identify the performance, assessment, monitoring, evaluating for participants performance of scientific teachers under the Office of Udonthani Educational Area Zone 3 as the EET (Thiengkamol, 2004, Thiengkamol, 2005a, Thiengkamol, 2005b, Thiengkamol, 2011a, Thiengkamol, 2011b, Thiengkamol, 2011c and Thiengkamol, 2011e). 4. Results 4.1 General Characteristics of Sample Group The sample group was 34 scientific teachers that were selected by purposive sampling technique from scientific teachers under the Office of Udonthani Educational Area Zone 3 in the academic year of 2011. Most of them were female with 67.65%, graduate at bachelor degree with 85.29% and program education were general science. Most of them had marital status of marriage with 82.35%, and lived at Semi-Urban area with 47.06%. Majority of them were with ever activity participation with 91.18% and ever received teaching award with 70.59%. They had average of age with 42.17 years and teaching experience with 5.08 years as shown in table 1. Table 1 Demographic Characteristics of Sample Group
Characteristics
Undergraduate Scientific teachers Frequency Percent
Sex Male Female
11 23
32.35 67.65
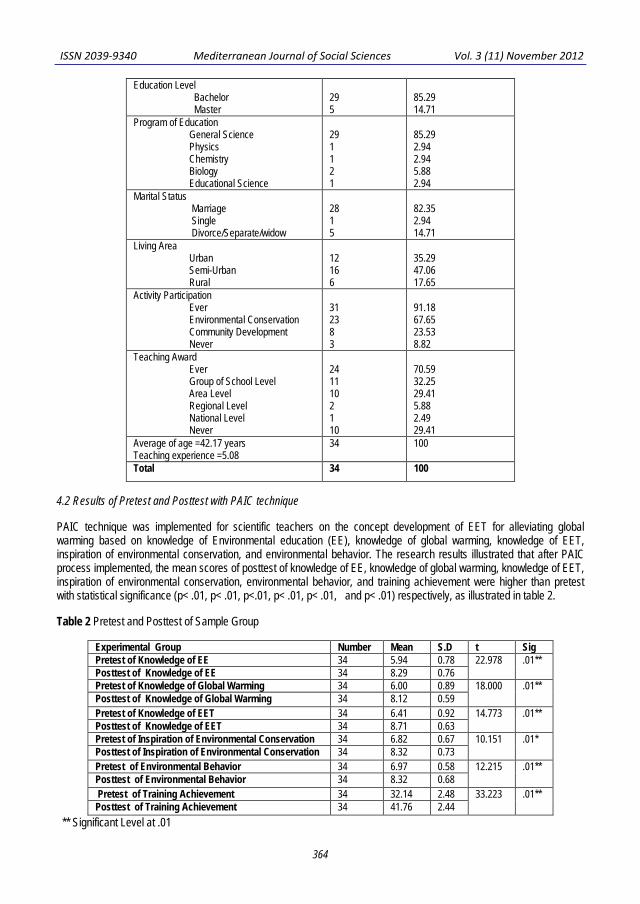
ISSN 2039-9340 Mediterranean Journal of Social Sciences Vol. 3 (11) November 2012
364
Education Level Bachelor Master
29 5
85.29 14.71
Program of Education General Science Physics Chemistry Biology Educational Science
29 1 1 2 1
85.29 2.94 2.94 5.88 2.94
Marital Status Marriage Single Divorce/Separate/widow
28 1 5
82.35 2.94 14.71
Living Area Urban Semi-Urban Rural
12 16 6
35.29 47.06 17.65
Activity Participation Ever Environmental Conservation Community Development Never
31 23 8 3
91.18 67.65 23.53 8.82
Teaching Award Ever Group of School Level Area Level Regional Level National Level Never
24 11 10 2 1 10
70.59 32.25 29.41 5.88 2.49 29.41
Average of age =42.17 years Teaching experience =5.08
34 100
Total 34 100
4.2 Results of Pretest and Posttest with PAIC technique PAIC technique was implemented for scientific teachers on the concept development of EET for alleviating global warming based on knowledge of Environmental education (EE), knowledge of global warming, knowledge of EET, inspiration of environmental conservation, and environmental behavior. The research results illustrated that after PAIC process implemented, the mean scores of posttest of knowledge of EE, knowledge of global warming, knowledge of EET, inspiration of environmental conservation, environmental behavior, and training achievement were higher than pretest with statistical significance (p< .01, p< .01, p<.01, p< .01, p< .01, and p< .01) respectively, as illustrated in table 2. Table 2 Pretest and Posttest of Sample Group
Experimental Group Number Mean S.D t Sig Pretest of Knowledge of EE 34 5.94 0.78 22.978 .01**
Posttest of Knowledge of EE 34 8.29 0.76 Pretest of Knowledge of Global Warming 34 6.00 0.89 18.000 .01** Posttest of Knowledge of Global Warming 34 8.12 0.59 Pretest of Knowledge of EET 34 6.41 0.92 14.773 .01**
Posttest of Knowledge of EET 34 8.71 0.63 Pretest of Inspiration of Environmental Conservation 34 6.82 0.67 10.151 .01* Posttest of Inspiration of Environmental Conservation 34 8.32 0.73 Pretest of Environmental Behavior 34 6.97 0.58 12.215 .01** Posttest of Environmental Behavior 34 8.32 0.68 Pretest of Training Achievement 34 32.14 2.48 33.223 .01** Posttest of Training Achievement 34 41.76 2.44
** Significant Level at .01

ISSN 2039-9340 Mediterranean Journal of Social Sciences Vol. 3 (11) November 2012
365
4.3 Results of Three Dimensional Evaluations for Participation TDE was employed for determination the perceptions of 34 scientific teachers in three aspects evaluation, Self-evaluation, Friend-evaluation, and Facilitator-evaluation by using One-way ANOVA to investigate the mean scores difference of three groups. The results of One-way ANOVA showed that there were no differences of mean scores about participation in training process through brain storming process with statistical significance (p>.05) as illustrated in table 3. This meant that the perceptions of scientific teachers about themselves, their friends in the same small group and their facilitators were not different for their participation in focus group discussion during training process as presented in table 3. Table 3 Three Dimension Evaluation of Sample Group Participation
Source of Variation Sum of squares Df Mean Square F Sig.
Between Group Within Group Total
17.784 563.206 580.990
2 99 101
8.892 5.689
1.563 .215
** Significant Level at .01 TDE was used to evaluate the participation of participant, the finding revealed that the mean scores of Self-Evaluation and Friend-Evaluation, Friend Evaluation and Facilitator Evaluation, and Self-Evaluation and Facilitator-Evaluation showed no statistical difference , and between showed statistical difference (p>.05, p>.05, and p>.05) respectively as illustrated in table 4. Table 4. Scheffe’ Analysis of Each Pair Comparisons
Each Pair of Variables
Mean Diff(I-J)
Std. Error
Sig.
95% Confidence Interval
Lower Bound Upper Bound
Self-Eva. and Friend-Eva. -0.85675 .19862 .852 -1.897 3.8548 Self-Eva. and Facilitator-Eva. -0.26589 .19862 .997 -1.7931 2.1548 Friend-Eva. and Facilitator-Eva. .82100 .19862 .885 -1.5321 3.4952
* Significant Level at .05 4.4 Results of Four Dimensional Evaluations of Participation as Trainer Role play FDE was used for trainer role play evaluation and it illustrated that Trainer Self-Evaluation, Audience Evaluation, Trainer Friend-Evaluation and Expert Trainer-Evaluation of the selected 10 scientific teachers with top ten highest scores to be trainers. One-way ANOVA was used investigate the mean score differences of four groups. The results of One-way ANOVA showed that there were no difference of mean scores on role play as a trainer in training process (p>.05) as illustrated in table 5. This implied that the opinions of four aspects of Trainer Self-Evaluation, Audience Evaluation, Trainer Friend-Evaluation and Expert Trainer-Evaluation on the trainer role plays, were not different, therefore trained scientific teacher can perform as a prototype of EET trainer. Table 5 Four Dimensional Evaluation of EET as Trainer Role Play
Source of Variation Sum of squares df Mean Square F Sig. Between Group Within Group Total
22.698 698.940 721.638
3 132 135
7.566 5.295
1.429
.321
* Significant Level at .05

ISSN 2039-9340 Mediterranean Journal of Social Sciences Vol. 3 (11) November 2012
366
During PAIC implemented, the six focus group discussion were done, the overall results illustrated that there were at least 6 projects purposed such as “Love Environment”, “Waste Bank”, “Youth Camp for Environmental Conservation” “Green School”, “One Man One Tree Cultivation” and “Bio-fertilizer Preparation” to be implemented according to the action plans on “Network Development for Environmental Conservation”. The pilot projects selected for implementing were four from six proposed projects. These were “Love Environment”, “Waste Bank”, “Youth Camp for Environmental Conservation”, and “One Man One Tree Cultivation”. After some part of four of projects were started implementing, the scientific teachers gained more experiences including raising their awareness and responsibility to environmental conservation. Particularly, they got more skill to make decisions on solving environmental problems correctly and practice themselves properly.
Additionally, after the PAIC training finished. The finding revealed that before training, the scientific teacher had less to moderate level of knowledge of Environmental (EE), knowledge of global warming, knowledge of EET, inspiration of environmental conservation, environmental behavior contents. At the beginning of training process, most of them lacked of self-confidence to express their ideas and thinking. But after using the integration of environmental education and training of trainer through focus group discussion and brain storming process including role play as a trainer, they can express and explain their ideas and thinking more confident when compared with before training. Furthermore, PAIC can be initiated to stimulate scientific teachers to increase their environmental behavior, to inspire their public consciousness and to participate different activities for environmental conservation with more knowledge of EE, knowledge of global warming, knowledge of EET, inspiration of environmental conservation, and environmental behavior as shown in table 2. However, PAIC is able to use for encouraging the participant to be able to make a proper decision on the facing problem by practicing so it is resembling to environmental education process that guide to practice in decision making of self- control of creation of environmental behavior about issues concerning environmental quality and environmental conservation to accomplish quality of life.
The PAMEI used for participatory assessment, participatory monitoring, participatory evaluation and participatory impact were approval for four projects implementations. Additionally, it was revealed that after the scientific teachers had implemented the four pilot projects, then they gain more environmental knowledge, experiences, raise more awareness and take more responsibility for environmental conservation, particularly, they have more skill to make a decision of environmental problem solving correctly. 5. Discussions The results indicated that the scientific teachers will gain knowledge of Environmental education (EE), knowledge of global warming, knowledge of EET, inspiration of environmental conservation, and environmental behavior after participating in the PAIC training. These were congruent to a variety of studies of Thiengkamol, (2004, 2005a, 2005b, 2010b, 2011b, 2011c, 2011g, 2011h, 2011i & 2012). It might be explained that the training with PAIC technique is able to raise knowledge in various issues and for different target groups and it can be used for stimulation the attitude and behavior changing. Moreover, it is also able to stimulate inspiration of public consciousness for environmental conservation through practicing suitable behavior in their daily life activities for alleviating global warming. The findings are also pertinent to the results from the study of Jumrearnsan, and Thiengkamol, 2011, Thiengkamol, 2011i, Thiengkamol, 2011j, Thiengkamol, 2012a & Thiengkamol, 2012b, that the awareness is affected to inspiration creation of public consciousness for environmental conservation and behaviors changing for global warming alleviation and environmental conservation to meet sustainable development through EET competency development with EE principle.
The results of TDE of 34 participants were employed for determination of the congruence of three aspects evaluation, Self-evaluation, Friend-evaluation, and Facilitator-evaluation. The mean scores three aspects were no difference among three aspects (p>.05, p>.05, and p>.05). The mean scores of Self-Evaluation was a little lower than mean scores Friend-Evaluation and Facilitator-Evaluation, so it indicated that the participants evaluated themselves lower than friend and facilitator because they are humble persons that are general style of Thai scientific teachers.
Moreover, FDE was used to evaluate the role plays as trainer of 10 scientific teachers, it was found that there was no statistically significant level (p>.05) as illustrated in table 5. It might be concluded that 10 scientific teachers can be trainer of prototype of EET for training other scientific teachers as illustrated in table 5. The result of training of trainer as EET was pertinent to different studies of Thiengkamol, N., and Theingkamol colleagues (2004, 2005a, 2005b, 2010b, 2011b,2011c, & 2011a) and researches of Sukwat, Thiengkamol, Navanugraha, & Thiengkamol, and Wattanasaroch, Thiengkamol, Navanugraha, & Thiengkamol 2012. Furthermore, it was found that PAIC training is effective for training with integration of brain storming process to develop a shared vision, action plan and projects in different issues of training such as energy conservation, urban community food security management, environment and natural resource conservation, development of health cities network for Mekong Region, development of women’s political participation in

ISSN 2039-9340 Mediterranean Journal of Social Sciences Vol. 3 (11) November 2012
367
Pattaya City, community strengthening, environmental management in dormitory, and soil and water conservation (Thiengkamol, N., 2004, Thiengkamol, N., 2005a, Thiengkamol, N., 2005b, Thiengkamol, N., 2010b, Thiengkamol, N., 2011b, Thiengkamol, N., 2011a, Wattanasaroch, Thiengkamol, Navanugraha, & Thiengkamol 2012, and Sukwat, Thiengkamol, Navanugraha, & Thiengkamol, 2012). During, the PAIC training implemented, focus group discussion and brain storming concept were integrated, therefore, it is obviously seen that after training they had intended to run 4 pilot projects from 6 projects. They search the way to maintain the four pilot projects with different ideas being suggested during this brain storming process in order to meet their intentions of being EET for alleviating global warming, especially in accordance with the action plans on “Empowerment of EET” across Udornthani Province and to join with other educational area in the same province, and other provinces in the Northeastern Region or other region of country. Additionally, the result was congruent to plentiful studies of Thiengkamol, N., (2005a, 2005b, 2010b, 2011b, 2011c), and Theingkamol colleagues Wattanasaroch, Thiengkamol, Navanugraha, & Thiengkamol 2012, Sukwat, Thiengkamol, Navanugraha, & Thiengkamol, C. 2012, Jumrearnsan, & Thiengkamol, 2012, Saenpakdee, & Thiengkamol, 2012, & Sukserm, Thiengkamol, & Thiengkamol, 2012, including study of Jansab, 2006.
References
Bicknell, J., D. Dodman, et al., Eds. (2009). Adapting Cities to Climate Change: understanding and addressing the development challenges. London: Earthscan.
Charoensilpa, D., Thiengkamol, N., Thiengkamol, C., and Kurokodt, J. (2012). Development of Environmental Education Characteristics. Journal of the Social Sciences, 7 (3):56-60.
CEDPA. (1999). Advocacy Building Skills for NGO Leaders: The CEDPA Training Manual Series Volumes IX. Published by the center for Development and Population Activities: Washington, D.C.
InWent-DSE-ZEL. (2002). Regional Training Course “Advanced Training of Trainer”. Grand Jomtien Palace. Pattaya City. Thailand. Jansab, S. (2006). Strategies for the Development of Women’s Political Participation in Pattaya City. Thesis of Master of Art Master of
Art (Women Studies), Office of Women and Youth Studies of Thammasart University. Jumrearnsan, W., & and Thiengkamol,n. (2012). Development of an Environmental Education Model for Global Warming Alleviation. The
Social Sciences, 7: 65-70. Ketuman, P. (2007). Adolescent Development. Retrieved from: http://www.psyclin.co.th/new_page_56.htm on 9 September 2011. Langly, A. (1998). “The Roles of Formal Strategic Planning” Long Range Planning. Vol. 21, No.1. Office of Basic Education Commission,
Ministry of Education. (2010). Teacher Friend: Environmental Education Process for school development. Bangkok: Office of National Buddhist Publishing.Office of Secretary of
Educational Council. (2005). Strategic development of children and youth with special abilities. Pimdee, P., Thiengkamol N,, Thiengkamol T., (2012) Psychological Trait and Situation Affecting through Inspiration of Public Mind to
Energy Conservation Behavior of Undergraduate Student, Mediterranean Journal of Social Sciences Vol 3 (3) Saenpakdee, A. & Thiengkamol, N. (2012). Formulation of Community Forest Act for Thailand. The Social Sciences, 7: 71-76. Sproull, N.L. (1995). Handbook of Research Method: A Guide for Practitioners and Scientific teachers in the Social Science. (2nd ed.).
Metuchen, NJ: Scarecrow Press. Sukwat, S. Thiengkamol, N., Navanugraha, C., and Thiengkamol, C. (2012). Development of Prototype of Young Buddhist
Environmental Education. Journal of the Social Sciences, 7 (1):56-60. Sukserm, T., Thiengkamol, N. & Thiengkamol, T (2012). Development of the Ecotourism Management Model for Forest Park. The Social
Sciences, 7: 95-99. Thiengkamol, N. (2004). Development of A Learning Network Model for Energy Conservation. Doctoral Dissertation of Education
(Environmental Education) Faculty of Graduate Studies, Mahidol University, Thailand. Thiengkamol, N. (2005a). Strengthening Community Capability through The Learning Network Model for Energy Conservation. Journal
of Population and Social Studies, 14 (1), 27-46. Thiengkamol, N. (2005b). Development of Health Cities Network for Mekong Region. In Proceedings of the International Conference
“Transborder Issues in the Grate Mekong Sub-Region” Ubon Ratchathani, Thailand, 30 June-2 July 2005 (pp.111-119). Ubol Ratchathani: Nevada Grand Hotel.
Thiengkamol, N. (2009a). The Great Philosopher: the Scientist only know but Intuitioner is Lord Buddha. Bangkok: Prachya Publication. Thiengkamol, N. (2009b). The Happiness and the Genius can be Created before Born. Bangkok: Prachya Publication. Thiengkamol, N. (2010b). Urban Community Development with Food Security Management: A Case of Bang Sue District in Bangkok.
Journal of the Association of Researcher, 15 (2), 109-117. Thiengkamol, N. (2011a). Holistically Integrative Research (2nd ed.). Bangkok: Chulalongkorn University Press. Thiengkamol, N. (2011b). Development of Energy Security Management Model for Rural Community through Environmental Education
Process. In Proceedings of the 1st EnvironmentAsia International Conference on “Environmental Supporting in Food and Energy Security: Crisis and Opportunity” Bangkok, Thailand, 22-25 March 2011 (pp.11). Bangkok: Rama Garden Hotel.
Thiengkamol, N. (2011c). Development of Food Security Management Model for Undergraduate Student Mahasarakham University through Environmental Education Process. In Proceedings of the 1st EnvironmentAsia International Conference on
ISSN 2039-9340 Mediterranean Journal of Social Sciences Vol. 3 (11) November 2012
368
“Environmental Supporting in Food and Energy Security: Crisis and Opportunity” Bangkok, Thailand, 22-25 March 2011 (pp.12). Bangkok: Rama Garden Hotel.
Thiengkamol, N. (2011e). Environment and Development Book. (4th ed.).Bangkok: Chulalongkorn University Press. Thiengkamol, N. (2011f). Nurture Children to be Doctors. Bangkok: INTELLUALS. Thiengkamol, N. (2011g). Development of Energy Security Management for Rural Community. Canadian Social Science, 7 (5), October
31, 2011. Thiengkamol, N. (2011h). Development of a Food Security Management Model for Agricultural Community. Canadian Social Science, 7
(5), October 31, 2011. Thiengkamol, N. (2011i). Development of Model of Environmental Education and Inspiration of Public Consciousness Influencing to
Global Warming Alleviation. European Journal of Social Sciences, 25 (4):506-514. Thiengkamol, N. (2011j). Model of Psychological State Affecting to Global Warming Alleviation. Canadian Social Science, 7 (6):89-95,
December 31, 2011 Thiengkamol, .N. (2012a). Development of A Prototype of Environmental Education Volunteer. Journal of the Social Sciences, 7 (1):77-
81. Thiengkamol, N. (2012b). Development of Food Security Management for Undergraduate Student Mahasarakham University. European
Journal of Social Sciences, 27 (2):246-252. Wattanasaroch, K. and Thiengkamol, N. Navanugraha, C., & Thiengkamol, T. (2012). Training ISO 14001 to Develop Green Dormitory
Standards. Journal of The Social Sciences, 7 (2): 98-110. Weiss, J. W. (1995). Organizational Behavior and Change: Managing Diversity, Cross Cultural Dynamics and Ethics. Anaheim, CA:
West Publishers. Wikipedia. (2010). List of countries by carbon dioxide emissions per capita. Retrieved from http://en.wikipedia.org/wiki/List_of_countries_
by_carbon_dioxide_emissions_per_capita. UNESCO. (1978). Intergovernmental Conference on Environmental Education Organized by UNESCO in Cooperation with UNEP Tbilisi
(USSR) 14-16 October 1977. Final Reports. Paris: UNESCO.

ISSN 2039-9340 Mediterranean Journal of Social Sciences Vol. 3 (11) November 2012
369
Taboo and Health Behavior of Mahout in Elephant Biosphere of Thailand
and Lao People’s Democratic Republic
Mr. Somsri Boonmee
Ph.D. Candidate Student of Regional Development Strategies Program, Surindra Rajabhat University
Prof. Dr. Krasae Chanawongse
Major Advisor, Regional Development Strategies Program,
Surindra Rajabhat University
Assist. Prof. Malinee Uttisaen
Co-Advisor, Regional Development Strategies Program, Surindra Rajabhat University
Dr. Kittima Rewdang
Co-Advisor, Regional Development Strategies Program,
Surin Rajabhat University
Doi: 10.5901/mjss.2012.v3n11p369 Abstract The In-Depth Interview was done with 5 leaders of mahouts (Elephant Charmers). The content from qualitative research was analyzed to construct the 97 items for quantitative research. Factor analysis was used for determination the component factors of health behavior of the Elephant Charmers, mahouts and their families in Thailand. The survey research, questionnaires were used for data collection from 530 Elephant Charmers, mahouts and their families in Surin Province of Thailand. Data was analyzed exploratory factors analysis and group discussion. The objectives of this research were to study health autobiography, taboo and health behavior of Elephant Charmers, mahouts and their families in elephant biosphere of Thailand and Lao People’s Democratic Republic, and to analyze component factor of heath behavior; propose ways to improve health behaviors of mahouts and their families in Thailand. The results of the research were as the followings. The health autobiography and health behavior of 5 Elephant Charmers (leaders of mahouts), key informants in both Thailand and Laos, aged 81-89 years, known as “Mhor sa-diang”, “Mhor Sa-dum” and “Kru-ba-yai or Ti-yai” were found in 5 aspects of health; Physical with well-being, Emotional with good temper, Social with the leadership, Spiritual self-reliance and Intellectual with good memory. They were the leaders of community rites. They could raise warm and strong families by being careful, proudly, practicing in the taboo and the principle of Buddhism without exploitation. They lived consistently with the Sufficiency Economic Philosophy. The taboo of mahouts in elephant biosphere of Thailand and Lao People’s Democratic Republic were the same as in daily activities; such as, eating, sitting, walking, sleeping, worshipping “Pa Kam” spirits and practicing the dharma. They were even more strict in their daily lives during the wild elephant round-up. The factors analysis, the five components related to heath behavior of Elephant Charmers, mahouts, and their families in Thailand included 1) The procedure and food for health, 2) The family relationship, 3) The strict practice in morals and the principle of Buddhism, 4) The credibility leadership, and 5) The generosity and non-exploit. Keywords :Taboo/ Mahout/ Elephant Charmer/ Health Behavior/ Elephant biosphere / Thailand / Laos PDR. 1. Introduction Many years ago, mahouts (Elephant Charmers) who used to go to catch the wild elephants in a deep forest. Almost they were Kuis who lived in Thatoom district, Surin province, Thailand and Champasak province, Laos PDR. It was said that the ethnographic history people of both countries were the same ethnic group that they have moved from one area to

ISSN 2039-9340 Mediterranean Journal of Social Sciences Vol. 3 (11) November 2012
370
others since the past to the present. They spoke in Kui and Laos language and were believed in Buddhism. Those people had ability to catch the wild elephants to train as the domestic elephants. Elephants were fed for the house working assistants and some were sold if it is unnecessary (Fine Arts Department, 2007). The Elephant Charmers (leader of mahouts), mahouts and their families both of countries had the same taboos strictly duration of hooking elephants was spent at least 2-3 months or longer, for safe, fortunes and getting lots of elephants. Unfortunately, if they did wrong from taboos, they would be punished from the family's guardian spirit and the ghost of ancestors. This might be harmful to Elephant Charmers and mahouts; they might get harmful by elephants or tigers, illness, or they could not get any elephants (Panurut, et al.,1996). These were believed and accepted from generation to generation by Elephant Charmers, mahouts and family since nowadays. Nevertheless, the elephant’s owner or the mahouts were not Kuis, but they would be learned the way of taboos as strictly as possible for happy family both of owner and elephant (Sodesiri, 1972) .
Hundred years ago the wild elephant has been catching for long time. Right now, both of Kuis in Surin Province, Thailand and Champasak Province, Laos PDR stopped to catch the wild elephants due to laws and the border situation problem between Thailand and the kingdom of Cambodia since 1960, while in Laos PDR was stopped to catch elephants since 1986 (Untanon, 2011). Due to these problems, it was caused the Elephant Charmers could not promote at the high level of position as well as in the past. All Ma, Mhor Ja, Mhor Sa-diang, Mhor Sa-dam and Kru-ba-yai (the leader of the mahout or almost senior mahout) or Ti-yai (in Laos PDR) were decreased by the time changing, getting old and the old age passed away. According to the participants, it was found that almost Elephant Charmers were healthy for all aspects of mental and physical health, society, intellectual health in term of living long life, trustable and leadership. If the Elephant Charmers, mahouts and their families could not follow the taboos as carelessness, drinking alcohol, smoking, ignored in five precepts and so on; they would be killed by tuberculosis disease, Aids disease and accident increasingly. Especially, since January, 2012 it was found that the mahouts and the family were affected by the tuberculosis disease more than 10% (Kom-Chat-Luek, 2012 : 20th February). It is interesting to researcher to study the autobiography health history of taboos and health behavior of mahouts in the biosphere of domestic elephants in Thailand and Laos PDR. The elements of taboos were analyzed whether they relate to the health behavior of the Elephant Charmers, mahouts, and their families in Thailand. From the study, it could be divided into five elements for health as follows: it should be followed the way of mahouts; it should be the policy proposal to develop the leader of Elephant Charmers, mahouts and their families in Thailand and it should be applied to use in over all other people. The Document and Literature review about this research were 3 issues 1) Concept and the Related Theories 2) Health status of the Elephant Charmer, mahouts and their family and 3) Research Review including concept and theories of Philosophy of Sufficiency Economy (Office of National Economic and Social Development, 2010), Holistic Health in the way of Buddhism, (Prayuthto, 1996), Epidemiology (Beagle, Bonita and Kjellstorm, 1993), Survival of Fittest (Darwin, 1952), Historicalism (Boas, 1940), Diffusionism (Kroeber, 1963), Ethnographic Research (Geertz, 1973), and Health Belief Model (Janz, Becker, 1984, Suwan, et al., 1991, and Tonsakul, 2000). The research was applied by the conceptions and related theories as follows: In the life style of Elephant Charmers to apply Philosophy of Sufficiency Economy. Moderation in the way of life; Approximately, Enough not much and no few, Not to exploit our self and the other, To put one’s faith in the reason and good immunity and Must support by the knowledge and merit (Office of National Economic and Social Development, 2010). At present the Elephant Charmers had what kind of the life style. The development theory, the theory of personality development by Sigmund Freud and Erik Erikson span of age were integrated together. Their development were dynamic, if they are not mature that will have an effect on personality development in the present and the future. The identities of individual causality from personality development, to have knowledge of Elephant Charmer’s personality development, are important. These were the guidelines for studying the health autobiography. Moreover, the Ethnographic Research was applied. The Ethnographic was a branch of anthropology culture to aim at the cultural description, especially, at the culture from the original ethnic group (Geertz, 1973). This will be the method and guideline of Ethnographic Research in the original ethnic group. “Gui” identity and wisdom were useful for social development. Charles Darwin. 1952; In the Survival of Fittest the Darwinism that is to say “Plant and Animal were difficult, every life to go up double and every life adjust to fight to be able to stand on one, s life. ”( Darwin, 1952, and Burney. 2000). The elephant Charmer, mahout and their families and elephants were adapting to live. Context of the elephant Charmers, mahout and their families in the culture and behavior to study with historicalism. Study the culture from the past to the present by observation, it was conducted by material and situation with time and place (Fine Arts Department 2007, and Rewdang, 2010).

ISSN 2039-9340 Mediterranean Journal of Social Sciences Vol. 3 (11) November 2012
371
According to, observations and the interviews from the sub-district promoting hospital in Surin Province about the health of Elephant Charmers, mahouts and their families it was found that the Elephant Charmers (mahout’s leaders) were quite good in health but some mahouts and their families were concerned by spending life careless as too smoking and drinking; elephants were, sometimes, got accident by cars. At the Elephant Study Center, it has been promoting on the title of “Take Me Home Project” and “The Kingdom of Elephants Project” since 2006-2012; there were registered by 215 elephants. So, those people were health checked by the doctors; it was found that they were affected by the tuberculosis completely, while elephants were not found yet. At the Champasak province, Lao People’s Democratic Republic, it was not found these problems, because Laos might not know about this problem, less of elephant’s populations, and rich natures of land.
Regarding to the health report of Thatoom hospital issued on 30th November, 2009 by chest x-ray of 142 mahouts; it was found that there were 16 mahouts who were affected by tuberculosis; because the result of x-ray found an abnormal of lungs (Thatoom hospital, 2012 : 14th February). Later, on 24th to 25th January, 2012, it was rechecked again by the doctor Manoon Leechawengwong, the chairman of Siriraj drug-resistant tuberculosis, research foundation, under Her patronage of Princess Galyani Vadhana Krom Luang Narathiwat Rajanakarin, had said that by participating for “the new mahouts should be cared on healthy elephants” of the zoo organization under the His majesty patronage of Adulyadej King, had worked cooperative with Surin hospital and other related organizations to find the germ of tuberculosis which it could be affected to elephants at the Elephant Study Center; the results of chest x-ray of 140 mahouts was found that 13 mahouts or almost 10%, a rate higher than normal, were affected. Normally, it should not be more exceeded than 1%. Therefore, the state of situation was concerned in the transmission to both mahouts and elephants (Kom-Chat-Luek. 2012 : 20th February). Moreover, the health report of Thatoom hospital, the diagnostic health results of mahouts and their families was found that there were 24 people who were affected by abnormal lungs; they were closely watched by doctors to diagnose about phlegm. There were only 6 people who did not go to get the diagnosed health on the date appointments. So, elephant villages, Ban Krapo, Thatoom district, and other elephant villages in Chumponburi district, Surin province could be similarly affected by the tuberculosis disease higher than other areas. It was found, nevertheless, that the Elephant Charmers’s health was not found any illness with tuberculosis or other diseases even they were between 81-84 years old.
Therefore, it is interesting to study on health autobiography, taboos and health behavior of the Elephant Charmers, mahouts and their families in elephant biosphere of Thailand and Lao People’s Democratic Republic, and to analyze component factor of heath behavior of the Elephant Charmers, mahouts and their families in Surin Province, Thailand. In order to accomplish to the health promotion for Elephant Charmers, mahouts and their families to check up their health and elephant’s health at least once a year, they must have knowledge and understanding and awareness to look after themselves and their elephants to save from different contagious diseases such as tuberculosis and AIDS. Moreover they can prevent themselves and their elephants from those infectious diseases with integration of leadership, moral, religion belief, taboos and local wisdom to conserve environment and ecosystem development for their life quality. 2. Objectives
1. To study the health autobiography, taboos and health behavior of the Elephant Charmers, mahouts and their families in Surin province, Thailand and Champasak province, Laos PDR.
2 . To analyze component factor of heath behavior of the Elephant Charmers, mahouts and their families in Thailand.
3. To propose ways to improve health behaviors of the Elephant Charmers, mahouts and their families in Thailand.
3. Methodology 3.1 Qualitative research with In-Depth Interview was used for data collection from In-Depth Interview form with 5 Thai-Lao Elephant Charmers (leaders of mahouts) in Surin Province, Thailand and Champasak Province, Laos PDR. 3.2 Quantitative research was survey research with questionnaires that constructed from content analysis of qualitative research. The questionnaires contains 97 items that use for data collection from 530 Elephant Charmer’s families, mahouts and their families in Surin Province of Thailand. Data was analyzed exploratory factors analysis.

ISSN 2039-9340 Mediterranean Journal of Social Sciences Vol. 3 (11) November 2012
372
4. Results
4.1 In-Depth Interview
The results of In-Depth Interviews with 5 Thai-Lao leaders of mahouts in Surin Province, Thailand and Champasak Province, Laos PDR were the followings. 1) It was studied by four healthy autobiographies of Elephant Charmers in Thailand; there were two Mhor Sa-dum, males, 81 and 82 years old, one married (spouse was 78 years old), one widower; their educations were grade four; right now they are living in Ban Ta-klang, Ban Krapo, Krapo sub-district, Thatoom district, Surin province. Once, they used to catch 16 wild elephants when they were 14 years old; and again when they were 20 years old, they got 10 wild elephants respectively. And other two Mhor Sa-diang were males, 81 and 84 years old, one married (spouse was 78 years old), one widower; their educations were grade two and four respectively; right now they are living in Ban Cokekung and Ban Krajaow, Krapo sub-district, Thatoom district, Surin province. The health autobiographies of all were healthy. 2) It was studied by one health autobiography of Elephant Charmer in Laos PDR, it is called “Ti-yai” or a great teacher (Kru-ba-yai); he was 89 years old, his spouse was 79 years old, lived in Ban Papo, Patumporn district, Champasak province. He was healthy also.
It was found, therefore, that five Elephant Charmers both Thailand and Laos PDR were healthy including physical, emotional, social, spiritual, and intellectual health. They were ritual leadership in communities. They were living with the philosophy of sufficiency economy, good memory, happiness, self-esteem, warm families, carefulness, taboos practices, Buddhist teaching practices, and avoiding from any gambles. So they have been happy since right now. 3) Taboos of the Elephant Charmers, mahouts and their families in Thailand and Laos PDR. Many years ago, both Thailand and Laos PDR had similar taboos or rules for practices strictly during catching wild elephants 2-3 months or longer. Those might be affected to their health in eating ways. According to the Buddhist disciplines has been prohibited for 10 kinds of eating meat prohibitions; they were elephant, horse, human beings, snake, Bengal tiger, leopard, tiger, lion and bear. The other taboos in eating prohibitions due to leaders of mahouts practices; they could not eat ant, honey, egg, duck, any entrails, shell and completed in rice eating should not be remained.
For self-practice site, he could not tread on a head of elephant, could not smoke or drink on the neck of elephant, could not sing a song, could not use village language, use only wild or Pakam languages, call a elephant’s name representative individual name, could not tease each other, could not mimic each other, could not pick a flower up to put at ears, could not pick a wood from other taken already, could not sit cross-legged, could not talk during sleeping, could not rest a hand on the forehead, sexual misconduct, could not talk with strange women in the forest, could not talk with non-relatives at home, could not sit under or cross the stairs, could not steal something from someone (it would be strictly mistaken in taboos, morals, laws if he stole a hook or a chain).
For health site, it would not allow in sweeping and cleaning house, hair cut, nails cut, dress more beautifully, put face powders, throw things into the house, hit children, go to see the nightlife and so on. It was obviously seen that some taboos were caused by illness, spread out some diseases to others such as skin diseases, gastrointestinal diseases, infected by the virus, diseases of the respiratory system especially tuberculosis which was available in elephant villages. Almost taboos, however, were good affected into health behaviors, happiness and longevity finally. 4) Health behaviors of the Elephant Charmers in Surin province, Thailand and Laos PDR; Due to the studies it was found that there were five Elephant Charmers both Thailand and Laos PDR, were healthy consistent with taboos, morality and Buddhist principles including eating ways, sleeping, exercises, diseases prevention, behavioral illness, healthy mind, mental and emotional controls, reliability and leadership. 4.2 Survey Research results The questionnaire was used to collect data from 530 Elephant Charmers’s families, mahouts and their families in Surin Province of Thailand. Then the factor analysis was used for component determination. There were 5 components were constructed as presented in table 1.

ISSN 2039-9340 Mediterranean Journal of Social Sciences Vol. 3 (11) November 2012
373
Table 1. Components of Health Behavior of 530 Mahouts and Families in Surin Province of Thailand
Components Number of Variables Weight 1) The procedure and food for health 20 0.722-0.358 2)The family relationship 14 0.637-0.515 3) The strict practice in morals and the principle of Buddhism 17 0.953-0.433 4) The credibility leadership. 8 0.932-0.518 5) The generosity and non-exploit. 8 0.969-0.955
From table 1, the finding illustrated that the component 1: The procedure and food for health had loading weight between0.722-0.358, component 2: The family relationship had loading weight between 0.637-0.515 , component 3: The strict practice in morals and the principle of Buddhism had loading weight between 0.953-0.433, component 4: The credibility leadership had loading weight between 0.932-0.518, and component 5: The credibility leadership had loading weight between 0.932-0.518. 5. Discussions According to this study, it was found that the health autobiography of taboos and health behaviors of five Elephant Charmers, mahouts and their families in Thailand, and Laos PDR, were healthy because they followed taboos and health behaviors, consistent with the element analysis and the multiple regression analysis were as follows: 1) the practices and healthy foods, 2) the family relationship, 3) strict in morality and following the Buddhist principles, 4) credibility and leadership, and 5) generosity and do not exploit together, which was consistent with the 10 national healthy regulations and 6 healthy principles of the Ministry of Health (Health Education Division, 1998). They lived consistently with the Sufficiency Economic Philosophy (Office of National Economic and Social Development Plan, 2010).
It was said that five components were promoted by health due to the ways of the Elephant Charmers which it could be made suggestions to related organizations to support Elephant Charmers, mahouts and their families in Thailand that it could be applied to general public properly.
Due to the Elephant Charmers were healthy because there were many reasons such as carefulness via all activities, followed taboos and Buddhist principles strictly, meditation practices, always good mood, be not stress, healthy foods (fish, vegetables and fruits by nature / organic food), live in good environment, working daily routines; commanding elephants, feeding elephant’s foods, and so on. These activities could be supported their health automatically. The Elephant Charmers and mahouts spent their life more with elephants than their families. Then they had plenty of time to practice or reviews things under a big tree. Both mahouts and elephants were happy surrounded with good environment at that time. Many years ago, populations were increasing, the needs of places to live and doing agricultures were commanding; these reason why many trees and forests were cut and destroyed. Right now it is seen that many mahouts take elephants to earn some money in the city, immigrate to many big cities around the country. Mahouts, families and elephants suffer from foods for both owner and elephants, money for supporting their families. These problems are caused mahouts and elephants to be ill and more stress. Some mahouts could not follow the taboos traditionally. So they drink alcohol, smoking and go out at night places; some are drug addicted. They are became risk situation in getting some diseases. Recently, the report of healthy checking from the hospital was found that almost 10 percents of mahouts were infected tuberculosis. Mahouts and elephants were injured from the accident increasingly by day. These problems could be careless and did not follow taboos and the Buddhist principles as well as in the past. Therefore, the taboos related to health behaviors could be applied and could be the guideline drawing back to the past. And then their life would be got benefits from the study surely.
6. Recommendations The results of this research were taken into group discussions by 24 connoisseurs (knowledgeable people) getting the suggestions to improve the health behavior development; such as, Food safety, Food quality, Food security, Healthy behavior, Family development, Practicing in Taboo and the principle of Buddhism. The Leadership training and Ecological development for the Elephant charmers, mahouts and their families in Thailand and apply with the general public for future generations; were recommendation to the governor of Surin province, Zoological park organization “Elephant kingdom Surin province”, Surin Provincial Administrative Organization “Elephant study center Surin province”, Surin Provincial Public Health Center and the other related organizations were that they should implement the developed action plan under the His majesty patronage of Adulyadej King, Surin provincial local administrative organization and other

ISSN 2039-9340 Mediterranean Journal of Social Sciences Vol. 3 (11) November 2012
374
related organizations. It would be realizably taken the His majesty ways on the philosophy of sufficiency economy and effective strategies into “understanding, reachable and developing” to perform effective integrations and participation as well as possible and support for further research on Multidisciplinary Research for health development on the people and domestic elephants in Surin province.
References
Beagle, R., Bonita, R., and Kjellstorm, J. (1993). What is epidemiology, in Who, Basic epidemiology, P. 1-11. Berny, D. (2000). Natural Science Dictionary. Bangkok : Ammarin Printing and Publishing Company limited. Boas, F. (1940). Race Language and Culture. New York : Free Press. Darwin, C. (1952). On the Origin of Species. New York : Atheneum. Fine Arts Department. (2007). The History of Surin Province . Bangkok: Ammarin Printing and Publishing Company limited. Geertz, C. (1973). The Interpretation of Culture. New York : Basic Book. Janz, N. K.; Becker, M. H. (1984). “The Health Belief Model: A Decade Later”. Health Education & Behavior 11 (1): 1–47. Health Education Division. (1998) . National Hygiene 10 Elements for good HealthBehavior. Bangkok : Ministry of Public Health. Kom-Chat-Luek online. [Online]. Available: http://www.komchadluek.net [2012 : 20th February] Kroeber, A. L. (1963). The Nature of Culture. Chicago : University of Chicago Press. Office of National Economic and Social Development Plan. (2010). The Tenth National Economic and Social Development Plan B.E.
2550-2554. Retrieve from: http://www.nesdb.go.th/Default.aspx?tabid=90. Panurut, A.,Talubthong S. and Chusongdech P. (1996). The way of Surin Elephant. 2nd Edition. Surin : Rungtanakiat-obset. Prayuthto, P. (1996). Thai medical Profession: Alternative choice in Globalization. 2nd Edition.Bangkok: Thummasan Company limited. Rewdang, K. (2010). Associated Factors to Mental Health and Mental Development in Thai-Laos Ethnic Group Community. Surin:
Dissertation. The Graduate School Surindra Rajabhat University. Sodesiri, R. (1972). The Changing Systems of belief of the Elephant Hunters of Surin, Thailand. The degree of Master of Arts in Anthropology at the
University of Western Australia. Suwan, P. et al. (1991) . Behavioral Science Health Behavior and Health Education. Bangkok : Chula Book Center. Thatoom hospital. (2012). Health Report. Surin : release press, 2012: 14th February. Tonsakul, C. (2000). Behavioral Science in Public Health . Bangkok : Common Legal Sahaprachapanich Limited Partnership. Untanon, S. (2011). Local Wisdom of Domestic Elephants in Phanom Dongrek – Xepian Cultural Ecology. Surin : Dissertation. The
Graduate School Surindra Rajabhat University.

ISSN 2039-9340 Mediterranean Journal of Social Sciences Vol. 3 (11) November 2012
375
Can be Explained the Moroccan Growth of Public Spending
by the Demand Approach?
El Mustapha Kchirid
Professor de Cadi Ayyad University - Marrakech
Lakhdar Adouka
Professor Mascara University
Aissa Darraji
Professor Khémis-Miliana University
Mohamed Kerbouche
Professor Mascara University
Doi:10.5901/mjss.2012.v3n11p375
Abstract The objective of this paper is to explain the growth of public spending by the approach of the demand for public goods in Morocco from 1970 to 2010, to test the veracity of Wagner's law for the Moroccan economy by an approach demand, to verify the positive effect between the share of public expenditure to GDP ratio and the following variables: the per capita income, population, urbanization, degree of economic openness, the effect of Baumol and macroeconomic stability. We concluded from our study that Wagner's law holds for the Moroccan economy. Our model confirms the positive effect between the share of public expenditure to GDP ratio and the following explanatory variables: per capita income, the degree of economic openness, the effect of macroeconomic stability and the effect of Baumol ..We also concluded from our study that there is a feedback relationship between public spending and per capita income using the Granger causality test. Keywords: Wagner law, government spending, growth, stationarity, VECM 1. Introduction Until around 1960, government spending was a relatively neglected area of the Survey of public finances. Since then, considerable attention is paid to different aspects of public spending in trying to redress the imbalance resulting from the emphasis in the past on the role of taxation in the economy. This is how many ideas were put forward to explain the growth of public spending. Lying in a perspective of supply and demand, not from a historical perspective, some authors have explained the growth of public expenditure by economic agents demand for public goods. Others argue instead that the idea that public spending growth is due to the level of supply of public resources. The fact that there is not a market where demand for public goods and the provision of public resources are found, some more recent authors hypothesize to use the approach where the imbalance of supply and demand adjust themselves at the same time and the level of public spending are situated either on supply or on demand. It appears essential in this paper to focus on explaining the growth of public spending by the approach of demand of economic agents in Morocco during the period 1970 to 2010. For this purpose, in this work we asked the follows recurring question: Can be explained the growth of public spending by the approach of demand? This main question is divided to the auxiliary questions: Is that Wagner's law holds for the Moroccan economy? What are the determinants of demand function? Public spending stimulates economic activity? What are the income effect and the productivity effect on growth of public spending?

ISSN 2039-9340 Mediterranean Journal of Social Sciences Vol. 3 (11) November 2012
376
The objective of this paper is to explain the growth of public spending by the approach of the demand for public goods in Morocco from 1970 to 2010, to test the veracity of Wagner's law for the Moroccan economy.
To achieve our objective, the paper was organized into three sections. The first is a brief presentation of the model of the demand approach; the second section focuses on macroeconomic indicators that are used in this model. Finally, in the third section, we try applying empirical and econometric analysis of this model to the Moroccan economy. 2. The theoretical framework of the model The growth in public spending are explained either by the approach of the demand, either by the approach of the supply. In the first approach the growth of public spending is explained by: Wagner's law (1909), the median voter theorem of Black (1948) the median voter theorem of Meltzer and Richard (1981, 1983) Theorem redistribution of income to interest groups of Buchanan and Tullock (1962). In the second approach, the growth of public spending is explained by: The difference in productivity (Baumol's thesis) The displacement effect (Peacock and Wiseman) The elements of the theory of bureaucracy (Niskanen) (1971) The demand approach is inspired by the work of economist Adolf Wagner (1835-1917) who formulated a law that links public spending and economic growth "law of increasing expansion of public activity." Wagner's hypothesis stipulates a relationship between the public sector development and the level of economic development. Referring to the study of Romuald sostaine, we can see five versions of Wagner's law and that several researchers have interpreted on their own way after they have tested theme empirically: public expenditure should grow faster than GNP in the growing economies, the ratio of public consumption / national income rises. For a country facing growth accompanied by development, the public sector activities are increasing at a rate which, when converted to costs, must exceed the growth rate of GNP per capita. there would be a rise from the ratio of government expenditure / GDP when a country moves from low to high levels of per capita income the per person number of government employees increases with per capita income Empirically Wagner's law has been verified and validated in two ways: By the elasticity of public spending over the level of economic development. By examining the temporal relationship between public sector size and income using the techniques of time series using the Granger causality The formulation most commonly used for empirical testing of Wagner's law is that given by the model of Musgrave (1969). The latter is written as follows:
t Yt tG α β ε= + + (1) With: G : denotes government spending relative to GDP in real terms Y : denotes per capita GDP in real terms According to Musgrave, it is necessary that the income elasticity is positive when Wagner's law is verified. Empirical, verification of this law can also be done by the approach in terms of Granger causality. This approach examines the reciprocal relationship between public spending and economic growth. The mathematical representation of Wagner's law by adopting an approach in terms of Granger causality is as follows:
k k
i 1 i 1i 1 i 1k k
i 1 i 1i 1 i 1
t t t t
t t t t
G G Y
Y Y G u
α β ε
α β
− −= =
− −= =
= + +
= + +
∑ ∑
∑ ∑
(2)
Referring to the study of Elkhider and al, we discuss in this section a different version under consideration of the validity of Wagner's law. This version has focused on the aspect disaggregated (by industry) in public spending and its effects on economic growth using two models: The first type of model is concerned about the efficiency of public spending on health and education, by adopting the following formulation:

ISSN 2039-9340 Mediterranean Journal of Social Sciences Vol. 3 (11) November 2012
377
1 t 2 t 3 t G (0) E Ht tS C vβ β β= + + + + (1) With: S : Represents the social indicators G : Represents the initial level of development E : Represents the public expenditure on education H : Represents the expenditure of health The second model examines the link between public capital and economic growth. This model is written as a function of Cobb-Douglass type as follows:
'tY t tK K H DO IPα β τ λ υ= (2)
With: Y : Is the GDP K : Is the public capital K’ : Is the public-private capital H : Represents the human capital DO : represents the degree of openness IP : the index of total factor productivity in the U.S. Empirical application of the model 3.1 Model Specification In this study, we will explain the underlying growth of public spending in Morocco between 1970 and 2010 by a demand model of economic agents; the model can be written as follows:
t 0 1 2 3 4 5 6DP logtt t t t t tU P Y RID DO Dα α α α α α α ε= + + + + + + + (3)
With: DP: Share of total expenditure in GDP U: the proportion of urban population in total population P: the total population Y: real per capita income at constant prices RID: the relationship between the index of consumer prices and the GDP deflator DO: the degree of openness D: Dummy variable represents macroeconomic stability We expect a positive sign for all coefficients of the model: A positive sign for the first three variables (U, Y and LOG(P)) because they positively influence the demand for public spending. The population increase has a positive effect on demand for goods provided by government. We expect a positive sign for the deflated price index (RID), this variable reflects the effect of Baumol. This indicates that there is an increase in the relative price of public good with an inelastic demand to price The degree of openness (DO) in the economy represents the distribution of income to pressure groups; we also expect a positive sign. 3.2 The statistical data We wish to estimate, in the case of the Moroccan economy, equation (3) on a sample of annual data covering the period 1970 -2010. Data are from International Financial Statistics of IMF, WDI : World Bank. The graphs of six variables (the ratio of public expenditure, the proportion of urban population in total population, total population, the per capita GDP, the index of consumer prices deflated and degree of openness are given below) show the presence of a trend for each variable. This makes the stationarity of the series in question.

ISSN 2039-9340 Mediterranean Journal of Social Sciences Vol. 3 (11) November 2012
378
Graph 1: the evolution of the variables of interest
3.3 Testing of unit root There are many unit root tests. The pioneering work in this area are those of Fuller (1976) and Dickey and Fuller (1979.1980). The Dickey-Fuller tests are parametric, this tests highlight the character of a stationary or not of a chronic with identifing ,a deterministic trend or stochastic . These tests are based on an estimate of an autoregressive process. Dickey and Fuller consider three basic models for the series: Model (1) model without constant or deterministic trend
tερXX 1tt += −
Model (2): model with constant and non-trend t1tt εbX ρX ++= −
Model (3): model with constant and trend
t1tt εbatX ρX +++= −
In all three models, we assume that ) BB(0,ε 2t εσ→
The test principle is: 1 :H0 =ρ : Presence of a unit root; the series is non-stationary 1 :H0 <ρ Absence of unit root; the series is stationary If 1 :H0 =ρ is accepted in one of these three models, then the process is non-stationary. The test strategy is sequential; we start from the model (3) to the model (1). In our study we will apply the ADF test and we determined the number of lags using partial autocorrelation function . The application of this method based on the study of correllogramme for different variables in equation(3), we obtained the lags for all variables. After we determined the lags for each variable, we adopted the strategy of sequential ADF test to examine the stationarity of the study variables. The following table summarizes our application:

ISSN 2039-9340 Mediterranean Journal of Social Sciences Vol. 3 (11) November 2012
379
Table 1: Augmented Dickey-Fuller Test
variables Lag ADF Order of integration
tDP
tdDP
1 1
0.52 -5.83
I(1) I(0)
tLP 1 -4.41 I(0)
tU
tdU 2
td U
1 1 1
-0.11 -1.01 -6.08
I(1) I(1) I(0)
tY
tdY
1 1
5.29 -2.47
I(1) I(0)
tDO
tdDO
1 1
0.64 -7.92
I(1) I(0)
tD
tdD 1 1
-1.51 -6.62
I(1) I(0)
tRID
tdRID 1 1
0.14 -6.09
I(1) I(0)
By comparing the ADF statistic (Table 1) with the critical value of ADF for a significance level of 5%. This comparison shows that the null hypothesis of nonstationarity is accepted for the variables in level (government spending, GDP per capita, the degree of economic openness, the index of consumer prices deflated and macroeconomic stability and urbanization), by cons we see that the hypothesis null is rejected for the same variables in first differences (Table 1) except for urbanization. The series (
tDP ,tY ,
tRID , tDO ,
tDA ) are then integrated of order 1, since the first difference of each of these variables is stationary I (0). We also see from Table 1 that the hypothesis is rejected for the variable in level (total population) at a significance level of 5%. Hence the variable is stationary and is then integrated of order 0. We see from Table 1 that the urbanization variable is integrated of order 2. The variables total population and the proportion of urban population relative to the total population will be eliminated from our study because they do not fulfilled the conditions of application of error correction models (ECM) 3.4 Cointegration tests We recall, for a long term relationship between several variables, two conditions must be met; first the variables must be non-stationary and integrated into the same order. Secondly their stochastic trends must be linked. The ADF tests suggest therefore assume the existence, of a cointegration relation between government spending, GDP per capita, the Degree of economic openness, the index of consumer prices deflated and macroeconomic stability. To investigate the existence of a long-term relationship between the variables in the model, we applied two methods: the general method of maximum likelihood (Johansen, 1988, 1991, Johansen and Jueslius, 1990). The two-step method of Engle and Granger (1978) 3.4.1 The Johansen test The applied of the trace test, we can detect the number of cointegration vectors. The hypothesis of this test is:
0H : There are at most r cointegrations vectors
1H : There are at least r cointégations vectors

ISSN 2039-9340 Mediterranean Journal of Social Sciences Vol. 3 (11) November 2012
380
When the statistical Trace is below the critical values at a significance level, we accept 0H ; otherwise we reject 0H . This test is applied sequentially from r = 0 to r = k-1. Table 2. The Johansen Test
Eigen values Likelihood ratio (trace statistic)
critical value
Hypothesis on the number of EC
0,55 76,5 69,81 None 0,31 44,53 47,85 At least one 0,31 0,26 0 ,07
29,58 15 ,10 2,92
29,79 15,49 3,84
At least two At least three At least four
First we test the hypothesis that the number of cointegration vectors is strictly zero (r = 0) (column Likelhood ratio,Table 2 We note that the statistics of the Trace for r = 0 (76.5) is greater than the critical value (69.81), which leads us to reject
0H . We then test the hypothesis that the number of cointegration vectors is strictly equal to one (r = 1). Statistics of Trace for r = 1 (44.53) is lower than the critical value (47.85), which brings us therefore to accept
0H . With The tests trace of the Johansen, we conclude that there is a cointegration relationship between the five variables. 3.4.2 Application method of Engle and Granger The notion of cointegration assumes that if two variables X and Y are integrated of order one (I (1)), and there exist a stationary linear combination of these variables I (0), then one can conclude that X and Y are cointegrated of order (1,1). We have already shown that the series are nonstationary and integrated of the same order. It remains, then, to test if the residual of this linear combination is stationary. In the case where, the deviations from the equilibrium value tend to cancel in time then, a long-term relationship exists between the variables. We estimate in a first stage, with OLS, the long-term relationship:
tDP 19,88 0.02DO1 0,002 0,34 0,38tt t tY RID DA ε= − + + + + + (4)
We deduced from the estimate of the relationship(4): -If the residues are non-stationary, the estimated relationship of long-term(4) is a spurious regression -If the residues are stationary, the estimated relationship of long-term (4) is a cointegraton relationship To test the stationarity of residues, we will use the critical values tabulated by Engle and Yoo (1987) in applying the ADF test The results from applying the ADF test on residues of the relationship between public spending and GDP per capita, the degree of economic openness, the index of consumer prices deflated and macroeconomic stability; given in Annex. It is found that the estimated ADF statistic (-3.12) is less than the tabular value of Engle and Yoo at the 5% (-2.67), this allows us to reject the hypothesis of non stationarity of residues, where the residuals from the relationship between public spending, GDP per capita, the degree of economic openness, the index of consumer prices deflated and macroeconomic stability are stationary. Therefore, the variables public expenditure and GDP per capita, the degree of economic openness, the index of consumer prices deflated and macroeconomic stability are cointegrated. It is then possible to estimate the error correction model. 3.5 Estimation of ECM After we examined the stationarity of the series and cointegration among the variables, we turn to the estimation stage of the model coefficients, but prior to this step, we must verify that the single cointegration relationship is an equation of public spending and thus the other variables are weakly exogenous. For this purpose, we performed a simple test for exogeneity from the estimated VECM model using the Johansen method. This test is carried out through adjustment coefficient associated with the cointegration vectors.

ISSN 2039-9340 Mediterranean Journal of Social Sciences Vol. 3 (11) November 2012
381
From Table of VECM (Table 4 In annex), we find that the adjustment parameters associated with the vector cointegration (speed adjustment) are not significant except for the variables index consumer price deflated and economic openness, this allows us to say that the variables GDP per capita and economic stability are weakly exogenous. By the variables against, the index consumer price deflated and economic openness are not weakly exogenous. The weak exogeneity test, we cannot therefore say that the equation (5) above is an equation written in public spending.
By opposite, the index consumer price deflated and economic openness are not weakly exogenous. The weak exogeneity test, say that the equation(3) above, is an equation written in public spending.
After the test of weak exogeneity, we address the step of estimating the parameters of the equation of public spending, according to Engle-Granger (1987) ; the simple method of estimating the long-term relationship between public spending , and the variables GDP per capita, the degree of economic openness, the index of consumer prices deflated and macroeconomic stability is to apply the method of ordinary least squares (OLS) regression to the following:
t 0 3 4 5 6DPtt t t tY RID DO Dα α α α α ε= + + + + + (5)
With 0 3 4 5 6, , ,α ,α α α α represent the long-term coefficients The estimated parameters of equation (5) by OLS are biased and super convergent because the variables are cointegrated (Davidson and Mackinnon, 1993). To improve estimates, we apply the correction of Stock and Watson (1988); equation (5) becomes:
t 0 3 4 5 6DP ΔYt i
ΔDOt i
t
p
t t t t ii p
Y RID DO D RIDp
i pp
ti p
α α α α α
ε
−=−
= + + + + + ∆ +∑
∑
+−= −
+−= −
∑ (6)
We estimate the coefficients of the long-term relationship of the equation of public expenditure as follows: 15,95 0,002 1,14 0,06 0,35
0,01 ( 1)0,01 0,001 ( 1)0,08 ( 1) 0,10 0,13 ( 1)0,19 ( 1) 0,15 0,09 ( 1)
t t t t t
t t t
t t t
t t t t
DP Y RID DO DAY Y YRID RID RIDDO DO DO ε
= − − − + +∆ + ∆ − ∆ − +∆ − + ∆ − + −∆ − − ∆ − ∆ + +
(7)
From Table (2) in annex and according to the test of student; we find that all the coefficients of the differential equation(7) are not significant in level except for the present economic openness.
The study of the relationship of short-term through ECM, allows us to analyze , in one hand, the speed of convergence of real exchange rate towards its equilibrium level of long term and, in other hand, the contribution he contribution of the fundamentals to the short-term dynamics. This brings us to test the significance of the equation parameters following short-term.
t 1DPp
aΔY c ΔDOt i t i0 i 0 0t i t i i tz
p pRID DA ti i
φ ε− −∆ = + +∑ ∑ ∑+ ∆ + +− −= = =
With 1 t-1 t-1 t-1 t-1 t-1DP ( 19,88 0.02DO1 0,002 0,34 0,38 )tZ Y RID DA ε− = − − + + + + +
With 1−tZ is the residual of the cointegration relationship, and the error correction term (the adjustment term).
Model the expenditure based on residues from the previous period, the expenditure of a lag period, the GDP per capita and this lag for a period of economic openness and this lag one period of the index of consumer prices deflated and now lag by a period and macroeconomic stability. The ECM of the equation of our model by the approach of Granger:
1 10, 46 0,33 0,24 0,24 0,009 0,16 0,02t t t t t t tDP e DP DA Y RID DO ε− −∆ = − + ∆ − − ∆ + ∆ − ∆ + We find that the coefficient associated with the restoring force is negative (0.33) and significantly different from zero at 5%. There is therefore a mechanism for error correction. This mechanism indicates the convergence of trajectories of the series of public spending towards long-term target. Thus, the impact on public spending of Morocco is correct to 33% by effect of feedback. The calculation of the duration of convergence can be achieved by the following formula: T)φ-(1)-(1 =δ

ISSN 2039-9340 Mediterranean Journal of Social Sciences Vol. 3 (11) November 2012
382
With T , φ and δ are respectively the number of years, the error correction coefficient and the percentage of shock. We used the inverse of the coefficient of restoring force to calculate the convergence time and we concluded that: Shock observed during a given year is completely eliminated within three years and three months and a half.
We have found by the table of the ECM Granger approach (Appendix Table 3) that all coefficients of variables that explain the growth of public expenditure are not significant except per capita income and economic openness, this allows us to say that there is no relationship of short term between public expenditure and the index of consumer prices deflated and macroeconomic stability. By cons, i a relationship exists between short-term public spending, GDP per capita and the degree of economic openness.
The method of Johansen (Appendix Table 4), shows that there is not a short-run relationship between public spending and the explanatory variables of our model. We interpret our long-term equation obtained by the OLS:
tDP 19,88 0.02DO1 0,002 0,34 0,38tt t tY RID DA ε= − + + + + +
We see the Table 1 in annex; that all the coefficients of the equation are not significant at 5%, except the deflated price index is significant and the signs of the coefficients obtained are consistent with economic theory: The variable GDP per capita has a positive sign (the expected sign is positive) and it is not significant, it allows us to say that our model satisfies the law of Wagner The openness of the economy, captured in our model by the share of exports and imports in GDP, has a positive influence on public spending but not significant. The Baumol effect, reflected by the increase in the relative price of public good with an inelastic demand to price, has a positive influence that reflects a positive relationship between public spending and the index of consumer prices deflated. This result is consistent with the theory of Baumol productivity. The Student's test confirms the significance of the coefficient at 5% To implement the robustness tests on residuals, stability coefficients, we taken the following steps: i) using the Chow test for testing the stability of the coefficients (equalities between the coefficients). This test can be practiced only after determining the sub-periods. To this end, we'll take two sub-periods: First Period: 1970-1986, which 17 observations Second Period: 1987-2009, which 23 observations. We recall that this test is based on the following statistic:
1 1 21 2
1
2Chow = ( , T 2 )2
RSS RSS T T K F K T KRSS K
− + −→ + −
RSS is the sum of squared residuals for all observations (40 observations), 1RSS is the sum of squared residuals for
the first sub-period and K : the number of variables. Under 0H : equal coefficients against 1H : instability of the coefficients, The application of this test gives us the following result: cChow 66,86 (4 , 32) 5.74tF= > = According to the Chow test, we can conclude that the coefficients are unstable. ii) The residues of our empirical model meet four conditions: normality, stationarity. Homoscedasticity and independence between the residues. The residues are actually distributed as a normal distribution, the Jarque-Bera test Accepts the null hypothesis of normality ( 2
0,05JB 0,56 (2) 5,99χ= = ) The ADF test on residuesconfirms the stationarity of the residues using the table as critical values of Engle and Yoo (1987) (ADF = -3.12 estimated is less than the tabulated value which is equal to (-2, 67). The White test (1980) accepts the null hypothesis and the homoscedasticity rejects the alternative hypothesis of hétéroscédasticité (). The Durbin-Watson (DW) confirms the dependence of the errors ( LDW 0,64 ; d dd= =
)
iii) To confirm that this relationship is generally stable, several tests can be used: tests of recursive residuals, CUSUM and CUSUM squares. This last test we will apply:

ISSN 2039-9340 Mediterranean Journal of Social Sciences Vol. 3 (11) November 2012
383
Graph 2: CUSUM test applied to the model coefficients
We observe in Figure 2 that the CUSUM leaves the interior corridor from 2004. This test allows us to say that the relationship is unstable. iv) The explanatory power in our model is 52%, This allows us to say that the GDP per capita, the degree of economic openness, the index of consumer prices deflated and macroeconomic stability strongly explain government spending during the study period. According to the statistical study we have treated, we can conclude that our model is generally satisfactory. In this section, we will was that if government spending causes growth? Where growth because public spending, where there is a feedback relationship between the two? To answer this question, we will apply the test of Granger causality. The principle of causality is as follows; We say X causes Y if the prediction based on knowledge of past joint X and Y is better than the prediction based on knowledge of the single Y The tests are applied to non-causality which is based on statistics of maximum likelihood:
X YTCξ →= (8)
Where T and X YC → represents respectively the number of observation and measurement of causality
Under the null hypothesis of no causal expression (8) follows a chi-square of ( )T pτ τ− degree of freedom with τ is the number of constraints imposed. The decision rule is: If ξ <
( ( ) )
2T pτ τ
χ−
, we accept the null hypothesis of no causality
If ξ >( ( ) )
2T pτ τ
χ−
,, we reject the null hypothesis of no causality
The result of the application of Granger causality test is summarized in the following table: Table 3: Granger causality test
The null hypothesis F statistic Prob The per capita income does not cause public spending
0,15 0,69
government spending does not cause per capita income
0,04 0,83
According to Table 3 of causality, we reject the null hypothesis of no causality, this allows us to say that per capita income cause government spending and government spending cause per capita income, hence there is a relationship feedback.
-20
-15
-10
-5
0
5
10
15
88 90 92 94 96 98 00 02 04 06 08 10
CUSUM 5% Significance

ISSN 2039-9340 Mediterranean Journal of Social Sciences Vol. 3 (11) November 2012
384
4. Conclusion The objective of this paper is to explain the growth of public spending by the approach of the demand for public goods in Morocco from 1970 to 2010, to test the veracity of Wagner's law for the Moroccan economy by an approach demand to see the positive effect between the share of public expenditure to GDP ratio and the following variables: the per capita income, population, urbanization, degree of economic openness, the effect of Baumol and macroeconomic stability.
We concluded from our study that Wagner's law holds for the Moroccan economy. Our model confirms the positive effect between the share of public expenditure to GDP ratio and the following explanatory variables: per capita income, the degree economic openness, the effect of macroeconomic stability and Baumol .. We also concluded from our study that there is a feedback relationship between public spending and per capita income using the Granger causality test.
References Abizadeh S. et Yousefi M. (1988), « The growth of government expenditure: the case of Canada », Public Finance Quaterly Barro R.J. (1991), « Economics growth in a cross section of countries », Quaterly journal of Economics, 106, pp 407-443. Baumol W.J. (1967), « The macroeconomics of unbalanced growth », American Economic Review. Bernard J. (1985), « Economie publique », Economica. Bird R.M. (1972), « The displacement effect : a critical note », public finance. Black D. (1948), « On the rationale of group decision making », Georges Allen and Unwin, UK. Blais A. et Nadeau R. (1992), « The electoral budget cycle », public choice 74 Borcheding T.E. (1977), « Budgets and bureaucrats: the sources of Government growth », Duke U.P., 1977. Bourbonnais R. (2002), « Econométrie », Dunod, 4e Edition. Bresson G. et Pirote A. (1995), « Econométrie des séries temporelles », PUF, Paris Davidson R., Mckinnon J. (1993), « Estimation and Inference in Econometrics”, New-York, Oxford University Press Dickey D.A. et Fuller W.A. (1981), « Likelihood ratio statistics for autoregessive time series with a unit root », Econometrica. Dickey D.A. et Fuller W.A. (1979), « Distribution of the estimators for autoregressive time series with a unit root », journal of the
American statistical association. Durbin J., Watson G. (1950), “Testing for serial Correlation in Least Squares Regression”, Biometrika Elkhider A, Kchirid E., Tahiri C. (2005), « "Identification des dépenses publiques porteuses de croissance économique : cas du Maroc de
1970 à 2003", Working paper du projet FEMISE 22-26 Engle R.F. et Granger C.W.J. (1987), « Cointegration and error correction: representation, estimation and testing », Econometrica. Engle R.F. et Yoo S. (1987), « Forecasting and testing in cointegrated systems », Journal of Econometrics. Engle R.F. et Granger C.W.J. (1987), « Cointegration and error correction: representation, estimation and testing », Econometrica. Engle R.F. et Yoo S. (1987), « Forecasting and testing in cointegrated systems », Journal of Econometrics. Johansen S.(1988), « Estimation and Hypothesis Testing of Cointegration Vectors in Gaussian Vector Autoregressive Models »,
Econometrica Johansen S.(1991), « Statistical Analysis of Cointegration Vectors », Journal of Economic Dynamics and control Johansen S., Juselius K. (1990), «Maximum Likelihood Estimation and Inferences on cointegration with Application to the Demand for
Money”, Oxford Bulletin of Economics and Statistics Laffont J. J. (1988), « fondement de l'économie publique, Economica », vol I et II Gaudemet P.M. et Molinier J. (1996), « Finances publiques », 7e édition, Montchrestien. Granger C.W.J. (1983): « Cointegrating variables and error correcting models », UCSD Discussion paper. Greene W. (2005), « Econométrie », 5e éd, Pearson Education France Mignon V. et Lardic S. (2002) , « Econométrie des séries temporelles macroéconomiques et financières », Economica Muller D.C. et Murell P. (1985) , « Interest groups and the political economy of government size », in Forte F. et Peacock A.: « Public
expenditure and government growth », Oxford. Musgrave R.A. (1959), « Theory of public finance, New York, USA, McGraw Hill. Musgrave R.A. (1986), « Public finance in a democratic society », Oxford: Harvester Press. Niskanen W.J. (1971), « Bureaucracy and representative government », Chicago, Aldine Atherton Peacock A.T. et Wiseman J. (1967), « The growth of public expenditures in the United Kingdom 1890-1955, Allen and Unwin », London Ram R. (1987), « Wagner's hypothesis in time series and cross-section perspectives: evidence from real data 115 countries », the
Review of Economics and Statistics. Romuald Sostaine F. (2009), «croissance des dépenses publiques et incidences sur le développement au Cameroun : le cas du secteur
de l'éducation», mémoire de D.E.A., université de Yaoundé II Stock J., Watson M. (1988), “Testing for Common Trends” Journal of the American Statistical Association Wagner A. (1909-1913) : Les fondements de l'économie politique, Paris, 5 volumes Weber L. (1978) : Analyse économique des dépenses publiques, P.U.F. White H. (1980), “A Heteroskedasticity-Consistant Covariance Estimator and a Direct Test for Heteroskedasticity” Econometrica

ISSN 2039-9340 Mediterranean Journal of Social Sciences Vol. 3 (11) November 2012
385
Annex
Table 1 Dependent Variable: DP Method: Least Squares Date: 05/21/12 Time: 20:13 Sample: 1970 2010 Included observations: 41
Variable Coefficient Std. Error t-Statistic Prob. C -19.88018 7.252111 -2.741295 0.0095
IPD 0.342050 0.081669 4.188259 0.0002 DO 0.021596 0.049884 0.432916 0.6677 DA 0.385149 0.652310 0.590438 0.5586 Y 0.002132 0.001913 1.114406 0.2725 R-squared 0.529119 Mean dependent var 15.95603
Adjusted R-squared 0.476799 S.D. dependent var 2.287372 S.E. of regression 1.654517 Akaike info criterion 3.958744 Sum squared resid 98.54732 Schwarz criterion 4.167717 Log likelihood -76.15426 Hannan-Quinn criter. 4.034840 F-statistic 10.11311 Durbin-Watson stat 0.648236 Prob(F-statistic) 0.000014
Table2 Dependent Variable: DP Method: Least Squares Date: 05/21/12 Time: 16:33 Sample(adjusted): 1972 2009 Included observations: 38 after adjusting endpoints
Variable Coefficient Std. Error t-Statistic Prob. C 15.95559 0.605298 26.35988 0.0000
D(Y(+1)) 0.012412 0.008657 1.433820 0.1631 D(Y(-1)) 0.001035 0.007422 0.139387 0.8902
D(Y) 0.010637 0.009618 1.105931 0.2785 D(DO(-1)) -0.194163 0.091754 -2.116122 0.0437 D(DO(+1)) -0.096631 0.056532 -1.709325 0.0989
D((DO)) -0.154226 0.062454 -2.469413 0.0201 D(IPD(-1)) 0.086530 0.126347 0.684859 0.4993
D(IPD) 0.106053 0.123005 0.862187 0.3962 D(IPD(+1)) 0.138078 0.134616 1.025714 0.3141
DA 0.353419 0.785638 0.449850 0.6564 R-squared 0.336964 Mean dependent var 16.23413
Adjusted R-squared 0.091395 S.D. dependent var 1.974811 S.E. of regression 1.882405 Akaike info criterion 4.340176 Sum squared resid 95.67315 Schwarz criterion 4.814214

ISSN 2039-9340 Mediterranean Journal of Social Sciences Vol. 3 (11) November 2012
386
Log likelihood -71.46334 F-statistic 1.372175 Durbin-Watson stat 0.360867 Prob(F-statistic) 0.245146
Table3
Dependent Variable: D(DP) Method: Least Squares Date: 05/21/12 Time: 17:08 Sample(adjusted): 1972 2010 Included observations: 39 after adjusting endpoints
Variable Coefficient Std. Error t-Statistic Prob. C 0.466502 0.213787 2.182085 0.0366
FF(-1) -0.331567 0.114557 -2.894342 0.0068 D(DP(-1)) 0.244854 0.163715 1.495615 0.1446
D(Y) -0.009711 0.003607 -2.692365 0.0112 D(DO) -0.026365 0.028659 -0.919972 0.3645 D(IPD) 0.163020 0.067416 2.418108 0.0215
DA -0.247665 0.378687 -0.654008 0.5178 R-squared 0.354624 Mean dependent var 0.153215
Adjusted R-squared 0.233616 S.D. dependent var 1.110472 S.E. of regression 0.972144 Akaike info criterion 2.942524 Sum squared resid 30.24207 Schwarz criterion 3.241112 Log likelihood -50.37921 F-statistic 2.930585 Durbin-Watson stat 1.736369 Prob(F-statistic) 0.021536
Table4
Vector Error Correction Estimates Date: 05/21/12 Time: 22:18 Sample(adjusted): 1972 2010 Included observations: 39 after adjusting endpoints Standard errors in ( ) & t-statistics in [ ]
Cointegrating Eq: CointEq1 DP(-1) 1.000000
IPD(-1) -2.074392 (0.46346) [-4.47590]
DO(-1) 2.229765 (0.37886) [ 5.88543]
DA(-1) 5.034965 (3.13061) [ 1.60830]
Y(-1) -0.071440 (0.01403)

ISSN 2039-9340 Mediterranean Journal of Social Sciences Vol. 3 (11) November 2012
387
[-5.09287] C 135.1014 Error Correction: D(DP) D(IPD) D(DO) D(DA) D(Y) CointEq1 0.050222 0.138097 -0.285868 0.002396 1.217981 (0.02158) (0.05085) (0.12024) (0.00505) (0.87488) [ 2.32757] [ 2.71572] [-2.37743] [ 0.47489] [ 1.39218]
D(DP(-1)) -0.142872 -0.391887 0.817957 0.023661 5.115831 (0.21092) (0.49707) (1.17537) (0.04932) (8.55194) [-0.67739] [-0.78839] [ 0.69591] [ 0.47978] [ 0.59821]
D(IPD(-1)) 0.019816 0.068406 -0.320893 -0.018735 -0.086534 (0.07055) (0.16625) (0.39313) (0.01649) (2.86035) [ 0.28090] [ 0.41145] [-0.81626] [-1.13582] [-0.03025]
D(DO(-1)) -0.039396 -0.203901 0.156347 -0.001506 0.759952 (0.04557) (0.10739) (0.25393) (0.01065) (1.84755) [-0.86459] [-1.89875] [ 0.61572] [-0.14138] [ 0.41133]
D(DA(-1)) 1.103193 -1.411171 1.300784 0.071663 -46.72643 (0.79057) (1.86314) (4.40560) (0.18485) (32.0548) [ 1.39544] [-0.75741] [ 0.29526] [ 0.38768] [-1.45770]
D(Y(-1)) 0.003541 -0.008644 0.011114 -0.000503 -0.233255 (0.00420) (0.00991) (0.02342) (0.00098) (0.17043) [ 0.84244] [-0.87256] [ 0.47447] [-0.51194] [-1.36862]
C 0.114735 0.534974 0.482667 0.011583 31.10604 (0.22133) (0.52162) (1.23342) (0.05175) (8.97426) [ 0.51838] [ 1.02561] [ 0.39132] [ 0.22382] [ 3.46614] R-squared 0.288461 0.230823 0.247267 0.088583 0.422094
Adj. R-squared 0.155047 0.086603 0.106129 -0.082308 0.313737 Sum sq. resids 33.34246 185.1869 1035.447 1.822835 54815.59 S.E. equation 1.020760 2.405637 5.688384 0.238670 41.38825 F-statistic 2.162154 1.600487 1.751958 0.518358 3.895394 Log likelihood -52.28237 -85.71578 -119.2796 4.393189 -196.6779 Akaike AIC 3.040121 4.754655 6.475878 0.133683 10.44502 Schwarz SC 3.338709 5.053243 6.774466 0.432271 10.74361 Mean dependent 0.153215 0.094124 1.006082 0.000000 26.53605 S.D. dependent 1.110472 2.517099 6.016606 0.229416 49.96108
Determinant resid covariance (dof adj.) 9533.750
Determinant resid covariance 3545.607 Log likelihood -436.0756 Akaike information criterion 24.41413 Schwarz criterion 26.12035

ISSN 2039-9340 Mediterranean Journal of Social Sciences Vol. 3 (11) November 2012
389
Traveling Behavior Model for Primary School
Manascha Waewthaisong
Department of Environmental Education
Faculty of Environment and Resource Studies Mahasarakham University, Mahasarakham 44150, Thailand
Nongnapas Thiengkamol
Major Advisor, Department of Environmental Education
Faculty of Environment and Resource Studies Mahasarakham University, Mahasarakham 44150, Thailand
Chatchai Thiengkamol
Co- Advisor, Director of Research In Motion Co., Ltd. 599/321
Baan Klang Krung, Jatujuk Sub-district, Jatujuk District Bangkok 10900, Thailand
Doi:10.5901/mjss.2012.v3n11p389
Abstract. The objective of this research was to develop an environmental traveling behavior model for primary school. The simple random sampling was employed to select the sample of 400 students from 5,220 students in Ampur Namsom, Udonthani Province. Questionnaire was used as instrument for data collection. Pearson Correlation and Path Analysis will be used for data analysis.The results revealed that psychological traits in terms of goal of life (GL) showed directly affected to inspiration of public consciousness in aspects of role model (RM) with .532, It also showed directly affected to traveling behavior (TB) and energy consumption behavior (EB) with .513 and .458. Moreover, psychological states (PS) in terms of religion belief (RB) showed directly affected to inspiration of public consciousness in aspects of role model (RM) with .567 and of role model (RM) also directly affected to traveling behavior (TB) and energy consumption behavior (EB) with .601 and .599. Considering on environmental education, environmental attitude (AT) showed directly affected to inspiration in aspects of role model (RM) with .575 and it showed also directly affected to inspiration in aspects of impressive environment (IE) with .638 and directly affected to traveling behavior (TB) and energy consumption behavior (EB) with .574 and 506. Energy consumption behavior (EB) showed directly affected to traveling behavior (TB) with .466. Key Words: Development / Environmental Traveling Behavior / Model / Primary School 1. Introduction Regarding to rural community in Thailand, most of them are agriculturist but they are pulled to materialism or consumerism or capitalism in the age of globalization during three decades because it came from the political plan to change the country from agricultural country to be industrial country. Most of rural communities also have been trapped to globalization period without preparing to face with these situations of industrialization; therefore they have changed their lifestyles to be materialists, consumerists, and capitalist. The meaning of these can be concluded as followings. Materialism, hereby, is belief of favoring for material more than mind and spirit so it doesn’t have the concept and meaning like as philosophic consideration, therefore, materialism is a mindset that views the consumption and acquisition of material goods as positive and desirable (Wikipedia.2001, & Thiengkamol, 2007). Consumerism is a social and economic order that is based on the systematic creation and fostering of a desire to purchase goods and services in ever greater amounts, and capitalism is an economic system in which the means of production are privately owned and operated for profit, usually in competitive markets (Wikipedia.2001, & Thiengkamol, 2007).
Consequently, most of rural people, they change the mean of transport from walk, cart, and bicycle to be motor bicycle and car tremendously. It is relevant to the numbers of motor bicycles that have registered more than two million a

ISSN 2039-9340 Mediterranean Journal of Social Sciences Vol. 3 (11) November 2012
390
year overall country. Finally, motor bicycle becomes a part of their living. Until, the economic crisis in 1997, they realize that their original livelihood of agriculture is still important for their basic needs. Besides, His Majesty the King, Bhumibol Adulyadej, has introduced the theory of self-sufficiency economy through New Theory for his peoples who are majority of agriculturist to comply and practice this theory. Most of them who were failure from the monoculture concepts and became indebted and bankrupt, have turn back to use the New Theory or other similar concept of Sustainable Agriculture covering Agroforestry Agriculture, Integrative Agriculture, Organic Agriculture, Non-toxic Agriculture, Natural Agriculture, Ecological Agriculture, and Buddhist Agriculture (Thiengkamol, 2009c). These concepts and principles have assisted a great number of Thai people have turned back to be able to stand on their own feet with sustainability again without trapping with capitalism. Nevertheless, they addicted with modern conveniences. Especially, rapid transportation like as motor bicycle, however, it also leads to higher accidence than prior period and causes of higher petrol consumption and green house gases released by combustion in both urban and rural areas.
The physical exercise gained from cycling is generally linked with increased health and well-being in according with the World Health Organization, physical inactivity is second only to tobacco smoking as a health risk in developed countries and this is associated with many hundreds of billions of dollars of healthcare costs such as the medical care costs of obesity in the United States are staggering with the costs totaled about 147 billion dollars in 2008 (World Health Organization, 2009, & Finkelstein, 2009). The WHO's report suggests that increasing physical activity is a public health ‘best buy’, and that cycling is a ‘highly suitable activity’ for this purpose (World Health Organization, 2009).
However, changing the ideas of Thai people to turn back to transport as prior time, it might be a difficult job but generally, Thai society pays respect to teachers so it might a good opportunity to use this strength though introducing this concepts of bicycle use in the school, particularly in primary school of rural areas of Thailand with the integration of better health concept of bicycle use by making them realization of present situation of young generation obesity. Therefore, giving education for young generation in the rural schools, it should be a way to accomplish of change them to use bicycle to conserve the natural resources and environment.
Until, the Tenth National Economic and Social Development Plan of Thailand, it included the principle of participation of every sectors in Thai society and aimed to set Thai citizen as center of development in order to accomplish a sustainable economic and society based on the moral and ethics for living and conservation of natural resources and environment. These assisted to develop the quality of life of Thai people in various aspects that was consistent to principle of sustainable development in accordance to concept of conference of environment and development of United Nation since 1992. In Agenda 21 of global action plan mentioned that “Sustainable development is development which meets the needs of the presented without compromising the ability of future generations to meet their own needs.” (Office of National Economic and Social Development Plan, 2010, Watkinson, 2009, WCED, 1987, Volker, 2007, & Thiengkamol, 2011e).
Generally, it is widely accepted that the sustainable society, economics, education, and environment, therefore it needs to develop the quality of people before to consider to other aspects of development. Therefore the human is the origin of development in all aspects, then they will be impacted by the results of those development. The human is accepted to be a centered development of all aspects in society (Punthumnavin, 2008).
To study on human behavior, it is emphasized on the stage of perception and evaluation on stimulants and intervention factors that occurred from the stimulants that must occur before the behavior expression afterward. However, in studying of human geography, it revealed that both physical and biological features are the stimulants to make people express their behavior in different approaches of place, surrounding people, and experience. These are unable to ignore since the human and environment are deeply and tightly related to each other, while environment plays a role as stimulant to make human to perform different activities. These activity expressions are influenced by these environments, and it causes the change in the environment. Therefore, the human behavior was expressed by environmental influencing and also caused to make a change of environment. This might be called as environmental behavior characteristics (Suwan, M., 2006). The ability of understanding about behavioral occurrence or expression of human, it leads to predict and control the undesirable behavior or promote and build the desirable behaviors. Studying on cause of human behaviors, there are different main guidelines. In this study, the researcher was interested in Interactionism model. In 1997 the academics in psychology, leading by David Magnusson and Norman S. Endler, proposed the textbook called “Personality at the crossroads” that compiled the theories of human behavior on integration of mind and states together (Punthumnavin, 2008, Magnusson, & Endler, 1997, Magnusson, 1999, Magnusson, 2001).
Additionally, from the literature reviews of behavioral science, it was found that the research was done on factors and causes that affected behavior of conservation of natural resources and environment relating to psychological traits, psychological states, and environment. At present, it is very rarely and there is no research is holistically integrative done about environmental education when it compared with other aspects of relating factors affecting to behaviors, especially,

ISSN 2039-9340 Mediterranean Journal of Social Sciences Vol. 3 (11) November 2012
391
environmental traveling behavior for global warming alleviation (Thiengkamol, 2011i, Thiengkamol, 2011j, & Jumrearnsan, & Thiengkamol, 2012).
Nevertheless, Inspiration of public consciousness proposed by Thiengkamol, should be paid attention for natural resources and environment conservation. She stated that public consciousness or public mind based on inspiration from insight and inspiration different from motivation because inspiration needs no rewards or admirations. Inspiration of public consciousness or public mind, especially, for natural resources and environment conservation, one doesn’t receive any reward, admiration or complement for ones act for natural resources and environment conservation. Inspiration might occur due to appreciation in a person as role model or idle, events, situations, environment, and media perceived such movies, book, magazine, and internet. (Thiengkamol, 2009a , Thiengkamol, 2009b , Thiengkamol, 2011a, Thiengkamol, 2011e, Thiengkamol, 2011f, Thiengkamol, 2011i, & Thiengkamol, 2011j).
Environmental education process aimed to change human behavior based on knowledge and understanding, awareness and consciousness raising, values, belief, attitude, and behavioral change (Elliot, R., 1995; Thiengkamol, N., 2011e). Therefore, it should be provided through every level of schools in Thailand, particularly, in the rural area of country because it is not only save the world from global warming but also provide the better quality of life with exercise by riding. This is congruent to the sustainable development principle that aimed to develop the responsible global young generations to minimize the fossil energy consumption by practicing through daily living of traveling to conserve energy for next generations. Especially, Thiengkamol mentioned about environmental education and psychological factors are able to adjust the environmental behavior whether consumption, behavior, recycling behavior, energy conservation behavior and traveling behavior though inspiration of public mind or consciousness (Thiengkamol, 2011e, Thiengkamol, 2011f, Thiengkamol, 2011i, & Thiengkamol, 2011j). Furthermore, form research findings revealed that after training with Participatory Appreciation Influence and Control (PAIC) the participants will gain more knowledge and understanding, raise awareness, and change attitude and behavior in environmental conservation, therefore these are congruent to different studies on environmental education volunteer building, environmental education network development, development of food security, development of energy security, development of network for natural resources conservation, strengthening community through energy conservation and political competency development for women (Thiengkamol, 2004, Thiengkamol, 2005a, Thiengkamol, 2005b, Thiengkamol, 2010b, Thiengkamol, 2011b, Thiengkamol, 2011c, Thiengkamol, 2011f, Thiengkamol, 2011g, Thiengkamol, 2011h, Thiengkamol, 2011i, & Thiengkamol, 2011j)
Most of rural community in Thailand locates not near to school to walk but it is not far from school to travel with bicycle. In the real situation, most of them usually travel with motor-bicycle that is an essential factor affected to the greenhouse gases emission. It is obviously seen from the number of motor bicycle was registered over two million per year (Department of Land Transport, 2011). Therefore, if the primary school teachers and parents realize to create an environmental traveling behavior for their children by changing to travel with bicycle instead of motor bicycle. It leads to the great dynamic change of petrol fuel consumption. Finally, the greenhouse gases emission will be decreased successfully for rural area of Thailand. Moreover, it will decrease household expense and build their good health as well.
Therefore, this research was designed to study by covering all factors relating as mentioned above, it would be able to develop a model of environmental behavior that happened from inspiration of public consciousness that was affected by psychological traits, psychological states, and environmental education process. 2. Objective The objective of this research was to develop environmental traveling behavior model for primary school 3. Methodology The research design was implemented in steps by step as follows: 1) The populations were 5,220 primary school students of the second semester in academic year 2011 of primary school in Ampur Namsom, Udonthani Province. The 400 primary school students were collected by simple random sampling from different schools of Ampur Namsom, Udonthani Province with the same proportion. 2) The research instrument was the questionnaire and it was used for data collecting. The content and structural validity were determined by Item Objective Congruent (IOC) with 5 experts in the academic fields of environmental education, psychology, social science and social research methodology. The reliability was done by collecting the sample group from 40 primary school students from Ampur Ban Phue, Udonthani Province. The reliability was determined by

ISSN 2039-9340 Mediterranean Journal of Social Sciences Vol. 3 (11) November 2012
392
Cronbach’s Alpha. The reliability for psychological traits was .847 and psychological states was .915, environmental education was .926, inspiration was .855, behavior was .839 and the whole questionnaire was .969. The descriptive statistics used were frequency, percentage, mean and standard deviation. The inferential statistics used Pearson Correlation and Path Analysis for data analysis. 4. Results 4.1 General Characteristics of Sample Group The sample group of this study was 400 primary school students were collected by simple random sampling from different schools of Ampur Namsom, Udonthani Province with the same proportion. Most of them were female with 209 students (52.25%), most of them had Grade Point Average (GPA) between 2.50-2.99 with 181 students (45.25 %), mean to school used motor bicycle with 334 (84.25 %). Majority of father occupation was agriculturist with 332 peoples (82.50%) and mother was agriculturist with 332 peoples (78.75%). Most of father and mother had education level at primary school with 330 (83.00%) and 289 (72.25%). Average of family income was 15,237 Baht per year as presented in table 1. Table 1 Demographic Characteristics of Sample Group
Characteristics
Secondary School Students
Frequency Percent Sex Male Female
191 209
47.75 52.25
Class Level 1 Level 2 Level 3 Level 4 Level 5 Level 6
62 73 71 70 66 62
15.5 18.2 17.8 17.5 16.5 15.5
GPA 1-<2.50 2.50-<2.99 3.00->=3.00
103 181 116
25.75 45.25 29.00
Mean of Travel to School Walk Bicycle Motor Bicycle Car
32 29 337 2
8.00 7.25 84.25 0.50
Father’ Occupation -Agriculturist -Government Officials -Private Business -Employee -General Hire
332 2 2 16 50
82.50 0.50 0.50 4.0 12.50
Father Education Level -Primary School Level -Secondary School Level -High School Level/ Vocational Certificate -Bachelor -Master or higher
330 56 10 2 2
83.00 14.00 2.50 0.50 0.50
Mother’ Occupation -Agriculturist -Government Officials -Private Business -Employee -General Hire
315 3 11 16 55
78.75 0.75 2.75 4.00 13.70
Mother Education Level -Primary School Level
289
72.25

ISSN 2039-9340 Mediterranean Journal of Social Sciences Vol. 3 (11) November 2012
393
-Secondary School Level -High School Level/ Vocational Certificate -Bachelor -Master or higher
76 31 4 -
19.00 7.75 1.00 -
Average Family Income per year 15,237 Baht Total 400 100
4.2 Comparison of Demographic Characteristics on Inspiration of Sample Group Comparison of traveling behavior among different demographic characteristics of sample in terms of sex, Grade Point Accumulation (GPA), and Mean of Travel to School of sample group presented as follows: 4.2.1 Comparison of Traveling between Different Sexes of Sample Group The demographic characteristics of sample in terms of sex, the comparison of traveling behavior between different sex of sample group was revealed that it was highly statistical significance (p<.01) as shown in table 1. Table 2 Comparison of Traveling Behavior between Different Sexes of Sample Group
Sex Number (n) Mean S.D. t Sig. Male 191 3.312 .657 3.890 .000** Female 209 3.865 .626
** Statistically Significant at the .01 level 4.2.2 Comparison of Traveling Behavior n among Different GPA of Sample Group The demographic characteristics of sample in terms of GPA, the comparison of traveling behavior among different GPA of sample group was revealed that it was no difference among different GPA of 1-<2.50, 2.50-<2.99 and 3.00->=3.00 with statistical significance (p>.05) as presented in table 2. Table 3 Comparison of Traveling Behavior among Different GPA of Sample Group
Source of Variation Sum of squares df Mean Square F Sig.
Between Group Within Group Total
2.398 395.015 3397.413
2 397 399
1.199 .955
1.256 .325
* Statistically Significant at the .05 level 4.2.3 Comparison of Traveling Behavior among Different Mean of Travel to School of Sample Group The demographic characteristics of sample in terms of mean of travel to school included walk, bicycle, motor bicycle and car, the comparison of traveling behavior among different mean of travel to school of sample group was revealed that it was highly statistical significance (p<.01) as presented in table 3. Table 4 Comparison of Inspiration among Different Mean of Travel to School of Sample Group
Source of Variation Sum of squares df Mean Square F Sig.
Between Group Within Group Total
76.308 360.756 437.064
3 396 399
25.436 .911
27.923 .000**
** Statistically Significant at the .01 level

ISSN 2039-9340 Mediterranean Journal of Social Sciences Vol. 3 (11) November 2012
394
The LSD Multiple Comparison was used for analysis of each pair of traveling behavior among different mean of travel to school of sample group. The differences of mean travel to school included walk, bicycle, motor bicycle and car, determination of the mean score differences of mean travel to school, it illustrated that walk and bicycle, walk and car were no statistical difference (p>.05, and p>.05), while walk and motor bicycle, bicycle and motor bicycle, and motor bicycle and car were statistical difference (p<.01) respectively. Additionally, bicycle and car was statistical difference (p<.05) as shown in table 5. Table 5 LSD Multiple Comparison of Traveling Behavior among Different Mean of Travel to School of Sample Group
Each Pair of Variables Mean Diff(I-J)
Std. Error
Sig.
95% Confidence Interval
Lower Bound Upper Bound
Walk and Bicycle -.17657030 .11311055 .235 -.2821211 .1566788 Walk and Motor Bicycle -.77620318(*) .10991595 .000** -.9629691 -.5326198 Walk and Car .15854614 .11331045 .162 -.2727797 .1708599 Bicycle and Motor Bicycle -.61765703(*) .10811055 .000** -.9125211 -.4823256 Bicycle and Car .19455213(*) .11244126 .045* -.9006443 -.4930247 Motor Bicycle and Car .52645521(*) .12112135 .000** -.7896411 -.5361325
4.3 Environmental Traveling Behavior Model for Primary School The results revealed that psychological traits in terms of goal of life (GL) showed directly affected to inspiration of public consciousness in aspects of role model (RM) with .532, It also showed directly affected to traveling behavior (TB) and energy consumption behavior (EB) with .513 and .458.
Moreover, psychological states (PS) in terms of religion belief (RB) showed directly affected to inspiration of public consciousness in aspects of role model (RM) with .567 and role model (RM) also directly affected to traveling behavior (TB) and energy consumption behavior (EB) with .601 and .599.
Additionally, psychological traits in terms of goal of life illustrated directly affected to inspiration in aspects of impressive environment (IE) with .527 and psychological states in terms of religion belief (RB) illustrated directly affected to inspiration in aspects of impressive environment (IE) with .562 while impressive environment (IE) showed directly affected to traveling behavior (TB) and energy consumption behavior (EB) with .604 and .453. Moreover, religion belief (RB) illustrated directly affected to behavior (TB) and energy consumption behavior (EB) with .544 and 456.
Considering on environmental education, environmental attitude (AT) showed directly affected to inspiration in aspects of role model (RM) with .575 and it showed also directly affected to inspiration in aspects of impressive environment (IE) with .638 and directly affected to traveling behavior (TB) and energy consumption behavior (EB) with .574 and 506. Energy consumption behavior (EB) showed directly affected to traveling behavior (TB) with .466.
Diagram 1: Environmental Traveling Behavior Model for Primary School ** Statistically Significant at the .01 level
GL
RB
AT
TB
EB RM
IE
.599** .532**
.458**
.466**
.506**
.574**
.638** .575**
.562**
.604**
.453**
.601** .513**
.567** .456**
.544**
.527**

ISSN 2039-9340 Mediterranean Journal of Social Sciences Vol. 3 (11) November 2012
395
5. Discussions The findings illustrated that for the demographic characteristics of sex, GPA, and field of study, the female had better traveling behavior with mean score of 3.612 and male with mean score of 3.865. This might indicate that the female might be easily to stimulate to have inspiration of public mind or public consciousness for changing the traveling behavior easier than male. After testing with Independent t-test, it was found that the mean score of female is higher than male with statistically significant (p<.01). The result of comparison of the inspiration of traveling behavior among different GPA of sample group was revealed that it was no statistical significance (p>.05). This might explain that there are no differences of the inspiration of traveling behavior among different GPA of students, therefore whether they got low, moderate or high, the same traveling behavior. Moreover, the comparison of inspiration among mean travel to school of study of sample group was revealed that it was highly statistical significance (p<.01).
Moreover, the comparison of traveling behavior among different mean travel to school of sample group was revealed that it was highly statistical significance (p<.01), then the LSD Multiple Comparison was used for analysis of each pair of traveling behavior among sample group. It illustrated that walk and bicycle, walk and car were no statistical difference (p>.05, and p>.05), while walk and motor bicycle, bicycle and motor bicycle, and motor bicycle and car were statistical difference (p<.01) respectively. Additionally, bicycle and car was statistical difference (p<.05). Considering on the mean difference in table 5, it was found that walk and bicycle and walk and car showed no statistically different at level of .05. It might conclude that the primary school students used mean of travel to school with walk, bicycle and car with the similar frequency but they used walk and motor bicycle, bicycle and motor bicycle, motor bicycle and car were statistical difference (p<.0.1, p<.0.1 and p<.0.1). It indicated that they used motor bicycle more often than walk, bicycle and car when considering on mean differences of three pairs. It might be explained that in the rural area of Thailand, most of them used motor bicycle and this pertinent to the amount of motor bicycle was registered over two million per year (Department of Land Transport, 2011). These results also pertinent to different researches of Jumrearnsan, and Thiengkamol, (2012), and Thiengkamol, (2005a, 2005b, 2010b, 2011b 2011c, 2011g, 2001j, 2012a, & 2012b) including concept proposed by Thiengkamol about environmental education and psychological factors are able to adjust the environmental behavior whether consumption, behavior, recycling behavior, energy conservation behavior and traveling behavior though inspiration of public mind or consciousness (Thiengkamol, 2011e, Thiengkamol, 2011f, Thiengkamol, 2011g, Thiengkamol, 2011i, & 2011j).
From environmental traveling behavior model for primary school as presented in diagram 1, the results illustrated that if we want to develop primary school students to have environmental behavior with energy decreased behavior for rural region likes as Ampur Nansom, Udorn Thani Province, we might use the religion belief, especially, most of them are Buddhist to understand the impact of energy consumption with fossil fuel that might cause harmful effect to health and green house effect occurrence in present that they faced with climate change in the Summer Season in this year (2011) with cold weather instead of hot weather. This has not happened before in the past since Thailand locates in Tropical Rain Forest. Moreover, parents and teacher should perform role model for their children and students. Nevertheless, environmental education in term of attitude also illustrated affected to traveling behavior so we might use environmental education process to educate them in the school by integrated through every subjects. These findings were also congruent to studies of Thiengkamol, (2005a, 2005b, 2010b, 2011b and 2011c, Thiengkamol, 2011g, Thiengkamol, 2011h, Thiengkamol, 2012a, & Thiengkamol, 2011b).
References Department of Land Transport. (2011). Motor Bicycle Registration in 2011. Retrieved from http://apps.dlt.go.th/statistics_web/statistics
.html on 14 September 2011 Elliot, R. (1995). Environmental Ethics. Oxford: Oxford University Press. Finkelstein, EA, Trogdon, JG, Cohen, JW, & Dietz, W. (2009). Annual medical spending attributable to obesity: Payer- and service-
specific estimates. Health Affair, 28(5), w822-w831. Jumrearnsan, W. and Thiengkamol, N. (2012). Development of an Environmental Education Model for Global Warming Alleviation.
Journal of the Social Sciences, 7 (1):67-70. Magnusson, D., and Endler, N.S. (1997). Interactional psychology and Personality. New York: John Whitey & Sons. Magnusson, D. (1999). Holistic interactionism : A perspective for research on personality development. In L.A. Pervin & O.P. John
(Eds.), Handbook of personality : Theory and research, pp. 219-247, New York : Guilford. Magnusson D. (2001). The holistic-Interactionistic Paradigm: Some Directions for Empirical Developmental Research. European
Psychologist, 6 (3), 153-162. Office of National Economic and Social Development Plan. (2010). The Tenth National Economic and Social Development Plan B.E.
2550-2554. Retrieve from http://www.nesdb.go.th/Default.aspx?tabid=90

ISSN 2039-9340 Mediterranean Journal of Social Sciences Vol. 3 (11) November 2012
396
Pimdee, P., Thiengkamol N,, Thiengkamol T., (2012) Psychological Trait and Situation Affecting through Inspiration of Public Mind to Energy Conservation Behavior of Undergraduate Student, Mediterranean Journal of Social Sciences Vol 3 (3)
Punthumnavin, D. (2008). Feature of Hypothesis and Data Analysis Providing for Utilization of Results of Development Research. Bangkok: National Research Council of Thailand (NRCT).
Suwan, M. (2006). Management of Environment: Principle and Concept. Bangkok: Odian Store. Thiengkamol, N. (2004). Development of A Learning Network Model for Energy Conservation. Doctoral Dissertation of Education
(Environmental Education) Faculty of Graduate Studies, Mahidol University, Thailand. Thiengkamol, N. (2005a). Strengthening Community Capability through The Learning Network Model for Energy Conservation. Journal
of Population and Social Studies, 14 (1), 27-46. Thiengkamol, N. (2005b). Development of Health Cities Network for Mekong Region. In Proceedings of the International Conference
“Transborder Issues in the Grate Mekong Sub-Region” Ubon Ratchathani, Thailand, 30 June-2 July 2005 (pp.111-119). Ubol Ratchathani: Nevada Grand Hotel.
Thiengkamol, N. (2007). Globalization Administration. Bangkok: Saengchai Publishing. Thiengkamol, N. (2009a). The Great Philosopher: the Scientist only know but Intuitioner is Lord Buddha. Bangkok: Prachya Publication. Thiengkamol, N. (2009b). The Happiness and the Genius can be Created before Born. Bangkok: Prachya Publication. Thiengkamol, N. (2009c). Environment and Development Book 2 (Food Security). Bangkok: Chulalongkorn University Press. Thiengkamol, N. (2010b). Urban Community Development with Food Security Management: A Case of Bang Sue District in Bangkok.
Journal of the Association of Researcher, 15 (2), 109-117. Thiengkamol, N. (2011a). Holistically Integrative Research (2nd ed.). Bangkok: Chulalongkorn University Press. Thiengkamol, N. (2011b). Development of Energy Security Management Model for Rural Community through Environmental Education
Process. In Proceedings of the 1st EnvironmentAsia International Conference on “Environmental Supporting in Food and Energy Security: Crisis and Opportunity” Bangkok, Thailand, 22-25 March 2011 (pp.11). Bangkok: Rama Garden Hotel.
Thiengkamol, N. (2011c). Development of Food Security Management Model for Undergraduate Student Mahasarakham University through Environmental Education Process. In Proceedings of the 1st EnvironmentAsia International Conference on “Environmental Supporting in Food and Energy Security: Crisis and Opportunity” Bangkok, Thailand, 22-25 March 2011 (pp.12). Bangkok: Rama Garden Hotel.
Thiengkamol, N. (2011e). Environment and Development Book 1. (4th ed.).Bangkok: Chulalongkorn University Press. Thiengkamol, N. (2011f). Nurture Children to be Doctors. Bangkok: INTELLUALS. Thiengkamol, N. (2011g). Development of Energy Security Management for Rural Community. Canadian Social Science, 5 (5), October
31, 2011. Thiengkamol, N. (2011h). Development of a Food Security Management Model for Agricultural Community. Canadian Social Science, 7
(5), October 31, 2011. Thiengkamol, N. (2011j). Model of Psychological State Affecting to Global Warming Alleviation. Canadian Social Science, 7 (6):89-95,
December 31, 2011. Thiengkamol, .N. (2012a). Development of A Prototype of Environmental Education Volunteer. Journal of the Social Sciences, 7 (1):77-
81. Thiengkamol, N. (2012b). Development of Food Security Management for Undergraduate Student Mahasarakham University. European
Journal of Social Sciences, 27 (2):246-252. Volker., H. (2007). Brundtland Report: A 20 Years Update. Retrieve from http://www.sd-network.eu/pdf/doc_berlin/ESB07_
Plenary_Hauff.pdf. Watkinson, J. (2009). WCED (1987) – Copenhagen (2009): Will we ever take the environment seriously? Retrieve from
http://myliberaldemocratpoliticalramblings.wordpress.com/2009/08/27/wced-1987-copenhagen-2009-will-we-ever-take-the-environment-seriously/
Wikipedia. (2001). Materialism. Retrieve from http://en.wikipedia.org/wiki/Materialism Wikipedia. (2001). Capitalism. Retrieve from http://en.wikipedia.org/wiki/Capitalism Wikipedia. (2001). Consumerism. Retrieve from http://en.wikipedia.org/wiki/ Consumerism World Commission on Environment and Development (WCED. (1987). Our Common Future. Oxford: Oxford University Press. The Brundtland Report. United Nations World Commission on Environment and Development.
Retrieve from http://en.wikisource.org/wiki/Brundtland_Report World Health Organization. (2009). A Physically Active Life through Everyday Transport With a Special Focus on Children and Older People and Examples and Approaches from Europe. Retrieved from http://www.euro.who.int/__data/assets/pdf_file/0011/87572/E75662.pdf

ISSN 2039-9340 Mediterranean Journal of Social Sciences Vol. 3 (11) November 2012
397
Volunteers’ Employment and Counterinsurgency in Italy:
The Case the Hungarian Legion (1861-1862)
Andrea Carteny, Ph.D.
Assistant professor, Sapienza University of Rome
Doi: 10.5901/mjss.2012.v3n11p397 Abstract In South-Italy the brigandage is a complex phenomenon, deeply popular and culturally reactionary: a “great brigandage” emerged in dangerous and structural forms after the fall of the last Bourbon king and the Italian unification under the Savoy dynasty, in 1861. From the “Mille” expedition and the conquest of redshirts leaded by Garibaldi, the Southern Army and the Italian Army fought against the brigandage as a real insurgency movement supported by Bourbons’ loyalists and Catholic environments. In the campaign of banditism’s repression a particular case was the employment of volunteers, as the former Garibaldi’s Hungarian Legion. From the General Staff Army’s Historical Archive the documents show both Command’s strategy and local tactics in the Hungarian practices. The concentration of the legionaries in Nocera (March 1861) and the growing number of effectives in few months (less than 1 thousand) gave the opportunity of their employment for more than 1 year in a large area of Southern regions. The Hungarian legionaries’ mutiny, in July 1862, rised at the same time of the Garibaldi’s expedition from South to Rome, blocked in August at the Aspromonte. After the disarm of the soldiers, the calling back to Torino meant the risk of his dissolution. Only a complete reorganization, in 1863, allowed to employ back a new Legion until 1867. Keywords: Risorgimento, Brigandage, Hungarian Legion,
1. Introduction Through the 19th century, the historical synthony and synchrony of national struggle for independence and freedom (in Italian Risorgimento, in Hungarian Szabadságharc) in Italy and Hungary means to build a common culture of both nations. It happens a consolidation not only of a kind of “hagiographical” history but also of historiographical branchs, interesting for the bilateral and international relations, for the history of politics and culture, for the national (mainly Italian and Hungarian) and European independence movements, with original ideas and perspectives developed within the concept of political freedoms and modern nation.
From the late 19th century, memoirs and essays are edited by actors and scholars. Through the 20th century historiographical schools are only partly ideological or cultural oriented, or characterized by the review of the national achieved goals.1 Concerning the Italian Risorgimento and Hungarian Szabadságharc, within a wide historiography it must to be mentioned some branchs and research fields: about general studies on the history of Hungary and on the Hungarian revolution and his actors;2
1 See the recent volume, about the historiography on Eastern Europe, of Giovanna Motta (ed.): Studi sull’Europa orientale, Passigli, Firenze 2012, and, about Hungary inside this volume, A. Carteny: “L’Ungheria tra età di mezzo e Ottocentro. Un Risorgimento mancato”, pages 125-131. 2 See the writings of: Antonello Biagini (Storia dell’Ungheria contemporanea, Bompiani, Milano 2006), Péter Hanák (Egy ezredév: Magyarország rövid története, Gondolat, Budapest 1986, in Italian Storia dell'Ungheria, Franco Angeli, Milano 1996), István Deák (The lawful revolution: Louis Kossuth and the Hungarians, 1848-1849, Columbia University Press, New York 1979, later Phoenix, London 2001, in Hungarian A törvényes forradalom: Kossuth Lajos és a magyarok 1848-49-ben, Gondolat, Budapest 1994), Róbert Hermann (Negyvennyolcas történetünk mai állása, Fokusz Egyesület, Budapest 2011; Az 1848-1849-es szabadságharc nagy csatái, Zrínyi, Budapest 2004; Kossuth Lajos élete és kora, Pannonica, Budapest 2002; Az 1848-1849-es magyar szabadságharc története, 2 cd, Arcanum, Budapest 2002; 1848–1849. A szabadságharc hadtörténete, Korona Kiadó, Budapest 2001; Kossuth Lajos és Görgei Artúr levelezése, 1848-1849, Osiris, Budapest 2001), Gábor Pajkossy ("Nemzeti újjászületés": válogatás Kossuth Lajos írásaiból és beszédeiből, Új Mandátum, Budapest 2002; Kossuth Lajos, Új Mandátum, Budapest 1999), György Szabad (Kossuth irányadása, Válasz, Budapest 2002; Kossuth Lajos üzenetei, Ikva, Budapest 1994; Kossuth politikai pályája: Ismert és ismeretlen megnyilatkozásai tükrében, Kossuth, Budapest 1977; Forradalom és kiegyezés válaszútján: 1860-61, Akadémiai Kiadó, Budapest 1967, in English Hungarian political trends between the revolution and the compromise: 1849-1867, Akadémiai Kiadó, Budapest 1977).
about researches on the Hungarian emigration after the 1848-49 and on the Italian-

ISSN 2039-9340 Mediterranean Journal of Social Sciences Vol. 3 (11) November 2012
398
Hungarian relationships.3 In 2011, within the historiographical framework, 150 years after the Italian Unification was the occasion to investigate better, freely and fairly, the historical events of the Italian Risorgimento, from the ’48 European revolution until the Italian Unity in 1861, through the exile and the European anti-Habsburgs movement leaded by Giuseppe Mazzini and Luigi Kossuth.4 The turning point of the Italian “revolution” for the national unification was the 2nd Independence war launched against Austrians by the Franco-Sardinians (1859) and the expedition of the “Thousand”, the Mille red shirts, leaded by Giuseppe Garibaldi (1860). As consequence, in 1861 the proclamation of the Kingdom of Italy means the birth of a new power in Europe, but also the beginning of the “Southern question” in the unified Italy and the refusal approach of the Savoy regime by a relevant part of the Centre and South-Italy people. Mainly in some Southern regions, particularly tied to the former Bourbon dynasty, the phenomenon of “brigands” was taking the dimension of a real guerrilla, employing regular weapons and army’s tactics, called “Brigandage”.5 Criminals, even “terrorists” called by the official and institutional point of view, the insurgent brigands were the heroes of the “counter” revolution’s movement against the Italian “unitary revolution” and Savoy dinasty, for the restoration of the Bourbons’ and the Pope’s authority. The repression of the Piedmont’s government was done for several years by the Italian Army,6 with the help of the national Guards and special Legions of volunteers, employed specifically against the brigands.7
As a complex phenomenon, deeply popular and culturally reactionary, the “big Brigandage” emerged in dangerous and structural forms in the 60s of 19th century. During 1860 this insurgency movement was initiated in the regions of the former Pontifical State (as Marche and Umbria) by Pope’s officials and followed in Southern Italy with the support of Bourbons’ loyalists and catholic environments. Punctually, the “first wave of reactions” (Autumn 1860 until Winter 1861)
2. The Big Brigandage
3 See the volumes of: Pasquale Fornaro (István Türr: una biografia politica, Rubbettino, Soveria Mannelli 2004; Risorgimento italiano e questione ungherese: 1849-1867, Rubbettino, Soveria Mannelli 1995), László Csorba (Teleki László, Új Mandátum, Budapest 1998; A Kossuth-emigráció fényképeskönyve, Kossuth, Budapest 1994; Garibaldi élete és kora, Kossuth, Budapest 1988), László Pete (Olaszország magyar katonája: Türr István élete és tevékenysége 1825-1908, Argumentum, Budapest 2011; Monti ezredes és az olasz légió a magyar szabadságharcban, Multiplex Media-Debrecen UP, Debrecen 1999, in Italian Il colonnello Monti e la legione italiana nella lotta per la libertà ungherese, Rubbettino, Soveria Mannelli 2003), Lajos Lukács (Magyar politikai emigráció, 1849-1867, Kossuth Kiadó, Budapest 1984, in English Chapters on the hungarian political emigration: 1849-1867, Akadémiai Kiadó, Budapest 1995; A olaszországi magyar légió története és anyakönyvei, 1860-1867, Akadémiai Kiadó, Budapest 1986; A magyar garibaldisták útja: Marsalától a Porta Piáig (1860-1870), Kossuth Kiadó, Budapest 1971; Garibaldival a szabadságért: Dunyov István élete és működése 1816-1889, Gondolat, Budapest 1968; Garibaldi e l'emigrazione ungherese, 1860-1862, Mucchi, Modena 1965; Garibaldi magyar önkéntesei és Kossuth 1860-61-ben, Akadémiai Kiadó, Budapest 1962; Magyar függetlenségi és alkotmányos mozgalmak 1849-1867, MTA Történettudományi Intézete-Művelt Nép, Budapest 1955), Jenõ Koltay -Kasztner (A Kossuth-emigráció Olaszországban, Akadémiai Kiadó, Budapest 1960; Studi e documenti italo-ungheresi della R. Accademia d'Ungheria di Roma, Tipografia Russo, Roma 1937-1942; Il contributo ungherese nella guerra del 1859. Storia e documenti, Le Monnier, Firenze 1934), Endre Kovács (A Kossuth-emigráció és az európai szabadságmozgalmak, Akadémiai Kiadó, Budapest 1967), Magda Jászay (Incontri e scontri nella storia dei rapporti italo-ungheresi, Rubbettino, Soveria Mannelli 2003; Il Risorgimento vissuto dagli ungheresi, Rubbettino, Soveria Mannelli 2000; L'Italia e la rivoluzione ungherese. 1848-1849, Athenaeum, Budapest 1948), Éva Nyulásziné-Straub (A Kossuth-emigráció olaszországi kapcsolatai, 1849-1866, Magyar Országos Levéltár, Budapest 1998, in Italian Le relazioni italiane dell'emigrazione di Kossuth: 1849-1866, Archivio Nazionale Ungherese, Budapest 2003), Beatrix Cs. Lengyel (Olaszhoni emlék: az itáliai magyar emigráció fényképeinek katalógusa – Ricordo dall'Italia : catalogo delle fotografie degli emigranti ungheresi in Italia, Magyar Nemzeti Muzeum, Budapest 2007), Györgyi Kalavszky (Emigrációban a szabadságért: az olaszországi és poroszországi magyar légiók tisztjeinek fényképkatalógusa, 1849-1867 – In Emigration der Freiheit willen...: Photokatalog der Offiziere der ungarischen Legionen in Italien und Preussen, 1849-1867 – Lottare per la libertà in emigrazione: catalogo delle fotografie degli ufficiali delle legioni ungheresi in Italia ed in Prussia, 1849-1867, Hadimúzeum Alapítvány, Budapest 2003). 4 See Antonello Biagini, Andrea Carteny: “Il Risorgimento, dalla rivoluzione all’esilio ‘europeo’: Mazzini e Kossuth dopo il 1849”, in F. Di Giannatale (ed.): Escludere per governare. L’esilio politico fra Medioevo e Risorgimento, Le Monnier Università, Firenze 2011. 5 See in general, about brigandage as social European phenomenon, Eric J. Hobsbawm: Bandits, Nicolson, London-Weidenfeld 1969. About the debate soldiers’ vs volunteers’ employment in the Italian Risorgimento, see Piero Del Negro: “I militari nel Risorgimento: regolari e irregolari”, in B. Alfonzetti, F. Cantù, M. Formica, S. Tatti (eds): L'Italia verso l'Unità. Letterati, eroi, patrioti, Ediz. di Storia e Letteratura, Roma 2011. In general, on the Italian military history, see Piero Pieri: Storia militare del Risorgimento: guerre e insurrezioni, Einaudi, Torino 1962 6 See Cesare Cesari: Il brigantaggio e l'opera dell'esercito italiano dal 1860 al 1870, Ausonia, Roma 1920. 7 This contribution is based on the paper (A. Carteny: “Banditism and repression in post unity Italy”) presented on 30th August 2010 in Amsterdam at the XXXVI Congress of International Military History (entitled: Insurgency and Counterinsurgency: Irregular Warfare from 1800 to the Present), quoted by Herman Amersfoort: “At the End of the Day. Reflections on Insurgency anc Counterinsurgency. Irregular Warfare from 1800 to the Present”, in T. Brocades, J. Hoffenaar, A. Lemmers (eds): Insurgency and Counterinsurgency: Irregular Warfare from 1800 to the Present, Netherlands Institute of Military History, Den Haag 2011, pages 673-674.

ISSN 2039-9340 Mediterranean Journal of Social Sciences Vol. 3 (11) November 2012
399
emerged the overlap of the Bourbons’ plans on the spontaneous peasants counter-revolution. 8 The Bourbons basic strategy was, already during the Summer 1860 facing to the Garibaldi advance, the support of the peasants’ movement against the “liberal insurrections” and the provisional governments created by liberals in several localities of South, in which they used the National Guards recently reconstituted by Bourbons. This strategy was successful, by the end of September until half of October: in this context, Bourbons official documents (called “blank papers”) were authorizing “brigandage” and violence against properties and liberals, leaving on the “civil war” field a lot of victims, as reported by witnesses.9 After the Volturno’s battle (2nd October) and the arriving of the Savoy’s Army, the soldiers of the Bourbon king Francis 2nd remained only to the Gaeta’s last defense, without the hope for the old regime’s restore.10
In October 1860, the Garibaldi’s dictatorship and the new provincial governors were opposed to the last Bourbons military threats and peasant uprising, particularly by the annexation’s plebiscite day (21st October). The Cavour government priority was to dissolve the Garibaldi’s Southern Army (more than 50 thousand unities) and to end the dictatorship power, substituted by a Royal Lieutenant; only as second step was the repression of peasant and loyalist brigandage insurrections.
11 A part of historiography shows that as a partially error and premise to the anti Savoy enduring resistance of brigandage.12
In this difficult context, all force available and accountable was employed: among them, the Hungarian Legion.
In 1861-62, meanwhile the Garibaldi’s worries about the Red Shirts’ unemployment (April 1861) and to contrast the great peasant revolt (growing in Spring-Summer 1861), Ricasoli and Rattazzi governments called back in the Royal Army some former volunteers and officers. 3. The Hungarian Legion
13 In line with historical friendship anti-Habsburgs and the constitution of legionaries’ corps, respectively in Hungary and Italy – as the Italian Legion (1100 unities under the command of Alessandro Monti) in Hungary in 1849,14 the Hungarian Legion (60 unities under the command of Lajos Winkler) in Venice in 1849 15 and in Piedmont in 1849 (110 unities under the command of István Türr)16 and in 1859 (3200 unities under the command of György Klapka)17 – the origin of the present formation was held in the Mille expedition of Garibaldi.18
After the departure of 1089 volunteers by Quarto (5th May 1860), Giuseppe Garibaldi counted on 4 Hungarians (Col István Türr, Maj Lajos Tüköry, Sgt Antal Goldberg and the soldier Vencel Lajoski): among them, he sincerely appreciated Türr, the former Colonel of the ’59s Hungarian legion, and appointed him Aide-de-camp. After the heroism of Maj Lajos Tüköry, dead on 6th July because of a wound received during the Red Shirts assault of Porta Termini during the battle of Palermo (27th-30th May), in consequence of the arriving of more Hungarian soldiers among the troops of Gen Giacomo Medici, Türr pointed out to Garibaldi that presence of several number of Hungarian volunteers. On 12th July Garibaldi formally reviewed them: on 16th July his dictatorial decree authorized the constitution of a Hungarian Legion, formed by infantry and chivalry. Initially composed by 48 troop unities and 3 officers, under the command of the Maj Adolf Mogyoródy, the Legion was growing in number of officers and troops and forming a Hussar squadron, reaching the 89 unities at the departure from Palermo (6th August). Hungarians were assigned to the 2nd Brigade leaded by the Hungarian Gen Nándor Éber, within the 15th Division under the command of Gen Türr:
19
8 Franco Molfese: Storia del brigantaggio dopo l’Unità, Feltrinelli, Milano 1964, pages 9-67 (Chapter 1: “Le ‘reazioni’ dell’autunno 1860 – inverno 1861”). 9 See Alberto Mario: La Camicia Rossa, Sonzogno, Milano 1865 and later 2010 (English edition: The Red Shirt. Episodes, Smith, Elder and Co., London 1865). 10 See Cesare Cesari: La campagna di Garibaldi nell’Italia meridionale (1860), Libreria dello Stato, Roma 1928. 11 See Denis Mack Smith: Cavour e Garibaldi nel 1860, Einaudi, Torino 1958, later Rizzoli, Milano 1999 (1st English edition: Cavour and Garibaldi, 1860. A study in political conflict, Cambridge University Press, Cambridge 1954 and later 1985). 12 Molfese: Storia del brigantaggio, pages 28-29. 13 See Attilio Vigevano: La Legione Ungherese in Italia (1859-1867), Libreria Dello Stato, Roma 1924. 14 See László Pete: Il colonnello Monti e la legione italiana nella lotta per la libertà ungherese, Rubbettino, Soveria Mannelli 2003 (in Hungarian: Monti ezredes és az olasz légió a magyar szabadságharcban, Multiplex Media-Debrecen UP, Debrecen 1999). 15 See Eszter Lénárt: “Ungheresi per la Repubblica di Venezia del 1848-1849”, in Quaderni dell’Istituto di Iranistica, Uralo-altaistica e Caucasologia, Università degli studi di venezia, n. 20, 1984. 16 See László Pete: “La Legione ungherese in Piemonte (1849)”, in Italianistica Debreceniensis, X, Debrecen 2003. See also László Pete, Olaszország magyar katonája: Türr István élete és tevékenysége 1825-1908, Argumentum, Budapest 2011. 17 See Jenõ Koltay-Kasztner: Il contributo ungherese nella guerra del 1859. Storia e documenti, Le Monnier, Firenze 1934. 18 See László Pete: “Gli Ungheresi nei Mille”, in RSU. Rivista di Studi Ungheresi, 10-2011, Sapienza Università di Roma – anno XXV. 19 Carlo Pecorini Manzoni: Storia della 15° divisione Türr nella campagna del 1860 in Sicilia e Napoli, Tipografia della Gazzetta d'Italia, Firenze 1876. See also the quoted book of Lukács, e.g. in the Italian edition: Garibaldi e l'emigrazione ungherese (1860-1862) (Mucchi, Modena 1965), and the military diary of the Brigade Eber in appendix.
at the time of the march in

ISSN 2039-9340 Mediterranean Journal of Social Sciences Vol. 3 (11) November 2012
400
continental Italy (on 26th August) they counted on 118 infantry unities and 66 hussars (still without horses) under the command of Maj Fülöp Figyelmesy. On 2nd September, at the stop in Catanzaro, the number is reloaded to 194 unities (119 infantrymen, 14 officers, 75 hussars), the infantry including 25 no Hungarians too (Italians from Lombardy, Veneto, Piedmont, from Bohemia and Moravia, from Switzerland, 1 from Tyrol and 1 French). On 16th September, the Hussar squadron reached in Caserta the Legion: the hussars, now under the command of Maj György Scheiter, were full equipped by horses. On 28th September, the Hungarian legion force counted on 215 unities: 20 106 infantrymen (19 officers, among them 12 lieutenants, and 87 troops) and 109 hussars (21 officers including 13 lieutenants, and 88 soldiers). The day after 16 soldiers enlisted in the Legion, ready for the great battle of the river Volturno against Bourbon Army. On 1st October the Legion (with the Brigade. Éber) was commanded to reach Santa Maria Capua Vetere, meanwhile a hussar squad was separated by Gen Türr towards Maddaloni, giving a link until the division Bixio. In this field the Hungarians were showing military values, suffering more than 1/3 of the effectives as victims: 21
On 4th November the Legion, with the Brigade Eber, left to the Caserta royal residence, for the expected – but not achieved – review of the Southern Army by King Victor Emmanuel 2nd, auspicated by Garibaldi on 6th November. In that week emerged discontent and plaints among the troops: all the corps were separated and dislocated in the province. The Hungarian legion arrived in Nola on 15th November: with all 15th Division they passed under the command of the Savoy authority, which deliberated the dismissing of the Southern Army and so discharged quite all the brigade Eber troops. The Cavour government decided the dissolution of the Southern Army but the maintaining of the Hungarian legion, prepared to be the hardcore of a new Hungarian national army in a new revolutionary action against Habsburg – in agreement with the Hungarian emigration leaded by Lajos Kossuth, but also with Serbs and Romanians – planned for the April 1861. The difficulties and the delay of the Klapka mission in Danube princedoms, followed by the death of Cavour (6th June 1861), stopped finally this project. The surviving of the Legion was warranted, even if with a not clear status: in fact, the Legion was a rest of the Southern Army by at the dependence of the General Secretary of the War Ministry cabinet. The Ministerial letter of 25th February 1861 confirmed that the Legion depended by the War General Director of Naples, with the name of “Auxiliary Hungarian Legion” (the special status continued on 12th December with the appointment of Gen Vetter as General Inspector of the Legion). On 21st January 1861 by a detailed verify of the Legion emerged that it was constituted by an inspectorate and a brigade command (in Naples) an infantry battalion, a hunters battalion, a hussar cavalry regiment and a mountain battery (in Nola): in total 56 officers, 448 troop unities, 146 horses, 7 pieces (in plus concerned the Legion four deposits: in Milan, Acqui, Genoa and Naples). Evident were the inefficences:
on a real presents number of 122, 13 dead (3 officers and 10 troop) and 28 wounded (1 officer and 27 troop). On 31st October in Naples, Garibaldi celebrated the flags giving to the Hungarians, sided by Gen Türr, Col Sándor Teleky, LtCol Kiss and Maj Mihály Gusdafy.
22 too high the officers number, too small the troops units, without uniform and too much different nationalities among the troops (Italians, Swiss people, Germans, Slaves, Frenchmen, Greeks). On 25th February 1861, with a letter by the War Ministry cabinet there were some changes: the inspectorate and the deposits (except Naples) were suppressed, the battery was composed only of 6 pieces, the hunters battalion was renamed bersaglieri (marksmen) division, and that the nationalities admitted were only Hungarian, Poles, Germans. Some tensions were emerging among officers and troops, basically because the frustration of the Hungarian expectations for a new attack against Habsburgs. At the end of March was decided the transfer of the Legion to Nocera, in contrast of the growing brigandage in that region. The discontent grew up against the “Italian” government and the presence of Austrian agents among the troops was supposed. Gen Türr was called to review the legionaries in May and put order among the officers, calling ones to Turin, discharging and arresting the second ones. He wrote to Kossuth about all of these orders, with the hope of their validity: really, that was not enough.23
The quantity of the troops was growing: on 15th July, the force was formed by 69 officers, 813 troops, 44 horses for officers and 208 quadrupeds for troops; on 23rd August, 61 officers, 910 troops, 246 quadrupeds.
24
20 Vigevano: La Legione Ungherese, page 79. 21 Ibidem, pages 85-86. 22 Ibidem, page 104. 23 Ibidem, page 120. 24 Ibidem, page 105.
In the second half of 1861, because of the high number, the honvéd infantry was placed in San Marzano, Salerno, San Gregorio, Eboli, Solofra; the marksmen division in Salerno and Siano; the hussars in Salerno, Nocera De’ Pagani, Eboli, San Gregorio, Solofra, San Marzano, the artillery in Salerno and Nocera De’ Pagani. In 1862 the placement was enlarged to the Puglie, and Amalfi and Potenza regions (in Potenza city and later in Lavello there was the hussar regiment command). In this

ISSN 2039-9340 Mediterranean Journal of Social Sciences Vol. 3 (11) November 2012
401
condition, the Legion was finalized to the repression against the bands raids and brigands insurgency in the period April 1861 – August 1862.25
The General Staff Army’s Historical Archive (AUSSME) files show an interesting documentation about the real employment of the Auxiliary Hungarian Legion in this period within the rich and ordered archival fund Brigandage “G11”.
4. Fights and battles in the Army’s Archival sources (1861-1862)
26 In the fragmented job of the Legion, there are some main episodes in which it’s possible to see the methods and practices of legionaries.27
In June 1861 the Avellino district was in tension, and at the beginning of July the revolts exploded in the localities of Montemiletto, Montefusco and mainly Montefalcione. Required by the Naples command on 8th July, from the Legion command of Nocera De’ Pagani Col Juhász sent Maj Girczy with 3 honvéd companies and 120 hussars to Avellino. Meanwhile, in Montefalcione the intervention of the Avellino governor De Luca, with an infantry company (100 unities of Aosta brigade, 6th regiment) and a national guards battalion (350 unities), was forced by a 2 thousand brigands band to take a refuge in a monastery. On 9th July the legionaries intervention was divided in 3, a company to all the towns: 1st company with Cpt Pinczés to Montefusco and 2nd with Cpt Biró to Montemiletto, each of these supported lately by a hussar platoon. At the morning of 10th July, these companies from the North were converging to Montefalcione, where from South attacked the 3rd company with the rest of hussars (60 unities) to liberate the besieged forces in the monastery. After 1 hour of fight, at 8 o’clock the brigands were pushed back to the town: with the command of the Italian infantrymen and a part of national guards, Maj Girczy at 11 o’clock assaulted the town disbanding brigands to the mountains. The arriving of the reinforcements of the Maj Reinfeld legionaries (2 companies and 2 mountain battery sections with 4 artillery pieces) permitted to all the forces to move in pursuit of brigands. Until 14th July, Girczy and Reinfeld forces were completing the resetting action of the order. In consequence of these actions, several officers and troops were mentioned for military honors: Maj Girczy was mentioned for the knight cross of the Savoy military order and the bronze medal for valor, 4 officer and 16 troops for the silver medal, finally 32 troops for the honor mention.
28
After the Montefalcione episode, the Legion was at the availability of the 16th division command of Ltg Della Chiesa, for intervention in other districts (as in Salerno, Potenza and Basilicata districts). One unit (by the 1st company) under the command of Cpt Halas was detached to Ruvo Di Puglia against a 40 brigands band active in this locality.
29 In January and first half of February 1862 they employed heavy methods and all the measures to destroy the network and environment of this band:30 frequent frisks and controls, burning haystacks and walling up all the doors and windows at the manor farms, questioning and interrogation to all the suspects (without permission for moving) and realizing several arrests. The result was: 3 shot, 15 arrested, the band dispersed.31
In Amalfi hinterland there was an attack of 150 brigands against a patrol reconnaissance (7th infantry regiment) on the Monte Fosse Della Neve, on 13th June 1862. The Hungarian battalion was commanded to outflank this mountain, on 16th June: organized in two military columns, they were attacked by brigands but the right column (under the orders of Lt Serban) resisted until the intervention the national guards from Ravello.
32
At the same time, at Venosa was detached 1st hussar squad with Cpt Dollesz. Because the signal of the presence of brigands in this area, on 16th June 1862 a 30 hussars platoon, leaded by Lt Viberak, was attacked by 28 brigands near a manor farm in the Montemilone town.
33
On 19th June the 4th infantry company of legionaries arrived in the village named Laviano, because the people was pro-brigands. On 25th June the band burned a manor farm and extorted money and weapons from the archpriest: so on
Legionaries launched themselves in pursuit of the band: in the following scrum 19 brigands were killed and 2 wounded. Among Hungarians there were only 2 wounded, meanwhile Lt Viberak, Sgt Bemyasfy, Sgt Zedló and Cpl Werszenberger were mentioned for bravery.
25 It must be mentioned the book of János György Szilágyi: In search of Pelasgian Ancestors, Atlantisz, Budapest 2004 (English edition), about the archaeological excavations organized in the Apennines’ region by Hungarian officials in 1861. 26 See Piero Crociani: Guida al Fondo “Brigantaggio”, Stato Maggiore dell'Esercito-Ufficio Storico, Roma 2004. The documents are in the following dossiers: AUSSME-G11, 1861: Busta XII, pages 999-1181; AUSSME-G11, 1862: Busta XXXIV, fasc. 7/3; further quotations about the legionaries in the dossiers of honor mentions are in AUSSME-G11 1962: Busta XXVIII (XXXX), fasc. 5, page 3. 27 Vigevano: La Legione Ungherese, pages 108-114. 28 Ibidem, pages 108-110. 29 Molfese: Storia del brigantaggio, page 181. 30 The “exceptional measures” were diffusely employed in the Capitanata region by Spring 1862. Ibidem, 180. 31 Vigevano: La Legione Ungherese, page 110. 32 Ibidem, page 111. 33 Ibidem, pages 111-112. See even Molfese: Storia del brigantaggio, page 179.

ISSN 2039-9340 Mediterranean Journal of Social Sciences Vol. 3 (11) November 2012
402
26th June legionaries intercepted the brigands and wounded the leader Vincenzo Robertiello.34 Dispersed the band, on 2nd July Robertiello was arrested and the day after executed.35
In the Amalfi region on summer 1862 was employed a lot of forces against the rage of bandits.
36 On 30th June the brigands occupied the village of Praiano: a legionaries company leaded by Lt Secolic engaged a fight, with the result of 11 brigands captives.37
In Amalfi too, on 22nd July, entered a brigands band, contrasted only by legionaries under the order of Maj Reinfeld. The result was 9 brigands killed, 20 wounded: Maj Reinfeld was appointed of honor citizen and patrician of Amalfi, with a medal for saving the city.
38
The efficiency of repression’s Hungarian tactics (and also their cruelty) was famous within the people. But within the legionaries the discontent grew up because the lack of news about the Hungarian national question. The frustrated expectations of a new action against Habsburgs by Garibaldi (real leader and hero of the Hungarian legionaries) and the lack of unity (because their dispersion in different regions) were at the basis of the tensions between Hungarians and commands. In April 1862 a reform projected a rationalization for the Legion, with the reunification of all the troops in one seat (e.g. in Capua), with one own flag, verbal commands in Hungarian, appointment of the officer etc. On 27th May Gen Türr, passing by Naples, one more time was called to give newly order to the troops: on 29th arrived the order of reorganization, by discharging of several unities and fixing the period of service in 1 year (upon oath to the command). In advance to these new orders, at the half of June 350 legionaries applied for their discharge: without the acceptance of foreign countries to receive them, the former soldiers were remaining in Italy, living by the government subsistence. The notice of arriving hundreds of aspirant legionaries from Balkans, pushed the best elements also to apply for discharge (at the end of June 64 soldiers demanded to leave). In fact, probably inspired by the some Hungarian officers, charges to legionary officers emerged in the press – as in the newspaper Il Popolo d’Italia – on 19th July. So these same days first the legionaries of Nocera (on 18th July), in number of a hundred troops, refused to remain in service and to take arms. The Legion commander Col Juhász (appreciated officer but weak with the troops) was replaced with Col Telkessy. First Gen Klapka, then Gen Türr was commanded to reorganize the Legion. The concentration of all the others legionaries in Nocera and the transfer to Turin (as the 2nd August order) was not achieved, because arrived the notice of the Garibaldi landing in Sicily (on 7th July) for a new expedition until Rome. As Garibaldi joined volunteers during his march, the legionaries were organizing themselves to reach their leader and to reinitializing the war for Hungarian freedom. So on 3rd August the hussars left Lavello towards Nocera, and the squad of Venosa and Melfi decided to do the same: consequently, all the honvéd troops prepared themselves to do that.
5. The legionaries’ mutiny
39 Planned for leaving by the ship “Conte di Cavour” on 13th August, the legionaries were disarmed with some resistance. At the moment of boarding from Salerno, 150 unities scattered towards the mountains, with the aim to join Garibaldi. Arriving to Genoa on 16th August, the ship disembarked 748 unities (41 effective officers, 58 added officers, 649 troops) and 16 horses. The last force remained in Laviano, the 4th infantry company, left by the ship “Ville de Lyon” on 28th August. All the troops were sent to Alessandria, where remained disarmed and under a strict control.40
On 28th August Col Pallavicini stopped the glorious expedition of Garibaldi in Aspromonte: the “hero of the two worlds” was wounded and arrested without the possibility to be joined by Hungarians. A glorious period of the Hungarian participation in the Italian Unification, from the Mille expedition until the Aspromonte, ended, marked by the Garibaldi leading figure and by the employment of the Legionaries against the Brigands.
41
These events were the end of an emotional period for Hungarian troops and hussars in the Italian Royal Army. Emerged the question about the property of weapons, quadrupeds etc of the Legion: the Hungarian committee and Gen Türr proved that it was a gift by Garibaldi and kept weapons, and the Italian government and Army took the rest. Türr was the
6. Conclusion
34 Ibidem, pages 182-183. 35 Vigevano: La Legione Ungherese, pages 112-113. 36 See Molfese: Storia del brigantaggio, page 183. 37 Vigevano: La Legione Ungherese, page 113. 38 Ibidem, page 114. 39 Molfese: Storia del brigantaggio, page 196. 40 Vigevano: La Legione Ungherese, pages 131-133. 41 About this period and perspective, see in general Lukács: Garibaldi e l'emigrazione ungherese (1860-1862).

ISSN 2039-9340 Mediterranean Journal of Social Sciences Vol. 3 (11) November 2012
403
main author of the reorganization of the Legion, with which prepared by the Spring 1863 for a new period of the Legion’s employment in Marche and Abruzzi regions. But the changes within the Legion constitution and, particularly, the new context given by the exceptional laws and application of Pica’s law (August 1863), suspending the civil rights in the regions under the brigands’ threat, signed an extraordinary period in the repression of brigandage and the employment of corps as legions.42
In all the cases, the first years of the repression against the brigandage are important for the emerging of the phenomenon and for the organizing the repression instruments. Particular part of this system was the employment of former volunteers of the Southern Army, enlisted by Garibaldi but in big part discharged after the unification by the government. The efficiency in the employment of these troops (which were really cruel in the repression systems) on the field is parallel with the unaccountability in a regular Army life system (often in peace).
43
In the present Italian public debate, over the pro and contra positions,
Hungarians, in that historical and political framework, showed themselves as troops with military bravery but not unconditionally devoted to the Italian (and, for them, foreign) government.
44 the focal point about the Italian unification is “how” was achieved the national Unity: in this perspective, the most important element emerged is the Italian Risorgimento as the “model” and sample of national resurgences in the wider European Risorgimento.45
42 See Molfese: Storia del brigantaggio (Part II: “Attacco e liquidazione del brigantaggio”). 43 Vigevano: La Legione Ungherese, page 222. 44 See, as samples of the press and public debate, books like: P. Aprile: Terroni. Tutto quello che è stato fatto perché gli italiani del Sud diventassero meridionali, Piemme, Milano 2010; L. Del Boca: Maledetti Savoia, Piemme, Casale Monferrato 1998 and following editions, until 2011; G. Di Fiore: I vinti del Risorgimento. Storia e storie di chi combatté per i Borbone di Napoli, Utet, Torino 2004, and Controstoria dell’Unità d'Italia. Fatti e misfatti del Risorgimento, Rizzoli, Milano 2007. Must be mentioned here some political and academic positions of the political/historiographical and scientific/academic debate about the Risorgimento: firstly, from the contemporary historical debate launched by Alfredo Oriani in La lotta politica in Italia. Origini della lotta attuale (476-1887) (Rome 1892), about the meaning of the Italian unification as “conquest” by the Savoys or as “revolution” not achieved. Scholars and politicians engaged, during the liberal period, edited essaies and speeches about the “Southern” question and the Brigandage (as Giuseppe Zanardelli: Sulle condizioni del Mezzogiorno, 1901; Sidney Sonnino: La questione meridionale, 1902; Francesco Saverio Nitti: Briganti, 1899, Napoli e la questione meridionale, 1903; Gaetano Salvemini: Suffragio universale, questione meridionale e riformismo, 1909; Leopoldo Franchetti: Mezzo secolo di Unità nelle provincie meridionali, 1911) and began the “meridionalism” in Italy (Giustino Fortunato, Napoleone Colajanni, Nitti, Salvemini etc.). Along the XX century too, during the interbellic period (Gioacchino Volpe, Mario Missiroli, Benedetto Croce, Piero Gobetti, Antonio Gramsci, Luigi Sturzo) and after the WWII, some “meridionalists” presented the criticisms: in a marxist perspective; about the institutions of economy and society in the South (e.g. in Rosario Romeo); among different political and ideological environments (Catholic, Liberal, Socialist and Communist ones: e.g. Vincenzo Scotti, Francesco Compagna, Massimo Salvadori, Egidio Sterpa). Essays recently published about the Southern question, written by scholars, are: Giuseppe Galasso (Il Mezzogiorno: da questione a problema aperto, Lacaita, Manduria 2005) and Luigi De Rosa (La provincia subordinata: saggio sulla questione meridionale, Laterza, Roma-Bari 2004). 45 See Giovanna Motta (ed.): Ripensare il Risorgimento, Passigli, Firenze 2012; see also Antonello Biagini, Andrea Carteny: “Introduzione”, in Pierre-Joseph Proudhon: Contro l’Unità d’Italia. Articoli scelti, Miraggi, Torino 2010, pages 5-19.
References Alfonzetti, B., Cantù, F., Formica, M., Tatti, S. (eds), (2011) L'Italia verso l'Unità. Letterati, eroi, patrioti, Ediz. di Storia e Letteratura,
Roma Biagini, A., (2006) Storia dell’Ungheria contemporanea, Bompiani, Milano Brocades, T., Hoffenaar, J., Lemmers A. (eds) (2011) Insurgency and Counterinsurgency: Irregular Warfare from 1800 to the Present,
Netherlands Institute of Military History, Den Haag Cesari, C., (1920) Il brigantaggio e l'opera dell'esercito italiano dal 1860 al 1870, Ausonia, Roma _____ (1928) La campagna di Garibaldi nell’Italia meridionale (1860), Libreria dello Stato, Roma Crociani, P., (2004) Guida al Fondo “Brigantaggio”, Stato Maggiore dell'Esercito-Ufficio Storico, Roma Csorba, L., (1988) Garibaldi élete és kora, Kossuth, Budapest Di Giannatale, F. (ed.), (2011) Escludere per governare. L’esilio politico fra Medioevo e Risorgimento, Le Monnier Università, Firenze Fornaro, P., (2004) István Türr: una biografia politica, Rubbettino, Soveria Mannelli Id., (1995) Risorgimento italiano e questione ungherese: 1849-1867, Rubbettino, Soveria Mannelli Hanák, P., (1996) Storia dell'Ungheria, G. Motta, R. Tolomeo (eds), Franco Angeli, Milano Hobsbawm, E.J., (1969) Bandits, Nicolson, London-Weidenfeld Jászay, M. (2000), Il Risorgimento vissuto dagli ungheresi, Rubbettino, Soveria Mannelli Koltay-Kasztner, J., (1934) Il contributo ungherese nella guerra del 1859. Storia e documenti, Le Monnier, Firenze Lukács, L. (1965), Garibaldi e l'emigrazione ungherese, 1860-1862, Mucchi, Modena

ISSN 2039-9340 Mediterranean Journal of Social Sciences Vol. 3 (11) November 2012
404
Mack Smith, D., (1954) Cavour and Garibaldi, 1860. A study in political conflict, Cambridge University Press, Cambridge Molfese, F (1964), Storia del brigantaggio dopo l’Unità, Feltrinelli, Milano Motta, G. (ed.), (2012) Ripensare il Risorgimento, Passigli, Firenze _____ (2012) Studi sull’Europa orientale, Passigli, Firenze Nyulásziné-Straub, É., (2003) Le relazioni italiane dell'emigrazione di Kossuth: 1849-1866, Archivio Nazionale Ungherese, Budapest Pecorini Manzoni, C. (1876) Storia della 15° divisione Türr nella campagna del 1860 in Sicilia e Napoli, Tipografia della Gazzetta d'Italia,
Firenze Pete, L., (2003) Il colonnello Monti e la legione italiana nella lotta per la libertà ungherese, Rubbettino, Soveria Mannelli 2003 _____(2011) Olaszország magyar katonája: Türr István élete és tevékenysége 1825-1908, Argumentum, Budapest 2011 Pieri, P., (1962) Storia militare del Risorgimento: guerre e insurrezioni, Einaudi, Torino Szabad, Gy., (1977) Hungarian political trends between the revolution and the compromise: 1849-1867, Akadémiai Kiadó, Budapest Szilágyi, J.Gy., (2004) In search of Pelasgian Ancestors, Atlantisz, Budapest Vigevano, A. (1924) La Legione Ungherese in Italia (1859-1867), Libreria Dello Stato, Roma Archival documents AUSSME-G11, 1861: Busta XII AUSSME-G11, 1862: Busta XXXIV AUSSME-G11 1962: Busta XXVIII (XXXX)

ISSN 2039-9340 Mediterranean Journal of Social Sciences Vol. 3 (11) November 2012
405
Metadiscourse in Applied Linguistics Research Articles:
A Cross-Sectional Survey
Davud Kuhi (PhD)
Maraghe Branch, Islamic Azad University, IRAN
Mahin Yavari (MA)*
Maraghe Branch, Islamic Azad University, IRAN [email protected]
Ali Sorayyaei Azar (PhD Candidate)
Faculty of Languages and Linguistics, University of Malaya, Malaysia
Doi:10.5901/mjss.2012.v3n11p405
Abstract: The literature on the generic features of academic discourse has revealed that the communicative purposes of different sections of research reports (e.g. research articles) affect the degree of tentativeness, flexibility, and authorial engagement realized by various linguistic resources. Following this assumption, a corpus of 32 research articles in the field of applied linguistics were analyzed in order to find out both the cross-sectional (i.e. Introduction-Methodology-Results-Discussion/Conclusion) variations in the use of metadiscourse – as a key tool for establishing interpersonal relationships in academic writing. Hyland’s (2005) taxonomy of metadiscourse was applied to analyze the data set. The findings of the study revealed that the authors utilized interpersonal features differently in the four rhetorical atmospheres of their texts. Writers tended to employ high frequency of interactive metadiscourse resources in the introduction section of their articles, while in the discussion/conclusion section writers utilized more interactional resources. The findings clearly indicate that the differences in the discoursal functions of different sections of a research report play a significant role in writers’ fashioning of interactive and interactional features. The results of this study can be drawn on in academic writing courses for research students and novice writers in order to facilitate their achievement in academic writing. Key words: Metadiscourse; Introduction; Method; Results; Discussion/Conclusion 1. Introduction The awareness that success of academic communication is partly accomplished through strategic manipulation of interpersonal and rhetorical elements has stimulated a fresh wave of studies exploring the interactive, interpersonal, evaluative, persuasive, and rhetorical dimensions of academic discourse. Many of these studies can be clustered under the uniting umbrella of metadiscourse − an intuitively attractive concept as it seems to offer a principled way of collecting under one heading the diverse range of linguistic devices writers use to explicitly organize texts, engage readers, signal their own presence, and signal their attitudes to their material and their audience. The concept of metadiscourse brings to the fore qualities of academic written communication, such as nontopical linguistic material that may be irrelevant to topic development but key to understanding discourse as a whole (Lautamatti, 1987); linguistic material that does not add propositional information but signals the presence of an author (VandeKopple, 1985); author’s intrusion into the discourse to direct rather than inform (Crismore, 1983); and nonreferential aspects of discourse that help to organize prose as a coherent text and convey a writer’s personality, his or her awareness of readers, and his or her stance toward the message (Hyland, 1998).
Studies that have developed a cross-cultural perspective (e.g., Adel, 2006; Breivega, Dahl, & Flottum, 2002; Dahl, 2004; Mauranen, 1993; McEnry & Kifle, 2002; ThueVold, 2006) have revealed that metadiscourse is not uniform across languages; studies that have looked at metadiscourse form cross-disciplinary point of view (e.g., Charles, 2006; Harwood, 2005; Hewings & Hewings, 2001; Swales et al., 1998) have shown how metadiscourse use is sensitive to the ways texts are written, used and responded by individuals acting as members of academic discourse communities; and

ISSN 2039-9340 Mediterranean Journal of Social Sciences Vol. 3 (11) November 2012
406
studies that have adopted communicative purpose (Swales, 1990) as the major focus—genre-based studies of metadiscourse—have also contributed to awareness of how different communicative purposes and different audiences can influence the use of metadiscourse.
Different academic genres have been investigated both individually and in comparison with other genres. While due to its significance in the life of academy, the research article (RA) has been studied more extensively (e.g., Hyland, 1996a, 1996b, 2002c, 2007), other academic genres like textbooks (e.g., Hyland, 1994), dissertations (e.g., Bunton, 1999), and undergraduate essays (e.g., Myers, 2001) have also been investigated. Other studies have compared two or more academic genres: Hyland’s (1999) study of research articles and textbooks; Hyland’s (2002a) study of textbooks, research articles, and student reports; de Oliveira and Pagano’s (2006) study of research articles and science popularization articles; Hyland’s (2004) investigation of master’s and PhD dissertations; Hyland’s (2002b) investigation of expert and non/less expert writers; and Hyland and Tse’s (2005) investigation of research articles and dissertations.
While such comparative genre-based studies have contributed a great deal to understanding how metadiscourse use might vary with generic fluctuations, there has been a tendency to look at the variations in those genres that represent an overt contrast in terms of the communicative purpose(s) they serve without considering the nature of variations in smaller components – i.e. subgenres – of those genres. The main objective of the present study, hence, was to investigate how metadiscourse use varies due to the variations in communicative and rhetorical features of the subgenres (Introduction, Method, Results, and Discussion/Conclusion) of a single genre – research article (RA henceforth). This research might be of some significance in that it looks at how the differences in the communicative purposes of different subgenres might influence the fashioning of interpersonal relationships in academic writing and hence provide useful insights for novice writers and researchers.
2. Theoretical Review Studies dealt with analyzing language can be grouped into two: first studies concerning language structure, that is identifying structural unites, classes of language (such as words and phrases) and describing how these units form larger grammatical units, and second studies concerning language use, that is analyzing how speakers and writers make use of the language.
Therefore, moving beyond the grammatical features of any discourse, specially written one to analyse language in use (how people use language in their everyday lives), the distinction is made between transactional and interactional uses of language, in other words communication of information and the communication of affect respectively. The former one which deals with that function of language applied for expressing content and the latter one which deals with that function of language applied for expressing personal relations and attitudes can be considered as two sides of the same coin that the researchers refer to it as interaction. Both of them act simultaneously to create meaning in real life (Hyland, 2005). Reflexivity, according to Roman Jakobson, is a feature of everyday language in use and as Adel (2006) asserts, reflexivity is not limited to discourse for specific purposes. She points out that “not only is reflexivity abundant in everyday discourse, but some scholars argue that it is fundamental to human communication” (p.2). She, therefore, classifies metadiscourse as one type of reflexivity: “it includes reflexive linguistic items which reveal the writer's and reader’s (or speaker’s and hearer’s) presence in the text, either by referring to the organization of the text or by commenting on the text in other ways” (p.2). The metadiscourse approach to language analysis focuses on the natural language used in texts rather than what is theoretically possible in a language.
The term metadiscourse was coined by Zellig S Harris in 1959 for the first time. Later on a number of researchers such as Williams (1981), Vande Kopple (1985), Crismore (1989) and Hyland (2005) elaborated it more. It has been widely defined as ‘discourse about discourse’ or ‘communication about communication’ (Vande Kopple, 1985:83), ‘metatalk’ (Schiffrin, 1980), and ‘signaling devices’ (Crismore, 2004) among many other scholar’s definitions. Very few studies offer a specific definition of metadiscourse, however, partly because it constitutes a fuzzy nature (Hyland, 2005, Adel, 2006). In a simple term, it is difficult to find a single accepted definition of the term metadiscourse because of its fuzzy nature. That is why we can observe density of definitions in the literature of metadiscourse. Of all these descriptions of the term metadiscourse, two groups are identifiable: the first group as non-propositional or non-topical definitions and the second group as writer’s act on research discourse. Harris’ (1959) definition of metadiscourse can be regarded as a foundation for non-propositionality. He defined metadiscourse as “non-topical linguistic material” (p. 464). Williams (1981: 226) also considered metadiscourse as anything which “does not refer to the subject matter being addressed”.
Vande Kopple (1985), Crismore (1983) are among those scholars who considered metadiscourse as something that writers are doing in the text. For example, Vande Kopple (1985: 83) pointed out that in metadiscourse level “we do not add propositional material but help our readers organize, clarify, interpret, evaluate, and react to such material”. In a similar vein, Crismore (1983) also regarded metadiscourse as “the author’s intrusion into the discourse, either explicitly or

ISSN 2039-9340 Mediterranean Journal of Social Sciences Vol. 3 (11) November 2012
407
non-explicitly, to direct rather than inform, showing readers how to understand what is said and meant in the primary discourse and how to ‘take’ the author” (p. 2).
But above all definitions of both propositional/non-propositional distinctions, Hyland (2005: 37) proposes the most advantageous definition of metadiscourse: “Metadiscourse is the cover term for the self-reflective expressions used to negotiate interactional meanings in a text, assisting the writer (speaker) to express a view point and engage with readers as members of a particular community”. In other words, in this new definition he tries to show presence of the writer in the text and also the role of the reader in the construction of argument. 3. The Present Study Following Hyland’s (2005) taxonomy of interpersonal metadiscourse, this study by taking more comprehensive picture of the rhetorical atmosphere in different rhetorical sections of RAs as well as concentrating on all interpersonal resources- Interactive and Interactional, aims at providing a more comprehensive cross-sectional analysis of features utilized for both structuring the discourse and conveying authors stance towards readers and the discourse itself in a corpus of Applied Linguistics RAs published in high prestigious applied linguistics journals. In order to do so the following research question addressed in this study: What are the differences across four different sections of research articles (Introduction, Methodology, Results, and Discussion/Conclusion) in using metadiscoursal resources? 4. Procedures and the Corpus 4.1 Selection Process of the Journals and Articles A journal may contain different types of content including Empirical/Experimental RAs, Theoretical RAs, Review Articles, Editorials, Case reports. The corpus of this study was restricted to 32 Empirical/Experimental RAs (see Appendix for full bibliographical information of the articles). The research articles belonged to Applied Linguistics articles all published between 2005 and 2011. In the context of the present study Applied Linguistics was defined as: In a broad sense, applied linguistics is concerned with increasing understanding of the role of language in human affairs and thereby with providing the knowledge necessary for those who are responsible for taking language related decisions whether the need for these arises in the classroom, the workplace, the law court, or the laboratory (Wilkins, 1999:7). Theoretical articles were excluded from the scope of the study, because it is clear that the overall organization of empirical RAs and theoretical RAs completely differ. The empirical research articles include those articles reporting on investigations that apply quantitative, qualitative or mixed approach in the process of collecting and analyzing the data, while the purpose in theoretical RA is presenting a theory, synthesis of other theories. Tow criteria were involved in sampling procedure of the journals. The first one was their rating among AL lecturers and the second criterion was the accessibility to the most important publications. In this process, ten lecturers that held a PhD in AL were individually interviewed - this is known as informant nomination, the established tradition of selecting and sampling in metadiscourse studies- (see for e.g. Hyland 2000, 2007; Kuhi & Behnam, 2010). They were asked to name and rank the five most prestigious journals defined as journals with higher degree of popularity and reputation among academics which they would want/wish their research articles to be published in. Then the responses were scored and the journals were ranked based on what their score was. An important question at this point, however, might be to ask if writer’s nationality (native or non-native) can affect the study. According to Lindeberg’s (2004) view top English-medium journals’ severity in review processing and also their demands according to their specific guidelines “make it irrelevant whether the RAs were written by native English speakers or not” (p.8).They are presented in the order ranked by academics as follows: TESOL Quarterly (Teachers of English to Speakers of Other Languages Quarterly Journal) AL Journal (Applied Linguistics Journal) ESP Journal (English for Specific Purposes Journal) Journal of Pragmatics System Journal

ISSN 2039-9340 Mediterranean Journal of Social Sciences Vol. 3 (11) November 2012
408
As to the focus of this study, cross-sectional comparison, the choice of RAs was based on a criterion. The RAs had the standard macrostructure of empirical RAs, IMRD/C (Introduction, Method, Results, and Discussion/Conclusion) structure. The researchers went through a random sampling procedure.The articles were selected, making 32 in all including 8 from AL, 7 from TESOL Quarterly, 7 from System, 6 from ESP, and 4 from Pragmatics (due to the variety in the publication frequency of the journals). This study was part of a larger project investigating metadiscourse use in articles rhetorical sections (IMRD/C) as well as comparing and contrasting males and females’ use of metadiscourse in sections mentioned above. . (When extracts are provided from the corpus, the first letter of each subgenre initiates the extract; for example: ‘D. RA2 which means Discussion of Research Article number 2’). As the focus of this study was on four different sections of AL RAs, namely Introduction, Methodology, Results and descussion/conclusion (IMRD/C), the reference sections, tables, abstracts, figures, bibliographies, footnotes, direct quatations of other researchers and headings were deleted and excluded from the domian of the present study, to form an electronic corpus of totalling 221284 words from four sections of 32 articles. In the process of sampling, it was understood that most of the articles had seprate results and discussion, but some others had results and discussion merged/coalesced. Considering the fact that different sections of articles perform different rhetorical functions raelized through applying different linguistic resources (see, for example, Salager-Meyer , 1994; Hopkins and Dudly-Evans , 1988; Adams-Smith, 1984), here the focus was on articles with separate results and discussion/conclusion sections. 4.2 Model of Analysis The instrument applied in the analytic component of the present study was Hyland’s (2005) Interpersonal model of metadiscourse. Hyland’s (2005) taxonomy includes two sub-divisions: the first sub-division is interactive resources that refer to different ways of organizing discourse. This concerns the writers to manage the information flow and assist the readers to know writers' preferred interpretation including code glosses, Transitions, Frame markers, Evidentials, and Endophoric markers. The second category is interactional resources that engage readers in the argument by alerting them to the author’s perspectives both toward a propositional content and readers themselves. This concerns writers to display an acceptable persona consistent with the norms of discourse community such as Hedges, Attitude markers, Boosters, Self mentions, and Engagemnet. In the analysis procedure, we also took into consideration the following principles emphasized by Hyland: Metadiscourse is distinct from propositional material Metadiscourse refer to some aspects of texts that embody writer-reader interactions Metadiscourse refer only to relations which are internal to the discourse All in all, it suits best and complete as a model or framework for the purposes of this study, because it is supposed to move away from traditional treatment of metadiscourse towards a model that can capture the underlying principles of academic writing. 4.3 Data Analysis Procedure In order to achieve a reliability in the data analysis procedure, two processes of researchers analysis and inter-rater analysis along with consultation with a specialist in this field were applied in the present study. Four different sections of 32 RAs were read carefully word by word in order to identify both interactive and interactional metadiscourse resources. In order to increase the reliability of the findings, the inclusion of inter-rater was necessary: after highlighting all the instances of metadiscourse resources in four different sections of 32 RAs, in the second phase of the data analysis, the items were double-checked by another expert in the field. We prefered to select one page from each article randomly. Inter-rater reliability was found to be 0.85. There were some disagreements and also ambiguities. Such cases were consulted with professor K. Hyland via e-mail. 5. Results and Discussion 5.1. A Quantitative Discussion To address the research question of the study, the frequency of interpersonal resources were calculated, the overall distribtion of which is summarized in table 1.

ISSN 2039-9340 Mediterranean Journal of Social Sciences Vol. 3 (11) November 2012
409
Table 1.Overall Frequency of Metadiscourse Resources in AL RAs’ Four Sections (per 1,000 words)
(I=Introduction; M=Method; R=Results; D/C=Discussion/Conclusion; F=Frequency) As Table 1 shows, the frequency of metadiscourse resources in terms of interactive resources in the Introduction section of AL RAs (62.3 per 1,000 words) was higher, and also in the Discussion/ Conclusion section (45.8 per 1,000 words) of AL RAs, there was higher frequency of interactional resources. The overall distribution of both categories in four sections is summarized in Figure 1 on the basis of average frequency (per 1,000 words). Figure 1.Overall Frequency of Interpersonal Metadiscourse Resources in AL RAs’ Four Sections (per 1,000 words)
I M R D/C
Interactive 62.34 39.82 27.99 38.23
Interactional 35.45 24.7 30.23 45.87
010203040506070
F per
1000
(I=Introduction; M=Method; R=Results; D/C=Discussion/Conclusion) To better illustrate the findings about the frequency of interpersonal resources, Figure 2 and Figure 3 display the frequency of subcategories in the Introduction, Method, Results, and Discussion /Conclusion sections. Figure 2.Category-based Distribution of Interactive Metadiscourse Resources in Four Sections of AL RAs
(CG=Code Glosses; End=Endophorics; Evd=Evidentials; F=Frame markers; T=Transitions)
CG End Evd F T
Intro. 11,97 2,56 26,89 6,58 14,32
M. 7,5 5,16 7,58 7,84 11,72
R. 6,02 5,37 2,04 4,08 10,47
D/C 6,85 2,71 8,8 4,41 15,44
05
1015202530
F pe
r 100
0Applied Linguistics RAs
Total D/C R. M. I Total words 221284 57353 62935 42211 58785 9301 2193 1762 1681 3665 Total number of Interactive Devices 42.03 38.23 27.99 39.82 62.34 F per1,000 words 7661 2631 1903 1043 2084 Total number of Interactional Devices 34.62 45.87 30.23 24.70 35.45 F per 1,000 words

ISSN 2039-9340 Mediterranean Journal of Social Sciences Vol. 3 (11) November 2012
410
Regarding the interactive devices, as can be seen in Figure 2, evidentials can be considered as the most varied feature across four sections. The introduction section ranked the first with discussion, method, results were being the second, third, and fourth. Figure 3.Categorical Distribution of Interactional Metadiscourse Resources in Four Sections of AL Ras
0
5
10
15
20
25
F per
1000
Intro 10,78 4,88 0,23 1,93 17,6
M. 6,65 2,81 3,52 1,49 10,21
R. 11,02 4,3 0,71 1,71 12,47
D/C 13,28 5,99 1,08 2,98 22,52
AM B SM E H
(AM=Attitude Markers; B=Boosters; SM=Self Mentions; EM=Engagement Markers; H=Hedges; Intro=Introduction; M=Method; R=Results; D/C=Discussion/Conclusion) Regarding interactional devices, as Figure 3 shows, hedges can be considered as relatively a varied feature across the sections. These differences can be explained by resorting to the communicative purposes of different sections of research papers which may affect the degree of writer-reader relationship and also discourse organization, realized by means of different linguistic resources. In what follows, we have provided an in-depth analysis of the findings: 5.2. The Priority of Interactive Resources in the Introduction Section The priority of evidentials in introduction section of AL RAs can be explained through Swales’ (1990) ideas. He believes that writers/authors can relate their study to previous research in order to determine the significance of its contribution in the introduction section of articles. This is achieved by means of evidentials. Similarly, as Hill, Soppelsa, and West (1982) state, in the introduction section, the purpose is to transit from the larger academic field to the particular study by means of evidentials. This can also be a support for many of move related studies that claimed about the density of citations as a tool for identifying the neglected areas in previous studies so as to open a way for new research (see Swales and feak, 2000; Thompson and Tribble, 2001; Samraj, 2002; Fakhri, 2004; Yeh, 2010). The example from the corpus illustrates the point: (1) Clearly, these claims about attention and noticing are important for SLA. Scmidt (1995,2001) and Robinson (1995,2001, 2003) argue that learners must consciously notice input...referred to as the Noticing Hypothesis (Schmidt 1990,1993,1995), which has been explored in a number of studies (e.g. Alanen 1995; Leow 1997; Rosa and O'Neill 1999;Leow 2000; Izumi 2002; Leow 2002; Swain and Lapkin 2002; Adams 2003; Gass et al. 2003).(I. RA1) ‘Hedges’ and ‘attitude markers’ were the most frequently used subcategories of interactional category in the introduction section of articles. Considering hedges, as Salager-Meyer (1997) puts, they are used to establish a context of argumentation that results in giving encouragement to the researcher’s own work. Regarding attitude markers, “the build-up of attitude markers amplifies the negative tone of the introduction to create a rhetorical effect which constructs a problematic issue worthy of research” (Hyland, 2005:150). The following examples can show such tendencies: (2) In addition to knowledge, pre-service programs are expected to prepare teachers with a variety of techniques and strategies. There may be more opportunities for student teachers in these programs…I argue that these courses could aim to create reflective learning communities where student teachers would also be trained. (I. RA9)

ISSN 2039-9340 Mediterranean Journal of Social Sciences Vol. 3 (11) November 2012
411
(3) L2 vocabulary development through reading is complex…the quality of processing during reading and on any tasks intended to facilitate integration of new words is crucial…a few studies investigated effects of background knowledge on retention of nonsense words… (I. RA17) 5.3. Writer’s Stance in Method Section Less frequent use of hedges can be an indication of author's desire in highlighting the reliability and validity of their methodological decisions. Through these devices, persuading variety of readers (for example novice readers, informant readers and referee) of the validity of applied models for getting appropriate findings will be easy and achievable (Lim, 2006). Hyland (2005) offers a good possible explanation for this: The fact that methodologies and results are more open to question also means that writers in the soft fields need to work harder to establish the significance of their work against alternative interpretations. This means they also have to restrict, or fend off, possible alternative voices, closing them down using boosters to emphasize the strength of the writer’s commitment, and thereby convince the reader through the force of the argument (p. 146). 5.4. Lower frequency of metadiscourse in the Results Section The use of evidentials with the lowest frequency in Results section in comparison with three other sections can be considered as an important issue in the results section of articles. Of course, it is clear that here the goal is providing an account of the results of the present research not the findings of other studies. However, there might be some hidden motivations behind weaker resort to such devices as well. In fact, the writers might look at this section as a safer atmosphere for developing a monolithic voice. What is also interesting about the Results section of articles (with results separate from discussion section) is that there is much less space to comment on the reported results. Thus, Results section of articles contains low density of interpersonal metadiscourse in comparison with other three sections. 5.5. The Priority of Interactional Devices in Discussion/Conclusion Section Writer’s heavier use of interactional devices in the Discussion section of articles suggests that they are aware of the subjective nature of the Discussion section. Moreover, according to Hyland (1998), “ [i]t is in Discussions that authors make their claims, consider the relevance of results and speculate about what they might mean, going beyond their data to offer the more general interpretation by which they gain their academic credibility. The level of generality, and therefore the density of hedges, is much higher here, as explore the ratifications of their results” (p. 154). Hyland (1999) also indicates that writers utilize more hedging strategies as a major pragmatic feature to establish the importance of their findings in the discussion section. This finding of the present study confirms other researchers’ findings (Marandi, 2003; Faghih and Rahimpour, 2009; Salager-Meyer, 1994; Adam Smith's, 1984; Swales, 1990) in that the discussion section is the most heavily hedged subgenre due to the kind of information it encompasses or greater possibility of using author projection to this section. The preference for interactional devices in the discussion section of articles shows that this section is more explicitly interpersonal and evaluative. The following examples from the corpus clarify the point: (4)…the Hong Kong students appeared to have relatively more difficulty than other two groups… (D. RA21) (5) Emotions (at least in some cases) could be coded as filling a rapport-building function. (D. RA26) (6) It is acknowledged that learners of Japanese, as suggested by Okada et al., may be more motivated and more dedicated than others, which may explain the discrepancy described above. (D. RA13) Another important device which was found to further affect the communicative purpose of Discussion/Conclusion section of articles was the positive quality of attitude markers− while, it was used negatively in the Introduction section. It means that authors try to realize the importance of their arguments by means of using positive kinds of attitude markers. In this way, readers can be influenced positively to agree on writer’s argument. The following examples from the Discussion/Conclusion section of articles can be a proof for this:

ISSN 2039-9340 Mediterranean Journal of Social Sciences Vol. 3 (11) November 2012
412
(7) This finding is particularly interesting because it indicates that these students hold strong beliefs about the relative difficulty of learning these two foreign languages. (D. RA27) (8) It would be vital to move deeper into the constituent steps belonging to each move. Linguistic similarities existing between different constituent steps reveals a great deal of information…linguistic structures may effectively enable learners to acquire a deeper understanding of the common situations. (D. RA12) 6. Implications In this study we presented an overall cross-sectional picture of the types and frequencies of metadiscourse in RA as a high prestigious genre. It was revealed that different sections of articles are demanding different kinds and distributions of interpersonal resources. This can be insightful for the teachers of English for academic purposes in making their learners sensitive to the ways metadiscourse use is shaped by the rhetorical atmosphere of the section in which it occurs. In this way section-specific metadiscourse features may sensitize academic writers and can assist them to understand what kinds of resources are needed to achieve the communicative purposes of specified genre. ESP teachers also need to move beyond a view that academic writing is simply detached and factual. According to Hyland (1998), ESP courses need to discuss the interpersonal aspects of writing as there is still not enough focus on students to be taught explicitly about interpersonal relationships. They, for example, need to view writing of discussion/conclusion section in soft sciences (AL) as evaluative section and acknowledge students that hedges are one of the conventions of this section. In this way, they can use can delete hedges in the discussion section of papers and ask their students to rewrite it in a way that can be hedged. In conclusion, learning to deal with interpersonal relationship in academic writing is as important as learning to deal with the propositional content of academic discourse; in other words, both of them act dependently not independently (Halliday, 1994).
References
Adams Smith, D.E. (1984). Medical discourse: aspects of author’s comment. English for Specific Purposes, 3, 25–36. Adel, A. (2006). Metadiscourse in L1 and L2 English. Amsterdam: John Benjamins. Breivega, K. R., Dahl T., & Flottum, K. (2002). Traces of self and others in research articles. A comparative study pilot study of English,
French, and Norwegian research articles in medicine, economics and linguistics. International Journal of Applied Linguistics, 12, 218-239.
Bunton, D. (1999). The use of higher level metatext in PhD theses. English for Specific Purposes, 18, 41-56. Charles, M. (2006). The construction of stance in reporting clauses: A cross-disciplinary study of theses. Applied Linguistics, 27, 492-
518. Crismore, A. (1983). Metadiscourse: What is it and how is it used in school and non-school social academic science texts. Urbana-
Champaign: University of Illinois. Crismore, A. (1989). Talking with readers: Metadiscourse as rhetorical act. New York: Peter Lang. Crismore, A. (2004). Pronouns and metadiscourse as interpersonal rhetorical devices in fundraising letters: a corpus linguistic analysis.
In Discourse in the professions. Perspectives from corpus linguistics, edited by U. Connor and T. A. Upton. Amsterdam: John Benjamins, pp. 307-330.
Dahl, T. (2004). Textual metadiscourse in research articles: A marker of national culture or of academic discipline? Journal of Pragmatics, 36(10), 1807–1825.
De Oliveira, J.M. & Pagona, A.S. (2006). The research article and the science popularization article: a probabilistic functional grammar perspective on direct discourse representation. Discourse studies, 8(5), 627-646.
Faghih, E. & Rahimpour, S. (2009). Contrastive rhetoric of English and Persian written texts: Metadiscourse in applied linguistics research articles. Rice Working Papers, 1, 92-107
Fakhri, A. (2004). Rhetorical properties of Arab research article introductions. Journal of Pragmatics, 36, 1119-1138. Halliday, M. (1994). An Introduction to Functional Grammar, 2nd ed. Edward Arnold, London. Harris, Z. (1959). The transformational model of language structure. Anthropological Linguistics, 1(1), 27-29. Harwood, N. (2005). “We do not seem to have a theory…The theory I present here attempts to fill this gap”: Inclusive and exclusive
pronouns in academic writing. Applied Linguistics, 26, 343-375. Hewings, A., & Hewings, M. (2001). Anticipatory “it” in academic writing: an indicator of disciplinary difference and developing
disciplinary knowledge. In M. Hewings (Ed). Academic writing in context (pp. 199-214). Birmingham, UK: University of Birmingham press.
Hill, S. S., Soppelsa, B. F. & West, G. K. (1982). Teaching ESL students to read and write experimental-research papers. TESOL Quarterly, 16(3), 333-347.
Hopkins, A., & Dudley-Evans, T. (1988). A genre-based investigation of the discussion sections in articles and dissertations. English for Specific Purposes, 7(1), 113-121.

ISSN 2039-9340 Mediterranean Journal of Social Sciences Vol. 3 (11) November 2012
413
Hyland, K. (1994). Hedging in academic writing and EAP textbooks. English for Specific Purposes, 13, 239-256. Hyland, K. (1996a). Nurturing hedges in the ESP curriculum. System, 24, 477-490. Hyland, K. (1996b). Writing without conviction? Hedging in Science research articles. Applied Linguistics, 17, 433-454. Hyland, K. (1998). ‘Boosting, hedging and the negotiation of academic knowledge. Texts, 18(3), 349-382. Hyland, K. (1999). Talking to student: Metadiscourse in introductory textbooks. English for Specific Purposes, 18(1), 3-26. Hyland, K. (2000). Disciplinary discourses: Social interactions in academic writing. Harlow, Essex: Pearson Education. Hyland, K. (2002a). Directives: Argument and engagement in academic writing. Applied Linguistics, 23, 215-239. Hyland, K. (2002b). Options of identity in academic writing. ELT Journal, 56, 351-358. Hyland, K. (2002c). What do they mean? Questions in academic writing. Texts, 22, 529-557. Hyland, K. (2004). Graduate gratitude: The generic structure of dissertation acknowledgments. English for Specific Purposes, 23, 303-
324. Hyland, K. (2005). Metadiscourse: Exploring interaction in writing. London: Continuum. Hyland, K. (2007). Applying a gloss: Exemplifying and reformulating in academic discourse. Applied Linguistics, 28, 266-285. Hyland, K., Tse, P. (2005). Hooking the reader: A corpus study of evaluative that in abstracts. English for Specific Purposes, 24, 123-
139. Kuhi, D. & Behnam, B. (2011). Generic variations and metadiscourse use in the writing of applied linguistics: a comparative study and
preliminary. Written Communication, 28(1), 97-141. Lautamatti, L. (1987). Observations on the development of the topic in simplified discourse. In U. Conner & R. B. Kaplan (Eds.), Writing
across languages (pp. 87-114). Reading, MA: Addison-Wesley. Lim, J. M. H. (2006). Method sections of management research articles: A pedagogically motivated qualitative study. English for Specific
Purposes, 25(3), 282-309. Lindeberg, C. (2004). Promotion and politeness: conflicting scholarly rhetoric in three disciplines. Vasa: Abo Akademi University Press,
Abo, Finland. Marandi, S. (2003). Metadiscourse in Persian and English master’s thesis: A contrastive study. Iranian Journal of Applied Linguistics, 6
(2), 23-42. Mauranen, A. (1993). Contrastive ESP rhetoric: Metatext in Finnish- English economics texts. English for Specific Purposes, 12, 3-22. McEnry, T. & Kifle, N.A. (2002). Epistemic modality in argumentative essays of second language writers. In J. Flowerdew (Ed.)
Academic Discourse (pp. 182-195). London, UK: London. Myers, G. (2001). “In my opinion”: The place of personal views in undergraduate essays. In M. Hewings (Ed.), Academic writing in
context (pp. 63-78). Birmingham, UK: University of Birmingham Press. Salager-Meyer, F. (1994). Hedges and textual communicative function in medical English written discourse. English for Specific
Purposes, 13(2), 149–170. Salager-Meyer, F. (1997). I think that perhaps you should: a study of hedges in written scientific discourse. The Journal of TESOL
France, 2(2), 127-143. Samraj, B. (2002). Introductions in research articles: Variations across disciplines. English for Specific Purposes, 21, 1-17. Schiffrin, D. (1980). Metatalk: Organizational and evaluative brackets in discourse. Sociological inquiry. Language and Social Interaction,
50, 199-236. Swales, J. (1990). Genre analysis. English in academic and research setting. Cambridge: Cambridge University Press. Swales, J., Ahmed, U. K., Chang, Y., Chavez, D., Dressen, D. F., & Seymour, R. (1998). Consider this: The role of imperatives in
scholarly writing. Applied Linguistics, 19, 97-121. Swales, J., & Feak, C. (2000). English in today’s research world. Ann Arbor: University of Michigan Press. Thompson, P., & Tribble, C. (2001). Looking at citations: Using corpora in English for academic purposes. Language Learning &
Technology, 5(3), 91-105. Thue Vold, E. (2006) Epistemic modality markers in research articles: A cross-linguistic and cross-disciplinary study. International
Journal of Applied linguistics, 16(1), 61-87. VandeKopple, W. (1985). Some exploratory discourse on metadiscourse. College Composition and Communication, 36, 82–93. Wilkins, D.A. (1999). Applied Linguistics. In B. Spolsky (Ed). Concise encyclopedia of educational linguistics (pp. 6-17). Amsterdam:
Elsevier. Williams, J. M. (1981). Style: Ten lessons in clarity and grace. Chicago: University of Chicago Press. Yeh, C. (2010). Citations practices in TESL research articles: A comparative study. Asian ESP Journal, 6(2), 40-64.
Appendix: List of Research Articles
No.
Article
1 Mackey, A. (2006). Feedback, noticing and instructed second language learning. Applied linguistics, 27/3, 405-430. 2 Alderson, Ch. (2007). Judging the frequency of English words. Applied Linguistics, 28/3, 383-409. 3 Vandergrift, L. (2005). Relationships among motivation orientations, metacognition awareness and proficiency in L2
listening. Applied Linguistics, 26/1, 70-89. 4 Forman, R. (2011). Humorous language play in a Thai EFL classroom. Applied Linguistics, 32(5), 541-565. 5 Field, J. (2005). Intelligibility and the listener: The role of lexical stress. TESOL Quarterly, 39(3), 399-423.

ISSN 2039-9340 Mediterranean Journal of Social Sciences Vol. 3 (11) November 2012
414
6 Field, J. (2008). Bricks or Mortar: Which parts of the input does a second language listener rely on?. TESOL Quarterly, 42(3), 411-433.
7 Folse, K. (2006). The effect of type of written exercise on L2 vocabulary retention. TESOL Quarterly, 40(2), 273-283. 8 Radwan, A. (2005). The effectiveness of explicit attention to form in language learning. System, 33, 69-87. 9 Goker, S.D. (2006). Impact of peer coaching on self-efficacy and instructional skills in TEFL teacher education. System, 34,
239-254. 10 Grainger, P. (2005). Second language learning strategies and Japanese: Does orthography make a difference?. System, 33,
327-339. 11 Alptekin, C. (2006). Cultural familiarity in inferential literal comprehension in L2 reading. System, 34, 494-508. 12 Lim, J. (2006). Method sections of management research articles: A pedagogically motivated qualitative study. English for
Specific Purposes, 25, 282-309. 13 Ozturk, I. (2007). The textual organization of research article introductions in applied linguistics: Variability within a single
discipline. English for Specific Purposes, 26, 25-38. 14 Cheng, A. (2008). Individualized engagement with genre in academic literacy tasks. English for Specific Purposes, 27, 387-
411. 15 Rothman, J. (2009). Pragmatic deficits with syntactic consequences? L2 pronominal subjects and the syntax-pragmatics
interface. Journal of Pragmatics, 41, 951-973. 16 Hu, G., & Cao, F. (2011). Hedging and boosting in abstracts of applied linguistics articles: A comparative study of English-
and Chinese- medium journal. Journal of Pragmatics, 43, 2795-2809.
17 Pulido, D. (2007). The effects of topic familiarity and passage sight vocabulary on L2 lexical inferencing and retention through reading. Applied Linguistics, 28(1), 66-86.
18 Larsen-Freeman, D. (2006). The emergence of complexity, fluency, and accuracy in the oral and written production of five Chineses learners of English. Applied Linguistics, 27, 590-619.
19 North, S. (2005). Disciplinary Variation in the Use of Theme in Undergraduate Essays. Applied Linguistics, 26(3), 431-452. 20 Yiakoumetti, A. (2006). A bidialectal programme for the learning of Standard Modern Greek in Cyprus. Applied Linguistics,
27, 295-317.
21 Mcdowell, H. & Lorch, M.P. (2008). Phonemic awareness in Chinese L1 readers of English: Not simply an effect of orthography. TESOL Quarterly, 42(3), 495-512.
22 Setter, J. (2006). “Speech rhythm in world Englishes. The case of Hong Kong”. TESOL Quarterly, 40, 763–782.
23 Li, Y. (2007). Apprentice Scholarly Writing in a Community of Practice: An Interview of an NNES Graduate student writing a research article. TESOL Quarterly, 41, 55-79.
24 Winke, P. (2011). Evaluating the validity of a high-stakes ESL test: Why teachers' perceptions matter. TESOL Quarterly, 45(4), 628-660.
25 Zareva, A. (2005). Models of lexical knowledge assessment of second language learners of English at higher levels of language proficiency. System, 33(4), 547-562.
26 Shen, Helen H. (2005). An investigation of Chinese-character learning strategies among non-native speakers of Chinese. System, 33, 49-68.
27 Diab, R. L. (2006).University students’ beliefs about learning English and French in Lebanon, System, 34, 80-96. 28 Sesek, U. (2007). English for teachers of EFL-Toward a holistic description. English for Specific Purposes, 26, 411-425. 29 McGrath, L., & Kuteeva, M. (2011). Stance and engagement in pure mathematics research articles: Linking discourse
features to disciplinary practices. English for Specific Purposes, xxx, 1-13.
30 Kaewpet, Ch. (2009). Communication needs of Thai civil engineering students, English for Specific Purposes, 28, 266-278. 31 Dafouz-Milne E. (2008): “The pragmatic role of textual and interpersonal metadiscourse markers in the construction and
attainment of persuasion: A cross-linguistic study of newspaper discourse”. Journal of Pragmatics, 40, 95-113.
32 Adel, A. (2011). Rapport building in student group work. Journal of Pragmatics, 43, 2932-2947.

ISSN 2039-9340 Mediterranean Journal of Social Sciences Vol. 3 (11) November 2012
415
Zimbabwean Science Students’ Perceptions of Their Classroom Learning
Environments and Attitude Towards Science
Mandina Shadreck
Department of Educational Foundations, Management and Curriculum Studies Midlands State University P Bag 9055 Gweru, Zimbabwe
Email: [email protected], [email protected], phone: 263 54 260464
Doi:10.5901/mjss.2012.v3n11p415 Abstract: The purpose of the present study was to examine Zimbabwean junior secondary school students’ perceptions of their classroom environment in science and to investigate relationships between these perceptions and students’ attitudes toward science. The study also aimed to investigate differences in students’ attitudes toward science by gender, school location. Data were collected from 1728 Zimbabwean junior secondary school science students in 10 Kwekwe district schools. Data were collected with an adapted and modified version of the “What is Happening in This Classroom” (WIHIC) instrument and the “Test of Science Related Attitudes” (TOSRA). The study confirmed that the Zimbabwean version of the modified WIHIC is a valid and reliable instrument for measuring the classroom learning environment in the Zimbabwean educational context. Significant differences between students’ perceptions of the actual and preferred learning environment were shown to exist with students tending to prefer a more favorable classroom learning environment than the one which they actually are experiencing. Female students generally hold more positive perceptions of the learning environments than their male counterparts. The findings also revealed that student’ perceptions of the classroom learning environment depending on the schools’ locality, with students in rural schools holding less favorable perceptions than students in urban schools for all seven WIHIC scales. Correlation and regression analyses revealed that students’ perceptions of their learning environment in science were significantly associated with their attitudes. Key words: Learning environment; Science classroom; Student perceptions; Attitude towards science 1. Introduction The classroom environment has a powerful influence on learning, and children's perceptions of that environment influence their behavior. The classroom environment is thus an important determinant of student learning in an educational system (Fraser, 1998a). Students learn better when they perceive the classroom environment more positively, thus the study of classroom environment has become a concern to educators, researchers, administrators of the school system and parents. Numerous researches on classroom environment or climates have been conducted years ago and have provided a lot of valuable information for educators and researchers on students’ perceptions of classroom environment ( Fraser, 1998a, 1998b; Dorman, 2003; den Brok et al., 2006; Wahyudi and Treagust, 2004; Rickards et al., 2003).
Research studies in maths, physics, chemistry, and biology education have shown that student perceptions of the classroom environment account for appreciable amounts of variance in learning outcomes, often beyond that attributable to background student characteristics. Moreover, students’ perceptions of their teachers’ behavior do act as one set of important mediators between the actual behaviors of teachers and the actual performance of learning activities by each student (Jennings and Greenberg, 2009; Den Brok, 2001; Shuell, 1996). That is, students will only react upon those teacher behaviors that they observe and will interpret (perceive) these behaviors each in their personal idiosyncratic ways (Shuell, 1996; Stahl, 1987). Thus, in order to stimulate and optimize student learning and the environment in which they learn, knowledge of students’ perceptions of this environment and the factors that influence these perceptions is crucial for both teachers and educational researchers.
Research studies on classroom learning environments have employed a number of salient and robust instruments that have been validated and cross-validated (Fraser, 1998a, 1998b). This educational area has attracted researchers from non-Western countries, such as Brunei (Khine and Fisher, 2003; Majeed et al., 2002 ), Korea (Kim, Fisher & Fraser, 2000;), Taiwan (Aldridge, Fraser & Huang, 1999), Nigeria (Idiris & Fraser, 1997), Papua New Guinea (Raj, 1998), Singapore (Wong & Fraser, 1996), India (Koul and Fisher, 2003), Indonesia (Wahyudi and Treagust, 2004) and Turkey

ISSN 2039-9340 Mediterranean Journal of Social Sciences Vol. 3 (11) November 2012
416
(Carkiroglu et al., 2007; Telli et al., 2009; den Brok et al., 2010). Thus, there has been an acceptance of the learning environment as a significant variable in predicting the success of educational practice. It seems that the evaluation of learning environment is as important as evaluating students’ other performances and outcomes. Fraser, Fisher, and McRobbie (1996) developed a learning environment instrument called the What Is Happening In This Class? (WIHIC) questionnaire. This questionnaire has been used by many researchers from different countries to collect data about the classroom environment. It has been validated in Australia (Rawnsley, and Fisher, 1998) and Taiwan (Aldridge, Fraser, & Huang, 1999), Singapore (Wong and Fraser, 1996), Korea (Kim, Fisher, and Fraser, 2000), Indonesia (Fraser, and Aldridge, 2002) and validated cross-nationally (Dorman, 2003). Because of its cross-cultural validity, the WIHIC was selected as one of the questionnaires for this study in Zimbabwe.
Research in this area in Western countries and in some developing countries has grown rapidly, but such research is scarce in Zimbabwe. Over the years, there have been no studies in Zimbabwe devoted to learning environment issues. A review of studies conducted by Irianto & Treagust, 2001; Margianti & Fraser, 2000; Margianti, Fraser & Aldridge, 2002; Soerjaningsih, Fraser & Aldridge, 2001) confirms that the classroom learning environment can be a determinant of school achievement and should be taken into account. Accordingly, this study was conducted to provide insights into the nature of science classroom learning environments in rural and urban lower secondary schools in the Zimbabwean educational context.
The domain of learning environments research is a new born research field in Zimbabwe. This study is the first in its kind to connect the WIHIC to student attitudes in Zimbabwe and thereby adds significantly to this field in the region. Moreover, the study adds to the existing knowledge base on WIHIC-related studies by investigating effects on student attitudes conjointly with other possible relevant background variables, something that has not been attempted before. The outcomes of this study might be a base for improvement and evaluation of teaching and science classrooms in Zimbabwe. This study also significantly adds to the cross-national validity of the learning environment instruments used, consequently revealing more insight in the cultural variation that may exist in learning environments across the world, an area of current and future interest to the learning environments domain. 2. Theoretical Framework The What Is Happening In this Class (WIHIC) Questionnaire Developed by Fraser, Fisher, and McRobbie (1996), the WIHIC measures high school students’ perceptions of their classroom environment. The WIHIC questionnaire brings parsimony to the field of learning environment by combining modified versions of the most salient scales from a wide range of existing questionnaires with additional scales that accommodate contemporary educational concerns (e.g., equity and cooperation, Fraser, (1998). Based on the previous studies, Fraser, Fisher and Mc Robbie (1996) developed this new learning environment instrument. The What is Happening In This Class? (WIHIC) consists of 7 scales and 56 items (Fraser, Fisher, & Mc Robbie, 1996) The seven scales are Student Cohesiveness, Teacher Support, Involvement, Investigation, Task Orientation, Cooperation and Equity. Table 1 shows the scales in the WIHIC, along with a brief description and a sample item from each scale in the questionnaire. Table 1:Scale Description for each Scale and Example of Items in the What Is Happening In This Class? (WIHIC) Questionnaire
Scale Description Item
Student Cohesiveness [SC]
Extent to which students know, help and are supportive of one another.
I make friendship among students in this class
Teacher Support [TS]
Extent to which teacher helps, befriends, trusts, and shows interest in students.
The teacher takes a personal interest in me.
Involvement [IV]
Extents to which students have attentive interest, participate in discussions, perform additional work and enjoy the class.
I discuss ideas in class.

ISSN 2039-9340 Mediterranean Journal of Social Sciences Vol. 3 (11) November 2012
417
Investigation [IN]
Extent to which there is emphasis on the skills and their use in problem solving investigation.
I am asked to think about the evidence for statements.
Task Orientation [TO]
Extent to which it is important to complete activities planned and to stay on the subject matter.
Getting a certain amount of work done is important.
Cooperation [CO]
Extent to which students cooperate rather than compete with one another on learning tasks.
I cooperate with other students when doing assignment work.
Equity [EQ]
Extent to which the teacher treats students equally. The teacher gives as much attention to my questions as to other students' questions.
The WIHIC questionnaire has been used to measure the psychosocial aspects of the classroom learning environment in various contexts since its development. In certain cases, the questionnaire has been adapted without any modifications, while as in other cases modifications were made to suit the specific context. Until now, the original questionnaire in English has been translated into Chinese for use in Taiwan (Aldridge & Fraser, 1997) and Singapore (Chionh & Fraser, 1998) and Korean for use in Korea (Kim, Fisher, & Fraser, 2000).
A study by Rawnsley and Fisher (1998) investigated associations between learning environments in mathematics classrooms and students’ attitudes towards that subject in Australia using the WIHIC questionnaire. It was found that students developed more positive attitudes towards their mathematics in classes where the teacher was perceived to be highly supportive, equitable, and in which the teacher involved them in investigations.
Chionh & Fraser, (1998) investigated associations between actual classroom environment and outcomes were using actual and preferred forms of the WIHIC. The associations between five different outcome measures, namely, examination results, self-esteem, and three attitude scales and the seven actual classroom environment scales were investigated in geography and mathematics classrooms in Singapore and Australia. The study revealed that better examination scores were found in geography and mathematics classrooms where students perceived the environment as more cohesive. It was also found that self-esteem and attitudes were more favorable in classrooms perceived as having more teacher support, task orientation, and equity.
Gender-related differences in students’ perceptions of their learning environment and teacher behavior were explored by Kim, Fisher, and Fraser (2000). The study involved 543 eighth-grade students in 12 different secondary schools in metropolitan and rural areas of Korea. Statistically significant di fferences were found between boys and girls on all seven scales. It was reported that boys perceived more Teacher Support, Involvement, Investigation, Task Orientation, and Equity than did girls.
A study by Wahyudi (2004) found association between students’ outcomes and the status of classroom learning environments. Both simple analysis and multiple regression analysis procedures showed that all scales of the Indonesian WIHIC were statistically significantly positively associated with two scales of the Indonesian adapted TOSRA and students’ cognitive scores. Hoffner-Moss and Fraser (2002) reported that attitudes are particularly favorable in investigative, task oriented and equitable classes in their study with 364 biology students in 18 classes. They also revealed that all students in the study perceived relatively high level of Task orientation.
Fraser and Aldridge (1999) used English and Chinese versions of WIHIC in Australia and Taiwan, respectively, to explore the potential of cross-cultural studies. Results of the study indicated that students in Australia consistently perceived their classroom environment more positively than students in Taiwan. Significant differences were detected on the WIHIC scales of Involvement, Investigation, Task Orientation, Cooperation and Equity. This indicated that students in Australia perceived they are given more opportunity to get involved in the experiments and investigate scientific phenomena. In this study, cultural differences were highlighted. Education in Taiwan is examination based and teaching styles are adopted to suit the particular situation. In Taiwan, having good content knowledge of the subject was the yardstick for being a good teacher, while as in Australia having good interpersonal relationships between students and teachers is considered the most important factor in education process. Taiwan classrooms are teacher centered giving very little opportunity to students to discuss issues.
Aldridge et al. (2004) compared students’ perceptions on the WIHIC between South Africa and Australia. Their study showed that students in South Africa perceived a greater degree of investigation opportunities in their science classrooms than Australian students, while students perceived less cooperation and equity in South Africa than students in Australia.
Rickards, den Brok, Bull, and Fisher (2003), validated the WIHIC in California classrooms. Their results showed correlations between the scales of the WIHIC in the range of 0.20 to 0.81 indicating that the scales measured distinct, yet

ISSN 2039-9340 Mediterranean Journal of Social Sciences Vol. 3 (11) November 2012
418
somewhat overlapping variables. Their results also proved the reliability of the WIHIC yielding alpha reliability coefficients between 0.78 and 0.96 at the class level. In discussing the results, Rickards et al.(2003) reported that male students have a more favorable perception of the science learning environment than female students. Ethnic make-up variables and class size also displayed positive effects. There was a positive association between the number of ethnic groups in the classroom and their perception of student cohesion. There also appeared to be a positive correlation between class size and investigation as measured by the WIHIC. The larger classes tended to score higher in the investigation dimension. This might be related to the idea that teachers have less time to spend with individual students in larger classes and thus students are left to discover things on their own. Cakiroglu et al. (2007), investigated grade eight students’ perceptions of their science learning environment (WIHIC), of teachers’ interpersonal behaviour (QTI) and their subject- related attitudes (TOSRA). The findings indicated a positive relationship between students’ perceptions of their science teachers’ interpersonal behaviours and perceptions of the learning environment and their affective outcomes. Some WIHIC scales correlated particularly strong with attitudinal outcomes: Teacher Support, Investigation, Equity, and Task orientation. It was also demonstrated that, in general, Turkish students perceive their classes as highly task oriented and cooperative, moderately cohesive, teacher supportive, and equitable. With respect to gender differences, all dimensions of the WIHIC attained statistical significance, that is, girls viewed their learning environment in a more positive way than did boys. The above studies support the validity and reliability of WIHIC in portraying the nature of science classroom environments. These studies also have consistently demonstrated that the WIHIC can be used to gather information from students for improving teaching and learning in different classroom contexts. Thus, with such a wide use and applicability of the WIHIC, its applicability was validated in Zimbabwe to get an insight into its use as well as insight into the Zimbabwean classroom learning environment. 3. Aim of the Study The aim of this study was to investigate the nature of science classroom learning environments in schools in Kwekwe District, Zimbabwe. The study was designed to answer the following research questions: 1. Can the What Is Happening in this Class (WIHIC) questionnaire be used in a valid and reliable manner with Form 2 science students in Kwekwe, Zimbabwe? 2. What are students’ perceptions of their science classroom learning environment? 3. Are there differences between male and female students’ perceptions of their science classroom learning environment? 4. Are there differences between rural and urban students’ perceptions of their science classroom learning environment? 5. Are there differences between teachers’ and students’ perceptions of their science classroom learning environment? 6. What is the association between students’ perception of their learning environment and their attitude towards science 4. Methodology 4.1 Research Design The study employed the descriptive survey method. This method focused on systematic description or exposure of the salient aspects of a situation with a focus on the patterns that emerge. The study was analytic (qualitative) in that the researchers focused on the relationships between variables and further interpreted the relationships. The survey design was preferred because it is the most appropriate design where self-reported beliefs and opinions of participants are sought (David and Sutton 2004). 4.2 The sample A multistage sampling or cluster sampling method (Haber, 1994) was employed that initially categorized schools in the district into rural and urban. Five urban and five rural schools were then randomly selected and learners in Form 2 (Zimbabwe Junior Certificate,(ZJC) classes at each school automatically became participants in the study. Thus the sample consisted of 1728 learners (880 boys and 848 girls) in 42 classes and their science teachers (40) in 10 junior secondary schools in urban, and rural areas of Kwekwe district, Zimbabwe.

ISSN 2039-9340 Mediterranean Journal of Social Sciences Vol. 3 (11) November 2012
419
4.3 Research Instrumentation and validation To assess students’ perceptions of their learning environment, the WIHIC was administered to all students of participating classes and schools. The WIHIC contains 56 items that are answered on a 5-point Likert-type scale. The items refer to seven scales. For each scale, Table 2 presents a typical item. Prior to the main data collection, a pilot study that involved 245 Form 1 students and their teachers was conducted to ensure suitability and readability of the questionnaire. Based on the pilot study results, modifications were made. After this, the instrument was distributed among the classes and students involved in the present study. The final modified form of instrument was constructed with a five-point Likert-type response scale with the following alternatives: (1)Almost Never, (2) Seldom, (3) Often, (4) Usually, (5) Almost Always. To ensure that scales had been measured reliably, a Cronbach’s alpha reliability coefficient at the student and class (aggregated) levels was computed (see Table 3). An intra class coefficient was also computed to see the degree to which the scales managed to differentiate between classes (den Brok et al., 2006). The consistency of each of the WIHIC scales was determined by computing Multi level lambda based on both the reliability and intra-class correlation coefficients and represents the degree to which the instrument is capable of measuring consistently across classes (Snijders and Bosker,1999). Table 2. Typical items for the WIHIC scales
Scale Typical item
Student Cohesiveness I work well with other class members. Teacher Support. The teacher helps me when I have trouble with the work Involvement I give my opinion during class discussions Investigation. I find out answers to questions by doing investigations Task Orientation I know how much work I have to do. Cooperation When I work in groups in this class, there is teamwork. Equity I am treated the same as other students in this class.
4.4 Data Collection The data about the classroom learning environment in this study was collected mainly through the administration of the WIHIC questionnaire . In addition, observations of some classrooms and interviews with both teachers and students were conducted as a way of triangulating the data in order to portray a more accurate picture of the learning environment. The classroom observations mainly focused on the aspects that corresponded to items of the scales in the instruments, while the semi-structured interviews aimed to scrutinize those related aspects. All students responded to the Test of Science Related Attitudes (TOSRA) questionnaire an already existing attitude scale measuring students’ attitudes towards their science classrooms. The scale comprises eight items measuring the extent to which students enjoy, are interested in and look forward to science lessons. The attitude scale is based on the Test of Science Related Attitudes (TOSRA), developed by Fraser earlier. 5. Results and Discussion 5.1 Reliability and Validity of the WIHIC Since this study was the first to use the WIHIC on a Zimbabwean secondary school sample, several analyses were done to investigate the quality of the outcomes. First, an examination of whether scales had been measured reliably was conducted by computing a Cronbach’s alpha reliability coefficient at the student and class (aggregated) levels. The findings of these analyses are given in Table 3.

ISSN 2039-9340 Mediterranean Journal of Social Sciences Vol. 3 (11) November 2012
420
Table 3. WIHIC scales, sample item, reliability (Cronbach’s Alpha), Ability to differentiate between classes (ANOVA results). And consistency (Lambda).
Scale Alpha(student) Alpha(class) Anova Eta2 Lambda
Student Cohesiveness 0.80 0.83 0.12 0.36
Teacher Support 0.88 0.91 0.14 0.82
Involvement 0.89 0.93 0.11 0.55
Investigation 0.87 0.89 0.12 0.54
Task Orientation 0.85 0.92 0.10 0.35
Cooperation 0.89 0.89 0.09 0.65
Equity 0.87 0.93 0.14 0.79
As can be seen in table 3, the pilot study generally revealed that the questionnaire has good reliability and discrimant validity. The scale reliability (Cronbach’s alpha) for different WIHIC scales ranged from 0.80 to 0.89 in this Zimbabwean sample. The highest alpha reliability (0.89) was obtained for the involvement and cooperation scales and the lowest (0.80) for the scale Student Cohesiveness. The results being consistently above 0.50 suggests that the WIHIC can be considered to be a reliable tool (de Vellis,1991) for use with Zimbabwean students. The values were even higher for the preferred form suggesting the trustworthiness of the Zimbabwean version of modified WIHIC questionnaire in measuring this group of students’ perceptions of their science classroom learning environment. The values of the Eta2 statistic ranged from 0.09 to 0.16 and was statistically significant for each scale. This indicates that each scale of the WIHIC is capable of differentiating significantly between classes (p = 0.01). Overall the reliability, discriminant validity and ANOVA results confirmed that the WIHIC could be used with confidence for further research. The WIHIC scale intercorrelations : the mean correlation of a scale with the other scales, which measures each scale’s discriminant validity, are displayed in table 4. As can be seen, all scales are positively related, meaning that if students have higher perceptions of one element of their learning environment, they also tend to see more of the other elements of the learning environment. This indicates that each scale measures a reasonably distinct aspect of the classroom learning environment, although with a degree of overlap with other scales. Nevertheless, correlations rarely exceed 0.50, and the average scale correlation between one WIHIC scale and the other scales ranges between 0.39 (Student Cohesiveness) and 0.44 (Involvement). Table 4: WIHIC scales correlations and average correlation.
Cohes Support Involvm Investig Task ori Cooper Average Corrrelation Cohes 0.39 Suppo 0.41 0.41 Involvm 0.44 0.44 0.44 Investig 0.33 0.40 0.49 0.41 Task ori 0.32 0.37 0.39 0.52 0.40 Cooper 0.52 0.35 0.47 0.41 0.39 0.43 Equity 0.30 0.46 0.45 0.39 0.49 0.42 0.43
Note: all correlations were significant at p=0.01 ; N= 1728 in 42 classes. Cohes=Student Cohesiveness; suppo=Teacher Support, involvm=Involvement; investig=Investigation; task ori=Task Orientation; cooper =Cooperation; equity =Equity. 5.2 Student perceptions of their learning environment To investigate the nature of student perceptions of the science classroom learning environment, the average item mean (the scale mean divided by the number of items in that scale) and average item standard deviation of each scale for both actual and preferred forms of each WIHIC scale were calculated. A t-test for paired samples was performed for each scale to check the statistical significance of differences between students’ actual and preferred perceptions of their learning environment. The results are shown in table 5.

ISSN 2039-9340 Mediterranean Journal of Social Sciences Vol. 3 (11) November 2012
421
Table 5: Average Item Mean, Standard Deviation and t-Test for Paired Samples
Scale Average Item mean Actual Prefered
Average item Standard deviation Actual Prefered
t
Student Cohesiveness 3.80 4.62 0.48 0.42 58.12 Teacher support 2.86 4.18 0.65 0.61 67.77 Involvement 2.65 2.65 0.62 0.62 0.00 Investigation 2.54 3.48 0.71 0.75 63.10 Task Orientation 3.79 4.60 0.52 0.48 59.50 Cooperation 3.30 4.05 0.62 0.64 44.05 Equity 3.65 4.50 0.75 0.59 44.28
The results from t-tests for paired samples show that there are significant differences (p < 0.01) between students’ perceptions of their actual and preferred learning environment on all scales except Involvement. The results, are consistent with previous studies (Fisher & Fraser, 1983; Wahyudi and Treagust, 2004), and suggest that most students would prefer a learning environment which is characterized by more Student Cohesiveness, Teacher Support, Task Orientation, Investigation, Cooperation and Equity. The same perception by the students on the involvement scale does indicate that students have classrooms in which they experience activities associated with involvement with a frequency between ‘seldom’ and ‘usually’. The students are thus happy within the classroom atmosphere that allows them to be passive. This finding is consistent with Wahyudi and Treagust, (2004) Thair and Treagust (1997), who found out that the teacher in the Indonesian classroom has absolute authority and gives students little chance to participate. 5.3 Student perceptions of their learning environment based on gender This study also explored the differences in perceptions of male and female students on the science classroom learning environment. A paired sample t-test was conducted for each scale using the within-class gender mean as the unit of analysis. Since the number of male and female students was not equal, the data were organized into 84 within-class means (42 male means and 42 female means). These pairs of data then were matched for analysis. The results are shown in Table 6. Table 6: Female and male Students’ perceptions of Classroom Learning Environment using WIHIC and Within –Class Gender Subgroup Mean as unit of Analysis
Scale Average Item mean Male Female
Average item Standard deviation Male Female
t-value
Student Cohesiveness 4.15 4.25 0.49 0.46 2.4 Teacher support 3.54 3.50 0.75 0.79 - 0.85 Involvement 3.45 3.40 0.72 0.74 - 1.9 Investigation 3.49 3.43 0.65 0.72 - 2.01 Task Orientation 4.15 4.35 0.48 0.60 5.15 Cooperation 3.79 4.12 0.69 0.64 4.15 Equity 3.85 4.20 0.65 0.69 5.28
Female n = 848 ; Male n = 880 ; p<0.01 The results of this study are consistent with those from previous research (Goh & Fraser, 1995; Riah, 1998; Wahyudi and Treagust, 2004; Koul and Fisher, 2006) in which females hold more positive perceptions of the classroom learning environment than do males as indicated by significant statistical differences in the scales for Cohesiveness, Task Orientation, Cooperation and Equity whose magnitude are relatively large in favor of female students. Furthermore, gender has been found to be a significant factor that differentiates students’ perceptions of learning environments. For example, according to Mok (2002), female students had both higher developmental expectations of their schools and more positive perceptions of the classroom atmosphere. Thus it can be inferred that girls on the whole have more positive perceptions of their science classes than did boys. Girls seem to perceive their science teacher as more cohesive, task oriented, cooperative and giving them equal opportunity in the class while the boys perceived for more of teacher support, involvement and investigation activities in the science classroom.

ISSN 2039-9340 Mediterranean Journal of Social Sciences Vol. 3 (11) November 2012
422
5.4 Student perceptions of their learning environment based on school location In order to explore differences between students’ perceptions of actual learning environment based on school location (urban, rural), a one-way between-groups ANOVA with post-hoc comparisons was carried out for each WIHIC scale. Table 7 shows the scale means and F value for the scales of the WIHIC with the perceptions of the students from the two main localities( rural and urban). The purpose of this analysis was to establish whether there are significant differences in the perceptions of students about their classroom-learning environment according to their school localities. Table 7 : Item Mean for School locality Differences in Students Perceptions of Classroom Learning Environment as Measured by the WIHIC Scales
Scale Average Item mean Rural Urban
F-value
Student Cohesiveness 3.65 3.88 7.84 Teacher support 2.59 2.90 3.92 Involvement 2.50 2.56 2.89 Investigation 2.42 2.54 2.97 Task Orientation 3.60 3.85 5.75 Cooperation 3.0 3.48 3.98 Equity 3.47 3.55 3.05
Statistical analysis indicated that student perceptions on all the seven scales of the WIHIC had statistically significant differences according to the location of the schools students belonged to. The Tukey’s post hoc test (p<0.05) revealed that, the students coming from the urban schools had significantly higher means in all the seven scales. Students in rural schools held less favorable perceptions than did students in urban schools for all seven scales. The findings are consistent with findings from classroom observations. In most cases, classroom transactions in rural schools were more dominated by teacher-centered methods and had less investigation or laboratory activities. Most of the time, in rural schools students copied notes from the blackboard before the teacher explained them. Consequently, students in rural schools did not have a chance to develop a better learning environment. Interviews conducted with science teachers also confirmed this assertion. The teachers noted that most rural schools are deprived and lack resources, facilities and teachers. It was also observed that the majority of these rural schools do not have financial resources to purchase chemicals and consumables to conduct practical investigations moreover the laboratories in most rural schools are not adequately equipped. This, thus results in a relatively poor teaching performance in science. Milkie and Warner (2011) have also noted that students in a negative learning environment such as classrooms with fewer material resources have more learning, externalizing, interpersonal, and internalizing problems. 5.5 Differences Between Students’and Teachers’ in Their Perceptions of Classroom Environment To explore the differences between students and teachers’ perceptions of science classroom learning environment, class means of students’ scores and the individual scores of teachers were calculated as the units of analysis. The average item means and average standard deviations of each scale for the actual forms of the WIHIC are reported in table 8. The differences between students’ and teachers’ perceptions were investigated using t-tests for paired samples. Table 8: Average Item Mean, Average Item Standard Deviation and Difference Between Students’ and Teachers’ Perceptions (Effect Size and t-Test for Independent Samples) on WIHIC Scales
Scale Average Item mean Student Teacher
Average item Standard deviation Student Teacher
t-value
Student Cohesiveness 4.60 4.72 0.19 0.28 -2.84 Teacher support 4.20 4.56 0.16 0.32 - 5.65 Involvement 2.70 3.58 0.24 0.48 - 4.88 Investigation 3.82 4.35 0.28 0.40 - 2.38

ISSN 2039-9340 Mediterranean Journal of Social Sciences Vol. 3 (11) November 2012
423
Task Orientation 4.60 4.81 0.20 0.31 0.08 Cooperation 4.05 4.62 0.39 0.20 -2.59 Equity 4.50 4.78 0.21 0.35 -3.48
Sample size 40 teachers and 72 student means ; p<0.01 The results do indicate that teachers hold more favorable views of the actual classroom learning environments than do their students, with the exceptions of Task Orientation for which students’ and teachers’ views are in agreement. The findings are consistent previous research (Fisher & Fraser, 1983; Wahyudi and Treagust, 2004) in that teachers’ views of science classroom learning environments are more positive than those of their students. 5.6 Associations between learning environment and attitude towards science To investigate the associations between science classroom environments and individual students’ attitudes towards science, simple and multiple correlation analyses were computed between the TOSRA scales and the WIHIC scales. The results are shown in table 9. Table 9: Associations between WIHIC Scales and Attitudes Towards Science Lessons in Terms of Simple Correlations (r), Multiple Correlation (R) and Standardized Regression Coefficient (b)
Scale Attitude towards Science r β
Student Cohesiveness 0.19 -0.05 Teacher support 0.25 0.06 Involvement 0.27 0.02 Investigation 0.29 0.18 Task Orientation 0.40 0.30 Cooperation 0.25 0.00 Equity R – 0.47 R2 – 23%
0.35 0.20
The results of the simple correlation analysis indicate that all the seven scales were significantly correlated with attitude to science classroom environment (p<0.01). It was found that these associations were positively correlated ranging from 0.19 to 0.40 suggesting a positive effect of perceptions of the learning environment on attitudes towards the subject. The multiple correlation, R, computed was 0.47 and is statistically significant (p<0.01) an indication that strongly supports the conclusion that the nature of the classroom environment is strongly influencing students’ attitudes towards science lessons. To further confirm this relationship, the standardized regression coefficient (β) was computed and examined. Only three scales (Investigation, Task Orientation and Equity) out of the seven retained their significance (p<0.01) an indication that these scales are independent predictors of individual students’ attitude towards science lessons. The R2 value, which indicates the proportion of variance in attitude towards science lessons that can be attributed to students’ perception of classroom environments was 23%. The results are consistent with previous findings (Koul and Fisher, 2003; Telli et al., 2006) in that there is a strong link between student attitudes and their perceptions of the learning environment. 6. Conclusion This study provided insights into the science classroom environment in junior secondary school classes in Kwekwe district of Zimbabwe. This study is a pioneering study for Zimbabwe in the domain of learning environments research in some respect. Based on the findings, the Zimbabwean version of the modified WIHIC was reliable and valid for measuring the classroom learning environment junior secondary science classrooms in Zimbabwe. It has shown that the WIHIC is a valid a reliable instrument for use in the Zimbabwean secondary education context and is also capable of differentiating between the perceptions of students in different classes, groups and locations. The study also revealed that students were dissatisfied with the actual learning environment as indicated in their preferred perceptions of what kind of learning environment should be created by the teacher. The Students would prefer

ISSN 2039-9340 Mediterranean Journal of Social Sciences Vol. 3 (11) November 2012
424
a learning environment which is characterized by more Student Cohesiveness, Teacher Support, Task Orientation, Investigation, Cooperation and Equity. Consequently science educationists, teachers and policy makers need to take note of this information and then use it to enhance, improve and foster their service to students.
Furthermore the study has also shown that females hold more positive perceptions of the classroom learning environment than do males as indicated by significant statistical differences in the scales for Cohesiveness, Task Orientation, Cooperation and Equity whose magnitude are relatively large in favor of female students. in urban and suburban schools. Students in rural schools have been found to experience a less positive learning environment than did their counterparts in urban areas due to inadequate resource materials and facilities and shortage of qualified teachers. Therefore the Ministry of Education should consider what can be done to provide a better education, especially with respect to the classroom learning environment, in those schools.
Finally, teachers were found to hold more favorable views of the actual classroom learning environment than do their students, with the exceptions of Task Orientation for which students’ and teachers’ views are in agreement. The results of the simple correlation analysis indicate that all the seven scales were significantly correlated with attitude to science classroom environment. It was found that these associations were positively correlated suggesting a positive effect of perceptions of the learning environment on attitudes towards the subject supporting the notion that the nature of the classroom environment strongly influences students’ attitudes towards science lessons.
References Aldridge, J.M., & Fraser, B.J. (2000). A cross-national study of classroom environments in Taiwan and Australia. Learning Environments
Research: An International Journal, 3, 101-134. Aldridge, J. M., & Fraser, B. J. (1997, August). Examining science classroom environments in a cross-national study. Paper presented at
12th WAIER Research Forum for the Weatern Australian Institute for Educational Research, Perth, Australia. Aldridge, J. M., Fraser, B. J. & Huang, T. (1999). Investigating classroom environments in Taiwan and Australia with multiple research
methods. Journal of Educational Research, 93, 48-57. Aldridge, J., Laugksch, R. C., & Fraser, B. J.(2004, April). A cross-national study of the learning environments of Science classrooms in
South Africa and Australia. Paper presented at the annual meeting of the American Educational Research Association, San Diego.
Cakiroglu, J., Tekkaya, C., & Rakici, N. (2007). Learning environments, teacher interpersonal behavior, and students’ attitudinal outcomes in science classrooms: A Turkish context. In Mutua, K. & Sunal, C. S. (Eds.), The enterprise of education research on education in Africa, the Caribbean and the Middle East (pp. 291-311). Charlotte, NC: Information Age Press..
Chionh, Y. H. & Fraser, B. J. (1998). Validation and use of the “What is Happening In This Class” Questionnaire in Singapore. Paper presented at Annual Meeting of the American Educational Research Association, San Diego.
David, M., and Sutton, C. D. (2004) "Social Research: The Basics" London: Sage de Vellis, R. F. (1991). Scale development: Theory and application. Newbury park: Sage Publications. den Brok, P., Telli, S., Cakiroglu, J., Taconis, R., and Tekkaya, C.(2010). Learning environment profiles of Turkish secondary biology
classrooms. Learning Environvionment Research 13:187–204. DOI 10.1007/s10984-010-9076-5 den Brok, P., Fisher, D. L., Rickards, T., & Bull, E (2006). Californian science students’ perceptions of their classroom learning
environments. Educational Research and Evaluation, 12 (1), 3-25 Den Brok, P. (2001). Teaching and student outcomes. Utrecht, The Netherlands: W.C.C. Dorman, J. P. (2003). Cross-national validation of the What is Happening in This Class? Questionnaire using confirmatory factor
analysis. Learning Environments Research, 6, 231–245. Fisher, D.L. & Fraser, B.J. (1983). A comparison of actual and preferred classroom environment as perceived by science teachers and
students. Journal of Research in Science Teaching, 20, 55–61. Fraser, B. J. (1998a). Classroom environment instruments; development, validity and applications. Learning Environment Research, 1,
7-33. Fraser, B. J. (1998b). Science learning environments: Assessments effects and determinants. In B. J.Fraser & K. Tobin (Eds.),
International handbook of science education (pp. 527–564). Dordrecht, The Netherlands: Kluwer Academic Publishers. Fraser, B. J., & Aldridge, J. M. (1998). The potential of cross-national studies of science classrooms; An example involving Australia and
Taiwan. In L. Y. Pak., L. Ferrer., & M. Quigley. (Eds.) Science, Mathematics and Technical Education for National Development (pp. 76-83). Brunei: Universiti Brunei Darussalam.
Fraser, B. J., Fisher, D. L., & McRobbie, C. J. (1996, April). Development, validation and use of personal and class forms of a new classroom environment instrument. Paper presented at the annual meeting of the American Educational Research association, New York, USA.
Goh, S.C. & Fraser, B.J. (1996). Validation of an elementary school version of the Questionnaire on Teacher Interaction. Psychological Reports, 79, 512–522.
Haber, J. (1994). Sampling. In G. LoBiondo-Wood & J. Haber (Eds.), Nursing research: Methods, critical appraisal, and utilization (3rd ed., pp. 286–312). St Louis, MO: Mosby-Year Book.
ISSN 2039-9340 Mediterranean Journal of Social Sciences Vol. 3 (11) November 2012
425
Hoffner Moss, C., & Fraser, B. J. (2002, April). Using environment assessments in improving teaching and learning in high school biology classrooms. Paper presented at the Annual Meeting of the National Association for Research in Science Teaching, New Orleans, LA.
Idiris, S. A., & Fraser, B. J. (1997). Psychosocial environment of agricultural science classroom in Nigeria. International Journal of Science Education, 19, 79–91.
Irianto, B., & Treagust, D. F. (2001, March). Teachers’ perceptions of the role of the laboratory in a national professional development centre. Paper presented at the annual meeting of the National Association for Research in Science Teaching, St Louis, MO.
Jennings, P.A. & Greenberg, M.T. (2009). The prosocial classroom: Teacher social and emotional competence in relation to student and classroom outcomes. Review of Educational Research, 79, 491-525 Koul, R.B., and Fisher, D.(2003). Students’ perception of science classroom Learning environment in Jammu, India: Attitudes and
gender differences, Journal Of Science And Mathematics Education In South East. Asia Vol. 26, No. 2 107 - 130 Khine, M. S. and Fisher, D. L. (eds) (2003) Technology-Rich Learning Environments: A Future Perspective. Singapore: World Scientific. Kim, H., Fisher, D., & Fraser, B. (2000). Classroom environment and teacher interpersonal behavior in secondary science classes in
Korea. Evaluation and Research in Education, 14, 3-22. Majeed A., Fraser B.J., Aldridge J.M.(2002) Learning Environment And Its Association With Student Satisfaction Among Mathematics
Students In Brunei Darussalam , Learning Environments Research 5(2) 203 - 226 Margianti, E.S., Aldridge, J.M. and Fraser, B.J. (2004). Learning environment perceptions, attitudes and achievement among private
Indonesian university students. International Journal of Private Higher Education. Available at: www.xaiu.com/xaiujournal. Milkie, M.A., and Warner,C.H.(2011). Classroom Learning Environments and the Mental Health of First Grade Children, Journal of
Health and Social Behavior vol. 52 no. 1 4-22. doi: 10.1177/0022146510394952 Mok, M. C. (2002). Determinants of students’ quality of school life: a path model. Learning Environments Research, 5, 275-300. Rawnsley, D., & Fisher, D. L. (1998, December). Learning environments in mathematics classrooms and their associations with
students’ attitudes and learning. Paper presented at the Australian Association for Research in Education Conference, Adelaide, Australia. Retrieved 8 July from: http://www.aare.edu.au/98pap/fis98269.htm
Riah, H., & Fraser, B. J. (1998, April). The learning environment of high school chemistry classes. Paper presented at the annual meeting of the American Educational Research Association, San Diego, CA.
Rickards, T., den Brok, P., Bull, E. & Fisher, D. (2003). Predicting student views of the classroom: A Californian perspective. Proceedings Western Australian Institute for Educational Research Forum 2003. Retrieved July8, 2012 from: http://education.curtin.edu.au/waier/forums/2003/rickards-1.html
Shuell,T.J.(1996).Teaching and learning in a classroom context.In D.C.Berliner&R.C.Calfee (Eds.), Handbook of educational psychology (pp. 726–764). New York: Macmillan.
Snijders, T. A. B., & Bosker, R. J. (1999). Multilevel analysis: An introduction to basic and advanced multilevel modeling. London: Sage. Soerhaningsih, W., Fraser, B. J., & Aldridge, J. M. (2001, April). Achievement, satisfaction and learning environment among Indonesian
computing students at the university level. Paper presented at the Annual meeting of the Americal Education Research Association (AERA), Seattle, USA.
Stahl, R. J. (1987, July). A way of thinking about how humans think and learn: An information constructivist perspective with implications for curriculum and instruction. Session presented at the biennial meeting of the Australian Association for Curriculum Studies, Macquarie University, North Ryde, NSW, Australia.
Telli, S., Cakiroglu, J., & Brok, P. den (2006).Turkish secondary education students’ perceptions of the i r c lassroom learn ing env i ronment and the i r a t t i tude towards Bio logy. In D. L . F isher & M. S.Khine (Eds.), Contemporary approaches to research on learning environments: world views (pp.517-542). Singapore: World Scientific
Thair, M., & Treagust, D. F. (1997). A review of teacher development reforms in Indonesian secondary science: The effectiveness of practical work in biology. Research in Science Education, 27, 581–597. Wahyudi, D. and Treagust, D.F.(2004). The status of science classroom learning Environments in Indonesian lower secondary Schools,
Learning Environments Research 7: 43–63, Wong, A.F.l., & Fraser, B. J. (1996). Environment-attitude associations in the chemistry laboratory classroom. Research in Science and
Technological Education, 64, 29-40.


ISSN 2039-9340 Mediterranean Journal of Social Sciences Vol. 3 (11) November 2012
427
Model of Environmental Education and Psychological Factors
Influencing to Global Warming Alleviation
Dr. Nongnapas Thiengkamol
Department of Environmental Education Faculty of Environment and Resource Studies
Mahasarakham University, Mahasarakham 44150, Thailand Email: [email protected]
Doi:10.5901/mjss.2012.v3n11p427
Abstract: Environmental education has been accepted and applied for encouraging the global citizens to take a responsible practice through their behavior changing in daily life activity. This might be an effective and rapid change to decrease the greenhouse gases via the awareness raising, attitude and belief adjusting, skill and participation increasing including real practice in daily living.The populations were 35,010 undergraduate students of the first semester of academic year 2011 of Mahasarakham University. The simple random sampling was used to collect the sample for 450 undergraduate students with proportion according to fields of study. The questionnaire was employed as instrument for data collecting. LISREL was used for model verification. Results illustrated as Equation 1and 2 as followings. Considering on structural model confirmatory factors was able to explain the variation of endogenous factors of Environmental Education (EE) to caused Environmental Behaviors for Global Warming Alleviation (BEH) with 97.5 percents and the variation of endogenous factor of Environmental Education (EE) with 90.5 percents. Therefore, the equation 1 and 2 can be written as followings. BEH = 0.56 *PsT + 0.38*PsS + 0.52* EE …………..…………..(1) (R2 = 0.975) EE = 0.45*PsT + 0.47*PsS …………………..…………..………..(2) ( R2 = 0.905) Key Words: Model / Environmental Education / Psychological Factors / Global Warming Alleviation.
1. Introduction Global warming is continuous rising in the average temperature of Earth’s atmosphere and oceans. This finding is recognized by the national science academies of all the major industrialized countries and is not disputed by any scientific body of national or international standing. In particular, most scientists indicate that the warming in recent decades has been caused primarily by human activities that have increased the amount of greenhouse gases in the atmosphere such as deforestation and fossil fuel combustion (United States National Academy of Sciences., 2008, National Research Council of USA., 2010, & Thiengkamol, 2011e).
The main international mitigation effort is the Kyoto Protocol, which seeks to stabilize greenhouse gas concentration to prevent a “dangerous anthropogenic interference” (UNFCCC, 2005). At international level as of May 2010, 192 states members of the UNFCCC had ratified the protocol. The only members of the UNFCCC that were asked to sign the treaty but have not yet ratified it are the USA and Afghanistan (UNFCCC, 2011).
Presently, environmental information on climate change with global warming has become hot issue for general people who are directly impacted by the earth quake, flood, and drought, furthermore it also affected to natural system, ecological system, loss biodiversity, new vector of disease born, species migration, and so on. However, the environmental problem can’t absolutely separate from individual level. The main of cause is revealed that the people have not enough knowledge and understanding, and lack of consciousness, awareness, and attitude to practice proper behavior including realizing that they take very important parts to take responsibility for conservation of natural resources and environment (Thiengkamol, 2011e, & Thiengkamol, 2011f ).
The Tenth National Economic and Social Development Plan of Thailand (B.E. 2550-2554), it included the principle of participation of every sectors in Thai society and aimed to set Thai citizen as center of development in order to accomplish a sustainable economic and society based on the moral and ethics for living and conservation of natural resources and environment in order to develop the quality of life of Thai people in numerous aspects that was consistent

ISSN 2039-9340 Mediterranean Journal of Social Sciences Vol. 3 (11) November 2012
428
to principle of sustainable development in accordance to concept of conference of environment and development of United Nation since 1992. In Agenda 21 of global action plan mentioned that “Sustainable development is development which meets the needs of the presented without compromising the ability of future generations to meet their own needs.” (Office of National Economic and Social Development Plan, 2010, WCED, 1987, Volker, 2007, Watkinson, 2009, Thiengkamol, 2011e, & Thiengkamol, 2011f). In order to meet sustainable development, it can be done through the environmental education process by via all channels whether informal, formal, non-formal, lifelong education systems, moreover the mass media and internet are included but it needs to stress in the way of attitude changing and continuous implementation to develop permanently environmental behavior of natural resources and environmental conservation (Thiengkamol, 2011e).
The intention of psychologists tried to understand on human behavior, and then they had developed a large number of theories and models but they had the main focus on explanation how individual perceived and evaluated the stimulant before making decision to express his behavior. Nevertheless, study on human behavior, it can’t be neglected the psychological trait. Trait theorists are primarily interested in the measurement of traits, which can be defined as habitual patterns of behavior, thought, and emotion including psychological health and physical health which are inherited trait from parents. There is much debate over how much of who we are is by nature (genetic) or nurture (environment), and both contribute significantly to our complete expression (Kassin, 2003, & Pearson, 2006). However, Interactionist theory has grown in the latter half of the twentieth century and has become one of the principal sociological perspectives in the world today. Interationism is most popular at present in Thailand for psychological study, especially, psychological trait and psychological state are play essential roles to spire for public consciousness for environmental conservation. Generally, environmental issues were ignorant as non-important issue for people until the beginning of this year 2011, Thai peoples have faced with strange of weather in summer, they faced with cold weather. This stimulated their attention s for turning their awareness to global warming seriously (Punthumnavin, 2008, Thiengkamol, 2009b, Thiengkamol, 2009c, 2011e, Thiengkamol, 2011f, and Jumrearnsan, & Thiengkamol, 2012).
Therefore, this research was designed to study by covering all factors relating as mentioned above, it would be able to develop a model of environmental behaviors that are affected by environmental education and psychological traits. 2. Objective The objective was to propose the structural model of environmental education and psychological factors affecting to environmental behavior for global warming alleviation. 3. Methodology The research design was implemented in steps by step as follows: The populations were 35,010 undergraduate students of the first semester in academic year 2011 of Mahasarakham University. The 450 simple random sampling was employed to collect data from different faculties of Mahasarakham University with the equal proportion. The research instrument was the questionnaire and it was used for data collecting. The content and structural validity were determined by Item Objective Congruent (IOC) with 5 experts in the aspects of environmental education, psychology, social science and social research methodology. The reliability was done by collecting the sample group from 50 undergraduate students of Rajabhat Mahasarakham University which is nearby Mahasarakham University. The reliability was determined by Cronbach's Alpha. The reliability of environmental education, psychological trait, psychological state, and inspiration of public consciousness, environmental behaviors, and the whole questionnaire were .937, .838, .897, .805, 929 and 978 respectively.
The descriptive statistics used were frequency, percentage, mean and standard deviation. The inferential statistics used was LISREL by considering on Chi-Square value differs from zero with no statistical significant at .05 level or Chi-Square/df value with lesser or equal to 5, P-value with no statistical significant at .05 level and RMSEA (Root Mean Square Error Approximation) value with lesser than 0.05 including index level of model congruent value, GFI (Goodness of Fit Index) and index level of model congruent value, AGFI (Adjust Goodness of Fit Index) between 0.90-1.00.

ISSN 2039-9340 Mediterranean Journal of Social Sciences Vol. 3 (11) November 2012
429
4. Results 4.1 Confirmatory factors of Exogenous Variables Results of Confirmatory Factor Analysis of Exogenous Variables of Psychological Trait, and Psychological State affecting to environmental behaviors for global warming alleviation, were revealed as followings. 4.1.2 Confirmatory Factor Analysis of Psychological Trait (PsT) Confirmatory factors of PsT had Bartlett’s test of Sphericity of 591.807 statistically significant level (p< .01) and Kaiser–Mayer–Olkin Measure of Sampling Adequacy/MSA) of 0.782. This indicated that components of PsT aspect had proper relationship at good level and it can be used for analysis of confirmatory factors as shown in picture 1 and table 1. Picture 1: Model of Confirmatory factors of Psychological Trait (PsT)
Table 1 Results of Analysis of Confirmatory factors of Psychological Trait (PsT)
Confirmatory factors of Psychological Trait Weight SE t 2R X1 Physical Health 0.24 0.035 6.94** 0.16 X2 Psychological Health 0.43 0.028 15.14** 0.57 X3 Self-Confidence 0.39 0.029 13.71** 0.46 X4 Mercy and Kindness 0.36 0.037 9.71** 0.25 X5 Achievement Motivation 0.25 0.031 8.02** 0.17 X6 Goal of Life 0.46 0.040 11.45** 0.34 Chi-square = 10.20 df = 7 P = .17745 GFI = 0.99 AGFI = 0.98 RMSEA = 0.032 RMR = .0093
** Statistically significant level of .01 From picture 1 and table 1, results of analysis of confirmatory factors of PsT from 6 observe variables were revealed that the model was congruent to empirical data by considering from 1) Goodness of Fit Index (GFI) equaled to 0.99 and Adjust Goodness of Fit Index (AGFI) equaled to 0.98 2) Root Mean Square Error of Approximation (RMSEA) equaled to 0.015 (RMSEA < 0.05) and 3) Chi- Square value had no statistically significant at level of .01 and degree of freedom was lesser than or equaled to .05 ( 00.5/2 ≤dfχ ). Considering on loading weight of observe variables in model, it was revealed that observe variables had loading weight with 0.24 to 0.46 and had covariate to model of Psychological Trait with 16.0 to 57.0 percents.
X1 0.31
X2 0.14
X3 0.18
X4 0.37
X5 0.29
X6 0.43
1.00
Chi-Square=10.20, df=7, P-value=0.17745, RMSEA=0.032
0.24
0.43
0.39
0.36
0.25
0.46
0.05
0.13
PsT

ISSN 2039-9340 Mediterranean Journal of Social Sciences Vol. 3 (11) November 2012
430
4.1.2 Confirmatory Factor Analysis of Psychological State (PsS) Confirmatory factors of Psychological State had Bartlett’s test of Sphericity of 751.823 statistically significant level (p< .01) and Kaiser–Mayer–Olkin Measure of Sampling Adequacy/MSA) of 0.769. This indicated that components of PsS aspect had proper relationship at good level and it can be used for analysis of confirmatory factors as presented in picture 2 and table 2.
Picture 2: Model of Confirmatory factors of Psychological State (PsS) Table 2 Results of Analysis of Confirmatory factors of Psychological State (PsS)
Confirmatory factors of Psychological State Weight SE t 2R X7 Value of Self-Living 0.46 0.028 12.02** 0.39 X8 Value of Family Living 0.45 0.035 11.56** 0.47 X9 Attitude of Sufficiency 0.47 0.037 15.58** 0.49 X10 Religion Belief 0.71 0.038 17.96** 0.88 X11 Environmental Physical 0.45 0.039 11.01** 0.46 Chi-Square=0.236, df=2, P-value=0.75428 GFI = 1.00 AGFI = 1.00 RMSEA = 0.001 RMR = .012
** Statistically significant level of .01 From picture 2 and table 2, results of analysis of confirmatory factors of PsS from 5 observe variables were revealed that the model was congruent to empirical data by considering from 1) Goodness of Fit Index (GFI) equaled to 1.00 and Adjust Goodness of Fit Index (AGFI) equaled to 1.00 2) Root Mean Square Error of Approximation (RMSEA) equaled to 0.001 (RMSEA < 0.05) and 3) Chi- Square value had no statistically significant at level of .01 and degree of freedom was lesser than or equaled to 5. ( 00.5/2 ≤dfχ ). Considering on loading weight of observe variables in model, it was revealed that observe variables had loading weight with 0.45 to 0.71 and had covariate to model of Psychological State with 39.0 to 88.0 percents. 4.2 Confirmatory Factor Analysis of Endogenous Variables Results of Confirmatory Factor Analysis of Endogenous Variables of Environmental Education influencing to environmental behaviors for global warming alleviation, was revealed as followings. 4.2.1 Confirmatory factors of EE had Bartlett’s test of Sphericity of 995.457 statistically significant level (p< .01) and Kaiser–Mayer–Olkin Measure of Sampling Adequacy/MSA) of 0.809. This indicated that components of EE aspect had
X7 0.23
X8 0.40
X9 0.22
X10 0.06
X11 0.42
PsS 1.00
Chi-Square=0.236, df=2, P-value=0.75428, RMSEA=0.001
0.46
0.45
0.47
0.71
0.45
0.13
0.05
0.10
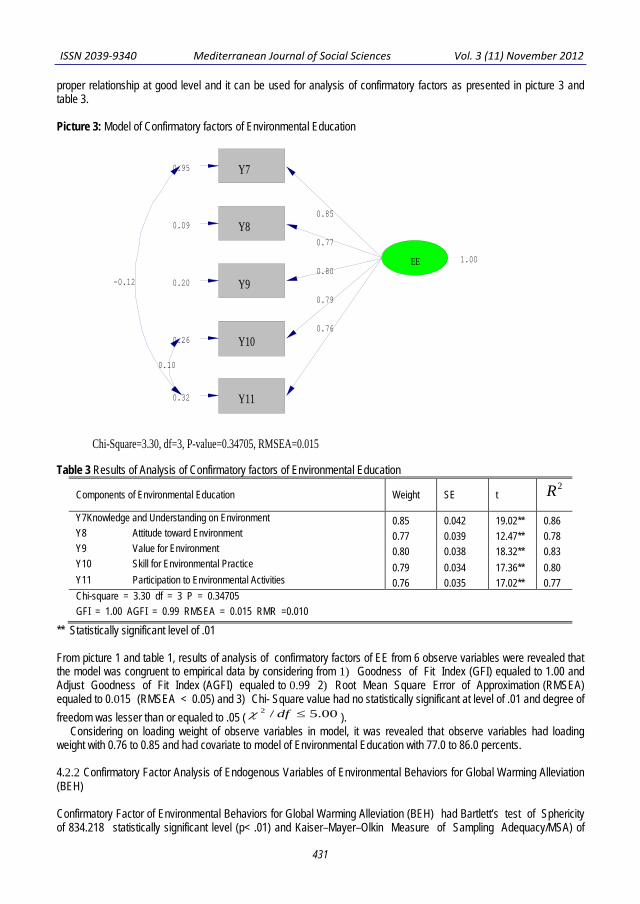
ISSN 2039-9340 Mediterranean Journal of Social Sciences Vol. 3 (11) November 2012
431
proper relationship at good level and it can be used for analysis of confirmatory factors as presented in picture 3 and table 3. Picture 3: Model of Confirmatory factors of Environmental Education Table 3 Results of Analysis of Confirmatory factors of Environmental Education
Components of Environmental Education Weight SE t 2R
Y7Knowledge and Understanding on Environment 0.85 0.042 19.02** 0.86 Y8 Attitude toward Environment 0.77 0.039 12.47** 0.78 Y9 Value for Environment 0.80 0.038 18.32** 0.83 Y10 Skill for Environmental Practice 0.79 0.034 17.36** 0.80 Y11 Participation to Environmental Activities 0.76 0.035 17.02** 0.77 Chi-square = 3.30 df = 3 P = 0.34705 GFI = 1.00 AGFI = 0.99 RMSEA = 0.015 RMR =0.010
** Statistically significant level of .01 From picture 1 and table 1, results of analysis of confirmatory factors of EE from 6 observe variables were revealed that the model was congruent to empirical data by considering from 1) Goodness of Fit Index (GFI) equaled to 1.00 and Adjust Goodness of Fit Index (AGFI) equaled to 0.99 2) Root Mean Square Error of Approximation (RMSEA) equaled to 0.015 (RMSEA < 0.05) and 3) Chi- Square value had no statistically significant at level of .01 and degree of freedom was lesser than or equaled to .05 ( 00.5/2 ≤dfχ ). Considering on loading weight of observe variables in model, it was revealed that observe variables had loading weight with 0.76 to 0.85 and had covariate to model of Environmental Education with 77.0 to 86.0 percents. 4.2.2 Confirmatory Factor Analysis of Endogenous Variables of Environmental Behaviors for Global Warming Alleviation (BEH) Confirmatory Factor of Environmental Behaviors for Global Warming Alleviation (BEH) had Bartlett’s test of Sphericity of 834.218 statistically significant level (p< .01) and Kaiser–Mayer–Olkin Measure of Sampling Adequacy/MSA) of
Y7 0.95
Y8 0.09
Y9 0.20
Y10 0.26
Y11 0.32
1.00
Chi-Square=3.30, df=3, P-value=0.34705, RMSEA=0.015
0.85
0.77
0.80
0.79
0.76
-0.12
0.10
EE

ISSN 2039-9340 Mediterranean Journal of Social Sciences Vol. 3 (11) November 2012
432
0.832. This indicated that components of BEH aspect had proper relationship at good level and it can be used for analysis of confirmatory factors as shown in picture 4 and table 4.
Picture 4: Model of Confirmatory factors of Environmental Behaviors for Global Warming Alleviation (BEH) Table 4 Results of Analysis of Confirmatory factors of Environmental Behaviors for Global Warming Alleviation
Confirmatory factors of Environmental Behaviors for Global Warming Alleviation Weight SE t 2R Y1 Consumption Behavior 0.59 0.029 19.95** 0.69
Y2 Energy Conservation 0.40 0.032 12.67** 0.34
Y3 Waste Management 0.21 0.028 7.41** 0.13
Y4 Travelling Behavior 0.34 0.039 8.81** 0.18
Y5 Recycling Behavior 0.76 0.044 17.01** 0.54
Y6 Knowledge Transferring and Supporting for Environmental Conservation 0.60 0.031 18.96** 0.64
Chi-square = 11.08 df = 7 P = 0.13517 GFI = 0.99 AGFI = 0.98 RMSEA = 0.000 RMR = 0.036
** Statistically significant level of .01 From picture 4 and table 4, results of analysis of confirmatory factors of BEH from 6 observe variables were revealed that the model was congruent to empirical data by considering from 1) Goodness of Fit Index (GFI) equaled to 0.99 and Adjust Goodness of Fit Index (AGFI) equaled to 0.98 2) Root Mean Square Error of Approximation (RMSEA) equaled to 0.000 (RMSEA < 0.05) and 3) Chi- Square value had no statistically significant at level of .01 and degree of freedom was lesser than or equaled to .05. 00.5/2 ≤dfχ . Considering on loading weight of observe variables in model, it was revealed that observe variables had loading weight with 0.21 to 0.76 and had covariate to model of Environmental Behaviors for Global Warming Alleviation with 13.0 to 69.0 percents. 4.3 Results of Effect among Variables in Model in Terms of Direct Effect 4.3.1 Confirmatory factors of Psychological Trait (PsT) had direct effect to Environmental Education (EE) and Environmental Behaviors for Global Warming Alleviation (BEH) with statistically significant at level of .01 with effect of 0.45 and 0.56. Additionally, confirmatory factors of Psychological Trait (PsT) had indirect effect to Environmental
Y1 0.16
Y2 0.32
Y3 0.29
Y4 0.52
Y5 0.49
Y6 0.20
1.00
Chi-Square=11.08, df=7, P-value=0.13517, RMSEA=0.036
0.59
0.40
0.21
0.34
0.76
0.60
0.04
0.07
BEH

ISSN 2039-9340 Mediterranean Journal of Social Sciences Vol. 3 (11) November 2012
433
Behaviors for Global Warming Alleviation (BEH) with statistically significant at level of .01 with 0.234. 4.3.2 Confirmatory factors of Psychological State (PsS) had direct effect to Environmental Education (EE) and Environmental Behaviors for Global Warming Alleviation (BEH) with statistically significant at level of .01 with effect of 0.47 and 0.38. Additionally, confirmatory factors of Psychological State (PsS) had indirect effect to Environmental Behaviors for Global Warming Alleviation (BEH) with statistically significant at level of .01 with 0.2444. 4.3.3 Confirmatory factors of Environmental Education (EE) had direct effect to Environmental Behaviors for Global Warming Alleviation (BEH) with statistically significant at level of .01 with effect of 0.52. Considering on structural model confirmatory factors was able to explain the variation of endogenous factors of Environmental Education (EE) to caused Environmental Behaviors for Global Warming Alleviation (BEH) with 97.5 percents and the variation of endogenous factor of Environmental Education (EE) with 90.5 percents. Therefore, the equation 1 and 2 can be written as followings.
BEH = 0.56 *PsT + 0.38*PsS + 0.52* EE …………..…..………..(1) (R2 = 0.975)
Equation (1) factors that had the most effect to Environmental Behaviors for Global Warming Alleviation (BEH) was Environmental Education (EE), subsequences were Psychological Trait (PsT) and Psychological State (PsS). These were able to explain the variation of Environmental Behaviors for Global Warming Alleviation (BEH) with 90.5 percents.
EE = 0.45*PsT + 0.47*PsS ………………………………..(2) (R2 = 0.905)
Equation (2) factors that had the most effect to Environmental Education (EE) was Psychological Trait (PsT), subsequences was Psychological State (PsS). These were able to explain the variation of Environmental Inspiration of Public Consciousness with 90.5 percents. Picture 5: Model of Direct and Indirect Effect of PsT and PsS through EE Influencing to BEH
Chi-Square=201.73, df=186, P-value=0.14321, RMSEA=0.031
0.09
-0.02 -0.06 -0.02 -0.04 -0.08 -0.05 -0.11 -0.03 0.06
-0.04
0.03 -0.02 -0.03 -0.04
0.03 -0.03
0.56
0.38
0.45
0.47
BEH
EE
Y1 0.10
Y2 0.33
Y3 0.29
Y4 0.55
Y5 0.56
Y6 0.14
Y7 0.37
Y8 0.40
Y9 0.21
Y10 0.32
0.79 0.49 0.25 0.38 0.88 0.81
.85 0.77 .80 0.79
0.52
0.05
0.07
0.07
0.02 0.02
0.16 0.01
-0.08 0.08
X1 0.33
X2 0.23
X3 0.23
X4 0.26
X5 0.32
X61 0.27
X7 0.20
X8 0.40
X9 0.28
X10 0.23
X11 0.37
PsT
PsS
0.20 0.31 0.31 0.49 0.19 0.61
0.38 0.43 0.56 0.57 0.51
0.36
0.09 0.03 0.07
0.04 0.06 0.02
-0.04
0.05
0.3 0.08
0.07
0.04 0 0.07 0.11
0.03 0.03
-0.04
-0.04 0.03
0.04
-0.04
0.07
Y11
0.76
0.22

ISSN 2039-9340 Mediterranean Journal of Social Sciences Vol. 3 (11) November 2012
434
5. Discussion The findings indicated that Psychological Trait (PsT) composing of Physical Health (X1), Psychological Health (X2), Self-Confidence (X3), Mercy and Kindness (X4), Achievement Motivation (X5), and Goal of Life (X6), and Psychological State (PsS) composing of Value of Self-Living (X7), Value of Family Living (X8), Attitude of Sufficiency (X9), Religion Belief (X10), and Environmental Physical (X11) affecting to Behavior for Global Warming Alleviation (BEH) covering of Consumption behavior (Y1), Energy conservation (Y2), Waste disposal (Y3), Travelling behavior (Y4), Recycling behavior (Y5), and Knowledge transferring and supporting for environmental conservation (Y6).
The endogenous factors of Environmental Education (EE) was determined by observed variables of Knowledge and Understanding on Environment (Y7), Attitude toward Environment (Y8), Value for Environment (Y9), Skill for Environmental practice (Y10), and Participation to Environmental Activity (Y11),
The exogenous factors of Psychological Trait and Psychological State were able to explain the variation of endogenous factors of Environmental Education (EE) to caused Environmental Behaviors for Global Warming Alleviation (BEH) with 97.5 percents and the variation of endogenous factor of Environmental Education (EE) with 90.5 percents. The model of PsT and PsS affecting to BEH through EE was verified the proposed model was fitted with all observe variables according to criteria of Chi-Square value differs from zero with no statistical significant at .05 level or Chi-Square/df value with lesser or equal to 5, P-value with no statistical significant at .05 level and RMSEA (Root Mean Square Error Approximation) value with lesser than 0.05 including index level of model congruent value, GFI (Goodness of Fit Index) and index level of model congruent value, AGFI (Adjust Goodness of Fit Index) between 0.90-1.00.
Therefore, it might be concluded that, psychological trait and Psychological state play very important parts to create the environmental behavior of consumption behavior, energy conservation, waste management, travelling behavior, recycling behavior , and knowledge transferring and supporting for environmental conservation based on environmental education, therefore environmental education should introduced by integration in every subjects in the school. Moreover, in aspect of environment, especially in formal education, Ministry of Education should introduce school curriculum in all level of education since kinder garden level to university level across the country to make student to gain more knowledge and understanding about environment and to raise their awareness, attitude adjust, to challenge their participation to cause behavioral changing for environmental conservation. The results of this study were congruent to various studies of Thiengkamol, N., (2004, 2005a, 2005b, 2010b, 2011b, 2011c, 2011e, 2011i, 2011j, & 2012c Jumrearnsan, & Thiengkamol, 2012, and Dornkornchum, & Thiengkamol, 2012).
References Dornkornchum, S., & Thiengkamol, N. (2012). Model of Environmental Education and Psychological State Affecting to Global Warming
Alleviation. International Proceedings of Economic Development and Research, 44, 1-5. Jumrearnsan, W., & Thiengkamol, N. (2012). Development of an Environmental Education Model for Global Warming Alleviation. The
Social Sciences, 7: 65-70. Kassin, S. (2003). Psychology. USA: Prentice-Hall, Inc. National Research Council of USA. (2010). Advancing the Science of Climate Change. Washington, D.C.: The National Academies Press. Office of National Economic and Social Development Plan. (2010). The Tenth National Economic and Social Development Plan B.E. 2550-2554. Retrieve from http://www.nesdb.go.th/Default.aspx?tabid=90 Pearson, H. (2006). “Genetics: what is a gene?” Nature 441 (7092): 398–401. Suwan, M. (2006). Management of Environment: Principle and Concept. Bangkok: Odian Store. Punthumnavin, D. (2008). Feature of Hypothesis and Data Analysis Providing for Utilization of Results of Development Research.
Bangkok: National Research Council of Thailand (NRCT). Thiengkamol, N. (2004). Development of A Learning Network Model for Energy Conservation. Doctoral Dissertation of Education
(Environmental Education) Faculty of Graduate Studies, Mahidol University, Thailand. Thiengkamol, N. (2005a). Strengthening Community Capability through The Learning Network Model for Energy Conservation. Journal
of Population and Social Studies, 14 (1), 27-46. Thiengkamol, N. (2005b). Development of Health Cities Network for Mekong Region. In Proceedings of the International Conference
“Transborder Issues in the Grate Mekong Sub-Region” Ubon Ratchathani, Thailand, 30 June-2 July 2005 (pp.111-119). Ubol Ratchathani: Nevada Grand Hotel.
Thiengkamol, N. (2009b). The Great Philosopher: the Scientist only know but Intuitioner is Lord Buddha. Bangkok: Prachya Publication. Thiengkamol, N. (2009c). The Happiness and the Genius can be Created before Born. Bangkok: Prachya Publication. Thiengkamol, N. (2010b). Urban Community Development with Food Security Management: A Case of Bang Sue District in Bangkok.
Journal of the Association of Researcher, 15 (2), 109-117. Thiengkamol, N. (2011a). Holistically Integrative Research (2nd ed.). Bangkok: Chulalongkorn University Press.

ISSN 2039-9340 Mediterranean Journal of Social Sciences Vol. 3 (11) November 2012
435
Thiengkamol, N. (2011b). Development of Energy Security Management Model for Rural Community through Environmental Education Process. In Proceedings of the 1st EnvironmentAsia International Conference on “Environmental Supporting in Food and Energy Security: Crisis and Opportunity” Bangkok, Thailand, 22-25 March 2011 (pp.11). Bangkok: Rama Garden Hotel.
Thiengkamol, N. (2011c). Development of Food Security Management Model for Undergraduate Student Mahasarakham University through Environmental Education Process. In Proceedings of the 1st EnvironmentAsia International Conference on “Environmental Supporting in Food and Energy Security: Crisis and Opportunity” Bangkok, Thailand, 22-25 March 2011 (pp.12). Bangkok: Rama Garden Hotel.
Thiengkamol, N. (2011e). Environment and Development Book. (4th ed.).Bangkok: Chulalongkorn University Press. Thiengkamol, N. (2012d). Model of Psychological Factors Affecting to Global Warming Alleviation. International Proceedings of
Economic Development and Research, 44, 6-12. United Nations Framework Convention on Climate Change. (2005). Retrieved from http://unfccc.int/essential_background/convention
/background/items/1353.php.. United Nations Framework Convention on Climate Change. (2011). “Kyoto Protocol: Status of Ratification”. Retrieved from
http://unfccc.int/kyoto_protocol/ status_of_ ratification/items/2613.php United States National Academy of Sciences. (2008). Understanding and Responding to Climate Change. Retrieved from
http://americasclimatechoices.org/climate_change_2008_final.pdf Volker., H. (2007). Brundtland Report: A 20 Years Update. Retrieve from http://www.sd-network.eu/pdf/doc _berlin/ESB07 _Plenary
_Hauff.pdf. Watkinson, J. (2009). WCED (1987) – Copenhagen (2009): Will we ever take environment seriously? Retrieve from http://myliberaldemocratpoliticalramblings.wordpress.com/2009/08/27/wced-1987-copenhagen-2009-will-we-ever-take-the-environment-
seriously/ World Commission on Environment and Development (WCED. (1987). Our Common Future. Oxford: Oxford University Press. The
Brundtland Report. United Nations World Commission on Environment and Development. Retrieve from http://en.wikisource.org/wiki/Brundtland_Report


ISSN 2039-9340 Mediterranean Journal of Social Sciences Vol. 3 (11) November 2012
437
Gender Equality in Housing Delivery -
A Panacea to Adequate Housing Supply in Nigeria
Olusegun Oriye
Department of Architecture, College of Environmental Sciences, Joseph Ayo Babalola University, Ikeji-Arakeji, Osun State, Nigeria
E-mail: [email protected]; Tel: +2348033929923
Oluranti Owoeye
Department of Urban and Regional Planning, School of Environmental Technology, Federal University of Technology, Akure, Ondo State, Nigeria
Corresponding Author: E-mail: [email protected]; Tel: +2348039179250
Innocent I. Weje
Centre for the Built Environmental Studies, Ado-Ekiti, Ekiti State, Nigeria
Doi:10.5901/mjss.2012.v3n11p437
Abstract: Women represent about fifty percent of the world’s population yet own less than one percent of the world’s property. Available literature reveals that housing has hitherto been seen as a male resource with women having access only to its use and content. A concept rooted in patriarchy and strengthened by societal norms. By this, women are usually not consulted during the various housing development processes. They are expected to adapt, even when they are major users and consumers of housing facilities and infrastructure. While the home-bound women devote 95.0% of their working hours to cleaning and maintaining their environment, the working class and the female heads of households experience functional problems accessing housing facilities and services in order to fulfill their socially and domestically accepted roles. In this regard, the major thrust of this research work is to review substantive and empirical evidences available in past literatures to set up a basis of suggesting the conceptualization of women and housing as a distinct policy domain. Areas of focus in this paper therefore include housing design and planning, building materials production and supply, housing facilities and management. The paper recommends that since women have both ‘strategic’ and ‘political’ housing needs, the scope or rationale of women housing need should be treated separately from those of men’s or housing for all the poor. Keywords: Women involvement, housing delivery, housing need, management, patriarchy.
1. Introduction Housing has been variously defined by several authors. The platform of these definitions has two things in common; it is either that housing is defined as a ‘product’ or a ‘process’. For example defining it as a product, Agbola (2001) sees it as a finished entity that can be seen and touched while as a process, it involves all the interacting activities and entities that must be in vogue to bring the product to fruition. Hence, Ezenagu (2000) opines that housing not only signifies the structure but a host of complex and comprehensive evolutionary and participatory processes which consummate in giving shape to human settlements. Women play significant roles in society building. They are known to be the major uses, consumers and maintainers of shelter, especially in the rural area and poor urban neighborhoods. They are prime home makers as well as providers of basic services and infrastructure in the majority of human settlements, especially among the poor. False assumptions concerning their roles in housing development cause a lack of consideration of their potential contributions and needs. Thus, the inability to assess woman’s need vis-à-vis housing needs and define them as inherently different from those of men is the underlying factor that undermines women participation in formulation of housing related policies and programs. As a result, woman issues in housing development are still ill-defined and specific remedies to these problems are yet to be found (UNCHS, 1993). The focus of these papers therefore is to make a

ISSN 2039-9340 Mediterranean Journal of Social Sciences Vol. 3 (11) November 2012
438
substantive and conceptual review of available literatures so as to establish a basic relationship that associate women with housing society.
In Nigeria, women represent 49 percent of the total population (Olabisi, 1998). In addition to the time spend by the sub-Saharan village women in collecting firewood and water, children caring and food preparation; they equally engage in agriculture, craftwork and trading activities to gain financial assistance that will enable her carry out any envisaged project. In rural areas, women with extremely meager resources available to them often support their husband to build shelter for their family while they are directly responsible for the upkeep. Women’s access to land and having control over housing and landed property is a determining factor in women’s overall living condition particularly in developing countries. it women’s everyday survival, economic security and physical safety and some would argue, it is the most critical factor in women’s struggle for equality in gender relations and empowerment. Despite the importance of land, housing and property to women, they generally lack security tenure. This is largely a result of gender based law which grants men direct access to housing and property than woman. 2. Conceptual issues and facts on women housing delivery This section review some conceptual beliefs that seem to narrow down access to land, housing and properties to male gender. It also reveals the United Nations documentary reports on some resolution made at various conventions organized in support of women’s involvement in housing delivery. 2.1 The Concept Of Patriarchy This concept was pioneered by the early Christian apologist and philosophers who uphold the belief that God the Father is the first and the final being while other personalities are counted as mere instruments (Encyclopedia of Philosophy, 1975). Homans (1956) broadened the concept to a family setting where men assume the headship the role over women in a home. While men are seen as direct owners of houses, women are only seen as subordinates who run and maintain the home, cook food and raise the family. This presupposition, however, introduced the notion of male bias into the formal and informal organizations. Milino (1997) sees the concept as the bias of men assuming superiority over women. According to him, the concept creates interdependence and solidarity among men that enable them dominates women. In the same vein, Jacob (2002) observes that patriarchal culture validate male associated values and denigrates that which is non-male.
Olatubara (2003), corroborating the above assertion, opined that patriarchy is a societal value system rooted in gender discrimination. Analyzing the participation of women in residential location decision-making, he submitted that it is culturally right for a woman to fit herself into the residential choice of her husband since a woman is regarded as part of the moveable property of her husband once she is married. This cultural belief reserves the right and decision to own a house for men. Any attempt made by a woman amount to usurping the authority of her husband. Such cultural set up has neither substantially benefit the target groups (i.e woman and children) nor the society in the area of housing need reduction. This assertion has seriously affected the operation of many formal establishments in charge of the provision of shelter and infrastructures (Agbola, 1990).
The concept of patriarchy and practice is not restricted to a country or a locality, but a malady whose onslaught has had far reaching impact across continents. For instance, woman in Uganda are not expected to own or inherit capital property such as land and houses since cultural norms forbid them from doing so. In Brazil, as quoted in Agbola (1990), applicants for a site and service project must be a father (male gender) as stipulated criteria for eligibility. This is rooted in the belief that a father heads a family in compliance with the western nuclear model. Even in some communities where women are permitted to undertake construction of shelter, their male counterparts control such finished shelter and households. This is practiced in Tanzania where women who venture into housing delivery are ostracized by the society and condemned for usurping the role of men and treating societal norms with levity (Mascarenhas, 1999).
The situation is not different in Nigeria. Akande (1986) opined that under normal arrangement in Nigeria customary law, a married woman can only acquire a house by purchase with concrete evidence to proof that no consideration, either directly or indirectly will she allow the building to be furnished by her husband if she claim exclusive ownership of such property. In the same vein, Mwaka and Tumushabe (1992) observed that traditionally, a woman is regarded as a minor and once she is married, she losses her identity and subsume under her husband’s identity. Hence, her husband name is expected to reflect when acquiring any property. Of a truth, a man lowers his prestige and honour if he accepts to move into an apartment or a building owned and controlled by his wife. Where a woman own personal property in her name or father’s name, it attract social stigmatization. It is however believed generally in Africa settings that married woman should co-habit with their spouses and not to acquire individual residential property except by inheritance from her

ISSN 2039-9340 Mediterranean Journal of Social Sciences Vol. 3 (11) November 2012
439
lineage. Under this arrangement, women control such property for the purpose of generating financial support to the family through rents. 2.2 Women as Beneficiaries of Housing The international community is beginning to recognize that woman‘s lack of right in having access to and control over land, housing and property constitutes violation of human right and contributes significantly to woman’s increasing poverty. The United Nations Centre for Human Settlement (UNCHS, 1985) affirmed that developing countries are seriously facing financial difficulties in allocating resources to housing, so that focusing on administrative and financial resources on the specific housing need of women is a secondary priority.
A large proportion of world’s population is either homeless or live in extremely inadequate housing conditions. High proportion of this population constitutes of women who, though contribute immensely to development but seem to form part of the poorest population. This is quite obvious because they lag behind in their access to resources. Thus, they are vulnerable group particularly in area of land and housing resources. They include poor female heads of household who are divorced, widowed, single working mothers or separated. It also includes elderly ones, the physically and mentally challenged, the battered, refugee and destitute women (UNCHS, 1993). Although, provision of housing for the battered women are given some considerable attention in developed counties like England where about 11,400 women and 20,850 children were accommodated in one year in about 150 refuges homes. Similar programs are being experimented in some parts of Nigerian and many other developing countries. For instance, in Ebonyi State, several self-contained bungalows were constructed to house widows in 2004, which was undertaking by the then First Lady, Mrs. Eunice Ukamaka Egwu. These widows were predominantly those maltreated by the cruel hands of those obnoxious traditions. There is need for improvement on this few examples as these efforts seem to be infinitesimal compare to the backlog of challenges in housing demand by this few group of people. Meanwhile, single parents, separated, divorced are yet to receive any attention from any quarters. Concrete measure however seems difficult to formulate for now. They are either too costly or require a broad-based scheme whose main target is female population in urban and rural areas for housing program’s consideration. 2.3 Housing Design and Planning Housing development is conceptualized in its broad aim and objectives, and actualized in its eventual ability to enhance livability. This depends on a hub of information needed, which are best provided by women who are best users of shelter and infrastructures. Unfortunately, they are never consulted and their opinions are usually treated with levity. At micro level of housing construction and delivery, it is common to notice that woman’s wishes have not been integrated into set standards. They are often expected to adapt themselves to the finished products as regular maintainers of those properties. However, most women often nurse this quest especially if circumstance does not allow them to express such over time. But in situation where they have the opportunity to voice out their desire, they often criticized the plan and design. A typical case was when some female residents in Central America defiantly refused to use toilets designed by male engineers. According to them, the design of the toilets creates room for spaces which exposed their feet while using the toilets. This design violated their notion of privacy (Agbola, 1990).
In everyday life, women seem to lay emphasis on the space provided for kitchen and its attendant utilities and not necessarily on spacious living rooms nor exotic bedroom. It is very conventional to see women requesting spaces to store extra water, extra fuel (e.g. firewood) to plan for days when normal supply seems to disappoint. In view of this, women idea and concept should be incorporated in planning and design of buildings. But rather, this has been dominated by men whose perceptions, thought and designs have resulted in today’s architecture and city designs. This trend, according to Agbola (1990) tends to have forgotten the historic role of woman in housing participation and involvement. In this wise, men principles of design tend to run parallel to women conceptions. While women have a tendency to design from inside to outside with a view to make housing area function as a social and cultural unit man tend to go entirely in opposite direction. 2.4 Housing Maintenance Due to inbuilt traits of women and their domestic locus, they play considerable roles in day-to-day maintenance of housing and their immediate environment. In most societies, housing maintenance is regarded as the sole responsibility of women. As observed in Muma (1998), 95.0% of work hours are spent by women in upkeep of house and yard while

ISSN 2039-9340 Mediterranean Journal of Social Sciences Vol. 3 (11) November 2012
440
men spend just 5.0% on the same venture. According to Agbola (1990), women’s involvements in housing maintenance focus on three main benefits and objectives. They are to:
I.achieve better results and prevent the settlements from degenerating into a slum II. cut down cost of renovation and repairs, and
III. speed up repair and servicing of infrastructures (where necessary).
Women involvements in housing maintenance basically centers on decorations and cleaning, sometimes on minor repairs and painting. At communal level, they safeguard facilities against vandalism and mischievous damages by children. This is so because they exhibit more concern for regular functioning of such amenities like communal water tap, light and other household facilities. Besides, they are the one faced with the bulk of the hardship generated by the breakdown of these facilities. They are equally responsible to manage traditional water sources since they know their location, accessibility and reliability as well as the quality in their different communities. However, the UNCHS (1985) observed their exclusion from any geo-hydrological surveys as not justifiable. 2.5 Involvement in Building Materials Production and Supply Apart from food and clothing, the other major category of basic good for which rural communities have a participatory requirement is that of building materials for houses and storage structures (Carr, 1985). Normally, women’s involvement in the production of building materials is expected to enhance their source of income; but beyond that, it complements regular and adequate and supply of building materials for easy construction. For instance, many of Asia’s Lime burners are women while in most Eastern and Southern Africa like Kenya, Zimbabwe, Malawi, Mozambique and Sri Lanka, women do involve in traditionally brick-making, roofing of houses, blocks, tiles, wash-hand basin, water pumps supply, decking and other building activities and process (Carr,1985). They actually derive huge income from undertaking such activities; hence, they do them with joy and enthusiasm. Some women own block-making factory and operate as principal suppliers of sands, gravels, stones, cement, chipping as well as contractors to both large and small-scale constructions. In Abakaliki (Ebonyi state), women are involved in purchase of large block of hard rocks, blasting them and subsequently crushing them into crushed rock and chippings. Also, in some parts of Nigeria, Better Life for Rural Women provided springboard where women became principal suppliers of concrete blocks, asbestos roofing sheets, and ties. Example is the Olorunsogo Development Association in Oyo State (Agbola, 1990). 2.6 Women’s Role in Housing Construction Women are actives as men in building the family house, particularly in area of manual labour and efforts to get materials like water, mud and sand adequately supply as well as preparing food for the workers at sites. A study conducted in Dar-es-salam (Tanzanian) by Mascarenhas (1999) on division of labour during housing construction process corroborates the above assertion with some findings and discoveries as shown in Table 1 below: Table 1: Role played by Women compared to Men in Construction processes
Construction Tasks Women Men Frequency Percentage Frequency Percentage Drawing house plan 19 15.8 52 43.3 Fetching of water 76 63.8 22 18.7 Collecting of mud 37 30.8 24 20 Collecting of grass 19 15.8 14 11.7 Pulling up of thatch 13 10.8 16 13.3 Total 120 100.0 120 100.0
Sources: Mascarenhen, 1999 The above statistical data reveal that involvement in building process is affected by gender division of labour as women get involved in most of the unskilled works and activities more than men. However, training of women in construction related skill such as carpentry, masonry, bricklaying, electrical fitting and steel works have been carried out in many countries under various projects and programmes to enhance women improved participation in actual building

ISSN 2039-9340 Mediterranean Journal of Social Sciences Vol. 3 (11) November 2012
441
construction. Notable examples are the Western Kingston Women Collective Construction (WKWCC) and the Women Self-Help Construction Project (WSHCP) in Panama (Agbola, 1990). 2.7. Un Documents / Beijing Platform For Action (PFA) UN documents on resolution and reports emerged from various world conferences in support of gender equality in housing delivery are not legally binding on states, but carry moral persuasion and presents sources of international law that enhances women’s involvement in housing delivery. The Beijing Platform for Action (PFA), which emerged from the fourth World Conference on women, explicitly recognized the importance of land, housing and property to women’s livelihood. It recognized important link between women’s property and their homelessness, inadequate housing and lack of access to economic resources such as credit, land ownership and inheritance. It equally notes the relative impact that the unequal division of labour and responsibilities within the household has on women’s participation in decision making in public forums. The PFA squarely places these concerns in a human rights framework by reaffirming that all human right be it civil, cultural, economic, political and social are universal human rights. It therefore commits government to enable women to: (i) Attain an affordable housing and access to land by removing all obstacles to access (ii) Undertaking legislative and administrative reforms to give women full and equal access to economic resources, including the rights to inheritance and ownership of land and other property. (ii) Eliminate the injustice and obstacles facing the female gender, particularly in area of inheritance by enacting and enforcing legislation that guarantees equal right to succession and ensure equal right to inherit, and (iv) Enhancing, at both national and local levels, rural women’s income generating potential by facilitating their equal access to and control over productive resources, land, credit, capital and property rights. 2.7.1 Habitat Agenda At the onset, the Habitat Agenda rightly identifies the factors which have prevented women from obtaining adequate shelter to include persistent increasing burden of poverty and discrimination against women (UN-Habitat, 1996). In turn; women equal access to land, housing and property is one of the overall guiding principles of the habitat agenda. This is reflected in chapter II of the agenda which the set goals and principles regarding human settlements. It stipulates that equitable human settlement are those in which all people without discrimination have equal access to housing, and provide equal access to the right to inheritance, ownership of landed properties and credits (par. 27). Chapter III of the agenda is particularly articulated on women’s right to land, housing and property ownership with paragraph 40 (b) committing government to “providing legal security of tenure and equal access to land to all people, including women and those living in poverty; and undertaking legislative and administrative reforms give women full and equal access to economic resources, including the right to inheritance and to ownership of land and other proper property, credit, natural resources and appropriate technology” (par. 40). This is reinforced by the commitment undertaken by states to ensure gender equality in all aspects of human settlements such as integration of gender perspectives in human settlements related legislation, policies, programmes and project; developing conceptual and practical methodologies for incorporating gender perspective in human settlement planning, development and evaluation; and formulating and strengthening policies and practice to promote the full and equal participation of women in human settlement planning and decision making (par. 46).
Later, the document compliments these objectives and commitments with corresponding strategies for implementation, recommending the eradication of legal and social barriers to women’s equal and equitable access to land. Specifically, the document calls for states to promote awareness campaign and education regarding women’s legal rights with respect to tenure, land ownership and inheritance. Support community project that aim to remove all barriers to women’s access to affordable housing, land, housing that aim to remove all barriers to women’s access to affordable housing and property ownership, economic resources, infrastructure and social services and ensure the full participation of women in all decision making process; undertaken legislative and administrative reforms to give women full and equal access to economic resources, including the right to inheritance and the ownership of land and other property, credit, natural resources and appropriate technologies (par 78).
The habitat agenda is useful in the struggle to promote and protect women’s right to land, housing and property as it reaffirms the crucial link highlighted in the Beijing PFA between women’s economic and social disadvantages and women’s lack of access to land, housing and property. It provides a number of concrete actions government and others can take to ensure equal access to land, housing, and property. Like the Beijing PFA, however, the Habitat Agency does

ISSN 2039-9340 Mediterranean Journal of Social Sciences Vol. 3 (11) November 2012
442
not go far enough, as it fails to recognize and call upon government to ensure women’s equal right to land, housing and property (par, 93). 2.7.2 Special Rapporteur on the right to Housing In 1993, Justice Rajindar Sachar was appointed special rapporteur on promoting the realization of the right to housing. During his tenure, he produced three reports which explore the various aspects of the right to adequate housing. What follows is an overview of the special rapporteur’s comments pertaining to women land, housing and property.
In his first progress report, the special rapporteur notes that gender and housing must be further examined in order to understand the causes of the global housing crisis (par. 94). Toward this end, in his final report, the special rapporteur devotes several paragraphs to women’s land, housing and property rights. In particular, he notes that “women’s across the globe continue to suffer from discrimination in the attainments of all aspect of the right to housing such as land security and inheritance of right to land, housing and property as well as access to credit facilities. He further comments that issue of land security is of primary importance to women, especially given that in most countries of the world, women have neither a right to the home in which they were born nor to the home they live in after marriage (par. 96). He further noted that even in countries where inheritance laws and laws governing right to home ownership and security of tenure have changed, women are seldom able to exercise their rights (par. 97). He then suggests that the most critical factor in the perpetuation of gender inequality and poverty is the continued discrimination faced by women in all matters of land, housing and property. He then concludes that gaining and securing the right to housing can lead women to attain other right and create possibilities for the improvement of the environment in which women live (par. 98).
Under the heading “Gender equality”, the special rapporteur stated that it is necessary to alter the unjust and exploitive socio-cultural practices and processes against women to ensure that these issues are explicitly considered in all aspects of housing policy, programmes and legislation. To maintain this momentum, however, the report proceeds to recommend that states should guarantee women full equality of treatment regarding any and all aspects of the human right to adequate housing, with particular attention on right to land and/or property ownership and inheritance that influence decision making processing (par, 99). 2.7.3 Resolutions At the end of the conference, there were three resolutions adopted by UN bodies on women’s right to land, housing and property. They include: Resolution 1997/19 – Women and the right to adequate, housing and to land, housing and property (par. 100). Resolution 1998/15 – women and the right to land, housing and property and adequate housing (par. 101), both adopted by the sub-commission on the prevention of discrimination and protection of minorities. Resolution 42/1- Human right and land right discrimination adopted by the commission on the status of women (par 102). These resolutions underscore and support women’s right to land, housing, and property as well as the right to be free from discrimination with respect to land, housing and property. The two resolutions adopted by the sub-commission are particularly interesting for the linkages they make to a variety of human right documents. These can equally be implemented in other parts of the world, both the developed and less developed countries, particularly in Nigeria as a panacea to drastically reduce inadequate housing supply that seems to pose serious threat to human environment and livability. 3. Factors Militating Against Women Involvement in Housing Delievery in Nigeria Women access to housing, in the context of this paper, implies that they must have the right to build, own, buy or rent their own houses, the right to generate income out of housing operations and implementation process. All these border on their access to land, housing finance, training information and access to appropriate technology (Awotona and Akinola, 1997). As a leverage to this submission, the UN conventions on the elimination of all forms of discriminations against women (some of which are discussed in section 2.7.0 of this paper) called for equal treatment in land and agrarian reforms as well as in land settlement schemes. There should be equal rights for women to conclude contracts and to administer property as it is for their spouses in respect of ownership, acquisition management, administration, enjoyment and disposal of property (Tusuigwine, 1999). In Nigeria, however, the followings have been notes as militating factors against women’s full involvement in housing operations:

ISSN 2039-9340 Mediterranean Journal of Social Sciences Vol. 3 (11) November 2012
443
Lack of Access to Land: Lands are not generally allocated to women by the informal method of land acquisition since women are culturally not meant to have the right. The custom, according to Akande (1995) was to protect family land in Nigeria against outsiders who might have many women in the family to inherit lands indirectly. Traditionally, the ownership and right of women to land acquisition are restricted by customary laws while the modernization and commercialization of land negatively affect land entitlement of women. For instance, the statutory ablation of certificates of land occupancy in Nigeria shows that 20 times as many males as females received statutory allocation in 1979 (UNCHS, 1993). Since women acquire land generally through purchase, their low income ability could be an important constrain. (Macarenhas and Mbilnge, 1980). Lack of security is a nagging problem. Besides purchase of land; traditionally, inheritance practice generally favour male children more than their female counterparts in the ownership of capital property including housing. Exceptional cases only prevail in few tribes like Koramojong tribe in Kampala (Tusingwine, 1999) and among the Effiks in Nigeria where women ‘may be allowed’ to inherit land or houses after performing the burial of a deceased parent. In this context, the only way out in making land sufficiently available to women is through legal provision and government interventions that will terminate the restrictive mechanisms to granting security of tenure for women as beneficiaries. Lack of Access to Finance: Building construction and sometimes infrastructural provision are generally self-financed. In view of this, the participation of married women during construction involves careful household budgeting to ensure that the family is not adversely affected. Generally, income dictates the quality of housing and women are often associated with lower income, they are usually left with ‘left over’ of housing delivery efforts. Meanwhile, to secure housing loan and mortgages, there is always a criteria for qualification; e.g. formal employment, educational level and regular monthly income. The nature of collateral and securities often demand by the housing agencies (both public and private) tend to be beyond what some women can provide in societies which generally ‘downplay’ the need for women to own a house (Awotona and Akinola, 1997). According to UNCHS (1989), there are three main constraints which women face in their attempt to gain access to credit facilities. These include: Social constraint which emanate from low wages and unstable employment situations; Policy constraints which emanate from lack of political commitment, instability of government to formulate and implement policy that will advance the status of women; and Institutional constraints which emanate from stringent operations of various financial institutions. These constraints could be alleviated through the formulation of macro and micro economic policies which are women-centered and deliberately seeking women involvement to share in the windfall of development. The operations of financial institutions must be made simple and flexible in nature to enhance easy accessibility by an average woman including the interest rates. Lack of Access to Information: The vast majority of women in Africa are illiterate which exclude them from taking any advantage of documented information on housing. Besides, women encounter greater difficulties than men in establishing a dialogue with settlement planners to help define their contributions to housing management and to acquire equitable benefit from them. They are equally predisposed to negative fallout of redevelopments, resettlements and even upgrading of neighbourhoods. The small proportion of vocal women can never stand up to the weight of the denials aggravated by lack of information militating against women’s access to credit, (particularly saving and credits schemes), lack of information on housing and housing related resources (such as building/construction materials and labour) which will further promote the participating of women. Sub-Position of Women in Formal Establishment: Women participation in top-level decision making is seriously hampered by their failure to acquire relevant professional skills. The UN conference on women in 1995 had resolved, amongst other things, that the enrollment of women in architectural, engineering and related fields should be assigned to professional, policy and decision making position (UNCHS, 1995). However, studies on gender, architectural education and professions in Ghana by Mills Tetty (1994) revealed that only about 7.8% of all the registered personnel (i.e qualified and practicing engineers and related field) were women. This should be encouraged. Misconceptions about Women’s Participation in Construction Sector: There are various misconceptions about women’s involvement in the construction sector. Some of which include, among others: (i) Belief that women cannot withstand the physical exertion of works on the construction sites.

ISSN 2039-9340 Mediterranean Journal of Social Sciences Vol. 3 (11) November 2012
444
(ii) Traditional values and supposition of males been supervised by females. (ii) Insinuation that man’s artisanal skill are more qualitative than their female’s counterpart. (iv) Belief that women’s place in the home would be override by their commitment to their profession. Statistics of the international labour organization in 1988 showed that female participation in construction ranged between 0.55% and 16.78% generally. While 1.5% of Egyptian women engaged in housing sector of their economy, about 3.8% of Nigerian women were actually involved in housing construction (UN-Habitat, 1985). 4. Women’s Strategic Efforts Toward Greater Participation in Housing Delivery Women over the years seem to have gone against the wind in their quest for increased participation in housing delivery. With almost everything tending to work against their policy, institutional and traditional norms as well as endogenous factors like low income needs; that which they could not achieve as persons, they overcame through the spirit of organization and co-operatives. The traditional conception that housing construction is no women’s job is gradually going into extinction. Women are vigorously contributing to the stock of housing supply especially through collective efforts, ranging from Community Development Association (CDA), Co-operative Thrift and Credit Societies (CTCS) to Informal Cooperatives (IC) (Akinola and Awotona, 1999). Some of their contributory roles played over the years include the followings: Informal Cooperative: Women basically take part in most local institutions. Their membership and participation are more prominent in the co-operative societies (formal and informal) run and dominated by women. Their roles seem to be latent when co-operatives are of both men and women due to disparities in the occupation of influential positions by men. Whatever the constitutional provision might be, one thing is certain that women join co-operatives primarily to increase their financial capital-base and enablement to cater for their social, domestic and housing commitments. For instance, most women members of the University of Uyo Cooperative have either built houses of their own or purchased landed property to enable them to have their personal building in the nearest future. Community Development Association (CDA): The CDA, otherwise known as ‘Self-help Group’, is a form of modern social intervention used to address government neglect in terms of the provision of social amenities and physical infrastructures (Akinola and Awotona, 1997). A cursory look at the contributions of Women CDA’s in some states of Nigeria reveals the following data as shown in Table 2 below. Table 2: Various projects executed by some women CDAs in Nigeria
State Type of CDA Project Edo/Benue Abawo Development committee
Akpan Women Development Association Construction of Garri Processing Factory and Multipurpose Hall.
Borno Women’s League Construction of Day care, meeting hall, center for man literacy campaign and School for the Blind.
Kaduna Atung Bin Women Associate Construction of Vocational Schools and some N/P Schools Lagos Magbon Alade Construction of Primary Schools, Town, Hall, Court House,
Post Office, Bank building. Lagos Agorin CDA Construction of schools, provision of facilities and Skills
acquisition to members Lagos Olorunsogo CDA Training and Skills acquisition to members Akwa Ibom Nka Uforo Iban Construction of Multipurpose hall, Uforo Community Bank
and Skill Acquisition Centre. Source: Akinola and Awotona, 1997. 5. Summary, Conclusion and Policy Recommendation The broad spectrum survey of available literature throw more lights on the various aspect of women involvement in housing delivery as well as the many limitations and inhibitions they encounter in the course of participation in house delivery. Central to this review is the fact that patriarchy conceptual belief, which supports male dominance and male-headed households, has far reaching impact on women’s involvement in housing delivery. The concept prevails in family settings where women needs, wishes and aspirations are not considered in housing policy formulation and planning. They suffer the same neglect in formal organization due to the male bias syndrome. However, in spite of this; this paper

ISSN 2039-9340 Mediterranean Journal of Social Sciences Vol. 3 (11) November 2012
445
revealed the involvement of women in housing maintenance, building material production, supplying of labour and auxiliary services at construction sites as well as maintenance of community facilities. A lot of constraints work against women. These had been identified as lack of access to credit facilities, non-inclusion in formulation of housing policies and programmes as well as other traditional notions, presuppositions and beliefs that go against their freedom of been involved directly. It is therefore recommended that, as a strategic effort in enhancing greater women involvement in housing; women needs of housing must be seen as a warrant for conceptualization as a distinct policy domain where past and present efforts could be integrated while the redress of the constrain faced by women would be treated separately as a sub-area. This could be a broad policy statement in National Housing Policies to address pressing issues such as lack of access to land, credit and information as well as measures to cushion the bureaucratic effects of non-inclusion of women in the housing sector. Women participation in housing delivery should be encouraged by integrating the various roles played by women’s co-operatives (formal and informal). This could be achieved by treating their contributions as sub-areas in housing finance whereby legislation are spell out to make them of universal acceptance. To curb the problem of inadequate finance and inadequate savings, women’s literacy level could be enhanced by lighting domestic chores so that women could engaged in more qualitative higher levels of education. Training in artisanal skills could help them to participate in top decision making in housing sector. This can earn women more, not only to participate in direct housing provision but also enhance their capability to benefit from housing as target population.
References Agbola, Tunde (1990): Tha nature of women’s involvement in housing development: A survey of the literature in Schlyster, A. and Johal,
D. (ed.): Special Issues on women in human development and management in Africa; African Urban Quarterly; 5(3): 178-186 Agbola, Tunde (2004): Readings in Urban and Regional Planning, Macmillan, Nigeria Agbola, Tunde, C.O. Olatubara, Moruf Alabi (2001): Student On-Campus Housing at Bursting Point: A Case Study of the University of
Ibadan, IFRA, Ibadan Akande, J.O (1986): Women’s Right in Poverty in Nigeria Law; An unpublished LLM Dissertation, Lagos State University Awotona, A. and Akinola, R. (1997): The Participation of Women in housing and community development in Africa: A case study of
Nigeria in Emine, M.K (ed.): Housing Questions of the others; Chamber of Architects of Turkey; pp. 106-115 Carr, M. (1985): Blacksmith and Baker, Roofing Sheet maker…Employment for Rural women in developing countries; Immediate
Technique Publication, London. Encyclopedia of Philosophy (1975) Ezenagu, V.C (2000): Fundamentals of Housing; Fountain Publishers (Nigeria) Limited, Awka Nigeria Homans, G.C (1956): The Human Group; Harcourt, Brace and World Inc. New York Jacob, H.M (2002): Contemporary Environmental Philosophy and its Challenge to Planning Theory in Handler, S. (ed.): Planning Ethics
– A Reader in Planning; CURP, New Jersey Matanmi, S. (1990): Water Politics – Remarks on the sources of water supply to the Nigerian households in Olurode, L. (ed.): Women
and Social change in Nigeria; Dokun Publishing House, Ibadan Nigeria Susana Lastarria-Cornhiel (1997): Impact of Privatization on Gender and Property Rights in Africa; World Development; 25(8): 13-17 UNCHS (1995): Women and Human Settlements Development: A Case study of the Gambia; Paper presented at the International
Workshop on Women’s Access, Control and Tenure of Land, Property and Settlement; October, 9-11. UNCHS (Habitat, 1999): ‘Women’s Right to Land, Housing and property in post-conflict situations and during reconstruction: A Global
Overview’ (A Research conducted with the support of the Government of Sweden); Series No. 9, Nairobi. UN Document (1991): Committee on Economic, Social and Cultural Rights; General Comment No. 4 on the Right to Adequate Housing;
EC/12/1991/41.


ISSN 2039-9340 Mediterranean Journal of Social Sciences Vol. 3 (11) November 2012
447
Causal Relationship Model of Hospital Environmental Management
Nipaporn Jongwutiwes
Department of Environmental Education
Faculty of Environment and Resource Studies Mahasarakham University, Mahasarakham 44150, Thailand
Nongnapas Thiengkamol
Major Advisor, Department of Environmental Education
Faculty of Environment and Resource Studies Mahasarakham University, Mahasarakham 44150, Thailand
Email: [email protected]
Tanarat Thiengkamol
Co- Advisor, School of Management, Assumption University, Hua Mak Campus, 592/3 Ramkhamhaeng 24,
Hua Mak, Bangkok 10240, Thailand
Doi: 10.5901/mjss.2012.v3n11p447 Abstract: The populations were 270 workers of Roi-ed Thonburi Hospital in Northeastern region of Thailand. The populations of 270 workers were used as sample group. The questionnaire was used as instrument for data collection. LISREL was used for model verification. Considering on structural model confirmatory factors of Environmental Education (EE) and Hospital Environmental Management (EM) were able to explain the variation of endogenous factors of Inspiration of Public Consciousness (PM) to caused Environmental Conservation Behaviors (CB) with 72.00 percents. As a result, the equation 1 can be written as following. CB = 0.51*PM - 0.13*EE + 0.34*EM ………………………………(1) R2 = 0.72 Equation (1) factors that had the most effect to Environmental Conservation Behaviors (CB) was Inspiration of Public Consciousness (PM) and subsequences were Hospital Environmental Management (EM) and Environmental Education (EE) with negative direction, these were able to explained the variation of Environmental Conservation Behaviors (CB) with 72.00 percents.Moreover, confirmatory factors of Environmental Education (EE) and Hospital Environmental Management (EM) were able to explain the variation of confirmatory factors of Inspiration of Public Consciousness (PM) with 63.00 percents. Therefore, the equation can be written as following equation 2. PM = 0.17*EE + 0.44*EM …………………………..…………….(2) R2 = 0.63 Equation (2) factors that had the most effect to was Inspiration of Public Consciousness (PM) and subsequences were Hospital Environmental Management (EM) and Environmental Education (EE), these were able to explained the variation of Inspiration of Public Consciousness (PM) with 63.00 percents Key Words: Causal Relationship Model / Hospital Environmental Management / Environmental Education 1. Introduction With the real situations facing in currently, environment and development are considered as the conflict philosophies because people cannot avoid the unbalance among social, economic and environmental aspects. However, every people should take the responsibilities of our daily activities that cause differently environmental problems. In order to solve environmental problem, it should inspire people to take a real participation. The participation would conquer the noise pollution, air pollution, land degradation, fresh water shortage for consumption, deforestation, solid waste accumulation, toxic chemicals, and hazardous wastes, increased of green house gases that are important factors of global climate

ISSN 2039-9340 Mediterranean Journal of Social Sciences Vol. 3 (11) November 2012
448
change and ozone depletion in stratosphere atmosphere including degrading of non-renewable natural resources with rapid rate. In addition, loss of biodiversity affects to balance of Ecosystem. These environmental problems have impacted to whole biosphere because one thing changes and then affects to others like as chain reaction (Thiengkamol, 2011e).
In line with the population growth, the more population grow the more poverties are because of the imbalance of equality of income gaining, it builds pressures to natural resources. The United Nations, predicted that in the last half of twenty first century, ninth of tenth of world population would be in the poorest countries of the world. Those poor people will lack of fresh water for consumption including lacking of other natural resources. The unstable status of agriculturists, the chance of dearth will occur together with natural resource degradation due to soil erosion (Thiengkamol, 2011e). This extends the gap between the rich and the poor wider. Even though, the cost of health care is also higher, consequently the high rate of death in some region of the world. The attempt to overcome the poverty through the birth control is not really successful because most of poor people often lack of knowledge due to illiteracy (Thiengkamol, 2011e).
Currently, the situation of pollutions, the pollutants are released and accumulated in the environment such as heavy metal in the water resources or toxic gases in the air. These cause the deprivation of environmental quality to affect to human health and life and other living organism. The environmental diseases become more vigorous at present. Such as lead toxicity, silicosis from construction activity, flu occurred from air pollution, headache, cancer, migraine, heart disease, and skin disease are commonly found in people who lived in the degraded environment (Thiengkamol, 2011e).
“Environmental Management” was defined by Zhongsuntharawong that referred to the process of work plan arrangement or activity to allocate the utilization of natural resources in order to respond the requirement of human being to accomplish the highest goal of development (Zhongsuntharawong, 2003). The stability of economic, social and maintenance of good environmental quality based on the maximization of utilization principle with sustainability and it caused a less damage to environment as most as possible. Nevertheless, Punjasuwan, compiled and gathered the meaning of “Environmental Management” that referred to method of implementation or way of practice systemically for sustaining environment as long as possible through prevention, conservation, and improvement to maintain the good environment (Punjasuwan, 2005). He also suggested that the best way of natural resources and environmental management is prevention, which is process or action to diminish and eliminate the environmental impact before causing damage to humans.
EPA New England, issued check list of hospital environmental assessment in accordance with the different acts such as Resource Conservation and Recovery Act, Clean Air Act, Federal Insecticide, Fungicide & Rodenticide Act, Clean Water Act, Toxic and Substances Control Act. In addition, solid waste with recycling concept, toxic waste and infectious waste management, energy and water conservation, and environmental topic training courses for workers such as general compliance, Clean Air Act (CAA), solid waste recycling, energy management systems, Resource Conservation and Recovery Act- hazardous waste (RCRA), Spill Prevention Control Countermeasure Plans (SPCC), red bag waste reduction, energy conservation, universal waste, EPA Audit Program, resource management, green buildings, mercury, water conservation, Environmental Management System (EMS), Integrated Pest Management, and green purchasing also are paid attention as well (EPA, 2004) .
Throughout 5 decades of social and economic development of Thailand, governments announced different policies of environmental quality promotion and maintenance to prevent and solve the environmental problem but there is only governmental sector took the role but it lacked of real participation of all sectors, especially the people participation. Therefore, it might be needed to give environmental conservation knowledge through all systems of educations covering formal, non-formal, informal and lifelong education process based on concepts of environmental education that included lacked of knowledge and understanding, awareness, consciousness, attitude and belief to practice themselves towards environment and natural resource protection because they do not realize that they are an important part to take a responsibility for natural resource and environmental conservation (Thiengkamol, 2011e).
Even though, there is having no specific for hospital environmental management (HEM) clearly In Thailand, but some of them applied the Theoretically, ISO 14001 could serve as a comprehensive framework for significantly improving performance in an organization with minimal environmental management capacity, especially in agreement with legal compliance or as a set of common sense guidelines for enhancing performance in an organization to effectively implement for environmental quality maintenance for well being of human. However, an environmental management system requires support from all levels of management in every organization, therefore, participation from all sector is essential for implementing a successful environmental management system. Motivational training, information, and the presentation of success stories generate enthusiasm and help guarantee the environmental management system’s success. Major components of successful environmental management systems include environment, people and cost. The most common of environmental problems included 6 aspects including energy consumption, waste water

ISSN 2039-9340 Mediterranean Journal of Social Sciences Vol. 3 (11) November 2012
449
management, solid waste management, green area increment, safety, and facilities (Wattanasaroch, and Thiengkamol, 2012, & Arunsrimorakot, 2005).
Therefore, the environmental education principle for hospital workers should be introduced to them to practice until it becomes a part of their habit in daily living. In order to educate people to gain more knowledge and understanding on natural resource and environmental conservation, it need to introduce environmental education principles and hospital environmental management based on Environmental Management System in terms of ISO 14001. Environmental education comprising environmental knowledge transferring, awareness and consciousness raising, attitude and practice changing, inspiration of public consciousness creation and participation for hospital workers, these should facilitate them to be able to practice according to Environmental Management System in terms of ISO 1400 in terms of HEM based on principle of environmental management system and environmental education principles in order to meet the better practice and behavior of environmental conservation (Thiengkamol, 2010b,Thiengkamol, 2011a, Thiengkamol, 2011e, Thiengkamol, 2011g, Thiengkamol, 2011h, Thiengkamol, 2012, & Arunsrimorakot, 2005).
Even though, Roi-ed Thonburi Hospital is operated with ISO 14000 but the most importance of hospital environmental management must be paid attention on worker behavior in their everyday practicing at hospital. Consequently, the most rapid and cheapest mean is to challenge the worker to collaborate energy effectively utilization, waste management, wastewater management and landscape architectural environment via the human resource strengthening with the worker based on the concept positive thinking like as owner. Environmental education concept is pertinent to sustainable principles that cover knowledge and understanding, awareness, attitudes, values, belief, responsibility, participation, and skill to make proper decision for solving the facing environmental problem correctly and repeatedly until it becomes permanent behavior in everyday living that leads to successful management to build a sustainable hospital management with minimization of energy and water utilization and management of waste water and solid with effectiveness and safety including increasing security for patient and workers (Thiengkamol, N., 2010 , Thiengkamol, N., 2011a, &Thiengkamol, N., 2011b).
Accordingly, Thiengkamol mentioned on public consciousness or public mind based on inspiration from insight and inspiration different from motivation because inspiration needs no rewards. Inspiration of public consciousness or public mind, especially, for natural resources and environment conservation, one doesn’t receive any reward, admiration or complement for ones act for natural resources and environment conservation. Inspiration of public consciousness might occur due to appreciation in a person as role model or idle, impressive events, notable situations, impressive environment, media perceived such as movies, book, magazine, and internet (Thiengkamol, 2009a, Thiengkamol, 2009b, Thiengkamol, 2011a, & Thiengkamol, 2011e).
Regarding to environmental conservation behavior for hospital, therefore the workers in hospital should have actual knowledge and understanding, awareness, positive attitude, public consciousness and responsibility for conservation behavior. They should be trained and practiced in accordance with appropriate Environmental Management System based on their inspirations, the success of hospital environment management will be occurred effectively. Therefore, the research will be studied on development of causal relationship model hospital environmental conservation with integration of environmental education and hospital environmental management affecting through inspiration of public consciousness for environmental conservation to environmental conservation behaviors for workers of Roi-ed Thonburi Hospital, it might lead to good environmental quality for hospital, community and society as whole.
2.Objective The objective of this research was to develop a causal relationship model of hospital environmental management in Roi-Et Province. 3. Methodology The research design was implemented in steps by step as follows: The populations were 270 workers of Roi-ed Thonburi Hospital in Northeastern region of Thailand. The populations of 270 workers were used as sample group. The research instrument was the questionnaire and it was used for data collection. LISREL was used for model verification. The content and structural validity were determined by Item Objective Congruent (IOC) with 5 experts in the aspects of environmental education, psychology, social science and social research methodology. The reliability was done by collecting the sample group from 30 workers from another hospital in Roi-ed Province that is a private hospital nearby Roi-ed Thonburi Hospital. The reliability was determined by Cronbach's

ISSN 2039-9340 Mediterranean Journal of Social Sciences Vol. 3 (11) November 2012
450
Alpha. The reliability of environmental education, hospital environmental management, inspiration of public mind, and environmental behaviors, and the whole questionnaire were 0.970, 0.983, 0.976, 0.983 and 0.989 respectively. The descriptive statistics used were frequency, percentage, mean and standard deviation. The inferential statistics used was LISREL by considering on Chi-Square value differs from zero with no statistical significant at 0.05 level or Chi-Square/df value with lesser or equal to 2, P-value with no statistical significant at 0.05 level and RMSEA (Root Mean Square Error Approximation) value with lesser than 0.05 including index level of model congruent value, GFI (Goodness of Fit Index) and index level of model congruent value, AGFI (Adjust Goodness of Fit Index) between 0.9-1.00.
4. Results 4.1 General Characteristics of Sample Group The populations of 270 workers of Roi-ed Thonburi Hospital, were used as sample group. Most of them were female with 76.67% and had age with mean of 33.00 years. Majority of them were Administrator and Assistant with 34.44% and their education level at Lower Secondary School or Lower with 41.11%. Their average work duration was 7.11 years. Most of them had marriage status with 55.19%, their average income with 10,755.64 Bahts as presented in table1. Table 1 Demographic Characteristics of Sample Group
Characteristics of Sample Group Workers of Roi-ed Thonburi Hospital
Number Percent Sex Male Female
63 207
23.33 76.67
Age Mean=33.00 years SD.=4.51
Position Nurse Nurse Aid Patient Aid Technologist and Assistant Pharmacist and Assistant Nutritionist and Assistant Administrator and Assistant
40 24 65 17 10 21 93
14.82 8.89 24.07 6.30 3.70 7.78 34.44
Educational Level Lower Secondary School or Lower Diploma Bachelor Higher than bachelor
111 71 86 2
41.11 26.30 31.85 0.74
Work Duration Mean = 7.11 years SD=2.56 years
Characteristics of Sample Group Workers of Roi-ed Thonburi Hospital
Number Percent Status Single Marriage Widowhood Separated
104 149 8 9
38.52 55.19 2.96 3.33
Income per month = 10,755.64 Bahts
Total 270 100

ISSN 2039-9340 Mediterranean Journal of Social Sciences Vol. 3 (11) November 2012
451
4.2 Confirmatory factors Analysis of Exogenous Variables 1) Confirmatory factors Analysis of Exogenous Variables of Environmental Education (EE) Confirmatory factors of EE had Bartlett’s test of Sphericity of 776.612 statistically significant level (p< .01) and Kaiser–Mayer–Olkin Measure of Sampling Adequacy/MSA) of 0.732. This indicated that components of EE aspect had proper relationship at good level and it can be used for analysis of confirmatory factors as shown in picture 1 and table 2. Picture 1: Model of Confirmatory factors of Environmental Education Table 2 Results of Analysis of Confirmatory factors of Environmental Education
Components of Environmental Education Weight SE t 2R X1 Knowledge and Understanding 0.79 0.099 7.97** 0.24 X2 Environmental Attitude 0.44 0.026 16.59** 0.77 X3 Environmental Awareness 0.46 0.028 16.18** 0.74 X4 Environmental Responsibility 0.39 0.035 11.16** 0.41 X5 Environmental Public Mind 0.40 0.038 10.54** 0.38 Chi-square = 4.35 df = 4 P = 0.36116 GFI = 0.99 AGFI = 0.98 RMSEA = 0.018 RMR =0.011
** Statistically significant level of .01 From picture 1 and table 2, results of analysis of confirmatory factors of EE from 5 observed variables was revealed that the model was congruent to empirical data by considering from 1) Goodness of Fit Index (GFI) equaled to 0.99 and Adjust Goodness of Fit Index (AGFI) equaled to 0.98 2) Root Mean Square Error of Approximation (RMSEA) equaled to 0.000 (RMSEA < 0.05) and 3) Chi- Square value had no statistically significant at level of .01 and degree of freedom was lesser than or equaled to .05 ( 00.5/2 ≤dfχ ). Considering on loading weight of observed variables in model, it was revealed that observed variables had loading weight with 0.39 to 0.79 and had covariate to model of Environmental Education with 24.00 to 77.00 percents.
X1 2.03
X2 0.06
X3 0.07
X4 0.22
X5 0.27
EE 1.00
Chi-Square=4.35, df=4, P-value=0.36116, RMSEA=0.018
0.79
0.44
0.46
0.39
0.40
0.18

ISSN 2039-9340 Mediterranean Journal of Social Sciences Vol. 3 (11) November 2012
452
2. Confirmatory factors Analysis of Exogenous Variables of Hospital Environmental Management (EM) Confirmatory factors of EM had Bartlett’s test of Sphericity of 1604.346 statistically significant level (p< .01) and Kaiser–Mayer–Olkin Measure of Sampling Adequacy/MSA) of 0.781. This indicated that components of Environmental Management (EM) aspects had proper relationship at good level and it can be used for analysis of confirmatory factors as shown in picture 2 and table 3. Picture 2: Model of Confirmatory factors of Hospital Environmental Management Table 3 Results of Analysis of Confirmatory factors of Hospital Environmental Management
Components of Hospital Environmental Management Weight SE t 2R X6 Energy Conservation 0.45 0.033 13.84** 0.63 X7 Waste Water Management 0.53 0.035 15.00** 0.69 X8 Waste Management 0.55 0.042 13.18** 0.56 X9 Arrangement of Green Area 0.53 0.034 15.43** 0.74 X10 Safety Management 0.47 0.041 11.33** 0.48 Chi-square = 1.48 df = 1 P = 0.22437 GFI =1.00 AGFI =0.97 RMSEA = 0.042 RMR =0.0033
** Statistically significant level of .01 From picture 2 and table 3, results of analysis of confirmatory factors of Environmental Management (EM) from 5 observed variables was revealed that the model was congruent to empirical data by considering from 1) Goodness of Fit Index (GFI) equaled to 1.00 and Adjust Goodness of Fit Index (AGFI) equaled to 0.97 2) Root Mean Square Error of Approximation (RMSEA) equaled to 0.000 (RMSEA < 0.05) and 3) Chi- Square value had no statistically significant at level of .01 and degree of freedom was lesser than or equaled to .05 ( 00.5/2 ≤dfχ ). Considering on loading weight of observed variables in model, it was revealed that observed variables had loading weight with 0.45 to 0.55 and had covariate to model of Environmental Management (EM) with 56.0 to 74.0 percents. 4.3 Confirmatory Factors Analysis of Endogenous Variables Results of Confirmatory Factors Analysis of Endogenous Variables of Inspiration of Public Consciousness influencing to Environmental Behaviors for Sustainable Development, was revealed as followings.
X6 0.12
X7 0.12
X8 0.23
X9 0.10
X10 0.24
EM 1.00
Chi-Square=1.48, df=1, P-value=0.22437, RMSEA=0.042
0.45
0.53
0.55
0.53
0.47
0.02
0.13
0.02
0.06

ISSN 2039-9340 Mediterranean Journal of Social Sciences Vol. 3 (11) November 2012
453
1) Confirmatory Factors Analysis of Endogenous Variables of Inspiration of Public Consciousness (PM) Confirmatory Factors of Inspiration of Public Consciousness (PM) had Bartlett’s test of Sphericity of 878.356 statistically significant level (p< .01) and Kaiser–Mayer–Olkin Measure of Sampling Adequacy/MSA) of 0.838. This indicated that components of Public Consciousness (PM) aspect had proper relationship at good level and it can be sed for analysis of confirmatory factors as shown in picture 3 and table 4. Picture 3: Model of Confirmatory factor of Inspiration of Public Consciousness Table 4 Results of Analysis of Confirmatory factors of Inspiration of Public Consciousness
Confirmatory factors of Inspiration of Public Consciousness Weight SE t 2R Y5 Person as Role Model 0.72 0.040 18.26** 0.83 Y6 Impressive Event 0.80 0.048 16.83** 0.74 Y7 Impressive Environment 0.61 0.044 13.94** 0.58 Y8 Media Receiving 0.66 0.046 14.55** 0.60
Chi-square = 0.00 df = 0 P = 1.0000 GFI = 1.00 AGFI = 1.00 RMSEA = 0.000 RMR = .0000
** Statistically significant level of .01 From picture 3 and table 4, results of analysis of confirmatory factors of PM from 4 observed variables was revealed that the model was congruent to empirical data by considering from 1) Goodness of Fit Index (GFI) equaled to 1.00 and Adjust Goodness of Fit Index (AGFI) equaled to 1.00 2) Root Mean Square Error of Approximation (RMSEA) equaled to 0.000 (RMSEA < 0.05) and 3) Chi- Square value had no statistically significant at level of .01 and degree of
freedom was lesser than or equaled to .05 and 00.5/2 ≤dfχ . Considering on loading weight of observed variables in model, it was revealed that observed variables had loading weight with 0.61 to 0.80 and had covariate to model of Inspiration of Public Consciousness (PM) with 58.00 to 83.00 percents. Confirmatory Factors Analysis of Endogenous Variables of Environmental Behaviors Confirmatory Factors of Environmental Behaviors (CB) had Bartlett’s test of Sphericity of 537.564 statistically significant level (p< .01) and Kaiser–Mayer–Olkin Measure of Sampling Adequacy/MSA) of 0.824. This indicated that components of CB aspect had proper relationship at good level and it can be used for analysis of confirmatory factors as shown in picture 4 and table 5.
Y6 0.10
Y7 0.22
Y8 0.27
Y9 0.29
PM 1.00
Chi-Square=0.00, df=0, P-value=1.00000, RMSEA=0.000
0.72
0.80
0.61
0.66
0.04
0.18

ISSN 2039-9340 Mediterranean Journal of Social Sciences Vol. 3 (11) November 2012
454
Picture 4: Model of Confirmatory factors of Environmental Conservation Behaviors (CB) Table 5 Results of Analysis of Confirmatory factors of Environmental Conservation Behaviors
Confirmatory factors of Environmental Conservation Behaviors Weight SE t 2R Y1 Waste Management Behavior 0.65 0.045 14.58** 0.63 Y2 Water Conservation Behavior 0.63 0.041 15.30** 0.68 Y3 Recycling Behavior 0.52 0.041 12.83** 0.54 Y4 Energy Conservation Behavior 0.64 0.045 14.09** 0.61 Y5 Traveling Behavior 0.64 0.045 14.09** 0.61 Chi-square = 0.08 df = 1 P = 0.77356 GFI = 1.00 AGFI = 1.00 RMSEA = 0.000 RMR = 0.0011
** Statistically significant level of .01 From picture 4 and table 5, results of analysis of confirmatory factors of Environmental Conservation Behaviors (CB) from 5 observed variables was revealed that the model was congruent to empirical data by considering from 1) Goodness of Fit Index (GFI) equaled to 1.00 and Adjust Goodness of Fit Index (AGFI) equaled to 1.00, 2) Root Mean Square Error of Approximation (RMSEA) equaled to 0.000 (RMSEA < 0.05) and 3) Chi- Square value had no statistically significant at level of .01 and degree of freedom was lesser than or equaled to .05 and
00.5/2 ≤dfχ . Considering on loading weight of observed variables in model, it was revealed that observed variables had loading weight with 0.52 to 0.65 and had covariate to model of Environmental Conservation Behaviors with 54.00 to 68.00 percents. 5. Results of Effect among Variables in Model in Terms of Direct and Indirect Effect 5.1 Confirmatory factors of Environmental Education (EE) and Hospital Environmental Management (EM) had direct
Y1 0.35
Y2 0.29
Y3 0.17
Y4 0.19
Y5 0.53
CB 1.00
Chi-Square=0.09, df=2, P-value=0.95634, RMSEA=0.000
1.06
0.77
0.85
0.68
0.47
-0.13
0.10
0.08

ISSN 2039-9340 Mediterranean Journal of Social Sciences Vol. 3 (11) November 2012
455
effect to Inspiration of Public Consciousness (PM) with statistically significant at level of .01 with effect of 0.17 and 0.44.. Moreover, Environmental Education (EE) and Hospital Environmental Management (EM) had direct effect to Environmental Conservation Behaviors (CB) with statistically significant at level of .01 with effect of -0.13 and 0.17. In addition, confirmatory factors in aspect of Environmental Education (EE) and Hospital Environmental Management (EM) had indirect effect to Environmental Conservation Behaviors (CB) with statistically significant at level of .01 with effect of --0.09 and 0.23. 5.2 Confirmatory factors of Inspiration of Public Consciousness (PM) had direct effect to Environmental Conservation Behaviors (CB) with statistically significant at level of .01 with effect of .51. Considering on structural model confirmatory factors of Environmental Education (EE) and Hospital Environmental Management (EM) were able to explain the variation of endogenous factors of Inspiration of Public Consciousness (PM) to caused Environmental Conservation Behaviors (CB) with 72.00 percents. As a result, the equation 1 can be written as following. CB = 0.51*PM - 0.13*EE + 0.34*EM ………………………………(1) R2 = 0.72 Equation (1) factors that had the most effect to Environmental Conservation Behaviors (CB) was Inspiration of Public Consciousness (PM) and subsequences were Hospital Environmental Management (EM) and Environmental Education (EE) with negative direction, these were able to explained the variation of Environmental Conservation Behaviors (CB) with 72.00 percents Moreover, confirmatory factors of Environmental Education (EE) and Hospital Environmental Management (EM) were able to explain the variation of confirmatory factors of Inspiration of Public Consciousness (PM) with 63.00 percents. Therefore, the equation can be written as following equation 2.
PM = 0.17*EE + 0.44*EM …………………………..…………….(2) R2 = 0.63 Equation (2) factors that had the most effect to was Inspiration of Public Consciousness (PM) and subsequences were Hospital Environmental Management (EM) and Environmental Education (EE), these were able to explained the variation of Inspiration of Public Consciousness (PM) with 63.00 percents Picture 5: Model of Direct and Indirect Effect of EE and EM through PM Influencing to CB
X12.26
X20.12
X30.14
X40.16
X50.13
X60.11
X70.10
X80.13
X90.12
X100.26
EE €
EM €
CB \
PM €
Y1 -0.10
Y2 0.43
Y3 0.33
Y4 0.06
Y5 0.30
Y6 0.08
Y7 0.25
Y8 0.20
Y9 0.30
Chi-Square=208.53, df=118, P-value=0.00000, RMSEA=0.043
1.40
-0.47
0.64
0.71
0.72
0.63
0.71
0.74
0.62
0.61
0.62
0.36
0.37
0.46
0.54
0.47
0.55
-0.62
1.16
0.51
0.45
0.51
-0.13
0.34
0.17
0.44
0.15-0.34
-0.28
-0.08
-0.11
0.08
-0.050.10
0.14
0.13
0.11
0.07
-0.03
-0.02
0.09
0.05
0.05
0.04
0.060.11
0.13
-0.03
0.10
0.01
-0.02
0.08

ISSN 2039-9340 Mediterranean Journal of Social Sciences Vol. 3 (11) November 2012
456
6. Discussion The findings indicated that EE had direct influencing to inspiration of public consciousness and environmental conservation behaviors with highly statistically significant at level of .01 with effect of -0.13 and 0.17. Moreover, when considering on prediction of correlation of observed variables of Knowledge and Understanding (X1), Environmental Awareness (X3), Environmental Attitude (X2), Environmental Public Mind (X5), and Environmental Responsibility (X4), can predict the EE rather high with 0.79, 0.46, 0.44, 0.40, and 0.39 respectively. These were congruent to different studies of Thiengkamol and her colleagues (Thiengkamol, 2004, Thiengkamol, 2005a, Thiengkamol, 2011a, Thiengkamol, 2011g, Thiengkamol, 2011i, Thiengkamol, 2012a, Thiengkamol, 2012b, Thiengkamol, 2012c, Jumrearnsan, & Thiengkamol, 2012, Dornkornchum, et al, 2012a, Gonggool, et al, 2012b, Ngarmsang, et al, 2012b, Pimdee, et al, 2012a, Ruboon, et al, 2012a, and Waewthaisong, et al, 2012a) that the results illustrated that inspiration of public consciousness would inspire workers of Roi-ed Thonburi Hospital to perform better environmental conservation behaviors whether Waste Management Behavior (Y1),
Water Conservation Behavior (Y2), Recycling Behavior (Y3), Energy Conservation (Y4) Behavior, and Traveling Behavior (Y5), if they had real practice through environmental conservation with inspiration of public consciousness. Moreover, hospital environmental management activity such as energy and water conservation through daily life practice for electrical and pipe water conservation, waste management based on waste recycling concept in hospital also lead to good practice of environmental conservation behavior for sustainable development.
Consequently, EM had direct influencing to inspiration of public consciousness and environmental conservation behaviors with highly statistically significant at level of .01 with effect of 0.34 and 0.44. Additionally, when considering on prediction of correlation of observed variables of Energy Conservation (X6), Waste Water Management (X7), Waste Management (X8), Arrangement of Green Area (X9), and Safety Management (X10) can predict the EM rather high with 0.45, 0.53, 0.55, 0.53, and 0.47 respectively. These were congruent to different studies of Thiengkamol and her colleagues (Thiengkamol, 2004, Thiengkamol, 2005a, Thiengkamol, 2011b, Thiengkamol, 2011g, Thiengkamol, 2011i, , Thiengkamol, 2011j, Thiengkamol, 2012c, Thiengkamol, 2012d, Gonggool, et al, 2012b, Ngarmsang, et al, 2012b, and Pimdee, et al, 2012a).
Moreover, Inspiration of Public Consciousness (PM) had direct effect to Environmental Conservation Behaviors (CB) with statistically significant at level of .01 with effect of .51. Particularly, when considering on prediction of correlation of observed variables of Person as Role Model (Y5), impressive Event (Y6), Impressive Environment (Y7), and Media Receiving (Y8), can predict the PM rather high with 0.72, 0.80, 0.61, and 0.66 respectively, these results are pertinent to numerous studies of Thiengkamol, and her colleagues (Thiengkamol, 2011i, Thiengkamol, 2011j, Thiengkamol, 2012c, Thiengkamol, 2012d, , Dornkornchum, and Thiengkamol, 2012, Dornkornchum, et al, 2012a, Gonggool, et al, 2012b, Ngarmsang, et al, 2012b, Ruboon, et al, 2012a, Pimdee, et al, 2012, and Waewthaisong, et al, 2012a).
However, it might be concluded that EE observed from observed variables of Environmental Attitude (X1), Knowledge and Understanding (X2), Environmental Awareness (X3), Environmental Responsibility (X4) and Environmental Public Mind (X5), and EM observed from observed variables of Energy Conservation (X6), Waste Water Management (X7), Waste Management (X8), Arrangement of Green Area (X9), and Safety Management (X10) can influence through Inspiration of Public Consciousness (PM) composing of Person as Role Model (Y5), impressive Event (Y6), Impressive Environment (Y7), and Media Receiving (Y8), to Environmental Conservation Behavior (CB) that included Waste Management Behavior (Y1), Water Conservation Behavior (Y2), Recycling Behavior (Y3), Energy Conservation (Y4) Behavior, and Traveling Behavior (Y5). Therefore, the model of EE and EM influencing through PM to CB was verified the proposed model was fitted with all observed variables according to criteria of Chi-Square value differs from zero with no statistical significant at .01 level or Chi-Square/df value with lesser or equal to 2, P-value with no statistical significant at .01 level and RMSEA (Root Mean Square Error Approximation) value with lesser than 0.05 including index level of model congruent value, GFI (Goodness of Fit Index) and index level of model congruent value, AGFI (Adjust Goodness of Fit Index) between 0.90-1.00.
Lastly, Environmental Conservation Behavior (CB) comprised 6 observed variables Waste Management Behavior (Y1), Water Conservation Behavior (Y2), Recycling Behavior (Y3), Energy Conservation (Y4) Behavior, and Traveling Behavior (Y5) in this study were modified from Environment Management System (EMS) concepts and environmental education principles to investigate the factors that will affect through inspiration of public consciousness of Thiengkamol concept that is in the with her and her colleagues studies (Wattanasaroch, & Thiengkamol, 2012, and Thiengkamol, 2009a, Thiengkamol, 20098b, &Thiengkamol, 2011h). Therefore, to understand these factors are able to use for hospital environmental management though integration of environmental education and Environment Management System (EMS) for every hospital in Thailand.

ISSN 2039-9340 Mediterranean Journal of Social Sciences Vol. 3 (11) November 2012
457
References
Arunsrimorakot, S. (2005). Development of Document of Environmental Management ISO14001: 2004 for Industrial Factory. Faculty of
Environment and Resource Studies. Mahidol Unviversity, Nakhon Prathom Province. Cannella, G. and Kincheloe., J.L. (2002). Kidworld: Childhood Studies, Global Perspectives, and Education. New York: Peter Lang. Charoensilpa, D., Thiengkamol, N., Thiengkamol, C., and Kurokote, J. (2012). Development of Environmental Education
Characteristics. Journal of the Social Sciences. 7 (2):71-76. Dornkornchum, S. and Thiengkamol, N. (2012). Model of Environmental Education and Psychological State Affecting to Global Warming
Alleviation. International Proceedings of Economic Development and Research, 44, 1-5. Dornkornchum, S. Thiengkamol, N., & Thiengkamol, C. (2012a). Causal Relationship Model of Environmental Conservation Behavior
Integrated with LCA Knowledge. European Journal of Social Sciences, 33 (1):5-16. Gonggool, D., Thiengkamol, N., & Thiengkamol, C. (2012b). Development of Environmental Education Volunteer Model through
Inspiration of Public Consciousness for Sustainable Development. European Journal of Social Sciences, 32 (1):150-160. Ketuman, P. (2007). Adolescent Development. Retrieved from: http://www.psyclin.co.th/new_page_56.htm on 9 September 2011. Mahasarakham University. (2012). Going Green. Retrieved from http://www.inter.msu.ac.th/ Ngarmsang, K., Thiengkamol, N., & Thiengkamol, C. (2012b). Development of an Environmental Education and Environmental
Management Model for Learning Disability Student. European Journal of Social Sciences, 32 (1):120-127. Office of the United Nations Higher Commissioner for Human Rights. (2012). Convention on the Rights of the Child. Retrieved
fromhttp://www2.ohchr.org/english/law/crc.htm Pimdee, P., Thiengkamol, N., & Thiengkamol, T. (2012a). Causal Relationship Model of Electrical Energy Conservation. European
Journal of Social Sciences, 32 (3):306-315. Ruboon, O., Thiengkamol, N, Thiengkamol, T, & Kurukodt, J. (2012a). Model of Environmental Education Teacher with Inspiration of
Environmental Conservation for Global Warming Alleviation. European Journal of Social Sciences, 31 (1):92-102. Thiengkamol, N. (2004). Development of A Learning Network Model for Energy Conservation. A Thesis Doctor of Education
(Environmental Education) Faculty of Graduate Studies, Mahidol University. Thiengkamol, N. (2005a). Strengthening Community Capability through The Learning Network Model for Energy Conservation. Journal
of Population and Social Studies, Volume14, Number1, July 2005. Thiengkamol, N. (2009a). The Great Philosopher: the Scientist only know but Intuition is Lord Buddha. Bangkok: Prachya Publication. Thiengkamol, N. (2009b). The Happiness and the Genius can be created before Born. Bangkok: Prachya Publication. Thiengkamol, N. (2011a). Holistically Integrative Research. Published 2nd Edition. Bangkok: Chulalongkorn University Press. Thiengkamol, .N. (2011e). Environment and Development Book 1. Published 4th Edition. Bangkok: Chulalongkorn University Press. Thiengkamol, N. (2011g). Development of Energy Security Management for Rural Community. Canadian Social Science, 7 (5), October
31, 2011. Thiengkamol, N. (2011i). Development of Model of Environmental Education and Inspiration of Public Consciousness Influencing to
Global Warming Alleviation. European Journal of Social Sciences, 25 (4):506-514. Thiengkamol, N. (2011j). Model of Psychological State Affecting to Global Warming Alleviation. Canadian Social Science, 7 (6):89-95,
December 31, 2011. Thiengkamol, .N. (2012a). Development of A Prototype of Environmental Education Volunteer. Journal of the Social Sciences, 7 (1):77-
81. Thiengkamol, N. (2012b). Development of Food Security Management for Undergraduate Student Mahasarakham University. European
Journal of Social Sciences, 27 (2):246-252. Thiengkamol, N. (2012c). Model of Psychological Trait Affecting to Global Warming Alleviation. European Journal of Social Sciences, 30
(3) : 484-492. Waewthaisong, S. Thiengkamol, N., & Thiengkamol, C. (2012a). Development of Environmental Traveling Behavior Model through
Inspiration of Public Mind for Global Warming Alleviation. European Journal of Social Sciences, 33 (1). Wikipedia. (2012). Child. Retrieved from http://en.wikipedia.org/wiki/Child


ISSN 2039-9340 Mediterranean Journal of Social Sciences Vol. 3 (11) November 2012
459
Kantian Notions of Feminine Beauty and Masculine Sublimity in
Hawthorne’s ‘The Birthmark’
Najmeh Hafezi (Corresponding Author)
MA in English Literature, Islamic Azad University-Arak Branch, Arak, Iran Address: Postal Code: 3713156635, Qom, Iran
Tel: +989381454192 Email: [email protected]
Dr. Moussa Ahmadian
Associate professor, Dept. of English Language and Literature, Faculty of Arts and Humanities, Arak University, Arak 38156-8-8349, PO Box: 879, Iran Tel: +98861313511 E-mail: [email protected]; [email protected]
Dr. Fazel Asadi Amjad
Associate professor, Dept. of English Language and Literature,
Faculty of Arts and Humanities, Khawrazmi University, Tehran, Iran Tel: +989127646512 Email: [email protected]; [email protected]
Doi:10.5901/mjss.2012.v3n11p459
Abstract: Hawthorne’s ‘The Birthmark’ is one of his short stories whose theme falls among the domain of experimenting human nature in the fields of art, religion, and science. Regardless of the birthmark itself which represents the Original Sin, a conflict between masculine attitude and feminine perspective toward perfection and beauty is artfully manifested in this story. The paper study employs the notions of the beautiful and the sublime according to Immanuel Kant’s Observations on the Feeling of the Beautiful and Sublime in which he puts forward the idea that different sexes possess different perceptions of events and environment. From his viewpoint, women are mostly capable to feel the beautiful and sympathy, while men, with their tendency to perfection, possess and convey the feeling of the sublime. Several events, disputes and descriptions in ‘The Birthmark’, clearly exemplify women’s zeal for beauty and men’s seeking the perfection. Hawthorne proves that oversensitivity to perfection and sublimity can be a destructive force for the beautiful. One should not defy nature to reconcile his or her internal desires. Within the quest to win perfection by means of limited power of science, the only winner is true love. Key Terms: the beautiful, the sublime, masculine, feminine, perfection
1. Introduction The idea about the differences between sexes goes far back to Plato who, like modern feminists, felt that women must be in action in society just like men. Plato, in his Republic, sees no fundamental difference between men and women. According to the Platonic perspective, “sex is relevant to the architecture of the ideal society on two counts: it is the means of producing new guardians, and it is emotionally charged and potentially divisive.” (Craik, 1990, p. 224) Several other opinions manifest female charm and male inclinations to it.
In many literary texts as well as the real life or even in children’s literature we witness men dealing with women’s attractiveness; perhaps, the first and the most familiar example is Milton’s expression, when Adam eats the apple “against his better knowledge, not deceived but fondly overcome with female charm.” (Milton, 1850, p. 407) There are several accounts as well throughout the world that illustrate feminine charm. Followers of various traditions, religions, and sects emphasize covering woman’s body or the face; observing the effect of feminine beauty over many thoughts and hearts, as well as masculine inclination to this feminine feature motivated rulers and lawmakers to define a specific type of clothing appropriate for women of those regions. Japanese layered kimonos, laced neckline and puffed sleeves of the

ISSN 2039-9340 Mediterranean Journal of Social Sciences Vol. 3 (11) November 2012
460
17th and 18th century European fashion, head covering of traditional sari in India, and various types of hijab1
God the Almighty says in the Quran (24/31) “they [women] should wear something to cover their hair, shoulders, neck and bosom”
used chiefly by Muslim women, all confirm such a belief.
2
Repeatedly, Kant refers to woman as the fair sex whose “figure in general is finer than male sex” (Kant, 2004, p. 76). She has more delicacy and gentleness in her traits. Woman has a powerful instinctive feeling for all that is beautiful, stylish, and ornamented. Even little girls like to dress up and use adornment. “They [women] love pleasantry and can be entertained by trivialities if only these are merry and laughing.” (Kant, 2004, p. 77); this sentence of Kant reminds us of the characteristics of comedy which is pleasant and causes laughing. Woman tries to keep modesty, and knows how to give herself a fine deportment and be self- possessed in very early ages. Woman has the chief reason in human nature for the distinction of the beautiful features with the noble, and she does “refine even the masculine sex” (Kant, 2004, p.
. On the other hand, numerous theorists and philosophers have talked and written of men’s zeal for ultimate perfection and sublimity. At least, the various types of cosmetic surgeries, makeup artists, and the manufacturers of cosmetic products prove such ideas. A similar notion is elaborated in Nathaniel Hawthorne’s short story ‘The Birthmark’. In this story, Hawthorne portrays the quest between the anxiety about the beauty and the zeal for sublimity. The beautiful and the sublime are a pair of aesthetic concepts about which some philosophers and critics pointed out their opinions. Immanuel Kant (1724- 1804) is one of those philosophers who, in detail, expressed his perspective about the beautiful and the sublime.
In 1764 Kant wrote a treatise on aesthetics and titled Observations on the Feeling of the Beautiful and Sublime (OBS). This book contains four ‘sections’, each of which defines the feeling of the beautiful and the feeling of the sublime from a diverse point of view. During the first section, Kant presents a general attitude toward finer feelings and divides them into two categories of the beautiful and the sublime. The former charms, while the latter moves. Kant, in the second section, indicates that only those people are capable to feel the beautiful or the sublime who are truly virtuous; that is, in their feeling, thought, and action, they attend specific principles. In this regard, the idea of four human temperaments including melancholy, sanguine, choleric and phlegmatic emerge; however, the core focus of the present study lies upon section three which talks about the diversity of perception of the finer feelings between different sexes. In the Kantian perspective, with their tendency to sympathy and adornment, women symbolize the feeling of the beautiful; on the other hand, since men’s deeds accord more with the principles, and the nobility of their behavior rises higher than that of women, they are capable of the feeling of the sublime. Eventually, through section four, Kant expresses national characteristics which influence the perception of the finer feelings. 2. Background Although the third section of OBS must contain the characteristics of both woman and man in perceiving the finer feelings, in OBS, Kant mostly pays attention to the attributes of women and enumerates their features to feel beautiful. Generally, Kant explains that woman is capable of the feeling of the beautiful, and man for that of sublime; however, Kant does not mean that:
“Woman lacks noble qualities, or that the male sex must do without beauty completely. On the contrary, one expects that a person of either sex brings both together, in such a way that all the merits of a woman should unite solely to enhance the character of the beautiful, which is proper reference point; on the other hand, among the masculine qualities the sublime clearly stands out as the criterion of his kind. All judgments of the two sexes must refer to these criteria, those that praise as well as those that blame;” (Kant, 2004, pp. 76- 77).
When it comes to matrimonial issues, the true virtue of nature and its principles demand a man to “become more perfect as a man, and a woman as a wife” (Kant, 2004, P. 95). The drives of the sexual preference act in accordance with the handbook of nature, hence more to ennoble the man and to beautify the woman. The unified couple must build a single moral character, which is full of life and “governed by the understanding of the man and the taste of the woman” (Kant, 2004, p. 95).
1 As a general term, hijab is covering body (and hair for women) by a type of cloth to prevent the drives of opposite sex in public and to protect dignity. In many regions such as North & West Africa, Middle East and East Asia, women cover their hair, and sometimes their faces in public. Covering the face is mostly popular in Arab nations. Despite various prohibitions, hijab, in recent decades, has been getting more popular among Muslims in European countries such as France, Spain, and Denmark. Hijab is not only personalized to women, but men also should wear in a reasonable way. 2 Quran, Surah Noor, Verse 32 " "واليضربن بخمرهن علی جيوبهن

ISSN 2039-9340 Mediterranean Journal of Social Sciences Vol. 3 (11) November 2012
461
77). This notion reminds us of Imam Khomeini’s famous statement saying that man ascents to the heavens from woman’s lap. Kant admits that a woman has just the same understanding that man holds, yet in a beautiful form. Then he follows to assert that since woman’s nature is so delicate and her “unconstrained charms should show nothing else than a beautiful nature” (Kant, 2004, p. 78), deep rumination and arduous learning ruin her merits of beauty and delicacy. A woman observes virtue beautifully; she hardly acts on the basis of principles, and her reason for preventing evil deeds is not for they are wrong, but more because they seem ugly to her.
Age is “the great destroyer of beauty” and “threatens all these charms” (Kant, 2004, p. 92). Gradually, beauty fades, and sublimity and nobleness take its place. As age shrinks beauty and charms, it is proper to women to start studying and educating themselves. But Kant observes justice and shifts his statements to man as well.
Speaking about men, Kant calls them the noble sex. Man is capable to feel noble and sublime. In fact, these are the merits of his sex. At an early age that women become aware of observing dignity, “well- bred male youth is still unruly, clumsy, and confused” (Kant, 2004, p. 77). The understanding of men is ‘deep’ and it indicates identity with the noble and sublime. Ruthless difficulties arouse approval and belong to the attributes of the sublimity of men. The virtue “of the male sex should be a noble virtue” (Kant, 2004, p. 81). Here, Kant deliberately and delicately advises men; Kant does not agree with a man who makes his wife aware of his intention to risk his destiny on behalf of his friend; because, he must not “fetter her merry talkativeness by burdening her mind with a weighty secret whose keeping lies solely upon him” (Kant, 2004, pp. 81- 82). Kant does not permit men to “weep other than magnanimous tears” (Kant, 2004, p. 82). Compared to the sublime, nothing is much more inferior than the ridiculous; nothing can be more insulting to a man than considering him as a ‘fool’ as it opposes sublimity. 3. The Analysis The primary concept that draws our attention in terms of sexuality in ‘The birthmark’ is the unconscious awareness of every masculine creature of feminine tendency to adornments and decoration. Aylmer, the scientist-husband of ‘The Birthmark’, similar to a male peacock that extends its tail to win its purposed female, clears “his fine countenance from the furnace smoke”, washes “the stain of acids from his fingers” and persuades “a beautiful woman to become his wife.” (Hawthorne, 1982, p. 836) Aylmer is a scientist and this matter intensifies his ardent interest in perfection and sublimity. Yet, in such a context, besides beautiful qualities, he expects sublime and flawless features of his wife; that is, the exact mistake which gradually leads their love and life to failure.
Aylmer’s terrible feeling to the birthmark begins just “soon after their marriage” (Hawthorne, 1982, p. 764). In general, men’s prejudice or some similar feeling keep them introvert about the most important issues that may engage their mind, otherwise, the necessity of the matter rises so high that it appears physically or even in remarks as Aylmer says to Georgiana “Has it never occurred to you that the mark upon your cheek might be removed?” (Hawthorne, 1982, p. 764) This is the first expression of Aylmer in which, for the first time, his search of perfection manifests itself clearly. Georgiana, on the other hand, is unable to believe his point of view, because all her memory tells her about the affection of the lovers and bachelors who called it “magic endowment” and:
“Masculine observers, if the birthmark did not heighten their admiration, contented themselves with wishing it away, that the world might possess one living specimen of ideal loveliness without the semblance of a flaw”. (Hawthorne, 1982, p. 765)
Accordingly, Georgiana’s mind comes across a paradox. Who is right? People or Aylmer? Also, Aylmer has “discovered that this [the birthmark] was the case with him” (Hawthorne, 1982, p. 766) after marriage. Does this mean that his idea about Georgiana’s beauty, before their union, has been as well as other men? What should she do? Does she have to accept the idea of her husband who is the only love of her life, or remain on her present status? For her feminine sympathy and good-heartedness, she decides to agree her husband and remove the fatal hand at any cost “I know not what may be the cost to both of us to rid me of this fatal birthmark. Perhaps its removal may cause cureless deformity; or it may be the stain goes as deep as life itself…” (Hawthorne, 1982, p. 768).
This remark and the following one clearly illustrate that Georgiana has deeply hurt of Aylmer’s attitude toward the defect that the birthmark has put on her beauty. Her aesthetic and long- lived beautified esteem are shrunk, thus she is strongly determined to remove the mark. “"If there be the remotest possibility of it," continued Georgiana, "let the attempt be made at whatever risk. Danger is nothing to me; …either remove this dreadful hand, or take my wretched life!” (Hawthorne, 1982, p. 768).
What is a woman for, but to be beautiful? If there is no beauty, there is no life. With such an expression Georgiana is getting prepared for a kind of suicide; Hawthorne artistically proves Kantian belief that nothing could be more harmful for a woman than being said that she is not beautiful enough. On the other hand, with such words, Georgiana

ISSN 2039-9340 Mediterranean Journal of Social Sciences Vol. 3 (11) November 2012
462
demonstrates her absolute decision and confidence about removing the birthmark; however, she also doubts about the success of such experiment. In this regard, Aylmer faces an uneasy feeling of being not reliable and professional enough to perform it. Therefore, he has to ensure both Georgiana and himself:
“…doubt not my power. I have already given this matter the deepest thought--…Georgiana, you have led me deeper than ever into the heart of science. I feel myself fully competent to render this dear cheek as faultless as its fellow;” (Hawthorne, 1982, p. 768)
Since Aylmer is aware of the sensitivity of women and their sympathetic heart, he behaves gently with Georgiana. Hawthorne proves that sometimes sublimity can destroy beauty. There are some expressions in the story that demonstrate such notion. Georgiana is a masterpiece of Nature; Nature “permits us, indeed, to mar, but seldom to mend” (Hawthorne, 1982, p. 769). One other phrase that foreshadows destructive power of perfection is that Hawthorne calls it “abortive experiment”.
As any other man who is normally informed of the anxieties of the fair sex, Aylmer all the time attempts at creating an environment that influences Georgiana’s comfort; for instance, he does his best to create visual adornments in the apartment and make a beautiful context in which she can regain her ease and to get ready for the experiment. Meanwhile, Hawthorne portrays a beautiful relationship of the united couple. Many times, Aylmer and his wife try to be one soul that, as Kant says, bring both delicacy and dignity to their life, “So she poured out the liquid music of her voice to quench the thirst of his spirit. He then took his leave with a boyish exuberance of gayety, assuring her that her seclusion would endure but a little longer...” (Hawthorne, 1982, p. 775)
Georgiana belongs to those women who have an exaggerated sense of sympathy and their trust and loyalty to their husband influences their reason. Although Aylmer is in a number of ways informed of the possible risks of the experiment, Georgiana’s patience is over, and all she wants is to look as most beautiful as possible [or even impossible] in Aylmer’s eyes "And, Aylmer, I shall quaff whatever draught you bring me; but it will be on the same principle that would induce me to take a dose of poison if offered by your hand." (Hawthorne, 1982, p. 777) and then goes on to say “"Danger? There is but one danger--that this horrible stigma shall be left upon my cheek!" cried Georgiana. "Remove it, remove it, whatever be the cost, or we shall both go mad!"” (Hawthorne, 1982, p. 777)
So the story progresses with similar anxieties, tenderness, sympathies, and perfectionist attitudes; the fearsome moments that intensifies Aylmer’s fervor for removing the birthmark and reaching the sublime perfection, for purifying his soul of the fatal hand that reminds him of a probable sin or flaw in the past. Georgiana bears a fine comprehension of her husband’s feelings. Her part in matrimonial life is to carry peace and serenity to Aylmer, and the only way to perform it is removing the fatal birthmark. In this regard, however, she finds herself not strong enough to bear the birthmark a lifetime or to neglect it and endure carelessly; her life is destroyed ‘with’ the birthmark “…Were I weaker and blinder it might be happiness. Were I stronger, it might be endured hopefully. But, being what I find myself, methinks I am of all mortals the most fit to die.” (Hawthorne, 1982, p. 778). Aylmer, in response, raises a utopian idea which illustrates his ultimate zeal for sublimity; that is, “You are fit for heaven without tasting death!” (Hawthorne, 1982, p. 778)
Possibly, one reason for which Aylmer seeks perfection and purification of his soul in Georgiana’s perfection is because he finds no more flawless spirit than that of hers. If, in any other case, he was to purify his soul, he could repent of former flaws or search purification by means of his excellent science and creating a chemical substance for himself. Why, for instance, he does not try on perfectionizing his assistant, Aminadab, who is in no way man- like?! Hawthorne clears the answer through Aylmer’s words addressing Georgiana: “There is no taint of imperfection on thy spirit. Thy sensible frame, too, shall be all perfect.” (Hawthorne, 1982, p. 778)
Through such flattering expressions or whatever one may call them, the couple pace the last step to the birthmark removal; that is, preparing liquid by Aylmer and drinking it by Georgiana. She faints, and Aylmer begins to play his role to the end of the story as a man of science rather than a man of love and life. Hawthorne launches this idea through one moving and heart- breaking statement:
Aylmer sat by her side, watching her aspects with the emotions proper to a man the whole values of whose existence was involved in the process now to be tested. Mingled with this mood, however, was the philosophic investigation characteristic of the man of science. (Hawthorne, 1982, p. 779)
Aylmer’s part in these last paragraphs of the story is recording and writing down the results of his experiment which is already in touchstone. He does not allow any slightest symptom to escape; breaths, heartbeats, movements, color of her countenance and eventually, the birthmark. Among all his efforts to remove the fatal hand, there is but one, the easiest, that implicitly leads to success “Yet once, by a strong and unaccountable impulse he pressed it [the birthmark] with his lips. His spirit recoiled…” (Hawthorne, 1982, p. 779)

ISSN 2039-9340 Mediterranean Journal of Social Sciences Vol. 3 (11) November 2012
463
Hawthorne portrays the removal of the birthmark just after this expression. Perhaps he tends to say that true love with no malice or inclination to destruction is the only elixir of survival. Now, what happens as the result of the scientific experiment is devastation and death; Georgiana, with her deep feeling is inhaling the essence of death“… you have rejected the best the earth could offer. Aylmer, dearest Aylmer, I am dying!” (Hawthorne, 1982, p. 780) 4. Conclusion The closing sentence of Hawthorne’s ‘The Birthmark’ seems to be a proper opening for our conclusion: “He failed to look beyond the shadowy scope of time, and, living once for all in eternity, to find a perfect future in the present.” (Hawthorne, 1982, p. 780).
Both Aylmer and Georgiana are in search of the perfect form of what the Providence has put within their nature; that is, the masculine sublimity and the feminine beauty. Although both characters’ zeal for the beautiful and the sublime is natural for their sex, they are not aware of the destructive power of the ultimate perfection which is not tolerable by a limited creature such as human. Aylmer has learned to change, deform, and reform everything to what he desires. He is not able to understand the true nature of love that is to love whatever naturally is, not whatever should be or he wants to be; this is his exact fault in dealing with the birthmark.
He supposes his purification of soul solely in removing the birthmark; while his spirit recoils only after kissing it “by a strange and unaccountable impulse”. As the story suggests, the birthmark vanishes after this incident. But, is the tiny hand removed in reality, or is it only Aylmer’s vision who, unconsciously, found the eventual impulse of true love purifying his soul? One may consider the removal of the birthmark happening physically; as Aylmer’s servant, Aminadab’s “gross, hoarse chuckle” appears; however, he is a servant and even his happiness can be as a result of accomplishing his master’s command:
“Ah, clod! Ah, earthly mass!” cried Aylmer, laughing in a sort of frenzy, “You have served me well! Matter and spirit—earth and heaven—have both done their part in this! Laugh, thing of the sense! You have earned the right to laugh.” (Hawthorne, 1982, pp. 779-80)
We know not how long Aminadab has lived and worked in Aylmer’s laboratory; yet, it is clear that this passive creature’s state of being and living depends directly on Aylmer’s works and experiments. As a result, his exhibition of happiness can be one major that relates his progress of life to the laboratory as a place to live in. Aminadab’s happiness and laugh is under the authority of Aylmer; therefore, one can conclude that the birthmark is not truly removed, and it is Aylmer’s vision. One which Aminadab has no right but to obey whatever his master commands; even if Aylmer is sunk in daydreaming, Aminadab has to play a role in it and to make Aylmer believe it.
Georgiana’s wrong decision in removing the birthmark at any cost is one major element that makes a tragedy out of Hawthorne’s story. She is a woman, a really beautiful and charming one; at least, Hawthorne and the people of his story-town lead us to such perception. She has always encountered with the flattering and lovely expressions of men, and envy of women. Before Aylmer’s decision, Georgiana plays neutrally; instead of making him aware of the true beauty and charm that the Providence has put in her, she just intensifies Aylmer’s daydreaming. Perhaps the majority of women with their tender hearts would be influenced under such situations and cultivate dreams of their husbands. She was a wiser woman, Georgiana would prove her power of feminine beauty and could cure her husband’s abnormal enthusiasm for perfection and sublimity. As a woman, the worst that could be said against her is that something defects her beauty. Receiving such an opinion, particularly from her husband, is so grave to her. Thus, she decides to regain her perfect beauty, even if it puts her life in danger.
Georgiana’s lack of self esteem and Aylmer’s over confidence, leads the story to experimenting the fatal hand. None of the characters is able to moderate his or her passion and affection for perfection either in the form of the beauty or in the form of the sublime.
The birthmark faints only when Aylmer, although unexpectedly, moderates his enthusiasm for sublimity and bestows a true love’s kiss to the tiny hand. Hawthorne proves that Aylmer’s medicine is a poison to his wife’s life; and that, neither oversensitivity to beauty nor extra enthusiasm for sublime is the winner; the only champion is true love.

ISSN 2039-9340 Mediterranean Journal of Social Sciences Vol. 3 (11) November 2012
464
Bibliography Craik, E. (1990). (Ed.). Owls to Athens. Oxford University Press. Online. At: <http://users.ox.ac.uk/~jrlucas/libeqsor /platsex.html> Hawthorne, Nathaniel. (1982). Tales and Sketches. Ohio State University Press. Print. Kant, Immanuel. (2004). Observations on the Feeling of the Beautiful and Sublime. Trans: John T. Goldthwait. University of California
Press. Print. Milton, John. (1850). Paradise Lost. Ed. Rev. James Robert Boyd. A. S. Barnes & Co. Online. At http://books.google.com
/books?id=paradiselost

ISSN 2039-9340 Mediterranean Journal of Social Sciences Vol. 3 (11) November 2012
465
Evaluation, a Challenge for Successful Management of the Public Administration
Msc Marjana Lako
Ministry of Education and Science, Tirana, Albania
E-mail: [email protected], [email protected]
Prof Assoc Dr Alba Dumi ,
2Dean of graduated School “Ismail Qemali”Vlora University, Albania Email:[email protected]
Doi:10.5901/mjss.2012.v3n11p465
Abstract The evaluation of individual performance has always been an element for the motivation of the employees of the public administration and the increase of its performance. In this study there are efforts done to point out some problems of the evaluation of individual performance as a part of the organization’s culture, which affects the increase of efficiency and consists of the key for a successful management of the public administration. The concept of evaluation must be considered as a psycho-social and administrative process which has its own impacts on the motivation and performance of the public administration. The right relations between them, increase of the evaluation criteria, the combination of the evaluation of individual performance with the respective structure as a strong bond of evaluation and career, use of the method of self-evaluation, evaluation for your superior and your colleague, financial rewards etc, are not only the success of the administration but also guarantee a qualitative management. Keywords: Individual performance, challenges, strategic aims, institutions performance 1. Introduction In many countries of Europe the public sector is going through a deep reformation. The most important element of this reform in the public sector is the incentive related to the reformation of the public administration. This process is necessary to face the challenges and to have better services with few sources possible.
The public services are oriented by the input. The structures and the organizational procedures are created in order to involve the employees and need efforts and contribution from them. In the public service department the results are considered as a product of the efforts and staff's capacities. The requirement of these results is lead by an inspirational vision, which is a clear mission and has some strategic aims, and these aims are transformed in objectives which aim to improve the performance.
Improving performance, better services,time spent on the assignments realization, the responsibility and the effectiveness of the programs and public services, are very important to everybody, for the persons who offer these services and for the ones who receive it. But there are a lot of political, bureaucratic and technical hindrances that affect the performance of the Public Administration.
When the expected results are determined as an accomplishment of the citizen's needs, the implementation and the application of the performance standards serves as an instrument that makes the citizen feel better with the offered services by the state, local and central institutions. Here there are some profits from setting the performance standards:
- Higher probability to achieve the expected results by supporting the vision and the mission of the institution. - Helps in emplacing the work plans according to the objectives set before. - Helps in monitoring of the institutions performance. - Enables the institution to improve the service quality and the achievement scale.
The performance evaluation is a process that makes the employees reflect, discuss and change their working methods. During the process the individuals can change their working methods and there may be changes even in their behavior. At the institutional level the process enables the systematic collection of data about the individual's performance. The performance evaluation of the employees has two objectives:

ISSN 2039-9340 Mediterranean Journal of Social Sciences Vol. 3 (11) November 2012
466
First, administrative objectives. It gives information in setting the salary, promotions, firing, and assures the necessary documentation to verify decisions in juridical processes. Second, and maybe the main objective is the objective of the development. The information can be used to diagnose the needs for trainings, career planning etc. the feedback and the training based on the information of the evaluation assures the fundaments for constant performance improvement. (Robins & Couter, 1999) The performance evaluation is determined as an evaluation of the past and actual performance of an employee that works in accordance with the performance standards of the organization. The evaluation process includes: Setting the work standards. Evaluating the actual performance according to the standards. Gives the feedback at the employee in order to motivate him to diminish its feeblenesses. (Dessler 2000). Helps in the development of the Human Resources. Gives to the employees a more objective sight to understand if the institution progressed or not. More motivation to improve performance by giving information, by introducing new challenges and by evaluating the work that still needs to be done. Enables the leaders of the institution to develop a fair evaluation and to determine a plan that involves all the staff members. The staff members have anticipatory access in knowing the evaluation results. Despite the importance of the performance system evaluation there are some feeblenesses that can be manifested. The individual self-evaluation may be harmed. The process takes a lot of time. During the process the relationships between the employees may deteriorate and organizational conflicts may come out. The motivation levels may decrease for many reasons such as; no rewards for the low performance, unilateral evaluation and giving advantages to only some employees. Higher costs in trainings and support services. 2. Literature Review and Hypotheses The performance evaluation is a process related to the identification, evaluation and development of the performance of all the employees in the organization, in order to achieve effectively the objectives, and in the same time the process is in the behalf of the employees. It helps the employees in knowing, receiving feedback and offering work and career services.(Lansbury, 1988).
The performance evaluation is a managerial instrument that serves to the employees, leaders and managers. If it is done properly, the performance evaluation creates a culture of fairness continuous improvement and supports the standards. The system of the performance evaluation is important for the leaders and employees for these reasons: It is a method that needs the agreement of both parts and according to this it evaluates the progress of the employees. It strengths the continuous professional development for all the staff members.
The performance standards and the performance evaluation are the key points for a managerial system based on performance. 2.1 How is performance evaluated? An evaluation system is a very powerful managerial instrument which is decisive for the progress and the long-term development of an institution. It is fundamental for a system which is based on performance. Mainly it gives to the employees the necessary motivation to further improvements based on personal and institutional success. The actual evaluation system in the Albanian Public Administration functions as a system where the general structure matches with the modern opinion related to the evaluation, and the evaluation is based on objectives such as “fundamental skills” (competences). 2.2 The evaluation system is considered effective when the leaders Coordinate the institutional objectives with the objectives of the employees. Introduce to the employees challenging and achievable objectives.

ISSN 2039-9340 Mediterranean Journal of Social Sciences Vol. 3 (11) November 2012
467
Have the ability to communicate effectively the coordination between the needs of the employees and the institutional objectives. Develop the proper skills for the evaluation of the performance regarding the achievement of these objectives. Are fair and honest during the evaluation by not involving personal opinions and considerations that have no relation with the work. The Human Resources must use the data retrieved from the system for training needs, promotion, recognition and rewards. 2.3 An historical sight of the evalution system in Albania During the last decade the Albanian Public Administration is going under a reformation process, a process related with the political, economical and social changes.
At the beginning of the ’90 the role of the Albanian state was modernized, and was stimulated to economic improvement and to conceal social injustice. The new role of the state determined new obligations for the public, central and local administration. During this period the administration was nearly totally politicized and there were no clear divisions between the political and techno-professional functions. During this period the model of the political control was inappropriate and out of logic and it was still in the development phase.
During 1996-1999 the politicization of the administration ended and the administration was based on merits. The division between the political and techno-professional was clear. Several laws were approves; law no. 8095 in 21.03.96, “For the Civil Service in the Albanian Republic”, The Decision of the Minister's Council no.657 in 16.09.96 “For ethic rules in the public service”, law no. 8549 in 11.11.1999 “The status of the civil employee”. All this laws were approved during this period. The administration had the possibility to implement a different system, in the human resources management in all the central and local institutions. After DAP, the Institution of Training for the Public Administration was funded in order to give response to all the circumstances, opportunities and to the new challenges.
In 2000 was published the Instruction from the Council of Ministers no. 2 in 07.07.2000 “For the evaluation system of the individual annual achievements of the civil employees”.
In 2002-2006 the position of the General Secretary in each ministry was consolidated as a inter-mediator between the political and managerial levels. The performance evaluation was designed to evaluate the employees based on their work and the individual work descriptions in four levels. 3. Methodology and Research Goal The motivation of the employees was not related to the salary but with the expectations for the safety and the endurance of their position in the administration and also for trainings and qualifications. To avoid the lacks mentioned before, in 2007 the evaluation system for the employees in the public institutions changed, the evaluation was made in four levels, three levels would be rewarded in monetary values. This system is still applied nowadays in all the institutions of the public administration. But the performance evaluation was a closed process, not transparent and subjective, and in the major part it did not reflect the realization of the objectives and the annual achievements of the employees. Generally there were very positive evaluations related to the performance of the public administration. The main objective of this study is highlighting the problems of the performance evaluation in the Public Administration. But there are some other objectives that are related with:
The importance of the institutionalization of the performance standards. The importance of the evaluation system. Treating to evaluation system of the Public Administration according to the history of past systems. 3.1 Data and methodology of study in this paper research This article was made created by respecting all the methodological rules. The methodology of this article was based in two parts: Studying the foreign and Albanian literature, bibliographic studies, collecting data from official sources as DAP, the Directory of Human Resources and from different publications such as magazines. And practicing, which is related with the interviews with leaders and employees of the Public Administration. To collect the data for this article we made interviews, questionnaires and other researches. We created also a questionnaire, which was composed by 20 questions and 2.8% of the employees in the central level of the public administration answered.

ISSN 2039-9340 Mediterranean Journal of Social Sciences Vol. 3 (11) November 2012
468
3.2 Analyzing data and regression analyze The performance evaluation is mainly characterized by qualitative indicators and there are only a few quantitative indicators. According to the data collected from the questionnaires the employees asses the importance of the performance evaluation in 100%, they concretize it with the objectivity in the evaluation. To the question “Is the performance evaluation objective in your institution?”- 30% answered positively, 44% avoided the answer and 26% of them think that it is dictated from the subjectivity of the leaders. According to the questionnaire the major part of the questioned employees think that the performance evaluation takes to conflicts between the subordinate and the superiors. This is also another factor that contests rewarding according to the performance.
Despite this in some cases we see stereotypes that do not respect properly the requirements of the performance evaluation by standardizing the evaluation of a category. In most of the cases the evaluation of the specialists is evaluated in level 2 good. This sort of standardization menaces the performance evaluation and does not create the conditions to put competitive conditions between the specialists. The performance evaluation is done once a year as a summarization of the employees work within a year. This way does not justify an objective evaluation.
Actually there is no monthly planning and evaluation. Generally the performance evaluation is made based on the declarations of the employees, what decreases the importance of the evaluation. In these conditions the leaders do not pay attention. From the results of the canvass there are no individual and monthly working plans, which can facilitate the performance evaluation from the leaders. Results from the study show that the performance evaluation focuses only the foreseen objectives in the work description, what narrows the evaluation circle.
Even though generally the employees of the Public Administration were evaluated very good and good, still there is work that needs to be done regarding the personal qualification. The personal qualification often is referred to the trainings that the employees of the public administration, which is very important. Until nowadays only a small part of the employees are involved in doctorate studies. The employees are still far from career commitments, and this is why only a few of them represent scientific publications for their sector.
And this is why we pretend that the performance evaluation does not justify its objectives because it is based only in the commitment related to the job. To create the conviction for this problem a hypotheses came out:
H1: The performance evaluation in the public administration is objective.
The question “Is the performance evaluation objective?” was analyzed in details and the answers were evaluated from 1-10 points each, nine of the questioned persons were leaders and employees. The respective evaluations are presented below:
First choice 7 8 7 9 Second choice 4 7 5 6 4
We join both choices in one and keep the identity by underlining (for ex. the second choice)
values 4 4 5 6 7 7 7 8 9 Ranks 1 2 3 4 5 6 7 8 9
We calculate the sum of the first choice and the average
We calculate the quadratic average derivation of the Man Whitney criteria
R1o = 6+7+8+9
MR= 𝑛𝑛1(𝑛𝑛1+𝑛𝑛2+1)
2 = 4(4+5+1)
2 = 20
We calculate the quadratic average derivation of the Man Whitney criteria
SR1 = �𝑛𝑛1𝑛𝑛2(𝑛𝑛1+𝑛𝑛2+1)12
= �4.5(4+5+1)12
= 4.8 We calculate the factual value Zf and is compared with Zk that is the statistic value at a critic level. Zf= (R1m –MR)/SR1 = (30-20)/4.8 = 2 Zf> Zk ; 2>1.76 This calculation shows that the hypothesis is not valid.

ISSN 2039-9340 Mediterranean Journal of Social Sciences Vol. 3 (11) November 2012
469
In the performance evaluation the subjectivism has high levels. It is important to find other parameters for the evaluation, and this is a commitment of this article in the future. 4. Conclusions The results from this article show that the performance evaluation is a very important element in the Public Administration, and it effects the improvement of the work in the state and central bodies.
The performance evaluation conditions the emplacement and the implementation of the standards as referential points. Emplacing standards would increase the responsibility for each post in the Public Administration and will help in monitoring the performance of the institution.
Despite the continuous improvements after 1990, there are still lacks and gaps in the performance evaluation and this harms the public opinion for the Public Administration.
One of the lacks is the considerable subjectivism during the performance evaluation, which was proved by the contemporary methods, with the Man Whitney method for the minor choices where Zf is larger than Zk, and this showed that the hypothesis about the objectivity of the performance evaluation is not available.
Bibliography Gent Ibrahimi & Institute for Legal and Public Publications”, “Manual for the General Secretar” September 2002. Ardian Dhima & Institute for Legal and Public Publications“The Ministers Manual”, September 2003. “The department of the Public Administration “Manual for the Structurisation of the Institutions” 2003 The Stabilization and Association Report for Albania in 2004“The status of the civil employee”/1999 The department of the Public Administration, no.37 “Expansion of the EU” The department of the Public Administration, np.39 “The role of the Ministries in politic development system, monitoration and
evaluation” Bleriy and Scouleer 2004“The department of the Public Administration, Selznick, Philip. 1957. Leadership in Administration: A Sociological Interpretation. New York: Harper & Row.
Dessler, G. 2000. “Human Resource and Management. 8th New Jersey International, Inc. De Bruijn, H. 2002.Managing Performance in the Public Sector. London: Routledge.
Robins, S.P. and Couter, M. 1999. 6th New Jersey: Prentice-Hall.
Dessler, G. 2000. Human Resource and Management 8th
Neë Jersey: Prentice Hall International, Inc.
Robbins, S.P. 1998. Organizational Behavior: Concepts, Controversies, Applications. 8thNew Jersey: Prentice Hall.

ISSN 2039-9340 Mediterranean Journal of Social Sciences Vol. 3 (11) November 2012
471
Case Study on Physical Education and Sport in Naples, Italy
Di Tore P. A.,
Raiola G.
Faculty of Formation Sciences, Department of Human,
Philosophical and Formation Sciences, University of Salerno, Italy
Doi:10.5901/mjss.2012.v3n11p471 Abstract In 2009 Minister of Education University and Research (MIUR) of Italy enacted the Guidelines of physical education and sport to improve the sport activity into the school through the sport school association and gives, for this aim, only 33% of amount of economical resources allocated in the previous years for extra activity of physical education. Approach: From a case study to compare data between 2 years of a sample of 10 schools of Naples, 6 schools decreased sports activity, 4 schools slightly increased and only one school increased significantly adding own economical resources. Furthermore, this school also deliberated a collaboration with sport association as new Guidelines suggested. The aim of this study is to investigate the process adopted by the school. Method is case study to describe the process. Results and Conclusion: All 10 schools confirm the past sport activities in different forms with several percentages among the schools. The decrease of number of students is significant and generally distributed. Seven schools utilized only the economical ministerial resource and only 2 schools utilized economical ministerial resources and a few own economical resources. The datum of only one school adding own economical resource in congruent amount means that just the 10% of schools understand the spirit of change according to the new Guidelines of Physical Education and Sport. The study suggests to start an investigation on public sport education service offered by school and by sport association and to establish a specific committee to investigate every aspect of this phenomenon. Keywords: Regulation document, Sport association, Skills learning
1. Introduction Nowadays, the Physical Education and Sport in Italian school meets several following problems: decreasing amount of compulsory physical education, decreasing quality of physical education, high amount of non-exercising pupils, exempted pupils from physical education classes, low physical fitness and motor productivity of youth, insufficient support to disabled pupils, lack of control of Physical Education, weak of social and financial honor of Physical Education and Sport teachers and low interest of graduates in teaching specialization (MIUR, 2009). Furthermore, the phenomenon of exergames is the most problem of the teaching method in the age from 3 to 14 years old because of large diffusion in the student population. This question has to discuss in the school organization according to recent theory of motor skill learning. “With an appropriate educating and training it can uses the neural network theory. It is possible to establish deductive rules of an expert system for the prediction of the opponent's move in a direct confrontation for the fight activities and sports game. Training enables students to use the motor schemes that they acquired during their training (perceptual affordances). The students will reproduce - with growing precision - athletic gestures that allow performing certain actions during the activity. The increasing increment of the accuracy in the execution irreparably leads to a decrease in the movement flexibility because - in order to achieve the expected result - it can not coexist with different execution modalities.” (Raiola 2012a) To change this status, it should contribute a new project of education. It is established on the basis of educational domains- human and nature, human and technique, an individual, Society, Culture, Mathematical and Logical Thinking, Language and Communication, Health and Movement, Educational area Health and movement is elaborated in subject physical and sport education in New National Indication (MIUR, 2003), Indication for Curriculum (MIUR, 2007) into modules that include health and its impairment, healthily life style, physical fitness and motor performance, sport activities of movement regime. Furthermore, the Minister of Education, University and Research implements the Sports Student Championship Games every year and gives economical special resource to do teaching in extra time school by the teachers of physical education. This process is evaluated by school in its internal path and, at the end of it, it is approved. Due to the decreasing of economical resource to destination to school, and in particular of the economical special resource for Sports Student

ISSN 2039-9340 Mediterranean Journal of Social Sciences Vol. 3 (11) November 2012
472
Championship Games, many schools are not inclined to do activities in extracurricular time. For this reason, the Minister wants to give a response to this problem doing a series of administrative measures to increase motor and sport practice in school. Furthermore, a research by Italian National Olympic Committee (CONI) had carried out the decrease of the sport practitioners and charged this debt of practitioners to school deficit. Thus, the Minister of Education University and Research had, last year, enacted the experimental project called New Guidelines of Physical Education and Sport into the school (MIUR, 2009). A precedent study has investigated the variation of sport practitioners in a sample of 100 students that have submitted questionnaire with the specific parameters (Raiola and D’Isanto 2011) as a way to analyze the association between indicators and descriptors of phenomenon of sport practices. In the same way, we would apply this method research to investigate the process into the schools. So, it is useful to know the steps and their dynamic in order to sequence, consistence and timing. Particularly, we want to study the solutions that the school had adopted to resolve the problem to pay the teachers of physical education for the extra work time school. To realize the purpose to improve motor sport activities into the school, it needed the economical added resource to pay the teachers for the extra work time, because they have to organize, train and do the work activities, including the competitions to the others school. The special economical resources, that the Minister has given and is going to give has decreased of 66%. This New Guidelines of Physical Education and Sport (MIUR, 2009) to improve the sport activity establishes a new organizational tool inside the school called School Sport Center. It consists in internal sport association. The question was how it is possible to increase the sport practitioners if the economical resource decreases. Particularly how the School Sport Center can increase the motor and sports activity into the school and to offer a more sport service for the student if money is not enough as such as the past years. So it is important to take in relation ship regulation document under some partial education aspect and didactics. “A clear need for those involved in facilitating the learning process in the field of motor activity is the definition of the criteria underlying the methodological and didactic choices. Not infrequently this definition is based on empiricism or reiteration of established practices. This approach is sometimes effective but not efficient: you will get results without knowing in detail the causes that produced them. A more effective system to select the criteria consists in placing, as a basis of activity, scientific theories about the movement, motor control and motor learning. However, structuring the experience of motor learning on a scientific basis is often difficult due to the absence of supports that are able to translate theory into educational practices to be included in didactics.” (Raiola 2012a)
The special objective of past study was to know if there was an increase or decrease of motor and sport activity in Naples schools and what was the solution that the school had adopted in the past year to pay the teachers. CONI research had carried out the decrease of the sport practitioners and the MIUR had, consequently, enacted the experimental project to improve the motor and sports activities into the school.
Thus, it needed economical resource to pay the teachers for organizing, training and doing the competitions, but the special economical resources, Minister had usually given last year had decreased of 66 %. The adopted method for the past work was the case study through quantitative and qualitative methods. Firstly, a sample of 10 schools was requested to start an investigation in order to collect data on motor and sports activity and its costs in the past years. Secondly, data were collected on new and old motor and sports activities. Thirdly, data was examined to identify the school that had increased the motor and sport activities. Finally, schools that increased the motor and sport activity described the process of administrative activities and its steps. The plenty sample of 10 school confirmed the motor and sports activities in previous form but decreased the amount of motor and sports activity for each student. They used only the ministerial specific economical resources. Only 4 schools had increased the sport activities. Only one school had added own economical resource to improve the ministerial resources. This school had deliberated the school sport center with the joint collaboration to sport association to develop educational purposes of motor and sports activity. The order of process was the following:
• a sample of 10 school of Naples was requested to start an investigation in order to collect data on motor and sport activity and its costs in the past years;
• data on motor and sports activities in current and previous year were collected; • data were examined in order to identify schools that increased the sport activities; • schools that increased the motor and sport activity were requested to describe the economical strategy
and the details and the steps of the process; The data on participation of external sport association and economical resource was been Tabled by three ranges as following:

ISSN 2039-9340 Mediterranean Journal of Social Sciences Vol. 3 (11) November 2012
473
From 0% until 33%: no sport associations participation and no additional economical resources. From 34% until 66%: real participation of sport associations with a marginal role in sport organization, low partecipation in additional economical resources. From 67% until 99%: full participation of sport associations with a significant role and significant amount of money Table 1. Ten schools data
% New Students Participants
Old Students Participants
Economical Resources
Collaboration Range Sport Association
School 1 30 32 33 33
School 2 27 33 33 33
School 3 29 30 66 33
School 4 33 36 33 66
School 5 38 45 66 66
School 6 24 28 33 33
School 7 29 33 99 33
School 8 32 30 33 99
School 9 30 39 33 33
School 10 26 28 33 33 Table 1. Case study results
Step Description of single action 1 Discussion and deliberation, inside the school organisms, of School Sport Association
and to include sports activity in Offer Education Planning (POF)
2 Allocation of additional own economic resources that needs to realize the sports activity 3 Collaboration with sport association to aim indications of official ministerial document 4 Participation at Sports School Championship (CSS) for several sports and Youth Games 5 Payment of physical education teachers using own economic resources 6 Transfer from Minister to school economical current resources and then payment of physical education teachers
The previos results were the following. Table 1 shows that all 10 school confirms the past sport activities in different forms with several percentage among the schools but with a significant decrease of number of students that are generally distributed in every schools. Seven schools utilized only the economical ministerial resource, while 2 schools utilized economical ministerial resources and a few own economical resources. Only one school added own economical resource in congruent amount. The two schools wich added a little bit of economical resource has a good percentage of student participation that is higher than the schools that did not add own economical resource. Only one school increased the sport activities, adding a congruent additional economical resource. All schools deliberated the school sport center trough a correct process as such as the administrative and juridical parameters. Only one school established a plenty joint collaboration with a sport association to develop the educational purposes of sport activity and not the competitive sport purpose. Every school confirmed the institution of Sport Student Championship Games and so the sport activity in several forms utilizing the ministerial specific economical resources: it was just of 33% than the past years. Every school incountered lot of problems to participate to competitive forms of Sport Student Championship Games. Nowadays, for the data that was been decrypted in this introduction it could be examined the school had made a better performance in order the three indicators and its descriptors. The aim of this study is to investigate the process adopted by the school that obtained better performance in relation to indicators described above.

ISSN 2039-9340 Mediterranean Journal of Social Sciences Vol. 3 (11) November 2012
474
2. Materials and methods Case study to describe the process and steps. The Case study is a research methodology common in social science (George and Bennett, 2005). It is based on an in-depth investigation of a single individual, group, or event to explore causation in order to identify underlying principles. Rather than using samples and following a rigid protocol to examine limited number of variables, case study methods involve an in-depth, longitudinal examination of a single instance or event: a case. They provide a systematic way of looking at events, collecting data, analyzing information and reporting the results. (Dul and Hak, 2007). As a result the researcher may gain a sharpened understanding of why the instance happened as it did and what might become important to look at more extensively in future research. Case studies lend themselves to both generating and testing hypotheses (Eisenhardt, 1989). Another suggestion is that case study should be defined as a research strategy, an empirical inquiry that investigates a phenomenon within its real-life context. Case study research means single and multiple case studies, can include quantitative evidence, relies on multiple sources of evidence and benefits from the prior development of theoretical propositions. Case studies should not be confused with qualitative research and they can be based on any mix of quantitative and qualitative evidence (Bent, 2006). Single subject research provides the statistical framework for making inferences from quantitative case-study data. This is also supported and well-formulated in: The case study is a research approach, situated between concrete data taking techniques and methodological paradigms (Lamnek, 2005). In this study it uses a case study trough qualitative and quantitative method with mix approach: case study and statistical data. 3. Results The study shows the following descriptive data (Table 3): Discussion and deliberation, inside the school organisms, of School Sport Association and to include sports activity in Offer Education Planning (POF) Allocation of additional own economical resources that needs to realize the sports activity Collaboration with sport association to aim indications of official ministerial document Participation at Sports School Championship (CSS) for several sports and Youth Games Payment of physical education teachers using own economical resources Transfer from Minister to school economical current resources and then payment of physical education teachers 4. Discussion All 10 school confirm the past sport activities in different forms with several percentage among the schools is very good in consideration of the bad actual context of public school. But the significant decrease of number of students, that are generally distributed in every schools, must do a reflection on general situation of high sport left. The 7 schools utilized only the economical ministerial resource and only 2 schools utilized economical ministerial resources is the demonstration of low culture in physical education and sport into school. Furthermore, the low additional own economical resources is relevant to demonstrate the gravity of situation. The datum of only 1 school added own economical resource in congruent amount means that just the 10% of schools understand the spirit of change according to the new Guidelines of Physical Education and Sport (MIUR, 2009). In the same way is the datum that only 1 school increased the sport activities because of it gives a congruent additional economical resource and so the school is according to the sense and spirit of the new Guidelines of Physical Education and Sport (MIUR, 2009).

ISSN 2039-9340 Mediterranean Journal of Social Sciences Vol. 3 (11) November 2012
475
Figure 1 - Economical Resources
Figure 2 - Sport associations collaboration range
7% 7%
15%
7%14%7%
7%
22%
7% 7%
Economical resources
School 1
School 2
School3
School 4
School 5
School 6
7%7%
7%
15%
14%7%7%
22%
7%7%
Sport associations collaboration range
School 1
School 2
School3
School 4
School 5
School 6
School 7
School 8
020406080
100
Scho
ol 1
Scho
ol 2
Scho
ol 3
Scho
ol 4
Scho
ol 5
Scho
ol 6
Scho
ol 7
Scho
ol 8
Scho
ol 9
Scho
ol 1
0
Summary
new students participants
old students participants
%economical resources

ISSN 2039-9340 Mediterranean Journal of Social Sciences Vol. 3 (11) November 2012
476
5. Conclusion The case study of only school established a joint plenty collaboration to sport association to develop the educational purposes of sport activity and not the sport competitive purpose is an ambiguous datum. The results of case study descriptive data open a new reflexion on the reality into the school. Offer Educational Planning (POF) is the tool to solve a problem of lack the joining the sport association and the school in unique physical education and sport organism. Furthermore, if in one hand it is positive for the educative purpose for the school and not vice versa for the competitive purpose for the sport association, in the other hand the quantitative datum is not positive for the lowest percentage of the school occurs in this investigation. The problem about the decrease of ministerial economical resource is nowadays metabolized by the school. So the schools have to be adapted as soon as possible in changing of the scenario of public education without economical resources as well as in the past years. It had shown a complex total negative data on this changing for the physical education and sport into the school. Probably, the sample is not significant because of the schools are in the same territory that is same social problems. It suggests to start an investigation on public sport education service offered by school and by sport association and to establish a specific committee to research on this phenomenon to carry out the data to know every aspect of it. It needs in future to investigate on sport education service offered both school and sport association to agree an institutional collaboration which does not have a distinction between competitive sport and educative one.
References Bent, F. (2006). Five Misunderstandings About Case- Study Research. Qualitative Inquiry, 12: 219-245. [Online]
Available: http://vbn.aau.dk/files/3790172/BF-Qualitative-Inquiry-2006-vol-12-no-2-April-pp-219-245.pdf D’Isanto, T., Raiola G. (2010). State of art study of the change of physical education and sport in secondary school in Italy. [Online]
Available: University of Salerno, http://www.analefefs.ro/anale-fefs/2010/issue-2-supplement/files/70.pdf Dul J., Hak T. (2007) Case Study Methodology in Business Research. 4th Edn, Butterworth-Heinemann/Elsevier, Boston, MA, ISBN: 10-
0750681969. pp: 302-302. Eisenhardt, K.M. (1989). Building theories from case study research. Acad. Manag. Rev., 14: 532-550. [Online]
Available: http://business.illinois.edu/josephm/BA504_Fall%202008/Session%203/Eisenhardt%20%281989%29.pdf George A.L., Bennett, A. (2005). Case studies and theory development in the social sciences. 1st Edn., MIT Press, Cambridge, Mass,
London, ISBN: 10- 0262072572, pp: 331 Lamnek, S. (2005). Qualitative Sozialforschung: Lehrbuch: Beltz, PVU. MIUR, 2003. Indicazioni nazionali, [Online] Available: http://archivio.pubblica.istruzione.it/normativa/2004/dec190204.shtml MIUR, 2007. Indicazioni per il curricolo Ministero della Pubblica Istruzione, Università e Ricerca [Online]
Available: http://www.indire.it/indicazioni/templates/monitoraggio/dir_310707.pdf MIUR, 2009. Linee guida per l’educazione fisica e sportiva, [Online]
Available: http://archivio.pubblica.istruzione.it/normativa/2009/allegati/all_prot4273.pdf Raiola, G. (2012a). Didactics and Movement Learning in Documents on Physical Education and Sport in Lower Secondary School in
Italy, Journal of Educational and Social Research Vol. 2 (1) January 2012 Doi: 10.5901/jesr.2012.02.01.225 Raiola, G. (2012b). Placement in Open University By Virtual Environment and Robotics Journal of Educational and Social Research Vol.
2 (1) January 2012 Doi:10.5901/jesr.2012.v2n2 Raiola G, D’isanto, T. (2011). New Research Approach to Rebuild Sport Facilities. J. Social Sci., DOI:10.3844/jssp.2011.306.308

ISSN 2039-9340 Mediterranean Journal of Social Sciences Vol. 3 (11) November 2012
477
Politics and International Criminal Court Debate:
A Critical Discourse Analysis of Utterances by Politicians in Kenya
Juliet Akinyi Jagero
Bondo University College, Kenya. School of Humanities and Social Sciences Email address: [email protected]
Doi:10.5901/mjss.2012.v3n11p477
Abstract Language plays a critical role in political action. The choice of words written or spoken is a very important tool in political engagements. This paper aims at analyzing utterances by politicians in Kenya on International Criminal Court (ICC) debate. This study uses Critical Discourse Analysis (CDA) to analyze these utterances so as to reveal the sources of power abuse, dominance, inequality and bias and how these sources are initiated, maintained, reproduced and transformed within specific political and historical context. This paper draws data from political speeches and utterances from press conferences, Newspapers, interviews, political rallies and other forms of media from the time the ICC debate begun in the year 2009 after parliament voted against constitutional amendment that would have allowed a credible and independent local court. From the analysis it is evident that politicians use language that does not conform to the norms of the society and thus threatening national cohesion and perpetuating animosity among different ethnic groups as they politicize the ICC debate. Keywords: Political discourse, International Criminal Court, utterances, Critical Discourse Analysis 1. Background Language is an important tool in politics. Politics is a struggle for power in order to put certain political, economic and social ideas into practice. Politicians have continued to persuade their audience of the validity of their claims by using rhetoric’s. According to the Oxford English Dictionary, rhetoric’s is the art of using language so as to persuade or influence others. Although language is an unquestionable important element of politics, it can misrepresent as well as represent realities, it can weave visions and imaginaries which can be implemented to change realities and in some cases improve human well-being, but it can also rhetorically obfuscate realities, and construe them ideologically to serve unjust power relation (Fairclough, 2006). Language therefore has a key role in the exchange of values in social life and transforming power into right and obedience into duty (Byram, 2010). It is against this background that this paper analyses the utterances by politicians in Kenya on the ICC debate. 2. Objectives The objective of this study is to analyze utterances by politicians in Kenya on the ICC based cases at The Hague. International Criminal Court The International Criminal Court investigations in Kenya began after the 2007-2008 post- election violence. This was after the disputed presidential election that was held on 27th December 2007 and the Electoral Commission of Kenya officially declared the then incumbent President Mwai Kibaki as being the winner. Supporters of the then opposition candidate Raila Odinga accused the government of electro malpractice and rejected the results. A series of protests and demonstrations followed, and fighting mainly along tribal lines led to many deaths, injuries and displacements. It was after a failed attempt to conduct a criminal investigation of the key perpetrators of the post election violence that the matter was referred to the International Criminal Court in The Hague, Netherlands. In 2010, the Prosecutor of the ICC Luis Moreno Ocampo named six people as being the key suspects: Deputy Prime Minister Uhuru Kenyatta, the then Industrial Minister Henry Kosgey, the then Higher Education Minister William Ruto and the then Head of Public Service Francis Muthaura, the then head of operations at Kass FM, Joshua arap Sang and former Police Commissioner Mohammed Hussein Ali. All were accused of crime against humanity.

ISSN 2039-9340 Mediterranean Journal of Social Sciences Vol. 3 (11) November 2012
478
The efforts by the government of Kenya and the National Assembly to stop the ICC process failed even after trying to appeal to both the United Nations Security Council and the court itself regarding the admissibility of the case. Despite all these oppositions, the suspects cooperated and attended preliminary charges hearing in September the same year. It was on 23 January 2012 that the Pre-Trial Chamber II confirmed the charges against Deputy Prime Minister Uhuru Kenyatta, Francis Muthaura, William Ruto and Joshua arap Sang and declined to confirm the charges against Mohammed Hussein Ali and Henry Kosgey. The four have since appealed against the ruling. 3. Literature Review Discourse refers to expressing oneself in words. According to Fairclough (1989) the term refers to “the whole process of interaction of which a text is just part.” Discourses are used in everyday contexts for building power and knowledge, for regulation and normalization, for the development of new knowledge and power relations, and hegemony. Political discourse, as a sub-category of discourse in general, can be based on two: functional and thematic. Political discourse is as a result of politics and it is historically and culturally determined. It fulfills different functions due to political activities. It is thematic because its topic is primarily related to politics such as political activities, political ideas and political relations. People use language to wield power over others. Power is a complex and abstract idea and has a significant influence on our lives. According to Edward (2006) people do not react to the world on the basis of sensory input but, rather, of what they perceive that input to mean. This is because language use corresponds to views of the social status of the language users, thus providing simple labels which evoke social stereotypes that go far beyond language itself. For instance listening to a given variety, acts as a trigger or a stimulus that evokes attitudes or prejudices or stereotypes about the community to which the speaker is thought to belong. Wareing (2004) states that effective functions of language is concerned with who is allowed to say what to whom and of which is deeply tied up with power and social status. In addition, he notes that words can also have a strong influence on our attitudes; which word is chosen affects people’s perception of the others and of themselves. Eldelman (1977) states that the knowledgeable politician becomes successful by using his or her knowledge of informal influence. According to Jones & Peccei (2004) this can be achieved through “presuppositions” and “implicature”. These tools can lead to listener to make assumptions about the existence of information that is not made explicit in what is actually said but that might be deduced from what was said. Presuppositions are background assumptions embedded within a sentence or phrase. These assumptions are taken for granted to be true regardless of whether the whole sentence is true. Such technique is particularly useful in political discourse because it can make more difficult for the audience to identify or reject views communicated in this way, persuading people to take for granted something which is actually open to debate. Like presuppositions, implicatures lead the listener to infer something that was not explicitly asserted by the speaker. However, unlike presuppositions, these operate over more than one phrase or sentence and are much more independent on shared knowledge between the speaker and the hearer and on the context of the discourse. Similarly, Jones & Peccei (2004) points out that language can be used not only to steer people’s thoughts and beliefs but also to control their thoughts and beliefs. Byram (2010) concurs with him by explaining that how individual choose and use different language systems therefore varies according to who the speakers are, how they perceive themselves and what identity they want to project. Ojwang (2002) notes that language is an instrument of control as well as communication. Linguistic forms allow significant information to be conveyed and be distorted. In this way the, the hearers can either be manipulated or informed. In this article we realize that politicians have continued to manipulate the public by using rhetoric’s for the purpose of winning public support and also pitting the public against their political opponents on the ICC debate. Language use also varies according to whether the situation is public or private, formal or informal, who is being addressed and who might be able to overhear. Meyerhoff (2006) also points out that we draw powerful inferences about people from the way they talk. Since politics is concerned about power: power to control other people’s behavior and often to control their values, politicians throughout ages have achieved success in politics by skillful use of rhetoric by which they aim to persuade their audience of the validity of their views, delicate and careful use of elegant and persuasive language. 4. Theoretical Framework This study uses Critical Discourse Analysis (CDA) because it is concerned with studying and analyzing written texts and spoken words to reveal the discursive sources of power, dominance, inequality and biased and how these sources are initiated, maintained, reproduced and transformed within specific social, economic, political, and historical contexts (Van Dijk, 1988). It tries to illuminate ways in which the dominant forces in the society construct versions of reality that favours

ISSN 2039-9340 Mediterranean Journal of Social Sciences Vol. 3 (11) November 2012
479
their interests. By unmasking such practices, Scholars aims to support the victims of such oppression and encourage them to resist and transform their lives (Foucault, 2000). CDA aims to systematically explore often opaque relationships between discursive practices, texts, and events and wider social and cultural structures, relations and processes. It strives to explore how these non- transparent relationships are a factor in securing power and hegemony, and it draws attention to power imbalances, social injustices in hope of spurring people to corrective actions (Fairclough, 1993). Fairclough (2000) identifies three central tenets of CDA namely: social structure (class, status, age, ethnic identity and gender); by culture (the general accepted norms of behavior in the society): and discourse (the words we use). The goal of CDA is to determine the relationship between these three central tenets. Our discourses reflect the societal norms and beliefs i.e. we say things in conformity with the way they should normally be said in our society, and there are certain things we do not say because the society has constrained us not to say them. Likewise, our identity in the social structure is shown in the way we think, act and speak. A text is a record of communication, which involves the presentation of facts, beliefs and the construction of identities of participants. It is produced by socially-situated speakers. It is therefore more than just words spoken or written on the pages of books, but how such words are used in particular social context. This paper analyses utterances by politicians in Kenya on ICC debate and their socio political implications. Since the beginning of the ICC trials at The Hague there has been a lot of debate. This has been seen as politicizing and ethnicizing the process. This paper therefore aims at analyzing utterances by politicians in Kenya on International Criminal Court (ICC) debate using CDA. 5. Methodology This paper draws data from political speeches, press conferences, Newspapers, interviews, political rallies and other forms of media from the time the ICC debate begun in the year 2009 after parliament voted against constitutional amendment that would have allowed a credible and independent local court. Data in the form of textual extracts are then analyzed using CDA. 6. Findings, Analysis and Discussions When the Kenyan parliament was unable to come up with a local tribunal to try the perpetuators of post election violence the cases were referred to ICC in The Hague. The prosecutor of the ICC Luis Moreno Ocampo who has since retired, promised to use Kenya as an example to other countries and politicians. Kenyan politicians being unhappy they have been lobbying other African countries to support to defer cases, claiming that the trials could threaten reconciliation process. A process which was meant to bring ethnic communities which fought each other during post election violence to live together in harmony. Politicians have made utterances that indicate their dissatisfaction with the famous Ocampo list. However Kenyans on the other hand supports the process as indicated in the opinion poll conducted in 2009 by Synovate. In the opinion poll which surveyed 1501 adults nationwide 54% of respondent’s preferred ICC trials in Hague, 23% preferred forgiveness and 23% preferred trials locally. On 20 February 2011 Njonjo Mue the head of the Kenya office of the International Centre for Transitional Justice was reported by NTV (a television channel in Kenya) saying, “The political elite is working not so much in the interest of justice for victims of post election violence as in the interest of trying to shield those who bear the greatest responsibility that have been named by ICC” This is a clear indication that the politicians in Kenya are unhappy with the decision to try the accused at the Hague as it touches on those deemed to be powerful in the political circle. On the other side, those who were affected are seen to be less powerful therefore the law should only be applied to the meek in the society. On February 2011 NTV Kenya reported on Mr. Uhuru’s anger on The Speaker Kenneth Marende’s action on judicial appointments. House Speaker Kenneth Marende had rejected President Kibaki’s judicial nominations of Chief Justice, Deputy Chief Justice, Attorney General and Chief Prosecutor. The president had nominated the officers without consulting the Prime Minister Raila Odinga contrary to the National Accord which requires him to consult before appointments. In addition, the nominations done by the president was contrary to the new constitution which stipulates clearly that the officers must be interviewed and vetted before being nominated to take up the offices. Deputy Prime Minister Uhuru Kenyatta addressing a public rally directed his anger at the speaker and Prime Minister Raila Odinga by claiming that “There was an attempt to mobilize support for the presidents’ nominees because of the ICC indictments.” Uhuru went ahead and said “I will face The Hague Court and come back a free man.” As result of being angered by the decision he said that “Hague is not anyone’s mothers’ house. He even referred to The Prime Minister as “Kehe” a Kikuyu term meaning uncircumcised. This was not true as the new constitutional dispensation bars the president from direct

ISSN 2039-9340 Mediterranean Journal of Social Sciences Vol. 3 (11) November 2012
480
nominations. Associating the nominees with Hague based cases was even more suspicious as this was tantamount to trying to use the judicial nominations to stop the cases. This is a clear indication of power struggle between the President verses the Prime Minister and the house speaker. The president is seen by his supporters as powerful and capable of appointing without consultation or respecting the constitution. The interviews and vetting of the officers were later done as per the constitution. Making reference to The Prime Minister as ‘kehe’ is tantamount to abusing and undermining him because he comes from the Luo community which does not practice circumcision and therefore not fit to be a leader. This gives a prejudice or stereotype about the Luo community and also the community in which the speaker comes from that is the Kikuyu community due to their cultural practices.
As a result of rejection of the constitution office nominations of which could have helped in the ICC cases there was an ugly exchange of words between Prime Minister Raila Odinga, Deputy Prime Minister and suspended Higher Education Minister William Ruto. Prime Minister Raila while addressing a public rally at Tononoka grounds in Mombasa said “Kuna vijana wengine, akiamka asubuhi bangi, wengine, anamka asubuhi anatafuta mali ya kuiba. Anaona plot pale, amenyakua, nyingine hapa amenyakua, sasa kila mara kortini tu. Anatoka hii anaenda koti hii” (There are some youths, when they wake up in the morning they take bhang. Others wake up in the morning to look for property to grab. They get a plot there and grab, another here they also grab. Now they are constantly in court. They leave this court and go into another). The crowed on the other hand was chanting the names of Uhuru and Ruto. (Reported on 28 February by Kenyauptodate.blog.com) In this case the speaker presupposes certain things which are known to those who are familiar to historical events in which those referred have been accused. These are tactics used by politicians so as not to be pinned down for defaming their opponents. Even without mentioning the names the crowd knew those who were being referred to that is why they were chanting their names. The use of Kiswahili by politicians shows that most politicians use it so as to reach majority of Kenyans who speak Kiswahili. Report by Kenyauptodate.blog.com on 28th February indicates that Prime Minister Raila also came under attack by Deputy Prime Minister when he was being interviewed by a Kikuyu language radio station, where he referred to The Prime Minister Raila as ‘Kemundu’ which means a small person in Kikuyu language. Mr. Uhuru believes that the Prime Minister is the one pushing for the cases to be handled by ICC. However, cases at the ICC are handled independently and are not influenced by politics in a country. Mr. Uhuru wants people to believe that ICC is a plot to block him from rising to presidency. Mr. Uhuru has continuously been using Kikuyu language especially abusive language. According to Wareing (2004) the language used by speakers affects people’s perception of themselves. On 28 February 2011 Mr. Ruto also while speaking at St. Maria secondary school in Marakwet west district where he had presided over fund-raiser, without mentioning Prime Minister Raila by name stated “Tulikuwa KICC tukichunga kura wakati vita vikitokea, Sasa yeye anasema eti mimi nilipanga vita Eldoret, Kakamega, Kisumu, Bungoma, mpaka Mombasa. Si huyu mtu ni wazimu? ” (We were at KICC (Kenyatta Conference Centre) protecting our votes when chaos broke and now he is saying that I was planning the fighting in Eldoret, Kakamega, Kisumu and Bungoma even Mombasa. Isn’t he a mad man? Mr. Ruto was insinuating that he never participated in post election violence hence being accused falsely. By mentioning where he was, he makes the listener believe his statement without questioning. On 8 February 2012 Prime Minister Raila Odinga while addressing a rally in Bungoma sought to distance himself from allegations that he advocated the intention of killing off political competition by saying “I am not the type of politician to resort to such tactics to boost my bid for the presidency”. From his statement one tend to believe that he is not a bad person after all as depicted by his opponents who believe that he is taking advantage of the situation to clinch presidency come 2013 elections. When the presidents name was mentioned on ICC related issues as it was said that there was a meeting held in the state house of which hosted ‘Mungiki’ members during the skirmishes. ‘Mungiki’ is an outlawed group which is believed to have participated in the killing of people in Naivasha in the Rift Valley province during post election violence. The President’s supporters defended him. This was evident in the then Internal Security Minister Saitotis’ statement on February 2012, “Leave President Mwai Kibakis’ name out of ICC talks!” In a statement he was lashing out at those dragging president Kibakis’ name into ICC debates terming it ‘unwarranted’, ‘uncalled for’ as well as ‘disrespectful’ of the person who is the president of Kenya. Linking the President and the activities of Mungiki at State house is tantamount to accusing the president of participating in post election violence. A case that has not been confirmed or ascertained. On 23rd January 2012, when Mr Ruto emerged from the court room at The Hague he said “We have absolutely no reason to be here. We are innocent people.” Mr Henry Koskey also added “I have no guilt, none at all, and it is my belief that this case will show that I have no guilt whatsoever.” Koskey was later to be acquitted for not being guilty while Mr Ruto still has a case to answer. All the accused wanted the listeners to believe that they were innocent and were falsely being accused. According to Byram (2010) this is a way of projecting innocence. Prior to the court session at The Hague, 40 Members of Parliament who accompanied them held a small demo outside the ICC to protest against the ICC proceedings. Moyale Member of Parliament Mohamud Mohamed Ali said, “We

ISSN 2039-9340 Mediterranean Journal of Social Sciences Vol. 3 (11) November 2012
481
are opposed to the ICC trials as we feel we are able to handle our cases and this is not right. The best solution is a local solution.” The speaker assertion makes the hearer think that what he is saying is true or authentic. However to those who understand the historical events surely the Member of Parliament is not being sincere as they had the opportunity in parliament to establish a local tribunal to deal with the post election cases but they instead insisted that the cases be referred to the ICC. Some were heard saying “stop being vague go to Hague.” This is a clear indication that they supported the ICC process and also they never trusted the Kenyan courts. On 20 January 2012 The then Justice Minister Mutula Kilonzo referring to the beginning of cases said “It is encouraging that the judicial process had started. “It’s about time the judicial process begins. The country deserves closure. The chickens have come home to roost after politicians foiled the formation of a local tribunal to try the cases.” What Mr. Mutula meant here was that what he had warned them has now come to happen as he had wanted the cases to be handled locally through the formation of a local tribunal but the politicians refused. Now the cases were referred to The Hague. By then Mr. Mutula believed that the Kenyan courts were better than The Hague but Members of Parliament never listened to him when he was fronting for the formation of a local tribunal. 7. Conclusions This study examined utterances by politicians in Kenya on International Criminal Court (ICC) debate. This study notes that ICC is neither a tribal not apolitical process but a judicial one.. In addition, working within the discipline of Critical Discourse Analysis, our findings show clearly that beyond the politicians utterances there are generally hidden meanings. The analysis of utterances by politicians in Kenya shows that politicians have politicized the ICC cases in their debates. This has an adverse effect on the common citizen as they trade counter accusations. Their utterances can cause animosity among ethnic groups. It is also evident that two of the accused that is Mr. Sang and Mr. Muthaura have not participated in the debate as they are not politicians.
References Byram, F. (2010). Ideology and Political Discourse: A Critical Discourse Analysis of Erdogan’s Political Speech ARECL Vol. 7 pp. 23-40. Edwards, J. (2006). ‘Language Attitudes’, in Brown, K. (ed.) The Encyclopedia of Language and Linguistics. Vol. 6 Oxford: New York:
Pergamon Press, pp. 324-331. Eldelman, M. J. (1977). Political Language: words that succeed and policies that fail. New York: Academic Press. Fairclough, N. (2000). New Labour, new language? London: Routledge. Fairclough, N. (1993). Discourse and Social Change. Cambrige: Policy Press. Fairclough, N. (1989). Language and Power, London: Longman. Foucault, M. (2000). The Essential Works of Foucault (vol. 3, Power). New York: The New Press. Meyerhoff, M. & Ebooks Corporation (2006). Introducing Sociolinguistics. A bingdon: Routledge. Ojwang’, B. O. (2002). Multilingualism and Political Disintegration in Kenya in Etzold, C. and Mutuku, S. K. (eds.) Institutionalizing
Democracy in Kenya: Prospects and Challenges Workshop preceeding, Limuru Conference Centre pp 198. Jones, J. & Peccei, J. S. (2004). ‘Language and politics’, in Thomas, L. (ed.), Language, Society and Power. New York: Routlege. Van Dijk, T. A. (1988). News as Discourse. Hillside, N. J.: Erlbaum. Wareing, S. (2004) ’What is language and what does it do?’ in Thomas, L. (ed.), Language, Society and Power. New York: Routlege.


ISSN 2039-9340 Mediterranean Journal of Social Sciences Vol. 3 (11) November 2012
483
Development Strategy for Economic Status Elevation of Sri-utumporn Community
Based on Sufficiency Economy Philosophy through Systematic Approach
Amnaj Wangsu
Ph.D. Candidate Student of Development Strategy Program, Nakhon Sawan Rajabhat University.
Professor Dr. Direk Lerkrai
Major Advisor, Development Strategy Program,
Nakhon Sawan Rajabhat University.
Asst. Prof. Dr. Supawan Wongkumchan
Co-Advisor, Development Strategy Program, Nakhon Sawan Rajabhat University.
Asst. Prof. Dr. Thavajchai Sakpuram
Co-Advisor, Development Strategy Program,
Nakhon Sawan Rajabhat University.
Doi:10.5901/mjss.2012.v3n11p483
Abstract The research objectives were 1) to construct development strategy for economic status elevation of Sri-utumporn Community, 2) to experiment the constructed development strategy for economic status elevation based on Sufficiency-Economy Philosophy (SEP) through system approach, and 3) to determine satisfaction level of experiment group for implementation of development strategy for economic status elevation based on SEP through system approach. The research design was mixed methods of quantitative and qualitative approaches. The Multi-stage random sampling was used for sampling 102 households from 499 households of Sri-Utumpon Community, Nongkrot Subdistrict, Nakhon Sawan Province for qualitative research with focus group discussion for construction development strategy for economic status elevation based on SEP through system approach. The purposive sampling was employed for selection of experimental and control groups for Quasi-experimental research.The results were as followings: the constructed economic status elevation based on SEP comprised 4 system units included 1) raising more income, 2) reducing expenses, 3) increasing saving, and 4) paying debt gradually and regularly. The mean scores of knowledge and understanding, and acceptance of development strategy for economic status elevation based on SEP was higher than the control group at statistically significant level of 0.01. Their satisfaction level as a whole was at good level. Key Words: Development Strategy / Economic Status Elevation / Sri-utumporn Community / Sufficiency Economy Philosophy / Systematic Approach
1. Introduction Thailand is the geographical heart of South-East Asia and tropical rain forest climate. Its location and climate flavors for cultivation all types of grains, fruit and vegetables, moreover along from north to middle parts, there is important river called Cha Phra-ya River which is the main water supply for agricultural activities, therefore during half century, the majority of economic development based on the agricultural sector, although the government paid attention for industrial development for more than three decades. However, Thailand still the main exporter of rice grain and other agricultural products, therefore majority Thai people in rural are still in agricultural sector (The National Economic Development Board Office of the Prime Minister, 2007). Thailand experienced rapid economic growth between 1985 and 1996, and is presently a newly industrialized country and a major exporter. Tourism also contributes significantly to the Thai economy

ISSN 2039-9340 Mediterranean Journal of Social Sciences Vol. 3 (11) November 2012
484
(The World Bank, 2011). The World Bank has upgraded Thailand’s income categorization from a lower-middle income economy to an upper-middle income economy in July 2011. This is due to Thailand’s progress in social and economic development, despite facing a number of financial, economic and political challenges. As such, Thailand has been one of the great development success stories, with sustained strong growth and impressive poverty reduction. In the decade that ended in 1995, the Thai economy was one of the world’s fastest growing at an average rate of 8-9% per year. After recovering from the Asian Crisis of 1997-1998, the Thai economy took off again, with growth averaging about 5% per year in the period 2002-2007. Primarily due to the high rates of economic growth, poverty has been falling steadily since the late 1980s. Over the last decade, poverty has been reduced from its recent peak of 21% (a result of the 1997 crisis) to about 8% in 2009. Poverty in Thailand is primarily a rural phenomenon, with 88% of the country’s 5.4 million poor living in rural areas. Furthermore, in 2010, Thailand’s economic growth slowed because of global economic conditions and political uncertainty. However, Thailand’s economic activity is gradually returning to normal, with quarterly economic growth rates now closer to the levels often seen before the global financial crisis began in 2008. For 2011 as a whole, the World Bank is predicting economic growth in Thailand of over 3.5% (The World Bank, 2011 and Wikipedia, 2012). In Thailand, “Sufficiency Economy is a philosophy that directs the livelihood and behavior of people at all levels, from the family to the community to the country with regarding national development and administration. Its concept is similar to “Middle Path”’ which is one of four Buddhism principles as “Four Noble Truths”. Especially in pursuing economic development in keeping with the world of globalization, Sufficiency means moderation and reasonableness, including the need to build a reasonable immune system against shocks from the outside or from the inside. Intelligence, thoughtfulness, and extreme care should be utilized to guarantee that all plans and every step of their implementation are based on knowledge. Simultaneously, they must build up the spiritual foundation of all people in the nation, chiefly state officials, scholars, and business people at all levels, consequently they are conscious of moral integrity and honesty, hence they struggle for the suitable wisdom to live life with tolerance, diligence, self-awareness, intellect, and thoughtfulness. Finally, it should sustain the balance and be ready to manage rapid physical, social, environmental, and cultural changes from the outside world (Krongkaew, 2003 and Thiengkamol, 2007). Household debt in system, majority was occurred from house and land purchases. It might caused by measurement of real estate stimulation with promotion of tax deceasing for buying. On the other hand the household debt outside system was occurred from consume product buying. Therefore, considering from income, expense, and debt of household in term of region, it was revealed that Metropolitan Region (covered Bangkok and 3 provinces of Nonthaburi, Pathumthani, and Samutprakarn) had household income with 37,732 Bahts that higher than other region but it was discovered that the expense and debt per household was higher that other region as well. However, comparing among income, expense and debt per case, it was found that overall country since 2007-2009, the average of income was more than essential expense for living and it was also disclosed that income and expense were still gradually increased and proportion of household debt per income has declined while amount of debt has increased from 68,405 to 134,699 Bahts. Analysis of income distribution, it was found that unequal income per individual per month had decreasing trend with average increasing from 5,494 Bahts in 2007 to be 6,319 Bahts in 2009 in every group of society (National Statistics Office, 2009).
The concept of Thai lifestyle with Middle Path of Buddhism was introduced to meet self-dependent after economic crisis in 1997-1998, particularly, economy sufficiency comprised increasing income, decreasing expense and living with adequate status according to personal status by adopting the Sufficiency Economy Philosophy from remarks made by His Majesty King Bhumibol Adulyadej throughout his 58 years of the throne (NESDB, 2004a). In order to apply for liberating from debt, they have adjusted way of thinking, way of life and behavior with real understanding of sufficiency for every people and family based on interdependence among people in community by learning together with intelligences to practice and continuous adaptation (Wasi, 2001). Development of economic way of life for household in term of self-sufficiency by avoiding the supplies, we are not own by ourselves to decrease or liberate debt and decrease expense for household (Tantivechkul, 1998). This was come out from research titled “To study problems and causes of accumulated debt of customer of Bank for Agriculture and Agricultural Cooperatives”, the finding showed that the main accumulated debt of agriculturist was caused by high capital and expense for cultivation including high household expense (Aktaweewatanadej, 2002). Moreover, another research studied on “Factor Affecting to Accumulation of Loan” also revealed that the expense for consumption increasing and expanding, particularly, occurring due to imitation for high status people to buy unnecessary electrical appliances (Thammasena, 2002). Nevertheless, there were other different researched about agriculturalist debt such as the study on “Development Model of Agriculturist Loan Payment”, it proposed the guideline for loan payment with training, information sending, supervising, and continuous monitoring and these aid agriculturist to have knowledge and understand for loaning and guideline for intention loan payment and practicing for saving (Rungvitayakarn, 2003). Increasing repay made debt decreasing, the research was conducted on “Study of Saving in Extinguishment Repay Project of Bank for Agriculture and Agricultural Cooperatives at Chakarach

ISSN 2039-9340 Mediterranean Journal of Social Sciences Vol. 3 (11) November 2012
485
Branch”. It showed that saving or depositing was not regular and few because it related to income (Srisaknok, 2004). However, the attempt to decrease dept burden, it might cause lack of liquidity in the country, beside the debtor should control expense to balance with income by recording or accounting income and expense. On the other hand, they should be saving deposit increasing and good discipline for financial management. If we left household debt burden increasing in every year, it might be difficult problem to solve and finally affected to main economic in country. Sri-Utumpon Community, Nongkrot Subdistrict, Nakhon Sawan Province is also an agricultural area that locates in the lower part of Cha Phra-ya River of North region of country. Commonly, Thai society has recognized that the agriculturists are the poorest people of country because they have fallen with trap of capitalism due to globalization (Thiengkamol, 2009c). It was reported in 2009, global economic crisis was influenced to cause debt burden as whole country, particularly, and it was found that over 60 percents of Thai people had average debt with 134,699 Bahts per household per year but average income of household per month of 20, 903 Bahts was obtained from working with 72 percents and the left was income from interest, income in term of social welfare. The main debts were house and land loan after the government had measurement of real estate stimulation. While the expense was 16,205 Bahts per month with majority of 34.2 percents for food and drink, subsequence were shelter and household appliances with 20.1 percents and transport and vehicle with 17.7 percents. Moreover, there were other expenses excluded consumption such as tax, gift, insurance premium, lottery, and interest paying with 12.1 percents (National Statistics Office, 2009). Sri-Utumpon Community, Nongkrot Subdistrict, Nakhon Sawan Province, people have economic activities along with traditional way of life in term of rural lifestyles, therefore on matter of economic crisis since 1997, it was found that there was problem accumulation with “Debt” from survey with agriculturists. Their major debts with 70 percents are both formal system and informal system (Agriculture Office of Mueang Nakhon Sawan, 2010). Simultaneously, capitalism was introduced into Thai economic concept with full opening for private sector with free, while the government sector would interfere in only some case that is related to the nation security (Institute for the Promotion and Development of Learning Innovation, 2009). This caused people change their consumption behaviors of buying convenient household appliances that are over their needs. Even though, there is a community rice mill that has economic activity in company with rural lifestyles because it is implemented without systemic operation and they still lack of sufficiency, therefore, they faced with suffering problem of agriculturist debts with both formal system and informal system about 15,000-200,000 Bahts per household (Agriculture Office of Mueang Nakhon Sawan, 2010). The researcher had survey and interview inside community, it was found that majority of them still have household debts and they desire to solve these problems by search mean to decrease expense or liberate debt, therefore the target problem is to decrease expense to sustain economic status elevation in daily living. 2. Objective The research objectives were as followings: 2.1 To construct the strategy for economic status elevation of Sri-utumporn Community. 2.2 To experiment the constructed development strategy for economic status elevation based on Sufficiency Economy Philosophy through system approach. 2.3 To determine satisfaction level of experiment group for implementation of development strategy for economic status elevation based on SEP through system approach. 3. Methodology
The research design was implemented in steps by step as followings: 3.1 The qualitative research was used for searching Best Practice and Key Success
Factors through brain storming process integrated with SWOT (Strength, Weakness, Opportunity and Threat) analysis (Thiengkamol, 2011a). 3.2 Questionnaire for development strategy for economic status elevation of Sri-utumporn Community based on Sufficiency Economy Philosophy through systematic approach, it included as followings: System Unit 1: Increasing income. System Unit 2: Decreasing expense.

ISSN 2039-9340 Mediterranean Journal of Social Sciences Vol. 3 (11) November 2012
486
System Unit 3: Increasing saving. System Unit 4: Paying debt gradually and regularly. These were verified by 27 stakeholders from Sri-utumporn Community and experts. 3.3. The quantitative research was used for experimenting the development strategy for economic status elevation of Sri-utumporn Community based on Sufficiency Economy Philosophy through systematic approach of Nongkrot Subdistrict, Nakhon Sawan Province. The experimental group and control group were selected by purposive sampling technique. The experimental group of 30 participants was chosen from the ninth and fourteenth villages, while the control group of 30 participants was selected from the eleventh and the seventeenth village with voluntary mind and their economic status and occupations were nearly equivalent to those of the experimental group. 4. Results
4.1 Searching Best Practice and Key Success Factors through brain storming process integrated with SWOT with 102 households, the results were as followings.
1) Best practice according to Sufficiency-Economy Philosophy in aspects of expense decreasing, and household income increasing such as washing-up liquid production, work at community rice mill, domestication for household consumption, home-grown vegetable for household and sale. 2) Select to cultivate vegetables that are different from neighbors. 3) Have strong leader and devote for public. 4) Grouping for aid each others with regular and continuous meeting to propose problem and solve problems together. 4.2 Comparison between Experimental Group and Control Group on Knowledge and Understanding of Development Strategy for Economic Status Elevation of Experimental Group Results of comparison mean scores between experiment group and control group, it was revealed that the mean score of experiment group on knowledge and understanding of development strategy for economic status elevation of experimental group based on Sufficiency Economy Philosophy through systematic approach implementation was higher than control with statistically significant at level of 0.01, as presented in table 1. Table 1 Comparison between Experimental Group and Control Group on Knowledge and Understanding of Development Strategy for Economic Status Elevation
Knowledge and Understanding of Strategy for Economic Status Elevation
Experiment Group Control Group p
X S.D. X
S.D.
1. Systematic Economic Implementation 13.47 0.51 9.87 0.82 0.00**
2. Sufficiency Economy Philosophy 13.53 0.51 10.03 0.89 0.00**
3. Systematic Economic Implementation according to SEP 13.40 0.50 9.93 0.83 0.00**
4. Increasing Income 13.43 0.50 9.83 0.87 0.00**
5. Decreasing Expense 13.50 0.51 10.13 0.78 0.00**
6. Increasing Saving 13.50 0.51 9.70 0.75 0.00**
7. Paying Debt Gradually and Regularly 13.40 0.50 10.13 0.86 0.00**
8. Total Achievement 94.23 1.33 69.63 2.22 0.00**
** Statistically significant at level of .01

ISSN 2039-9340 Mediterranean Journal of Social Sciences Vol. 3 (11) November 2012
487
4.3 Comparison between Experimental Group and Control Group on Acceptance for Development Strategy for Economic Status Elevation of Experimental Group Results of comparison mean scores between experiment group and control group, it was revealed that the mean score of experiment group on acceptance of development strategy for economic status elevation of experimental group based on Sufficiency Economy Philosophy through systematic approach implementation was higher than control with statistically significant at level of 0.01, as presented in table 2. Table 2 Comparison between Experimental Group and Control Group Acceptance of Development Strategy for Economic Status Elevation
Acceptance of Strategy for Economic Status Elevation Experiment Group Control Group p
X S.D. X
S.D.
1. Systematic Economic Implementation 13.40 0.50 10.03 0.89 0.00**
2. Sufficiency Economy Philosophy (SEP) 13.53 0.51 9.83 0.95 0.00**
3. Systematic Economic Implementation according to SEP 13.57 0.50 9.80 0.89 0.00**
4. Increasing Income 13.47 0.51 10.10 0.80 0.00**
5. Decreasing Expense 13.43 0.50 10.20 0.81 0.00**
6. Increasing Saving 13.43 0.50 10.07 0.78 0.00**
7. Paying Debt Gradually and Regularly 13.60 0.50 9.93 0.87 0.00**
8. Total Achievement 94.57 1.43 69.97 1.92 0.00**
** Statistically significant at level of .01
4.4 Satisfaction Level of Experimental Group for Implementation of Development Strategy for Economic Status Elevation Based on Sufficiency Economy Philosophy through System Approach
Results of satisfaction level of experimental group for implementation of development strategy for economic status elevation based on Sufficiency Economy Philosophy through System Approach, it was found that in aspect of increasing income, decreasing expense, and paying debt gradually and regularly were at good levels and increasing saving was at very good level, therefore satisfaction level as a whole was at good level respectively, as presented in table 3.
Table 3 Satisfaction of Experimental Group for Implementation of Development Strategy for Economic Status Elevation Based on Sufficiency Economy Philosophy through System Approach
Strategies X S.D. Level Increasing Income 4.43 0.50 Good Decreasing Expense 4.46 0.50 Good Increasing Saving 4.56 0.50 Very Good Paying Debt Gradually and Regularly 4.36 0.20 Good Satisfaction as a Whole 4.45 0.43 Good 5. Discussion Holding meeting of 102 households from 499 households of Sri-Utumpon Community, Nongkrot Subdistrict, Nakhon Sawan Province with focus group discussion for construction development strategy for economic status elevation based on SEP through system approach, was found that there are 4 system units included 1) Increasing income, 2) Decreasing expense, 3) Increasing saving and 4) Paying debt gradually and regularly. The experimental group gain more knowledge and understanding including accepting Systematic Economic Implementation according to SEP seriously. Moreover,

ISSN 2039-9340 Mediterranean Journal of Social Sciences Vol. 3 (11) November 2012
488
these must be implemented continuously and consistently with good discipline of financial management. Simultaneously, they must not buy the unnecessary convenient appliances. In order to accomplish the debt liberation successfully, they should record household income, expense and saving critically because the account will assist them to realize their actual implementation along with development strategy for economic status elevation based on SEP through system approach. This development strategy will help them to be genuine self-dependent according to SEP.
References
Aktaweewatanadej, K. (2002). To Study Problems and Causes of Accumulated Debt of Customer of Bank for Agriculture and Agricultural Cooperatives at Ampur Muang, Prachuap Kiri Khan Province. Thesis of Master Degree (Public Policy). Chonburi : Burapha University.
Agriculture Office of Mueang Nakhon Sawan. (2010). Agriculturist Debt Reporting 2008-2010. Nakhon Sawan : Reporting by Agriculture Office of Mueang Nakhon Sawan.
Institute for the Promotion and Development of Learning Innovation. (2009). Economic Development. Retrieved from http://dnfe5.nfe.go.th/dnfe5_v2/frontend/theme/index.php Krongkaew, M. (2003). The Philosophy of Sufficiency Economy. Retrieved from http://kyotoreview.cseas.kyoto-
u.ac.jp/issue/issue3/article_292.html National Economic and Social Development Board (NESDB). (2004a). What is Sufficiency Economy? Bangkok, Thailand: NESDB. National Statistics Office. (2009). Survey of Household Social and Economic Status B.E.2552. Retrieved from http://service.nso.go.th/nso/nsopublish/download/files/socPBook52.pdf Srisaknok, S. (2004). Study of Saving in Extinguishment Repay Project of Bank for Agriculture and Agricultural Cooperatives at
Chakarach Branch. Thesis of Master Degree (Public Policy). Mahasarakham : Mahasarakham University. Thammasena, B. (2002). Factor Affecting to Accumulation of Loan at Roi-ed Branch. Thesis of Master Degree (Social Development).
Mahasarakham: Rajabhat Mahasarakham University. The National Economic Development Board Office of the Prime Minister. (2007). The Tenth Economic and Social Development Plan
(2007-2011). Retrieved from http://www.nesdb.go.th/Default.aspx?tabid=402 Thiengkamol, N. (2007). Globalization Administration. Bangkok: Saengchai Publishing. Thiengkamol, N. (2009c). Environment and Development Book2: Food Security. Bangkok: Chulalongkorn University Press. Thiengkamol, N. (2011a). Holistically Integrative Research. (2nd Edition). Bangkok: Chulalongkorn Press. The World Bank. (2011). Thailand Overview. Retrieved from http://www.worldbank.org/en/country/thailand/overview Wasi. P. (2001). Sufficiency Economy Based on Thai Culture. In way to Overcome Nation Crisis and Survival of That Society. Bangkok:
Puctharos. Wikipedia. (2012). Thailand .Retrieved from http://en.wikipedia.org/wiki/Thailand

ISSN 2039-9340 Mediterranean Journal of Social Sciences Vol. 3 (11) November 2012
489
Critical Factors Influencing Facility Maintenance Management of Tertiary Institutional Buildings in Southwest Nigeria
Akinsola, O. E.
Department of Building Technology
School of Environmental Studies, Yaba College of Technology E-mail:[email protected]
Hussaini P. O.
Department of Building Technology
School of Environmental Studies, Federal Polytechnic, Ede.
Oyenuga S.O.
Department of Estate Management School of Environmental Studies, Yaba College of Technology
Fatokun, A.O. (Correspondence Author)
Department of Building Technology
School of Environmental Studies, Yaba College of Technology. Nigeria Tel: +2348052314874. E-mail: [email protected]
Doi:10.5901/mjss.2012.v3n11p489
Abstract Building maintenance has until recently been a neglected field of technology in most of our governmental policy formulation and execution. This is reflected in the maintenance of housing stocks held in our various institution of Higher learning. Every Tertiary institutional building whether old or new requires being maintained and constitutes parts of our most valuable asset, providing learners with shelter facility for study, work and leisure. This project take as a look at the “Assessment of the Factors Influencing Maintenance Programme of Tertiary Institutional Buildings in Southwest Nigeria” through examination of environmental and climatic conditions, availability of funds, socio-political reasons, mishandling and overpopulation. Two hundred and fifty administered to were returned out of the Three hundred and fifty administered to Hostel occupants, Technical staffs and Maintenance organization heads. The method adopted was simple percentage and inferential statistical tool for the analysis of data. The findings of the study revealed that the claims of the Maintenance department to practicing combined maintenance of planned and unplanned are faulted. Findings revealed that they lacked the wherewithal to make it a success. This paper recommends that budget allocation for maintenance of tertiary institutional buildings be made by the government in view of the inflationary trend in the economy, adequate and skilful staff should be provided for the maintenance department to avoid delay in job execution, while rate of response to maintenance request, repair to damages and faults identified should be made faster. Keywords: Facility Maintenance Management, Tertiary Institution, Buildings, Facilities.
1. Introduction
Tertiary institution is considered throughout the world to be key to both individual and societal aspirations. For individuals, education beyond the secondary level is assumed to be the way to societal esteem, better paying jobs, expanded life options, intellectual stimulation and frequently a good time in the pursuit of any or all of the above.
For societies, tertiary institution is assumed to be the key to technology, productivity, and the other ingredients of international competitiveness and economic growth. Tertiary institution also shapes and preserves the value that defines culture. And it is believed to be a major engine of social justice, equal opportunity, and democracy. Tertiary institution

ISSN 2039-9340 Mediterranean Journal of Social Sciences Vol. 3 (11) November 2012
490
faces immediate pressure to preserve existing college of its campuses and enhance the capacity of its higher education system to address growing demands. In order to serve the current population of students, tertiary institution must maintain, renovate, and expand their building where necessary ad keep equipment and technology current to meet changing workplace needs. For higher institutions, the money for maintenance comes from the government as part of each school annual budget. This poses some difficulties for such institutions maintenance programme because expenditure from the government budget is not only adequate, and tied to strict financial regulations and payment control system.
The government release of maintenance budget for the year which might run contrary to the institution’s maintenance programme. The construction and development of capital projects in institution such as university is each university’s administration priority; thus new buildings are designed and constructed as hostels, classrooms or facility buildings every year while little or nothing is allowed for maintenance of such facilities from the planning stage. Many times without numbers, School programme are distorted and becomes irregular, hence making maintenance programme difficult. Academic environment sometimes becomes volatile which makes facilities in the higher institutions a high risk insurance property; incidence of complete destruction and willful damage are common occurrence this differentiate the institutions environment from normal environment. In view of these numerous problems the study undertook the assessment of those factors influencing maintenance programme of tertiary institutional buildings in Southwestern Nigeria with a view to determine the effect of inadequacy of maintenance staff, environment, socio political, management decisions on the maintenance programme of such institutions. The most common problems in the institutions are also investigated while the factors leading to them are examined.
This sudden boom exerted higher pressures on designers. This designers in most instance embraced imported westernized designs meant for temperate climate but unsuitable to Nigerian environment; Mahmoud (1997) said such design cloning not only come with its attendant maintenance problems but when urgency is also attached to their production; draw on system and materials without having enough time to test their relevance and suitability works on construction sites been handicapped by the lack of an experienced workforce; construction methods, harsh climatic conditions, presence of chlorides, and sulphates are some of the factors generating need; a well planned system which reflect adequate keeping the building and its fabric in functional state of performance. 2. Past Works on the Study The performance of tertiary institution buildings and their components depends to large extent on continuous and planned periodical maintenance, which challenges the management and maintenance mangers, to institute precise planning based on a well structure maintenance programme (shohet, 2002). Seeley (1976) stated that it is highly desirable to produce maintenance free building; the task according to the study is hardly feasible. Amusan (2003) opined that all elements of houses deteriorates at a greater or lesser rate dependent on the materials, design adequacy quality of workmanship environmental condition; function and use of the building the economic boom of the seventies and eighties made the country to witness rapid development in all facets of its infrastructural facilities amongst which are educational buildings. 2.1 Climatic Conditions Southwest Nigeria is located in the rainforest belt of Nigeria with temperature ranging from 22 degree Celsius to 35 degree Celsius. In this region, there are extreme variations in humidity and radiation as the belts transits between rainy season of October to March and dry season of April to September. The university town of Lagos is located in the lowland of ocean belt characterized by usually heavy down pours and flooding; rain water is accompanied with sulphates and chlorides which are agents of corrosion on metal products. The ravaging effects of this is seen on the buildings and properties located along the coastal line of Ahmadu Bello Street, Bishop Oluwole street in Victoria island. University of Lagos has properties like theatre, classrooms, and office accommodations located near the lagoon front, which opened them to avarice of whether directly and indirectly, by the sulphates carrying rainwater from the ocean. In the dry season, the absence of hills and thick forest too dampen the effect of the ravaging wind allows it have a direct impacts on the properties. Such impacts sometimes increases aging process of the building while elements like roofs, window – panes, hand- railing are affected making repairs necessary. Hence, increasing the maintenance need of the buildings. The problems highlighted here as confronting university of Lagos is also applicable to Yaba College of Technology, which is located within 1 kilometer of one another. University of Ibadan and state polytechnic is located in the relief town of Ibadan, which contract to Lagos is located on a high land.

ISSN 2039-9340 Mediterranean Journal of Social Sciences Vol. 3 (11) November 2012
491
The town enjoys relief rainfall regularly and windstorm associated with Lagos environment is less prevalent. The effect of sulphates and sulphides in rainwater is highly reduced. The clear skyline with varying temperature however encourages radiation of heat from the sun to have a degrading effect on the properties. The presence of iron in the rainwater is noticeable from the corroding zinc roof covering that corrodes shortly after installation and get discolored. Mamoud, (2000) in his study, confirmed that clear skies promote high level of radiation and that climate is an important factor of influence in maintenance needs. Obafemi Awolowo university is however located on a lowland and rainforest belt of old western Nigeria, where regular rainfall [promotes the growth of tree crops like cocoa and kola Nut University enjoys similar climatic conditions with her counterpart in Ibadan.
2.2 Soil and Water The environment for building in Lagos shoreline and lagoon front or land adjacent to or within proximity is particularly very hostile because of chlorides and sulphates pressure in soil and water. According to Shamsideen (2004), the pressure of chlorides in soil promotes rising water level which results in rising damps. A survey carried out by Iyagba (2005) revealed that most buildings along the coastline experiences rising damp their wall, which encourages algae growth that consequently leads to sick building syndrome. The salinity of the soil and water in the presence of high ground water levels, is noted to affect concrete in foundations and other parts of the building (Mahmoud, 2000).
This claim was however contradicted by Fatokun (2005) whose study revealed that presence of salt in water and soil increases the compressive strength of concrete in foundation. This contribution might be due to short period of the study by Fatokun (2005), which covered only six months. 2.3 Building Materials Mahmoud (2000) listed factors which influence choice of materials in a locality as availability, climate, economy and building techniques. The growth in population, which resulted in increase of the age brackets that required higher education, had necessitated the needs to build more classroom, theater, office blocks and hostel accommodations. The advancement in management techniques and the discovery of the fact that less duration of contract execution implies less cost have appreciably influenced the choice of building materials and systems. The construction Booms in the oil boom period; and increased construction works led to importation and use of various building materials of which substantial quantities are inferior. Various tests carried out on selected building materials indicate some do not meet the required standards (Mahmoud, 2000 and Windapo, 2004). Steel reinforcement ranked highest in this study.
The other approach is to adopt the use if in houses maintenance crew to oversea the daily maintenance of the facilities. This method also has its own problems which are: - In adequate knowledge of specialized maintenance works - Unmotivated civil servants - Inadequate numbers of skilled maintenance works to work with. 3. Survey of Tertiary Institutions in Southwest Nigeria Data for the study were obtained from a structural questionnaires served on a target population. The questionnaires were administered on selected respondents in the tertiary institutions across southwestern Nigeria. The questionnaire was structured to capture information from maintenance heads, technical staffs and office /hostel occupants. 350 questionnaires were distributed and response was from 275 respondents. Mean item score (MIS) were computed from the responses to the factors listed in the scale of likert used for the study. The factors were then ranked in order of importance, effectiveness and agreement respectively. The formulae used was MIS = 5n5 +4n4 + 3n3 + 2n2 +n4 N Where: n = frequency of occurrence of the options N= total number of respondents

ISSN 2039-9340 Mediterranean Journal of Social Sciences Vol. 3 (11) November 2012
492
3.1 Survey Results Table 1. Maintenance Problems in Tertiary Institution
Maintenance Problem Respondents
Ranking MIS
Irregular cleaning 10.0 1.0 6.6 Untimely replacement of bad fitting (plumbing) 8.0 2.0 8.25
Plumbing leakage 8.0 2.0 8.25 Untimely replacement of defective fitting 7.0 3.0 9.43 Untimely disposal of refuse 7.0 3.0 9.43 Algae growths on walls 6.0 4.0 11.0 Irregular dislodgement of septic tanks 6.0 4.0 11.0 Roof leakage 6.0 4.0 11.0 Non –instant connection to generator 4.0 5.0 16.5 Untimely response to repair call 2.0 6.0 33.0 Irregular sweeping of offices, classroom and Hostel 2.0 6.0 33.0 Total 74.0
The most occurring amongst maintenance problems from the sampled respondent are irregular cleaning, untimely replacement of bad fittings (plumbing), and plumbing leakage. Others followed suit as can be seen in table 1 above. Table 2. Factors influencing defects occurrence in tertiary institution buildings.
Influencing factors Respondents Ranking MIS Environmental&climatic conditions 28 1 2.64 Availability of funds 25 2 2.96 Socio-Political reason 12 3 6.16 Lack of appropriate knowledge of maintenance 9 4 8.22 TOTAL 74
The respondents in all agreed that environmental and climatic conditions, availability of funds, socio – political reason and lack of appropriate knowledge of maintenance influence defects occurrence in a tertiary institution buildings in southwest Nigeria. Table 3. Factors leading to maintenance problems
Factors Ranking MIS COMMENTS Lack of foresight for projection 1 4.1 Most leading factor Inadequate experience of designer 2 1.8 Moderate leading factor Client insistence constraints 3 1.4 Least leading factor Non incorporation of user’s need into design 3 1.4 least leading factor Non –introduction of feedback from previous Works into design
3 1.4
Use of inappropriate materials 1 4.1 Most leading factor Poor workmanship 2 2.4 Moderate leading factor Poor control mechanism 2 2.4 Moderate leading factor Poor funding 1 5.0 Most leading factor Poor management attitude to maintenance 2 4.5 Most leading factor Inadequate maintenance tool 3 4.1 Next after most leading Absence of effective maintenance culture 4 2.3 Moderate leading factor Ineffective use of maintenance vote 4 2.3 Next after moderate Absence of maintenance plan 5 1.4 leading factor Least Non- involvement of user’s idea on maintenance 6 0.5 Least leading factor Absence of effective maintenance staff 6 0.5 Least leading factor

ISSN 2039-9340 Mediterranean Journal of Social Sciences Vol. 3 (11) November 2012
493
The analysis of table 3.0 highlighted the factors contributing to defects occurrence in building as ranked by the respondents. These problems are classified into three viz factors at design stage which contributes to future development of defect. In this stage, lack of foresight for projection of user’s needs is ranked most followed by inadequate experience of designer.
While in construction stage, use of inappropriate materials is chosen ahead of poor workmanship and poor control mechanism. However at user’s stage; poor funding is ranked most, followed by poor management attitude and inadequate maintenance tool while non- involvement of user’s idea in maintenance is considered as not contributing much to defect developments in building. Table 4. Common Maintenance Problems in Tertiary Institution Buildings Hostels blocks Admin/Class blocks
Maintenance Problems
Respondents MIS Respondents Ranking MIS
Blocked drain 3 8.2 3 1 8.33 Warped doors 2 12.3 3 1 8.33 Broken pipes 2 12.3 2 2 12.5 Cracked titles 2 12.3 2 2 12.5 Loss of water pressure
2 12.3 2 2 12.5
Faulty electric accessories
2 12.3 2 2 12.5
Cracked sanitary fittings
2 12.3 2 2 12.5
Loss of shower head
1 24.6 2 2 12.5
Rusty balustrades 1 24.6 1 3 25 Broken pain /louvers
2 12.3 2 2 12.5
Leaking roof/slab 5.6 4.39 4 1 6.25 There is agreement between the respondents, that is the hostel occupants and the office users that the most occurring defects in both hostels blocks and office apartments surveyed, are blocked drain, loss of water pressure, faulty electric accessories and broken pipers which are ranked highest. Cracked walls, cracked ceiling and filled septic tank are rare occurrence. Table 5. Factor influencing maintenance programme
Factors MIS Ranking Comment Wear and tear 4.3 1 Most influencing factors Fittings and components ageing 3.0 2 Second most influencing factor Exposure to weather 2.70 3 Third most influencing factor Inadequate fund 4.70 1 Most influencing factors Delay in release of funds 2.30 2 Second most influencing factor Over population 3.0 1 Most influencing factors Approval protocol 2.70 1 Second most influencing factor Delay in report 2.0 3 Third most influencing factor Willful damage 1.5 4 Fourth Most influencing factors Delay in response to complaint 1.0 5 Least influencing Factor Delay in response to complaint 4.0 1 Most influencing factors Mishandling 3.0 2 Second Most influencing Factor Unavailability of appropriate tools 3.0 2 Second Most influencing Factor
The result of the analysis in table 5.0 indicated that inadequate find is the most influencing factor of maintenance programme while the least influencing factor is delay in response by the management and maintenance department. This result could be appreciated in that in table 5, willful damage came a distant 4th in ranking. The reason for this might not be

ISSN 2039-9340 Mediterranean Journal of Social Sciences Vol. 3 (11) November 2012
494
unconnected with the fact that at point of decision certain funds might have been set aside while at programme development, how much available to the institution may play a significant role on the planning process and strategy. Table 6. Factor Influencing Management to Execute Maintenance Works
Factors MIS Ranking Comments Building Characteristics 5.0 1 Most influencing factor Building status 5.0 1 Most influencing factor Building age 5.0 1 Most influencing factor Building complexity 4,3 2 Moderately influencing factors Building size 3.7 3 Next after moderate influencing Building shape 1.0 4 Least influencing factor Building location 1.0 4 Least influencing factor Political factors User status 4.7 1 Most influencing factor Use of buildings 3.7 2 Moderately influencing factors User’s persistent complaint 2.3 3 Next after moderate influencing Management decision 2.0 4 Least influencing factor Economic Factors Proximity to defect generating factors 5.0 1 Most influencing factor Age of building 4.7 2 Moderately influencing factors Availability of funds 4.3 3 Next after moderate influencing Willingness of users to foot the bill for later refund
2.7 4 Least influencing factor
First come first treated 2.3 5 Next to least influencing factor Respondents in table 6.0 when asked to ranked what they in their opinion influences management decision to effect repairs, chose under building characteristics, status and age as the most influencing factor while they believed that building location and shape had little to do with decision to maintain it. On socio political factors, users status is best considered by the management as perceived by the respondent to management arbitrary decision and under economic factors, proximity to defect generating factors, age of building, revenue generating status of the building and availability of fund are the most influencing of the factors. In overall, however, it is seen from table 6.0 that economic considerations takes uppermost position in the minds of the management building characteristics and socio political factors in taking decision to effect repair in a building. 4. Discussion of Findings 4.1 Frequently Occurring Maintenance Problems In the tertiary settings of property maintenance and management the frequently occurring problems as survey revealed are mostly of plumbing and electrical natures the damaged fittings inn both hostels and offices, plumbing defects such as broken pipes and blockades filled up septic tanks and broken panes and louvers were the most frequently occurrence defects in the tertiary institutions surveyed. The occurrence of theses defects in the hostels may not be unconnected with the usual over population of the students’ hostels and resultant effects of mishandlings of these facilities. 4.2 Management Decision to Effect Repairs. In taking decisions to effect, repairs in a building or facility, the management is faced with certain factors to consider before finally giving their consent and approval for the repair works to be carried out. These factors are identified as environmental which includes building location, age, status political factors which are management decisions, users status, fund availability, revenue generating status of building, willingness of users to foot bill for refund, proximity to defect generating factors like lagoon front in university of Lagos were the most influencing while arbitrary management decision, the issue of first come first serve and willingness of users to their bill had least influence. It would have been expected that users who had the fund be accorded priorities to salvage time but such approval; might be construed to be inefficiency and might be used to rate the management performance. This might be the reason why it’s not encouraged influencing their decisions.

ISSN 2039-9340 Mediterranean Journal of Social Sciences Vol. 3 (11) November 2012
495
4.3 Factor Influencing Maintenance Programmes The findings in table 5.0 and 5.1 revealed that environmental and climate conditions availability of funds and socio –political factors are all influencing the tertiary institutions maintenance programme. This findings corroborated in part similar work of mahmoud (2000) in Riyadh university where listed factors influencing maintenance programme of the university as environmental and climate conditions contract system organizations e.t.c.
However, fund availability, with socio [political reason among others like willful damage, vandalism, indecision of management (table 4. 18) is unique to Nigerian environment.
The problem of fund available for maintenance was treated by (Oladapo, 2004) where he painted the picture of under-funding and went to suggest that 10% of cost of constructions of the building should be set aside for effective maintenance.
The unstable academic session characterized by frequent closure occasioned by students unrest is part of our academic experience, in the course of unrest, student embark sometimes violent demonstrations vandalisms, and willful damage which deplete the stock of available sound structures. Most universities that aware of these problems had instituted their programme to alight with development.
Major facilities in the university are overhauled, repaired and refurbished during closure, which is alien to universities in developed economy. The decision to effect repairs by the management when faults are reported is influenced mostly by economic factors such as fund availability, order of fault report, revenue generating status of the building age of building followed by building characteristic of location, complexity size, status and age; while political factors in the least influencing amongst which are management decisions, user, status users persistent complaints and use of buildings. 5. Summary of Findings From the analysis of the results certain factors influencing maintenance programme of tertiary institution’s buildings become obvious as poor time management, lack of effective maintenance culture, High cost of maintenance works; inadequacy of skilled maintenance workers, in availability of tools and equipment to use, ageing of components and fillings, willful vandalism and exposure to weather. Also included in the list of these factors are those classified as management factors and these are: approval protocol, Delay in reporting defects, delay in release of funds from management/bursary and political factors like user status, user record of persistent complaints and use of building. Whereas those found and classified as economic factors are first come first treated, revenue generating status of building, user’s willingness to foot bill for later refund and proximity of building to defect generating factors like lagoon front in University of Lagos. 6. Conclusion and Recommendations 6.1 Conclusion The following conclusions made from the research in line with the findings that inadequacy of staff and lopsidedness in their distribution across the professional discipline exerts significant influence on prompt and qualitative delivery of service to end users measure of efficiency of maintenance works, users measure of efficiency of maintenance departments is anchored on present state and conditions of facilities in the institution as well as prompt response to complaints by both management and maintenance departments while the common maintenance problems in the tertiary institutions are in the area of services.
This is more in plumbing and electrical works while cleaning is equally a major problem in routine maintenance works. The factor of environment and climatic conditions were also found to influence to a large extent, the effectiveness of the tertiary institution’s maintenance programme while availability of funds is the most critical factors influencing the maintenance programme of tertiary institutional building in Southwest Nigeria. It is also noteworthy that socio-political reason is an influencing factor of maintenance programme and Building Characteristic e.g. Building complexity, building size, building status and building age are also factors that influence management decision to effect repairs on a building maintenance. Epileptic academic calendar characterized by unending students unrest is equally a major factor in effecting a workable maintenance programme in tertiary institutions in Southwest Nigeria while willful damage and vandalism also contributes to defects manifestation and maintenance needs in Nigerian university system.

ISSN 2039-9340 Mediterranean Journal of Social Sciences Vol. 3 (11) November 2012
496
6.2 Recommendations The following recommendations are proposed in line with the conclusions on how to improve the maintenance programme of tertiary institutional building:
• The budgetary allocation for maintenance of tertiary institution by the federal Ministry of Education is grossly inadequate. The ministry should allocate a substantial budgetary allocation to the maintenance of the facilities and other infrastructures which should be reviewed from time to time to accommodate inflationary trends.
• Adequate training should be encourage among staff of the works and services department to acquire the necessary skills for continual maintenance of the facilities in their schools.
• Approval protocol should be made flexible in order to allow maintenance needs to be met immediately • Appropriate tools and equipment should be made available for maintenance to be effective • The management should endeavors to provide maintenance department with adequate staffs, because most
departments are understaffed and this in turn delays job execution. • The rate of response to maintenance need, damages, and faults reported should be made more faster
because minor fault get expanded if immediate action is not taken and this increase the cost of repair. • Management and senate of each university should evolve a conflict resolution technique that will ensure that
steady and stable academic calendar is sustained and consequently eliminates willful damages and vandalism associated with students’ unrest.
• An enlightening programme should be undertaken by ways of hand bills and postal educating students on collective responsibility of keeping the hostel unvandalized and properly maintained.
References
Adenuga O.A, and Iyagba R.O. (2003, best maintenance practice for public building Journal of Housing Corporations, 5, 10-4. Amusan, J. (2003). Evaluation of factors influencing hostel maintenance in university of Lagos, B.Sc Building dissertation, university of
Lagos, Nigeria. Eze N.(2004) African industrial –organizational psychology. Pumark press limited, lagos. Fatokun A.O. (2005). Salinity Effect on the Compressive Strength of Reinforced Concrete Buildings. HND Building Technology
dissertation, Yaba College of Technology, Nigeria. Mahmoud M.I (1997). Assessment of the factors influencing the maintenance programme Of a large University. Building in Riyadh.
Journal of college of architecture and planning, 5, 22-28. Oladapo O. (2004). Assessment of factors influencing housing maintenance priorities in Tertiary institution in south west Nigeria. Ph.D
construction management, Obafemi Awolowo University Seeley I. (1976). Building maintenance, Macmillan press limited, London. Shamsideen A. (2005). The effect of chlorides on submerged concrete elements. D Building Dissertation, Yaba College of Technology,
Nigeria Shoet, I M. (2002) integrated maintenance monitoring of hospital. Construction management And Economics, 21,219-288. Shoet, I. M. (2002). Key performance indicators for maintenance of health-care Facilities. Facilities, 21(2), 5.12. Shoet I. M . and Lavy, S. (2004). Department of integrated health care facilities Management model. Facilities, 22(5), 129-140. Windapo, A.O. (2004). Factors constraining the use of local building materials in Housing delivery in Nigeria. Builders Focus 1, 31-36.

ISSN 2039-9340 Mediterranean Journal of Social Sciences Vol. 3 (11) November 2012
497
Model of Environmental Education with Integration of Life Cycle
Assessment in term of Recycling Behavior
Sirikanya Donkonchum
Department of Environmental Education Faculty of Environment and Resource Studies
Mahasarakham University, Mahasarakham 44150, Thailand
Nongnapas Thiengkamol
Major Advisor, Department of Environmental Education Faculty of Environment and Resource Studies
Mahasarakham University, Mahasarakham 44150, Thailand
Chatchai Thiengkamol
Co- Advisor, Director of Research In Motion Co., Ltd. 599/321 Baan Klang Krung, Jatujuk Sub-district, Jatujuk District
Bangkok 10900, Thailand
Doi: 10.5901/mjss.2012.v3n11p497 Abstract: The objective of this research was to develop a model of environmental education with integration of Life Cycle Assessment (LCA) in term of recycling behavior. Moreover, understating on LCA in term of recycling behavior. Populations were 37,156 undergraduate students of academic year 2012 of Mahasarakham University. Simple random sampling was employed to select the sample. Questionnaire was used as instrument for data collecting. Pearson correlation and Path Analysis were used for data analysis. The results revealed that psychological traits in terms of goal of life (GL) showed directly affected to inspiration in aspects of role model (RM) with .554, It also showed directly affected to LCA in term of recycling behavior (RC) and energy consumption behavior (EB) with .604 and .598 while RM showed directly affected to RC and EB with .621 and .565. Moreover, psychological states in terms of religion belief (RB) showed directly affected to RM with .631 and it also directly affected to RC and EB with 622 and .601. Considering on environmental education integration with LCA in term of recycling behavior, in aspect of environmental attitude (AT) showed directly affected to RM with .611 and it showed also directly affected IE with .632 and directly affected to RC and EB with .629 and 605. EB showed directly affected to RC with .522. Key Words: Development / Environmental Education Model / Integration / Life Cycle Assessment/ Recycling Behavior 1. Introduction Presently, world community has recognized that recycling behavior is a mean to retard the waste accumulation and natural resources depletion. Recycling behavior is an effective way to cure the global environmental problems due to human activities. The environmental education principles include knowledge on ecological systems and environmental problems, preventing new problems from material production from natural resources. In addition, it includes the affective domain: the attitudes, values, and commitments necessary to build a sustainable society. Additionally, it also includes opportunities to build skills that enhance learners’ problem-solving abilities, such as communication, public speaking, persuasive writing, researching, interviewing, and data analysis including group process of leadership, decision making, and cooperation. Additionally, understating on Life Cycle Assessment (LCA) in term of recycling behavior, will stimulate and inspire people to have public mind or public consciousness to raise their awareness and change attitude and behavior to realize the real value of material that covers to the environmental impact consequences (European Topic Centre on Waste and Material Flows, 2004 Thiengkamol, 2009a, Thiengkamol, 2009b, Thiengkamol, 2011e, Thiengkamol, 2011f, Thiengkamol, 2011i, Thiengkamol, 2011i, Jumrearnsan, & Thiengkamol, 2012, & Morgan, & Hughes, 2006).

ISSN 2039-9340 Mediterranean Journal of Social Sciences Vol. 3 (11) November 2012
498
In this research, LCA is covering the three paper cycle system areas of raw materials and forestry, paper production, and disposal/recovery. The raw materials are woods from cultivation for this specific purpose of paper production including considering on recycling behavior of paper. In order to inspire the undergraduate students to understand the importance of recycling behavior of paper based on LCA concept. Even though, they are not facing with shortage of paper and majority of them don’ t face the environmental impact of paper production process directly but some of them who live close to the paper production factory might understand better about the environmental impact, especially, wastewater discharge from the plants. This caused different harmful effect to water resources and the quality of life.
Additionally, recycling behavior based on LCA concept would be introduced the concept of energy consumption during production process, transportation, and distribution. From research findings, the overall results of the LCA studies indicate that recycling of waste paper has a lower environmental impact than the alternatives of land filling or incineration. The results is very clear in the comparison of recycling vs. land filling, and less pronounced but also clear in the comparison of recycling vs. incineration. Nevertheless, LCAs should be considered in terms of the environmental consequences occurring when choosing one alternative over the other recycling method based on energy consumption (European Topic Centre on Waste and Material Flows, 2004).
In 1997 the academics in psychology, leading by Magnusson and Endler, proposed the textbook called “Personality at the crossroads” that compiled the theories of human behavior on integration of mind and states together (Magnusson, D.,& Endler, N.S., 1997, Magnusson, 1999, Magnusson, 2001 & Punthumnavin, 2008). On the other hand, the Interactionism model is a popular theory that was universal recognize, even though in Thailand, since this model assists the academics to perceive a point of view on studying of causal behavior expression in different dimensions such as cause of trait, cause of state, cause of mind, and cause of co-influence or interaction between characteristics of trait and state of mind of actor. The holistic interactionist paradigm offers a prospect with individual characteristics variable factor affecting towards behavior (Cervone, 1991; Magnusson, 2001, Pervin, & John, 1990, & Cairns, 2001). The complexity of the processes at work implies that the operation of the organization cannot be explained by only one factor but there are the rest factors on a group of psychological and biological processes of a holistic nature (Susman, 2001).
However, with numerous literature reviews of behavioral science, it was found that there is no research was done on factors and causes that affecting towards behavior of conservation of natural resources and environment directly. In particular, the psychological traits, psychological states, and environmental education with integration of LCA influencing to environmental behavior change including recycling behavior based on LCA for energy conservation. Presently, it is very rarely and there is no research is holistically integrative done about environmental education when it compared with other aspects of relating factors affecting to environmental behaviors (Thiengkamol, 2011i, Thiengkamol, 2011j, & Jumrearnsan, & Thiengkamol, 2012).
Nonetheless, Inspiration of Public consciousness propositioned by Thiengkamol, should be paid notice for natural resources and environment conservation. She uttered that that public consciousness or public mind based on inspiration from insight and inspiration different from motivation because inspiration needs no rewards or admirations. Inspiration of public consciousness or public mind, especially, for natural resources and environment conservation, one doesn’t receive any reward, admiration or complement for ones act for natural resources and environment conservation. Inspiration might be occurred due to appreciation in a person as role model or idle, events, situations, environment, media perceived such movies, book, magazine, and internet. (Thiengkamol, 2009a , Thiengkamol, 2009b, Thiengkamol, 2011a, Thiengkamol, 2011e, & Thiengkamol, 2011f).
Environmental education process aimed to change human behavior based on knowledge and understanding, awareness and consciousness raising, values, belief, attitude, and behavioral change. Therefore, it should be provided through every level of education in Thailand, particularly, in the university level since they are the young generations of the world hope to save the world, therefore they should take action and responsibility to protect biodiversity and ecological system through natural resources and environment conservation. Mahasarakham University is a leading university of Northeastern of Thailand that opens the faculty of Environment and Resources Studies. Therefore, it is its burden to carry out to produce young leaders and volunteers for the country to have better quality of life. This is pertinent to the sustainable development principle that aimed to develop the responsible global young generations to minimize the fossil energy consumption by practicing through daily living of recycling behavior building.
Recycling behavior is also beneficial to the environment because fewer natural resources are destroyed when paper recycled. Projects to increase recycling behavior can also raise public mind or public consciously and lead to increased environmental attitude and awareness to change their behavior. Several theoretical orientations can be identified for environmentally behavioral change on dealing with recycling behavior based on LCA and environmental education principle with integration of LCA concept. One strand of the literature is grounded in the belief that people are primarily maximization of inspiration of public mind or public consciousness. This research is paid the attempts to relate a variety of psychological factors in terms of psychological trait and psychological state to create recycling behavior based on LCA

ISSN 2039-9340 Mediterranean Journal of Social Sciences Vol. 3 (11) November 2012
499
concept (European Topic Centre on Waste and Material Flows, 2004 Thiengkamol, 2009a, Thiengkamol, 2009b, Thiengkamol, 2011e, Thiengkamol, 2011f, Thiengkamol, 2011i, Thiengkamol, 2011j, & Jumrearnsan, & Thiengkamol, 2012).
Therefore, this research was designed to study by covering all factors relating as mentioned above, it would be able to develop a model of environmental education with integration of Life Cycle Assessment concept to educate students to practice environmental behavior that happened from inspiration of public consciousness with affecting of psychological traits, psychological states, and environmental education principle. 2. Objective The objective of this research was to develop a model of environmental education with integration of LCA in term of recycling behavior. 3. Methodology The research design was implemented in steps by step as follows: 1) The populations were 37,156 undergraduate students of academic year 2012 of Mahasarakham University. The 400 undergraduate students were collected by simple random sampling from different faculties of Mahasarakham University with the equal proportion.
2) The research instrument was the questionnaire and it was used for data collecting. The content and structural validity were determined by Item Objective Congruent (IOC) with 5 experts in the fields of environmental education, psychology, social science and social research methodology. The reliability was done by collecting the sample group from 50 undergraduate students of Rajabhat Mahasarakham University. The reliability of environmental education, psychological trait, psychological state, inspiration of public consciousness, recycling behaviors, and the whole questionnaire were 0.971, 0.956, 0.972, 0.964, 0.889 and 0.978 respectively. The descriptive statistics used were frequency, percentage, mean and standard deviation. The inferential statistics used were t-test, One Way ANOVA, Pearson Correlation and Path Analysis for data analysis.
4. Results 4.1 General Characteristics of Sample Group The sample group of this study was 400 undergraduate students that were collected by random sampling technique from different faculties Mahasarakham University with the same proportion in the academic year of 2012. Most of them were female with 310 students (68.89%), most of them had Grade Point Average (GPA) between 2.50-2.99 with 175 students (38.89%) and most of them study in the field of social science with 170 students (37.78 %). 4.2 Comparison of Demographic Characteristics on Inspiration of Sample Group The demographic characteristics of sample in terms of sex, Grade Point Accumulation (GPA), and field of study of sample group presented as follows: 4.2.1 Comparison of Inspiration between Different Sex of Sample Group The demographic characteristics of sample in terms of sex, the comparison of inspiration between different sex of sample group was revealed that it was highly statistical significance (p<.01) as shown in table 1.

ISSN 2039-9340 Mediterranean Journal of Social Sciences Vol. 3 (11) November 2012
500
Table 1 Comparison of Inspiration between Different Sex of Sample Group
Sex Number (n) Mean S.D. t Sig. Male 143 3.411 .799 4.013
.000**
Female 307 3.672 .768
** Statistically Significant at the .01 level 4.2.2 Comparison of Inspiration among Different GPA of Sample Group The demographic characteristics of sample in terms of GPA, the comparison of inspiration among different GPA of sample group was revealed that it was no difference among different GPA of 1-<2.50, 2.50-<2.99 and 3.00->=3.00 with statistical significance (p>.05) as presented in table 2. Table 2 Comparison of Inspiration among Different GPA of Sample Group
Source of Variation Sum of squares df Mean Square F Sig. Between Group Within Group Total
2.456 376.753 379.209
2 397 399
1.228 .949
1.254 .325
* Statistically Significant at the .05 level 4.2.3 Comparison of Inspiration among Different Fields of Study of Sample Group The demographic characteristics of sample in terms of field of study included health science, science and technology, and social science, the comparison of inspiration among different fields of study of sample group was revealed that it was highly statistical significance (p<.01) as presented in table 3. Table 3 Comparison of Inspiration among Different Fields of Study of Sample Group
Source of Variation Sum of squares df Mean Square F Sig. Between Group Within Group Total
60.650 398.191 458.841
2 397 399
30.325 1.003
30.235 .000**
** Statistically Significant at the .01 level The LSD Multiple Comparison was used for analysis of each pair of inspiration among field of study of sample group. The differences of field of study included social science (Field 1), science and technology (Field 2), and health science (Field 3) to determine the mean score differences of their field of study, it showed that social science and science and technology were statistical difference (p<.01) while social science and health science were statistical difference (p<.01) but science and technology, and health science were no statistical difference (p>.05) as shown in table 4. Table 4 LSD Multiple Comparison of Inspiration among Different Fields of Study of Sample Group
Variables Χ Field 1 Field 2 Field 3 3.012 3.567 3.879
Field 1 3.012 - 5.612** (.006)
8.045** (.000)
Field 2 3.567 - -
Field 2 3.879 -
** Statistically Significant at the .01 level

ISSN 2039-9340 Mediterranean Journal of Social Sciences Vol. 3 (11) November 2012
501
4.3 Comparison of Characteristics and Recycling Behavior Based on LCA of Sample Group 4.3.1 Comparison of Recycling Behavior Based on LCA between Different Sex of Sample Group The demographic characteristics of sample in terms of sex, the comparison of recycling behavior based on LCA between different sex of sample group was revealed that it was highly statistically significant (p<.01) as presented in table 5. Table 5 Comparison of Recycling Behavior Based on LCA between Different Sex of Sample Group
Sex Number (n) Mean S.D. t Sig. Male 143 3.432 .701 4.365
.000**
Female 307 3.764 .689
** Statistically Significant at the .01 level 4.3.2 Comparison of Recycling Behavior Based on LCA among Different GPA of Sample Group The demographic characteristics of sample in terms of GPA, the comparison of recycling behavior based on LCA among different GPA of sample group was revealed that it was no difference among different GPA of 1-<2.50, 2.50-<2.99 and 3.00->=3.00 with statistical significance (p>.05) as presented in table 6. Table 6 Comparison of Recycling Behavior Based on LCA among Different GPA of Sample Group
Source of Variation Sum of squares df Mean Square F Sig. Between Group Within Group Total
3.118 446.106 449.224
2 447 449
1.599 0.998
1.603 .212
* Statistically Significant at the .05 level 4.3.3 Comparison of Recycling Behavior Based on LCA among Different Fields of Study of Sample Group The demographic characteristics of sample in terms of field of study included health science, science and technology, and social science, the comparison of recycling behavior based on LCA among different fields of study of sample group was revealed that it was highly statistically significant (p<.01) as presented in table 7. Table 7 Comparison of Recycling Behavior Based on LCA among Different Fields of Study of Sample Group
Source of Variation Sum of squares df Mean Square F Sig. Between Group Within Group Total
56.646 425.000 481.646
2 447 449
28.323 .951
29.782 .000**
** Statistically Significant at the .01 level The LSD Multiple Comparison was used for analysis of each pair of recycling behavior based on LCA among field of study of sample group. The differences of field of study included social science (Field 1), science and technology (Field 2), and health science (Field 3) to determine the mean score differences of their field of study, it showed that social science and science and technology were statistical significance (p<.01) while social science and health science were statistical significance (p<.01) including science and technology, and health science were no statistical significance (p>.05) as presented in table 8.

ISSN 2039-9340 Mediterranean Journal of Social Sciences Vol. 3 (11) November 2012
502
Table 8 LSD Multiple Comparisons of Recycling Behavior Based on LCA among Different Fields of Study
Variables Χ Field 1 Field 2 Field 3 3.113 3.621 3.908
Field 1 3.113 - 6.012** (.006)
7.534** (.000)
Field 2 3.621 - -
Field 2 3.908 -
** Statistically Significant at the .01 level 4.4 Environmental Education Model with Integration of Life Cycle Assessment in term of Recycling Behavior The results revealed that psychological traits in terms of goal of life (GL) showed directly affected to inspiration in aspects of role model (RM) with .554, It also showed directly affected to LCA in term of Recycling Behavior (RC) and energy consumption behavior (EB) with .604 and .598 while role model (RM) showed directly affected to to LCA in term of Recycling Behavior (RC) and energy consumption behavior (EB) with .621 and .565. Moreover, psychological states in terms of religion belief (RB) showed directly affected to inspiration in aspects of role model (RM) with .631 and it also directly affected to LCA in term of Recycling Behavior (RC) and energy consumption behavior (EB) with 622 and .601. Additionally, psychological traits in terms of goal of life (GL) illustrated directly affected to inspiration in aspects of impressive environment (IE) with .533 and psychological states in terms of religion belief (RB) illustrated directly affected to inspiration in aspects of impressive environment (IE) with .628 while impressive environment (IE) showed directly affected to LCA in term of Recycling Behavior (RC) and energy consumption behavior (EB) with .633 and .608. Considering on environmental education integration with LCA in term of Recycling Behavior in aspect of environmental attitude (AT) showed directly affected to inspiration in aspects of role model (RM) with .611 and it showed also directly affected to inspiration in aspects of impressive environment (IE) with .632 and directly affected to LCA in term of Recycling Behavior (RC) and energy consumption behavior (EB) with .629 and 605. Energy consumption behavior (EB) showed directly affected to RC (RC) with .522.
Diagram 1: Model of Environmental Education with Integration of LCA in term of Recycling Behavior ** Statistically Significant at the .01 level 5. Discussions The findings illustrated that the demographic characteristics of sex, GPA, and field of study, the female had better inspiration for LCA in term of Recycling Behavior with mean score of 3.672 and male with mean score of 3.411. This
GL
RB
AT
RC
EB
RM
IE
.565**
.598**
.608**
.522**
.629** .605**
.632** .611**
.628**
.633**
.604** .621**
.554**
.631** .601**
.622**
.533**

ISSN 2039-9340 Mediterranean Journal of Social Sciences Vol. 3 (11) November 2012
503
might indicate that the female might be easily to stimulate to have inspiration of public consciousness for changing the recycling behavior easier than male. The result of comparison of the inspiration of LCA in term of Recycling Behavior among different GPA of sample group was revealed that it was no statistical significance (p>.05). This might explain that there are no differences of the inspiration of LCA in term of Recycling Behavior among different GPA of students, therefore whether they got low, moderate or high, the similar inspiration of LCA in term of Recycling Behavior. Moreover, the comparison of inspiration of public consciousness among different fields of study of sample group was revealed that it was highly statistical significance (p<.01). The mean score differences of their field of study, it showed that social science and science and technology were statistical difference (p<.01) while social science and health science were statistical difference (p<.01) but science and technology, and health science were no statistical difference (p>.05). It implied that science and technology, and health science had better inspiration of public consciousness than social science.
Moreover, the comparison of LCA in term of Recycling Behavior between sex of sample group was revealed that it was highly statistical significance (p<.01), it might be concluded that female had better LCA in term of Recycling Behavior than male. Besides the comparison of LCA in term of Recycling Behavior among different GPA of sample group was revealed that it was no statistical significance (p>.05) but comparison of LCA in term of Recycling Behavior among different fields of study of sample group, was revealed that it was highly statistical significance (p<.01), then the LSD Multiple Comparison was used for analysis of each pair of LCA in term of Recycling Behavior among field of study of sample group. It illustrated that science and technology, and health science had LCA in term of Recycling Behavior than social science. It indicated that they female had better inspiration of public consciousness of LCA in term of Recycling Behavior better than male. However, their different GPA did not effect to inspiration of public consciousness of LCA in term of Recycling Behavior . These results are also pertinent to researches of Thiengkamol, 2011i, Thiengkamol, 2011j, & Jumrearnsan, & Thiengkamol, N., 2012.
Environmental education model with integration of LCA in term of Recycling Behavior as presented in diagram 1, the results illustrated that if we want to develop undergraduate students to have LCA in term of Recycling Behavior and energy conservation behavior for undergraduate students, Mahasarakham University, we might use the religion belief, especially, most of them are Buddhist to understand the important of LCA in term of Recycling Behavior and energy conservation behavior that will decrease natural resource such as forest wood and decrease fossil fuel use for paper product transportation. Moreover, decrement of paper use with LCA in term of Recycling Behavior, it leads to decrease of energy consumption and increase carbon dioxide sink as forest protection and also increase oxygen for human being. Moreover, parents and teacher should perform role model for their children and students. Nevertheless, environmental education in term of attitude also illustrated highly affected to LCA in term of Recycling Behavior and energy conservation behavior so we might use environmental education process to educate them in the university by integrated through every subjects. These findings were also congruent to studies of Thiengkamol, N., (2005a, 2005b, 2010b, 2011b, 2011c, 2011f, 2011g, 2011i, 2011j, 2012a & 2012b).
References
Cairns, R. B. (1979). Social Development. The origins and plasticity of interchanges. San Francisco : W.H. Freeman and Company. Cervone, D. (1991). The two disciplines of personality psychologie. Review of Handbook of personality; Theory and research.
Psychological Science, 2, 371-377. Jumrearnsan, W. and Thiengkamol, N. (2012). Development of an Environmental Education Model for Global Warming Alleviation.
Journal of the Social Sciences, 7 (1):67-70. Magnusson, D., and Endler, N.S. (1997). Interactional psychology and Personality. New York: John Whitey & Sons. Magnusson, D. (1999). Holistic interactionism : A perspective for research on personality development. In L.A. Pervin & O.P. John
(Eds.), Handbook of personality : Theory and research, 219-247, New York : Guilford. Magnusson D. (2001). The holistic-Interactionistic Paradigm : Some Directions for Empirical Developmental Research. European
Psychologist, 6 (3), 153-162. Morgan, F. W., & Hughes, M. V. (2006). Understanding Recycling Behavior in Kentucky: Who Recycles and Why. JOM, 58 (8), 32 -35 Pervin L. A., and John, O. P. (1990). Handbook of Personality: Theory and research. New York : The Guilford Press. Pervin, L. A. (1999). Epilogue: Constancy and change in personality theory and research. In L.A. Pervin & O.P. John (Eds.), Handbook
of personality: Theory and research (pp. 689-704). New York : Guilford. Pervin, L. A. (2001). A dynamic Systems Approach to Personality. European Psychologist, 6 (3), 172-176. Punthumnavin, D. (2008). Feature of Hypothesis and Data Analysis Providing for Utilization of Results of Development Research.
Bangkok: National Research Council of Thailand (NRCT). Susman E. J. (2001). Mind-Body interaction and development: Biology, Behavior and Context. European Psychologist, 6 (3), 63-171. Thiengkamol, N. (2004). Development of A Learning Network Model for Energy Conservation. Doctoral Dissertation of Education
(Environmental Education) Faculty of Graduate Studies, Mahidol University, Thailand.

ISSN 2039-9340 Mediterranean Journal of Social Sciences Vol. 3 (11) November 2012
504
Thiengkamol, N. (2005a). Strengthening Community Capability through The Learning Network Model for Energy Conservation. Journal of Population and Social Studies, 14 (1), 27-46.
Thiengkamol, N. (2005b). Development of Health Cities Network for Mekong Region. In Proceedings of the International Conference “Transborder Issues in the Grate Mekong Sub-Region” Ubon Ratchathani, Thailand, 30 June-2 July 2005 (pp.111-119). Ubol Ratchathani: Nevada Grand Hotel.
Thiengkamol, N. (2009a). The Great Philosopher: the Scientist only know but Intuitioner is Lord Buddha. Bangkok: Prachya Publication. Thiengkamol, N. (2009b). The Happiness and the Genius can be Created before Born. Bangkok: Prachya Publication. Thiengkamol, N. (2010b). Urban Community Development with Food Security Management: A Case of Bang Sue District in Bangkok.
Journal of the Association of Researcher, 15 (2), 109-117. Thiengkamol, N. (2011a). Holistically Integrative Research (2nd ed.). Bangkok: Chulalongkorn University Press. Thiengkamol, N. (2011b). Development of Energy Security Management Model for Rural Community through Environmental Education
Process. In Proceedings of the 1st EnvironmentAsia International Conference on “Environmental Supporting in Food and Energy Security: Crisis and Opportunity” Bangkok, Thailand, 22-25 March 2011 (pp.11). Bangkok: Rama Garden Hotel.
Thiengkamol, N. (2011c). Development of Food Security Management Model for Undergraduate Student Mahasarakham University through Environmental Education Process. In Proceedings of the 1st EnvironmentAsia International Conference on “Environmental Supporting in Food and Energy Security: Crisis and Opportunity” Bangkok, Thailand, 22-25 March 2011 (pp.12). Bangkok: Rama Garden Hotel.
Thiengkamol, N. (2011e). Environment and Development Book. (4th ed.).Bangkok: Chulalongkorn University Press. Thiengkamol, N. (2011f). Nurture Children to be Doctors. Bangkok: INTELLUALS. Thiengkamol, N. (2011g). Development of Energy Security Management for Rural Community. Canadian Social Science, 5 (5), October
31, 2011. Thiengkamol, N. (2011h). Development of a Food Security Management Model for Agricultural Community. Canadian Social Science, 7
(5), October 31, 2011. Thiengkamol, N. (2011i). Development of Model of Environmental Education and Inspiration of Public Consciousness Influencing to
Global Warming Alleviation. European Journal of Social Sciences, 25 (4):506-514. Thiengkamol, N. (2011j). Model of Psychological State Affecting to Global Warming Alleviation. Canadian Social Science, 7 (6):89-95,
December 31, 2011 Thiengkamol, .N. (2012a). Development of A Prototype of Environmental Education Volunteer. Journal of the Social Sciences, 7 (1):77-
81. Thiengkamol, N. (2012b). Development of Food Security Management for Undergraduate Student Mahasarakham University. European
Journal of Social Sciences, 27 (2):246-252. European Topic Centre on Waste and Material Flows. (2004). Review of existing LCA studies on the recycling and disposal of paper and
cardboard. Retrieve from http://eea.eionet.europa.eu/Public/irc/eionet-circle/etc_waste/library?l=/working_ papers/lcapdf/_EN_1.0_&a=d

ISSN 2039-9340 Mediterranean Journal of Social Sciences Vol. 3 (11) November 2012
505
Language as a Tool for Identifying Social Dissimilarity of Speakers
Dr. Rrezarta Draçini
”Luigj Gurakuqi" University
Faculty of Social Sciences, Department of Linguistics Shkoder, Albania
Doi:10.5901/mjss.2012.v3n11p505
Abstract: “The language is the only real means which serves to study the man and his behavior” [Rorty,1992]. It shows the most positive and the most wholesome element in which man’s behavior finds its traces. “There are no frontiers in manners among which people get connected with each-other for motifs of auto-identification, security, profit, religious belief. As a result, there are no frontiers in the amount and the varieties of linguistic communities that can be individualized in the society”. [Bolinger,1975, p.15] Within the social community of a nation we distinguish even smaller groups of individual-speakers that have different linguistic features depending on various characteristics. The religious belief is one of the factors that influence on the identification of the linguistic differences. Such a fact becomes evident when there are speakers who belong to a nation, a state, a language, a dialect, even dwellers of the same city who are linguistically distinguished simply from the fact who belong to different religious beliefs. According to Hudson” the language performs a social function, either as a means of communication, or as a way of the social groups’ identification and their study, without referring to the society that uses it, which means excluding the possibility of finding social explanations about the used structures”. [Hudson, 2002, p.15] Considering closely the impact that the religious differences have on language we have dwelled in Shkoder , a city in the north of Albania, where inhabitants of catholic and Muslim beliefs have lived for centuries. We have seen from close the linguistic situation in this city of about 120 thousand inhabitants. An inhabitant manages to identify an interlocutor whether this one belongs to his or her religious belief or not, since it carries with itself even linguistic differences depending on the religion to which he or she belongs. The institutional aspect of the religion deals with the conservatism in language. These religious-based linguistic differences are embedded in Albania although for 50 years, the communist dictatorship had legally banned the religious belief and had even killed a great number of clerics, even though for more than 70 years there have been marriages among youngsters of different religious beliefs, even though the subject –speakers belong to close social groups. Considering closely this linguistic reality in relation with the religious differences we have done a lot of interviews and observations. Keywords: language, social dissimilarity, religion, behavior 1. Why have we chosen the region of Shkoder? Albania is situated in the peninsula of Balkans, in Europe. There are approximately 3 million inhabitants and it is a country where three religious beliefs live together; Muslim, catholic and orthodox. Shkoder is one of the oldest cities in Albania, founded at the end of the 4th century and at the beginning of the 3d century before Christ. It lies in the north-west of Albania; it has been a big economic-administrative center and one of the few Albanian areas that managed to maintain the catholic belief despite of the Ottoman Empire for about 500 years. In 1479 Shkoder fell under the rule of Turkey and at that time the majority of the population turned from the catholic belief into the muslim belief. Although the inhabitants were under the occupant’s pressure, they fanatically preserved their religion. This bigotry occurred even in the language. Just as they preserved their religion unchanged, they also preserved their language and brought phonetic characteristics of the old Albanian nowadays. It is certain that a major positive role played the fact that the representatives of the catholic belief were at the same time the first authors of the written Albanian and those who created the written Albanian tradition. While the rest of the population, turned into muslims and having changed the belief, acquired the respective linguistic changes. “ The birth and the disappearance of beliefs constitutes for each race culminant points of its history and form the real skeleton of each civilization.” [Le Bon, 2008, p.235] By the passing of centuries the religious separation led to the physical separation of the city. “The eastern part was catholic, whereas the western part was muslim. These two parts composed of the inhabitants of the same city, but of different religions, were separated from “The road of Gjan ( rruga e gjan) ” or “Piaca”, which follows the line coming from the bazaar, passes through the center and then turns left towards the north of Shkoder to Koplik.” [Ziu, 2002, p.46] In his study “Oborret e Shkodrës (Shkoder’s courts)”, Trifon Ziu affirms that:” Long life under the Turkish rule left a deep trace in the social life of the city.” [Ziu, 2002, p.46] As all the cities of European Turkey, Shkoder got in terms of an urban look of an oriental city. Town houses in the neighborhood divided by

ISSN 2039-9340 Mediterranean Journal of Social Sciences Vol. 3 (11) November 2012
506
religious affiliation were surrounded by high walls. According to the researchers this division was more a quiet natural phenomenon led by the respective religious mentality. Between the two parts of the city there were differences in various aspects related to cultural influences. Turkish-oriental habits gradually penetrated the Muslim quarters. The division in different religions led to differentiations in social and cultural relations, as well. The cultural life developed in a considerable extent under the influence of the respective religious beliefs. In the catholic areas despite the no little influence of the oriental customs, there was more affinity to the social life conception and organization under the European and western tendency. However, among Shkoder communities of different religions there have traditionally been tolerance and harmony (understanding). Never have there been any fights or violence among these communities. The communities themselves, the clerics of the different religious communities, the various state institutions or associations and social organizations have reacted just at the right time, avoiding the development or installation of the evil in the people’s minds and the undermining of the age-long equilibrium. 2. Linguistic differences among various religious communities. We noted above the link between religion and language, we stopped at the fact that religious differences lead to linguistic differences. Let us stop at these differences in the Shkoder city. Between the speakers of Muslim and catholic belief there are differences in both lexical and phonetic level. [Shkurtaj,2004, p.232] 2.1. Differences in the lexical level The lexicon is one of the fields where linguistic differences between religious beliefs are evident. The religious influences can be clearly seen in the countries names (topomyms). In cases when in the same area live inhabitants of the two beliefs there are specific denominations, for example Zagora has two denominations : Zagore- Isufaj for the muslim community and Zagore- Ndreaj for the catholic community.
The people’s names , the antroponyms are another distinctive part. The inhabitants of catholic belief have saints’ names of the catholic belief. These names have been albanianised , for example: Shtjefёn, Tefё from Stefano, Gjin from Giovani, Kolё, Nikollë from Nikola, Tom from Tomaso. Whereas the inhabitants of muslim belief have names related to their belief, mainly of Turkish origin: Ahmet, Sulltane, Hamdi, Mehmet, Bajram, Ajet, Habibe etc.
The most distinctive part consists in religious words and services. They are the property of the respective community speakers. Speakers of catholic belief use these phrases: Go to the church, Mass, minister, saint, hallowed (shkoj në kishë, meshë, meshtar, shejt, shejtnua). In their speaking we can frequently find used catholic saints ‘names Krisht ose Jezu Krisht (Christ or Jesus Christ), Maria ose Maria e Bekueme (Mary or Blessed Mary), Shnazefi ( Saint Joseph), Shnanou (Saint Anthony), Shnarroku, Shёnkolli( Saint- Nicola, Shnjergji( Saint-Georges. There are nouns of some of the periods related closely to specific religious practices such as : Fast, Shrove Tuesday; swears and other formulas which contain God and saints’ names , such as : Pasha Zotёn , pёr Zotin or pёr tё lumin Zot ( for God’s sake), pёr tё lumen Zoj, pasha Zojn e Diell( for God’s sake and Sun), pasha Zojen e Bekueme, bej kryq, rrefehem, (confess at the priest) , kungohem or marr kungimin. In their every day speaking, speakers of catholic belief use a lot of borrowed words from Italian, whereas speakers of muslim belief use them less.
Speakers of Muslim belief use other phrases that distinguish them from the former group. Thus, we can mention names of xhami, tyrbe (mosques and mausoleums), hoxhё, imam (preacher); names of different festivals of Muslim belief, such as: Bajrami i madh (big bajram) ,bajram i vogël (little bajram), kurban- bajrami, natё e madhe ose natё e mirё ( big night or good night), natё teravie (night teravie), pejgameri, xhehnet,(paradise) xhehnem ( hell), allahu ( god), pasha allahun( for god’s sake),; as well as greetings and swears containing the allah words, perёndi (goodness). The first phenomenon of the difference of these two lexemes groups is that in the case of the muslim belief there is an abundance of words and terms of Turkish – Arabic origin, which appears even in some of the following greetings, such as: selam, “tё fala”, alekum selamn, selamalekum,, ramazan, yftar, ninoj ( to fast), me ra shehadet, shkoft n’ahiret , bismilah. Interjections ala turka are used: allah-i (allah-u), din-i, iman, pejgamer-i, such as . pasha allahun, pasha din e imân, etc. Very distinguishing has been in the muslim environment the use of Friday in Turkish, which everywhere was called e xhuma. The religious differences have made that linguistic differences be in greetings and consolations phrases. For example, in the case of a death consolation The Catholics say: “Pastё dritё”, or “ Dritё pastё”, “Krishti e pastё ne parriz”, “Dritё i baftё shpirti”, whereas Muslims say: “ Pastё rahmet” or “ Rahmet pastё, “ Allahu e pastё nё xhehnet”;
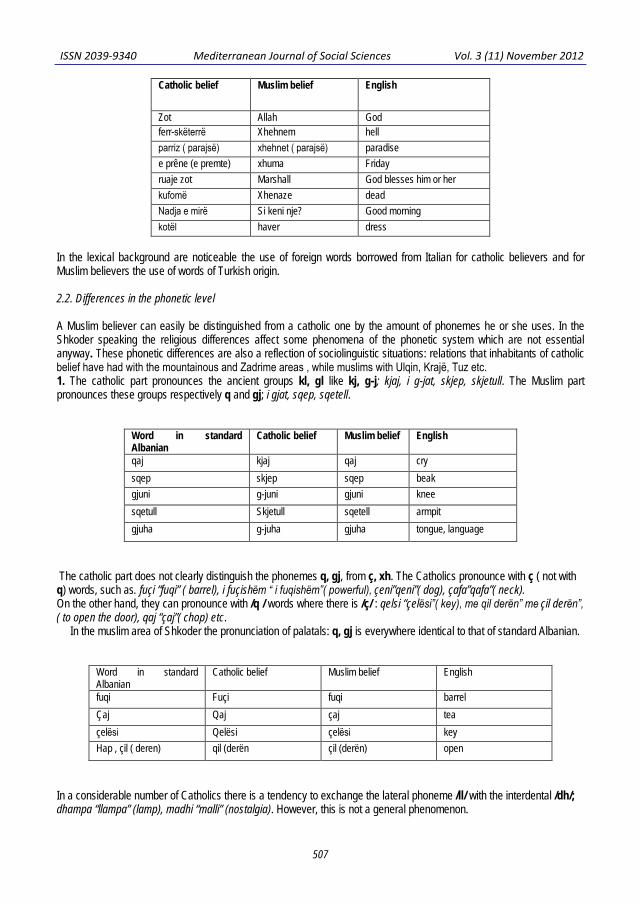
ISSN 2039-9340 Mediterranean Journal of Social Sciences Vol. 3 (11) November 2012
507
Catholic belief Muslim belief English
Zot Allah God ferr-skёterrё Xhehnem hell parriz ( parajsё) xhehnet ( parajsё) paradise e prêne (e premte) xhuma Friday ruaje zot Marshall God blesses him or her kufomё Xhenaze dead Nadja e mirё Si keni nje? Good morning kotёl haver dress
In the lexical background are noticeable the use of foreign words borrowed from Italian for catholic believers and for Muslim believers the use of words of Turkish origin. 2.2. Differences in the phonetic level A Muslim believer can easily be distinguished from a catholic one by the amount of phonemes he or she uses. In the Shkoder speaking the religious differences affect some phenomena of the phonetic system which are not essential anyway. These phonetic differences are also a reflection of sociolinguistic situations: relations that inhabitants of catholic belief have had with the mountainous and Zadrime areas , while muslims with Ulqin, Krajё, Tuz etc. 1. The catholic part pronounces the ancient groups kl, gl like kj, g-j; kjaj, i g-jat, skjep, skjetull. The Muslim part pronounces these groups respectively q and gj; i gjat, sqep, sqetell.
Word in standard Albanian
Catholic belief Muslim belief English
qaj kjaj qaj cry sqep skjep sqep beak gjuni g-juni gjuni knee sqetull Skjetull sqetell armpit gjuha g-juha gjuha tongue, language
The catholic part does not clearly distinguish the phonemes q, gj, from ç, xh. The Catholics pronounce with ç ( not with q) words, such as. fuçi “fuqi” ( barrel), i fuçishёm “ i fuqishёm”( powerful), çeni”qeni”( dog), çafa”qafa”( neck). On the other hand, they can pronounce with /q / words where there is /ç/ : qelsi “çelёsi”( key), me qil derёn” me çil derёn”, ( to open the door), qaj “çaj”( chop) etc. In the muslim area of Shkoder the pronunciation of palatals: q, gj is everywhere identical to that of standard Albanian.
Word in standard Albanian
Catholic belief Muslim belief English
fuqi Fuçi fuqi barrel Çaj Qaj çaj tea çelёsi Qelësi çelёsi key Hap , çil ( deren) qil (derën çil (derën) open
In a considerable number of Catholics there is a tendency to exchange the lateral phoneme /ll/ with the interdental /dh/; dhampa “llampa” (lamp), madhi “malli” (nostalgia). However, this is not a general phenomenon.

ISSN 2039-9340 Mediterranean Journal of Social Sciences Vol. 3 (11) November 2012
508
Word in standard Albanian Catholic belief Muslim belief English llampë Dhampë llampë light bulb
mall Madh mall nostalgia
llokum Dhokum llokum sweet dhuratë Lluratë dhuratë present
In the muslims’speaking the short phoneme /o/ which misses passes to /a/ : kas “kos”(yougourt), mas”mos”,(don’t), sat”sot”(today), santé”sonte”(tonight), or it passes to /e/: thet “thotё”(says); sometimes it passes to /u/ : sunde “sonte” (tonight)
Word in standard Albanian Catholic belief Muslim belief English sonte Sonte santé tonight kos Kos kas jogurt kot Kot kat useless zot Zot zat god
These are some of the main linguistic differences among subject speakers of various beliefs in the Shkoder city. 3. Today’s reality in Shkoder With the society evolution, the creation of new socio-political circumstances the linguistic situations change, since language is their reflection. This is why linguistic differences do not show all speakers the same use density. Their age, their education and social circle affects the intensity of their use. To see specifically this reality we have made a survey. We have investigated subject-speakers of two beliefs in Shkoder (catholic and muslim) that belong to three age groups: the first group consisted of 70-75 year-old subject speakers, the second group included those of 40-45 years old and the third group were children of 10-15 years old. The linguistic differences in spoken language have been a part of our study. The material recorded during their free conversations has served as a comparative part, too. It is easily noticeable that in the first group (70-75) the linguistic differences, consequence of religious beliefs are more visible. There are numerous differences in both phonetic and lexical level, because: They belong to the generation having acquired a complete religious education. At the time of communist dictatorship this generation had already obtained the religious information. They have carried with them a strong religious heritage from their parents. In the second group the religious differences related to the respective belief can be identified in a lower degree, although they are visible. The reasons are the following: This group has grown up under the communist rule when the religious belief was banned and was considered as a crime. The religious heritage in families has secretly been transmitted because of the dictatorship. The generation’s education and the coexistence between religious beliefs have influenced the softening of these differences In the third group we have included 10-15 year-old children. Despite their young age the differences in their spoken language are present, because: Children carry features of their close social circle they belong to. The revival of religious belief has made children get direct information.

ISSN 2039-9340 Mediterranean Journal of Social Sciences Vol. 3 (11) November 2012
509
We have made a survey with teachers of first grade in the Shkoder city. About 80% of these teachers have claimed that they are able to identify their pupils ‘religious beliefs from the phonetic differences in their speaking. The existence of these linguistic differences as a consequence of various religious beliefs can be explained from both aspects: psycholinguistic and sociolinguistic, as the impact the social community has is great. Children receive cash linguistic differences from their social circle; learn languages together with these differences by making them their part at a time when they are not aware of the existence of religious differences. On the other hand, the linguistic structures are crystallized in the children’s brain by embedding the linguistic differences, differences that become part of language unconsciousness and the speaker always carries them with him. 4. Conclusions Along with the language is born and developed what we directly feel as personal. This inner feeling does not really find expression in the social world, but it occurs through language. “The language establishes unconsciousness in human beings. The language includes in its theme even the unconsciousness in its psychoanalytic conception” [Rrokaj, 2010, p. 188] According to Saussure the language is a social phenomenon, but on the other hand there is a discourse which is an individual act of the language implementation and while we communicate we show our individualism. Mankind is inclined to represent himself through language and this the key which explains the existence of linguistic differences in individuals belonging to different religious beliefs, although these people belong to the same nation, state, language, dialect, city or social group.” … the world starts from the immaterial radiation of meditation to God”. [Rrokaj, 2010, p. 188] The language is an energy that the speaker owns and through which he creates realities to infinity. According to Gustav le Bon “little change in the state of beliefs of any nation leads to a series of changes in its existence” and the language is one of the most existential elements of a nation. Within the linguistic community every repartition is noted, above all through the particular linguistic use and the community itself is able to know to notice the presence of such repartitions. The selection of a linguistic form is the most direct means of speakers to individualize the speaker’s position in the society in an automatic way. Man has the tendency of keeping up to the group which he belongs to. Religion affects directly in the creation of identity and language is part of it. The feeling of religious belonging is deep, it is deeply rooted in ethnic psyche. The protective role of religion is the continuity of the protective function that the family offers in certain phases of man’s development, especially in the most important phase in that of childhood. According to the psychoanalysts parental principle of religion and nation remains present as religion is identified with the family, the mother. The religious belief as an important part of the individual becomes a direct cause of linguistic differences.
References Baron, A. Robert, Psychology, United States of Amerika, 1992. Beci,B., Të folmet veriperendimore të Shqipes dhe sistemi fonetik i së folmes së Shkodres,Tiranë 1995. Bloom, Paul, Language Acquisition, Cambridge, 1994 Bolinger, Aspects of language, 2nd edicion, Neë Jork 1975 fq 333 Cacciari, C., Psicologia del linguaggio, il Mulino, 2006 Chomsky, Noam, New Horizons in the Study of Language and Mind, Cambridge, 2000. Chomsky, Noam, Language in a Psychological setting, Angli,1997 De Saussure, F., Kurs i Gjuhësisë së Përgjithshme,Tiranë,2002. Field, J., Psycholinguistics, London, 2002. Frojd, Gabimet, Tiranë, 1997. Gil, R., Neuropsikologjia, botimi i dytë, Tiranë, 2002 Fromm, E., Të kesh apo të jesh, Tiranë,2001. Hasani, I.,Vetëdija fetare dhe kombëtare tek shqiptarët, Prishtinë,2001. Hudson .A. R.,Sociolinguistika,Tiranë 2002, fq 15. Ismajli, R., Gjuhë Standarde dhe histori identitetesh, Tiranë 2005. Karmiloff-Smith, A., Oltre la mente modulare, Bologna, 1995. Kordinjano, F., Shqipëria ( Përmes veprës dhe skrimeve të misionarit të madh Italian At Domeniko Pazi 1847-1914), Tiranë 2002Ziu, T.,
Oborret e Shkodrës, Shkodër, Camaj-Pipa, 2002, Le Bon, G., Psikologjia e popujve dhe e turmave,Tiranë 2008 Owens, E. R., Language Development, An introduction, London, 2000. Nisbet, R., Konservatorizmi _Ëndrra dhe realiteti,Tiranë 2002

ISSN 2039-9340 Mediterranean Journal of Social Sciences Vol. 3 (11) November 2012
510
Rashiti, S., Kategoria e ndërgjegjes, Rilindja,Prishtine 1998. Robins, H. R., Historia e Gjuhësisë, Dituria, Tiranë 2007 Rorty,R., The linguistics turn ,Chicago, University of Chicago Press,1992 Rrokaj,Sh., Filozofia e gjuhës, Tiranë 2010 Shkurtaj, Gj., Etnografi e të folurit të shqipes, Tiranë, 2004 Shkurtaj, Gj., Sociolinguistika, Tiranë, 2003. Todorova,M., Ballkani imagjinar,Ballkani si alter ego e Europes,Tiranë 2006. Traxler, M.;Gernsbacher Ann M., Handbook of Psycholinguistics,second edition,Oxford 2006. Vygotskij, S. L., Pensiero e linguaggio, Rome 2004

ISSN 2039-9340 Mediterranean Journal of Social Sciences Vol. 3 (11) November 2012
511
Development Strategy of Communication on Cardiovascular
Disease Prevention for Risk Group
Mrs. Punnapat Chivachaichawan
Ph.D. Candidate Student of Development Strategy Program, Nakhon Sawan Rajabhat University
Assoc. Professor Dr. Suchat Saengthong
Major Advisor, Development Strategy Program,
Nakhon Sawan Rajabhat University
Asst. Prof. Dr. Supawan Vongkamjan
Co-Advisor, Development Strategy Program, Nakhon Sawan Rajabhat University
Doi:10.5901/mjss.2012.v3n11p511
Abstract: The research objectives were 1) to construct development strategy of communication on cardiovascular disease prevention for risk group in Chainat Municipality, 2) to experiment the constructed development strategy of communication on cardiovascular disease prevention for risk group in Chainat Municipality, and 3) to determine satisfaction level of experiment group for implementation development strategy of communication on cardiovascular disease prevention for risk group in Chainat Municipality. The research design was mixed methods of quantitative and qualitative approaches. The purposive sampling was used for sampling 310 community peoples of risk group in Chainat Municipality, Chainat Province on perception on. The qualitative research with focus group discussion and in-depth Interview were conduct with stakeholders from risk group in Chainat Municipality, community leaders, health volunteer and experts from Jainad Narendra Hospital included professional nurses of Department of Medicine, public health personnel, nutritionists, physicians, risk group and handlers. The purposive sampling was employed for selection of 53 community people from risk group for Quasi-experimental research. The results were as followings: the constructed economic status elevation based on SEP comprised 3 system units included 1) Risk Assessment, 2) Risk Management and 3) Monitoring the Results. The mean scores of posttest in aspects of risk opportunity, severity of cardiovascular disease, and self-health toward cardiovascular disease were higher than pretest at statistically significant level of 0.01, 0.01, and 0.01. Their whole satisfaction level was at very good level for risk communication model, content, media and equipments to raise awareness. Keywords: Development Strategy / Communication / Cardiovascular Disease/ Prevention / Risk Group 1. Introduction Among globalization with unbalancing development of economic, social and environment of globe, the high competition of economic has occurred from materialism and capitalism after industrial age period from 1750 to 1850 where changes in agriculture, manufacturing, mining, transportation, and technology had a profound effect on the social, economic and cultural conditions of the times. It began in the United Kingdom, then subsequently spread throughout Western Europe, North America, Japan, and eventually the rest of the world. Industrialization) is the period of social and economic change that transforms a human group from an agrarian society into an industrial one (Wikipedia, 2012, & Thiengkamol, 2007). These are origin of non-communication diseases such as cardiovascular disease, heart attack, atherosclerosis, hypertension, diabetes, obesity, and cancer due to mental stress, hurry lifestyles, non-exercise and consume few fruits, vegetable, grain and high fiber foods. Particularly, the fast food, instant food, readymade food and semi-finished noodle are provided widely and conveniently in fast food shop and department store including fried, grill and toast foods from food stands across the urban and city center of all provinces in Thailand with day and night time, therefore, whenever you go out you can buy any food as you wish. All kinds of these malnutrition foods are high sodium and sugar, and then it can

ISSN 2039-9340 Mediterranean Journal of Social Sciences Vol. 3 (11) November 2012
512
cause obesity, diabetes, hypertension, kidney failure, and cardiovascular disease. Consequently, the mental stresses due to economic competition and hurry up lifestyles have also affected lack of exercise, and alcohol drinking to release stress. Moreover, lack of city planning has impacted to traffic congestion, inadequate mass transportation system and wrong value of personal car use. WHO estimated that in 2005, death of 58 millions of global citizen, about 60% would die from chronic disease of non-infectious diseases and death of cardiovascular disease would be about half of them (29%). Furthermore in 2022, death of 25 millions or 80% would be in developing countries or poor countries and it will be important cause of death in work-force age group. This will be cause of family, social and national losses and disability adjusted life year from 6 in top 10 diseases (Wikipedia, 2012).
From research of disease status and health risk factors of Thai citizen in 2003, the loss was occurred with 65% of total loss, mainly, they were cardiovascular disease, atherosclerosis, and cancer. Besides, it also discovered that top ten diseases occurred from risk factor of wrong way of living as important orders that were alcohol drinking and smoking. Hypertension, obesity and high cholesterol were occurred due to less fruits and vegetable consumption with inadequate exercise. In 2008, the rate of patients with hypertension, diabetes, cardiovascular disease, cancer, and atherosclerosis were 1,149, 845, 684, 505, and 257 per 100,000 peoples and as out- patients with 14,328, 9,702, 2,565, 1,023, and 980 per 100,000 peoples. In 2009, cause of death of Thai citizen as top ten disease were cancer, and subsequences were cardiovascular disease, atherosclerosis, diabetes and hypertension with rate of 88.3, 29.0, 21.0, 11.1 and 3.6 per 100,000 peoples respectively.
Cardiovascular disease is a class of diseases that involve the heart or blood vessels (arteries, capillaries and veins). Cardiovascular disease refers to any disease that affects the cardiovascular system, principally cardiac disease, vascular diseases of the brain and kidney, and peripheral arterial disease. The causes of cardiovascular disease are diverse but atherosclerosis and/or hypertension are the most common (Maton, 1993, & Bridget, & Valentin, 2010).
Cardiovascular diseases remain the biggest cause of worldwide deaths, though over the last two decades, cardiovascular mortality rates have declined in many high-income countries. At the same time cardiovascular deaths and disease have increased at an surprisingly speedy rate in low- and middle-income countries (Mendis, Puska, & Norrving, (editors), 2011). Even though cardiovascular disease regularly affects older adults, the antecedents of cardiovascular disease, notably atherosclerosis begin in early life, making primary prevention efforts necessary from childhood (McGill, McMahan, & Gidding, 2008). Therefore, emphasis was increased on preventing atherosclerosis by modifying risk factors, such as healthy eating, exercise, and avoidance of smoking (Wikipedia., 2012).
Almost all cardiovascular disease in a population can be explained in terms of a limited number of risk factors: age, gender, high blood pressure, high serum cholesterol levels, tobacco smoking, excessive alcohol consumption, family history, obesity, lack of physical activity, psychosocial factors, diabetes mellitus, and air pollution (Bridget, & Valentin, 2010). While the individual contribution of each risk factor varies between different communities or ethnic groups the consistency of the overall contribution of these risk factors is remarkably strong (Yusuf, et al., 2004 & Wikipedia., 2012). Some of these risk factors, such as age, gender or family history are undeniable, however many important cardiovascular risk factors are modifiable by lifestyle change, drug treatment or social change. Such as consumption pattern of Thai people during three decades, particularly people who have lived in urban area have hurry lifestyles due to traffic congestion. Hence, they have little time exercise because they have tired with long time traveling to go work place. Moreover, the imitation to western lifestyle with fast food consumptions providing widely in department store and food stands over urban and center of city, these have also accelerated the consumption changing behavior. The non-infectious disease like as cardiovascular become extended important health problem for Thai citizen (Thiengkamol, 2009c).
Additionally, cardiovascular disease consumes time to express its symptom. Although, it can be prevented but on one knows when disease will attack. It can be easily prevented by adjusting way of life with eating more fruits and vegetables, regularly exercise, and decreasing high fat and carbohydrate foods consumption including avoiding sweet beverage and alcohol drinks. WHO forecasts that the fruits and vegetable lesser than 400-600 grams/person/day in developing countries is a major cause of death of people more than 2.5 million per year and it also related to cardiovascular disease, atherosclerosis, heart attack or stroke, and cancer. According to the World Health Organization, chronic diseases are responsible for 63% of all deaths in the world, with cardiovascular disease as the leading cause of death (WHO, 2011).
Jainad Narendra Hospital is tertiary hospital level with 367 beds under control of Ministry of Public Health, Thailand. It provides health promotion, prevention, treatment, and rehabilitee together with promotion and health network connection. It reported that cause of sick of patients who admitted at top ten diseases in hospital are hypertension since 2009-2011 were 3,064, 3,004 and 3,450 cases respectively. The cardiovascular disease with third order were 3,288, 3,118, and 3,257 cases respectively. Atherosclerosis were 929, 960, and 1,211 cases respectively. The tendency is increasingly, particularly, cause of death was happened from myocardial infarction with third order of death from top ten since 2009-2011 were 70, 63, and 60 cases respectively. Atherosclerosis with the forth order were 58, 59, and 63 cases respectively.

ISSN 2039-9340 Mediterranean Journal of Social Sciences Vol. 3 (11) November 2012
513
Even though, Jainad Narendra Hospital and network have implemented to support policy and to solve urgent problems that is health promotion to decrease impact from non-infectious disease. Principally, communication to people with public relation and holding campaign of knowledge giving with aim to adjust to have proper behavior by emphasizing on content about risk factors, severity, and impact of diseases. Method or mean of communication model, personal media, and channel to reach people, it was disclosed that communication on cardiovascular disease cannot make people to perceive and to be aware the danger of disease. Even though, there is proactive policy with campaign of communication to make peoples change their behaviors to decrease non-infectious diseases but it was also found that people with risk has increased every year. This indicated that media campaign use cannot change people behavior to decrease risk factors of cardiovascular disease and atherosclerosis. This might be as following causes of lack of analysis the different receiver characteristics of education level, occupation, living, environment, cultural context and belief. Additionally, they might have wrong belief that cardiovascular disease and atherosclerosis are not severe diseases or lack of time due to busy with work. Nevertheless, media were defined and construct by health personnel so it might be difficult for general people to understand or it is not direct to general people but communication was passed through health volunteers or they might not accept health volunteers since there are wide rage capability of health volunteers.
Chainat Municipality is a large community with 18 communities and it is semi-urban therefore, they have good relationship among them and have rather good economic status. Main agriculture is rice farming by using water resource from Chao Phaya River and households have pipe water for consumption. There are group establishment both formal and private to cooperate for implantation different activities and they have temple as mind center of community and have Jainad Narendra Hospital as big hospital in community, municipality public health center, and various clinics. Most of them consume three meals a day with having rice, boil, fried, and toast food with flavor high fat pork and they flavor sweet, oily, salty tastes and they put fish sauce and seasoning before eating without tried the taste first. They drink coffee with sugar and cream in the morning and evening everyday and drink beverage at least one bottle a day. Some of them drink beer or alcoholic drink at party or at home every day. Some drinks herbal liquor and they like to have dinner outside because there were a lot of food shop and not expensive. Their favorite foods are pork hot plate, oysters fried in egg batter, green mussel fried in egg batter, oyster omelet and various kinds of desserts
In order to accomplish cardiovascular disease prevention, it needs to develop strategy of risk communication model through focus group discussion with brain storming of stakeholders of health management group and risk group including survey perception of community people on cardiovascular disease and experiment would be conducted with purposive risk group who are interested to prevent cardiovascular disease to test proposed development strategy of risk communication by system approaches. Therefore, it will achieve the effective strategy to communicate to risk group in Chinat Municipality with health management team of Jainad Narendra Hospital to adjust health behavior of risk group to prevent cardiovascular disease effectively and meet quality of life of people in Chinat Municipality. 2. Objective 2.1 To construct development strategy of communication on cardiovascular disease prevention for risk group in Chainat Municipality 2.2 To the constructed development strategy of communication on cardiovascular disease prevention for risk group in Chainat Municipality. 2.3 To determine satisfaction level of experiment group for implementation development strategy of communication on cardiovascular disease prevention for risk group in Chainat Municipality. . 3. Methodology The research design was implemented in steps by step as followings:
3.1 The qualitative research was used for searching knowledge, risk factors of severity and impact of cardiovascular disease through brain storming process integrated with SWOT (Strength, Weakness, Opportunity and Threat) analysis (Thiengkamol, 2011a). 3.2 Questionnaire for through systematic approach for development strategy of risk communication of Jainad Narendra Hospital on cardiovascular disease prevention for risk group in Chainat Municipality, there were 3 system units included as followings:
System Unit 1: Risk Assessment composed of 2 Sub- system Units. Studying Real Situation Creating Model of Communication on Cardiovascular Disease

ISSN 2039-9340 Mediterranean Journal of Social Sciences Vol. 3 (11) November 2012
514
System Unit 2: Risk Management composed of 3 Sub- system Units. 2.1 Construct Manual for Self-care for Cardiovascular Disease Prevention and Manual of communication to prevent Cardiovascular Disease for Public Health Personnel. 2.2 Training on Knowledge for Cardiovascular Disease Prevention System Unit 3: Monitoring Results composed of 2 Sub- system Units. 3.1 Conclusion of Strategic Experiment 3.2 Propose the Strategy of Distribution, Transferring, and Communication of Risk and establish the club of “Community Leader of Heart and Vascular Care” . These were verified by stakeholders from risk group in Chainat Municipality, community leaders, health volunteer and experts from Jainad Narendra Hospital included professional nurses of Department of Medicine, public health personnel, nutritionists, physicians, risk group and handlers. 3.3. The quantitative research was used for experiment of the development strategy of risk communication of Jainad Narendra Hospital on cardiovascular disease prevention for risk group in Chainat Municipality. The experimental group came from 53 community peoples in Chainat Municipality. 4. Results 4.1 Searching risk communication on cardiovascular disease prevention through brain storming process integrated with SWOT, the results were as followings. From focus group discussion was implemented with 26 health personnel composed of 9 health volunteers, 7 representatives of patients and handlers, and 10 nurses and public health persons who took responsibility for non-infectious disease. They proposed knowledge, risk factors of severity and impact of cardiovascular disease, communication model, and communication channels to community people as followings; 1) Target problem was lack of proper risk communication model for cardiovascular disease prevention. 2) Develop communication model with community participation in every steps of implementation including contents, media, channels and manual self-care construction. 3) Holding training activities about knowledge of cardiovascular disease, risk factors of severity and impact of cardiovascular disease by introducing theory of motivation for disease prevention. 4) Evaluation knowledge information perception on severity and impact of cardiovascular disease. 5) Promotion for risk group to change health behaviors to prevent cardiovascular disease. 4.2 Perception of Community People on Cardiovascular Disease Interviewing was conducted with 310 community peoples. It was revealed that their perceptions on risk of cardiovascular disease, they were able to control food consumption at most level with mean of 2.79. Subsequences were peoples who had over weight or obesity both sexes was at most level with mean of 2.77 and Alcohol drinking person was at moderate level with 2.08. Perception of severity of cardiovascular disease, they were cigarette smoker at least level with mean of 1.69. Subsequence was person who could not control food consumption was at moderate level with mean of 1.89. Health Behavior in positive aspect when they faced with problem, they would solve by consulting and talking with others or going to temple at moderate level with mean of 1.83. Subsequence was exercise at least 3 times a week at least level with mean of 1.47. For negative aspect, they put fish sauces before eating every time at moderate level with mean of 2.32. Subsequence was dinking sweet beverage at moderate level with mean of 2.23. Belief on cardiovascular disease, most of them did not know that cardiovascular disease can be prevented with 43.5% and believed that it occurred for only old age with 31.9%. 4.3 Training for Risk Group of 53 Community Peoples in Chainat Municipality Training was conducted with risk communication model proposed by community participation on perception of cardiovascular disease and severity of disease for risk group of 53 Community Peoples in Chainat Municipality. It was found that perception of risk opportunity, severity of cardiovascular disease, and self-health toward cardiovascular disease were presented in table 1.

ISSN 2039-9340 Mediterranean Journal of Social Sciences Vol. 3 (11) November 2012
515
Table 1 Comparison between Pretest and Posttest of 53 Community Peoples in Chainat Municipality Perception
Posttest Pretest t p
X S.D. X
S.D. Risk Opportunity 2.98 .055 2.79 .180 7.553 .000** Severity of Cardiovascular Disease 2.86 .178 2.54 .291 7.644 0.00** Self-health toward Cardiovascular Disease 2.77 .481 2.22 .313 10.39 0.00**
** Statistically significant at level of .01 4.4 Monitoring afterTraining Monitoring risk group of 53 Community Peoples in Chainat Municipality was conducted. It was found that health behavior and health management in aspects of consumption on carbohydrate foods and put fish sauces or others seasoning were no different between pretest and posttest at statistically significant at .05 level and the others were different between pretest and posttest at statistically significant at .05 level as presented in table 2. Table 2 Comparison between Pretest and Posttest of Experimental Group Health Behavior and Health Management for Cardiovascular Disease Prevention for Monitoring
Health behavior and Health Management for Cardiovascular Disease Prevention
Pretest Posttest t p
X S.D. X
S.D. 1. Consumption on carbohydrate foods 1.89 .670 1.83 .427 .490 .626 2. Drink alcohol mixed at least 2 glasses a day 2.72 .455 1.26 .445 -15.858 .000** 3. Drink sweet beverage 2.08 .615 1.83 .612 2.094 .041*
4. Put fish sauces or others seasoning 1.83 .700 1.81 .521 0.163 .871 5. Prefer to consume high fat food 2.09 .564 1.62 .596 4.433 .000** 6. Use force or movement at least 30 minutes a day 1.47 .575 2.72 .455 -11.591 .000** 7. Exercise with different activities 1.83 .753 2.57 .605 -5.677 .000** 8. Decrease smoking cigarette or others 2.91 .405 1.04 .192 30.893 .000** 9. Control weight by eating fruits and vegetables 1.70 .638 2.53 .608 -7.318 .000** 10. When you had stress, you consulted others and went to temple 1.87 .590 2.53 .504 -5.632 .000**
* Statistically significant at level of 0.05, ** statistically significant at level of 0.01 4.5 Satisfaction Level of Experimental Group for Communication Model for Risk Communication on Cardiovascular Disease Prevention Results of satisfaction level of experimental group for implementation of development strategy for risk communication on cardiovascular disease prevention, it was found that communication model in all aspects at very good level, therefore satisfaction level as a whole was at very good level respectively, as presented in table 3. Table 3 Satisfaction of Experimental Group for Communication Model
Development Strategy X S.D. Level
Model of Creation for Wakening for Cardiovascular Disease Prevention
4.58 0.63 Very Good
Model of Perception of Risk Factors and Awareness to Severity of Cardiovascular Disease
4.57 0.50 Very Good
Model of Gain Knowledge and Understanding for Cardiovascular Disease Prevention
4.64 0.48 Very Good
Model of Participation on Health Behavior Adjusting for Cardiovascular Disease Prevention
4.70 0.46 Very Good
Model of Knowledge and Understanding Application to Health Care Practice for Cardiovascular Disease Prevention
4.77 0.42 Very Good
Whole Satisfaction 4.65 0.38 Very Good

ISSN 2039-9340 Mediterranean Journal of Social Sciences Vol. 3 (11) November 2012
516
4..6 Satisfaction Level of Experimental Group of Media, Equipment and Others for Risk Communication on Cardiovascular Disease Prevention Results of satisfaction level of experimental group for implementation of development strategy for risk communication on cardiovascular disease prevention, it was found that media, equipment and others in all aspects at very good level, and whole satisfaction for three aspects was at very good level, except slide media with physician description, and lecture and demonstration were at good level as presented in table 4. Table 4 Satisfaction of Experimental Group for Content Media and Equipments to Raise Awareness
Strategies X S.D. Level
1. Person Media -Hospital Health Team - Prototype Person
4.72 4.50
0.46 0.69
Very Good Very Good
Whole Satisfaction 4.53 0.18 Very Good 2. Equipment -Self-health Manual -Slide media with Physician Description - Health education board -Food model
4.70 3.57 4.51 4.77
0.50 0.57 0.58 0.42
Very Good Good Very Good Very Good
Whole Satisfaction 4.53 0.18 Very Good 3. Others -Knowledge Content of Risk Factors -Lecture and Demonstration
4.56 4.47
0.50 0.22
Very Good Good
Whole Satisfaction 4.53 0.18 Very Good 5. Discussion Holding meeting of 53 community peoples of risk group in Chainat Municipality, Chainat Province with focus group discussion for construction development strategy for risk communication on cardiovascular disease prevention, was found that there are 3 system units included 1) Risk Assessment, 2) Risk Management, and 3) Monitoring Results. After training, posttest mean score of experimental perception of risk opportunity, severity of cardiovascular disease, and self-health toward cardiovascular disease were higher than pretest with statistically significant at level of .01. Moreover, when monitoring was conducted after training, it was found that health behavior and health management in aspects of consumption on carbohydrate foods and put fish sauces or others seasoning were no different between pretest and posttest at statistically significant at .05 level and the others were different between pretest and posttest at statistically significant at .05 level. Satisfactions of experimental group for 5 communication models were at very good level including media, equipment and others in all aspects at very good level, and whole satisfaction for three aspects was at very good level, except slide media with physician description, and lecture and demonstration were at good level. Therefore to decrease cardiovascular disease, they must not consume much carbohydrate food and avoid to put fish sauces or others seasoning in their food. In order to accomplish cardiovascular disease prevention, they should aware and practice according to decreasing carbohydrate food and eating more fruits and vegetables, and exercises at least 3 times a week. Additionally, risk assessment, risk management and monitoring for results of health behavior and health management by using 5 communication model effectively.
References
. Bridget, B. K., and Valentin., F. (2010). Promoting Cardiovascular Health in the Developing World: A Critical Challenge to Achieve Global
Health. Washington, D.C: National Academies Press. Yusuf, S., et al. (2004). “Effect of potentially modifiable risk factors associated with myocardial infarction in 52 countries (the
INTERHEART study): case-control study”. Lancet 364 (9438): 937–52. Maton, A. (1993). Human Biology and Health. Englewood Cliffs, New Jersey: Prentice Hall. McGill, H.C., McMahan, C.A., Gidding, S.S. (2008). “Preventing heart disease in the 21st century: implications of the Pathobiological
Determinants of Atherosclerosis in Youth (PDAY) study”. Circulation 117 (9): 1216–27. Mendis, S., Puska, P., Norrving, B. (editors). (2011). Global Atlas on Cardiovascular Disease Thiengkamol, N. (2007). Globalization Administration. Bangkok: Saengchai Publishing. Thiengkamol, N. (2009c). Environment and Development Book2: Food Security.Bangkok: Chulalongkorn University Press. Thiengkamol, N. (2011a). Holistically Integrative Research. (2nd Edition). Bangkok: Chulalongkorn Press.

ISSN 2039-9340 Mediterranean Journal of Social Sciences Vol. 3 (11) November 2012
517
WHO. (2011). United Nations high-level meeting on non-communicable disease prevention and control. Retrieved from http://www.who.int/nmh/events/un_ncd_summit2011/en/index.html
Wikipedia. (2012). Cardiovascular disease. Retrieved from http://en.wikipedia.org/wiki/Cardiovascular_disease Wikipedia. (2012). Industrial Revolution. Retrieved from http://en.wikipedia.org/wiki/Industrial_Revolution


ISSN 2039-9340 Mediterranean Journal of Social Sciences Vol. 3 (11) November 2012
519
Exploratory Factor Analysis of the Effects of Design on Brand
Strategy-Performance in Malaysian Furniture Firms
Puteri Fadzline Tamyez
Universiti Teknologi MARA Email: [email protected]
Norzanah Mat Nor
Universiti Teknologi MARA
Email: [email protected]
Syed Jamal Abdul Nasir bin Syed Mohamad
Universiti Teknologi MARA Email: [email protected]
Doi:10.5901/mjss.2012.v3n11p519
Abstract: To investigate the performance of the Malaysian furniture companies in the context of design and brand strategy, a self-administered questionnaire survey was conducted. This research was conducted to examine the effects of design on the brand strategy towards a better export performance among companies. It is an important strategic tool that can help firms to manage their business activities more efficiently as well as provide them with their competitive edge, has attracted significant research attention. Despite the increased research attention in recent years, limited numbers of empirical studies have investigated how small and medium-sized firms (SMEs) perceived design, in the Malaysian context. The subjects involved in the survey included 223 furniture companies participating in the Malaysian Furniture Fair (MIFF 2012) that are highly committed in exporting. Consequently, it resulted in a return of 116 questionnaires that were furthered analyzed. This study sought to address this research issue by examining the perceptions of owners and managers of 116 furniture SMEs concerning design and their branding strategy in the Malaysian furniture industry. The findings suggest favourable perceptions of design among the SMEs brand strategy surveyed. Keywords: design, brand strategy, export performance, furniture 1. Introduction
The Malaysian furniture industry gives out an impressive growth for the past nine years as it contributes from 2.6 billion in 1997 to 6.3 billion in 2009 (MIFF, 2010). In 2010, Malaysia still has to endure the fierce competition with low cost producers of China and Vietnam. Most buyers from all over the world craves for solid wood furniture from Malaysia. It is also cost-effective and this had enable Malaysia to be on the 10 of the most exported furniture in the world after China and Vietnam. 600 exporters ceased to exist with 50 of them contributes to 65 to 75 percent of the exports (Wong, 2011). However, the decline of raw materials and the rise of costs have forced companies to venture into branding and design. Not to be left behind, more companies has transformed from OEM (Original Equipment Manufacturing) to ODM (Original Design Manufacturing). However, the level of good design has drop among local furniture manufacturers. Designers and manufacturers have not been synchronized enough to meet the challenges in the global market. Malaysia is in fact between China and the Italian in terms of quality of products. In the propensity of being a branded furniture industry, a study of past literature indentified that originality, creativity and high-quality products will reach for branding as a whole. A synergy of government agencies as well as furniture producers will greatly enhance the competitiveness of local companies through branding. Agencies related to the furniture industry are committed and highly enthusiastic in giving support and overcome the challenges ahead. NATIP or National Timber Industry Policy has given is full guidance in drawing appropriate policies and for sufficient growth for the years to come. Asian companies still consider branding as merely a logo design or as advertising(Roll 2008; Unit 2010).

ISSN 2039-9340 Mediterranean Journal of Social Sciences Vol. 3 (11) November 2012
520
“I felt that Asian business would never get anywhere if it didn’t own brands. Partly this reflected the earlier experience in our family business of putting in the energy to build a brand as agent for an overseas principal, only to lose it when they eventually took the brand in-house. I also knew the problems of competing in commodity markets where the business disappear as soon as a cheaper supplier comes into the scene.” Ho Kwon Ping They are already plentiful in their own comfort zone in their short term profit mentality. There feel competent and bountiful in outsourcing for other global branded companies and remained as an OEMs (Original Equipment Manufacturers)(Unit 2010). Copying is accepted and considered conventional among Asian countries. “Today the designer in Hong Kong or Taipei opens the magazine and looks at the best seller and copies that. But to be successful you have to find your own designs and energy.” Phillip Starck. This statement indicates the low importance of design among Asian companies. Design in fact determine a wide differentiation for products and changes a new outlook among customers(Roll 2008). A dramatic change as a whole is crucial as Asian companies need not only have to be fierce in being trendsetters by being closely linked to society, and the people and the culture (Dae-ryun and Roll 2011). Trendsetting must be carried out globally through branding, in being a role model for our nation’s richness in culture and identity. 2. Literature Review
2.1 Defining Export Performance Turbulence of global economy and changing of political conditions has forced companies to search for fresh ideas with lesser resources or in other words ‘more with less’(Abbing 2010). Export performance is defined as a result of efficiency through geographic diversification. These both elements has a highly positive relationship(Beleska-Spasova and Glaister 2010). This relationship will benefit companies for years to come in terms of economic of scale, resource accessibility, the augmentation of global market power, decreasing of instability and more experience gained internationally. The export figures of the industry are greatly influenced by incremental capital inputs (i.e. labor, raw materials) or production growth within the industry that spurs export performance(Ratnasingam 2003). The growth may be hindered with the combination of a drop of resources and the rise of labour cost particularly in the Asian industry. Furniture trade gained more control of the market through design and marketing. There is a lack of training on designs and innovation regardless of the existence of national policies. There is a lower chance of the Asian furniture industry to elevate the design and marketing with less importance on formal education and training. (Ratnasingam 2003). Figure 1.0 shows the sustainability of the export performance growth factors in the Southeast Asian furniture sector Figure 1: Sustainability of the export performance growth factors in the Southeast Asian furniture sector PRODUCTIVITY GAINS INDUSTRIAL GROWTH INCREASING EXPORTS INCREMENTAL INPUTS However, it is reported that actual productivity gains does not play a key role in increasing the exports, but by incremental capital gains. This indicate that factors that drive the furniture export growth is still not ascertain and this could lead to an industry that is accessed inaccurately with unreliable statistics(Ratnasingam and Ioras 2003). 2.2 Furniture Design Design are perceived by different types of definitions be it among users, designers or the manufacturers themselves. Its definition is semantically ‘fuzzy’ and unclear although in everyday language it is closely associated with aesthetics and visual expression particularly in the furniture industry(Council 2010). A classic meaning of design was stated by Krippendorff (1989);
“The etymology of design goes back to the latin de+ signare and means making something, distinguishing it by sign, giving it significance, designating its relation to others, owners, users and goods”
Krippendorff(1989) cited from (Czarnitzki and Thorwarth 2009)

ISSN 2039-9340 Mediterranean Journal of Social Sciences Vol. 3 (11) November 2012
521
Even though Malaysia, China as some of the countries in South East Asia has the largest furniture exporting constituency in the world, still elements of innovation and original design are still weak and immature(Ratnasingam 2003). He also stressed that even though Malaysia, China as some of the countries in South East Asia has the largest furniture exporting constituency in the world; still elements of innovation and original design are still weak and immature. He also mentioned that customer when purchase furniture would consider the aesthetic appeal of the product, the branding and its competitive pricing. IKEA for example uses a celebrity image which symbolizes products that are fashionable and elite but at the same time affordable. Their target market is the younger generation that is educated from students to urban professionals (Fulton, 2005). The most important element for the furniture industry to progress is design. Function and form that complement each other are regarded as the best design. In order to boost sales designers are urged to aspire with original ideas and be trend setters to new products in the market(Board 2010). Manufacturing and marketing are given more focus than design by some managers, as in Italy that gives out expressive design in comparison to Denmark that focuses on functionality. More furniture are related to functionality and this gives difficulty in branding to promote to the buyers to buy furniture(Walsh 2011). 3. Research Methodology
Figure 1.2: Conceptual Model This pilot study is based on a sample survey and it provides a great opportunity to assess the feasibility of large full-scale studies. This small scale study is also carried out to assist the preparation of a large, more comprehensive investigation. The sampling design used for the data collection was stratified random sampling as it was gathered via face-to-face survey involving Malaysian furniture companies. It is considered the most suitable and effective compared to other probability designs (Sekaran 2006). The primary data was collected from structured questionnaires in March 2012. The handing-in of the 223 questionnaires to the exporting furniture companies resulted in the return of 116 usable questionnaires. The 116 returned questionnaires represented a response rate of 52%.It is considered high and representative of the population studied and generalized(Sekaran 2006). 3.1 Survey Questionnaire The structured survey questionnaire adapted in this study consisted of five sections with a total number of 31 questions. Questions 1 through 11 in section A and B were used to obtain the general information concerning the respondents’ characteristics and the firms. The remaining 20 questions in sections C, D and E were designed to capture the respondents assessments of the export performance rate (5 questions), their branding strategy (9 questions), and their importance placed on design towards their branding strategy (6 questions). There are 3 open ended questions in this survey. The 31 questions, which was an adaption from the earlier works by(Boehe and Cruz 2010) . The respondents were asked to rate each item on a five-point scale ranging from (1) almost always true (2) usually true (3) often true (4) occasionally true (5) sometimes but frequently true (6) usually not true (7) almost never true, and another five-point scale ranging from (1) excellent (2) very good (3) good (4) fairly good (5) average (6) poor (7) very poor. The questionnaire was tested prior to the handing in to the 116 respondents. The reliability of variables should have a Cronbach’s alpha of 0.6 or more (Sekaran 2006). The coefficient alpha scores of the measures ranged from 0.69 to 0.98.
Export Performance Design
Branding Strategy
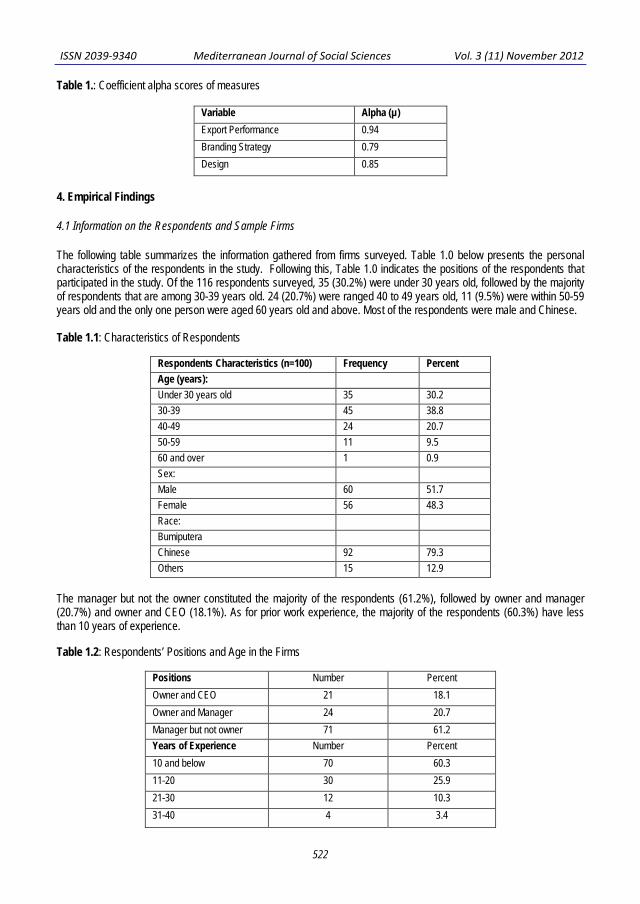
ISSN 2039-9340 Mediterranean Journal of Social Sciences Vol. 3 (11) November 2012
522
Table 1.: Coefficient alpha scores of measures
Variable Alpha (µ) Export Performance 0.94 Branding Strategy 0.79 Design 0.85
4. Empirical Findings
4.1 Information on the Respondents and Sample Firms
The following table summarizes the information gathered from firms surveyed. Table 1.0 below presents the personal characteristics of the respondents in the study. Following this, Table 1.0 indicates the positions of the respondents that participated in the study. Of the 116 respondents surveyed, 35 (30.2%) were under 30 years old, followed by the majority of respondents that are among 30-39 years old. 24 (20.7%) were ranged 40 to 49 years old, 11 (9.5%) were within 50-59 years old and the only one person were aged 60 years old and above. Most of the respondents were male and Chinese. Table 1.1: Characteristics of Respondents
Respondents Characteristics (n=100) Frequency Percent Age (years): Under 30 years old 35 30.2 30-39 45 38.8 40-49 24 20.7 50-59 11 9.5 60 and over 1 0.9 Sex: Male 60 51.7 Female 56 48.3 Race: Bumiputera Chinese 92 79.3 Others 15 12.9
The manager but not the owner constituted the majority of the respondents (61.2%), followed by owner and manager (20.7%) and owner and CEO (18.1%). As for prior work experience, the majority of the respondents (60.3%) have less than 10 years of experience. Table 1.2: Respondents’ Positions and Age in the Firms
Positions Number Percent Owner and CEO 21 18.1 Owner and Manager 24 20.7 Manager but not owner 71 61.2 Years of Experience Number Percent 10 and below 70 60.3 11-20 30 25.9 21-30 12 10.3 31-40 4 3.4

ISSN 2039-9340 Mediterranean Journal of Social Sciences Vol. 3 (11) November 2012
523
4.2 Characteristics of Sample Firms Table 1.2 displays the characteristics of the 116 firms that participated in the survey. Out of the 116 firms that responded, 90 firms or 78 percent had been in operation for more than ten years. In terms of employment, 14 of the 116 firms had more than 301 employees, 16 firms had between 201 to 300 employees, 33 firms employed between 101-200 employees and 53 firms had less than 100 employees which make the most employment within these firms.
Out of the total number of 116 firms, 86 were private limited, 13 were sole proprietors, and the remaining were partnerships and public listed. The 116 furniture companies represented various different sectors. Of the total 116 companies, 33 (28.4%) were office furniture, 32 (27.6%) represented bedroom furniture, 25 (21.6%) were involved in others, 17 (14.75%) operated door, and the remaining represent kitchen cabinet and outdoor furniture. Most of the firms involved were medium sized organization (56.0%), followed by small sized (18.1%), and the remaining (13.8%) and (12.1%) represent large and global organizations.
Furthermore, out of the 116 firms, 54 companies (46.6%) indicated that their companies produce RM1 Million to 10 Million in 2011. 28 companies (24.1%) reported having sales of more than RM10 Million, 20 companies (17.2%) represents sales of less than RM1 Million and the remaining companies has produced sales of more than RM50 Million. Table 1.3: The Sample Firms Characteristics
Firm Characteristics (n=100) Frequency Percent Size of Organization: Small 21 18.1 Medium 65 56.0 Large 16 13.8 Global 14 12.1 Legal Form: Sole Proprietorship 13 11.2 Partnership 8 6.9 Private Limited 86 74.1 Public Listed 9 7.8 Number of Employees 1-100 53 45.7 101-200 33 28.4 201-300 16 13.8 301-600 14 12.1 Total Sales (2011) Less than RM1 million 20 17.2 RM1 mil-10mil 54 46.6 RM10 mil-50mil 28 24.1 RM50mil-100mil 9 7.8 RM100mil-500mil 5 4.3 Furniture category Office 33 28.4 Kitchen Cabinet 3 2.6 Outdoor 6 5.2 Bedroom 32 27.6 Door 17 14.7 Others 25 21.6 Age of company Less than 5 years 8 6.9 6-10 years 18 15.5 11-15 years 33 28.4 16-20 years 22 19.0 More than 20 years 35 30.2
4.3 Export Rate Performance among the Furniture Companies The responses to the five Likert Scale questions about the rate of export performance obtained from the 116 furniture
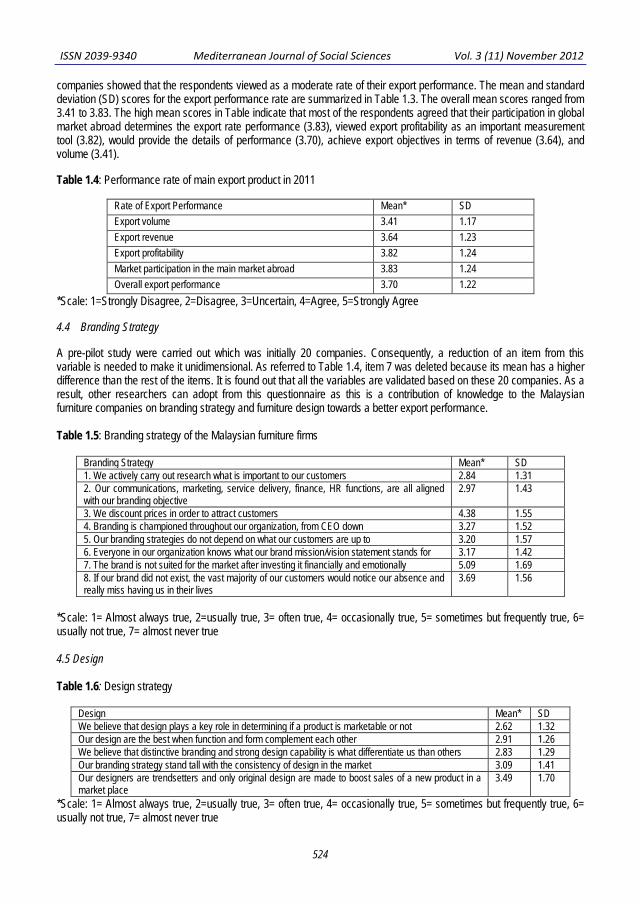
ISSN 2039-9340 Mediterranean Journal of Social Sciences Vol. 3 (11) November 2012
524
companies showed that the respondents viewed as a moderate rate of their export performance. The mean and standard deviation (SD) scores for the export performance rate are summarized in Table 1.3. The overall mean scores ranged from 3.41 to 3.83. The high mean scores in Table indicate that most of the respondents agreed that their participation in global market abroad determines the export rate performance (3.83), viewed export profitability as an important measurement tool (3.82), would provide the details of performance (3.70), achieve export objectives in terms of revenue (3.64), and volume (3.41). Table 1.4: Performance rate of main export product in 2011
Rate of Export Performance Mean* SD Export volume 3.41 1.17 Export revenue 3.64 1.23 Export profitability 3.82 1.24 Market participation in the main market abroad 3.83 1.24 Overall export performance 3.70 1.22
*Scale: 1=Strongly Disagree, 2=Disagree, 3=Uncertain, 4=Agree, 5=Strongly Agree 4.4 Branding Strategy A pre-pilot study were carried out which was initially 20 companies. Consequently, a reduction of an item from this variable is needed to make it unidimensional. As referred to Table 1.4, item 7 was deleted because its mean has a higher difference than the rest of the items. It is found out that all the variables are validated based on these 20 companies. As a result, other researchers can adopt from this questionnaire as this is a contribution of knowledge to the Malaysian furniture companies on branding strategy and furniture design towards a better export performance. Table 1.5: Branding strategy of the Malaysian furniture firms
Branding Strategy Mean* SD 1. We actively carry out research what is important to our customers 2.84 1.31 2. Our communications, marketing, service delivery, finance, HR functions, are all aligned with our branding objective
2.97 1.43
3. We discount prices in order to attract customers 4.38 1.55 4. Branding is championed throughout our organization, from CEO down 3.27 1.52 5. Our branding strategies do not depend on what our customers are up to 3.20 1.57 6. Everyone in our organization knows what our brand mission/vision statement stands for 3.17 1.42 7. The brand is not suited for the market after investing it financially and emotionally 5.09 1.69 8. If our brand did not exist, the vast majority of our customers would notice our absence and really miss having us in their lives
3.69 1.56
*Scale: 1= Almost always true, 2=usually true, 3= often true, 4= occasionally true, 5= sometimes but frequently true, 6= usually not true, 7= almost never true 4.5 Design Table 1.6: Design strategy
Design Mean* SD We believe that design plays a key role in determining if a product is marketable or not 2.62 1.32 Our design are the best when function and form complement each other 2.91 1.26 We believe that distinctive branding and strong design capability is what differentiate us than others 2.83 1.29 Our branding strategy stand tall with the consistency of design in the market 3.09 1.41 Our designers are trendsetters and only original design are made to boost sales of a new product in a market place
3.49 1.70
*Scale: 1= Almost always true, 2=usually true, 3= often true, 4= occasionally true, 5= sometimes but frequently true, 6= usually not true, 7= almost never true

ISSN 2039-9340 Mediterranean Journal of Social Sciences Vol. 3 (11) November 2012
525
Initially, the factorability of the 17 items was examined. Several well-recognised criteria for the factorability of a correlation were used. The Kaiser-Meyer-Olkin test (KMO) and Bartlett’s test of Sphericity were applied on the collected data (see Table 1.6). Kaiser-Meyer-Olkin measure of sampling adequacy tests whether the partial correlations among variables are small or not. The results showed KMO is 0.842 and, according to the criteria suggested by (Pallant 2007), the criteria for KMO value must be 0.6 or above and that the Bartlett’s Test of Sphericity value is significant which is 0.5 or smaller. Thus KMO Statistic suggests that we have sufficient sample size relative to the number of items/ attributes in our scale. We can also conclude from the Bartlett’s Test of Sphericity value, the correlation matrix is not an identity matrix. Hence, the KMO statistic and Bartlett’s tests of Sphericity (P<0) suggest that the correlation matrix is factorable. The significance Level (Sig) for Bartlett’s test of Sphericity (135585.75), for the 15 attribute/item Correlation matrix was highly significant (p<.000). Thus, we can conclude that according to Bartlett’s test, the correlation matrix is not an identity matrix. Hence, the KMO statistic and Bartlett’s test of Sphericity (P<O) Table 1.7: KMO and Bartlett's Test
Kaiser-Meyer-Olkin Measure of Sampling Adequacy. .845 Bartlett's Test of Sphericity Approx. Chi-Square 1.232E3
Df 153 Sig. .000
Table 1.8: Descriptive Statistics
Mean Std. Deviation Analysis N
C1 3.4138 1.17265 116
C2 3.6379 1.23286 116
C3 3.8190 1.24131 116
C4 3.8276 1.23904 116
C5 3.6983 1.22453 116
D2 2.8362 1.31178 116
D3 2.9741 1.42927 116
D4 4.3793 1.54726 116
D5 3.2672 1.52291 116
D6 3.1983 1.57270 116
D7 3.1724 1.42204 116
D8 5.0862 1.69177 116
D9 3.6897 1.56268 116
E1 2.6207 1.31649 116
E2 2.9138 1.26194 116
E3 2.8276 1.28723 116
E4 3.0948 1.40792 116

ISSN 2039-9340 Mediterranean Journal of Social Sciences Vol. 3 (11) November 2012
526
Mean Std. Deviation Analysis N
C1 3.4138 1.17265 116
C2 3.6379 1.23286 116
C3 3.8190 1.24131 116
C4 3.8276 1.23904 116
C5 3.6983 1.22453 116
D2 2.8362 1.31178 116
D3 2.9741 1.42927 116
D4 4.3793 1.54726 116
D5 3.2672 1.52291 116
D6 3.1983 1.57270 116
D7 3.1724 1.42204 116
D8 5.0862 1.69177 116
D9 3.6897 1.56268 116
E1 2.6207 1.31649 116
E2 2.9138 1.26194 116
E3 2.8276 1.28723 116
E4 3.0948 1.40792 116
E5 3.4914 1.70164 116
In Table 1.8 of the descriptive statistics table, item D4 and D8 have different means than others, which are 4.3793 and 5.0862. Table 1.9: Communalities
Initial Extraction
C1 1.000 .867 C2 1.000 .809 C3 1.000 .791 C4 1.000 .704 C5 1.000 .894 D2 1.000 .502 D3 1.000 .591 D4 1.000 .588 D5 1.000 .693 D6 1.000 .624 D9 1.000 .531 E1 1.000 .675

ISSN 2039-9340 Mediterranean Journal of Social Sciences Vol. 3 (11) November 2012
527
E2 1.000 .655 E3 1.000 .790 E4 1.000 .739 E5 1.000 .506 D8 1.000 .627 Extraction Method: Principal Component Analysis.
All five extracted components account for 86.4% of the variance in variable C1 (h2=0.864). The communality value for each variable should be more than 0.5 or higher.
Table 2.0:Total Variance Explained
Component
Initial Eigenvalues Extraction Sums of Squared Loadings Rotation Sums of Squared Loadings
Total % of Variance Cumulative % Total % of Variance Cumulative % Total % of Variance Cumulative %
1 6.059 35.641 35.641 6.059 35.641 35.641 4.187 24.628 24.628
2 2.876 16.918 52.559 2.876 16.918 52.559 3.747 22.041 46.669
3 1.539 9.054 61.613 1.539 9.054 61.613 2.529 14.875 61.544
4 1.113 6.546 68.159 1.113 6.546 68.159 1.125 6.616 68.159
5 1.074 6.315 74.474
6 .786 4.623 79.097
7 .618 3.633 82.730
8 .562 3.306 86.036
9 .482 2.837 88.874
10 .403 2.370 91.244
11 .316 1.861 93.105
12 .289 1.703 94.807
13 .245 1.438 96.246
14 .221 1.300 97.546
15 .190 1.120 98.665
16 .138 .811 99.477
17 .089 .523 100.000
Extraction Method: Principal Component Analysis.
Principal components analysis revealed the presence of five components with eigenvalues exceeding 1, explaining 34.4%, 16.9%, 9.0%, 6.4%, and 6.1% of the variance respectively in Table 2.0.

ISSN 2039-9340 Mediterranean Journal of Social Sciences Vol. 3 (11) November 2012
528
Figure 1.3: Scree Plot Figure 1.3 displays the point at which the curve begins to straighten out is considered to indicate the maximum factors to extract. In this case, the first 7 factors would qualify. Beyond 7, too large proportion of unique variance would be included; thus these factors would not be acceptable. In using latent root criterion, only 4 factors would have been considered. Table 2.1:Component Matrixa
Component 1 2 3 4 5
C1 .671 -.626 -.154 -.035 .024 C2 .686 -.577 -.066 -.039 .051 C3 .682 -.566 -.004 -.073 .032 C4 .652 -.521 .062 -.059 .108 C5 .757 -.558 -.095 .009 .008 D2 .515 .409 .246 -.092 .415 D3 .662 .276 .126 -.245 .273 D4 .343 -.040 .644 .234 -.263 D5 .579 .386 .427 -.163 -.052 D6 .513 .237 .547 .069 -.081 D9 .518 -.027 .156 .488 -.452 E1 .612 .429 -.331 -.088 -.163 E2 .661 .420 -.181 .097 .117 E3 .722 .459 -.221 -.092 -.078 E4 .713 .389 -.272 .071 .126 E5 .379 .273 -.483 .234 -.388 D8 -.022 .014 -.056 .790 .563 Extraction Method: Principal Component Analysis.

ISSN 2039-9340 Mediterranean Journal of Social Sciences Vol. 3 (11) November 2012
529
Component 1 2 3 4 5
C1 .671 -.626 -.154 -.035 .024 C2 .686 -.577 -.066 -.039 .051 C3 .682 -.566 -.004 -.073 .032 C4 .652 -.521 .062 -.059 .108 C5 .757 -.558 -.095 .009 .008 D2 .515 .409 .246 -.092 .415 D3 .662 .276 .126 -.245 .273 D4 .343 -.040 .644 .234 -.263 D5 .579 .386 .427 -.163 -.052 D6 .513 .237 .547 .069 -.081 D9 .518 -.027 .156 .488 -.452 E1 .612 .429 -.331 -.088 -.163 E2 .661 .420 -.181 .097 .117 E3 .722 .459 -.221 -.092 -.078 E4 .713 .389 -.272 .071 .126 E5 .379 .273 -.483 .234 -.388 D8 -.022 .014 -.056 .790 .563 Extraction Method: Principal Component Analysis. a. 5 components extracted.
Table 2.1 displays each variable's loading on each component. From the output, there is one item (D8) which do not load on the first component (always the strongest component without rotation) but create their own retained component (also with eigenvalue greater than 1). A component should have, as a minimum, 3 items/variables; but deletion of items is reserved until it is discovered whether or not these components are related. A simple correlation is on these components. In Table 2.2 there is no relationship between the components which indicates orthogonal rotation strategy can be used. Therefore, D8 can be extracted among the components. Table 2.2: Correlations
Correlations
REGR factor score
1 for analysis 1 REGR factor score
2 for analysis 1 REGR factor score
3 for analysis 1 REGR factor score
4 for analysis 1 REGR factor score
5 for analysis 1
REGR factor score 1 for analysis 1
Pearson Correlation 1 .000 .000 .000 .000
Sig. (2-tailed) 1.000 1.000 1.000 1.000
N 116 116 116 116 116 REGR factor score 2 for analysis 1
Pearson Correlation .000 1 .000 .000 .000
Sig. (2-tailed) 1.000 1.000 1.000 1.000 N 116 116 116 116 116
REGR factor score 3 for analysis 1
Pearson Correlation .000 .000 1 .000 .000
Sig. (2-tailed) 1.000 1.000 1.000 1.000

ISSN 2039-9340 Mediterranean Journal of Social Sciences Vol. 3 (11) November 2012
530
N 116 116 116 116 116 REGR factor score 4 for analysis 1
Pearson Correlation .000 .000 .000 1 .000
Sig. (2-tailed) 1.000 1.000 1.000 1.000 N 116 116 116 116 116
REGR factor score 5 for analysis 1
Pearson Correlation .000 .000 .000 .000 1
Sig. (2-tailed) 1.000 1.000 1.000 1.000 N 116 116 116 116 116
Table 2.3 displays the total variance explained. This value of 70.7% of the variance in the items (specifically variance-covariance matrix) is accounted for by all 4 components.
Table 2.3: Total Variance Explained
Component
Initial Eigenvalues Extraction Sums of Squared Loadings Rotation Sums of Squared Loadings
Total % of Variance Cumulative % Total % of Variance Cumulative % Total % of Variance Cumulative %
1 6.059 37.866 37.866 6.059 37.866 37.866 4.135 25.843 25.843
2 2.876 17.974 55.841 2.876 17.974 55.841 2.875 17.968 43.811
3 1.538 9.614 65.455 1.538 9.614 65.455 2.839 17.744 61.555
4 1.087 6.795 72.250 1.087 6.795 72.250 1.711 10.694 72.250
5 .788 4.925 77.174
6 .631 3.941 81.116
7 .564 3.525 84.640
8 .503 3.144 87.784
9 .430 2.688 90.472
10 .320 1.998 92.470
11 .302 1.889 94.359
12 .254 1.588 95.948
13 .222 1.387 97.335
14 .195 1.221 98.556
15 .139 .867 99.423
16 .092 .577 100.000
Extraction Method: Principal Component Analysis.
Table 2.4 displays component loadings for each item (prior to rotation)

ISSN 2039-9340 Mediterranean Journal of Social Sciences Vol. 3 (11) November 2012
531
Table 2.4: Component Matrixa
Component 1 2 3 4
C1 .671 -.626 -.154 -.041 C2 .686 -.577 -.066 -.064 C3 .682 -.566 -.006 -.070 C4 .652 -.521 .062 -.121 C5 .757 -.558 -.095 .000 D2 .516 .409 .250 -.384 D3 .662 .276 .124 -.365 D4 .343 -.040 .645 .350 D5 .579 .386 .422 -.059 D6 .513 .237 .548 .103 D9 .518 -.028 .161 .655 E1 .612 .429 -.336 .077 E2 .661 .419 -.176 -.035 E3 .722 .460 -.225 .007 E4 .713 .389 -.267 -.057 E5 .379 .273 -.483 .453 Extraction Method: Principal Component Analysis. a. 4 components extracted.
A principle-components factor analysis of the remaining 16 items, using varimax was conducted, with the four factors explaining 72.25% of the variance. Table 2.4 shows the Rotated Component Matrix that displays the loadings for each item on each rotated component, again clearly showing which items make up each component.
Table 2.4: Rotated Component Matrixa
Component 1 2 3 4
C1 .921 .133 .011 .035 C2 .887 .099 .088 .087 C3 .870 .062 .117 .123 C4 .816 .004 .179 .128 C5 .914 .186 .083 .131 D2 .041 .135 .786 .078 D3 .246 .235 .739 .042 D4 .138 -.109 .173 .773 D5 .041 .178 .669 .430 D6 .078 .064 .509 .601 D9 .256 .406 -.096 .696 E1 .095 .740 .347 .014 E2 .131 .616 .494 .062 E3 .139 .712 .501 .076 E4 .200 .677 .487 -.001 E5 .034 .794 -.131 .091 Extraction Method: Principal Component Analysis. Rotation Method: Varimax with Kaiser Normalization.

ISSN 2039-9340 Mediterranean Journal of Social Sciences Vol. 3 (11) November 2012
532
Table 2.4: Rotated Component Matrixa
Component 1 2 3 4
C1 .921 .133 .011 .035 C2 .887 .099 .088 .087 C3 .870 .062 .117 .123 C4 .816 .004 .179 .128 C5 .914 .186 .083 .131 D2 .041 .135 .786 .078 D3 .246 .235 .739 .042 D4 .138 -.109 .173 .773 D5 .041 .178 .669 .430 D6 .078 .064 .509 .601 D9 .256 .406 -.096 .696 E1 .095 .740 .347 .014 E2 .131 .616 .494 .062 E3 .139 .712 .501 .076 E4 .200 .677 .487 -.001 E5 .034 .794 -.131 .091 Extraction Method: Principal Component Analysis. Rotation Method: Varimax with Kaiser Normalization. a. Rotation converged in 16 iterations.
Rotated Component Matrix shows the factor loadings for each variable. Based on these factor loadings, the factors represent: Table 2.5: Rotated Component Matrix
Component 1 2 3 4 Export volume .921 Export revenue .887 Export profitability .870 Market participation in the main market abroad .816 Overall export performance .914 We believe that design plays a key role in determining if a product is marketable or not .740 Our design are best when function and form complement each other .616 We believe that distinctive branding and strong design capability is what differentiate us than others
.712
Our brand strategy stand tall with the consistency of design in the market .677 Our designers are trendsetters and only original design are made to boost sales of a new product in a market place
.794
We actively investigate what is important to our customers using research .786 Our communications, marketing, service delivery, finance, HR functions, all aligned with our brand objective
.739
Branding is championed throughout our organization, from the CEO down .669 Everyone in our organization knows what our brand mission stands for .509 Our brand strategy stands tall with the consistency of design .501 We don’t have to discount prices in order to attract and keep customers .773 Our brand strategies do not depend on what our competitors are up to .601 If our brand did not exist, the vast majority of our customers would notice our absence and really miss us in our lives
.696

ISSN 2039-9340 Mediterranean Journal of Social Sciences Vol. 3 (11) November 2012
533
The questions that load highly on factor 1 seem to all relate to export performance of these firms. Therefore, this factor is labeled as factor export performance. The questions that load highly on factor 2 seem to relate to design strategy. The 5 questions that load highly on factor 3 all seem to relate with both brand strategy and design strategy. Finally, the questions that load highly on factor 4 all contain some component of brand strategy; therefore this factor is labeled as brand strategy. This analysis seems to reveal that the initial questionnaire, in reality composed of three scales: export performance, brand strategy and design. The Component Transformation Matrix displays the correlations among the components prior to and after rotation. This table is related with the SPSS performing the orthogonal rotation that was carried out earlier.
Table 2.6:Component Transformation Matrix
Comp 1 2 3 4
1 .639 .501 .508 .287 2 -.752 .452 .479 .039 3 -.108 -.623 .363 .685 4 -.121 .397 -.617 .669 Extraction Method: Principal Component Analysis. Rotation Method: Varimax with Kaiser Normalization.
Number of items have been reduced from 18 to 16, reduced the number of components, and yet have improved the amount of variance accounted for in the items by our principal components. 5. Concluding remarks
The present study initiated an attempt to investigate the perceptions of small and medium-sized firms (SMEs) in the Malaysian furniture industry concerning the effects of design on their brand strategy. More specifically, the study attempted to examine how these companies viewed the importance of design to their firms and how is it related with their brand strategy. On the basis of the overall analysis of the results of the study, several interesting findings can be summarized. The questionnaire survey has 18 items and was run by factor analysis. Eigenvalue and scree plot show the questions are multidimensional. 18 items has been extracted and reduced to 16 items. Composite scores were created for each of the three factors, based on the mean of the items which had their primary loadings on each factor. Higher scores indicated export performance. Brand strategy was the factor that firms reported using the most, with a positively skewed distribution, whilst Design were used considerably less. All factors had positively skewed distributions. Descriptive statistics are presented in Table 2.7. Table 2.7: Descriptive statistics for the three factors (N =116);
No. of items M (SD) Skewness Kurtosis Alpha Export Performance 5 3.68 (1.22) .22 -.16 .94 Brand Strategy 8 3.58 (1.49) .20 -.44 .79 Design 5 2.99 (.94) .64 -.03 .85
Overall, these analyses indicated three distinct factors were determinants of the firms’ performance and that these factors were moderately internally consistent. Two of the eighteen items were eliminated, however the 4 factors were retained. Table 2.5 displayed the Rotation component matrix which clearly shows the higher loadings on export performance on factor 1, higher loadings on both brand strategy and design on factor 2, and higher loadings of brand strategy on factor 3. An approximately normal distribution was evident in the current study, thus the data were well suited for parametric statistical analysis.
ISSN 2039-9340 Mediterranean Journal of Social Sciences Vol. 3 (11) November 2012
534
References Abbing, E. R. (2010). Brand-Driven Innovation. Switzerland, AVA Publishing SA. Beleska-Spasova, E. and K. W. Glaister (2010). "Geographic Orientation and Performance." Management International Review 50: 533-
557. Board, M. T. I. (2010). Mas Kayu (October 2010), MTIB. 10. Boehe, D. M. and L. B. Cruz (2010). "Corporate Social Responsibility, Product Differentiation Strategy and Export Performance." Journal
of Business Ethics 91: 325-346. Council, N. D. (2010). Design Driven Innovation Programme. N. D. Council. Norway. Czarnitzki, D. and S. Thorwarth (2009). The Design Paradox: The Contribution of In-house and External Design Activities on Product
Market Performance. C. o. E. E. Research. Copenhagen. Dae-ryun, C. and M. Roll (2011) Next Level of Asian Marketing. The Korea Times: Business Focus Pallant, J. (2007). SPSS Survival Manual. Australia, Allen & Unwin. Ratnasingam, J. (2003). "A Matter of Design in the South East Asian Wooden Furniture Industry." Springer-Verlag 61: 3. Ratnasingam, J. and F. Ioras (2003). "The sustainability of the Asian wooden furniture industry " European Journal of Wood and Wood
Products 61(2): 233-237. Roll, M. (2008). " Asian Brand Strategy - Executive Summary." Sekaran, U. (2006). Research Methods for Business: A Skill Building Approach, John Wiley and Sons. Unit, E. I. (2010). Brand and Deliver: Emerging Asia's new corporate imperative. The Economist. Walsh, V., Roy Robin and Margaret Bruce (2011). "Competitive by Design." Journal of Marketing Management 4(2).

ISSN 2039-9340 Mediterranean Journal of Social Sciences Vol. 3 (11) November 2012
535
Factors Affecting Villagers Participation in Community Environment Development
Chuleewan Praneetham
Department of Environmental Education
Faculty of Environment and Natural Resources Studies Mahasarakham University, Mahasarakham 44150, Thailand
Dr. Nongnapas Thiengkamol
Major Advisor, Department of Environmental Education Faculty of Environment and Natural Resources Studies
Mahasarakham University, Mahasarakham 44150, Thailand Email: [email protected]
Assoc. Prof. Dr. Kongsak Thathong
Co- Advisor, Department of Environmental Education Faculty of Education, Khon Kaen University, Thailand
Dr. Tanarat Thiengkamol
Co- Advisor, School of Management, Assumption University
Hua Mak Campus, 592/3 Ramkhamhaeng 24 Hua Mak, Bangkok 10240, Thailand
Doi:10.5901/mjss.2012.v3n11p535
Abstract The objectives of this research were to develop a prototype network of community environment with integration of environmental education principle and the principle of self-sufficiency economy and study factors affecting of villagers participation in community environment development in Khon Kaen Province, Thailand. The population was villagers in the Khon Kaen Province, Thailand. The simple random sampling technique was employed to collect 400 villagers for this research. The questionnaire was used as research instrument for data collection. The content and structural validity were determined by Item Objective Congruent (IOC) with 5 experts in the aspects of environmental education, psychology, social research methodology and philosophy of self-sufficiency economy. The reliability was determined by Cronbach’s Alpha. Reliability of knowledge about environment, awareness, attitude towards environment, behavior towards environment and self-sufficiency economy practice and the whole questionnaire were 0.884, 0.874, 0.893, 0.900, 0.942 and 0.934 respectively. The descriptive statistics used were frequency, percentage, mean and standard deviation. The inferential statistics used was the Canonical Correlation Analysis for statistical analysis.The results revealed that the best model of canonical correlation for the prototype village of sufficiency economy and the ordinary village sample group were the models had canonically correlation with .36136 and .39126 respectively between the set of independent variable of canonical correlation between knowledge, awareness and attitude towards environment and the set of dependent variables included behavior towards environment and self-sufficiency economy practice. Keywords: Development/ Prototype Network of Community Environment/ Environmental Education Principle/ Principle of Self-sufficiency Economy 1. Introduction Human negligence and human activities of livelihood often cause the environmental impacts and environmental degradation (Jamaluddin Md. Jahi et al., 2009: 258; Thiengkamol, N., 2011e: 22). People’s participation is the most important issue of affecting in protecting the environment and natural resource because people lacked of knowledge and understanding, awareness, consciousness, attitude and failing to see the benefits directly applicable to them and their

ISSN 2039-9340 Mediterranean Journal of Social Sciences Vol. 3 (11) November 2012
536
community. Moreover, they do not realize that they are an important part to take a responsibility for natural resource and environmental conservation (Thathong, 2009:8 – 13; Thiengkamol, N., 2011e: 15-16).
Environmental education is an effective learning process to help achieve sustainable development. Because it’s learning process helps people to understand the relationship between human and environment that human actions will affects directly and indirectly to the environment. This education can help create public consciences within people and stimulate them to have responsible behavior by using appropriate technological education to develop the quality of life and the environment (Stapp & Dorothy. 1981: 1; Schmieder & Allen, 1977a: 25; Thathong and Sukriyapong, 1988; Chunkao, K., 1993: 715; Thiengkamol, N., 2005a; Thiengkamol, N., 2005b; Jamaluddin Md. Jahi et al., 2009; Thiengkamol, N., 2010b; Thiengkamol, N., 2011e). Environmental education can increase people’s knowledge and understanding, and support people to have good attitude, raise their awareness on environmental problem, develop problem – solving skills and evaluation for challenging, fostering attitudes, belief, and value, motivate people to commit and take responsible action for environmental conservation including strengthening his competency for self, family and community (Stapp et al., 1969; UNESCO, 1978; Thiengkamol, N., 2005a; Thiengkamol, N., 2005b; Thiengkamol, N., 2011c; Thiengkamol, N., 2011e). Environmental education process must be implemented at all agents regarding local, country, region, and international level with the public awareness raising, attitude and behavior changing, public consciousness and responsibility building (Thiengkamol, N., 2011e: 22-25).
The self-sufficiency economy concept is to lead people to a balanced way of life with a self-sufficiency economy in mind, guide the livelihood and behavior of people on matters concerning sustainable development at all levels, from the family to the community to the country (Punthasaen, 2007; Sukwat, el al, 2012). Community takes an important role to promote and support environment conservation and sustainable development. People in community are an important force in solving the environmental crisis because they would be a prototype of community environment for other province in the same region or other region of Thailand. It could be concluded that environmental education principle and principle of self-sufficiency economy have the same goal which is sustainable development. Therefore, the researcher is interested to study on develop the prototype network of community with integration of environmental education principle and the principle of self-sufficiency economy. 2. Objective The objective of this research was to develop the prototype network of community environment with integration of environmental education principle and the principle of self-sufficiency economy and study factors affecting of villagers participation in community environment development in Khon Kaen province, Thailand. 3. Methodology The research design was implemented in steps by step as followings:
The population was villagers in the Khon Kaen Province, Thailand. The simple random sampling technique was employed to collect 400 villagers; 200 villagers from villages which were selected by Ministry of Interior, Thailand, as the prototype village of sufficiency economy and 200 villagers from the ordinary villages. The research instrument was questionnaire and it was used for data collecting.
The content and structural validity were determined by Item Objective Congruent (IOC) with 5 experts in the aspects of environmental education, psychology, social research methodology and philosophy of self-sufficiency economy. The reliability was determined by Cronbach’s Alpha. Reliability of knowledge about environment, awareness, attitude towards environment, behavior towards environment and self-sufficiency economy practice and the whole questionnaire were 0.884, 0.874, 0.893, 0.900, 0.942 and 0.934 respectively.
The descriptive statistics used were frequency, percentage, mean and standard deviation (S.D). The inferential statistics used was the Canonical Correlation Analysis used for statistical analysis (Hair, J.F., et al, 1998: 442-462). 4. Results 4.1 General Characteristics of Sample Group The sample group of this study was 200 villagers from villages which were selected by Ministry of Interior, Thailand, as the prototype village of sufficiency economy and 200 villagers from ordinary villages in Khon Kaen Province, Thailand.

ISSN 2039-9340 Mediterranean Journal of Social Sciences Vol. 3 (11) November 2012
537
Most of them were female with 58.50 % and had average of age with 42.52 years old. Most of them had education level at primary school with 43.00 % and had occupation as farmer with 36.30 %, as shown in table 1. Table 1: Demographic Characteristics of Sample Group
Characteristics Sex Frequency Percent Male 166 41.5 Female 234 58.5 Total 400 100.0
Age Year S.D. Minimum 18 Maximum 65 Average 42.52 9.8 Education Level Frequency Percent Primary school 172 43.0 High school 85 21.3 Secondary school or equal level 62 15.5 Diploma or equal level 14 3.5 Bachelor 45 11.3 Higher than Bachelor 22 5.5
Occupation Frequency Percent Farmers 145 36.3 Agriculturist 64 16.0 Salesmen 33 8.3 General hire 43 10.8 Housewives 15 3.8 Official 51 12.8 Employees 42 10.5 Un-identification/Students 7 1.8 Total 400 100.0
4.2 Correlation among Environmental Education Variables and Behavior towards Environment and Self-sufficiency Economy Practice Variables of Villagers Sample Group From table 2, the results illustrated knowledge of ordinary village sample group correlated only to behavior towards environment with statistically significant at .05 while awareness of the prototype village of sufficiency economy sample group correlated to behavior towards environment and self-sufficiency economy with statistically significant at .01. Meanwhile, awareness of ordinary village sample group correlated only to self-sufficiency economy with statistically significant at .01. Additionally, attitude of prototype village of sufficiency economy sample group correlated to behavior towards environment and self-sufficiency economy practice with statistically significant at .01 while, attitude of ordinary village sample group correlated only to self-sufficiency economy practice with statistically significant at .01.

ISSN 2039-9340 Mediterranean Journal of Social Sciences Vol. 3 (11) November 2012
538
Table 2: Pearson Correlation between Independent and Dependent Variables
Variable Prototype Village of Sufficiency Economy Ordinary Village Behavior towards Environment
Self-sufficiency Economy Behavior towards Environment
Self-sufficiency Economy practice
Knowledge .066 .091 -.168* -.058
Awareness .256** .359** .134 .353** Attitude .226** .257** .071 .298**
* Correlation significant at the .05 level, * * Correlation significant at the .01 level. 4.3 Multivariate Tests of Significance among Independent and Dependent Variables From table 3, the results of the different techniques of Multivariate Tests of Significance as Pillais, Hotellings, and Wilks showed that these were highly statistical significance (p<.01) which all indicated that the canonical function taken collectively, were statistically significant at the .01 level. Expected only Roy techniques illustrated with .13058 for the prototype village of sufficiency economy sample group and .15309 for the ordinary village sample group, which an alternative technique was called step-down procedure, it was a test of significance and simultaneous confidence-bound on a number of “deviation-parameters”. The essential point of the step-down procedure in multivariate analysis is that the variates were supposed to be arranged in descending order of importance Table 3: Multivariate Tests of Significance among Independent and Dependent Variables
Prototype Village of Sufficiency Economy Sample Group Variables Value Approx. F Hypoth. DF Error DF Sig. of F Pillais .13650 4.78553 6.00 392.00 .000*** Hotellings .15615 5.04872 6.00 388.00 .000*** Wilks .86427 4.91775 6.00 390.00 .000*** Roys .13058 Ordinary Village Sample Group Variables Value Approx. F Hypoth. DF Error DF Sig. of F Pillais .19243 6.95515 6.00 392.00 .000*** Hotellings .22171 7.16863 6.00 388.00 .000*** Wilks .81360 7.06248 6.00 390.00 .000*** Roys .15309
* ** Correlation is significant at the .001 level (2-tailed). 4.4 Canonical Correlation Canonical correlation between the set of independent variables included knowledge, awareness and attitude towards environment and the set of dependent variables included behavior towards environment and self-sufficiency economy, the finding revealed that they canonically correlated with .36136 and Eigenvalue was .15020 for the prototype village of sufficiency economy sample group and they canonically correlated with .39126 and Eigenvalue was .18076 for the ordinary village sample group. This is the best model to explain canonical correlation between two set of variate as shown in table 4. Table 4: Eigenvalue and Canonical Correlations
Prototype Village of Sufficiency Economy Sample Group
Root No. Eigenvalue Pct Cum. Pct. Canon Cor. Sq. Cor. 1 .15020 96.18968 96.18968 .36136 .13058 2 .00595 3.81032 100.00000 .07691 .00591

ISSN 2039-9340 Mediterranean Journal of Social Sciences Vol. 3 (11) November 2012
539
Dimension Reduction Analysis was done, the finding revealed that every pair of roots was statistically significant at level .000 and .559 respectively.
Ordinary Village Sample Group Root No. Eigenvalue Pct Cum. Pct. Canon Cor. Sq. Cor. 1 .18076 81.52907 81.52907 .39126 .15309 2 .04095 18.47093 100.00000 .19835 .03934 Dimension Reduction Analysis was done, the finding revealed that every pair of roots was statistically significant at level .01 and .020 respectively.
4.5 Correlations between Dependent and Canonical Variables Function Numbers From table 5, the finding revealed that for the prototype village of sufficiency economy sample group, the highest weight of function number 1 was awareness with -.99316, the highest weight of function number 2 was attitude towards environment with -.68943. For the ordinary village sample group, the highest weight of function number 1 was awareness with -.92527, the highest weight of function number 2 was knowledge with .86265.
Table 5: Correlations between Dependent and Canonical Variables Function No.
Type of Variable
Name of Variable
Prototype Village of Sufficiency Economy Sample Group Ordinary Village Sample Group
Canonical Variables Function No. Canonical Variables Function No. No. 1 No 2 No. 1 No 2
Independent Variable
Knowledge -.25154 .00722 .07711 .86265
Awareness -.99316 .10159 -.92527 .10568 Attitude towards environment -.71990 -.68943 -.80061 .33994
5. Discussion The result of quantitative approach findings revealed that the independent variables of knowledge, awareness and attitude towards environment affected to behavior towards environment and self-sufficiency economy practice. This related to survey of Sukwat, et al, (2012) revealed that environmental education regarding to knowledge, awareness and attitude related to behavior towards environment and sufficiency economy practice. Moreover, environmental behavior changing would be influenced by environmental education principles in term of knowledge, attitude and awareness (Thiengkamol, N., 2011g; Thiengkamol, N., 2011h; Thiengkamol, N., 2012a; Thiengkamol, N., 2012b; Thiengkamol, N., 2012c; Ngarmsang, K, Thiengkamol, N., and Thiengkamol, C., 2012). Moreover, the results also discovered that villagers from the prototype village of sufficiency economy are able to act as environmentalist because they could be inspired attitude and behavior changing for participation including taking responsibility daily life activity in environmental conservation. They might be a good prototype of community environment to stimulate and encourage other villages to conserve environment and natural resource.
References
Chunkao, K. (1993). Environmental Education. Bangkok: Aksornsayam Publishing, Economic and Social Commission for Asia and the
Pacific, 30Sep-2 Oct 1997. Department of Environmental Quality Promotion, Ministry of Science, B.E. 2540-2544. Hair, J.F. Anderson, R.E., Tataham, R.L., Black, W.C. (1998). Multivariate Data Analysis. New Jersey : Prentice Hall. Jamaluddin Md. Jahi. et al. (2009). Development, environmental degratation and environmental management in Malaysia. European
Journal of Social Sciences; 9 (2) : 262-264. Ngarmsang, K, Thiengkamol, N., and Thiengkamol, C. (2012). Development of an Environmental Education and Environmental
Management Model for Learning Disability Student. Journal of the Social Sciences, 23 (1):120-127. Punthasaen, A. (2007). Institute of Management for rural and Society. Project of Synthesis of Research Work, Writing and Article about
Self-S Article about Self-Sufficiency Economy. Bangkok: Rural Reconstruction Movement under Royal Patronage and Office of Prime Minister, Budget of National Research Council of Thailand of the year 2007.

ISSN 2039-9340 Mediterranean Journal of Social Sciences Vol. 3 (11) November 2012
540
Schmieder & Allen. (1977). “The Nature and Philosophy Environmental Education: Goal and Objective”. Trends in Environmental Education. Paris: UNESCO
Stapp, W. et al. (1969). The concern of environmental education. The Journal of Environmental Education; 1 (1). Stapp, W.B. and Dorothy, A. (1981). Environmental education activities manual. Michigan: Thomas Shore Inc. Sukwat, S., Thiengkamol, N., Navanugraha, C. and Thiengkamol, C. (2012). Development of Prototype of Young Buddhist
Environmental Education. Journal of the Social Sciences, 7 (1):56-60. Thathong, K. (2009). Growing golden teak at home, a do-good for our father project: Save in the soil. Khon Kaen: Faculty of Education,
Khon Kaen University. Thathong, K. & Sukriyapong, W. (1988). Awareness towards environmental problems in Thailand of Khon Kaen University students.
Khon Kaen: Faculty of Education, Khon Kaen University. Thiengkamol, N., (2005a). Strengthening Community Capability through the Learning Network Model for Energy Conservation. Journal
of Population and Social Studies, 14 (1): July 2005. Thiengkamol, N., (2005b). “Development of Health Cities Network for Mekong Region” at the International Conference “Transborder
Issues in the Grate Mekong Sub-Region” at Ubol Ratchathani, Thailand. Thiengkamol, N., (2011b). Development of Energy Security Management Model for Rural Community through Environmental Education
Process. The 1st EnvironmentAsia International Conference on “Environmental Supporting in Food and Energy Security: Crisis and Opportunity” 22-25 March, 2011Rama Garden Hotel, Bangkok, Thailand.
Thiengkamol, N., (2011c). Development of Food Security Management Model for Undergraduate Student Mahasarakham University through Environmental Education Process. The 1st Environment Asia International Conference on “Environmental Supporting in Food and Energy Security: Crisis and Opportunity” 22-25 March, 2011Rama Garden Hotel, Bangkok, Thailand.
Thiengkamol, N., (2011e). Environment and Development Book 1. Published 4th Edition. Bangkok: Chulalongkorn University Press. Thiengkamol, N. (2011g). Development of Energy Security Management for Rural Community. Canadian Social Sciences; 7 (5), October
31 2011. Thiengkamol, N. (2011h). Development of a Food Security Management Model for Agricultural Community. Canadian Social Sciences, 7
(5), October 31 2011. Thiengkamol, N. (2012a). Development of a Prototype of Environmental Education Volunteer. Journal of the Social Sciences, 7 (1):77-
81. Thiengkamol, N. (2012b). Development of Food Security Management for Undergraduate Student Mahasarakham University. European
Journal of Social Sciences, 27 (2):246-252. Thiengkamol, N. (2012c). Model of Psychological Trait Affecting to Global Warming Alleviation. European Journal of Social Sciences, 30
(3):484-492. UNESCO. (1978). Intergovernmental Conference on Environmental Education, Organized by UNESCO in Cooperation with UNEP Tbilisi
(USSR), 14-16 October 1977. Final Reports. Paris: UNESCO.

ISSN 2039-9340 Mediterranean Journal of Social Sciences Vol. 3 (11) November 2012
541
The Fight for Balkan Latinity (II). The Aromanians after World War
Giuseppe Motta (Ph.D)
Sapienza University of Rome
Doi:10.5901/mjss.2012.v3n11p541
Abstract The article focuses on the Vlach question after the first World War, when the Balkan region was finally divided among the different national States and the Ottoman Empire collapsed. In this period the Aromanian communities had to find a new policy inside a new scenario and addressed towards different options represented by Albania, Italy and Romania. In a first time Vlachs also tried to create an autonomous principality of Pindus but this experience was short-lived and did not produce tangible results. On the contrary, during the interwar period the Vlachs consolidated their privileged relationship with Romania and established an influent group at Bucharest, where they partecipated to the internal political life even supporting the most radical movements such as Corneliu's Codreanu Iron Guard. Keywords: Aromanian, Vlach, Balkan, Albania, Romania. 1. Introduction. The Vlachs and the First World War. The history of the Vlachs in the Balkan regions was undoubtedly conditioned by the unstable and chaotic situation of the region, which during the troublesome period of the “Eastern Question” became a central area for the system of international relationships. The problems were particularly acute in the regions of Pindus, Epirus and Macedonia, and were naturally exacerbated by the constant atmosphere of war that the people of this area breathed for many years, at the end of XIX century and during the first decades of the XX.
The dispute between Romania and Greece, which led to a real break in their diplomatic relations in 1905, was soon aggravated by the outbreak of the Balkan wars, in which the Vlachs tried to secure their position approaching the newborn Albanian state. But the end of the Balkan wars, in 1913, was soon followed by the start of a new period of conflict and by the continuation of the struggle which in the past had directed the Vlachs against the assimilation policies of Greece.
If in the past, the intervention of Romania has been useful to strengthen the cultural rights of the Aromanian people, in this phase of war the need of a foreign help further increased and became an essential condition in order to safeguard the political interests of a scattered minority, who had no kin States to rely on in the proximity. The war meant for these regions a continous turmoil with the arrival of several armies and the birth of many short-lived and semi-autonomous States. In 1914, in the aftermath of Balkan wars, an Autonomous Republic of Epirus was formed around Gjirokastër.1
Even if the two provinces of Korytsa and Argyrokastro were inhabitated by a melting pot of creeds and populations, during the Epirus autonomy, the Greek administration viewed all Albanian Aromanians as part of the Greek minority without taking into account their different nationality. The region later fell under the control of the Bulgarians, who tried to join Austrian allies, before being stopped by French intervention. When the city of Koritza came under French control, an Autonomous Albanian Republic of Korçë was established with a council made up of seven Christians and seven Muslims
1 From the Albanian perspective, adopted also by Italian and Austrian sources of that time, the Northern Epirote movement was directly supported by the Greek state with the help of a minority of inhabitants in the region, resulting in chaos and political instability in all Albania. In Albanian historiography, the Protocol of Corfu was either scarcely mentioned, or its interpretation grounded on different positions: it is seen as an attempt to divide the Albanian state and as a proof of the Great Powers' disregard for Albania's national integrity. With the ratification of the Protocol of Corfu the term "Northern Epirus", which was the common name acquired official status. However, after 1921, when the region was finally ceded to Albania, these terms were considered to be associated with Greek irredentism action and did not acquire any legal status by the Albanian authorities On the other hand, anyone that made use of them was persecuted. The autonomy question remained on the diplomatic agenda in Albanian-Greek relationships as part of the Northern Epirote issue. In the 1960s, the Soviet General Secretary Nikita Khrushchev asked his Albanian counterpart about giving autonomy to the Greek minority, but this initiative was without any results. In 1991, after the collapse of the communist regime in Albania, the chairman of the Greek minority's organization Omonoia called for autonomy for Northern Epirus on the basis that the rights provided for under the Albanian constitution were highly precarious.

ISSN 2039-9340 Mediterranean Journal of Social Sciences Vol. 3 (11) November 2012
542
and with Themistokli Gërmenji as prefect of police. Italy reacted against this French policy aimed at influencing Albanian affairs and, counting on the presence of
Italian armies were also present in many parts of Albania, proclaimed Albanian indipendence and tried to counter-balance French dominion.
In 1917, when Italian troops advanced into Albania they were welcomed in all Aromenian villages, for example in Ciamuria and Samarina. A National council for Pindus was created and a "Principate of Pindos" in the area of Aromanian settlement was created with the help of some local representative as Alkiviadis Diamantis.
In this particular context, Italian military forces felt the need to improve the ethnic and political conditions of the Aromanians, and sketched some documents on their history and traditions.
Their villages could be distinguished for the solidity and a certain elegance and were often placed in positions of military interest, next to the mountains and road junctions.2 The Aromanians were described as calm, wealthy, occupied in trade or sheep-breeding, resistant to any persecution or massacre, even though the denaturalization policies pursued by the Greeks “con ogni arte e con ogni mezzo”.3
On the 25th of July 1917 a first phonogram was addressed to colonel Delli Ponti, who was called brave Duce (Duce valoroso), and his new legions, while on the 27th of July 1917 the Italian commander in Valona, General Giacinto Ferrero, received a telegram coming from the mayors (sindaci) of many Aromenian villages who met in Metzovo, representing the Pindus-Zagori people.
The Aromenian presence was particularly evident in two districts, Grammos – expecially in the city and around Koritza - and Pindus, where 36 villages clearly had a Vlach character. Even if they were not as populous as the old Moscopole, these settlements mantained their ethnic identity. The language, instead, was in some case abandoned, also as a consequence of the Greek propaganda, pressures and abuses. Aromanians even arrived at creating national armed bands against those sent by Greeks to terrorize the region and this resistance was considered almost incredible by Italians, due to the peaceful and calm traditions of the Vlachs. It was also noted that many Vlachs enlisted in the Romanian army staying in Moldova asked to be sent back to the Balkans to fight for the security of their lands.
Italians were sure that all Aromanians believed their origin was different from the one of the surrounding populations. Moreover, a particular feature to take into consideration was the particular economic situation of those shepards who periodically migrate and had thus become matter of study because they kept high the economy of sheep-grazing, dairy, weaving and tanning - “la principale industria valacca della pastorizia e quelle altre che ne derivano (caseificio, tessitura, conciatura etc.)” -. Trying to conquer the sympathies of those communities, the Italians thought that the strategy to follow was that of sponsoring the birth and increase of local authorities in order to prepare for the peace negotiations a fertile ground for the establishments of cantons or political and administrative autonomy. These hopes were alimentated also by the demands of Aromenian communities, who after the years of the Greek-Romanian dispute and the troubles of war searched in Italy a stronger protector.
4
Besides the enthusiastic recalling of ancient Roman roots, in this appeal the Aromanians underlined the security given to them by the Italian troops; their leaving would mean falling easily prey of the enemies who looked forward to the extermination of Aromanians. The latter invoked Italy and her powerful and careful protection, the only means of defence against the superiority of the enemis, “il numero soverchiante di avversari”. Finally, the signataries self-appointed
2 After remembering some of the denominations under which they are known, the documents describe the Aromanians in this way: “Colonie di questi aromani se ne trovano un poco dappertutto nei territori già ottomani ed i loro villaggi, che si distinguono per la solidità ed una certa eleganza delle costruzioni, per la cortesia degli abitanti quieti, benestanti, occupati nei traffici o nella pastorizia, e per le istituzioni civili...”. Colonel Fortunato Castoldi, 29th May 1917. The number of Aromanians in 1916 was indicated by an Italian Atlas was more or less 600.000 divided among Bulgaria, Serbia, Albania and Greece. L'Europa etno-linguistica. Atlante descrittivo in tre carte speciali colorite con testo dimostrativo, Novara, Istituto Geografico De Agostini, 1916. For a comprehensive study of Vlach history, see I. Nicolau, Les caméléons des Balkans. Civilisations En Quete d'identité XLII/2 (Université Libre de Bruxelles), 1993; G.Zbuchea, Românii de la sud de dunăre.documente, Editura Arhivele Naţional ale României Bucureşti 1997 (up to 1810); Tom Winnifrith, The Vlachs of the Balkans: A Rural Minority Which Never Achieved Ethnic Identity. In D. Howell (ed.) Roots of Rural Ethnic Mobilisation: Comparative Studies on Governments and Non-Dominant Ethnic Groups in Europe 1850-1940. Vol. 7, New York, Dartmouth 1992; T. Kahl, The Ethnicity of Aromanians after 1990: the Identity of a Minority that Behaves like a Majority, in “Ethnologia Balkanica”, 6 (2002), 145-169; The most important bibliographical source, anyway, remains Payfuss'work. M.Payfuss, Chestiunea Aroânească, Ed Enciclopedică, Bucureşti 1994. 3 Note circa la questione valacca, report issued by colonel Castoldi ( May 29, 1917). Aussme, E8, 74, 6. 4 “Figli non degeneri di Roma sempre memori della madre nostra antica e tenaci custodi della lingua e delle tradizioni dei nostri padri dopo lunghi secoli di lotta sanguinosa contro la straniero che tentava tutti i modi di cancellare nostro carattere nazionale latino respiriamo finalmente le pure aure della libertà che le nuove legioni di roma vittoriose agli ordini vostri hanno apportato ai loro fratelli di sangue dispersi lontani sul Pindo e Zagori”. These documents are kept in the Historical Archive of the Italian Army,s General Staff (Aussme, Archivio Storico dello Stato Maggiore dell'Esercito, Roma), Catalogue E8, box 74, dossier 10.

ISSN 2039-9340 Mediterranean Journal of Social Sciences Vol. 3 (11) November 2012
543
themselves the sons of Rome, who throughout millenary events had kept intact and preserved the remembrance of the Roman civilization in the valleys and the mountains of Pindus.5
“Saeculis compluribus non mutata Romana gens Pindi et Zagoriae catsra patribus custodienda per Traianum tradita distintus libertati et cultui defendes hostibus immitibus strenue adversata demum votis expletis alma amplexatur matrem urbem divinam Romam invictam aeternam...”.
The same declarations were included in the comunication sent the same day to the president of the United states, to the -president of the Provisory Russian Government, to the Belgian Foreign Affairs minister, to the French, English and Russian consuls in Yanina, to General Ricciotti Garibaldi in Rome and to the mayor of Rome, who was informed in Latin:
6
The restoration of order and peace under Italian military rule, anyway, was soon followed by the arrival of Greek troops at the beginning of September, and meant for the “revolutionary” Aromanians a whole of arrests and repression.
7
When the war ended and the peace conference started its works at Versailles, the Vlahs tried to present their pleas in order to improve their situation and finally obtained the formal engagement of the Greek government. The latter accepted the provision regarding Vlah autonomy inside the minority treat signed at Sévres in 1920, only after the pressures of Romanian and international diplomacy. As a matter of fact, during the peace talks, the Vlahs pressured Rome and Bucharest in order to make them represent their interests at the conference of Versailles. In 1918 a memorandum of the Vlach people was addressed to the Foreign affairs minister Sydney Sonnino by the Comité de l'action nationale du people valaque together with a Codicille confidentiel.
8 Another one was sent to the conference in Paris through the volume Les Macedo-Roumains (Koutzo-Valaques) devant le Congrè de la Paix redacted by the National Council of the Pindus Roumanians and signed by G.Munru, Nicolae Tacit, Arghir Culina, T. Papahagi. This document asked for a full scholastic and ecclesial autonomy and a for a political reform in order to develop Vlach ethnic identity.9
Besides the historical connection, the Aromanians recalled their will of joining Roman Catholic Siege repairing “le plus grave erreur historique” and restablishing the relationships that Kalojan Asan had with the Pope, which proved the never-ending Latin character of the Vlach people, “son orientation spirituelle découlant naturellement et logiquement de sa latinité”.
10
5 “Siamo figli di Roma sotto le ali dell'alma madre affronteremo fiduciosi l'avvenire pieno per noi di speranza, di prosperità e di progresso fra le genti latine”. Telegram n.118 sent from Samarina on 27th July 1917 to general Ferrero, Commander of the XVI Corpo Armata. It was signed by the mayors of Samarina, Abela, Perivoli, Amingui, Palioseli, Papes, Turia, Bicaso, Laca, Dobrinovo, Armata Vraca (J.Dabura, Arociani, Teguaiani, Nolla, Mike, Zissachi, Paponi, Scufi, Pispa, Safarico, Caragiorgio) and the respective delegates. Aussme, E8, 74, 10. 6 According to the Datas comunicated by the Vlachs, they were 70.108 in the Vilayet of Janina, 161.699 in Salonique, 29.506 in Skutari, 25.109 in Cossova (Kosovo), 148.699 in Monastir, and 81.620 in Thesalia. 7 FILE PINDU 1917 as stated by the documents sent ot the Romanian consulat in Ianina (September 9 and 12) 8 A copy of this document is kept in the Archive of the Italian Army in Rome. It is dated 13 September 1918, Aussme E8, 74, 11. the signature on it, at least that of the president is not readable. The secretary a certain Zega while the cashier was George Celea. 9 “La pleine autonomie scolaire et ecclesiastique, et un regime politique compatible avec un libre developpement de leur individualitè ethnique, sous la surveillance de la Société des Nations, la Roumanie étant autorisée à subventionner leur institutions culturelles et à intervenir au cas où les droits concédés ne seraient pas respectés. Ces revendications modestes et légitimes, tendent a obtenir: 1. Le libre développement ethnique de l`élément latin que repésentent les Macédo-roumains dans la péninsule balkanique. 2. La disparition de tous foyers de discorde politique ou de guerre de nationalités dans la péninsule. 3. La création et le développement d`une oeuvre de civilisation en Orient. La région du Pinde présente, sous les rapports: historiques, ethnographique, économiques, stratégiques et politiques, toutes les conditions nécessaires à une existence indépendante durable. Les Macédo-roumains ont la ferme conviction que le Congrés de la Paix, réuni pour réparer toutes les injustices et assurer l`existence libre la solidarité et la fraternité des nations leur rendra la justice qui leur est due, car: “La chose juste est la seule chose permanents dans le monde, et une solution vicicuse n`est qu`une solution temporaire” (Wilson). 10 Memorandum of the Vlach people was addressed to the Foreign affairs minister Sydney Sonnino by the Comité de l'action nationale du people valaque, p. 5. Aussme, E8, 74, 11.
The memorandum also asked the Pope for the envoy of a Bishop in Macedonia in order to finad a compromise and to combine the adhesion to the Roman Church with the respect of the Eastern religious rites exercised by the Vlachs used to exercise - “l'exercise de leur culte conformément aux régles prescriptes par l'Eglise Orientale” -.
Italy was the natural benchmark of the Vlahs and her prestige deriving from the victory of the war increased her power and attraction towards the Vlahs, who kept on invking Italian protection for the safeguard of their Latin culture.
At Delvino, on the 28th of December 1918 and on the 10th of January 1919, a special Assembly was convoked. The meeting defined a precise political project: the autonomy of Pindus and Zagori united with Albania and under the protection of Italy and pointed out a strategy to avoid any other undesired solution.

ISSN 2039-9340 Mediterranean Journal of Social Sciences Vol. 3 (11) November 2012
544
“Ad evitare che i nemici, approfittando della nostra assenza e disorganizzazione all'estero, riescano, con intrighi e menzogne, ad indurre in errore gli uomini di Stato delle Grandi Potenze che, tra breve, alla Conferenza della Pace decideranno delle sorti di ogni popolo; sia eletta una delegazione, di compatrioti la quale venga inviata in Europa per esprimere, a chi di ragione, l'incrollabile volontà e la ferma decisione delle popolazioni romene del Pindo di non indietreggiare dinanzi ad alcun sacrificio per realizzare il loro sacro ideale nazionale; cioè: L'autonomia della regione del Pindo e Zagori unita politicamente all'Albania e sotto la protezione dell'Italia, sola via di salvezza...” Another memorandum was sent to the Peace conference by the Macedo-Roumanian Cultural Society of Bucharest which asked the incorporation in the State of Albania, the only one where the Romanism could freely develop as the others, Serbia (with six Aromenian groups), Greece, (with Meglene, Veria, Pindus and Thesalia) and Bulgaria (with smaller communities) were all considered enemies of the Romanian national identity.
During the peace talks, Romania pressed Italy to assume the role of defending the interests of Balkan Vlahs because, as stated by Alexandru Vaida-Voevod, Romanian priorities were to be put in the question of the borders. The target was the establishment of a Balkan policy which could represent a “trait d'union” between Italy and Romania, who had to sustain and turn into their favour the presence of a million of Vlahs.11
The strong solidarity existing between the Vlach and Albanian populations of Pindus and Macedonia were noticed also by the American commission who visited those zones in spring 1919.
These political requests, anyway, were part of a precise strategy Bucharest pursued to obtain the great territorial
extension necessary to create a Great Romania. Aromenians continued to feel Romania as their mother-country and during the interwar period benefited from special policies that let them settle in Romania, especially in Dobruja, where they finally became integral part of the Romanian nation. 2. The New Sons of the Romanian Nation The Vlach communities of the Balkans sent to the peace conference their documents and their requests but, as a little minority who was living far from their mother-country, they did not have great chances of success. The above mentioned acts were to be put into a more complex context, which opposed Albania and Greece for the possession of Epirus and Pindus regions. As a consequence of it, the presence of the Italian army was seen as an obstacle by the Greeks, who wished to occupy the region and demanded it at the negotiations in Versailles. As a consequence, Albanians and Aromenians, who were generally pro-Albania, considered the Italians as protectors against Greece, in a particular moment when Albania needed a defense to establish and consolidate the indipendence of the State.
12
On the contrary, Greek authorities forced the people under their occupation to attend Greek schools and immediately started an active propaganda against Albania and Italy.
13 the attacks against Italy were common in Greek newspapers, which denounced the “Bulgarism” of the Italian Command also because of the contrasting interests of Athens and Rome in Asia minor.14
The Greek occupation led to the return of various leaders of different bands (Bolas, Endoas, Karajorghi, Muzervas, Kiriaco) who started a new season of brigantage and persecutions against the Muslims and the Aromanians of Pindus, whose attitude with the Italian troops considered too friendly. Many requests of help were issued to the Italians, informing them about the plans of the Greeks, who put into practice the most discriminatory measures to cut off all the resistance
11 Report of the Expert Castoldi, Paris, May 24 1919; Report of the Colonel Vicenzi to the Foreign Affairs ministry, Rome, June 18 1919. An introductive travel to start this policy was planned by general Iliescu, who had as fist aid, the Aromenian officer tennant Papahagi from Avdela. I Documenti Diplomatici Italiani. Sesta Serie, Vol. III, Doc. 599, p. 615; doc. 838, p. 842. 12 “Comisiunea americana a parasit acele localitati declarand ca convingerea lor este ca sa se intemeeze un stat etnic albano-roman, de oare ce intreaga populatiune a acelor tinuturi nu are nicipicior de grec sau de sarb”. Document 36/1. Directiunea Politiei şi Sigurantei Generale. Brigada Informatiuni. Note of May 17, 1919. 13 American Albanians complained that they knew that under French occupation Albanian flags were downed while Greek propaganda started and Greek schools were opened. Note sent from the sub-secretary for the Foreign Affairs Borsarelli to London ambassador Imperiali, Rome, November 18, 1918. I documenti diplomatici italiani, sesta serie 1918-1922, vol. I, Roma 1955 p.108 doc.211. 14 The attacks against Italy were due to the facts in Epirus, where Italians would have blocked and isolated the region acting in a “Bulgarian way”. Denouncing The effect of these denounces was to excite public opinion excite public against against Italy. Note from the minister in Athens Avezzana to Foreign minister Sonnino, Athens November 15, 1918.I Documenti diplomatici italiani, sesta serie 1918-1922, vol. I, Roma 1955, p.89, doc. 173.

ISSN 2039-9340 Mediterranean Journal of Social Sciences Vol. 3 (11) November 2012
545
for the control of the regions.15
The National Committee of Pindus, for instance, in April 1919 sent a petition to Paris and asked for a “solution équitable de la question”, denouncing the continuation of “persecutions by the Greek authorities. The delegate Aulimă critically reported the example of the arrests in Hrupista, where the priest, the director of the school and the president of the Vlach community were beaten and imprisoned, “mailtrités et jetés en prison par les gendarmes grecs”.
16
The situation was very troublesome, as the complaints of Vlachs and Albanians were accompanied by analogous acts of the Greeks, who claimed the autonomy of Norther Epirus under Albanian sovereignty. A memorandum issued by the Pan-Epirotic union in America, (August 1, 1921), denounced the regulations of the minister of interior to punish Greek propaganda and the discriminations commited by Albanians “to force the Greeks to partecipate in the Albanian elections, the expulsion of the Greek clergy, the confiscation of Greek schools and churches, and the introduction in Albania of laws which were in operation only under Abdul-Hamid in Turkey”. Local inter-ethinc conflicts, moreover, were accompanied by an instable international situation, in which the interests of Italy, Greece, Albania and, indirectly, also Romania, converged and clashed.
17
A different question was that of Vlachs living under the rule of Karadjeordjevic, which costed Romania many diplomatic efforts. The presence of Romanians in many regions of the South Slav Kingdom gave Bucharest the opportunity to use it as a means of pressure over Belgrade, in order to obtain a generous draft of the frontiers. After the signature of the treaties, anyway, the question remained open and the Romanians of Banat and Timok valley remained hidden by the political alliance of the two countries. Bucharest could only made some little moves and did not use the minority card as a means of pressure against a member of the Little Entente. The interest for the conditions of the Latins-speaking population of the Balkans were left unvaried and was still discussed by the nationalist and cultural circles: according to the works and datas published in 1918 and 1919 which numbered about 300.000 Romanians in the country of Serbs, Croats and Slovenes
At the end of the war Italy tried to turn her occupation into a sort of protectorate over Albania, but the events led
the Italian armies outside the country, isolating the only troops left in the port of Valona. The Italian adventure in Albania soon finished as a widespread rebellion made Italians reconsider their aspirations over the Reign of Albania. After the Venizelos-Tittoni agreement and the start of Greek-Turkish war, in 1921 Epirus was ceded to Albania, which issued her declaration for the protection of minority rights, without referring to any group in particular but adopting the general stipulations alreday contained in the previous minority treaties
Also Greece had to accept some provisions regerding her minorities and a special article regarding Vlach autonomy was inserted into the special minority treaty signed at Sevres in 1920 : this provision was targeted at solving a controversy that opposed Romania and Greece since the previous century.
18
The Romanians of Northern Yugoslavia and those of Macedonia joined their efforts and in 1921 issued a common memorandum to manifest the desperate conditions in which they lived under the torture of the Serb dominion. This document accused the Serbs to throw the priests out of the churches, to close their schools, to subject them to the violence of the bands who sacked, burnt and killed. Whole villages were destroyed with fire while the prominent figures of the communities were imprisoned or massacred, as happened with the lawyer Garbovean at Versez (Banat) and with the old Nikola Ibronka, impaled and burnt.
.
19
The situation of the Aromenians was very complicated: many of themcontinued their existence in the Balkans, melted with the other people and then dispersed through the States of the region. Some others were assimilated and, for
Vlach cultural and political life was jeopardized by the nationalist policies of the different states, and it seemed that
it could be safeguarded only by the Albanian government. The only option left for the Vlachs of Greece and Yugoslavia, on the contrary, was the migration to Romania, which in the past had consolidated her role of cultural benchmark for the Aromenian students and her economic connections with the Vlach communities of the Balkans.
15 I documenti diplomatici italiani, sesta serie 1918-1922, vol. I, Roma 1955, p.246, doc.456; p.331 doc. 605; p.336 doc.614. These documents, as the note sent from the general consul in Janina, Nuvolari, to foreign minister Sonnino (Janina, December 5, 1918), described the situation of Pndus and Epirus at the end of 1918 and reported the tranquillity of Muslims and Pindus Romanians; the decision to intensify brigantage of the meeting of Koritza’s metropolit, colonel Dudi and others such the tenent Papageorgio, who was notorious or the massacres of Premeti; the wishes of the population for an union with Albania, the fear for the retirement of the Italians, which it would imply the arrival of Greeks and their bands. 16 The note sent to colonel Castoldi, Paris, April 8, 1919, talked about a “vittoria piena e grande della latinità fra noi”. Aussme, E8,74, 2 17 Letter presented by Rev. Theophanis Nolis, memorandum of the Pan-Epirotic union in America. Historical archive of the League of Nations, section 11, box 585 dossier 9506. 18 About the conditions of Vlachs in Banat and in Yugoslavia, see Bocu, Le question du Banat – roumains et serbes, Paris 1919; Valsan, Les Roumains de Bulgarie et Serbie, Paris 1918. Draghicescu, Les Roumains de Serbie, Paris 1919. 19 A.Tamaro, La lotta delle razze nell'Europa danubiana, Roma 1923, p. 224.

ISSN 2039-9340 Mediterranean Journal of Social Sciences Vol. 3 (11) November 2012
546
example, some remained loyal to the national Greek community (Ethniki 'elliniki koinonia), others who had converted to Islam were even wrongly inserted in Lausanne exchange of population and went to Turkey, while the majority maintained their coexistence with the other cultures and in some cases adopted them.20
The attention for the Romanians in the Balkans was kept alive by some activists and some reviews, which reminded the short indipendence reached in 1917, during the period of Italian occupation and supported the development of the Vlach national identity and the relationships with Bucharest. In 1924, at Bucharest, the society of Macedo-Romanian culture celebrated the seventh anniversary from the independance of 1917, with a solemn reception and a holy funciton at the church of Antim. During the same years, many journals like “Graiul românesc”, “Peninsula Balcanică”, “Revista aromânească” and “Macedonia” dedicated many articles to the Vlach question, appealing to Romanian brotherhood, reporting the impressions of a Czech supporter and of one of the funders of the autonomous Pindus in 1917, Guli Papageorge Samarineanu.
On her side, Roumania continued her traditional policy in favour of her Balkan compatriots recalling from those
regions many Aromenians and retaking the colonization projects of 1914. After that in 1919 the government acted in favour of the Aromenians even commissioning to the historian Nicolae Iorga the publication of a little book - Historie des Roumains de la Péninsule des Balcans (Albanie, Macédonie, épire, Thessalie etc.) - in the Twenties Bucharest developed a precise policy of solidarity towards the Balkan Vlachs.
21 The latter described the days of 1917 and the brutal change of the situation after the retreat of Italian troops: then Greek bands soon came and the Romanian patriot was obliged to flee to Argicastro and continue there his struggle against the Greeks, searching the support of Italian authorities. The same pattern was followed by many other activists who fled Pindus and through Albania and Italy continued their journey to Romania.22
This flow contributed to press the Romanian autorities towards the definition of an active policy in the Vlach question. The parliament discussed the issue several times between 1921 and 1923, realizing that the conditions of the Aromenians were getting worse as the traditional hostility of Greek authorities continued to constitute an obstacle for the development of their normal cultural life. Aromenians protested against the Greek policies that prevented from them from attending to attend their own schools and against the strict measures adopted against their transfer to Romania.
23
Romanian governement kept on managing carefully the Romanian schools of the Balkans, attracting to Romania many scholars and activists. But together with the sponsorization of the schools, Bucharest also started a special policy of colonization, which was aimed at settling Romanian-speaking colonists in Dobrudja, expecially in Tulcea and
After 1923, another question was raised as the Greeks expelled from Asia minor were placed in the same regions where Aromenian communities were settled, with the clear intention of altering the ethnic balance of those zones. As a consequence, the expropriation was added to the traditional list of discriminations and persecutions enacted by the Greek authorities and Vlachs found another reason to leave the Balkans and settle in Romania. These troubles contributed to renew the policy of colonization in Dobruja, which had already started with the law of the 1st of April 1914. The colonization of Dobruja was aimed at killing two birds with one stone as it strengthened the Romanian solidarity and the protective role of Romania for the Vlachs and, at the same time, it was useful to enhance the Romanian character of a Bulgarian region as Dobruja. With the law ofthe 22nd of April 1924, Romania decided to give State lands for colonization and created a special office encharged with the implementation of this policy - Onac, Oficiul Naƫional al colonizării - and a Central Bank for Colonization (Casa Centrala de Colonizare).
20 V.A. Friedman, The Vlah Minority in Macedonia: Language, Identity, Dialectology, and Standardization, in “Slavic, Balkan, and Balkan Studies”, ed. by Juhani Nuoluoto, Martii Leiwo, Jussi Halla-aho, (Slavica Helsingiensa 21). Helsinki: University of Helsinki. 2001. 26-50. 21 I. Ursu, Fraţii din Balcani, în „Peninsula Balcanică”, I, nr. 2, 6 iunie 1923, pp. 3-4. St. Brezeanu, Gh. Zbuchea (coord.), J. Mu ̈ller, România mică aromânească. Un ceh către aromâni cu prilejul unei aniversări, în „Graiul românesc”, I, nr. 8, august 1927; Românii de la sud de Dunăre. Documente (Arhivele Naţionale ale României), f.e., Bucureşti, 1997, 22 Convorbire cu d. Guli Papageorge Samarineanu, unul din promotorii proclamării independenţei Pindului, în „Peninsula Balcanică”, V, nr. 7-8, noiembrie-decembrie 1927, pp. 115-117. The same days were reminded also in another articles, where Italian occupation was regarded with joy and N.Z.Drulla, Italia şi macedo-românii, în „Peninsula Balcanică”, VI, nr. 2-4, februarie-aprilie 1928, pp. 53-54. 23 Presedintia Adunarii Deputatilor. No. 4326 din 14 lulie 1921. 1) Deputat I. Buzdugan in sedinta din 11 lulie 1921: “cred ca ma fac ecoul tuturor romanilor cind interpelez pe Domnul Ministru de Externe, care e situatia romanilor macedoneni, aceasta ramura oropsita a neamului nostru, rugindu-I sa intervina totodata pe linga guvernul grec ca sa respecte pe supu~ii romani, caci acolo unde se afla un supus al Romaniei. este un colti~or din Romania”. Presedintia Adunarii Deputatilor No. 2642 din 24 Mai 1923. 1) Deputat Gh. Popp: "De un an de zile, fratii no~tri din Macedonia greceasca, aromanii Pindului ~i ai altor regiuni din regatul Elen, traiesc zile tot mai grele. Din ziua dezastrului din Asia Mica, sute de mii de refugiati din tinutul Smirnei au invadat regiunile aromane din Epir ~i Macedonia, ingustand baza de existenta, pamantul ~i pa~unile fratilor no~tri din Grecia. Guvernul grec a hotarit, ca cu ocazia improprietaririlor ce se fac in aceste regiuni, vechii locuitori aromani, cetateni stravechi”; Dosar 20/1923; Directiunea Politiei §i Sigurantei Generale. Brigada IV. Nota din 9 Octombrie 1923. 1) Indignarea §i ura Macedo-Romanilor contra Grecilor ia proportii din zi in zi (si aceasta in urma unor stiri pe care Ie-au primit din Macedonia-Greaca).

ISSN 2039-9340 Mediterranean Journal of Social Sciences Vol. 3 (11) November 2012
547
Constanţa, where they were called to increase the Romanian element against the Bulgarian minorities. The effects of this policy were immediate. In January 1925 a delegation of 4 Vlachs from Greek Macedonia was
introduced to the Foreign Affair minister who was asked for an intervention in the question, which was very urgent, due to the expropriation of the lands in favour of the Greek refugees coming from Asia.24
Between October 1925 and April 1926 3 ships took almost 1500 families to Romania while, after 1927, the arrivals continued but the involvement of the authorities decreased: as a matter of fact, the signature of a declaration was asked to migrants who accepted to be treated not as State colonists.
25
Also in the following years, many other episodes contributed to inflame the situation and destabilize the life of the region, where Aromenians were targeted by the activities of the Bulgarian revolutionaries, while Bulgarian families were maltreated by Romanian authorities. This conflict was well-known aslo abroad, as documented by the visit of the League's official Pablo De Azcarate, who underlined that Romanian laws required the verification of the property titles of the Bulgarian owners and legimited the government to confiscate lands in order to give them to the Cutzovalaques. This policy caused a certain lack of security, which was due not only to the activity of Bulgarian komitadji, but also to the revengeful attacks of the Vlachs.
Between 1930 and 1933 the flows continued but they were stopped with the last 450 families arrived in Constanţa in 1933. The policy of colonization was affected by different administrative problems, for example those connected with the status and citizenship of the colonists. But the main obstacle to the prosecution of those measures was represented by the lack of the necessary funds, which constituted a great problem for the interwar governments of Romania, especially after the crisis of 1929.
Moreover, the settlement of Aromenian families in Dobruja gave birth to violent conflicts with the Bulgarians. The Bulgarian revolutionary movement created in Sofia established some branches in Rusciuk, Varna and Durostor, where terrorist actions were organized against Romanian authorities and civilians. Many victims were assaulted near the woods by the “comitagi”, also 12-13 years old children, as in the case of the cousins Gheorghe and Tănase Dardac, killed on the 5th of September 1930 at Arabagi. This assassination caused the revenge and the murder of a Bulgarian on the road Silistra-Bazargic.
26
Some of them distinguished for their skill in the cultural field. Among them: Teodor Capidan, born and educated in Perlepe. He studied in Bucharest and Leipzig and worked in the universities of Cluj and Bucharest becoming a member of the Romanian academy also thanks to his works on Aromenian language and culture; the writer Marcu Beza, who also became a member of the Romanian Academy, and Tache Papahagi, who studied and worked at the university of Bucharest dedicating his works to Aromenian history and culture.
On the 13th of May 1934, the Mayor of Carageat Gheorghe Lepăr was quarreling with a padurar (woodman) Dimo
Jecoff while another Bulgarian appeared from the back and killed him. Aromenians searched the killer in Jecoff's house and when Jecoff responded justifying the assassination he was himself killed too.
Thanks to her colonization measures and to the consolidation of her role of Kin State for the Balkan Vlachs, interwar Romania became the homeland of many Aromenians who moved there, gaining important spaces in the cultural and political life of the country.
27Aromenians partecipated actively not only in the cultural life of the country but also in political competitions and
many of them became notorious as they proved to be fierce nationalists and adhered to rightist movements, as Codreanu's Iron Guard (Garda de fier). In his book, Pentru Legionarii, Corneliu Zelea Codreanu testified his friendship and common activity with Beza and the group of Aromenians; the latter showed to be extreme nationalists and were greatly appreciated by Capitanul Codreanu.Tthe leader of the Iron Guard met in prison many young Aromenians and
24 Directiunea Politiei si Sigurantei Generale. Nota din 31 Ianuarie 1925. 1) Pe ziua de 29 lanuarie corent a sosit In Capitala 0 delegatie de 4 romani macedoneni, din regiunea greceasca, care se va prezenta Oomnului Ministru al Afacerilor Straine cu un memoriu prin care vor cere sa Ii se dea pamant In tara spre a se stabili aici, Intrucat guvernul grec i-a deposedat de terenurile de cultura ce au avut :;;i Ie a Incredintat refugiatilorgreci din Asia Mica”. 25 N.Cuşa, Macedo-Aromanii dobrogeni. The Macedo-Aromanians in Dobrudja, Constanta 2004, p.53. 26 The latter was another well-known grievance and contributed to aggravate the troublesome situation of Bulgarians outside Bulgaria. Report of the visit of De Azcarate in Bulgaria (February 1931). HALN, section 41, box 2176, dossier 40409. The Romanian colonization, in fact, made the exercise of Romanian authority even more difficult. P.De Azcarate, League of Nations and National Minorities.An Experiment, Washington 1945,, p. 48. 27 T.Capidan wrote Meglenoromânii, București 1925-1935, vol. I: Istoria și graiul lor; vol. II: Literatura populară la meglenoromâni; vol. III: Dicționar meglenoromân. Fărșeroții: studiu lingvistic asupra românilor din Albania, Cluj 1930, ;Aromânii: dialectul aromân, studiu lingvistic, București 1932. T.Papahagi was the author of Aromânii din punct de vedere istoric, cultural și politic , (1915); La românii din Albania (1920); Antologie aromânească (1922); Din folklorul romanic și cel latin, 1923; O problemă de romanitate sud-ilirică, 1923; Biblioteca națională a aromânilor, 3 vols., (1926-1935).

ISSN 2039-9340 Mediterranean Journal of Social Sciences Vol. 3 (11) November 2012
548
described their “pure ancestry” and their moral sanity, which made them good patriots and fighters ready to sacrifice.28
Other acvitists of the Iron Guard were Sterie Ciumeti and Constantin Papanace, who was born in Greek Macedonia and studied in Bucharest. In 1930 he met Codreanu in prison and started his career among the ranks of the Iron Guard.
Some of them were among those Ni.ca.do.ri who assassinated the first minister Ion Duca in 1933. The term nicadori came from the assassins' initial letters Nicolae Constantinescu, Ion Caranica, Doru Belimace; among them Constantinescu and Belimace were Aromenians born in the Balkans and then settled in Romania. The Aromenians were really much upset with the Romanian government, which was accused of having betrayed them stopping the colonization policies. Beza, for example, attempted to the minister Anghelescu's life only wounding him, while Ion Duca paid with his life not only owing to his policy of repression against the revolutionary legionaries, but also as he was considered guilty of having stopped Aromenian immigration while increasing Jewish one.
29
After 1938, the Italians occupied Albania and prepared their further advance into Greece recruiting the Aromenians of those regions, or at least trying to,.
The involvement of the Aromenians inside the most radical factions of the Romanian nationalist movements was
justified by the bad conditions Vlach communities were keeping on experiencing all over the Balkans. As a matter of fact, the cultural life of the Vlachs was deteriorating not only in Greece or Serbia, which were traditionally adverse to their Romanian citizens, but also in Albania, where the number of Romanian churches was gradually decreasing.
The problems experienced in all the Balkan States strengthened Aromenian consciousness and also gave birth to the organization of political movements against the authorities and the local élites. One of the co-founder of the first Pindus republic, Alchiviad Diamandi of Samarina or Alkiviadis Diamandi or Alcibiade Diamandi or Diamandis, started to work for a complex and ambitious project to create a wide empire of Latin-speaking peoples around the Mediterranean. He contacted the Romanian ambassy in Rome and fascist regime and maybe was econcouraged to travel to the various Vlach-speaking villages of the Pindus mountain to raise a Romanian national consciousness. After 1927 he worked for the National Petroleum Company of Romania in Athens and made several travels to the Italian-occupied island of Rhodes attracting the interest of the Greek counter-intelligence services. As a result, Diamandis received an expulsion order which was never carried out. On the contrary, he remained in Greece until the Italian invasion, when he was appointed translator and aide of the general Alfredo Guzzoni.
30 Naturally, Greeks reacted to this treason with barbarity and violence, burning some Aromenian villages - Samarina, Perivoli, Avdela, Baisa – arresting and shooting Aromenians who were accused to revolt against the Greek State.31
On March 1, 1942, Diamandi issued a complte Manifesto which was was co-signed by leading Aromanians (Vlachs)
The failure of Italian attacks soon required the intervention of Germans, who were successfull in overthrowing the
Greek resistance and occupying the country. As a consequence, in 1941, Diamandis could finally create the "Autonomous State of Pindus," or "Principatu di la Pind" composed of Vlach speaking villages in Epirus, Macedonia and Thessaly. He founded the Roman Legion of Larissa, a paramilitary group, to assist the Italian and German occupation and even tried to summon a parliament of his principality. Even if it was a body deprived of any real power, this assembly issued a series of local regulations, making Vlach the official language of the region and proscribing the use of Greek.
28 C.Z.Codreanu, Pentru Legionari, pp. 263, 354. Codreanu described his meeting with Sterie Ciumeti, who has been chosen by god for his good and pure soul to become the greatest martyr of the legionary movement, and the solidarity expressed with all the Romanians, from the Dnestr to Pindus. 29 Papanace also published many books about Aromenians: Sur la minorité aroumaine (vlachs) dans les Pays Balkaniques, Rome, 1950; La persecution des minorités Aromounes (Valaques) dans les Pays Balcaniques. Le Problème Macédonien, Editura Armatolii (colecția "Biblioteca verde" nr.3), Roma 1950; Geneza și evoluția conștiintei naționale la macedo-români, Ed. Brumar, București, 1995; Reflecții asupra destinului istoric și politic al aromânilor, București, 1996. 30 N.Djuvara, Aromânii: istorie, limbă, destin, ed. Fundației Culturale Române, 1996; O scurtă istorie a românilor povestită celor tineri, seria Istorie, Humanitas, 1999; Cum s-a născut poporul român, seria Humanitas Junior, 2001. 31 Emitent necunoscut - n.n./. Nota Nr.30518 din 11 Octomvrie 1940: “Rezidentul nostru din Grecia comunica urmatoarele informatiuni: In Sudul Albaniei si In Epirul de Nord actiunea Italiei se intensifica. Interesul pe care Italia 11manifesta fata de populatia aromaneasca din Macedonia si In special din Pind, devine din ce In ce mai evident. In legatura cu aceasta se semnaleaza ca 01. Grazzi, Ministrulltaliei la Atena, a avut, cu un distins personagiu dintre Aromani, lungi si repetate convorbiri, cari, dupa informatiile obtinute, star fi Invartit In jurul atmosferei din Pind si a interesului pe care Italia poarta Aromanilor." Emitent necunoscut - n.n.l. Nota Nr. 3070 din 13 Decemvrie 1940; “Asuprirea elementului aromanesc. Rezidentul din Skoplje (Iugoslavia de Sud) transmite urmatoarele informatiuni cu privire la aromanii din Epir si din Macedonia Greceasca: In prima faza a operatiunilor, cand armata italiana se gasea in inaintare, Grecii au incendiat 4 localitati romane~ti: Samarina, Perivoli, Avdela, si Baisa (situate intr'o regiune la 40-50 km. Nord Est lanina). Numerosi aromani au fost arestati, internati si maltratati in mod barbar de autoritatile grecesti”.

ISSN 2039-9340 Mediterranean Journal of Social Sciences Vol. 3 (11) November 2012
549
intellectuals such as George Munru and published in the local press.32
The zenith of Diamandis' rule was reached in 1942, when a faction of the so-called Internal Macedonian Revolutionary Organisation offered him the throne of Macedonia. But in late 1942 the local Greek resistance, which was formed also by Vlach-speaking members, intensified its activities against the Italo-German occupation in the Pindus mountains. Diamandi escaped to Romania while his successor, Nicola Matushi, was soon replaced by Gyula Csezneky, a Hungarian-Croatian aristocrat in Italian service, who only nominally reigned as Voivode Julius between August-September in 1943 and was later succeded by M. Hatzi as military governor until the end of the Principality in 1944.
33Romania continued to subsidize schools until 1948, when the communist regime ended all links. George Padioti,
an Aromanian author (born and living all his life in Greece) described one of the last liturgy services in Vlach, in February 1952, when the priest Costa Bacou officiated the last allowed liturgy in Aromanian language. Afterwards, he was not permitted anymore because he refused to forcibly officiate the divine service in Greek language.
34
In spite of the loss of any help or assistance from abroad, an Aromenian identity survived all along the Cold War age and represented once again after the implosion of the communist regimes. During the Nineties and the following years, Aromenian organizations started a new campaign to be recognized as a national group by the countries where they lived, in Albania, Greece, the Republic of Macedonia, Bulgaria and Romania. They pavented the risk of their total extintion as an ethnic group, who was loosing its own traditions and values through a constant process of assimilation, which had been changing their nomadic modes and settling them in existing villages. In 1988, Vlach societies in Bitola and Skopje, as the Pitu Gula Cultural association, launched an appeal to the Foreign ministers of Yugoslavia, Albania, Bulgaria, Greece, Romania and Turkey who were meeting in Belgrade.
35
32 The maniphesto was republished in Greek by Anthemidis, Axilleas, The Vlachs of Greece. Thessaloniki: Malliaris 1998. See also, A.Munoz, Herakles and the Swastika: Greek Volunteers in the German Police, Army and SS, New York 2000. 33 For the Italian occupation during the war, see D.Rodogno, Fascism's European empire: Italian occupation during the Second World War. Cambridge University Press, 2006. 34 According to Sevold Braga in his treatise Die Aromunische Minderheit in Griechenland (Albumul Macedo-Roman II, Freiburg 1964), the Romanian help suddenly stopped with the coming of Communism. Braga's explanation was that in fact Romania had shown its true face, having used the Aromanians for its own purposes during the Ottoman rule, but afterwards throwing them away and disowning them. 35 H.Poulton, The Balkans: minorities and states in conflict, Minority Rights Publications, London, 1994, pp.95-96.
Their principal demands concerned their administrative status, schools and access to the mass media, language and cultural autonomy. These elements were necessary to fight the crisis of identity of the Aromenians, who anyway had not lost any influence in the political sphere. Although the various cultural adresses and distinct profiles, some special figures as Matilda Caragiu-Marioţeanu and some societies and organizations (Academia Română, Fara armãneascã de Roumanie, Union panhellénique des associations culturelles valaques et d’autres forums valaques, Société de culture aroumaine of Athènes, Association of the Armân Community in Romania) all started to work to defend and keep alive the Aromanian consciousness.
These efforts even attracted the attention of international institutions and so, after the report of the socialist Lluis Maria de PUIG in 1997, the Council of Europe issued a recommendation (no.1333) to encourage the Balkan States to sign, ratify and apply the European Chart of minority and regional languages and to sustain the cultural sphere of the Aromenian communities living inside their borders. The loss of all the protection from abroad made an external intervention more urgent and necessary as the disappereance of the Vlach culture would mean not only the loss of an important piece of the Balkan mosaic, but also a cultural loss for Europe as a whole.
References A.Tamaro, La lotta delle razze nell'Europa danubiana, Roma 1923, p. 224. Aussme, Archivio Storico dello Stato Maggiore dell'Esercito, Roma, Catalogue E8, box 74, dossier 10. Aussme, E8, 74, 11. Memorandum of the Vlach people was addressed to the Foreign affairs minister Sydney Sonnino by the Comité de
l'action nationale du people valaque, p. 5. Documenti Diplomatici Italiani. Sesta Serie, Vol. III, Doc. 599, p. 615; doc. 838, p. 842. H.Poulton, The Balkans: minorities and states in conflict, Minority Rights Publications, London, 1994, pp.95-96 I documenti diplomatici italiani, sesta serie 1918-1922, vol. I, Roma 1955 p.108 doc.211. I Documenti diplomatici italiani, sesta serie 1918-1922, vol. I, Roma 1955, p.89, doc. 173. I. Ursu, Fraţii din Balcani, în “Peninsula Balcanică”, I, nr. 2, 6 iunie 1923, pp. 3-4. St. Brezeanu, Gh. Zbuchea (coord.), J. Mu ̈ller,
România mică aromânească. Un ceh către aromâni cu prilejul unei aniversări, în „Graiul românesc”, I, nr. 8, august 1927; Românii de la sud de Dunăre. Documente (Arhivele Naţionale ale României), f.e., Bucureşti, 1997,

ISSN 2039-9340 Mediterranean Journal of Social Sciences Vol. 3 (11) November 2012
550
N.Cuşa, Macedo-Aromanii dobrogeni. The Macedo-Aromanians in Dobrudja, Constanta 2004, p.53. N.Djuvara, Aromânii: istorie, limbă, destin, ed. Fundației Culturale Române, 1996; O scurtă istorie a românilor povestită celor tineri, seria
Istorie, Humanitas, 1999; Cum s-a născut poporul român, seria Humanitas Junior, 2001. P.De Azcarate, League of Nations and National Minorities.An Experiment, Washington 1945,, p. 48. Report of the Colonel Vicenzi to the Foreign Affairs ministry, Rome, June 18 1919. Report of the Expert Castoldi, Paris, May 24 1919; V.A. Friedman, The Vlah Minority in Macedonia: Language, Identity, Dialectology, and Standardization, in “Slavic, Balkan, and Balkan
Studies”, ed. by Juhani Nuoluoto, Martii Leiwo, Jussi Halla-aho, (Slavica Helsingiensa 21). Helsinki: University of Helsinki. 2001. 26-50.

ISSN 2039-9340 Mediterranean Journal of Social Sciences Vol. 3 (11) November 2012
551
The Country of Origin and the Consumer Behavior
- How to Improve Chinese Products Brands?
Mohammed Kerbouche*
Lakhdar Adouka*
Abdenour Belmimoun*
Habib Guenouni*
*Professor Mascara University
Doi:10.5901/mjss.2012.v3n11p551 Abstract: There are two objectives of the project. First is to assess the overall image of China brand products in consumers’ minds. Countries of origin effect influences people’s evaluations on products and purchase decisions since people have different perceptions towards different countries and products. This is because each country has its own political, technological and economical environment. In consumers’ minds, they have negative attitudes on China brand products, such as old-fashioned, cheap, etc. So, there is negative country of origin effect on China brand products in markets. This is the first reason for doing this project. Second objective is to analyze the data for our survey and give some suggestions and recommendations. We choose a specific product electric for our Study and we made some comparison between Chinese brand Lenovo and the Japanese brand Sony, I chose this two brand as Lenovo one of the most famous brand in China, and Sony as one of the big electronic company in the world. Consumers’ attitude towards electric appliance may influence their purchase of the products, which are in China or foreign brands. Besides, consumers’ attitude towards brand image may also affect their purchase decision among different brands of products. There are some factors help constructing consumers’ attitudes towards brand image, such as advertising, quality, price, technology and package. Moreover, other variables, such as sex, age, income and educational level can also influence consumers’ purchase decisions among different brand products. On the other hand, this study mainly focuses in 19 countries. Keyword: The country of origin, Chinese brands, consumer behavior. 1. Introduction China has grown rapidly to become one of the largest manufacturing countries in the world. Products from China can be seen everywhere today and the label Made in China is more of rule than an exception. The question is how world consumers will react with the Chinese product brands? And how to improve the image of these emerging brands?
The purpose of this article was to investigate the consumer’s attitudes towards Chinese product brands taking Japanese Sony product as a print of comparison for our survey. The study also analyzed differences in sex, age, income and educational level.
To collect the necessary data a questionnaire was handed out to 19 countries from five continents. The sample consisted of 196 answers which can be assumed to represent each continent.
The literature review and survey reflect the image of Chinese products in other markets. Overall the Chinese have a negative image in those markets .The country of origin effect influences the country image so much. Consumers view Chinese products as old-fashioned, cheap and unattractive.
To alleviate that, Chinese businesses could improve their marketing strategies in all the markets that where we surveyed, especially the marketing mixes. They could change their product technology designs and packaging with good brand names, put more emphasis on promotions and advertising, and improve their advertisements to adapt to the tastes of other markets consumers. In addition, they could increase the number of retail channels that are more convenient for consumers to get information and easier to find products. The low prices of China brand products gives people cheap and low class impression. So Chinese firms should raise the quality of products in order to set a higher price in other markets.

ISSN 2039-9340 Mediterranean Journal of Social Sciences Vol. 3 (11) November 2012
552
The largest growing market of today is found in China .The country`s importance in the world economy has been increasing rapidly over the past few years, and all indications show that such trends will continue. China has a history as a planned economy and about 25 years ago it became a market economy ready to get involved in the area of international business. Due to FD investments many western companies have placed capital and production within its borders. The result is that branded products marked Made in China have shown up all over the world. But in this article we will not be speaking about the foreign products, as we will focus on Chinese brand products and consumers attitudes towards them.
It is common that products made in developing country are perceived to be of lower quality than products from an industrialized nation (Hulland, Todino & Lecraw.1996); this has been experienced by nations such as South Korea and Japan during their initial internationalization phase. Still, the country image is not static, but can change over time as consumers become more familiar with the products and the quality of them actually improves.
Country of origin (COO) is the country in which the products are made. In fact, the country of origin effect has a great impact on the products, which do not have strong brand names. In the case of China brand products in world markets, they do not have strong brand names or brand loyalty. In the other markets consumer’s minds are poor quality, low prices and old-fashioned in packaging and advertising. So many consumers do not consider buying the products from China.
Thus, the country of origin effect is essential to Mainland Chinese firms, which want to export to the world markets. As China market opens continually, Chinese firms have great opportunities to develop other countries’ markets. The first thing the firms have to do is to examine the problems that hinder their products success in other countries. Country of origin effect may be a major cause for the failure of China brand products in other markets. And to see where the problem is, we will treat two questions.
Is there really having a negative image towards China products in world markets? And how can China brand products build a positive image and strong brand? 2. Research strategy To be able to see the result of the research questions we set up six hypotheses of the 19 countries consumers. The hypotheses were tested through a survey. The survey strategy was to test the hypotheses and see if they either were accepted or rejected, also to see the consumer’s attitude and perceptions to give our recommendations and suggestions. 3. Selection method The sample size of the test was 196 persons, in 19 countries Algeria, Argentina, Australia, Canada, Colombia, Ecuador, Egypt, England, French, Germany, Japan, Jordan, Korea, Mexico, Republic Dominican, Saudi Arabia, South Africa, Switzerland, United state). The test had done randomly, by some friends who send the questionnaire to their countries and also via internet using MSN and Skype programs. And due to we won`t have direct contact with the respondents I translate the questionnaire to four language (English, French, Spanish and Arabic) to make it more clear. And I spent more than 4 months to accumulate these results. 4. Hypothesis Independent variables: H1: country of origin effects on Chinese products and foreign brand products (Japan). H2: attitude towards brand: Advertising Quality Price Technology Package Other Variables: H3: Sex H4: Age H5: Income

ISSN 2039-9340 Mediterranean Journal of Social Sciences Vol. 3 (11) November 2012
553
H6 Educational level 4.1 Country of origin effects H1: There is negative country of origin effect on Chinese products. 4.2 Attitude towards brand H2: There are less favorable brand images of Chinese products. Other variables. Sex 2-3 H3: there are difference purchasing criteria between males and female’s .Males are more emphasize the function and technology of product where women are more emphasize on the appearance and design. Age 2-4 H4: the youngsters are likely to buy foreign brand products and the older people are more willing to buy Chinese products Income 2-5 H5: low income people are more willing to buy Chinese products than high-income people. Educational level 2-6 H6: less educated people are more willing to buy Chinese products than more educated people. The questionnaire The hypotheses were tested through a questionnaire the advantage is that each respondent answers the same set of questions, which will make it more efficient to collect large amount of response. The questionnaire contained 14 questions including nationality, gender, age, educational level, occupation and income allowed us to test our hypotheses. The three first questions we made it just to confirm and justify our dissertation and make comparison between Chinese brand and Japanese, it was as experiment for our project. In the four, five and six question the respondents were asked to measure the country of origin effect on the people from the five continents. We used also question four to see the hypothesis four regarding the youngest and old people and their willing to buy Chinese products. Also we used question to measure the income and the educational level effect on buying Chinese products. The question eleven we use its to test the respondents and see the difference purchasing criteria male and female. The other questions we use it to know more the consumers attitudes and to help us making our recommendation as I don’t have direct contact with the respondents during doing this survey. Our questionnaire show us that, the ratio of males to females of the simple is almost similar. Most of them are in age [21-30]. The interviewees are from wide range of educational level which from post graduates to no educational level. For the income level, most interviewees have lower than 4000$ income because there are more interviewees from Africa Asia and South America. 5. Analysis 5.1 Country of origin effects (Hypothesis 1) H1: There is negative country of origin effect on Chinese products.

ISSN 2039-9340 Mediterranean Journal of Social Sciences Vol. 3 (11) November 2012
554
Table 1: Test results of country of origin effect
Africa Asia South America
North America Europe
Q4
yes 13% 40% 18% 6% 13%
no 47% 24% 62% 12% 47% Not much 39% 35% 18% 18% 39%
Q5 yes 2% 40% 43% 31% 2%
no 98% 60% 57% 69% 98%
Q7
cheaper 98% 81% 97% 96% 98%
Good packaging 0% 9.5% 3% 4% 0% More technology 2% 9.5% 0% 0% 2%
From table 1 we need to know if there is negative image towards Chinese products. According to results these vary from one market to another.
Except in the Asian market, where we can find some positive sentiment, where as in other market (Africa, South America. North America, Europe) there is really a negative image towards Chinese products .Many people in these markets (Africa, South America. North America, Europe) think that Chinese products are cheap, unattractive, and are not familiar with Chinese brands .In addition in our survey we chose one of the most popular and best known Chinese brands (Lenovo) ,but most people don’t recognize this brand , and that is due to the lack of promotion in these markets.
In fact, the overall image of products from China is not favorable. When people see a Chinese product, they tend to have strong perceptions that these products are not good.
Furthermore the producers in China always ignore the packaging of the products , so the appearance of the products tend to be old fashioned and unattractive and the test result in table 1 reflects this situation, for Chinese brand products in (Africa, South America. North America, Europe).
Where as the situation in the Asian market is better than the other four markets, as we can see that there are some positive results such as the Q4 where 40% of people are familiar with Chinese brands, and the same percentage for the Q5 where 40% seen that the Chinese products are attractive. But regarding the Question 7 the consumers in Asian market would like to purchase Chinese products because they are cheap, but it is the same as other markets where the consumers see that Chinese product lack good packaging, appearance and technology.
To summarize this part, the result clearly indicates that in consumers minds, Chinese products are less expensive than Japanese products but not as attractive.
Many people in these markets recognize Japan as a developed country and have a strong financial position, so Japanese products are more creative and have high quality standards. However consumers recognize China as a developing country, people in there are relatively poor and old fashioned, so some people are shying away from using Chinese products, since there is a perceived risk of being laughed at or look down upon by others. Finally we can say that there is negative image towards Chinese products and hypothesis 1 is right. 5.2 Attitude towards brand (Hypothesis 2) H2: There are less favorable images towards Chinese products. Table 2: Results of attitudes towards Chinese brands (Lenovo) and Japanese brand (Sony).
Africa Asia South America
North America
Europe
Q6 Chinese 17% 10% 5% 12% 13%
Japanese 83% 90% 95% 88% 87% In this question we want to test the attitude of consumers towards a brand from Japan (Sony), and one from China (Lenovo). From the result we can see the big difference between these two brands, and in all markets people are more

ISSN 2039-9340 Mediterranean Journal of Social Sciences Vol. 3 (11) November 2012
555
willing to buy the Japanese brand though it’s more expensive than the Chinese brand. These results can be summarized in two points: As we saw in the hypotheses some of the people have negative image towards Chinese products, and as we’ve said that some people feel shy using Chinese products.
People are with a lot of Japanese products especially electric appliances, and as we see in some market 100% of consumers know Sony where as 0% recognize Lenovo, because they can get information about Japanese brand products and even have experiences using them, so they may be more confidant about the quality, function and technology of the Japanese product and have greater willingness to buy. From the results, it is proven that there is negative image towards Chinese products. 5.3 Sex (Hypothesis 3) H3: there are difference purchasing criteria for males and female’s .Males are more emphasize the function and technologies of the product more, where as women have more emphasis on the appearance and design. Table 3: Test results of sex influence on the intension to buy.
Africa Asia South America North America Europe
Q11
Male T D A T D A T D A T D A T D A
37% 15% 44% 17% 0% 37% 6% 31% 15% 9% 29% 8% 14% Female 46% 0% 2% 25% 13% 1% 45% 6% 6% 29% 12% 4% 23% 15% 11%
T: Technology- D: Design -A: Appearance From the question 11 we want to test the different purchasing criteria between males and females, from table 3 we can see the results from all markets. According to this table we can see that the consumers have more willingness to buy products that they have more technology, for African countries we can see that females are more willing to buy products with good technology than the males, and that is the same in the south American market, where we can see that the results are very close between females and males and we can also see that in all markets males and females prefer to buy high tech products, the design and appearance are secondary matters. Except in Europe where males pay more attention to the appearance and design. So a hypothesis 3 is rejected, and the technology is the main factor for attraction for males and females alike. 5.4 Age (Hypothesis 4) H4: The young generations are more likely to buy foreign brand products, where as the older generations are more willing to buy Chinese products Table 4: Results of comparing Age and country of origin effect towards Chinese products.
Q4
Africa Asia South America North America Europe yes No N.S.M yes no N.S.M Yes no N.S.M yes no N.S.M yes no N.S.M
Below20 - 66% 34% 22% 11% 67% - - - - - - 100%
21-30 6% 75% 19% 20% 35% 45% 3% 74% 23% 5% 22% 73% 15% 38% 47%
31-40 44% 11% 45% 46% 23% 31% 33% 50% 17% 42% 58% 54% 46%
41-50 16% 50% 33% 81% 19% - 100% - - 100% 14% 43% 43%
Over50 100% - - 100% - - 100% - - 25% 50% 25% 40% 40% 20%

ISSN 2039-9340 Mediterranean Journal of Social Sciences Vol. 3 (11) November 2012
556
In the questionnaire using question 4, 6 we tested the effect of age toward Chinese products, and we can see from the result that people over 50 years old in Africa Asia and South America are more familiar with the Chinese brand, in other hand we see that elder people in N America and Europe are less familiar with the Chinese products. But this category of people (over 50years) have better attitudes towards Chinese brand products than other age groups, and for Japanese products, it seems that the younger people prefer it, especially for the age group of 21-30 and bellow 20.
The consumer group between 41-50 and over 50 in the three market ( Africa ,Asia , South America ) as we said before they have better attitude towards Chinese products, as this group mostly live in developing countries, and they are not fully aware of new technologies, or the brand name value, the most important factor for this group is the price. However the same age groups in North America and Europe are less willing to buy Chinese brand products, as these countries are developed and they are aware of brand name value, and are very well informed about new technology.
For the younger people, especially the age group of 21-30 most of them like to follow the fashions and trendy products from Japan, besides they are the group of people that tend to be more willing to try new products or inventions, so they may like Japanese products more as these products are more innovative. The young people may have negative attitudes or feeling towards China because of historical experiences that they might have encountered, such as the incident in 4th of June 1989, it damaged the image of China a lot.
In conclusion, the elderly people tend to have better attitudes towards the Chinese products, while the younger generations tend to like Japanese products more. Even the elderly people have better attitude towards Chinese products, but when compared with Japanese products they have better evaluation for the Japan brands. Consequently, age is a variable that can affect people attitude and evaluation towards products and the country of origin. The result supports our hypothesis in which the youngsters are likely to buy foreign brand products and the older people are more willing to buy Chinese products. 5.5 Income (Hypothesis 5) H5: low income people are more willing to buy Chinese products than high-income people. Table 5: Results of income levels influence on the intension to buy.
Q6
Africa Asia South America North America Europe
CH JAP CH JAP CH JAP CH JAP CH JAP Less 4000$ 30% 70% 16% 84% 11% 89% 30% 70% 50% 50% 4001-8000$ 0 100% 7% 93% 0 100% 50% 50% 100% 0 8001-12000$ 0 100% 0 100% 0 100% 25% 75% 18% 82%
12001-16000$ 0 0 0 100% 0 100% 12.5% 87.5% 5% 95% More 16001 0 100% 0 100% 0 100% 0 100% 0 100%
Even though some people earn less than 4000$ annually, but they prefer to buy the Japanese brands over Chinese brand, and through this results especially in Africa Asia and South America we can ask this question ( why are people willing to buy Japanese products although the are relatively poor ? because what we see as answers are illogical, or maybe there is questionnaire impact on consumers answers, but if there is impact why is it that in North America and Europe we can see that people who have less than 4000$ are more willing to buy Chinese brands than Japanese?). Any way the results indicate that income levels have less influence on peoples purchasing decision. Generally people still prefer buying the Japanese products even though they might have difficulty buying them because of their income level. This may be because the consumers in other market believe that high quality products have relatively higher prices. So people are more willing to pay more money to buy high quality products. So we can say that the results support our hypothesis as people with high incomes tend to have greater willingness to buy Japanese products, and from the same results we must abandon the hypothesis that the people with lower incomes are more willing to buy Japanese products. 5.6 Educational level (Hypothesis 6) H6: less educated people are more willing to buy Chinese products than more educated people.

ISSN 2039-9340 Mediterranean Journal of Social Sciences Vol. 3 (11) November 2012
557
Table 6: Results of educational level effect toward Chinese and Japanese brands
Q6
Africa Asia South America North America Europe
CH JAP CH JAP CH JAP CH JAP CH JAP P.Graduate 28% 72% 18% 82% 0 100% 18% 82% 13% 87%
Undergraduate 20% 80% 0 100% 0 100% 18% 82% 0 0 Diploma 50% 50% 14% 86% 5% 95% 0 100% 10% 90% H.School 16% 84% 8% 92% 100% 0 0 0 25% 75% M.School 0 100% 0 100% 0 0 0 0 0 0
No Education 0 100% 0 0 0 0 0 0 0 0
This table below shows the relationship between the educational level and the negative image towards Chinese products. As we discuss in the hypothesis, educational level, more or less, do have some influence on people’s attitudes and evaluations on different courtier’s products. In this case it is not very true as the results in table 7 shows.
Regarding African Market the results are almost similar between all educational level except for diploma where the people with a diploma are more willing to buy Chinese products due to their income level, because most of diploma holders earn 4000$ or less annually. The other results are different from the hypothesis, as people with lower educational levels are more willing to buy Chinese products than people with higher educational level, we can explain this results: the better educated people use there information and knowledge of the brand during the purchasing decision, so they are better informed about the Chinese products brands, on the other hand people with lower educational level as we’ve already said; are more willing to buy Japanese products and this because the not so well educated people have less information about the Chinese products ,and because some other influences that can effect them such as advertising and other people views. Finally we can say that our hypothesis is not applicable in this market.
As For the Asian market the situation is not difference from the African market as all the educational levels are more willing to buy Japanese products, and the reasons are the same as Africa. So the hypothesis is also inapplicable here
In the Asian market we can see a different attitude, as people with better education are not willing to buy the Chinese products, where as we can see that 100% of the not so well educated consumers are ready to buy Chinese products, these results are more effected by the annual income as most of the less educational level have low income so they don’t have other choice except the Chinese products as it is cheaper. The hypothesis in this market is admitted.
In the North American market we can’t test the hypothesis because we don’t have enough data, so we can’t make any decision about this hypothesis in this market, but what we can say is that the consumers with the higher educational levels are more willing to buy Japanese products as the appearance governing these communities.
The European market looks same as the South America market as the people with lower educational levels are more willing to buy the Chinese products, so the hypothesis is accepted in this market too. The result of our survey were presented and we made analysis for each hypothesis. The table 7 summaries our findings. Table 7 Summary of the hypotheses
Hypothesis Hypothesis Accepted
Hypothesis rejected
Hypothesis partially accepted
H1: There is negative country of origin effect on Chinese products. X H2: There are less favorable images towards Chinese products. X
H3: there are difference purchasing criteria for males and female’s .Males are more emphasize the function and technologies of
the product more, where as women have more emphasis on the appearance and design.
X
H4: The young generations are more likely to buy foreign brand products, where as the older generations are more willing to buy
Chinese products X
H5: low income people are more willing to buy Chinese products than high-income people. X
H6: less educated people are more willing to buy Chinese products than more educated people. X

ISSN 2039-9340 Mediterranean Journal of Social Sciences Vol. 3 (11) November 2012
558
6. Conclusion Through the literature review and survey, there is evidence to prove that Chinese products in others markets are not popular and have a negative image in consumer’s minds. The reason that makes consumers view Chinese products as unattractive and not innovative is mainly due to the negative image of China. The negative country image makes products from China not so popular and unsuccessful in the world markets. Besides, the product design and packaging and technology should adapt to the markets, e.g. can be more funny and colorful. The low price strategy may be a competitive advantage for Chinese products, but this can`t last for a long time because in some markets as Europe and North America the living standard is quite high, so the consumers emphasize on the quality of living rather than quantity of living. So, if the Chinese business wants to have better sales in these two markets, the first and the most effective way they can use is to redesign their marketing strategies , and we can give some recommendations as following : From the study, it shows that there is really a negative image towards Chinese brand products, but fortunately the situation is not bad. Therefore, we believe that Chinese firms can do something to turn around the negative country of origin effect of their products. As the country of origin effect towards a country may consist of many factors, such as the history of the country, or it’s political, economical, technological and social environment. So in our report, we try to give some suggestion on the 4P`s strategies in order to help Chinese firms to build better brand and product image and to eliminate the problem of negative country of origin effect. Price First, for the price we think that the major problem is not here so Chinese firms can put rather less effort on their pricing strategies. Most of Chinese firms are using a low price strategy in all the world markets; it may be because their cost of production I relatively lower. A low price strategy can attract more customers but it may promote a cheap, low class image of the product or even the brand. As we investigate the overseas consumers think that Chinese products are cheap and have negative attitudes on them. So low price strategy may not suitable for Chinese firms to build better image of the products and brands, they have to pay more attention on this issue. Product Second, for the product, we believe that it may be the major problem causing the failure of Chinese products in the worldwide markets. This especially true in the packaging and design of the products. The brand name is important for developing the brand image as people familiarize with a product or brand through its brand name, so it must effect people`s attitude towards this product or brand if the brand name is good.
In the case of China brand products, the brand name always gives the overseas consumers a feeling of old fashioned and out of date. So they lack a positive attitude towards these products.
For the packaging or design of the products, it should be adapted to other market. Even people in China may not care about the products packaging, but the packaging of products is an important criteria in products evaluation by the overseas consumers as we have proved in the survey. So Chinese firms should put more capital and efforts into the product’s design and packaging, and think of something innovative since the consumers like something special and innovative. An attractive appearance of the products can attract more people and hence increase the competitive power.
Beside the packaging and design, the quality and technology are important, and these are the most important factors to consumers, as most of people care about the technology, so the Chinese firms should produce theme products including more technology without ignoring the quality, and here we stop and speak about what I heard from some dealers who import the Chinese products, they told me that some Chinese firms agree with some dealers to reduce the quality of the raw materials to make the products cheap and sell it without any consideration for world standards. And if the Chinese firms and the Chinese managers continue in this ways I am sure it will damage the Chinese economy and the Chinese image. So Chinese firms or managers, as they are responsible, must ensure their products are in high quality and should put a lot of effort on research and development tasks to make their products more innovative and suitable for consumers. And as we see in the survey the quality and image are more important than the price as most people are ready to buy Sony though it is more expensive than Lenovo. So the quality is the most vital element of products .Thus Chinese firms have to improve the quality of products in order to enhance their competitive power in the other market.

ISSN 2039-9340 Mediterranean Journal of Social Sciences Vol. 3 (11) November 2012
559
Place For the place we suggest Chinese firms to increase the number of distribution channels of their products in the other market, as most people don’t have any idea about Chinese distribution channels, so it is quite inconvenience for people to buy Chinese products and difficult to get information about these products. So the firms should promote their products in more shops, especially the large department stores, it can make people more confidant buying these products with after sale support and a warranty by large stores. Especially for electric appliance, people would have greater confidence buying from large department store or specialists stores than buying from small shops. Promotion Finally, for the promotion it is also a great problem causing the failure of Chinese products in other markets. From the test result, most people don’t know the most famous brand in China (Lenovo). And it is because Chinese products lack promotion, so many people are not familiar with these products or brands or even do not know of their existence. The solution is to carry out different promotional strategies, such as advertising, sales promotion and public relation. These are effective for building up brand image and penetrating the target customers. As for advertising, Chinese firms must pay attention to the content, wordings, slogans, and the style of the advertisement, they must adapt to the special culture in the other markets.
References Agrawal,J., & Kamakura, W.A.(1999).Country of Origin: A competitive Advantage? International Journal Of research in Marketing, 16(4),
255-267. Assael,H.(1994) Consumer behavior and marketing action. New York: International Thomson Publishing. Baker, M.J., &Michie, J. (1995). Product Country Image, Department of Marketing. Bilkey, W.J., & Nes, E. (1982).Country of origin effects on product evaluation .Journal of International Business Studies, 8(1), 89-99 Bnnister, J.P., & Sounders, J.A. (1978).UK consumers’ attitude towards import: The measurement of national stereotype
image .European Journal of Marketing 12(8) 562-570. Brodowsky, GH. Tan, J. & Meillich, O. (2004).Managing country of origin choices: competitive advantage and opportunities. International
Business Review 13 (2004), 729-748. Country of origin .Retrieved January 14, 2007 from http://www.answers.com/country%20of%20origin Erickson, G.M., Johanson.J.K. & Chao, P. (1984).Image variable in multi –attribute product evaluations: Country of origin effect. Journal
of Consumer Research 11(4), 694-699 Hong Kong Trade Development Concil, 1991. Johanson, J.K. (1993).Missing strategic opportunity: Manager`s denial of country of origin effect. In N Papadopoulos., & L.A.Heslop,
(Ed.), Product country image, impact and role in international marketing. New York, Binghamton: International Business Press an imprint of the Haworth Press Inc, 77-86
Lee & Jaffe (1997).Effect of partitioned country image in the context of brand image and familiarity. International Marketing Review, 16(1),18-19.
Manrai, L.A., Lascus, D-N., & Manarai, A.K. (1998) Interactive effects of country of origin and products category on product evaluation. International Business Review 7, 591-615
Olsen, J.E., Kent, L.G. &Abhijit, and B. (1993) .influencing consumer’s selection of domestics versus imported products: implication for marketing based on model of helping behavior .Journal oh the Academy of Marketing Science, 21(4), 307-322.
Papadopoutos, N., Heslop, LA. (1993).Product Country Image: Impact and Role in international Marketing .New York: International. Philip Kolter .(1999) Principle of Marketing. Prentice Hall Europe. Salah S. Hassan, Erdener Kaynak .Globalization of Consumer Markets: Structures and Strategies. p.33-34. Schooler, RD (1965).Product bias in the Central American common market. Journal of Marketing Research 2, 394-397. Schooler, R.D. (1971).Bias Phenomena Attendant to the marketing of foreign goods in the US .Journal of international Business Studies,
2(spring),71-80 Shimp, T.A., & Sharma, S. (1987) Construction and Validation of the CETSCALE. Journal of Marketing Research 24(3),280-289. Verlegh, P.W.J., &Steenkamp, J-B.E.M. (1999).A review and Meta analysis of country of origin research, Journal of Economic
Psychology, 20, (1999), 521-546.


ISSN 2039-9340 Mediterranean Journal of Social Sciences Vol. 3 (11) November 2012
561
Development of Dengue Fever Prevention and Control Model
Koraphat Artwanichakul
Department of Environmental Education
Faculty of Environment and Resource Studies Mahasarakham University, Mahasarakham 44150, Thailand
Nongnapas Thiengkamol
Major Advisor, Department of Environmental Education
Faculty of Environment and Resource Studies Mahasarakham University, Mahasarakham 44150, Thailand
Tanarat Thiengkamol
Co- Advisor, School of Management, Assumption University
Hua Mak Campus, 592/3 Ramkhamhaeng 24 Hua Mak, Bangkok 10240, Thailand
Doi:10.5901/mjss.2012.v3n11p561
Abstract: The objective of this research was to develop dengue fever prevention and control model. The populations were community health leader of Nongkhai Province. The questionnaire was used as instrument for data collecting. Pearson Correlation and Path Analysis were used for data analysis.The results revealed that environmental education in terms of knowledge (KN) showed directly affected to inspiration of public mind in aspects of role model (RM), impressive environment (IE), and impressive environment (IV) with .553, .572, and 627. Public mind in aspects of role model (RM), impressive environment (IE), impressive environment (IV) showed directly affected to participation of Dengue fever prevention and control (PAR) with .559, .608 and .516. KN also directly affected to PAR with .612. Environmental education in terms of awareness (AW) showed directly affected to RM, IE, and IV with .612, .558 and .601. AW also directly affected to PAR with .635. KN and AW showed directly affected to Dengue fever prevention and control behavior (BEH) with .544 and .653. RM, IE, and IV showed directly affected to BEH with .462, .537 and .542 respectively. Key Words: Development / Dengue Fever / Prevention / Control / Model 1. Introduction Climate change is likely to have indirect effect on vector abundance and vector population. Environmental condition might stimulate the patter of vector behavior such as Aedes aegypti, which is a vector of Dengue fever changing its behavior of day time feeding to take more long duration of feeding. Moreover, the vector might be replaced by another vector species (McMichael, Haines, Slooff, & Kovats, (Eds),1996).
Additionally, human behavior has also promoted the spreading of vector, especially, the waste disposal of man-made containers like earthenware jars, metal drums and concrete cisterns used for domestic water storage, as well as discarded plastic food containers, used automobile tyres and other items that collect rainwater (WHO, 2009, & Theingkamol, 2011e).
WHO presently estimates there may be 50 million dengue infections worldwide every year. The disease is now endemic in more than 100 countries in Africa, the Americas, the Eastern Mediterranean, South-east Asia and the Western Pacific. South-east Asia and the Western Pacific are the most seriously affected. Before 1970 only nine countries had experienced dengue hemorrhagic fever (DHF) epidemics, a number that had increased more than four-fold by 1995. Not only is the number of cases increasing as the disease is spreading to new areas, but explosive outbreaks are occurring. In 2007, there were more than 890, 000 reported cases of dengue in the Americas, of which 26,000 cases were DHF. Additionally, Venezuela reported over 80, 000 cases, including more than 6,000 cases of DHF (WHO, 2009).

ISSN 2039-9340 Mediterranean Journal of Social Sciences Vol. 3 (11) November 2012
562
Dengue fever (DF) or Dengue Hemorrhagic Fever (DHF) is occurred by a bite from an infected Aedes mosquito. The victim is happened when the patience got second or even third strain of virus after the initial infection of a strain of dengue virus. Prevention and control are more importance than treatment. It is a fatal disease. Therefore, the global population should pay attention on change behavior housing and community environment.
Environmental management involves planning, organization, execution and monitoring of activities for the modification and/or manipulation of environmental factors or their interplay with human beings with a view to prevent or minimize vector breeding and reduce human-vector-virus contact. The control of Ae. aegypti in Cuba and Panama in the early part of the 20th century was based mainly on environmental management. Such measures remain applicable wherever dengue is endemic (WHO, 2009 & Langly, 1998).
Environmental methods of Ae. aegypti and Ae. Albopictus control, it is reducing man-vector contact, solid waste management, modification of man-made breeding sites, and improved house design. The major environmental management of Ae. aegypti control, it should begin at production sites such as water evaporation cooler, water storage tank/cistern, drum, flower vase with water, potted plants with saucers, ornamental pool/fountain, roof gutter/sun shades, animal water container, ant-trap , used tyres, discarded large appliances, discarded buckets, discarded food and drink containers, including natural sources such as tree holes, and rock holes are important sources (WHO, 2009).
Therefore, prevention and control on physical and biological and to achieve sustainability of a successful DF/DHF vector control program, it is essential to focus on the larval source reduction while closely cooperating with non-health sectors such as nongovernmental organizations, civic organizations and community groups to ensure community understanding and involvement in implementation.
Biological control is based on the introduction of organisms that prey upon, parasitize, compete with or otherwise reduce populations of the target species.
The application of biological control agents, which are directed against the larval stages of dengue vectors, in South-East Asia has been somewhat restricted to specific container habitats in small-scale field operations. While biological control avoids chemical contamination of the environment, there may be operational limitations such as the expense and task of rearing the organisms on a large scale, difficulty in applying them and their limited utility in aquatic sites where temperature, pH and organic pollution may exceed the narrow requirements of the organism. Importantly, the biological control organisms are not resistant to desiccation, hence their utility is mainly restricted to container habitats that are seldom emptied or cleaned, such as large water-storage containers or wells. However, the willingness of communities to accept the introduction of organisms into water containers is essential. Community involvement is also desirable in distributing the agents, and monitoring and restocking containers, as necessary (WHO, 2009).
With the high rate of infection of Dengue fever, it was projected that in 2008, there would be around 25,000 to 30,000 reported cases in Thailand. If we set it at 35,000 out of a population of 70 millions that would mean about 1 in 2,000 people will be infected. (It's fairly similar to HIV / AIDS statistics) (Thailandguru, 2011).
Empowerment for community for dengue fever prevention and control, the ultimate goal of controlling any epidemic disease including dengue is to prevent its transmission and control the spread of the disease as soon as possible. The success of the efforts for prevention and control of dengue relies on the effectiveness of the initiatives to control the breeding sites of the vector by improving public and household environmental sanitation and water supply, and through sustained modification of human behavior. This requires the entire gamut of the success of a disease control program relies heavily on community participation and intersectoral cooperation with non-health sectors in the prevention of disease, including vector control, and the treatment of the sick. To secure and sustain community participation and intersectoral cooperation, the following activities should be carried out community participation involvement of community health volunteer or leader to change problematic conditions and influence policies and program that affect the quality of their lives or the lives of others. Even though, Ministry of Public Health of Thailand has paid attention to prevent and control Dengue fever intensively with elimination of vector by using chemical control and public relation through community health volunteer or leaders but the epidemic of disease are still high. It might lack of the genuine recognition of Thai people on the serious fatal of dengue infection. Therefore, it might be needed the education process such as environmental education to raise awareness, change attitude and behavior of prevention and control for Dengue fever spreading in any community with public consciousness participation (WHO, 2009, Thiengkamol, 2004, Thiengkamol, 2005a, Thiengkamol, 2010b).
In order to achieve self-care prevention and control of community, they should adjust their concept and practice for daily living health care through environmental education aims to increases knowledge and understanding, awareness raising and values, belief, attitude, and behavioral change to achieve sustainable development. The community people should closely cooperate or collaborate with health official to meet success for prevention and control dengue fever. The environmental education concept is congruent to sustainable development principle, therefore it is able to use for empowering their competencies to emphasize sustainable self care management (UNESCO, 1978, Weiss, 1995 &

ISSN 2039-9340 Mediterranean Journal of Social Sciences Vol. 3 (11) November 2012
563
Thiengkamol, 2011e), including for developing people to understand that they have a relationship with the environment and that whatever they do, their activities would also affects it. This education is there to help create consciences within people and stimulate them to take a responsible behavior by using environmental education principle to develop the capability of community people to practice themselves for proper environment management to meet disease prevention and control dengue fever effectively with self-care and public consciousness (Stapp & Dorothy, 1981, Schmieder, & Allen, 1977a, Chunkao, 1993, WHO, 2009, Thiengkamol, 2011e, & Thiengkamol, 2011f, Thiengkamol, 2011g, Thiengkamol, 2011h, Thiengkamol, 2011i & Thiengkamol, 2011j). 2. Objective The objective of this research was to develop dengue fever prevention and control model. 3. Methodology The research design was implemented in steps by step as follows: The populations were 9,299 community health leaders of Nongkhai Province in 2012. The 400 community health leaders were collected by simple random sampling from different districts of Nongkhai Province.
The research instrument was the questionnaire and it was used for data collecting. The content and structural validity were determined by Item Objective Congruent (IOC) with 5 experts in the academic of public health for Dengue fever prevention and control, environmental education, and social research methodology. The reliability was done by collecting the sample group with 50 community health leaders of Udonthani Province, which is adjacent province. The reliability was determined by Cronbach's Alpha (Sproull, 1995). The reliability for knowledge and understand of Dengue fever prevention and control was .899, participation for Dengue fever prevention and control was .902, environmental education was .924, inspiration of public conscious for Dengue fever prevention and control was .882, was .839 and the whole questionnaire was .921.
The descriptive statistics used were frequency, percentage, mean and standard deviation. The inferential statistics used Pearson Correlation and Path Analysis for data analysis (Hair, Anderson, Tataham, & Black, 1998).
4. Results 4.1 General Characteristics of Sample Group The sample group of this study was community health leaders were collected by simple random sampling from different districts of Nongkhai Province with the same proportion. Most of them were female with 325 leaders (81.25%), and most of them had marital status of marriage with 281 community health leaders (70.25 %). Majority had occupation as agriculturist with 319 peoples (79.75%). Most of them had education level at primary school with 287 (71.75%) and all of them were Buddhist. Average of family income was 17,244 Baht per year and average age was 32.56 years as illustrated in table 1. Table 1 Demographic Characteristics of Sample Group
Characteristics
Community Health Leader
Frequency Percent Sex Male Female
75 325
18.75 81.25
Marital Status Marriage Single Divorce/ Widow/Separate
281 101 18
70.25 25.25 4.50
Occupation Agriculturist Government Officials Private Business Employee
299 2 7 5
74.75 0.50 1.75 1.25

ISSN 2039-9340 Mediterranean Journal of Social Sciences Vol. 3 (11) November 2012
564
General Hire House wife
72 15
18.00 3.75
Education Level Primary School Level Secondary School Level High School Level/ Vocational Certificate Bachelor Master or higher
319 67 10 2 2
79.75 16.75 2.50 0.50 0.50
Religion Buddhist
400
100.00
Average Family Income per year 17,224 Baht Average of Age 32.56 years
Total 400 100.00
4.2 Comparison of Sex on Knowledge of Sample Group The demographic characteristics of sample in terms of sex, the comparison of knowledge of Dengue fever prevention and control between different sex of sample group was revealed that it was highly statistical significance (p<.01) as shown in table 2. Table 2 Comparison of Knowledge of Dengue Fever Prevention and Control between Different Sex of Sample Group
Sex Number (n) Mean S.D. t Sig. Male 75 13.563 2.015 8.443 .000** Female 325 15.87 2.213
** Statistically Significant at the .01 level 4.3 Comparison of Sex on Awareness of Sample Group The demographic characteristics of sample in terms of sex, the comparison of awareness of Dengue fever prevention and control between different sex of sample group was revealed that it was highly statistical significance (p<.01) as shown in table 3. Table 3 Comparison of Awareness for Dengue Fever Prevention and Control between Different Sex of Sample Group
Sex Number (n) Mean S.D. t Sig. Male 75 9.98 1.784 3.909 .000** Female 325 12.94 1.811
** Statistically Significant at the .01 level 4.4 Comparison of Sex on Participation of Sample Group The demographic characteristics of sample in terms of sex, the comparison of participation for Dengue fever prevention and control between different sex of sample group was revealed that it was highly statistical significance (p<.01) as shown in table 4. Table 4 Comparison of Participation for Dengue Fever Prevention and Control between Different Sex of Sample Group
Sex Number (n) Mean S.D. t Sig. Male 75 8.85 1.564 4.875 .000** Female 325 10.94 1.237
** Statistically Significant at the .01 level

ISSN 2039-9340 Mediterranean Journal of Social Sciences Vol. 3 (11) November 2012
565
4.5 Comparison of Sex on Inspiration of Public Mind of Sample Group The demographic characteristics of sample in terms of sex, the comparison of Inspiration of public mind for Dengue fever prevention and control between different sex of sample group was revealed that it was highly statistical significance (p<.01) as shown in table 5. Table 5 Comparison of Inspiration of Public Mind for Dengue Fever Prevention andControl between Different Sex of Sample Group
Sex Number (n) Mean S.D. t Sig. Male 75 14.33 2.313 4.201 .000**
Female 325 15.98 2.415 ** Statistically Significant at the .01 level 4.6 Comparison of Sex on Behavior of Sample Group The demographic characteristics of sample in terms of sex, the comparison of Behavior for Dengue fever prevention and control between different sex of sample group was revealed that it was highly statistical significance (p<.01) as shown in table 6. Table 5 Comparison of Behavior for Dengue Fever Prevention and Control between Different Sex of Sample Group
Sex Number (n) Mean S.D. t Sig. Male 75 14.89 2.112 4.658 .000** Female 325 16.77 2.035
** Statistically Significant at the .01 level 4.7 Dengue Fever Prevention and Control Model for Community Health Leaders The results revealed that environmental education in terms of knowledge (KN) showed directly affected to inspiration of public mind in aspects of role model (RM) with .553, it also showed directly affected to participation of Dengue fever prevention and control (PAR) with .612. Public mind in aspects of role model (RM) showed directly affected to participation of Dengue fever prevention and control (PAR) with .559.
Environmental education in terms of knowledge (KN) showed directly affected to inspiration of public mind in aspects of impressive environment (IE) with .572, public mind in aspects of impressive environment (IE) showed directly affected to participation of Dengue fever prevention and control (PAR) with .608.
Environmental education in terms of knowledge (KN) showed directly affected to inspiration of public mind in aspects of impressive environment (IV) with .627. Public mind in aspects of impressive event (IV) showed directly affected to participation of Dengue fever prevention and control (PAR) with .516.
Environmental education in terms of awareness (AW) showed directly affected to inspiration of public mind in aspects of role model (RM) with .612, it also showed directly affected to participation of Dengue fever prevention and control (PAR) with .635.
Environmental education in terms awareness (AW) showed directly affected to inspiration of public mind in aspects of impressive environment (IE), and inspiration of public mind in aspects of impressive environment (IV) with .558 and .601.
Environmental education in terms of knowledge (KN) showed directly affected to Dengue fever prevention and control behavior with .544 and Environmental education in terms awareness (AW) showed directly affected to Dengue fever prevention and control behavior (BEH) with .653. Inspiration of public mind in aspects of role model (RM), impressive environment (IE), and impressive environment (IV) showed directly affected to Dengue fever prevention and control behavior with .462, .537 and .542 respectively as illustrated in diagram.

ISSN 2039-9340 Mediterranean Journal of Social Sciences Vol. 3 (11) November 2012
566
Diagram 1: Dengue Prevention and Control Model ** Statistically Significant at the .01 level 5. Discussions The findings illustrated that After testing with Independent t-test, it was found that the mean score of knowledge, awareness, inspiration of public mind, participation and behavior for Dengue fever prevention and control of female were higher than male with statistically significant (p<.01., .01, .01, .01, and .01) respectively. Therefore, it might be explained that female had better knowledge, awareness, inspiration of public mind, participation and behavior for Dengue fever prevention and control. This indicated that the female might be easily to give knowledge, to raise awareness, to stimulate to have inspiration of public mind or public consciousness for changing participation and behavior for dengue fever prevention and control easier than male.
These results also pertinent to different researches of Jumrearnsan & Thiengkamol, (2012), and Thiengkamol, (2005a, 2005b, 2010b, 2011g, 2011h, 2011i, & 2011j) including concept proposed by Thiengkamol about environmental education and inspiration of public mind or public consciousness are able to adjust participation and behavior for dengue fever prevention and control (Thiengkamol, 2011e, Thiengkamol, 2011f, Thiengkamol, 2011g, & Thiengkamol, 2011i). Furthermore, it also congruence with Participatory Appreciation Influence and Control (PAIC) in different studies on environmental education volunteer building, development of food security, development of energy security, development of network for natural resources conservation, strengthening community through energy conservation and political competency development for women (Thiengkamol, 2004, Thiengkamol, 2005a, Thiengkamol, 2005b, Thiengkamol, 2010b, Thiengkamol, 2011f, Thiengkamol, 2011g, Thiengkamol, 2011h, Thiengkamol, 2011i, & Thiengkamol, 2011j, & Jansab, 2005)
Dengue fever prevention and control model community health leaders as presented in diagram 1, the results illustrated that if we want to develop and to build community health leaders to participate and change their behavior for Dengue fever prevention and control for rural region likes as Nongkhai Province, we might use the inspiration of public mind in terms of role model of public health officers for them. However, environmental education in term of knowledge and awareness also illustrated affected participation and behavior for Dengue fever prevention and control, therefore, we might use environmental education process to educate them in the community by public health officers. These findings were also congruent to studies of Thiengkamol, (2005a, 2005b, 2010b, 2001f, 2011g, 2011h, 2011i, & 2011j). Furthermore, to build inspiration of public mind in aspects of impressive environment and impressive event, these can be done with arrangement of appropriate environment and event for community health leaders with demonstration of Dengue fever prevention and control at community site.
References
Chunkao, K. (1993). Environmental Education. Bangkok: Aksornsayam Publishing, Economic and Social Commission for Asia and The Pacific, 30Sep-2 Oct 1997. Department of Environmental Quality Promotion, Ministry of Science, B.E. 2540-2544.
Havanonth, N., Jeeradejakul, P, & Padthaisong, S. (2007a). Ground Theory of Community Strength. Bangkok: Office of Thailand Research Fund).
Hair, J.F., Anderson, R.E., Tataham, R.L., & Black, W.C. (1998).Multivariate Data Analysis. New Jersey : Prentice Hall.
PAR
RM
IE
IV
KN
AW
.553**
.612**
.572**
.655**
.559**
.608**
.601** .516**
.635**
.558**
.627**
BEH
.542**
.462**
.653**
.544**
.537**

ISSN 2039-9340 Mediterranean Journal of Social Sciences Vol. 3 (11) November 2012
567
IPCC (1990). First Assessment Report. Retrieved from http://en.wikipedia.org/wiki/IPCC Jansab, S. (2006). Strategies for the Development of Women’s Political Participation in Pattaya City. Thesis of Master of Art Master of
Art (Women Studies), Office of Women and Youth Studies of Thammasart University. Jumrearnsan, W., & and Thiengkamol, N. (2012). Development of an Environmental Education Model for Global Warming Alleviation.
Journal of The Social Sciences, 7 (1): 65-70. Langly, A. (1998). “The Roles of Formal Strategic Planning” Long Range Planning. Vol. 21, No.1. McMichael, A.J. Haines, A., Slooff, R, & Kovats, S (Eds). (1996). Climate Change and Human Health. United Kingdom: Horley Studios,
Redhill. Schmieder & Allen. (1977). “The Nature and Philosophy Environmental Education: Goal and Objective”. Trends in Environmental
Education. Paris: UNESCO. Sproull, N.L. (1995). Handbook of Research Method: A Guide for Practitioners and Students in the Social Science. (2nd ed.). Metuchen,
NJ: Scarecrow Press. Stapp, W.B. and Dorothy, A., (1981). Environmental education activities manual. Michigan: Thomas Shore Inc. Thailandguru. ( 2011). Dengue Fever. Retrieved from http://www.thailandguru.com/dengue-fever-mosquito-thailand.html Thiengkamol, N. (2004). Development of A Learning Network Model for Energy Conservation. Doctoral Dissertation of Education
(Environmental Education) Faculty of Graduate Studies, Mahidol University, Thailand. Thiengkamol, N. (2005a). Strengthening Community Capability through The Learning Network Model for Energy Conservation. Journal
of Population and Social Studies, 14 (1), 27-46. Thiengkamol, N. (2005b). Development of Health Cities Network for Mekong Region. In Proceedings of the International Conference
“Transborder Issues in the Grate Mekong Sub-Region” Ubon Ratchathani, Thailand, 30 June-2 July 2005 (pp.111-119). Ubol Ratchathani: Nevada Grand Hotel.
Thiengkamol, N. (2010b). Urban Community Development with Food Security Management: A Case of Bang Sue District in Bangkok. Journal of the Association of Researcher, 15 (2), 109-117.
Thiengkamol, N. (2011e). Environment and Development Book. (4th ed.).Bangkok: Chulalongkorn University Press. Thiengkamol, N. (2011f). Nurture Children to be Doctors. Bangkok: INTELLUALS. Thiengkamol, N. (2011g). Development of Energy Security Management for Rural Community. Canadian Social Science, 7 (5), October
31, 2011. Thiengkamol, N. (2011h). Development of a Food Security Management Model for Agricultural Community. Canadian Social Science, 7
(5), October 31, 2011. Thiengkamol, N. (2011i). Development of Model of Environmental Education and Inspiration of Public Consciousness Influencing to
Global Warming Alleviation. European Journal of Social Sciences, 25 (4):506-514. Thiengkamol, N. (2011j). Development of Food Security Management for Undergraduate Student Mahasarakham University. European
Journal of Social Sciences. Thiengkamol, .N. (2012a). Development of A Prototype of Environmental Education Volunteer. Journal of the Social Sciences, 7 (1):77-
81. Thiengkamol, N. (2012b). Development of Food Security Management for Undergraduate Student Mahasarakham University. European
Journal of Social Sciences, 27 (2):246-252. Weiss, J. W. (1995). Organizational Behavior and Change: Managing Diversity, Cross Cultural Dynamics and Ethics. Anaheim, CA:
West Publishers. WHO. (2009). Dengue and dengue haemorrhagic fever. Retrieved fromhttp://www.who.int/mediacentre/factsheets/fs117/en/ UNEP. (1991). Climate Change and Energy Efficiency in Industry. London: IPIECA. UNESCO. (1978). Intergovernmental Conference on Environmental Education Organized by UNESCO in Cooperation with UNEP Tbilisi
(USSR) 14-16 October 1977. Final Reports. Paris: UNESCO.


ISSN 2039-9340 Mediterranean Journal of Social Sciences Vol. 3 (11) November 2012
569
Lexical Cohesion in English and Persian Texts of Novels
Ali Rahimi
English Department, University of Kashan, Kashan, Iran
Email: [email protected]
Nabi A. Ebrahimi
Young Researchers Club, Arsanjan Branch, Islamic Azad University, Arsanjan, Iran Corresponding Author: [email protected] Tel: 00989171261337
Doi:10.5901/mjss.2012.v3n11p569
Abstract: What are the stylistic differences between Persian and English novelists with regard to their choices and application of lexical patterns? What are the textual differences between Persian and English novels in terms of lexical cohesion? To answer these questions, two Persian (The Blind Owl by Sadigh Hedayat and The Patient Stone by Sadigh Chubak) together with two English novels (The Old Man and the Sea by Ernest Hemingway and The Pearl by John Steinbeck) which are enormously popular in contemporary Persian and English literatures were selected as the main source of data. The results of lexical cohesion analysis on 1000-word excerpts of these novels showed that the difference between Persian and English novelists’ choices of lexical patterns is caused by the higher number of reiteration as well as the collocation pairs used by Persian novelists. This study concludes that some lexical relations are more frequent in the Persian novels than in the English ones (e.g. Equivalence and Elaborative collocation), conversely some are more salient in English texts under study (e.g. Simple repetition). The similarities of these texts with regard to the frequency of lexical relations turned out to be more than their differences nonetheless. In addition, detailed explanations of the results as well as complete elucidation of the model of analysis (proposed by Tanskanen, 2006) accompanied by examples extracted from the selected Persian and English novels have been put forward. The results of this study can inspire literary critics, theorists in stylistics, EFL teachers, assessment specialists, translators and contrastivists. Keywords: stylistics, lexical cohesion, lexical relations, Persian novels, English novels 1. Introduction Cohesion is the network of lexical, grammatical, and other relations which link various parts of a text. Halliday and Hasan (1976) take the view that the primary determinant of whether a set of sentences do or do not constitute a text depends on cohesive relationships within and between the sentences, which create texture. Cohesion as Halliday and Hasan define refers to relations of meaning that exist within the text and that define it as a text (Shafiee, 2003). The topic of cohesion has always appeared to be the most useful constituent of discourse analysis or text linguistics applicable to translation (Newmark, 1987). Analysis of cohesive devices within a text gives us more insight into how writers structure what they want to say and may be crucial factors in our judgments of whether something is well-written or not. Different languages may show a tendency towards the use of some specific types of different cohesive devices for creating texts. Such tendencies can be clarified by cohesion analysis. Among the different types of cohesive devices, i.e. reference, substitution, ellipsis, conjunction, and lexical cohesion (Haliday & Hasan, 1976), lexical cohesion is of great importance and has different applications in translation studies, computational linguistics, information retrieval researches and teaching and learning issues. Lexical cohesion is a type of cohesion whereby certain lexical features of the text connect sentences with each other in the text (Benbrahim, 1996, cited in Dahl, 2000, p.123). In this study, we focused on the lexical patterns in the texts of Persian and English novels. The present study is the first of its type and it is one of rare studies exploring stylistic properties of Persian novels. The rest of the article is presented as follows. At first, different applications of lexical cohesion analyses will be presented. Then different models for analyzing lexical cohesion along a full account of Tanksanen model for lexical cohesion analyses (used in the study) are introduced. The results of the study and a full discussion of the findings form the following parts. Concluding remarks are presented in the last part.
ISSN 2039-9340 Mediterranean Journal of Social Sciences Vol. 3 (11) November 2012
570
Applications of lexical cohesion analyses Lexical cohesion analyses can be of different applications including summarization, segmentation, anaphora resolution, improved speech recognition, improved optical character recognition and improved machine translation.
A rudimentary summary of a document can be created by extracting the most important sentences from the document, where the importance of a sentence is measured by the presence of key phrases. Such summaries often contain outliers, sentences that do not fit with the other sentences. A measure of lexical cohesion can be used to detect and remove these outliers, thereby improving the quality of the summary.
According to Berber (1999), segmentation refers to the principled division of texts into contiguous constituents. He added that segmentation means using the computer to divide a written text into acceptable parts (or segments). Among the different kinds of segments, lexical segments are of great importance.
A typical document first introduces an entity, such as a company, by giving its full name. Later in the document, the entity will be mentioned more briefly, using phrases like "the company" or simply "it". Anaphora resolution is the task of recognizing that these shorter phrases refer to the same entity as the full name. One approach to anaphora resolution involves building a chain of lexically cohesive terms, connecting sentences in the given document that discuss the same entity.
A measure of lexical cohesion can be used to recognize when speech recognition software has made errors. The incorrect words usually do not cohere with the rest of the text. Errors in optical character recognition can also be detected by their lack of lexical cohesion. Errors in machine translation also lack cohesion, although they may be more cohesive than errors in speech recognition and optical character recognition.
Among these applications, summarization and also segmentation have been of great interest for researchers in the field of corpus linguistics and language study. Various researchers (e.g. Benbrahim (1996, cited in Dahl, 2000, p.123) and Ercan & Cicekli (2008) have considered summarizing text by the use of lexical cohesion. Benbrahim (1996, cited in Dahl, 2000, p.123) stated that an analysis of lexical cohesion in text, primarily by counting repetitions, synonyms and paraphrase, leads to the establishment of a network of sentences, some tightly bonded through lexical cohesion relations, some others having weak bonds or no bonds at all. The strength of connections in this cohesion network is used to determine key sentences in a text.
Lexical cohesion is also of great importance in translation studies and pedagogical issues. Within a discoursal framework, Lotfipour-Saedi (1997) introduced seven dimensions of translation equivalence (TE): vocabulary, structure, texture, degree of indirection, language variety, cognitive effect and aesthetic effect. He listed four components for texture: thematization strategies, schematic structures, cohesion, and paralanguage. Then he talked about lexical cohesion and its implication for TE. He added that in evaluating a translated text to determine the degree to which the translator has managed to maintain the discoursal value intended by the SL text, especially in literature-texts, lexical cohesion can offer critical guidelines.
Lexical cohesion is also of great importance for language teachers, material developers and students. McCarty (1991) stated that it is necessary to give a discourse dimension to vocabulary teaching and vocabulary activities in the classroom. He continued that Halliday and Hasan’s (1976) description of lexical cohesion is one recent attempt at studying vocabulary patterns above sentence level. He added that the study of vocabulary in discourse is concerned with patterns in text created by the vocabulary or lexical relations that are found over clause and sentence boundaries, the role of special words in organizing discourse and signaling their structure and the relationship between these features of textuality and the register of the end product. Students themselves can be motivated to collect items along discourse-functional lines, something which become more and more important as they embark on composition writing and argumentation in general. In addition, contrastive analysis of different discourse features of two languages can be inspiring for the teachers and material developers to find the difficulties the learners may face through language learning. Studies such as Salehuddin et.al, (2006) and Forutan & Nasiri (2011) tried to spot the difficulties may face in their transfer of L1 features to L2. The model of analysis used in this study The model utilized in this study was developed by Tanskanen (2006). She borrowed some of the categories from the previous models (e.g. Halliday & Hasan, 1976 and Morris and Hirst (1991)) and believed that her model “provide a good basis for understanding the work done by lexical cohesion in discourse” ( Tanskanen, 2006, p.49). Let us now turn to the categories of lexical cohesion proposed by Tanskanen (2006) and discuss them in detail with examples. The categories are:

ISSN 2039-9340 Mediterranean Journal of Social Sciences Vol. 3 (11) November 2012
571
Reiteration: simple repetition complex repetition substitution equivalence generalization specification co-specification contrast Collocation: ordered set activity-related collocation elaborative collocation Reiteration relations Simple and complex repetition Here repetition is divided into simple repetition and complex repetition. Tanskanen (2006) asserted that simple repetition occurs when an item is repeated either in an identical form or with no other than a simple grammatical change, e.g. singular – plural, present tense – past tense. Complex repetition involves a more substantial change: the items may be identical but serve different grammatical functions, or they may not be identical but share a lexical morpheme. The following example selected from The Pearl includes both simple and complex repetition: ….Kino saw Juana arise silently from beside him. He saw her move towards the fireplace. So carefully did she work that he heard only the slightest sound when she moved the fireplace stone. In this example, we find both simple and complex repetition at work. Saw-saw, him-he, her-she, he-he and she-she are instances of simple repetition, while move-moved is an example of complex repetition. So in this example, there are five pairs of simple repetition and there is one pair of complex repetition. Studying lexical cohesion in multiparty conversations in English, Gonzalez (2011) reports repetition (59%) as the most frequent lexical cohesion device. Substitution The second category of reiteration relation is substitution. The most usual form of substitution is a pronoun substituting for a noun. In the following sentences selected from The Old Man and the Sea, they reiterates my eyes or they substitutes for my eyes. All my life the early sun has hurt my eyes, he thought. Yet they are still good. In the next sentences selected from the Persian novel “the Patient Stone”, eu substitutes for Gohar Gohar kolfate shomas. Eu kasio nadare Behjat (2009) studied cohesive devices in English novels and their corresponding Persian translations and mentioned that pronouns are used in English more than Persian. Beside pronouns, there are other substitutions items as well, like one, do and so, which can substitute for previous items. These kinds of substitution are actually relatively rare in the material. Equivalence The third subcategory of reiteration in our classification is that of equivalence. Following McCarthy (1988), the term equivalence is used to refer to the relation more commonly referred to as synonymy. I should mention again that our approach is a discourse-specific one to lexical relations. As Tanskanen (2006) stated that the significance issue for this more discourse- specific approach to lexical relations is the language user's decision to use an item for instance in equivalence with another item, although they may not be semantically absolutely synonymous. Using non-lexical-semantic terms draws attention to the fact that the justification and explanation for a relation between lexical items can and should be sought for in the text in which the items occur. Let us consider some examples. In the following sentences selected from the Persian novel “the Blind Owl”, cheke cheke and ghatre ghatre are in an equivalence relation.

ISSN 2039-9340 Mediterranean Journal of Social Sciences Vol. 3 (11) November 2012
572
Hala mikhaham sartasare zendegiye khodam ra manande khusheye angur dar dastam befesharam va osareye anra- na, sharable anra- ghatre ghatre dar galuye khoshke sayeam mesle abe torbat bechekanam……..mikhaham osareye- na, sharable talkh-e- zendegiye khodam ra cheke cheke dar galuye khoshke sayeam chekanide be eu beguyam: “in zendegiye man ast!” Rescue and save in the next sentences selected from The Pearl are in an equivalence relation. All of the time Juana had been trying to rescue something of the old peace, of the time before the pearl. But now it was gone, and there was no retrieving it. And knowing this, she abandoned the past instantly. There was nothing to do but to save themselves. Generalization The fourth subcategory is generalization, which covers the relation between an item and a more general item. This relation has been referred to as a superordinate or hyponymic relation in most of the earlier studies, or inclusion: specific-general by McCarthy (Tanskanen, 2006). In the following sentence selected from “the Patient Stone”, bahr reiterates and generalizes gohar Tora setayesh mikonam ke yekta gohar-e bahr-e mavaje afarinesh maeim In the following text, political party is a generalization of labor: Gordon: If Labor get in and they can't fulfill their promises... (21 turns) Audrey: Well I can't well I mean there's an awful lot, I mean would, no no matter which political party it is, they all make promises, but they don't carry them all out. Specification Specification, the fifth subcategory, is the opposite of generalization: it refers to the relation between an item and a more specific item. This relation has previously been called meronymy, and McCarthy referred to it as inclusion: general-specific (Tanskanen, 2006). In the following sentences, health, education reiterate and specify the other social services. The deceptive nature of the accelerated growth argument occurs also with respect to the other social services. The White Paper tells us that what we want to do in health, education, etc. depends on faster growth. Haj esmoeil is a specification of bozorguna in the next sentences selected from the Patient Stone. Man ye dokhtare rakhtshuri budam ke nanam esmesh khojaste bud va too khunehaye bozorguna rakhtshuri mikard. Yeki az unaee ke nanam miraft khunashun rakhshuri mikard hamin haj esmoeil tajere gomrok bud ke tu gomrok hojre dasht. Co-specification The next subcategory of reiteration is co-specification, which includes the relation between two items which have a common general item. The earlier studies that have included this relation have referred to it as co-hyponymy or co-meronymy. The general item would be tan for the items khun, sar, dasthayam in the next sentences selected from The Blind Owl: Vali man bidar budam, hes mikardam tanam dagh hast va lakehaye khun be aba va shal gardanam chasbide bud. Dasthayam khunin bud. Ama ba vojude tab va davare sar, yekno ezterab va hayajane makhsus dar man tavalod shode bud ke shadidtar az fekre mahv kardane asare khun bud…… In the next example, RP speakers and Standard English speakers are related even without the mention of the general item English speakers. It is widely agreed, though, that while all RP speakers also speak Standard English, the reverse is not the case. Perhaps 9%-12% of the population of Britain (see Trudgill & Cheshire 1989) speaks Standard English with some form of regional accent. It is true that in most cases Standard English speakers do not have 'broad' local accents (i.e. accents with large numbers of regional features which are phonologically and phonetically very distant from RP)... Contrast The final subcategory of reiteration is contrast, which refers to the relation between an item and another item which has an opposite meaning. This relation has also been called antonymy, opposition, or complex repetition

ISSN 2039-9340 Mediterranean Journal of Social Sciences Vol. 3 (11) November 2012
573
or paraphrase. In the following sentences selected from The Blind Owl, javan and pirmard are related by contrast. Har kas diruz mara dide bud, javan-e shekaste va nakhoshi did ast. Vali emruz pirmard-e ghuzi mibinad ke muhaye sefid, cheshmhaye vasukhte va labe shekari darad. In the following example borrowed from Tanskanen (2006), the contrastiveness of out of fashion and up to date is enhanced by the use of, respectively, dramatically and completely. And the reason for this is that it belongs to a tradition, a fashion if you like, of writing which went dramatically out of out of fashion immediately after World War One. So, at the time when it was published most readers would have regarded it as completely up to date in its in its style and in its presentation. Collocation relations Now it is time to define and discuss collocation relations. This category has been notoriously to define, so much so that it has often been omitted from analysis. . Regardless of the difficulties that we will no doubt have to face, collocation relations will be included in our model of analysis. The three types of collocations are presented in the following sections. Ordered set Ordered set is the first of the collocation subcategories in our classification. It is perhaps the clearest of the three categories, the easiest to detect and closest to the more systematic reiteration relations described above. The category includes members of ordered sets of lexical items, for example, colors, numbers, months, days of the week and the like. Because the sets are relatively clear, these relations are not difficult to find in texts, but as luck would have it, they seem to be quite infrequent: there are only a few instances of ordered set in the material of the present study (Tanskanen, 2006). In the following sentences selected from The Blind Owl, we find ruz, saat, mah, sal as ordered set. Shayad az anjaee ke hameye ravabete man ba donyaye zendeha boride shode, yadegarhaye gozashte jeloam naghsh mibandad! Gozashte, ayande, saat, ruz, mah va sal hame barayam yeksan ast. Second, third and fourth in the next sentences from The Old Man and The Sea are considered as ordered set. One bait was down forty fathoms. The second was at seventy five and the third and fourth were down in the blue water one hundred and one hundred and twenty-five fathoms. Activity-related collocation The study of Martin (1992), which presents a redefinition of Halliday and Hasan’s collocation category, divides these relations into two: nuclear (extending and enhancing) and activity sequence relations. Let us therefore concentrate on what Martin (1992) calls nuclear relations, which reflect the ways in which "actions, people, places, things and qualities configure as activities". As an example of such relations Martin mentions, among others, serve — ace. It appears that in the present material as well we can find pairs such as cyphers — decode or meals—or driving— the same car in which the relation between the items is based on an activity: you can decode cyphers, eat meals and drive cars. In classifying such items, it may thus be helpful to think of their association as resulting from such a relation. The category will consequently be called activity-related collocation mive and nachinish in the next sentences from the Patient Stone are in such a relation. Dokhtare balegh mesle mive-ye reside immune, age nachinish khodesh legh mishe miofte va dige bedarde sahib nemikhore. The following example contains such a relation between cyphers — decode. C: well I expect you don't need cyphers during if by that you mean people who e: people who can decode yeah Elaborative collocation There are other items between which an association exists but which cannot be grouped as ordered set or activity-related collocation. Consider the following example quoted from Tanskanen (2006). ... at the beginning of the Michaelmas term 1955, Sylvia's first year at Cambridge. I had walked into the Mill Lane lecture

ISSN 2039-9340 Mediterranean Journal of Social Sciences Vol. 3 (11) November 2012
574
room a few minutes early... The relation in the above example illustrates our third collocation category, elaborative category. This is a category for all those pairs whose relation is not possible to define more specifically than stating that the items can somehow be developed on the same topic. You should keep in mind that the relation between items is not completely haphazard. It is with elaborative collocation that the frame concept is introduced. Frames are knowledge structures evoked by lexical items: for example, if a text begins with arraignment, it evokes the arraignment frame, and following items, such as magistrate and charges are interpreted according to this frame, thus creating coherence in the text (Fillmore & Baker 2001). Considering the above example, we can say that Cambridge evokes the university frame, and the Mill Lane lecture room can be interpreted within this frame. Tanskanen (2006) said that a “trigger-test” can be helpful in verifying some elaborative relations. Trigger is a concept introduced by Jordan (1998). Jordan argued that a trigger, which is usually a repetition of the previous topic (item), can be used to clarify the association between an item and its re-entry. Let us consider our example in a slightly modified form: ... at the beginning of the Michaelmas term 1955, Sylvia's first year at Cambridge. I had walked into Cambridge's Mill Lane lecture room a few minutes early... If there was no relation between the items, the result with the trigger would hardly be so satisfying. So, “trigger-test” is of great importance for detecting this kind of collocation. Let us consider two examples which are selected from our representative Persian and English novels. Nevisandegi che honare naghesiye. This sentence has been selected from the Patient Stone. The relation between nevisandegi and honar can be considered as elaborative collocation due to the satisfying result of the trigger-test: honare nevisandegi The pale moon dipped in and out of strands of clouds so that Juana walked in darkness for a moment and in light the next. In the above sentence taken from The Pearl, moon and light are in elaborative collocation relation. 2. Method Two Persian and two English novels were selected as the main sources of data for this study. The selected Persian novels were The Blind Owl by Sadigh Hedayat and The Patient Stone by Sadigh Chubak which are among the most famous novels in modern Persian literature. The Old Man and the Sea by Ernest Hemingway and The Pearl by John Steinbeck were selected as representative novels which are of great reputation in contemporary English literature. Then a 1000-word excerpt was extracted from each novel. The selection of these four excerpts was completely random. Finally, types of lexical cohesion relations in each excerpt were detected according to the model of lexical analysis proposed by Tanskanen (2006) and their numbers were recorded. 3. Results and discussion In the present study, the number of lexical cohesive ties was manually detected based on the proposed model through the selected texts. This section concentrates on the variation found in the use of lexical cohesion relations in the selected texts of Persian and English novels and on the potential differences between reiteration and collocation. Quantitative information on the occurrences of pairs of reiteration and collocation in the novels is tabulated in table 1 to 4. Table 1. Pairs of reiteration and collocation (per 1000 words) in the Persian and English novels
Persian novels(mean) English novels (mean)
Reiteration 268 250 Collocation 22 14.5 Total 288 264.5

ISSN 2039-9340 Mediterranean Journal of Social Sciences Vol. 3 (11) November 2012
575
Table 2. Mean of pairs of reiteratio relations and collocation (per 1000 words) in the two selected Persian novels: The Blind Owl and The Patient Stone. Table 3. Pairs of reiteration and collocation relations (per 1000 words) in the two selected groups of Persian and English novels
The Blind Owl
The Patient Stone Mean
Simple repetition 182 164 173 Complex repetition 8 20 14 Substitution 25 51 38 Equivalence 19 5 12 Generalization 5 7 6 Specification 22 4 13 Co-specification 6 4 5 Contrast 7 7 7 Ordered-set 3 1 2 Activity-related collocation 6 5 5.5
Elaborative collocation 12 17 14.5
The numbers shown in the tables are normalized frequencies of the cohesive pairs occurring in the Persian and English novel texts. In other words, frequencies of cohesive pairs are normalized to a text of 1000 words extracted from each novel, showing how many times they would occur in a text of 1000 words. This makes it possible to compare frequencies of cohesive pairs in the selected texts in a reliable way. The numbers in the tables are therefore directly comparable, which facilitates comparing our findings.
Table 3 shows the number of different lexical relations in the 1000-word excerpts extracted from our two Persian novels: The Blind Owl and The Patient Stone. Table 4 is related to the 1000-word excerpts extracted from the English novels: The Old Man and the Sea, and The Pearl.
Let us start with the distributions of pairs of reiteration and collocation in the selected novels. As you can see, reiteration relations are more frequent both in Persian and English novels. There are 268 reiteration pairs (i.e., simple repetition, complex repetition, substitution, generalization, specification, equivalence, co-specification, contrast) in 1000-
Persian novels (mean)
English novels (mean)
Simple repetition 173 186 Complex repetition 14 8 Substitution 38 36 Equivalence 12 2 Generalization 6 1.5 Specification 13 8.5 Co-specification 5 2 Contrast 7 6 Ordered-set 2 1 Activity-related collocation 5.5 5
Elaborative collocation 14.5 8.5

ISSN 2039-9340 Mediterranean Journal of Social Sciences Vol. 3 (11) November 2012
576
word texts selected from Persian novels in average and 250 in selected texts of English novels. The average number of collocation pairs (Ordered-set, elaborative collocation, activity-related collocation) is 22 and 14.5, respectively in Persian and English novel texts. Table 4. Pairs of reiteration and collocation relations (per 1000 words) in the two selected English novels: The Old Man and the Sea and The Pearl
The Old Man and the Sea The Pearl Mean
Simple repetition 199 173 186 Complex repetition 6 10 8 Substitution 24 48 36 Equivalence 2 2 2 Generalization 2 1 1.5 Specification 9 8 8.5 Co-specification 3 1 2 Contrast 6 6 6 Ordered-set 0 2 1 Activity-related collocation 7 3 5
Elaborative collocation 7 9 8.5
The two novel groups thus seem to differ as regard to the total number of pairs; the difference is caused by the higher number of reiteration and also collocation pairs in Persian novel texts.
We can then move on to examine the distribution of cohesive pairs in more detail, i.e. per categories of reiteration and collocation.
The most frequent relations in both of the Persian and English novel groups are simple repetition relations. Substitution comes second in both Persian and English novel texts. The order of frequency with regard to the rest of the relations for the Persian novel texts is elaborative collocation, complex repetition, specification, equivalence, contrast, generalization, activity-related collocation, co-specification and ordered-set. The same order for English novel texts is elaborative collocation, specification, complex repetition, contrast, activity-related collocation, co-specification, equivalence, generalization and ordered-set.
Persian and English novel texts are closely similar with regard to the average number of simple repetition, substitution, contrast, ordered-set and activity-related collocation relation pairs. The most striking difference between these novels with regard to the average number of cohesive pairs is related to equivalence. The frequency of pairs in equivalence relation is much higher in Persian novel texts. The number of pairs having generalization relation is also much more in Persian novel texts. Specification relations are also less frequent in English novel texts compared to Persian novel texts. Complex repetition and co-specification relations are also more frequent in Persian novel texts compared to the similar texts in English. 4. Conclusion Cook (1989) believes one should know about cohesive ties and their stylistic role in discourse. Among the different types of cohesive devices, i.e. reference, substitution, ellipsis, conjunction, and lexical cohesion (Haliday and Hasan, 1976), lexical cohesion is of great importance and has different applications in translation studies, computational linguistics, information retrieval researches and teaching and learning issues. The cognitive structure of the reader of a text can be manipulated by various lexical cohesion strategies. It is the responsibility of the translator to be aware of these strategies and to reflect them in their translation. Creating summaries and also segmenting texts into thematically coherent units are mainly performed by the use of lexical cohesion. Lexical cohesion is also of great importance for language teachers, material developers and students. In this study, we focused on the lexical patterns in the texts of Persian and English novels. Two Persian and two English novels were selected as the main sources of data for this study. The selected Persian novels were The Blind Owl

ISSN 2039-9340 Mediterranean Journal of Social Sciences Vol. 3 (11) November 2012
577
by Sadigh Hedayat and The Patient Stone by Sadigh Chubak. The Old Man and the Sea by Ernest Hemingway and The Pearl by John Steinbeck were selected as representative novels which are of great reputation in contemporary English literature. Then a 1000-word excerpt was extracted from each novel. The number of lexical cohesive ties was manually detected based on the model proposed by Tanskanen (2006) through the selected texts. The focus was on the variation found in the use of lexical cohesion relations in the selected texts of Persian and English novels and on the potential differences between reiteration and collocation. Quantitative information on the occurrences of pairs of reiteration and collocation in the novels was provided.
The result of this study showed that the two novel groups seem to differ as regard to the total number of pairs; the difference is caused by the higher number of reiteration and also collocation pairs in Persian novel texts. The most frequent relations in both of the Persian and English novel groups are simple repetition relations. Substitution comes second in both Persian and English novel texts. The order of frequency with regard to the rest of the relations for the Persian novel texts is elaborative collocation, complex repetition, specification, equivalence, contrast, generalization, activity-related collocation, co-specification and ordered-set. The same order for English novel texts is elaborative collocation, specification, complex repetition, contrast, activity-related collocation, co-specification, equivalence, generalization and ordered-set.
Persian and English novel texts are closely similar with regard to the average number of simple repetition, substitution, contrast, ordered-set and activity-related collocation relation pairs. The most striking difference between these novels with regard to the average number of cohesive pairs is related to equivalence. The frequency of pairs in equivalence relation is much higher in Persian novel texts. The number of pairs having generalization relation is also much more in Persian novel texts. Specification relations are also less frequent in English novel texts compared to Persian novel texts. Complex repetition and co-specification relations are also more frequent in Persian novel texts compared to the similar texts in English.
References Behjat, F. (2009). Cohesive devices in English novels and their corresponding Persian translations. Journal of Teaching English as a
Foreign Language and Literature, 1(3), 107-118. Berber Sardinha, T. (1999). Looking at discourse in a corpus: The role of lexical cohesion. Proceedings of AILA 2000 on CD-ROM,
AILA - 12th World Congress of Applied Linguistics (pp. 7-13). Tokyo. Cook, G. (1989). Discourse. Oxford: Oxford University Press Dahl, T. (2000). Text Summarisation: From Human Activity to Computer Program. The Problem of Tacit Knowledge. Hermes, Journal of
Linguistics, 25, 113-131. Ercan, G. & Cicekli, I. (2008). Lexical cohesion based topic modeling for summarization. In Proceedings of the Cicling 2008, pp. 582–
592. Fillmore, C.J. & Baker, C.F. (2001). Frames and the semantics of understanding. Retrieved 12 October 2008, from
http://framenet.icsi.berkeley.edu/ Forutan, A. & Nasiri, S.R. (2011). Signaling Nouns in English and Persian: A Contrastive Study. Theory and Practice in Language
Studies, 1(10), 1273-1283 Gonzalez, M. (2011). Lexical cohesion in multiparty conversations. Language Sciences, 33(1), 167-179. Halliday, M.A.K. & Hasan, R. (1976). Cohesion in English. London: Longman Jordan, M.P. (1998). Pragmatic, stylistic and grammatical limitations on choice: a study of cause-effect signaling in English. In
A.Sanchez-Macarro & R.Carter (Eds), Linguistic Choice Across Genres: Variation in Spoken and Written English (pp.65-86). Amsterdam & Philadelphia: John Benjamins.
Lotfipour-Saedie, K. (1997). Lexical Cohesion and Translation Equivalence. Meta, XLII (I), 185-192. Martin, J.R. (1992). English Text: System and Structure. Amsterdam & Philadelphia: John Benjamins. McCarty, M. (1991). Discourse Analysis for Language Teachers. Cambridge University Press. Morris, J. & Hirst, G. (1991). “Lexical cohesion computed by thesaural relations as an indicator of the structure of text”. Computational
Linguistics, 17, 21-48. Newmark, P. (1987). The use of systemic linguistics in translation analysis and criticism. In Steele, R. & T. Thtreadgold (Eds), Language
Topics: Essays in Honour of Michael Halliday, 1, (pp. 293-303), Amsterdam/Philadelphia: John Benjamins. Salehuddin, K., Tan Kim, H. & Marlyna M. (2006). Definiteness and indefiniteness: a contrastive analysis of the use of determiners
between the Malay language and English. GEMA Online Journal of Language Studies, 6(1), 21-30. Shafiee, N.S. (2003). Grammatical Cohesion in English and Persian in Contrast. Retrieved 23 October 2008, from
http://www.kkhec.ac.ir/klf/shafiee.htm. Tanskanen, S.K. (2006). Collaborating towards Coherence. Amsterdam & Philadelphia: John Benjamins.


ISSN 2039-9340 Mediterranean Journal of Social Sciences Vol. 3 (11) November 2012
579
Waste Management and Enterprise Development in Slum
Communities of Ado-Ekiti, Nigeria
Abike Ibidunni Awosusi
Centre for the Built Environmental Studies, Ado-Ekiti, Ekiti State, Nigeria.
Olusegun Oriye
Department of Architecture, College of Environmental Sciences,
Joseph Ayo Babalola University, Ikeji-Arakeji, Osun State, Nigeria E-mail: [email protected]; Tel: +2348033929923
Julius Oluranti Owoeye
Department of Urban and Regional Planning, School of Environmental Technology,
Federal University of Technology, Akure; PMB 704, Akure Ondo State, Nigeria Corresponding Author: E-mail: [email protected]; Tel: +2348039179250
Doi:10.5901/mjss.2012.v3n11p579
Abstract: This research explores the development of business enterprises through waste management in slum areas of Ado-Ekiti. The problem of waste disposal is a major concern in these areas of the city, being the reference point in this research work. Dirty environment would have been kept clean if only people were made to embrace the business opportunities in Waste Management as it puts money in their pockets. Both primary and secondary sources of data collection were accessed to gather relevant information for the work. The sample frame used is the total number of housing units in the six selected slum areas of the city. The total number of housing units in the area was 7858 out of which 2.5%, amounting to 200 housing units was selected as sample size with the aid of systematic random sampling. Findings in the study revealed the nature of waste generated in the area, ranging from food (domestic), paper, plastic and metal wastes. It was discovered also from the findings that very few, just about 1.0% of the respondents separate their wastes while 99.0% do not. This explains why Waste Management business is not embraced on a larger scale in Ado-Ekiti, except for a very few that are involved in scavenging, collection and those who work directly with the company in charge of street sweeping in collaboration with the State Waste Management Board. However, the encouragement of people becomes necessary in the establishment of business ventures in Waste Management Enterprise, which this research work sought to contribute to economic development in Waste Management in Ado-Ekiti. Keywords: Waste management, business enterprise, development, slum communities, Ado-Ekiti. 1. Introduction One of the dreadful consequences of urbanization has been the problem of solid waste management, particularly in terms of the environmental nuisance combined with the health hazards implications (Onibokun and Kumuyi, 2000). Raised quality of life and high standards of living has had an unintended and negative impact on the urban environment far beyond the handling capacities of the Urban Governments and Agencies. Cities are grappling with the problem of high volume of wastes, the costs involved, the disposal technologies and methods and the impact of waste on the local and global environment. Change in the natural and human environment are largely due to some factors such as population growth, size and distribution, economic growth and industrial development, the quality, quantity and characteristics of waste generated. The world today is an urban world and it is anticipated that most of our future population increase will be absorbed by cities. The implications of population and settlement patterns in terms of demand on the physical environment and urban services are overwhelming. Sporadic refuse dumps and a breakdown in waste disposal arrangements are a few of the problems associated with arrangements of some Nigerian urban centers.

ISSN 2039-9340 Mediterranean Journal of Social Sciences Vol. 3 (11) November 2012
580
The disposal of solid waste materials, principally garbage and rubbish, is primarily an urban center problem. However, unlike liquid waste, sewage and industrial effluents disposal, the problem of solid waste has received only limited recognition. It is common practice in many metropolitan areas to overlook or ignore the consequences of waste disposal programmes. Many areas, particularly in developing countries still have inadequate plans for waste management; poorly controlled open dumps and illegal roadside dumping remain a pattern. The dumping spoils scenic resources, pollutes soil and is a high potential health hazard to plants, animals and people. The indiscriminate dumping of wastes and the failure of the collection system in a community as well as the result of improperly managed waste for two to three weeks soon causes many problems. These problems in cycle of environmental, social and public health effects include the followings, among others: 1.Proliferation of health infested animals like rats and rodents which can transmit typhoid fever, rabies and other infectious diseases. 2.Prolific breeding of cockroaches, flies and mosquitoes which can transfer diarrhea, gastroenteritis, malaria, yellow fever etc 3. Production of noxious and offensive odour as a result of ammonia, hydrogen supplied, amines and in-doles produced when organic wastes decompose anaerobically. 4. Pollution of air by smoke and smog especially where wastes are burnt openly as practiced in West African countries. 5.Clogging of waterways when refuse is dumped indiscriminately along the water course and river banks leading to floods with destructive consequences; 6. Obstruction of free-flow of traffic when refuse is disposed onto motor ways. 7. Contamination of ground water with open dumps, unsanitary landfills which have not been properly constructed and their lactates (Onibokun and Kumuyi, 2000). These problems, if allowed to persist, could lead to epidemics and associated social problems. Therefore, there is an urgent need to address this problem in a sustainable way. All these problems call for immediate attention for cities to find solutions that would involve both communities and the private sectors to embrace innovative technologies and methods of waste disposal by involving behavioural change and awareness. There is a clear need for the approach of waste disposal to move more towards waste processing and waste recycling (turning waste to wealth) instead of the current approach which involves the use of high energy technology. Wastes can be turned into wealth; refuse can become resources while trash is changed for cash. There is definitely an urgent need for the current approach of waste disposal that is focused on landfills and dumpsites to move more towards waste processing and waste recycling which would involve public-private partnership aimed at eventual waste minimization. Some criteria for future waste minimization programmes will include deeper public participation, understanding economic benefits and recovery of wastes, minimizing environmental impacts, reconciling investment costs with long term goals. This therefore become the main focus of this research. 2. Statement of Research Problem By way of definition, waste is seen as any substance or object arising from human or animal activities, that has to be discarded as useless or unwanted (Ajibewa, 1995). This means that waste is heterogeneous in nature and may originate from people, homes, the market place, offices and industrial activities. The population of Ado-Ekiti sporadically increased upon the creation of Ekiti State in 1996 from 156,122 to 176,090 in year 2000 (NPC, 1991 and 1996). Ado-Ekiti being the state capital witnessed a great influx of people thereafter; this in turn increased the volume of wastes generated from durable goods, construction materials, organic matters, wastes from street vendors etc. As traffic congestion increased over the years in the city, it became more difficult for the State Environmental Protection Agency (SEPA) to transport wastes for disposal due to traffic jam and so fewer areas were covered daily. The rate at which solid wastes interfered with other elements of city infrastructure has also increased when garbage blocks drains, canals, rivers, gullies and the roads. It has been estimated that up to 50% of residents in low and middle income countries do not receive waste collection services (Parizeau et al, 2008). Like in most cases, the poor squatters receive no or little collection service mostly because they are usually inaccessible to the transportation vehicles used by the solid waste department. Also, these areas are usually overlooked and so no attention is given to them in the area of waste management. Like in most cities, the poor squatter receive no or little collection service mostly because they are usually inaccessible to the transportation vehicles used by the solid waste departments. These areas are equally overlooked with no attention given to them to evacuate their wastes. The need for this research is to address how enterprise can be developed from the slum communities of Ado-Ekiti through waste management endeavours. In this town, poorly controlled open dumps and illegal roadside dumping still remains a pattern which spoils scenic resources, pollutes soil and is a high potential health hazard to plants, animals and

ISSN 2039-9340 Mediterranean Journal of Social Sciences Vol. 3 (11) November 2012
581
even people. The usual practice is for these wastes to be burned or carried from roadsides to be disposed-off at landfills located at the towns’ outskirts. There is the need for private individuals to tap into the profit making advantage presented by the waste management process. Until now, the only form of enterprise in waste management process in Ado town is from the scavengers. Governmental bodies, particularly the State Environmental Protection Agency and the Waste Management Board are fully responsible for waste management in the city which their effort is grossly inadequate. This study therefore aims at encouraging the development of firms, private individuals, organizations that would be involved in effective and efficient waste management in such a way that it will generate employment in the study area. 3. The Study Area The study area is Ado-Ekiti, the capital of Ekiti State. It is located within the North-Western Part of Benin-Owena River Basin Development Area. The population of Ado-Ekiti region is put at 176,090 by the 1991 census with a density of 310 persons per square kilometer. According to Orubuloye (1993), 48.9 percent of the populations within the urban areas are male while 51.1% are female. The slum communities used in this study include Oke-Ila,Odo-Ado, Ile-Ibiye, Atikankan, Irona, Isato. Figures 1, 2 and 3 show the location of the study area. These areas are inhabited by indigenous people of Ado-Ekiti and are usually inaccessible to transportation because of bad roads; therefore waste carts/vehicles find it difficult to collect their wastes. Their housing structures are poor in nature; they are the low income earners. The area can generally be described as slum communities whose characteristics are similar to the definition above. Figure 1: Ekiti State in the National Setting
Source: Ekiti State Ministry of Physical Planning, Ado-Ekiti; 2011

ISSN 2039-9340 Mediterranean Journal of Social Sciences Vol. 3 (11) November 2012
582
Figure 2: Map of Ekiti State showing Ado Lacal Government Area
Source: Ekiti State Ministry of Physical Planning, Ado-Ekiti; 2011 Figure 3: Map of Ado-Ekiti showing the Location of Slum communities (The Study Area)
Source: Ekiti State Ministry of physical Planning, Ado-Ekiti; 2011

ISSN 2039-9340 Mediterranean Journal of Social Sciences Vol. 3 (11) November 2012
583
The volume of waste generation in Ado-Ekiti has increased drastically from about 95tons per day to 120tons per day since the creation of the State in 1996 (ESWMB, 2011). This is due to the influx of people into the town which has greatly increased the population of people in the town. The increased population has led to an increase in the generation of wastes. These wastes are not properly disposed-off in the different communities of the town. Most of the wastes are dumped by roadsides; some are dropped in water channels, littering the whole environment. The agencies involved in the collection and disposal of these wastes are not efficiently capable of handling the volume of wastes being generated. This usually makes the environment look littered and dirty. There is therefore the need to sensitize and encourage the involvement of the private sector in managing those wastes in all the processes involved as a means of developing enterprise. 4. Conceptual Underpinning The Zero Waste and 3R Concept Zero Waste is a philosophy that encourages the redesign of resource life cycle so that all products are reused. According to Wikipedia (2010) any trash sent to landfills is minimal. The process recommended is one similar to the way that resources are reused in nature. In industry, this process involves creating commodities out of traditional waste products; essentially making old input new inputs for similar or different industrial sectors. An example might be the cycle of a glass to milk bottle. The primary impact (or resource) is silica-sand, which is formed into glass and then into a bottle. The bottle is filled with milk and distributed to consumers. At this point, normal waste methods would see the bottle disposed in a landfill or similar waste dump. Zero waste can represent an economic alternative to waste systems where new resources are continually refined to replenish wasted raw material. It can also represent an environmental alternative to waste since waste represents a significant amount of pollution in the world. Zero waste is therefore the ultimate aim of waste valorization. In achieving Zero Waste status, the 3R concept is crucially termed the Waste Disposal Hierarchy, i.e. Reduce, Reuse and Recycle The Notion of the Zero Waste City Concept Cities are over-consuming and per capita waste generation is relatively higher in high consuming cities compared to low-consuming cities. The concept of the ‘Zero Waste City’ includes a 100 per cent recycling rate and recovery of all resources from waste materials. Cities attract people because of the socio-economic activities and quality of life offered to their inhabitants. However, inadequate urban management, often based on inaccurate perceptions and information, can turn opportunity into disaster (UNFPA, 2007). Cities are not only over-populated and over-consuming in nature but also deplete global finite natural resources at a high rate. There is a positive relationship between urbanization and poverty (UN-HABITAT, 2008) and the relationship indicates that expanding cities in a sustainable manner is an important factor for global sustainability. How to redesign the existing systems, how to design new products for consumption systems and how to design new scenarios for quality of life are now major questions for planners or researchers (Vezzoli and Manzini, 2008). 5. Research Methodology To achieve the goal of this study, data were obtained from both primary and secondary sources with the aid of questionnaire administration, direct observation and in-depth interviews as well as housing demographic survey. The study focused on waste management; the perception of slum residents on waste management business development and the effectiveness of waste management service providers in the state in general. The sample frame for this research work is the total number of housing units in the six slum areas involved. The total number of housing units counted in the 6 selected slum areas is 7858 (which become our target population). Atikankan had 1411 houses, Irona 1361 houses, Isato 1201 houses, Ile-Abiye 1024 houses, Oke-Ila 1556 houses while Odo-Ado had 1305 houses,. The sample size taken for this study was 2.5% of the total housing units in the area, totaling 197 houses in all. Systematic Random Sampling was used to select one out of every 40 houses on street-to-street basis. Meanwhile, purposive sampling method was used to elicit information from the principal officers of Ekiti State Environmental Protection Agency with the aid of interview guides.

ISSN 2039-9340 Mediterranean Journal of Social Sciences Vol. 3 (11) November 2012
584
6. Research Findings and Discussion Findings in this study are discussed under various sub-headings 6.1 Nature of Waste Generated The study examined waste management situations in the slum areas of Ado-Ekiti. Wastes are generated from different households in the communities. The nature of solid wastes generated according to the respondents, as shown in Table 1, ranges from food waste (53.3%), paper (17.3%), plastic (8.6%) and metals (9.1%). It was discovered that very few, just about 1.0% of the total respondents sort their waste while 99.0% do not, because they see no reason doing so, or due to lack of knowledge about waste separation. Some even see it as a waste of time to sort waste. This explains why waste management business is not embraced on a larger scale in the city, except for a very few that are involved in scavenging and those who work directly with the company in charge of street sweeping. Table 1: Nature of Waste Generated
Nature of Waste Generated Frequency Percent Food waste 105 53.3
Paper 34 17.3 Plastic 17 8.6 Metals 18 9.1 Food waste, Paper, Plastic and Metals 23 11.7
Total 197 100.0 Source: Authors’ Field Survey, 2011 Plate 1. Illegal Dumpsites at Oke Ila and Ile-Abiye Communities respectively
Source: Author’s Field Survey, 2011.

ISSN 2039-9340 Mediterranean Journal of Social Sciences Vol. 3 (11) November 2012
585
6.2 Methods of Waste Disposal Table 2 revealed the methods of waste disposal in the study area, 32.0% of the respondents dispose of their waste through the waste management board, 36.5% through cart pushers, burning accounted for 3.6%, dumping in open space pulled 26.9% and those that use both the cart pushers and dumping in open space is put at 1.0%, it can be deduced here that there is the need for effective waste disposal through the Waste Management Board in order to avoid indiscriminate waste disposal methods like burning and dumping in open spaces so as to ensure a cleaner and healthier environment. See also Plates 1a and 1b. Table 2: Methods of Waste Disposal
Methods of Waste Disposal Frequency Percent Through Waste Management Board 63 32.0
Cart Pushers 72 36.5 Burning 7 3.6 Dumping in Open Space 53 26.9 Cart Pushers and Dumping in Open Space 2 1.0
Total 197 100.0 Source: Authors’ Field Survey, 2011 Plate 2a: Water Channel Littered with Waste in Ile-Abiye Area
Source: Authors’ Field Survey 2011. Plate 2b: Ekiti State Waste Management Truck at work in Atikankan Community
Source: Authors’ Field Survey, 2011.

ISSN 2039-9340 Mediterranean Journal of Social Sciences Vol. 3 (11) November 2012
586
6.3 Business Opportunity in Solid Waste Enterprise The waste management businesses identified by this study are scavenging since collection of waste is the sole responsibility of the State Waste Management Board which it offers to the communities free of charge. Other business identified is the sweeping of the streets contracted by the state government to a company. The research also found out that people still employ unacceptable methods of refuse disposal like burning (3.6%) and dumping in open spaces (26.9%) despite the free service delivery of the Waste Management Board and the outcome of this action is the emergence of a dirty and unhygienic environment which could make the environment prone to sickness and diseases. Besides, 37.1% of the respondents complained that the service of the Waste Management Board was not very effective and suggested the need for private firms to take up the responsibility while the State Waste Management Board coordinates or oversees their operations. About 71.6% of the respondents expressed their willingness to patronize and pay the private firms for service rendered, thereby taking care of the shortfalls from the Waste Management Board and private firms who will have to employ more people into their work force. Over 70.0% of the respondents interviewed claimed to be aware of business opportunities in waste management while less than 25.0% would be willing to engage in waste business. Various businesses identified by respondents are scavenging (21.3%), sale of sacks and bottles from waste items (20.8%), fertilizer making from waste (9.1%) and conversion of excess sachet of water to resourceful products (21.3%). This well illustrated in Table 3 below. Table 3: Various Opportunities in Solid Waste Business
Business Opportunities Frequency Percentage No idea Scavenging Buying of sacks and bottles Fertilizer None Conversion excess sachet water to resourceful products
37 42 41 18 17 42
18.8 21.3 20.8 9.1 8.6 21.3
Total 197 100 Source: Authors’ Field Survey, 2011 6.4 Frequency of Waste Disposal Table 4 shows the frequency of waste disposal by respondents in the study area, the respondents that confirmed once in a week accounted for 10.2%, 6.1% said they dispose their waste twice a week, 17.3 thrice and 66.5% dispose of their waste more than three times a week. Based on the presentation in the table, there is need for Ekiti State Waste Management Board to put in place effective waste management to take care of the frequent waste generation in the study area for effective and efficient waste disposal in the study area. Table 4: Frequency of Waste Disposal
Frequency of Waste Disposal Frequency Percent Once 20 10.2 Twice 12 6.1 Thrice 34 17.3 More than three times 131 66.5 Total 197 100.0
Source: Authors’ Field Survey, 2011 6.5 Agencies Responsible for the Collection of Solid Waste in the Communities Table 5 displayed the agencies responsible for the collection of solid waste in the community, 26.9% claimed that they are personally responsible for collection of solid waste, 36.0% said the Waste Management Board is responsible for

ISSN 2039-9340 Mediterranean Journal of Social Sciences Vol. 3 (11) November 2012
587
waste collection, 6.6% for local government and cart pushers accounted for 30.5%.Looking at the involvement of the Waste Management Board at 36% shows that more has to be done by the Waste Management Board in order to withdraw the activities of individuals that dump wastes on illegal sites and road sides. Table 5: Agency Responsible for the Collection of Solid Waste in the Communities
Agency Responsible for the Collection Frequency Percent Self Waste Management Board Local Government Cart Pushers
53 71 13 60
26.9 36.0 6.6 30.5
Total 197 100.0 Source: Authors’ Field Survey, 2011 6.6 Problems hindering effective Waste Management in Slum Areas of Ado-Ekiti This research work revealed the problems hindering effective waste management in slum areas as it has been shown in Table 6; 19.8% identified one of the problems to be lack of environmental awareness, 2.5% pointed out the irregular waste collection system, 24.4% attributed it to the lack of monitoring group, 21.3% for lack of public participation and 32% identified the combination of all the problems already mentioned above. Table 6: Problems hindering effective Waste Management in Slum Areas of Ado-Ekiti
Problems Frequency Percent Lack of environmental awareness 39 19.8 Irregular waste collection system 5 2.5 Lack of monitoring group 48 24.4 Lack of public participation 42 21.3 All of the above 63 32.0 Total 197 100.0
Source: Authors’ Field Survey, 2011 When investigating into the problems hindering waste management and business development in the area; various responses have been associated with lack of environmental awareness, lack of awareness or knowledge about the prospects and values in waste management business, irregular waste collection on the part of the State Waste Management Board, insufficient/lack of information on business to establish in waste management, lack of public participation, and lack of monitoring group among others. Meanwhile, suggestions were made on how to improve solid waste management in Ekiti State, the suggestions range from education and awareness of the people 21.8%, bring more bins nearer to the people 26.4%, 17.3% said government should concentrate on those areas that are capable of making people generate income in waste management and encourage people to participate, 6.1% suggested that government should take waste management serious, 12.7% said there should be monitoring groups, 9.1% suggested that the government bring more vans nearer them for better waste disposal. The opinion of the people on whether or not they want private firms to take up the responsibility of waste management in the state was investigated, it was revealed that 70.6% of the respondents suggested that private firms should come in while 29.4% opposed. It can therefore be concluded based on the responses of the respondents that private participation in waste management is a good compliment to the efforts of the existing State Waste Management Board. In attempt to further know the willingness of the respondents to see private companies taking up the responsibility of waste management in the State, the view of the respondents sampled showed that 71.6% are willing to patronize the private companies while 28.4% did not respond to the commitment of patronage of the private companies who may be involved in waste management. Various advantages in waste management were suggested based on the knowledge of the respondents on waste management business. About 18.8% suggest fertilizer as one of the values in waste management, 5.6% said other products like tissue paper, 21.3% identified recycling of waste as one of the values,6.6% said metallic waste can be used for nails, 5.1% opined that

ISSN 2039-9340 Mediterranean Journal of Social Sciences Vol. 3 (11) November 2012
588
manure can be used as candle for further production while 6.1% and 25.9% respectively claim no idea and that there is no value in waste management. 6.7 Benefits of Business Development in Waste Management The benefits of business development in waste management are discussed based on the opinion of respondents in Table 7; 22.8% identified employment opportunities as a benefit, 40.6% said it is a viable source of income, while 12.2% see the benefits in terms of a cleaner and healthier environment, meanwhile, a section of the population sampled covering 11.7% identified the combination of all benefits already mentioned above. Table 7: Benefits of Business Development in Waste Management Source: Authors’ Field Survey, 2011 Plate 3: Solid Waste waiting to be transported from Ado-Ekiti to a Recycling Plant in Lagos for Further Transformation Process
Source: Authors’ Field Survey, 2011 6.8 Waste Management Business Activities Engaged in by People in the Study Area In order to know the various business opportunities engaged in by the people in the study area, this research made further enquiries from the respondents. About 34.0% respondents said that people engage in scavenging and cart pushing, 29.4% said people buy metals, cement sacks and bottles while 16.2% respondents identified regular sweeping of roads. This situation therefore suggests the need to explore waste management and develop more businesses that people can engage in. it was further revealed that there were no private waste collectors, recyclers and compost makers in the study area. This makes it the possible areas where business opportunities can be established if people were enlightened about its viability. However, there were 18 scavengers found in active waste management business when this survey was carried out, 72 Cart Pushers while 41 people engage in the selling of recyclables. There were 700
The Benefits Frequency Percentage Employment 45 22.8 Source of income 80 40.6 Cleaner and healthy environment 24 12.2 All the above 23 11.7 Do not know 25 12.7 Total 197 100.0
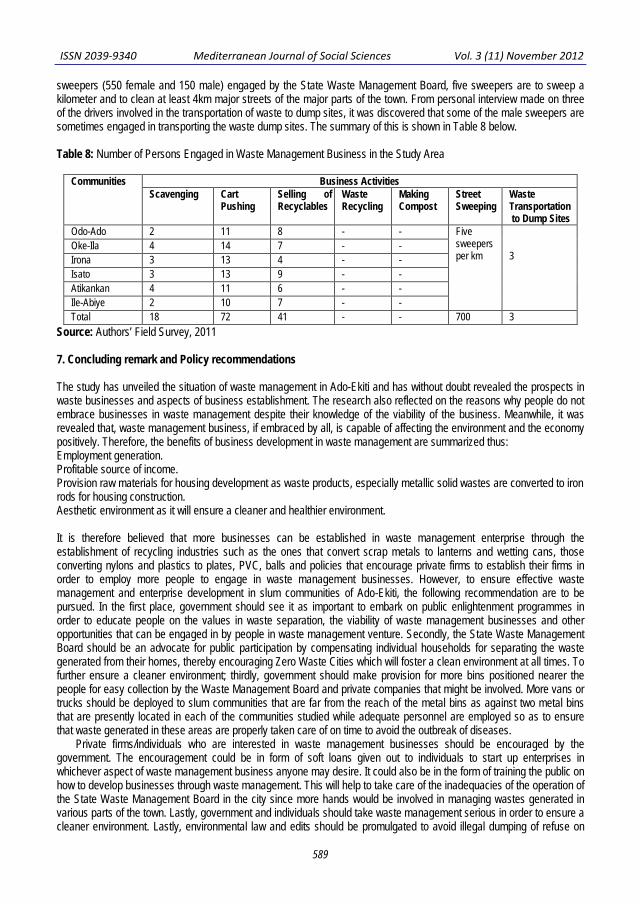
ISSN 2039-9340 Mediterranean Journal of Social Sciences Vol. 3 (11) November 2012
589
sweepers (550 female and 150 male) engaged by the State Waste Management Board, five sweepers are to sweep a kilometer and to clean at least 4km major streets of the major parts of the town. From personal interview made on three of the drivers involved in the transportation of waste to dump sites, it was discovered that some of the male sweepers are sometimes engaged in transporting the waste dump sites. The summary of this is shown in Table 8 below. Table 8: Number of Persons Engaged in Waste Management Business in the Study Area
Communities Business Activities Scavenging Cart
Pushing Selling of Recyclables
Waste Recycling
Making Compost
Street Sweeping
Waste Transportation to Dump Sites
Odo-Ado 2 11 8 - - Five sweepers per km
3
Oke-Ila 4 14 7 - - Irona 3 13 4 - - Isato 3 13 9 - - Atikankan 4 11 6 - - Ile-Abiye 2 10 7 - - Total 18 72 41 - - 700 3
Source: Authors’ Field Survey, 2011 7. Concluding remark and Policy recommendations The study has unveiled the situation of waste management in Ado-Ekiti and has without doubt revealed the prospects in waste businesses and aspects of business establishment. The research also reflected on the reasons why people do not embrace businesses in waste management despite their knowledge of the viability of the business. Meanwhile, it was revealed that, waste management business, if embraced by all, is capable of affecting the environment and the economy positively. Therefore, the benefits of business development in waste management are summarized thus: Employment generation. Profitable source of income. Provision raw materials for housing development as waste products, especially metallic solid wastes are converted to iron rods for housing construction. Aesthetic environment as it will ensure a cleaner and healthier environment. It is therefore believed that more businesses can be established in waste management enterprise through the establishment of recycling industries such as the ones that convert scrap metals to lanterns and wetting cans, those converting nylons and plastics to plates, PVC, balls and policies that encourage private firms to establish their firms in order to employ more people to engage in waste management businesses. However, to ensure effective waste management and enterprise development in slum communities of Ado-Ekiti, the following recommendation are to be pursued. In the first place, government should see it as important to embark on public enlightenment programmes in order to educate people on the values in waste separation, the viability of waste management businesses and other opportunities that can be engaged in by people in waste management venture. Secondly, the State Waste Management Board should be an advocate for public participation by compensating individual households for separating the waste generated from their homes, thereby encouraging Zero Waste Cities which will foster a clean environment at all times. To further ensure a cleaner environment; thirdly, government should make provision for more bins positioned nearer the people for easy collection by the Waste Management Board and private companies that might be involved. More vans or trucks should be deployed to slum communities that are far from the reach of the metal bins as against two metal bins that are presently located in each of the communities studied while adequate personnel are employed so as to ensure that waste generated in these areas are properly taken care of on time to avoid the outbreak of diseases. Private firms/individuals who are interested in waste management businesses should be encouraged by the government. The encouragement could be in form of soft loans given out to individuals to start up enterprises in whichever aspect of waste management business anyone may desire. It could also be in the form of training the public on how to develop businesses through waste management. This will help to take care of the inadequacies of the operation of the State Waste Management Board in the city since more hands would be involved in managing wastes generated in various parts of the town. Lastly, government and individuals should take waste management serious in order to ensure a cleaner environment. Lastly, environmental law and edits should be promulgated to avoid illegal dumping of refuse on

ISSN 2039-9340 Mediterranean Journal of Social Sciences Vol. 3 (11) November 2012
590
illegal sites. This should be sustained by the establishment of a monitoring group to punish defaulters. Although effective and enforceable environmental policies are difficult to develop and implement in many sub-Saharan countries including Nigeria, but this appear to be a viable solution if a country must be environmentally secured. In this wise, the re-introduction of the old sanitary inspectors is strongly recommended as a sustainable strategy for any environmental law that would be introduced to be efficient implemented in the area.
References Ajibewa, T.S. (1995): Public Participation in Solid Waste Management: A case study of Ibadan Markets. An Unpublished Dissertation
Submitted to the Department Urban and Regional Planning, University of Ibadan, Nigeria. Aledare, Kayode and Adeleke, Adetunji (2007): ‘An Overview of Solid Waste Scavenging in Lagos Metropolis’; in Journal for Sustainable
Development, Urban and Regional Planning Department, Yaba College of Technology, Lagos; 1(2):8-14. Bartone, C.J, Bernstein, J. and Wright, F. (1990): Investment in Solid Waste Management: Opportunities for Environmental
Improvement. Urban Development, Infrastructure and Urban Development Department, the World Bank, Washington D.C, USA: 1-85.
Collins, J.N. and Downes, B.T. (1977): The Effects of Size of the Provision of Public Services: The Case of Solid Wastes Collection in Smaller Cities. Urban Affairs Quarterly; 12:333-347
Dare Bejide, (2010): Ekiti State Official Gazette. Davinson, G. (1972): Residential Solid Waste Generation in Low Income Areas. United States Environmental Protection Agency,
Washington D.C Deakins, D. and Freel, M. (2009): Entrepreneurship and Small Firm. (5th Ed.), McGraw-Hill, New York. Mabogunje, A.L. (1968): Urbanization in Nigeria; London University Press, London. Ekiti State Ministry of Environment (2011): Guidelines on Waste Management Operation in Ekiti State. Okpala, D.C.I. (1986): Institutional Problems in the Management of Nigeria Urban Environment; NISER Monograph Series No 15;
NISER, Ibadan. Onibokun, A.G and Kumuyi, A.J (2000): Governance and Waste Management in Nigeria: The Case of Ibadan in Onibokun, A.G (Ed):
Governance and Waste Management in Africa- A Comparative Perspective; Ibadan CASSAD: 53-101. Parizeau. K.V. Maclaren and Lay Chantly (2008): Waste characterization as an Element of Waste Management Planning: Lessons
Learned from a Study in Siem Reap, Cambodia, Resources Conservation and Recycling; 49(20):110-128. Punch News Paper, 5 Feb. (2008): netserveafrica.com, retrieve on 01/05/2008 UNFPA (2007): State of world population 2007: Unleashing the Potential of Urban Growth, New York. UN-HABITAT (2008): State of the World’s Cities 2010/2011: Bridging the Urban Divide (1st edition); Earth Scan, London. Vessoli, C and Manzini, E (2008): Design for Environmental Sustainability, Springer-Verlag London Limited, London. Wahab, B. (1998): Environmental Education: A Panacea to Land degradation in Lagos, Nigeria in Journal for Sustainable Development;
1(2):137-146. Wikipedia, (2010): Retrieved from: http//en.wikipedia.org./wiki/entrepreneur; 01/06/2010. Wikipedia, (2010): Retrieved from http//en.wikipedia.org./wiki/waste minimization; 24/05/2010

ISSN 2039-9340 Mediterranean Journal of Social Sciences Vol. 3 (11) November 2012
591
Causal Relationship Model of Water Conservation Behavior
Chalermsak Udonboon
Department of Environmental Education
Faculty of Environment and Resource Studies Mahasarakham University, Mahasarakham 44150, Thailand
Nongnapas Thiengkamol
Major Advisor, Department of Environmental Education
Faculty of Environment and Resource Studies Mahasarakham University, Mahasarakham 44150, Thailand
Chatchai Thiengkamol
Co- Advisor, Director of Research In Motion Co., Ltd.
Bangkok 10900, Thailand
Doi:10.5901/mjss.2012.v3n11p591
Abstract: The populations were 18,463 upper secondary school students from school under Secondary Service Area Office 24 (Kalasin), Northeastern region of Thailand in academic year of 2012. The with Multi-stage random sampling technique was employed to collect the sample for 400 upper secondary school students. The research instrument was the questionnaire and it was used for data collecting. LISREL was used for model verification. The objective of this study was to develop a causal relationship model of water conservation behavior of upper secondary school student. Considering on structural model confirmatory factors of Psychological Trait (PsT), Psychological State (PsS), Environmental Knowledge (EK) and Environmental Education (EE) were able to explain the variation of endogenous factors of Inspiration of Public Consciousness (INS) to caused Water Conservation Behaviors (BEH) with 60.00 percents. As a result, the equation 1 can be written as following. BEH = 0.96*INS + 0.28*EK + 0.052*PsS - 0.14*PsT - 0.11*EE ……….…(1) R2 = 0.60 Equation (1) factors that had the most effect to Water Conservation Behaviors (BEH) was Inspiration of Public Consciousness (INS) and subsequences were Environmental Knowledge (EK) and Psychological State (PsS) but Psychological Trait (PsT) and Environmental Education (EE) with negative direction, these were able to explained the variation of Water Conservation Behaviors (BEH)with 60.00 percents. Moreover, confirmatory factors of Psychological Trait (PsT), Psychological State (PsS), Environmental Knowledge (EK) and Environmental Education (EE) were able to explain the variation of confirmatory factors of Inspiration of Public Consciousness (INS with 86.00 percents. Therefore, the equation can be written as following equation 2. INS = 0.79*EE +0.25*PsT - 0.21*PsS - 0.17*EK ……………………….(2) R2 = 0.86 Equation (2) factors that had the most effect to Inspiration of Public Consciousness (INS) was Environmental Education (EE) and subsequences were Psychological Trait (PsT) but Psychological State (PsS) and Environmental Knowledge (EK) with negative direction, these were able to explained the variation of Inspiration of Public Consciousness (INS) with 86.00 percents Key Words: Causal Relationship Model/ Water Conservation /Environmental Education / Inspiration of Public Consciousness 1. Introduction The Intergovernmental Panel on Climate Change (IPCC) observed on impacts of climate change and revealed the new obvious evidences that during five decades. The human activities were most important effect of global temperature rising over all area of the world at average of 1.4-5.8 Celsius degrees. The change of climate has been vigorous and more frequently. The obvious examples of climate change are violent drought, storming, flooding, hurricane, tornado, and earth quake. It has caused tremendously loss of million species of living things due to lost habitats and ecological imbalance including occurring acidity of sea water and changing of ocean currents, therefore, the small glacial age has occurred in

ISSN 2039-9340 Mediterranean Journal of Social Sciences Vol. 3 (11) November 2012
592
European continent and fluctuation of climate in different areas (IPCC, 2012, The Royal Society, 2005, &Sutayasue, 2010).
The risen of global temperature has affected to the ecological system obviously. Such as the rain is not raining according to periodic time and the amount of rain changes, the major change has been caused by deforestation, particularly in the tropical rain forest areas in Asia and Africa continents. Besides the global warming has loosen biodiversity of ecological system, the sea level and temperature in the sea has risen but it also impacted to ecological system of sea shore. Current sea level rise potentially impacts human populations such as those living in coastal regions and on islands and the wider natural environment such as marine ecosystems (Bindoff et al, 2007, & Fischlin, 2011).
Global average sea level rose at an average rate of around 1.8 mm per year over 1961 to 2003 and at an average rate of about 3.1 mm per year from 1993 to 2003. It is unclear whether or not the increased rate observed between 1993 and 2003 reflects an increase in the underlying long-term trend (Dahlman, 2009). However, Sea level rise is one of numerous lines of proof that strongly support the view that the climate has recently warmed (Solomon et al, 2007 & Hegerl et al, 2007). This also has caused the coral bleaching, therefore it has taken long time for recovering, and then it impacted to fishery and tourism industry. For health aspect, the climate change of temperature and humidity have caused the rapid growth of mosquito and increased the vector of malaria and dengue fever infection.
Moreover, the reports of natural disasters covering volcano eruptions, earthquakes, Tsunamis, various kinds of storms including tornadoes, thunderstorms, floods, droughts, fires, landslides and mudslides, blizzard and avalanches, and human epidemics and animal diseases have occurred more frequently. The opinions of scientists over the world are congruent that the green house gases are the essential factors of these phenomena of global warming and it is cause of these natural disasters (Kotchasenee, 2010, & Bicknell, et al., Eds. 2009).
The vast majority of the Earth’s water resources are salt water, with only 2.5% being fresh water. Approximately 70% of the fresh water available on the planet is frozen in the icecaps of Antarctica and Greenland leaving the remaining 30% (equal to only 0.7% of total water resources worldwide) available for consumption. From this remaining 0.7%, roughly 87% is allocated to agricultural purposes. These statistics are particularly illustrative of the drastic problem of water scarcity facing the world. Water scarcity is defined as per capita supplies less than 1700 m3/year (IPCC 2012).
Water scarcity is expected to become an escalating problem in the future, for diverse reasons. First, the distribution of precipitation in space and time is very irregular, leading to fabulous temporal unpredictability in water resources worldwide (Oki, & Kanae., 2006). For example, the Atacama Desert in Chile, the driest place on earth, receives undetectable annual quantities of rainfall each year. On the other hand, Mawsynram, Assam, India receives over 450 inches annually. If all the freshwater on the planet were divided equally among the global population, there would be 5,000 to 6,000 Cubic meter of water available for everyone, every year (Vorosmarty, et al, 2000).
Influencing of global warming to Thailand, even though, the climate change is not extremely affected to the agricultural sectors at over all view because most of the agricultural areas are supported by irrigation system but Thailand frequently affected by the floods almost every year, particularly, this year Thai people are facing with violent flood over the country.
The Northeastern region is the driest region of the country; therefore it has a chance of water shortage in summer season for food and vegetable cultivation. The shortage of water influenced to economic and social aspects as well. Furthermore, it also impacted to water resources, especially; the river, canal, swamp, and pond would be dried in the summer season. This will affected to the breeding and growth of water plants and animals such as fish, crab, and shrimp. Therefore, the number and diversity of living things will decrease and results in decrement of biodiversity and florist in Great Mekong Region in the Northeastern region of Thailand (Thiengkamol, 2005b).
Nevertheless, if climate change is still going on, Thailand might face with flood in some part of country and drought in some area such as Northeastern region. Therefore, the natural disasters will be repeated occurring every year. It was revealed that there are various areas will face to floods, landslides and mudslides covering 12 provinces included Chiang Rai, Chiang Mai, Nakhon Sawan, Pa Yao, Pichit, Pitsanulok, Lumpoon, Sukhothai, Chanthaburi, Nakhon Nayok, Prajeenburi, and Trang. Moreover, the villages nearby Cha Phraya River, the main river of country, are also affected. For drought, it is accumulated the vigorous water increment, it was found that 34 percents of villages over the country have faced with risk of water shortage, and drought, particularly, Northeastern region is in the high risk of drought (Office of Natural Resources and Environmental Policy and Planning, 2009). The estimation of water demand of whole country is 57,302.8 million cubic meters per year. For only agricultural sector has water demand of 51,786.2 million cubic meters or 90 percents per year. It forecasted that the total water shortage over the country will be approximately 4,737 million cubic meters per year (Office of Natural Resources and Environmental Policy and Planning, 2009).
From the above, it can be concluded that every region of Thailand will face with water problems in both quantity and quality. Presently, the demand of water consumption has increased in all sectors whether agriculture, industry, and household consumption but the quantity and quality of water is decreased because of water resources were

ISSN 2039-9340 Mediterranean Journal of Social Sciences Vol. 3 (11) November 2012
593
contaminated with toxic substances that drained from community, factory and agriculture (Thiengkamol, 2009c).The great problems of degradation of water resources and water shortage as mentioned above, different findings showed that the people are lacking knowledge and understanding, awareness, positive attitude, public consciousness and responsibility for natural resources and environment conservation such as look after water resources, and lack of measurement to control people who lacked of consciousness to maintain and use fresh water effectively (Thiengkamol, 2011e, & Vichaidit, 1994).
Therefore, to develop people, especially, new generations to use water with minimization and realize the value of water resources, it needs to cultivate them with environmental education process through different channels of educational system whether with Formal Education System, Non-Formal Education System, Informal Education System, and Lifelong Education System (Thiengkamol, 2011e). Particularly, the youths who are students by providing teaching and learning process with various activities to raise their knowledge and understanding, awareness, positive attitude, public consciousness and responsibility for natural resources and environment conservation including water resources, it will lead to success mean of active learning process through brain storming of group dynamic activities. In addition, they will learn about the real situation of community and river resources to receive direct experience from direct contact by themselves. This will stimulate them to be good observers, be able to gathering data, discuss among their friends and their teachers including evaluating, decision making for problem solving. Therefore, it will assist them to aware the importance of water resource and it will a good process for attitude and behavior changing to conserve natural resources and environment conservation (Thiengkamol, 2011e, & Sariwat, 2010). Additionally, the intention of psychologists tried to understand on human behavior, and then they had developed a large number of theories and models but they had the main focus on explanation how individual perceived and evaluated the stimulant before making decision to express his behavior. Nevertheless, study on human behavior, it can’t be neglected the psychological trait. Trait theorists are primarily interested in the measurement of traits, which can be defined as habitual patterns of behavior, thought, and emotion including psychological health and physical health which are inherited trait from parents. There is much debate over how much of who we are is by nature (genetic) or nurture (environment), and both contribute significantly to our complete expression (Kassin, 2003, & Pearson, 2006). However, Interactionist theory has grown in the latter half of the twentieth century and has become one of the principal sociological perspectives in the world today. Interationism is most popular at present in Thailand for psychological study, especially, psychological trait and psychological state are play essential roles to spire for public consciousness for environmental conservation. Generally, environmental issues were ignorant as non-important issue for people until the beginning of this year 2011, Thai peoples have faced with strange of weather in summer, they faced with cold weather. This stimulated their attention s for turning their awareness to global warming seriously (Punthumnavin, 2008, Thiengkamol, 2009b, Thiengkamol, 2009c, Thiengkamol, 2011e, Thiengkamol, 2011f, Thiengkamol, 2011i, Thiengkamol,2011j, Thiengkamol,2012c, & Thiengkamol,2012d).
Therefore to determine the actual problems of water conservation behavior of upper secondary school students by studying on the causal relationship model of water conservation behavior with integration of psychological trait, psychological state, environmental knowledge, and environmental education influencing through inspiration of public consciousness to water conservation behavior, it might be a good answer for Ministry of Education and national policy maker to formulate the curriculum and projects to support for water conservation to meet real sustainable development. 2. Objective The objective of this study was to develop a causal relationship model of water conservation behavior of secondary school student under the Office of Kalasin Educational Area Zone 24. 3. Methodology The research design was implemented in steps by step as follows: 1) The populations were 18,463 upper secondary school students from school under Secondary Service Area Office 24 (Kalasin), Northeastern region of Thailand in academic year of 2012. 405 upper secondary school students were used as sample group. The research instrument was the questionnaire and it was used for data collection. LISREL was used for model verification. The content and structural validity were determined by Item Objective Congruent (IOC) with 5 experts in the aspects of environmental education, psychology, social science and social research methodology. The reliability was done by collecting the sample group from 30 elementary school students from Demonstration School Elementary of Rajabhat Mahasarakham University that locates nearby. The reliability was determined by Cronbach's Alpha. The

ISSN 2039-9340 Mediterranean Journal of Social Sciences Vol. 3 (11) November 2012
594
reliability of environmental education, environmental management, inspiration of public mind, and environmental behaviors, and the whole questionnaire were 0.912, 0.862, 0.878, 0.883 and 0.964 respectively. The descriptive statistics used were frequency, percentage, mean and standard deviation. The inferential statistics used was LISREL by considering on Chi-Square value differs from zero with no statistical significant at 0.05 level or Chi-Square/df value with lesser or equal to 2, P-value with no statistical significant at 0.05 level and RMSEA (Root Mean Square Error Approximation) value with lesser than 0.05 including index level of model congruent value, GFI (Goodness of Fit Index) and index level of model congruent value, AGFI (Adjust Goodness of Fit Index) between 0.9-1.00. 4. Results 4.1 General Characteristics of Sample Group The sample group was 405 upper secondary school students under the Office of Kalasin Educational Area Zone 24 in academic year of 2012. Most of them were female with 71.60%, studying at level 6 with 40.25% and had GPA at 3.51-4.00 with 46.42%. They lived at their home with 90.15 percents. Most of them had nuclear family with 57.28% and lived at their home with 82.22%. Their parents’ statuses were living together with 70.07% and their guardian statuses were living together with 83.33%. Majority of their father, mother and guardian education levels were at the same level at lower than lower secondary school with 40.47%, 46.62%, and 55.36% respectively. Their father, mother and guardian had occupation as agriculturist with 33.83%, 32.84% and 47.02% respectively as presented in table1. Table 1 General Characteristics of Sample Group of Upper Secondary School Students
Sex Number Percent 1.Male 2.Female
115 290
28.40 71.60
Total 405 100 Table 1 (Cont’)
Studying in Level Number Percent 1. Level 4 2. Level 5 3. Level 6
123 119 163
30.37 29.38 40.25
Total 405 100 GPA Number Percent 1. Lower than 2.00 2. 2.01-2.50 3.2.51-3.00 4. 3.01-3.50 5. 3.51-4.00
4 18 52 143 188
0.99 1.44 12.84 35.31 46.42
Total 405 100 Family Characteristic Number Percent 1.Nuclear Family 2.Extended Family
232 173
57.28 42.72
Total 405 100 Present Resident Number Percent 1. Home 2. Guardian House 3. Rent 4. Dormitory
333 55 10 7
82.22 13.58 2.47 1.73
Total 405 100 Parents Status Number Percent 1. living together 2. Separated 3. Widow/Divorce 4. Father or Mother Passed away
300 36 42 27
70.07 8.89 10.37 6.67
Total 405 100

ISSN 2039-9340 Mediterranean Journal of Social Sciences Vol. 3 (11) November 2012
595
Table 1 (Cont’)
Guardian Status Number Percent 1. living together 2. Separated 3. Widow/Divorce
140 12 16
83.33 7.14 9.53
Total 168 100 Father Education Level Number Percent 1.Lower than Lower Secondary School 2.Upper Secondary School/Vocational School 3.Diploma /High Vocational School 4.Bachelor 5.Master or Higher
169 136 26 56 18
40.73 33.58 6.42 13.83 4.44
Total 405 100 Mother Education Level Number Percent 1.Lower than Lower Secondary School 2.Upper Secondary School/Vocational School 3.Diploma /High Vocational School 4.Bachelor 5.Master or Higher
188 122 29 53 13
46.42 30.12 7.16 13.09 3.21
Total 405 100 Guardian Education Level Number Percent 1.Lower than Lower Secondary School 2.Upper Secondary School/Vocational School 3.Diploma /High Vocational School 4.Bachelor 5.Master or Higher
93 34 7 25 9
55.36 20.24 4.17 14.88 5.35
Total 168 100 Table 1 (Cont’)
Father Occupation Number Percent 1. Government Officer 2. Retired Government Officer 3. State Enterprise Officer 4. Company Officer 5. Merchant / Business Owner 6. Employee / Hire 7. Agriculturist 8. Househusband
72 3 9 12 72 84 137 16
17.78 0.74 2.22 2.96 17.78 20.74 33.83 3.95
Total 405 100 Mother Occupation Number Percent 1. Government Officer 2. Retired Government Officer 3. State Enterprise Officer 4. Company Officer 5. Merchant / Business Owner 6.Employee / Hire 7. Agriculturist 8. Housewife
49 5 12 15 87 77 133 27
12.10 1.23 2.96 3.70 21.48 19.01 32.84 6.67
Total 405 100 Guardian Occupation Number Percent 1. Government Officer 2. Retired Government Officer 3. State Enterprise Officer 4. Company Officer 5. Merchant / Business Owner
26 2 3 2 30 15
15.48 1.19 1.79 1.19 17.85 8.93

ISSN 2039-9340 Mediterranean Journal of Social Sciences Vol. 3 (11) November 2012
596
6.Employee / Hire 7. Agriculturist 8. Househusband
79 11
47.02 6.55
Total 168 100 4.2 Confirmatory factors Analysis of Exogenous Variables 1) Confirmatory factors Analysis of Exogenous Variables of Psychological Trait (PsT) Confirmatory factors of EE had Bartlett’s test of Sphericity of 169.683 statistically significant level (p< .01) and Kaiser–Mayer–Olkin Measure of Sampling Adequacy/MSA) of 0.698. This indicated that components of PsT aspect had proper relationship at good level and it can be used for analysis of confirmatory factors as shown in picture 1 and table 2. Picture 1: Model of Confirmatory factors of Psychological Trait Table 2 Results of Analysis of Confirmatory factors of Psychological Trait
Components of Psychological Trait Weight SE t 2R X1 Physical Health 0.24 0.039 6.15** 0.15 X2 Mental Health 0.22 0.029 7.47** 0.23 X3 Locus of Control 0.21 0.026 7.99** 0.27 X4 Mercy and Kindness 0.23 0.027 8.46** 0.31 X5 Achievement Motive 0.04 0.039 0.99 0.044 X6 Life Target 0.14 0.024 5.67** 0.13 Chi-square = 5.25 df = 8 P = 0.73084 GFI =1.00 AGFI =0.99 RMSEA = 0.000 RMR =0.0046
** Statistically significant level of .01 From picture 1 and table 2, results of analysis of confirmatory factors of Psychological Trait from 6 observed variables was revealed that the model was congruent to empirical data by considering from 1) Goodness of Fit Index (GFI) equaled to 1.00 and Adjust Goodness of Fit Index (AGFI) equaled to 0.99 2) Root Mean Square Error of
X1 0.31
X2 0.15
X3 0.12
X4 0.12
X5 0.31
X6 0.12
PsT 1.00
Chi-Square=5.25, df=8, P-value=0.73084, RMSEA=0.000
0.24
0.22
0.21
0.23
0.04
0.14
0.05

ISSN 2039-9340 Mediterranean Journal of Social Sciences Vol. 3 (11) November 2012
597
Approximation (RMSEA) equaled to 0.000 (RMSEA < 0.05) and 3) Chi- Square value had no statistically significant at level of .01 and degree of freedom was lesser than or equaled to .05 ( 00.5/2 ≤dfχ ). Considering on loading weight of observed variables in model, it was revealed that observed variables had loading weight with 0.04 to 0.23 and had covariate to model of Psychological Trait with 4.40 to 31.00 percents. 2) Confirmatory factors Analysis of Exogenous Variables of Psychological State (PsS) Confirmatory factors of EE had Bartlett’s test of Sphericity of 139.267 statistically significant level (p< .01) and Kaiser–Mayer–Olkin Measure of Sampling Adequacy/MSA) of 0.614. This indicated that components of PsS aspect had proper relationship at good level and it can be used for analysis of confirmatory factors as shown in picture 2 and table 3. Picture 2: Model of Confirmatory factors of Psychological State Table 3 Results of Analysis of Confirmatory factors of Psychological State
Components of Psychological State Weight SE t 2R X7 Self -Value of Life 0.12 0.036 3.34** 0.061 X8 Family Value of Life 0.091 0.034 2.34* 0.037 X9 Attitude toward Sufficiency 0.19 0.036 5.37** 0.21 X10 Religion Belief 0.21 0.037 5.71** 0.27 X11 Physical Environment 0.18 0.036 4.82** 0.14 Chi-square = 1.82 df = 3 P = 0.61040 GFI =1.00 AGFI =0.99 RMSEA = 0.000 RMR =0.0031
** Statistically significant level of .01 From picture 2 and table 3, results of analysis of confirmatory factors of Psychological State from 5 observed variables was revealed that the model was congruent to empirical data by considering from 1) Goodness of Fit Index (GFI) equaled to 1.00 and Adjust Goodness of Fit Index (AGFI) equaled to 0.99 2) Root Mean Square Error of Approximation (RMSEA) equaled to 0.000 (RMSEA < 0.05) and 3) Chi- Square value had no statistically significant at level of .01 and degree of freedom was lesser than or equaled to .05 ( 00.5/2 ≤dfχ ). Considering on loading weight of observed variables in model, it was revealed that observed variables had loading weight with 0.091 to 0.21 and had covariate to model of Psychological State with 3.70 to 27.00 percents. 3) Confirmatory factors Analysis of Exogenous Variables of Environmental Knowledge (EK) Confirmatory factors of EE had Bartlett’s test of Sphericity of 145.726 statistically significant level (p< .01) and Kaiser–Mayer–Olkin Measure of Sampling Adequacy/MSA) of 0.614 This indicated that components of EK aspect had proper relationship at good level and it can be used for analysis of confirmatory factors as shown in picture 3 and table 4.
X7 0.22
X8 0.21
X9 0.14
X10 0.12
X11 0.19
PsS 1.00
Chi-Square=1.82, df=3, P-value=0.61040, RMSEA=0.000
0.12
0.09
0.19
0.21
0.18
0.06
0.04

ISSN 2039-9340 Mediterranean Journal of Social Sciences Vol. 3 (11) November 2012
598
Picture 3: Model of Confirmatory factors of Environmental Knowledge Table 4 Results of Analysis of Confirmatory factors of Environmental Knowledge
Components of Environmental Knowledge Weight SE t 2R X12 Natural Resources 0.49 0.11 4.50** 0.21 X13 Water Resource 0.32 0.080 3.98** 0.14 X14 Appropriate Technology 0.24 0.089 3.72** 0.12 X15 Effective Water Management 0.39 0.090 4.29** 0.15 Chi-square = 0.24 df = 1 P = 0.62135 GFI = 1.00 AGFI = 1.00 RMSEA = 0.000 RMR =0.0063
** Statistically significant level of .01 From picture 3 and table 4, results of analysis of confirmatory factors of EK from 4 observed variables was revealed that the model was congruent to empirical data by considering from 1) Goodness of Fit Index (GFI) equaled to 1.00 and Adjust Goodness of Fit Index (AGFI) equaled to 1.00 2) Root Mean Square Error of Approximation (RMSEA) equaled to 0.000 (RMSEA < 0.05) and 3) Chi- Square value had no statistically significant at level of .01 and degree of freedom was lesser than or equaled to .05 ( 00.5/2 ≤dfχ ). Considering on loading weight of observed variables in model, it was revealed that observed variables had loading weight with 0.24 to 0.49 and had covariate to model of Environmental Education with 12.00 to 21.0 percents. 4) Confirmatory factors Analysis of Exogenous Variables of Environmental Education ( EE) Confirmatory factors of EE had Bartlett’s test of Sphericity of 562.086 statistically significant level (p< .01) and Kaiser–Mayer–Olkin Measure of Sampling Adequacy/MSA) of 0.785. This indicated that components of EE aspect had proper relationship at good level and it can be used for analysis of confirmatory factors as shown in picture 4 and table 5.
Picture 4: Model of Confirmatory factors of Environmental Education
X12 0.88
X13 0.60
X14 0.88
X15 0.86
EK 1.00
Chi-Square=0.24, df=1, P-value=0.62135, RMSEA=0.000
0.49
0.32
0.24
0.39
0.04
X16 0.11
X17 0.11
X18 0.08
X19 0.18
X20 0.20
EE 1.00
Chi-Square=0.97, df=2, P-value=0.61452, RMSEA=0.000
0.31
0.26
0.30
0.28
0.38
0.02
-0.02
0.06

ISSN 2039-9340 Mediterranean Journal of Social Sciences Vol. 3 (11) November 2012
599
Table 5 Results of Analysis of Confirmatory factors of Environmental Education
Components of Environmental Education Weight SE t 2R X16 Environmental Awareness 0.31 0.024 12.77** 0.45 X17 Environmental Attitude 0.26 0.022 11.74** 0.39 X18 Environmental Belief 0.30 0.030 11.59** 0.51 X19 Environmental Skill 0.28 0.027 10.27** 0.29 X20 Environmental Participation 0.38 0.035 10.65** 0.42 Chi-square = 0.97 df = 2 P = 0.61452 GFI = 1.00 AGFI = 0.99 RMSEA = 0.000 RMR =0.0018
** Statistically significant level of .01 From picture 4 and table 5, results of analysis of confirmatory factors of EE from 5 observed variables was revealed that the model was congruent to empirical data by considering from 1) Goodness of Fit Index (GFI) equaled to 1.00 and Adjust Goodness of Fit Index (AGFI) equaled to 0.99 2) Root Mean Square Error of Approximation (RMSEA) equaled to 0.000 (RMSEA < 0.05) and 3) Chi- Square value had no statistically significant at level of .01 and degree of freedom was lesser than or equaled to .05 ( 00.5/2 ≤dfχ ). Considering on loading weight of observed variables in model, it was revealed that observed variables had loading weight with 0.26 to 0.38 and had covariate to model of Environmental Education with 29.00 to 51.0 percents. 4.3 Confirmatory Factors Analysis of Endogenous Variables Results of Confirmatory Factors Analysis of Endogenous Variables of Inspiration of Public Consciousness influencing to Water Conservation Behaviors was revealed as followings. Confirmatory Factors Analysis of Endogenous Variables of Inspiration of Public Consciousness (INS) Confirmatory Factors of Inspiration of Public Consciousness (INS) had Bartlett’s test of Sphericity of 593.889 statistically significant level (p< .01) and Kaiser–Mayer–Olkin Measure of Sampling Adequacy/MSA) of 0.842. This indicated that components of Public Consciousness (INS) aspect had proper relationship at good level and it can be sed for analysis of confirmatory factors as shown in picture 5 and table 6.
Picture 5: Model of Confirmatory factor of Inspiration of Public Consciousness
Y5 0.15
Y6 0.16
Y7 0.12
Y8 0.14
Y9 0.15
Y10 0.27
INS 1.00
Chi-Square=4.91, df=7, P-value=0.67111, RMSEA=0.000
0.25
0.19
0.41
0.39
0.37
0.39
0.02
-0.04

ISSN 2039-9340 Mediterranean Journal of Social Sciences Vol. 3 (11) November 2012
600
Table 6 Results of Analysis of Confirmatory factors of Inspiration of Public Consciousness
Confirmatory factors of Inspiration of Public Consciousness Weight SE t 2R Y5 Person as Role Model 0.25 0.023 10.68** 0.29 Y6 Impressive Event 0.19 0.023 8.15** 0.18 Y7 Impressive Environment 0.41 0.027 14.94** 0.57 Y8 Book Reading 0.39 0.028 13.97** 0.52 Y9 Television Watching 0.37 0.026 14.43** 0.38 Y10 Internet Using 0.39 0.032 12.12** 0.36 Chi-square = 4.19 df = 7 P = 0.67111 GFI = 1.00 AGFI = 0.99 RMSEA = 0.000 RMR = .0044
** Statistically significant level of .01 From picture 5 and table 6, results of analysis of confirmatory factors of INS from 6 observed variables was revealed that the model was congruent to empirical data by considering from 1) Goodness of Fit Index (GFI) equaled to 1.00 and Adjust Goodness of Fit Index (AGFI) equaled to 0.99 2) Root Mean Square Error of Approximation (RMSEA) equaled to 0.000 (RMSEA < 0.05) and 3) Chi- Square value had no statistically significant at level of .01
and degree of freedom was lesser than or equaled to .05 and 00.5/2 ≤dfχ . Considering on loading weight of observed variables in model, it was revealed that observed variables had loading weight with 0.19 to 0.41 and had covariate to model of Inspiration of Public Consciousness (INS) with 18.00 to 57.00 percents. 2) Confirmatory Factors Analysis of Endogenous Variables of Water Conservation Behaviors (BEH) Confirmatory Factors of Inspiration of Environmental Behaviors for Sustainable Development (BE) had Bartlett’s test of Sphericity of 1409.304 statistically significant level (p< .01) and Kaiser–Mayer–Olkin Measure of Sampling Adequacy/MSA) of 0.833. This indicated that components of BE aspect had proper relationship at good level and it can be used for analysis of confirmatory factors as shown in picture 6 and table 7.
Picture 6: Model of Confirmatory factor of Water Conservation Behaviors
Y1 0.34
Y2 0.42
Y3 0.17
Y4 0.26
BEH 1.00
Chi-Square=1.11, df=1,P-value=0.29304, RMSEA=0.016
0.51
0.68
0.75
0.47
0.11

ISSN 2039-9340 Mediterranean Journal of Social Sciences Vol. 3 (11) November 2012
601
Table 7 Results of Analysis of Confirmatory factors of Water Conservation Behaviors
Confirmatory factors of Water Conservation Behaviors Weight SE t 2R Y1 Self Water Conservation Behaviors (WCB) 0.51 0.038 13.36** 0.44 Y2 Promote for Family Member for WCB 0.68 0.045 12.70** 0.52 Y3 Promote for Community Member for WCB 0.75 0.040 18.70** 0.76 Y4 Promote for Social Member for WCB 0.47 0.033 14.09** 0.46 Chi-square = 1.11 df = 1 P = 0.29304 GFI = 1.00 AGFI = 0.99 RMSEA = 0.016 RMR = 0.0041
** Statistically significant level of .01 From picture 6 and table 7, results of analysis of confirmatory factors of Water Conservation Behaviors (BEH) from 4 observed variables was revealed that the model was congruent to empirical data by considering from 1) Goodness of Fit Index (GFI) equaled to 1.00 and Adjust Goodness of Fit Index (AGFI) equaled to 1.00, 2) Root Mean Square Error of Approximation (RMSEA) equaled to 0.000 (RMSEA < 0.05) and 3) Chi- Square value had no statistically
significant at level of .01 and degree of freedom was lesser than or equaled to .05 and 00.5/2 ≤dfχ . Considering on loading weight of observed variables in model, it was revealed that observed variables had loading weight with 0.47 to 0.75 and had covariate to model of Water Conservation Behaviors with 44.00 to 76.00 percents. 4.4 Results of Effect among Variables in Model in Terms of Direct and Indirect Effect 1) Confirmatory factors of Psychological Trait (PsT), Psychological State (PsS), Environmental Knowledge (EK) and Environmental Education (EE) had direct effect to Inspiration of Public Consciousness (INS) with statistically significant at level of .01 with effect of 0.25, -0.21 0.17 and 0.79. Moreover, Psychological Trait (PsT), Psychological State (PsS), Environmental Knowledge (EK) and Environmental Education (EE) had direct effect to Water Conservation Behaviors (BEH) with statistically significant at level of .01 with effect of- 0.14, 0.05, 0.28 and -0.11. In addition, confirmatory factors in aspect of Psychological Trait (PsT), Psychological State (PsS), Environmental Knowledge (EK) and Environmental Education (EE) had indirect effect to Water Conservation Behaviors (BEH) with statistically significant at level of .01 with effect of 0.24, -0.20, -0.16 and 0.76. 2) Confirmatory factors of Inspiration of Public Consciousness (INS) had direct effect to Water Conservation Behaviors (BEH) with statistically significant at level of .01 with effect of .96. Considering on structural model confirmatory factors of Psychological Trait (PsT), Psychological State (PsS), Environmental Knowledge (EK) and Environmental Education (EE) were able to explain the variation of endogenous factors of Inspiration of Public Consciousness (INS) to caused Water Conservation Behaviors (BEH) with 60.00 percents. As a result, the equation 1 can be written as following. BEH = 0.96*INS + 0.28*EK + 0.052*PsS – 0.14*PsT – 0.11*EE ……….…(1) R2 = 0.60 Equation (1) factors that had the most effect to Water Conservation Behaviors (BEH) was Inspiration of Public Consciousness (INS) and subsequences were Environmental Knowledge (EK) and Psychological State (PsS) but Psychological Trait (PsT) and Environmental Education (EE) with negative direction, these were able to explained the variation of Water Conservation Behaviors (BEH)with 60.00 percents Moreover, confirmatory factors of Psychological Trait (PsT), Psychological State (PsS), Environmental Knowledge (EK) and Environmental Education (EE) were able to explain the variation of confirmatory factors of Inspiration of Public Consciousness (INS with 86.00 percents. Therefore, the equation can be written as following equation 2. INS = 0.79*EE +0.25*PsT – 0.21*PsS – 0.17*EK ……….……….(2) R2 = 0.86 Equation (2) factors that had the most effect to Inspiration of Public Consciousness (INS) was Environmental Education (EE) and subsequences were Psychological Trait (PsT) but Psychological State (PsS) and Environmental Knowledge

ISSN 2039-9340 Mediterranean Journal of Social Sciences Vol. 3 (11) November 2012
602
(EK) with negative direction, these were able to explained the variation of Inspiration of Public Consciousness (INS) with 86.00 percents
Picture 7: Model of Direct and Indirect Effect of PsT, PsS, EK and EE through INS Influencing to BEH 5. Discussion The results revealed that Psychological Trait (PsT) had direct influencing to Inspiration of Public Consciousness (INS) and Water Conservation Behaviors (BEH) with highly statistically significant at level of .01 with effect of 0.25 and -0.14. Additionally, when considering on prediction of correlation of observed variables of Physical Health (X1), Mercy and Kindness (X4), Mental Health (X2), Locus of Control (X3), Life Target (X6) and Achievement Motive (X5) can predict the PsT rather high with 0.21, 0.23, 0.22, 0.21, and 0.04 respectively. These were congruent to different studies of Thiengkamol and her colleagues (Thiengkamol, 2011f, Thiengkamol, 2012c, Thiengkamol, 2012d, and Pimdee, et al, 2012a). Consequently, Psychological State (PsS) had direct influencing to Inspiration of Public Consciousness (INS) and Water Conservation Behaviors (BEH) with highly statistically significant at level of .01 with effect of -0.21 and 0.05. Additionally, when considering on prediction of correlation of observed variables of Religion Belief (X10), Attitude toward Sufficiency (X9), Physical Environment (X11), Self -Value of Life (X7), and Family Value of Life (X8) can predict the PsS rather high with 0.24, 0.19, 0.18, 0.12, 0.14 and 0.091 respectively. These were congruent to different studies of Thiengkamol and her colleagues (Thiengkamol, 2011j, Thiengkamol, 2012d, Dornkornchum, and Thiengkamol, 2012, Pimdee, et al, 2012a, and Waewthaisong, et al, 2012a).
X10.28
X20.16
X30.13
X40.11
X5-0.34
X60.12
X70.21
X80.18
X90.15
X100.10
X110.20
X121.00
X130.55
X140.85
X150.84
X160.13
X170.14
X180.12
X190.12
X200.14
PsT
PsS
EK
EE
BEH
INS
Y1 0.33
Y2 0.41
Y3 0.22
Y4 0.24
Y5 0.14
Y6 0.16
Y7 0.13
Y8 0.16
Y9 0.14
Y10 0.27
Chi-Square=609.34, df=366, P-value=0.00000, RMSEA=0.041
0.53
0.69
0.72
0.49
0.29
0.23
0.45
0.43
0.43
0.43
0.20
0.16
0.210.160.254.49
-4.53
0.14
0.04
0.14
0.04
0.16
0.170.240.14
0.350.390.290.41
0.280.200.230.380.45
0.96
-0.14
0.05
0.28
-0.11
0.25
-0.21
-0.17
0.79
0.10
-0
-0.0
0.04
0.04
0.07
0.040.07
0.04-0.02
-0.02
0.03
-0.02
0.04
0.02
0.02
0.02
0.04
0.020.03

ISSN 2039-9340 Mediterranean Journal of Social Sciences Vol. 3 (11) November 2012
603
Subsequently, Environmental Knowledge (EK) had direct influencing to Inspiration of Public Consciousness (INS) and Water Conservation Behaviors (BEH) with highly statistically significant at level of .01 with effect of 0.17 and 0.28. Additionally, when considering on prediction of correlation of observed variables of Natural Resources (X12), Effective Water Management (X15), Water Resource (X13), and Appropriate Technology (X14) can predict the EK rather high with 0.49, 0.39, 0.32, and 0.24 respectively. These were congruent to different studies of Thiengkamol and her colleagues (Thiengkamol, 2005b, Thiengkamol, 2011a, Thiengkamol, 2011i, Thiengkamol, 2012a, Thiengkamol, 2012b, Thiengkamol, 2012c, Dornkornchum, et al, 2012a, Gonggool, et al, 2012b, Ngarmsang, et al, 2012b, Pimdee, et al, 2012a, Ruboon, et al, 2012a, and Waewthaisong, et al, 2012a) Moreover, the findings indicated that Environmental Education (EE) had direct influencing to Inspiration of Public Consciousness (INS) and Water Conservation Behaviors (BEH) with highly statistically significant at level of .01 with effect of 0.79 and- 0.11. Moreover, when considering on prediction of correlation of observed variables of Environmental Participation (X20), Environmental Awareness (X16), Environmental Value (X18), Environmental Skill (X19), and Attitude (X17) can predict the EE rather high with 0.38, 0.31, 0.30, 0.28, and 0.26 respectively. These were congruent to different studies of Thiengkamol and her colleagues (Thiengkamol, 2005a, Thiengkamol, 2011a, Thiengkamol, 2011g, Thiengkamol, 2011i, Thiengkamol, 2012a, Thiengkamol, 2012b, Thiengkamol, 2012c, Dornkornchum, et al, 2012a, Gonggool, et al, 2012b, Ngarmsang, et al, 2012b, Pimdee, et al, 2012a, Ruboon, et al, 2012a, and Waewthaisong, et al, 2012a) that the results illustrated that inspiration of public consciousness would inspire upper secondary schools student to perform better water conservation behaviors whether self water conservation behavior, promote to family member for water conservation behavior, promote to community member for water conservation behavior, and promote to social member for water conservation behavior, when they had real practice through environmental conservation with inspiration of public consciousness.
Additionally, Inspiration of Public Consciousness (INS) had direct effect to Water Conservation Behaviors (BEH) with statistically significant at level of 0.01 with effect of 0.96. Particularly, considering on prediction of correlation of observed variables of Impressive Environment (Y7), Book Reading (Y8), Internet Using (Y10), Television Watching (Y9), Person as Role Model (Y5), and Impressive Event (Y6), can predict the INS rather high with 0.41, 0.39, 0.39, 0.38, 0.25 and 0.19 respectively (Thiengkamol, 2011i, Thiengkamol, 2011j, Thiengkamol, 2012c, Thiengkamol, 2012d, , Dornkornchum, and Thiengkamol, 2012, Dornkornchum, et al, 2012a, Gonggool, et al, 2012b, Ngarmsang, et al, 2012b, Ruboon, et al, 2012a, Pimdee, et al, 2012, and Waewthaisong, et al, 2012a).
However, it might be concluded that Psychological Trait (PsT) observed from observed variables of Physical Health (X1), Mental Health (X2), Locus of Control (X3), Mercy and Kindness (X4), Achievement Motive (X5) and Life Target (X6), Psychological State (PsS) observed from observed variables of Self -Value of Life (X7), Family Value of Life (X8), Attitude toward Sufficiency (X9), Religion Belief (X10), and Physical Environment (X11), Environmental Knowledge (EK) observed from observed variables of Natural Resources (X12), Water Resource (X13), Appropriate Technology (X14), and Effective Water Management (X15), and Environmental Education (EE) observed from observed variables of Environmental Awareness (X16), and Attitude (X17), Environmental Value (X18), Environmental Skill (X19), Environmental Participation (X20), can influence through Inspiration of Public Consciousness (INS) composing of Person as Role Model (Y5), Impressive Event (Y6), Impressive Environment (Y7), Book Reading (Y8), Television Watching (Y9), and Internet Using (Y10), to Water Conservation Behaviors (BEH) that included Self Water Conservation Behaviors (Y1) Promote for Family Member for Water Conservation Behaviors (Y2), Promote for Community Member for Water Conservation Behaviors (Y3), and Promote for Social Member for Water Conservation Behaviors (Y4). Therefore, the model of PsT, PsS, EK and EE influencing through INS to BEH was verified the proposed model was fitted with all observed variables according to criteria of Chi-Square value differs from zero with no statistical significant at .01 level or Chi-Square/df value with lesser or equal to 2, P-value with no statistical significant at .01 level and RMSEA (Root Mean Square Error Approximation) value with lesser than 0.05 including index level of model congruent value, GFI (Goodness of Fit Index) and index level of model congruent value, AGFI (Adjust Goodness of Fit Index) between 0.90-1.00.
References
Bicknell, J., D. Dodman, et al., Eds. (2009). Adapting Cities to Climate Change: understanding and addressing the development
challenges. London: Earthscan. Bindoff et al. (2007). Chapter 5, Introductory Remarks. Retrieved from http://en.wikipedia.org/wiki/Current_sea_level
_rise#CITEREFIPCC_AR4_WG12007 Dahlman, L. (2011). “NOAA Climate Portal: ClimateWatch Magazine: Climate Change: Global Sea Level”. NOAA Climate Services.
Retrieved from http://www.climatewatch.noaa.gov/article/2009/climate-change-sea-level.

ISSN 2039-9340 Mediterranean Journal of Social Sciences Vol. 3 (11) November 2012
604
Dornkornchum, S. and Thiengkamol, N. (2012). Model of Environmental Education and Psychological State Affecting to Global Warming Alleviation. International Proceedings of Economic Development and Research, 44, 1-5.
Dornkornchum, S. Thiengkamol, N., & Thiengkamol, C. (2012a). Causal Relationship Model of Environmental Conservation Behavior Integrated with LCA Knowledge. European Journal of Social Sciences, 33 (1):5-16.
Fischlin, A. (2011). “Section 4.4.9: Oceans and shallow seas – Impacts”. Chapter 4: Ecosystems, their Properties, Goods and Services. p. 234. Retrieved from http://www.ipcc.ch/publications_and_data/ar4/wg2/en/ch4s4-4-9.html
Gonggool, D., Thiengkamol, N., & Thiengkamol, C. (2012b). Development of Environmental Education Volunteer Model through Inspiration of Public Consciousness for Sustainable Development. European Journal of Social Sciences, 32 (1):150-160.
Hegerl et al. (2007). Executive summary, Section 1.3: Consistency of changes in physical and biological systems with warming, in IPCC AR4 SYR 2007.
IPCC. (2012). Organization. Retrieved from http://www.ipcc.ch/organization/organization.shtml Kassin, S. (2003). Psychology. USA: Prentice-Hall, Inc. Kotchasenee, J. (2010). Human and Environment. Sixth Edition. Bangkok: Chulalongkorn University Press. Ngarmsang, K., Thiengkamol, N., & Thiengkamol, C. (2012b). Development of an Environmental Education and Environmental
Management Model for Learning Disability Student. European Journal of Social Sciences, 32 (1):120-127. Office of Natural Resources and Environmental Policy and Planning. (2009). Report the Situation of Environmental Quality. Bangkok:
Bejapol. Oki, T., & Kanae., S. (2006). Global Hydrological Cycles and World Water Resources. Science (313): 5790. 1068-1072. Pearson, H. (2006). “Genetics: what is a gene?” Nature 441 (7092): 398–401. Pimdee, P., Thiengkamol, N., & Thiengkamol, T. (2012a). Causal Relationship Model of Electrical Energy Conservation. European
Journal of Social Sciences, 32 (3):306-315. Punthumnavin, D. (2008). Feature of Hypothesis and Data Analysis Providing for Utilization of Results of Development Research.
Bangkok: National Research Council of Thailand (NRCT). Ruboon, O., Thiengkamol, N, Thiengkamol, T, & Kurukodt, J. (2012a). Model of Environmental Education Teacher with Inspiration of
Environmental Conservation for Global Warming Alleviation. European Journal of Social Sciences, 31 (1):92-102. Sariwat, L. ( 2010). Psychological Work in Community. Bangkok: Se-education Limited. Solomon et al. (2007). Technical Summary, Section 3.4 Consistency among Observations, in IPCC AR4 WG1 2007. Sutayasue, U. ( 2010). Global Warming. Retrieved fromhttp://www.thaigoodview.com/ library/teachershow/usa_s/global _Warming/
aboutme.httm Thiengkamol, N. (2005a). Strengthening Community Capability through The Learning Network Model for Energy Conservation. Journal
of Population and Social Studies, 14 (1), 27-46. Thiengkamol, N. (2005b). Development of Health Cities Network for Mekong Region. In Proceedings of the International Conference
“Transborder Issues in the Grate Mekong Sub-Region” Ubon Ratchathani, Thailand, 30 June-2 July 2005 (pp.111-119). Ubol Ratchathani: Nevada Grand Hotel.
Thiengkamol, N. (2009b). The Happiness and the Genius can be created before Born. Bangkok: Prachya Publication. Thiengkamol, N. (2009c). Environment and Development Book 2 (Food Security). Bangkok: Chulalongkorn University Press. Thiengkamol, N. (2011a). Holistically Integrative Research. Published 2nd Edition. Bangkok: Chulalongkorn University Press. Thiengkamol, .N. (2011e). Environment and Development Book 1. Published 4th Edition. Bangkok: Chulalongkorn University Press. Thiengkamol, N. (2011f). Nurture Children to be Doctors. Bangkok: INTELLUALS. Thiengkamol, N. (2011g). Development of Energy Security Management for Rural Community. Canadian Social Science, 7 (5), October
31, 2011. Thiengkamol, N. (2011i). Development of Model of Environmental Education and Inspiration of Public Consciousness Influencing to
Global Warming Alleviation. European Journal of Social Sciences, 25 (4):506-514. Thiengkamol, N. (2011j). Model of Psychological State Affecting to Global Warming Alleviation. Canadian Social Science, 7 (6):89-95,
December 31, 2011. Thiengkamol, .N. (2012a). Development of A Prototype of Environmental Education Volunteer. Journal of the Social Sciences, 7 (1):77-
81. Thiengkamol, N. (2012b). Development of Food Security Management for Undergraduate Student Mahasarakham University. European
Journal of Social Sciences, 27 (2):246-252. Thiengkamol, N. (2012c). Model of Psychological Trait Affecting to Global Warming Alleviation. European Journal of Social Sciences, 30
(3) : 484-492. The Royal Society. (2005). “A guide to facts and fictions about climate change”. Retrieved from http://royalsociety.org/uploaded
Files/Royal_Society_Content/News_and_Issues/Science_Issues/Climate_change/climate_facts_and_fictions.pdf Vichaidit, T. (1994). Utilization of Water for Consumption. Seminar on Law Formulation on Utilization and Water Resource Conservation
in Celebration of Queen Sirikit of 60 years old. Bangkok: Office of the National Research Council of Thailand, Ministry of Science, technology and Environment.
Waewthaisong, S. Thiengkamol, N., & Thiengkamol, C. (2012a). Development of Environmental Traveling Behavior Model through Inspiration of Public Mind for Global Warming Alleviation. European Journal of Social Sciences, 33 (1).

ISSN 2039-9340 Mediterranean Journal of Social Sciences Vol. 3 (11) November 2012
605
First Language Acquisition: Towards Strategy-Oriented Perspective
Masoumeh Ahmadi Shirazi
Assistant Professor, Faculty of Foreign Languages and Literatures
University of Tehran, Iran Email: [email protected]
Majid Nemati
Assistant Professor, Faculty of Foreign Languages and Literatures
University of Tehran, Iran Email: [email protected]
Doi:10.5901/mjss.2012.v3n11p605
Abstract: A lot has been allocated to how a child learns to talk, but what has been neglected is the reason why he starts to. Satisfying biological needs, at most, would have been the first objective of the child. However, what he intends is communication for which the primitive signs and gestures are transformed into codes whether it be sounds uttered or figures engraved on the papers. Strategy leads the child to find his way into the community he belongs to, and language just like other abilities develops as he grows up biologically. His experience with otherese assists him to find the path, explore, experiment, practice and get involved with meaning-geared communication for which he goes all out to use linguistic aspects. In almost all developmental processes, when the child is not able to express oneself clearly, compensation strategies are resorted to in order for his/her intentions to become realized. However, these long-lasting strategies are not erased with the passage of time since they are taken to be devices of perfect versatility which appears to last for a lifelong period. Key terms: First Language (L1), language acquisition, learning strategies 1. Introduction First language acquisition research has witnessed many changes in perspectives since its genesis. There are different views on how a child learns to talk, which we now consider them.
As reason plays a significant role in any activity one does in life, the first hunch is that a child develops language to find satisfying reasons for thought-provoking questions in his environment. Beauzee (as cited in Lust and Foley 2004, p 15), a leading 18th century rational grammarian, defined general grammar as a deductive science concerned with the immutable and general principles of spoken and written language and their consequences; it is prior to all languages, because its principles are the same as those that direct human reason in its intellectual operations. Thus, the science of language does not differ at all from the science of thought. Particular grammar is not a true science in the sense of this rationalist tradition because it is not based solely on universal necessary laws; it is an art or technique that shows how given languages realize the general principles of human reason. As Miller (as cited in Lust and Foley, 2004, p. 15) later expressed the same leading idea, the principles and rules of grammar are the means by which the forms of language are made to correspond with the universal forms of thought. The structure of every sentence is a lesson in logic.
During the Romantic period some people like Humboldt argued that there existed a belief that the nature and content of thought are determined in part by the devices made available for its expression in particular languages.
With the demise of logical positivism and the emergence of cognitivism, the prominent view became rule-based orientation towards language learning. These rules were in-built and what children were in need of was exposure to enough input in the environment for their LAD (Language Acquisition Device) to get activated; it resembled mathematical ability which on condition that you learn the fundamental abilities such as addition, subtraction, multiplication and division, then you are able to do wonders with numerical signs. Chomsky in the mid-1950s called this productivity of inborn language "generative grammar" asserting that it limits itself to certain elements of this large picture; its standpoint is that of individual psychology; it is concerned with those aspects of form and meaning that are determined by the "language faculty", which is understood to be a particular component of the human mind. The nature of this faculty is the subject matter of a general theory of linguistic structure that aims to discover the framework of principles and elements common

ISSN 2039-9340 Mediterranean Journal of Social Sciences Vol. 3 (11) November 2012
606
to attainable human languages; UG may be regarded as a characterization of the genetically determined language faculty. One may think of this faculty as a "Language Acquisition Device", an innate component of the human mind that yields a particular language through interaction with presented experience, a device that converts experience into a system of knowledge attained.
Research on animal perceptual abilities (Cutting & Rosner 1974; Kluender, Diehl, & Killean 1987; Kuhl & Miller 1975; Kuhl & Padden 1982; Miller, Maruyama, Beaber, & Valone, 1976) suggests that both human and nonhuman discriminations depend on properties of the hearing system and not on any specialization in human just for the processing of speech sounds. These findings almost cast doubt on the existence of LAD just for language learning in human beings. As bees have potentiality to discriminate the odor, shape, pattern of flowers, human beings have the potential to differentiate the sound patterns, structures and above all meanings. Bees know the time of the day at which each flower provides nectar; they schedule their visit besides learning about enemies. It is clear that upon identifying the need, they develop some techniques in tune with the experience they obtain from their environment as is the case with babies who cry as the first step to find what reaction they get from the as-yet-unfamiliar surroundings. Even bees have some sort of cognitive ability by which they find their route (Gould & Marler, 1987). Do children have a mental map leading them towards the right track? If they are equipped with some cognitive ability, it will be likely for the human being to bear such ability enabling them to come up with some ways of communication that we call language.
Innatists' ideas have come under some criticisms whose avoidance seems inevitable. Piaget (as cited in Lust & Foley 2004, p. 69) states that autoregulation is what innatists forget. In fact, they define autoregulation as a kind of mechanism which plays a significant role quite like a genome or even more important than that. According to Piaget, the roots of autoregulation are organic, and common to biological and mental processes, and the fact that its actions are controllable can be a great advantage. Autoregulation is, therefore, constructivist. Along the same line, Piaget asserts that mutation in which innatists believe would be biologically inexplicable since our present goal is to emphasize the stability and the importance of cognitive structure and in particular the fixed nucleus in the field of linguistics; Piaget believes that the fixed nucleus would retain all its properties if it were not innate but constituted the "necessary" result of constructions of sensory-motor intelligence which takes place prior to language development and results from the joint organic and behavioral autoregulatios that determine this epigenesis.
When Chomsky in the 1960s proposed that the human capacity for language was innate, he put forward two rationales:
1. Adults offer such a distorted and imperfect source of data 2. Children learn their first language so fast that must be relying on an innate capacity, specifically for syntax
As Clark (2003) states, “child-directed speech is often singularly well-tailored to its addresses, highly grammatical in form and virtually free of errors” (p. 28). Maclay & Osgood (as cited in Clark, 2003) contend that: (a) adults actually offer highly grammatical speech to children (b) children take considerably longer to acquire syntactic structure in their first language than originally estimated. 1
1 Reilly (1982, 1986) investigated the conditional structures in English and found that at age 4 not all but many children could make use of future, present, and counterfactual conditions in talking about how one event is contingent upon another. They may still have to master a number of details (for instance, the appropriate sequences of tenses in such constructions), but they appear to have grasped what it means for one event to be contingent on another both in reality and in some hypothetical world.

ISSN 2039-9340 Mediterranean Journal of Social Sciences Vol. 3 (11) November 2012
607
Another common perspective which advocates what innatists believe is the poverty of stimulus argument. Children are exposed to degenerate language so how can they develop their language this much fast? Pullum (1996) examined the claim about variety in 23,886 interrogatives in the 1987 Wall Street Journal (WSJ) corpus. The fifteenth question in the corpus offered evidence of structure-dependence, as did several other examples in the first 500 interrogatives. Since such forms do occur, both there and in other types of text, they are probably available to children as well. Even in (WSJ) corpus, the text often quotes people's utterances from interviews, so this is not simply a matter of written form. Several other putative cases of poverty of the stimulus suffer from the same fate (Pullum & Scholz, 2002). They do appear and are nowhere near as rare as some linguists have claimed. People do hear linguistic evidence for structure dependence, children could, therefore, learn those constructions from child-directed speech.
The claim that, "This is still a very controversial view, and many linguists and psychologists do not believe language is as innate as Chomsky argues" is diminishing in light of further studies. Mark Baker's work, The Atoms of Language
)2002( presents a pretty convincing argument that there are not only certain" parameters" (as Chomsky called them) that are innate switches in our LAD, but we are very close to the point where these parameters could be put together in a "periodic table of languages" as determined by their parameter features.
Clark (2003) counts some limitations accompanying Chomsky's ideas: What belongs in UG? How many parameters are there? How much exposure to a language and what kind of evidence do children need to set a parameter in the continuity account? Is it reasonable to assume that learning syntax is quite separate from learning the rest of language – the lexicon, phonology, morphology, and all the pragmatic conditions on usage? It is also hard to separate off language from affect, perception, and cognition. (p. 403) Now that we went over some problems associated with nativist point of view, it seems rational to mention some functions of the tool we would call language. This tool can be used of for conveying meaning, social interaction, transacting and exchanging information. Clark (1978) was the first to use the word strategy; she asserts that:
By strategy I mean the choice of a device to communicate a particular meaning. hildren might choose a single word, a two-word combination, or a fully grammatical utterance, depending on what they want to convey, and how much they know of their first language. (p. 423)
In this paper, the researchers used Clark’s terminology to put forward a rather new way of acquiring first language. To Clark, strategy is a device, but it can be the tool, instrument, tactic, or any sort of performance-based activity done to tackle both in-context and out-context problems. To this date, this terminology has been used for second language learners as developed to make up for the lack of knowledge of the second language. When it comes to children, all the time, scholars have tried to find and cling to some reasons so that they could explain how children learn languages. Some scholars such as Skinner put forward conditioning as the solution and the stimulus, response and positive reinforcement as the processes through which children learn language. Then Chomsky put forward his idea of inborn language acquisition device which enables learners to acquire rules of language through which they can generate an infinite number of sentences of their language. However, two important factors are missing: first the objective of language learning, i.e., communication and then the sociolinguistic factors which abound the environment children live in. Slobin (1973) said that the first and most obvious point that comes to mind is that language is used to express the child's cognition of his environment – physical and social – and so a child cannot begin to use a given linguistic form meaningfully until he is able to understand what it means. It should be possible, then, to rank linguistic forms in terms of psychological or cognitive complexity of the notions they express. Is it possible to trace out a universal course of linguistic development on the basis of what we know about the universal course of cognitive development? When the social aspect of learning a language came to the scene, social interactionism and social constructivism were given substance. Along the same line, the cognitive development proposed by Piaget put forward another area in which first language acquisition processes can be sought. However, it seems feasible if we think of all the actions carried out by children as strategies of one sort or another to get the meaning across. If asked how it is possible, the answer would not refute the potential ability of children to learn as they learn other abilities besides language in the course of time; furthermore, as they act upon the environment they receive feedback too, so nobody would deny that children, if isolated, can learn language since it is innate. Genie, a 13 year and 7 month girl appeared to understand words which she was not able to produce herself. She was a case of

ISSN 2039-9340 Mediterranean Journal of Social Sciences Vol. 3 (11) November 2012
608
isolation from the society in which she could have developed language, but what seems noteworthy is the fact that she could comprehend those words after staying with others for a while. Therefore, the distinction between competence and performance offered by Chomsky makes us hesitant that whether her understanding goes for competence or performance while Fromkin, Krashen, Curtiss, and Rigler (1974) call comprehension also a sort of performance. As Slobin (1973) named his perspective functional, this very perspective can be called strategical. These strategies are developed one after another until the child comes up with accurate and fluent speech. Stepping in the world, the child needs to satisfy one's biological needs for which there exist some senses helping him to achieve what he is in need of. Visual modes such as eye gaze appear to be a method to direct the attention of the addressees. Other senses including tactile, acoustic, gustatory, and olfactory each contribute to a child's association with the new environment. These are not just some senses for organic functioning of the body, but they convey special meaning to the child's parents. Affect can be realized via tactility, but not gustation. Children also reply to hearing stimulus showing that they understand what lullaby means. Research has shown that children can distinguish the smell of their mother among others. Therefore, all their attempts are geared towards finding some ways through their perceptual strategies to communicate with their parents in the first phase and then with others. When they are quite competent in applying these strategies to make themselves understood, they step towards social milieu further by resorting to social strategies. They try to share some time with others other than their families. In doing so, they associate more with otherese to develop their primitive language. In the course of association, sometimes they repeat the sounds or sentences they hear. Repetition is not regarded as the only way of learning the rules of the sentence construction in language but it can have many functions. As Clark (2003) mentions repetition can be used in many ways: Repetitions help speaker and addressee establish common ground Repetitions allow the current speaker to ratify what the previous speaker proposed Repetitions mark the uptake of information about words (or relation among words) offered by the previous speaker. (p. 320) Likewise, McTear (1978, as cited in Clark, 2004) tried to distinguish between imitation and repetition. In his point of view, they can be regarded (a) as means of expressing agreement or interest, (b) as forms of verbal play, or (c) as repetition of the others' questions. I would like to add some other functions as suggestions to above-mentioned ones: repetition to enhance their memory repetition to reach self-correction repetition to achieve fluency repetition to show dislike, surprise, and sometimes unanimity Another sort of social strategy is perhaps what we call attention-getting strategies which are not only peculiar to children but also to adults as well. Crying, smiling, and gestures of any sort (e.g. facial, body, and deictic) are among the strategies children use to direct or divert the attention of the others. The last social strategy is the physical stance. Physical stance is the place the child prefers to be placed. The first place the child is willing to stay is his/her mother’s arms; growing up little by little children sometimes prefer to be with others or spend their time with a person in another location. Thus, in all, they go to the society to which we all belong. No one can live in isolation and no one at home reaches the level of language competence that adults bear. Venturing out into society, children now are exposed to situational context within which they need to communicate. Now they utilize other strategies which can be called analytic strategies which are selection, discrimination, identification, analogy, inference, deduction, and generalization. No doubt they all help children to not only deal with the syntax but also the other linguistic factors which all together create language. Common to almost all these strategies is their propensity for directing the children towards finding a meaning for what they comprehend or produce. As such, they are not solely syntax-oriented. Compensation strategies stand at the end but playing a crucial role in language acquisition. From birth on, this little creature goes for unfamiliar to add to his/her own familiar. Sometimes he/she falls short of expressing himself/herself, and then some other strategies come to his/her help among which are simplification, assimilation, omission, substitution, avoidance, and in later stages topic change. 1.1. Simplification of syllable structure Clark (2003) states that:
Clark (2003) continues saying that what Chomsky overlooked is sociolinguistic factors:
… sociolinguistic research showed that adults are attentive to their addresses and use different styles or registers accordingly. In general, speakers have control over a variety of different ways of talking – the way they talk to babies, to foreigners, to pets, and so on – and one's language varies with the addressee, the occasion, and even the topic under discussion. (pp. 27-28)
Current positions on innate categories and structures fall into two main categories, the continuity view and the maturational view (O'Grady 1997, as cited in Clark 2003, p. 400). Both views focus on syntax. Those taking the continuity view assume that children use the same notions and relations throughout language development; they are there from birth (Mcnamara, 1982; Pinker, 1984).
The maturational view of what is innate differs from the continuity view on the role of experience. In the maturational account, children make progress in syntactic acquisition without much regard to experience.
When children start to talk early in their second year, it is often difficult to identify their first words. Their earliest attempts at Word production typically fall short of the adult forms. Take one-year-old's first production of the English word squirrel: ga. Upon reflection, it is easy to trace the processes that led to this simplified

ISSN 2039-9340 Mediterranean Journal of Social Sciences Vol. 3 (11) November 2012
609
pronunciation. First children typically omit liquid sounds like l and r; they simplify consonant clusters, usually retaining only the stop if there is one, so in the initial cluster skw-, they drop both the glide w and the initial s-, keeping only the velar stop k; and they often voice initial stop consonants, here changing the k- into a g-. Finally, vowels in children's earliest words are typically produced with little or no narrowing of the vocal tract, as in a. in this case, we know what the target word was. But in children's earliest attempts at talking, it is often hard to discern the intended targets. (p. 101)
The first syllables that children produce are typically consonant + vowel, or CV. This is the only syllable type that is found in all the languages of the world; it's the "perfect syllable," so it's not surprising that children master it first. In fact, the opposite relation is probably more to the point: all languages have it because it's the easiest one to learn and to produce. For example: Ka vs. Cat 1.2. Simplification of consonant clusters Another very common feature of child speech is reduction of consonant clusters to a single consonant. For example: [koz] clothes Here the rule could be stated as "Reduce clusters to one consonant." Which consonant survives is a more complex matter, but often it will be a stop consonant (so that a liquid, nasal, or fricative is deleted). A less dramatic, but related, reduction is found in words such as bankie for "blanket." In other cases, a new consonant that combines features of the adult consonants might be used.
[fIn] "spin"
Here, the alveolar fricative + labial stop become a labial fricative. One child was reported to have made this change quite consistently in his speech, so the rule would be /sp/ --> [f]. 1.3. Assimilations Babies will experiment with sounds, usually high pitched ones. They glide from high to low much like adult sentences, and they reduplicate sounds like ‘ba-ba-ba and da-da-da’, this is assimilation, another stepping stone in language acquisition. According to Clark (2003) assimilation is: …the effect of sounds on those preceding or following them within a word or across word-boundaries; the commonest assimilation in young children's production is probably reduplication where children simply repeat the syllable they are articulating, as in [baba] for bottle, [dada] for daddy (Ingram, 1974). They may also use partial reduplication, either keeping the vowel the same across syllable (vowel harmony), as in [lidi] for little, or keeping the consonant the same (consonant harmony), as in [babi] for blanket; a third type of assimilation is to add nasality to nonnasal consonants, as in the production of [nam] for lamb, where the initial /l/ is produced /n/. (p. 115) 1.4. Omission “Children, in their early words, often omit the final consonants or even the final syllable if it is unstressed, in their early words”, Clark (2003, p. 115) states. She says: Children also find clusters of adjacent consonants difficult to pronounce and generally attempt only certain parts of them, for instance, in initial clusters with an s plus a stop, for example, st- or sm- , children generally produce just the stop, as in [top] for stop where a stop is combined with a liquid, they again produce just the stop, as in [gok] for clock and if a stop is combined with a nasal, they again focus on the stop, as in [bup] for bump; finally, where a fricative is combined with a glide, they tend to produce only the fricative, as in [fom] for from (Smith, 1973). Early utterances are often just one syllable in length. Typically it's the stressed syllable that survives in the child's version. This syllable might be subject to other processess such as cluster simplication.

ISSN 2039-9340 Mediterranean Journal of Social Sciences Vol. 3 (11) November 2012
610
[ba] "bottle" [ba] "baby" [dæ] "daddy" Truncation of a word to one syllable is actually quite common in many adult languages. In English, it's how we usually make nicknames (Sue from Susan, Pete from Peter) and other shortenings (vet for veteran, dis for disrespect). Sometimes -- especially at a somewhat later stage -- one unstressed syllable can also be preserved. The result is generally a stressed plus an unstressed syllable, with deletion of anything else in the adult form. This structure is called a trochaic foot or a trochee: a way of organizing two syllables into a stressed + unstressed pair, found as a fundamental element in the prosody of a great many languages including English. [næna] "banána" Many languages use trochees to create shortened words as well: a smaller number of English nicknames are like this, as in Alex for Alexander. Prosodic patterns such as trochees -- but also the overall intonation of a phrase -- seem to be grasped by children quite early. Before they start speaking at all, they can distinguish the basic intonation patterns of their parents' language from that of other languages. 1.5. Substitution Labov and Labov (1978) assert that some children compensate for their inability to voice stop consonants in final positions by using a nasal consonant after the stop at the same place of articulation, as in [dadn] for dad, or by combining a nasal consonant with a voiceless stop, as in [piŋk] for pig; since voiced nasals like /n/ /o/ /m/ are easier to produce in final position, they seem to offer a convenient way, early on, to maintain voicing at the appropriate place of articulation (Clark & Bowerman, 1986 as cited in Clark 2003). Another common substitution is to use a stop in place of a fricative (Ferguson 1978, Olmsted 1971, as cited in Clark, 2003), as in [tæwi∫] for sandwic h; or occasionally the reverse: A final stop may become a fricative, as when up is produced as [^f] (Menn, 1971 as cited in Clark, 2003). Other common substitutions include fronting, where the child produces a consonant further forward in the mouth than the intended target, as in [ti] for key or [fik] for thick; and gliding, where children produce the glides /w/ and /y/, typically in place of the liquids /l/ and /r/, as in [wæbit] for rabbit. 1.6. Avoidance and topic change Schwartz and Leonard (1982) carried out an experimental study with a group of one-year-olds with small vocabularies. They attempted to determine the consonantal inventories and syllable structures for each child's current words. They then constructed a set of new words (unfamiliar forms), corresponding to unfamiliar referent-object and –actions for each child such that half the words contained consonants that the child used (IN words) and half consonants that the child didn't use (OUT words). They presented the IN and OUT words equally frequently to each child in play sessions over several weeks and observed all the spontaneous productions the children made. They produced a significantly greater number of IN words during the play session, and they produced them more rapidly than OUT words. At the same time, tests of comprehension showed no difference between IN versus OUT words. In addition to what was mentioned, avoidance is a common strategy clung to when you lack some phonological, lexical, or syntactic knowledge. Children just as adults would like to communicate. If they fail in one aspect, they will try to show their ability in other ways one of which can be avoidance of a phoneme, lexeme or structure. Even when they reach fluency passing for a near-native speaker, sometimes they avoid talking about certain issues with which they are not familiar. Therefore, it seems feasible to call both tactics to which children and adults resort as strategies. 2. Discussion All theories of first language acquisition have paved the way for coming up with logical ideas on the development of language in children despite their – sometimes biased – highly supported claims. Throughout this paper it has been attempted to have a non-biased look on how a child develops language as a medium of communication. It is noteworthy to mention that the author is not trying to call the previously-known theories of first language acquisition under question, but look at it from another perspective.

ISSN 2039-9340 Mediterranean Journal of Social Sciences Vol. 3 (11) November 2012
611
This model begins with basic necessities of the first language acquisition going through different stages until the child passes for an appropriate adult speaker in the society. What is quite vivid in this model is that in spite of the fact that it has the children and their language development in its focus, later some strategies are considered vital in the language used by adults. The model started with the idea of biological strategies, the first tangible ones in the hands of children to express their ideas in a primitive form. As long as behaviorism is concerned, the stimulus motivates them to have some reaction towards what they have found in the newly-stepped world. Nativists pay little attention – if any at all – to these aspects of language development. What they have in mind is the built-in language-specific device which is activated by exposure to input in the environment. However, what is missing is the role the society plays in the child language development. Social interactionists put emphasis upon this aspect saying that a child cannot develop language in a vacuum-like environment; they should be in constant contact with otherese to take the steps necessary to enhance their language-based communication. Although nativists believe that input is the component within the child's milieu of language development, they themselves underscore the poverty of access to ample input in the environment. Thus some questions still remain unanswered: What does exposure to input within the environment mean from innatists' point of view? How much input is needed for the child to go through language development? How much does it take to grasp this input from environment? Is language acquired as fast as it has been claimed? And last but not the least, aren't adults in need of input to communicate up to the end of their life, so it is not necessarily peculiar to first language development. On the contrary, social interactionists and constructivists stressed the significance of social factors in language development. Without their presence in the society, children are not able to materialize the most important function of language, i.e., communication for which it was originally developed: communication. If the purpose is communication, humans need to have some strategies to resort to so as to exchange information or convey what they mean to the society of which they are a member. Analytical strategies of the model presented in this paper consider this issue showing that by stepping to the social setting there exists a number of strategies paving the ground for appropriate communication. The model presented has taken into account many factors which is not considered anew; however, it has its own processes of development. Just as sensory development is beneficial in language development, sensory deprivation can stand on the way of child language development. Society assists children as much, if not more, as the senses they cling to deal with their basic needs. And with their mind cognitively developed by coming into contact with otherese, children infer that if they happen to find communication difficult, they can make use of compensatory strategies so as to keep the flow of communication surfing. The question which may occupy the mind of many is the stand of compensation strategies in this model. In the course of child language development, compensation strategies are quite noticeable as they point, gaze, touch, cry, smile, and frown. This is not just the case with biological strategies, since when they enter the society with which they are not as familiar as they should, they have no choice but to use some supplements to make up for what they lack. These strategies make their way into even analytic ones when, for example, the child cannot easily differentiate the variation in color, hence, overgeneralization occurs to compensate for this inability. However, as it is illustrated in the model, compensation strategies serve as helping hands to both biological and social strategies; therefore, they act as subsidiary ones in case that child can attend to as the last resort. However this function is absent in analytical strategies. The reason can be delved into by looking at two perspectives: first of all with the cognitive development, children reach the level at which they can use many analyses to find solutions for their failure in communication so there is little room for compensation. On the other hand, adulthood does not mean that you are all the time able to tackle language appropriately due to discourse-based issues such as style, register, and formality, etc; therefore, compensation strategies come to the last act on the model to make up for the prospective communicative failures. Compensation strategies don't die down with children passing for a competent speaker of their language. When we, as adults, cannot find the right language to communicate, we use some strategies to make ourselves understood. In a word, it is not the phonological problems which push the children to use compensatory devices to convey meaning, but it can appear in the lexical usage, structural choice, style and register and in fact discourse-based uses. Figure 1 would be the model of language development.
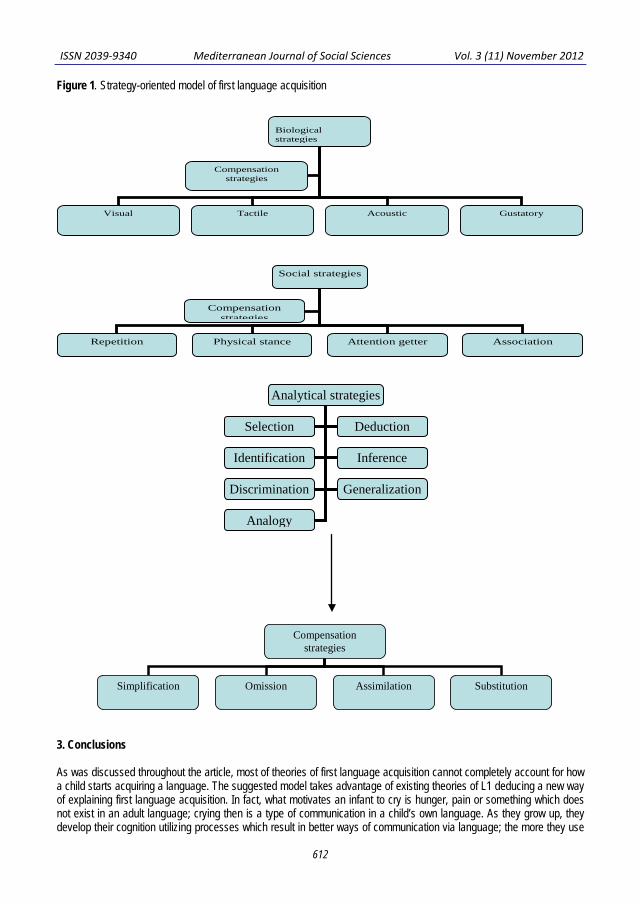
ISSN 2039-9340 Mediterranean Journal of Social Sciences Vol. 3 (11) November 2012
612
Figure 1. Strategy-oriented model of first language acquisition
3. Conclusions As was discussed throughout the article, most of theories of first language acquisition cannot completely account for how a child starts acquiring a language. The suggested model takes advantage of existing theories of L1 deducing a new way of explaining first language acquisition. In fact, what motivates an infant to cry is hunger, pain or something which does not exist in an adult language; crying then is a type of communication in a child’s own language. As they grow up, they develop their cognition utilizing processes which result in better ways of communication via language; the more they use
Biological strategies
Visual Tactile Acoustic Gustatory
Compensation strategies
Social strategies
Repetition Physical stance Attention getter Association
Compensation strategies
Analytical strategies
Selection Deduction
Identification Inference
Discrimination Generalization
Analogy
Compensation strategies
Simplification Omission Assimilation Substitution

ISSN 2039-9340 Mediterranean Journal of Social Sciences Vol. 3 (11) November 2012
613
their cognition, the less they resort to the basic strategies they used when they were born to get the meaning across. However, their cognition is not that much developed hence compensation strategies are always present during childhood; in social contacts, children, although successful from the beginning when they are quite capable of directing their mothers’ attention to themselves to fulfill their needs, are sometimes short of right techniques to convey meaning; this is the point at which compensation strategies come to their help. Strategies form different types of behavior a child show to attain what he needs. On the whole, the model easily shows that when children are not cognitively developed, they use some strategies of basic types; when they come into contact with people in their social environment, they learn much from others and add these strategies to their reservoirs for effective interactions in the future; steadily they try to analyze their surroundings and occurrences which sometimes are not easily understandable, therefore, they search through their reservoirs of strategies they have developed so far in order to find the best way to respond to their environment. In case they encounter difficulty using what they have in their reservoirs, they resort to compensation strategies on specific occasions to handle communication. This model is a bid to advance the notion of strategy highlighting the interconnectedness of biological, social, analytic and compensation strategies which complement each other throughout childhood, which may pass on adulthood as well. In future, further research on L1 strategies as well as case studies on different L1 contexts can pave the way for first language acquisition researchers to look at these processes more broadly considering the amalgamation of behaviorists, cognitivists, socio-constructivists’ doctrines to present a model of L1 acquisition which is more logical and empirically-viable.
References Baker, C. M. (2002). The atoms of language: The mind’s hidden rules of grammar. New York: Basic Books. Brown, H. D. (2000). Principles of language learning and teaching (4th ed). Longman. Chomsky, N. (1986). Knowledge of language as a focus of inquiry: Its nature, origin, and use. New York: Praeger. Clark, V. E. (2003). First language acquisition. Cambridge: CUP. Cutting, E. J., & Rosner, S. B. (1974). Categories and boundaries in speech and music. Perception and Psychophysics, 16, 564-570. Fromkin, V., Krashen, S., Curtiss D. R., & Rigler, M. (1974). The development of language in Genie: a case of language acquisition
beyond the critical period. Brain and Language 1, 81-107. Gould L, J., and Marler, P. (1987). Learning by instinct. Scientific American, 255 (1), 74-85. Ingram, D. (1974). Phonological rules in young children. Journal of Child Language, 1, 49-64. Kluender, K. R., Diehl, R. L., & Killeen, P. R. (1987). Japanese quail can learn phonetic categories. Science, 237, 1195-1197. Kuhl, P. K., & Miller, J. D. (1975). Speech perception by chinchilla: Voiced-voiceless distinction in alveolar plosive consonants. Science,
190, 69-72. Kuhl, P. K., & Padden, D. M. (1982). Enhanced discriminability at the phonetic boundaries for the voicing feature in macaques.
Perception & Psychophysics, 32, 542-550. Labov, W., & Labov, T. (1978). The phonetics of cat and mama. Language, 54, 816-852. Lust, C. B., & Foley, C. (2004). First language acquisition: The essential readings. Blackwell Publishing. Macnamara, J. (1982). Names for things: A study of human learning. Cambridge, MA: MIT Press. Miller, N., Maruyama, G., Beaber, R. J., & Valone, K. (1976). Speed of speech and persuasion. Journal of Personality and Social
Psychology, 34 (4), 615-624. Parker, F., and Riley, K. (2005). Linguistics for non-linguists (4th ed). Allyn & Bacon. Pinker, S. (1984). Language learnability and language development. Cambridge, MA: Harvard University Press. Pullum, G. K. (1996). Learnability, hpyerlearning, and the poverty of the stimulus. In J. Johnson, M. L. Juge, & J. L. Moxley (Eds.),
Proceedings of the 22nd annual meeting of the Berkeley Linguistic Society, Parasession on the role of learnability in grammatical theory (pp. 498-513). Berkeley, CA: Berkeley Linguistics Society.
Pullum, G. K., and Scholz, C. B. (2002). Empirical assessment of stimulus poverty argument. The linguistic Review, 19 (1-2). Schwartz, G, R., & Leonard, B. L. (1982). Do children pick and choose? Journal of Child Language, 9, 319-336. Slobin, D. I. (1973). Cognitive prerequisites for the development of grammar. In C. A. Fergusen & D. I. Slobin (Eds.), Studies of child language development (pp. 175-208). New York: Holt, Rinehart & Winston. Smith, N. V. (1973). The acquisition of phonology: A case study. Cambridge: Cambridge University Press. Williams, M., & Burden L, R. (1997). Psychology for language teachers: A social constructivist approach. Cambridge: CUP.

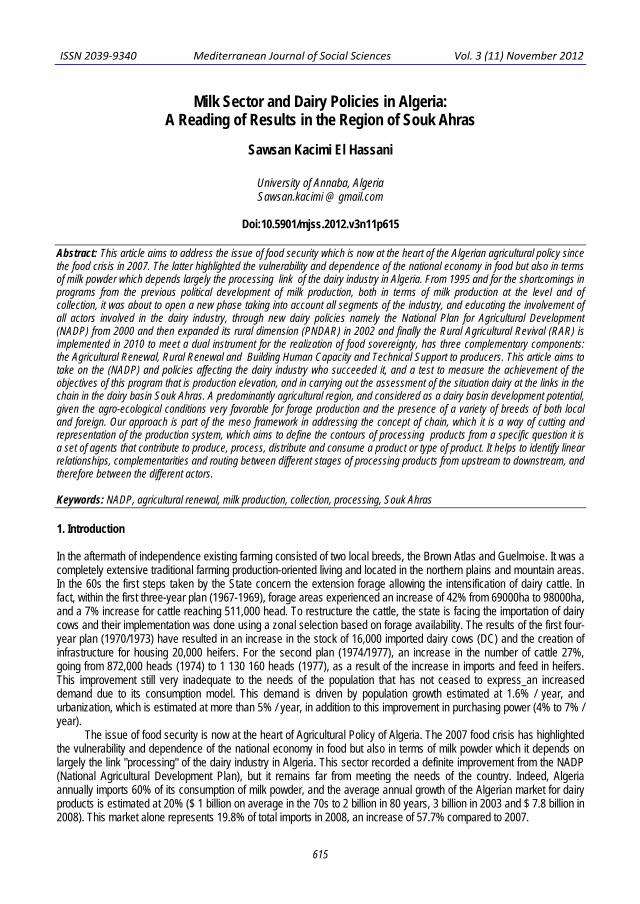
ISSN 2039-9340 Mediterranean Journal of Social Sciences Vol. 3 (11) November 2012
615
Milk Sector and Dairy Policies in Algeria:
A Reading of Results in the Region of Souk Ahras
Sawsan Kacimi El Hassani
University of Annaba, Algeria Sawsan.kacimi @ gmail.com
Doi:10.5901/mjss.2012.v3n11p615
Abstract: This article aims to address the issue of food security which is now at the heart of the Algerian agricultural policy since the food crisis in 2007. The latter highlighted the vulnerability and dependence of the national economy in food but also in terms of milk powder which depends largely the processing link of the dairy industry in Algeria. From 1995 and for the shortcomings in programs from the previous political development of milk production, both in terms of milk production at the level and of collection, it was about to open a new phase taking into account all segments of the industry, and educating the involvement of all actors involved in the dairy industry, through new dairy policies namely the National Plan for Agricultural Development (NADP) from 2000 and then expanded its rural dimension (PNDAR) in 2002 and finally the Rural Agricultural Revival (RAR) is implemented in 2010 to meet a dual instrument for the realization of food sovereignty, has three complementary components: the Agricultural Renewal, Rural Renewal and Building Human Capacity and Technical Support to producers. This article aims to take on the (NADP) and policies affecting the dairy industry who succeeded it, and a test to measure the achievement of the objectives of this program that is production elevation, and in carrying out the assessment of the situation dairy at the links in the chain in the dairy basin Souk Ahras. A predominantly agricultural region, and considered as a dairy basin development potential, given the agro-ecological conditions very favorable for forage production and the presence of a variety of breeds of both local and foreign. Our approach is part of the meso framework in addressing the concept of chain, which it is a way of cutting and representation of the production system, which aims to define the contours of processing products from a specific question it is a set of agents that contribute to produce, process, distribute and consume a product or type of product. It helps to identify linear relationships, complementarities and routing between different stages of processing products from upstream to downstream, and therefore between the different actors. Keywords: NADP, agricultural renewal, milk production, collection, processing, Souk Ahras 1. Introduction In the aftermath of independence existing farming consisted of two local breeds, the Brown Atlas and Guelmoise. It was a completely extensive traditional farming production-oriented living and located in the northern plains and mountain areas. In the 60s the first steps taken by the State concern the extension forage allowing the intensification of dairy cattle. In fact, within the first three-year plan (1967-1969), forage areas experienced an increase of 42% from 69000ha to 98000ha, and a 7% increase for cattle reaching 511,000 head. To restructure the cattle, the state is facing the importation of dairy cows and their implementation was done using a zonal selection based on forage availability. The results of the first four-year plan (1970/1973) have resulted in an increase in the stock of 16,000 imported dairy cows (DC) and the creation of infrastructure for housing 20,000 heifers. For the second plan (1974/1977), an increase in the number of cattle 27%, going from 872,000 heads (1974) to 1 130 160 heads (1977), as a result of the increase in imports and feed in heifers. This improvement still very inadequate to the needs of the population that has not ceased to express an increased demand due to its consumption model. This demand is driven by population growth estimated at 1.6% / year, and urbanization, which is estimated at more than 5% / year, in addition to this improvement in purchasing power (4% to 7% / year).
The issue of food security is now at the heart of Agricultural Policy of Algeria. The 2007 food crisis has highlighted the vulnerability and dependence of the national economy in food but also in terms of milk powder which it depends on largely the link "processing" of the dairy industry in Algeria. This sector recorded a definite improvement from the NADP (National Agricultural Development Plan), but it remains far from meeting the needs of the country. Indeed, Algeria annually imports 60% of its consumption of milk powder, and the average annual growth of the Algerian market for dairy products is estimated at 20% ($ 1 billion on average in the 70s to 2 billion in 80 years, 3 billion in 2003 and $ 7.8 billion in 2008). This market alone represents 19.8% of total imports in 2008, an increase of 57.7% compared to 2007.

ISSN 2039-9340 Mediterranean Journal of Social Sciences Vol. 3 (11) November 2012
616
Note that we are interested in the dairy industry in Algeria, but more specifically to the players in the industry of the province of Souk Ahras, located in the North East of the country, a region that holds more than half of the national dairy cattle 58.4% (MT Benyoucef, 2005) and whose total BLM (Modern Dairy Cattle) is estimated at 46.6% of the national dairy cattle. But what about performances? This region can be viewed as a pool slag having the same potential overflow of self-sufficiency? And if it is not the case, what are the real factors behind this situation of dependence milk powder for the link “processing”? And what possible ways to overcome them?
Studying the local dimension or territorial approach, allows to understand better the mechanisms of this chain. The dairy basin is defined as an area organized around a pole merchant, draining the flow of milk or milk products, and the industry is also involved in its spatial organization, economic and social functioning.
It is in this vein that we propose through this article to answer the following question: what were the objectives for the NADP dairy industry? This plan has been successful in achieving its goal of raising milk production in the diary basin of souk ahras?
We start from the hypothesis that the region of Souk Ahras is a basin of milk production and collection with the potential to achieve self-sufficiency in the region but it is not achieved due to lack of processing manufactories and good organization of the collection network. When the second hypothesis concerning the NADP, it has resulted in improved milk production but it is still far from guaranteeing self-sufficiency in the region.
To answer the questions above and test our hypothesis, our work will focus on two main parts namely: - The new dairy policy including NADP and policies that succeed. - Presentation of data changes in the dairy industry dairy Souk Ahras basin during the last decade. 2. Overview of new dairy policies in Algeria Views the shortcomings in programs from the previous development policies of milk production, both in terms of milk production level and collection, a national consultation on the development of agriculture was held in 1992 which had enabled a relatively complete inventory of the national milk production. Two years later, the Ministry of Agriculture and Fisheries decided to create a commission to promote the development of milk production. Less than a year later it was issued the ministerial circular of 1995, opening a new phase, by taking into account all segments of the industry, and educating the involvement of all actors of the milk sector. Financial allocations have been released since 1995 of 04 billion dinars (500 million + awarded in 2000) (Kherzat, 2006). The three main programs of rehabilitation policy of national milk production are: the promotion of the collection, to encourage the implementation of mini-dairies, and the development of milk production. Note, however, that the criteria set differed from the scope of incentives very small farmers and ranchers out basement. However, the second instruction revisited the criteria for access to incentives and setting eligibility, in order to be less tight, which would broaden the scope of action by integrating the mass of small farmers. It also introduced a new chapter that is the creation of collection centers. As for the third statement, it has put in place measures to support the production of selected heifers, to boost local expansion capacity of livestock and reduce imports dependence (Cherfaoui et al , 2006). 2.1 The National Agricultural Development Plan (NADP) The situation of chronic food deficit has led the government to develop a national program of agricultural development from 2000, considered as a solution for curbing the agricultural sector. This new agricultural development policy constitutes a break with past policies. Indeed, the NADP is wanted as an instrument that seeks people's access to food, according to the conventionally accepted standards, better coverage of consumption by the production of agricultural inputs and propagating material.
In this sense the NADP; whose purpose is the restructuring of agricultural land to expand production both quantitatively and qualitatively; focuses on encouraging and supporting farms and which is financed by the Fund National Regulation and Agricultural Development (FNRDA), which is an aid to the upgrading of farms and production chains. This device has benefited to nearly 220,000 farms but excluded 600 000 scattered or isolated farms (Bessaoud, 2006) which represents a rural population of nearly 10 million people. In 2002 came the National Rural Agricultural Development Plan (NRADP) which is the extension of the privious plan to the rural dimension, and the revitalization of rural areas through improved living conditions, and with the main objective of reducing regional disparities by developing activities of a social, economic and environmental character, with the participation of local actors. The (NRADP) revolves around two components: the development plan of the farms supported by the (FNRDA), and the revitalization of rural areas through local schemes and projects of rural development (PRD). It is a specific approach to support rural populations including technical, organizational and financial efforts to make economic activities sustainable, income generating and able to

ISSN 2039-9340 Mediterranean Journal of Social Sciences Vol. 3 (11) November 2012
617
provide them with better food security and favorable living conditions (MARD, 2003). It is designed as a tool for sustainable development activities in order to ensure the stability of rural communities. Reading the table below, it appears that between 2000 and 2007 the total premiums granted to farmers to encourage production of advantage of raw milk has evolved significantly, the amount of 1.38 billion DA, or 2.76 times the amount granted in 2000 which is 500 million dinars. Premium producers are moderately 59% of the total amount allocated to the various agents of the dairy industry over the period (2000-2007). The incentive premium to local production of milk delivered to the transformation, it increased from 5 DA/liter of raw milk produced and sold to processing plants in 2000 to 7 DA/liter in 2005 and to 12DA/liter from 2010 until today. Table 1. Evolution of measures to support production by state funds
Depreciation 2000 2001 2002 2003 2004 2005 2006 2007
Total premium diary industry (103DA)
867967 939901 911993 958522 1238004 1903051 2587652 2537941
Premium producers (103DA) 500598 520858 578915 632293 796698 1136169 1399042 1380513 Milking trolleys (103DA) 2757 4164,2 45686 23915 28269 - - -
Number of units 58 667 582 321 409 298 133 - Source: (MARD, 2007) However, there are also other subsidies for farm investment granted to farmers who have more than 6 cows: they can receive funding for irrigation equipment, premiums of 5000 DA / ha for forage production, and incentives for the construction of silos and silage production. In addition to the promotions of farm investment, the overall management of artificial insemination at the farm level is applied for a decade already. (KALI S., et al, 2011) 2.2 Policy Renewal Agricultural and Rural This policy reflects the challenge of building sustainable national food security. It is thus to reduce vulnerabilities in the context of a public-private partnership, and with a strong involvement of the different actors and the emergence of a new governance of agriculture and rural areas. In fact, the food crisis that occurred in 2007/2008 focused on the need to modernize and develop the Algerian agriculture. To remedy this situationm a policy of Agricultural and Rural Renewal (ARR) is implemented as an instrument for the realization of food sovereignty. Through its three complementary components: the agricultural renewal, the rural renewal, and strengthening of rural human capacity and technical support to producers.
The five-year program mobilizes around 1000 billion dinars incentives for private investment and spends 200 billion dinars / year to support agriculture and rural renewal. It is expected that this program, in 2014, improving the food security of Algeria, induced by improvement in the rate of growth of average agricultural production (6% per year (2000-2008) to 8.33% over the period (2010-2014)), increasing domestic production and improving its integration and its collection, sustainable recovery of the industrial and improving national integration agro-industrial and job creation especially in poor areas of job creation opportunities and off-farm income (MARD, 2010).
On the dairy, agricultural renewal policy aims to increase domestic production of raw milk and raw milk volume collected. To achieve these objectives, three programs are implemented: (MARD, 2010) 1 - The program to upgrade dairy farms: improving conditions for livestock, making food availability through the development and practice fodder silage and finally mastering the reproduction by developing artificial insemination. 2 - The program increased staffing dairy and raw milk collection: framework for the collection is provided by the National Interprofessional Office of Dairy (NIOD) which has an agreement with MARD and dairies and dairies in turn are under agreement with the collectors and breeders 3 - The technical support that is given to the ITELV the CNIAD and CETO and the financial oversight of the dairy industry set is achieved through three mechanisms: The interest-free credit (RFIG), the FNRPA to support the production, collection and integration of raw milk and FNDIA to finance investments in the farm. Authorities through the development program of renewal dairy farming, aimed at young people interested investors in various sectors, including that of milk by providing a package of incentives for the collection and production, with support to 12DA / l for any breeder producing raw milk. Support of 5DA / l for collectors and collection centers. Support of 5DA / l

ISSN 2039-9340 Mediterranean Journal of Social Sciences Vol. 3 (11) November 2012
618
for any transformer manufacturer pasteurized milk (MARD, 2011), in order to increase production and delivery, collection and integration of raw milk industry. And the dairy industry was reorganized on the basis of the multiplication of contracts sponsored by NIOD, linking farmers and dairies, farmers and collectors and / or collectors and dairies. This revival of the sector has led to the revitalization of the Interprofessional Council in an effort to reinforcement of relations between professionals (farmers, collectors, dairy) and joint discussions to resolve problems for some and for others (Chehat, 2010).
The results made on the occasion of the 11th session of the "evaluation meeting quarterly performance contracts renewal agricultural and rural wilayas" show production of 2.92 billion liters of milk then the overall objective selected under performance contracts for this year was 2.73 billion liters. Collection of raw milk was 510 million liters for the 2010-2011 season, this collection volume is significantly higher compared to the level of the average annual milk collection during the period 2005 -2008 which was of the order of 200 million liters. The wilaya of Tizi Ouzou, Setif, Bordj Bou Arreridj, Sidi Bel-Abbes, Constantine, Tlemcen and Souk Ahras totalize two-thirds of total national collection of raw milk. (MARD, 2011) 3. Basin dairy Souk ahras: Between potential and constraints of developing The province of Souk Ahras lies in the extreme north of the country, bounded on the north by the wilaya of Tarf and Wilaya of Guelma, to the west by the Wilaya of Oum El Bouaghi, to the south by the Wilaya of Tebessa and the east by Tunisia. It extends over an area of 4359.65 km2, this region is a predominantly agricultural area of 253 606ha, and is considered as a dairy basin with development potential, views the agro-ecological conditions very favorable for fodder production and the presence of a variety of breeds of both local and foreign. Note that the cattle predominate in the plains and mountain areas. Agriculture and Livestock plays an important role in the household economy, the population was estimated at 454,034 inhabitants, with a density of 104 inhabitants per km2 and with a rate of 36.45% rural. The active population is 108,300 which 18% of is paid in agriculture. Indeed, the number of farms is 15 018 (82% private): 219 collective farms (EAC), 2510 individual farms (EAI) and 03 pilot farms. Table 2. Distribution of farms in the region of Souk Ahras
number Area (h) Area (%)
Pilot farms 03 1688 0,5 Collective farms 219 27194 08,7 Individuel farms 2510 25100 08
Private properties 12286 257510 83 Total 15018 311492 100
Source: Compiled based on data from the DAS Souk Ahras (2010) Note, however, that the region has a hilly terrain with an average altitude of 1000 m north and 650 m to the south, two inhomogeneous sets determining the geomorphological configuration of the Wilaya, mountainous north and forestry composed of 12 municipalities with an area of 1879, 58 km2, and South consists of high plains and pasture encompassing 14 municipalities covering an area of 2480.07 km2. Like this wilaya is located on the heights of the Tell Atlas, it is exposed to climatic influences Mediterranean on one hand, and desert on the other.
The government strategy; by involving the rehabilitation of the dairy production in order to reduce the value of imports; includes the phases of intervention mainly rehabilitation milk basins, including the province of Souk Ahras. This wilaya offers significant socio-economic benefits and can improve the level of production.
From the advent of NADP, the agricultural sector has benefited from important investments funded by the FNRDA. An initial amount of over $ 1.7 Billion DA was used to fund various operations in the program of development of agricultural products, by sector, and 35 million DA towards the development of the dairy industry in 2004. The total granted by public authorities for the benefit of Wilaya de Souk Ahras for the period 2010-2014, all programs, amounted to 97.828 billion DA, plus the remainder of the five-year program 2005-2009 which is of the order of 33.424 billion DA is a total budget of 131.252 billion DA. This significant allocation granted by the Five-Year Plan 2010-2014, will let to improve the living conditions of the population, to develop basic infrastructure, and to support economic development and modernization of the public service, agriculture and forests (DAS Souk Ahras, 2010)

ISSN 2039-9340 Mediterranean Journal of Social Sciences Vol. 3 (11) November 2012
619
Table 3. Results of the 2005-2009 five-year plan in the province of Souk ahras 2005-2009
The Five-year olan 2005-2009 Total agricultural area (S.A.T) 311000ha
Agricultural area (S.A.U) 253600ha irrigated area 6800ha
Number members of FNRDA and FNDIA 6850 Agricultural production 17,456 billion DA
cattle breeding 87600 head Milk production 45 million liters
Source: (DSA Souk ahras, 2010) 3.1. Dairy cattle: Numbers and Production About 90,900 cattle heads of the wilaya include 47,900 cows for 2010, held by 4800 farmers whose only 1084 farmers (23%) have a certificate and a card issued by the Chamber of Agriculture. Note that the number of farmers with a herd of modern dairy cows (MDC) and improved dairy cows (IDC) does not exceed 1 480 farmers out of a total of 4800 farmers, 31% only. It also notes from the 2007 data that 75% of farmers have a herd of less than 06 cows, and only 10% have a herd of over 13 cows. The amount of milk produced in the province increased from 45 million liters in 2007 to more than 77 million liters in 2010. While forage production does not exceed 500 000 quintals of the 30 000ha reserved for this purpose (DAS Souk ahras, 2010). Indeed, it is clear that the most efficient cows are located in the plains area with high potential for forage, against the local dairy cow (LDC) the majority is present in the mountainous area. Feeding for milk production is based mainly on concentrates. As fodder, the essential is provided by the natural fodder and vetch oats. Concerning water supply, cows do not have access at all times to drinking water because of severe lack of equipment such as automatic waterers or other material in livestock buildings. Table 4. Detail of cattle in the wilaya
Source: (Direction of Agricultural Services-DAS Souk Ahras 2010) Reading the table above, it appears that the LDC is the predominant race in dairy cattle (58%) while the MDC assumed to have superior performance represents only 18% of the dairy herd of the wilaya. Indeed, there are three types of dairy farms: - Farms Dairy-dominated local LDC, made by cow breed "guelmoise" famous in the region; - Farms Dairy domination in modern MDC, from importing and performance remains inadequate and below the average expected production; - Farms dairy Cattle domination improved IDC, resulting from a cross between the local dairy cattle and dairy cattle modern. This type of dairy cattle is a multitude of phenotypic fact that the crossing is usually a randomly without tree control (Mamin et al, 2011). The milk production is about 92 million for the year 2011 which represent 20% more than the previous year, this production is provided by the 32% dairy cattle modern, this improved performance is due to the importation policy of heifers, and the genetic improvement of dairy cattle.
Year 2007 2010 2011 Cattle DC MDC IDC LDC DC MDC IDC LDC DC MDC IDC LDC
staff (heads) 45800 7300 11400 27100 47900 7942 11755 28183 50100 9000 12100 29000 % 100 16 25 59 100 16 25 59 100 18 24 58
Production (103L) 45000 - - - 77000 20020 23870 33110 92000 29400 - - % 100 - - - 100 26 31 43 100 32 - -
Production/cow/year (L) 982 - - - 1608 2521 2027 1175 1836 3266 - -

ISSN 2039-9340 Mediterranean Journal of Social Sciences Vol. 3 (11) November 2012
620
Table 5. Discharge of dairy production
2007 2010 Evolution Quantity (L) % Quantity (L) % Quantity (L) % Breast feeding 5500000 12 18095000 23 12595000 229 Self-consumption 12150000 27 12966800 17 816800 06,7 Informel commerce 21140000 47 33738200 44 12599360 57 Approved collection 6210000 14 12200000 16 5982812 96 Total production 45000000 100 77000000 100 31993800 71
Source: (DAS Souk ahras, 2010) The province reveals the phenomenon of informal sale of milk in dairies and cafes whose quantities are estimated at 33 million liters (2010). Indeed, the informal sale represents 47% of the total average production of the wilaya (2010) distributed as follows: - 31% of dairies; - 2.5% of cafes; - 13.5% of collectors not approved for processing. Approved collection for 2007 represents only 14%, while consumption represents 27% resulting mainly from the local breed situated in the most inaccessible areas, particularly in rural communities in number 21 of 26. Note that breastfeeding represents 12% of total production, this is due to the high cost of food. This percentage increased in 2010 for the same reason to 23%, production registered a growth of 71% and 16% approved collection due to the incentives of the state, but it remains far short of program goals. While the informal sale continues with 44% of total milk production. On 4800 1084 livestock breeders only 23% have a card issued by the breeder Chamber of Agriculture of the province and may be eligible for support from FNDIA FNRPA and therefore fit into the dairy program. Table 6. Evolution of the number of livestock and dairy cattle in the rehabilitation program of raw milk
Years Number of approved dreeders Number of breeders integraed
into the workforce programme 2000 329 264 2001 306 305 2002 280 216 2003 265 247 2004 258 254 2005 314 278 2006 298 280 2007 378 342 2008 258 339 2009 1204 1084
Source: (DAS Souk ahras, 2010) The number of farmers actually enrolled in the rehabilitation program of raw milk in 2007 is 342 as shown in the table above. On the total number of dairy cattle, only 2756 dairy cows (06%) with 68% of MDC and 25% of IDC are integrated into the program. The year 2009 was marked by the number of farmers included in the program that reached 1,084 farmers, an increase of 216% compared to 2008. This number can be explained by the increased subsidies that induced a recovery of investment in cattle, and also explains the strong demand for the purchase of high dairy potential cows. Note that for the year 2011, 2100 of the 5000 farmers livestock are integrated in the collection program.

ISSN 2039-9340 Mediterranean Journal of Social Sciences Vol. 3 (11) November 2012
621
3.2 Collection and processing Milk collection is justified in the case of a supply basin away from the factory and when milk production is ensured by small farmers with difficult access to their farms because of the roads that incentive to increase their milk production (Bara, 2009). Table 7. Evolution of the collection of raw milk in the province Souk Aras
Source: (DAS Souk ahras, 2010) Although the collection in 2009 represents 2.82 times the collection in 2000 and 2.54 times compared to the average of previous years, it represents only 16% of total production in 2009 (the collection rate was 7.8 % in 2001). This increase in the collection is the result of encouragement from the state since 1995 and with FNDA FNRDA in 2000, and the current through FNRPA premiums allocated to both collectors (5DA / L), farmers who deliver their production (12DA / L) and from 2009 under the Rural Renewal processors (5DA / L) that incorporate the milk collected locally. While the province has 03 collection centers, it have several collection points in areas of high potential dairy with a capacity of 50 685L/day collection, and 12 private collectors involved in the rehabilitation program of milk with a daily capacity of 20 050L, thus totaling a collection capacity of 70735L / day or more than 02 million liters of milk collected per month. In 2007 within the framework of FNRDA 214 785 568 DA has been allocated for investment in farms and extension of the network of milk collection equipment and processes to achieve a 50 000l / day. For the transformation, one private unit (dairy HAMADA) is functional with annual technical capability of 13 million liters, but this does not mean that 06 units out wilaya also supply from Souk Ahras (1 Annaba, 1 El Tarf, 1 Guelma, 1 Skikda, 2 Constantine). The problem of low milk integration is not only the result of the lack of processing facilities in the wilaya, but is rather due to weaknesses in the collection and transport of milk to existing processing structures. These deficiencies due to the difficult access to douars, an impediment for collectors especially in the rainy season in addition to the conditions of transport of milk delivered to dairies directly. The latter complain of the poor quality of milk delivered. The milk sector operates primarily on the basis of imported raw materials. It is milk powder and anhydrous milk fat (AMF) to be added to drinking water to reconstitute milk. This will serve as a basis for the manufacture of various dairy products (yogurt, pudding, cheese ...). 3.3. Constraints encountered and possible solutions for the dairy industry Based on our interviews with officials of the Directorate of Agricultural Services (DSA) of Souk Ahras and our meetings with farmers, constraints of the dairy industry in the wilaya can be listed as follows:
- The traditional way of conducting livestock despite the evolution of livestock, increased production and growth in the number of breeders. This is exacerbated by the reluctance of farmers LDC (65%) for the operation of testing and artificial insemination supported by the state. Until September 2011, only 29 cows were inseminated with 08 successful cases (27% success. - Insufficient sole forage (07% of UAA) and low diversification of fodder crops and therefore livestock feed. Adding to this the absence of a feeding plan; - Aging herd and presence of unproductive dairy cows; - The poor organization of the activity of collection so that the device remains insufficient in relation to the production and the importance of the informal network representing 47% of the production; - Weak capacity of local transformation (one dairy). Farmers do not only need material for agricultural work but also to be accompanied and assisted in monitoring and technical advice. Solutions can be envisaged to address these constraints, indicative and not exhaustive, are as follows: - Continuing Operations extension outreach with the local breed breeders to motivate them to integrate into the program; - Restocking infrastructure cattle by forms of partnership; - Increase the capacity of collection and processing, with a ban on the sale of raw milk informal;
Years 2000 2001 2002 2003 2004 2005 2006 2007 2008 2009 quantities 4319000 3526400 3933800 4127000 5966600 5196400 5000000 6217200 12807000 12200000

ISSN 2039-9340 Mediterranean Journal of Social Sciences Vol. 3 (11) November 2012
622
- Improvement of rangelands and development of fodder production through conversion of fallow and crop diversification; - Development of the practice of silage; - Improved animal performance; 4. Conclusion To conclude this research, it is important to note the following points regarding the dairy industry in Algeria: - A disconnected domestic market; - An industry facing the base of the processing imported milk powder; - A pricing structure in favor of recombined milk; - Structural constraints of the processing industry. Rehabilitation of milk production is seen as a necessity in regard to the potential that the sector holds one hand to the place this product in food security on the other. She also became inevitable, based on the weight of imports of dairy products for the production of recombined milk and generating a heavy bill currency, moreover, the challenge is to meet the challenge by limiting the dependence of markets outside a tolerable level and improving the capacity and environment production. However, the development plan for the dairy industry has not had the desired effect. Indeed, the study of the industry in the province of Souk Ahras revealed that the approved collection for 2007 is only 14%, while consumption represents 27% resulting mainly from the local breed (LDC). Note that breastfeeding represents 12% of total production, this is due to the high cost of food. This percentage increased in 2010 for the same reason, to 23% during the year 2010, production registered a growth of 71% and 16% approved collection due to the incentives of the state, but it remains far short of program goals. While the informal sale continues with 44% of total milk production.
As for the outlook for the sector at Souk ahras, an agreement between the Institute of breeding techniques (ITELV) Algiers and the French Britain International, which focuses on training and support to 300 farmers cows to increase milk production. The specifications of the Technical Support Group for dairy farmers Souk Ahras was signed by 69 professionals of this sector since the beginning of the operation in February 2012. Among the objectives of this program which extends over 3 years, is improving to 50% yields of dairy cows and the cattle of 30%, the provision of local services and presenting suggestions to farmers to improve milk production and encouraging the creation of professional associations, in addition to identifying the needs of farmers training. In case the results of the program in the provinces committed drivers namely: Souk Ahras, Blida and Relizane; proved successful, the program would be extended to 22 provinces of the country in order to increase milk production.
We can conclude then by the need to support the productivity of 03 axes, namely: the local production of tools, productivity that will meet regional standards, the collection that will end the informal market and the creation of processing units locally.
References
Aissaoui, C., Benkahla A., Aouadi H. (2003) «Caractérisation du bovin race locale dans l’Est Algérien : Etude
biométrique et structurale du troupeau », Rencontres. Recherches. Ruminants, n°10, P111, disponible on-line http://www.journees3r.fr/IMG/pdf/systemes_21_Aissaoui.pdf
Benyoucef M.T., (2005) « Diagnostic systémique de la filière lait en Algérie », thèse de doctorat d’Etat en sciences agronomiques, INA Alger
Bessaoud O., (2006) « La Stratégie de Développement Rural en Algérie », Options Méditerranéennes, sér.A/n°71, P83 CACI, Rapport de présentation du secteur agroalimentaire en Algérie : projet Emed- commission Européenne, chambre algérienne de
commerce et d’industrie (CACI) Chehat F., « La politique de soutien à la production agricole et ses effets à l’offre à la consommation », disponible on-line
http://www.mincommerce.gov.dz/seminaire/semprixprod/comuniq3.pdf Cherfaoui M.L., Mekersi S., Amroun M., (2006) « Le programme national de réhabilitation de la production laitière: objectifs visés,
contenu, dispositif de mise en œuvre et impacts obtenus », P04, disponible on-line www.inraa.dz/spip.php?article14 Collection statistiques 2009 n°144 série E, indices des prix à la consommation ville d’Alger et National 1998-2008, ONS, Alger, P45-55. Djebbara M, 2008, « Durabilité et politique de l’élevage en Algérie. Le cas du bovin laitie »r, Colloque international , Développement
durable des productions animales : enjeux, évaluation et perspectives, Alger, INA, Alger Doufene H., « la place réservée à la petite paysannerie par les pouvoirs publiques en Algérie », disponible on-line
www.ummto.dz/IMG/pdf/Com-_Doufene-_pdf

ISSN 2039-9340 Mediterranean Journal of Social Sciences Vol. 3 (11) November 2012
623
DSA (Direction des Services Agricoles) 2010 la wilaya de Souk Ahras Kali S., et al (2011) « Situation de la filière lait en Algérie: Approche analytique d’amont en aval », livestock research for rural
developement, vol23, disponible on-line http://www.lrrd.org/lrrd23/8/Kali23179.htm Kherzat B., 2006 « Essai d'évaluation de la politique laitière en perspective de l'adhésion de l'Algérie à l'Organisation Mondiale du
Commerce et à la Zone de Libre Echange avec l'Union Européenne », mémoire de magister, INA Alger, P38-40 Madani T., Mouffok C., (2008) « Production laitière et performances de reproduction des vaches Monttbéliardes en région semi-aride
algérienne », Revue d’Elevage et de Médecine Vétérinaires des Pays Tropicaux,n°61, P :97-107, disponible on-line http//www.remvt.cirad.fr/cd/derniers_num/2008/EMVT08_097_107.pdf
MADR (2003) « Rapport national sur les ressources génétiques animales en Algérie » MADR (2010) « Le renouveau agricole » disponible on-line http://www.miagri.dz/image/affiche/lait1%20fr.jpg MADR (2010) « Présentation de la politique de renouveau agricole et rural en Algérie et du programme quinquennal en Algérie2010-
2014 », P1-5, disponible on-line http://www.minagri.dz/pdf/Presentat%20rar.pdf Mamine F., (2010) « Les facteurs socioéconomiques impliqués dans l’émergence géographique d’un pole d’excellence productive cas
du bassin laitier de Souk Ahras en Algérie », master2, IAM Montpellier, P60 Nouad M., (2008). « Filière lait Algérie » in séminaire agroalimentaire, un rapport ministériel. Ministère de l’industrie et de promotion de
l’investissement. Rapport Agroalimentaire sur le passé, le présent et l’avenir Algérie, disponible on-line http://www.ats-sea.agr.gc.ca/afr/3832-fra.pdf


ISSN 2039-9340 Mediterranean Journal of Social Sciences Vol. 3 (11) November 2012
625
Causal Relationship Model of Food Security Management
Kruemas Tumpracha
Department of Environmental Education
Faculty of Environment and Resource Studies Mahasarakham University, Mahasarakham 44150, Thailand
Nongnapas Thiengkamol
Major Advisor, Department of Environmental Education
Faculty of Environment and Resource Studies Mahasarakham University, Mahasarakham 44150, Thailand
Chatchai Thiengkamol
Co- Advisor, Director of Research In Motion Co., Ltd.
Bangkok 10900, Thailand
Doi:10.5901/mjss.2012.v3n11p625
Abstract The populations were 18,463 upper secondary school students from school under Secondary Service Area Office 24 (Kalasin), Northeastern region of Thailand in academic year of 2012. The Multi-stage random sampling technique was employed to collect the sample for 371 upper secondary school students. The research instrument was the questionnaire and it was used for data collecting. LISREL wFas used for model verification. The objective of this research was to develop causal relationship model of food security management for upper secondary school student of Kalasin Province. Considering on structural model confirmatory factors of Environmental Education (EE) and Food Security Management Characteristics (FC) were able to explain the variation of endogenous factors of Inspiration of Public Consciousness with Food Security Management for Environmental Conservation (FP) to caused Food Security Behaviors (FB) with 54.00 percents. As a result, the equation 1, it can be written as following. FB = 0.57*FP + 0.49*EE - 0.33*FC …………………………(1) R2 = 0.54 Moreover, confirmatory factors of Environmental Education (EE) and Food Security Management Characteristics (FC) were able to explain the variation of confirmatory factors of Inspiration of Public Consciousness with Food Security Management for Environmental Conservation (FP) with 58.00 percents. Therefore, the equation can be written as following equation 2. FP = 0.34*EE + 0.52*FC …………………………..…………(2) R2 = 0.58 Key Words: Causal Relationship Model / Food Security Behavior /Environmental Education 1. Introduction The increment of greenhouse gas emissions is raising the earth’s temperature and consequences include melting glaciers, more precipitation, additionally extreme weather fluctuation, and uneven seasons. The speeding velocity of climate change, combined with global population and income growth, threatens food security everywhere in the world. Populations in the developing world, which are already vulnerable and food insecure, are likely to be the most seriously affected. In 2005, nearly half of the economically active population in developing countries with 2.5 billion people relied on agriculture for its livelihood. Presently, most of them about 75 percent of the world’s poor live in rural areas (Gerald, 2009, FAO, 2009 & Thiengkamol, 2009c).
According to the United Nations Food and Agriculture Organization’s (FAO’s) widely accepted definition, “Food security” means that food is available at all times; that all persons have means of access to it; that it is nutritionally adequate in terms of quantity, quality and variety; and that it is acceptable within the given culture. Only when all these

ISSN 2039-9340 Mediterranean Journal of Social Sciences Vol. 3 (11) November 2012
626
conditions are in place can a population be considered “food secure.” In addition to, food security may be defined as access by all people at all times to the food required for a healthy life; at the household level, at issue is the household’s ability to secure enough food to ensure adequate dietary intake for all of its members (Von Braun et al., 1993).
The concept of food security has been undergoing an evolutionary change during the last 50 years. In the 1950s, food security was considered essentially in terms of production. It was assumed that adequate production would assure adequate availability of food in the market as well as in the household. In the 1970s, it became clear that availability alone did not lead to food security, since those who lacked purchasing power were not able to have access to balanced diets. Purchasing power again is related to jobs or livelihood opportunities. Moreover, recently, it is becoming evidence that even if availability and access are satisfactory, the biological absorption of food in the body is related to the consumption of clean drinking water as well as to environmental hygiene, primary health care and primary education. Additionally, there are micro and macro issues cause food insecurity such as political instability, poor economic government, poverty, and lack of sustainable household income (GECAFS, 2008).
Despite remarkable success in economic growth and poverty reduction in Asia, many Asia-Pacific countries have faced with problems of food insecurity. During 2003-2005, 541.9 million people in this region were undernourished even through many countries do have policies for ensuring an adequate availability of basic food products, particularly staple food grains. Each country in the region has enhanced food accessibility with minimum food requirement at the household level (FAO, 2009, & Thiengkamol, 2009a).
Over the last 50 years, the main global food issues have been famine, chronic hunger and protein-energy malnutrition (PEM). These problems interact with other problems and, as they retreat, expose new problems. Hence, attention is paid increasingly to nutrition security. Although undernourishment still contributes to the deaths of 6 million children each year, other goals cannot be brushed aside: anemia increases the mortality risk for more than 1.5 billion people worldwide; obesity (Body Mass Index: BMI >27.5) affects about a third of adults in the United States and will help kill at least another third. Paradoxically, nutrition problems of late development, such as obesity, are genetically and behaviorally rooted in those of underdevelopment, such as PEM. Moreover, a growing majority of countries are seriously affected by both sets of problems (FAO, 2001).
Thailand has agricultural development policy based on increases in productivity and incomes is a key driver to achieve national and household food security, moreover export of surplus production for the global food security has also emphasized as well. The production of food in Thailand, particularly rice, has enormously increased far more than the domestic demand therefore the surplus production is exported. While it is a food surplus country at the macro level, food accessibility at the household level remains a problem, particularly remote rural areas (Isvilanonda, & Bunyasiri, 2009, Theingkamol, 2011c , Theingkamol, 2009c)
Food availability and accessibility have been impacted by the global economic crisis, climate change and the expansion at the production of food-fuel crops. Additionally, the rise of global food price in recent years has induced a sharp increase in the domestic food price, causing a high inflation rate, especially, for the poor, food constitutes is considerable as an important portion of expenditure of household income. The high food price and inflation rate directly affect their livelihood status (Isvilanonda, & Bunyasiri, 2009, & Theingkamol, 2009c).
The household food poverty line, on average in 2007 was at 779 baht (22.58 US$)/person/month, or approximately 54 percent of the total poverty line. Using the official food poverty line, it was found that 416,410 people in Thailand or 0.65 percent of the population were affected by food poverty. The problem of food poverty in Thailand is highly concentrated in the rural North and Northeast. Even though the poorest subsistence farmers generally consume more than half of their own production but all their food needs cannot be met by their production. For example, while purchased rice expenditures of the poorest subsistence farmer accounted for 12 percent of total rice expenditures, purchased meat and vegetable expenditures accounted for 92 percent of total meat expenditures and 86 percent of total vegetable expenditures respectively. Overall purchased food expenditures of the poorest subsistence farmers accounted for 59 percent of total food expenditures and 47 percent of the total money income. Where prices of other foods, such as meat increase dramatically relative to staple grains, some farmers cannot afford to purchase what they do not produce (Isvilanonda, & Bunyasiri, 2009).
In view of on food stability, vulnerable households have not accessed to adequate food at all times even though Thailand has action plan to greatly reduced food poverty during 1988-2007. The numbers of people were affected by food poverty increased during 1998-2000 (in the wake of the financial crisis in 1997) and during 2004-2006 because of food price inflation) (Isvilanonda, & Bunyasiri, 2009).
It’s also not clear whether current research on food insecurity reflects students’ experiences. Current research suggests that there are psychological, social and physical consequences of food insecurity. It is not clear whether food insecure students experience these consequences or if there are additional consequences unique to students. There was a research tried to explore the food insecurity experience of postsecondary students in Canada with the research

ISSN 2039-9340 Mediterranean Journal of Social Sciences Vol. 3 (11) November 2012
627
objectives of document the severity of food insecurity in first-time and repeat users, describe the factors that explain the clients’ usage level and identify strategies that Campus Food Bank clients use for coping with food insecurity including describe the relationship between Campus Food Bank clients’ well-being including health and academic performance) and food insecurity (Krista, 2007). This indicated that even though in the developed country, it also has problem of food insecurity that might be due to their consumption behavior or their knowledge and understanding of nutritional component requirement of body. Consequently, to develop people, especially, new generations to have proper consumption behavior by minimizing ready-to-eat food such as potato chip, fried chicken, fried beef, and unwell cooking, it needs to cultivate them with environmental education process through different channels of educational system whether with Formal Education System, Non-Formal Education System, Informal Education System, and Lifelong Education System (Chotechuan, 2006, & Thiengkamol, 2011e). Particularly, the youths who are students by providing environmental education principle with a variety of activities to raise their knowledge and understanding, awareness, positive attitude, public consciousness and responsibility for natural resources and environment conservation including food security management for environmental conservation, it will lead to success mean of active learning process through brain storming of group dynamic activities. Therefore, it will assist them to aware the importance of food security and it will a good process for attitude and behavior changing to conserve natural resources and environment conservation to meet food security (Thiengkamol, 2009c,Thiengkamol, 2011e, Thiengkamol, 2011g, Thiengkamol, 2011h, Thiengkamol, 2011i, Thiengkamol, 2011j, &2012b).
During the past few decades, Thailand has agricultural development policy that has emphasized on the nation’s food security and export income. It is also a food surplus country at the macro level, but at the household level remains a problem in food security. According FAO, food security refers availability, accessibility and utilization, especially, nutritional knowledge and understanding. But in the educational institute like as school, it should pay attention to quantity, quality, safety, and good taste which is the concept Ministry of Public Health of Thailand. Therefore, the secondary school students in Northeastern Region, lack of nutritional knowledge, attitude, awareness, value and behavior. Concerning to another essential factor that was neglected is inspiration to have public consciousness or public mind. Public mind or public consciousness was defined according to different perception or consideration of people, however in Thai society gave various meaning such as National Research Council of Thailand giving definition of public mind that take notice and participate in the public issues that are advantage to country with consciousness and holding the system of morality and ethics including indignity for wrong action and emphasizing on being neat, economizing, and balance between human and nature.
Along with concept of inspiration of public consciousness, Thiengkamol mentioned on public consciousness or public mind based on inspiration from insight and inspiration different from motivation because inspiration needs no rewards. Inspiration of public consciousness or public mind, especially, for natural resources and environment conservation, one doesn’t receive any reward, admiration or complement for ones act for natural resources and environment conservation. Inspiration on might occur due to appreciation in a person as role model or idle, events, situations, environment, media perceived such movies, book, magazine, and internet. (Thiengkamol, 2009a , Thiengkamol, 2009b , Thiengkamol, 2011a; and Thiengkamol, 2011e, Thiengkamol, 2011f, Thiengkamol, 2011i, Thiengkamol, 2011j, Thiengkamol, 2012c, &Thiengkamol, 2012d). As mentioned above, particularly, for Northeastern region, most of people prefer to eat unwell cooking beef and fish. Particularly, the problems of food insecurity, the new generations of secondary school students are still of lacking knowledge and understanding, awareness, positive attitude, public consciousness and responsibility for consumption behavior changing to practice in accordance with awareness of better nutritional composition. Moreover, these youth are in trap of over consumption without economization by following capitalism concept and materialism, they should turn back to traditional Thai food that contains various herbs and vegetables to meet healthier. This research was interesting to study on development of causal relationship model food security management with integration of environmental education and food security management characteristics affecting through inspiration of public consciousness with food security management for environmental conservation to food security behaviors for upper secondary school student under the Office of Kalasin Educational Area Zone 24. 2. Objective The objective of this study was to develop causal relationship model of food security management for upper secondary school student of Kalasin Province.

ISSN 2039-9340 Mediterranean Journal of Social Sciences Vol. 3 (11) November 2012
628
3. Methodology The research design was implemented in steps by step as follows:
1) The populations were 18,463 upper secondary school students from school under Secondary Service Area Office 24 (Kalasin), Northeastern region of Thailand in academic year of 2012. The 371 upper secondary school students were used as sample group. The research instrument was the questionnaire and it was used for data collection. LISREL was used for model verification. The content and structural validity were determined by Item Objective Congruent (IOC) with 5 experts in the aspects of environmental education, psychology, social science and social research methodology. The reliability was done by collecting the sample group from 50 upper secondary school students from other area of education that locates nearby. The reliability was determined by Cronbach's Alpha. The reliability of environmental education, food security management characteristics, inspiration of public consciousness with food security management for environmental conservation, and food security behaviors, and the whole questionnaire were 0.872, 0.917, 0.935, 0.875 and 0.957 respectively.
2) The descriptive statistics used were frequency, percentage, mean and standard deviation. The inferential statistics used was LISREL by considering on Chi-Square value differs from zero with no statistical significant at 0.05 level or Chi-Square/df value with lesser or equal to 2, P-value with no statistical significant at 0.05 level and RMSEA (Root Mean Square Error Approximation) value with lesser than 0.05 including index level of model congruent value, GFI (Goodness of Fit Index) and index level of model congruent value, AGFI (Adjust Goodness of Fit Index) between 0.9-1.00. 4. Results 4.1 General Characteristics of Sample Group The sample group was 371 upper secondary school students under the Office of Kalasin Educational Area Zone 24 in academic year of 2012. Most of them were female with 58.22%, studying at level 6 with 33.97%. Their father status and father status were living together with 82.48% and 77.36%. Majority of their father, and mother education levels were at the same level at lower than lower secondary school and upper secondary school/vocational school with the same 36.12%. Their father, and mother had occupation as agriculturist and employee / hire with 21.56%, and 22.64% respectively. Their father and mother had average income with 8,000 Bahts and 7,600 Bahts, and their father and mother had average age with 41.50 and 37.50 years old as presented in table1. Table 1 General Characteristics of Sample Group of Upper Secondary School Students
Sex Number Percent 1.Male 2.Female
155 216
41.78 58.22
Total 371 100 Studying in Level Number Percent 1. Level 4 2. Level 5 3. Level 6
122 123 126
32.88 33.15 33.97
Total 371 100
Table 1 (Cont’)
Student from School Size Number Percent 1. Special Large
100
26.95
Total 371 100 Father Status Number Percent 1. living together
306
82.48
Total 371 100

ISSN 2039-9340 Mediterranean Journal of Social Sciences Vol. 3 (11) November 2012
629
Mother Status Number Percent 1. living together
287
77.36
Total 371 100 Father Education Level Number Percent 1. Lower Secondary School or Lower
134
36.12
Total 371 100 Mother Education Level Number Percent 1. Lower Secondary School or Lower
133
35.85
Total 371 100
Table 1 (Cont’)
Father Occupation Number Percent 1. Agriculturist
80
21.56
Total 371 100 Mother Occupation Number Percent 1. Agriculturist
75
20.22
Total 371 100 4.2 Confirmatory factors Analysis of Exogenous Variables
1) Confirmatory factors Analysis of Exogenous Variables of Environmental Education (EE). Confirmatory factors of EE had Bartlett’s test of Sphericity of 639.323 statistically significant level (p< .01) and Kaiser–Mayer–Olkin Measure of Sampling Adequacy/MSA) of 0.764. This indicated that components of EE aspect had proper relationship at good level and it can be used for analysis of confirmatory factors as shown in picture 1 and table 2.
Picture 1: Model of Confirmatory factors of Environmental Education
X1 0.15
X2 0.20
X3 0.17
X4 0.19
X5 0.11
X6 0.20
EE 1.00
Chi-Square=6.94, df=6, P-value=0.32607, RMSEA=0.021
0.13
0.13
0.21
0.41
0.50
0.52
0.06
0.05
0.08

ISSN 2039-9340 Mediterranean Journal of Social Sciences Vol. 3 (11) November 2012
630
Table 2 Results of Analysis of Confirmatory factors of Environmental Education
Components of Environmental Education Weight SE t 2R X1 Knowledge and Understanding 0.13 0.032 5.65** 0.10 X2 Environmental Attitude 0.13 0.026 4.74** 0.071 X3 Environmental Awareness 0.21 0.025 834** 0.20
X4 Environmental Skill 0.41 0.030 13.79** 0.48
X5 Environmental Participation 0.50 0.012 17.21** 0.70 X6 Environmental Evaluation 0.52 0.034 15.32** 0.57 Chi-square = 6.94 df = 6 P = 0.32607 GFI = 0.99 AGFI = 0.98 RMSEA = 0.021 RMR =0.0055
** Statistically significant level of .01
From picture 1 and table 2, results of analysis of confirmatory factors of EE from 6 observed variables was revealed that the model was congruent to empirical data by considering from 1) Goodness of Fit Index (GFI) equaled to 0.99 and Adjust Goodness of Fit Index (AGFI) equaled to 0.98 2) Root Mean Square Error of Approximation (RMSEA) equaled to 0.000 (RMSEA < 0.05) and 3) Chi- Square value had no statistically significant at level of .01 and degree of freedom was lesser than or equaled to .05 ( 00.5/2 ≤dfχ ). Considering on loading weight of observed variables in model, it was revealed that observed variables had loading weight with 0.13 to 0.52 and had covariate to model of Environmental Education with 7.10 to 70.00 percents.
2) Confirmatory factors Analysis of Exogenous Variables of Food Security Management Characteristics (FC) Confirmatory factors of Food Security Management Characteristics (FC) had Bartlett’s test of Sphericity of 1203.451 statistically significant level (p< .01) and Kaiser–Mayer–Olkin Measure of Sampling Adequacy/MSA) of 0.871. This indicated that components of Food Security Management Characteristics (FC) aspects had proper relationship at good level and it can be used for analysis of confirmatory factors as shown in picture 2 and table 3. Picture 2: Model of Confirmatory factors of Food Security Management Characteristics
X7 0.20
X8 0.24
X9 0.23
X10 0.11
X11 0.10
X12 0.39
X13 0.18
X14 0.11
FC 1.00
Chi-Square=10.05, df=12, P-value=0.61120, RMSEA=0.000
0.28
0.36
0.36
0.40
0.39
0.20
0.40
0.35
0.09
0.08
0.10
0.02
0.03
-0.04
0.03
0.07

ISSN 2039-9340 Mediterranean Journal of Social Sciences Vol. 3 (11) November 2012
631
Table 3 Results of Analysis of Confirmatory factors of Food Security Management Characteristics
Components of Environmental Food Security Management Characteristics
Weight SE t 2R X7 Nutritional Knowledge 0.28 0.028 10.09** 0.28 X8 Safe and Clean Foods 0.36 0.032 11.21** 0.35 X9 Environmental Quality for Food Preparation 0.36 0.032 11.22** 0.35 X10Food Production for House and Community 0.40 0.025 15.84** 0.59 X11 Environmental Quality for Food Production 0.39 0.024 15.78** 0.59 X12 Sustainable Agriculture 0.20 0.037 5.50** 0.25
X13 Social and Economic Security 0.40 0.030 12.30** 0.46 X14 Public Health 0.35 0.024 14.73** 0.52 Chi-square = 5.31 df = 7 P = 0.62251 GFI = 0.99 AGFI = 0.98 RMSEA = 0.000 RMR = 0.0047
** Statistically significant level of .01 From picture 2 and table 3, results of analysis of confirmatory factors of Security Management Characteristics (FC) from 8 observed variables was revealed that the model was congruent to empirical data by considering from 1) Goodness of Fit Index (GFI) equaled to 0.99 and Adjust Goodness of Fit Index (AGFI) equaled to 0.98 2) Root Mean Square Error of Approximation (RMSEA) equaled to 0.000 (RMSEA < 0.05) and 3) Chi- Square value had no statistically significant at level of .01 and degree of freedom was lesser than or equaled to .05 ( 00.5/2 ≤dfχ ). Considering on loading weight of observed variables in model, it was revealed that observed variables had loading weight with 0.20 to 0.00 and had covariate to model of Security Management Characteristics (FC) with 25.00 to 59.00 percents. 4.3 Confirmatory Factors Analysis of Endogenous Variables Results of Confirmatory Factors Analysis of Endogenous Variables of Inspiration of Public Consciousness influencing to Environmental Behaviors for Sustainable Development, was revealed as followings. 1) Confirmatory Factors Analysis of Endogenous Variables of Inspiration of Public Consciousness (PM) Confirmatory Factors of Inspiration of Public Consciousness with Food Security Management for Environmental Conservation (FP) had Bartlett’s test of Sphericity of 1227.1847 statistically significant level (p< .01) and Kaiser–Mayer–Olkin Measure of Sampling Adequacy/MSA) of 0.878. This indicated that components of Inspiration of Public Consciousness with FP aspect had proper relationship at good level and it can be sed for analysis of confirmatory factors as shown in picture 3 and table 4.
Picture 3: Model of Confirmatory factor of Public Consciousness with Food Security Management for Environmental Conservation
Y7 0.17
Y8 0.16
Y9 0.14
Y10 0.14
Y11 0.07
Y12 0.11
FP 1.00
Chi-Square=3.77, df=5, P-value=0.58274, RMSEA=0.000
0.37
0.36
0.46
0.47
0.46
0.50
0.07
0.02
-0.02
-0.03

ISSN 2039-9340 Mediterranean Journal of Social Sciences Vol. 3 (11) November 2012
632
Table 4. Results of Analysis of Confirmatory factors of Public Consciousness with Food Security Management for Environmental Conservation
Confirmatory factors of Public Consciousness with Food Security
Weight SE t 2R Y7 Person as Role Model 0.37 0.028 13.37** 0.44 Y8 Impressive Event 0.36 0.026 13.99** 0.44
Y9 Impressive Tourism Environment 0.46 0.028 16.28** 0.60 Y10 Book Reading 0.47 0.027 18.97** 0.61 Y11 Television Watching 0.46 0.023 20.09** 0.78 Y12 Internet Using 0.50 0.028 17.84** 0.68 Chi-square = 377 df = 5 P = 0.58274 GFI = 1.00 AGFI = 0.99 RMSEA = 0.000 RMR = .0033
** Statistically significant level of .01
From picture 3 and table 4, results of analysis of confirmatory factors of FP from 6 observed variables was revealed that the model was congruent to empirical data by considering from 1) Goodness of Fit Index (GFI) equaled to 1.00 and Adjust Goodness of Fit Index (AGFI) equaled to 0.99 2) Root Mean Square Error of Approximation (RMSEA) equaled to 0.000 (RMSEA < 0.05) and 3) Chi- Square value had no statistically significant at level of .01 and degree of freedom was lesser than or equaled to .05 and 00.5/2 ≤dfχ . Considering on loading weight of observed variables in model, it was revealed that observed variables had loading weight with 0.36 to 0.50 and had covariate to model of Inspiration of Public Consciousness with Food Security Management for Environmental Conservation (FP) with 44.00 to 78.00 percents. 2) Confirmatory Factors Analysis of Endogenous Variables of to Food Security Behaviors (FB)
Confirmatory Factors of Food Security Behaviors (FB) had Bartlett’s test of Sphericity of 616.087 statistically significant level (p< .01) and Kaiser–Mayer–Olkin Measure of Sampling Adequacy/MSA) of 0.836. This indicated that components of BE aspect had proper relationship at good level and it can be used for analysis of confirmatory factors as shown in picture 4 and table 5.
Picture 4: Model of Confirmatory factors of Food Security Behaviors
Y1 0.26
Y2 0.26
Y3 0.27
Y4 0.31
Y5 0.25
Y6 0.22
FB 1.00
Chi-Square=1.63, df=4, P-value=0.80318, RMSEA=0.000
0.30
0.22
0.50
0.63
0.33
0.50
0.06
0.04
0.06
0.03
0.03

ISSN 2039-9340 Mediterranean Journal of Social Sciences Vol. 3 (11) November 2012
633
Table 5 Results of Analysis of Confirmatory factors of Food Security Behaviors
Confirmatory factors of Food Security Behaviors Weight SE t 2R Y1 Consumption Behavior 0.30 0.033 8.98** 0.26 Y2 Production Behavior for Consumption 0.22 0.033 6.82** 0.16
Y3 Acquisition and Preparation Behavior 0.50 0.038 13.37** 0.49 Y4 Food Waste Management Behavior 0.63 0.043 14.60** 0.56 Y5 Social and Cultural Behavior 0.33 0.034 9.65** 0.30 Y6 Environmental Conservation Behavior 0.50 0.036 14.05** 0.54 Chi-square = 168 df = 4 P = 0.80318 GFI = 1.00 AGFI = 0.99 RMSEA = 0.000 RMR = 0.0037
** Statistically significant level of .01
From picture 4 and table 5, results of analysis of confirmatory factors of factors of Food Security Behaviors (FB) from 6 observed variables was revealed that the model was congruent to empirical data by considering from 1) Goodness of Fit Index (GFI) equaled to 1.00 and Adjust Goodness of Fit Index (AGFI) equaled to 1.00, 2) Root Mean Square Error of Approximation (RMSEA) equaled to 0.000 (RMSEA < 0.05) and 3) Chi- Square value had no statistically
significant at level of .01 and degree of freedom was lesser than or equaled to .05 and 00.5/2 ≤dfχ . Considering on loading weight of observed variables in model, it was revealed that observed variables had loading
weight with 0.22 to 0.63 and had covariate to model of Environmental Behaviors for Sustainable Development with 16.00 to 56.00 percents.
4. Results of Effect among Variables in Model in Terms of Direct and Indirect Effect 4.1 Confirmatory factors of Environmental Education (EE) and Food Security Management Characteristics (FC) had direct effect to Inspiration of Public Consciousness with Food Security Management for Environmental Conservation (FP) with statistically significant at level of .01 with effect of 0.34 and 0.52. Moreover, Environmental Education (EE) and Food Security Management Characteristics (FC) had direct effect to Food Security Behaviors (FB) with statistically significant at level of .01 with effect of 0.49 and -0.33. In addition, confirmatory factors in aspect of Environmental Education (EE) and Food Security Management Characteristics (FC) had indirect effect to Food Security Behaviors (FB) with statistically significant at level of .01 with effect of 0.24 and 0.30. 4.2 Confirmatory factors of Inspiration of Public Consciousness with Food Security Management for Environmental Conservation (FP) had direct effect to Food Security Behaviors (FB) with statistically significant at level of .01 with effect of .57.
Considering on structural model confirmatory factors of Environmental Education (EE) and Food Security Management Characteristics (FC) were able to explain the variation of endogenous factors of Inspiration of Public Consciousness with Food Security Management for Environmental Conservation (FP) to caused Food Security Behaviors (FB) with 54.00 percents. As a result, the equation 1, it can be written as following.
FB = 0.57*FP + 0.49*EE - 0.33*FC …………………………(1) R2 = 0.54
Moreover, confirmatory factors of Environmental Education (EE) and Food Security Management Characteristics (FC) were able to explain the variation of confirmatory factors of Inspiration of Public Consciousness with Food Security Management for Environmental Conservation (FP) with 58.00 percents. Therefore, the equation can be written as following equation 2.
FP = 0.34*EE + 0.52*FC ………… ……..…………(2) R2 = 0.58

ISSN 2039-9340 Mediterranean Journal of Social Sciences Vol. 3 (11) November 2012
634
Picture 5: Model of Direct and Indirect Effect of EE and FC through FP Influencing to FB 5. Discussion
The findings indicated that EE had direct effect to Inspiration of Public Consciousness with Food Security Management for Environmental Conservation (FP) and Food Security Behaviors (FB) with statistically significant at level of .01 with effect of 0.49 and 0.34. Moreover, when considering on prediction of correlation of observed variables of Environmental Evaluation (X6), Environmental Participation (X5), Environmental Skill (X4), Environmental Awareness (X3), Environmental Attitude (X2), and Knowledge and Understanding (X1) can predict the EE rather high with 0.52, 0.50, 0.41, 0.21, 0.13 and 0.13 respectively. These were congruent to different studies of Thiengkamol and her colleagues (Thiengkamol, 2005a, Thiengkamol, 2011a, Thiengkamol, 2011g, Thiengkamol, 2011i, Thiengkamol, 2012b, Thiengkamol, 2012c, Dornkornchum, et al, 2012a, Gonggool, et al, 2012b, Ngarmsang, et al, 2012b, Pimdee, et al, 2012a, Ruboon, et al, 2012a, and Waewthaisong, et al, 2012a) that the results illustrated that Inspiration of Public Consciousness with Food Security Management for Environmental Conservation would inspire upper secondary school student to perform better food security behaviors whether consumption behavior, production behavior for consumption, acquisition and preparation behavior, food waste management behavior , social and cultural behavior, and environmental conservation behavior when they had real practice through food security behaviors with inspiration of public consciousness with food security management for environmental conservation. Food Security Management Characteristics (FC) had direct effect to Inspiration of Public Consciousness with Food Security Management for Environmental Conservation (FP) and Food Security Behaviors (FB) with statistically significant
X10.13
X20.17
X30.13
X40.22
X50.13
X60.18
X70.20
X80.21
X90.23
X100.11
X110.11
X120.29
X130.17
X140.12
EE
FC
FB
FP
Y1 0.25
Y2 0.24
Y3 0.22
Y4 0.37
Y5 0.25
Y6 0.17
Y7 0.15
Y8 0.12
Y9 0.14
Y10 0.14
Y11 0.07
Y12 0.12
Chi-Square=437.42, df=259, P-value=0.00000, RMSEA=0.043
0.30
0.25
0.53
0.56
0.32
0.53
0.39
-0.19
0.50
0.45
0.46
0.46
0.48
0.02
0.19
-0.01
0.22
0.06
0.25
0.38
0.48
0.54
0.00
0.29
-0.19
0.47
0.36
0.40
0.38
0.35
0.01
0.42
0.34
0.57
0.49
-0.33
0.34
0.52
0.05
-0.05
0.03
0.040.02
-0.03
-0.02
-0.03
0.04
0.02
0.05
0.030.02
-0.01
0.02
0.05
0.08
-0.02
0.08
0.10
0.03
0.03
-0.02
-0.06
-0.06
0.02
0.05

ISSN 2039-9340 Mediterranean Journal of Social Sciences Vol. 3 (11) November 2012
635
at level of .01 with effect of -0.33 and 0.52. Additionally, considering on prediction of correlation of observed variables of Food Production for House and Community (X10), Social and Economic Security (X13), Environmental Quality for Food Production (X11), Safe and Clean Foods (X8), Environmental Quality for Food Preparation (X9), Public Health (X14), Nutritional Knowledge (X7) Sustainable Agriculture (X12) can predict the EE rather high with 0.40, 0.40, 0.39, 0.36, 0.36, 0.35 0.28 and 0.20 respectively. These were congruent to concept and studies of Thiengkamol and Thiengkamol and her colleagues (Thiengkamol, 2009c, Thiengkamol, 2011a, & Thiengkamol, 2011g) that food security management in youth such as upper school students would succeed, it needs to change their consumption behavior through the daily practice by selecting knowledge and understanding of nutritional knowledge, raising awareness of avoiding high carbohydrate fat of fast food consumption such as pizza, hamburger, potato chip, potato chip, fried chicken, fried beef, and unwell cooking. Additionally, they should adjust their life style from sitting in front of computer or television to play for exercise regularly to prevent obesity, mellitus, hypertension and cardiovascular which is the top ten diseases that threaten Thai people currently. Furthermore, Inspiration of Public Consciousness with Food Security Management for Environmental Conservation (FP) had direct effect to Food Security Behaviors (FB) with statistically significant at level of .01 with effect 0.57. Particularly, considering on prediction of correlation of observed variables of Person as Role Model (Y7), Impressive Event (Y8), impressive Environment (Y9), Book Reading (Y10), Television Watching (Y11), and Internet Using (Y12), can predict the FP rather high with 0.37, 0.36, 0.46, 0.47, 0.46, and 0.50 respectively, these results are pertinent to numerous studies of Thiengkamol, and her colleagues (Thiengkamol, 2011i, Thiengkamol, 2011j, Thiengkamol, 2012c, Thiengkamol, 2012d, Dornkornchum, and Thiengkamol, 2012, Dornkornchum, et al, 2012a, Gonggool, et al, 2012b, Ngarmsang, et al, 2012b, Ruboon, et al, 2012a, Pimdee, et al, 2012, and Waewthaisong, et al, 2012a).
However, it might be concluded that EE observed from observed variables of Environmental Attitude (X1), Knowledge and Understanding (X2), Environmental Awareness (X3), Environmental Skill (X4), Environmental Participation (X5) and Environmental Evaluation (X6), and FC observed from observed variables of Nutritional Knowledge (X7), Safe and Clean Foods (X8), Environmental Quality for Food Preparation (X9), Food Production for House and Community (X10), Environmental Quality for Food and Public Health (X14), can influence through Inspiration of Public Consciousness with Food Security Management for Environmental Conservation (FP) composing of Person as Role Model (Y7), Impressive Event (Y8), impressive Environment (Y9), Book Reading (Y10), Television Watching (Y11), and Internet Using (Y12), to Food Security Behaviors (FB) that included Consumption Behavior (Y1), Production Behavior for Consumption (Y2), Acquisition and Preparation Behavior (Y3), Food Waste Management Behavior (Y4) Social and Cultural Behavior (Y5), and Environmental Conservation Behavior (Y6). Therefore, the model of EE and FC influencing through FP to FB was verified the proposed model was fitted with all observed variables according to criteria of Chi-Square value differs from zero with no statistical significant at .01 level or Chi-Square/df value with lesser or equal to 2, P-value with no statistical significant at .01 level and RMSEA (Root Mean Square Error Approximation) value with lesser than 0.05 including index level of model congruent value, GFI (Goodness of Fit Index) and index level of model congruent value, AGFI (Adjust Goodness of Fit Index) between 0.90-1.00. Finally, food security behavior comprised 6 observed variables Consumption Behavior (Y1), Production Behavior for Consumption (Y2), Acquisition and Preparation Behavior (Y3), Food Waste Management Behavior (Y4), Social and Cultural Behavior (Y5), and Environmental Conservation Behavior (Y6) in this study were modified from food security management concepts of FAO and environmental education principles to investigate the factors that will affect through inspiration of public consciousness of Thiengkamol. Therefore, to understand these factors are able to use for food insecurity solving in Northeastern Region and other region of Thailand.
References
Chotechuan, P. (2006). Knowledge on potential carcinogen in ready-to-eat food and Food behaviors secondary school students. Thesis of Master of Science (Community Health), Faculty of Graduate Studies of Mahidol University.
Dornkornchum, S. and Thiengkamol, N. (2012). Model of Environmental Education and Psychological State Affecting to Global Warming Alleviation. International Proceedings of Economic Development and Research, 44, 1-5.
Dornkornchum, S. Thiengkamol, N., & Thiengkamol, C. (2012a). Causal Relationship Model of Environmental Conservation Behavior Integrated with LCA Knowledge. European Journal of Social Sciences, 33 (1):5-16.
FAO. (2001). The State of Food and Agriculture 2000. Retrieved fromhttp://www.fao.org/docrep/x4400e/x4400e11.htm FAO. (2009). Statistical Year Book. Retrieved from http://www.fao.org/economic/the-statistics-division-ess/publications-studies/statistical-
yearbook/fao-statistical-yearbook-2009/en/ Gerald, C. N. (2009), Climate Change: Impact on Agriculture and Costs of Adaptation. Washington, D.C. : International Food Policy
Research Institute (IFPRI).

ISSN 2039-9340 Mediterranean Journal of Social Sciences Vol. 3 (11) November 2012
636
Global Environmental Change and Food Systems (GECAFS). (2008). A food-secure future for those most vulnerable. Retrieved from http://www.gecafs.org/ Gonggool, D., Thiengkamol, N., & Thiengkamol, C. (2012b). Development of Environmental Education Volunteer Model through
Inspiration of Public Consciousness for Sustainable Development. European Journal of Social Sciences, 32 (1):150-160 Isvilanonda, S. and Bunyasiri, I. (2009). Food Security in Thailand: Status, Rural Poor Vulnerability, and Some Policy Options. A paper
presented at the international seminar on “Agricultural and Food Policy Reforms: Food Security from the Perspective of Asian Small-scale Farmers” heldin Seoul on 24-28 August 2009.
Krista Rondeau, RD. (2007). Hunger on Campus: Understanding Food Insecurity in Post-Secondary Students. MSc Candidate, Centre for Health Promotion Studies, School of Public Health, University of Alberta, Edmonton, Alberta.
Ngarmsang, K., Thiengkamol, N., & Thiengkamol, C. (2012b). Development of an Environmental Education and Environmental Management Model for Learning Disability Student. European Journal of Social Sciences, 32 (1):120-127.
Pimdee, P., Thiengkamol, N., & Thiengkamol, T. (2012a). Causal Relationship Model of Electrical Energy Conservation. European Journal of Social Sciences, 32 (3):306-315.
Ruboon, O., Thiengkamol, N, Thiengkamol, T, & Kurukodt, J. (2012a). Model of Environmental Education Teacher with Inspiration of Environmental Conservation for Global Warming Alleviation. European Journal of Social Sciences, 31 (1):92-102.
Thiengkamol, N. (2005a). Strengthening Community Capability through The Learning Network Model for Energy Conservation. Journal of Population and Social Studies, 14 (1), 27-46.
Thiengkamol, N. (2005b). Development of Health Cities Network for Mekong Region. In Proceedings of the International Conference “Transborder Issues in the Grate Mekong Sub-Region” Ubon Ratchathani, Thailand, 30 June-2 July 2005 (pp.111-119). Ubol Ratchathani: Nevada Grand Hotel.
Thiengkamol, N. (2009a). The Great Philosopher: the Scientist only know but Intuitioner is Lord Buddha. Bangkok: Prachya Publication. Thiengkamol, N. (2009b). The Happiness and the Genius can be Created before Born. Bangkok: Prachya Publication. Thiengkamol, N. (2009c). Environment and Development Book 2 (Food Security). Bangkok: Chulalongkorn University Press. Thiengkamol, N. (2010b). Urban Community Development with Food Security Management: A Case of Bang Sue District in Bangkok.
Journal of the Association of Researcher, 15 (2), 109-117. Thiengkamol, N. (2011a). Holistically Integrative Research (2nd ed.). Bangkok: Chulalongkorn University Press. Thiengkamol, N. (2011e). Environment and Development Book. (4th ed.).Bangkok: Chulalongkorn University Press. Thiengkamol, N. (2011f). Nurture Children to be Doctors. Bangkok: INTELLUALS. Thiengkamol, N. (2011g). Development of Energy Security Management for Rural Community. Canadian Social Science, 7 (5), October
31, 2011. Thiengkamol, N. (2011h). Development of a Food Security Management Model for Agricultural Community. Canadian Social Science, 7
(5), October 31, 2011. Thiengkamol, N. (2011i). Development of Model of Environmental Education and Inspiration of Public Consciousness Influencing to
Global Warming Alleviation. European Journal of Social Sciences, 25 (4):506-514. Thiengkamol, N. (2011j). Model of Psychological State Affecting to Global Warming Alleviation. Canadian Social Science, 7 (6):89-95,
December 31, 2011 Thiengkamol, N. (2012b). Development of Food Security Management for Undergraduate Student Mahasarakham University. European
Journal of Social Sciences, 27 (2):246-252. Thiengkamol, N. (2012c). Model of Psychological Trait Affecting to Global Warming Alleviation. European Journal of Social Sciences, 30
(3) : 484-492. Von Braun, J.; McComb, J.; Fred-Mensah, B.K.; Pandya-Lorch, R. (1993). Urban food insecurity and malnutrition in developing ountries.
International Food Policy Research Institute, Washington, DC, USA. . Waewthaisong, S. Thiengkamol, N., & Thiengkamol, C. (2012a). Development of
Environmental Traveling Behavior Model through Inspiration of Public Mind for Global Warming Alleviation. European Journal of Social Sciences, 33 (1).

ISSN 2039-9340 Mediterranean Journal of Social Sciences Vol. 3 (11) November 2012
637
Trade Openness and Manufacturing Sector Growth:
An Empirical Analysis for Nigeria
Adegbemi B.O Onakoya
Department of Economics, College of Social and Management Sciences,
Tai Solarin University of Education, Ijagun, Nigeria Corresponding author: [email protected]
Ismail O. Fasanya
Department of Economics,
University of Ibadan, Ibadan, Nigeria [email protected]
Muhibat T. Babalola
Department of Economics and Financial Studies
College of Social and Management Sciences, Fountain University, Osogbo,Osun State, Nigeria
Doi:10.5901/mjss.2012.v3n11p637
Abstract This study examines the impact of trade openness on manufacturing sector performance in the Nigerian economy, using a time series data from 1975 to 2010. The effects of stochastic shocks of each of the endogenous variables are explored using Error Correction Model (ECM). The analysis shows that trade openness has a positive impact on the manufacturing sector performance while exchange rate, inflation rate have a negative impact on the sector performance. The error correction coefficient also indicates rate of adjustment for disequilibrium of the variables shows that growth in the manufacturing sector adjust slowly in the economy. The development of Manufacturing sector and its effective promotion have not been approached seriously in Nigeria, hence, the lack of their impact in the economy. This could be attributed to a plethora of factors, including a weak technological base and low level of capacity utilization. Another major finding from this study is that there are significant pay-offs from the policy of trade liberalization. This study therefore recommends that government should avoid short-term fixes and front-loaded deals with other countries and move beyond arrangements that focus solely on the petroleum sector. Also to promote the imports of capital goods, there the need for transparent oversight largely monitored by regulatory institutions. KeyWords: Trade openness, Manufacturing Sector, Economic Growth, Cointegration
1. Introduction Trade of a country is a key determinant for the improvement of a country’s industrialisation. Moreover development experienced by a country brings some changes in trade structure on the basis of endowments and comparative advantage (Hulton, 1967). Trade is considered an integral part of Nigeria’s economic activity and, among Nigerians at least, it is widely perceived that Nigeria is a very open economy. The economic condition of Nigeria has advanced over the years as a result of the rapid pace of industrialization. The economy of Nigeria has also improved tremendously with foreign investment aided by high quality research and development. Nigeria was under the British colonial rule for a considerable period of time. After independence, efforts were made to enhance the economic growth of the country through a set of reforms. One of these reforms is liberalizing trade for the purpose of improving growth of the country. However, debates over the relationship between trade openness and growth have been going on for years. A key aspect

ISSN 2039-9340 Mediterranean Journal of Social Sciences Vol. 3 (11) November 2012
638
of that debate is how important growth is for poor countries as they strive to catch up with the best-of-the best in a competitive world.
Due to the establishment of multilateral ties with other countries, the trade scenario of Nigeria has received a great impetus over the last decades. An overview of the economy of Nigeria remains incomplete without mentioning its growing foreign investment which has left behind a positive effect on its trade and commercial business. There have been defective infrastructural facilities which have hampered the constant growth of the country yet efforts are made to revive those sick industries of the country through foreign collaboration and investments. The relationship between trade openness and manufacturing productivity growth is a highly debated topic in the growth and development literature, yet this issue is far from being resolved. The existing empirical literature does not provide clear evidence on relationship between trade openness and manufacturing productivity growth. Many studies provide evidence that increasing openness has a positive effect on manufacturing output growth. On the other hand some studies report that it is difficult to find robust positive relationships or even that there is negative relationship between openness and manufacturing output growth.1
Protectionist laws attract a large number of small, high-cost producers and results in a fragmentation of the home market. Goldar (1986) conducted a study for India showing that Import-substitution policies had a negative impact on total factor productivity; this was tested and supported in the case of Turkish industries (Krueger and Tuncer 1982). Due to foreign exchange constraints and non-substitutability between imports and domestic intermediate and capital inputs, the fixed capacity level may become idle in an economy where import-substitution policy is pursued. In the Chilean economy (Condon, Corbo and de Melo 1984) and Egyptian industry (Handoussa, Nishimizu and Page 1986), this was found to be an important reason for Technical Factor Productivity (TFP, thereafter) growth during trade opening. A study conducted in
Several studies on trade openness both theoretical and empirical have based their studies on trade openness and
economic growth, examples of the studies include, Harrison (1996), Edward (1998), Ynikkaya (2003), wacziang (2001), Sinha. and Sinha (2000), Njikam (2009) and Adebiyi (2006) among others. Past studies of trade openness on economic growth have found various results, there is however evidence that there is both positive impact and negative impact of trade openness on economic growth.
However, only limited studies explicitly recognize the fact that before there can be economic growth in an economy there are variables that have to be present in addition to be efficient and effective in their sectors before there can be economic growth. The manufacturing sector is a major determinant of economic growth, so the study is therefore a contribution to the role and impact that the performance of the manufacturing sector plays as regards trade openness in an economy. Foreshadowing our main results, we find evidence that trade openness has a positive impact on the manufacturing sector performance while exchange rate, inflation rate has a negative impact on the sector performance and also the adjustment for disequilibrium of the variables shows that growth in the manufacturing sector adjust slowly in the economy.
The remainder of the paper is organized as follows. Following section one is section two which deals with the literature review. In Section three, the methodology and data of the study is pursued while the empirical results are discussed in section four. Section five concludes the paper. 2. Review of Relevant Literatures A number of arguments have been discussed in the empirical literature with regard to the impact of trade liberalisation on the output growth of domestic firms in an economy. One can argue that there would be a negative relationship between import penetration and manufacturing sector performance, as foreign competition should restrain the exercise of market power by domestic firms in the domestic market. Katrak (1980) for India, Amjad (1977) for Pakistan, Haddad et. al, (1996) for Morocco, and Foroutan (1996) for Turkey has obtained support for their hypothesis that, in industries faced with significant degrees of actual import competition, the ability of domestic firms to maintain prices above average cost is reduced. Beng and Yen (1977) conducted a study for Malaysia, Weiss (1991) for Mexico and Krishna and Mitra (1997) for India obtained support for their hypothesis that tariffs enable producers to reap high domestic profits.Grether (1996) for Mexico concluded that less protective sectors behaved more competitively. In another study, Semenick and Morrison (2000) reduction in protectionism could be accompanied by a decrease in industrial output since increased competition may force producers to exit instead of expanding.
1 Nishimizu and Robinson (1984); Tybout (1992); Mulaga and Weiss (1996); Soo, (2008); Madheswaran et al (2007); Krishna and Mitra, (1997); Kim, (2000), and Goldar and Anita Kumari (2003), found a positive relation between trade openness and manufacturing growth. Goldar (1986); Krueger and Tuncer (1982); Semenick and Morrison (2000) showed a negative relation between aid and growth.

ISSN 2039-9340 Mediterranean Journal of Social Sciences Vol. 3 (11) November 2012
639
Malawi, Mulaga and Weiss (1996) argue that the slight improvement in TFP as a result of trade reforms between 1987-91 can be explained in terms of higher capacity, as firms previously facing a shortage of foreign exchange were able to stock up on parts and raw materials. The authors did not establish any link between TFP and the fall in protection when they used TFP estimates adjusted for change in capacity utilisation. In this case TFP does not reflect genuine productivity improvement, as a shift from one production frontier to other occurs and does not appear to correlate systematically with exposure to foreign competition.
Nishimizu and Robinson (1984) found a positive link between higher exports and TFP growth of the manufacturing sector arising from competitive cost-reducing incentives and a positive link between export expansion, import liberalization and TFP growth arising from the importance of foreign exchange constraints and non-substitutable imports of intermediate inputs and capital goods. A growth decomposition measure was used in this study to explain productivity growth in a multiple regression framework of four semi-industrialized countries: Japan, South Korea, Turkey and Yugoslavia. At the two-digit ISIC level South Korea’s total factor productivity grew more rapidly than those of Turkey and Yugoslavia. South Korea selectively promoted infant industries and these exhibited superior performance by following an outward-looking strategy. In Turkey, the export phase from 1970 to 1973 turned out to be abortive largely because the government allowed incentives to move against exports. Turkey entered into rapid and successful export promotion during 1963-76. If this is true, then it can be argued that Turkey experienced a successful period of import substitution, in which its infant industries reached maturity. This is contradictory to Krueger and Tuncer’s (1982) findings that protection did not elicit the growth in productivity. The assumption that there are well-defined production technologies describing all plants within an industry may not be true. Tybout (1992) went beyond this and measured productivity growth at plant level in Chile, Colombia and Morocco. Tybout's model revealed that output expansion not only came from productivity growth, but also that productivity change was accompanied by changes in scale or net entry. Tybout (1992) found that output growth was positively correlated with entry but did not correlate significantly with the exit of firms, and higher effective protection rates were associated with large plant size, especially at the low end of the size distribution.
Based on the aforementioned argument, the hypothesis that trade opening had a positive impact on manufacturing’s productivity growth has been tested and obtained some support in some studies which include (Kim, 2000: Dongsuk 1992) for South Korea, (Weiss, 1992: Tybout and Westbrook, 1995) for Mexico, (Rodrigo, 1995) for the Chilean economy, Sri Lanka (Weiss and Jayanthakumaran, 1994), (Urata and Tokota, 1994) for Thailand, in Cote d’Ivoire (Harrison, 1993), Indonesia (Kristiono, 1997: Sjoholm, 1997), and in India (Soo, 2008; Madheswaran et al 2007; Krishna and Mitra, 1997; Goldar and Anita Kumari (2003).
Tybout (2000) and Epifani (2003) survey the possible effects of trade policies on manufacturing firms in developing countries. Among these studies, some try to determine whether internal economies of scale explain correlation between trade liberalization and productivity. Their conclusions suggest that scale efficiency gains are minor and not correlated with trade liberalization (Tybout and Westbrook 1995). Firm-level studies find that it is the re-allocation of resources from less to more productive firms that explains productivity gains (Pavcnik 2002, Tybout 2001, Tybout and Westbrook 1995). Other studies also estimate if there are turnover effects linked to trade policies. Using firm data for Chile 1975-85, Tybout (1996) finds that net exit increased aggregate productivity in Chile. Net exit was in fact the main component of productivity gains for import competing industries. On the contrary, for Morocco net entry led to lower aggregate productivity (Haddad, et al 1996). A third source of aggregate productivity gains associated with trade liberalization policies could come from improvements in intra-firm efficiency. Roberts (1996) finds that productivity growth can be attributed to intra-plant movements, using firm-level data for Colombia for 1977-87. Without exploring why trade liberalization may affect productivity, some studies use firm and industry-level data and find a positive and significant correlation between trade measures and productivity measures (Haddad 1993, Paus et. al. 2003).
Sharma, Jayasuriya and Oczkowski (2000), based on their analysis of Nepalese manufacturing, claim that while trade and exchange rate policy reforms may be a necessary condition for improving productivity growth in “least developed” economies, they are not sufficient conditions. Other factors such as appropriate investment policies, shortages of human capital and physical infrastructure need to be addressed if potential productivity improvements are to be reaped. Jenkins (1995) found very little evidence from the Bolivian case and concluded that trade liberalization is neither a necessary nor sufficient condition for rapid productivity growth. Only the spinning and weaving industries have increased productivity through the elimination of high cost producers and the scrapping of obsolete capacity. Bolivia experienced lack of investment, a high real rate of interest and lack of organizational change during this period. As a result, increased productivity through these factors was insignificant.
Finally, Njikam, Binam and Tachi (2006) assess the factors behind differences, in total factor productivity (TFP) across sub-Sahara Africa (SSA) countries over the period 1965-2000. The cross-section, fixed effects using annual data, fixed-effects using data in 3-year averages as well as the seemingly unrelated regression (SUR) results show that (i) openness to world trade is conducive to TFP in SSA region only if issues related to supply conditions such as poor

ISSN 2039-9340 Mediterranean Journal of Social Sciences Vol. 3 (11) November 2012
640
transport and communication infrastructure, erratic supply of electric energy. Corruption and bad governance, insufficient education of the labour force etc are adequately addressed, (ii) physical capital accumulation is important for TFP, (iii) the size of the financial sector mattes for TFP, in some SSA countries and negative for TFP in other SSA countries. In short, the results of research on the relation between openness and manufacturing sector growth vary depending upon the models, data and countries of analysis. Therefore, the debate over the impact of trade openness on manufacturing sector growth is on-going and left open to further study. 3. Methodology and Data 3.1 Model Specification
The theoretical foundation of this work rest on the Heckscher- Ohlin model. The Heckscher-Ohlin model is a general equilibrium mathematical model of international trade. It builds on David Ricardo’s theory of comparative advantage by predicting patterns of commerce and production based on the factor endowments of a trading region. The model essentially says that countries will export products that use their abundant and cheap factors of production and import products that use the countries scarce factor. The Heckscher Ohlin model serves as a platform on which the empirical model is formulated as follows. The empirical part begins with a traditional production function of the Cobb-Douglas type that is assumed to reflect the true production of a given industry.
𝑌𝑌 = 𝐴𝐴𝐾𝐾𝛽𝛽1𝐿𝐿𝛽𝛽2 … … … … … … … … … … … … … … … … … … … … … … … … … (1) Y is the output level, A is technical efficiency of the sector, L represents number of workers and K represents the stock of capital. Endogenising trade impact into equation one with an assumption that the country is an open economy generates;
𝑌𝑌 = 𝐴𝐴𝐾𝐾𝛽𝛽1𝐿𝐿𝛽𝛽2𝑇𝑇𝛽𝛽3 … … … … … … … … … … … … … … … … … … … … … … … … … (2) The production function follows a constant return to scale (CRS) such that 𝛽𝛽1+𝛽𝛽2 + 𝛽𝛽3 = 1 In logarithms, the true production function can be expressed as:
𝐼𝐼𝑛𝑛𝑌𝑌 = 𝐼𝐼𝑛𝑛𝐴𝐴 + 𝛽𝛽1𝐼𝐼𝑛𝑛𝐾𝐾 + 𝛽𝛽2𝐼𝐼𝑛𝑛𝐿𝐿 + 𝛽𝛽3𝐼𝐼𝑛𝑛𝑇𝑇… … … … … … … … … … … … … … … … . (3) We have adopted the model of Sinha and Sinha (2000), which states that the GDP growth has three growth components, namely; trade growth, labour growth and investment growth. The volume of trade (import plus export)/GDP is used as proxy of openness. The following equation is then derived.
𝑀𝑀𝑌𝑌𝑀𝑀 = 𝛽𝛽0 + 𝛽𝛽1𝐼𝐼𝑀𝑀 + 𝛽𝛽2𝑃𝑃𝑀𝑀 + 𝛽𝛽3𝑇𝑇𝑀𝑀 + 𝛽𝛽4𝐼𝐼𝐼𝐼𝐼𝐼 + 𝛽𝛽5𝐶𝐶𝐴𝐴𝐴𝐴𝐶𝐶 + 𝜀𝜀… … … … … … . (4) MYG refers to manufacturing output growth; TG is trade growth – proxy for openness; IG is Investment growth; PG is employment growth in the sector; INF is inflation rate; REER is real exchange rate; e is the error term. This research is also concerned with the terms 𝛽𝛽0 (=lnA) 3.2 Estimation Technique and methodology In order to develop strong, robust and reliable models that capture the relationship between trade openness and manufacturing output growth, the research work adopts the econometric techniques of the Error Correction Term (ECT) as the estimation technique. The method of ECT is extensively used in regression analysis primarily because it is initiatively appealing and mathematically much simpler than any other econometric technique (Gujarati, 2003). The error correction term indicates the speed of the adjustment which restores equilibrium in the dynamic model.
∆𝑀𝑀𝑌𝑌𝑀𝑀𝑡𝑡 = 𝛼𝛼0 + �𝛼𝛼1𝑦𝑦
𝑗𝑗
𝑦𝑦=1
∆𝑀𝑀𝑌𝑌𝑀𝑀𝑡𝑡−𝑦𝑦 + �𝛼𝛼2𝑦𝑦
𝑗𝑗
𝑦𝑦=1
∆𝑇𝑇𝑀𝑀𝑡𝑡−𝑦𝑦 + �𝛼𝛼3𝑦𝑦
𝑗𝑗
𝑦𝑦=1
∆𝐼𝐼𝑀𝑀𝑡𝑡−𝑦𝑦 + �𝛼𝛼4𝑦𝑦
𝑗𝑗
𝑦𝑦=1
∆𝑃𝑃𝑀𝑀𝑡𝑡−𝑦𝑦 + �𝛼𝛼5𝑦𝑦
𝑗𝑗
𝑦𝑦=1
∆𝐼𝐼𝐼𝐼𝐼𝐼𝑡𝑡−𝑦𝑦
+ �𝛼𝛼6𝑦𝑦
𝑗𝑗
𝑦𝑦=1
∆𝐶𝐶𝐴𝐴𝐴𝐴𝐶𝐶𝑡𝑡−𝑦𝑦 + 𝛼𝛼7𝑦𝑦𝐴𝐴𝐶𝐶𝑀𝑀𝑡𝑡−1 + 𝑈𝑈𝑡𝑡 … … … … … … … … … … … … … … … … (2)
As this study involves time series data, the ordinary least square (OLS) method cannot be applied unless it is established that the variables concerned are stationary. For this paper, we have applied unit root test to check the stationarity of the variables under study. Specifically, the Augmented Dickey-Fuller (ADF) and Phillip-Perron test (PP) are used; the ADF and PP are used to avoid spurious regression thereby subjecting each of the variables used to unit root test so as to determine their orders of integration since unit root problem is a common feature of most time series data. 3.3 Data Sources

ISSN 2039-9340 Mediterranean Journal of Social Sciences Vol. 3 (11) November 2012
641
The research study makes use of secondary data. The data used are obtained from the Central Bank of Nigeria (CBN) statistical bulletin 2010 and Penn World Data. 4. Empirical Results
4.1 Descriptive Statistics The summary of the statistics used in this empirical study is presented in Table 1 below. As observed from the Table, MYG as a has the mean value of 11.21767 and the mean value of (INF) has the highest mean value of 20.55208 whereas the mean values of TG, IG, PG and REER are 11.21767, 11.36799, 11.36799 and 2.344606 respectively. The analysis was also fortified by the values of the skewness and kurtosis of all the variables involved in the models. The skewness is a measure of the symmetry of the histogram while the kurtosis is a measure of the tail shape of the histogram. The bench mark for symmetrical distribution i.e. for the skewness is how close the variable is to zero while the case of the kurtosis is three (mesokurtic) but values lower than that is called platykurtic and above is referred to as leptokurtic. Table 1. Summary Statistics
MYG TG IG PG INF REER Mean 11.21767 11.21767 11.36799 2.492094 20.55208 2.344606 Median 11.59682 11.59682 11.32467 2.495455 13.50000 2.968233 Maximum 11.97767 11.97767 14.70862 3.111829 72.80000 5.003275 Minimum 8.917713 8.917713 8.521145 1.610936 5.400000 -0.604404 Std. Dev. 0.963798 0.963798 1.995797 0.379603 16.85481 2.171385 Skewness -1.597378 -1.597378 0.244273 0.029297 1.489451 -0.161476 Kurtosis 3.902516 3.902516 1.640693 2.404800 4.441715 1.462111 Jarque-Bera 16.53151 16.53151 3.129587 0.536545 16.42860 3.704103 Observations 36
36 36 36 36 36
Source: Computed by the Researchers 4.2 Result of Unit Root Test In this analysis, the model with constant is considered. The null hypothesis in both the ADF and test is that there is the presence of unit root. Table 2 and 3 below report the results of ADF and PP test respectively. Table 2: Augmented-Dickey Fuller (ADF) Test
Variables ADF Values Mackinnon Critical Values Order of Integration
MYG -6.422229* -3.6394 I(1) TG -7.2556* -3.6394 I(1) IG -2.9249* -2.6158 1(0) PG -5.1794** -3.6394 I(1) INF -2.9827** -2.9484 I(0) REER -5.6964* -3.6394 I(1)
Source: Computed by the Researchers
Note: One, two and three asterisk denotes rejection of the null hypothesis at 1%, 5% and10% respectively based on Mackinnon critical values. The above results i.e. ADF test shows that all the variables are stationary at first difference with the exception of IG and INF. This means not all the variables are integrated of order 1, some are of level while the others are of order one. Table 3: Phillip-Perron Test (PP)
PP

ISSN 2039-9340 Mediterranean Journal of Social Sciences Vol. 3 (11) November 2012
642
Variables PP Values Mackinnon Critical Values Order of Integration
MYG -7.282436* -3.6329 I(1) TG -7.1854* -3.6394 I(1) IG -5.0592* -3.6329 I(0) PG -7.6373** -36394 I(1) INF -3.0478** -2.9484 I(0) REER -5.7085* -3.6394 I(1)
Source: Computed by the Researchers
Note: One, two and three asterisk denotes rejection of the null hypothesis at 1%, 5% and10% respectively based on Mackinnon critical values The above results i.e. Phillip-Perron test shows that all the variables are stationary at first difference with the exception of INF and IG. The two tests produce similar results. Therefore, the PP method is adopted for the research work where the results show that all most all the variables are found to be stationary at 99 percent significance level in their first difference from with the assumption of constant. Therefore, all variables are non-stationary and integrated of level order and order 1. 4.3 The Co integration Analysis Results and Interpretation In determining the number of co integrating vectors, trace test and maximum Eigen value test using the more recent critical values of Mackinon-Haug-Michelis (1999) was applied. The assumption of no deterministic trend and restricted constant was for all the variables. The choice was tested using (AIC) and Schwartz Information Criterion (SIC). The result for both trace test and maximum Eigen value for unrestricted co integration rank test are presented in Table 4 Table 4: Johansen Cointegration Result
Hypothesized No. of CE(s)
Eigen value Max-Eigen value
Critical value Trace statistic
Critical value 5 percent 1 percent 5 percent 1 percent
None 0.85208 64.9788** 39.37 45.10 136.050** 94.15 103.18
At most 1 0.60727 31.7774* 33.46 38.77 71.0711* 68.52 76.07
At most 2 0.42079 18.5672 27.07 32.24 39.2936
47.21 54.46
At most 3 0.32645 13.4370 20.97 25.52 20.7263 29.68 35.65
At most 4 0.17458 6.52370 14.07 18.63 7.28931 15.41 20.04
At most 5 0.02226 0.76561 3.76 6.65 0.76561 3.76 6.65
Source: Computed by the Researchers *(**) denotes rejection of the hypothesis at the 5 %( 1%) level From Table 4 above, it is observed that both the Trace test and Max-Eigen statistic indicates two integrating equations at 5% level of significance and one integrating equation at 1% significance level. Based on the evidence above, we can safely reject the null hypothesis (H0) which says that there is no co integrating vectors and conveniently accept the alternative hypothesis of the presence of co integrating vectors. Thus, we can conclude that a long run relationship exists among the variables. This result means that in Nigeria’s case, the hypothesis of no co integration among the variables should be rejected. Therefore there exists a long run relationship among the variables which are –MYG, TG, IG, PG, INF and REER. 4.4 Model Estimation Issues and Discussion of Results The result of our co integration test reveals that at least one co integrating vectors exist among the variables of interest. This means that we can estimate the Error Correction Model. An Error Correction Model is designed for use with non-stationary series that are known to be co integrated. The ECM has co integration relations built into the specification so

ISSN 2039-9340 Mediterranean Journal of Social Sciences Vol. 3 (11) November 2012
643
that it restricts the long-run behavior of the endogenous variables to converge to their co integrating relationships while allowing for short-run adjustment dynamics. The use of the methodology of co integration and ECM add more quality, flexibility and versatility to the econometric modeling of dynamic systems and the integration of short-run dynamics with the long-run equilibrium. The Error Correction Models were evaluated using the conventional diagnostic tests and the Schwarz Information Criterion (SIC) was adopted in choosing the appropriate lag length. The model with the lowest (SIC) was adopted. The results are of the co integrating relationship amongst the variables within the ECM framework are presented in Table 5 below. Table 5: Parsimonious Error Correction Estimate
Dependent Variable: D(In(MYG)) Method: Least Squares Variable Coefficient t-Statistic Prob. C 6.8149 3.8716* 0.0037 D(In(MYG(-2))) 0.3684 1.49679 0.1475 D(TG(-1)) 0.0092 0.2373 0.8144 D(In(IG(-1))) 0.5688 1.7169*** 0.0989 D(PG(-2)) -0.2074 -0.5615 0.5796 D(INF(-2)) -0.0023 -0.4845 0.6324 D(In(REER(-1))) -0.0648 -0.3070 0.7615 ECM(-1) -0.3246 -2.0092** 0.0549 R-squared 0.4839 Adjusted R-squared 0.4281 Durbin-Watson stat 1.9414
Source: Computed by the Researchers The analysis on the impact of trade openness on the manufacturing sector is presented in the table above. The result obtained from the dynamic model indicates that the overall coefficient of determination (R2) shows that 48.39 percent of growth rate of MYG is explained by the variables in the equation. As the adjusted (R2) tends to purge the influence of the number of included explanatory variables, the (R2) of 0.4281 shows that having removed the influence of the explanatory variables, the dependent variable is explained in the equation by 42.81 percent. The Durbin Watson (D.W) statistics of 1.94 as it is significantly below the bench mark of 2, we can conclude that there is no auto- correlation or serial correlation in the model specification; hence the assumption of linearity is not violated.
In terms of the signs and magnitude of the coefficients which signify the impact of trade openness on the manufacturing sector, it can be seen that all the variables MYG, TG, INF and REER except IG and PG concur with a’priori theoretical expectation. The significant coefficients of all exogenous variables clearly state that Nigeria’s economy manufacturing growth rate depends on growth of investment, population and foreign exchange in the long run. Above all trade openness has a positive impact on growth of MYG, though small but still significant. From the table a unit change in trade openness brings about 0.9% increase in growth of MYG thereby suggesting that there are other relevant variables apart from trade openness that can lead to manufacturing sector development Also exchange rate has a negative impact on growth of MYG and this is because there has not been a stable policy in exchange rate by the CBN. The variable exchange rate is important but it does not significantly affect the growth of MYG positively. A unit change in REER brings about 6% decrease in the growth of MYG. Also inflation has a negative impact on MYG. A unit change in INF brings about a 0.19% change in growth of MYG. In terms of t-statistics, all variables are not statistically significant with the exception of IG which is significant at 10%.
The estimated coefficient for the error correction term reveals which of the variables adjust to correct imbalance in the growth situation whilst the variable coefficients show the short-run effects of the changes in the explanatory variables on the dependent variable. The results confirm that growth of manufacturing output in Nigeria has an automatic mechanism and that MYG in Nigeria responds to deviations from equilibrium in a balancing manner. A value of (-0.324) for the ECM coefficients suggests that a fast speed of adjustment strategy of 32%. The results of this paper authenticate the findings of Tybout (2000), Epifani (2003), Soo, (2008) and Madheswaran et al (2007) that trade liberalization has a substantially greater impact on manufacturing sector performance. 5. Concluding Remark

ISSN 2039-9340 Mediterranean Journal of Social Sciences Vol. 3 (11) November 2012
644
The study has been preoccupied with the impact of trade liberalization on the manufacturing sector of the Nigerian economy. The development of Manufacturing sector and its effective promotion have not been approached seriously in Nigeria; hence, the lack of serious impact in the economy. Important findings were discovered during the course of this research, one is the relatively low productivity in the Nigerian manufacturing sector. This could be attributed to a plethora of factors, including a weak technological base and low level of capacity utilization. Also another major finding from this study is that there are significant pay-offs from the policy of trade liberalization. The current policy of trade liberalization, which emphasizes lower tariffs and increasing openness of the economy, was found to be growth enhancing.
The manufacturing sector is a very important sector in the economy requiring efficient and effective management to increase the level of growth and development. It is therefore, important to consider conditions that would ensure sustained growth in this sector. So the following recommendations are discovered from the cause of the study, they include;
i. Policies must be introduced to promote the imports of capital goods, in addition new and advanced technologies must be promoted in enhancing the growth of industrial value added which in turn contributed to positive economic growth.
ii. The Nigerian government should avoid short-term fixes and front-loaded deals with other countries and move beyond arrangements that focus solely on the petroleum sector. High commodity prices are only a temporary vehicle that can be utilized to drive Nigeria’s economy into a more economically diversified state, the true mechanism for sustained growth.
iii. Nigerians should be pragmatic as they strive to “build institutions.” Past attempts to build institutions in Nigeria particular and other African countries have shown that just uprooting and transplanting institutions does not work. The process is evolutionary in nature and dependent on political will and strong leadership to make the necessary changes.
References
Adebiyi. M.A. (2006) “Trade Liberalization Policy and Industrial Growth Performance in Nigeria: An Error Correction Mechanism
Technique”. In challenges of Nigerian industrialisation: A pathway to Nigeria becoming a highly Industrialized country in the year 2015. Selected Papers for the 2004 Annual Conference of the Nigerian Economic Society, pp. 119-145.
Amjad,R.(1977) “Profitability and Industrial Concentration in Pakistan”, The Journal of Development Studies, vol.13, pp.181-98. Beng,G.W. and Yen,T.S. (1977), “Market Structure and Price-Cost Margins in Malaysian Manufacturing Industries”, The Developing
Economies, vol.15(3), pp.280-91. Condon,T. Corbo,V. and De.Melo.(1984), “Productivity Growth, External Shocks and Capital Inflows in Chile During 1977-81: A General
Equilibrium Analysis”, Development Research Department, Economic and Research Staff, World Bank Report, No. DRD 128. Dongsuk, S. (1992), “Trade Liberalization and Productive Efficiency in Korean Manufacturing: Evidence from Firm-level Panel Data”, A
Dissertation submitted to the Faculty of the Graduate School of Georgetown University for the Degree of Doctor of Philosophy, U.M.I, A Bell & Howell Information Company, Michigan
Edwards, S., (1998). “Openness, productivity and growth: what do we really know?” Economic Journal 108, pp 383– 398 Engle, R.F and Granger C.W.J. (1987), “Co-Integration and Error Correction: Presentation, Estimation and Testing”. Econometrica, 55,
251-276 Epifani, P. (2003), “Trade Liberalization, Firm Performance and Labor Market Outcomes in the Developing World: What can we learn
from micro-level data?” World Bank Policy Research Working Paper 3063, May 2003. Foroutan, F. (1996), Turkey, 1976-85: “Foreign Trade, Industrial Productivity, and Competition”, In Mark J. Roberts and James R. Tybout
(eds.) Industrial Evolution in Developing Countries, Oxford University Press, Oxford. Goldar, Bishwanath, and Anita Kumari.2003. “Import Liberalization and Productivity Growth in Indian Manufacturing Industries in the
1990s.” The Developing Economies. XLI-4: 436-60. Golder,B. (1986) “Import Substitution, Industrial Concentration and Productivity Growth in Indian Manufacturing”, Oxford Bulletin of
Economics and Statistics, vol.48, pp.144-164. Grether, Jean-Marie. (1996), “Mexico, 1985-90: Trade Liberalisation, Market Structure, and Manufacturing Performance”, In Mark J.
Roberts and James R. Tybout (eds.) Industrial Evolution in Developing Countries, Oxford University Press, Oxford. Gujarati, D.N. (2003). Basic Econometrics, 4th Edition, New York: McGraw-Hill Higher Education. Haddad, M. (1993), “How Trade Liberalization Affected Productivity in Morocco,” World Bank Policy Research Working Paper S1096,
February 1993. Haddad, M., de Melo, J. and Horton, B. (1996), “Morocco, 1984-89: Trade Liberalisation, Exports, and Industrial Performance”, In Mark
J. Roberts and James R. Tybout (eds.) Industrial Evolution in Developing Countries, Oxford University Press, Oxford. Handoussa,H. Nishimizu,M. and Page, J.M.(1986), “Productivity Change in Egyptian Public Sector Industries After the Opening": 1973-
79, Journal of Development Economics, vol.20, pp.53-73. Harrison, A. E. (1994),” Productivity, Imperfect Competition and Trade Reform: Theory and Evidence”, Journal of International
Economics, vol.36, pp. 53- 73

ISSN 2039-9340 Mediterranean Journal of Social Sciences Vol. 3 (11) November 2012
645
Harrison, A., (1996). “Openness and Growth: A Time Series, Cross-Country Analysis for Developing Countries”. Journal of Development Economics, 48, 419– 447.
Hulton, C. W. (1967). “Exports Expansion and Economic Growth: A Survey”, Land Economics, Vol. 43, Pp. 148-157. Jenkins, R. (1995), “Does Trade Liberalisation Lead to Productivity Increases? A Case Study of Bolivian Manufacturing”, Journal of
International Development, vol.7 (4), pp. 577-97. Johansen, S. (1988). “Statistical Analysis of Co integration Vectors”, Journal of Economic Dynamics and Control, 12, 231-254. Johansen, S. (1991). “Estimation and Hypothesis Testing of Co integration Vectors in Gaussian Vector Autoregressive Models”,
Econometrica, 59: 1551-1580. Katrak,H.(1980) “Industry Structure, Foreign Trade and Price-Cost Margins in Indian Manufacturing Industries”, The Journal of
Development Studies, vol.17, pp.62-79. Kim, E. (2000), “Trade Liberalisation and Productivity Growth in Korean Manufacturing Industries: Price, Protection, Market Power and
Scale Efficiency”, Journal of Development Economics, vol. 62, pp. 55-83. Krishna, P. and Mitra, D. (1997), “Trade Liberalisation, Market Discipline and Productivity Growth: New Evidence from India”, Journal of
Development Economics, vol. 56, pp. 447-462. Kristiono, H. (1997), “The Effect of Indonesian Trade Liberalisation on Price-Cost Margins and Technical Efficiency”, A Dissertation
submitted to the Graduate School of Syracuse University for the Degree of Doctor of Philosophy, U.M.I, A Bell & Howell Information Company, Michigan.
Krueger,A.O.and Tuncer,B.(1982), “Growth of Factor Productivity in Turkish Manufacturing Industries”, Journal of Development Economics, vol.11, pp.307-25.
Madheswaran, S; Liao Hailin; and Rath Badri Narayan.2007. “Productivity Growth of Indian Manufacturing Sector: Panel Estimation of Stochastic Frontier and Technical Inefficiency.” The Journal of Developing Areas. Vol. 40, No. 2: 35-36.
Mulaga, G. and Weiss, J. (1996), Trade Reform and Manufacturing Performance in Malawi 1970-91, World Development, vol.24 (7), pp.1267-78.
Nishimizu,M.and Robinson,S. (1984), Trade Policies and Productivity Change in Semi-Industrialized Countries, Journal of Development Economics, vol.16 (1&2), pp.177-206.
Njikam, Binam, And Tachi.(2006). “Productivity and Openness in Indian Economy, Understanding Total Factor Growth”. IMF Working Paper 06:208
Njikam, O. (2009). “Trade Liberalization, Infrastructure and Industrial Performance in Cameroon”. Faculty of Economics and Management , University of Yaounde.
Paus, E. , N. Reinhardt, and M. Robinson (2003) , “Trade Liberalization and Productivity Growth in Latin American Manufacturing, 1970-98,” Policy Reform. March 2003, 1-15.
Pavcnik, N. (2002), “Trade Liberalization, Exit, and Productivity Improvements: Evidence from Chilean Plants,” Review of Economic Studies, 69(1), 245-276.
Roberts, M. (1996), “Colombia, 1977-85: Producer Turnover, margins, and Trade Exposure,” in Mark J. Roberts and J.R. Tybout (ed), Industrial Evolution in Developing Countries, Oxford University Press.
Semenick A., Morrison A.R., 2000, "Trade Reform Dynamics and Technical Efficiency: the Peruvian Experience", The World Bank Economic Review, Vol. 14, n° 2, pp. 309-30.
Sharma, K. Jayasuriya, S. and Oczkowski, E (2000), “Liberalisation and Productivity Growth: The Case of Manufacturing Industry in Nepal”, Oxford Development Studies, vol. 28 (2), pp. 205-22.
Sinha, D. and Sinha, T. (2000), “Openness, Investment and Economic Growth Asia”. The Indian Economic Journal, 49, No. 4, page 110-117.
Sinha, T. and Sinha D. (1999), “The Relation between Openness and Economic Growth: Postwar evidence from 124 countries,” Seoil Journal of Economics, Vol. 12, pp. 67-83.
Sjoholm, F. (1997), “Exports, Imports and Productivity: Results from Indonesian Establishment Data”, Working Paper Series in Economics and Finance No. 183, Stockholm School of Economics, Sweden.
Soo, Kwok Tong. 2008. “From License Raj to Market Forces: The Determinants of Industrial Structure in India after Reform.” Economica. Vol. 75: 222-243.
Tybout, J. R. (1996), “Chile, 1979-86: Trade Liberalization and Its Aftermath” in Mark J. Roberts and J.R. Tybout (ed), Industrial Evolution in Developing Countries, Oxford University Press.
Tybout, J. R. (2000), “Manufacturing Firms in Developing Countries: How Well Do They Do, and Why?” Journal of Economic Literature. March 2000, 11-44.
Tybout, J. R., and M.D. Westbrook (1995), “Trade Liberalization and the Dimensions of Efficiency Change in Mexican Manufacturing-Industries,” Journal of International Economics, Aug 1995, 53-78.
Tybout, J.R. (1992), Linking Trade Policy and Productivity: New Research Directions, The World Bank Economic Review, vol.6 (2), pp.189-211.
Tybout, J.R. and Westbrook, M. D. (1995), “Trade Liberalisation and the Dimensions of Efficiency Change in Mexican Manufacturing Industries”, Journal of International Economics, vol. 39, pp. 53-78.
Urata, S. and Yokota, K. (1994), “Trade Liberalisation and Productivity Growth in Thailand”, The Developing Economies, vol. 32 (4), pp. 445-59.
Wacziarg, R., and K. H. Welch, (2003), “Trade Liberalization and Growth: New Evidence”, NBER Working Paper 10152, National Bureau of Economic Research.

ISSN 2039-9340 Mediterranean Journal of Social Sciences Vol. 3 (11) November 2012
646
Weiss, J. (1992) “Trade Liberalization in Mexico in the 1980s: Concepts, Measures and Short-Run Effects”, Review of World Economics, Band 128, Haft 4, pp. 711- 725.
Weiss, J. (1991) “Industry in Developing Countries: Theory, Policy and Evidence”, Routledge, London. Weiss, J.and Jayanthakumaran, K. (1995), “Trade Reform and Manufacturing Performance: Evidence from Sri Lanka 1978-89”,
Development Policy Review, Vol.13. pp. 65-83. Yanikkaya Halit (2003), “Trade Openness and Economic Growth: a cross country empirical investigation”, Journal of Development
Economics 72, pp. 57-89

ISSN 2039-9340 Mediterranean Journal of Social Sciences Vol. 3 (11) November 2012
647
Policy Variables and Economic Growth in South Africa: Understanding the Nexus
Kanayo Ogujiuba
Department of Statistics and Population Studies
University of the Western Cape Cape Town, South Africa
Nancy Stiegler
Department of Statistics and Population Studies University of the Western Cape
Cape Town, South Africa
Oluwasola Omoju
Research Division National Institute for Legislative Studies
National Assembly, Abuja, Nigeria
Doi:10.5901/mjss.2012.v3n11p647 Abstract The South African economy witnessed profound transformation in the post-apartheid era. This transformation was attributed to a lot of factors, particularly the various economic and development policies that accompanied the end of apartheid and the political liberation of 1994. This paper investigates the impact of macroeconomic variables on economic growth in South Africa; and identifies policy variables that have been significant in influencing economic growth in the country. The research adopts a dynamic regression model within the framework of the neo-classical growth model, specifically the adjusted neo-classical model as applied by Ghura & Hadjimichael (1996) and Calanitsis, Basu & Ghura to sub-Sahara Africa. The study found that the political liberation of 1994, government investment, maintenance of fiscal discipline and stable exchange rate have a positive impact on economic growth. On the other hand, private investment and terms of trade have negative impact on economic growth. The paper recommends that the fiscal and monetary adopted in South Africa should be consolidated, while the investment and trade policy should be reviewed to make it growth-inducing. Keywords: Policy, Growth, South Africa, Nexus
1. Introduction The South African economy has witnessed profound transformation in the past decades. Between 1950 and 1973, the economy witnessed a modest growth rate of 2.2% per annum in real GDP and 3% in labour productivity. The economy grew by 1% during the period 1984-1993. The growth rate improved to 3% and 5% for the period 1994-2003 and 2004-2006 respectively. According to Manuel (2007), the South African economy has grown by about 40% between 1993 and 2007; and is expected to grow by 6.5% and 8% by 2010 and 2011 respectively. It was also revealed that as at 2006, the economy has grown consistently and consecutively for over eight years, which is regarded as the longest streak since 1945. This substantial economic expansion has also been accompanied by employment growth, increase in labour productivity, tax relief, high real wages, increase in social grants. All these have culminated in increasing the level of household income and consumption and reduction in poverty level.
The economic performance of post-apartheid South Africa has attracted the attention of policy makers. Various factors have been adduced for this phenomenal growth, of which macroeconomic and fiscal management as well as favourable global conditions were core underlying dynamics. Specifically, factors such as public investment, low cost of input, export growth, growth in manufacturing and service sectors and good governance have been identified as crucial to the sudden surge of the economy. Moreso, the volatility of the currency, poor logistics system, shortage of skilled

ISSN 2039-9340 Mediterranean Journal of Social Sciences Vol. 3 (11) November 2012
648
manpower, limited investment opportunities, poor regulatory environment and deficiencies in governance were identified as constraints to economic growth in the country (Hanival and Maia, 2008). Some studies have posited that economic growth anywhere is a product of sound and quality economic policies (Collier and Dollar, 2001). The post-apartheid period witnessed various macroeconomic and development policies, aimed at promoting economic growth. Were these policies responsible for the improvement in economic growth in South Africa? Which of the policy variables were effective and which are not? Numerous empirical studies have been conducted on the factors that promote economic growth in South Africa. The findings of these studies varies, owing to methodological and specification differences. But, there are limited works on the impact of economic policies on growth in South Africa. This gap is what this present study tries to capture.
This paper investigates the policy frameworks that influence economic growth in South Africa. It also investigates whether economic policies in South Africa have been consistent with theoretical views on how they are expected to affect growth. Specifically, the paper undertakes to:
(i) Investigate the effect of macroeconomic policies on economic growth; and (ii) Identify the policy variables that have significant effect on economic growth in South Africa. 2. An Overview of Macroeconomic Performance in South Africa The South African economy is a pre-dominantly mineral exporting economy. It has rich deposits of gold, platinum, diamond and coal, and exports these commodities to the rest of the world. Nonetheless, agriculture, manufacturing, services and trade also form integral parts of the economy. The role of these sectors, particularly the mining sector in economic development cannot be over-emphasized. Mining contributes significantly to economic development due to discovery of new gold mines and increases in gold price. Howbeit, the manufacturing sector sprang up due to the exploits of the mining industry and the inflow of foreign direct investment, vis-à-vis the financial sector that also developed alongside these industries. Furthermore, the efficiency of commercial agriculture soon improved due to increased mechanization (Feinstein, 2005). However, the Apartheid regime limits the potentials of the economy, by creating constraints and problems in the labour market. It also limited people’s access to economic activities and created an inefficient public sector. Attempts by the government to transform the economy in the early 1990s was unsuccessful due to rising political dissatisfaction, a highly regulated economy, poor capital inflow and restricted foreign trade.
The period of stagflation in the early 1970s affected the economy severely. Real GDP per capita growth averaged -0.6% during the period 1973 to 1994. The economy also witnessed balance of payment problems occasioned by foreign aversion to the apartheid policy. The economic decline of this period was further exacerbated by the demise of the gold standard in the international monetary system, unfavourable external economic and political changes, and poor performance in the industrial sector (Feinstein, 2005). As at the end of apartheid in 1994, poverty was widespread, unemployment was high, and access to quality education, health care and other social services by the populace was limited.
The end of Apartheid and the political liberation that followed upturned the fortune of the South African economy. GDP growth has been fairly strong since 1994, with the exception of 1998 due to the contagious financial crisis in Asia. Growth recovered thereafter and has sustained an average annual rate of 5% since 2004. The economy recorded a GDP growth of 5.4% in 2006, its best performance since 1984, before slightly reducing to 5.1% in 2007. Average annual growth rate of fixed gross capital formation increased from 9.4% in 2003 to 12% in 2006. Private investment increased by over 12% in 2006, indicating a positive outlook for economic growth and employment generation. Between 1998/1999 and 2006/2007, debt service as a percentage of GDP reduced from 5.6% to 3.2%. The reduction in budget deficit within this period freed up about R33 billion which was invested in infrastructure and other social programmes. On sectoral contribution to economic growth, the service sector and retail and wholesale trade made significant inputs. The contribution of the manufacturing sector to the growth in GDP has also improved considerably due to increase in commercial and civil construction investments. Between 2003 and 2006, investment in the manufacturing sector increased by about 12%. The growth of the construction industry grew from 2.8% in the 1994-2003 periods to 12.1% in 2004-2006 periods (Manuel, 2007). The removal of trade barriers also contributed to the growth in productivity by encouraging the inflow of capital and foreign direct investment into the economy. Nonetheless, the growth witnessed was dulled by the performance of the agriculture sector that was highly volatile because of unfavourable climate conditions, price movements, land reforms and security issues.

ISSN 2039-9340 Mediterranean Journal of Social Sciences Vol. 3 (11) November 2012
649
2.1 A Brief Review of Macroeconomic Policies and Strategies in Post-Apartheid South Africa The end of apartheid and the democratization of the political landscape in South Africa in 1994 marked a turning point in the economic fortune of the country. There was urgent need to consolidate the political liberation attained by the country with economic growth, job creation and ultimately, poverty reduction. The first few years of the new government witnessed series of fiscal adjustments; and the initiation of the Reconstruction and Development Programme (RDP) provided the base for the prioritization of the government spending to the poorest segment of the society. The major objectives of the programme were to remove racial biases from the economic and social structure of the economy and address the problems of poverty. The Reconstruction and Development Programme was a socio-economic programme, and therefore needed complementary policy initiatives.
The introduction of the Growth Employment and Redistribution (GEAR) policy in 1996 was a step towards consolidating the gains of the Reconstruction and Development Programme. The broad objectives of the policy include redistribution of income, increasing access to social services, enhancing economic growth and employment and creating conducive environment for productivity. The first specific objective of the programme is to achieve macroeconomic balance, through reduction in budget deficit and rate of inflation. The second objective is to ensure that the economy achieved a minimum growth rate of 6% by 2000. This was expected to be driven by improvement in fixed investment and non-gold exports. The third specific objective is to equitably re-distribute income through job creation realized from growth. The policy was aimed at reducing fiscal deficits, reducing inflation, maintaining exchange rate stability, creating incentives to promote new investments, reducing barriers to trade and liberalizing capital flows. These policy changes were considered necessary for sustainable economic growth and the realization of the other objectives of GEAR. The effectiveness of the policy was, however, questioned by Standing, Sender and Weeks (1996), who argued that the GEAR strategy is capable of inhibiting instead of promoting growth. They argued that a cut in government expenditure without corresponding expansion in investment or exports, may stifle growth, and compound the problem of unemployment and poverty.
The programme was, however, adversely affected by the Asian financial crisis of the late 1990s. The decline in global demand for South African exports, especially gold during these periods, coupled with the quest by the country’s firm to remain competitive led to massive retrenchment by firms. Specifically, the growth rate of the manufacturing export sector slumped to 0% in 1999 (Khamfula, 2005). The currency depreciated by about 28% between April and August, 1998. Similarly, the currency also depreciated by 21% between September and December, 2001 due to external crisis. These crises exerted shocks that hindered investment and economic growth during these periods. The failure of the Reconstruction and Development Programme and the Growth Employment and Redistribution led to the launching of the Accelerated and Shared Growth Initiative for South Africa (AsgiSA) in 2006. The programme was aimed at accelerating economic growth to an average of minimum of 4.5% between 2005 and 2009; and further to a sustainable 6% average annual growth rate between 2010 and 2014. Such growth projection was aimed at reducing the level of poverty and unemployment by 50% by 2014. It is a coordinating platform for different policies, including some elements of GEAR and RDP. It emphasizes infrastructural development. Specific amounts were earmarked for building and upgrading of ports, railway lines, airports, petroleum pipeline, stadia, roads, energy, power generation, etc. This is in a bid to ensure that the benefits of economic growth are shared through the provision of these facilities and other complementary social services. In all, the economy has seen 14 consecutive years of positive real GDP growth. Fixed investment as a percentage of GDP increased from 15% in 2000 to 19% in 2006, and further increasing to 21% in 2007. The incidence of poverty has reduced; and access to education, health care, water, sanitation, electricity and affordable housing has increased significantly. According to the Community Survey released in late 2007, over 88% of the populace has access to piped-water, compared to only 50% in 1996. Similarly, over 70% have access to good housing compared to 64% in 1996. There has also been steady progress in access to education, healthcare, electricity supply, telecommunications and transport facilities. 2.2 Monetary and Fiscal Policies Before 2000, the monetary authority in South Africa was emphasizing financial stability at the expense of economic growth in the pursuit of its monetary policy objectives (Khamfula, 2005). The authority maintained high interest rate in order to achieve low inflation, and check exchange rate fluctuation and capital flight. Continued emphasis on reduction of fiscal deficit, and the increase in interest rate adversely affects economic growth through dwindling private and public investment. As a result of this, the monetary authority intends to pursue the objectives of exchange rate stability, interest rate flexibility and open capital market simultaneously. The difficulty in achieving these objectives led to active focus on

ISSN 2039-9340 Mediterranean Journal of Social Sciences Vol. 3 (11) November 2012
650
inflation targeting at the expense of exchange rate stability. The massive capital inflow that greeted the political liberation in 1994 led to increase in money supply.
In addition to pursuing low inflation, the South African Reserve Bank introduced capital account liberalization to maintain competitive real exchange rate. This was an attempt to pursue both monetary and exchange rate targets simultaneously. By 2000, the monetary authority adopted the inflation targeting monetary policy framework, indicating that the rate of inflation is being targeted directly by the apex bank. The objective of the inflation targeting mechanism is to ensure price stability by reducing the inflationary effect of discretionary monetary policy. Khamfula (2004) have empirically investigated the impact of inflation targeting on interest and exchange rate in South Africa; and found that inflation targeting is accompanied by a stable exchange and interest rate in the long-run. In the area of fiscal policy, there was a significant adjustment in the system of public expenditure management, financial planning and reporting during the post-apartheid era (Manuel, 2007). The budget was contained within the Medium Term Expenditure Framework (MTEF) and output-linked performance indicators were established. The Public Finance Management Act was established to coordinate and ensure stringent controls over financial management in government institutions. As a result of this fiscal measures, fiscal deficit as a percentage of GDP has been kept below 3%, as stated in the GEAR policy. The adoption of expansionary fiscal policy after 2001 led to non-interest expenditure growing by 8% over the next three years, and a fiscal deficit of 3.2% for the 2004-2005 fiscal year. Thus, the level of public debt as a percentage of GDP dropped from about 50% to less than 40% (Khamfula, 2005). There was also reduction in capital budget to free up resources for social spending. According to Van der Berg (2001), there was an increase of about 24% in per capita social spending between 1993 and 1997; this has been sustained in the preceding year. 3. Theoretical Framework The neo-classical growth model is a long run economic growth model, also known as the Solow-Swan or exogenous growth model. The model explains economic growth by examining the role of productivity, capital accumulation, population growth and technological progress. It is an extension of the Harrod-Domar growth model that investigates the separate effect of technological change, capital accumulation and labour productivity on economic growth. The Harrod-Domar emphasized exogenous factor accumulation as a determinant of growth. In response, the Solow model show that steady state growth is driven by technological change, while the adjustment to stable steady state growth is achieved by endogenous changes in factor accumulation. Thus, from the neo-classical growth model, the source of growth, technological changes, is considered to be exogenous (Solow, 1956).
The model assumes that GDP is produced to an aggregate production function. Thus, the model is expressed with the use of the Cobb-Douglas Production Function, which is stated as follows:
Yt = AtKtαLt1-α, 0 < α >1
where Yt is the level of output or GDP, Kt is the capital input, Lt is the labour input, α is production elasticity and At is total factor productivity. From the mathematical expression, it can be seen that output is produced using capital and labour, where this inputs are turned into outputs through a constant returns to scale and decreasing marginal returns to factor accumulation. Increase in At is called technological progress, but ultimately it is a measure of productive efficiency. This is because an increase in At leads to increase in the productiveness of other factors.
The neo-classical growth model has both short and long-run implications for output level. In the short run, policy measures can affect only the steady state level of output. Growth is affected as the economy converges to the new steady state output level. The rate of growth of the economy is determined by the rate of capital accumulation, which on its own, is determined by the savings rate and the rate of capital accumulation. In the long run, the rate of growth is exogenously determined. It is believed that the economy will converge towards a steady state rate of growth, which is determined by technological progress and labour force growth rate. A key prediction of the model is that in the long-run, economic growth in developing countries will converge with those of developed countries, given that the countries have the same institutional arrangements, market, trade and educational policy. The model has, however, been criticized for its inability to account for entrepreneurship and institutions. Besides, it fails to explain how and why technological progress occurs. 3.1 Empirical Framework Empirical research requires accurate and comprehensive data, but finding complete data series for South Africa is very difficult (Sunde, 2012). This is the case for the entire continent. This paper makes use of time-series data. Obtaining the

ISSN 2039-9340 Mediterranean Journal of Social Sciences Vol. 3 (11) November 2012
651
entire series from a single source proved a challenging task. As a result, the data used in this paper were obtained from various sources 1
We investigated the role of policy variables as determinants of growth, using a modified version of the neo-classical model applied by Ghura and Hadjimichael (1996) and Calanitsis, Basu and Ghura (1999) to sub-Saharan Africa. This model was also recently employed by Akitoby and Cinyabuguma (2004) with minor adjustments to reflect the economy of DR Congo. The growth equation estimated in this paper is in the form
, with possibly different methods of calculation. This may somewhat impact, but not invalidate the findings of this paper. The time period under investigation is between 1980 and 2010.
2
Series
:
GDPG = β0 + β1 P/Y + β2 G/Y + β3 EXCHR + β4 DEF/GDP + β5 TOT + β6 DUM94 + µ
where the dependent variables is GDPG (GDP growth rate), while the independent variables include EXCHR (exchange rate), TOT (terms of trade), DEF/GDP (deficit as a percentage of GDP), P/Y (private investment as a percentage of GDP) and G/Y (government investment as a percentage of GDP) and DUM94 is the dummy variable, signifying the end of apartheid and the beginning of a new political and economic dispensation. The variable was assigned for 0 for apartheid and 1 for post-apartheid periods. 4. Results and Analysis We employed the Augmented Dickey Fuller (ADF) test to find out the degree of differencing required to establish stationarity in the series. This is a test to examine the presence of unit root and confirm the order of integration in the data series. The results of the ADF test are summarized in the table below (see appendix for detailed results). Table 1. Result of Unit Root Test
ADF Statistic 1% Sig. level 5% Sig. level 10% Sig. level Order of Integration GDPG -4.0043 -3.6661 -2.9627 -2.6200 I(0) EXCHR -1.1079 -3.6752 -2.9665 -2.6220 I(1) TOT -1.2668 -3.6752 -2.9665 -2.6220 I(1) DEF/GDP -1.8616 -3.6852 -2.9705 -2.6242 I(2) P/Y -0.7793 -3.6752 -2.9665 -2.6220 I(1) G/Y -0.04537 -3.6752 -2.9665 -2.6220 I(1)
Source: Authors’ Computation (E-views) Using the ADF unit root test, we found that GDP growth rate was the only variable that was stationary at level. All the other variables were non-stationary at levels, implying the presence of unit root. At first differencing, exchange rate, terms of trade, private investment/GDP ratio and government investment/GDP ratio were stationary. Fiscal deficit as a percentage of GDP (DEF/GDP) was stationary after second differencing. Table 2. Summary of Dynamic Regression Result (See Appendix for detailed results)
Series Coefficient Probability C 1.319786 0.0059 D(EXCHR) 0.876762 0.0269 D(TOT) -13.37050 0.0004 D(D(DEF/GDP)) 0.138132 0.5089 D(P/Y(-3)) -15.57520 0.0135 D(G/Y) 17.49817 0.0643 DUM94 2.296991 0.0007 Adjusted R-Square 0.674864 DW 1.70 F- Statistic 8.9566
Source: Author’s Computation (E-Views) 1 Some were obtained from the World Bank, South Africa Treasury, US Central Intelligence Agency, and other economic data sourcing agencies’ websites. Some years of a particular series may be found in a particular source, while the remaining years found in another source(s). 2 Several variables found to have strong impact on growth according to the literature were not included in the model due to unavailability of data.

ISSN 2039-9340 Mediterranean Journal of Social Sciences Vol. 3 (11) November 2012
652
The result of the dynamic regression model is presented in table 2 above, and discussed below. The dummy variable for the end of apartheid in 1994 have a significant and positive impact on the growth and development of the SA economy. This implies that the apartheid regime has substantially constrained economic growth and development in the country. This is in conformity with earlier studies (Khamfula, 2005). Government investment also has a significant and positive impact on economic growth. The variable for government investment was significant only at 10% level of significance. The huge size of government investments in the country crowds out short term private sector investment, and partly explains the negative relationship found between private sector investment and economic growth. The negative relationship is contrary to a priori expectation, but corroborates the findings of Blomstrom, Lipsey and Zegan (1996), Easterly and Levine (2000). These studies suggest that physical and human capital do not lead to faster growth, and growth promotes investment more than investment promotes growth. Thus, the effect of private sector investment on economic growth in South Africa was disappointing, at least in the short term. The deficit-GDP coefficient captures the impact of fiscal discipline on economic growth. The coefficient is positive but not significant; indicating that fiscal discipline is necessary but not sufficient for economic growth. However, despite the effort in keeping the deficit-GDP ratio low3
3 The average deficit-GDP ratio for 1980 to 1993 is -4.38 against it average of -2.47 for 1994 to 2010.
, there is still room for improvement in order to optimize its impact on growth. TOT, contrary to a priori expectation was negatively related to GDP. This could be as a result of the primary nature of SA export against its capital import which has affected its terms of trade. At the initial point, South Africa adopted an import substitution trade strategy. However, the opening of its economy through trade liberalization policies has caused the influx of different goods. Exports have, however, been primary commodities such as agricultural products, gold, platinum, diamond, etc that have depreciated in prices. From the result also, exchange rate has a significant positive impact on economic growth, which is an indication of the effectiveness of the monetary policy pursued by the country. An adjusted R-squared of 0.6749 shows that all the policy variables included in the model explains 67% of variations in GDP. 5. Conclusion and Policy Implications This paper has examined the effect of macroeconomic policies on economic growth in South Africa. It investigates the policy determinants of growth using a modified neo-classical model. Factors that have contributed to the economic performance of the country were also reviewed. Some of these factors were the manipulative variables underlying these policies. The factors for which data are available to the researchers have been used to determine which of them impact economic growth in South Africa. The summary of findings is provided below.
Using a dynamic regression model, the study found that apartheid regime is one of the most important constraints to economic growth in the country. The end of apartheid and the emergence of democracy in 1994 was the turning point in the fortune of the economy. This necessitated the initiation of series of macroeconomic and development policies such as the Economic Reconstruction and Development (ERD), Growth Employment and Redistribution Strategy (GEAR), etc. These policies were developed to correct the structural imbalances and rigidities that had been deeply rooted in the economy by the apartheid regime: and also serve as the foundation for a new emerging economy.
Government investment contributes to the growth performance witnessed in the South African economy. Strategic fiscal adjustments were initiated after 1994, which involved significant and massive investment in infrastructure and social services, particularly focused at the poor and neglected part of the population. Although, these investments were important in contributing to economic growth, they crowd-out private investment.
The fiscal policy regime in the country, focused on ensuring and maintaining fiscal discipline contributes to growth, though there is need to ensure that the impact of fiscal discipline on economic growth is optimized. The terms of trade has a negative impact on economic growth. This indicates the preponderance of non-productive luxury imports and export of primary products as argued by Jager (2004). The positive relationship between exchange rate and economic growth shows that the exchange rate management system has a positive impact on the country’s economic performance.
In the light of these findings, to promote economic growth in South Africa, the government should initiate more people-oriented macroeconomic and development policies. Increase in government investment, especially in the area of infrastructure and social services should be sustained. Efforts should be made to create an enabling environment where private investment would significantly and positively contribute to economic growth. Promoting and maintaining fiscal discipline should be at the core of government activities. Imports of productive capital goods, rather than non-productive luxury goods and export of manufactured goods, rather than primary products are essential for the growth of the economy; and should be vigorously sought by the government of South Africa. The monetary authority should mobilize effort to ensure that exchange rate stability is ensured over the long run.

ISSN 2039-9340 Mediterranean Journal of Social Sciences Vol. 3 (11) November 2012
653
References Akitoby, B. & Cinyabuguma, M. (2004). Sources of growth in the Democratic Republic of the Congo: A cointegration approach. IMF
Working Paper No. 4. Washington: International Monetary Fund. Blomstrom, M., Lipsey, R. E. & Zejan, M. (1996). Is fixed investment the key to economic growth? NBER Working Paper No. 4436.
Cambridge, MA: National Bureau of Economic Research. Calamitsis, A. E., Basu, A., & Ghura, D. (1999). Adjustment and economic growth in sub-Saharan Africa. IMF Working Paper No. 51.
Washington: International Monetary Fund. Collier, P. & Dollar, D. (2001). Can the world cut poverty in half? How policy reform and effective aid can meet the international
development goals. World Development, 29(11), 1787-1802. De Jager, J. L. W. (2004). Aspects of growth empirics in South Africa. Unpublished PhD Thesis. Faculty of Economics and Management
Sciences, University of Pretoria. Easterly, W. & Levine, R. (2000). It’s not factor accumulation: Stylized facts and growth models. University of Minnesota Working Paper. Feinstein, C. (2005). An economic history of South Africa: Conquest, discrimination and development. London: Cambridge University
Press. Ghura, D. & Hadjimichael, M. T. (1996). Growth in Sub-Saharan Africa. IMF Staff Papers, 43, 605-634, September. Hanival, S. & Maia, J. (2008). an overview of the performance of the South African economy since 1994, Paper Commissioned for the
Fifteen Year Review. Khamfula, Y. (2004). Real interest and exchange rate volatility: The rule of ideal inflation target. Department of Economics, University of
the Witwatersrand, Mimeo. Khamfula, Y. (2005). Macroeconomic policies, shocks and economic growth in South Africa. Paper presented at the Macroeconomic
Policy Challenges in Low Income Countries Conference, IMF Headquarters, Washington: DC. Manuel, T. (2007). Economic policy and South Africa’s growth strategy. Retrieved online from
http://www.treasury.gov.za/comm_media/speeches/2007/2007031901.pdf. Solow, R. M. (1956). A contribution to the theory of economic growth. Quarterly Journal of Economics, 70(1), 65–94. Standing, G., Sender, J. & Weeks, J. (1996). Restructuring the labour market: The South African challenge. Geneva: International
Labour Office. Sunde, T. (2012). Financial sector development and economic growth nexus in South Africa. International Journal of Monetary
Economics and Finance, 5(1), 64-75. Van der Berg, S. (2001) Trends in racial fiscal incidence in South Africa, South African Journal of Economics, 69(2), 243-268, June.
Appendix
ADF Test Statistic -4.004339 1% Critical Value* -3.6661 5% Critical Value -2.9627 10% Critical Value -2.6200 *MacKinnon critical values for rejection of hypothesis of a unit root. Augmented Dickey-Fuller Test Equation Dependent Variable: D(GDPG) Method: Least Squares Date: 09/10/12 Time: 13:09 Sample(adjusted): 1981 2010 Included observations: 30 after adjusting endpoints Variable Coefficient Std. Error t-Statistic Prob. GDPG(-1) -0.676674 0.168985 -4.004339 0.0004 C 1.511884 0.588371 2.569608 0.0158 R-squared 0.364138 Mean dependent var -0.127900 Adjusted R-squared 0.341429 S.D. dependent var 2.851447 S.E. of regression 2.314018 Akaike info criterion 4.580188 Sum squared resid 149.9310 Schwarz criterion 4.673601 Log likelihood -66.70282 F-statistic 16.03473 Durbin-Watson stat 1.927961 Prob(F-statistic) 0.000415
ADF Test Statistic -1.107926 1% Critical Value* -3.6661 5% Critical Value -2.9627 10% Critical Value -2.6200

ISSN 2039-9340 Mediterranean Journal of Social Sciences Vol. 3 (11) November 2012
654
*MacKinnon critical values for rejection of hypothesis of a unit root. Augmented Dickey-Fuller Test Equation Dependent Variable: D(EXCHR) Method: Least Squares Date: 09/10/12 Time: 13:10 Sample(adjusted): 1981 2010 Included observations: 30 after adjusting endpoints Variable Coefficient Std. Error t-Statistic Prob. EXCHR(-1) -0.064744 0.058437 -1.107926 0.2773 C 0.505012 0.302971 1.666868 0.1067 R-squared 0.041998 Mean dependent var 0.218000 Adjusted R-squared 0.007784 S.D. dependent var 0.863878 S.E. of regression 0.860510 Akaike info criterion 2.601756 Sum squared resid 20.73335 Schwarz criterion 2.695169 Log likelihood -37.02634 F-statistic 1.227499 Durbin-Watson stat 1.589969 Prob(F-statistic) 0.277321
ADF Test Statistic -4.219279 1% Critical Value* -3.6752 5% Critical Value -2.9665 10% Critical Value -2.6220 *MacKinnon critical values for rejection of hypothesis of a unit root. Augmented Dickey-Fuller Test Equation Dependent Variable: D(EXCHR,2) Method: Least Squares Date: 09/10/12 Time: 13:10 Sample(adjusted): 1982 2010 Included observations: 29 after adjusting endpoints Variable Coefficient Std. Error t-Statistic Prob. D(EXCHR(-1)) -0.837332 0.198454 -4.219279 0.0002 C 0.179214 0.172292 1.040177 0.3075 R-squared 0.397353 Mean dependent var -0.041379 Adjusted R-squared 0.375032 S.D. dependent var 1.118301 S.E. of regression 0.884072 Akaike info criterion 2.657916 Sum squared resid 21.10275 Schwarz criterion 2.752212 Log likelihood -36.53978 F-statistic 17.80231 Durbin-Watson stat 1.828567 Prob(F-statistic) 0.000247
ADF Test Statistic -1.266883 1% Critical Value* -3.6661 5% Critical Value -2.9627 10% Critical Value -2.6200 *MacKinnon critical values for rejection of hypothesis of a unit root. Augmented Dickey-Fuller Test Equation Dependent Variable: D(TOT) Method: Least Squares Date: 09/10/12 Time: 13:11 Sample(adjusted): 1981 2010 Included observations: 30 after adjusting endpoints Variable Coefficient Std. Error t-Statistic Prob. TOT(-1) -0.156488 0.123522 -1.266883 0.2156 C 0.169162 0.142087 1.190557 0.2438

ISSN 2039-9340 Mediterranean Journal of Social Sciences Vol. 3 (11) November 2012
655
R-squared 0.054214 Mean dependent var -0.009183 Adjusted R-squared 0.020435 S.D. dependent var 0.106588 S.E. of regression 0.105494 Akaike info criterion -1.595994 Sum squared resid 0.311609 Schwarz criterion -1.502581 Log likelihood 25.93991 F-statistic 1.604992 Durbin-Watson stat 2.084254 Prob(F-statistic) 0.215634
ADF Test Statistic -6.773299 1% Critical Value* -3.6752 5% Critical Value -2.9665 10% Critical Value -2.6220 *MacKinnon critical values for rejection of hypothesis of a unit root. Augmented Dickey-Fuller Test Equation Dependent Variable: D(TOT,2) Method: Least Squares Date: 09/10/12 Time: 13:11 Sample(adjusted): 1982 2010 Included observations: 29 after adjusting endpoints Variable Coefficient Std. Error t-Statistic Prob. D(TOT(-1)) -1.211212 0.178822 -6.773299 0.0000 C -0.004914 0.019088 -0.257457 0.7988 R-squared 0.629516 Mean dependent var 0.004937 Adjusted R-squared 0.615794 S.D. dependent var 0.165353 S.E. of regression 0.102493 Akaike info criterion -1.651567 Sum squared resid 0.283632 Schwarz criterion -1.557271 Log likelihood 25.94772 F-statistic 45.87758 Durbin-Watson stat 1.787215 Prob(F-statistic) 0.000000
ADF Test Statistic -1.861696 1% Critical Value* -3.6661 5% Critical Value -2.9627 10% Critical Value -2.6200 *MacKinnon critical values for rejection of hypothesis of a unit root.
Augmented Dickey-Fuller Test Equation Dependent Variable: D(DEFGDP) Method: Least Squares Date: 09/10/12 Time: 13:12 Sample(adjusted): 1981 2010 Included observations: 30 after adjusting endpoints Variable Coefficient Std. Error t-Statistic Prob. DEFGDP(-1) -0.247573 0.132983 -1.861696 0.0732 C -0.841345 0.498859 -1.686537 0.1028 R-squared 0.110148 Mean dependent var -0.043333 Adjusted R-squared 0.078368 S.D. dependent var 1.455947 S.E. of regression 1.397734 Akaike info criterion 3.571922 Sum squared resid 54.70245 Schwarz criterion 3.665335 Log likelihood -51.57882 F-statistic 3.465913 Durbin-Watson stat 1.154474 Prob(F-statistic) 0.073174
ADF Test Statistic -2.497457 1% Critical Value* -3.6752 5% Critical Value -2.9665 10% Critical Value -2.6220 *MacKinnon critical values for rejection of hypothesis of a unit root.

ISSN 2039-9340 Mediterranean Journal of Social Sciences Vol. 3 (11) November 2012
656
Augmented Dickey-Fuller Test Equation Dependent Variable: D(DEFGDP,2) Method: Least Squares Date: 09/10/12 Time: 13:12 Sample(adjusted): 1982 2010 Included observations: 29 after adjusting endpoints Variable Coefficient Std. Error t-Statistic Prob. D(DEFGDP(-1)) -0.645609 0.258507 -2.497457 0.0189 C -0.105276 0.273114 -0.385465 0.7029 R-squared 0.187659 Mean dependent var -0.196552 Adjusted R-squared 0.157573 S.D. dependent var 1.588009 S.E. of regression 1.457536 Akaike info criterion 3.657843 Sum squared resid 57.35908 Schwarz criterion 3.752140 Log likelihood -51.03873 F-statistic 6.237293 Durbin-Watson stat 1.519205 Prob(F-statistic) 0.018903
ADF Test Statistic -5.696474 1% Critical Value* -3.6852 5% Critical Value -2.9705 10% Critical Value -2.6242 *MacKinnon critical values for rejection of hypothesis of a unit root. Augmented Dickey-Fuller Test Equation Dependent Variable: D(DEFGDP,3) Method: Least Squares Date: 09/10/12 Time: 13:13 Sample(adjusted): 1983 2010 Included observations: 28 after adjusting endpoints Variable Coefficient Std. Error t-Statistic Prob. D(DEFGDP(-1),2) -1.192531 0.209345 -5.696474 0.0000 C -0.219386 0.306884 -0.714884 0.4811 R-squared 0.555174 Mean dependent var -0.121429 Adjusted R-squared 0.538065 S.D. dependent var 2.385505 S.E. of regression 1.621327 Akaike info criterion 3.873116 Sum squared resid 68.34625 Schwarz criterion 3.968274 Log likelihood -52.22363 F-statistic 32.44981 Durbin-Watson stat 1.873254 Prob(F-statistic) 0.000005
ADF Test Statistic 0.771376 1% Critical Value* -3.6661 5% Critical Value -2.9627 10% Critical Value -2.6200 *MacKinnon critical values for rejection of hypothesis of a unit root. Augmented Dickey-Fuller Test Equation Dependent Variable: D(PY) Method: Least Squares Date: 09/10/12 Time: 13:13 Sample(adjusted): 1981 2010 Included observations: 30 after adjusting endpoints Variable Coefficient Std. Error t-Statistic Prob. PY(-1) 0.023922 0.031012 0.771376 0.4469 C 0.003643 0.002659 1.369862 0.1816 R-squared 0.020809 Mean dependent var 0.005333 Adjusted R-squared -0.014163 S.D. dependent var 0.008193 S.E. of regression 0.008251 Akaike info criterion -6.692652 Sum squared resid 0.001906 Schwarz criterion -6.599239 Log likelihood 102.3898 F-statistic 0.595021

ISSN 2039-9340 Mediterranean Journal of Social Sciences Vol. 3 (11) November 2012
657
Durbin-Watson stat 1.612305 Prob(F-statistic) 0.446945
ADF Test Statistic -4.032443 1% Critical Value* -3.6752 5% Critical Value -2.9665 10% Critical Value -2.6220 *MacKinnon critical values for rejection of hypothesis of a unit root.
Augmented Dickey-Fuller Test Equation Dependent Variable: D(PY,2) Method: Least Squares Date: 09/10/12 Time: 13:14 Sample(adjusted): 1982 2010 Included observations: 29 after adjusting endpoints Variable Coefficient Std. Error t-Statistic Prob. D(PY(-1)) -0.811741 0.201303 -4.032443 0.0004 C 0.004069 0.001942 2.094773 0.0457 R-squared 0.375875 Mean dependent var -0.000690 Adjusted R-squared 0.352760 S.D. dependent var 0.010327 S.E. of regression 0.008308 Akaike info criterion -6.676644 Sum squared resid 0.001864 Schwarz criterion -6.582348 Log likelihood 98.81134 F-statistic 16.26059 Durbin-Watson stat 1.792955 Prob(F-statistic) 0.000406
ADF Test Statistic 0.045370 1% Critical Value* -3.6661 5% Critical Value -2.9627 10% Critical Value -2.6200 *MacKinnon critical values for rejection of hypothesis of a unit root. Augmented Dickey-Fuller Test Equation Dependent Variable: D(GY) Method: Least Squares Date: 09/10/12 Time: 13:14 Sample(adjusted): 1981 2010 Included observations: 30 after adjusting endpoints Variable Coefficient Std. Error t-Statistic Prob. GY(-1) 0.004958 0.109291 0.045370 0.9641 C 0.006600 0.031424 0.210033 0.8352 R-squared 0.000074 Mean dependent var 0.008000 Adjusted R-squared -0.035638 S.D. dependent var 0.031991 S.E. of regression 0.032556 Akaike info criterion -3.947342 Sum squared resid 0.029678 Schwarz criterion -3.853929 Log likelihood 61.21014 F-statistic 0.002058 Durbin-Watson stat 1.560993 Prob(F-statistic) 0.964135
ADF Test Statistic -4.238831 1% Critical Value* -3.6752 5% Critical Value -2.9665 10% Critical Value -2.6220 *MacKinnon critical values for rejection of hypothesis of a unit root. Augmented Dickey-Fuller Test Equation Dependent Variable: D(GY,2) Method: Least Squares Date: 09/10/12 Time: 13:14 Sample(adjusted): 1982 2010 Included observations: 29 after adjusting endpoints

ISSN 2039-9340 Mediterranean Journal of Social Sciences Vol. 3 (11) November 2012
658
Variable Coefficient Std. Error t-Statistic Prob. D(GY(-1)) -0.793784 0.187265 -4.238831 0.0002 C 0.007472 0.006093 1.226376 0.2306 R-squared 0.399569 Mean dependent var 0.001724 Adjusted R-squared 0.377331 S.D. dependent var 0.040538 S.E. of regression 0.031988 Akaike info criterion -3.980409 Sum squared resid 0.027628 Schwarz criterion -3.886113 Log likelihood 59.71593 F-statistic 17.96769 Durbin-Watson stat 1.970119 Prob(F-statistic) 0.000235
Dependent Variable: GDP Method: Least Squares Date: 09/10/12 Time: 22:54 Sample(adjusted): 1984 2007 Included observations: 24 after adjusting endpoints Variable Coefficient Std. Error t-Statistic Prob. C 1.319786 0.419801 3.143836 0.0059 D(EXR) 0.876762 0.362030 2.421797 0.0269 D(TOT) -13.37050 3.033901 -4.407033 0.0004 D(D(DEF/GDP)) 0.138132 0.204704 0.674789 0.5089 D(P/Y)(-3) -15.57520 5.651405 -2.755987 0.0135 D(G/Y) 17.49817 8.842725 1.978821 0.0643 DUM94 2.296991 0.553689 4.148518 0.0007 R-squared 0.759682 Mean dependent var 2.543875 Adjusted R-squared 0.674864 S.D. dependent var 2.251786 S.E. of regression 1.283984 Akaike info criterion 3.576306 Sum squared resid 28.02646 Schwarz criterion 3.919905 Log likelihood -35.91567 F-statistic 8.956606 Durbin-Watson stat 1.701926 Prob(F-statistic) 0.000168

ISSN 2039-9340 Mediterranean Journal of Social Sciences Vol. 3 (11) November 2012
659
Contrastive Analysis of Different Types of Shifts in Persian Translation of The Secret
Dr. Seyed Mohammad Hosseini-Maasoum
Department of Linguistics & Foreign Languages, Payame Noor University, I.R. Iran Email: [email protected]
Hoda Davtalab
Department of English, Quchan Branch, Islamic Azad University, Quchan, Iran
Email: [email protected]
Doi:10.5901/mjss.2012.v3n11p659 Abstract: Translation shift is one of the most controversial domains of translation studies. In the present study an attempt was made to compare different translators’ use of shifts in a literary text. The selected theoretical framework for the present study was Vinay and Darbelnet (1995). To achieve this aim, a contrastive analysis was done on The Secret by Rhonda Byrne and its several Persian translations. The results of the study revealed that the translators use different types of shifts for a single sentence. In many cases, the translators use a combination of different kinds of shift in order to transfer an appropriate massage.
Key words: Shift, Translation, translator, Transposition, Modulation, Adaptation, equivalence, The Secret 1. Introduction Translation is a complicated phenomenon in which one concept of language transfers from one language into another. The act of translation may be in two ways: oral (interpretation) or written. This paper focuses on the written aspect of translation. In 1969, Nida and Taber pointed that “Translating consists in reproducing the receptor language the closest natural equivalent of the source language message, first in terms of language and secondly in terms of style” (p.12). In this definition, Nida and Taber focus that the selected equivalent by the translator should have some characteristics. Among these characteristics “language” and “style” are of paramount importance. These characteristics are specific for each language. As a result, there may be some alterations in the act of translation from source text (ST) into the target text (TT). In this regard, Popovič (1970) argues that “this transfer is not performed directly and is not without its difficulties” (P. 79). He argues that An analysis of the shifts of expression, applied to all levels of the text, will bring to light the general system of the translation, with its dominant and subordinate elements (p.85).
In addition, according to Toury (1980, p.12) translation involves “invariant under transformation”. Hence, some changes are inevitable when we try to render one language into another. This is because of the changes across different cultures and languages. These changes often named shifts in translation. Therefore, a faithful translator deals with a heavy responsibility and plays an important role in translation process.
Although this is the translator who determines the appropriate type of shift in the TT, the entity of the text is also more significant. Some types of shifts are more culture based; while the others are structural based. In the case of the structure of the sentence, it is necessary to say that word orders are different across languages. For example, in some languages like Persian the head word is initial position, while in some other languages like English the head word is final position. To illustrate the debate it is better to use an example. Consider a phrase like beautiful flower in English and its translation گل زيبا /gol-e ziba/ in Persian. In English phrase beautiful is an adjective and flower (head word) is a noun. It is clear that head word is in the final position. However, in Persian گل /gol/is the noun which is the head word. It is clear that it is initial position, while زيبا /ziba/ is an adjective and it is situated in the final position.
Some researchers such as Vinay and Darbelnet (cited in Newmark 1988, p.85) believes that shift is a procedure of changing grammatical structure of SL into grammatical structure of TL. He considers shift as a technique in which the translator can overcome some difficulties in the act of translation. Any way, it is elucidated that shift in translation “is not something to avoid by translator” and it occurs automatically in the process of translation. It is important to know that different natures and structure of languages bring about different types of shifts.

ISSN 2039-9340 Mediterranean Journal of Social Sciences Vol. 3 (11) November 2012
660
This research intends to identify and compare Persian translators’ ability for finding the best way in use of translation shift in a literary text. The debates of this paper are illustrated by the use of some examples of the book The Secret by Rhonda Byrne (2006) and its different related Persian translations by Nafiseh Motakef (2010), Mahdi Gharacheh Daghi (2009), Ata-ollah Fath Ali (2009), Monireh Jalali (2009) and finally Mohammad Sadegh Sabt-ol-sheykh (2008). The current study tries to investigate whether the translators use the same type of shift in translation of the same sentence. Vinay and Darbelnet’s (2000) model of shift has been adopted as the theoretical framework of this study. Therefore, the present research tries to find out types of shifts in form and meaning in the Persian translations of a literary work. 2. Shift In Translation A. Shift in Persian translations
There are a few researches in Persian translation shifts. As an example, Khoda bakhshi (2010) applied Catford’s category shifts in the Persian Translation of Oliver twist. His aim was to find the areas in which Persian is deviated from English. Khoda bakhshi (2010) believes “in translating from English to Persian structural shifts tend to occur everywhere within the text. However there were some instances of exception in literary forms”. He added in the process of translating from English to Persian translator doesn’t have many structural choices and any alterations lead to a change in the style.
Farrokh (2011) investigated different types of shifts in Persian translation of English complex sentences with wh subordinate clauses. She classifies the data into two main categories: the equivalence and shift. Her findings indicated that “in the Persian translation of these sentences, the shifts occur more than the equivalence, with the percentage of 86.25% and the equivalence with the percentage of 13.75%”.
Another research in this domain is related to Vossughi and Pourebrahim (2010, pp.79-90) investigate the realization of Catford’s shifts in the Farsi translation of English psychology texts. For this aim, they selected five books on psychology written in English and their Persian translations. Their findings demonstrated that all types of shifts in Catford’s classification were used in the translations. They also proved that structural shift is the most popular form in Catfords’ classification of shift.
As we will discuss in later parts, modulation is one type of shift which is discussed by Vinay and Darbelnet (1995). This topic is highlighted inTaghavi’s (2007) investigation which is centered around translation of modulations from English into Persian. Her study includes identification of modulations in the two different Persian translations of The Sound and the Fury which is written by Faulkner. She distinguished between two types of modulations: obligatory vs. optional. She argued that “comparison of the translators’ choices of obligatory and optional modulations will yield regularities enlightening their translatorial behavior” (p. ii). B. Shift of cohesion and coherence in translation It is clear that there is a difference between cohesion and coherence. For better understanding of this debate first we briefly define the notion of cohesion and coherence. Secondly, we discuss the deference between them and finally we talk about the shift of cohesion and coherence in the process of translation. Cohesion is one of the aspects of textual analysis in translation studies which refers to the network of lexical, grammatical, and other relations which link various parts of a text. These relations or ties organize or to some extent create text, for instance by requiring the reader to interpret words and expressions by reference to other words or expressions in the surrounding sentence or paragraphs. Cohesion is a surface relation. It connects together the actual words and expressions that we can see or hear (Baker, 1992, p.180).
In this definition lexical cohesion operate through the lexical chains throughout the text to create a unified whole (Schaffner, 2002, p.26). Therefore, cohesion is the concrete aspect in the text and makes the connection between the sentences. Halliday and Hasan (1976, p.146) believe that there is no structural relationship between the sentences. They establish five cohesion categories: reference, substitution, ellipsis, conjunctions, and lexical cohesion.
On the hand coherence refers to the ways in which the components of the textual world, i.e., the configuration of concepts and relations which underlie the surface text, are mutually accessible and relevant (Beaugrande & Dressler, 2002). Therefore, it is abstract. Zheng (2009, p. 53) argues that a coherent text is the outcome of combining concepts and relations into a network composed of knowledge space centered around main topics. She mentions that the result of this combination directly relates to translation “to yield a truthful target text with smoothness”. Knowing the definition of cohesion and coherence, Hoey (1991) shows the difference between them in this way:

ISSN 2039-9340 Mediterranean Journal of Social Sciences Vol. 3 (11) November 2012
661
We will assume that cohesion is a property of the text and that coherence is a facet of the reader's evaluation of a text. In other words, cohesion is objective, capable in principle of automatic recognition, while coherence is subjective and judgments concerning it may vary from reader to reader (p.12).
Now, it should be noted that shifts may occur at the level of both cohesion and coherence. Based on Taylor (2006, p.45) “cohesion shift” analysis is a means of examining cohesion dynamics to know where linguistic shifts occur in a text. Based on Blum Kulka (in Venuti, 2000, p.299) it may be in two directions: shifts in levels of explicitness and shifts in text meaning(s). At the first level the explicitness which is made by translator in TT is higher or lower than the ST. The reason is that in such cases the translator tends to make the TT clear for his/ her audience. In the second level “the explicit and implicit meaning potential of the source text changes through translations”.
On the other hand in the case of “shift of coherence”, Blum Kulka (in Venuti 2000) argues that “I will be concerned, on the most general level, with examining the possibility that texts may change or lose their meaning potential through translation” (p.304). She discusses shift in coherence in two levels. The first level is “reader-focused shifts of coherence” in which the text becomes a coherent discourse in the reader’s mind. Hence, Van Dijk and Kintsch (1983) suggest that each text may be interpreted in different ways by the readers. The second level is “Text-focused shifts of coherence” that “occur as a result of particular choices made by a specific translator, choices that indicate a lack of awareness on the translator’s part of the SL text’s meaning potential” (p.309).
As the result shift in cohesion and coherence is inevitable that is used by translators. The result may be a clear and understandable translation or a poor and ambiguous one. It is the art of a translator to choose the best way in keeping cohesion and coherence in the TT as well as the ST. 3. Translation shift classifications There are different classifications in translation shifts proposed by translation scholars. The most important classifications are presented by Vinay and Darbelnet (1995); Catford (1965); and Leuven-Zwart (1989). A. Vinay and Darbelnet (1995)
Vinay and Darbelnet (1995) consider the differences between languages. Although, their work limit to English and French, it influences on other languages (Munday, 2000, p.56). Observing equivalence in translation as a procedure that “replicates the same situation as in the original, whilst using completely different wording” (Vinay and Darbelnet, 1995, p.342), they suggest a classification for translation shift (pp. 31- 40) and argued that there two kinds of translation namely “direct translation” and “oblique [indirect] translation” (p.31). Direct translation involves the following three branches:
a. Barrowing: “The SL word is transferred directly to the TL”. Some examples in Persian are راديو /radijo/ and tələvizjon/ which are borrowed from English words Radio and Television. As it is obvious, there is no/ تلويزيونsignificant difference in pronunciation of these words in Persian and English.
b. Calque: “This is a special kind of borrowing where the SL expression or the structure is transferred in a literal translation”. In other word, an expression or a word enters TL by a literal translation. An Example is Persian is .havapəyma/ which is a literal translation of English word airplane/ هواپيما
c. Literal Translation: “This is a word for word translation” and it is “common between languages of the same family and culture”. Vinay and Darbelnet (1995, p.288) mention that “literalness should only be sacrificed because of structural and metalinguistic requirements and only after checking that the meaning is fully preserved”. However, they added the translators may reject literal translation because it may transfer inappropriate meaning which is different from the original meaning. In addition, the structure of the TT may interfere in transferring an appropriate meaning (pp. 34-35).
On the other hand, oblique translation involves: a. Transposition: this is a grammatical change that occurs in the process of translation. In other words, it refers to
the change of one part of speech for another without changing the sense (Vinay and Darbelnet, 1995, pp. 94- 99). For example, when a noun translates as verb or an adjective translates as a noun. Consider the following example in English and Persian: ST: He prefers to walk slowly. TT : را ترجيح می دهد .آرام پياده رویاو
In English sentence to walk is an infinitive verb, while in Persian translation its equivalence پياده روی /pijadəravi/ is a noun. At the same time the word slowly in an adverb in above English sentence. However, its corresponding translation in

ISSN 2039-9340 Mediterranean Journal of Social Sciences Vol. 3 (11) November 2012
662
Persian (آرام) is an adjective. Since, in ST and TT we deal with change of parts of speech, both of these cases can be considered as transposition.
b. Modulation: “This changes the semantics and the point of view of the SL”. Based on Vinay and Darbelnet (1995, pp. 246- 255) modulation may occurs in the following cases:
Abstract for concrete Cause- effect Part – whole Part- another part Reversal of terms Negation of opposite Active or passive Space or time Rethinking of intervals Change of symbol
For illustrating this debate, it is better to use an example in the case of active and passive sentences
ST TT Literal meaning Such dogs are highly valued by all experienced sheep farmers.
با تجربه ارزش زيادی برای چوپانان سگ ها قائل هستند.
All experienced shepherds put value on dogs.
In this example, the ST is passive, while the Persian translation is active. Therefore this is a case of modulation in translation.
c. Equivalence: “This is where languages describe the same situation by different stylistic or structural means and it is useful in translating idioms and proverbs”. For instance money doesn’t grow on trees is an idiom in English. The very literal Persian translation is completely different from English. It means that the words in ST and TT in this idiom are not correspondent, but it conveys exactly the same meaning.
ST TT Literal meaning money doesn’t grow on trees پول علف خرس نيست Money is not the grass of a bear!
d. Adaptation: “This involves changing in cultural reference when a situation in the source culture does not exist
in the target culture”. Therefore, in this case the process of translation involves considerable changes in ST. Consider the following example:
ST TT Literal meaning He went to a bar. رفت. قهوه خانهبه He went to a tea shop.
In Persian culture bar is not normal. It is forbidden in this culture. As the result, the translator changes it to tea shop which is used in Persian frequently.
B. Catford (1965)
Catford is one of the translation scholars who believe that the theory of translation should be based on comparative linguistics. He developed his theory under the effect of Halliday’s systematic grammar model. Catford’s book A Linguistic Theory of Translation (1965) is centered around the above mentioned idea. He argued that there are three types of translation:
1) Full and partial translation 2) Rank-bound translation and unbounded (rank-free) translation 3) Total translation vs. restricted translation
It should be noted that formal correspondent and textual equivalent are two important dimensions in Catford’s definition of shift. According to Catford (1965), a formal correspondent is “any TL category (unit, class, element of structure, etc) which can be said to occupy, as nearly as possible, the “same” place in the “economy” of TL as the given SL category

ISSN 2039-9340 Mediterranean Journal of Social Sciences Vol. 3 (11) November 2012
663
occupies in the SL” (p.27). On the other hand, a textual equivalent is “any TL text or portion of text which is observed on a particular occasion … to be the equivalent of a given SL text or portion of text”. Sánchez (2009) believes that “formal correspondent focuses on the linguistic structure of languages”, while “textual difference focuses on the translation in itself and its equivalent relationship with the ST” (p. 93). Catford (1965, p.73) mentions that translation shifts are “departures from formal correspondence in the process of going from the SL to the TL”. Considering these definitions Catford introduces two kinds of shift: level shift and category shift. Level shift occurs “when an SL item at one linguistic level, for example grammar, has a TL equivalent at a different level for example lexis”. In contrast, category shift involves the following subdivisions:
a. Structural shift: It is related to the grammatical structure of languages. According to Catford (1965), this kind of shift is the most common form. For example, the subject + verb + object structures in English are translated as subject + object+ verb in Persian.
ST: He (Subject) eats (verb) an apple (object). TTاو : (subject) سيب(object) می خورد (verb) .
b. Class shifts: this is changing of one part of speech to another. For example, when an adjective in ST translates as an adverb in TT or an adjective may be translated as a verb or a noun (see the example in part a: transposition).
c. Unit shifts (rank shifts): It refers to the changes of ranks in the ST and TT. Unit shifts occurs when “the translation equivalent in the TL is at a different rank to the SL”. For example, a word may be translated by a morpheme or a group by a clause (cited in Baker, 1998, p.229).
C. Van Leuven-Zwarts (1989
Zwart’s model consists of two parts: comparative and descriptive model. According to Leuven-Zwarts (1989, p. 154) this model “intended for the description of integral translations of fictional texts”. Cyrus (n.d, p.1240) argues that we can consider comparative model as a practical method for studying syntactic, semantic, stylistic, and pragmatic shifts within sentences, clauses, and phrases of literary texts and their translations. This model comprises microstructural shifts between ST and TT (Leuven-Zwarts, 1989, pp.155-170). Firstly, she divides the text into “transemes” which are “comprehensible textual units”. Secondly, “Architranseme” has been defined which is the invariant core sense of the ST transeme (Munday, 2001, p.64). In the next step, each transeme comprises with the Architranseme. In this situation:
If both transemes have a synonymic relationship with the Architranseme, no shift is deemed to have occurred. The absence of the synonymic relationship indicated a shift in translation and shifts are divided into three main categories with numerous subcategories. These three main categories are modulation, modification and mutation (Munday, 2001, p. 64).
On the other hand, descriptive model uses for the analysis of translated literature (Leuven-Zwarts, 1989, pp. 171-179). It is a macrostructural model which is based on the concepts of narratology and stylistics (Munday, 2001, p. 65). 4. Procedure Since “translators belong to the literary systems” (Toury, et al, 2008, p. 28), a literary text -The Secret by Rhonda Byrne (2006)- and its several corresponding Persian translations were selected as the corpus of the study and some examples were extracted from this book. The reason for selecting this topic was that shift translation debates are interesting area of research for many students and translation scholars. Moreover, translation shifts play an important role in linguistics and translation studies. In spite of the significance of this issue, there is a little attention to it especially in Persian translation. It is necessary to say that most of the researches in this domain are theoretical and there are a few numbers of practical researches in this area. This issue becomes more important in Persian translation. In addition, for a topic like this doing a contrastive research seems appropriate. The reason is that a contrastive analysis enables us to make a comparison between different translations in the same language. Moreover, it provides a situation to compare them to each other and observe that whether all translators use the same type of shifts for a selected sentence of ST. Here, there are some examples of The Secret accompanied with five different Persian translations. ST: I couldn't believe all the people who knew this.

ISSN 2039-9340 Mediterranean Journal of Social Sciences Vol. 3 (11) November 2012
664
Motakef’s translation: بود.باور نکردنیاينکه بيشتر مردم از آن خبر داشتند، برايم
Literal meaning: It was unbelievable for me that most of the people knew that. The word “believe” is translated as “unbelief” in Motakef’s translation. The ST is negative by using the word “couldn’t”, while Motakef’s translation is negative by using an adjective. She has used the word باور نکردنی (unbelief). It is clear that a verb in ST is changed to an adjective in TT. Therefore, in this sentence we have a change of one part of speech without changing the sense. According to Vivay and Darbelnet’s definition (1995, pp. 94- 99), Motakef has used transposition in her translation. Gharachedaghi’s translation:
عجيب بود که اين همه آدم از آن مطلع بودند.Literal meaning: It was interesting that these people knew that. As it is clear, Gharache daghi’s translation is positive and there is no negative element in sentence, while the ST is negative. According to Vinay and Darbelnet (1995) this is kind of modulation that include “negation of opposite”. Fath Ali’s translation:
نمی توانستم تمام حرف های آنهايی که از آن آگاه بودند را باور کنم. Literal meaning: I couldn't believe all the people’s statements that knew this. Fathali’s translation of this sentence is literal and there is no shift in translation of this sentence into Persian. Jalali’s translation: باورم نمی شد انسان های بزرگی همچون افالطون، شکسپير، نيوتون، هوگو، بتهوون، امرسون، اديسون و انيشتين از اين راز آگاه بوده اند.
Literal meaning: I couldn't believe that greatest people like Plato, Shakespeare, Newton, Hugo, Beethoven, Lincoln, Emerson, Edison, and Einstein knew this secret. Sabt-ol-sheikh’s translation:
وقتی که متوجه شدم در طول تاريخ افراد بزرگ و برجسته به مانند افالطون، شکسپير، نيوتون، هوگو، بتهوون، امرسون، اديسون و انيشتين که از نام آشنايان تاريخ بوده اند راز را می دانستند برايم غير قابل باور بود.
Literal meaning: When I found great people like Plato, Shakespeare, Newton, Hugo ,Beethoven, Lincoln, Emerson, Edison, and Einstein who were famous in the history, knew the secret through the history, it was unbelievable for me. Jalili and Sabt-ol-sheikh have mixed this sentence with the following sentence in the ST. In jalili’s translation, there is no shift for the word “believe”, while Sabt-ol-sheikh has used transposition like Motakef’s. ST: We did not have a single teacher secured to film. Motakef’s translation:
ما حتی يک تعليم دهنده که تضمينی برای فيلم باشد در دسترس نداشتيم.Literal translation: we didn’t have even a guaranteed tutor who was available for the film. In this sentence, the word “secured” has been translated as a clause. In regard to Vinay and Darbelnet (1995) this is kind of transposition. Since “translation equivalent in the TL is at different rank to the SL” (Munday, 2001, p.61), this is unit shift or rank shift in Catford’s (1965) categorization. Gharachedaghi’s translation:
به معلم خاصی نظر نداشتيم.Literal translation: We didn’t think a special teacher. Here, the translator has used the term “special” as an adjective for the word “teacher”. This is extra information which is given by the translator, not by the original author. It means that the translator has used a “part” of a “whole” which is specific in his translation. Therefore, this is kind of modulation. Fathali’s translation:
ما يک استاد ثابت که فقط برای اين فيلم کار کند نداشتيم.Literal meaning: We didn’t have a fixed teacher who only works for this film. In this translation, the translator adds a clause- who only works for this film- instead of the word “secured” which is transposition. On the other hand, he considers a special kind of teacher- fixed- which is one kind of modulation. In this sentence, we saw that the translator has used two kinds of shifts at the same time. Jalali’s translation:
ما برای فيلم خود، استاد راهنمای ويژه در کنارمان نداشتيم.

ISSN 2039-9340 Mediterranean Journal of Social Sciences Vol. 3 (11) November 2012
665
Literal translation: We didn’t have a special advisor beside us for our film. The translator has used “a special advisor” instead of “a single teacher” which is kind of modulation. Sabt-ol-sheikh’s translation:
در آن موقع ما حتی يک مدير فيلم برداری هم برای تهيه ی فيلم نداشتيم.
Literal meaning: At that time, we didn’t have even a manager filming for providing the film. Here, the translator changes the cultural reference. Instead of “a single teacher” he has used “a manager filming”. In fact, he found that the original author’s mean can be transferred better by using adaptation in this sentence. ST: When he did his stand-up comedy routines he started getting standing ovations, and nobody was heckling him! Motakef’s translation:
ديگر کسی موی دماغش نمی وقتی او در باشگاه نقش کمدين را بازی می کرد، مشتريان از جای خود بلند می شدند و برايش کف می زدند و ! شد
Literal meaning: He was playing a comedian in the club, the customers stand up from their sits and clap him and nobody was a hair in his noise! According to Vinay and Darbelnet (1995), equivalence is one kind of shift that describes the same situation by different stylistic or structural means. They believe that equivalence often used in translation of idioms and proverbs. In the above translation, Motakef uses this kind of shift for translation of “nobody was heckling him”. “To be a hair of someone’s noise” is a common idiom in Persian which is used when a person bothers someone frequently. Gharachedaghi has omitted this part in his translation. Fatali’s translation:
و کسی به او طعنه مواجه شد که وقتی روی صحنه رفت با تشويق تماشاگران او پيشنهاد شددر نهايت يک کار کمدی دائمی نمايش کمدی به .نزد
Literal translation: Finally, he was suggested an eternal comedian job. When he appeared on the scene, he was faced with the spectator’s encouragement and nobody mocked him. Active voice in the ST is changed to passive voice in the TT. As a result, there is a kind of modulation in this translation. In addition, طعنه زدن in Persian is an idiom which means “to speak ironically”. This type of shift is equivalence in translation. Jalali’s translation:
هنگام اجرای برنامه های خنده دار، ديگر مورد استهزاء قرار نمی گرفت. Literal translation: Performing comic plays, he wasn’t ridiculed. Taking a deep look at the ST, we can easily understand that the ST is an active sentence. However, Jalali’s translation is a passive one. Therefore, the translator has used modulation in this sentence. Considering Catford’s (1965) classification of shift, we can call it structural shift which is the most common type of shift in the process of translation and involves a shift in grammatical structure (Munday, 2001, p.61). Sabt-ol-sheikh’s translation:
در ضمن وقتی نمايش کمدی اش را در تئاتر بازی می کرد، همه با عالقه به او گوش می کردند و به حرف ها و کارهايش می خنديدند و لذت می بردند و هيچ کس هم او را مسخره نمی کرد.
Literal translation: Meanwhile, when he plays his comedy in the theater, all the people listen to him eagerly and laugh at his speech and actions. 5. Conclusion An appropriate translation of shifts is an important criterion in translation studies which is discussed by many translation scholars almost at beginning of translation studies. There are different classifications for this issue which are given by translation scholars. The current study was an attempt to investigate translators’ tendency in applying different types of shifts based on Vinay and Darbelnet’s (1995) model through a contrastive analysis. To achieve this aim, a literary book- The Secret by Rhonda Byrne (2006) – and its five corresponding Persian translations were selected. The findings indicated that five translators used different kinds of shifts for a single sentence in their translation. One type of shift may be applied by many translators for a sentence. It is also possible for each translator to select a kind of shift which is different from others. It means that one translator may use transposition for a sentence, while another translator may use modulation for the same sentence. It was also revealed that many translators use a combination of shifts. They may use different types of shifts in a sentence. It is also possible that one translator use shift in his/ her translation, while another

ISSN 2039-9340 Mediterranean Journal of Social Sciences Vol. 3 (11) November 2012
666
one prefers not to use any kind of shift. From the above mention debates we can understand that using shift in translation totally depends on the translator’s background knowledge of the topic. It is also depends on the ST and TT condition. As a result, the translator’s knowledge of the application of different types of shift in different situations can help him/ her to use an appropriate kind of shift in special situations.
References Baker, M. (1992). In Other Words: A course book on translation. London: Routledge. Baker, M. (1998). Routledge encyclopedia of translation studies. London: Routledge. BeaugrandeR.De &W. Dressler. ( 2002). Introduction to Text Linguistics. London: Longman. Byrne, R. (2006). The Secret. New York: Beyond words publishing. Catford, J. C. (1965). A Linguistic Theory of Translation. London: Oxford University Press. Cyrus, L. (n.d). Buildingaresourceforstudyingtranslationshifts. Retrieved 14 June 2012 from http://www.lrec-
conf.org/proceedings/lrec2006/pdf/622_pdf.pdf Farrokh, P. (2011). The Equivalence and Shift in the Persian Translation of English Complex Sentences with wh-Subordinate Clauses.
English Language and Literature Studies. 1 (2), 74-81. Halliday, M.A.K. and Hasan, R. (1976). Cohesion in English. London: Longman Hoey, M.(1991). Patterns of Lexis in Text. Oxford: Oxford University Press. Kenny, D. (1998). 'Equivalence'. Routledge Encyclopaedia of Translation Studies. Edited by Mona Baker, London and New York:
Routledge. pp. 77-80. Khoda bakhshi, N. (2010). The Application of Catford’s Shifts on the Persian Translation of Oliver Twist by Yusof Gharib. Retrieved 14
Jun 2012 from http://www.translationdirectory.com/articles/article2108.php Leuven-Zwart, K. van. (1989).Translation and original: Similarities and dissimilarities. Target, 1(2), 151–181. Munday, J. (2001). Introducing Translation Studies: Theories and Applications. USA and Canada: Routledge. Newmark. (1988). A Textbook of translation. New York: TiceHall Press Nida, E. & Taber, C. (1969). The Theory and Practice of Translation. Leiden: Brill Popovič, A .(1970). “The concept 'shift of expression' in translation analysis”, in J.S Holmes (ed.) The Nature of Translation. Mouton: The
Hague. Sánchez, M.T. (2009). The problems of literary translation: a study of the theory and practice of Translation from English into Spanish.
Switzerland: Peter Lang. Schäffner, C. (2002). The role of discourse analysis for translation and in translator training. UK: Multilingual matters. Taghavi, M. (2007). The Translator’s Habitus and Shifts: a study on modulations in the Persian translations of Faulkner’s The Sound And
The Fury, Go Down Moses and Absalom! Absalom! Ph.D thesis. University of Salford. Taylor, M.E .(2006). A text-linguistic investigation into the discourse structure of James. London ; New York : T & T Clark. Toury, G. (1980). In Search of a Theory of Translation. Tel-Aviv: The Porter Institute for Poetics and Semiotics. Toury.G, A. Pym, M. Shlesinger, D. Simeon.(2008).Beyond descriptive translation studies: investigations in homage to Gideon Toury.
Amsterdam and Philadelphia: John Benjamins. Van Dijk, T, and W.Kintsch. (1983) .Strategies of Discourse Comprehension. New York: Academic Press. Venuti, L. (2000). The Translation Studies Reader. London ; New York: Routledge. Vinay, J. P., and Darbelnet, J. (1995). Comparative Stylistics of French and English: A Methodology for Translation. North America,
Amsterdam and Philadelphia: John Benjamins. Vossoughi, H and Pourebrahim, F. (2010).Appling Catford’s Shifts to the Farsi Translation of Psychology Texts. JELS, 1 (3), 79-90. Zheng, Y. (2009). Text Coherence in Translation. English Language Teaching. 2(3), pp. 53- 57. Byrne, R. The Secret (in Persian): translator: Mohammad Sadegh Sabt-ol- sheikh. (2008). Tehran: Nikfarjam. Byrne, R. The Secret (in Persian): translator: Ata-ol-lah Fath Ali. (2009). Tehran: Mansha-e- Danesh Byrne, R. The Secret (in Persian): translator: Monireh Jalali. (2009).Tehran: Alborz. Byrne, R. The Secret (in Persian): translator: Nafiseh Motakef. (2010).Tehran: Lyosa. Byrne, R. The Secret (in Persian): translator: Mehdi Gharacheh Daghi. (2009).Tehran: Peykan. .

ISSN 2039-9340 Mediterranean Journal of Social Sciences Vol. 3 (11) November 2012
667
The Contractual Rights of International Civil Servants: Administrative Tribunals of
the United Nations and International Labour Organization Perspective
Md. Kamal Uddin
Assistant Professor Department of International Relations University of Chittagong, Bangladesh
Email: [email protected]
Md.Siraj Uddin
Senior Lecturer Department of Law
Southern University Bangladesh Email: [email protected]
Doi:10.5901/mjss.2012.v3n11p667
Abstract: International Organizations are acting within the parameters provided by the rules of procedure of the organization and terms of their contract of employment. The International Labour Organization Administrative Tribunal (ILOAT), was created as a judicial system for international civil servants. The United Nations Administrative Tribunal (UNAT) was established as an independent organ competent to hear and pass judgments upon application alleging non-observance of contracts or terms of employment by staff members of the UN Secretariat. The two most important administrative tribunals that grant remedies to aggrieved staff of an international organization that have accepted their jurisdiction. The ILOAT and UNAT has gradually consolidated the idea that international organizations are under a human rights obligation to provide access to staff dispute settlement mechanisms. Keywords: Uited Nations, Civil servants, ILOAT, UNAT
1. Introduction All international organizations are structured to guarantee internal accountability of all their agents towards the executive head for acts done in the exercise of their functions.1
This study aims at evaluating the nature and procedures of the International Labour Organization Administrative Tribunal (ILOAT) and United Nations Administrative Tribunal (UNAT) in promotion and protection of the contractual rights of international civil servants whom their employers in dealing with them would have violated the rules and regulations
There is an apparent deficiency, however, in the provision of mechanisms for ascertaining whether officials of an International Organization are acting within the parameters provided by the rules of procedure of the organization and terms of their contract of employment. The right to redress as a general principle of law and a norm of customary international law applies in all dealings between an international organization and their staff. This right includes both the procedural right of effective access to a fair hearing and the substantive right to a remedy; - both elements serve as yardsticks to assess whether an international organization has complied with their inherent duty to provide adequate, equivalent legal protection as it is found in the national courts system of states.(Wellens 2004) This work will compare between the International Labour Organization Administrative Tribunal (ILOAT) and the United Nations Administrative Tribunal (UNAT) to look at internal environment with adequate due processes to ensure that best practice standards for fair trial are guaranteed. 2. Aims and Purposes of the Study
1 UN Staff Regulation 1.3(a). See also, Bulletin on the Status, Basic Rights, and Duties of U.N. Staff Members, U.N.Doc. ST/SBG/1998/19.

ISSN 2039-9340 Mediterranean Journal of Social Sciences Vol. 3 (11) November 2012
668
governing their terms of employment without regards to due processes, remedy or recourse to the principles of natural justice after they might have exhausted all internal appeal procedures. This paper also demonstrated the fact that the ILOAT, though with a broader jurisdiction, is not the only administrative body addressing the grievances by employees of international organizations but the United Nations Administrative Tribunal (now reformed as United Nations Dispute Tribunal and Appeals Tribunal) has also played a similar role in addressing conflicts between staffs of the United Nations who upon application alleging non-observance of contracts or terms of employment/appointment by the UN Secretariat or applications alleging non-observance of the regulations and rules of the United Nations Joint Staff Pension Fund (UNJSPF), arising out of decisions by the Fund. Though the World Bank and IMF Administrative Tribunals also play similar role, they have not been not covered in this study. 3. Scope of this Study This study will address the issues of law relating to the contractual rights of international civil servants and means of redress in the event of conflict relating to the violations of terms of contracts of employment between international organizations, particularly the International Labour Office and United Nations. This work shows that there is a legally binding obligation between the International Organizations and their staffs as contained in their contract of employment and taking into considerations the principles of International Law relating to ILO core labour standards. The ILOAT also takes into consideration the complaints of family members of deceased staffs or by a person(s) who claims that he/she is entitled to some right on the death of a staff of an international organizations that have recognized its jurisdictions and competence in their contractual relationships with the deceased staff. The tribunal is not a court of first instance rather it is an appellate body which complaints can only be made after all the internal remedies, including appeals procedures, available to the official concerned under the Staff Rules and Regulations of the international organizations have been fully exhausted and final decisions given. 4. Research Methodology This study is generally a non-empirical analysis. The main sources of this study include library and desk research. It involves a review of literature relying on secondary sources materials - textbooks, journals, studies, reports and on-line documents related to the ILO and UN Administrative Tribunal. This study has examined and analyzed policy documents such as international conventions, and resolutions of the United Nations that dealt with the topic of this research. The study has also relied on decided cases from the ILOAT and UNAT on contractual rights of international civil servants in buttressing facts that were discussed in this paper. Perusing through, analyzing and internalizing existing academic literatures and scholarly writings both in hard copy and from the Internet on the subject of international civil servants constitute a good portion of the research. 5. Limitations One of the greatest limitations of this research work is that there is dearth of books dealing with the subject of International Labour Organization Administrative Tribunal and defunct United Nations Administrative Tribunal. Again this work did not embark on case analysis but references were made to decided cases by ILOAT and UNAT in buttressing facts. Finally, there are very few available Journal Articles, international documents, papers and internet resources dealing with the subject matter of this paper that are accessible in libraries and on the internet. 6. The Nature of ILO and UN Administrative Tribunals
The International Labour Organization Administrative Tribunal, or ILOAT, is the successor of the League of Nations Administrative Tribunal. It was created as a judicial system for international civil servants,(Flaherty and Hunt 2010) while the United Nations Administrative Tribunal (UNAT) was established by the General Assembly through Resolution 351A(IV) (1949) 2
2 As adopted by the Tribunal on 7 June 1950 and amended on 20 December 1951, 9 December 1954, 30 November 1955, 4 December 1958, 14 September 1962, 16 October 1970, 3 October 1972, 1 January 1998, 1 January 2001, and 27 July 2004 (See also United Nations Administrative Tribunal Available online at http://untreaty.un.org/unat/Statute.htm Last visited 17 February, 2011
as an independent organ competent to hear and pass judgments upon application alleging non-observance of contracts or terms of employment by staff members of the UN Secretariat or of their terms of appointment
ISSN 2039-9340 Mediterranean Journal of Social Sciences Vol. 3 (11) November 2012
669
as well as applications alleging non-observance of the regulations and rules of the United Nations Joint Staff Pension Fund (UNJSPF), arising out of decisions by the Fund. It is composed of seven members, no two of whom may be nationals of the same State. The members shall be appointed by the General Assembly for four years, and may be reappointed once.(Chersterman at al 2002).The League of Nations established the Administrative Tribunal in 1927 with jurisdiction over staff of the ILO and with time, staffs of UN Specialized Agencies and other international organizations that have accepted its jurisdiction. While the United Nations Administrative Tribunal (UNAT) members usually come from a diplomatic or University background, the ILOAT Tribunal is composed of seven lawyers mostly coming from the national judiciaries. Schermers., H.G. and Blokker (2003). It is competent to consider disputes between the organizations concerned and their staffs at the initiative of staff members. It will not accept a complaint filed by organization against a staff member. In addition to staff cases, the tribunal can be charged with the settlements of possible conflicts arising from contracts concluded by the ILO. Judgments of the Tribunal are binding, final and without appeal. The ILOAT is older than the UN itself, being a descendant of the League of Nations Administrative Tribunal. It is the court for labour disputes, including workplace harassment, promotions difficulties, unfair dismissal and discrimination, for many international organization employees. It is the labour law court for a workforce of over 40 international organizations. Its sister tribunal, the defunct United Nations Administrative Tribunal, or UNAT, has jurisdiction over associated programs, including the staff of the International Court of Justice Registry, the UN and its internal units. Together, the system adjudicates disputes for around 70,000 workers, over half of whom are on precarious, short-term contracts. The next sub-heading will compare the Statutes of the two tribunals to see whether there exist similarities and differences in the way there are drafted to function. 7. Statutes of ILO and UN Administrative Tribunal According to Frank Gutteridge, (2009) the ILO3
Under their means of redress, the ILOAT may order the rescinding of an unlawful decision or the performance of an undercharged obligation. If such rescinding or performance is not possible or advisable, the Tribunal awards compensation and has sole discretion in the matter while UNAT may order the rescinding of a decision or the performance of an obligation, but at the same time it fixes the amount of compensation to be paid should the Secretary General decide
itself have outlined four significant differences between the two tribunals in terms of membership, means of redress, compensation and the final nature of its judgment. Though firstly, the ILOAT uses the designation “Judges” for the Judges and “Registrar” of “Greffier” for the officers of the Court, as opposed to members and “Executive Secretary” for UNAT, a usage suggesting that for UNAT the intention was to distance the conceptions underlying the text of the statutes as far as possible from those of a true court of law and in particular from the droit administratif (Gutteridge 2009). In terms of membership, the Judges of ILOAT (named as “judges” and not “members” as in the case of UNAT) are appointed by the International Labour Conference on the recommendation of the governing body to which the Director General submits their names and qualifications. The members of UNAT are appointed by the General Assembly on the nomination of the government of their own countries. Not only are the appointing bodies different in composition, since there are no representation of employers and workers at the International Labour Conference (ILC), but there are also differences in practice. The members of ILOAT are eminent lawyers, and most of them hold or have held judicial offices in their own countries but in the contrary, not all member of UNAT need to be judges or experienced lawyers and this is the line which the General Assembly has consistently taken (Gutteridge 2009).
4
3 See ILO Document GB.234/PFA/11/17,3 4Despite the safe guard by the ICJ review procedure, the UNAT has come, over the years, under similar attacks, within the suggestion that the General Assembly has a General Discretionary power of review over Judgments. (See for example JIU Follow up Report on Staff Cost in the United Nations Secretariat, UN Document A/40/653 (18 September, 1985), 15.) This has not been the case for the ILOAT despite the difficulties arising out of the Duberg, Leff ILOAT Judgment No.2 (1955) Wilcox and Bernstein cases which was followed by review by the ICJ, which concluded that the Tribunal was competent to give the judgment, and the Lindsey case, after which the possibility of such a review was mooted but finally not requested.
, in the interest of the United Nations that the applicant should be compensated without further action…. The ILOAT has remain discreet in the ordering of reinstatement and in recent times have left it to the organization to deiced in the last resort whether the reinstatement might prove undesirable or impossible, a procedure which appears to be similar with that followed by UNAT (Gutteridge 2009).

ISSN 2039-9340 Mediterranean Journal of Social Sciences Vol. 3 (11) November 2012
670
In terms of compensation, ILOAT determine the amounts at its discretion by reference to the wrong sustained by the complainant. Save in exceptional cases requiring special justification, the UNAT may not, under its statutes, award compensation exceeding the equivalent of two year’s net salary of the applicant. This issue will be further elaborated in the next sub-heading. In terms of the nature of the judgments of ILOAT and UNAT, the ILOAT’s judgments are final and without appeal, except that the governing body may seek advisory opinion from the ICJ if it considers that the tribunal has exceeded its jurisdiction or taken a decision which is vitiated by a fundamental procedural fault. According to the statutes of UNAT; a member state, the Secretary General or the applicant may within 30 days ask a committee of the most recent regular session of the General Assembly to request an advisory opinion of the International Court of Justice where a judgment is challenged on the ground that the tribunal has exceeded its jurisdiction or competence or failed to exercise its jurisdiction, or erred on a question of law relating to the provisions of the Charter of the UN, or committed a fundamental error in the procedure which has occasioned a failure of justice. If no such application is made within a period of thirty days, or if such application is dismissed, the judgment becomes final. If the matter goes to court, the payment of any compensation awarded under the challenged judgment is suspended, except that in some cases part provisional payment may be made. Another compares, that may be made between the ILOAT and UNAT is in respect of Article 14 of the latter’s Statutes which provides that the tribunals competence may be extended to any Specialized Agency brought into relationship with the United Nations in accordance with the provisions of Article 57 and 63 of the Charter upon the terms established by a special agreement to be made with each such agency by the Secretary-General of the United Nations (Elias 2009). Each such special agreement shall provide that the Agency concerned must be bound by the judgment of the tribunal and not be responsible for the payment of any compensation awarded by the tribunal in respect of a staff member of that agency and must include inter-alia, provision’s concerning the agency’s participation in the administrative arrangements for the functioning of the Tribunal and on the bearing of the expenses of the Tribunal. This is in marked contrast to the administrative arrangements’ involved in the judgments of the Administrative Tribunal of the ILO upon complaints made against UNESCO cases. Another point of departure, and a significant one is that, the ILO Administrative Tribunal Statutes provides, in its own Article 10 that, for an appeal to be made to the Court in cases of a challenge to the tribunal’s judgment by the ILO or the UNESCO or other Agencies having the power to use the ILO Statutes. In other words, the ILO Statutes and therefore the UNESCO has not been given the power to conclude matters for itself; it provides that the court is to decide the matter finally. It seems reasonable to suppose that the UN Administrative Tribunal’s Statutes provides for it to operate as a self contained body so far as its judicial function is concerned, leaving only a power of review to the court within the limits set out in Article 11 of the UNAT Statutes.. (Elias 2009). 8. Functions of ILOAT and UNAT in Awarding Remedies and Compensations Both the International Labour Organization Administrative Tribunal (ILOAT) and United Nations Administrative Tribunal (UNAT) are the two most important administrative tribunals that grant remedies to aggrieved staff of an international organization that have accepted their jurisdiction. Although it has to be said, that extracting any general principles applicable to all tribunals and which would underlie the granting of particular remedies is difficult (Amerasinghe, 1994). As a result of the different statutes, there is no uniformity of approach to the issue of remedies and each tribunal takes its decisions in the light of a certain expediency and discretion (Wellens 2002) Though in the capacity of Chief Administrative Officer of the Organization5, the Secretary General is the respondent to the applications to the UNAT (Tribunal), although the tribunal decisions normally, are final, the Statutes of the Administrative Tribunal of the UN in this respect differs from that of the Statutes of the Administrative Tribunal of the International Labour Organization to which the Specialized Agencies subscribe.6
5 See., United Nations Charter June, 1945, Article 97 6Ibid., It should be noted that certain international organisation based in Europe has accepted the jurisdiction of the ILOAT.
Although the UNAT’s powers to freely grant remedies are more limited by its statutes because the choice between recession and compensation belongs to the respondent organization, both UNAT and ILOAT have sometimes awarded remedies in a manner not explicitly provided for in their statutes. Often when the decision was not found to be invalid, compensation has been awarded by UNAT without ordering rescission or specific performance which was not appropriate, but the ILOAT has granted compensation in such cases. Both tribunals have considered these powers to be inherent, and have liberally construed the provisions on remedies while recognizing the express limitations placed on them by their respective statutes and not exceeding their powers beyond what is clearly and unequivocally circumscribed in the statutes.

ISSN 2039-9340 Mediterranean Journal of Social Sciences Vol. 3 (11) November 2012
671
Specific performance has also been ordered by both ILOAT and UNAT when the decision was regarded as being invalid but has not been specifically annulled because the tribunal considered the order of specific performance, without substitute compensation, to provide the applicant with an adequate remedy. Regarding the terms of compensation, it may be awarded as an alternative to annulment, rescission or specific performance. In some cases, the UNAT has accessed the compensation, but in numerous cases, it did not, in case the respondent chose not to carry out the order. In many cases, the ILOAT, after quashing the administrative decision decided to award compensation and an alternative to rescission or reinstatement, although this has not always been a very reasoned decision. In cases where the respondent’s wrongful act is considered to have caused additional damage to the claimant, compensation may operate as an additional remedy or the sole remedy where for variety of reasons, other remedies are inappropriate or impossible. Compensation may also be awarded either without an annulment or, conversely without the tribunal characterizing the decision as valid. In the case of non-renewal of fixed term of contract, the UNAT has never ordered a renewal of the contract, but has awarded compensation instead7
Finally, it certainly cannot be said that in the decisions by the UNAT and ILOAT to award damages the most significant factors are the character of the applicant, the unanimity of the court and the procedural or substantive nature of the rights violated. On the other hand, the UNAT and ILOAT’s case law apparently does not show the routine and non-controversial substantive violation or a pattern of non- compliance with procedural norms are more likely to give rise to damages. Although, the option of deciding between rescission and compensation lies within its powers and there is no ceiling for compensation provided in its statutes, the ILOAT generally follows a policy of restraint in awarding compensation. The UNAT, for its part, has an exceptional case and not without giving reasons exceeded the ceiling of two year salary. Finally, it is important to note that the UN Administrative Tribunal and the ILO Administrative Tribunal publish their judgments unlike other similar tribunals.
. Undue hardship suffered by the applicant may be compensated in unusual circumstance even when the conduct of the respondent was legally correct.
8
The ILOAT is older than the UN itself, being a descendant of the League of Nations Administrative Tribunal. It is the court for labour disputes, including workplace harassment, promotions difficulties, unfair dismissal and discrimination, for many international organization employees. It is the labour law court for a workforce of 58 international organizations. Its sister tribunal, the United Nations Administrative Tribunal, or UNAT,
At this point let’s compare the jurisdiction and powers of ILO and UN Administrative Tribunal 9. Jurisdiction/Powers of ILO and UN Administrative Tribunal
9 has jurisdiction over associated programs, including the staff of the International Court of Justice Registry, the UN and its internal units. Together, the system adjudicates disputes for around 70,000 workers, over half of whom are on precarious, short-term contracts.10
UNAT shall be competent to hear and pass judgement upon applications alleging non-observance of contracts of employment of staff members of the Secretariat of the United Nations
11
7Ibid., In Effects of Awards of compensation Made by the United Nations Administrative Tribunal (Advisory Opinions) 1954 ICJ Reports 50, The tribunal held that the non- renewal of the employees’ contracts was unwarranted because it was unrelated to their professional qualities. Not having the power to reinstate the employees to their formal positions, the tribunal awarded reparation. Pressure from the United States on the General assembly for those amounts not to be paid failed following the rendering of advisory opinion by the ICJ, which affirmed that finding that the General Assembly should pay out the sums allocated by the UNAT in its judicial decision, was final. On this point, the UNAT thus made a decisive contribution to the rule of law within the United Nations. (See also Robert Kolb, An Introduction to the Law of United Nations, (Oxford, Portland, and Oregon: Hart Publication, 2010) p.153)
or of the terms of appointment of such staff members. The words “contracts” and “terms of appointment” include all pertinent regulations and rules in force at the time
8 Available online at www.ilo.org/trib and http://untreaty.un.org/UNAT/ Last visited 16 February, 2011 See also Edward Patrick Flaherty,“Legal Protection in International Organizations for Staff: A Practitioner’s View”, Available online http// www.campaignsitebuilder.com/user /.../download/March%20paper.doc. http://www.jm-rico.at/iloat.pdf. Last visited 17 February, 2011 9Statutes of the Administrative Tribunal of the United Nations As adopted by the General Assembly by resolution 351 A (IV) on 24 November 1949 and amended by resolution 782 B (VIII) on 9 December 1953, by resolution 957 (X) on 8 November 1955, by resolution 50/54 on 11 December 1995, by resolution 52/166 on 15 December 1997, by resolution 55/159 on 12 December, 2000 by resolution 58/87 on 9. The most recent amendment has been adopted by GA/RES 59/283 of 2 June 2005. Operative Paragraph 40 reads “Decides to amend Article 3(1) of the Statutes of the Tribunal with effect from 1 January, 2006. 10Edward Patrick Flaherty& Sarah Hunt, op. cit. 11 The employment of personnel is provided for with respect to the United Nations system as a whole. Moreover, the different organizations share the principal administrative tribunals that are based in Geneva, namely the United Nations Administrative Tribunal (UNAT) and the International Labour Organization Administrative Tribunal (ILOAT). These tribunals are competent to hear any claim brought by a member of staff relating to their contract.(See., Robert Kolb op. cit., p.160)

ISSN 2039-9340 Mediterranean Journal of Social Sciences Vol. 3 (11) November 2012
672
of alleged non observance, including the staff pension regulations. The Tribunal shall be open: (a) To any staff member of the Secretariat of the United Nations even after his or her employment has ceased, and to any person who has succeeded to the staff member's rights on his or her death; (b) To any other person who can show that he or she is entitled to rights under any contract or terms of appointment, including the provisions of staff regulations and rules upon which the staff member could have relied.12 In the event of a dispute as to whether the Tribunal has competence, the matter shall be settled by the decision of the Tribunal.13 While Article II of the Statute of the ILO Administrative Tribunal recognize the jurisdiction of the Tribunal to consider complaints alleging the non-observance, in substance or in form, of the terms of appointment of officials, or of the provisions of the Staff Regulations of those organizations. 14
10. UN Official Justice Systems: The UN Dispute and Appellate Tribunals Since the 1990s, the internal justice system of the United Nations as well as other international organizations, providing for the settlement of disputes between the employer organizations and their staff has been intensively criticized, by staff associations legal practitioners and academics, over the years different panels of experts have addressed the issue, identified major weaknesses and made recommendations for improving the current system, regarding both the informal and the formal system of staff dispute settlement. Already in the late 1990s reform proposal for the ILOAT were high on the agenda, however they did not result in any concrete changes [up till now].15 Ten years later, the debate reached the United Nations and the result and the reform suggestion put forward by the Redesign Panel16 in 2006 have led to a follow up process that created a completely new system of internal dispute settlement within the United Nations and the Specialized Agencies that have accepted the statutes of the United Nations Administrative Tribunal.17
The actual stages for the new system of justice administration within the United Nations was set when the United Nations General Assembly adopted resolution (42/226) on 8 April 1993
18, which stressed the importance of a just, transparent, simple, impartial and efficient system on internal justice at the Secretariat and requested the Secretary-General to undertake a comprehensive review of the UN system for the administration of justice. A task force not only proposed a complete reform of the administrative review system, but also called for measures to encourage settlement through informal channels, such as through the office of the ombudsman.19
12The UNAT had extended its jurisdiction to a dispute involving a non-staff member. In Zafari and in Salaymeh, the UNAT extended its jurisdiction to claims brought by local United Nations Relief and Works Agency (UNRWA) staff. Under normal circumstances, it was not the UN Administrative Tribunal itself, but rather a Special Panel of Adjudicators that was competent to hear such complaints. The jurisdiction of this special panel was, however, very limited; it was basically restricted to scrutinizing the legality of a termination of employment. In Zafari the applicant disputed that the end of his employment was to be qualified as an early voluntary retirement; whereas in Salaymeh the applicant complained that the calculation of his contribution to UNRWA’s pension fund was incorrect. In both cases UNAT thought that the Special Panel of Adjudicators would lack jurisdiction. In the Tribunal’s view applicant Zafari was “thus deprived of any recourse against the decision of the Commissioner-General of UNRWA” and “has truly been denied justice.” (See the case of Zafari v. UNRWA, UN Administrative Tribunal, 10 November 1990, Judgment No. 461. See also the case of Salaymeh v. UNRWA, UN Administrative Tribunal, 17 November 1990, Judgment No. 469) 13Article 2 (1) (2) and (4) Statutes of the Administrative Tribunal of the United Nations, As adopted by the General Assembly by resolution 351 A (IV) on 24 November 1949 and amended by resolution 782 B (VIII) on 9 December 1953, by resolution 957 (X) on 8 November 1955, by resolution 50/54 on 11 December 1995, by resolution 52/166 on 15 December 1997, by resolution 55/159 on 12 December 2000, by resolution 58/87 on 9…Accordingly, in other to be within the tribunals’ jurisdiction, a claim must derive from a concluded employment contract. Mere unsuccessful applicants cannot avail themselves of the tribunal should they have grievances and wish to “alleged the occurrence of prejudice or some other impropriety in the selection process”. Moreover, it is the policy of the organisation “not to enter into any litigation or arbitration with such individuals but to rely in a reasoned manner to such individual with a copy provided to the Permanent Mission if it becomes involved in the matter”. (See the Report of the Secretary General on the Procedures in place for the implementation of Article VIII, section 29, on the Privileges and Immunities of the United Nations. A/C.5/49/64 of 24 April, 1995 para. 24) (See also, Peter Neumann, “Immunities of International Organisations and Alternative Remedies Against the United Nations” Seminar on State Immunity, Vienna University, Department of International Law, Summer Semester 2006 (1064200) 14 Article II, of the Statute of the ILO Tribunal Adopted by the International Labour Conference on 9 October 1946 and amended by the Conference on 29 June 1949, 17 June 1986, 19 June 1992, 16 June, 1998 and 11 June, 2008 15August Reinisch and Christina Knahr, “From the United Nations Administrative Tribunal to the United Nations Appeal Tribunal-Reform of the Administration of the Justice System within the United Nations”, Max Planck Year Book of United Nations Law, The Netherlands, Volume 12, 2008, pp.447-483 at p.448 16 Redesign Panel of the United Nations System of Administration of Justice, 2005, A/RES/59/283 of 13 April, 2005 17 Ibid 18UN General Assembly Resolution A/C.5/49/1 of 5 August 1994 para.94 19Karel Wellens: op. cit. p.81
Again in 1995, a report for the reform of the

ISSN 2039-9340 Mediterranean Journal of Social Sciences Vol. 3 (11) November 2012
673
internal justice system in the UN Secretariat was submitted by the then Secretary General in September but the proposal was never put into effect.20 With regards to the pre-litigation procedure, a series of measures proposed by the Secretary General were designed to promote the early resolution of dispute before they reach the formal appeal stage. Ombudsman panels would have been appointed to deal with disagreements, grievances and discrimination issues raised informally by staff members. The review of administrative decisions would be conducted within the office of the under Secretary-General for Administration and Management but as a result of the decision of the General Assembly to establish a new system of administration of justice, including a two-tier formal system comprising a first instance, the UN Dispute Tribunal, and an appellate instance, the UN Appeals Tribunal, the age long UN Administrative Tribunal was abolished as of 31 December 2009.21
The United Nations Dispute Tribunal was established by the UN General Assembly and became operational on 1 July 2009.
22 It is the first instance court in the new system of administration of justice bringing to an end the sixty years old United Nations Administrative Tribunal (UNAT) including the joint appeals boards, the joint disciplinary committees and the disciplinary committees of the separately administered funds and programmes. 23
This decision was reached in reaffirming the decision in paragraph 4 of UN General Assembly, resolution 61/261 of 4 April, 2007 to establish a new, independent, transparent, professionalized, adequately resourced and decentralized system of administration of justice consistent with the relevant rules of international law and the principles of the rule of law and due process to ensure respect for the rights and obligations of staff members and the accountability of managers and staff members alike. The Dispute Tribunal
24
20Ibid., p.199-200, See UN General Assembly Resolution A/C.5/50/2, of September, 1995, p.2 para.4
hears and decides cases filed by or on behalf of current and former staff
21See UN Resolutions 61/261 of 4 April 2007, 62/228 of 22 December 2007 and 63/253 of 24 December 2008) Available online at http://www.un.org/en/internaljustice. Last visited 20 February, 2011 22Resolution adopted by the General Assembly on the report of the Fifth Committee (A/63/642)] 63/253. Administration of Justice at the United Nations of 17 March, 2009. The General Assembly, Recalling its resolutions 57/307 of 15 April 2003, 59/266 of 23 December 2004, 59/283 of 13 April 2005, 61/261 of 4 April 2007 and 62/228 of 22 December 2007, and its decisions 62/519 of 6 December 2007 and 63/531 of 11 December 2008. See also UNAT statute (A/RES/63/253 of 24 December 2008) Available online at http://daccess-dds-ny.un.org/doc/UNDOC/GEN/N08/485/97/PDF/N0848597.pdf?OpenElement Last visited 18 February, 2011 23Ibid., As part of its transitional measures the para. 57 of resolution 62/228of 22 December, 2007 provides that, “ the United Nations Administrative Tribunal shall cease to accept new cases as of 1 July 2009; and also abolish the United Nations Administrative Tribunal as of 31 December 2009. 24Annex I of the UN. Resolution adopted by the General Assembly (on the report of the Fifth Committee (A/63/642)) 63/253 on Administration of Justice at the United Nations A/RES/63/253, 17 March, 2009, Statutes of the United Nations Dispute Tribunal, Article 2 (1) provide that “The Dispute Tribunal shall be competent to hear and pass judgment on an application filed by an individual, as provided for in Article 3, paragraph 1, of the statute, against the Secretary-General as the Chief Administrative Officer of the United Nations: (a) To appeal an administrative decision that is alleged to be in noncompliance with the terms of appointment or the contract of employment. The terms “contract” and “terms of appointment” include all pertinent regulations and rules and all relevant administrative issuances in force at the time of alleged non-compliance; (b) To appeal an administrative decision imposing a disciplinary measure; (c) To enforce the implementation of an agreement reached through mediation pursuant to Article 8, paragraph 2, of the statute. 2. The Dispute Tribunal shall be competent to hear and pass judgment on an application filed by an individual requesting the Dispute Tribunal to suspend, during the pendency of the management evaluation, the implementation of a contested administrative decision that is the subject of an ongoing management evaluation where the decision appears prima facie to be unlawful, in cases of particular urgency, and where its implementation would cause irreparable damage. The decision of the Dispute Tribunal on such an application shall not be subject to appeal. 3. The Dispute Tribunal shall be competent to permit or deny leave to an application to file a friend-of-the-court brief by a staff association. 4. The Dispute Tribunal shall be competent to permit an individual who is entitled to appeal the same administrative decision under paragraph 1 (a) of the present article to intervene in a matter brought by another staff member under the same paragraph. 5. The Dispute Tribunal shall be competent to hear and pass judgment on an application filed against a specialized agency brought into relationship with the United Nations in accordance with the provisions of Articles 57 and 63 of the Charter of the United Nations or other international organization or entity established by a treaty and participating in the common system of conditions of service, where a special agreement has been concluded between the agency, organization or entity concerned and the Secretary-General of the United Nations to accept the terms of the jurisdiction of the Dispute Tribunal, consonant with the present statute. Such special agreement shall provide that the agency, organization or entity concerned shall be bound by the judgments of the Dispute Tribunal and be responsible for the payment of any compensation awarded by the Dispute Tribunal in respect of its own staff members and shall include, inter alia, provisions concerning its participation in the administrative arrangements for the functioning of the Dispute Tribunal and concerning its sharing of the expenses of the Dispute Tribunal. Such special agreement shall also contain other provisions required for the Dispute Tribunal to carry out its functions vis-à-vis the agency, organization or entity. 6. In the event of a dispute as to whether the Dispute Tribunal has competence under the present statute, the Dispute Tribunal shall decide on the matter. 7. As a transitional measure, the Dispute Tribunal shall be competent to hear and pass judgment on: (a) A case transferred to it from a joint appeals board or a joint disciplinary committee established by the United Nations, or from another similar body established by a separately administered fund or programme; (b) A case transferred to it from the United Nations Administrative Tribunal; as decided by the General Assembly”.

ISSN 2039-9340 Mediterranean Journal of Social Sciences Vol. 3 (11) November 2012
674
members appealing administrative decisions alleged to be in non-compliance with their terms of appointment or contract of employment. The Tribunal conducts hearings, issues orders, and renders binding judgments. Both staff members and the Administration have a right to appeal the judgments of the Dispute Tribunal to the United Nations Appeals Tribunal. As a transitional measure from the former system, the Dispute Tribunal also hears and passes judgment on cases transferred from the former Joint Appeals Boards, Joint Disciplinary Committees and United Nations Administrative Tribunal.25
10.1 Organization of the United Nations Dispute Tribunal
The United Nations Dispute Tribunal (UNDT) is located in Geneva, Nairobi and New York, but it may also decide to hold sessions at other duty stations. It operates on a full-time basis and is composed of five permanent, professional judges - three full-time and two half-time - with one full-time judge in Geneva, Nairobi and New York, respectively. As a provisional measure, the General Assembly further decided to appoint three ad litem or temporary judges in order to strengthen the UNDT capacity to adjudicate cases transferred from the former system of administration of justice. The three ad litem judges have all the powers conferred to the permanent judges and exercise their functions in Geneva, Nairobi and New York, respectively. The judges are all nationals from different Member States of the United Nations. They must be of “high moral character” and “possess at least 10 years of judicial experience in the field of administrative law”. They are appointed by the General Assembly from a list of candidates drawn up by the Internal Justice Council (which consists of representatives from staff and management, as well as distinguished jurists), for a non-renewable term of seven years. As a transitional measure, one full-time and one half-time judges initially appointed serve for a three-year term and may be reappointed to the UNDT for a further non-renewable term of seven years. The judges are not eligible for any appointment within the UN, except another judicial post, for a period of five years following their respective terms of office.26
10.2 Office of Administration of Justice: United Nations Appeals Tribunal United Nations Appeals Tribunal (UNAT) is an appellate court established by the General Assembly to review appeals against judgments rendered by the United Nations Dispute Tribunal (UNDT). It also hears and passes judgment on appeals from decisions taken by the Standing Committee acting on behalf of the United Nations Joint Staff Pension Board (UNJSPB) and by those agencies and entities that have accepted jurisdiction of the UNAT. UNAT is composed of seven judges, who normally review appeals in three-member panels. Their judgments are final and binding on the parties. 27
10.3 Jurisdiction United Nations Appeals Tribunal (UNAT)28
25Available online at http://www.un.org/en/oaj/dispute/ last visited 19 February, 2011 26Available online at http://www.un.org/en/oaj/dispute/organization.shtml last visited 16 February, 2011. In accordance with its statute, the UNDT has established its own rules of procedure link on 26 June 2009, which have also been approved by the General Assembly. The UNDT elects a President from among the full-time Judges. In June 2009, the Tribunal elected Judge Vinod Boolell (Mauritius) as President for a term of one year. On 2 July 2010, the Tribunal elected Judge Thomas Laker as President for a term of one year. The President directs the work of the UNDT in accordance with the Statute. Three Registries have been established in Geneva, Nairobi and New York respectively to support the work of the UNDT at the different locations.
is competent to hear and pass judgment on appeals from judgments of the UNDT, decisions taken by the Standing Committee acting on behalf of the United Nations Joint Staff Pension Board
27Available online at http://www.un.org/en/oaj/appeals/ Last visited 17 February, 2011. The UNAT is based in New York. It holds sessions in New York, Geneva or Nairobi, as required by caseload. It held its first session in Geneva in 2010. 28UN. Resolution adopted by the General Assembly (on the report of the Fifth Committee (A/63/642)) 63/253. Administration of Justice at the United Nations A/RES/63/253, 17 March, 2009 Annex II Statutes of the United Nations Appeal Tribunal, Article 2 (1). Provides that “the Appeals Tribunal shall be competent to hear and pass judgment on an appeal filed against a judgment rendered by the United Nations Dispute Tribunal in which it is asserted that the Dispute Tribunal has: (a) Exceeded its jurisdiction or competence; (b) Failed to exercise jurisdiction vested in it; (c) Erred on a question of law; (d) Committed an error in procedure, such as to affect the decision of the case; or (e) Erred on a question of fact, resulting in a manifestly unreasonable decision. 2. An appeal may be filed by either party (i.e., the applicant, a person making claims in the name of an incapacitated or deceased applicant, or the respondent) to a judgment of the Dispute Tribunal. 3. The Appeals Tribunal may affirm, reverse, modify or remand the judgment of the Dispute Tribunal. It may also issue all orders necessary or appropriate in aid of its jurisdiction and consonant with the present statute. 4. In cases of appeal under paragraph

ISSN 2039-9340 Mediterranean Journal of Social Sciences Vol. 3 (11) November 2012
675
(UNJSPB) and decisions taken by the heads of those agencies and entities that have accepted jurisdiction of the UNAT, which currently include the International Civil Aviation Organization (ICAO), the International Maritime Organization (IMO), the United Nations Relief and Works Agency for Palestine Refugees in the Near East (UNRWA) and the International Seabed Authority (ISA).29
United Nations Appeals Tribunal (UNAT) may review a UNDT judgment under appeal only on limited grounds. As an appellant you must allege that UNDT has: (i) exceeded its jurisdiction or competence; (ii) failed to exercise jurisdiction vested in it; (iii) erred on a question of law; (iv) committed an error of procedure, such as to affect the decision of the case; or (v) erred on a question of fact, resulting in a manifestly unreasonable decision. Appeals may be filed as follows: (i) A judgment rendered by the UNDT may be appealed by either party; (ii) A decision of the Standing Committee acting on behalf of the United Nations Joint Staff Pension Board (UNJSPB) may be appealed by a United Nations Joint Staff Pension Fund (UNJSPF) participant; (iii) An administrative decision made by the head of a specialized agency or entity that has accepted the jurisdiction of UNAT may be appealed by a current or former staff member of the agency or entity.
30
11. Conclusion The establishment of the ILOAT and UNAT has gradually consolidated the idea that international organizations are under a human rights obligation to provide access to staff dispute settlement mechanisms which has also found expression in the opinion of some international organizations that the establishment of administrative tribunals was the fulfillment of an international legal obligation. For instance, when the World Bank Administrative Tribunal was set up in 1980, the official explanatory report referred to a principle accepted in many national legal systems and reaffirmed in the Universal Declaration of Human Rights which required that, wherever administrative power was exercised, a machinery should be available to accord a fair hearing and due process to an aggrieved party in cases of disputes.31
In fact, the establishment of the ILOAT and the sister tribunal (UNAT) has shown that contractual rights of international civil servants are binding upon international organizations and this has been endorsed by many administrative tribunals in their jurisprudence. UNAT and the International Labour Organization Administrative Tribunal (ILOAT)
32 have both endorsed the ECJ’s view that general principles of law, which may contain fundamental rights obligations, can be relied upon in order to supplement the applicable staff rules and regulations of the organizations subject to their jurisdiction.33
1 (e) of the present article, the Appeals Tribunal shall be competent: (a) To affirm, reverse or modify findings of fact of the Dispute Tribunal on the basis of substantial evidence in the written record; or (b) To remand the case to the Dispute Tribunal for additional findings of fact, subject to paragraph 5 of the present Article, if it determines that further findings of fact are necessary”.
To the extent that one may consider the right of access to court (as contained, or at least
29 Available online at http://www.un.org/en/oaj/appeals/jurisdiction.shtml Last visited 17 February, 2011 30UNAT is composed of seven Judges, appointed by the General Assembly. The current Judges were appointed on 2 March 2009 for one non-renewable term of seven years beginning 1 July 2009. Drawing lots, the General Assembly appointed three Judges (Judges Painter, Courtial and Garewal) for an initial term of three years. These three Judges may be re-appointed for a non-renewable term of seven years. 31Memorandum to the Executive Directors from the President of the World Bank, 14 January 1980, Doc. R80- 8, 1., cited in C.F. Amerasinghe, The Law of the International Civil Service (as Applied by International Administrative Tribunals) Vol. I (2nd edn. , 1994), 41. The World Bank Administrative Tribunal was established by a resolution adopted by the Boards of Governors of the IBRD, IDA, and IFC on 30 April, 1980. 32Statute of the Administrative Tribunal of the International Labour Organization, adopted by the International Labour Conference, 9 October 1946, amended on 29 June 1949, 17 June 1986, 19 June 1992 and 16 June 1998, available at http://www.ilo.org/public/english/tribunal/stateng.htm. Last visited 22 February, 2011 Article II (5) ILO of the Administrative Tribunal Statute provides that “the Tribunal shall also be competent to hear complaints ... of officials ... of any other intergovernmental organization approved by the Governing Body which has addressed to the Director General a declaration recognizing, in accordance with its Constitution or internal administrative rules, the jurisdiction of the tribunal for this purpose, as well as its Rules of Procedure.” Among others, WHO, UNESCO, FAO, WMO, IAEA, and GATT have made such declarations. 33In 1957 the ILOAT held, in Waghorn v. ILO (1957) ILOAT Judgment No. 28, that it is also “bound … by general principles of law.” In Franks v. EPO, (1994) ILOAT Judgment No. 1333, it included alongside “general principles of law” also “basic human rights.” Similarly, the World Bank Administrative Tribunal held that sexual discrimination or harassment violated “general principles of law.” Mendaro v. IBRD, World Bank Administrative Tribunal Reports Judgment No. 26 (1981) at p.9. See more generally de Merode, World Bank Administrative Tribunal Reports Judgment No. 1 (1981) para. 28 “while the various international administrative tribunals do not consider themselves bound by each other’s decisions and have worked out a sometimes divergent jurisprudence adapted to each organization, it is equally true that on certain points the solutions reached are not significantly different. It even happens that the judgments of one tribunal may refer to the jurisprudence of another. Some of these judgments even go so far as to speak of general principles of international civil service law or of a body of rules applicable to the international civil service”). for the ECHR Golder v. United Kingdom,

ISSN 2039-9340 Mediterranean Journal of Social Sciences Vol. 3 (11) November 2012
676
implicit, 34 in the Universal Declaration of Human Rights, 35 the International Covenant on Civil and Political Rights (ICCPR),36 and the European Convention of Human Rights (ECHR)37 as also forming part of customary human rights law, it becomes apparent that international organizations may be under a duty to provide such access in cases of claims brought against them.38
Edward Patrick Flaherty& Sarah Hunt, “Rule without Law: Injustice at the United Nations?” Available online at
Bibliography Amerasinghe C. F., Documents on International Administrative Tribunals, (Oxford: Clarendon Press, 1989) Amerasinghe, C.F., The Law of the International Civil Service: As Applied by International Administrative Tribunals 2nd edn, (Oxford:
Clarendon Press, 1994) Amerasinghe., C.F: Principles of the Institutional Law of International Organizations, 2nd edn. (Cambridge: Cambridge University Press,
2005) August Reinisch and Christina Knahr, “From the United Nations Administrative Tribunal to the United Nations Appeal Tribunal-Reform of
the Administration of the Justice System within the United Nations”, Max Planck Year Book of United Nations Law, The Netherlands, Volume 12, 2008
August Reinisch, “The Immunity of International Organizations and the Jurisdiction of their Administrative Tribunals”, International Law and Justice Working Papers, Institute for International Law and Justice, New York University, School of Law IILJ Working Paper 2007/11 (Global Administrative Law Series) 9 November, 2007 Available online at : http://iilj.org/publications/documents/2007-11.GAL.Reinisch.web.pdf Last visited 20 December, 2010
Chris De Cooker (ed), International Administration: Law and Management Practices in International Organisations, (Leiden & Boston: Martinus Nijhoff Publishers, 2009)
http://www.iowatch.org /FlahertyHuntGPQ.pdf Last Visited 06 December, 2010
Edward Patrick Flaherty, “Legal Protection in International Organisations for Staff: A Practitioner’s View” Paper presented at the Conference “Accountability for Human Rights Violations by International Organisations, Brussels 16-17 March, 2007. Available on line at www.campaignsitebuilder.com/user/.../download/March%20paper.doc Last visited 04 December, 2010
Karel Wellens “Fragmentation of International Law and Establishing an Accountability Regime for International Organizations: the Role of the Judiciary in Closing the Gap” Michigan Journal of International Law Vol.25 Summer 2004
Karel Wellens: Remedies Against International Organisations, 2nd edn. (Cambridge: Cambridge University Press, 2002) Robert Kolb An Introduction to the Law of United Nations, (Oxford, Portland and Oregon: Hart Publication, 2010) Schermers., H.G. and Blokker. N.M: International Institutional Law: Unity within Diversity, 4th edn. (Boston and Leiden: Martinus Nijhoff,
2003) Simon Chersterman, Thomas M. Frank, David M. Malone., Law and Practice of the United Nations: Documents and Commentary, (New
York: Oxford University Press, 2002) Application No. 4451/70, 21 February 1975, Series A No. 18, (1975) ECHR 1, para. 36; Osman v. United Kingdom, European Court of Human Rights, Application No. 23452/94, 28 October 1998, (1998) ECHR 101, para. 136. With regard to the ICCPR, the Human Rights Committee has referred to “equality before the courts, including equal access to courts” in General Comment No. 13: Equality before the courts and the right to a fair and public hearing by an independent court established by law (Art. 14), 13 April 1984, para. 3. 34The ECHR judgment in Golder v. United Kingdom, supra 1, para. 36; Osman v. United Kingdom, European Court of Human Rights, Application No. 23452/94, 28 October 1998, (1998) ECHR 101, para. 136. With regard to the ICCPR, the Human Rights Committee has referred to “equality before the courts, including equal access to courts” in General Comment No. 13: Equality before the courts and the right to a fair and public hearing by an independent court established by law (Art. 14), 13 April 1984, para. 3. 35Article 10 of the Universal Declaration of Human Rights provides: “Everyone is entitled in full equality to a fair and public hearing by an independent and impartial tribunal, in the determination of his rights and obligations and of any criminal charge against him.” GA Res. 217(III), UN GAOR, 3d Sess., Supp. No. 13, UN Doc. A/810 (1948) 71. 36Article 14 para. 1 of the International Covenant on Civil and Political Rights provides, inter alia, that “all persons are equal before the courts and tribunals. In the determination of any criminal charge against him, or of his rights and obligations in a suit at law, everyone shall be entitled to a fair and public hearing by a competent, independent and impartial tribunal established by law.” International Covenant on Civil and Political Rights, 19 December 1966, 999 UNTS 171 (1976) 37Article 6(1) European Convention on Human Rights provides: “In the determination of his civil rights and obligations or of any criminal charge against him, everyone is entitled to a fair and public hearing within a reasonable time by an independent and impartial tribunal established by law.” European Convention for the Protection of Human Rights and Fundamental Freedoms (adopted 4 November 1950, entered into force 3 September 1953) 213 UNTS 221 38See generally, August Reinisch, op. cit.

ISSN 2039-9340 Mediterranean Journal of Social Sciences Vol. 3 (11) November 2012
677
UN Official Documents ILO Documents GB.234/PFA/11/17 UN General Assembly Resolution A/C.5/49/1 of 5 August 1994 UN General Assembly Resolution A/C.5/50/2, of September, 1995 U.N Resolution No.55/61, 4 December, 2000 United Nations System of Administration of Justice, 2005, A/RES/59/283 of 13 April, 2005 UN Resolutions 61/261 of 4 April 2007, 62/228 of 22 December 2007 and 63/253 of 24 December 2008 Resolution adopted by the General Assembly on the report of the Fifth Committee (A/63/642) 63/253 Administration of Justice at the
United Nations of 17 March, 2009 General Assembly, Resolutions 57/307 of 15 April 2003, 59/266 of 23 December 2004, 59/283 of 13 April 2005, 61/261 of 4 April 2007
and 62/228 of 22 December 2007, and its decisions 62/519 of 6 December 2007 and 63/531 of 11 December 2008 UN Resolutions 61/261 of 4 April 2007, 62/228 of 22 December, 2007 and 63/253 of 24 December, 2008 Administration of Justice at the United Nations A/RES/63/253, 17 March, 2009


ISSN 2039-9340 Mediterranean Journal of Social Sciences Vol. 3 (11) November 2012
679
Minister Hooper’s Melancholic Virtue
Najmeh Hafezi
MA in English Literature, Islamic Azad University-Arak Branch, Arak, Iran
Address: Postal Code: 3713156635, Qom, Iran (Corresponding Author)Tel: +989381454192 Email: [email protected]
Dr. Fazel Asadi Amjad
Associate professor, Dept. of English Language and Literature, Faculty of Arts and Humanities,
Kharazmi University, Tehran, Iran Tel: +989127646512 Email: [email protected]; [email protected]
Dr. Moussa Ahmadian
Associate professor, Dept. of English Language and Literature, Faculty of Arts and Humanities,
Arak University, Arak, Arak 38156-8-8349, PO Box: 879, Iran Tel: +98861313511 E-mail: [email protected]; [email protected]
Doi:10.5901/mjss.2012.v3n11p679
Abstract: Hawthorne’s ‘The Minister’s Black Veil’ is one of his short stories whose protagonist has sunk in a gloomy depression. Since most of the male characters in such stories follow a procedure for a type of self awareness (this may happen out of the plot, as in Mr. Hooper whose insight has occurred before the story begins), the result of their journey within themselves is darkness and depression. The present study sought the footprint of true virtue in drawing the character into such deep thoughts that resulted in his everlasting coverage of his face by a black veil. One of the best approaches which proved the truth of the minister’s virtue was the definition that Immanuel Kant presented through his Observations on the Feelings of the Beautiful and Sublime. Kant made use of the theory of the four temperaments which influence human mental and behavioral traits. In his attitude, a melancholy is, among the other personality, the most virtuous and capable for the feeling of the sublime. In accordance with the characteristics represented by Kant for each temperament, reverend Mr. Hooper is regarded as a melancholy. With his deep thoughts, most realistic insight, and black moods, the minister of the story exhibits a truly virtuous personality. Key Terms: True virtue, virtuous, temperaments, melancholy 1. Introduction
In consonance with assorted ethical schools, philosophies and theories, virtue includes numerous categories and definitions. This term which originates in Latin signifies moral excellence. Virtue is the very gist and principle of our lives, the content of our personality and the truest interpretation of our souls. For human beings of all ethnicities, cultures and beliefs, virtue is the essence of genuine success. Virtue is the core element of the human spirit. it grows stronger whenever one uses it. The idea of virtue returns to the ancient era when Aristotle in his Nicomachean Ethics defined virtue as a “balance point between a deficiency and an excess of a trait” (Robinson, 2010, p. 121); private and individual virtue carries the fundamental values that embody some categories; for instance, ethics most commonly regard binary oppositions such as virtue- vice, right- wrong, and good- evil; some doctrinal categories concern chiefly religious, social, ideological or political values. On the other hand, there are some other categories that indicate the aesthetic values as well as inborn genius.
Ancient Socratic model of human excellence is explained as celestial and sacred one, because such a person does not concern with the necessities involved in sustaining his body. Spenser, in Book VI of The Faerie Queene, portrays courtesy as a factually ethical virtue. It results not only from gentleness, that is, an innate inclination to seek what finely benefits others, but also from the conscious and deliberate choice of a deed that best meets the requirements of
ISSN 2039-9340 Mediterranean Journal of Social Sciences Vol. 3 (11) November 2012
680
particular circumstances. One of the primary concerns of courtesy is the aid that one man should give to others. The books on the gentleman rarely mention courtesy and provide some other virtues such as justice, charity, and general moral duty in poor and overlapping descriptions.
Spenser carefully differentiates among these virtues, contrasting the areas governed by justice and courtesy in parallel episodes in Books V and VI. Courtesy, then, is not "merely" a social grace; it is a virtue suffused with a grace and comeliness of manner. Both the courteous action and the manner in which it is performed draw men together in good will and form a foundation for human society. (Woodward Culp, 1971, p. 73)
Rousseau, another theorist who possesses lines in terms of virtue, in his primary depiction of virtue presents heroic images. He appears to offer that deeds challenging or even surpassing the might of God, and gallant sacrifices for honor are needed if characters are to be considered truly virtuous. “Heroic virtue is understood to produce beautiful deeds.” (Emberley, 1984, p. 732)
Western thought also has a classification for virtue; ‘temperance’ as moderation in thought, feeling and behavior represents virtue. The other measure for virtue would be ‘prudence’ or to be able to discipline and manage one’s life using logic. To confront and overcome fear, misery and danger suggest ‘courage’; moderation between selfishness and selflessness refers to ‘justice’ as the last class of virtue. Nietzsche, the philosopher and classical philologist of the 19th century says:
Genuine honesty, assuming that this is our virtue and we cannot get rid of ‘perfection’ ourselves in our virtue, the only one we have left: may its glory come to rest like gilded, blue evening glow of mockery over this aging culture and its dead and dismal seriousness. (Beyond Good and Evil, 2009, trans. Helen Zimmern, p. 227)
The importance of the issues related to virtue has risen so high that even computer experts who believe in Christianity have programmed a game entitled Saints of Virtue. Players of this game experience a virtual ‘Pilgrim’s Progress’ in which they learn how to ask others for help, to attempt with more courage and to think. The player has to overcome vices such as fear, pride and vanity. Also, the multitude of attitudes indicating virtue in public relations and political behaviors manifest it as a critical point so that “thinkers such as Hobbes, Lock, Montesquieu, and Hume conveyed a powerful critique of traditional virtues to their non-philosophic citizens” (Lutz, 1997, p. 556). Among numerous philosophers and thought leaders who have concerned moral attitudes and virtue, Immanuel Kant (1724- 1804) puts forward the definition that in a number of ways includes various points of view.
2. Background
In his 1764 treatise, Observations on the Feeling of the Beautiful and Sublime (OBS), Kant, the prominent and inspiring philosopher of the 18th century Germany, introduces finer feeling which differs critically from everyday feeling in that it is subjective and universal. In terms of such feeling, Kant admits that it is “of a more delicate sort, so described either because one can enjoy it longer without satiation and exhaustion; or because it presupposes a sensitivity of the soul, so to speak, which makes the soul fitted for virtuous impulses;” (OBS, trans. Goldthwait, 2003 , p. 46). Through this statement, Kant foreshadows the second section of his book in which he describes people who are capable to feel sublime, or in other words, those who are truly virtuous. In progression of his speech, Kant articulates that one who possesses courage, honesty, simplicity and esteem conveys and feels sublimity. People with such traits are gifted with true virtue. In Kantian terms, a virtuous heart is not merely one with benevolent and gentle passions; true virtue is to have the ability to judge fairly and to behave according to principles. For further clarification, Kant represents an example:
“…good- natured passion is nevertheless weak and always blind. For suppose that this feeling stirs you to help a needy person with your expenditure. But you are indebted to another, and doing this makes it impossible for you to fulfill the stern duty of justice. Thus the action obviously cannot spring from a virtuous design;” (OBS, 2003, p. 58)
The question already is how it is possible to distinguish a truly virtuous character form the rest. Kant answers this question by introducing four human temperaments and their capability to feel the beautiful and the sublime. Many philosophers and scientists, prior to Kant, have arisen some opinions about four humors and their influence upon human thoughts and behavior. The origin of this theory goes back to ancient Egypt; however, we are said that Hippocrates (400- 370 BC) the Greek physician, developed it into a medical theory. Also, the Persian scientist, Avicenna (980- 1037) in his The Canon of Medicine wrote that the four humors influence “emotional aspects, mental capacity, moral attitudes, self

ISSN 2039-9340 Mediterranean Journal of Social Sciences Vol. 3 (11) November 2012
681
awareness, movements and dreams” (Lutz, 2002, p. 60). Kant explains how an individual with a particular characteristic and temperament differs from others in terms of true virtue and performing principled actions. Among people, those with phlegmatic temperament possess no finer taste and they have absence of virtue. Sanguine people, on the other hand, with their tendency to decoration and superficiality are gifted with the feeling of the beautiful. Two remaining temperaments, choleric and melancholy, have both strong tastes for the sublime; nevertheless, people with choleric traits possess showy sublime, that is, the outward appearance and the attitude of others is so crucial for these people. On the other hand, a person with melancholy temperaments “has above all a feeling for the sublime” (OBS, 2003, p. 64). It was formerly mentioned that only virtuous people are capable to feel the sublime, and that true virtue means to think and behave according to principles; but, what type of principles? Where do they come from? Are they included within the domain of written laws or unwritten ones? In response to these questions, Kant believes that these principles do not include theoretical rules, “but the consciousness of a feeling that lives in every human breast and extends itself much further than over the particular grounds of compassion and complaisance” (OBS, 2003, p. 60). Kant summarizes all expressions and defines true virtue as “the feeling of the beauty and the dignity of human nature. The first is ground of universal affection, the second of universal esteem” (1764, p. 60). Kant sets up two types of virtue including adoptive and genuine. The former lives in a kind heart and possesses beautiful and charming traits, while the latter appears in noble heart and it is sublime and venerable and it is the second type which Kant calls true virtue. He continues “… genuine virtue based on principles has something about it which seems to harmonize most with the melancholy mind in the moderated understanding.” (OBS, 2003, p. 63)
Following these statements, Kant begins to count melancholy’s characteristics; A melancholy is away from joys of life; he afflicts himself in dark depression. His feelings are evoked so powerfully that they easily terminate. “He has above all a feeling for the sublime” (OBS, 2003, p. 64). Even the beauty which pleases others must move him. He is always more effectively fascinated to the sublime than charmed by beauty. He has the most resolute personality; a person with melancholy frame of mind possesses power to bring his sensation under principle and to control it. Such a person behaves honorably with his wife; that illnesses or the pass of time may ruin her beauty is not important for him; as a matter of fact, he looks at her as a human rather than a woman. In being of assistance to others, a melancholy personality does not require later gratitude; he believes whatever befalls one individual, may one day concern him as well. “The man of melancholy frame of mind cares little for what others judge, what they consider good or true; he relies in this matter simply on his own insight” (OBS, 2003, p. 66); such a person is steadfast in his deeds. He possesses thoughtful silence and true friendship which is the feature of sublime. He respects everybody as human being who is dignified. A person with melancholy frame of mind feels ultimate freedom for himself and judges strictly both himself and others; that is why many times you see him deprived of himself or of people around. His heart is the safe home for many a secret. Such traits that demonstrate a notable heart belongs to a person with melancholy temperament.
Through Kantian introduction about melancholy frame of mind, one of Nathaniel Hawthorne’s (1804- 1864) characters is going to be studied. Mr. Hooper, the minister of Milford village, enters the meeting house with his face covered by a black veil becoming a mystery for all country people! He introduces this piece of cloth as a symbol and wears the black veil for his entire life; even his last testament appeals to bury him with the black veil. The reason for wearing the black veil happens before the story begins; however, it is probable to find it through Mr. Hooper’s black moods and behavior.
3. The Analysis
The primary issue in ‘The Minister’s Black Veil’ suggesting the nobility of Mr. Hooper is his occupation as a pious and respectable minister. Hawthorne initiates his short story with a religious and spiritual context which represents the feeling of honorability and tendency to divinity; in other words, from the very beginning, the story conveys the existence of a supernatural and mighty element dominating the mood of the story and this earnest aroma goes along with the plot to the end. Throughout the story, the concerning character is entitled Mr. Hooper, parson or reverend each of which exemplifying this Hawthorne-made character as a thoughtful, religious and venerable figure; even his manner of walking manifests his dignity:
“all within hearing immediately turned about, and beheld the semblance of Mr. Hooper, pacing slowly his meditative way towards the meeting house” (Hawthorne, 1889, p. 18)
Hawthorne’s pictorial style is evident in his creation of environmental elements that represent spirituality and link to divinity; tolling the bell, the meeting house, and the pulpit, all suggest connectivity between human and the Almighty, an invisible tie between the finite and the Infinite whose everlasting might conveys the feeling of the sublime. The effect of
ISSN 2039-9340 Mediterranean Journal of Social Sciences Vol. 3 (11) November 2012
682
this power on reverend Hooper appears as a microscopic perspective to his neatness of clothes and the way he “was dressed with due clerical neatness, as if a careful wife had starched his band, and brushed the weekly dust from his Sunday’s grab” (Hawthorne, 1889, p. 18). It is proved from the attention of people that Mr. Hooper is respected by everybody, and at the same time, he knows how finely to be well-mannered to others. This characteristic arises from truly virtuous frame of mind that is aware of human’s general dignity:
He entered with an almost noiseless step, bent his head mildly to the pews on each side, and bowed as he passed his oldest parishioner, a white-haired great-grandsire, who occupied an armchair in the center of the isle. (Hawthorne, 1889, p. 18)
One major trait that Kant expresses for all sublime entities is that they all move, and this could be either subjective or objective. It might produce a shift in one’s moods, behaviors, or belief or it may cause someone to move physically. The reverend-character of Hawthorne’s story possesses such features and is consciously moved by an inner power; by something that makes him able to control himself, even while putting out his sermon, the black veil is moved “with his measured breath” (Hawthorne, 1889, p. 19)
The picture of black veil utilized by Hawthorne ironically refers to the sinfulness and shame of the character beseeching the Almighty for mercy and forgiveness; as Mr. Hooper’s psalm “had reference to secret sin, and those sad mysteries which we hide from our nearest and dearest, and would fain conceal from our own consciousness, even forgetting that the Omniscient can detect them.” (Hawthorne, 2004, p. 19); however, not only the minister of the story has not conceal his probable past sin, but also by wearing the black veil he is presenting a type of confession and is accepting the truth evidently and courageously. The narrator calls this piece of crape “mysterious emblem” (Hawthorne, 1889, p. 19), a piece of cloth that, although contains a mystery for the people who are observing their minister, it is meaningful for the deep insight of the melancholy mind of the minister himself. As it is commonly and truly believed, it happens for people with melancholy frame of mind to experience deep depressive and gloomy passions and usually no other person with different temperament has an insight deep enough to interpret and understand a melancholy mind. Perhaps that is why some people are habituated to call sorrowful individuals melancholic: “though reckoned a melancholy man, Mr. Hooper had a placid cheerfulness for such occasions,” (Hawthorne, 1889, p. 20), or because something appears strange to them it falls out of the domain of human intellect: “‘something must surely be amiss with Mr. Hooper’s intellects,’ observed her [a woman in the story] husband, the physician of the village.’” (Hawthorne, 1889, p. 20). People whose natures possess humors other than melancholy, feel despair and even sometimes afraid of the world of the persons with melancholy traits. In Hawthorne’s story as well, there are statements that explicitly express the melancholic features of Mr. Hooper. Once Hawthorne writes, “It [sermon] was tinged, rather more darkly than usual, with the gentle gloom of Mr. Hooper’s temperament.” (Hawthorne, 1889, p. 19) and one other time he says:
Each member of the congregation, the most innocent girl, and the man of hardened breast, felt as if the preacher had crept upon them, behind his awful veil… many spread their clasped hands on their bosoms. There was nothing terrible in what Mr. Hooper said, at least, no violence; and yet, with every tremor of his melancholy voice, the hearers quacked. (Hawthorne, 1889, p. 19)
People of Minister Hooper’s town, like all people around the world, possess different humors, and Hawthorne unveils them through their responses to the black veil after the sermons, when they leave the meeting-house. Some possess the features of choleric mind that tries to find the cause and depth of everything and then introduce itself as the conqueror: “a few [people] shook their sagacious heads, intimating that they could penetrate the mystery” (Hawthorne, 1889, p. 19). There are some others whose sanguine temperament illustrates itself as loud as their words and behavior: “… eager to communicate their pent-up amazement… some talked loudly, and profaned the Sabbath day with ostentatious laughter.”(Hawthorne, 1889, p. 19) There are also some people who lack any insight and according to Kant, they lack any finer taste; one or two people with phlegmatic personality “affirmed that there was no mystery at all, but only that Mr. Hooper’s eyes were so weakened by the midnight lamp, as to require a shade.”(Hawthorne, 1889, p. 19). By the weak understanding of such people an aroma of loneliness begins to appear. Hawthorne expresses the initial deserting behavior to Mr. Hooper:
Old Squire Saunders, doubtless by an accidental lapse of memory, neglected to invite Mr. Hooper to his table, where the good clergyman had been wont to bless the food, almost every Sunday since his settlement. (Hawthorne, 1889, p. 19)
From now on the solitude of the Minister is manifested brightly, people look at their good preacher as a stranger, children are afraid of him, and there are some rumors around about his veil that might be as the result of an unknown and

ISSN 2039-9340 Mediterranean Journal of Social Sciences Vol. 3 (11) November 2012
683
shameful sin. The always beloved Mr. Hooper is known a stranger with a terrible black veil on his face; a trembling one that shudders every soul during his sermons. Separation from the villagers is still tolerable since Mr. Hooper still has got a confidant intimate friend; that is, his fiancée Elizabeth. With no fear, anxiety, or negative perspective, once, Elizabeth decides to enquire the reason for wearing the black veil. As a matter of fact, she is the only person to whom seeking the truth looks crucial, and at the same time, the only person on whom Mr. Hooper can rely and talk of his heart. The initiation of the conversation goes on by Elizabeth’s sympathetic search for the reason and informing the Minister of what others think about him; however, as a melancholic person, Mr. Hooper pays a little smile on such rumors, for he possesses much higher and deeper reflections. Elizabeth’s requests for removing the black veil fails and Mr. Hooper, though endearing her does not accept to remove the veil. He is a man with melancholy frame of mind, one who, by nature, is capable of depression and solitude. He is aware of the difference he has with others, and therefore, he does not want to miss the last chance, the last creature on the ground, her beloved Elizabeth. When refused to remove the veil, Mr. Hooper witnesses Elizabeth trembles, like other people, to the sight of the black veil. So when she turns to leave the room:
He rushed from forward and caught her arm. “Have patience Elizabeth!” cried he, passionately. “Do not desert me, though this veil must be between us here on earth. Be mine, and hereafter there shall be no veil over my face, no darkness between our souls! It is but a mortal veil—it is not for eternity! O! You know not how lonely I am, and how frightened, to be alone behind my black veil. Do not leave me in this miserable obscurity forever!” (Hawthorne, 1889, p. 23)
She might be a woman with melancholy personality, Elizabeth would wait and think and perhaps feel Mr. Hooper’s passion. These sorrowful and heartbreaking statements illustrate the depth of the Minister’s loneliness on the earth. After Elizabeth there will be no hope for staying away from solitude. Mr. Hooper needs someone with the same depth of feeling and interpretation, and he thinks that Elizabeth is the most innocent one that can accompany him; on the other hand, Elizabeth is not a melancholic person, and as a result, she does not afford feeling such horrible countenance forever. Since then, Mr. Hooper’s only intimate friend is his black veil. He continues his life as a minister, puts out sermons, observes ceremonies for weddings and funerals, and always has the deepest effect on addressee’s heart. The black veil becomes a loyal friend that accompanies Mr. Hooper into his grave. 4. Conclusion
As stated formerly, the present paper aims at finding the footprint of true virtue in the behavior of Mr. Hooper, and the reason for his depression that has resulted in wearing the black veil. The model and the definition used for finding such incidents are those of Immanuel Kant who believes that people with melancholy frame of mind are truly virtuous. It was proved through the analysis that the character is a melancholic man.
Hawthorne introduces his story as a parable, a story that tends to teach and can be similar to every one’s life. The writer utilizes a melancholic minister as his protagonist to carry his plot. In the first glance, the reader comes across a respectable clergyman, neat in appearance, humble and polite in manner, and firm and at the same time passionate in feeling. One who has sunk in gloomy depression and suffers from a secret sin so shameful that has made him cover his face physically in front of the villagers. On the other hand, Mr. Hooper, when explaining the matter of the black veil for his beloved Elizabeth, calls it “a type and a symbol” and reminds the reader of the parable being read.
Indeed Hawthorne has created Mr. Hooper a truly virtuous character. In spite of being deeply passionate, he feels not sympathy and does not agree to remove the veil for anyone’s sake. He is brave, persistent, and inattentive to the gossips. Above all, he is embarrassed of a probable and secret sin. Now the question is whether he is really sinful or not. There are some expressions in the story that manifest the Minister as someone who really is ashamed of his sins; particularly the scene in which the dead young lady trembles at his face and he hastily gets the veil back on his face, as if the corpse has been able to see him.
By a profound investigation beneath the surface of the story, one may conclude that, as the title suggests, this tale is purposed to teach its readers. Mr. Hooper is the preacher of Hawthorne’s thoughts and beliefs. If the Minister was so deeply sank in his depressions and there was no person remained intimate for him, why, like other melancholic people, does not suicide or even does not once think about it? How he endures his job as a minister till he is aged? Mr. Hooper himself confesses in one sentence to Elizabeth that there is a vow in wearing the black veil. One party is the Minister, the other is not clear; it could be a promise between him and his God, or maybe he has secretly promised to one of his colleagues. In each case, there is a mission to be done, and Mr. Hooper uses the black veil to perform his job as best as possible. As a virtuous person, he is confidant and reliable and devotes himself to what he considers the best for him and

ISSN 2039-9340 Mediterranean Journal of Social Sciences Vol. 3 (11) November 2012
684
the people of his village. During the story, Hawthorne writes that the black veil has emphasized the influence of his sermons on the parishioners. Even this piece of crape becomes a type of advertisement for that small village and the meeting-house. Many strangers come to his church to attend their services. In this case, the black veil becomes a commercial and political means rather than a symbol for sinfulness and shame. Although it is reasonable for Mr. Hooper to ask Elizabeth to stay with him not to be alone, he might aim at making her a type of assistant in his preaches. However, above all, this character devotes his life to achieve his goal.
By this parable-tale, Hawthorne reminds many people of their duties, responsibilities and goals. He teaches his readers to be honest, kind, humble, friend, firm, respectful and honorable, and above all to behave according to principles rather than impulses and sympathy. That is what Kant exactly calls a truly virtuous person.
References Emberley, Peter. (1984). ‘Rousseau and the Domestication of Virtue’. Canadian Journal of Political science XVII: 4. Hawthorne, Nathaniel. (1889). Twice Told Tales. Philadelphia: David McKay. EBook. (2004). At:
http://www.gutenberg.org/files/13707/13707-h/13707-h.htm Kant, Immanuel. (2003). Observations on the Feeling of the Beautiful and Sublime. Trans. William T. Goldthwait. Print. California
University Press. Lutz, Mark J. (1997). ‘Civic Virtue and Socratic Virtue’. Polity. XXIX: 4. Online. At: www.jstor.org/stable/3235268/ Lutz, Peter L. (2002). The Rise of Experimental Biology: An Illustrated History. New Jersey: Humana Press. Print. Nietzsche, Fredrich. (2009). Beyond Good and Evil. Trans. Helen Zimmern. Online. At: www.books.google.com Robinson, T. S. (2010). Mirror of Opposition. USA: Xlibris Corporation. Online. At: www.books.google.com Woodward Culp, Dorothy. (1971). ‘Courtesy and Moral Virtue’. Studies in English Literature 1500- 1900. 11: 1. Online. At: www.jstore.org http://www.saintsofvirtue.com/

ISSN 2039-9340 Mediterranean Journal of Social Sciences Vol. 3 (11) November 2012
685
The Challenges of Democratic Governance in Nigeria’s Fourth Republic
Ogbonnaya, Ufiem Maurice
National Institute for Legislative Studies (NILS),
Plot 14/18 Danube Street, Off IBB Way Maitama, Abuja – Nigeria. [email protected]
Omoju, Oluwasola Emmanuel
National Institute for Legislative Studies (NILS),
Plot 14/18 Danube Street, Off IBB Way Maitama, Abuja – Nigeria. [email protected]
Udefuna, Nnadozie Patrick
National Institute for Legislative Studies (NILS),
Plot 14/18 Danube Street, Off IBB Way Maitama, Abuja – Nigeria. [email protected]
Doi:10.5901/mjss.2012.v3n11p685
Abstract This paper examined the nature and dimension of such challenges as electoral malpractice, inter- and intra-ethnic cleavages, religious crises and insecurity, weak democratic institutions and institutionalized corruption, which have confronted democratic governance in Nigeria since the Fourth Republic in 1999. It predominantly utilized secondary data. Findings showed that these challenges threaten the consolidation of democratic formula capable of carrying the Nigerian state out of its endemic cycle of democratic and leadership crises. Despite these challenges, the paper observed that democracy in Nigeria has the prospects of creating enabling environment for good governance. Thus, the paper recommended that for these prospects to be realized, democratic principles in Nigeria must be consolidated and institutions strengthened. Key Words: Democratic Governance, Fourth Republic; Electoral System. 1. Introduction Since the mid-twentieth century, global economic and political restructuring dictated by the Breton Woods’ financial institutions1
1 The International Monetary Fund (IMF) and the World Bank (IBRD)
has resulted in the democratization of political systems and electoral processes across the world especially in the Third World Countries (TWCs). This process which began after the end of the cold war, has occasioned the ascension of democracy as a universally embraced governing system for delivering social good and rendering accountability to the people (Duruji 2010: 98). Nigeria has not been an exception. After fifteen years of military dictatorship and authoritarianism, the military in May 1999 disengaged from politics and relinquished political power to a democratically elected government. That was the beginning of the Fourth Republic in Nigeria’s attempt at democratic consolidation since political independence in 1960. A decade and three years after, three different civilian regimes have emerged and there have been three successive transitions from one civilian regime to another. Despite these seeming successes in democratic consolidation, governance in Nigeria, especially in the Fourth Republic has been confronted in the main, by a myriad of challenges namely electoral malpractices, inter- and intra-ethnic rivalries, religious crises and insecurity, inadequate and weak democratic institutions, poverty and institutionalized corruption, among others. These challenges threaten the consolidation of democratic formula capable of carrying the Nigerian state out of its endemic cycle of democratic and leadership crises that have persisted since independence (Barrret 2004, 5). Examining the nature, scope and dimensions of these challenges is the central focus of this paper.

ISSN 2039-9340 Mediterranean Journal of Social Sciences Vol. 3 (11) November 2012
686
Structurally, the paper is divided into four sections. Section one which is the introduction took a general overview of the paper. Section two reviewed extant literature and located the work within a theoretical framework of analysis. Section three examined in a detailed dimension the challenges of democratic governance in Nigeria while section four drew conclusion and made recommendations. 2. Theoretical Direction and Literature Review 2.1 Theoretical Framework and Direction Extant literature and scholarship on democratic governance has generated a substantial body of theoretical contributions not all of equal status. A most appropriate way to examine this array of theories might be to consider them along the line of Cox (1991)’s classification of orthodox or “problem solving theories” and radical or “critical theories” (Cox, 1991:276-277). This classification is informed by Cox’s observation of the functions of theory generally. According to him;
Theory can serve two distinct purposes. One is simple, direct response; to be a guide to help solve the problem within the terms of the particular perspective which was the point of departure. The other is more reflective which gives rise to theorizing and its relation to the other prospective…. and to open up the possibility of choosing a different valid perspective from which the problematic becomes one of creating an alternative world (Cox, 1991:277).
From the above assertion, Odock (2006) has opined that the line of demarcation between the two classifications of theory can simply be posited in terms of perspective which a given theory seeks to distribution of power or to transcend the existing political or social order. On the basis of these distinctions, much of the theoretical contributions to the contemporary scholarship on democratic governance in Nigeria; the various variants and strands of elite theory as properly utilized by Omodia (2009: 35-42) in his analysis of Elections and Democratic Survival in the Fourth Republic of Nigeria; Structural Functionalism as also adopted by Omodia (2010:129-133) in his consideration of Elite Recruitment and Political Stability in the Nigerian Fourth Republic and Instrumentalism as adumbrated upon by Duruji (2010: 92-106) in his examination of Democracy and the Challenge of Ethno-Nationalism in Nigeria’s Fourth Republic: Interrogating Institutional Mechanism; among others, can easily be located within the Orthodox or Problem-Solving theories in so far as they seek to proffer solutions to enhance the efficiency and the efficacy of democratic governance as it obtains in Nigeria.
Among all the works reviewed, it is only Ekanem (2001)’s The Dialects of Instability and Underdevelopment in Africa and Ekanem (1997)’s Government and Ideology for Nigeria, which utilized Dialectic Materialism and Crude Marxism respectively as theoretical frameworks that can safely be classified under Cox’s critical theory, as they posit the existence of conflicts and contradictions within the African and Nigerian democratic order, and their attempt at the transformation of the order is seen as likely to produce a new order that will necessarily be an amended version of the former. It is in the light of the above classification that this work adopts the Neo-Marxist theoretical paradigm as its analytical framework. The Neo-Marxist paradigm adopts three basic approaches in its explanation of a given phenomenon namely; history, economy and actors’ perception and interpretation of external stimuli. The major assumption and thrust of this theory are vividly captured by Barongo (1981); a leading proponent of the theory. According to him;
In a very real sense, the nature of political life in a particular society, the type of institutions that are created and sustained and the peculiar patterns of political processes that emerge are a function of the interplay among three main factors, namely; the condition of the base of society, the history and the experience of the society and the actors’ perception, interpretation and response to environmental stimuli (Barongo, 1981: 138).
Undoubtedly, a proper understanding of Nigeria’s political system and democratic experiences cannot be attained without an in-depth knowledge of the political history and economy of the Nigerian state nor can the workings of the political institutions that are created and sustained be understood without a good knowledge of the personal preferences and ideological inclinations and proclivities of those who act on behalf of the state. Thus, the Neo-Marxist theory as captured above, its short comings and weaknesses notwithstanding, adequately explains the challenges of democratic governance in Nigeria. This is because these challenges revolve around the history and economy of the Nigerian state as well as the nature and character of the political and democratic institutions developed and sustained by the leadership.

ISSN 2039-9340 Mediterranean Journal of Social Sciences Vol. 3 (11) November 2012
687
2.2 Review of Related Literature Contemporary scholarship on politics in Nigeria in particular and Africa in general parades a vast array of literature on democratic practices and governance. While some scholars examine democratic governance in Nigeria from institutional prisms; paying attention particularly to the roles of the various democratic institutions in the consolidation of democracy (Bankole, 2009; Zwingina, 2010), others consider it from a comparative perspective; being concerned with the similarities and differences in the pattern and practice of democracy in Nigeria and other states and the influence of contending global variables and imperatives on democratic ethos in various countries (Omeiza, 2010). Other group of scholars see democracy from a normative and legalistic background, being interested in the norms and legal processes in democratic practices such as constitutional provisions and administrative procedures in democratic systems (Adewale, 2009). While these scholars have adequately articulated the institutional, normative and constitutional issues that border around democracy, little attention has been paid to the challenges which confront democratic states such as Nigeria that seek to deepen and consolidate democratic practices and principles.
The second group of literature that set to address this observed lacuna in the literature did not approach the issue holistically. Rather, the various variables and factors that constitute this challenge were disaggregated and considered. Thus, while Ogundiya (2010) examined corruption as a factor that impacts on democratic governance in Nigeria in isolation of other factors, Best (2001) considered religious conflicts; ethno-nationalistic tendencies and weak institutional mechanisms fell within the focus of the issues discussed by Duruji (2010) and Adewale (2009). Class dialectics, elite dynamics and electoral crisis were considered by Omodia (2009). The implication of the above is that this body of literature does not provide in a single volume a comprehensive reading on the challenges of democratic governance as it concerns Nigeria.
These scathing remarks notwithstanding, Oko (2008) and Wali (2002) have within the limits and shortcomings of their work provided a relatively comprehensive account of the crisis of democratic governance and the factors that constitute the challenge. However, the point of departure from the perspectives of the two scholars is that while Wali (2002) focused primarily on Nigeria, Oko (2008)’s scope of coverage extended to other countries within the African continent from where he drew insightful lessons and far reaching policy recommendations and options for Nigeria. Beside this, Oko (2008:15) categorized these challenges into two, namely “domestic challenges and challenges from the international community”.
These differences in scope and issue areas of coverage notwithstanding, there is a somewhat unanimity among these scholars that certain of these factors pose more threat to democracy that the others both within and outside Nigeria. For instance, the potency and formidability of political corruption, electoral malpractices, weak democratic institutions and national security crisis occasioned by ethnic cleavages and extreme poverty reverberated in all the literature consulted. This is evident in the listing of electoral malpractice, corruption, ethno-nationalistic issues by Omodia (2009), Duruji (2010) and Ogundiya (2010), while weak institutional mechanisms, security crisis and poverty were listed by Oko (2008) and Wali (2002) respectively.
The import of these recurrent themes in the extant literature is that these factors are fundamental national issues that demand urgent and critical but sustainable solutions if democratic governance is to be deepened and consolidated in Nigeria. However, a fundamental issue not raised in the extant literature is the practicability and workability of the solutions put forward. For instance, while, Wali (2002) has listed among other things; strengthening democratic infrastructure, subordination of the polity to the rule of law, strengthening of party politics, supporting electoral institutions, provision of some social services, and facilitating economic growth; Oko (2008) on his part has listed improving security, revamping public institutions, countering anti-democratic sentiments, fighting corruption, organizing credible elections without clearly stating the strategies and methodologies that could be employed in applying these recommended solutions. Thus, it becomes a cyclical crisis in which solutions for observed challenges lead to another challenge. The reason for this is because the state and its democratic institutions that ordinarily would have facilitated this reform process are considered inadequate and weak.
Be that as it may, the body of literature considered here, has clearly and successfully pointed to us; amidst incomprehensively, and called attention to the challenges which impede the consolidation of democratic governance and practice in Nigeria. By so doing, it has widened the scope of knowledge in this regard and opened up the frontiers of academic research in this direction. 3. Challenges of Democratic Governance in Nigeria Among the multiplicity of the challenges that have confronted democratic governance in Nigeria since the inception of the Fourth Republic in 1999, the following would be considered more worrisome; electoral irregularities and malpractices,

ISSN 2039-9340 Mediterranean Journal of Social Sciences Vol. 3 (11) November 2012
688
inter-and intra-ethnic rivalries, religious crises and insecurity, poverty, inadequate and weak democratic institutions and institutionalized corruption. 3.1 Electoral Malpractice One of the cardinal tenets of participatory democracy is orderly change of government through credible, free, fair and periodic elections. Since the inception of the Fourth Republic in Nigeria, change of government has been orderly while elections have been periodic. Between 1999 and 2011 three different civilian regimes have emerged and there have been three successive transitions from one civilian regime to another (Obasanjo Regime, 1999 – 2007; Yar’ Adua/Jonathan Regime, 2007 – 2011; Jonathan Regime, 2011 till date). The same has been replicated in the legislature. Since 1999, the country has successfully passed through three Legislative Houses both at the State and Federal Government levels viz: 1999-2003; 2003-2007; 2007-2011. However, the credibility, freeness and fairness of the elections that brought about this process have been the subject of thorny debates in contemporary national discourse (Omodia, 2009:1, 2; Tinubu 2009).
Elections in the Fourth Republic have been characterized by monumental irregularities and malpractices which magnitude increases with every election. Institutions of the state such as the police, the military, and even the electoral body, the Independent National Electoral Commission (INEC) collude to manipulate the electoral process in favor of certain candidates. Thus, situations where individuals have won elections from prison custody as in the case of Senator Omisore of Osun State and Governor Ahamefuna Orji of Abia State, contrary to the provisions of the Electoral Act, have been witnessed. In some other cases, INEC has conducted elections in states where the tenures of sitting Governors were still subsisting as in the case of Governor Peter Obi against Andy Uba of Anambra State in 2007. In every periodic election, local and international observers have been unanimous in their reports that the elections generally fall below internationally accepted standards. For instance, the 1999 elections that brought Olusegun Obasanjo to power were said to have been marred by such widespread fraud that observers from the US based Carter Centre concluded that “it is not possible for us to make an accurate judgment about the Presidential elections” (Carter Center and National Democratic Institute, 1999). In 2003, the general elections were widely seen as a test of Nigeria’s progress towards more open and accountable governance after four years of civilian rule under Obasanjo. However, the Transition Monitoring Group (TMG) described the 2003 elections thus:
While the voters waited and persevered in the polling stations to cast their votes, the political class and the political parties had different ideas. The voters wanted their votes to determine the winner of the elections, while the political class wanted to corrupt the process and rig their way into elective office…on the whole the result can be said to marginally reflect the choice and will of the Nigerian people (TMG 2003: cited in Adejumobi and Agbaje, 2006:39).
In the same light, Nigerian’s 2007 general elections were widely regarded as a crucial barometer of the federal governments’ commitment to the notion of democratic consolidation, but according to Human Rights Watch;
The polls marked a dramatic step backwards, even when measured against the dismal standard set by the 2003 election. Electoral officials alongside the very government agencies charged with ensuring the credibility of the polls were accused of reducing the elections to a violent and fraud ridden farce (Human Rights Watch, 2007:27).
Indeed, the view “that the history of election administration in Nigeria is a history of electoral fraud and violence” (Ajayi, 2007) is widespread. Also scholars have observed that this poor electoral system in Nigeria breeds persistent crises of legitimacy in governance. Omodia (2009: 38) is one of such scholars. According to him;
In Nigeria, just like most of the countries in Africa, elections especially its freeness and fairness constitute the central factor in ensuring democratic survival. This is because the lack of free and fair elections often tends to threaten the democratic process as a result of legitimacy question. This factor, no doubt has characterized the democratic experiment of the Nigerian Fourth Republic in that there have been persistent crises of legitimacy in governance arising from poor electoral system.
Apart from being one of the cardinal tenets of democratic process, free, fair and credible elections are central to the consolidation and sustenance of democracy. It defines the degree of freedom exercised by the people in selecting who represent them in government. But this has not been the case in Nigeria as the system is manipulated in favor of certain
ISSN 2039-9340 Mediterranean Journal of Social Sciences Vol. 3 (11) November 2012
689
individuals and political parties. This history of problematic and controversial election administration threatens the consolidation of democracy. 3.2 Ethnic Cleavages and Security Crisis Inter- and intra-ethnic rivalries, religious crisis and insecurity also constitute potent challenges to democratic governance in Nigeria. Reading through the works of Best (2001), Duru and Ogbonnaya (2010: 1-9); Adewale (2009) and Duruji (2010: 92-106) one sees these issues fairly handled and exhaustively treated. According to Duruji (2010:92-93), the return of Nigeria to democracy in 1999 opened up the space for expression of suppressed ethnic demands bottled up by years of repressive military rule. The expression of these demands have resulted in the emergence of ethno-nationalist insurgencies such as the Movement for Emancipation of the Niger Delta (MEND) in the Niger Delta region, the renewed demand for Biafra spearheaded by the Movement for Actualization of Sovereign State of Biafra (MASSOB) and the increasing notoriety of the Odua People’s Congress (OPC) in the South-West. This has also resulted in incessant ethnic clashes in the Middle Belt region and other parts of the country such as the Ijaw-Itshekiri ethnic clashes in 2009. There have also been frequent inter- religious clashes and sharia-instigated riots in the Northern part of Nigeria as well as the emergence of the Boko Haram Islamic Jihadists with well known preferences in religious belief and social practices (Eso, 2011). Intra-ethnic cleavages as witnessed in the horrors of Ife/Modakeke and Aguleri/Umuleri fratricidal wars in the South-West and South-East regions respectively have also been the order of the day. These inter and intra- ethnic rivalries and religious crises not only result in the loss of human and material resources that cannot be quantified in monetary terms which occasion untold economic hardship, they most fundamentally breed state of anarchy that threaten the unity and corporate existence of the Nigerian state; leaving those who act on behalf of the state with magnitude of national issues to contend with. For instance, while the militancy in the Niger Delta took a heavy toll on the nation’s economy because of its independence on oil for foreign exchange earnings2
2 In 2008 alone, it was estimated that Nigeria lost over three trillion naira as a result of militancy in the Niger Delta (See Tawiah, 2012).
, the Boko Haram insurgency in the North has at the last count left over 16,000 policemen, soldiers and civilians, including politicians dead (UNCIRF, 2012; Nigerian Crime News, March 31, 2012). This has resulted in Nigeria being considered as unsafe country for foreign direct investments.
Furthermore, given that these inter-religious and socio-cultural crises occur outside of the confines of the law, they challenge and weaken democratic institutional mechanisms that are meant to check them and threaten the consolidation and survival of democratic governance in Nigeria (Duruji, 2010: 93). 3.3 Poverty Poverty is another factor that constitutes grave challenge to democratic governance in Nigeria. Unarguably, Nigeria is blessed with abundant human and material resources. This notwithstanding, the nation ranks among the world’s poorest. According to UNDP (2009:27), in Nigeria, hunger exhibits its ugly face in most homes where the average citizen contends with a life of abject poverty. Thus, the common man is “alienated from himself as he lacks the wherewithal to afford the basic necessities of life such as education, medical facilities, and so forth”.
Expectedly, life expectancy is low compared with those of the developed nations of the world” (Olu-olu, 2008:1; see also UNDP National Human Development Reports for Nigeria, 2011). Drawing a comparison in the incidence of poverty between Nigeria and India, Nda-Isiah (2012:56) submitted that;
Between then and today (1962 and 2012), India has been able to lift 400 million people out of poverty, just as democracy has also flourished in that country… In the corresponding period, however, 100 million Nigerians out of a population of 167 million have slipped into poverty. Statistically, about 10million Nigerians are in absolute poverty, which literally means they cannot afford the basic necessities of life.
From the foregoing, it can be asserted that life generally in Nigeria is threatened by absolute and abject poverty. These realities are much more obvious in rural areas. A factual indicator is the result of the Harmonized Nigerian Living Standard Survey published by the National Bureau of Statistics in 2011 that showed that large proportion of Nigerians live in poverty (see Tables 2 and 3). Thus, despite the fact that Nigerian economy is paradoxically growing, the proportion of Nigerians living in poverty is increasing every year as shown in Table 2. Table 2 Relative Poverty Headcount from 1980 – 2010.

ISSN 2039-9340 Mediterranean Journal of Social Sciences Vol. 3 (11) November 2012
690
Year Poverty Incidence (%) Estimated Population (Million) Population in Poverty (million) 1980 27.2 65 17.1 1985 46.3 75 34.7 1992 42.7 91.5 39.2 1996 65.6 102.3 67.1 2004 54.4 126.3 68.7 2010 69.0 163 112.47
Source: NBS Harmonized Living Standard Survey, 2010. Table 3: Relative Poverty: Non-Poor, Moderately Poor and Extremely Poor.
Year Non-Poor Moderately Poor Extremely Poor 1980 72.8 21.0 6.2 1985 53.7 34.2 12.1 1992 57.3 28.9 13.9 1996 34.4 36.3 29.3 2004 43.3 32.4 22.0 2010 31.0 30.3 38.7
Source: NBS Harmonized Living Standard Survey, 2010. Distributing the population into extremely poor, moderately poor and non-poor, the proportion of the extremely poor increased from 6.2 per cent in 1980 to 29.3 per cent in 1996 and then came down to 22.0 per cent in 2004 before reaching 38.7 per cent in 2010. For the moderately poor, the picture was quite different as the proportion rose between 1980 and 1985 from 21.0 per cent to 34.2 per cent. It went down between 1996 and 2004, from 36.3 per cent to 32.4 per cent, and even further in 2010 to 30.3 per cent. On the other hand, the proportion of non-poor was much higher in the country in 1980 (72.8 per cent) compared to 1992 (57.3 per cent). It dropped significantly in 1996 to 34.4 per cent, falling further in 2010 to 31 percent. Undoubtedly, this has undermined and challenged the legitimacy and integrity of government and the functionality of not just the democratic process but also of the Nigerian state. For instance, scholars have argued that the recent security challenges that have been confronting the country (Niger Delta militancy and the Boko Haram insurgency) are caused by high level of poverty in the country (Awoyemi, 2012; Harrington, 2012). These security situations as pointed out earlier breed state of anarchy that threaten the secularity, unity and corporate existence of the Nigerian state upon which its democratic process is anchored. 3.4 Weak Democratic Institutions The weakness of the democratic institutions in Nigeria is another challenge to democratic governance. By democratic institutions, we refer to the Executive, Judiciary, the Legislature and electoral agencies such as the Independent National Electoral Commission (INEC). In principle, each of these institutions is constitutionally empowered to maintain a certain degree of independence and autonomy while serving as checks on each other. In practice however, the tendency for the Executive to dominate employing all manner of advantages on its side including the control of budgetary allocations, remains a formidable reality. This dominance and over-bearing characteristics of the Executive is located in the pattern and practice of dictatorship in Nigeria especially during the military era. Bankole (2009) has asserted that decades of military dictatorship has had the effect of eroding constitutional federalism,3
Assessing the independence and autonomy of INEC and the Judiciary in the Fourth Republic, Omodia (2009:38) has observed that events in this democratic dispensation have shown that the electoral body is not independent of the party in power. This according to him has been defined in relation to the manner in which the electoral body has conducted elections in the way that advantaged the party in power while the Judiciary has “served as a tool for creating political topsy-turvy that undermined the democratic process”. Duruji (2010:102) has also observed that the judiciary has
the erosion of the culture of rule of law, the enthronement of a culture of arbitrariness and impunity resulting in high levels of corruption. This legacy has fundamentally impacted on the power relations between the Executive and the other democratic institutions. The consequence of this has been the existence of subdued judiciary, weak oversight capacity of the legislature and the dumbness of the electoral bodies both at the Federal and State levels.
3 By its concentration of power and resources in the Executive.

ISSN 2039-9340 Mediterranean Journal of Social Sciences Vol. 3 (11) November 2012
691
been unable to sustain the democratic process in Nigeria by failing to convict anybody through the judicial process for the several cases of arson and killing that have characterized inter- and intra-ethnic clashes while the legislative institution has proven incapable of interfering decisively in the management of ethno-religious and security crises in Nigeria. According to Best (200:75), the Nigeria Police is an instrument of the state for the maintenance of law and other. Yet, it has repeatedly proved to be incompetent with respect to handling both simple and major internal conflicts, be they religious, ethnic, communal, etc. while the state has failed to prosecute and punish people under the law. This weakness of state institutions, impact negatively on democratic practices and also threatens the consolidation of democratic governance in Nigeria. As Makinda (2004:20) has observed, “democracy is only possible if the structures, processes and institutions through which the people’s will is expected to be addressed accommodate their interests, values and aspirations. Constitutional democracy continues to falter not only because of the conduct of leaders but also because of inefficient, ineffective and deteriorating public institutions”. 3.5 Institutionalized Corruption That political and institutionalized corruption constitutes one of the greatest challenges and threats to democratic governance in Nigeria since the First Republic has long been established as evident in Joseph (1991), among other scholarly works. What is worrisome is the magnitude and degree of its manifestation in the Fourth Republic. The incidence of corruption in Nigeria reached a crescendo in 2004 when a German-based international non-governmental organization, Transparency International (TI) in its 2004 Corruption Perception Index (CPI) report, projected Nigeria as the 2nd most corrupt country in the world (132nd out of 133 countries surveyed) (Akinyemi, 2008: 22). The Transparency International’s CPI is the world’s most credible measure of domestic and public sector corruption. According to the Index, every single public institution in Nigeria is corrupt and has failed to appreciate fully the obligation upon them to do something concrete about corruption.
In 2008, Nigeria sank deeper into the CPI ranking and has since maintained a consistent low rating. From a score of 2.7 to 2.5 in 2009, and 2.4 in 2010 which it maintained in 2011, Nigeria has been ranked as the 3rd most corrupt country in Sub-Saharan Africa and 143rd out of 183 countries surveyed around the world in 2011 (Transparency International, 2011). It is reported by Transparency International that the level of corruption and other related crimes in Nigeria attract between $4 million and $8 million loss on daily basis and a loss of about $70.58 million to the national economy annually, and that the country has lost more than $380 billion to graft since independence in 1960. According to the report, nepotism, bribery and patronage are so deeply engrained in the daily life of Nigerians that even existing anti-corruption laws have little or no impact (Yishan, 2011). It has been argued that the war against corruption has been difficult to win because the act is perpetrated by policy makers themselves (Olu-Olu, 2006; 2008). A clear indicator to this fact is the US$ 620, 000 oil subsidy bribery scandals rocking the Nigerian National Assembly and the Federal Ministry of Petroleum Resources. This has thrown up public frustration in Nigeria. The 2011 Transparency International’s Corruption Perception Index (CPI) shows that the public frustration is well founded. This frustration notwithstanding, corruption has become an ineradicable part of the culture in Nigeria and continues to threaten both constitutional democracy and the nation. According to Oko (2008:60), nothing enfeebles democracy more than corruption. It distorts governance, provides perverse incentives for dysfunctional behaviour, and ultimately diminishes the quality of life by diverting funds for social services into private pockets. And like the national economy of the country, democratic governance in Nigeria has not been immune to the damages of corruption. Senator Barack Obama perceptively observed during his 2006 visit to Kenya that;
Corruption erodes the state from the inside out, sickening the justice system until there is no justice to be found, poisoning the police forces until their presence becomes a source of insecurity rather than a source of security (Obama, 2006).
4. Conclusion and Policy Recommendations 4.1 Conclusion From the analysis so far presented, democracy in Nigeria is flawed, problematic and threatened by internal and external variables. However, this does not negate the fact that it is preferred more than military dictatorship and authoritarianism. This preference for democracy is predicated upon the fact that it has, despite its shortcomings, afforded within the period under consideration, opportunity for the Nigerian populace to participate in the governance of their state. This is evident in the following examples;

ISSN 2039-9340 Mediterranean Journal of Social Sciences Vol. 3 (11) November 2012
692
1. The formation of political parties which has provided the platform for Nigerians to come together to articulate and espouse political ideas and seek political offices. This provided the opportunity of participating in the selection of their leaders and representatives;
2. The institutionalization of the legislative arms of government both at the state and national levels with its constitutional oversight function of the Executive. This has created room for checks and balances for the system.
The implication of the foregoing is that its challenges and shortcomings notwithstanding, democratic governance has provided Nigerians the opportunity to contribute to political and national development of their state. This was not the case in the military system of government that lasted for than fifteen years. Implicitly therefore, democratic governance possesses the prospects of good governance. 4.2 Recommendations To curtail the observed challenges that democratic governance is faced with in Nigeria and to fully realize the prospects of democracy, the following policy options are hereby recommended; 1. Strengthening of Democratic Institutions The weakness and inadequacy of democratic institutions is the greatest challenge facing democratic governance in Nigeria. State institutions cannot ensure the security of life and property of Nigerian citizens; they are weak to ensure the credibility of the electoral process; they cannot sanction perpetrators of violence nor does the legal framework hold corrupt private individuals and public officials accountable for their actions. Consequently, the electoral process is vulnerable and is easily manipulated; corruption undermines public confidence in the democratic process while insecurity looms large. This therefore calls for the creation and maintenance of institutions that will uphold transparency and the rule of law. This can be done through vast structural and attitudinal readjustments of the public institutions and public office holders so that they will curtail corruption, insecurity and executive interference and indifference to public goods (Oko, 2008: 35). 2. Deepening of Democratic Principles Democracy generally is characterized by definite and defined principles. These include, adherence to the rule of law, respect for fundamental human rights and the protection of life and property. For the prospects of democratic governance to be realized, these principles of democracy, must not just be imbibed, they must be deepened.
References Adewale, Y. D. 2009. “Ethnic Politics, Political Corruption and Poverty: Perspectives on Contending Issues and Nigeria’s
Democratization Process”. Ethnic Studies Review, 32(1), June Adejumobi, S. and Agbaje, A. 2006. Do Votes Count: The Travails of Electoral Politics in Nigeria. Dakar: Council for the Development of
Social Science Research in Africa – CODESRIA. Akinyemi, B. 2008. “Corruption: A Battle Nigeria Must Win”, THISDAY, August 22, p.22. Ajayi, K. 2007. “Elections Administration in Nigeria and the Challenges of the 2007 Elections”. The Social Sciences, Medwell Journals,
2(2), 142-151. Awoyemi, O. 2012. Revenue Allocation, Insecurity and Poverty in Northern Nigeria. Retrieved on 5th July, 2012 from
www.proshareng.com/news/16703. Bankole, D. 2009. “The Role of the Legislature in the Consolidation of Democracy in Nigeria”. The Nation, June 29. Barret, L. 2004. “Diplomatic Morality and Africa’s Global Presence”. Daily Sun, August 5, p.9. Barongo, Y., ed. Political Science in Africa: A Critical Review, 1981. London: Zed Publishers. Best, S. G. 2001. “Religion and Religion Conflicts in Northern Nigeria”. University of Jos Journal of Political Science, 11(111), 63-81,
December. Carter Centre and National Democratic Institute, 1999. Statement by the Carter Center/NDI International Observer Delegation to the
Nigerian Presidential Election, March. Cox, R. W. 1991. “Social Forces, States and World Orders: Beyond International Relations Theory.” In A Reader in International
Relations Theory, eds. Williams, H., Wright, M. and Evans, T. Vancouver: UBC Press. Duru, E. J. C. and Ogbonnaya, U. M. 2010. “Globalization, International Terrorism and National Security Challenges in Contemporary
World Order”. Kogi Journal of Politics, 1(2), 1-9, November.

ISSN 2039-9340 Mediterranean Journal of Social Sciences Vol. 3 (11) November 2012
693
Duruji, M. M. 2010. “Democracy and the Challenge of Ethno-Nationalism in Nigeria’s Fourth Republic: Interrogating Institutional Mechanism”. Journal of Peace, Conflict and Development, 15, 92-106, March.
Ekanem, O. 1997. “Government and Ideolgy for Nigeria”. In Nigerian Government and Politics, ed. Ozumba, G. O. Aba: Vitalis Books. Ekanem, O. 2011. “The Dialectics of Underdevelopment and Instability in Africa”. Calabar Journal of Politics and Administration, 1(2), 52-
66, April. Eso, H. 2011. Boko Haram: The Enemy Within. Retrieved on 6th March, 2012 from www.kwenu.com/moe/2011/boko_haram_
enemy_within.htm. Harrington, E. 2012. “Religion is not Driving Extremist Violence in Nigeria, Says Obama Officials, after Church Bombings”. CNS News.
Retrieved on 5th May, 2012 from www.cnsnews/news/article/.../ Human Rights Watch, 2007. Criminal Politics: Godfathers and Corruption in Nigeria. Retrieved on 11th September 2010 from
www.hrw.org. Joseph, R. A. 1991. Democracy and Prebendal Politics in Nigeria: The Rise and Fall of the Second Republic. London: Cambridge
University Press. Makinda, S. M. 2004. “Between Authoritarianism and Post Democracy: Agenda for Democracy in Africa”. Africa Quarterly, 44(1), 17-29. Nigerian Crime News, 31 May, 2012. Obama, B. 2006. An Honest Government, A Hopeful Future. Address delivered at the University of Nairobi, Kenya, August 28. Available
at www.obama.senate.gov/speech/060828-an_honest_gover. Odock, C. N. 2006. “International Relations: Background, Trends and Perspectives”. In Political Science: An Introductory Reader, eds.
Bassey, C. O. and Ozumba, G. O. Calabar: Wusen Publishers. Ogundiya, I. S. 2010. “Corruption: The Bane of Democratic Stability in Nigeria”. Current Research Journal of Social Sciences, 2(4), 233-
241. Oko, O. 2008. The Challenges of Democratic Consolidation in Africa. From the Selected Works of Okechukwu Oko,
www.works.bepress/okechukwu_oko/2 Olu-olu, O. 2006. “Corruption and the Problem of Development in Nigeria”. The Social Sciences, 1(3), 183-187. Olu-olu, O. 2008. “Corruption by Example: Legalizing the Illegal as a Means of Survival in Modern Nigeria”. Bangladesh e-Journal of
Sociology, 5(1), January. Omeiza, M. D. 2009. A Comparative Study of Globalization and Democratic Consolidation in Nigeria and Ghana (1990-2008). Available
at www.abu.edu.ng/publications/2009-06-21-210702_5713.doc. Omodia, S. M. 2009. “Elections and Democratic Survival in the Fourth Republic of Nigeria”. The Journal of Pan African Studies, 3(3), 35-
42, September. Omodia, S. M. 2010. “Elite Recruitment and Political Stability in the Nigerian Fourth Republic”. Journal of Social Sciences, 24(2), 129-
133. Tawiah, F. 2012. “Counting the Gains of the Amnesty Programme”. The Nation, February 15. Tinubu, B. A. 2009. “Democratic Consolidation in Nigeria: Issues, Challenges and Prospects. Text of a Lecture delivered at a National
Symposium on 10 Years of Democracy (1999-2009) in Nigeria”. Organized by the Aminu Kano Centre for Democratic Research and Training, Mambyya House, Bayero University, Kano, on May 29.
Transparency International, Corruption Perception Index 2011. Available at www.cpi.transparency.org/cpi2011/results/ Transition Monitoring Group (TMG), 2003. Do the Votes Count? Final Report of the 2003 General Elections in Nigeria. United States Commission on International Religious Freedom (USCIRF) Annual Report 2012 – Countries of Particular Concern:
Nigeria, 20 March 2012. Retrieved on 4 July, 2012 from http://www.unhcr.org/refworld/docid/4f71a675a.html. UNDP, Human Development Report, 2009. UNDP, Human Development Report, 2011. Yishau, 2011. TI Index: Corruption is Killing Nigeria. Wali, M. A., 2002. “Consolidating Democracy in Nigeria”. A Paper Presented at the University of Belgrano, Buenos Aires, Argentina on
Tuesday, 30th April. Zwingina, J. S. 2010. “The Role of the Legislature in Democratic Governance: The Nigerian Experience”. Nigerian Journal of Legislative
Affairs, 1(1), 285-301.

Printed for MCSER in November 2012 by Gruppo Atena.net Srl
Via del Lavoro 22, 36040 Grisignano, VI, Italy
www.atena.net