SOCIAL SCIENCES: Psychological and Cognitive Sciences Joel, S ...
40
SOCIAL SCIENCES: Psychological and Cognitive Sciences Joel, S., Eastwick, P. W., Allison, C. J., Arriaga, X. B., Baker, Z. G., Bar-Kalifa, E., Bergeron, S., Birnbaum, G., Brock, R. L., Brumbaugh, C. C., Carmichael, C. L., Chen, S., Clarke, J., Cobb, R. J., Coolsen, M. K., Davis, J., de Jong, D. C., Debrot, A., DeHaas, E. C., Derrick, J. L., Eller, J., Estrada, M. J., Faure, R., Finkel, E. J., Fraley, R. C., Gable, S. L., Gadassi, R., Girme, Y. U., Gordon, A. M., Gosnell, C. L., Hammond, M. D., Hannon, P. A., Harasymchuk, C., Hofmann, W., Horn, A. B., Impett, E. A., Jamieson, J. P., Keltner, D., Kim, J. J., Kirchner, J. L., Kluwer, E. S., Kumashiro, M., Larson, G., Lazarus, G., Logan, J. M., Luchies, L. B., MacDonald, G., Machia, L. V., Maniaci, M. R., Maxwell, J. A., Mizrahi, M., Muise, A., Niehuis, S., Ogolsky, B. G., Oldham, C. R., Overall, N. C., Perrez, M., Peters, B. J., Pietromonaco, P. R., Powers, S. I., Prok, T., Pshedetzky-Shochat, R., Rafaeli, E., Ramsdell, E., Reblin, M., Reicherts, M., Reifman, A., Reis, H. T., Rhoades, G. K., Rholes, W. S., Righetti, F., Rodriguez, L. M., Rogge, R., Rosen, N. O., Saxbe, D., Sened, H., Simpson, J. A., Slotter, E. B., Stanley, S. M., Stocker, S., Surra, C., Vaughn, A. A., Vicary, A. M., Visserman, M. L., & Wolf, S. (2020). Machine learning uncovers the most robust self-report predictors of relationship quality across 43 longitudinal couples studies. Proceedings of the National Academy of Sciences, 117, 19061-19071. https://doi.org/10.1073/pnas.1917036117
-
Upload
khangminh22 -
Category
Documents
-
view
0 -
download
0
Transcript of SOCIAL SCIENCES: Psychological and Cognitive Sciences Joel, S ...

SOCIAL SCIENCES: Psychological and Cognitive Sciences
Joel, S., Eastwick, P. W., Allison, C. J., Arriaga, X. B., Baker, Z. G., Bar-Kalifa, E., Bergeron,
S., Birnbaum, G., Brock, R. L., Brumbaugh, C. C., Carmichael, C. L., Chen, S., Clarke, J.,
Cobb, R. J., Coolsen, M. K., Davis, J., de Jong, D. C., Debrot, A., DeHaas, E. C., Derrick,
J. L., Eller, J., Estrada, M. J., Faure, R., Finkel, E. J., Fraley, R. C., Gable, S. L., Gadassi,
R., Girme, Y. U., Gordon, A. M., Gosnell, C. L., Hammond, M. D., Hannon, P. A.,
Harasymchuk, C., Hofmann, W., Horn, A. B., Impett, E. A., Jamieson, J. P., Keltner, D.,
Kim, J. J., Kirchner, J. L., Kluwer, E. S., Kumashiro, M., Larson, G., Lazarus, G., Logan,
J. M., Luchies, L. B., MacDonald, G., Machia, L. V., Maniaci, M. R., Maxwell, J. A.,
Mizrahi, M., Muise, A., Niehuis, S., Ogolsky, B. G., Oldham, C. R., Overall, N. C., Perrez,
M., Peters, B. J., Pietromonaco, P. R., Powers, S. I., Prok, T., Pshedetzky-Shochat, R.,
Rafaeli, E., Ramsdell, E., Reblin, M., Reicherts, M., Reifman, A., Reis, H. T., Rhoades, G.
K., Rholes, W. S., Righetti, F., Rodriguez, L. M., Rogge, R., Rosen, N. O., Saxbe, D.,
Sened, H., Simpson, J. A., Slotter, E. B., Stanley, S. M., Stocker, S., Surra, C., Vaughn, A.
A., Vicary, A. M., Visserman, M. L., & Wolf, S. (2020). Machine learning uncovers the
most robust self-report predictors of relationship quality across 43 longitudinal couples
studies. Proceedings of the National Academy of Sciences, 117, 19061-19071.
https://doi.org/10.1073/pnas.1917036117

Machine Learning Uncovers the Most Robust Self-Report Predictors of Relationship Quality
Across 43 Longitudinal Couples Studies
Short Title: Best Predictors of Romantic Relationship Quality Across 43 Studies
Samantha Joel1*, Paul W. Eastwick2, Colleen J. Allison3, Ximena B. Arriaga4, Zachary G. Baker5, Eran Bar-Kalifa6, Sophie Bergeron7, Gurit Birnbaum8, Rebecca L. Brock9, Claudia C. Brumbaugh10, Cheryl L. Carmichael11, Serena Chen12, Jennifer Clarke13, Rebecca J. Cobb3, Michael K. Coolsen14, Jody Davis15, David C. de Jong16, Anik Debrot17, Eva C. DeHaas3, Jaye L. Derrick5, Jami Eller18, Marie-Joelle Estrada19, Ruddy Faure20, Eli J. Finkel21, R. Chris Fraley22, Shelly L. Gable23, Reuma Gadassi- Polack24, Yuthika U. Girme3, Amie M. Gordon25, Courtney L. Gosnell26, Matthew D. Hammond27, Peggy A. Hannon28, Cheryl Harasymchuk29, Wilhelm Hofmann30,31, Andrea B. Horn32,Emily A. Impett33, Jeremy P. Jamieson19, Dacher Keltner11, James J. Kim34, Jeff L. Kirchner35, Esther S. Kluwer36, Madoka Kumashiro37, Grace Larson38, Gal Lazarus39, Jill M. Logan3, Laura B. Luchies40, Geoff MacDonald34, Laura V. Machia41, Michael R. Maniaci42, Jessica A. Maxwell43, Moran Mizrahi44, Amy Muise45, Sylvia Niehuis46, Brian G. Ogolsky22, C. Rebecca Oldham46, Nickola C. Overall43, Meinrad Perrez47, Brett J. Peters48, Paula R. Pietromonaco49, Sally I. Powers49, Thery Prok23, Rony Pshedetzky-Shochat39, Eshkol Rafaeli39,50, Erin Ramsdell51, Maija Reblin52, Michael Reicherts53, Alan Reifman46, Harry T. Reis19, Galena K. Rhoades54, William S. Rholes55, Francesca Righetti56, Lindsey M. Rodriguez57, Ron Rogge19, Natalie O. Rosen58, Darby Saxbe59, Haran Sened39, Jeffry A. Simpson18, Erica B. Slotter60, Scott M. Stanley54, Shevaun Stocker61, Cathy Surra62, Hagar Ter Kuile63, Allison A. Vaughn64, Amanda M. Vicary65, Mariko L. Visserman34,45, Scott Wolf35. 1Western University. 2University of California, Davis. 3Simon Fraser University. 4Purdue University. 5University of Houston. 6Ben Gurion University. 7Université de Montréal. 8Interdisciplinary Center (IDC) Herzliya. 9University of Nebraska-Lincoln. 10Queens College & Graduate Center, City University of New York. 11Brooklyn College & Graduate Center, City University of New York. 12University of California, Berkeley. 13University of Colorado, Colorado Springs. 14Shippensburg University. 15Virginia Commonwealth University. 16Western Carolina University. 17University of Lausanne. 18University of Minnesota. 19University of Rochester.

20Vrije Universiteit Amsterdam. 21Northwestern University. 22University of Illinois at Urbana-Champaign. 23University of California, Santa Barbara. 24Yale University. 25University of California, San Francisco. 26Pace University. 27Victoria University of Wellington. 28University of Washington. 29Carleton University. 30University of Cologne. 31Ruhr University Bochüm. 32University of Zurich. 33University of Toronto Mississauga. 34University of Toronto. 35University of North Carolina at Chapel Hill. 36Utrecht University and Radboud University. 37Goldsmiths, University of London. 38University of Cologne. 39Bar-Ilan University. 40Calvin University. 41Syracuse University. 42Florida Atlantic University. 43University of Auckland. 44Ariel University Center of Samaria. 45York University. 46Texas Tech University. 47University of Fribourg. 48Ohio University. 49University of Massachusetts, Amherst. 50Barnard College, Columbia University. 51University of Nebraska-Lincoln. 52Moffitt Cancer Center. 53University of Fribourg. 54University of Denver. 55Texas A & M University. 56Vrije Universiteit Amsterdam. 57University of South Florida St. Petersburg. 58Dalhousie University. 59University of Southern California. 60Villanova University. 61University of Wisconsin, at Superior. 62University of Texas at Austin. 63Utrecht University. 64San Diego State University. 65Illinois Wesleyan University.

*Correspondence to: [email protected]
Keywords: romantic relationships, relationship quality, machine learning, statistical learning, random forests, ensemble methods

Abstract
Given the powerful implications of relationship quality for health and well-being, a central
mission of relationship science is explaining why some romantic relationships thrive more than
others. This large-scale project used machine learning (i.e., Random Forests) to (a) quantify the
extent to which relationship quality is predictable and (b) identify which constructs reliably
predict relationship quality. Across 43 dyadic longitudinal datasets from 29 laboratories, the top
relationship-specific predictors of relationship quality were perceived-partner commitment,
appreciation, sexual satisfaction, perceived-partner satisfaction, and conflict. The top individual-
difference predictors were life satisfaction, negative affect, depression, attachment avoidance,
and attachment anxiety. Overall, relationship-specific variables predicted up to 45% of variance
at baseline, and up to 18% of variance at the end of each study. Individual differences also
performed well (21% and 12%, respectively). Actor-reported variables (i.e., own relationship-
specific and individual-difference variables) predicted 2-4 times more variance than partner-
reported variables (i.e., the partner’s ratings on those variables). Importantly, individual-
differences and partner-reports had no predictive effects beyond actor-reported relationship-
specific variables alone. These findings imply that the sum of all individual differences and
partner experiences exert their influence on relationship quality via a person’s own relationship-
specific experiences, and effects due to moderation by individual differences and moderation by
partner-reports may be quite small. Finally, relationship-quality change (i.e., increases or
decreases in relationship quality over the course of a study) was largely unpredictable from any
combination of self-report variables. This collective effort should guide future models of
relationships.

Significance:
What predicts how happy people are with their romantic relationships? Relationship science—an
interdisciplinary field spanning psychology, sociology, economics, family studies, and
communication—has identified hundreds of variables that purportedly shape romantic
relationship quality. The current project used machine learning to directly quantify and compare
the predictive power of many such variables among 11,196 romantic couples recruited by 29
research labs. People’s own judgments about the relationship itself—such as how satisfied and
committed they perceived their partners to be, and how appreciative they felt toward their
partners—explained approximately 45% of their current satisfaction. The partner’s judgments
did not add information, nor did either person’s personalities or traits. Further, none of these
variables could predict whose relationship quality would increase versus decrease over time.

Romantic relationship quality—a person’s subjective perception that their relationship is
relatively good versus bad (1)—is a powerful psychological construct with far-reaching societal
consequences and policy implications (Fig. 1). Unhappy marriages are associated with many
negative stress-related outcomes (2), including poor physical health (3), high blood pressure (4),
poor immune system functioning (5), mortality (2), and risk of mental health problems (6). Low
marital quality spills over into people’s professional and personal lives, predicting lost work
productivity (7) and lower well-being for children (8).
As the importance of relationships for health, work productivity, and parent/child well-
being has entered public awareness, there has been an explosion of research attempting to
explain, predict, and improve relationship quality. That is, why do some partners feel especially
positively about their relationship, and why do these evaluations change (10)? Interest in this
question across many disciplines—including psychology, sociology, communication, economics,
and family studies—has transformed relationship quality into one of the most central and
pervasive outcome variables in the social sciences, and a primary focus of applied efforts to
strengthen marriages (e.g., the multi-million dollar Healthy Marriage and Relationship Education
Grant program in the U.S., 11). These efforts have resulted in a wide array of constructs and
concepts that—via interpersonal, behavioral processes—shape relationship quality and
relationship stability (see 12-15 for reviews). Some of these variables characterize individuals
(e.g., age at marriage, attachment style, neuroticism; Fig. 1, top-left box), whereas others
characterize partners’ perceptions and experiences within the relationship itself (e.g., conflict,
sex, relationship length, domestic violence; Fig 1, bottom-left box).
A key challenge now—more than 20 years after the emergence of relationship science as
a mature discipline (16)—is to make this knowledge cumulative. In a critique of the field, Reis

(17) highlights an important factor that has historically limited scholars’ ability to organize their
efforts into a coherent body of knowledge: the tendency of the current academic system to
reward individual contributions rather than team science. Indeed, a collectivistic approach would
be particularly beneficial to relationship science for several reasons. First, couples are costly to
recruit, necessarily limiting the statistical power that can be achieved in a given study by a single
lab. Second, participants become fatigued after completing too many measures, limiting the
number of constructs that can be examined in a given study. Third, traditional techniques (e.g.,
regression) make it easy for researchers to mistakenly overfit statistical models to individual
datasets and are suboptimal for comparing the predictive importance of constructs (18,19). The
result of these practical research constraints is that no individual lab has the resources or means
to compare the efficacy of the growing list of important constructs, much less their affiliated
theoretical frameworks.
To document the most reliable predictors of relationship quality and the relative
predictive power of different measurement strategies, the ideal study would combine the
longitudinal and dyadic data-collection efforts of multiple independent laboratories, it would
include a wide array of published and unpublished predictors, and it would use preregistered
statistical procedures that permit data exploration without overfitting. This paper reports the
conclusions of such a study. The project combines the efforts of 86 relationship researchers by
examining 43 longitudinal datasets (funded by 39 national/university grants) with 11,196 couples
(baseline N = 22,163 participants) and 2,413 (mostly self-report) measures collected at baseline.
The datasets tracked couples for an average of four timepoints (range = 2 to 11 timepoints) over
14 months (range = 2 to 48 months). The baseline measures collected from each partner were
used to predict relationship quality at baseline (the first timepoint collected), at follow-up (the

last timepoint collected) and over time (i.e., each participant’s slope calculated across all
available timepoints). This design provides initial answers to the questions of (a) how much
variance in relationship quality can researchers predict? and (b) what types of psychological
measures most reliably emerge as predictors of relationship quality?

Fig. 1. Antecedents and consequences of relationship quality. [See uploaded pdf] Schematic depiction of the field of relationship science. In their work, relationship scientists use an extensive assortment of overlapping individual difference and relationship-specific constructs. These constructs predict the way couple members behave toward and interact with each other, which in turn affects relationship quality and a variety of consequential outcomes. These processes are themselves embedded in social networks as well as broader cultural and historical structures.

Data Solicitation Strategy
Datasets were eligible to be included in the study if they included (a) data from both
romantic partners of each couple, (b) data collected from at least two time points that were at
least two months apart, and (c) a measure of relationship satisfaction collected at each time point.
The overall design and analysis plan for the project was preregistered on June 15, 2018
(https://osf.io/g9sqf/). We used listservs (Society for Personality and Social Psychology and
International Association for Relationship Research), social media (twitter), and the OSF
StudySwap platform to invite researchers with dyadic longitudinal datasets to join the project.
We solicited new datasets from June 15 to October 1, 2018. A total of 48 datasets were
committed to the project, of which 43 datasets were ultimately provided. Datasets were analyzed
on a rolling basis from June 18, 2018 (Dataset 1) to March 25, 2019 (Dataset 43). For each
dataset, coauthors provided a codebook outlining their design and measures. Each codebook was
used to tailor an analysis plan, and each was preregistered prior to analysis (i.e., 43 preregistered
analysis plans total). Analysis plans, final syntax files, and word files outlining any
preregistration changes can be found for each dataset on OSF (https://osf.io/d6ykr/). Analytic
features of each included dataset are reported in Table 1. Demographic features of each dataset
can be found in the SI Appendix.
Measures
The dependent measure was relationship quality (i.e., a person’s subjective perception
that their relationship is relatively good vs. bad; a person’s evaluation of the relationship), and
our primary operationalization of this construct consisted of relationship satisfaction measures.
Commitment was used as an additional operationalization of relationship quality in the datasets

that included it (31 datasets). We selected satisfaction as our primary dependent measure because
it is the most common dependent measure used in relationship science—we have never
encountered a couples dataset that lacked it—and we selected commitment because it is
theoretically central to the field and nearly as pervasive (13).
The remaining self-report measures collected at baseline were used as predictors; the
specific predictors included varied from dataset to dataset. Baseline measures were categorized
into two groups of predictors: individual difference variables (judgments about the self, such as
traits and characteristics) and relationship-specific variables (judgments about the relationship or
the partner, and variables that are, by definition, identical for both couple members such as
relationship length). Although the major theories of relationships differ with respect to which
specific individual and relationship variables they emphasize, both classes of variables are
purported to make independent or interactive contributions in virtually all of them (e.g.,
attachment theory, interdependence theory, the interpersonal process model of intimacy,
relational regulation theory, risk regulation theory, the vulnerability-stress-adaptation model, see
15 for a review). Furthermore, two versions of each predictor were available in all datasets: an
actor-reported version (Amir’s individual/relationship variable used to predict Amir’s
satisfaction), and a partner-reported version (Amir’s partner Alex’s individual/relationship
variable used to predict Amir’s satisfaction). The distinction between actor and partner is also
central to relationship science (20), and their purported joint importance is often the raison d’être
of intensive dyadic data collection efforts.
Four relationship-specific variables—trust, intimacy, love, and passion—are often
conceptualized as predictors of relationship quality (21-23). But alternatively, they could be

conceptualized as indicators of relationship quality, as these four variables may tap relationship
quality approximately as well as satisfaction and commitment do (1). It is therefore possible that
retaining these measures as predictors artificially inflates the amount of variance that
relationship-specific variables can collectively explain. In the models presented below, we
removed the actor and partner versions of trust, intimacy, love, and passion as predictors (59
total variables across 21 of the datasets). A version of the analyses in which these predictors are
retained, consistent with our preregistered analysis plan, is also presented in the SI Appendix.
The initial categorization of variables into individual versus relationship variables was
made by the authors of each dataset. After all 43 datasets had been compiled, the first and second
author combined the predictors into a master list of individual versus relationship variables, and
re-categorized variables as necessary to ensure consistent categorization across datasets (see OSF
for procedural details). We next identified constructs that were measured multiple times across
datasets and grouped each one using a common code. For example, the item, “How old are you?”
from Dataset 1 and the item “Age in years” from Dataset 4 were each coded as “age.” This coded
master list of predictors was then used to compute the predictive success rate of each construct.
The final master list of predictors and the syntax used to compute success rates can be found at
https://osf.io/v5e34/.
Analysis Strategy, Part 1: Machine Learning
Each dataset was analyzed using Random Forests (24): a machine learning method
designed to handle many predictors at once while minimizing overfitting (i.e., fitting a model so
tightly to a particular dataset that it will not replicate in other datasets). The Random Forests
method builds on classification and regression trees (25). Specifically, using a random subset of

predictors and participants, the Random Forests method tests the strength of each available
predictor one at a time through a process called recursive partitioning. It builds a decision tree
out of the strongest available predictors and tests the tree’s overall predictive power on a subset
of data that were not used to construct the tree (also called the “out of bag” sample). The
Random Forests method does this repeatedly, separately bootstrapping thousands of decision
trees and then averaging them together. Results reveal how much variance in the dependent
measure was predictable and which predictors made the largest contributions to the model.
Random Forests are non-parametric—they do not impose a particular structure on the data—and
as such they are able to capture non-linear relationships, including interactions among the
predictors (26). For example, a model with actor- and partner-reported predictors would detect
any robust actor × partner interactions (e.g., moderation, attenuation effects, matching effects)
that could not be captured in a model featuring actor- or partner-reported predictors alone.
Each model was conducted using the “randomForest” package for R, with the same
tuning parameters that we have used in previous research (27). Specifically, we set “ntree” to
5000 for all analyses, meaning that each RF model was constructed from 5000 regression trees,
and we left “mtry”—the number of predictors available for splitting at each tree node—at its
default value of one third of the total number of predictors. Variable selection was conducted
using the interpretation step of the “VSURF” package for R, such that models were constructed
using only the predictors that meaningfully contributed to the model (i.e., the “interpretation”
step). Procedural details on how the VSURF R package selects predictors can be found in papers
published by Genuer and colleagues (28, 29). Each model revealed the total amount of variance
explained by the model, and the specific variables that emerged as predictors. We conducted 21

Random Forests models on each dataset with satisfaction as the dependent variable (DV; i.e.,
seven predicting baseline satisfaction, seven predicting follow-up satisfaction, and seven
predicting change in satisfaction). Similarly, we conducted 21 Random Forests models on each
dataset that contained commitment (i.e., our secondary DV), for a total of 42 Random Forests
models (maximum) per dataset. Results across the 43 datasets were then combined using random
effects meta-analysis. Results for each individual dataset can be found here: https://osf.io/4pbfh/.
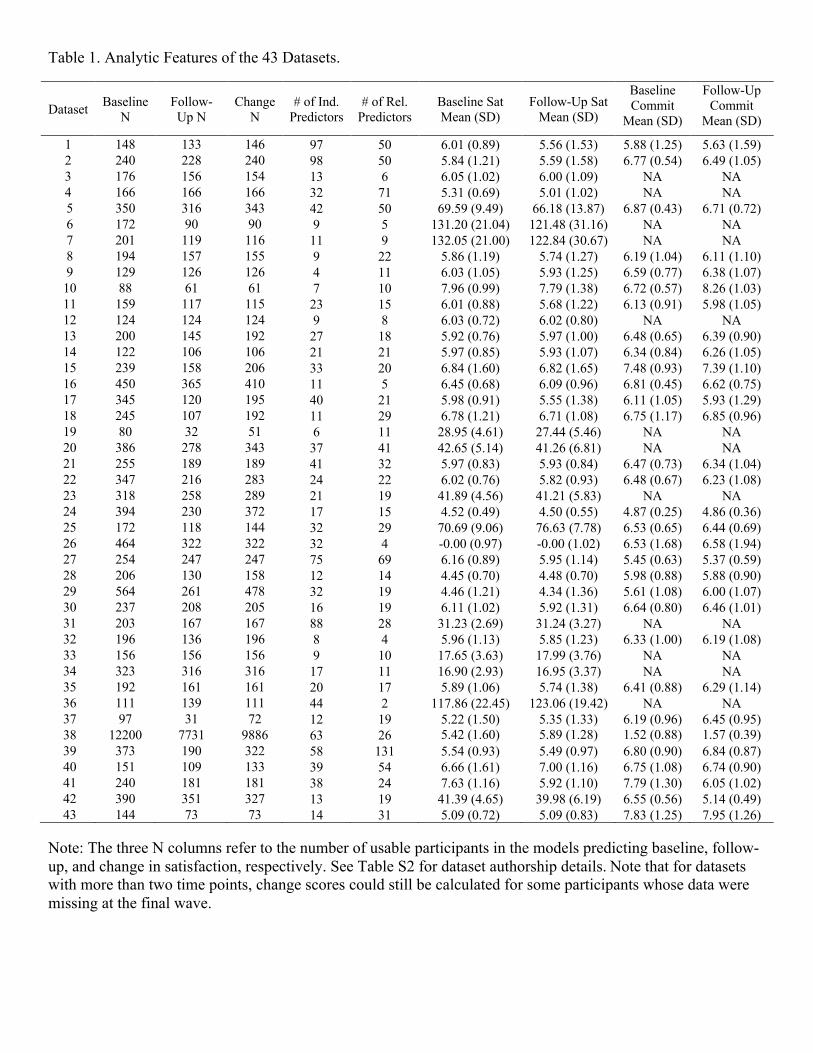
Table 1. Analytic Features of the 43 Datasets.
Dataset Baseline N
Follow-Up N
Change N
# of Ind. Predictors
# of Rel. Predictors
Baseline Sat Mean (SD)
Follow-Up Sat Mean (SD)
Baseline Commit
Mean (SD)
Follow-Up Commit
Mean (SD)
1 148 133 146 97 50 6.01 (0.89) 5.56 (1.53) 5.88 (1.25) 5.63 (1.59) 2 240 228 240 98 50 5.84 (1.21) 5.59 (1.58) 6.77 (0.54) 6.49 (1.05) 3 176 156 154 13 6 6.05 (1.02) 6.00 (1.09) NA NA 4 166 166 166 32 71 5.31 (0.69) 5.01 (1.02) NA NA 5 350 316 343 42 50 69.59 (9.49) 66.18 (13.87) 6.87 (0.43) 6.71 (0.72) 6 172 90 90 9 5 131.20 (21.04) 121.48 (31.16) NA NA 7 201 119 116 11 9 132.05 (21.00) 122.84 (30.67) NA NA 8 194 157 155 9 22 5.86 (1.19) 5.74 (1.27) 6.19 (1.04) 6.11 (1.10) 9 129 126 126 4 11 6.03 (1.05) 5.93 (1.25) 6.59 (0.77) 6.38 (1.07) 10 88 61 61 7 10 7.96 (0.99) 7.79 (1.38) 6.72 (0.57) 8.26 (1.03) 11 159 117 115 23 15 6.01 (0.88) 5.68 (1.22) 6.13 (0.91) 5.98 (1.05) 12 124 124 124 9 8 6.03 (0.72) 6.02 (0.80) NA NA 13 200 145 192 27 18 5.92 (0.76) 5.97 (1.00) 6.48 (0.65) 6.39 (0.90) 14 122 106 106 21 21 5.97 (0.85) 5.93 (1.07) 6.34 (0.84) 6.26 (1.05) 15 239 158 206 33 20 6.84 (1.60) 6.82 (1.65) 7.48 (0.93) 7.39 (1.10) 16 450 365 410 11 5 6.45 (0.68) 6.09 (0.96) 6.81 (0.45) 6.62 (0.75) 17 345 120 195 40 21 5.98 (0.91) 5.55 (1.38) 6.11 (1.05) 5.93 (1.29) 18 245 107 192 11 29 6.78 (1.21) 6.71 (1.08) 6.75 (1.17) 6.85 (0.96) 19 80 32 51 6 11 28.95 (4.61) 27.44 (5.46) NA NA 20 386 278 343 37 41 42.65 (5.14) 41.26 (6.81) NA NA 21 255 189 189 41 32 5.97 (0.83) 5.93 (0.84) 6.47 (0.73) 6.34 (1.04) 22 347 216 283 24 22 6.02 (0.76) 5.82 (0.93) 6.48 (0.67) 6.23 (1.08) 23 318 258 289 21 19 41.89 (4.56) 41.21 (5.83) NA NA 24 394 230 372 17 15 4.52 (0.49) 4.50 (0.55) 4.87 (0.25) 4.86 (0.36) 25 172 118 144 32 29 70.69 (9.06) 76.63 (7.78) 6.53 (0.65) 6.44 (0.69) 26 464 322 322 32 4 -0.00 (0.97) -0.00 (1.02) 6.53 (1.68) 6.58 (1.94) 27 254 247 247 75 69 6.16 (0.89) 5.95 (1.14) 5.45 (0.63) 5.37 (0.59) 28 206 130 158 12 14 4.45 (0.70) 4.48 (0.70) 5.98 (0.88) 5.88 (0.90) 29 564 261 478 32 19 4.46 (1.21) 4.34 (1.36) 5.61 (1.08) 6.00 (1.07) 30 237 208 205 16 19 6.11 (1.02) 5.92 (1.31) 6.64 (0.80) 6.46 (1.01) 31 203 167 167 88 28 31.23 (2.69) 31.24 (3.27) NA NA 32 196 136 196 8 4 5.96 (1.13) 5.85 (1.23) 6.33 (1.00) 6.19 (1.08) 33 156 156 156 9 10 17.65 (3.63) 17.99 (3.76) NA NA 34 323 316 316 17 11 16.90 (2.93) 16.95 (3.37) NA NA 35 192 161 161 20 17 5.89 (1.06) 5.74 (1.38) 6.41 (0.88) 6.29 (1.14) 36 111 139 111 44 2 117.86 (22.45) 123.06 (19.42) NA NA 37 97 31 72 12 19 5.22 (1.50) 5.35 (1.33) 6.19 (0.96) 6.45 (0.95) 38 12200 7731 9886 63 26 5.42 (1.60) 5.89 (1.28) 1.52 (0.88) 1.57 (0.39) 39 373 190 322 58 131 5.54 (0.93) 5.49 (0.97) 6.80 (0.90) 6.84 (0.87) 40 151 109 133 39 54 6.66 (1.61) 7.00 (1.16) 6.75 (1.08) 6.74 (0.90) 41 240 181 181 38 24 7.63 (1.16) 5.92 (1.10) 7.79 (1.30) 6.05 (1.02) 42 390 351 327 13 19 41.39 (4.65) 39.98 (6.19) 6.55 (0.56) 5.14 (0.49) 43 144 73 73 14 31 5.09 (0.72) 5.09 (0.83) 7.83 (1.25) 7.95 (1.26)
Note: The three N columns refer to the number of usable participants in the models predicting baseline, follow-up, and change in satisfaction, respectively. See Table S2 for dataset authorship details. Note that for datasets with more than two time points, change scores could still be calculated for some participants whose data were missing at the final wave.

Analysis Strategy, Part 2: Meta-Analysis
Each of the 42 models was examined as a separate random effects meta-analysis; the 21
satisfaction meta-analyses each contained k = 43 effect sizes, and the 21 commitment meta-
analyses each contained k = 31 effect sizes. We performed the basic analyses using
Comprehensive Meta-Analysis (30). To calculate each of the effect sizes, we transformed the “%
variance accounted for” outcome of the random forest model into effect size r (by taking the
square root); we then administered the Fisher zr transformation, and we used N-3 as the inverse
variance weight (31,32) where N equals the number of observations used in the random forests
analysis. We transformed the outcomes of the meta-analyses back to % variance accounted in the
Results section (by squaring the values). The meta-analytic data files for satisfaction and
commitment can be found at https://osf.io/v5e34/.
Moderation Analyses
We examined 12 possible meta-analytic moderators. Ten were features of the datasets:
study length, length between time points, number of time points, average relationship length of
the sample, average age of the sample, the year data collection began, country, publication status
(≥ 1 publication vs. unpublished), sample type (community vs. college student), and relationship
status (dating vs. married). We also examined two features that were specific to each meta-
analytic datum: number of predictors used in the Random Forests model and number of
predictors selected in the final model by VSURF. We used David Wilson’s SPSS macros
(http://mason.gmu.edu/~dwilsonb/ma.html) to perform the moderator analyses (i.e., ANOVA for
country, regression for the other 11 moderators).

Results
Primary Meta-Analytic Results
For baseline satisfaction, actor-reported individual variables (19%) were approximately
four times as powerful as partner-reported individual variables (5%), and combining actor and
partner individual variables (21%) added no predictive power beyond actor individual variables
alone (Fig. 2). Actor-reported relationship variables predicted baseline satisfaction quite
powerfully (45%)—much more so than partner-reported relationship variables (15%).
Combining actor- and partner-reported relationship variables (46%), and combining all
individual and relationship variables (44%) added no predictive power beyond actor-reported
relationship variables alone. In essence, these findings revealed that any variance in satisfaction
explained by information about actor-reported individual differences, partner-reported individual
differences, and partner-reported relationship-specific variables could be explained by
information about the actor’s relationship-specific variables.
When predicting follow-up satisfaction, the pattern of findings was similar, although not
surprisingly, all estimates were smaller. Analyses predicting change in satisfaction were
generally poor. No analyses accounted for more than 5% of the variance, and the confidence
intervals for all estimates overlapped substantially. Self-report variables may be ill-equipped to
reliably predict future changes in satisfaction, at least as operationalized here (typically over a
span of 1-2 years; see SI Appendix).
Results for commitment were generally smaller across models (the average estimate was
3% smaller), but the pattern of findings mirrored those of satisfaction (Fig. 3). Actor-reported
variables were at least twice as powerful as partner-reported variables, partner variables did not

contribute beyond actor variables alone, individual variables did not contribute beyond
relationship variables alone, and change in commitment was generally unpredictable.
Meta-Analytic Moderators
Each of the 12 moderators was examined across each of the 21 meta-analytic models for
satisfaction and the 21 meta-analytic models for commitment (12 × (21 + 21) = 504 total tests;
Table S6 and S7). We only interpret a moderator substantively if four or more of a set of 21 tests
achieved significance: The binomial probability of at least four out of 21 tests achieving
significance under the null is p = .019 (33).
Three of the 12 moderators exhibited meaningful effects. Effects were generally larger
for (a) baseline and follow-up satisfaction in datasets in which the couples were older, and (b)
baseline commitment in datasets that had smaller lags between time points. Also, individual
difference variables performed better for studies that were conducted relatively recently. None of
the moderators affected our (in)ability to reliably predict change in satisfaction or commitment.
See SI Appendix for details.

Fig. 2. Meta-analytic results predicting relationship satisfaction. [See uploaded pdf] Note: Meta-analytic effect sizes (and 95% CIs) from k = 43 datasets predicting satisfaction at baseline, at follow-up, and over time. The dependent measure is the percentage of variance accounted for in the random forests model that used the set of predictors indicated on the x-axis.

Fig. 3. Meta-analytic results predicting relationship commitment. [See uploaded pdf] Note: Meta-analytic effect sizes (and 95% CIs) from k = 31 datasets predicting commitment at baseline, at follow-up, and over time. The dependent measure is the percentage of variance accounted for in the random forests model that used the set of predictors indicated on the X-axis.

Predictor Restriction Effects
To what extent are the current results dependent on which variables are removed or
retained as predictors? In total, we conducted three versions of the current analyses: a version in
which no predictors were excluded except for satisfaction and commitment (“none”, i.e., our
preregistered analysis plan), a version in which trust, intimacy, love, and passion were removed
as potential predictors (“moderate”), and a version in which eight more variables were removed
as suggested by a reviewer (affection, appreciation, conflict, empathy, investment, perceived
partner responsiveness, sacrifice motives, and sexual satisfaction; “stringent”). The moderate
version is presented in the main text above, and the two alternative versions are presented in the
SI Appendix. The relative performance of all three analytic strategies is depicted in Fig. 4.
In this figure, the blue bars indicate the variance accounted for by actor-reported
relationship variables at baseline (left side) and follow-up (right side), averaged across the
satisfaction and commitment analyses. This figure addresses two key questions: Do models that
include partner- and actor-reported relationship variables explain more variance than actor-
reported relationship variables alone (stacked purple bars), and do models that include all actor-
and partner-reported individual difference and relationship variables explain more variance than
models including actor-reported relationship variables alone (stacked red bars)? The answer in
both cases is: not by much. The total amount of variance explained declines as more potential
predictors are excluded from the analyses. However, the individual difference and/or partner-
reported variables consistently explain only an additional 0.0-1.9% of the variance at baseline
and 0.9-3.5% of the variance at follow-up. In other words, regardless of which actor-reported
relationship variables are retained or removed, individual differences and partner-reports
collectively explain very little additional variance in relationship quality.

Finally, relationship quality change again proved difficult to predict. The ability to
predict change was similar regardless of whether the low (M = 2.4%), moderate (M ≤ 2.5%), or
severe (M = ≤ 2.2%) restriction strategy was implemented.
Fig. 4. Effects of predictor restriction on meta-analytic results.
[See uploaded pdf]
Note: Blue bars and upper 95% CIs indicate percentage of variance accounted for by actor-reported relationship variables alone. Purple bars indicate the additional percentage of variance explained by the addition of partner-reported relationship variables. Red bars indicate the additional percentage of variance explained by the addition of actor-reported individual differences, partner-reported individual differences, and partner-reported relationship variables. All analyses are averaged across commitment and satisfaction meta-analytic effect sizes.

Predictive Success of Specific Constructs
We also compiled and categorized the success of specific predictors. Constructs were
sorted according to their prediction success rates: the number of measures of the construct that
emerged as a contributing predictor for at least one of the three time-points (baseline, follow-up,
or change over time), divided by the number of measures of the construct that were tested. The
results for the most commonly measured constructs—those that were measured at least 10 times
across datasets—are presented in Tables 2 (relationship predictors) and 3 (individual predictors).
The most reliable (top 5) relationship variables were perceived partner commitment (e.g.,
“My partner wants our relationship to last forever”), appreciation (e.g., “I feel very lucky to have
my partner in my life”), sexual satisfaction (e.g., “How satisfied are you with the quality of your
sex life?”), perceived partner satisfaction (e.g., “Our relationship makes my partner very
happy”), and conflict (e.g., “How often do you have fights with your partner?"). Many of these
successful predictors have been emphasized by interdependence theory and related models (e.g.,
the interpersonal process model, 34; the investment model, 35; communal and exchange
perspectives, 36), although most theories are not specific enough to generate hypotheses about
which relationship variables should function as better predictors than others. Relatively objective
relationship variables (e.g., cohabiting status, dating versus married relationship status, having
children) generally mattered little, with the exception of relationship length. Finally, the
predictors trust, intimacy, love, and passion generally performed quite well in the SI Appendix
analyses that included them as predictors (see “greyed” rows in Table 2).
The most reliable individual difference variables were satisfaction with life (e.g., “The
conditions of my life are excellent”), negative affect (e.g., “distressed,” “irritable”), depression
(e.g., “feelings of hopelessness”), attachment anxiety (e.g., “I worry a lot about my relationships

with others”), and attachment avoidance (e.g., “I prefer not to be too close to romantic partners”).
Attachment theory (37) was well-supported in that its two central individual difference
constructs were the fourth- and fifth-most robust predictors. Variables from personality
psychology (agreeableness, conscientiousness) and clinical psychology (negative affect, positive
affect, depression, anxiety) also proved relevant; these results are consistent with a large body of
research on the strong, likely bidirectional connection between relationship quality and well-
being (38). Demographic variables, such as sex/gender, race/ethnicity, and education mattered
little.
Discussion
How predictable is relationship quality, and which variables predict it best? This project
aimed to answer these questions by applying machine learning techniques to 43 datasets
consisting of over ten thousand couples. Results revealed that variables capturing one’s own
perceptions of the relationship (e.g., conflict, affection) predicted up to 45% of the variance in
relationship quality at the beginning of each study and up to 18% of the variance in relationship
quality at the end of each study. Individual differences—variables capturing features of the self,
such as neuroticism, age, or gender—predicted a smaller but still meaningful amount of
variance: up to 21% at baseline and up to 12% at follow-up. Further, individual differences did
not predict relationship quality above relationship-specific predictors alone, partner-reports did
not predict relationship quality beyond actor-reports alone, and relationship-quality change was
largely unpredictable. That is, our results suggest that if Amir and Alex each complete many
questionnaires about themselves and their relationship, all of the predictable variance in their
relationship quality will be explained solely by their own perceptions of that relationship. Amir’s
reports about his own traits and other characteristics, Alex’s reports about her characteristics, and

Alex’s perceptions of the relationship will not explain any additional variance in Amir’s
relationship quality. Further, changes in Amir’s relationship quality over subsequent months or
years are unlikely to be predictable by any of these self-report measures.
Explaining the Relative Success of the Models
The finding that relationship-specific variables are more predictive of relationship
outcomes than individual difference variables is consistent with existing meta-analyses. In
reviews of marital (12) and dating relationships (13), relationship-specific variables are strong
predictors of divorce and non-marital breakups respectively, whereas individual difference
variables have lower predictive utility. However, meta-analyses are broadly limited to the effects
already published in existing literature and tend to reflect the publication biases of that literature
(see 39 for discussion). In particular, relationship variables may emerge as stronger predictors
than individual differences across published studies because some prominent relationship
theories (e.g., interdependence theory; 40) tend to emphasize dyadic and contextual features over
stable individual differences. This project addresses this limitation by conducting new, pre-
registered analyses on raw datasets, such that every measured variable had a similar chance to
contribute to the models.
Why did the addition of individual differences and partner reports to the models fail to
improve upon the predictive power of actor-reported relationship variables alone? Had these
variables functioned as robust and consistent moderators of actor relationship-specific variables
(e.g., individual-difference × relationship-specific variable interactions; actor × partner
interactions), the addition of individual differences and partner-reported variables to the random
forest models should have accounted for more variance (24). One possibility is that the actor-
reported relationship variables are redundant with each other (and with the

satisfaction/commitment dependent measures), and their collective inclusion leads to model
misspecification. This concern surely seems intuitive for scholars familiar with typical problems
caused by collinearity in multiple regression contexts, in which the simultaneous inclusion of
many correlated predictors causes estimates to become erratic. Critically, random forests models
are specifically designed to overcome this issue through recursive partitioning: the iterative
sampling of random sets of participants and predictors (24,25). In light of the way random
forests models work, then, it makes sense that our additional analyses that relaxed and restricted
the specific predictors available did not strongly affect these conclusions.
Another plausible, more theoretically interesting possibility is that individual differences
and partner reports exert their effects not via moderation but via mediation. That is, individual
differences and partner effects are important, but they exert their influence on relationship
quality indirectly, via interpersonal processes that are adequately captured by the actor-reported
relationship variables. The “all predictors” models do not predict more variance than the “actor-
reported relationship” models because actor-reported relationship variables fully mediate the
effects of the other predictors (Fig. 5). To better understand how individual differences might
shape relationship dynamics and in turn relationship quality, research is needed on the early
stages of relationships when these relationship-specific dynamics first emerge (41).

Fig 5. Mediational pathway implied by current findings.
[See uploaded pdf]
Note: This figure depicts the mediational model implied by the equivalent predictive power of the “all predictors” vs. “actor relationship” models in Fig. 2 and Fig. 3. That is, any effects of self-reported individual differences or partner-reported relationship variables on relationship quality are likely mediated by the actor-reported relationship variables. Individual-difference × relationship variable interactions and actor × partner interactions are not depicted because they are likely quite small. Other constructs in Fig. 1 (e.g., broader contextual forces) are not depicted because they were not examined in this study.
Also notable was the underperformance of the models predicting change in relationship
quality. In other words, any nascent signal of whether a relationship is going to become better or
worse over time does not seem to be detectable in self-reported variables at baseline. Surely,
change in relationship quality can be explained by baseline variables in conjunction with time-
varying predictors (e.g., stressful life events, the transition to parenthood; 42, 43). However,
models that attempt to account for future change entirely from contemporaneously assessed self-
report variables may not prove robust. These results are consistent with another recent large
collaboration showing that life trajectories are generally difficult to predict, even with complex
machine-learning methods (44).
Limitations and Future Directions
Why did demographic variables underperform as predictors of relationship quality? One
possibility is that, reflecting a common limitation of psychological samples more broadly (45),
the current samples may have been overly affluent, White, and college-educated, and were thus
too homogeneous to reveal the predictive power of variables such as ethnicity and education.
This possibility seems unlikely, however, because more than half of the couples tested (N =
6298) were recruited as part of the Supporting Healthy Marriages Project (Dataset 38), which
intentionally oversampled low-income couples. This sample varied considerably on ethnicity
(both spouses were White in 21% of couples), education (at least one partner had a college
degree in 27% of couples), and income (42% of couples reported income levels below the
poverty line). Yet, the pattern of results from this sample mirrored the results of the other 42
datasets; see SI Appendix Figure S3.
All of the current datasets were sampled from Western countries (the United States,
Canada, Switzerland, New Zealand, the Netherlands, and Israel). Future work should examine
whether the current effects generalize beyond the Western context. Our conclusions are also
specific to baseline self-report predictor variables; of the 1149 relationship-specific variables
tested in this project, 99.4% were explicit self-report rating scales (and similar numerical
response scales) rather than independent observations that directly captured participants’ real-
time behavior (i.e., variables directly assessing the interpersonal behavior arrow in Fig. 1).
Future work should explicitly solicit observational and other non-self-report data and compare
their predictive utility to self-reports. These results similarly do not apply to non-self-report
measures of contextual variables, such as income and debt (e.g., which could be measured
instead via tax returns), stress (e.g., diurnal cortisol patterns, neighborhood-level crime
statistics), or the role of social networks (e.g., informant reports). In this project, such variables
were measured with self-reports—for example, self-reported income, stress, or network
support—and were thus categorized as individual differences. However, drawing on evidence
that context can matter a great deal for relationship quality (11), another good future direction
would be to test contextual variables as their own category of predictors, ideally using non-self-
report measures. Finally, this collaboration included more datasets from the laboratories of
psychologists than sociologists, communications scholars, or family studies scholars; datasets in
these disciplines may commonly include variables that reveal different conclusions.
This study—which represents the largest and most integrative data analytic effort in the
study of romantic relationships—suggests the following four constraints on future theories and
models of relationship dynamics. First, constructs self-reported by the partner are unlikely to
predict the actor’s relationship quality beyond the actor’s own (contemporaneously assessed)
individual-difference and relationship-specific variables. Second, individual differences are
unlikely to predict relationship quality beyond (contemporaneously assessed) relationship-
specific variables. Third, change in relationship quality was not predictable from baseline self-
report measures, so change is likely a function of external context, behavioral processes, or other
factors that are themselves changing over time. Fourth, models should posit larger effect sizes for
the variables that fared well (vs. poorly) in Tables 2 and 3, regardless of whether those models
emphasize main effects or interactions. Of course, the occasional study may report findings that
run contrary to these constraints. Our collaborative effort does not necessarily overturn such
findings, but rather suggests that scholars may want to raise the standard for attaining high
confidence in them (e.g., await the independent replication of the finding in datasets that are
notably distinct from those we meta-analyze here).
Conclusion
From a public interest standpoint, this study provides provisional answers to the perennial
question “What predicts how satisfied and committed I will be with my relationship partner?”
Experiencing negative affect, depression, or insecure attachment are surely relationship risk
factors. But if people nevertheless manage to establish a relationship characterized by
appreciation, sexual satisfaction, and a lack of conflict—and they perceive their partner to be
committed and responsive—those individual risk factors may matter little. That is, relationship
quality is predictable from a variety of constructs, but some matter more than others—and the
most proximal predictors are features that characterize a person’s perception of the relationship
itself.

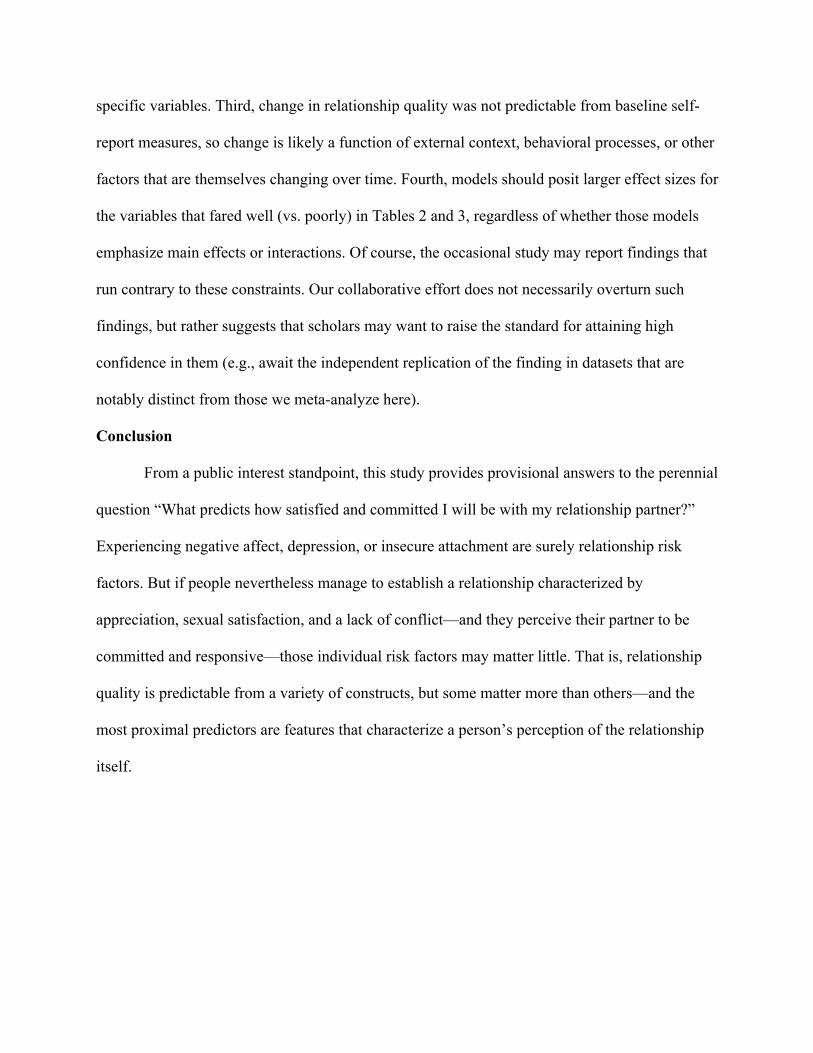
Table 2. Success rates of the most commonly measured relationship-specific constructs across datasets.
Construct
Number of Predictors Tested
% of Actor Versions Successful
% of Partner Versions Successful
Overall Success
Rate
Predicting Satisfaction
Predicting Commitment
Predicting Satisfaction
Predicting Commitment
Predicting Satisfaction
Predicting Commitment
perceived partner commitment 10 10 90% 70% 100% 80% 85%
intimacy 12 9 92% 92% 67% 67% 81%
appreciation 10 10 90% 80% 60% 60% 72%
love 17 17 88% 53% 76% 65% 71%
sexual satisfaction 20 13 90% 75% 54% 54% 71%
perceived partner satisfaction 11 9 91% 64% 78% 44% 70%
conflict 29 28 90% 79% 57% 50% 69%
perceived partner responsiveness 14 13 93% 57% 69% 54% 69%
trust 15 15 87% 60% 73% 53% 68%
investment 13 13 77% 62% 92% 38% 67%
support general 12 9 67% 42% 89% 67% 64%
capitalization 16 10 81% 62% 40% 30% 58%
normative attachment 13 13 69% 38% 69% 54% 58%
relationship length 54 41 59% 67% 44% 56% 57%
passion 14 13 64% 50% 54% 46% 54%
alternatives 12 12 58% 33% 67% 50% 52%
sexual frequency 11 8 73% 36% 25% 50% 47%
IOS 24 23 54% 33% 65% 35% 47%
affection 10 7 50% 50% 29% 43% 44%
empathy 11 11 45% 36% 45% 45% 43%
IPV 26 17 27% 62% 47% 35% 43%
conflict strategies 23 15 52% 30% 27% 27% 36%
power 13 13 31% 31% 31% 23% 29%
relationship status 27 21 26% 22% 38% 29% 28%
cohabiting 15 14 27% 20% 29% 36% 28%
sacrifice motives 22 22 18% 18% 14% 14% 16%
children 32 23 16% 6% 4% 13% 10%
Note: Success rate %s can be interpreted as the strength of the variable relative to the other variables of this class, but it does not have any independent meaning or effect size. Random forests do not specify the size or direction of the effect; only that the variable meaningfully contributes to the total variance explained in a given model. Some studies included multiple measures of the same construct, and thus the number of predictors tested can be higher than the total number of datasets. Greyed rows correspond to four constructs excluded from the primary models reported in the main text, because they are debatably indicators (not predictors) of relationship quality (1). The values for these four constructs derive from alternative models reported in the SI Appendix.

Table 3. Success rates of the most commonly measured individual difference constructs across datasets.
Construct
Number of Predictors Tested
% of Actor Versions Successful
% of Partner Versions Successful Overall
Success Rate Predicting
Satisfaction Predicting
Commitment Predicting
Satisfaction Predicting
Commitment Predicting
Satisfaction Predicting
Commitment
satisfaction with life 12 12 100% 83% 92% 75% 88%
depression 28 18 82% 68% 72% 72% 74%
negative affect 10 3 90% 70% 33% 67% 73%
anxious attachment 38 29 71% 74% 62% 76% 71%
avoidant attachment 34 25 71% 65% 80% 68% 70%
age 37 25 59% 70% 72% 72% 68%
anxiety 11 8 73% 82% 50% 50% 66%
self-esteem 16 15 56% 50% 67% 60% 58%
agreeableness 20 18 50% 60% 50% 56% 54%
positive affect 17 10 53% 59% 40% 60% 54%
psychological well-being 19 9 53% 53% 44% 44% 50%
religiosity 16 16 38% 44% 69% 44% 48%
stress 34 27 38% 50% 59% 41% 47%
conscientiousness 19 17 47% 26% 53% 47% 43%
income 26 21 46% 50% 43% 29% 43%
neuroticism 20 18 65% 40% 33% 22% 41%
openness 20 18 20% 40% 44% 44% 37%
relationship beliefs 19 19 37% 32% 53% 26% 37%
empathy 18 13 28% 22% 46% 38% 32%
sexism 21 21 38% 24% 29% 38% 32%
health 30 24 40% 27% 29% 29% 31%
extraversion 20 18 40% 30% 28% 11% 28%
alcohol use 17 14 18% 24% 43% 29% 27%
family history 12 12 17% 25% 42% 17% 25%

political orientation 10 10 20% 20% 30% 30% 25%
education 36 24 22% 19% 29% 25% 23%
employed 18 16 33% 17% 12% 25% 22%
aggression 13 13 15% 38% 0% 31% 21%
race/ethnicity 54 46 20% 22% 15% 17% 19%
gender 31 25 13% 16% 24% 20% 18%
own traits 35 35 9% 20% 23% 17% 17%
religious affiliation 15 14 20% 20% 14% 7% 16%
parents' relationship 13 13 8% 15% 31% 0% 13%
ideal standards 39 39 10% 3% 18% 8% 10%
Note: See Table 1 note.
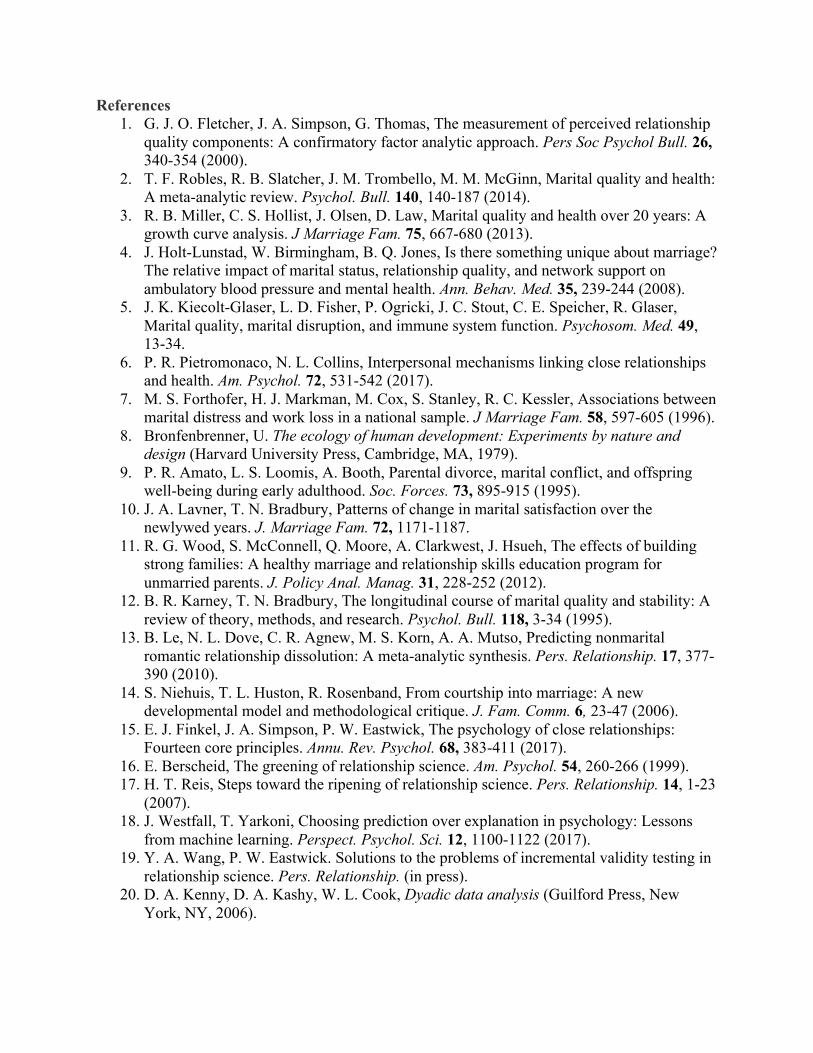
References 1. G. J. O. Fletcher, J. A. Simpson, G. Thomas, The measurement of perceived relationship
quality components: A confirmatory factor analytic approach. Pers Soc Psychol Bull. 26, 340-354 (2000).
2. T. F. Robles, R. B. Slatcher, J. M. Trombello, M. M. McGinn, Marital quality and health: A meta-analytic review. Psychol. Bull. 140, 140-187 (2014).
3. R. B. Miller, C. S. Hollist, J. Olsen, D. Law, Marital quality and health over 20 years: A growth curve analysis. J Marriage Fam. 75, 667-680 (2013).
4. J. Holt-Lunstad, W. Birmingham, B. Q. Jones, Is there something unique about marriage? The relative impact of marital status, relationship quality, and network support on ambulatory blood pressure and mental health. Ann. Behav. Med. 35, 239-244 (2008).
5. J. K. Kiecolt-Glaser, L. D. Fisher, P. Ogricki, J. C. Stout, C. E. Speicher, R. Glaser, Marital quality, marital disruption, and immune system function. Psychosom. Med. 49, 13-34.
6. P. R. Pietromonaco, N. L. Collins, Interpersonal mechanisms linking close relationships and health. Am. Psychol. 72, 531-542 (2017).
7. M. S. Forthofer, H. J. Markman, M. Cox, S. Stanley, R. C. Kessler, Associations between marital distress and work loss in a national sample. J Marriage Fam. 58, 597-605 (1996).
8. Bronfenbrenner, U. The ecology of human development: Experiments by nature and design (Harvard University Press, Cambridge, MA, 1979).
9. P. R. Amato, L. S. Loomis, A. Booth, Parental divorce, marital conflict, and offspring well-being during early adulthood. Soc. Forces. 73, 895-915 (1995).
10. J. A. Lavner, T. N. Bradbury, Patterns of change in marital satisfaction over the newlywed years. J. Marriage Fam. 72, 1171-1187.
11. R. G. Wood, S. McConnell, Q. Moore, A. Clarkwest, J. Hsueh, The effects of building strong families: A healthy marriage and relationship skills education program for unmarried parents. J. Policy Anal. Manag. 31, 228-252 (2012).
12. B. R. Karney, T. N. Bradbury, The longitudinal course of marital quality and stability: A review of theory, methods, and research. Psychol. Bull. 118, 3-34 (1995).
13. B. Le, N. L. Dove, C. R. Agnew, M. S. Korn, A. A. Mutso, Predicting nonmarital romantic relationship dissolution: A meta-analytic synthesis. Pers. Relationship. 17, 377-390 (2010).
14. S. Niehuis, T. L. Huston, R. Rosenband, From courtship into marriage: A new developmental model and methodological critique. J. Fam. Comm. 6, 23-47 (2006).
15. E. J. Finkel, J. A. Simpson, P. W. Eastwick, The psychology of close relationships: Fourteen core principles. Annu. Rev. Psychol. 68, 383-411 (2017).
16. E. Berscheid, The greening of relationship science. Am. Psychol. 54, 260-266 (1999). 17. H. T. Reis, Steps toward the ripening of relationship science. Pers. Relationship. 14, 1-23
(2007). 18. J. Westfall, T. Yarkoni, Choosing prediction over explanation in psychology: Lessons
from machine learning. Perspect. Psychol. Sci. 12, 1100-1122 (2017). 19. Y. A. Wang, P. W. Eastwick. Solutions to the problems of incremental validity testing in
relationship science. Pers. Relationship. (in press). 20. D. A. Kenny, D. A. Kashy, W. L. Cook, Dyadic data analysis (Guilford Press, New
York, NY, 2006).

21. L. Campbell, J. A. Simpson, J. G. Boldry, H. Rubin, Trust, variability in relationship evaluations, and relationship processes. J. Pers. Soc. Psychol. 99, 14-31 (2010).
22. S. Sprecher, S. Metts, B. Burleson, E. Hatfield, A. Thompson, Domains of expressive interaction in intimate relationships: Associations with satisfaction and commitment. Fam. Relations. 44, 203-210 (1995).
23. B. S. Meeks, S. S. Hendrick, C. Hendrick. Communication, love, and relationship satisfaction. J. Soc. Pers. Relationships. 15, 755-773 (1998).
24. L. Breiman. Random forests. Mach. Learn. 45, 5-32 (2001). 25. R. Berk. An introduction to statistical learning from a regression perspective. (Springer,
New York NY, 2008). 26. B. A. McKinney, D. M. Reif, M. D. Ritchie, J. H. Moore, Machine learning for detecting
gene-gene interactions, Appl. Bioinformatics. 5, 77-88 (2006). 27. S. Joel, P. E. Eastwick, E. J. Finkel, Is romantic desire predictable? Machine learning
applied to initial romantic attraction. Psychol. Sci. 28, 1478-1489 (2017). 28. R. Genuer, J. M. Poggi, C. Tuleau-Malot. Variable selection using random forests.
Pattern Recogn. Lett. 31, 2225-2236 (2010). 29. R. Genuer, J. M. Poggi, C. Tuleau-Malot. VSURF: An R package for variable selection
using random forests. R J. 7, 19-33 (2015). 30. M. Borenstein, L. V. Hedges, J. P. Higgins, H. R. Rothstein, Introduction to meta-
analysis (John Wiley & Sons, New Jersey, NY, 2011). 31. L. V. Hedges, I. Olkin, Statistical methods for meta-analysis (Academic press, Orlando,
Fl, 1985). 32. M. W. Lipsey, D. B. Wilson, Practical meta-analysis (Sage Publications, Washington
DC, 2001). 33. A. J. Bahns, C. S. Crandall, O. Gillath, K. J. Preacher, Similarity in relationships as niche
construction: Choice, stability, and influence within dyads in a free choice environment. J. Pers. Soc. Psychol. 112, 329-355 (2017).
34. J. P. Laurenceau, L. F. Barrett, M. J. Rovine, The interpersonal process model of intimacy in marriage: A daily-diary and multilevel modeling approach. J. Fam. Psychol. 19, 314-323 (2005).
35. C. E. Rusbult, Commitment and satisfaction in romantic associations: A test of the investment model. J. Exp. Social. Psychol. 16, 172-186 (1980).
36. M. S. Clark, J. Mills, Interpersonal attraction in exchange and communal relationships. J. Pers. Soc. Psychol. 37, 12-24 (1979).
37. C. Hazan, P. Shaver, Romantic love conceptualized as an attachment process. J. Pers. Soc. Psychol. 52, 511-524 (1987).
38. C. M. Proulx, H. M. Helms, C. Buehler, Marital quality and personal well-being: A meta-analysis. J. Marriage Fam. 69, 576-593 (2007).
39. E. C. Carter, F. D. Schönbrodt, W. M. Gervais, J. Hilgard, Correcting for Bias in Psychology: A Comparison of Meta-Analytic Methods. Adv. Methods Pract. Psychol. Sci. 2 (2019).
40. C. E. Rusbult, P. A. M. Van Lange, Why we need interdependence theory. Soc. Personal. Psychol. Compass. 2, 2049-2070 (2008).
41. S. Joel, P. W. Eastwick, Intervening earlier: An upstream approach to improving relationship quality. Policy Insights Behav. Brain Sci. 5, 25-32 (2018).

42. C. L. Cohan, T. N. Bradbury, Negative life events, marital interaction, and the longitudinal course of newlywed marriage. J. Pers. Soc. Psychol. 73, 114-128 (1997).
43. E. Lawrence, A. D. Rothman, R. J. Cobb, M. T. Rothman, T. N. Bradbury, Marital satisfaction across the transition to parenthood. J. Fam. Psychol. 22, 41-50 (2008).
44. M. J. Salganik, I. Lundberg, A. T. Kindel, C. E. Ahearn, K. Al-Ghoneim, A. Almaatouq, D. M. Altschul, J. E. Brand, N. B. Carnegie, R. J. Compton, D. Datta, T. Davidson, A. Filippova, C. Gilroy, B. J. Goode, E. Jahani, R. Kashyap, A. Kirchner, S. McKay, A. C. Morgan, A. Pentland, K. Polimis, L. Raes, D. E. Rigobon, C. V. Roberts, D. M. Stanescu, Y. Suhara, A. Usmani, E. H. Wang, M. Adem, A. Alhajri, B. AlShebli, R. Amin, R. B. Amos, L. P. Argyle, L. Baer-Bositis, M. Büchi, B. Chung, W. Eggert, G. Faletto, Z. Fan, J. Freese, T. Gadgil, J. Gagné, Y. Gao, A. Halpern-Manners, S.P. Hashim, S. Hausen, G. He, K. Higuera, B. Hogan, I. M. Horwitz, L. M. Hummel, N. Jain, K. Jin, D. Jurgens, P. Kaminski, A. Karapetyan, E. H. Kim, B. Leizman, N. Liu, M. Möser, A. E. Mack, M. Mahajan, N. Mandell, H. Marahrens, D. Mercado-Garcia, V. Mocz, K. Mueller-Gastell, A. Musse, Q. Niu, W. Nowak, H. Omidvar, A. Or, K. Ouyang, K. M. Pinto, E. Porter, K. E. Porter, C. Qian, T. Rauf, A. Sargsyan, T. Schaffner, L. Schnabel, B. Schonfeld, B. Sender, J. D. Tang, E. Tsurkov, A. van Loon, O. Varol, X. Wang, Z. Wang, J. Wang, F. Wang, S. Weissman, K. Whitaker, M. K. Wolters, W. L. Woon, J. Wu, C. Wu, K. Yang, J. Yin, B. Zhao, C. Zhu, J. Brooks-Gunn, B. E. Engelhardt, M. Hardt, D. Knox, K. Levy, A. Narayanan, B. M. Stewart, D. J. Watts, S. McLanahan. Measuring the predictability of life outcomes with a scientific mass collaboration. Proc. Natl. Acad. Sci.
45. J. Henrich, S. J. Heine, A. Norenzayan, Most people are not WEIRD. Nature, 466, 29 (2010).

Acknowledgments: Individual datasets were supported by many separate funding sources listed in the SI Appendix. The work of aggregating the datasets was supported by a Social Sciences and Humanities Research Council of Canada Insight Grant awarded to Joel (#435-2019-0115).