A prokaryotic acyl-CoA reductase performing reduction of fatty acyl-CoA to fatty alcohol
Upload
independentCategory
view
1download
0
Mechanisms of Fatty Acid-induced Inhibition of Glucose UptakeGuenther Boden,* Xinhua Chen,* Jose Ruiz,* John V. White,t and Luciano Rossetti*Division ofEndocrinology/Metabolism, tDepartment ofSurgery, and the General Clinical Research Center, Temple University SchoolofMedicine, Philadelphia, Pennsylvania 19140; and ODivision ofEndocrinology/Metabolism, Albert Einstein College ofMedicine,Bronx, New York 10461
Abstract
Increased plasma FFA reduce insulin-stimulated glucose up-take. The mechanisms responsible for this inhibition, however,remain uncertain. It was the aim of this study to determinewhether the FFA effect was dose dependent and to investigateits mechanism. We have examined in healthy volunteers (13male/1 female) the effects of three steady state plasma FFAlevels (- 50, - 550, - 750 MuM) on rates of glucose uptake,glycolysis (both with 3-3H-glucose), glycogen synthesis (de-termined with two independent methods), carbohydrate(CHO) oxidation (by indirect calorimetry), hepatic glucoseoutput, and nonoxidative glycolysis (glycolysis minus CHO ox-idation) during euglycemic-hyperinsulinemic clamping. In-creasing FFA concentration (from - 50 to - 750 gM) de-creased glucose uptake in a dose-dependent fashion (from - 9to - 4 mg/kg per min). The decrease was caused mainly(- 2/3) by a reduction in glycogen synthesis and to a lesserextent ( 1/3) by a reduction in CHO oxidation. We have iden-tified two independent defects in glycogen synthesis. The firstconsisted of an impairment of muscle glycogen synthase activ-ity. It required high FFA concentration ( - 750MM), was asso-ciated with an increase in glucose-6-phosphate, and developedafter 4-6 h of fat infusion. The second defect, which precededthe glycogen synthase defect, was seen at medium ( - 550MM)FFA concentration, was associated with a decrease in muscleglucose-6-phosphate concentration, and was probably due to areduction in glucose transport/phosphorylation. In addition,FFA and/or glycerol increased insulin-suppressed hepatic glu-cose output by - 50%. We concluded that fatty acids caused adose-dependent inhibition of insulin-stimulated glucose uptake(by decreasing glycogen synthesis and CHO oxidation) andthat FFA and/or glycerol increased insulin-suppressed hepaticglucose output and thus caused insulin resistance at the periph-eral and the hepatic level. (J. Clin. Invest. 1994. 93:2438-2446.) Key words: glycogen synthesis * glycolysis - carbohy-drate oxidation * glycogen synthase * glycogen phosphorylase
Introduction
Inability of insulin to appropriately promote glucose uptake inskeletal muscle (insulin resistance) has been recognized as an
Address correspondence to Guenther Boden, M.D., Temple UniversityHospital, 3401 North Broad Street, Philadelphia, PA 19140.
Receivedfor publication 19 November 1993 and in revisedform 7February 1994.
early and prevalent abnormality in non-insulin-dependentdiabetes mellitus (NIDDM)l (for review see reference 1).While its cause remains uncertain, insulin resistance is knownto be commonly associated with an inability of insulin to nor-mally promote nonoxidative glucose disposal (glucose storage)and to activate skeletal muscle glycogen synthase (GS) (2-9).There is evidence to suggest that in many instances the defectsin glucose uptake and storage may be related to abnormal fatmetabolism (10, 11). First, most patients with NIDDM areobese and have elevated blood FFA concentrations (12),which have been shown to inhibit insulin-stimulated glucoseuptake ( 13-17). The issue of whether or not FFA inhibit glu-cose uptake has remained somewhat controversial since someinvestigators have failed to find such an effect (18, 19). Wehave demonstrated recently, however, that the fatty acid-me-diated inhibition of insulin-stimulated glucose uptake only de-veloped after 3-4 h of fat infusion ( 15 ). It is therefore likelythat insufficient length of fat infusion was the reason why theinhibitory effect of FFA on glucose uptake was not found insome studies. Second, Gulli et al. (20) have recently shown inoffspring of parents with NIDDM, known to be at high risk todevelop the disease (7, 8), that impaired insulin-stimulatedglucose uptake and storage were associated with elevated fattyacid levels and oxidation. Third, fat infusion has recently beenshown to be associated with suppression of insulin-stimulatedskeletal muscle GS activity ( 15, 16). It was not clear from thesestudies, however, whether the observed GS defect was responsi-ble for the inhibition ofglucose uptake. GS activities were mea-sured only before and after but not during fat infusions; thus, itremained unknown whether the GS defect preceded, coincidedwith, or followed the inhibition in glucose uptake. Moreover,glycogen synthesis, which does not always correlate with GSactivity (21 ), was not measured. The aim of this study wastherefore to determine whether the fatty acid effects were dosedependent and to elucidate their mechanisms by examiningFFA actions on all major pathways of intracellular glucose uti-lization. To this end, we have examined effects of three steadystate fatty acid levels (- 50, 550, - 750 uM) on rates ofglucose uptake, glycolysis, glycogen synthesis, carbohydrate(CHO) oxidation, nonoxidative glycolysis (lactate/alaninefluxes), and on hepatic glucose output (HGO) in healthy vol-unteers during euglycemic hyperinsulinemia.
Methods
Subjects14 healthy, normal weight volunteers (13 men and 1 woman) werestudied. We were unable to recruit more women, largely because ofthe
1. Abbreviations used in this paper: CHO, carbohydrate; FFM, fat freemass; G-6-P, glucose-6-phosphate; GRd, glucose rate ofdisappearance;GS, glycogen synthase; HGO, hepatic glucose output; NIDDM, non-insulin-dependent diabetes mellitus; npRQ, nonprotein respiratoryquotient; PDH, pyruvate dehydrogenase; UDPG, uridine-diphos-phate-glucose.
2438 Boden, Chen, Ruiz, White, and Rossetti
J. Clin. Invest.© The American Society for Clinical Investigation, Inc.0021-9738/94/06/2438/09 $2.00Volume 93, June 1994, 2438-2446

need for four open muscle biopsies. The subjects' ages, weights, heights,and body compositions are shown in Table I. None ofthe subjects hada family history ofdiabetes or any other endocrine disorders, and nonewere taking any medications. Their weights were stable for at least 2mo, their diets contained a minimum of250 g/d ofcarbohydrate for atleast 2 d before the studies. Informed written consent was obtainedfrom all after explanation ofthe nature, purpose, and potential risks ofthese studies. The study protocol was approved by the InstitutionalReview Board ofTemple University Hospital. All subjects were admit-ted to Temple University Hospital's General Clinical Research Centeron the evening before the studies. The studies began at - 8 a.m. afteran overnight fast with the subjects reclining in bed. A short polyethyl-ene catheter was inserted into an antecubital vein for infusion of testsubstances. Another catheter was placed into a contralateral forearmvein for blood sampling. This arm was wrapped with a heating blanket(- 700C) to arterialize venous blood. We have shown in preliminaryexperiments that this results in near identical arterial and venous fore-arm blood glucose concentrations (Boden, G., unpublished observa-tions).
Experimental designStudy I (highfatty acids). Four subjects were studied in this protocol.3-3H-glucose was infused intravenously for 7.5 h (-90 to 360 min)starting with a bolus of 40 1Ci over 1 min, followed by a continuousinfusion of0.4 ,Ci/min. At 0 min, LIPOSYN II (Abbott Laboratories,North Chicago, IL) a 20% triglyceride emulsion (10% safflower, 10%soy bean oil) plus heparin (0.4 U/kg per min) were infused at a rate of1.5 ml/min for 6 h. Regular human insulin (Humulin R; Eli Lilly &Co., Indianapolis, IN) was infused intravenously at a rate of 1 mU/kgper min for 6 h starting at 0 min. Glucose concentrations were clampedat - 85 mg/dl by a feedback-controlled glucose infusion. The firstmuscle biopsy was performed before the start ofthe infusions (between-90 and 0 min), and the other three biopsies were performed at 120,240, and 360 min, respectively.
Study 2 (medium fatty acids). Four subjects were studied in thisprotocol, which was identical to study 1 except that LIPOSYN II wasinfused without heparin.
Study 3 (lowfatty acids). Six subjects were studied. All six receivedinsulin and glucose as in studies 1 and 2. Three received, in addition,glycerol (0.7±0.05 mg/kg per min) plus heparin (0.4 U/kg per min) tosimulate glycerol and heparin infusions in study 1 (LIPOSYN II con-tains 2.14 g glycerol/ 100 ml as emulsifier). The additional infusion ofglycerol and heparin had no effect on any of the metabolic parametersmeasured including serum concentrations of glucose, insulin, and glu-cagon and rates ofglucose appearance, oxidation, glycolysis, and glyco-gen synthesis. The data from the studies with and without glycerol plusheparin were therefore combined.
Glucose turnoverGlucose turnover was determined with 3- 3H-glucose. The tracer infu-sion was started 90 min before initiation of the clamp to assure isotopeequilibration. Glucose was isolated from blood for determination of3-3H-glucose specific activity as described (22). Changes in specificactivity during hyperinsulinemia were avoided by adding 3-3H-glucoseto the unlabeled glucose, which was infused at variable rates to main-
Table L. Characteristics ofStudy Subjects
Study 1 Study 2 Study 3(high fatty acids) (medium fatty acids) (low fatty acids)
Sex (MIF) 4/0 4/0 5/1Age (yr) 24.2±2.8 31.0±3.0 26.5±2.0Height (cm) 182.9±2.9 177.2±3.6 173.0±3.5Weight (kg) 83.3±8.2 82.9±4.6 68.5±3.6FFM (kg) 70.8±8.1 70.3±3.9 60.3±3.6
tain euglycemia (23). Rates oftotal body glucose appearance and disap-pearance (GRd) were calculated using Steele's equation for steady stateconditions (24). As seen in Fig. 1, serum 3-3H-glucose specific activi-ties were at steady state for all three groups and for the entire length ofthe studies except for minor changes during the initial 90 min.
GlycolyticfluxGlycolytic flux was determined according to Rossetti and Giaccari withminor modifications (25). Tritium in the 3-carbon position ofglucoseis lost into water during glycolysis. Recently, we have validated theassumption that the rate ofplasma tritiated water formation reflects theintracellular detritiation of 3-3H-glucose (26). The rate of glycolysiswas obtained by dividing the whole body 3H20 production rate by thespecific activity of its precursor, i.e., plasma 3-3H-glucose. To calculatethe 3H20 production rate, the time course of the plasma 3H20 concen-tration was plotted vs time, and the slope of the linear regression wasestimated by the least square method. The whole body production ratewas obtained by multiplying this value with the body water volumemeasured in each study subject. Total body water occupies - 73% offat free mass (FFM) (26). The latter was determined by underwaterweighing (27).
Glycogen synthesisGlycogen synthesis was quantitated by two independent methods.First, because net glycogen synthesis is the portion of glucose flux notentering glycolysis, whole body glycogen synthesis rates were obtainedby subtracting rates of glycolysis from rates of glucose uptake (GRd).We have documented the validity of this noninvasive approach bydemonstrating in healthy humans that results obtained with thismethod were comparable with rates of glycogen synthesis determinedby incorporation of tritium from 3-3H-glucose into muscle glycogen.Second, rates of glycogen formation were calculated on the basis of invitro muscle GS activity determined with actually measured muscleconcentrations of glucose-6-phosphate (G-6-P) and uridine-diphos-phate-glucose (UDPG) (26). Glycogen synthesis per unit muscle wasextrapolated to whole body glycogen synthesis, assuming that 52% ofFFM was muscle (26).
CHO and lipid oxidationCHO and lipid oxidation were determined by indirect calorimetry asdescribed (28) with a metabolic measurement cart (Beckman Instru-ments, Inc., Palo Alto, CA). Rates of protein oxidation were estimatedfrom urinary N excretion after correction for changes in urea N poolsize (29). Rates of protein oxidation were used to determine the non-protein respiratory quotient (npRQ). It was assumed that for eachgram ofN excreted in the urine, 6.02 liters of02 were consumed, and
1.0 r
0U 8Q) 43.
Ln6'aI 3
0.8
0.6k i7 AfiiN0_2i.80.4 [
0.2 V0
0 60 120 180 240 300 360
Minutes
Figure 1. 3H-Glucose specific activities. 3-3H-glucose specific activi-ties during euglycemic-hyperinsulinemic clamping at high (open tri-angles, n = 4), medium (open circles, n = 4), and low FFA concen-trations (filled circles, n = 6). Shown are mean±SE.
Mechanisms ofFFA-induced Inhibition ofGlucose Uptake 2439
4.75 liters of CO2 were produced (RQ = 0.79). Rates ofCHO and fatoxidation were determined with the npRQ tables of Lusk, which arebased on an npRQ of 0.707 for 100% fat oxidation and 1.00 for 100%CHO oxidation.
Muscle biopsies and extractionsBiopsies were obtained from the lateral aspect of the vastus lateralismuscle - 15 cm above the patella from all subjects as described ( 15).The excised muscle sample ( 150 mg) was dropped immediately intoisopentane, kept at its freezing point (- 160'C) by liquid nitrogen. Thefrozen muscle was stored at -80'C until it was aliquoted for measure-ment of GS, G-6-P/UDPG, and glycogen phosphorylase.
Metabolite assaysMuscle UDPG concentration was measured after two sequential chro-matographic and HPLC separations and ultraviolet detection, as re-ported previously (26). Briefly, the first is performed on a solid-phase,strong anion exchange cartridge, with the use of phosphate buffers ofincreasing molarity. This first purification allows one to partially sepa-rate the compound of interest from all nonpolar and most ofthe polarintracellular substrates with optimal recoveries. The second step is areversed-phase, ion-pairing HPLC isocratic method on a C18T column(Supelco, Inc., Bellefonte, PA). Muscle G-6-P concentrations weremeasured spectrophotometrically as described by Michal (30).
GS assayMuscle GS activity was measured by a modification (31, 32) of themethod ofThomas et al. (33) and is based on the measurement oftheincorporation of radioactivity into glycogen from UDP-[U-14C1-glucose. Tissue samples (7-12 mg) were homogenized in 1.0 ml ofTris-HCl buffer, pH 7.8, containing 10 mM EDTA, 5 mM DTT, 50mM NaF, and 2.5 g/liter rabbit liver glycogen type III. The homoge-nate was centrifuged at 2,000 g for 15 min (at 4°C), and the superna-tant was used for the GS assay by measuring the incorporation ofUDP-[U-14C]glucose into glycogen at 37°C. For the kinetic analysis, theassay was conducted at final concentrations of 0.005, 0.025, 0.050,0.125,0.50, and 2.0mM UDPG and 0,0.11,0.22, and 7.2 mM G-6-P;the data were linearized as Eadie-Hofstee plots and fit using linearregression. The Km forUDPG is the reciprocal ofthe slope, whereas theV. is the y-intercept divided by the slope.
GS activity was calculated as micromoles ofUDPG incorporatedinto glycogen per minute per milligram ofprotein and was expressed asKm, the concentration ofUDPG at which GS activity was half maxi-mal, as V,.,, or as the fractional velocity ofGS activity, i.e., the activityofGS at 0.1 mM G-6-P divided by the activity at 7.2mM G-6-P. This isan indicator of the active form of GS and believed to be a sensitiveparameter of in vivo GS activity (34).
Glycogen phosphorylase assayMuscle glycogen phosphorylase activity was measured as described pre-viously (31 ). This assay is based on the measurement ofthe incorpora-tion ofcarbon-14 into glycogen from labeled glucose 1-phosphate. Gly-cogen phosphorylase a, the active phosphorylated enzyme, was assayedin the absence ofAMP, and phosphorylase b, the total enzyme activity,was assayed in the presence of 5 mM AMP. The tissue homogenates(7-12 mg) were prepared as described above. The supernatant wasused for glycogen phosphorylase assays by measuring the incorporationof ['4C]glucose 1-phosphate into glycogen at 30°C in a mixture con-
taining 33 mM Mes, 200 mM KF, 0.45% mercaptoethanol, 15 mMglucose 1-phosphate (50 ,Ci/mmol), and 3.4 mg/ml glycogen. Phos-phorylase b was assayed in the same manner, except that the mixturecontained 100 mM glucose 1-phosphate (6 ,Ci/mmol), 13.4 mg/mlglycogen, and 5 mM AMP.
HGOHGO was calculated as the difference between glucose rate of appear-ance and the rate ofglucose infused to maintain euglycemia during theclamps.
Nonoxidative glycolysis (lactate/alanineflux)Nonoxidative glycolysis was calculated as the difference between ratesof total body glycolysis and CHO oxidation.
Leg bloodflowLeg blood flow was determined every 30 min by venous occlusionplethysmography with a mercury strain gauge apparatus (model EC-5R; Hokanson Inc., Issaquah, WA) (35).
Body compositionBody composition wasdeterminedby underwaterweighingwith correc-tion for residual lung volume (27), which was determined after immer-sion in a sitting position with a closed circuit °2 dilution method (27).
Analytical proceduresPlasma glucose was measured with a glucose analyzer (Beckman In-struments, Inc.). Serum insulin (36) and glucagon (37) were deter-mined by radioimmunoassay. Blood urea nitrogen (38) was measuredcolorimetrically. Urinary nitrogen was measured by the method ofKjeldahl (39). Lactate(40) and pyruvate (41 )were measured enzymat-ically. Fatty acids were determined by gas chromatography (model5730A; Hewlett-Packard Co., Palo Alto, CA) as the sum of seven indi-vidual fatty acids (myristate, palmitate, palmitoleate, stearate, oleate,linoleate, and arachidonate). Heptadecanoic acid was used as internalstandard.
Statistical analysis and calculationsAll data were expressed as the mean±SEM. Statistical significance wasassessed using ANOVA with repeated measures and Student's two-tailed paired or unpaired t test where applicable.
Results
Euglycemic insulin clamps with and withoutfat infusion (Fig.2). In all three studies, insulin infusion raised plasma insulinconcentrations from - 5 to - 70 MuU/ml. Plasma glucose wasclamped at - 85 mg/dl. In the low fatty acid group, plasmaFFA decreased from 526±90 before to 54±6MtM during insulininfusion. In the medium fatty acid group, FFA concentrationwas 500±120 before and 632±133 ,uM at the end of the clamp(NS). In the high fatty acid group, FFA concentrations in-creased from 415±69 before to 748±34 ,uM at the end of theclamp (P < 0.01). The three FFA concentration curves (high,medium, and low fatty acid groups) were significantly differentfrom each other (overall comparison of groups by ANOVAwith repeated measures P < 0.001 ).
Leg blood flow rates were 4.0±0.6, 3.8±0.5, and 3.9±0.3ml/dl leg tissue per min in the low, medium, and high fattyacid groups, respectively. During insulin infusions, leg flowrates increased to 4.7±0.8, 5.7±0.9, and 5.7±0.9 ml/dl, respec-tively. The differences among the three groups were not statisti-cally significant.
Glucose uptake (GRd) (Fig. 3, top). GRd rose from - 2 to- 6 mg/kg per min during the initial 90 min of insulin infu-sion in all three groups. Thereafter, GRd in the low, medium,and high fatty acid groups were significantly different fromeach other (overall comparison ofgroups). GRd rose further to- 9 mg/kg per min in the low fatty acid group, stabilized at- 6 mg/kg per min in the medium fatty acid group, and de-clined to - 4 mg/kg per min in the high fatty acid group.Comparing individual time points, the differences betweenhigh and low fatty acid groups became significant at 210 min.
Comparing mean values ofthe last 3 h (180-360 min) (Fig.4), GRd declined in a linear fashion with increasing plasma
2440 Boden, Chen, Ruiz, White, and Rossetti
ONI I I i
II& I I| ~ ~~~-a UpLipd + HSprnn
I e e Salin n
[v0 ~ -* So.e..
ECR
1-1
E
0
0.
0(.
12
10
8
8
l-
.2
la
c
a$
an1-E
4)C
00$0
looor
800
1~~~.- 1/
0 . . .. . .
0 60 120 180 240 300 360
Minutes
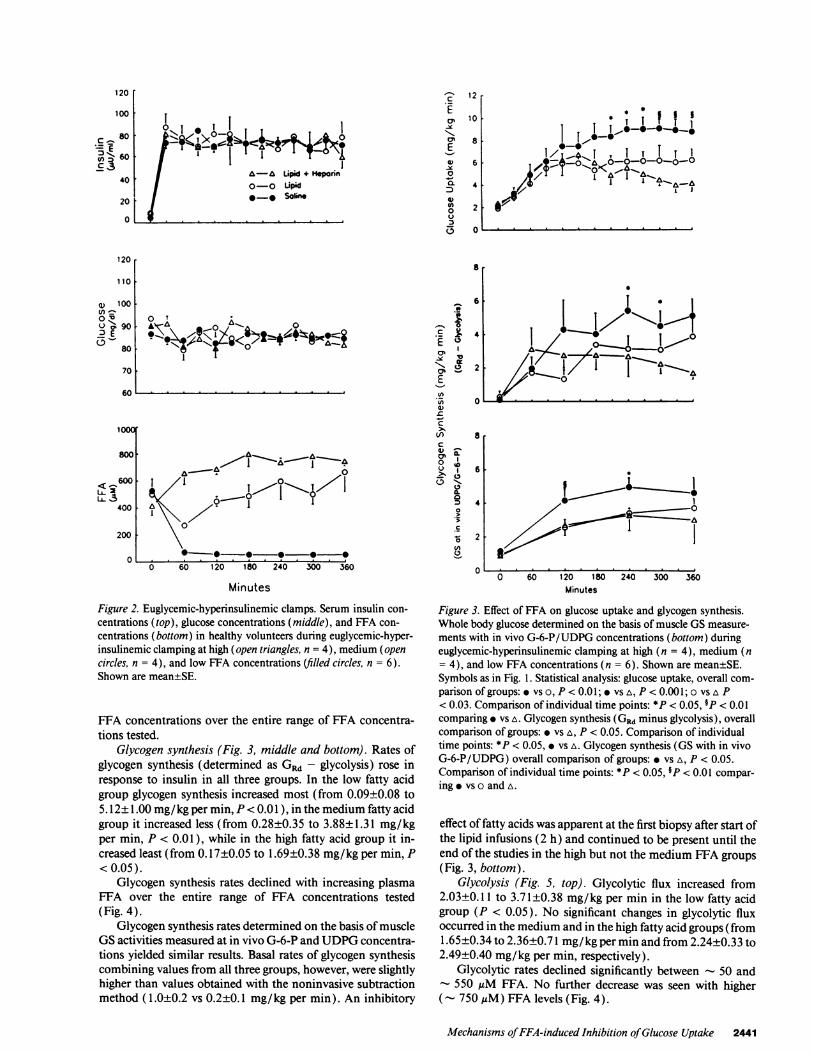
Figure 2. Euglycemic-hyperinsulinemic clamps. Serum insulin con-
centrations (top), glucose concentrations (middle), and FFA con-centrations (bottom) in healthy volunteers during euglycemic-hyper-insulinemic clamping at high (open triangles, n = 4), medium (opencircles, n = 4), and low FFA concentrations (filled circles, n = 6).Shown are mean±SE.
FFA concentrations over the entire range of FFA concentra-tions tested.
Glycogen synthesis (Fig. 3, middle and bottom). Rates ofglycogen synthesis (determined as GRd - glycolysis) rose inresponse to insulin in all three groups. In the low fatty acidgroup glycogen synthesis increased most (from 0.09±0.08 to5.12±1.00 mg/kg per min, P < 0.01), in the medium fatty acidgroup it increased less (from 0.28±0.35 to 3.88±1.31 mg/kgper min, P < 0.01 ), while in the high fatty acid group it in-creased least (from 0.17±0.05 to 1.69±0.38 mg/kg per min, P<0.05).
Glycogen synthesis rates declined with increasing plasmaFFA over the entire range of FFA concentrations tested(Fig. 4).
Glycogen synthesis rates determined on the basis ofmuscleGS activities measured at in vivo G-6-P and UDPG concentra-tions yielded similar results. Basal rates of glycogen synthesiscombining values from all three groups, however, were slightlyhigher than values obtained with the noninvasive subtractionmethod (1.0±0.2 vs 0.2±0.1 mg/kg per min). An inhibitory
6
4
2
8
a.-
0
.,
._00
6
4
2
0 0
4 , I T
I/~it~4 1
7T_.h.
*-1
a0 60 120 180 240
Minutes300 360
Figure 3. Effect of FFA on glucose uptake and glycogen synthesis.Whole body glucose determined on the basis of muscle GS measure-
ments with in vivo G-6-P/UDPG concentrations (bottom) duringeuglycemic-hyperinsulinemic clamping at high (n = 4), medium (n= 4), and low FFA concentrations (n = 6). Shown are mean±SE.Symbols as in Fig. 1. Statistical analysis: glucose uptake, overall com-parison of groups: vs o, P < 0.01; * vs A, P < 0.001; o vs A P< 0.03. Comparison of individual time points: *P < 0.05, 9P < 0.01comparing * vs A. Glycogen synthesis (GRd minus glycolysis), overallcomparison of groups: vs A, P < 0.05. Comparison of individualtime points: *P < 0.05, * vs A. Glycogen synthesis (GS with in vivoG-6-P/UDPG) overall comparison of groups: vs A, P < 0.05.Comparison of individual time points: *P < 0.05, P < 0.01 compar-ing vs o and A.
effect of fatty acids was apparent at the first biopsy after start ofthe lipid infusions (2 h) and continued to be present until theend of the studies in the high but not the medium FFA groups
(Fig. 3, bottom).Glycolysis (Fig. 5, top). Glycolytic flux increased from
2.03±0.11 to 3.71±0.38 mg/kg per min in the low fatty acidgroup (P < 0.05). No significant changes in glycolytic fluxoccurred in the medium and in the high fatty acid groups (from1.65±0.34 to 2.36±0.71 mg/kg per min and from 2.24±0.33 to
2.49±0.40 mg/kg per min, respectively).Glycolytic rates declined significantly between - 50 and550 ,sM FFA. No further decrease was seen with higher
(- 750WM) FFA levels (Fig. 4).
Mechanisms ofFFA-induced Inhibition ofGlucose Uptake 2441
120
100
C 80
.= EO 60
40
20
0
120
110
a) 1 00
0 -0
u > 90
80
70
60
< 600L..2LL3'
400
200
o
0 7 I
Alq.a -0 461-- 0, '\ I
. -110 1-1 a 'a<0 II

10 6
I
I I I
S
5
4
3
2
6
5
4
3
2
0x00
a06aSa'
z030
0*
Io0%ZLa
0 200 400 600 NO0
FFA oM0 200 400 600 SWO
FFA IAM
3.0-° I
2.5 X
C)0It
1.0 01.5 o
*0
0.0 0
C
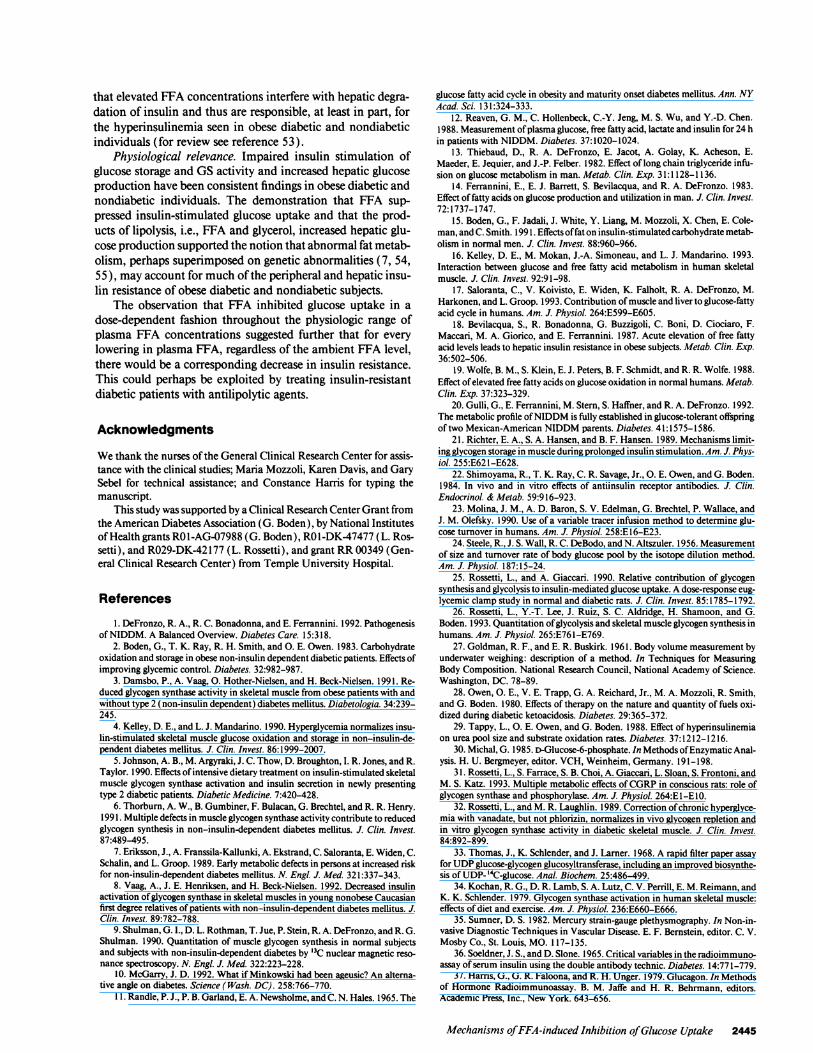
Figure 4. Effects of FFA on CHO metabolism. Ef-fects of three FFA concentrations on whole bodyrates of glucose uptake (average values from 180 to360 min), glycogen synthesis, glycolysis, CHO oxi-dation, nonoxidative glycolysis, and HGO duringeuglycemic-hyperinsulinemic clamping. Shown aremean±SE; *P < 0.05, UP < 0.01 comparing lowwith medium or high FFA values.
CHO oxidation (Fig. 5, middle). Rates ofCHO oxidationincreased from 0.63±0.21 to 2.33±0.21 mg/kg per min (P< 0.01 ) in the low fatty acid group. In both medium and highfatty acid groups, CHO oxidation did not increase significantlyabove basal values during insulin infusions and remainedlower than in the low fatty acid group. These differences be-came statistically significant at 150 min (P < 0.05).
CHO oxidation rates declined when plasma FFA increasedfrom 51±5 to 562±106 ,uM (P < 0.01). There was no furtherdecline in CHO oxidation rates when plasma FFA concentra-tion increased from 562±106 to 766±44 ,uM (Fig. 4).
Nonoxidative glycolysis (Fig. 5, bottom). Basal nonoxida-tive glycolysis rates were 1.40±0.26, 0.81±0.45, and 1.60±0.39mg/kg per min in low, medium, and high fatty acid groups,respectively (NS). There were no significant changes in re-
sponse to insulin or to fatty acids in any of the three groups.Plasma glucagon andHGO (Fig. 6). There were no signifi-
cant intra- or interstudy changes in plasma glucagon concen-
trations.In the low fatty acid group, insulin suppressed HGO vir-
tually completely from 2.26±0.06 to 0.29±0.14 mg/kg permin (not significantly different from 0). In the medium andhigh fatty acid groups, HGO was significantly less inhibited(from 2.10±0.27 to 0.93±0.12; -66% and from 2.72±0.56 to1.45±0.46 mg/kg per min; -47%, respectively). The differ-ences in HGO between low and high fatty acid groups becamestatistically significant at 150 min (P < 0.02). Increasing fattyacid concentration from 550 to 750 ;tM did not further in-crease HGO (Fig. 4).
Muscle GS (Fig. 7). The Km of GS activity (Fig. 7, top)declined significantly between 0 and 2 h in all three groups. Inthe low and medium fatty acid groups, Km remained low until
the end ofthe studies. In the high fatty acid group, Km increased
between 4 and 6 h and at 6 h had reached preclamp levels.GS V. (GS at 7.2 mM G-6-P) (Fig. 7, middle), represent-
ing an index ofthe total amount ofenzyme present in muscle,was the same in all three groups and did not change signifi-cantly in response to insulin or to fatty acids.
GS fractional velocity (Fig. 7, bottom), the ratio ofGS activ-ities at 0.1 1 and 7.2 mM G-6-P, is considered a good indicatorof in vivo enzyme activity. It increased significantly in all threegroups in response to insulin between 0 and 4 h. Between 4 and6 h GS fractional velocity remained elevated in the low andmedium, but declined significantly in the high fatty acid group.
Muscle glycogen phosphorylase and G-6-P (Table II). Gly-cogen phosphorylase a activities did not change significantly inresponse to insulin or to insulin plus fatty acids in any of thethree groups.
There were no statistically significant changes in G-6-Pconcentrations in any of the three groups between 0 and 4 h.Between 4 and 6 h, G-6-P increased significantly in the highfatty acid group (P < 0.05), while it remained unchanged inthe low and medium fatty acid groups.
Discussion
FFA/CHO metabolism dose effect relationships. In this study,we have examined effects ofthree steady state plasma fatty acidconcentrations on the ability ofinsulin to promote glucose up-take and on the rate of intracellular glucose utilization, i.e.,glycogen synthesis and glycolysis. As > 80% of the glucose in-fused intravenously has been shown to be taken up by muscle(42), our results provided information primarily on the effectsofFFA on muscle metabolism.
2442 Boden, Chen, Ruiz, White, and Rossetti
4)0
O100
V).a
4)
C.E-(nE,.t4)0M~E0-
0
6
6
6
5
4
3
2
6
5
.In 401UX0 32%0 2
I6
00

8
6
4
0
200 r
II 00--,, I 4T T85.;Pof &.;. I16 11
o 1600)o E 120
o Q- 80
2 40
C -,
0
6
5
C 4
aO#_
o 2I
0
6
5
4
-+.-, 4
0-4
:3
0) .
00o)
uI o,
3 tI II£1E
3..
0 I0 60 120 180 240 300 360
Minutes
Figure 5. Effect of FFA on glycolysis, CHO oxidation, and nonoxi-dative glycolysis. Whole body rates of glycolysis, CHO oxidation, andnonoxidative glycolysis during euglycemic-hyperinsulinemic clamp-ing at high, medium, and low FFA concentrations. Symbols andnumber of experiments as in Fig. 1. *P < 0.05 comparing values atlow and high FFA concentrations.
There was a dose-dependent relationship between plasmaFFA concentrations and glucose uptake. GRd decreased by- 50% (from 8.8 to 4.2 mg/kg per min) when FFA concentra-tions rose from - 50 to - 750 AM (Figs. 3 and 4). Overall, themajor part ( - 2/3) of the decline in GRd was caused by reduc-tion in the rate of glycogen synthesis, and a minor part (- l/)was caused by reduction in the rate of CHO oxidation. Thedecrease in GRd of - 3 mg/kg per min which occurred whenFFA concentrations rose from - 50 to - 500 gM was ac-
counted for equally by decreases in CHO oxidation and glyco-gen synthesis, while the decline in GRd which occurred whenplasma FFA concentrations rose further (from - 550 to- 750 ,gM) was caused exclusively by a decrease in glycogensynthesis. These findings expanded earlier observations (13,43) that the effect of fat on CHO oxidation was relatively smalland that the main problem in obese diabetic and nondiabeticsubjects, whose FFA concentrations are commonly > 500 OM,was a defect in nonoxidative glucose disposal ( 1-9).
I * 1 I!_= / I *,I
--.
0 60 120 180 240 300 360
Minutes
Figure 6. Plasma glucagon and HGO. Effect of euglycemic-hyperin-sulinemic clamping at high, medium, and low FFA concentrationson plasma glucagon concentration and on rates of HGO. Number ofsubjects and symbols as in Fig. 1. *P < 0.05 comparing high or me-
dium with low FFA concentrations.
Time course and mechanisms ofFFA effects. The inhibi-tion of CHO oxidation appeared early, was largest at postab-sorptive FFA concentrations (- 550 AiM), and, as we havepreviously demonstrated, was associated with a four- to five-fold increase in muscle acetyl-CoA content ( 15 ). Acetyl-CoAis well known to inhibit pyruvate dehydrogenase (PDH) activ-ity. Moreover, Kelley et al. ( 16) have shown recently that fatinfusion induced inhibition ofPDH in normal volunteers. Pres-ent evidence, therefore, supports the notion that fat infusiondecreases CHO oxidation in skeletal muscle by acetyl-CoA-in-duced inhibition of PDH activity. This may, however, not bethe only mechanism, as there was evidence that fatty acids mayhave lowered glucose transport or phosphorylation (see below)which would have also reduced CHO oxidation.
The present study provided evidence for the presence oftwo independent mechanisms for the inhibition of glycogensynthesis. First, as reported previously by us ( 15) and con-
firmed recently by others ( 16), fat infusion abolished insulinstimulation of GS activity in skeletal muscle. We have now
extended our earlier observations by demonstrating that theinhibition of GS occurred late, i.e., after 4-6 h of fat infusion,was seen only at high FFA concentrations (- 750 AM), andwas associated with an increase in muscle G-6-P content. Thecause for the inhibition of GS remained uncertain but may
have been related to an increase in long chain acetyl-CoA and/or glycogen concentrations. Both have been shown to suppress
glycogen synthesis (44, 45). Serial measurements in plasma
Mechanisms ofFFA-induced Inhibition ofGlucose Uptake 2443
U)U)
3
_
7U)U)
0.
C)
~0x0
0z
,

0.4,
0.3 L
EEE
0.2 [
0.1 [0
0.8,Q)VI)0.-
c(1)
CD0U
0
2)0
0
U0L&.
C
E 0.6
at 0.4
.0.2E
0.6
0.5
0.4
0.3 L0.2 .
0.1
0 2 4 6
Hours
Figure 7. Effect ofFFA on muscle GS. Effect of euglycemic-hyperin-sulinemic clamping at high, medium, and low FFA concentrationson GS Km (mM UDPG), V,,,,, and fractional velocity (0.11/0.72mM G-6-P). Symbols and number of subjects as in Fig. 1. *P < 0.05comparing high and low FFA concentrations.
and muscle biopsy samples revealed, however, that glycogensynthesis was already inhibited before inhibition of muscle GSactivity. This indicated the presence of an additional, earlierfatty acid-induced block ofglycogen synthesis which was unre-lated to an impairment of GS. Glycogen synthesis dependsprimarily on the activity of the rate-limiting enzyme GS andthe availability of its main substrate G-6-P/UDPG. The ob-served reduction of glycogen synthesis associated with normalGS activity, therefore, suggested that fatty acids had loweredG-6-P/UDPG levels in skeletal muscle. This suggestion wassupported when rates ofglycogen synthesis were determined invitro with in vivo G-6-P and UDPG concentrations (Fig. 3,bottom), and a significant suppression of glycogen synthesiswas apparent at the first muscle biopsy after start of the fatinfusion, i.e., at 2 h. Together, our data provided evidence thata decrease in G-6-P/UDPG, probably produced by fatty acid-mediated inhibition of glucose transport or phosphorylation,was responsible for a major defect in glycogen synthesis. Sup-porting this notion, Hardy et al. (46) have reported recently
Table II. Effects ofFatty Acids on Glycogen Phosphorylase aand on G-6-P Concentration in Skeletal Muscle
Hours
0 2 4 6
Imol/g wet wt per min
Glycogen phosphorylase aLow fatty acids 2.9±0.6 3.2±0.5 3.0±0.4 3.1±0.2Medium fatty acids 3.3±1.5 2.6±0.7 2.9±0.9 3.1±0.9High fatty acids 3.5±0.5 3.3±1.6 2.6±0.7 2.5±0.5
nmol/g wet wt
G-6-PLow fatty acids 79±19 101±30 109±31 96±16Medium fatty acids 74±26 57±18 78±19 105±11High fatty acids 56±10 84±11 69±13 139±29*
* P < 0.05 compared with values at 0, 2, and 4 h.
that 1-2 mM palmitic acid inhibited insulin-stimulated 3-0-methyl glucose transport into rat soleus muscle.
Nonoxidative glycolysis. Independent determination ofgly-colysis and CHO oxidation allowed us to calculate rates ofnonoxidative glycolysis, which consists essentially of lactateand alanine production rates. Our data suggested that neitherinsulin nor fat infusion affected nonoxidative glycolysis, whichremained at 1-1.5 mg/kg per min during all three studies.These findings are in accord with those of Consoli et al. (47)who reported postabsorptive lactate and alanine productionrates of - 1.4 mg/kg per min in normal volunteers. They arealso in agreement with data showing that insulin has little or noeffect on lactate and alanine release from resting muscle ( 16,48, 49). Our data do not exclude a small increase in lactateaccompanied by a decrease in alanine production in responseto lipid infusion as has been observed by Kelley et al. ( 16) inarterio-venous balance studies across forearm muscle.
HGO. Confirming reports by others ( 14, 17, 50), we foundthat lipid infusions interfered with insulin's suppressive effecton HGO, i.e., caused hepatic insulin resistance. The presentstudy showed, in addition, that this effect appeared earlyand seemed greatest at postabsorptive FFA concentrations(~550,gM).The mechanisms responsible for this effect were not studied
but could have been related to elevated plasma concentrationsof FFA, glycerol, or both. Lipolysis from the infused fat re-sulted in increased production of fatty acids and glycerol, re-sulting not only in higher FFA but also in higher glycerol con-centrations (4.5±0.6 vs 3.8±0.2 vs 1.2±0.4 mg/dl, respec-tively, in high, medium, and low FFA studies). Putativemechanisms for the lipid effect on HGO include enhanced 1#-oxidation of fatty acids which provides ATP, i.e., the energyneeded to drive gluconeogenesis, as well as acetyl-CoA whichactivates pyruvate carboxylase, the first key enzyme in the glu-coneogenetic pathway ( 51 ), and increased availability of glyc-erol which is an excellent substrate for gluconeogenesis (52).
Fatty acids and insulin clearance. Despite large differencesin plasma FFA concentrations (from 50 to 750 ,uM), steadystate serum insulin concentrations, produced by continuousinfusion of insulin at a rate of 1 mU/kg per min, were the samein all three groups. These data do not support the hypothesis
2444 Boden, Chen, Ruiz, White, and Rossetti
q
ILI TT 0 Ilp-- lw
0A
a I0 a
I-A I
I
that elevated FFA concentrations interfere with hepatic degra-dation of insulin and thus are responsible, at least in part, forthe hyperinsulinemia seen in obese diabetic and nondiabeticindividuals (for review see reference 53).
Physiological relevance. Impaired insulin stimulation ofglucose storage and GS activity and increased hepatic glucoseproduction have been consistent findings in obese diabetic andnondiabetic individuals. The demonstration that FFA sup-pressed insulin-stimulated glucose uptake and that the prod-ucts of lipolysis, i.e., FFA and glycerol, increased hepatic glu-cose production supported the notion that abnormal fat metab-olism, perhaps superimposed on genetic abnormalities (7, 54,55), may account for much ofthe peripheral and hepatic insu-lin resistance of obese diabetic and nondiabetic subjects.
The observation that FFA inhibited glucose uptake in adose-dependent fashion throughout the physiologic range ofplasma FFA concentrations suggested further that for everylowering in plasma FFA, regardless of the ambient FFA level,there would be a corresponding decrease in insulin resistance.This could perhaps be exploited by treating insulin-resistantdiabetic patients with antilipolytic agents.
Acknowledgments
We thank the nurses of the General Clinical Research Center for assis-tance with the clinical studies; Maria Mozzoli, Karen Davis, and GarySebel for technical assistance; and Constance Harris for typing themanuscript.
This study was supported by a Clinical Research Center Grant fromthe American Diabetes Association (G. Boden), by National Institutesof Health grants ROI-AG-07988 (G. Boden), ROI-DK-47477 (L. Ros-setti), and R029-DK-42177 (L. Rossetti), and grant RR 00349 (Gen-eral Clinical Research Center) from Temple University Hospital.
References
1. DeFronzo, R. A., R. C. Bonadonna, and E. Ferrannini. 1992. Pathogenesisof NIDDM. A Balanced Overview. Diabetes Care. 15:318.
2. Boden, G., T. K. Ray, R. H. Smith, and 0. E. Owen. 1983. Carbohydrateoxidation and storage in obese non-insulin dependent diabetic patients. Effects ofimproving glycemic control. Diabetes. 32:982-987.
3. Damsbo, P., A. Vaag, 0. Hother-Nielsen, and H. Beck-Nielsen. 1991. Re-duced glycogen synthase activity in skeletal muscle from obese patients with andwithout type 2 (non-insulin dependent) diabetes mellitus. Diabetologia. 34:239-245.
4. Kelley, D. E., and L. J. Mandarino. 1990. Hyperglycemia normalizes insu-lin-stimulated skeletal muscle glucose oxidation and storage in non-insulin-de-pendent diabetes mellitus. J. Clin. Invest. 86:1999-2007.
5. Johnson, A. B., M. Argyraki, J. C. Thow, D. Broughton, I. R. Jones, and R.Taylor. 1990. Effects ofintensive dietary treatment on insulin-stimulated skeletalmuscle glycogen synthase activation and insulin secretion in newly presentingtype 2 diabetic patients. Diabetic Medicine. 7:420-428.
6. Thorburn, A. W., B. Gumbiner, F. Bulacan, G. Brechtel, and R. R. Henry.1991. Multiple defects in muscle glycogen synthase activity contribute to reducedglycogen synthesis in non-insulin-dependent diabetes mellitus. J. Clin. Invest.87:489-495.
7. Eriksson, J., A. Franssila-Kallunki, A. Ekstrand, C. Saloranta, E. Widen, C.Schalin, and L. Groop. 1989. Early metabolic defects in persons at increased riskfor non-insulin-dependent diabetes mellitus. N. Engl. J. Med. 321:337-343.
8. Vaag, A., J. E. Henriksen, and H. Beck-Nielsen. 1992. Decreased insulinactivation ofglycogen synthase in skeletal muscles in young nonobese Caucasianfirst degree relatives of patients with non-insulin-dependent diabetes mellitus. J.Clin. Invest. 89:782-788.
9. Shulman, G. I., D. L. Rothman, T. Jue, P. Stein, R. A. DeFronzo, and R. G.Shulman. 1990. Quantitation of muscle glycogen synthesis in normal subjectsand subjects with non-insulin-dependent diabetes by "3C nuclear magnetic reso-nance spectroscopy. N. Engl. J. Med. 322:223-228.
10. McGarry, J. D. 1992. What if Minkowski had been ageusic? An alterna-tive angle on diabetes. Science (Wash. DC). 258:766-770.
1 1. Randle, P. J., P. B. Garland, E. A. Newsholme, and C. N. Hales. 1965. The
glucose fatty acid cycle in obesity and maturity onset diabetes mellitus. Ann. NYAcad. Sci. 131:324-333.
12. Reaven, G. M., C. Hollenbeck, C.-Y. Jeng, M. S. Wu, and Y.-D. Chen.1988. Measurement ofplasma glucose, free fatty acid, lactate and insulin for 24 hin patients with NIDDM. Diabetes. 37:1020-1024.
13. Thiebaud, D., R. A. DeFronzo, E. Jacot, A. Golay, K. Acheson, E.Maeder, E. Jequier, and J.-P. Felber. 1982. Effect oflong chain triglyceride infu-sion on glucose metabolism in man. Metab. Clin. Exp. 31:1128-1136.
14. Ferrannini, E., E. J. Barrett, S. Bevilacqua, and R. A. DeFronzo. 1983.Effect of fatty acids on glucose production and utilization in man. J. Clin. Invest.72:1737-1747.
15. Boden, G., F. Jadali, J. White, Y. Liang, M. Mozzoli, X. Chen, E. Cole-man, and C. Smith. 199 1. Effects offat on insulin-stimulated carbohydrate metab-olism in normal men. J. Clin. Invest. 88:960-966.
16. Kelley, D. E., M. Mokan, J.-A. Simoneau, and L. J. Mandarino. 1993.Interaction between glucose and free fatty acid metabolism in human skeletalmuscle. J. Clin. Invest. 92:91-98.
17. Saloranta, C., V. Koivisto, E. Widen, K. Falholt, R. A. DeFronzo, M.Harkonen, and L. Groop. 1993. Contribution ofmuscle and liver to glucose-fattyacid cycle in humans. Am. J. Physiol. 264:E599-E605.
18. Bevilacqua, S., R. Bonadonna, G. Buzzigoli, C. Boni, D. Ciociaro, F.Maccari, M. A. Giorico, and E. Ferrannini. 1987. Acute elevation of free fattyacid levels leads to hepatic insulin resistance in obese subjects. Metab. Clin. Exp.36:502-506.
19. Wolfe, B. M., S. Klein, E. J. Peters, B. F. Schmidt, and R. R. Wolfe. 1988.Effect ofelevated free fatty acids on glucose oxidation in normal humans. Metab.Clin. Exp. 37:323-329.
20. Gulli, G., E. Ferrannini, M. Stem, S. Haffner, and R. A. DeFronzo. 1992.The metabolic profile ofNIDDM is fully established in glucose-tolerant offspringof two Mexican-American NIDDM parents. Diabetes. 41:1575-1586.
21. Richter, E. A., S. A. Hansen, and B. F. Hansen. 1989. Mechanisms limit-ing glycogen storage in muscle during prolonged insulin stimulation. Am. J. Phys-iol. 255:E621-E628.
22. Shimoyama, R., T. K. Ray, C. R. Savage, Jr., 0. E. Owen, and G. Boden.1984. In vivo and in vitro effects of antiinsulin receptor antibodies. J. Clin.Endocrinol. & Metab. 59:916-923.
23. Molina, J. M., A. D. Baron, S. V. Edelman, G. Brechtel, P. Wallace, andJ. M. Olefsky. 1990. Use of a variable tracer infusion method to determine glu-cose turnover in humans. Am. J. Physiol. 258:E16-E23.
24. Steele, R., J. S. Wall, R. C. DeBodo, and N. Altszuler. 1956. Measurementof size and turnover rate of body glucose pool by the isotope dilution method.Am. J. Physiol. 187:15-24.
25. Rossetti, L., and A. Giaccari. 1990. Relative contribution of glycogensynthesis and glycolysis to insulin-mediated glucose uptake. A dose-response eug-lycemic clamp study in normal and diabetic rats. J. Clin. Invest. 85:1785-1792.
26. Rossetti, L., Y.-T. Lee, J. Ruiz, S. C. Aldridge, H. Shamoon, and G.Boden. 1993. Quantitation ofglycolysis and skeletal muscle glycogen synthesis inhumans. Am. J. Physiol. 265:E761-E769.
27. Goldman, R. F., and E. R. Buskirk. 1961. Body volume measurement byunderwater weighing: description of a method. In Techniques for MeasuringBody Composition. National Research Council, National Academy of Science.Washington, DC. 78-89.
28. Owen, 0. E., V. E. Trapp, G. A. Reichard, Jr., M. A. Mozzoli, R. Smith,and G. Boden. 1980. Effects of therapy on the nature and quantity of fuels oxi-dized during diabetic ketoacidosis. Diabetes. 29:365-372.
29. Tappy, L., 0. E. Owen, and G. Boden. 1988. Effect of hyperinsulinemiaon urea pool size and substrate oxidation rates. Diabetes. 37:1212-1216.
30. Michal, G. 1985. i-Glucose-6-phosphate. In Methods ofEnzymatic Anal-ysis. H. U. Bergmeyer, editor. VCH, Weinheim, Germany. 191-198.
31. Rossetti, L., S. Farrace, S. B. Choi, A. Giaccari, L. Sloan, S. Frontoni, andM. S. Katz. 1993. Multiple metabolic effects ofCGRP in conscious rats: role ofglycogen synthase and phosphorylase. Am. J. Physiol. 264:El-El0.
32. Rossetti, L., and M. R. Laughlin. 1989. Correction ofchronic hyperglyce-mia with vanadate, but not phlorizin, normalizes in vivo glycogen repletion andin vitro glycogen synthase activity in diabetic skeletal muscle. J. Clin. Invest.84:892-899.
33. Thomas, J., K. Schlender, and J. Lamer. 1968. A rapid filter paper assayfor UDP glucose-glycogen glucosyltransferase, including an improved biosynthe-sis of UDP- '4C-glucose. Anal. Biochem. 25:486-499.
34. Kochan, R. G., D. R. Lamb, S. A. Lutz, C. V. Perrill, E. M. Reimann, andK. K. Schlender. 1979. Glycogen synthase activation in human skeletal muscle:effects of diet and exercise. Am. J. Physiol. 236:E660-E666.
35. Sumner, D. S. 1982. Mercury strain-gauge plethysmography. In Non-in-vasive Diagnostic Techniques in Vascular Disease. E. F. Bernstein, editor. C. V.Mosby Co., St. Louis, MO. 117-135.
36. Soeldner, J. S., and D. Slone. 1965. Critical variables in the radioimmuno-assay of serum insulin using the double antibody technic. Diabetes. 14:771-779.
37. Harris, G., G. R. Faloona, and R. H. Unger. 1979. Glucagon. In Methodsof Hormone Radioimmunoassay. B. M. Jaffe and H. R. Behrmann, editors.Academic Press, Inc., New York. 643-656.
Mechanisms ofFFA-induced Inhibition ofGlucose Uptake 2445
38. Marsh, W. H., B. Fingerhut, and H. Miller. 1965. Automated and manualdirect method for the determination of blood urea. Clin. Chem. 1 1:624-627.
39. Hawk, P. 1947. The Kjeldahl method. In Practical Physiological Chemis-try. The Blakiston Company, Toronto. 814-822.
40. Hohorst, H. J. 1965. Lactate. In Methods of Enzymatic Analysis. H. U.Bergmeyer, editor. Academic Press, Inc., New York. 266.
41. Bucher, T., R. Czok, W. Lampbrecht, and E. Latzkco. 1959. Pyruvate. InMethods of Enzymatic Analysis. H. U. Bergmeyer, editor. Academic Press, Inc.,New York. 253.
42. DeFronzo, R. A., E. Jacot, E. Jequier, E. Maeder, J. Wahren, and J. P.Felber. 1981. The effect of insulin on the disposal of intravenous glucose; resultsfrom indirect calorimetry and hepatic and femoral venous catheterization. Dia-betes. 30:1000-1007.
43. Groop, L. C., R. C. Bonadonna, M. Shank, A. S. Petrides, and R. A.DeFronzo. 1991. Role offree fatty acids and insulin in determining free fatty acidand lipid oxidation in man. J. Clin. Invest. 87:83-89.
44. Wititsuwannakul, D., and K.-H. Kim. 1977. Mechanism of palmitylcoenzyme A inhibition ofliverglycogen synthase. J. Biol. Chem. 252:7812-7817.
45. Danforth, W. 1965. Glycogen synthetase activity in skeletal muscle. J.Biol. Chem. 240:588-593.
46. Hardy, R. W., J. H. Ladenson, E. J. Henriksen, J. 0. Holloszy, and J. M.McDonald. 1991. Palmitate stimulates glucose transport in rat adipocytes by amechanism involving translocation of the insulin sensitive glucose transporter(Glut 4). Biochem. Biophys. Res. Commun. 177:343-349.
47. Consoli, A., N. Nurjhan, J. J. Reilly, D. M. Bier, and J. E. Gerich. 1990.Mechanism of increased gluconeogenesis in non-insulin-dependent diabetesmellitus. Role of alterations in systemic, hepatic, and muscle lactate and alaninemetabolism. J. Clin. Invest. 86:2038-2045.
48. Consoli, A., N. Nurdahan, J. Gerich, and L. Mandarino. 1992. Skeletalmuscle in a major site of lactate uptake and release during hyperinsulinemia.Metab. Clin. Exp. 41:176-179.
49. Natali, A., G. Buzzigoli, S. Taddei, D. Santoro, M. Cerri, R. Pedrinelli,and E. Ferrannini. 1990. Effects of insulin on hemodynamics and metabolism inhuman forearm. Diabetes. 39:490-500.
50. Fanelli, C., S. Calderone, L. Epifano, A. De Vincenzo, F. Modarelli, S.Pampanelli, G. Perriello, P. De Feo, P. Brunetti, J. E. Gerich, and G. B. Bolli.1993. Demonstration ofa critical role for free fatty acids in mediatingcounterreg-ulatory stimulation ofglucogenogenesis and suppression ofglucose utilization inhumans. J. Clin. Invest. 92:1617-1622.
51. Williamsson, J. R., R. A. Kreisberg, and P. W. Felts. 1966. Mechanismsfor the stimulation of gluconeogenesis by fatty acids in perfused rat liver. Proc.Natl. Acad. Sci. USA. 6:247-254.
52. Nurjhan, N., P. J. Campbell, F. P. Kennedy, J. M. Miles, and J. E. Gerich.1986. Insulin dose-response characteristics for suppression ofglycerol release andconversion to glucose in humans. Diabetes. 35:1326-1331.
53. Kolaczynski, J. W., and G. Boden. 1993. Effects of oleate and fatty acidsfrom omental adipocytes on insulin uptake in rat liver cells. Endocrinology.133:2871-2874.
54. Wells, A. M., I. C. Sutcliffe, A. B. Johnson, and R. Taylor. 1993. Abnor-mal activation of glycogen synthesis in fibroblasts from NIDDM subjects. Evi-dence of an abnormality specific to glucose metabolism. Diabetes. 42:583-589.
55. Vestergaard, H., C. Bjorbaek, P. H. Andersen, J. F. Bak, and 0. Pedersen.1991. Impaired expression of glycogen synthase mRNA in skeletal muscle ofNIDDM patients. Diabetes. 40:1740-1745.
2446 Boden, Chen, Ruiz, White, and Rossetti
Copyright © 2022 FDOKUMEN