Corrosion Inhibition of Mild Steel in Acidic Media by Citrus ...
Corrosion Science 49 (2007) 2371–2391
www.elsevier.com/locate/corsci
Mechanisms of corrosion inhibitionof AA2024-T3 by vanadates
M. Iannuzzi *, G.S. Frankel
Fontana Corrosion Center, The Ohio State University Columbus, OH 43210, United States
Received 27 September 2006; accepted 16 October 2006Available online 16 January 2007
Abstract
The mechanisms of corrosion inhibition of AA2024-T3 by vanadates were studied using chrono-amperometry, polarization curves and adsorption isotherms. The electrochemical behaviour of clearsolutions containing metavanadates and orange solutions containing decavanadates was clearly dis-tinctive. Metavanadates reduced the kinetics of oxygen reduction to an extent similar to chromates.Corrosion inhibition of AA2024-T3 by metavanadates was very rapid and it might occur by the for-mation of an adsorbed layer. Reduction of clear metavanadate solution was very slow. Approxi-mately 35 min were required to develop a monolayer of a reduced vanadate species. Theadsorption of the inhibitor likely blocked reactive sites on intermetallic particles, discouraging theoxygen reduction reaction (ORR). Adsorption of the inhibitor on the Al matrix could also displaceCl� ions, increasing the stability of the passive film and reducing the breakdown of S-phase particles.In contrast, decavanadates were shown to be poor inhibitors of the ORR. A sharp current spike wasobserved after injection of decavanadates for both Cu and AA2024-T3 at various applied cathodicpotentials. Integration of the current peaks suggested the formation of several monolayers of areduced vanadate species. The formation of several monolayers was in line with the poor perfor-mance of decavanadates as inhibitors of AA2024-T3 corrosion.� 2006 Elsevier Ltd. All rights reserved.
Keywords: A. Aluminum; B. XPS; B. Polarization; C. Pitting corrosion; C. Oxygen reduction
0010-938X/$ - see front matter � 2006 Elsevier Ltd. All rights reserved.
doi:10.1016/j.corsci.2006.10.027
* Corresponding author. Tel.: +1 614 761 6959.E-mail address: [email protected] (M. Iannuzzi).
2372 M. Iannuzzi, G.S. Frankel / Corrosion Science 49 (2007) 2371–2391
1. Introduction
Aluminium alloy 2024-T3 (AA2024-T3) is a heat-treatable high strength aluminiumalloy that is used as fuselage skin and structural material in aircraft design due to the com-bination of good mechanical properties and light weight [1,2]. However, AA2024-T3 issusceptible to localized corrosion. The susceptibility of aluminium alloys to localized cor-rosion strongly depends on the distribution and electrochemical properties of intermetalliccompounds (IMCs) and second phase particles [3–9]. Aluminium alloys for aerospaceapplications are protected from the aggressive environment using multi-layered coatingsystems based on the chemistry of chromates [10–17]. A suitable candidate for chromatereplacement has not yet been developed for the most demanding applications [10].
In a recent publication, we discussed the complex speciation of the vanadate system inaqueous solutions of interest for corrosion studies [18]. In short, as-prepared solutions ofNaVO3 dissolved in 0.5 M NaCl remain colourless. According to 51V nuclear magnetic res-onance spectroscopy (NMR), clear metavanadate solutions contain monovanadate (V1),divanadate (V2), tetravanadate (V4) and pentavanadate (V5) species [19–23]. Polymerizationof these oligomers to form orange decavanadates (V10) occurs during acidification[19,20,22–25]. Thus, if the pH of clear solutions is adjusted to pH 4, only signal from V10
is detected by 51V NMR, indicating complete polymerization of V1–V5. Re-adjusting the pHof the orange electrolytes to pH 8.71 partially de-polymerizes V10 to give V2, V4, and V5.51V NMR also showed that the monovanadates are present exclusively in clear metavana-date electrolytes. In contrast, V10 and V4 are the predominant species in orange solutions [18].
The electrochemical behaviour of A2024-T3 in clear metavanadate solutions containingmonovanadates but no decavanadates was markedly different than in orange solutionscontaining decavanadates but no monovanadates [18]. The presence of monovanadatesremarkably reduced the rate of the oxygen reduction reaction (ORR) to an extent compa-rable to values reported for chromates [18]. On the contrary, orange solutions containingdecavanadates did not lower the rate the ORR significantly.
The corrosion inhibition mechanisms of clear metavanadate and orange decavanadatesolutions have been investigated [26,27]. The injection of clear metavanadate solutionscontaining monovanadate (V1) to the cathode side of different split cell setups reducedthe galvanic current to a large extent, confirming a potent inhibition of the ORR. Thereduction in galvanic current was not accompanied by a current spike that might be attrib-uted to vanadate reduction. In all cases a rapid decay in galvanic current was observed.These findings are in clear contrast to results obtained by Clark et al. for the chromatesystem [28,29]. Injection of Cr6+ during split cell experiments and chronoamperometryproduced a sharp current spike. These transient events were associated with the formationof a Cr3+ monolayer by reduction of Cr6+, which inhibited the ORR and further Cr6+
reduction. The absence of a reduction peak after injection of metavanadates suggested thatmetavanadates lowered the rate of the ORR by adsorbing on the surface and blockingsites rather than by a reduction process.
In contrast, the injection of orange solutions containing decavanadates but no mono-vanadates generated a current peak possibly associated with V10 reduction, followed bya modest decrease in current [18]. This suggests that the reduction of decavanadates didnot form a protective film as in the case of chromates. The fact that a difference in speci-ation gave such a contrast in electrochemical behaviour is a very interesting phenomenonthat requires further investigation.
M. Iannuzzi, G.S. Frankel / Corrosion Science 49 (2007) 2371–2391 2373
In this paper, chronoamperometry, polarization curves and adsorption isotherms wereutilized to further analyze the mechanisms of inhibition by vanadates. In addition the for-mation of a vanadium rich surface film was studied by X-ray photoelectron spectroscopy(XPS). The residual protection of the film was also investigated.
Adsorption isotherms are commonly used in corrosion inhibition studies [30,31]. Adsorp-tion isotherms describe the equilibria of the adsorbed species at the electrode/electro-lyte interface [31]. All adsorption isotherms can be described by a generalized equation [31]:
f ðh; xÞ expð�ahÞ ¼ KCi ð1Þwhere h represents the adsorption coverage, a the molecular interaction parameter, x the sizeratio, K the adsorption constant and Ci the concentration of the inhibitor [31]. The functionf(h,x) is the configurational term, which depends on the assumptions made to derive the iso-therms [31]. As explained by Kern and Landolt, the size ratio x represents the relative size ofthe adsorbate compared to the solvent molecules [4]. The molecular interaction parameter a
accounts for the lateral interactions between adsorbed species [31]. In general, adsorptionisotherms contain either x or a, but rarely both parameters [31]. Analysis of the two param-eter isotherms is done by linear fitting of the double logarithmic curves [30,31]. The Lang-muir isotherm represents the simplest case where each active surface site canaccommodate only one adsorbate molecule with no lateral interaction between them [32]:
hð1� hÞ ¼ KCi or
Ci
h¼ 1
Kþ Ci ð2Þ
where h is the surface coverage, K the adsorption equilibrium constant and Ci the concen-tration of the inhibitor. Assuming that complete coverage of the surface gives 100% reduc-tion in current, it is common to define h as:
h ¼ 1� iðinhibitorÞ
iðfreeÞð3Þ
where i(inhibitor) represents the corrosion rate in the presence of an inhibitor and i(free) therate in the absence of an inhibitor [30]. This definition is general and i(free) and i(inhibitor) canbe readily replaced by polarization resistance, or weight lost values [30,31,33]. When eval-uating a cathodic inhibitor it is common to use the current measured at an arbitrary catho-dic potential. In general, h represents the corrosion inhibition efficiency. The adsorptionequilibrium constant K is related to the free energy of adsorption by [33–35]:
K ¼ 1
55:5exp
�DG0abs
RT
� �ð4Þ
where K is the adsorption equilibrium constant in (1/mol), DG0abs is the free energy of
adsorption in (J/mol); R represents the gas constant (8.31 J/mol K) and T the temperaturein Kelvin.
2. Experimental
2.1. Materials and sample preparation
Sodium vanadium oxide, 98% NaVO3, and reagent-grade sodium chloride were obtainedfrom Sigma-Aldrich. All solutions were prepared with 18.2 MX-cm deionised water. Clearmetavanadate solutions containing monovanadate and orange solutions containing
2374 M. Iannuzzi, G.S. Frankel / Corrosion Science 49 (2007) 2371–2391
decavanadates were prepared as described previously [18]. In short, metavanadate solutionswere prepared by dissolving NaVO3 in 0.5 M NaCl and adjusting the as-prepared pH tothe higher value of 8.71. Orange solutions containing decavanadates were prepared by acid-ification of the clear solutions to pH 4 using concentrated HCl, and subsequent re-adjust-ment to pH 8.71. Prepared in this fashion, monovanadates (V1) are present only in clearsolutions and decavanadates (V10) are present only in orange electrolytes [18]. For simplic-ity, these solutions will be referred to as orange decavanadate and clear metavanadatesolutions, respectively, even though the former solutions also contain some metavanadates.
Two different AA2024-T3 panels (nominal composition 3.8–4.9% Cu, 1.2–1.8% Mg,0.3–0.9% Mn, 0.5% Fe, 0.5% Si, 0.25% Zn, 0.1% Cr, 0.05% Ti, balance Al), were testedwith 1 and 5 mm thickness, respectively. The samples were mounted in epoxy resin, expos-ing the rolled surface; ground through 1200 grit SiC papers (Buehler), and polished with 3and 1 lm diamond paste (Buehler). Ethyl alcohol (<0.2% water) was used as lubricantduring all the surface preparation stages to minimize corrosion damage during grindingand polishing. Pure Cu (99.95%) coupons were cut from 50 mm plates, mounted in epoxyresin and polished following similar procedures.
2.2. Chronoamperometry
Effects of metavanadate and decavanadate injections at varied applied potentials wereinvestigated by measuring the time evolution of the cathodic current at constant appliedpotential. Concentrated solutions containing metavanadates or decavanadates wereinjected to make 5 mM total vanadate after mixing. The final pH after mixing was 7.6in all the experiments. A VoltaLab PGP-201 potentiostat was used with a platinum meshcounter-electrode and a SCE reference electrode.
2.3. Potentiodynamic polarization curves
Electrochemical tests were carried out using either a Gamry PC3/300 or a VoltaLabPGP-201 potentiostat. In both chronoamperometry and electrochemical tests, a Luggincapillary filled with an agar-agar gel made with 0.5 M NaCl was used. Samples werecleaned and degreased with ethyl alcohol before testing. Each experiment was repeatedat least in triplicate.
Cathodic polarization experiments were carried out in aerated and deaerated solutions.Aeration was achieved by bubbling purified compressed air for 1 h prior to the experiment.The air flow was reduced but not stopped during measurements. The solution was stirredduring the experiment to generate a more reproducible limiting current for the ORR (iL).Deaeration was achieved by 1 h Ar degassing and stirring. After 1 h, samples were loweredinto the electrolyte and the OCP was measured for 15 min. The flow of Ar was reduced butnot stopped during the experiment. The potential sweep started 10 mV above OCP andwas stopped when the current density reached �2 mA/cm2. A scan rate of 1 mV/s wasused and the total exposed area was approximately 1 cm2.
2.4. X-ray photoelectron spectroscopy
Vanadium at the surface was investigated by XPS. Cu and AA2024-T3 samples werepolarized at fixed cathodic potentials for 3 h. Concentrated 150 mM metavanadate and
M. Iannuzzi, G.S. Frankel / Corrosion Science 49 (2007) 2371–2391 2375
decavanadate solutions were injected after 15 min to make 5 mM total vanadate after dilu-tion. Samples were removed under potential control and gently rinsed with DI water. Thecoupons were allowed to dry in a desiccator under low vacuum. XPS spectra wereacquired using a Kratos Axis Ultra with a monochromated Al X-ray source at 130 W.
3. Results
3.1. Chronoamperometry
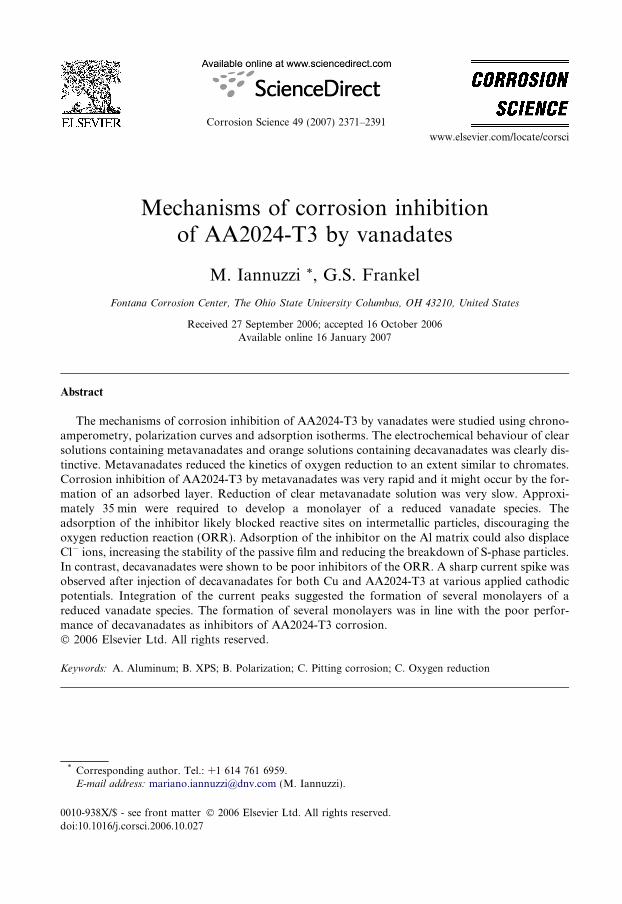
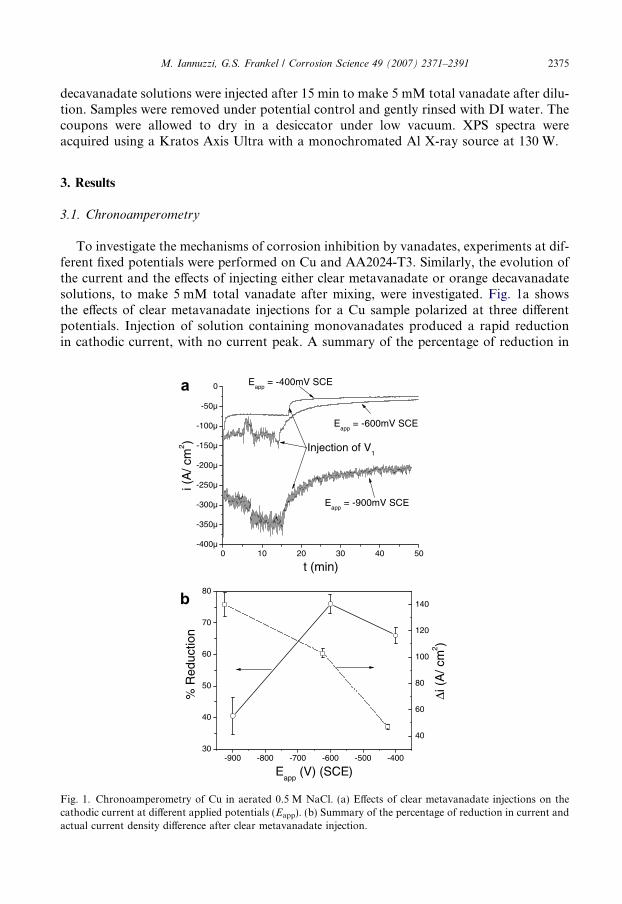
To investigate the mechanisms of corrosion inhibition by vanadates, experiments at dif-ferent fixed potentials were performed on Cu and AA2024-T3. Similarly, the evolution ofthe current and the effects of injecting either clear metavanadate or orange decavanadatesolutions, to make 5 mM total vanadate after mixing, were investigated. Fig. 1a showsthe effects of clear metavanadate injections for a Cu sample polarized at three differentpotentials. Injection of solution containing monovanadates produced a rapid reductionin cathodic current, with no current peak. A summary of the percentage of reduction in
0 10 20 30 40 50-400µ
-350µ
-300µ
-250µ
-200µ
-150µ
-100µ
-50µ
0
Eapp
= -900mV SCE
Eapp
= -600mV SCE
i (A
/ cm
2 )
t (min)
Eapp
= -400mV SCE
Injection of V1
-900 -800 -700 -600 -500 -40030
40
50
60
70
80
40
60
80
100
120
140
% R
educ
tion
Eapp
(V) (SCE)
Δi (
A/ c
m2 )
Fig. 1. Chronoamperometry of Cu in aerated 0.5 M NaCl. (a) Effects of clear metavanadate injections on thecathodic current at different applied potentials (Eapp). (b) Summary of the percentage of reduction in current andactual current density difference after clear metavanadate injection.
2376 M. Iannuzzi, G.S. Frankel / Corrosion Science 49 (2007) 2371–2391
current and the actual difference in current density (Di) before and after injection of theclear metavanadate solutions is shown in Fig. 1b. The percentage of current reduction,which can also be thought of as the inhibition efficiency, reached a maximum value of76% at an applied potential of�600 mV SCE. The total current density difference increasedas the applied potential decreased. Experiments were also performed on AA2024-T3 andpure Al. No current peaks were observed even at very negative applied potentials.
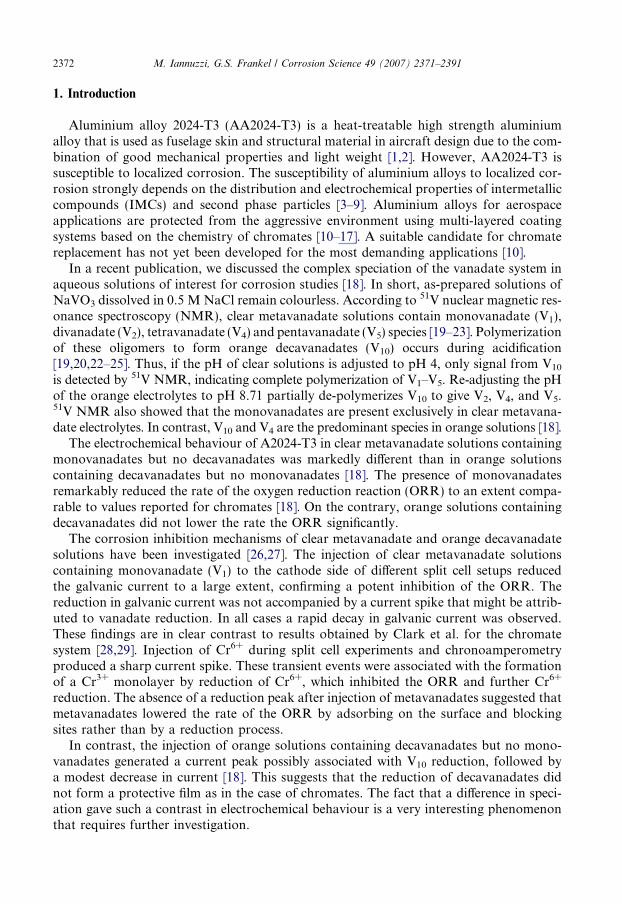
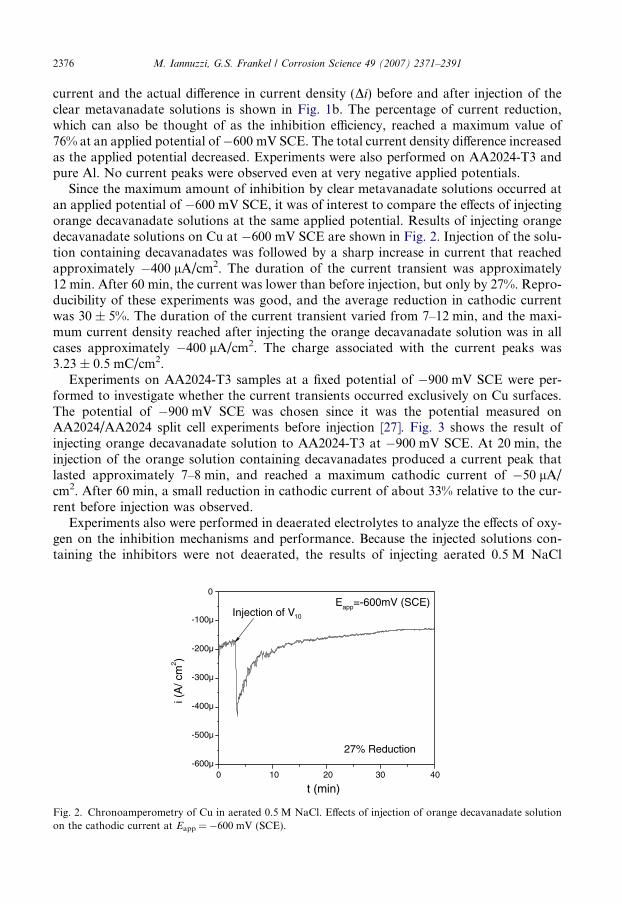
Since the maximum amount of inhibition by clear metavanadate solutions occurred atan applied potential of �600 mV SCE, it was of interest to compare the effects of injectingorange decavanadate solutions at the same applied potential. Results of injecting orangedecavanadate solutions on Cu at �600 mV SCE are shown in Fig. 2. Injection of the solu-tion containing decavanadates was followed by a sharp increase in current that reachedapproximately �400 lA/cm2. The duration of the current transient was approximately12 min. After 60 min, the current was lower than before injection, but only by 27%. Repro-ducibility of these experiments was good, and the average reduction in cathodic currentwas 30 ± 5%. The duration of the current transient varied from 7–12 min, and the maxi-mum current density reached after injecting the orange decavanadate solution was in allcases approximately �400 lA/cm2. The charge associated with the current peaks was3.23 ± 0.5 mC/cm2.
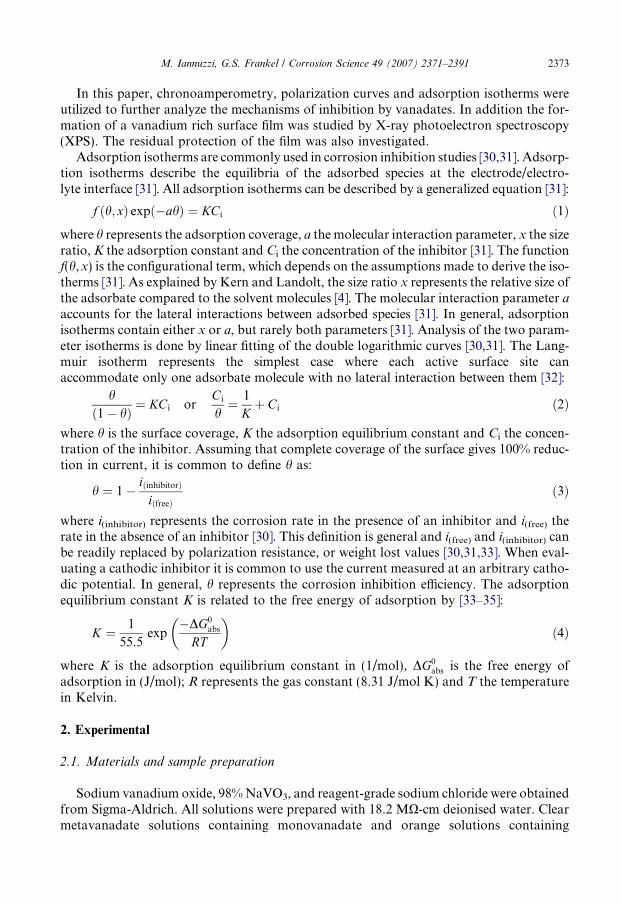
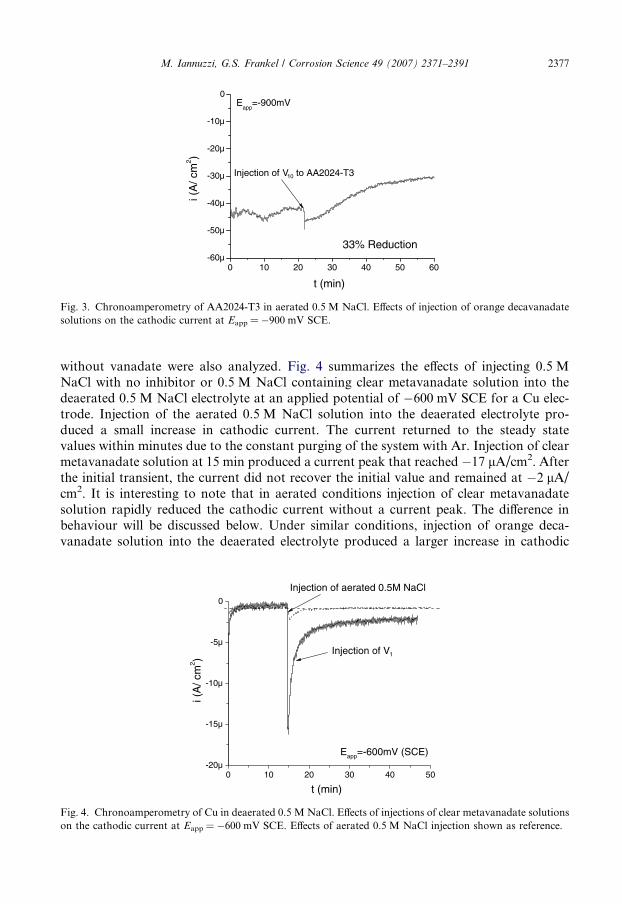
Experiments on AA2024-T3 samples at a fixed potential of �900 mV SCE were per-formed to investigate whether the current transients occurred exclusively on Cu surfaces.The potential of �900 mV SCE was chosen since it was the potential measured onAA2024/AA2024 split cell experiments before injection [27]. Fig. 3 shows the result ofinjecting orange decavanadate solution to AA2024-T3 at �900 mV SCE. At 20 min, theinjection of the orange solution containing decavanadates produced a current peak thatlasted approximately 7–8 min, and reached a maximum cathodic current of �50 lA/cm2. After 60 min, a small reduction in cathodic current of about 33% relative to the cur-rent before injection was observed.
Experiments also were performed in deaerated electrolytes to analyze the effects of oxy-gen on the inhibition mechanisms and performance. Because the injected solutions con-taining the inhibitors were not deaerated, the results of injecting aerated 0.5 M NaCl
0 10 20 30 40-600µ
-500µ
-400µ
-300µ
-200µ
-100µ
0
i (A
/ cm
2 )
t (min)
Injection of V10
27% Reduction
Eapp=-600mV (SCE)
Fig. 2. Chronoamperometry of Cu in aerated 0.5 M NaCl. Effects of injection of orange decavanadate solutionon the cathodic current at Eapp = �600 mV (SCE).
0 10 20 30 40 50 60-60µ
-50µ
-40µ
-30µ
-20µ
-10µ
0
i (A
/ cm
2 )
t (min)
Eapp
=-900mV
Injection of V10 to AA2024-T3
33% Reduction
Fig. 3. Chronoamperometry of AA2024-T3 in aerated 0.5 M NaCl. Effects of injection of orange decavanadatesolutions on the cathodic current at Eapp = �900 mV SCE.
M. Iannuzzi, G.S. Frankel / Corrosion Science 49 (2007) 2371–2391 2377
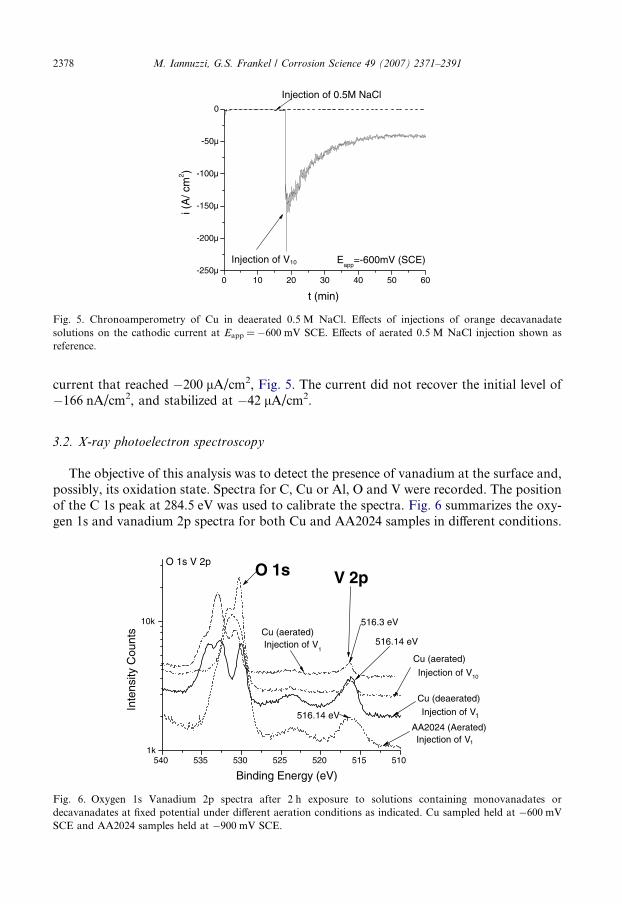
without vanadate were also analyzed. Fig. 4 summarizes the effects of injecting 0.5 MNaCl with no inhibitor or 0.5 M NaCl containing clear metavanadate solution into thedeaerated 0.5 M NaCl electrolyte at an applied potential of �600 mV SCE for a Cu elec-trode. Injection of the aerated 0.5 M NaCl solution into the deaerated electrolyte pro-duced a small increase in cathodic current. The current returned to the steady statevalues within minutes due to the constant purging of the system with Ar. Injection of clearmetavanadate solution at 15 min produced a current peak that reached �17 lA/cm2. Afterthe initial transient, the current did not recover the initial value and remained at �2 lA/cm2. It is interesting to note that in aerated conditions injection of clear metavanadatesolution rapidly reduced the cathodic current without a current peak. The difference inbehaviour will be discussed below. Under similar conditions, injection of orange deca-vanadate solution into the deaerated electrolyte produced a larger increase in cathodic
0 10 20 30 40 50-20µ
-15µ
-10µ
-5µ
0
Injection of V1
i (A
/ cm
2 )
t (min)
Injection of aerated 0.5M NaCl
Eapp=-600mV (SCE)
Fig. 4. Chronoamperometry of Cu in deaerated 0.5 M NaCl. Effects of injections of clear metavanadate solutionson the cathodic current at Eapp = �600 mV SCE. Effects of aerated 0.5 M NaCl injection shown as reference.
0 10 20 30 40 50 60-250µ
-200µ
-150µ
-100µ
-50µ
0
Injection of 0.5M NaCl
i (A
/ cm
2 )
t (min)
Injection of V10 Eapp
=-600mV (SCE)
Fig. 5. Chronoamperometry of Cu in deaerated 0.5 M NaCl. Effects of injections of orange decavanadatesolutions on the cathodic current at Eapp = �600 mV SCE. Effects of aerated 0.5 M NaCl injection shown asreference.
2378 M. Iannuzzi, G.S. Frankel / Corrosion Science 49 (2007) 2371–2391
current that reached �200 lA/cm2, Fig. 5. The current did not recover the initial level of�166 nA/cm2, and stabilized at �42 lA/cm2.
3.2. X-ray photoelectron spectroscopy
The objective of this analysis was to detect the presence of vanadium at the surface and,possibly, its oxidation state. Spectra for C, Cu or Al, O and V were recorded. The positionof the C 1s peak at 284.5 eV was used to calibrate the spectra. Fig. 6 summarizes the oxy-gen 1s and vanadium 2p spectra for both Cu and AA2024 samples in different conditions.
540 535 530 525 520 515 5101k
10k
O 1s
Cu (aerated)
Injection of V10
Cu (aerated)Injection of V
1
Inte
nsity
Cou
nts
Binding Energy (eV)
AA2024 (Aerated)Injection of V1
Cu (deaerated)
Injection of V1
O 1s V 2p
516.3 eV
516.14 eV
516.14 eV
V 2p
Fig. 6. Oxygen 1s Vanadium 2p spectra after 2 h exposure to solutions containing monovanadates ordecavanadates at fixed potential under different aeration conditions as indicated. Cu sampled held at �600 mVSCE and AA2024 samples held at �900 mV SCE.
M. Iannuzzi, G.S. Frankel / Corrosion Science 49 (2007) 2371–2391 2379
In comparison to the other elements, the intensity of the vanadium peaks was very small.The vanadium peaks were at a binding energy in the range of 516.14–516.3 eV with anexperimental error of 0.2 eV.
3.3. Residual protection
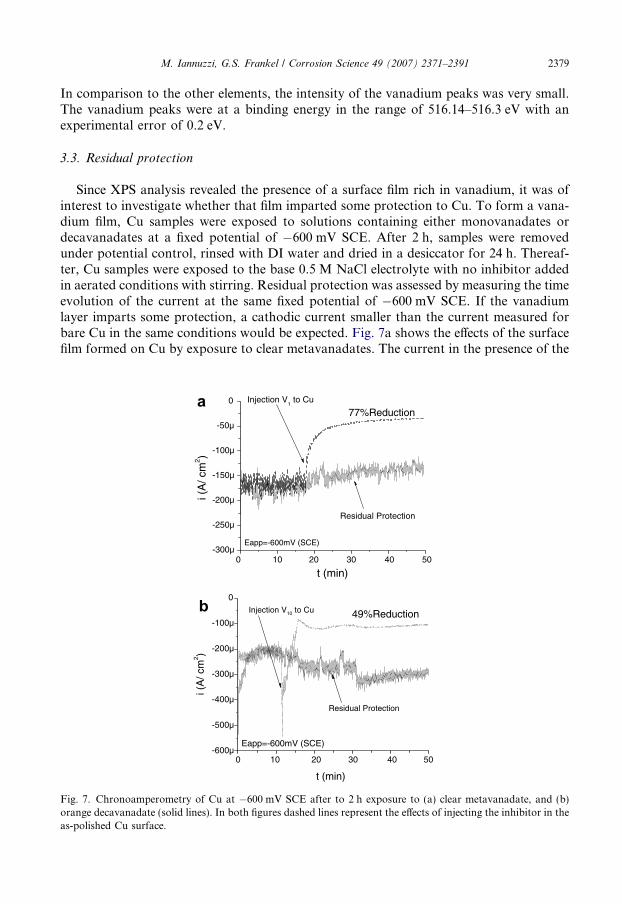
Since XPS analysis revealed the presence of a surface film rich in vanadium, it was ofinterest to investigate whether that film imparted some protection to Cu. To form a vana-dium film, Cu samples were exposed to solutions containing either monovanadates ordecavanadates at a fixed potential of �600 mV SCE. After 2 h, samples were removedunder potential control, rinsed with DI water and dried in a desiccator for 24 h. Thereaf-ter, Cu samples were exposed to the base 0.5 M NaCl electrolyte with no inhibitor addedin aerated conditions with stirring. Residual protection was assessed by measuring the timeevolution of the current at the same fixed potential of �600 mV SCE. If the vanadiumlayer imparts some protection, a cathodic current smaller than the current measured forbare Cu in the same conditions would be expected. Fig. 7a shows the effects of the surfacefilm formed on Cu by exposure to clear metavanadates. The current in the presence of the
-300µ
-250µ
-200µ
-150µ
-100µ
-50µ
0
Eapp=-600mV (SCE)
i (A
/ cm
2 )
t (min)
Residual Protection
Injection V1 to Cu
77%Reduction
0 10 20 30 40 50-600µ
-500µ
-400µ
-300µ
-200µ
-100µ
0
i (A
/ cm
2 )
t (min)
49%ReductionInjection V10 to Cu
Residual Protection
Eapp=-600mV (SCE)
0 10 20 30 40 50
Fig. 7. Chronoamperometry of Cu at �600 mV SCE after to 2 h exposure to (a) clear metavanadate, and (b)orange decavanadate (solid lines). In both figures dashed lines represent the effects of injecting the inhibitor in theas-polished Cu surface.
2380 M. Iannuzzi, G.S. Frankel / Corrosion Science 49 (2007) 2371–2391
V surface film was identical to the current on bare Cu, and the effect of injecting a clearmetavanadate solution is seen to be much greater. Similar results were found analyzingsurface films formed by exposing Cu to orange decavanadates at the same potential,Fig. 7b. These findings suggest that the surface films were not robust and imparted noreduction of the ORR in a solution without inhibitor.
4. Discussion
4.1. Chronoamperometry
The reversible potential for the reduction of the different metavanadates depends on pHand total vanadate concentration [36]. The reversible potential at pH 7.6 for theHVO2�
4 =HV2O�3 reduction reaction is approximately �420 mV SCE and for theH2VO�4 =HV2O�5 reduction reaction approximately �380 mV SCE. Likewise, the reversiblepotential for the reduction of divanadates, H3V2O�7 =HV2O�5 , is approximately �300 mVSCE [36]. 51V NMR data were used to obtain the concentration of the different vanadatespecies needed to calculate the reversible potentials [18]. Consequently, lower appliedpotentials should increase the driving force for those reactions to occur. However, in aer-ated conditions no current spike was observed upon injection of clear metavanadate solu-tion. The absence of a current spike associated with the electrochemical reduction of theinhibitor suggests that the inhibition results from a surface film formed by adsorption.
To evaluate if there was a dependency of inhibition on concentration of metavanadates,adsorption isotherms were constructed using the cathodic polarization plots. Cathodicpolarization curves were measured on AA2024-T3 samples in aerated conditions with stir-ring. The concentration of clear metavanadates varied from 0.001–5 mM. The i(inhibitor)
and the i(free) were determined by extrapolating the linear regions observed in cathodicpolarization plots to the high potential of �700 mV SCE. This definition is arbitrarybut gives a fair representation of the behaviour of the system.
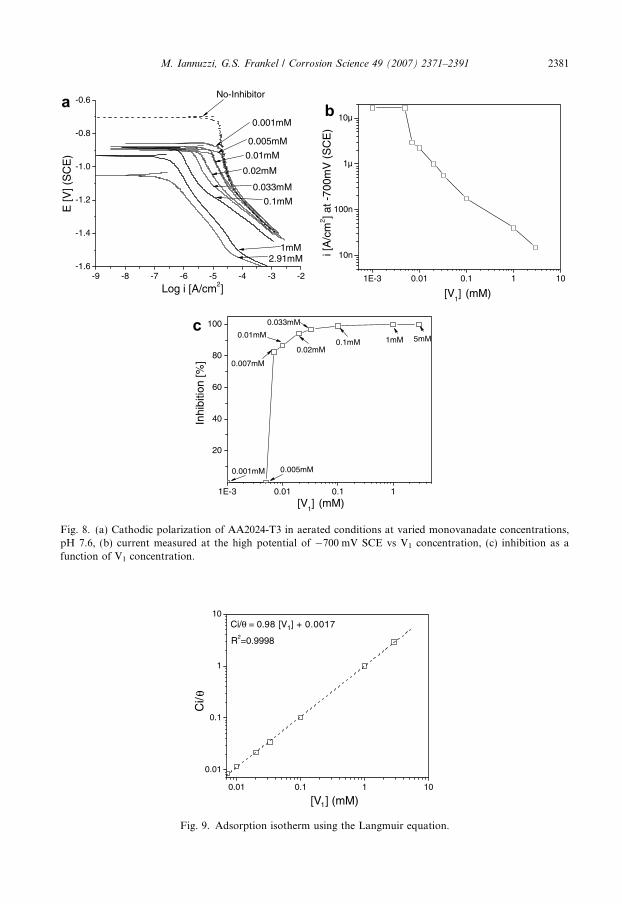
Fig. 8 shows cathodic polarization curves, the inhibition efficiency and the actual catho-dic current measured at �700 mV SCE as a function of concentration of monovanadate(determined by 51V NMR [18]). The pH of the solutions was fixed at pH 7.6, which cor-responds to the as-prepared pH of a 5 mM clear metavanadate solution. The Langmuiradsorption isotherm is shown in Fig. 9. The cathodic polarization curves showed thatthe cathodic current associated with the ORR was gradually reduced by incrementalamounts of the inhibitor, Fig. 8a and b. Therefore, the inhibition efficiency increased withincremental amounts of monovanadates, Fig. 8c. The minimum concentration of mono-vanadate that reduced the cathodic kinetics of oxygen reduction was 0.005 mM. Inhibitionjumped from 0% to 80% when the monovanadate concentration increased from 0.005 mMto 0.007 mM. This critical concentration of inhibitor is extremely low and similar to thereported critical concentration of Cr6+ [10,15,18,37–39]. Langmuir isotherms gave the bestfit of the data, suggesting that there were no lateral interactions between adsorbed mole-cules. Ci/h scaled with both monovanadate and total metavanadate concentrations. How-ever, the best fit of the data was obtained using the concentration of monovanadate. Theslope was almost unity and 1/K was approximately 0.0017 (1/mol). Using the dataobtained by fitting of the adsorption isotherm, a DG0
abs of �25.12 kJ/mol is obtained. Thisvalue is in good agreement with data reported in the literature and the negative sign rep-resents that adsorption is spontaneous [31,33–35,40]. This also suggests that adsorption
-9 -8 -7 -6 -5 -4 -3 -2-1.6
-1.4
-1.2
-1.0
-0.8
-0.6
2.91mM
E [V
] (S
CE
)
Log i [A/cm2]
0.001mM
0.005mM
0.02mM
0.033mM
0.01mM
0.1mM
1mM
No-Inhibitor
1E-3 0.01 0.1 1 10
10n
100n
1µ
10µ
i [A
/cm
2 ] at -
700m
V (
SC
E)
[V1] (mM)
[V1] (mM)
1E-3 0.01 0.1 1
20
40
60
80
100
0.007mM
0.001mM 0.005mM
0.01mM
0.02mM
0.033mM
0.1mM 1mM
Inhi
bitio
n [%
]
5mM
Fig. 8. (a) Cathodic polarization of AA2024-T3 in aerated conditions at varied monovanadate concentrations,pH 7.6, (b) current measured at the high potential of �700 mV SCE vs V1 concentration, (c) inhibition as afunction of V1 concentration.
0.01 0.1 1 10
0.01
0.1
1
10
Ci/
[V1] (mM)
Ci/θ = 0.98 [V1] + 0.0017
R2=0.9998
θ
Fig. 9. Adsorption isotherm using the Langmuir equation.
M. Iannuzzi, G.S. Frankel / Corrosion Science 49 (2007) 2371–2391 2381
2382 M. Iannuzzi, G.S. Frankel / Corrosion Science 49 (2007) 2371–2391
occurs immediately after injection of the clear metavanadate solution. DG0abs ranging from
�15 to �30 kJ/mol indicates that the molecules are physically adsorbed rather than chem-isorbed. Chemisorption is characterized by free energies of about �100 kJ/mol [41].
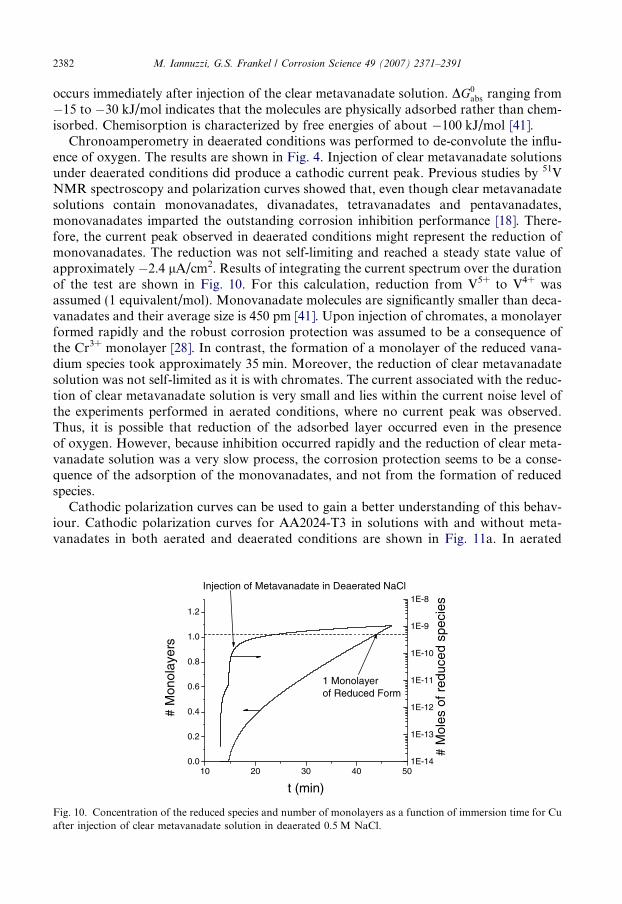
Chronoamperometry in deaerated conditions was performed to de-convolute the influ-ence of oxygen. The results are shown in Fig. 4. Injection of clear metavanadate solutionsunder deaerated conditions did produce a cathodic current peak. Previous studies by 51VNMR spectroscopy and polarization curves showed that, even though clear metavanadatesolutions contain monovanadates, divanadates, tetravanadates and pentavanadates,monovanadates imparted the outstanding corrosion inhibition performance [18]. There-fore, the current peak observed in deaerated conditions might represent the reduction ofmonovanadates. The reduction was not self-limiting and reached a steady state value ofapproximately �2.4 lA/cm2. Results of integrating the current spectrum over the durationof the test are shown in Fig. 10. For this calculation, reduction from V5+ to V4+ wasassumed (1 equivalent/mol). Monovanadate molecules are significantly smaller than deca-vanadates and their average size is 450 pm [41]. Upon injection of chromates, a monolayerformed rapidly and the robust corrosion protection was assumed to be a consequence ofthe Cr3+ monolayer [28]. In contrast, the formation of a monolayer of the reduced vana-dium species took approximately 35 min. Moreover, the reduction of clear metavanadatesolution was not self-limited as it is with chromates. The current associated with the reduc-tion of clear metavanadate solution is very small and lies within the current noise level ofthe experiments performed in aerated conditions, where no current peak was observed.Thus, it is possible that reduction of the adsorbed layer occurred even in the presenceof oxygen. However, because inhibition occurred rapidly and the reduction of clear meta-vanadate solution was a very slow process, the corrosion protection seems to be a conse-quence of the adsorption of the monovanadates, and not from the formation of reducedspecies.
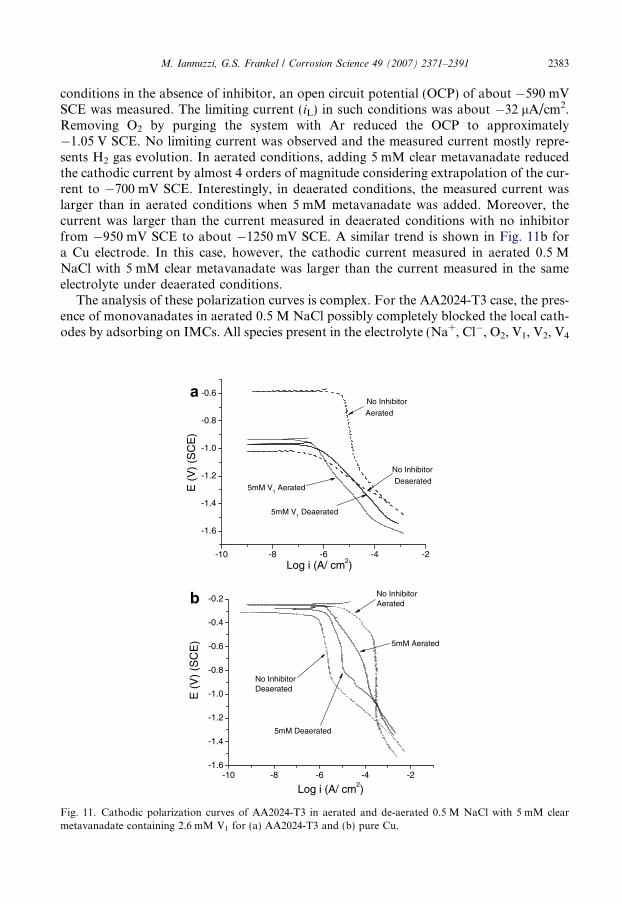
Cathodic polarization curves can be used to gain a better understanding of this behav-iour. Cathodic polarization curves for AA2024-T3 in solutions with and without meta-vanadates in both aerated and deaerated conditions are shown in Fig. 11a. In aerated
10 20 30 40 500.0
0.2
0.4
0.6
0.8
1.0
1.2
1E-14
1E-13
1E-12
1E-11
1E-10
1E-9
1E-8
# M
onol
ayer
s
t (min)
# M
oles
of r
educ
ed s
peci
es
Injection of Metavanadate in Deaerated NaCl
1 Monolayerof Reduced Form
Fig. 10. Concentration of the reduced species and number of monolayers as a function of immersion time for Cuafter injection of clear metavanadate solution in deaerated 0.5 M NaCl.
M. Iannuzzi, G.S. Frankel / Corrosion Science 49 (2007) 2371–2391 2383
conditions in the absence of inhibitor, an open circuit potential (OCP) of about �590 mVSCE was measured. The limiting current (iL) in such conditions was about �32 lA/cm2.Removing O2 by purging the system with Ar reduced the OCP to approximately�1.05 V SCE. No limiting current was observed and the measured current mostly repre-sents H2 gas evolution. In aerated conditions, adding 5 mM clear metavanadate reducedthe cathodic current by almost 4 orders of magnitude considering extrapolation of the cur-rent to �700 mV SCE. Interestingly, in deaerated conditions, the measured current waslarger than in aerated conditions when 5 mM metavanadate was added. Moreover, thecurrent was larger than the current measured in deaerated conditions with no inhibitorfrom �950 mV SCE to about �1250 mV SCE. A similar trend is shown in Fig. 11b fora Cu electrode. In this case, however, the cathodic current measured in aerated 0.5 MNaCl with 5 mM clear metavanadate was larger than the current measured in the sameelectrolyte under deaerated conditions.
The analysis of these polarization curves is complex. For the AA2024-T3 case, the pres-ence of monovanadates in aerated 0.5 M NaCl possibly completely blocked the local cath-odes by adsorbing on IMCs. All species present in the electrolyte (Na+, Cl�, O2, V1, V2, V4
-10 -8 -6 -4 -2
-1.6
-1.4
-1.2
-1.0
-0.8
-0.6No Inhibitor
Aerated
5mM V1 Aerated
5mM V1 Deaerated
E (
V)
(SC
E)
Log i (A/ cm2)
No Inhibitor
Deaerated
-10 -8 -6 -4 -2-1.6
-1.4
-1.2
-1.0
-0.8
-0.6
-0.4
-0.2
5mM Deaerated
No InhibitorAerated
E (
V)
(SC
E)
Log i (A/ cm2)
No InhibitorDeaerated
5mM Aerated
Fig. 11. Cathodic polarization curves of AA2024-T3 in aerated and de-aerated 0.5 M NaCl with 5 mM clearmetavanadate containing 2.6 mM V1 for (a) AA2024-T3 and (b) pure Cu.
2384 M. Iannuzzi, G.S. Frankel / Corrosion Science 49 (2007) 2371–2391
and V5) compete for absorption sites. Taking into account the evidence presented here, itis hypothesized that the rapid adsorption of monovanadates displaces other species, form-ing an adsorbed film at the surface. The consequence of the surface coverage is slowerkinetics of the ORR as shown by the extremely large reduction in cathodic current.
Reduction of oxygen is a rather complex phenomenon [42,43]. It can occur by 2- or 4-electron pathways with the formation of numerous intermediates such as superoxide ðO�2 Þ,peroxide ðH2O2;HO�2 Þ, and hydroxyl radical (OH�) [42–44]. As shown by severalresearchers, oxygen reduction is strongly affected by adsorption [42–44]. Adsorption ofO2 to metal surfaces weakens the O–O bonds and/or its reduction products acceleratingthe kinetics of the ORR [42]. In this context, prevention of O2 adsorption is an effectivemeans of corrosion control in aerated environments [28,29,45–47]. As an example, onmodified carbon electrode surfaces the ORR is forced to occur by superoxide if adsorptionof O2 is completely suppressed [42,43]. If the ORR occurs via O�2 formation, oxygenbecomes a weak oxidizing agent, since the effective potential decreases from 1.23 V SHEto �0.3 V SHE [42,43]. Thus, adsorption of monovanadates on AA2024-T3 surfacesmay limit O2 adsorption and the subsequent rupture of the O–O bonds. Another possibil-ity is that the presence of a monovanadate surface film impedes electron transfer, makingO2 reduction more difficult. In addition, according to Fig. 11, evolution of H2 gas wasobserved at much lower potentials (about �1.5 V SCE).
In deaerated 0.5 M NaCl with metavanadates, the cathodic current was larger than inthe aerated case. The larger cathodic current is related to the electrochemical reduction ofmonovanadate. The evolution of H2(g) was also shifted toward lower potentials in thedeaerated case. Comparing aerated and deaerated cathodic polarization curves, it canbe hypothesized that the reduction of monovanadates is somehow limited by the presenceof oxygen in the solution, resulting in the lower cathodic current. Likewise, since bothpolarization curves have the same slope, suggesting a similar reduction reaction, it seemspossible that the reduction of monovanadates occurred even in aerated conditions but at alower rate due to a synergistic effect with O2, which may keep part of the adsorbed mono-vanadates in the 5+ oxidation state by rapidly re-oxidizing any reduced molecule.
A similar interpretation can be given to the cathodic polarization curves shown inFig. 11b. Whereas local reduction of oxygen on AA2024-T3 is limited only to IMCs, Cusurfaces have a much larger cathodic area. In such a case, adsorption of monovanadatesdoes not entirely cover the active surface sites. Therefore, oxygen can still be adsorbedand reduced on the sites not blocked by the inhibitor. The result is a cathodic polarizationplot that represents a convolution of both oxygen and monovanadate reduction. Conse-quently, the cathodic current was lower than the current measured in aerated 0.5 M NaClwith no inhibitor but larger than the current measured in deaerated 0.5 M NaCl with meta-vanadates. The mixed O2 and monovanadate reduction complicates the interpretation ofthe data. However, it is clear that in deaerated conditions, the measured cathodic currentincludes the reduction of monovanadates. On the other hand, it is not clear why the catho-dic polarization curves in deaerated 0.5 M NaCl with metavanadates showed an apparentdiffusion control region. The diffusion of monovanadates from the bulk to the active sitesnot blocked by the inhibitor is likely to be the rate limiting step. The problem of this inter-pretation is the calculated diffusion coefficient (D) for monovanadate. Assuming a diffusionlayer thickness, d, of 10�3 cm [48], a measured limiting current density iL of 9 · 10�6 A/cm2,a concentration gradient of V1 of 1.6 mM, and considering that the number of electronsinvolve in the reduction is 1, a diffusion coefficient of approximately 1 · 10�8 cm2/s is
M. Iannuzzi, G.S. Frankel / Corrosion Science 49 (2007) 2371–2391 2385
obtained. This value for D is extremely low for diffusion in liquid phase and may suggestthat the process is not under diffusion control even though an apparent limiting currentwas observed [49].
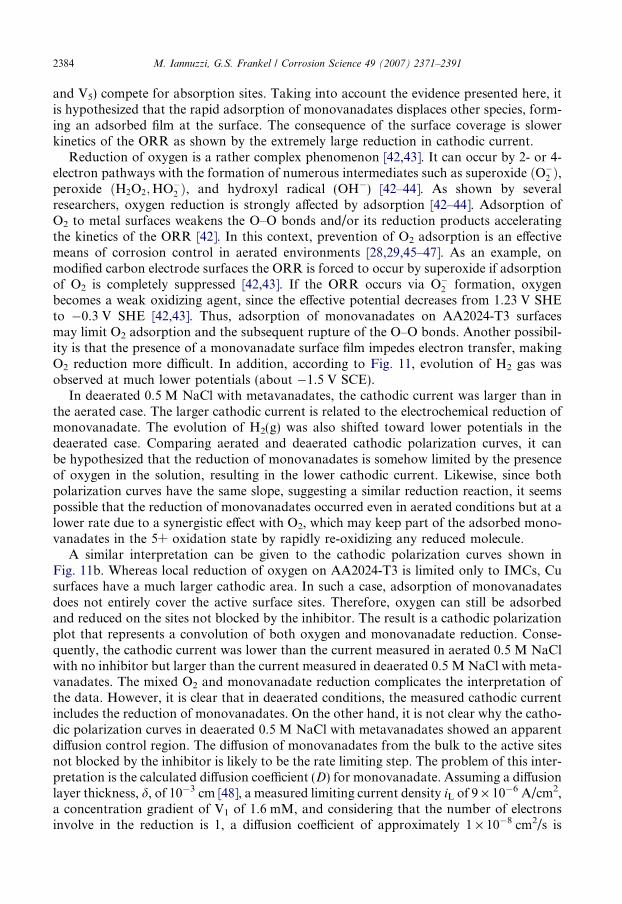
In aerated and deaerated conditions at an applied potential of �600 mV SCE, injectionof orange decavanadate solutions gave a current spike, Figs. 2 and 5. The duration of thetransient event varied between experiments. For aerated conditions, only 27% reduction inthe cathodic current was observed at the end of the experiment. Current spikes were alsoobserved on AA2024-T3 samples, which lasted approximately 7–8 min. In deaerated con-ditions, the current reached a steady state value of about �50 lA/cm2, which is 500·higher than the current prior to injection. In both aerated and deaerated solutions, the cur-rent peak must be associated with the electrochemical reduction of decavanadates.According to Fig. 5, the reduction of decavanadate is not self-limiting. Compared withthe reduction of metavanadates, the steady state current reached after injection of deca-vanadates was much larger. This indicates that the reduction of decavanadates is kineti-cally favoured over the reduction of monovanadates.
The integration of the current peaks for both aerated and deaerated conditions is shownin Fig. 12. Reduction from V5+ to V4+, and an average size of 750 pm for the decavanadate
0 5 10 15 200
2
4
6
8
10
1E-12
1E-11
1E-10
1E-9
1E-8
# M
onol
ayer
s
t (min)
# M
oles
of r
educ
ed s
peci
es
Injection of Decavanadatein Aerated NaCl
1 Monolayerof the Reduced Form
10 20 30 40 500
2
4
6
8
10
1E-10
1E-9
1E-8
# M
onol
ayer
s
t (min)
# M
oles
of r
educ
ed s
peci
esInjection of Decavanadate in Deaerated NaCl
1 Monolayerof The Reduced Form
Fig. 12. Concentration of the reduced species and number of monolayers as a function of immersion time for Cuafter injection of orange solution in (a) aerated and (b) deaerated 0.5 M NaCl.
2386 M. Iannuzzi, G.S. Frankel / Corrosion Science 49 (2007) 2371–2391
molecule were assumed for the integration [26,27]. In good agreement with other results[18,26,27], integration of the current peaks in both aerated and deaerated electrolytes sug-gested the formation of 10 monolayers. Since this calculation does not account for the pos-sible dissolution of the film, 10 monolayers represent the maximum number of monolayersformed. Nevertheless, the formation of several monolayers suggests the development of apoorly protective film of a reduced vanadate species.
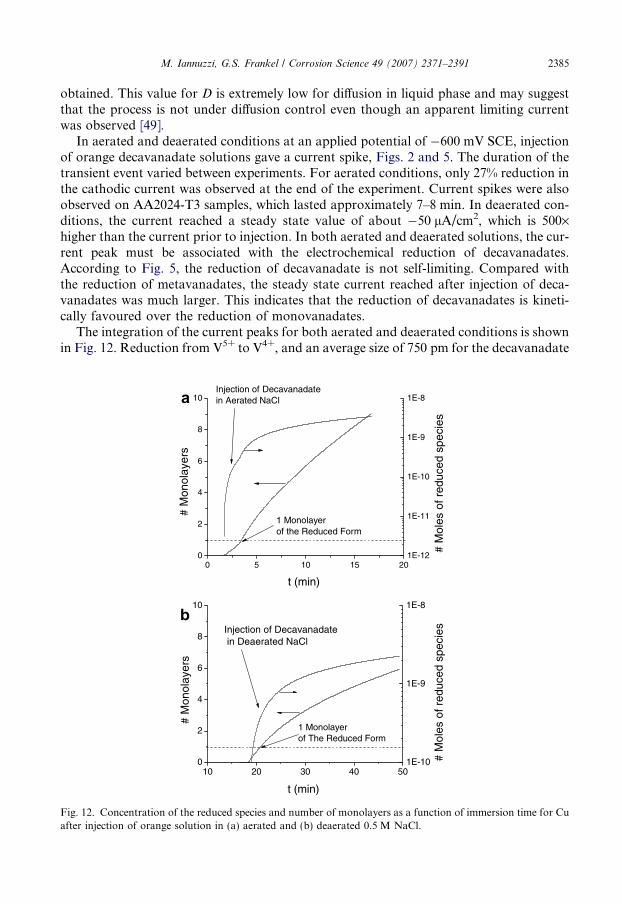
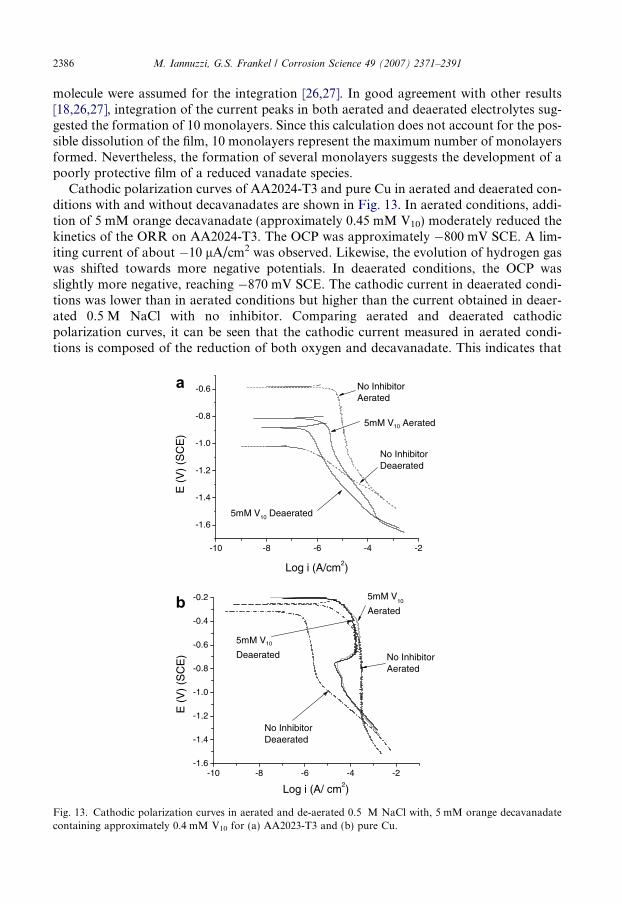
Cathodic polarization curves of AA2024-T3 and pure Cu in aerated and deaerated con-ditions with and without decavanadates are shown in Fig. 13. In aerated conditions, addi-tion of 5 mM orange decavanadate (approximately 0.45 mM V10) moderately reduced thekinetics of the ORR on AA2024-T3. The OCP was approximately �800 mV SCE. A lim-iting current of about �10 lA/cm2 was observed. Likewise, the evolution of hydrogen gaswas shifted towards more negative potentials. In deaerated conditions, the OCP wasslightly more negative, reaching �870 mV SCE. The cathodic current in deaerated condi-tions was lower than in aerated conditions but higher than the current obtained in deaer-ated 0.5 M NaCl with no inhibitor. Comparing aerated and deaerated cathodicpolarization curves, it can be seen that the cathodic current measured in aerated condi-tions is composed of the reduction of both oxygen and decavanadate. This indicates that
-10 -8 -6 -4 -2
-1.6
-1.4
-1.2
-1.0
-0.8
-0.6
E (
V)
(SC
E)
Log i (A/cm2)
No InhibitorDeaerated
No InhibitorAerated
5mM V10 Aerated
5mM V10 Deaerated
-10 -8 -6 -4 -2-1.6
-1.4
-1.2
-1.0
-0.8
-0.6
-0.4
-0.2
5mM V10
Deaerated No InhibitorAerated
E (
V)
(SC
E)
Log i (A/ cm2)
No InhibitorDeaerated
5mM V10
Aerated
Fig. 13. Cathodic polarization curves in aerated and de-aerated 0.5 M NaCl with, 5 mM orange decavanadatecontaining approximately 0.4 mM V10 for (a) AA2023-T3 and (b) pure Cu.
M. Iannuzzi, G.S. Frankel / Corrosion Science 49 (2007) 2371–2391 2387
when decavanadates are present and monovanadates are absent, adsorption on the localcathodic sites is not complete, allowing oxygen to reduce on the unprotected IMCs. Thepartial coverage of local cathodes and the easier reduction of decavanadates result inthe lower inhibition efficiency reported previously [18]. These findings could also explainwhy the inhibition efficiency of solutions containing decavanadates decreased with incre-mental concentrations of V10 [18,26]. As the concentration increases, the amount of reduc-tion of decavanadates is expected to increase accordingly, giving as result a larger cathodiccurrent during polarization experiments. This larger cathodic current resulted in thepoorer inhibition efficiency.
The effects of decavanadates are more dramatic on Cu surfaces (Fig. 13b). Cathodicpolarization curves in aerated and deaerated solutions containing 5 mM vanadate lookedalmost identical. Therefore, the limiting current could be related to diffusion controlledreduction of decavanadates rather than oxygen. The calculated diffusion coefficient fordecavanadates in such conditions is approximately 3 · 10�8 cm2/s. Similar to the case ofreduction of monovanadates; this diffusivity is extremely low for diffusion in liquid phase.This may also suggest that even though an apparent diffusion limited region was observed,the process was not under diffusion control. A similar anomalous behaviour was reportedby Scully and co-workers for molybdates on Cu electrodes [50]. The decay in current thatoccurred at approximately �650 mV SCE, could be related with the formation of a surfacefilm that reduced charge transference. As in the case of molybdates [26], the subsequentincrease in current is possibly the result of the electrochemical reduction of the surfacefilm.
These results are of interest due to the fact that pure Cu represents the upper limit of S-phase de-alloying and Cu redistribution on AA2024-T3 surfaces [3,51–53]. Thus, asAA2024-T3 corrodes in electrolytes containing Cl� and decavanadates, Cu redistributionwill significantly increase the ability of the surface to sustain not only O2 reduction butalso reduction of decavanadates. The consequence of the faster reduction kinetics is anaccelerated attack, which eventually will increase the extent of Cu re-deposition, increasingthe kinetics of V10 reduction even further.
4.2. XPS and residual protection
The spectra obtained after exposure at fixed cathodic potentials to solutions containingeither monovanadates or decavanadates showed the presence of vanadium peaks (Fig. 6).The binding energy in all the experiments was approximately 516.3 eV. According to theliterature, this binding energy corresponds to a 4+ oxidation state [54]. However, properinterpretation of the data is rather complex. All the oxidation states lie in a very narrowrange of 2 eV [55]. The binding energy increases with incremental oxidation state [55]. Inaddition, binding energies are generally reported for bulk oxides. Due to interactions withmetallic surfaces, the binding energy adsorbed vanadates may vary from the binding ener-gies reported for the oxides [54–57]. An attempt to obtain a calibration curve using bulkoxides with oxidation states varying from 5+ to 2+ was made. For the lower oxidationstates (2+ to 4+) the binding energies were in good agreement with the literature [54–57]. However, the binding energy of V2O5 (5+ oxidation state) gave values close to a4+ oxidation state (approximately 516.16 eV). Sputter etching of the oxide with ionizedAr did not produce any change in binding energy. After removal from the XPS chamber,the initially orange oxide appeared black, which is the colour of the oxides of lower
2388 M. Iannuzzi, G.S. Frankel / Corrosion Science 49 (2007) 2371–2391
oxidation state. The exact explanation for this phenomenon is not clear but it suggests thatphotoreduction during XPS analysis may occur. Therefore, it was impossible to determinefrom the XPS data if the V-rich film formed during exposure at a fixed cathodic potentialis in the 4+ or 5+ oxidation state.
Re-exposure of samples pre-treated with the different inhibitors showed that the surfacefilm did not impart residual protection. The current density during exposure to aerated0.5 M NaCl at nearly neutral pH with no inhibitor was identical to the current densitymeasured for untreated samples.
4.3. Mechanisms of Inhibition
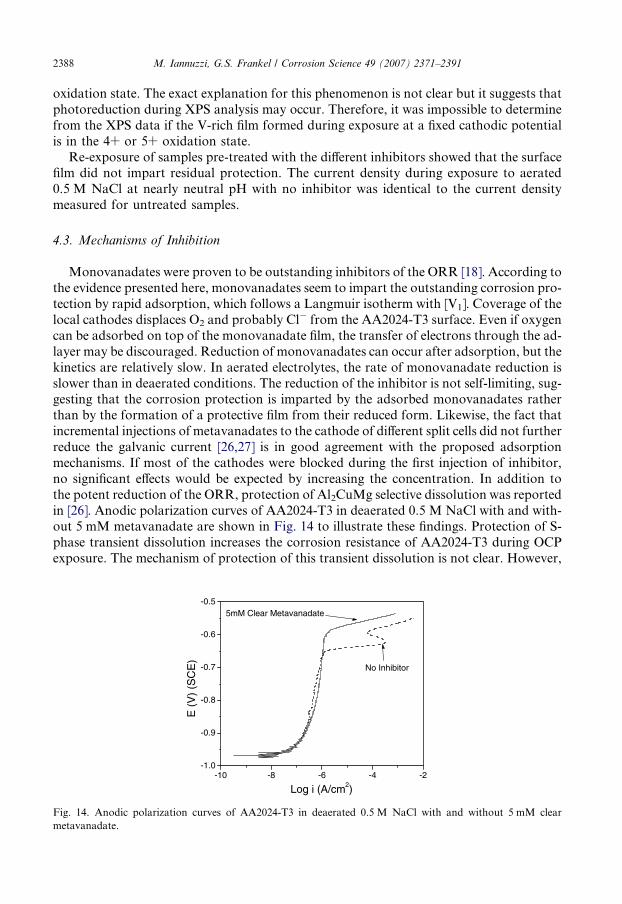
Monovanadates were proven to be outstanding inhibitors of the ORR [18]. According tothe evidence presented here, monovanadates seem to impart the outstanding corrosion pro-tection by rapid adsorption, which follows a Langmuir isotherm with [V1]. Coverage of thelocal cathodes displaces O2 and probably Cl� from the AA2024-T3 surface. Even if oxygencan be adsorbed on top of the monovanadate film, the transfer of electrons through the ad-layer may be discouraged. Reduction of monovanadates can occur after adsorption, but thekinetics are relatively slow. In aerated electrolytes, the rate of monovanadate reduction isslower than in deaerated conditions. The reduction of the inhibitor is not self-limiting, sug-gesting that the corrosion protection is imparted by the adsorbed monovanadates ratherthan by the formation of a protective film from their reduced form. Likewise, the fact thatincremental injections of metavanadates to the cathode of different split cells did not furtherreduce the galvanic current [26,27] is in good agreement with the proposed adsorptionmechanisms. If most of the cathodes were blocked during the first injection of inhibitor,no significant effects would be expected by increasing the concentration. In addition tothe potent reduction of the ORR, protection of Al2CuMg selective dissolution was reportedin [26]. Anodic polarization curves of AA2024-T3 in deaerated 0.5 M NaCl with and with-out 5 mM metavanadate are shown in Fig. 14 to illustrate these findings. Protection of S-phase transient dissolution increases the corrosion resistance of AA2024-T3 during OCPexposure. The mechanism of protection of this transient dissolution is not clear. However,
-10 -8 -6 -4 -2-1.0
-0.9
-0.8
-0.7
-0.6
-0.5
E (
V)
(SC
E)
Log i (A/cm2)
5mM Clear Metavanadate
No Inhibitor
Fig. 14. Anodic polarization curves of AA2024-T3 in deaerated 0.5 M NaCl with and without 5 mM clearmetavanadate.
M. Iannuzzi, G.S. Frankel / Corrosion Science 49 (2007) 2371–2391 2389
it is possible that adsorption of monovanadates on the Al matrix displaces adsorbed Cl�.Although the mechanisms of pit initiation are still an issue of debate, it is generally agreedthat Cl� either thins the passive film or diffuses through it [58]. Therefore, as indicated byseveral researchers [59–62], a critical step for pit initiation is adsorption of Cl� at the sur-face. If monovanadates displace Cl� from the local anodes, the mechanisms of breakdownof the passive film are discouraged. Thus, in polarization curves, a displacement of Cl�
from the surface by adsorption of monovanadates would be reflected by an increase thebreakdown potential of S-phase particles.
In contrast to metavanadates, decavanadate was proven to be a poor corrosion inhib-itor. Reduction of decavanadates took place in both aerated and deaerated conditions.Decavanadates were readily reduced upon injection. Adsorption on local cathodes isnot complete and the ORR can still occur at a fast rate. In addition, reduction of deca-vanadate on Cu seems to be favoured. Thus, as AA2024-T3 suffers selective dissolutionof S-phase particles, with the subsequent redistribution of Cu at the surface, the rate ofreduction of decavanadates will increase accordingly. These findings suggest that forma-tion of decavanadates should be avoided to obtain the best inhibition performance. Asshown previously [18], formation of decavanadates from clear metavanadate solutionstakes place by local acidification below a critical pH of about 3–4. Consequently, it isdesirable to maintain the pH of the electrolyte above the critical pH at any time. Thisshould not be an issue during atmospheric exposure of aircraft since the local electrolyteis thought to remain neutral or slightly basic [49].
5. Conclusions
The mechanisms of inhibition by clear solutions containing monovanadates and orangesolutions containing decavanadates but no monovanadates were investigated by chrono-amperometry and polarization curves. The following conclusions can be obtained:
1. Injection of clear metavanadate solutions to aerated 0.5 M NaCl at varied appliedpotentials showed a large reduction in cathodic current. The extent of inhibition wasa function of the applied potential. No current spike was observed even at large catho-dic overpotentials. The extent of reduction in the rate of ORR was similar to that ofchromate.
2. Construction of adsorption isotherms showed that monovanadates are adsorbed on thesurface following a Langmuir isotherm. The critical concentration of monovanadatewas 0.05 mM, similar to the reported critical concentration of Cr6+.
3. Corrosion inhibition of AA2024-T3 by monovanadates might occur by the formationof an adsorbed layer. Reduction of clear metavanadate solution was very slow, andit took approximately 35 min to develop a monolayer of the reduced form. The adsorp-tion of the inhibitor blocked reactive sites on IMCs, discouraging the ORR. Adsorptionof the inhibitor on the Al matrix might also displace Cl� adsorption, increasing the sta-bility of the passive film and reducing the breakdown of S-phase particles.
4. Compared with metavanadate solutions, decavanadates are not good inhibitors of theORR. Decavanadates showed a sharp current spike after injection on both Cu andAA2024-T3 at varied applied cathodic potentials.
5. XPS experiments could not conclusively determine the V oxidation state on the AA2024surface owing to the possibility of photoreduction during measurement.
2390 M. Iannuzzi, G.S. Frankel / Corrosion Science 49 (2007) 2371–2391
References
[1] J.R. Davis, ASM Specialty Handbook: Aluminum and Aluminum Alloys, ASM International, 1993(Chapter 2) pp. 31–35.
[2] C. Kammer, Aluminum Handbook, first ed., vol. 1, Aluminum-Verlag, 1999 (Chapter 4) pp. 125–143.[3] N. Birbilis, R.G. Buchheit, J. Electrochem. Soc. 152 (2005) B140–B151.[4] C. Blanc, B. Lavelle, G. Mankowski, Corr. Sci. 39 (1997) 495–510.[5] R.G. Buchheit, J. Electrochem. Soc. 142 (1995) 3994–3996.[6] G.S. Chen, M. Gao, R.P. Wei, Corrosion 52 (1996) 8–15.[7] W. Zhang, G.S. Frankel, Electrochem. Solid-State Lett. 3 (2000) 268–272.[8] W. Zhang, G.S. Frankel, J. Electrochem. Soc. 149 (2002) B510–B519.[9] W. Zhang, G.S. Frankel, Electrochim. Acta 48 (2003) 1193.
[10] R.G. Buchheit, R.G. Buchheit, ECS PV2002-13, Pennington, NJ, 2002, p. 430.[11] P. Campestrini, H. Terryn, J. Vereecken, J.H.W.D. Wit, J. Electrochem. Soc. 151 (2004) B370–B377.[12] G.S. Frankel, R.L. McCreery, Electrochem. Soc. Interface (2001) 34–38.[13] P.L. Hagans, C.M. Haas, ASM Handbook, Surface Engineering, 10th ed., vol. 5, ASM International, Metals
Park, OH, 1994.[14] M. Kendig, R.G. Buchheit, Corrosion 59 (2003) 379–400.[15] M. Kendig, C. Yan, J. Electrochem. Soc. 151 (2004) B679–B682.[16] M. Koudelkova, J. Augustynski, H. Berthou, J. Electrochem. Soc. 124 (1977) 1165–1168.[17] P.G. Sheasby, R. Pinner, The Surface Treatment and Finishing of Aluminum and its Alloys, vol. 1, ASM
International, Materials Park, OH, 2001 (Chapter 5) pp. 231–245.[18] M. Iannuzzi, T. Young, G.S. Frankel, J. Electrochem. Soc. 153 (2006) B533.[19] A. Gorzsas, K. Getty, I. Andersson, L. Petersson, Royal Soc. Chem., Dalton Trans. (2004) 2873.[20] E. Heath, O.W. Howarth, J. Chem. Soc., Dalton Trans. (1981) 1105–1110.[21] A.S. Tracey, Coord. Chem. Rev. 237 (2003) 113–121.[22] A.S. Tracey, J.S. Jaswal, S.J. Angus-Dunne, Inorg. Chem. 34 (1995) 5680–5685.[23] A.S. Tracey, C.H. Leon-Lai, Inorg. Chem. 30 (1991) 3200–3209.[24] M. Aureliano, R.M.C. Gandara, J. Inorg. Biochem. 99 (2005) 979–985.[25] J.W. Larson, J. Chem. Eng. Data 40 (1995) 1276–1280.[26] M. Iannuzzi, Inhibition of Al Alloy 2024-T3 Corrosion by Vanadates, PhD Dissertation, The Ohio State
University, 2006.[27] M. Iannuzzi, G.S. Frankel, Electrochim. Acta, in press.[28] W.J. Clark, R.L. McCreer, J. Electrochem. Soc. 149 (2002) B379–B386.[29] W.J. Clark, J.D. Ramsey, R.L. McCreery, G.S. Frankel, J. Electrochem. Soc. 149 (5) (2002) B179–B185.[30] V.S. Sastri, Corrosion Inhibitors, Principle and Applications, John Wiley & Son, West Sussex, England,
1998, p. 33.[31] P. Kern, D. Landolt, J. Electrochem. Soc. 148 (2001) B228–B235.[32] I. Langmuir, J. Am. Chem. Soc. 40 (1918) 1361–1369.[33] M. Kaminski, Z. Szklarska-Smialowska, Corr. Sci. 13 (1973) 553–555.[34] R. Gasparac, C.R. Martin, E. Stunpnisek-Lisac, J. Electrochem. Soc. 147 (2000) 991–998.[35] R.G. Nuzzo, R.R. Zegarsky, L.H. Dubois, J. Am. Chem. Soc. 109 (1987) 733–740.[36] M. Pourbaix, Atlas of Electrochemical Equilibria, second ed., NACE, Houston, Texas, 1974, pp. 237.[37] V. Guillaumin, P. Schmutz, G.S. Frankel, J. Electrochem. Soc. 148 (2001) B163–B173.[38] M. Kendig, S. Jeanjaquet, R. Addison, J. Waldrop, Surf. Coat Technol. 140 (2001) 58–66.[39] P. Schmutz, G.S. Frankel, J. Electrochem. Soc. 145 (1998) 2285–2295.[40] W.W. Damaskin, O.A. Pietrij, W.W. Batrakow, Adsorption of Organic Compounds on Electrodes, Plenum
Press, New York, 1971.[41] A.F. Holleman, E. Wiberg, Inorganic Chemistry, Academic Press, Berlin/New York, 2001.[42] H.H. Yang, R.L. McCreer, J. Electrochem. Soc. 147 (1996) 3420–3428.[43] J. Xu, W. Huang, R.L. McCreer, J. Electroanal. Chem. 410 (1996) 235–242.[44] S. Strbac, R.R. Adzic, Electrochim. Acta 41 (1996) 2903–2908.[45] B.L. Hurley, R.L. McCreery, J. Electrochem. Soc. 150 (2003) B367.[46] L. Xia, E. Akiyama, G.S. Frankel, R.L. McCreery, J. Electrochem. Soc. 147 (2000) 2556–2562.[47] J. Zhao, L. Xia, A. Sehgal, D. Lu, R.L. McCreery, G.S. Frankel, Surf. Coat Technol. 140 (2001) 51–57.[48] K.J. Vetter, Electrochemical Kinetics, Academic Press, New York, 1967.
M. Iannuzzi, G.S. Frankel / Corrosion Science 49 (2007) 2371–2391 2391
[49] G.O. Ilevbare, J.R. Scully, Corrosion 57 (2001) 134–152.[50] F.J. Presuel-Moreno, M.A. Jakab, J.R. Scully, J. Electrochem. Soc. 152 (2005) B376–B387.[51] R.G. Buchheit, R.P. Grant, P.F. Hlava, B. McKenzie, G.L. Zender, J. Electrochem. Soc. 144 (1997) 2621–
2628.[52] M.B. Vukmirovic, N. Dimitrov, K. Sieradzki, J. Electrochem. Soc. 149 (2002) B428–B439.[53] M.B. Vukmirovic, N. Vasiljevic, N. Dimitrov, K. Sieradzki, J. Electrochem. Soc. 150 (2003) B10–B15.[54] J. Kasperkiewicz, J.A. Kovacich, D. Lichtman, J. Electron. Spectrosc. Relat. Phenom. 32 (1983) 123–132.[55] Handbook of X-Ray Photoelectron Spectroscopy, Perkin–Elmer Co., 1992.[56] R.J. Colton, A.M. Guzman, J.W. Robalais, J. Appl. Phys. 49 (1978) 409.[57] N.I. Nefedov, Y.V. Salyn, G. Leonhardt, J. Electron. Spectrosc. Relat. Phenom. 10 (1977) 121–124.[58] J.R. Galvele, S.M. Demicheli, Corr. Sci. 10 (1970) 795–807.[59] E. Ghali, Uhlig’s Corrosion Handbook, second ed., CANMET Materials Laboratory, Ottawa, Ontario,
Canada, 1998.[60] E. McCafferty, Corr. Sci. 37 (1995) 481–492.[61] E. McCafferty, Corr. Sci. 45 (2003) 1421–1438.[62] F.D. Wall, C.M. Johnson, J.C. Barbour, M.A. Martinez, J. Electrochem. Soc. 151 (2004) B77–B81.
Copyright © 2022 FDOKUMEN