Corrosion and Inhibition Performances at the Steel-Mortar Interface. Part 1: A Surface Analytical...
68
1 Corrosion and Inhibition Performances at the Steel-Mortar Interface. Part 1: A Surface Analytical Investigation Zhengxian Yang 1 , Xianming Shi 1,2, * , Tuan Anh Nguyen 1 , Zhiyong Suo 3 , Recep Avci 3 1 Corrosion and Sustainable Infrastructure Laboratory, Western Transportation Institute, PO Box 174250, College of Engineering, Montana State University, Bozeman, MT 59717-4250, USA 2 Civil Engineering Department, 205 Cobleigh Hall, Montana State University, Bozeman, MT 59717-2220, USA 3 Imaging and Chemical Analysis Laboratory, Department of Physics, Montana State University, Bozeman, MT 59717, USA * Corresponding Author; Phone: 1-406-994-6486; Fax: 1-406-994-1697; E-mail: [email protected]
-
Upload
independent -
Category
Documents
-
view
3 -
download
0
Transcript of Corrosion and Inhibition Performances at the Steel-Mortar Interface. Part 1: A Surface Analytical...
1
Corrosion and Inhibition Performances at the Steel-Mortar
Interface. Part 1: A Surface Analytical Investigation
Zhengxian Yang1, Xianming Shi1,2, *, Tuan Anh Nguyen1, Zhiyong Suo3, Recep Avci3
1 Corrosion and Sustainable Infrastructure Laboratory, Western Transportation Institute, PO
Box 174250, College of Engineering, Montana State University, Bozeman, MT 59717-4250,
USA
2 Civil Engineering Department, 205 Cobleigh Hall, Montana State University, Bozeman, MT
59717-2220, USA
3 Imaging and Chemical Analysis Laboratory, Department of Physics, Montana State
University, Bozeman, MT 59717, USA
* Corresponding Author; Phone: 1-406-994-6486; Fax: 1-406-994-1697; E-mail:
2
Abstract
The present research evaluated the corrosion and inhibition performances of steel-mortar
samples with various levels of NaCl and corrosion inhibitors admixed in fresh mortar (0.05M
DGP, 0.5M SN, and 0.05M DMEA). FESEM, EDX and XPS were used to analyze the
fracture surfaces of the steel-mortar interfacial region for samples exposed to various time
periods of ponding by 3% NaCl solution. The admixing of NaCl and the corrosion inhibitors
in fresh mortar altered the morphology and microstructure of the hardened mortar at the
steel-mortar interfacial region. The admixing of the corrosion inhibitors in fresh mortar
increased the risk of carbonation of cement hydrates at the steel-mortar interfacial region, but
partially displaced chloride ions. Chloride (either admixed or ingressed) and the admixed
corrosion inhibitors facilitated the formation of different cement hydrates and affected
chloride binding.at the steel-mortar interfacial region, all of which may affect the steel
corrosion and its inhibition.
3
1. Introduction
One of the serious concerns to the durability of reinforced concrete worldwide is
chloride-induced corrosion of reinforcing steel 1-3, which leads to a subsequent loss in the
strength, serviceability, and aesthetics of the structure. Chloride contamination or chloride
ingress into concrete may create the need for early repair or premature substitution of the
structure due to steel corrosion 4-6. Such concrete structures include highway concrete slabs,
bridge decks and parking garages exposed to chloride-based deicing salts 7, structures
working in marine environments 8-9, etc.
The use of corrosion inhibitors for new structures, also known as corrosion inhibiting
admixtures (CIAs), seems to be a promising strategy in controlling steel corrosion in concrete
10-13. Extensive research has been conducted to investigate the mechanisms of steel corrosion
in concrete in the presence of aggressive chloride ions, and numerous corrosion inhibitors to
mitigate the corrosion of steel in concrete have been studied 14-18. As the first type of
commercial CIAs used to prevent chloride-induced corrosion of embedded steel, nitrites have
been known to feature oxidizing properties to inhibit the anodic reaction of the corrosion
process 19-20. Among them, sodium nitrite was proven to be a very effective corrosion
inhibitor, although its detrimental effects on mortar or concrete strength have been reported
21-22. Organic CIAs such as amines and esters may successfully inhibit both the anodic and
cathodic reactions of corrosion processes, by forming a protective film on the steel surface
and thus blocking the access of chlorides as well as oxygen 23-25.
Nonetheless, how CIAs work to control the corrosion of steel in concrete are still not
fully understood, when it comes to how they might alter the microstructure and chemistry of
4
hardened concrete and how such changes might affect the steel corrosion and its inhibition.
Furthermore, the field performance of CIAs reported in literature are often inconclusive,
which may be attributable to the variability inherent in the suite of other relevant factors such
as concrete mix design, construction practices, as well as environmental and mechanical
loadings experienced by the concrete structure. These knowledge gaps have hindered the
widespread implementation of CIAs as a best practice for corrosion management. More
research is thus needed to unravel the role of salt contamination and CIAs in the processes of
cement hydration and rebar corrosion.
A majority of the existing research pertinent to steel corrosion in concrete has been
carried out with the steel sample either immersed in a simulated pore solution, or embedded
in cement mortar or concrete specimens. In the former case, the research findings are of
limited value to field applications as such experiments ignore the uniqueness of a concrete
environment compared with typical aqueous solution environments. In the latter case,
measurements of corrosion characteristics of the steel are indirect. Even if the cement mortar
or concrete specimen is broken open and the steel is then taken for analyses, it is difficult to
obtain reliable information from the relevant interfacial region considering possible damage
or contamination of the steel surface.
In this work, a different model system was designed to facilitate the investigation of the
steel-mortar interface, with minimal damage at the interfacial region. Two methods were
used in combination to bring the chloride ions into direct contact with the steel: admixing
sodium chloride into the fresh mortar, and ponding the hardened mortar in a sodium chloride
solution. Three CIAs, sodium nitrite [SN, NaNO2], disodium β-glycerophosphate [DGP,
5
C3H7Na2O6P] and N,N′-dimethylethanolamine [DMEA, (CH3)2NCH2CH2OH] were
investigated.
In this paper (Part 1), we report on using field emission scanning electron microscopy/
energy dispersive x-ray spectroscopy (FESEM/EDX) and X-ray photoelectron spectroscopy
(XPS) to unravel the role of salt contamination and admixed corrosion inhibitors in the
processes of cement hydration and rebar corrosion. In a separate paper (Part 2), we report on
using electrochemical impedance spectroscopy (EIS) to characterize the behavior of
steel-mortar samples admixed with sodium chloride and corrosion inhibitors 26. SEM and
EDX provide information on surfaces and thus shed light on the localized morphology and
chemistry of cement hydrates at the steel-mortar interfacial region relative to the spatial
distribution of steel corrosion products. Recent technological advances in SEM/EDX enable
the observation to be performed under a weak vacuum, allowing retention of moisture in the
sample. As such, cement hydrates can be studied without suffering from the micro-shrinkage
or crystallization due to moisture evaporation 27. XPS has been previously utilized to confirm
the formation of inhibitor film on the surface of reinforcing steel 28.
2. Experimental procedures
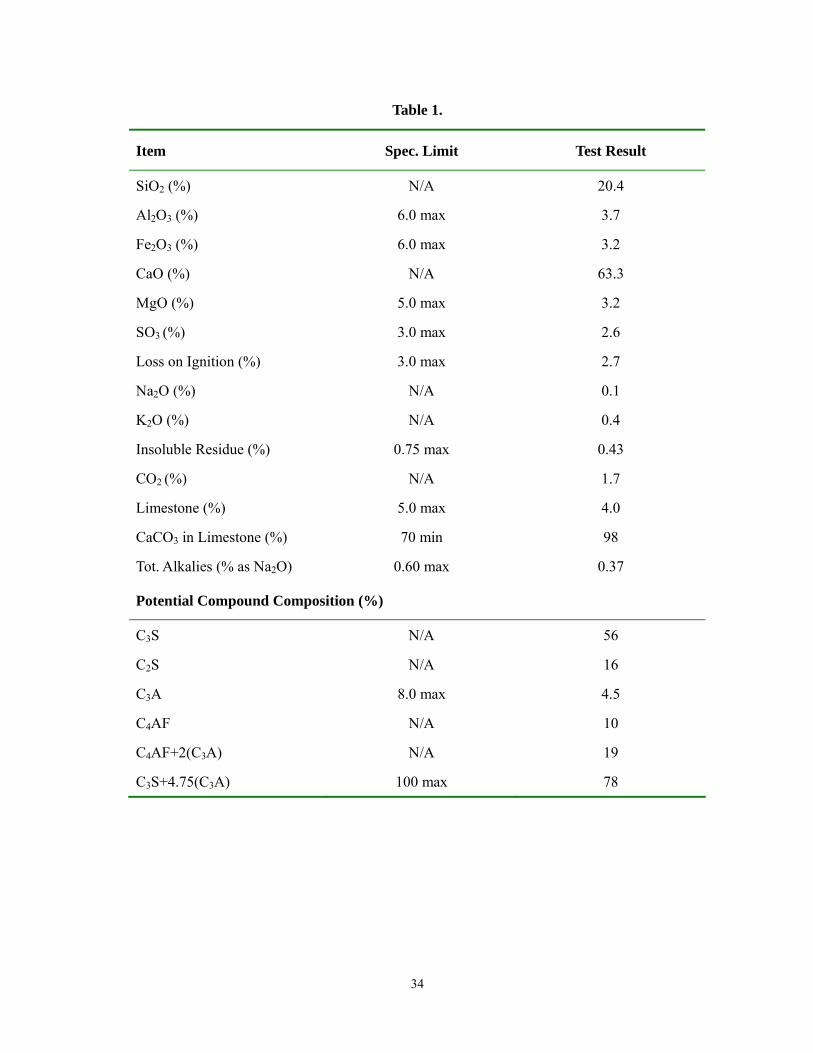
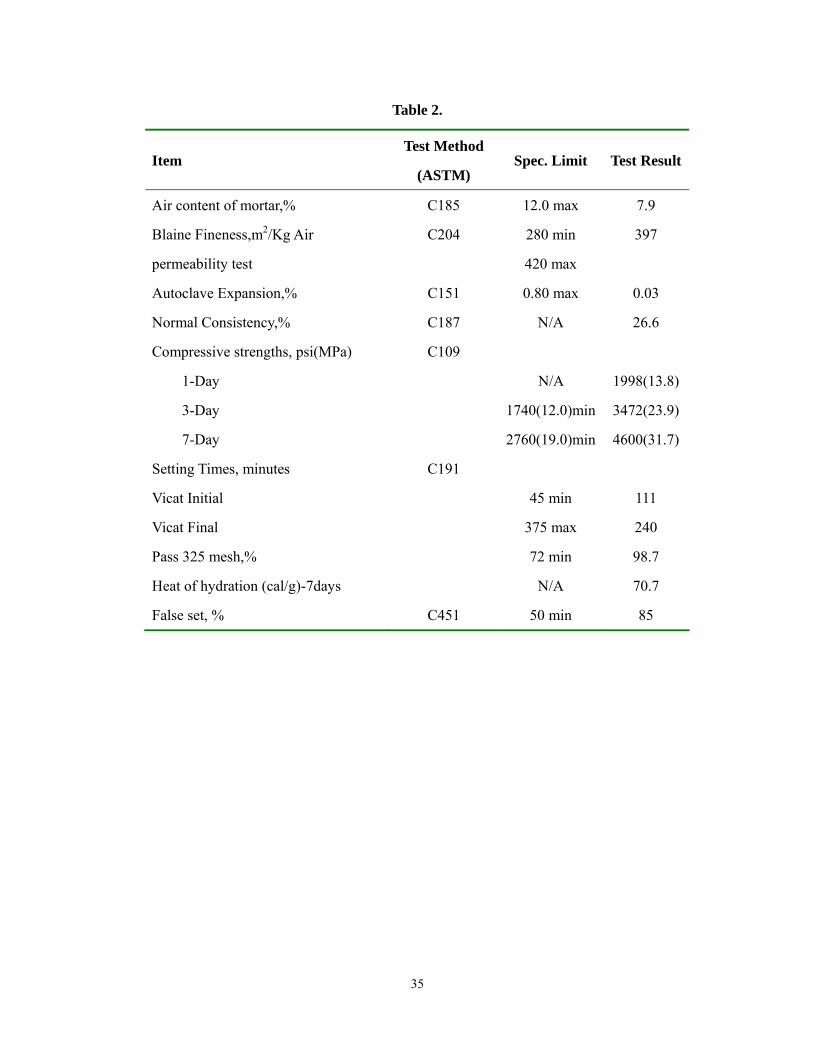
2.1. Materials. An ASTM specification C150-07 Type I/II low-alkali Portland cement
(ASH Grove Cement Company Clancy, MT) was used in this study. The chemical
composition and physical properties of the cement are listed in Tables 1 and 2, respectively.
The fine aggregates used were river sand sifted with a 250μm sieve before proportioning
and admixing. Steel plates (C4130 carbon steel) were purchased from Metal Samples, Inc.
6
(Munford, AL). De-ionized water was used in the experiment.
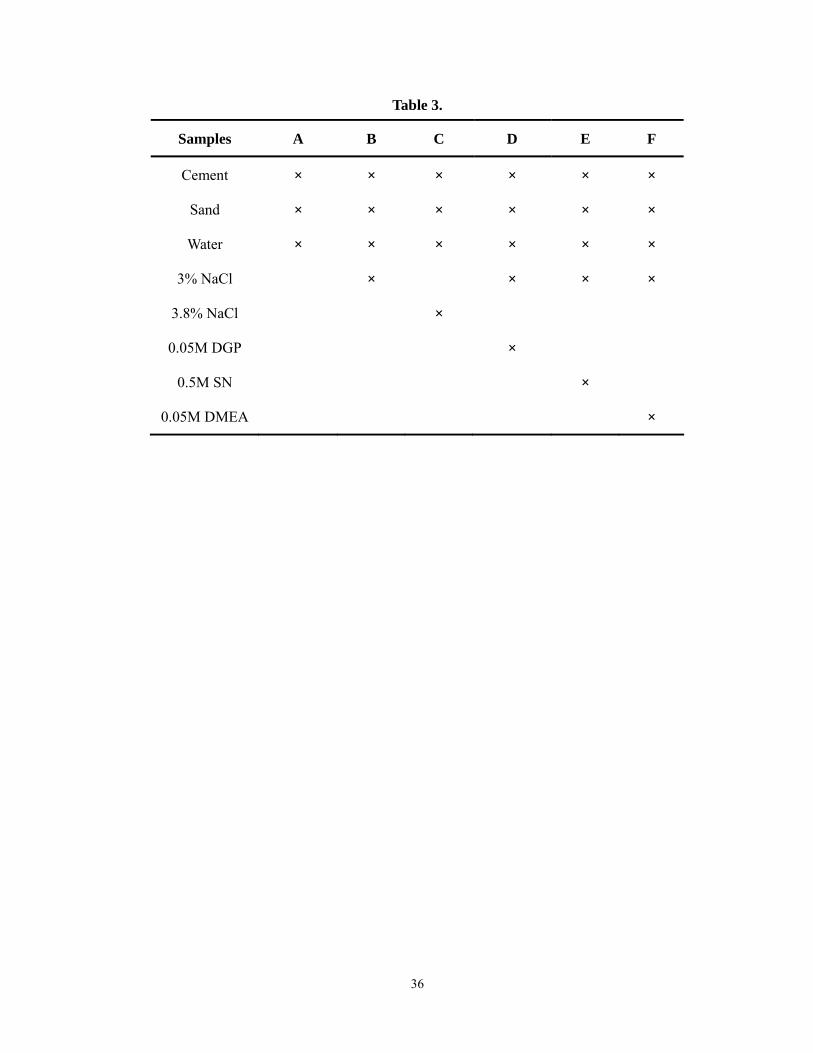
2.2. Sample preparation. All the mortar samples were prepared with cement: sand:
water mass ratio of 1: 0.075: 0.5. The percentages and concentrations of chloride and
inhibitors that were added to the mortar were by weight of water. Table 3 shows the mix
design for the six types of samples with various contents of admixed chloride and inhibitors.
The chloride contamination levels (3% and 3.8% by weight of water) in fresh mortar were
used to simulate the scenarios where seawater is used for concrete mixing and construction
for seashore structures and components. For each sample, fresh mortar was poured into a
plastic tube (2.2cm2 of surface area, 5mm deep) attached to a square steel plate (2.5cm ×
2.5cm) using epoxy resin and carefully compacted to minimize air voids. The steel plate
was cleaned with de-ionized water and acetone and dried in advance. Following curing in a
wet chamber for 28 days at approximately 20°C and 95% relative humidity, each
steel-mortar sample was demoulded from the plastic tube and another plastic tube (2.2cm2
of surface area, 10mm deep) was sealed on top of it to serve as a reservoir. To initiate steel
corrosion, all samples were then ponded with 3% NaCl solution. Three specimens were
prepared for each mix design to validate the reliability of test results.
2.3. Surface analyses. After being ponded with the 3% NaCl solution for a given
period, each steel-mortar sample was detached from the pond; the steel plate and mortar
were then separated mechanically from each other by shear force. The freshly exposed
fracture surface on each mortar specimen was then subjected to FESEM/EDX to examine
its localized morphology and elemental distributions at the microscopic level, using a Zeiss
Supra 55VP PGT/HKL system coupled with the energy dispersive x-ray analyzer. The EDX
7
data were obtained with a micro-analytical unit that featured the ability to detect the small
variations of trace element content. We used FESEM/EDX under variable pressure (VP
mode), typically 10-2 torr, to investigate the effect of sodium chloride (NaCl) and inhibitors
on the morphology and chemistry of cement hydrates at the steel-mortar interfacial region,
after ponding by 3% NaCl. The VP mode allowed the analyses of mortar microstructure
and cement hydrates without any information distortion seen in traditional SEM.
The freshly exposed fracture surface on each steel plate was subjected to XPS to
examine its localized chemistry, using a Physical Electronics 5600ci system equipped with
monochromatized Al Kα X-ray source featuring standard excitation energy of 1486.6eV.
Data acquisition and analysis were performed using the RBD AugerScan2 software. After
acquiring a typical survey scan, a high resolution scan (multiplex) was conducted to
identify individual element peaks of interest. The energy scale was corrected to the C 1s
peak maxima at 285eV.
3. Results and discussion
3.1. Morphology and microstructure of hardened mortars at the steel-mortar
interfacial region
3.1.1. Effects of admixed NaCl. The admixing of NaCl in fresh mortar was found to
alter the morphology and microstructure of the hardened mortar at the steel-mortar interfacial
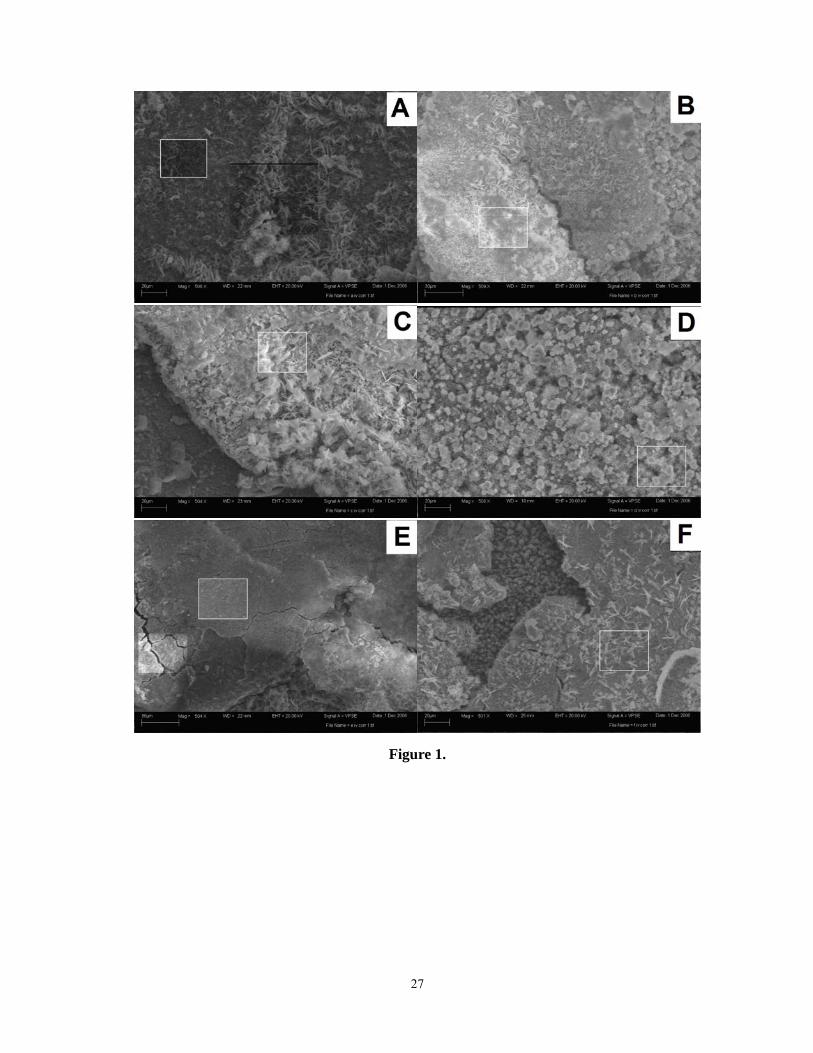
region, as illustrated by the FESEM images of the fracture surface on the mortar samples A,
B, and C after being ponded by 3% NaCl solution for 60 days (see Figures 1A-1C, all at
magnification level of approximately 500 times). The mortar sample without any chloride
8
admixed (A) had a relatively homogeneous surface, featuring the presence of fine rod-like
AFt phases (calcium aluminate trisulfate hydrates) 29. For the samples with 3% and 3.8%
NaCl admixed in fresh mortar (B and C), the exfoliated lamella crystals dominated the
fracture surface, while delicate globular or whiskery minerals were also observed. The
exfoliated lamella crystals were reported to be responsible for expansion and subsequent
cracking and spalling of concrete 30, which might have aggravated the expansion due to the
diffusion of steel corrosion products into mortar at the steel-mortar interfacial region.
Relative to the sample A, both the samples B and C gave a more textured fracture surface,
featuring the presence of hexagonal platy crystals (AFm phases, calcium aluminate
monosulfate hydrates) and less AFt phases (shown as coarser rods) 31. A possible
mechanism responsible for the diminished AFt phases is the substitution of the sulfate anion
in AFt phases by the chloride anion, such as the one converting ettringite into calcium
chloro-aluminate:
3CaO Al2O3 3CaSO4 32H2O 6Cl- 3SO42-+ 3CaO Al2O3 3CaCl2 32H2O= +
Furthermore, the overall characteristics of the fracture surface on all three mortar
samples were consistent with a reticulated Type II C-S-H (calcium silicate hydrates), which
was observed in samples with chloride admixed in fresh mortar 29.
3.1.2. Effects of admixed corrosion inhibitors. The admixing of corrosion inhibitors
in fresh mortar was found to alter the morphology and microstructure of the hardened
mortar at the steel-mortar interfacial region, as illustrated by the FESEM images of the
fracture surface on the mortar samples D, E, and F after being ponded by 3% NaCl solution
for 60 days (see Figures 1D-1F, all at magnification level of approximately 500 times).
9
Compared with the mortar sample with 3% NaCl but no inhibitors admixed (B), the
samples with corrosion inhibitors admixed (D, E, and F) had relatively more homogeneous
fracture surfaces. As seen in Figure 1D, the sample with 3% NaCl and 0.05 M DGP
admixed in fresh mortar (D) had a coarse mortar fracture surface with many air voids at the
steel-mortar interfacial region, which may explain the poor inhibition performance of DGP
discussed in our other paper 26. In addition to calcium-rich hexagonal platy crystals (AFm
phases), the mortar fracture surface for the sample D featured the presence of spherulites
characteristic of a Type I C-S-H, which generally occurred in samples without chloride
admixed in fresh mortar 29 This indirectly suggests the displacement of chloride ions by
DGP at the steel-mortar interface, as confirmed by the EDX data discussed later. As seen in
Figures 1E and 1F, the samples with 3% NaCl and 0.5 M SN or 0.05M DMEA admixed in
fresh mortar (E and F respectively) exhibited a more smooth and bare fracture surface with
some microcracks but few air voids at the steel-mortar interfacial region, which may
explain the good inhibition performances of SN and DMEA discussed in our other paper 26.
In addition, the mortar fracture surface for the sample E featured dense calcium-silicon rich
structures and the morphology resembling a reticulated Type II C-S-H 29. The dense
microstructure of the sample E along with the presence of evident microcracks at the
steel-mortar interfacial region indirectly suggests the “pore blocker” role played by SN, as
confirmed by the electrochemical data discussed in our other paper 26. The mortar fracture
surface for the sample F featured the co-existence of rod-like AFt phases, hexagonal platy
AFm phases, and a reticulated Type II C-S-H at the steel-mortar interfacial region.
3.2. Localized chemical composition at the steel-mortar interfacial region
10
3.2.1. XPS analyses. The freshly exposed fracture surface on each steel plate was
subjected to XPS to provide data that would supplement the information obtained with the
FESEM/EDX regarding the steel-mortar interfacial region. The XPS is known to provide the
chemical composition information of the very top surface layer (less than 10nm) of the tested
sample 32, in this case, from the steel-mortar interfacial region to the steel surface. The C 1s
peak at binding energy of approximately 290eV on the XPS spectra can be attributed to the
carbonation products of Portland cement mortar (PCM) such as calcite, because DGP and
DMEA do not contain carboxyl groups and thus C 1s signal for the organic inhibitors is
smaller than 290eV. The admixing of each of the three corrosion inhibitors in fresh mortar
was found to increase the risk of carbonation of cement hydrates at the steel-mortar
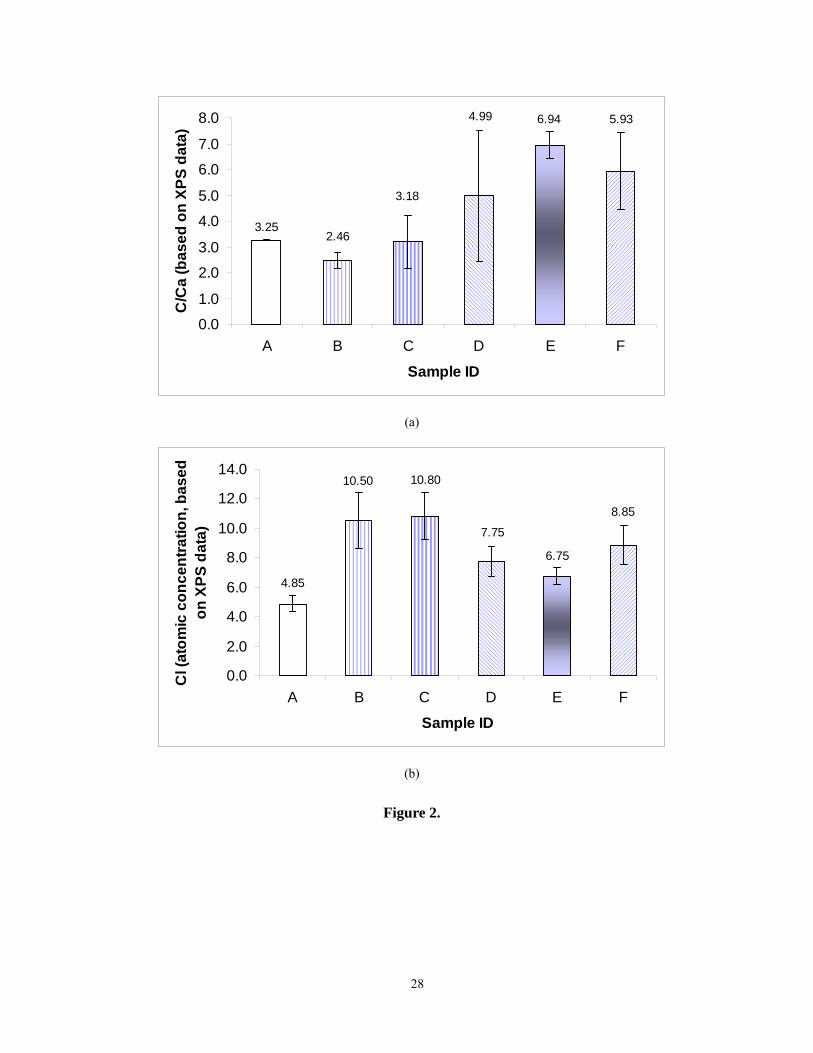
interfacial region, as illustrated by the C/Ca ratios of the fracture surface on the steel plate of
the samples after 60 days of ponding by 3% NaCl solution (see Figure 2a). Compared with
the sample B that had no inhibitors admixed, the samples D, E and F with their respective
inhibitor (0.05M DGP, 0.5M SN, and 0.05M DMEA) admixed featured significantly higher
C/Ca ratios, signifying the uptake of more atmospheric carbon dioxide by the residual cement
hydrates at the fracture surface on the steel plate of these samples. The potential carbonation
of cement hydrates may enhance the risk of rebar corrosion in concrete, which is a side effect
of these CIAs to be considered in future research and applications. Relative to the sample B,
the samples D, E, and F exhibited lower Cl contents at the fracture surface on the steel plate
(see Figure 2b), suggesting the partial displacement of chloride ions by the formation of
oxide film (in the case of SN) or the chemisorption of organic CIAs (in the case of DGP and
DMEA) on the steel surface.
11
3.2.2. EDX analyses. Using an appropriate accelerating voltage (20KV), the EDX data
provided the chemical composition at a large volume, as in the depth of approximately 1µm
from the steel-mortar interfacial region to the mortar bulk matrix. The EDX data were
taken from at least three different sites with high Fe signal (“rusty sites”) and at least three
different sites with low Fe signal (“non-rusty sites”) on the fracture surface of each mortar
sample at the steel-mortar interfacial region. Each site corresponded to a selected area of
approximately 40µm × 40µm (see frames shown in Figures 1A-1F).
The EDX data obtained from the mortar fracture surface of various samples confirm
the presence of each of the three CIAs at the steel-mortar interfacial region. For the sample
D after 60 days of salt ponding, the EDX data confirm the presence of the inhibitor DGP on
the mortar facture surface, with a phosphorus concentration of 0-0.05 wt.% at rusty sites
and 0.14-0.2 wt.% at non-rusty sites. This implies that if DGP had been admixed at a higher
content than 0.05M (by weight of mixing water) in fresh mortar, it could have achieved
better performance in inhibiting the steel corrosion. For the samples E and F after 60 days
of salt ponding, the EDX data confirm the presence of the inhibitors SN and DMEA at the
steel-mortar interfacial region, with an average nitrogen concentration of 0.45 wt.% and
0.81 wt.% on their mortar fracture surfaces respectively.
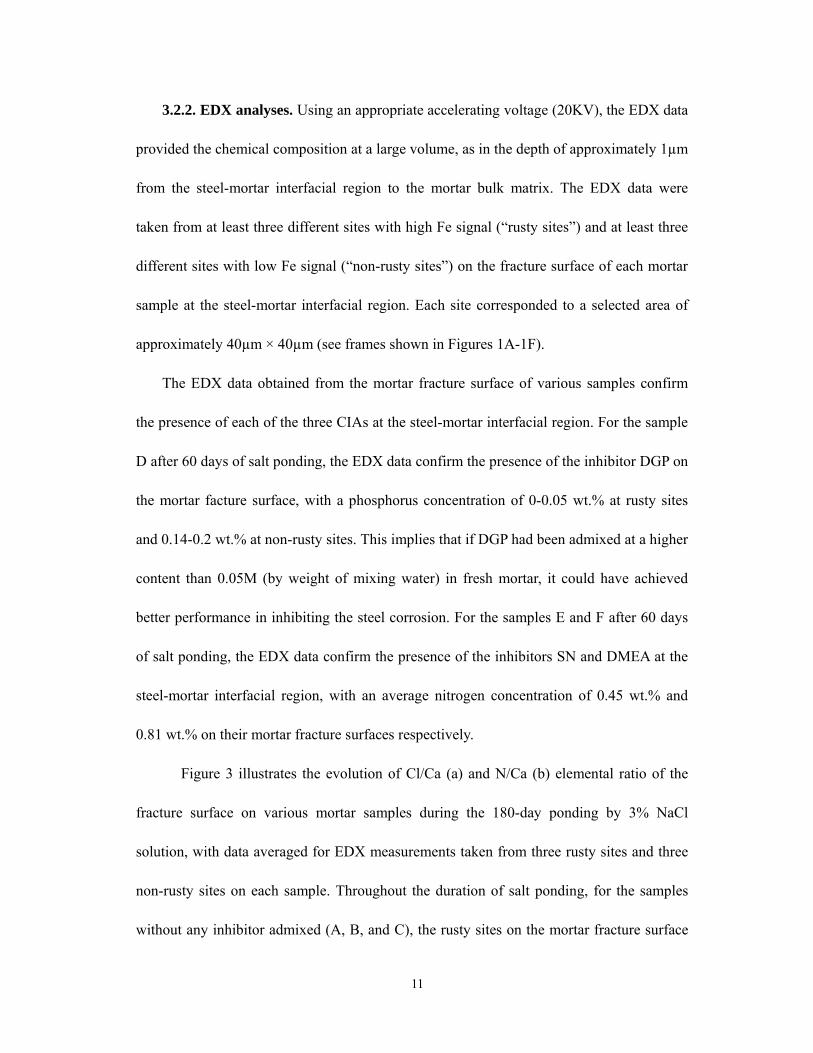
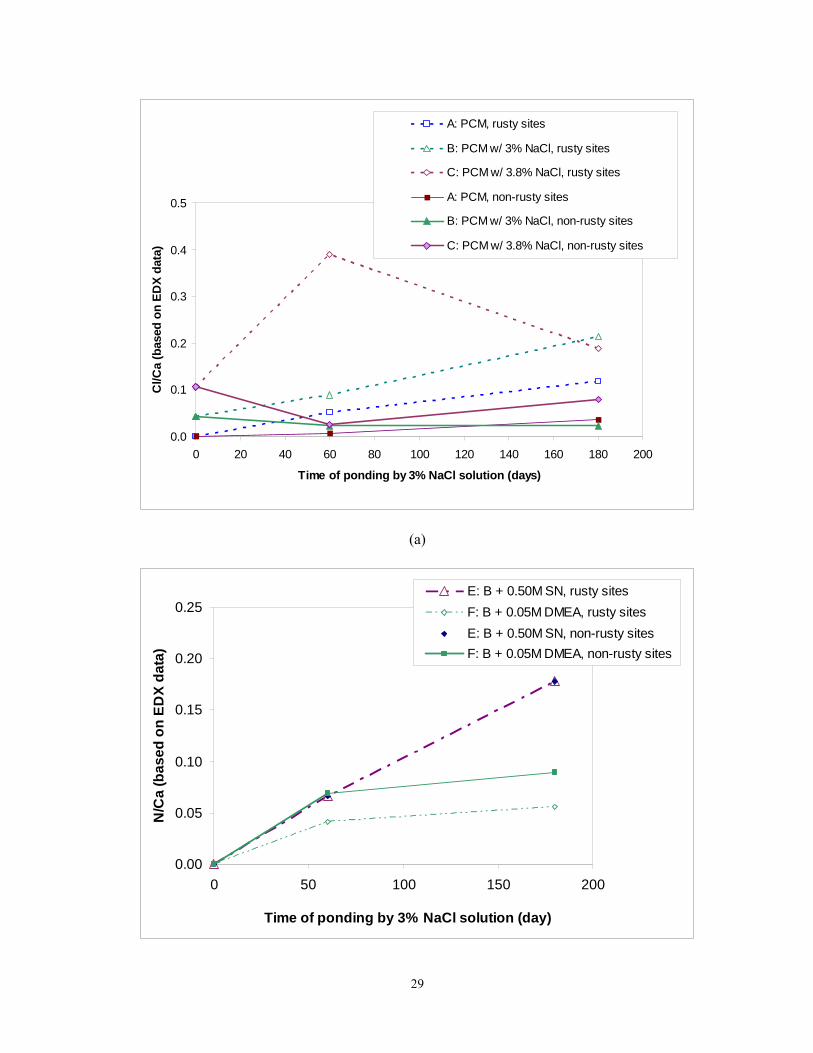
Figure 3 illustrates the evolution of Cl/Ca (a) and N/Ca (b) elemental ratio of the
fracture surface on various mortar samples during the 180-day ponding by 3% NaCl
solution, with data averaged for EDX measurements taken from three rusty sites and three
non-rusty sites on each sample. Throughout the duration of salt ponding, for the samples
without any inhibitor admixed (A, B, and C), the rusty sites on the mortar fracture surface
12
exhibited higher Cl/Ca ratios than the non-rusty sites (see Figure 3a), which confirms the
role of chloride ions in causing the steel corrosion. In general, the samples with more NaCl
admixed in fresh mortar were found to exhibit higher Cl/Ca ratios (see Figure 3a), which
indirectly demonstrates the validity of the EDX technique in characterizing the localized
chemistry of the mortar fracture surface.
The N/Ca ratios from rusty sites and non-rusty sites on the mortar fracture surface as
shown in Figure 3b are expected to illustrate the distribution of DEMA and SN at the
steel-mortar interfacial region. For the sample with 3% NaCl and 0.05M DMEA admixed
in fresh mortar (F), the non-rusty sites exhibited higher N/Ca ratios than the rusty sites,
indicating that higher content of DMEA at the non-rusty sites inhibited the corrosion of
steel more effectively, likely through the formation of a more reliable protective film on the
steel surface. For the sample with 3% NaCl and 0.5M SN admixed in fresh mortar (E), the
non-rusty sites exhibited N/Ca ratios similar to the rusty sites, indicating the uniform
distribution of NO2- in the hardened mortar, at least in the vicinity of the steel-mortar
interface. It is interesting to note that for both the samples E and F, the N/Ca ratio of the
mortar fracture surface increased with the time of salt ponding, suggesting the tendency for
NO2 - and DMEA to migrate towards the steel surface from the mortar bulk to control the
propagation of chloride-induced corrosion of the steel.
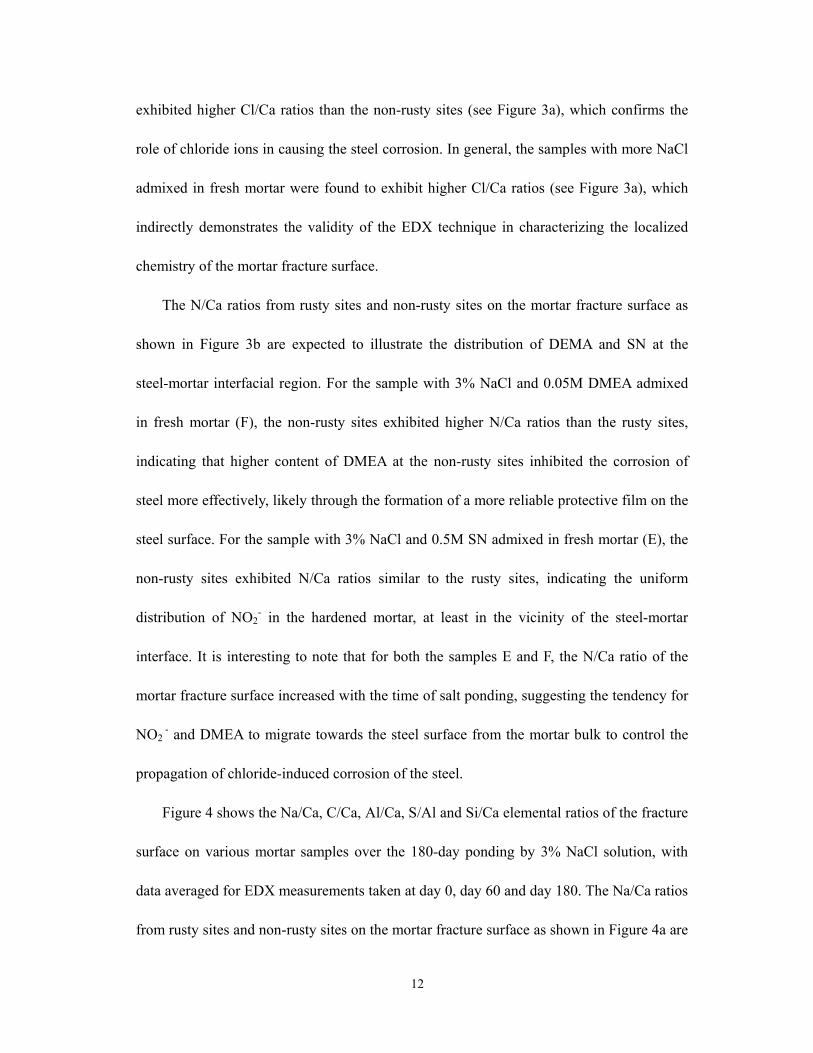
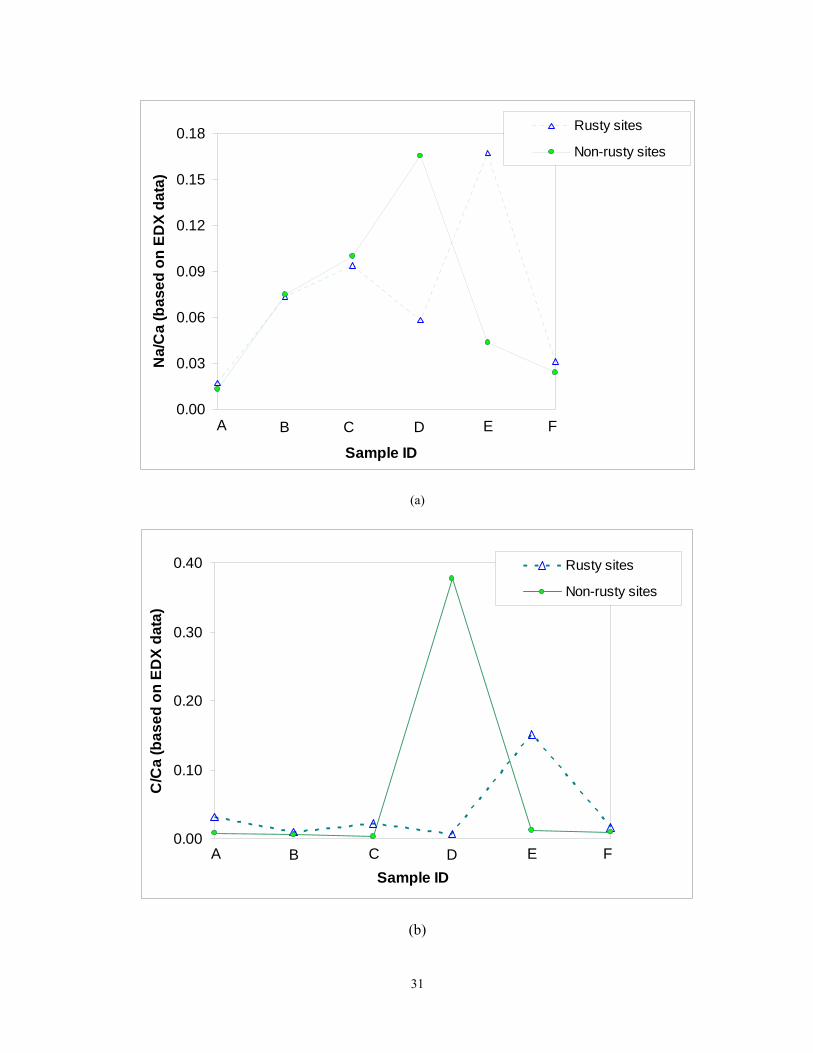
Figure 4 shows the Na/Ca, C/Ca, Al/Ca, S/Al and Si/Ca elemental ratios of the fracture
surface on various mortar samples over the 180-day ponding by 3% NaCl solution, with
data averaged for EDX measurements taken at day 0, day 60 and day 180. The Na/Ca ratios
from rusty sites and non-rusty sites on the mortar fracture surface as shown in Figure 4a are
13
expected to shed some light on the steel corrosion and inhibition mechanisms, even though
the sodium signal could be derived from either NaCl or inhibitors (DGP and SN
respectively). For the samples without any inhibitor admixed (A, B, and C), the rusty sites
on the mortar fracture surface exhibited similar time-averaged Na/Ca ratio (see Figure 4a)
but higher Cl/Ca ratios (see Figure 3a) than the non-rusty sites, which is consistent with
known mechanisms of chloride-induced corrosion of steel 5:
Fe2+ + 2Cl- → FeCl2
FeCl2 + 2OH - → Fe(OH)2 + 2Cl-
The samples with more NaCl admixed in fresh mortar were found to exhibit higher Na/Ca
ratios (see Figure 4a), which confirms the validity of the EDX technique. For the sample
with 3% NaCl and 0.05M DGP admixed in fresh mortar (D), its non-rusty sites exhibited
significantly higher time-averaged Na/Ca ratio than the rusty sites, suggesting that higher
DGP content at the non-rusty sites led to better inhibition performance. For the sample with
3% NaCl and 0.5M SN admixed in fresh mortar (E), the “rusty sites” (with strong Fe signal)
exhibited significantly higher time-averaged Na/Ca ratio than the “non-rusty sites” (see
Figure 4a), which may be explained by the similar diffusion behavior of ferrous ions and
sodium ions. This observation is consistent with the known inhibition reaction
characteristic of nitrites 33:
2Fe2+ + 2OH - + 2NO2 - → 2NO↑ + Fe2O3 + H2O
For the sample with 3% NaCl and 0.05M DMEA admixed in fresh mortar (F), both its rusty
and non-rusty sites exhibited significantly lower Na/Ca ratios than the sample without any
inhibitor admixed (B), which along with the lower Cl signal observed in XPS (see Figure
14
2b) suggest the partial displacement of Na+ as well as Cl- by DMEA from the steel-mortar
interfacial region.
The C/Ca ratios from rusty sites and non-rusty sites on the mortar fracture surface as
shown in Figure 4b are expected to shed some light on the steel corrosion and inhibition
mechanisms, even though the carbon signal could be derived from either the carbonation
products of cement mortar or inhibitors (DGP and DMEA respectively). For the samples
without any inhibitor admixed (A, B, and C), the rusty sites on the mortar fracture surface
exhibited relatively higher time-averaged C/Ca ratio than the non-rusty sites, which
confirms the role of mortar carbonation in aggravating the steel corrosion. The carbonation
of mortar hydrates is known to reduce the pH of the pore solution, which may decrease the
threshold chloride-to-hydroxyl concentration ratio for the initiation of steel corrosion 5. The
pH reduction may also release some of the bound chlorides (calcium chloro-aluminates,
e.g., Friedel’s salt) from the mortar matrix 34 and thus promote the chloride-induced steel
corrosion. For the sample with 3% NaCl and 0.05M DGP admixed in fresh mortar (D), its
non-rusty sites exhibited significantly higher time-averaged C/Ca ratio than the rusty sites,
likely attributable to the presence of higher content of DGP at the non-rusty sites. For the
sample with 3% NaCl and 0.5M SN admixed in fresh mortar (E), the “rusty sites” (with
strong Fe signal) exhibited significantly higher time-averaged C/Ca ratio than the
“non-rusty sites” (see Figure 4b). A possible explanation is that the presence of more SN in
certain areas at the steel-mortar interface led to the uptake of more atmospheric carbon
dioxide by cement hydrates, initiated the corrosion of steel and eventually led to the
formation of more protective ferric oxide layer in these areas featuring stronger Fe signals.
15
For the sample with 3% NaCl and 0.05M DMEA admixed in fresh mortar (F), the rusty
sites had lower content of DMEA (as suggested by the N/Ca ratio shown in Figure 3b) but
higher level of mortar carbonation than the non-rusty sites, the combined effects of which
led to a relatively higher time-averaged C/Ca ratio at the rusty sites.
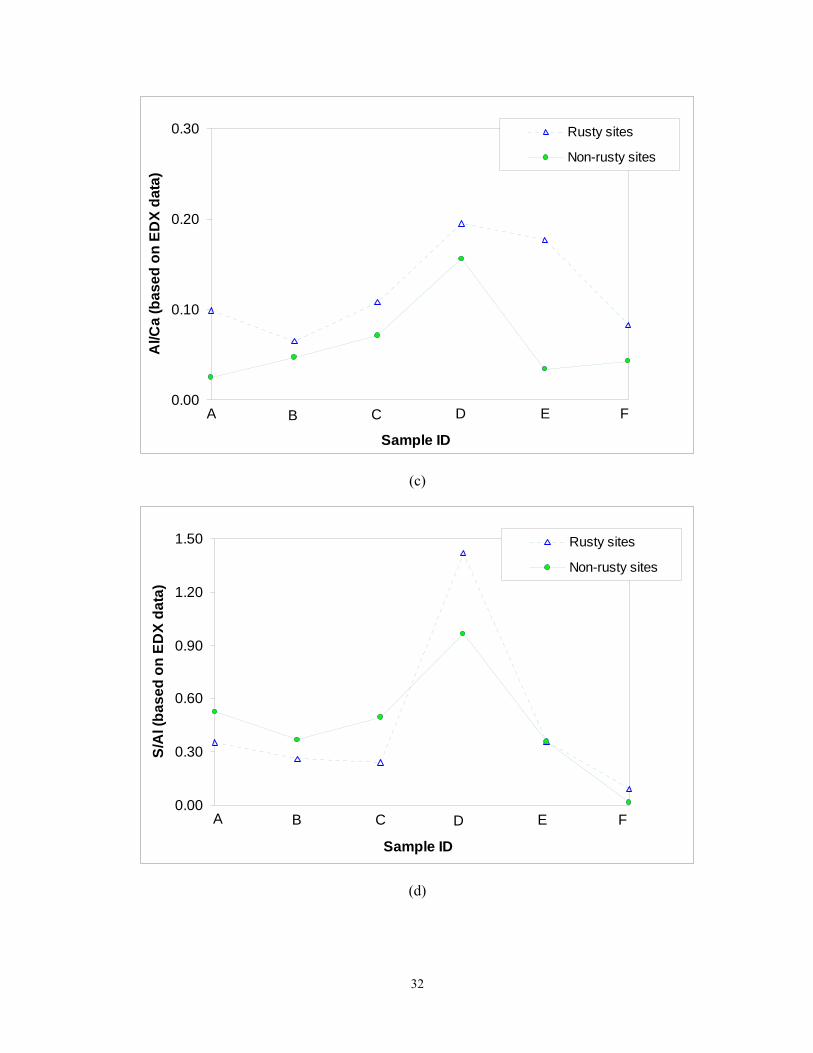
The Al/Ca and S/Al ratios on the fracture surface of various mortar samples are shown
in Figure 4c and Figure 4d respectively. For all the samples investigated (with or without
inhibitor admixed), the rusty sites on the mortar fracture surface consistently exhibited
higher time-averaged Al/Ca ratio than the non-rusty sites (see Figure 4c), suggesting the
presence of higher content of aluminum-rich cement hydrates. In the absence of inhibitors
(samples A, B, and C), the samples with more NaCl admixed in fresh mortar were found to
exhibit higher Al/Ca ratios (see Figure 4c) and lower S/Al ratios (see Figure 4d), which along
with the low S/Al values suggest the role of admixed chloride in facilitating the formation of
more AFm phases in cement hydrates and the partial substitution of the sulfate anion in AFm
or AFt phases by the chloride anion (i.e., chloride binding). For the samples without any
inhibitor admixed (A, B, and C), the rusty sites on the mortar fracture surface exhibited
lower time-averaged S/Al ratio than the non-rusty sites (see Figure 4d), which along with the
FESEM images (see Figure 1) and Al/Ca data confirm that the presence of more chloride at
the rusty sites at the steel-mortar interface led to the formation of more AFm phases and less
AFt phases. The EDX data obtained from the rusty sites also showed the increase of Al/Ca
ratio and the decrease of S/Al ratio over time of the 180-day salt ponding for each sample (A,
B, and C respectively), indicating both the substitution of AFt phases by AFm phases and the
aforementioned chloride binding facilitated by the chloride ions.
16
Compared with the sample B that had no inhibitors admixed, the admixing of 0.05M
DGP in fresh mortar (sample D) led to significantly higher Al/Ca and S/Al ratios in the
hardened mortar (at both rusty and non-rusty sites), which along with the high S/Al values
suggest that DGP promoted the formation of more aluminum-rich cement hydrates but
inhibited the aforementioned chloride binding (possibly due to the displacement of chloride
ions by DGP). For the sample D, the rusty sites exhibited higher time-averaged Al/Ca, S/Ca,
and S/Al ratios than the non-rusty sites, suggesting that the presence of more AFt phases and
their role in facilitating the steel corrosion. For the sample with 3% NaCl and 0.5M SN
admixed in fresh mortar (E), its “rusty sites” (with strong Fe signal) featured significantly
higher Al/Ca ratios but comparable S/Al ratios than those of sample B, which along with the
S/Ca data suggest that with the aid of ferrous ions, SN promoted the substitution of AFt
phases by AFm phases but inhibited the aforementioned chloride binding. Compared with
the sample B that had no inhibitors admixed, the admixing of 0.05M DMEA in fresh mortar
(sample F) led to significantly lower S/Al ratios as well as lower S/Ca ratios, which along
with the Al/Ca data suggest that DMEA promoted the substitution of the sulfate anion in
AFm or AFt phases by the chloride anion (i.e., chloride binding). Similar to the sample D,
the sample F exhibited higher time-averaged Al/Ca, S/Ca, and S/Al ratios at the rusty sites
than those at the non-rusty sites, suggesting that the presence of more AFt phases and their
role in facilitating the steel corrosion.
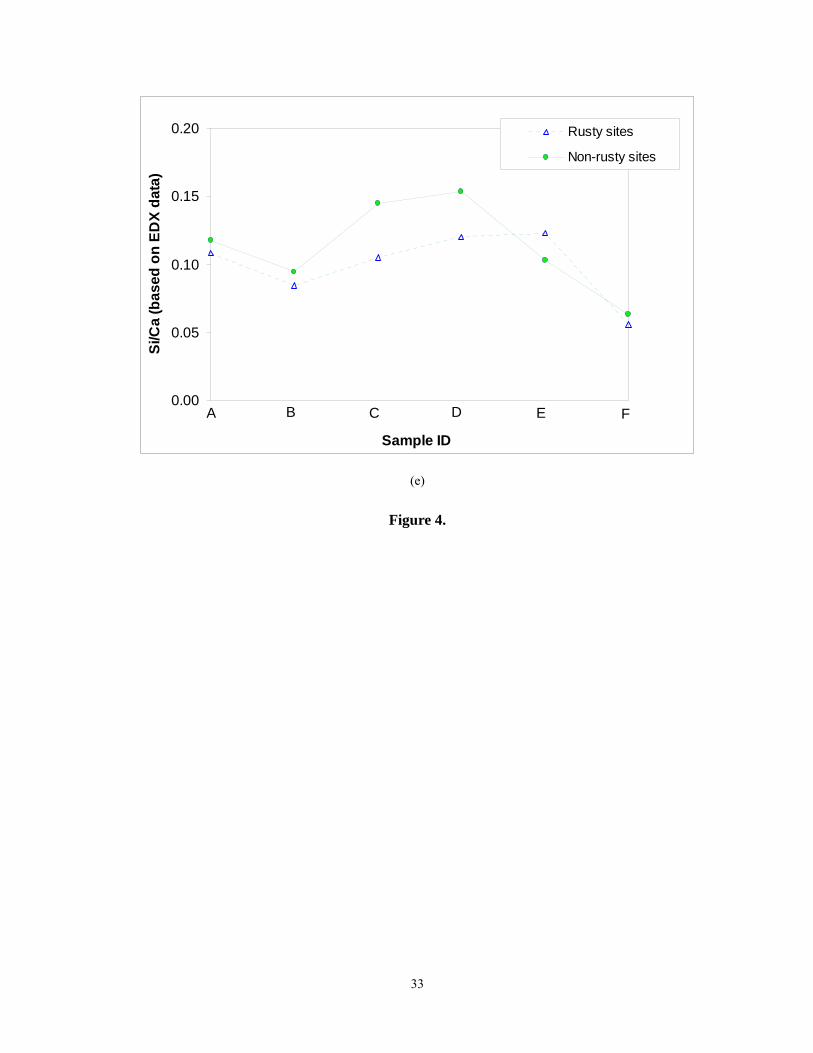
The Si/Ca ratios from rusty sites and non-rusty sites on the mortar fracture surface as
shown in Figure 4e are expected to shed some light on the role of cement chemistry in the
steel corrosion and inhibition processes. The Si/Ca ratio was extensively studied by some
17
other authors to evaluate the C-S-H phases in cement mortar and concrete 35,36. Generally, the
Si/Ca ratio of C-S-H phases is somewhat variable with a mean of approximately 0.45-0.55,
and C-S-H phases are regarded as the main source of concrete strength and transport
properties 37,38. For all the samples investigated (with or without inhibitor admixed), the
Si/Ca ratio of the mortar fracture surface decreased with the time of salt ponding, implying
the substitution of silicate-rich C-S-H by calcium-rich C-S-H facilitated by the chloride ions.
For the samples without any inhibitor admixed (A, B, and C), the rusty sites on the mortar
fracture surface exhibited relatively lower time-averaged Si/Ca ratio than the non-rusty sites,
suggesting the beneficial role of silicate-rich C-S-H phases in controlling the steel corrosion.
The admixed chloride seemed to have two competing effects on the Si/Ca ratio. While
chloride ions were expected to induce pore refinement and subsequently decrease the Si/Ca
ratio of C-S-H phases in mortars 39, once sufficient NaCl in the pore solution became
available, they might result in the dissolution of Ca(OH)2 through the following reaction and
thus increase the Si/Ca ratio:
2NaCl + Ca(OH)2 → CaCl2 + 2NaOH
Compared with the sample B that had no inhibitors admixed, the admixing of 0.05M
DGP in fresh mortar (sample D) led to significantly higher Si/Ca ratios in the hardened
mortar (at both rusty and non-rusty sites), suggesting that DGP promoted the formation of
more silicate-rich C-S-H phases. This is consistent with the FESEM observations of the
sample D and the sample B, which featured the spherulite-like Type I C-S-H (with high
Si/Ca ratio 29) and the reticulated Type II C-S-H (with low Si/Ca ratio 29) respectively, as
shown in Figure 1. For the sample D, the rusty sites exhibited lower time-averaged Si/Ca
18
ratio than the non-rusty sites, suggesting the beneficial role of silicate-rich C-S-H phases in
controlling the steel corrosion. Relative to the sample B, the admixing of 0.5M SN in fresh
mortar (sample E) led to higher Si/Ca ratios in the hardened mortar (at both rusty and
non-rusty sites), suggesting that SN promoted the formation of more silicate-rich C-S-H
phases. It is interesting to note that the sample E exhibited slightly higher Si/Ca ratios at its
“rusty sites” (with strong Fe signal) than the “non-rusty sites”, attributable to the slightly
higher content of SN at the “rusty sites”. Relative to the sample B, the admixing of 0.05M
DMEA in fresh mortar (sample F) led to significantly lower Si/Ca ratios in the hardened
mortar (at both rusty and non-rusty sites), likely due to the formation of more AFt or AFm
phases.
4. Conclusions
With respect to the investigated conditions of steel corrosion, the present research
evaluated the changed properties of the interfacial region of steel-mortar systems such as
morphology, crystallinity of the cement hydration products and the influence resulting from
the admixed sodium chloride and three inhibitors (0.05M DGP, 0.5M SN, and 0.05M
DMEA). Surface analytical tools including FESEM/EDX and XPS were used to analyze the
fracture surfaces of the steel-mortar interfacial region for samples exposed to various time
periods of ponding by 3% NaCl solution.
The FESEM data suggest that the admixing of NaCl and corrosion inhibitors in fresh
mortar altered the morphology and microstructure of the hardened mortar at the steel-mortar
interfacial region. The XPS data indicate that the admixing of each of the three corrosion
19
inhibitors in fresh mortar increased the risk of carbonation of cement hydrates at the
steel-mortar interfacial region but partial displaced chloride ions from the steel surface.
The EDX data obtained from the freshly exposed mortar fracture surface of various
samples confirm the presence of each of the three inhibitors at the steel-mortar interfacial
region. We further analyzed the evolution of several critical elemental ratios (Cl/Ca, N/Ca,
Na/Ca, C/Ca, Al/Ca, S/Al, and Si/Ca) of the fracture surface on various mortar samples
during the 180-day ponding by 3% NaCl solution. The EDX data were taken from three rusty
sites (with strong Fe signal) and three non-rusty sites respectively on each sample. The Cl/Ca
and C/Ca data confirmed the role of chloride ions and mortar carbonation in causing and
aggravating the steel corrosion respectively. Higher content of DGP or DMEA was found to
coincide with local areas of less corrosion products on the mortar fracture surface, indicating
their better inhibition performances. For SN, the EDX data were consistent with the known
passivation reaction characteristic of nitrites. We also found the tendency for NO2- and
DMEA to migrate towards the steel surface from the mortar bulk to control the propagation
of chloride-induced corrosion of the steel. DMEA was found to partially displace both Na+
and Cl- from the steel-mortar interfacial region.
The EDX data at the steel-mortar interfacial region suggested the role of chloride (either
admixed or ingressed) in facilitating the formation of more AFm phases, the partial
substitution of the sulfate anion in AFm or AFt phases by the chloride anion (i.e., chloride
binding), and the substitution of silicate-rich C-S-H by calcium-rich C-S-H. DGP promoted
the formation of more silicate-rich C-S-H phases that were beneficial in controlling the steel
corrosion as well as the formation of more aluminum-rich cement hydrates, but inhibited the
20
aforementioned chloride binding. The data from the sample with DGP admixed also
suggested the role of AFt phases in facilitating the steel corrosion. SN promoted the
formation of more silicate-rich C-S-H phases. With the aid of ferrous ions, SN also promoted
the substitution of AFt phases by AFm phases but inhibited the aforementioned chloride
binding. DMEA promoted the substitution of the sulfate anion in AFm or AFt phases by the
chloride anion (i.e., chloride binding) as well as the formation of more AFt or AFm phases.
This work provided improved understanding of the role of admixed chloride and
inhibitors in the cement hydration and steel corrosion, which is expected to contribute to the
effort of searching for effective measures to mitigate steel corrosion in concrete and protect
reinforced concrete structures in a chloride-laden environment.
Acknowledgements
This work was supported by the Research and Innovative Technology Administration
under the U.S. Department of Transportation through the University Transportation Center
research grant. We would also like to extend our appreciation to Matthew Reichert, Dan Hall,
and Alex Huffield at Montana State University (MSU) for their assistance in the early stage
of this research.
Literature Cited
(1). Hartt W. H.; Charvin, S.; Lee, S. K. Influence of permeability reducing and corrosion
inhibiting admixtures in concrete upon initiation of salt induced embedded metal
corrosion. Prepared for the Florida Department of Transportation. 1999.
21
(2). Martín-Pérez, B.; Zibara, H.; Hooton, R.D.; Thomas, M.D.A. A study of the effect of
chloride binding on service life predictions. Cement. Concrete. Res. 2000, 30, 1215.
(3). Samples L. M.; Ramirez, J. A. Methods of corrosion protection and durability of
concrete bridge decks reinforced with epoxy-coated rars, Phases I.
FHWA/IN/JTRP-98/15. Purdue University, IN. 1999.
(4). Page, C. L.; Ngala, V.T.; Page, M.M. Corrosion inhibitors in concrete repair systems.
Mag. Concrete. Res. 2000, 52, 25.
(5). Glass, G. K.; Buenfeld, N. R. Chloride-induced corrosion of steel in concrete. Progr.
Struct. Eng. Mater. 2000, 2, 448.
(6). Al-Otoom, A.; Al-Khlaifa, A.; Shawaqfeh A. Crystallization technology for reducing
water permeability into concrete. Ind. Eng. Chem. Res. 2007, 46, 5463
(7). Cady, P.D.; Weyers, R.E. Predicting service life of concrete bridge decks subject to
reinforcement corrosion. Corrosion forms and control for infrastructure. ASTM Spec.
Tech. Publication 1992, 1137, 328.
(8). Liam, K.C.; Roy, S.K.; Northwood, D.O. Chloride ingress measurements and corrosion
potential mapping of a 24 Year old reinforced concrete jetty structure in a tropic marine
environment. Mag. Concrete Res. 1992, 44, 205.
(9). Hartt, W.; Nam, J. Critical parameters for Corrosion Induced Deterioration of Marine
Bridge Substructures in Florida. Prepared for the Florida Department of Transportation.
2004.
(10). Berke N. S.; Weil T. G. World wide review of corrosion inhibitors in concrete. Advances
in concrete technology; CANMET: Ottawa, 1994.
22
(11). Ramachandran, V. S. Concrete admixtures handbook: properties, science, and
technology; 2nd ed. Noyes Publications: Park Ridge, NJ, USA; 1995.
(12). Lane, D. R.; Melendez, J. A.; Munteanu, V. F.; Kinney, F. D. Corrosion inhibiting
admixture for concrete. US Patent 2002, 6,340,438.
(13). V.S. Sastri. Corrosion inhibitors: principles and applications, Willey: England, 1998.
(14). Hansson, C. M.; Mammolite, L.; Hope, B. B. Corrosion inhibitors in concrete – Part I:
The principles. Cement. Concrete. Res. 1998, 28, 1775.
(15). Monticelli, C.; Frignani, A.; Trabanelli, G. A. Study on corrosion inhibitors for concrete
application. Cement Concrete Res. 2000, 30, 635.
(16). Morris, W.; Vázquez, M. A. Migrating corrosion inhibitor evaluated in concrete
containing various contents of admixed chlorides. Cement. Concrete. Res. 2002,
32,259.
(17). Munteanu V. F.; Kinney F. D. Corrosion inhibition properties of a complex inhibitor -
mechanism of inhibition; CANMET; Ottawa. 2000.
(18). Gaidis J. M. Chemistry of corrosion inhibitors. Cement Concrete Comp. 2004, 26, 181.
(19). Rosenberg, A. M.; Gaidis, J. M. The mechanism of nitrite inhibition of chloride attack
on reinforcing steel in alkaline aqueous environments. Mater. Performance. 1979, 18,
45.
(20). Tritthart, J.; Banfill, P. F. G. Nitrite binding in cement. Cement. Concrete. Res. 2001, 31
1093.
(21). Craig. R. J.; Wood, L. E. Effectiveness of corrosion inhibitors and their influence on the
physical properties of Portland cement mortars. Highway Res. Rec. 1970, 328,77
23
(22). Gonzalez, J. A.; Ramirez, E.; Bautista, A. Protection of steel embedded in chloride
containing concrete by means of inhibitors. Cement. Concrete. Res. 1998, 28, 577.
(23). Nmai, C. K.; Farrington, S. A.; Bobrowski, G. S. Organic-based corrosion-inhibiting
admixture for reinforced concrete. Concrete Intl. 1992, 14, 45.
(24). Campbell, S.; Jovancicevic, V. Corrosion inhibitor film formation studied by ATR-FTIR.
CORROSION 99; San Antonio, TX; USA. Paper No.484, 1999.
(25). Nmai, C.K. Multi-functional organic corrosion inhibitor. Cement. Concrete. Comp.
2004, 26(3),199.
(26). Nguyen, T. A.; Shi, X. Corrosion and inhibition performances at the steel-mortar
interface. Part 2: An electrochemical characterization. Ind. Eng. Chem. Res., under
review.
(27). Sarkar, S. L.; X, A. Preliminary study of very early hydration of superplasticized
C3A+Gypsum by environmental SEM. Cement. Concrete. Res. 1992, 22, 605.
(28). Swift, A.; Paul, A. J.; Vickerman, J. C. Investigation of the surface activity of
corrosion inhibitors by XPS and time-of-flight SIMS. Surf. Interface Anal. 1993,
20(1), 27.
(29). Marcotte, T. D.; Hansson, C. M. The effect of the electrochemical chloride extraction
treatment on steel-reinforced mortar. Part II: Microstructural characterization. Cement.
Concrete. Res. 1999, 29, 1561.
(30). Beaudoin, J. J.; Ramachandran, V. S. Handbook of analytical techniques in concrete
science and technology: Principles, techniques, and applications; William Andrew
Publishing: Norwich, NY, 2001.
24
(31). Pratt, P. L.; Ghose, A. Electron microscopy studies of Portland cement microstructures
during setting and hardening. Phil. Trans. R. Soc. Lond. A 1983,310, 93.
(32). Briggs, D; Grant, J. T, Surface analysis by Auger and X-ray photoelectron
spectroscopy; IM publications and Surface Spectra Ltd.: Chichester, 2003.
(33). Berke, N. S.; Sundberg, K. M. The effects of calcium nitrite and microsilica
admixtures on corrosion resistance of steel in concrete. Proceedings of Paul Klieger
Symposium on Performance of Concrete. ACI SP-122. 1990, 269
(34). Bertolini L., B.; Elsener, P. P.; Polder, R. Corrosion of Steel in Concrete: Prevention,
Diagnosis, Repair. Wiley-VCH, Verlag GmbH & Co.: KgaA, Weinheim, 2004.
(35). Famy, C.; Brough, A. R.; Taylor, H. F. W. The C-S-H gel of Portland cement mortars:
Part I. The interpretation of energy-dispersive X-ray microanalyses from scanning
electron microscopy, with some observations on C-S-H, AFm and AFt phases
compositions. Cement. Concrete. Res. 2003, 33, 1389.
(36). Chen, J. J.; Thomas, J. J.; Taylor; Hal F. W.; Jennings, H. M. Solubility and structure of
calcium silicate hydrates. Cement. Concrete. Res. 2004, 34, 1499.
(37). Mindess, S.; Young, J. F. Concrete; Prentice-Hall: Englewood Cliffs, NJ, 1981.
(38). Richardson, I. G.; Groves, G. W., Microstructure and microanalysis of hardened
ordinary Portland cement pastes. J. Mater. Sci. 1993, 28,265.
(39). Koleva, D. A.; Hu, J.; Fraaij, A. L. A.; Stroeven, P.; Boshkov, N; de Wit, J. H. W.
Quantitative characterisation of steel/cement paste interface microstructure and
corrosion phenomena in mortars suffering from chloride attack. Corros. Sci. 2006, 48,
4001.
25
List of Figures and Tables
Figure 1. Representative morphology and microstructure from the fracture surface of
mortars after 60 days of ponding by 3% NaCl solution, at the steel-mortar interfacial region:
A) without salt or inhibitor admixed; B) with 3% NaCl admixed; C) with 3.8% NaCl
admixed; D) with 3% NaCl and 0.05 M DGP admixed; E) with 3% NaCl and 0.5 M SN
admixed; F) with 0.05 M DMEA and 3% NaCl admixed. All FESEM images were taken at
magnification level of approximately 500 times.
Figure 2. Representative C/Ca signal ratios (a) and relative Cl content (b) of the fracture
surface on the steel plate of samples after 60 days of ponding by 3% NaCl solution. The
three characteristic peaks used were C 1s, Ca 2p and Cl 2p at binding energy of
approximately 290eV, 345eV, and 200eV respectively. The average and standard deviation
were calculated using XPS data from three different sites on each sample.
Figure 3. Evolution of Cl/Ca (a) and N/Ca (b) elemental ratios of the fracture surface on
various mortar samples during the 180-day ponding by 3% NaCl solution. The data were
averaged for EDX measurements taken from three rusty sites and three non-rusty sites
respectively on each sample. PCM stands for Portland cement mortar.
Figure 4. Na/Ca (a), C/Ca (b), Al/Ca (c), S/Al (d), and Si/Ca (e) elemental ratios of the
fracture surface on various mortar samples over the 180-day ponding by 3% NaCl solution,
with data averaged for EDX measurements taken at day 0, day 60 and day 180.
Table 1. Chemical composition of Type I/II low-alkali Portland cement

26
Table 2. Physical properties of Type I/II low-alkali Portland cement
Table 3. Mix design of mortar samples investigated (percentages and concentrations were by
weight of water)
27
Figure 1.
28
3.252.46
3.18
4.99 6.94 5.93
0.0
1.0
2.0
3.0
4.0
5.0
6.0
7.0
8.0
A B C D E F
Sample ID
C/C
a (b
ased
on
XPS
data
)
(a)
4.85
8.85
6.75
7.75
10.8010.50
0.0
2.0
4.0
6.0
8.0
10.0
12.0
14.0
A B C D E F
Sample ID
Cl (
atom
ic c
once
ntra
tion,
bas
ed
on X
PS d
ata)
(b)
Figure 2.
29
0.0
0.1
0.2
0.3
0.4
0.5
0 20 40 60 80 100 120 140 160 180 200
Time of ponding by 3% NaCl solution (days)
Cl/C
a (b
ased
on
EDX
data
)
A: PCM, rusty sites
B: PCM w/ 3% NaCl, rusty sites
C: PCM w/ 3.8% NaCl, rusty sites
A: PCM, non-rusty sites
B: PCM w/ 3% NaCl, non-rusty sites
C: PCM w/ 3.8% NaCl, non-rusty sites
(a)
0.00
0.05
0.10
0.15
0.20
0.25
0 50 100 150 200
Time of ponding by 3% NaCl solution (day)
N/C
a (b
ased
on
EDX
data
)
E: B + 0.50M SN, rusty sitesF: B + 0.05M DMEA, rusty sitesE: B + 0.50M SN, non-rusty sitesF: B + 0.05M DMEA, non-rusty sites

30
(b)
Figure 3.
31
FEDCBA0.00
0.03
0.06
0.09
0.12
0.15
0.18
Sample ID
Na/
Ca
(bas
ed o
n ED
X da
ta)
Rusty sites
Non-rusty sites
(a)
A B C D E F0.00
0.10
0.20
0.30
0.40
Sample ID
C/C
a (b
ased
on
EDX
data
)
Rusty sites
Non-rusty sites
(b)
32
FEDCBA0.00
0.10
0.20
0.30
Sample ID
Al/C
a (b
ased
on
EDX
data
)Rusty sites
Non-rusty sites
(c)
A B C D E F0.00
0.30
0.60
0.90
1.20
1.50
Sample ID
S/A
l (ba
sed
on E
DX
data
)
Rusty sites
Non-rusty sites
(d)
33
A B C D E F0.00
0.05
0.10
0.15
0.20
Sample ID
Si/C
a (b
ased
on
EDX
data
)Rusty sites
Non-rusty sites
(e)
Figure 4.
34
Table 1.
Item Spec. Limit Test Result
SiO2 (%) N/A 20.4
Al2O3 (%) 6.0 max 3.7
Fe2O3 (%) 6.0 max 3.2
CaO (%) N/A 63.3
MgO (%) 5.0 max 3.2
SO3 (%) 3.0 max 2.6
Loss on Ignition (%) 3.0 max 2.7
Na2O (%) N/A 0.1
K2O (%) N/A 0.4
Insoluble Residue (%) 0.75 max 0.43
CO2 (%) N/A 1.7
Limestone (%) 5.0 max 4.0
CaCO3 in Limestone (%) 70 min 98
Tot. Alkalies (% as Na2O) 0.60 max 0.37
Potential Compound Composition (%)
C3S N/A 56
C2S N/A 16
C3A 8.0 max 4.5
C4AF N/A 10
C4AF+2(C3A) N/A 19
C3S+4.75(C3A) 100 max 78
35
Table 2.
Item Test Method
(ASTM) Spec. Limit Test Result
Air content of mortar,% C185 12.0 max 7.9
Blaine Fineness,m2/Kg Air
permeability test
C204 280 min
420 max
397
Autoclave Expansion,% C151 0.80 max 0.03
Normal Consistency,% C187 N/A 26.6
Compressive strengths, psi(MPa)
1-Day
3-Day
7-Day
C109
N/A
1740(12.0)min
2760(19.0)min
1998(13.8)
3472(23.9)
4600(31.7)
Setting Times, minutes C191
Vicat Initial 45 min 111
Vicat Final 375 max 240
Pass 325 mesh,% 72 min 98.7
Heat of hydration (cal/g)-7days N/A 70.7
False set, % C451 50 min 85
36
Table 3.
Samples A B C D E F
Cement × × × × × ×
Sand × × × × × ×
Water × × × × × ×
3% NaCl × × × ×
3.8% NaCl ×
0.05M DGP ×
0.5M SN ×
0.05M DMEA ×
- 1 -
Corrosion and Inhibition Performances at the Steel-Mortar
Interface. Part 2: An Electrochemical Characterization
Tuan Anh Nguyen1 and Xianming Shi1,2,*
1 Corrosion and Sustainable Infrastructure Laboratory, Western Transportation Institute, PO
Box 174250, College of Engineering, Montana State University, Bozeman, MT 59717-4250,
USA
2 Civil Engineering Department, 205 Cobleigh Hall, Montana State University,
Bozeman, MT 59717-2220, USA
* Corresponding Author; Phone: 1-406-994-6486; Fax: 1-406-994-1697; E-mail:
- 2 -
Abstract
This research aimed to unravel the role of salt contamination and admixed corrosion inhibitors
in the processes of cement hydration and rebar corrosion, using mostly electrochemical
impedance spectroscopy. The admixing of all three inhibitors in fresh mortar was found to
increase the polarization resistance of steel, indicating reduced corrosion rate of the steel over
48-day exposures to salt ponding. 0.05M N,N′-dimethylethanolamine was the most capable
and reliable corrosion inhibitor, followed by 0.5M sodium nitrite; whereas 0.05M disodium β-
glycerophosphate was a slower and less capable corrosion inhibitor. The admixing of NaCl and
inhibitors in fresh mortar generally increased and decreased the electrical resistance of
hardened mortar, respectively. The admixing of inhibitors in fresh mortar consistently
increased the capacitance of hardened mortar. The effect of sodium nitrite on the resistance of
steel-mortar interfacial film offset that of NaCl, attributable to the formation of a protective
ferric oxide film.
- 3 -
1. Introduction
For highway bridges and other reinforced concrete structures, the corrosion of
reinforcing steel in concrete has been a major durability problem with serious economic and
safety implications 1. There is consensus that the most effective means to address this
problem can be achieved at the design stage by using adequate concrete cover and high-
quality concrete. Other practices at this stage include: the addition of corrosion inhibitors or
permeability-reducing admixtures to fresh concrete; the surface treatment of steel rebar; or
the use of alternative reinforcement materials.
The use of corrosion inhibitors for new structures, also known as corrosion inhibiting
admixtures (CIAs), seems to be a promising solution in controlling rebar corrosion in
concrete 2-6, by changing the local environment at the steel-concrete interface. In a recent
laboratory study 7, however, while both calcium-nitrite-based and organic CIAs delayed the
onset of corrosion, their effect on the corrosion rate of the embedded steel was found to be
insignificant once active corrosion had been initiated. While nitrite-based CIAs have been
reported to alter the strength properties of hardened concrete or change the curing behavior of
fresh concrete 4, there is little research on the effect of admixed inhibitors or chlorides on the
microstructure and chemistry of hardened concrete. Therefore, more research is needed to
help understand the role of salt contamination and CIAs in the processes of cement hydration
and rebar corrosion.
In this work, three CIAs, sodium nitrite [SN, NaNO2], disodium β-glycerophosphate
[DGP, C3H7Na2O6P] and N,N′-dimethylethanolamine [DMEA, (CH3)2NCH2CH2OH] were
investigated. Inorganic CIAs such as nitrites have been considered very effective, since they
act as a passivating agent with oxidizing properties to inhibit the anodic reaction of corrosion
process. Nonetheless, there are concerns over the performance of such inhibitors when used
in low dosage or where cracks in the concrete allow leaching to occur. The consensus is that
- 4 -
a sufficiently high nitrite/chloride molar ratio needs to be established and maintained for
effective inhibition. One study estimated the critical nitrite/chloride ratio for calcium nitrite
to be about 0.6 in order to prevent the onset of corrosion 8. SN was found to be a more
effective corrosion inhibitor than potassium chromate and sodium benzoate, but had some
detrimental effect on concrete strength 9. Organic CIAs act by adsorption on the metal
surface, forming a layer that may inhibit both the anodic and cathodic reactions of corrosion
process. Laboratory tests, in aqueous solution or in concrete, have shown conflicting results
about the efficiency and the minimum concentration required of organic CIAs for effective
inhibition 7, 10-11. There are also limited data on the long-term efficiency of organic inhibitors
12. Monticelli et al. (1995) reported that the corrosion resistance of steel rods embedded in a
chloride-polluted mortar was excellent in the presence of SN alone as well as in the presence
of a low-concentration DGP-SN admixture 13. SN was believed to allow the surface oxide to
form and repair on defects while DGP was known to protect the passive conditions by
chemisorption on the oxide film, and there was synergetic inhibition action between the two.
Monticelli et al. (2000) reported that over 30-day exposures, 0.05M SN and 0.05M DGP
were both able to prevent pitting corrosion of steel in a saturated calcium hydroxide solution
containing 0.1 M chloride ions 14. Data from Fourier transform infrared spectroscopy and
cyclic voltammetry further confirmed that DGP interacted with the steel surface by quick
chemisorption and both SN and DGP formed an impervious surface film on steel to block
any localized corrosion attack 15. Welle et al. (1997) reported that DMEA chemisorbed from
aqueous solution onto the oxidized steel surface, displaced chloride ions from the steel
surface, and formed a durable passivating film 16.
In this paper (Part 2), we report on using electrochemical impedance spectroscopy
(EIS) to characterize the behavior of steel-mortar samples admixed with sodium chloride and
corrosion inhibitors. In a separate paper (Part 1), we report on using field emission scanning
- 5 -
electron microscopy/ energy dispersive x-ray spectroscopy and X-ray photoelectron
spectroscopy to unravel the role of salt contamination and admixed corrosion inhibitors in the
processes of cement hydration and rebar corrosion 17. EIS provides information on interfaces
and thus shed light on the active-passive behavior and properties of the metal oxide formed
on the steel surface. It has also been used to study the migration behavior of the inhibitor ions
towards the reinforcing steel surface 10, 11, 18; and to study the change of electrical resistance
of bulk concrete as well as corrosion rate of rebar in concrete due to the admixing of
corrosion inhibitors 7.
2. Experimental procedures
2.1. Materials. An ASTM specification C150-07 Type I/II low-alkali Portland
cement (ASH Grove Cement Company Clancy, MT) was used in this study. The chemical
composition and physical properties of the cement are reported elsewhere 17. The fine
aggregates used were river sand sifted with a 250 μm sieve before proportioning and
admixing. Steel plate (C4130 carbon steel) was purchased from Metal Samples, Inc.
(Munford, AL). De-ionized water was used in the experiment.
2.2. Sample preparation. All the mortar samples were prepared with cement: sand:
water mass ratio of 1: 0.075: 0.5. The percentages and concentrations of chloride and
inhibitors added to the mortar were by weight of water. Table 1 shows the mix design for the
six types of samples with various contents of admixed chloride and inhibitors. The chloride
contamination levels (3% and 3.8% by weight of water) in fresh mortar were used to simulate
the scenarios where seawater is used for concrete mixing and construction for seashore
structures and components. The steel plate was cleaned with de-ionized water and acetone
and dried in advance. For each sample, fresh mortar was poured into a plastic tube (2.2cm2 of
surface area, 5mm deep) attached to a square steel plate (2.5cm × 2.5cm) using epoxy resin
- 6 -
and carefully compacted to minimize air voids. Following curing in a wet chamber for 28
days at approximately 20°C and 95% relative humidity, each steel-mortar sample was
demoulded from the plastic tube and another plastic tube (2.2cm2 of surface area, 10mm
deep) was sealed on top of it to serve as a reservoir. To initiate steel corrosion, all samples
were then ponded with 3% NaCl solution. Three specimens were prepared for each mix
design to validate the reliability of test results.
2.3. Electrochemical measurements. For each mortar sample, a platinum mesh was
placed in the pond as the counter electrode and a saturated calomel electrode (SCE) was used
as the reference electrode. Over the 48-day salt ponding period, a Gamry Electrochemical
Multiplexer ECM8 was used to monitor the open circuit potential (OCP) of square steel
plates attached to mortar and to measure the EIS data. EIS measurements were taken
periodically by polarizing the steel at ± 10 mV around its OCP and with a frequency between
300 KHz and 5 mHz (10 points per decade). The Gamry analysis software was used to plot
and fit the EIS data.
It should be noted that the OCP data measured were affected by both the steel corrosion
and the electrical resistance of hardened mortar, as the working electrode (the steel) was
separated from the reference electrode (the SCE in the pond) by the 5-mm thick mortar.
3. Results and discussion
Figures 1-4 show the Nyquist diagrams for these six steel-mortar samples, respectively, at the
salt ponding time of 1 day, 9 days, 22 days, and 43 days. For most of the mortar samples, the
equivalent circuit with three time constants and a diffusion element (also used by Song, 1998
19) as shown in Figure 5 was found to provide the best fit to the EIS data.
For some of the mortar samples, such as the control (A: without any salt or inhibitor
admixed), their EIS data showed a different pattern than the ones with salt admixed and
- 7 -
would fit well using a simpler equivalent circuit with two time constants (without the
intermediate frequency loop characterizing the corrosion products). In order to compare the
evolution of circuit parameters (R and C) over the salt ponding period, however, we
consistently used the same equivalent circuit in Figure 5 for analyzing all the EIS data. As
such, we divide the electrochemical system into three integrated interfaces: electrolyte-bulk
mortar interface; steel-mortar interface and steel-electrolyte interface. Even though the
mortar contains a certain electrolyte due to of its porosity, the steel-mortar and the steel-
electrolyte interface are different in terms of which material is in direct contact with the steel.
The Warburg diffusion impedance (W) associated with oxygen transport was assumed to be
similar for all the samples, i.e., 1× 10-18 S.s1/2, for the best fitting procedure.
It is interesting to note that samples A and E had similar EIS patterns, both of which
were different than those for other samples. At low frequency range both the control (sample
A, see Figure 1) and the sample E (with 3% NaCl and 0.5M SN admixed, see Figure 3)
featured a higher resistance corresponding to a stronger barrier effect, whereas in other
samples the diffusion process had dominated.
The EIS data indicated that that the fitting coefficients for C1 (capacitance of steel-
mortar interface) and C2 (capacitance of steel-electrolyte interface) were generally in the range
of 0.3-0.9 (with 1 being the perfect fit), indicating that those capacitances were not perfect,
attributable to the heterogeneous interfacial conditions and the competing processes (e.g.,
inhibitor absorption vs. chloride attack, steel passivation vs. pitting) occurring at the steel
surface.
3.1. The electrolyte-bulk mortar interface. In the Nyquist diagrams, the high
frequency loop can be attributed to the properties of the electrolyte-bulk mortar interface, with
R0 and C0 representing the electrical resistance and capacitance of the bulk mortar mix. These
two parameters have very important practical implications, as they can affect the rate of steel
- 8 -
corrosion propagation in concrete, the efficiency of electrochemical rehabilitation of reinforced
concrete, and the electrical properties of concrete in general.
Figure 6 shows the evolution of R0 and C0 over time for the steel-mortar samples
under salt ponding. Differences in the initial value of mortar resistance (R0) were derived
from the differences in microstructure and chemistry (especially cement hydrates) of the six
28-day old mortar samples. Over the 48 days of salt ponding, the evolution of R0 and C0 over
time and their differences between samples can be accounted for by the ever-changing pore
fluid chemistry and the continued cement hydration with active participation of chloride or
inhibitors.
The admixing of NaCl in fresh mortar generally increased the electrical resistance of
hardened mortar, especially in the first month of salt ponding (see Figure 6a). Note that to
examine the influence of salt contamination in fresh mortar, the data from the early stage of
ponding by 3% NaCl solution are more elucidatory as they were not as clouded by the
chloride ingress as the data from the later stage. In the first three weeks, for the non-inhibited
mortars (samples A, B and C), the mortar resistance increased significantly over time, which
may be attributed to the continued cement hydration resulting in denser mortar
microstructure and reduced porosity. The mortar resistance then fluctuated, indicating
possibly another competing mechanism at work. As the ponding progressed, the mortar
matrix became more conductive with the increase in moisture and salt content, which would
tend to reduce mortar resistance.
The admixing of corrosion inhibitors in fresh mortar generally decreased the electrical
resistance of hardened mortar (see Figure 6a), which is not beneficial in terms of controlling
the rate of rebar corrosion propagation. For the mortar admixed with 0.5M SN (sample E),
however, the mortar resistance increased significantly with time of salt ponding, eventually
exceeding that of two non-inhibited mortars (samples A and B). For sample E, this along
- 9 -
with the significant increase of C0 with time of salt ponding may be explained by the
modification of the mortar microstructure by SN. For the mortars admixed with 0.05M DGP
(sample D) or 0.05M DMEA (sample F), their electrical resistance was consistently lower
than that of the non-inhibited mortars and relatively stable over time. As such, DGP and
DMEA are unlikely to be inhibitors that would block the mortar pores and thus reduce the
cathodic current of steel corrosion by limiting the ingress of oxygen, whereas SN seems to
have such function.
As shown in Figure 6b, the admixing of corrosion inhibitors in fresh mortar
consistently increased the capacitance of hardened mortar (samples D, E, and F, compared
with sample B). This may be attributed to the increased dielectric constant of mortar matrix
as well as the altered mortar microstructure and cement hydrates in the presence of the
inhibitors. The capacitance value C0 obtained from all four diagrams are in range of 1-10
nF.cm-2 for the first 30 days of salt ponding. This order of magnitude is much lower than data
reported for bulk concrete (1-10 μF.cm-2) 11, but similar to data reported for bulk mortar
(~0.8 nF.cm-2) 20. Compared with concrete samples, the use of much smaller sand (maximum
size of 250 μm) in this study along with a very small sand-to-cement weight ratio (0.075, no
other aggregates) led to much denser microstructure of the mortar samples, which can
account for the much lower values in electrical capacitance.
3.2. The steel-mortar interface. In the Nyquist diagrams, the intermediate frequency
loop can be attributed to the properties of the steel-mortar interface, with R1 and C1
representing the electrical resistance and capacitance of the interfacial film consisting of
mainly the corrosion products. Figures 7a, 7b and 7c show the evolution of R1 and C1 over
time for some of the steel-mortar samples under salt ponding, respectively. According to
Dhouibi et al. (2002), differences in the initial value of resistance R1 were derived from the
differences in ionic resistance of this interfacial film 11.
- 10 -
As shown in Figure 7a, the admixing of NaCl in fresh mortar significantly decreased
the resistance of the steel-mortar interfacial film, indicating a more conductive interface due to
the presence of NaCl and corrosion products. For the mortar admixed with 3% NaCl (sample
B), R1 increased with time, attributable to the formation of corrosion products at the interface,
likely iron oxides and oxychloride complexes 10-11. For the Portland cement mortar without any
admixed salt (sample A), R1 decreased significantly after approximately 30 days of ponding by
3% NaCl, signifying that the chloride solution had reached the steel-mortar interface. For the
mortar admixed with 3% NaCl and 0.5M SN (sample E), it is interesting to note that the
evolution of its R1 followed a pattern similar to sample A, indicating that the effect of sodium
nitrite on the resistance of steel-mortar interfacial film offset that of NaCl.
As shown in Figure 7b, after approximately 30 days of salt ponding, all three inhibited
mortar samples (D, E, F) had lower R1 values than the non-inhibited mortar (B), implying
different amounts and characteristics of corrosion products at the steel-mortar interface. As
shown in Figure 7c, the admixing of NaCl in fresh mortar generally increased the capacitance
of the steel-mortar interfacial film, showing that the admixed salt changed the dielectric
properties of the interface layer, likely through the formation of corrosion products.
3.3. The steel-electrolyte interface. In the Nyquist diagrams, the low frequency loop
can be attributed to the properties of the steel/electrolyte interface, with R2 and C2
representing the charge transfer resistance of steel (mainly polarization resistance) and the
capacitance of double layer and inhibitor film on the steel surface, as well as the Warburg
impedance W characterizing the diffusion of species through the interface.
Figure 8 shows the corrosion current density (icorr) of steel as a function of mix design
and salt ponding time, where the upper bars (icorr >1 μA/cm2) indicate very active corrosion
- 11 -
state of steel according to literature 21. icorr was calculated as B/R2, with B = 52 mV for passive
state of steel (when icorr <0.1 μA/cm2) or 25mV if otherwise.
As shown in Figure 8, the steel plates attached to the 5-mm thick non-inhibited mortar
samples (A, B and C) had very active corrosion since the early days of salt ponding by 3%
NaCl solution. The samples studied featured a very aggressive environment for the steel, since
the mortar had a high water-to-cement ratio (0.5), was admixed with high concentrations of
chloride (except sample A), and then ponded by 3% NaCl solution. The admixing of NaCl in
fresh mortar generally reduced the open circuit potential (OCP) of the steel, especially in the
first month (samples B and C vs. sample A, see Figure 9a), attributable to exacerbated steel
corrosion and increased electrical resistance of hardened mortar.
The admixing of all three inhibitors in fresh mortar was found to increase the
polarization resistance of steel, indicating reduced corrosion rate of the steel over 48-day
exposures to salt ponding. The evolution of icorr over time of salt ponding indicates that 0.05M
DMEA (sample F vs. sample B) was the most capable and reliable corrosion inhibitor,
followed by 0.5M SN (sample E vs. sample B); whereas 0.05M DGP (sample D vs. sample B)
was a slower and less capable corrosion inhibitor.
3.4. Inhibition mechanisms
3.4.1. N,N′-dimethylethanolamine (DMEA). Figure 9b shows that the admixing of
0.05M DMEA in fresh mortar raised or reduced the OCP of the steel in a cyclic manner,
when comparing sample B (with 3% NaCl admixed) and sample F (with 3% NaCl and 0.05M
DMEA admixed). This confirms some of the inhibition mechanisms identified by a previous
study in aqueous solutions 16, suggesting that DMEA was able to displace chloride ions from
the steel surface and to protect the surface passive film. The partial displacement of chloride
ions accompanied by the chemisorption of DMEA is confirmed in our other paper (Part 1) 17.
- 12 -
The passive film on the steel surface, however, was not durable over the 48-day salt ponding
period. This differed from the finding from the study in aqueous solutions 16, where the
DMEA-to-chloride concentration ratio was much higher and a durable passivating film was
formed by DMEA on the steel surface. As suggested by the corrosion current density data
(icorr ~0.1 μA/cm2 over the 48-day salt ponding, see Figure 8), DMEA effectively delayed the
onset of steel corrosion and inhibited the steel corrosion even when the passive film was
compromised (e.g., when the OCP values dropped below -0.6 VSCE). The simultaneous
reduction in the OCP and in the icorr signified a “cathodic inhibitor” at work, i.e., the strong
absorption of DMEA onto the steel surface inhibited the cathodic reaction of steel corrosion
by limiting the access of oxygen to the steel 4. The inhibition mechanisms of DMEA make it
a very promising candidate for commercial corrosion inhibitor formulations, as it may offer
synergistic benefits when used together with nitrites.
3.4.2. Sodium nitrite (SN). Based on the corrosion current density data (icorr) shown
in Figure 8, the steel in sample E (with 3% NaCl and 0.5M SN admixed) had very active
corrosion until a few days into salt ponding, suggesting the mechanism that SN inhibits
corrosion by reacting with ferrous ions to form a protective ferric oxide film. SN did not
prevent the onset of steel corrosion, instead it significantly reduced the corrosion rate of the
steel once active corrosion had been initiated, demonstrating its strong ability to repair
defects. This differed from the findings from the study of calcium-nitrite-based and organic
CIAs, where they were found to inhibit the initiation of chloride-induced corrosion but did
not significantly affect the subsequent corrosion rates of steel 7. Figure 9b shows that the
admixing of 0.5M SN in fresh mortar raised the OCP of the steel, when comparing sample B
(with 3% NaCl admixed) and sample E. This confirms that SN can serve as an “anodic
inhibitor” to inhibit the anodic reaction of steel corrosion through passivation of the steel, as
a result of the following reaction 2:
- 13 -
2Fe2+ + 2OH - + 2NO2 - → 2NO↑ + Fe2O3 + H2O
This passivation mechanism accounted for the pattern similarity in the evolution of R1
(electrical resistance of the steel-mortar interfacial film) over time between sample E and the
control (A: without any salt or inhibitor admixed), as shown in Figure 7a. In other words, the
effect of SN on R1 offset that of NaCl, as they passivated and de-passivated the steel surface
respectively. The formation of a protective film in the presence of 0.5M SN also accounted for
the similarity in the EIS patterns between sample E and the control, as discussed earlier.
For sample E, the decay of the steel OCP over the 48-day salt ponding period (as shown
in Figure 9b) coincided with the decrease of nitrite-to-chloride ratio over time. As the ponding
progressed, the electrical resistance and capacitance of the mortar increased over time (see
Figure 6); and eventually, the low icorr values along with the diminished OCP enhancement
signified a “pore blocker” at work, i.e., the modification of mortar matrix by SN blocked the
pores critical to oxygen ingress and thus reduced the cathodic current 4. The modification of
mortar matrix by SN may account for its detrimental effect on concrete strength reported
previously 9. The inhibition mechanisms of SN make it a promising candidate for rehabilitating
chloride-contaminated reinforced concrete where active corrosion of the embedded steel might
have been initiated. In contrast, caution needs to be exercised when using SN as an inhibitor to
be admixed in fresh concrete, considering its inability to prevent the onset of steel corrosion
and its potential adverse impact on the concrete strength.
3.4.3. Disodium β-glycerophosphate (DGP). Based on the corrosion current density
data (icorr) shown in Figure 8, the steel in sample D (with 3% NaCl and 0.05M DGP admixed)
had very active corrosion until 48 days into salt ponding. DGP did not prevent the onset of
steel corrosion or bring the steel back to passive state (icorr <0.1 μA/cm2 or so), whereas it
constantly slowed down the pitting corrosion of the steel. This differed from the findings
from a previous study of DGP, where the DGP-to-chloride concentration ratio was much
- 14 -
higher (0.5) and 0.05M DGP was able to prevent pitting corrosion of steel in a saturated
calcium hydroxide solution containing 0.1 M chloride ions 14. Figure 9b shows that the
admixing of 0.05M DGP in fresh mortar raised the OCP of the steel in the early stage of salt
ponding, when comparing sample B (with 3% NaCl admixed) and sample D. This suggests
that DGP was able to displace chloride ions from the steel surface and to protect the surface
passive film. The partial displacement of chloride ions accompanied by the chemisorption of
DGP is confirmed in our other paper (Part 1) 17. The passive film on the steel surface,
however, was not durable over the 48-day salt ponding period. This differed from the finding
from the study in aqueous solutions 15, where the DGP-to-chloride concentration ratio was
much higher (0.5) and DGP formed an impervious surface film on steel to block any
localized corrosion attack 15.
For sample D, the decay of the steel OCP over the 48-day salt ponding period (as
shown in Figure 9b) coincided with the decrease of DGP-to-chloride ratio over time. As the
ponding progressed, both the OCP and the icorr values generally decreased. As discussed
earlier, the evolution of mortar resistance ruled out the possibility of DGP being a “pore
blocker”. Therefore, a reasonable hypothesis is that as the active corrosion propagated on the
steel surface, the condition of the surface film formed by the chelating action of the phosphate
group in DGP with the surface cations 15 improved, which was able to gradually slow down the
steel pitting corrosion by limiting the ingress of oxygen. The inhibition mechanisms of DGP
make it a not-so-ideal CIA in chloride-laden environments, but a promising candidate when
used together with nitrites since the nitrites would offer better protection of the passive
conditions of the steel surface while DGP can partially displace chloride ions and its
chemisorption on the surface can inhibit the cathodic reaction of steel corrosion.
- 15 -
4. Conclusions
We used electrochemical tools (EIS and OCP) to characterize the behavior of steel-
mortar samples admixed with sodium chloride and corrosion inhibitors. For most of the mortar
samples, an equivalent circuit with three time constants and a diffusion element was found to
provide the best fit to the EIS data. The admixing of NaCl and corrosion inhibitors in fresh
mortar generally increased and decreased the electrical resistance of hardened mortar,
respectively, especially in the early weeks of ponding by 3% NaCl solution. The admixing of
corrosion inhibitors in fresh mortar consistently increased the capacitance of hardened mortar.
The effect of sodium nitrite on the resistance of steel-mortar interfacial film offset that of
NaCl, attributable to the formation of a protective ferric oxide film.
The admixing of all three inhibitors in fresh mortar increased the polarization resistance
of steel in mortar, indicating reduced corrosion rate. 0.05M N,N′-dimethylethanolamine was
the most capable and reliable corrosion inhibitor, followed by 0.5M sodium nitrite; whereas
0.05M disodium β-glycerophosphate was a slower and less capable corrosion inhibitor.
The inhibition mechanisms of DMEA (partial displacing of chloride ions and acting as
cathodic inhibitor) make it a very promising candidate for commercial corrosion inhibitor
formulations, as it may offer synergistic benefits when used together with nitrites. The
inhibition mechanisms of SN (acting as anodic inhibitor and pore blocker) make it a promising
candidate for rehabilitating chloride-contaminated reinforced concrete where active corrosion
of the embedded steel might have been initiated. In contrast, caution needs to be exercised
when using SN as an inhibitor to be admixed in fresh concrete, considering its inability to
prevent the onset of steel corrosion and its potential adverse impact on the concrete strength.
The inhibition mechanisms of DGP make it a not-so-ideal CIA in chloride-laden environments,
but a promising candidate when used together with nitrites since the nitrites would offer better
protection of the passive conditions of the steel surface while DGP can partially displace
- 16 -
chloride ions and its chemisorption on the surface can inhibit the cathodic reaction of steel
corrosion.
Acknowledgements
This work was supported by the Research and Innovative Technology Administration
under U.S. Department of Transportation through the University Transportation Center
research grant. We would also like to extend our appreciation to Dr. Wei Chu, Matthew
Reichert, Dan Hall, and Alex Huffield at Montana State University for their assistance in the
early stage of this research.
- 17 -
Literature Cited
(1) Glass, G. K.; Buenfield, N. R. Chloride induced corrosion of steel in concrete. Prog.
Struct. Engng. Mater. 2000, 2, 448-458.
(2) Berke, N. S.; Sundberg, K. M. The effects of calcium nitrite and microsilica admixtures
on corrosion resistance of steel in concrete. Proceedings of Paul Klieger Symposium on
Performance of Concrete. ACI SP-122. 1990, 269
(3) Berke, N. S.; Weil, T. G. World wide review of corrosion inhibitors in concrete.
Advances in concrete technology; CANMET: Ottawa, 1994.
(4) Hansson, C. M.; Mammolite, L.; Hope, B. B. Corrosion inhibitors in concrete – Part I:
The principles. Cement. Concrete. Res.1998, 28, 1775-1781.
(5) Sastri, V.S, Corrosion inhibitors: principles and applications, Willey: England, 1998.
(6) Lane, D.R.; Melendez, J.A.; Munteanu, V.F.; Kinney, F.D. Corrosion inhibiting
admixture for concrete. US Patent 2002, 6,340, 438.
(7) Trépanier, S. M.; Hope, B. B.; Hansson, C. M. Corrosion inhibitors in concrete. Part III.
Effect on time to chloride-induced corrosion initiation and subsequent corrosion rates
of steel in mortar. Cement. Concrete. Res.2001. 31, 713-718.
(8) Stratfull, R. F. The corrosion of steel in a reinforced concrete bridge. Corrosion 1957,
13, 173-179
(9) Craig, R. J.; Wood, L. E. Effectiveness of corrosion inhibitors and their influence on the
physical properties of Portland cement mortars. Highway Res. Rec. 1970, 328:77
(10) Saricimen, H.; Mohammad, M.; Quddus, A.; Shameem, M.; Barry, M. S. Effectiveness
of concrete inhibitors in retarding rebar corrosion. Cement. Concrete. Comp. 2002, 24,
89-100.
- 18 -
(11) Dhouibi, L.; Triki, E.; Raharinaivo, A. The application of electrochemical impedance
spectroscopy to determine the long-term effectiveness of corrosion inhibitors for steel
in concrete. Cement. Concrete. Res.2002, 24, 35-43.
(12) Yunovich, M.; Thompson, N. G. Performance of corrosion inhibiting admixtures for
structural concrete - assessment methods and predictive modeling, Corrosion NACExpo
98, NACE International, San Diego, CA. 1998, Paper No. 655.
(13) Monticelli, C.; Frignani, A.; Trabanelli, G.; Brunoro, G. A study on the inhibiting
efficiency of a glycerophosphate-nitrite admixture against steel corrosion in mortars.
Proceedings of the 8th European Symposium on Corrosion Inhibitors. University of
Ferrara, Ferrara, Italy. 1995, 1, 609-620.
(14) Monticelli, C.; Frignani, A.; Trabanelli, G. A study on corrosion inhibitors for concrete
application. Cement. Concrete. Res. 2000, 30(4), 635-642.
(15) Monticelli, C.; Frignani, A.; Trabanelli, G. Corrosion inhibition of steel in chloride-
containing alkaline solutions. J. Appl. Electrochem. 2002, 32(5), 527-535.
(16) Welle, A.; Liao, J. D.; Kaiser, K.; Grunze, M.; Blank, N.; Mäder, U. Interactions of
N,N′-dimethylaminoethanol with steel surfaces in alkaline and chlorine containing
solutions. Appl. Surf. Sci. 1997, 119, 185-198.
(17) Yang, Z.; Shi, X.; Nguyen, T. A.; Suo, Z.; Avci, R. Corrosion and inhibition
performances at the steel-mortar interface. Part 1: A surface analytical investigation.
Ind. Eng. Chem. Res., under review.
(18) Trabanelli, G.; Monticelli, C.; Grassi, V.; Frignani, A. Electrochemical study on
inhibitors of rebar corrosion in carbonated concrete. Cement. Concrete. Res. 2005, 35,
1804– 1813.
- 19 -
(19) Song, S. Application of AC electrochemical spectroscopy (EIS) in the study of
corrosion of reinforced concrete. Proceedings of Corrosion and Prevention. November
23-25, 1998, Hobart, Australia. 1998, 257-264.
(20) He, X.; Shi, X. Chloride permeability and microstructure of Portland cement mortars
incorporating nanomaterials. Transport. Res. Rec. 2008, in press.
(21) Brown, M. C. Assessment of commercial corrosion inhibiting admixtures for reinforced
concrete. Thesis for Master of Science in Civil and Environmental Engineering,
Virginia Polytechnic Institute and State University. 1999.
- 20 -
List of Figures and Tables
Figure 1. EIS Nyquist diagram for sample A: a) complete diagram of 30 kHz -0.005 Hz; b)
high frequencies
Figure 2. EIS Nyquist diagram for: a) sample B; and b) sample C; and c) sample D, 30 kHz -0.005
Hz
Figure 3. EIS Nyquist diagram for sample E: a) complete diagram of 30 kHz -0.005 Hz; b)
high frequencies
Figure 4. EIS Nyquist diagram for sample F: a) complete diagram of 30 kHz -0.005 Hz; b)
high frequencies
Figure 5. Equivalent electric circuit for the steel-mortar system under salt ponding
Figure 6. Evolution of R0 (a) and C0 (b) over time for steel-mortar sample under salt ponding
Figure 7. Evolution of R1 (a) (b) and C1 (c) over time for steel-mortar sample under salt
ponding
Figure 8. Corrosion current density of steel as a function of mix design and salt ponding time
Figure 9. Evolution of OCP of the steel over time for: a) samples with or without admixed
NaCl; and b) samples with or without admixed corrosion inhibitors
Table 1. Mix design of mortar samples investigated (percentages and concentrations were by
weight of water)
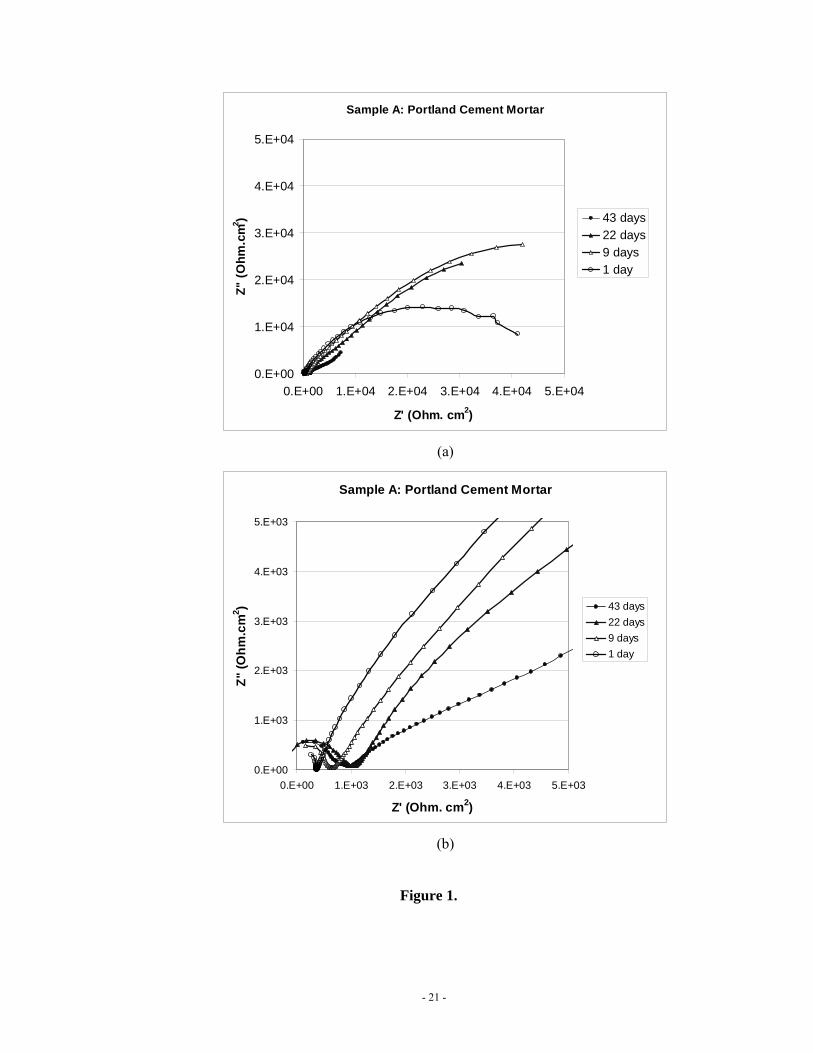
- 21 -
Sample A: Portland Cement Mortar
0.E+00
1.E+04
2.E+04
3.E+04
4.E+04
5.E+04
0.E+00 1.E+04 2.E+04 3.E+04 4.E+04 5.E+04
Z' (Ohm. cm2)
Z" (O
hm.c
m2 ) 43 days
22 days9 days1 day
(a)
Sample A: Portland Cement Mortar
0.E+00
1.E+03
2.E+03
3.E+03
4.E+03
5.E+03
0.E+00 1.E+03 2.E+03 3.E+03 4.E+03 5.E+03
Z' (Ohm. cm2)
Z" (O
hm.c
m2 ) 43 days
22 days9 days1 day
(b)
Figure 1.
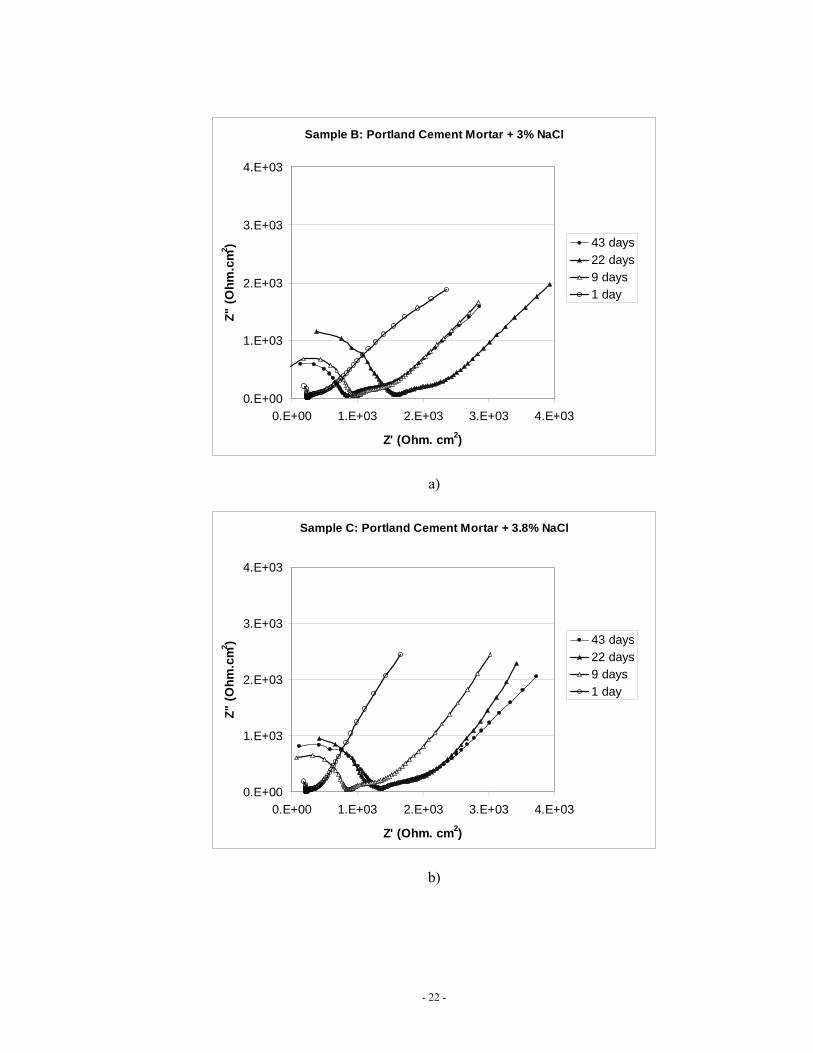
- 22 -
Sample B: Portland Cement Mortar + 3% NaCl
0.E+00
1.E+03
2.E+03
3.E+03
4.E+03
0.E+00 1.E+03 2.E+03 3.E+03 4.E+03
Z' (Ohm. cm2)
Z" (O
hm.c
m2 ) 43 days
22 days9 days1 day
a)
Sample C: Portland Cement Mortar + 3.8% NaCl
0.E+00
1.E+03
2.E+03
3.E+03
4.E+03
0.E+00 1.E+03 2.E+03 3.E+03 4.E+03
Z' (Ohm. cm2)
Z" (O
hm.c
m2 ) 43 days
22 days9 days1 day
b)
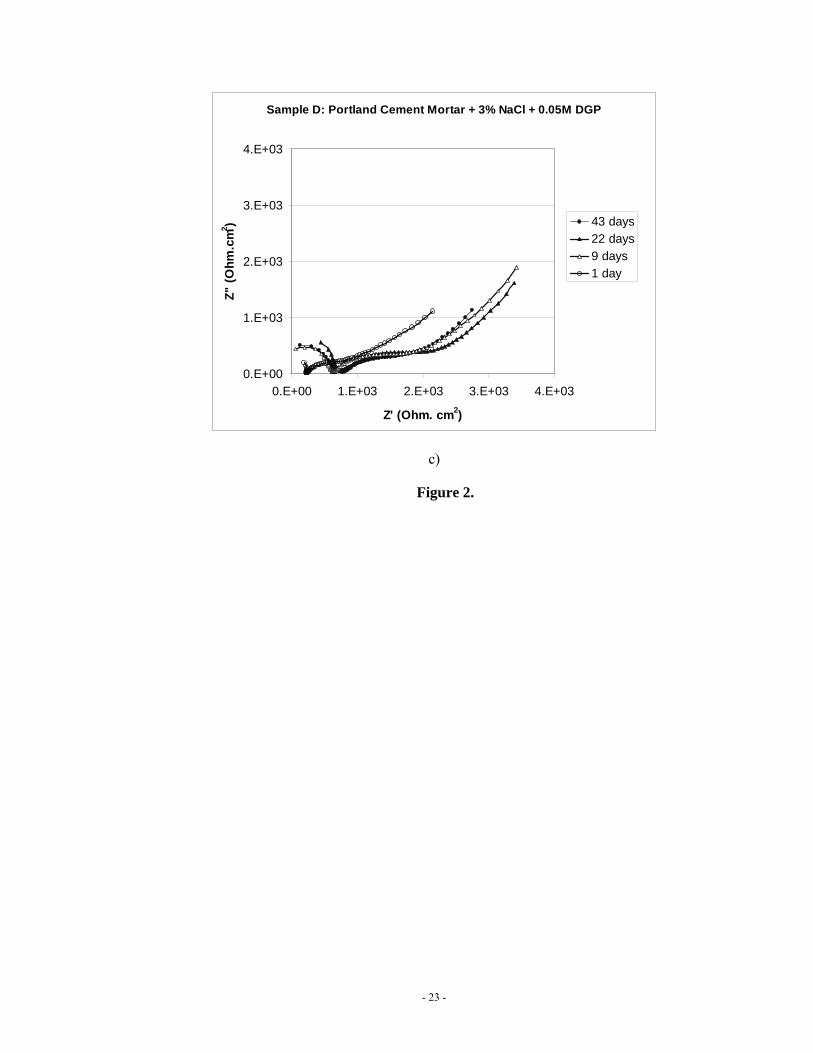
- 23 -
Sample D: Portland Cement Mortar + 3% NaCl + 0.05M DGP
0.E+00
1.E+03
2.E+03
3.E+03
4.E+03
0.E+00 1.E+03 2.E+03 3.E+03 4.E+03
Z' (Ohm. cm2)
Z" (O
hm.c
m2 ) 43 days
22 days9 days1 day
c)
Figure 2.
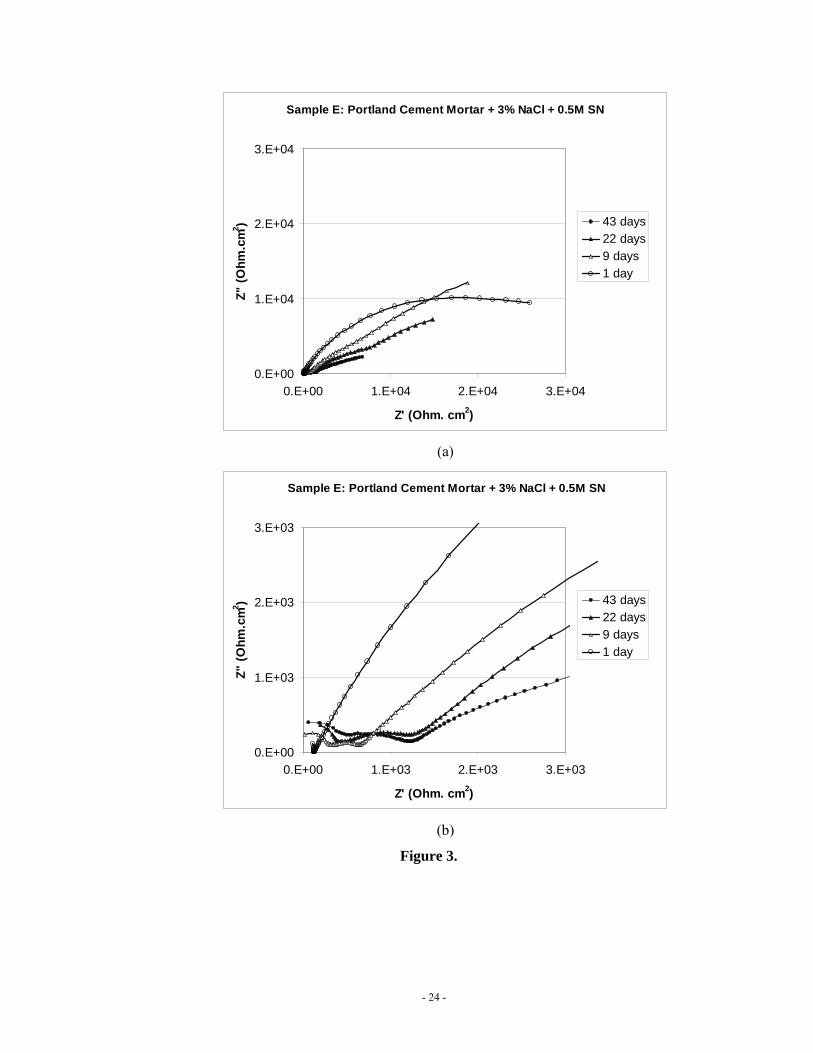
- 24 -
Sample E: Portland Cement Mortar + 3% NaCl + 0.5M SN
0.E+00
1.E+04
2.E+04
3.E+04
0.E+00 1.E+04 2.E+04 3.E+04
Z' (Ohm. cm2)
Z" (O
hm.c
m2 ) 43 days
22 days9 days1 day
(a)
Sample E: Portland Cement Mortar + 3% NaCl + 0.5M SN
0.E+00
1.E+03
2.E+03
3.E+03
0.E+00 1.E+03 2.E+03 3.E+03
Z' (Ohm. cm2)
Z" (O
hm.c
m2 ) 43 days
22 days9 days1 day
(b)
Figure 3.
- 25 -
Sample F: Portland Cement Mortar + 3% NaCl + 0.05M DMEA
0.E+00
1.E+03
2.E+03
3.E+03
0.E+00 1.E+03 2.E+03 3.E+03
Z' (Ohm. cm2)
Z" (O
hm.c
m2 ) 43 days
22 days9 days1 day
(a)
Sample F: Portland Cement Mortar + 3% NaCl + 0.05M DMEA
0.E+00
1.E+03
2.E+03
0.E+00 1.E+03 2.E+03
Z' (Ohm. cm2)
Z" (O
hm.c
m2 ) 43 days
22 days9 days1 day
(b)
Figure 4.
- 26 -
Figure 5.
- 27 -
0
200
400
600
800
1000
1200
1400
1600
0 10 20 30 40 50 60
Time of ponding by 3% NaCl solution (days)
R0 (
Ohm
.cm
2 )A: PCM
B: PCM + 3% NaCl
C: PCM + 3.8% NaCl
D: B+0.05M DGP
E: B + 0.50M SN
F: B + 0.05M DMEA
(a)
-9.5
-9.0
-8.5
-8.0
-7.5
-7.0
-6.5
-6.0
0 10 20 30 40 50 60
Time of ponding by 3% NaCl solution (days)
C0 (
F.cm
-2),
log B: PCM + 3% NaCl
D: B+0.05M DGPE: B + 0.50M SN
F: B + 0.05M DMEA
(b)
Figure 6.
- 28 -
0
20000
40000
60000
80000
100000
120000
0 10 20 30 40 50 60
Time of ponding by 3% NaCl solution (days)
R1 (
Ohm
.cm
2 )
B: PCM + 3% NaClA: PCM
C: PCM + 3.8% NaClE: B + 0.50M SN
(a)
0
5000
10000
15000
20000
25000
30000
35000
40000
0 10 20 30 40 50 60
Time of ponding by 3% NaCl solution (days)
R1 (
Ohm
.cm
2 )
B: PCM + 3% NaCl
D: B+0.05M DGPE: B + 0.50M SN
F: B + 0.05M DMEA
(b)
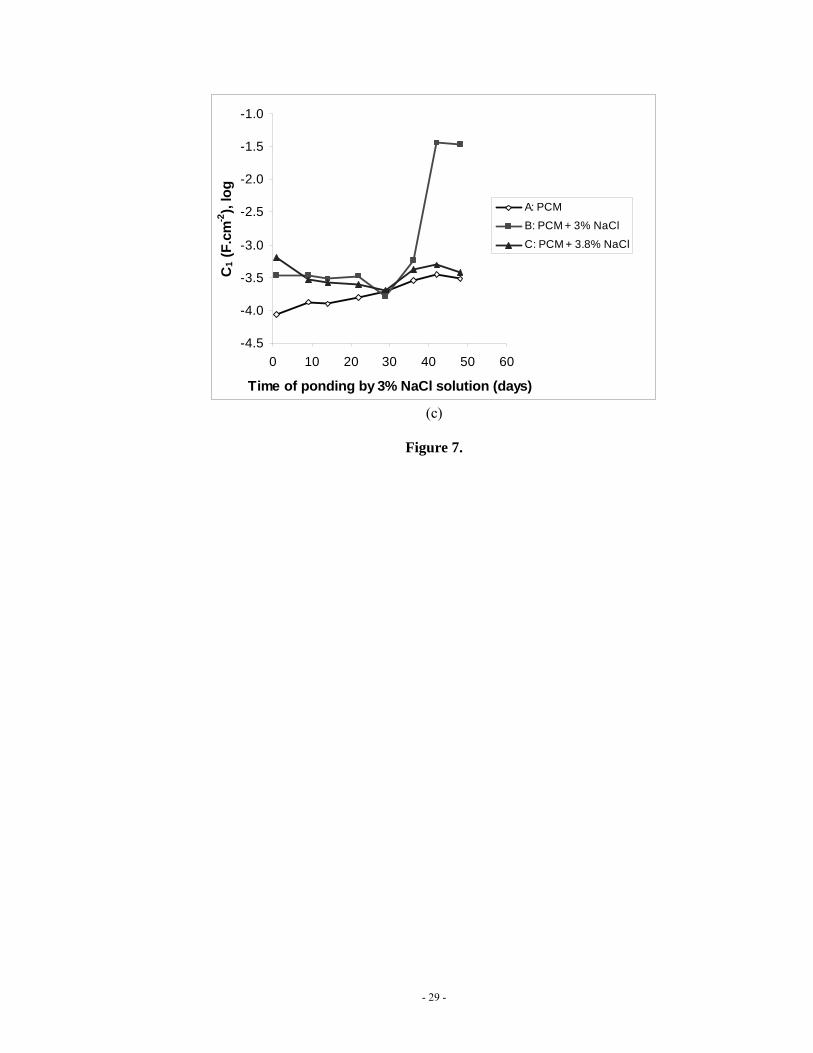
- 29 -
-4.5
-4.0
-3.5
-3.0
-2.5
-2.0
-1.5
-1.0
0 10 20 30 40 50 60
Time of ponding by 3% NaCl solution (days)
C1 (
F.cm
-2),
log
A: PCMB: PCM + 3% NaCl
C: PCM + 3.8% NaCl
(c)
Figure 7.
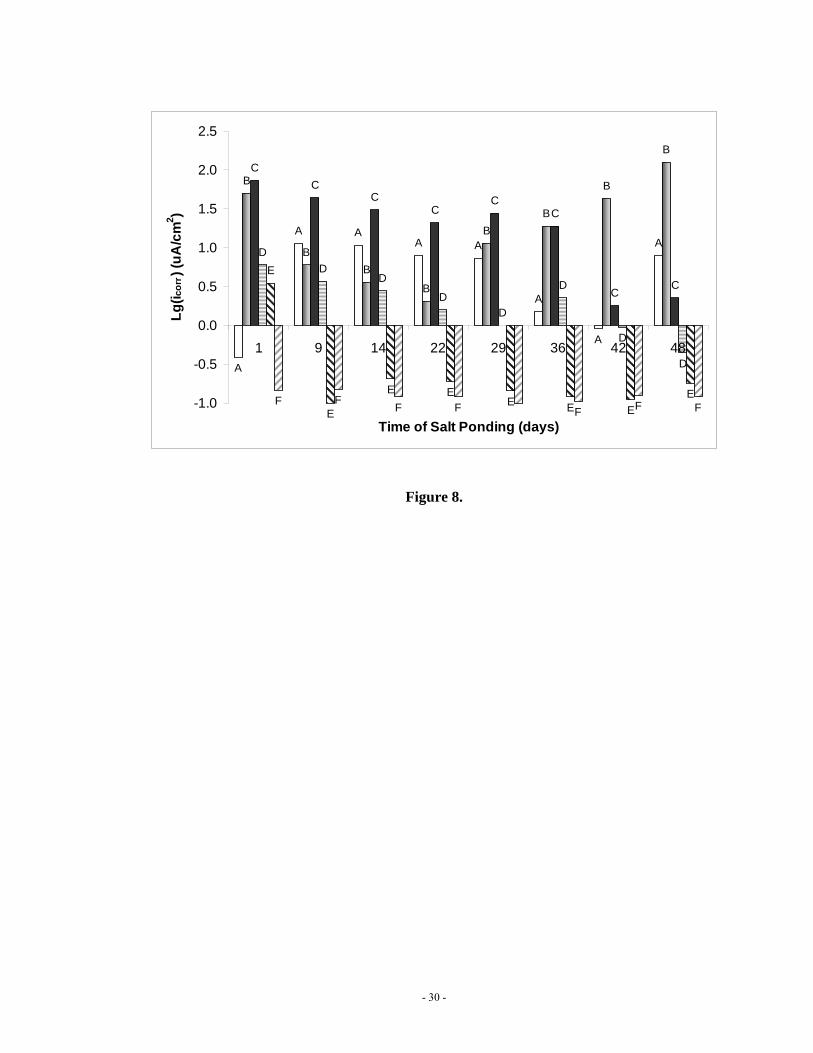
- 30 -
A
A AA A
A
A
A
B
BB
B
BB
B
BC
CC
CC
C
CC
DD
D
DD
D
D
D
E
E
E EE E E
EF FF F F F F-1.0
-0.5
0.0
0.5
1.0
1.5
2.0
2.5
1 9 14 22 29 36 42 48
Time of Salt Ponding (days)
Lg(i c
orr)
(uA
/cm
2 )
Figure 8.
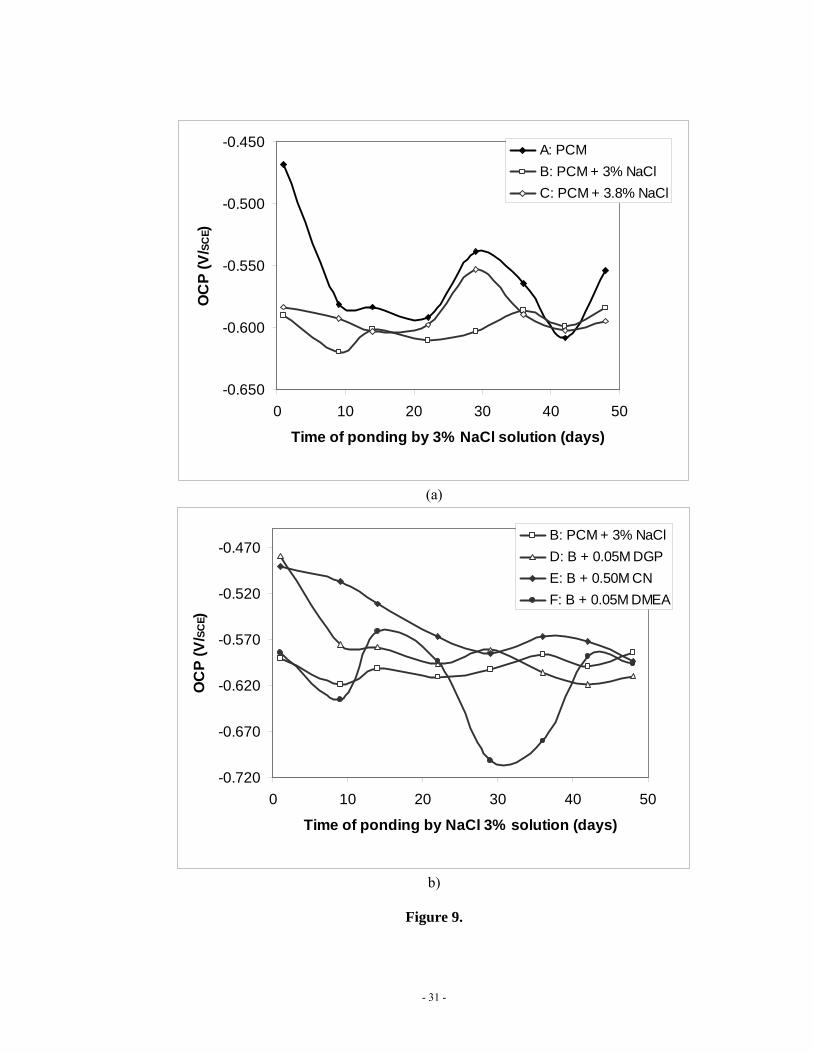
- 31 -
-0.650
-0.600
-0.550
-0.500
-0.450
0 10 20 30 40 50
Time of ponding by 3% NaCl solution (days)
OC
P (V
/ SCE)
A: PCMB: PCM + 3% NaClC: PCM + 3.8% NaCl
(a)
-0.720
-0.670
-0.620
-0.570
-0.520
-0.470
0 10 20 30 40 50
Time of ponding by NaCl 3% solution (days)
OC
P (V
/ SCE)
B: PCM + 3% NaClD: B + 0.05M DGPE: B + 0.50M CNF: B + 0.05M DMEA
b)
Figure 9.
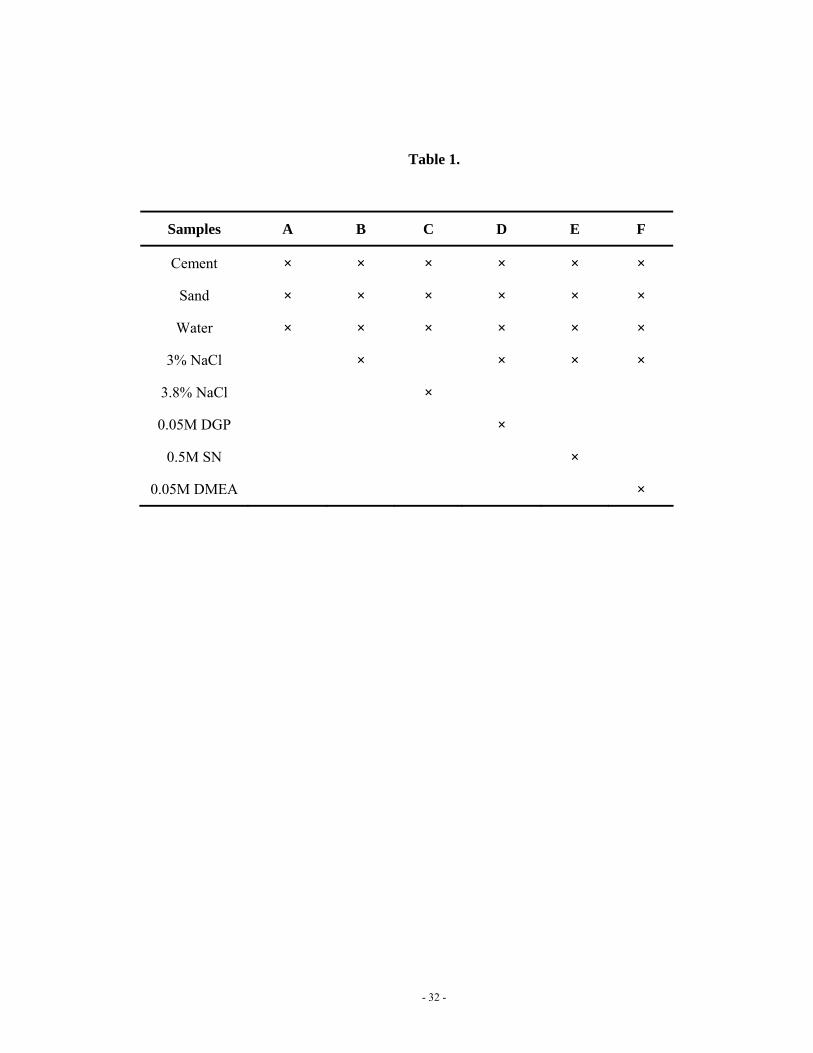
- 32 -
Table 1.
Samples A B C D E F
Cement × × × × × ×
Sand × × × × × ×
Water × × × × × ×
3% NaCl × × × ×
3.8% NaCl ×
0.05M DGP ×
0.5M SN ×
0.05M DMEA ×