Measuring cation dependent DNA polymerase fidelity landscapes by deep sequencing
10
Measuring Cation Dependent DNA Polymerase Fidelity Landscapes by Deep Sequencing Bradley Michael Zamft 1. , Adam H. Marblestone 2,9. , Konrad Kording 3,8 , Daniel Schmidt 4,5,7 , Daniel Martin-Alarcon 4,5,7 , Keith Tyo 6 , Edward S. Boyden 4,5,7 , George Church 1,2 * 1 Department of Genetics, Harvard Medical School, Boston, Massachusetts, United States of America, 2 Biophysics Program, Harvard University, Boston, Massachusetts, United States of America, 3 Northwestern University, Departments of Physical Medicine and Rehabilitation, Physiology, and Applied Mathematics, Chicago, Illinois, United States of America, 4 Media Lab, Massachusetts Institute of Technology, Cambridge, Massachusetts, United States of America, 5 Department of Biological Engineering, Massachusetts Institute of Technology, Cambridge, Massachusetts, United States of America, 6 Department of Chemical and Biological Engineering, Northwestern University, Evanston, Illinois, United States of America, 7 McGovern Institute, Massachusetts Institute of Technology, Cambridge, Massachusetts, United States of America, 8 The Rehabilitation Institute of Chicago, Chicago, Illinois, United States of America, 9 Wyss Institute, Harvard University, Boston, Massachusetts, United States of America Abstract High-throughput recording of signals embedded within inaccessible micro-environments is a technological challenge. The ideal recording device would be a nanoscale machine capable of quantitatively transducing a wide range of variables into a molecular recording medium suitable for long-term storage and facile readout in the form of digital data. We have recently proposed such a device, in which cation concentrations modulate the misincorporation rate of a DNA polymerase (DNAP) on a known template, allowing DNA sequences to encode information about the local cation concentration. In this work we quantify the cation sensitivity of DNAP misincorporation rates, making possible the indirect readout of cation concentration by DNA sequencing. Using multiplexed deep sequencing, we quantify the misincorporation properties of two DNA polymerases – Dpo4 and Klenow exo 2 – obtaining the probability and base selectivity of misincorporation at all positions within the template. We find that Dpo4 acts as a DNA recording device for Mn 2+ with a misincorporation rate gain of ,2%/mM. This modulation of misincorporation rate is selective to the template base: the probability of misincorporation on template T by Dpo4 increases .50-fold over the range tested, while the other template bases are affected less strongly. Furthermore, cation concentrations act as scaling factors for misincorporation: on a given template base, Mn 2+ and Mg 2+ change the overall misincorporation rate but do not alter the relative frequencies of incoming misincorporated nucleotides. Characterization of the ion dependence of DNAP misincorporation serves as the first step towards repurposing it as a molecular recording device. Citation: Zamft BM, Marblestone AH, Kording K, Schmidt D, Martin-Alarcon D, et al. (2012) Measuring Cation Dependent DNA Polymerase Fidelity Landscapes by Deep Sequencing. PLoS ONE 7(8): e43876. doi:10.1371/journal.pone.0043876 Editor: Mark Isalan, Center for Genomic Regulation, Spain Received June 26, 2012; Accepted July 30, 2012; Published August 22, 2012 Copyright: ß 2012 Zamft et al. This is an open-access article distributed under the terms of the Creative Commons Attribution License, which permits unrestricted use, distribution, and reproduction in any medium, provided the original author and source are credited. Funding: Adam Marblestone is supported by the Fannie and John Hertz Foundation. Daniel Schmidt is supported by the Damon Runyon Foundation. Konrad Kording and Keith Tyo are funded in part by the Chicago Biomedical Consortium with support from the Searle Funds at The Chicago Community Trust. Ed Boyden is supported by National Institutes of Health (NIH), National Science Foundation, the MIT McGovern Institute and Media Lab, the New York Stem Cell Foundation Robertson Investigator Award, the Human Frontiers Science Program, and the Paul Allen Distinguished Investigator in Neuroscience Award. Bradley Zamft and George Church acknowledge support from the Office of Naval Research and the NIH Centers of Excellence in Genomic Science. The funders had no role in study design, data collection and analysis, decision to publish, or preparation of the manuscript. Competing Interests: The authors have declared that no competing interests exist. * E-mail: [email protected] . These authors contributed equally to this work. Introduction Traditional approaches to signal recording rely on electromag- netic radiation or electronic hardware to couple the signals of interest to an external data storage device. These approaches become cumbersome, however, when signals reside deep within complex tissues, as is the case in functional neural connectomics, where simultaneously accessing millions of neurons is currently not feasible [1]. In contrast, molecular approaches to information transfer are by nature ubiquitous, massively parallel, and in- expensive. We have recently proposed that information could be recorded onto DNA [2,3,4], arguably the most robust molecular information storage mechanism in nature. Recording systems based on DNA can leverage scientific and industrial interest in technologies for manipulating and sequencing nucleic acids, as well as advances in protein design. A DNA polymerase could be repurposed as a nano-scale recording device, bypassing many of the hurdles of sensing technologies by locally measuring and storing information rather than requiring it to be rapidly transmitted, digitized and stored elsewhere. In a simple encoding scheme, an environmental signal of interest is coupled to the nucleotide misincorporation rate of the DNA polymerase (Figure 1A). Then, as the polymerase copies a known DNA template, the level of misincorporations produced in the copied strand will represent the amplitude of the environmental signal present. If the environmental signal varies over time, those changes could in principle also be reflected by changes in the misincorporation rate over time, enabling the DNA data storage idea to be extended to the time domain. PLOS ONE | www.plosone.org 1 August 2012 | Volume 7 | Issue 8 | e43876
-
Upload
northwestern -
Category
Documents
-
view
3 -
download
0
Transcript of Measuring cation dependent DNA polymerase fidelity landscapes by deep sequencing

Measuring Cation Dependent DNA Polymerase FidelityLandscapes by Deep SequencingBradley Michael Zamft1., Adam H. Marblestone2,9., Konrad Kording3,8, Daniel Schmidt4,5,7,
Daniel Martin-Alarcon4,5,7, Keith Tyo6, Edward S. Boyden4,5,7, George Church1,2*
1Department of Genetics, Harvard Medical School, Boston, Massachusetts, United States of America, 2 Biophysics Program, Harvard University, Boston, Massachusetts,
United States of America, 3Northwestern University, Departments of Physical Medicine and Rehabilitation, Physiology, and Applied Mathematics, Chicago, Illinois, United
States of America, 4Media Lab, Massachusetts Institute of Technology, Cambridge, Massachusetts, United States of America, 5Department of Biological Engineering,
Massachusetts Institute of Technology, Cambridge, Massachusetts, United States of America, 6Department of Chemical and Biological Engineering, Northwestern
University, Evanston, Illinois, United States of America, 7McGovern Institute, Massachusetts Institute of Technology, Cambridge, Massachusetts, United States of America,
8 The Rehabilitation Institute of Chicago, Chicago, Illinois, United States of America, 9Wyss Institute, Harvard University, Boston, Massachusetts, United States of America
Abstract
High-throughput recording of signals embedded within inaccessible micro-environments is a technological challenge. Theideal recording device would be a nanoscale machine capable of quantitatively transducing a wide range of variables intoa molecular recording medium suitable for long-term storage and facile readout in the form of digital data. We haverecently proposed such a device, in which cation concentrations modulate the misincorporation rate of a DNA polymerase(DNAP) on a known template, allowing DNA sequences to encode information about the local cation concentration. In thiswork we quantify the cation sensitivity of DNAP misincorporation rates, making possible the indirect readout of cationconcentration by DNA sequencing. Using multiplexed deep sequencing, we quantify the misincorporation properties of twoDNA polymerases – Dpo4 and Klenow exo2 – obtaining the probability and base selectivity of misincorporation at allpositions within the template. We find that Dpo4 acts as a DNA recording device for Mn2+ with a misincorporation rate gainof ,2%/mM. This modulation of misincorporation rate is selective to the template base: the probability of misincorporationon template T by Dpo4 increases .50-fold over the range tested, while the other template bases are affected less strongly.Furthermore, cation concentrations act as scaling factors for misincorporation: on a given template base, Mn2+ and Mg2+
change the overall misincorporation rate but do not alter the relative frequencies of incoming misincorporated nucleotides.Characterization of the ion dependence of DNAP misincorporation serves as the first step towards repurposing it asa molecular recording device.
Citation: Zamft BM, Marblestone AH, Kording K, Schmidt D, Martin-Alarcon D, et al. (2012) Measuring Cation Dependent DNA Polymerase Fidelity Landscapes byDeep Sequencing. PLoS ONE 7(8): e43876. doi:10.1371/journal.pone.0043876
Editor: Mark Isalan, Center for Genomic Regulation, Spain
Received June 26, 2012; Accepted July 30, 2012; Published August 22, 2012
Copyright: � 2012 Zamft et al. This is an open-access article distributed under the terms of the Creative Commons Attribution License, which permitsunrestricted use, distribution, and reproduction in any medium, provided the original author and source are credited.
Funding: Adam Marblestone is supported by the Fannie and John Hertz Foundation. Daniel Schmidt is supported by the Damon Runyon Foundation. KonradKording and Keith Tyo are funded in part by the Chicago Biomedical Consortium with support from the Searle Funds at The Chicago Community Trust. Ed Boydenis supported by National Institutes of Health (NIH), National Science Foundation, the MIT McGovern Institute and Media Lab, the New York Stem Cell FoundationRobertson Investigator Award, the Human Frontiers Science Program, and the Paul Allen Distinguished Investigator in Neuroscience Award. Bradley Zamft andGeorge Church acknowledge support from the Office of Naval Research and the NIH Centers of Excellence in Genomic Science. The funders had no role in studydesign, data collection and analysis, decision to publish, or preparation of the manuscript.
Competing Interests: The authors have declared that no competing interests exist.
* E-mail: [email protected]
. These authors contributed equally to this work.
Introduction
Traditional approaches to signal recording rely on electromag-
netic radiation or electronic hardware to couple the signals of
interest to an external data storage device. These approaches
become cumbersome, however, when signals reside deep within
complex tissues, as is the case in functional neural connectomics,
where simultaneously accessing millions of neurons is currently not
feasible [1]. In contrast, molecular approaches to information
transfer are by nature ubiquitous, massively parallel, and in-
expensive. We have recently proposed that information could be
recorded onto DNA [2,3,4], arguably the most robust molecular
information storage mechanism in nature. Recording systems
based on DNA can leverage scientific and industrial interest in
technologies for manipulating and sequencing nucleic acids, as
well as advances in protein design.
A DNA polymerase could be repurposed as a nano-scale
recording device, bypassing many of the hurdles of sensing
technologies by locally measuring and storing information rather
than requiring it to be rapidly transmitted, digitized and stored
elsewhere. In a simple encoding scheme, an environmental signal
of interest is coupled to the nucleotide misincorporation rate of the
DNA polymerase (Figure 1A). Then, as the polymerase copies
a known DNA template, the level of misincorporations produced
in the copied strand will represent the amplitude of the
environmental signal present. If the environmental signal varies
over time, those changes could in principle also be reflected by
changes in the misincorporation rate over time, enabling the DNA
data storage idea to be extended to the time domain.
PLOS ONE | www.plosone.org 1 August 2012 | Volume 7 | Issue 8 | e43876

DNA polymerases are complex biochemical machines [5]. To
establish them as molecular recording devices, it is necessary to
quantify how environmental variables affect their copying fidelity.
Of central importance is the transfer function associated with
a particular DNAP, which maps the amplitude of the environ-
mental signal to the misincorporation rate of the DNA sequence
data. This transfer function is not only shaped by the biochemical
properties of the polymerase, but also by other aspects of the
experimental setup; it reflects the entire sensing pathway from
environmental variable to filtered and processed sequence data.
Therefore, the design of DNA recording devices requires the
identification of any uncontrolled variables (such as local sequence
context or secondary structure of the source template) that could
alter the shape of this transfer function.
Cation concentrations are logical choices as the input signals for
a DNA recording device because they are affected by many
physiological variables, and some are known to modify DNAP
fidelity [6]. Ca2+, for example, is involved in many signaling
pathways, including neurotransmission [7] and immune activation
[8], and can also be modulated by external stimuli [9]. Mg2+ and
Mn2+ concentrations have been shown to strongly modulate
DNAP misincorporation rate [10]. Quantifying the transfer
function between cation concentration and DNAP fidelity is
a useful step towards elucidating the principles of a DNA
recording device.
Figure 1. DNA polymerase (DNAP) as a molecular signal recorder. (A) Overview of a strategy for using DNA polymerases as signal recordingdevices. Signals (top) are coupled to intracellular or extracellular cation concentration through direct or indirect modulation of an ion channel activity.Cation concentration is in turn coupled to DNA polymerase fidelity on a known template according to a known transfer function (orange curve),generating a DNA recording, in which data is represented by the density of misincorporated bases, and which can be read by DNA sequencing(bottom). (B) Modulation of Taq polymerase by Ca2+ concentration, measured by a traditional blue-white colony counting assay [25]. (C) Biochemicalsteps of the multiplex deep sequencing assay for measuring the transfer functions of error-prone DNAPs.doi:10.1371/journal.pone.0043876.g001
Measuring Cation Dependent DNAP Fidelity
PLOS ONE | www.plosone.org 2 August 2012 | Volume 7 | Issue 8 | e43876

There are a large number of known DNAPs with varying
properties [11] that impact their usability as recording devices. A
DNAP appropriate for DNA recording of environmental signals
should ideally have a wide dynamic range of misincorporation
rates and be active at mesophilic temperatures. Dpo4 (Sulfolobus
solfataricus) [12] is a member of the Y-family of polymerases
[13,14], which are implicated in translesion bypass [15] and
somatic hypermutation [16] and have high misincorporation rates.
Klenow exo2 is the D355A, E357A mutant [17] of the Klenow
Fragment of the E. coli DNA Polymerase I [18], which lacks 39–59
proofreading activity, and, unlike most commercially available
DNAPs, is compatible with the 37uC extension temperature used
for the Y-family enzymes. These two DNAPs seem particularly
interesting in the context of recording device development.
Here we have developed a strand-specific deep sequencing
method to measure the transfer function between divalent cation
concentration and polymerase misincorporation rate in a highly
multiplexed format. We performed barcoded, error-prone primer
extensions using Dpo4 and Klenow exo2, at varying cation
concentrations, and analyzed the products by deep sequencing.
Analysis of the measured transfer functions reveals strong cation,
template base, and sequence-context dependent effects on the
misincorporation rate, which differ dramatically between the
polymerases, and resolves the bulk misincorporation rate into its
underlying transition probabilities. Our method for quantifying
DNAP transfer functions will facilitate the development of
engineered molecular recording devices that utilize DNA as
a storage medium.
Results
To verify that physiologically relevant ions, such as Ca2+, can in
principle modulate DNAP fidelity, we checked the Ca2+ de-
pendence of the fidelity of Taq DNAP using a lacIq-based PCR
fidelity assay (Figure 1B). We constructed a derivative of pUC19
containing the lacIq repressor allele and the partial gene encoding
for the colorimetric enzyme beta-galactosidase (lacZa). The
plasmid was linearized, and PCR-amplified by Taq DNAP in
buffers containing varying concentrations of Ca2+. Subsequently,
the amplified DNA was circularized and transformed into an a-complementing strain of E.coli. Replication by Taq DNAP
introduces mutations in lacIq resulting in the de-repression of
lacZa, whose activity after complementation is detected on X-Gal
indicator plates. The ratio of blue to white colonies can be used to
calculate the bulk Taq error rate if the number of DNA
duplications, and mutations yielding non-functional protein, are
known. There are 349 single-base substitutions at 179 codons that
will result in a blue phenotype in the lacI gene [19]. Our assay
recapitulates previously reported error rates for Taq (2.661025
bp21 [20]) in the absence of added Ca2+, and demonstrates that
increasing divalent cation concentration monotonically increased
the bulk error rate.
While Ca2+ modulated Taq fidelity, Taq is unable to serve as
a recording device, because it requires high temperatures for
extension and has a low misincorporation rate (,0.015% nt21)
across the physiological range of Ca2+ concentrations [21]. We
therefore focused our analysis on DNAPs that have high baseline
misincorporation rates and operate at physiological temperatures.
Multiplexed Assay for Polymerase MisincorporationTo characterize DNAPs at varying cation concentrations, we
developed a multiplexed primer extension assay with deep
sequencing readout (Figure 1C). Barcoded primers were first
annealed to a known DNA template, followed by primer extension
by the error-prone polymerase. Using a 96-well plate format
allowed simultaneous testing of many cation concentrations.
Subsequently, all wells were normalized to equal cation concen-
trations (salt correction) to eliminate ion-dependent bias in
downstream biochemical steps. To eliminate bias against error-
rich primer extensions, a partial Illumina adapter was then ligated
downstream. Ligated products were amplified via high-fidelity
PCR using primers that completed the Illumina adapter
sequences. The template contained a dideoxy-C 39 modification,
preventing extension by the polymerase along the upstream
primer. Consequently, the template strand did not contain the
primer-binding site for PCR amplification; only strands of non-
template origin were amplified, and therefore contained the full
Illumina adaptors used for sequencing.
Diversity in the initial sequenced bases is required for proper
cluster identification during Illumina sequencing. We therefore
positioned the 5-base barcodes indexing the 96-well plate wells
such that these barcodes comprised the first five bases sequenced.
Following deep sequencing using the Illumina MiSeq platform,
individual reads were filtered in silico and compared with the
template sequence to quantify misincorporation rates as a function
of ion concentration and base position along the template (see
Materials and Methods).
This method generated hundreds to thousands of reads per
cation condition, some of which were not full length (the result of
abortive extensions and/or extensions containing base deletions).
Duplicate plate wells with nominally equal cation concentrations
and different barcode sequences were analyzed independently and
used to generate misincorporation rate estimates and errors
(standard error of duplicate means).
Measurement of the Mean Transfer Function betweenCation Concentration and Misincorporation RateWe observed misincorporation rates for each reaction condition
by comparing filtered sequencing reads with the known template
sequence (Table S1). We first analyzed the cation dependence of
Dpo49s mean misincorporation rate, and found it to be positively
correlated with both Mg2+ and Mn2+ concentrations (Figure 2A–
B, top). We found that Dpo4 acts as a Mn2+ sensor with a gain of
,2%/mM. Dpo4 also acts as a sensor with a gain of ,0.01%/
mM for Mg2+ (Table S1). Dpo4 is therefore a far better sensor for
Mn2+ than Mg2+.
While the misincorporation rate for Klenow exo2 is also
positively correlated with Mn2+ (top of Figure 2C), it exhibits
a weak negative correlation with Mg2+ (top of Figure 2D). Klenow
exo2 is a sensor for Mn2+ with a gain of ,0.6%/mM and a sensor
for Mg2+ with a gain of –0.01%/mM. Thus two cations may differ
in the direction by which they modify the kinetics of misincorpora-
tion.
Note that in all cases, the measured mean misincorporation
rates are much higher than the noise floor (shaded regions). This
noise floor is defined as the mean plus the standard error of the
mean of the misincorporation rate obtained by performing an
identical protocol with the high-fidelity Phusion DNAP in HF
buffer (Figure S1), and is in agreement with previous studies that
measured the substitution rate of phosphoramidite synthesis [22].
Therefore, the noise floor likely results from substitution impurities
in the synthetic template strands. Deep sequencing is therefore
a reliable method to characterize DNAPs with high misincorpora-
tion rates.
We further measured the transfer function for mean misincor-
poration by Dpo4 and Klenow exo2 with respect to Ca2+
concentration. Because the kinetics of primer extension in buffers
containing Ca2+ alone are at least ,50 fold slower than in either
Measuring Cation Dependent DNAP Fidelity
PLOS ONE | www.plosone.org 3 August 2012 | Volume 7 | Issue 8 | e43876

Mg2+ or Mn2+ [23], we performed the primer extensions in
a variety of both physiological and non-physiological Mn2+ and
Mg2+ backgrounds. Misincorporation rates were only significantly
affected in a small, non-physiological subset of the Mg2+ and Mn2+
backgrounds tested. The misincorporation rate by Dpo4 in
a 200 mM Mn2+ background increases 2.9-fold from 1 nM to
1 mM Ca2+, the majority of which occurs between 100 nM and
1 mM (Figure 2I, Table S1). Conversely, the misincorporation
rate of Dpo4 decreases by 42% between 1 nM and 1 mM Ca2+ in
a 7 mM Mg2+ background, with virtually all of the change
occurring between 100 mM and 1 mM Ca2+ (Figure 2J). Ca2+ has
no effect on misincorporation rate with Klenow exo2 in the same
backgrounds (Figure 2K and 2L) nor in most other enzyme/buffer
combinations (Table S1). Therefore neither of the tested DNAPs is
promising as a Ca2+ sensor without further modifications.
Base Specificity of MisincorporationThe misincorporation characteristics of DNAPs depend not
only on cation concentrations, but also on the particular template
base being copied. Deep sequencing allows quantification of the
misincorporation rate at every position within the template
(Figure 2A–D). Note that misincorporation by Dpo4 opposite
a template T exhibits a .50-fold increase over the range of Mn2+
studied, while misincorporation rates opposite other bases show
a comparatively weak dependence on Mn2+ (Figure 2B, Table S1).
Thus the mean Mn2+ dependence of misincorporation rate of
Dpo4 is largely driven by misincorporations opposite T. There is
no obvious correlation of the misincorporation rate with the
identity of the base preceding the template base (Figure S2).
Deep sequencing also allows direct measurement of the 464
transition probability matrix between template base and in-
corporated base (Table S2, Figure 2E–H). For example, the
disproportionate Mn2+ dependence of misincorporation by Dpo4
opposite template T is largely due to misincorporation of dGTP.
Likewise, mutations caused by Klenow exo2 are generally
dominated by misincorporation of dATP, except on template T,
which shows a .4-fold preference for misincorporation of dGTP.
Misincorporation by Dpo4 of dGTP opposite template T increases
50-fold with Mn2+. Note, however, that the relative proportions of
the misincorporated bases on a given template base are largely
insensitive to cation concentration for both Dpo4 and Klenow
exo2. Rather, cation concentration acts as a scaling factor with
respect to misincorporation opposite a given template base; it is
the differential magnitude of this scaling factor between the
template bases that underlies the template base dependence of
misincorporation.
Misincorporation is Context-DependentCations change misincorporation probabilities but not the
distribution of misincorporations across incoming dNTPs. How-
ever, the template base itself is not, in general, sufficient to predict
misincorporation rate; the sequence context is important as well
(Figure 3A–C). For Dpo4, the shape of the graph is dominated by
preferential misincorporations at template T (red dots). The
dependency on the sequence, however, is complicated: switching
the first half of the template (shaded blue) with the second half
(shaded red) leaves some aspects of the misincorporation curve
similar while changing others. Indeed, the swapped template leads
to a more even distribution of misincorporations, indicating that
template choice is an important design parameter for DNA
recording.
Figure 2. Ion-dependent misincorporation rates of Dpo4 and Klenow exo2 polymerases. (A, B, C, D) Mean (top) and template-base-specific (bottom) misincorporation rates as a function of Mn2+ (A, C) and Mg2+ (B, D) concentrations. (E, F, G, H) Normalized distributions ofmisincorporated dNTPs for each template base. (I, J, K, L) Mean (top) and template-base-specific (bottom) misincorporation rates as a function of Ca2+
concentration at 200 mM background Mn2+ (I, K) and 7000 mM background Mg2+ (J, L) concentrations. Errors are given in Tables S1–2, and are shownas error bars in the line graphs when they are larger than the data symbol.doi:10.1371/journal.pone.0043876.g002
Measuring Cation Dependent DNAP Fidelity
PLOS ONE | www.plosone.org 4 August 2012 | Volume 7 | Issue 8 | e43876

There is no obvious sequence context dependence of mis-
incorporation for Klenow exo2 (Figure 3C), beyond the identity of
the template base. Curiously, the misincorporation rate opposite
template G, which dominates at 75 mM Mn2+, stays relatively
unchanged with increasing Mn2+ concentration, while misincor-
porations opposite template A increase, becoming the predomi-
nant peaks at 800 mMMn2+. Thus different DNAPs are differently
affected by both cation concentrations and local sequence
contexts.
Statistical Analysis of Misincorporation EventsOur deep sequencing method produces large datasets that can
be used to characterize the correlations within each strand of
synthesized DNA, as well as the statistical distributions across
strands. To test the hypothesis that DNAPs could tend to string
errors together, we analyzed the lag-one correlations of mis-
incorporations, asking if a misincorporation on one base makes it
more likely that there is a misincorporation on the next base. After
correction for bias due to correlations within the template itself (see
Materials and Methods), there is a weak but statistically significant
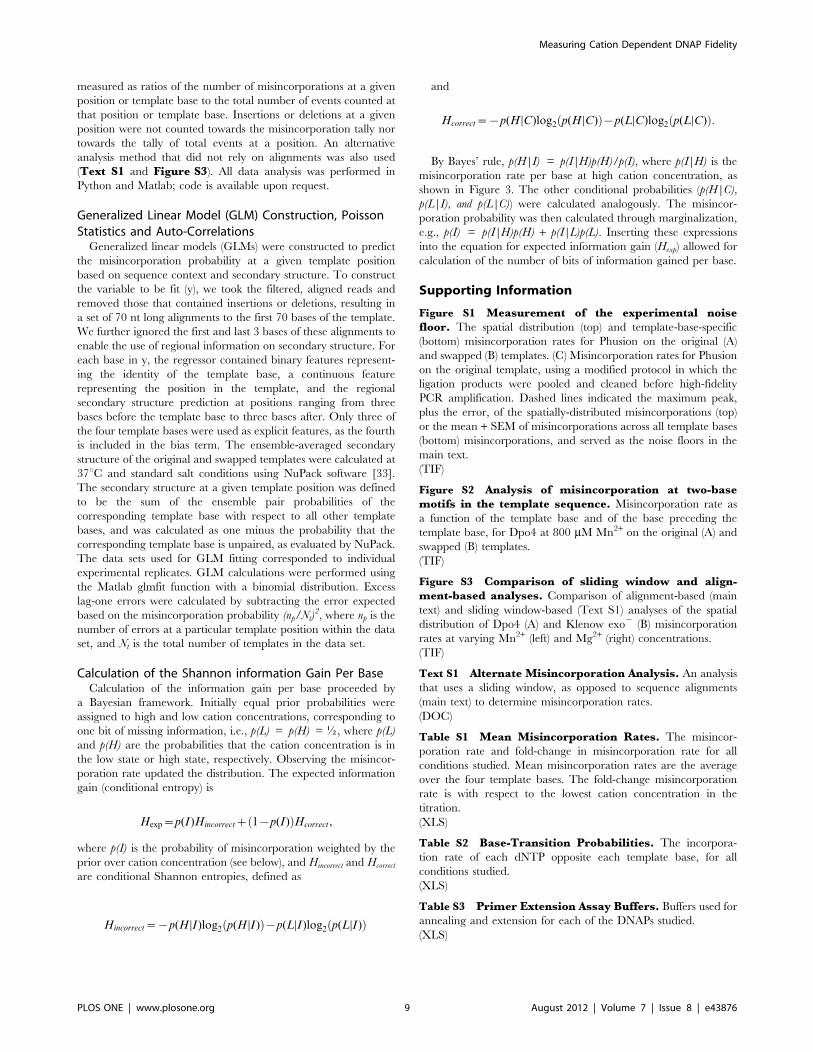
Figure 3. Template position dependence of misincorporation rates. (A) Template position dependence of Dpo4 misincorporation rates onthe original template at varying Mn2+ (left) and Mg2+ concentration (right). (B) Template position dependence of Dpo4 misincorporation rates on theswapped template at varying Mn2+ (left) and Mg2+ concentration (right). (C) Template position dependence of Klenow exo2 misincorporation rateson the original template at varying Mn2+ (left) and Mg2+ concentration (right). Letters above each data point denote the identity of the template baseat that position. Grey shaded areas indicate the noise floor, defined as the maximum over positions of the misincorporation rate (plus SEM) observedin an identical experiment with Pfusion HF DNA polymerase (Figure S1). Red (blue) shaded areas in (A) and (B) correspond to shared sub-sequencesbetween the original and the swapped template.doi:10.1371/journal.pone.0043876.g003
Measuring Cation Dependent DNAP Fidelity
PLOS ONE | www.plosone.org 5 August 2012 | Volume 7 | Issue 8 | e43876

correlation of misincorporations across bases for Klenow exo2 at
800 mMMn2+ (0.04760.002% excess misincorporations per base).
For Dpo4, misincorporations at consecutive positions appear
independent from one another (all excess errors ,0.01% per
base). Therefore, only for Klenow exo2 is a misincorporation on
a base associated with an increased probability of misincorpora-
tion on the next base.
It is unknown to what extent molecular heterogeneity plays
a role in the generation of DNAP misincorporations. If each
DNAP molecule performs misincorporations according to the
same statistics, the distribution of the total number of misincor-
porations per read should be governed by a Poisson distribution.
The variance is larger than the mean, however, for each DNAP/
template combination tested, and the null-hypothesis of a Poisson
distribution can be rejected for each of the datasets (X2 test,
p,0.05). Thus the ensemble of nominally identical DNAP
molecules is heterogeneous with respect to misincorporation rate.
To further study the determinants of misincorporation, we fit
the misincorporation data set to a generalized linear model (GLM)
containing sequence features that could plausibly impact mis-
incorporation rates (Figure 4). Possible features included the
identity of the template base and the predicted regional secondary
structure. The models were able to fit the data (R2 = 0.5860.02
and 0.5360.11 for the original and swapped templates, re-
spectively, Figure 4A and 4B). Interestingly, the models captured
the interplay of sequence properties that determine the spatial
dependence of misincorporation. Fits to the original template data
could predict the spatial dependence of misincorporation on the
swapped template (R2 = 0.4960.06), and vice versa
(R2 = 0.5060.01). Furthermore, the weights assigned to different
features (Figure 4C and 4D) in the model point to potential
determinants of the error rate. For example, the models identify
the positive contribution of a template T to Dpo49s error rate and
also suggest that local secondary structure may play a role.
Information Content of MisincorporationsBecause cation concentration modulates the number of
misincorporations in the copied DNA, one can consider the
sequenced data to store information about the cation concentra-
tion present during primer extension [24]. The information gain
per base is related to the likelihood that the observed misincor-
poration rate at a given template position was produced at
a particular cation concentration. For Dpo4 at high (800 mM) vs.
low (75 mM) Mn2+, the most informative template bases transmit
,0.03 bits of information per base about Mn2+ concentration
(Figure 4E), whereas only ,561024 bits per base are transmitted
at high (7000 mM) vs. low (1000 mM) Mg2+. Therefore, in the limit
in which Mn2+ concentration could be modulated as each
nucleotide is added, a Dpo4-based DNA recording device could
in principle write 11 megabytes onto a template the length of
a human genome (3.26109 bases).
Discussion
In this work, we have developed a method that can
quantitatively map the misincorporation landscapes of error-prone
polymerases as a function of environmental signals. Specifically,
we quantified how the concentrations of environmental Mg2+,
Mn2+ and Ca2+ affect the fidelity of Dpo4 and Klenow exo2.
Mn2+ has the strongest influence on misincorporation rates in
comparison to the other cations. Our method resolves the
misincorporation by spatial position and nucleotide-to-nucleotide
transition. We find that, for Dpo4 and Klenow exo2, Mn2+ and
Mg2+ change misincorporation rates but leave the distribution
across incoming misincorporated nucleotides untouched. We have
further shown that polymerase misincorporation rates exhibit
sequence dependences. The development of a DNAP-based cation
sensor, then, necessitates calibration of misincorporation rates at
specific template positions, within specific sequence contexts, and
at specific buffer conditions. The buffer-specificity of some DNAPs
suggests that polymerase-based sensors might work best within
controlled buffer environments, e.g. within living cells expressing
ion channels, which can maintain buffer integrity, but selectively
allow targeted ions to permeate. Our experiments quantify the
transfer function of misincorporation from cations, through
processing, all the way to DNA sequence data.
Our assay differs in important ways from the bacterial assays
that have been used for the quantification of DNAP behavior [25–
27]. Through deep sequencing we can readily observe polymerase
trajectories with single molecule and single base resolution while
simultaneously generating large datasets, both of which are critical
for achieving the comprehensive analyses necessary for establish-
ing polymerase data encoding transfer functions. Single base pair
resolution allows quantifying the template dependence of mis-
incorporations, while single molecule resolution allows quantifica-
tion of the correlation structure of misincorporations.
The method introduced here does have limitations, some of
which can be mitigated. For example, the measured background
noise level is likely dominated by errors introduced during the
chemical synthesis of the oligonucleotides used as templates. The
use of clonal isolates should dramatically lower that noise level and
may prove necessary in adapting this method to the characteriza-
tion of high fidelity DNAPs. In addition, GLM analysis indicates
that the spatial dependence of the observed misincorporation rates
may be in part due to the secondary structure of the ssDNA
template. Using a nicked, double stranded template would reduce
this source of variance, but would limit the applicability of the
method to DNAPs with strand displacement or nick translation
activity. While sophisticated molecular counting methods [28] and
clonal substrates are necessary to quantify the low misincorpora-
tion rates of proofreading polymerases using sequencing [22], in
this study, we have investigated error-prone polymerases, and are
therefore readily able to measure strong effects despite the
limitations of our method.
Certain limitations of the method cannot be mitigated without
resorting to engineered polymerase variants. For example, we have
shown that neither DNAP studied here can act as a Ca2+ sensor in
physiologically relevant conditions. Furthermore, these biological-
ly-based recording devices are limited to conditions that enable
efficient enzymatic activity; such devices will not work, without
modification, in environments of extreme pH, temperature,
oxidative stress, proteolysis, etc.
While we have demonstrated how a static ion concentration can
be measured by a polymerase copying DNA, it would ultimately
be useful to have polymerase-based sensors for time-dependent as
well as static signals. To do so, it will be necessary to optimize the
sensing polymerase for speed (for temporal resolution), processivity
(for recording time), low pause probability (for linearity of
temporal readout), total misincorporation rate (for information
density) and dynamic range of misincorporation rate (for signal to
noise ratio). We have shown that divalent ion concentration can be
a potent, yet continuously tunable, modulator of polymerase
misincorporation rates, and that such modulation can be restricted
to particular template bases and base-to-base transitions. Based on
its .15-fold change in misincorporation rate over the Mn2+ range
tested here, Dpo4 could act as a high resolution Mn2+ sensor. The
fact that misincorporations are largely localized to certain template
bases makes it possible in principle to preserve relevant features of
Measuring Cation Dependent DNAP Fidelity
PLOS ONE | www.plosone.org 6 August 2012 | Volume 7 | Issue 8 | e43876

the template (on the non-error-prone template bases) while
transmitting information at the same time (on the other bases).
Advances in fields such as neuroscience impose spatial,
temporal, and combinatorial challenges of unparalleled scope,
associated with the three-dimensional recording and analysis of
complex cellular systems. A molecular device capable of measur-
ing and recording sub-cellular signals, which can be manufactured
and delivered to target environments in a scalable fashion, may
emerge as an optimal platform for biological signal recording.
However, the basic principles for designing and testing such
molecular recording devices in vitro have not yet been established.
This study measures a static environmental signal – divalent cation
concentration – by using DNA polymerases as molecular
recording devices. The synthesized DNA strand can be considered
as an archival medium, which stores the measured signal in the
form of a misincorporation rate with respect to the known
template. Indeed, the use of DNA as an information storage
medium leverages the rapid improvement of sequencing technol-
ogy, which is currently outpacing the Moore’s law rate of
improvement of microelectronic technology [29], and which
promises to make DNA sequencing a preferred method for
extracting data from biological and bio-molecular systems [30,31].
Figure 4. Statistical analysis of misincorporation by Dpo4. (A) Spatial dependence (un-normalized) of Dpo4 error rate at 800 mM Mn2+ on theoriginal template (blue curve), and generalized linear model fits of this data set with respect to itself (green curve), and with respect to the swappedtemplate data set (red curve). (B) Spatial dependence (un-normalized) of Dpo4 error rate at 800 mM Mn2+ on the swapped template (blue curve), andgeneralized linear model fits of this data set with respect to itself (green curve), and with respect to the original template data set (red curve). (C)Feature weights for generalized linear model fit to Dpo4 original template data. (D) Feature weights for generalized linear model fit to Dpo4 swappedtemplate data. (E) Information gain per base as a function of template position, for discrimination between high (800 mM) and low (75 mM) Mn2+ byDpo4. (F) Information gain per base as a function of template position, for discrimination between high (7000 mM) and low (1000 mM) Mg2+ by Dpo4.doi:10.1371/journal.pone.0043876.g004
Measuring Cation Dependent DNAP Fidelity
PLOS ONE | www.plosone.org 7 August 2012 | Volume 7 | Issue 8 | e43876

Extension of the techniques described here to time-varying signals
and engineered polymerases could lead to molecular sensing
technologies of unprecedented scalability.
Materials and Methods
ReagentsAll primers were synthesized by IDT. All enzymes, dNTPs and
buffers were from New England Biolabs (NEB) unless otherwise
indicated.
Measurement of the Misincorporation Rate of TaqPolymeraseA derivative of pUC19 containing the lacZa and lacIq allele was
linearized with DraII. Linearized DNA was purified and used as
template in PCR reactions containing 5 U Taq DNAP, standard
Taq buffer with 1.5 mM Mg2+, 200 mM dNTPs (Invitrogen),
CaCl2 to indicated concentrations and 0.5 mM each of the primers
CLA55 (59-AGCTTATCGATAAGCGATGCCGGGAGCAGA-
CAAGC-39) and CLA33 (59-AGCTTATCGATGG-
CACTTTTCGGGGAAATGTGCG-39). Reactions were cycled
30 times with 1 minute of annealing at 55uC and 4.5 minutes
extension at 68uC. PCR products were purified using a DNA
Clean and Concentrator-5 kit (Zymo Research). After determining
the A260, the amplified DNA was digested at 37uC for 4 h with 10
U ClaI, and purified. Ligation were performed using the NEB
quick ligation kit with 50 ng of DNA, and directly transformed
into DH5a E. coli and plated on LB-Carb containing 40 mg/mL X-
Gal. Blue and white colonies were counted after incubation at
37uC overnight.
The error rate f was calculated as f = -ln(F)/(db) [32], where F is
the fraction of white colonies, d is the number of DNA duplications
and b=349 bp is the effective target size of the 1080 bp lacI gene
[19]. Error bars for the blue-white screening experiment were
obtained using Poisson statistics where, for large n, the distribution
is approximately Gaussian with a variance that is identical to the
mean.
Primer Extension AssayAll reactions were performed in 96-well plates, on ice, unless
otherwise noted. Annealing reactions were performed by mixing
100 nM barcoded primer N1.1.1.x (ACACTCTTTCCCTA-
CACGACGCTCTTCCGATCTNNNNNGATGGTCA-
TAGCTGTTGTA, where the underlined region is the unique 5-
mer barcode for each reaction, and x= 1 to 96; barcodes were
composed with pairwise Levenshtein distances greater than one)
with 150 nM PAGE-purified original template strand N1.0.6 (59-
AAAATCATAACTAAGTCAGTCAGTACGTCAGTAGCT-
CAGTCGATGGATGCAATGAATGAATGAATGAAAA-
TAAAAA TACAACAGCTATGACCAT-ddC-39) or swapped
template strand N1.0.8 (59-CGATGGATGCAATGAATGAAT-
GAATGAAAATAAAAAAAAATCATAACTAAGTCAGT-
CAGTACGTCAGTAGCTCAGTTACAACAGCTATGAC-
CAT-ddC-39) in 16annealing buffer (Table S3). The primer and
template oligonucleotides were annealed by incubation at 95uC for
5 min, followed by a 20.1uC/sec ramp until reaching 25uC. ThePEA2 adapter dsDNA was made at the same time, by mixing
N1.2.1 (59-P-AGATCGGAAGAGCGGTTCAGCAG-
GAATGCCGAG-39) and N1.2.2 (59-CTCGGCATTCCTGCT-
GAACCGCTCTTCCGATCT-39) to a final concentration of
300 nM each and annealing them via the same protocol.
Primer extensions were performed as per the manufacturer’s
instructions (Dpo4, Klenow exo2, Phusion) in 10 mL reactions
containing 1 mL annealing reaction, 50 mM each dNTP, and 1 mL
of a 1:1000 dilution of Dpo4 (Trevigen) in Dpo4 annealing buffer,
1 mL Klenow exo2, or 5 mL 26Phusion Mastermix in HF buffer,
in 16extension buffer (Table S3). Primer extensions were initiated
with the addition of divalent cation (chloride salt) to the reaction
mixture and incubation at 37uC for 1 h, except for Phusion, which
was incubated at 95uC for 10 minutes followed by 72uC for 1 h.
After primer extension, a 10 mL mixture of divalent cations was
added to each well such that the final concentration in each well
was normalized to 800 mM Mn2+, 7 mM Mg2+ and 1 mM Ca2+.
An automated liquid handling robot (Agilent) was used to create
stocks of the divalent cations used for primer extension and salt
correction in a 96-well plate format.
Ligations were performed in 10 mL volumes containing 6 mLsalt-corrected primer extensions, 200 U/mL T4 DNA ligase (New
England Biolabs), 1 mM ATP, and 1.23 nM PEA2 adapter.
Ligations reactions were incubated at 16uC overnight.
High-fidelity PCR of the ligation reactions was performed by
adding 5 mL ligation reaction, 0.5 mM primer N1.3.1 (59-
CAAGCAGAAGACGGCATACGAGATCGGTCTCGG-
CATTCCTGCTGAACCGCTCTTCCGATCT-39) and 0.5 mMN1.3.2 (59-AATGATACGGCGACCACCGAGATCTA-
CACTCTTTCCCTACACGACGCTCTTCCGATCT-39), in
16 HF Phusion mastermix, and incubating at 98uC for 30 s,
followed by 30 cycles of incubation at 98uC for 10 s and 72uC for 1
m, followed by a final extension at 72uC for 10 m.
DNA SequencingPooled PCR products were cleaned using a MinElute Cleanup
Column (Qiagen) into 20 mL buffer EB, resulting in a final
concentration of 300–400 ng/uL. Cleaned products were diluted
to a nominal concentration of 12–14 nM, calculated using
a droplet spectrophotometer (Qubit, Invitrogen), assuming a nom-
inal average dsDNA length of 100 bp in the sample. The diluted
sample (2 mL) was combined with 8 mL water, denatured with
10 mL NaOH and added to 980 mL HT1 buffer (Illumina). To
introduce sufficient base diversity for baseline intensity correction
during the sequencing run, 600 mL phiX paired-end library DNA
(Illumina) was combined with 400 mL of the sample and loaded on
a MiSeq (Illumina) for 150 bp paired-end sequencing. Approxi-
mately 4–5 pm of sample and at least 5 pm of phiX DNA were
loaded in each sequencing run.
Data AnalysisRaw sequencing reads in the forward direction were filtered for
the presence of the left primer binding sequence, the first 12 bp of
the right adaptor sequence, and the presence of a correct barcode.
Raw sequencing reads in the reverse direction were filtered for the
presence of the left primer binding sequence and the barcode.
Forward reads in which the sequence between the left and right
adaptors did not exactly match the corresponding reverse paired
end read were discarded. We also filtered out instances of a short
spurious PCR product resulting from known primer dimer
contamination. The raw sequence reads are available for
download (NCBI accession number SRP014521). The forward
reads thus filtered were aligned with the sequence of the
theoretical error-free primer extension product (reverse comple-
ment of the template) using the BioPython function pairwise2.
align. globalxs with gap open and gap extend penalties of210 and
22 respectively. Sequences with length greater than or equal to 70
bases between the left and right adaptors, and alignment scores
greater than 60, were selected for further analysis. Misincorpora-
tions aligned to a given template position were counted towards
the tally of misincorporations at that position and with respect to
its corresponding template base. Misincorporation rates were
Measuring Cation Dependent DNAP Fidelity
PLOS ONE | www.plosone.org 8 August 2012 | Volume 7 | Issue 8 | e43876
measured as ratios of the number of misincorporations at a given
position or template base to the total number of events counted at
that position or template base. Insertions or deletions at a given
position were not counted towards the misincorporation tally nor
towards the tally of total events at a position. An alternative
analysis method that did not rely on alignments was also used
(Text S1 and Figure S3). All data analysis was performed in
Python and Matlab; code is available upon request.
Generalized Linear Model (GLM) Construction, PoissonStatistics and Auto-CorrelationsGeneralized linear models (GLMs) were constructed to predict
the misincorporation probability at a given template position
based on sequence context and secondary structure. To construct
the variable to be fit (y), we took the filtered, aligned reads and
removed those that contained insertions or deletions, resulting in
a set of 70 nt long alignments to the first 70 bases of the template.
We further ignored the first and last 3 bases of these alignments to
enable the use of regional information on secondary structure. For
each base in y, the regressor contained binary features represent-
ing the identity of the template base, a continuous feature
representing the position in the template, and the regional
secondary structure prediction at positions ranging from three
bases before the template base to three bases after. Only three of
the four template bases were used as explicit features, as the fourth
is included in the bias term. The ensemble-averaged secondary
structure of the original and swapped templates were calculated at
37uC and standard salt conditions using NuPack software [33].
The secondary structure at a given template position was defined
to be the sum of the ensemble pair probabilities of the
corresponding template base with respect to all other template
bases, and was calculated as one minus the probability that the
corresponding template base is unpaired, as evaluated by NuPack.
The data sets used for GLM fitting corresponded to individual
experimental replicates. GLM calculations were performed using
the Matlab glmfit function with a binomial distribution. Excess
lag-one errors were calculated by subtracting the error expected
based on the misincorporation probability (np/Nt)2, where np is the
number of errors at a particular template position within the data
set, and Nt is the total number of templates in the data set.
Calculation of the Shannon information Gain Per BaseCalculation of the information gain per base proceeded by
a Bayesian framework. Initially equal prior probabilities were
assigned to high and low cation concentrations, corresponding to
one bit of missing information, i.e., p(L) = p(H) =K, where p(L)
and p(H) are the probabilities that the cation concentration is in
the low state or high state, respectively. Observing the misincor-
poration rate updated the distribution. The expected information
gain (conditional entropy) is
Hexp~p(I)Hincorrectz 1{p(I)ð ÞHcorrect,
where p(I) is the probability of misincorporation weighted by the
prior over cation concentration (see below), and Hincorrect and Hcorrect
are conditional Shannon entropies, defined as
Hincorrect~{p(H DI)log2 p(H DI)ð Þ{p(LDI)log2 p(LDI)ð Þ
and
Hcorrect~{p(H DC)log2 p(H DC)ð Þ{p(LDC)log2 p(LDC)ð Þ:
By Bayes’ rule, p(H|I) = p(I|H)p(H)/p(I), where p(I|H) is the
misincorporation rate per base at high cation concentration, as
shown in Figure 3. The other conditional probabilities (p(H|C),
p(L|I), and p(L|C)) were calculated analogously. The misincor-
poration probability was then calculated through marginalization,
e.g., p(I) = p(I|H)p(H) + p(I|L)p(L). Inserting these expressions
into the equation for expected information gain (Hexp) allowed for
calculation of the number of bits of information gained per base.
Supporting Information
Figure S1 Measurement of the experimental noisefloor. The spatial distribution (top) and template-base-specific
(bottom) misincorporation rates for Phusion on the original (A)
and swapped (B) templates. (C) Misincorporation rates for Phusion
on the original template, using a modified protocol in which the
ligation products were pooled and cleaned before high-fidelity
PCR amplification. Dashed lines indicated the maximum peak,
plus the error, of the spatially-distributed misincorporations (top)
or the mean + SEM of misincorporations across all template bases
(bottom) misincorporations, and served as the noise floors in the
main text.
(TIF)
Figure S2 Analysis of misincorporation at two-basemotifs in the template sequence. Misincorporation rate as
a function of the template base and of the base preceding the
template base, for Dpo4 at 800 mM Mn2+ on the original (A) and
swapped (B) templates.
(TIF)
Figure S3 Comparison of sliding window and align-ment-based analyses. Comparison of alignment-based (main
text) and sliding window-based (Text S1) analyses of the spatial
distribution of Dpo4 (A) and Klenow exo2 (B) misincorporation
rates at varying Mn2+ (left) and Mg2+ (right) concentrations.
(TIF)
Text S1 Alternate Misincorporation Analysis. An analysis
that uses a sliding window, as opposed to sequence alignments
(main text) to determine misincorporation rates.
(DOC)
Table S1 Mean Misincorporation Rates. The misincor-
poration rate and fold-change in misincorporation rate for all
conditions studied. Mean misincorporation rates are the average
over the four template bases. The fold-change misincorporation
rate is with respect to the lowest cation concentration in the
titration.
(XLS)
Table S2 Base-Transition Probabilities. The incorpora-
tion rate of each dNTP opposite each template base, for all
conditions studied.
(XLS)
Table S3 Primer Extension Assay Buffers. Buffers used for
annealing and extension for each of the DNAPs studied.
(XLS)
Measuring Cation Dependent DNAP Fidelity
PLOS ONE | www.plosone.org 9 August 2012 | Volume 7 | Issue 8 | e43876

Acknowledgments
We thank Zach Herbert at the Dana-Farber Cancer Institute Molecular
Biology Core Facility for providing expert assistance with MiSeq
sequencing; Sriram Kosuri for providing barcode sequences and for
helpful discussions; Roger Woodgate for helpful discussions; and A.
Michael Sismour for helpful discussions.
Author Contributions
Conceived and designed the experiments: BMZ AHM KK DS DMA KT
ESB GC. Performed the experiments: BMZ AHMDS DMA. Analyzed the
data: BMZ AHM KK DS DMA ESB GC. Contributed reagents/
materials/analysis tools: BMZ AHM KK DS DMA ESB GC. Wrote the
paper: BMZ AHM. Edited the paper: BMZ AHM KK DS DMA KT ESB
GC.
References
1. Buzsaki G (2004) Large-scale recording of neuronal ensembles. Nat Neurosci 7:
446–451.
2. Alivisatos AP, Chun M, Church GM, Greenspan RJ, Roukes ML, et al. (2012)The brain activity map project and the challenge of functional connectomics.
Neuron 74: 970–974.3. Kording KP (2011) Of toasters and molecular ticker tapes. PLoS Comput Biol 7:
e1002291.4. Church G, Shendure J (2003) Nucleic acid memory device. US Patent
20030228611.
5. Bustamante C, Cheng W, Mejia YX (2011) Revisiting the central dogma onemolecule at a time. Cell 144: 480–497.
6. El-Deiry WS, Downey KM, So AG (1984) Molecular mechanisms of manganesemutagenesis. Proc Natl Acad Sci U.S.A. 81: 7378–7382.
7. Maravall M, Mainen ZF, Sabatini BL, Svoboda K (2000) Estimating
intracellular calcium concentrations and buffering without wavelength ratioing.Biophys J 78: 2655–2667.
8. Rider TH, Petrovick MS, Nargi FE, Harper JD, Schwoebel ED, et al. (2003) A Bcell-based sensor for rapid identification of pathogens. Science 301: 213–215.
9. Stanley SA, Gagner JE, Damanpour S, Yoshida M, Dordick JS, et al. (2012)Radio-wave heating of iron oxide nanoparticles can regulate plasma glucose in
mice. Science 336: 604–608.
10. Braman J (2002) In vitro mutagenesis protocols. Humana Press. p. 259.11. Beard WA, Shock DD, Vande Berg BJ, Wilson SH (2002) Efficiency of correct
nucleotide insertion governs DNA polymerase fidelity. J Biol Chem 277: 47393–47398.
12. Boudsocq F (2001) Sulfolobus solfataricus P2 DNA polymerase IV (Dpo4): an
archaeal DinB-like DNA polymerase with lesion-bypass properties akin toeukaryotic poleta. Nucleic Acids Res 29: 4607–4616.
13. Sale JE, Lehmann AR, Woodgate R (2012) Y-family DNA polymerases andtheir role in tolerance of cellular DNA damage. Nat Rev Mol Cell Biol 13: 141–
152.14. Broyde S, Wang L, Rechkoblit O, Geacintov NE, Patel DJ (2008) Lesion
processing: high-fidelity versus lesion-bypass DNA polymerases. Trends
Biochem Sci 33: 209–219.15. Adar S, Livneh Z (2006) Translesion DNA synthesis across non-DNA segments
in cultured human cells. DNA Repair 5: 479–490.16. Ohmori H, Friedberg EC, Fuchs RP, Goodman MF, Hanaoka F, et al. (2001)
The Y-family of DNA polymerases. Mol Cell 8: 7–8.
17. Derbyshire V, Freemont P, Sanderson M, Beese L, Friedman J, et al. (1988)Genetic and crystallographic studies of the 39,59-exonucleolytic site of DNA
polymerase I. Science 240: 199–201.
18. Kuchta RD, Benkovic P, Benkovic SJ (1988) Kinetic mechanism whereby DNA
polymerase I (Klenow) replicates DNA with high fidelity. Biochemistry 27:
6716–6725.19. Provost GS, Kretz PL, Hamner RT, Matthews CD, Rogers BJ, et al. (1993)
Transgenic systems for in vivo mutation analysis. Mutat Res 288: 133–149.20. Barnes WM (1992) The fidelity of Taq polymerase catalyzing PCR is improved
by an N-terminal deletion. Gene 112: 29–35.21. Purves D, Fitzpatrick D, Katz LC, LaMantia AS, McNamara JO, et al (2001)
Neuroscience, 2nd ed. Sinauer Associates. p. 39–41.
22. Kinde I, Wu J, Papadopoulos N, Kinzler KW, Vogelstein B (2011) Detectionand quantification of rare mutations with massively parallel sequencing. Proc
Natl Acad Sci U.S.A. 108: 9530–9535.23. Irimia A, Zang H, Loukachevitch LV, Eoff RL, Guengerich FP, et al. (2006)
Calcium is a cofactor of polymerization but inhibits pyrophosphorolysis by the
Sulfolobus solfataricus DNA polymerase Dpo4. Biochemistry 45: 5949–5956.24. MacKay D (2003) Information theory, inference, and learning algorithms.
Cambridge UK: Cambridge University Press. p. 3225. Bebenek K, Kunkel TA (1995) Analyzing fidelity of DNA polymerases. Meth
Enzymol 262: 217–232.26. Jozwiakowski SK, Connolly BA (2009) Plasmid-based lacZalpha assay for DNA
polymerase fidelity: application to archaeal family-B DNA polymerase. Nucleic
Acids Res 37: e102.27. Dorjsuren D, Wilson DM, Beard WA, McDonald JP, Austin CP, et al. (2009) A
real-time fluorescence method for enzymatic characterization of specializedhuman DNA polymerases. Nucleic Acids Res 37: e128.
28. Shiroguchi K, Jia TZ, Sims PA, Xie XS (2012) Digital RNA sequencing
minimizes sequence-dependent bias and amplification noise with optimizedsingle-molecule barcodes. Proc Natl Acad Sci U.S.A. 109: 1347–1352.
29. Carr PA, Church GM (2009) Genome engineering. Nat Biotechnol 27: 1151–1162.
30. Zador A, Oyibo H, Cao G, Zhan H, Koulakov A, et al. (2011) Probing theconnectivity of neural circuits at single-neuron resolution using high-throughput
DNA sequencing. Nature precedings.
31. Ingolia NT, Ghaemmaghami S, Newman JRS, Weissman JS (2009) Genome-wide analysis in vivo of translation with nucleotide resolution using ribosome
profiling. Science 324: 218–223.32. Keohavong P, Thilly WG (1989) Fidelity of DNA polymerases in DNA
amplification. Proc Natl Acad Sci U.S.A. 86: 9253–9257.
33. Zadeh JN, Steenberg CD, Bois JS, Wolfe BR, Pierce MB, et al. (2011)NUPACK: Analysis and design of nucleic acid systems. J Comput Chem 32:
170–173.
Measuring Cation Dependent DNAP Fidelity
PLOS ONE | www.plosone.org 10 August 2012 | Volume 7 | Issue 8 | e43876