The real-time polymerase chain reaction
9
369 RESONANCE April 2008 GENERAL ARTICLE Real Time PCR is a new advancement in the field of molecular diagnostics. The evolution of capabilities of Real Time PCR from traditional PCR has provided researchers an upper hand over the quantification and detection of specific DNA sequences. During the recent years, the areas of application of Real Time PCR have expanded exponentially. Roughly three out of ten newborns of HIV-positive mothers are infected with the virus. Hence, it is important to identify HIV- positive babies early for appropriate treatment. But how can we recognise the infected babies? The most common test for HIV infection has been the ELISA, short for Enzyme-Linked Immuno- Sorbent Assay. In this test, blood is drawn from the patient and further processed to detect the antibodies 1 against HIV. ELISA is an effective diagnostic method that can detect HIV infections with 99% accuracy. Although ELISA works well for adults, it is not very effective in determining whether a newborn is infected or not. The reason is that every child is born with antibodies from its mother and if the mother is HIV-positive, the child’s blood too will be positive for HIV antibodies. These maternal antibodies can linger in the child’s blood for more than a year and hence a definitive ELISA can be performed only after ~18 months. But, children with HIV infection are generally more susceptible to infections making early treatment very important. If we cannot determine which newborns are infected, how do we treat them? This is the dilemma physicians faced before the advent of the technique called Real-time Polymerase Chain Reac- tion [1]. Real-time PCR (also known as quantitative PCR or Q- PCR) specifically detects the amount of HIV virus itself, and not the antibodies made against it, by detecting the viral DNA present (left) Simarjot Singh Pabla (right) Sarabjot Singh Pabla Both authors are students of MSc Bioinformatics at the GH Patel Post Graduate Department of Computer Science and Technology, Sardar Patel University, Gujarat. They are interested in new advents of molecular biology and bioinformatics. Real-Time Polymerase Chain Reaction A Revolution in Diagnostics Simarjot Singh Pabla and Sarabjot Singh Pabla Keywords PCR, Real Time PCR, Molecu- lar Diagnostics. 1 Antibodies are defensive- proteins made by our immune system in response to infections.
Transcript of The real-time polymerase chain reaction
369RESONANCE April 2008
GENERAL ARTICLE
Real Time PCR is a new advancement in the field of molecular
diagnostics. The evolution of capabilities of Real Time PCR
from traditional PCR has provided researchers an upper
hand over the quantification and detection of specific DNA
sequences. During the recent years, the areas of application of
Real Time PCR have expanded exponentially.
Roughly three out of ten newborns of HIV-positive mothers are
infected with the virus. Hence, it is important to identify HIV-
positive babies early for appropriate treatment. But how can we
recognise the infected babies? The most common test for HIV
infection has been the ELISA, short for Enzyme-Linked Immuno-
Sorbent Assay. In this test, blood is drawn from the patient and
further processed to detect the antibodies1 against HIV. ELISA is
an effective diagnostic method that can detect HIV infections
with 99% accuracy. Although ELISA works well for adults, it is
not very effective in determining whether a newborn is infected
or not. The reason is that every child is born with antibodies from
its mother and if the mother is HIV-positive, the child’s blood too
will be positive for HIV antibodies. These maternal antibodies
can linger in the child’s blood for more than a year and hence a
definitive ELISA can be performed only after ~18 months. But,
children with HIV infection are generally more susceptible to
infections making early treatment very important.
If we cannot determine which newborns are infected, how do we
treat them? This is the dilemma physicians faced before the
advent of the technique called Real-time Polymerase Chain Reac-
tion [1]. Real-time PCR (also known as quantitative PCR or Q-
PCR) specifically detects the amount of HIV virus itself, and not
the antibodies made against it, by detecting the viral DNA present
(left) Simarjot Singh Pabla
(right) Sarabjot Singh Pabla
Both authors are students of
MSc Bioinformatics at the
GH Patel Post Graduate
Department of Computer
Science and Technology,
Sardar Patel University,
Gujarat. They are interested
in new advents of molecular
biology and bioinformatics.
Real-Time Polymerase Chain Reaction
A Revolution in Diagnostics
Simarjot Singh Pabla and Sarabjot Singh Pabla
Keywords
PCR, Real Time PCR, Molecu-
lar Diagnostics.
1Antibodies are defensive-
proteins made by our immune
system in response to infections.
370 RESONANCE April 2008
GENERAL ARTICLE
in the sample. Using real time PCR, HIV infection, or its absence,
can be detected within six weeks of birth, making it easier to
decide the future course of action. Real-time PCR has turned out
to be the most powerful tool for the quantitative analysis of
nucleic acids for basic research and medical diagnostics.
Polymerase Chain Reaction
Studying specific gene sequences is very important for both basic
and applied research like medical diagnostics. However, getting
sufficient amount of a specific DNA fragment for the study is
often a limiting factor. Polymerase Chain Reaction (PCR) is a
technique that allows researchers to amplify a specific DNA
fragment from a very small amount of starting material. Kary
Mullis was awarded the 1993 Nobel Prize in Chemistry for
discovering this technique. The ability to specifically amplify
very minute amounts of DNA brought about a revolution not only
in molecular biology but also in medical and forensic sciences.
Recombinant DNA technology is dependent on the researcher’s
ability to manipulate DNA easily and PCR has been the major
technique that has made it possible. Great achievements like
cloning of mammals and the Human Genome Project would not
have been possible without PCR.
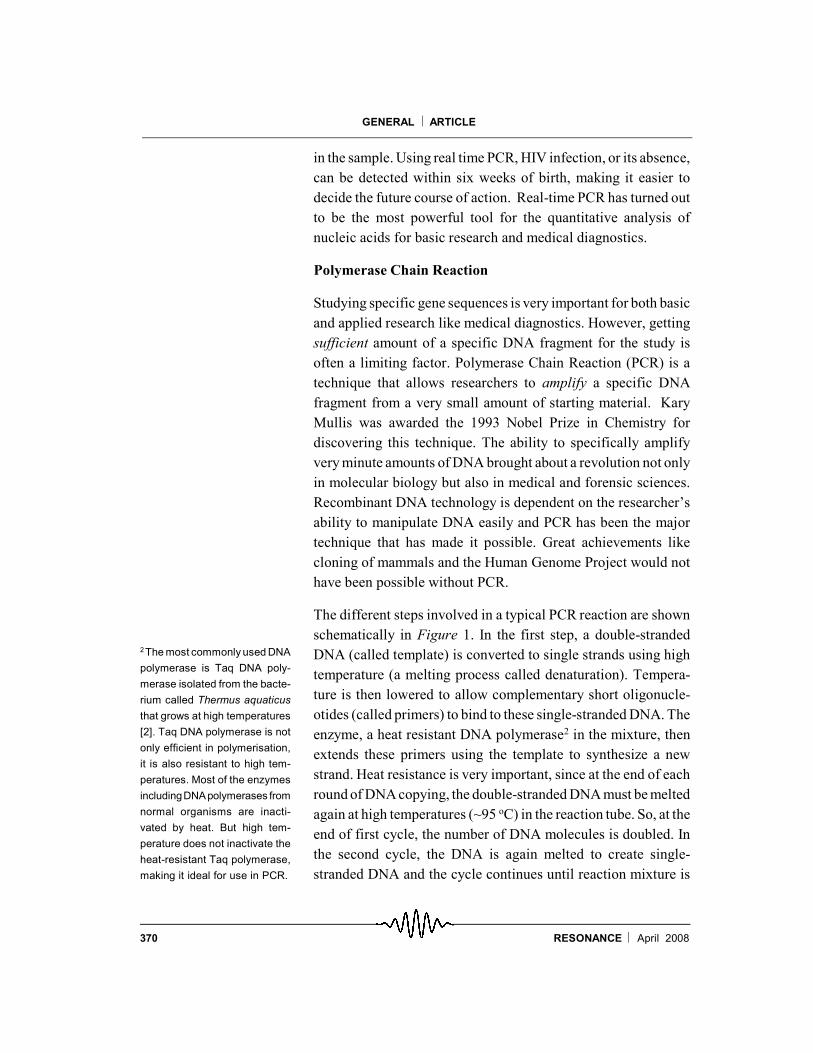
The different steps involved in a typical PCR reaction are shown
schematically in Figure 1. In the first step, a double-stranded
DNA (called template) is converted to single strands using high
temperature (a melting process called denaturation). Tempera-
ture is then lowered to allow complementary short oligonucle-
otides (called primers) to bind to these single-stranded DNA. The
enzyme, a heat resistant DNA polymerase2 in the mixture, then
extends these primers using the template to synthesize a new
strand. Heat resistance is very important, since at the end of each
round of DNA copying, the double-stranded DNA must be melted
again at high temperatures (~95 oC) in the reaction tube. So, at the
end of first cycle, the number of DNA molecules is doubled. In
the second cycle, the DNA is again melted to create single-
stranded DNA and the cycle continues until reaction mixture is
2 The most commonly used DNA
polymerase is Taq DNA poly-
merase isolated from the bacte-
rium called Thermus aquaticus
that grows at high temperatures
[2]. Taq DNA polymerase is not
only efficient in polymerisation,
it is also resistant to high tem-
peratures. Most of the enzymes
includingDNApolymerases from
normal organisms are inacti-
vated by heat. But high tem-
perature does not inactivate the
heat-resistant Taq polymerase,
making it ideal for use in PCR.
371RESONANCE April 2008
GENERAL ARTICLE
exhausted. This results in the exponential increase in the copies
of the template DNA (Figure 1).
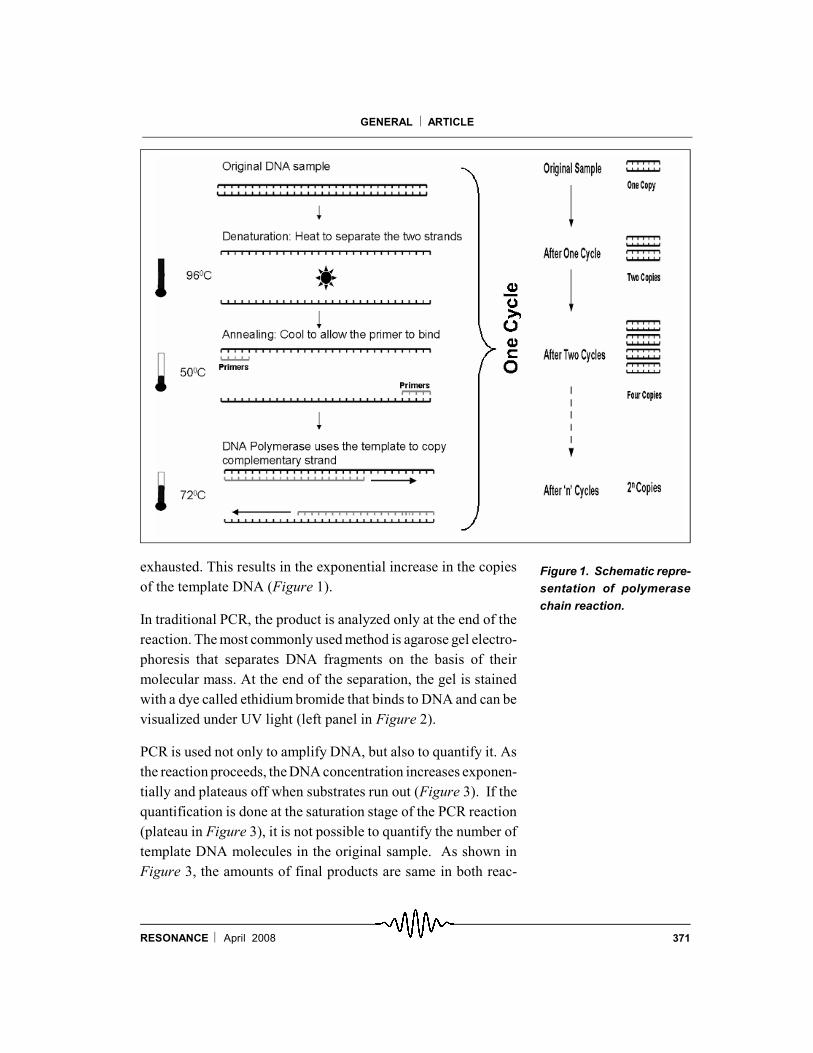
In traditional PCR, the product is analyzed only at the end of the
reaction. The most commonly used method is agarose gel electro-
phoresis that separates DNA fragments on the basis of their
molecular mass. At the end of the separation, the gel is stained
with a dye called ethidium bromide that binds to DNA and can be
visualized under UV light (left panel in Figure 2).
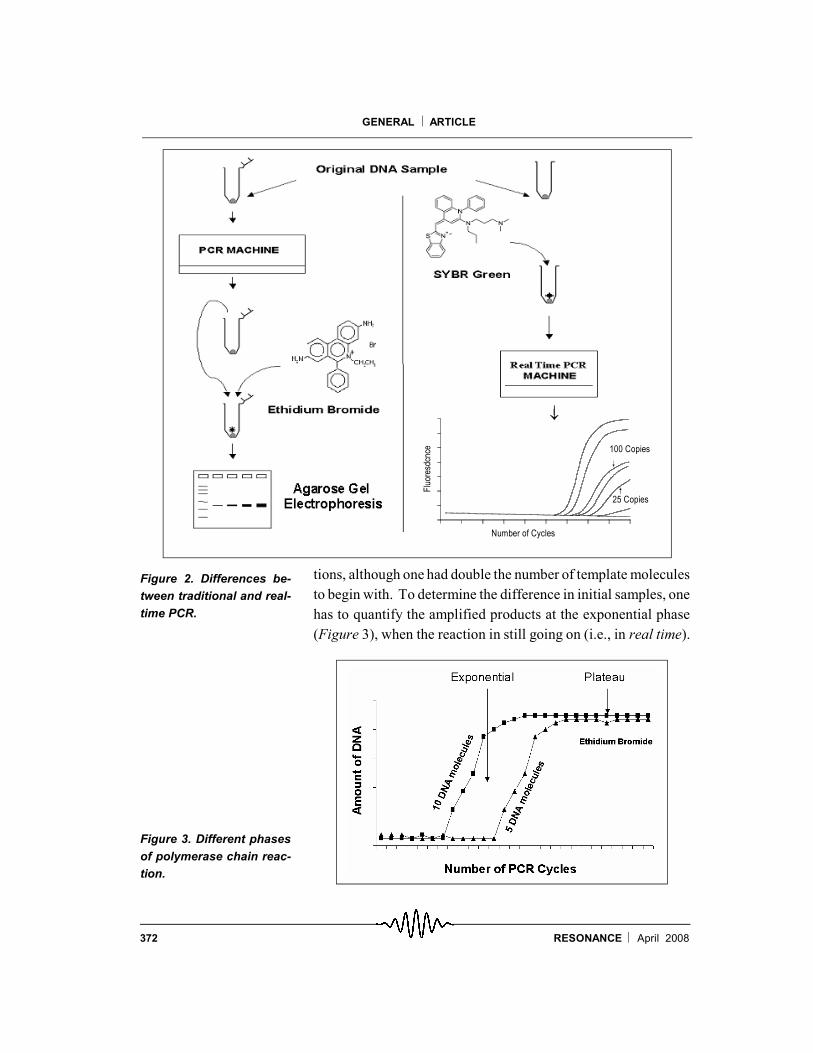
PCR is used not only to amplify DNA, but also to quantify it. As
the reaction proceeds, the DNA concentration increases exponen-
tially and plateaus off when substrates run out (Figure 3). If the
quantification is done at the saturation stage of the PCR reaction
(plateau in Figure 3), it is not possible to quantify the number of
template DNA molecules in the original sample. As shown in
Figure 3, the amounts of final products are same in both reac-
Figure 1. Schematic repre-
sentation of polymerase
chain reaction.
372 RESONANCE April 2008
GENERAL ARTICLE
Figure 2. Differences be-
tween traditional and real-
time PCR.
tions, although one had double the number of template molecules
to begin with. To determine the difference in initial samples, one
has to quantify the amplified products at the exponential phase
(Figure 3), when the reaction in still going on (i.e., in real time).
Figure 3. Different phases
of polymerase chain reac-
tion.
Number of Cycles
25 Copies
100 Copies
Flu
ores
dcnc
e

373RESONANCE April 2008
GENERAL ARTICLE
This, however, cannot be done by staining with ethidium bromide
since its sensitivity is quite low. Due to these limitations, the
amount of initial DNA in the sample cannot be quantified using
traditional PCR. But if a sensitive dye binds to DNA during the
exponential phase, then the difference between the fluorescence
of the two samples could be used to determine their initial
concentration. This technique where the amount of amplified
DNA is monitored during, and not after the PCR reaction is called
‘Kinetic’ or ‘Real-Time’ PCR.
Real-time PCR
Real-time PCR is an extension of the capabilities of traditional
PCR. This technique is used to amplify and at the same time
quantify a specific region of a DNA molecule. As mentioned
earlier, PCR amplifies specific regions of template DNA expo-
nentially, i.e., if there is ~1 nanogram (10–9 g) of template DNA,
by the time resources in the PCR reaction get exhausted, it is
amplified up to 1 microgram (10–6 g). But if the initial template is
in picogram (10–12 g) or femtogram (10–15 g) quantity, the ampli-
fication product would be too little to be detected using electro-
phoresis. This problem of sensitivity was addressed in Real-time
PCR by making use of the chemistry of fluorescent molecules
used in the reaction.
During the last decade, different fluorescent molecules were used
to detect and quantify DNA amplification in ‘real-time’. Among
these, SYBR Green3 provided the simplest method for detecting
and quantitating PCR products in real-time reactions with high
sensitivity. SYBR Green binds to double-stranded DNA and
emits light upon excitation. As the reaction proceeds and the PCR
products accumulate, the fluorescence increases proportional to
the amount of specific DNA present in the original sample. As the
amplification starts, more SYBR Green molecules are associated
with the newly synthesized double-stranded DNA and the
fluorescenece steadily increases. This enables the detection of
template DNA present in femtogram levels! The problem of
sensitivity was finally solved.
3SYBR Green has affinity for
only double-stranded DNA and
emits 1000-fold greater flores-
cence when it is associated with
the minor groove of double-
stranded DNA than when it is
free in solution [3]. SYBR Green
is added in the PCR reaction
along with other reactants and a
laser detector is used to detect
the level of fluorescence.
374 RESONANCE April 2008
GENERAL ARTICLE
Analysis of Real-Time PCR data
As shown in Figure 2, in a typical Real-time PCR reaction, the
reaction mixture containing template, polymerase, primers, etc.,
is mixed with SYBR Green. As the number of cycle progresses,
the amount of double-stranded DNA increases and so does the
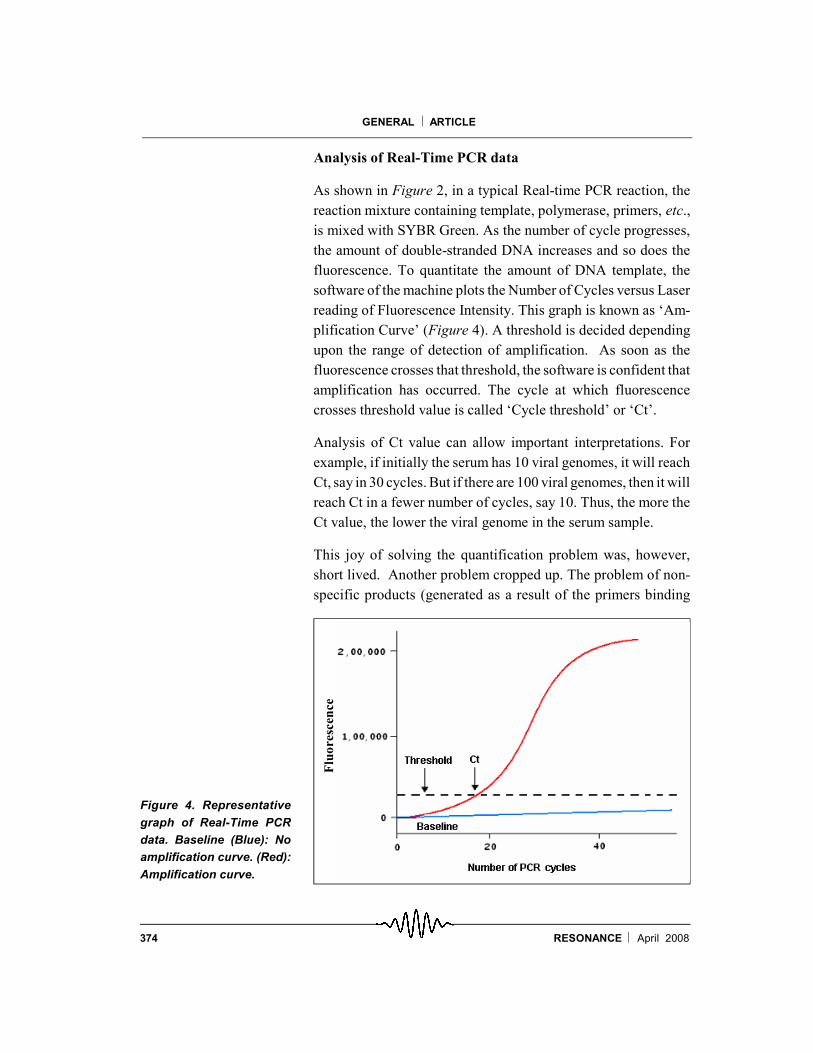
fluorescence. To quantitate the amount of DNA template, the
software of the machine plots the Number of Cycles versus Laser
reading of Fluorescence Intensity. This graph is known as ‘Am-
plification Curve’ (Figure 4). A threshold is decided depending
upon the range of detection of amplification. As soon as the
fluorescence crosses that threshold, the software is confident that
amplification has occurred. The cycle at which fluorescence
crosses threshold value is called ‘Cycle threshold’ or ‘Ct’.
Analysis of Ct value can allow important interpretations. For
example, if initially the serum has 10 viral genomes, it will reach
Ct, say in 30 cycles. But if there are 100 viral genomes, then it will
reach Ct in a fewer number of cycles, say 10. Thus, the more the
Ct value, the lower the viral genome in the serum sample.
This joy of solving the quantification problem was, however,
short lived. Another problem cropped up. The problem of non-
specific products (generated as a result of the primers binding
Figure 4. Representative
graph of Real-Time PCR
data. Baseline (Blue): No
amplification curve. (Red):
Amplification curve.
Flu
ore
scen
ce

375RESONANCE April 2008
GENERAL ARTICLE
non-specifically to the template DNA) has haunted PCR for a
long time. The SYBR Green molecule can also bind to these non-
specific double-stranded DNA and primer-dimer complexes. This
came as a big blow to Real-time PCR methodology. But as it has
been rightly said, there is always a way out. This problem was
countered by the introduction of ‘dissociation-curve analysis’.
Again, chemistry of DNA came to the rescue. The melting
temperature of DNA depends upon the length of the strand and its
GC4 content. These properties can be exploited to distinguish
between the specific and non-specific products. Thus, an extra
step was added to the PCR reaction. After the reaction is com-
plete, the amplification products are cooled to 25 oC and then the
temperature of the solution is slowly but progressively increased
again. The laser now detects the loss of fluorescence as more of
SYBR Green is released when DNA melts at high temperature.
As non-specific products are likely to have different lengths and
GC content compared to the specific product, they usually melt at
different temperatures compared to the specific amplified prod-
uct. A ‘Dissociation curve’ (Figure 5) is a graph of ‘Temperature
vs Fluorescence’. To ascertain whether the peak obtained is of
desired product, the value can be compared with standards.
Figure 5. Dissociation
curve. DNA sample A (red)
and sample B (green) give
different peaks due to dif-
ference in the GC content
as well as length. Sample A
dissociates much before
sample B, suggesting that
sample A has low GC con-
tent and lesser length than
sample B.
4DNA double strands with higher
GC content melt at higher tem-
perature than DNA having a
higher AT content.
45 50 55 60 65 70 75 80 85 90 950
0.2
0.4
Flu
ores
cenc
e
Temperature (deg. C)
376 RESONANCE April 2008
GENERAL ARTICLE
This method altogether reduced the need for electrophoresis to
check the amplified product. The dissociation curve analyses can
differentiate between two different peaks for two different DNA
molecules of same size, which would otherwise give a band at the
same position in gel electrophoresis. Differences between tradi-
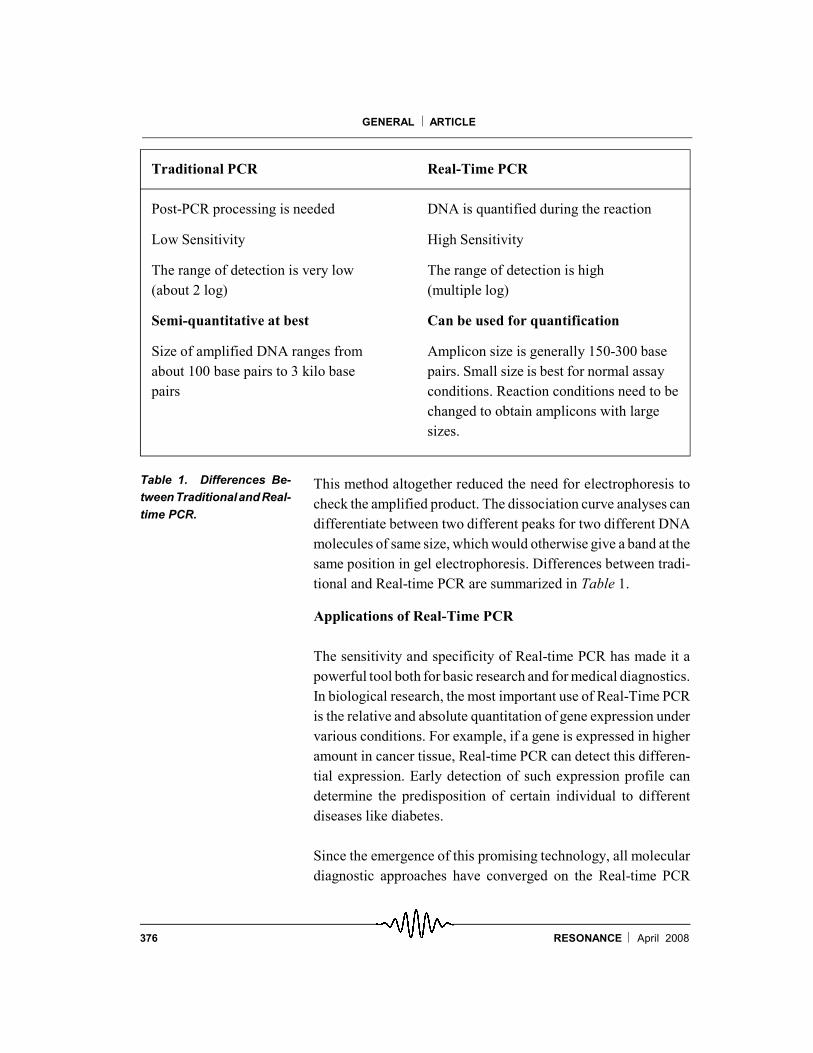
tional and Real-time PCR are summarized in Table 1.
Applications of Real-Time PCR
The sensitivity and specificity of Real-time PCR has made it a
powerful tool both for basic research and for medical diagnostics.
In biological research, the most important use of Real-Time PCR
is the relative and absolute quantitation of gene expression under
various conditions. For example, if a gene is expressed in higher
amount in cancer tissue, Real-time PCR can detect this differen-
tial expression. Early detection of such expression profile can
determine the predisposition of certain individual to different
diseases like diabetes.
Since the emergence of this promising technology, all molecular
diagnostic approaches have converged on the Real-time PCR
Traditional PCR Real-Time PCR
Post-PCR processing is needed DNA is quantified during the reaction
Low Sensitivity High Sensitivity
The range of detection is very low The range of detection is high
(about 2 log) (multiple log)
Semi-quantitative at best Can be used for quantification
Size of amplified DNA ranges from Amplicon size is generally 150-300 base
about 100 base pairs to 3 kilo base pairs. Small size is best for normal assay
pairs conditions. Reaction conditions need to be
changed to obtain amplicons with large
sizes.
Table 1. Differences Be-
tween Traditionaland Real-
time PCR.

377RESONANCE April 2008
GENERAL ARTICLE
system (4). It has drastically decreased the time frame of clinical
trials pertaining to drug resistance as well as testing the effective-
ness of drugs against elimination of pathogen and has been
effectively used to check drug resistance in HIV, which has
resulted in faster screening of alternative drugs. It is extremely
useful in detection and identification of bacterial strains. Immedi-
ate and specific detection offers the advantage of prescribing
highly specific antibiotics rather than a broad mixture of antibiot-
ics, which may result in development of antibiotic resistant
strains, and has also been very effective in identification of
specific DNA sequences in clinical oncology.
Those days are history when symptoms were used to diagnose the
onset of a disease. Today we can screen samples before the
symptoms show up in susceptible individuals and can improve
their quality of life due to early detection.
Suggested Reading
[1] Col A K Praharaj, Problems in diagnosis of HIV infection in babies,
Medical Journal Armed Forces of India, Vol.62, pp.363–366, 2006.
[2] R Maheshwari, Life at high temperatures, Resonance, Vol.10, No.9,
pp.23–34, 2005.
[3] H Zipper et al, Investigations on DNA intercalation and surface binding
by SYBR Green I, its structure determination and methodological
implications, Nucleic Acid Research, Vol. 32, No.12, e103, 2004.
[4] M A Valasek and J J Repa, The power of real-time PCR, Adv. Physiol.
Educ., Vol.29, pp.151–159, 2005.
Address for Correspondence
Simarjot Singh Pabla1 and
Sarabjot Singh Pabla2
GH Patel Post Graduate
Department of Computer
Science and Technology
Sardar Patel University
Gujarat
Email:[email protected]@gmail.com