Detection of nonauthorized genetically modified organisms using differential quantitative polymerase...
11
Detection of nonauthorized genetically modified organisms using differential quantitative polymerase chain reaction: application to 35S in maize Katarina Cankar a,1,2 , Valérie Chauvensy-Ancel b,1 , Marie-Noelle Fortabat b,1 , Kristina Gruden a , André Kobilinsky c , Jana Z ˇ el a , Yves Bertheau d, * a Department of Plant Physiology and Biotechnology, National Institute of Biology, Vec ˇna pot 111, 1000 Ljubljana, Slovenia b INRA, Méthodologies de la Détection des OGM, RD 10, Route de Saint-Cyr, 78026 Versailles cedex, France c INRA, Mathématiques Informatique Appliquées, Domaine de Vilvert, 78352 Jouy-en Josas cedex, France d INRA, RD10, Route de Saint Cyr, 78026 Versailles cedex, France article info Article history: Received 15 November 2007 Available online 21 February 2008 Keywords: Genetically modified organisms GMO Nonauthorized genetically modified organism Differential quantitative real-time PCR Differential quantitative PCR 35S Promoter P35S Maize abstract Detection of nonauthorized genetically modified organisms (GMOs) has always presented an analytical challenge because the complete sequence data needed to detect them are generally unavailable although sequence similarity to known GMOs can be expected. A new approach, differential quantitative polymer- ase chain reaction (PCR), for detection of nonauthorized GMOs is presented here. This method is based on the presence of several common elements (e.g., promoter, genes of interest) in different GMOs. A statis- tical model was developed to study the difference between the number of molecules of such a common sequence and the number of molecules identifying the approved GMO (as determined by border-frag- ment-based PCR) and the donor organism of the common sequence. When this difference differs statis- tically from zero, the presence of a nonauthorized GMO can be inferred. The interest and scope of such an approach were tested on a case study of different proportions of genetically modified maize events, with the P35S promoter as the Cauliflower Mosaic Virus common sequence. The presence of a nonauthorized GMO was successfully detected in the mixtures analyzed and in the presence of (donor organism of P35S promoter). This method could be easily transposed to other common GMO sequences and other species and is applicable to other detection areas such as microbiology. Ó 2008 Elsevier Inc. All rights reserved. In a decade of use of genetically modified organisms (GMOs) 3 , planting of GM crops has consistently increased and areas sown with GM crops exceeded 100 million hectares in 21 countries dur- ing 2005 [1]. Over 100 genetically modified plants have already been approved by regulatory agencies in different countries [2]. Due to public perception of GMOs as controversial, legislation re- quires traceability and detection of GMOs in some countries. In more than 15 countries, compulsory labeling is required for prod- ucts that contain GMOs or derived product above a certain thresh- old [3]. The list of approved GMOs differs from country to country (asynchronous approval) and the control of unapproved GMOs is necessary to monitor the presence of GMOs that are not autho- rized. Several recent unintentional releases of nonauthorized GMOs (Bt10 maize, Shanyou63 rice, LLRice601) clearly indicate the need for a detection method for unapproved GMOs. In the European Union (EU), legislation strictly imposes a zero tolerance level for nonauthorized GMOs [4,5]. This problem is not restricted to the EU because occurrence of GMOs authorized elsewhere in food supplies can be expected due to worldwide trade (for in- stance, the release of Chinese Shanyou63 rice into the U.S. market). In addition to GMOs authorized elsewhere, the source of unap- proved GMOs that enter the food supply chain can also be those that have been authorized only for feed or industrial use. The first well-documented occurrence of such a case was in October 2002 when Starlink maize was found in the U.S. food supply chain, halt- ing the U.S. trade toward the EU. Starlink maize was not approved for human consumption because the inserted protein Cry9C was suspected to be allergenic. Starlink maize was therefore withdrawn from the market at considerable expense [6,7]. Due to the commercialization of the new generations of GMOs, more GMOs that will not be approved for human consumption, such as those intended for industrial processes, bioremediation, or the production of pharmaceuticals [8,9], will enter the market 0003-2697/$ - see front matter Ó 2008 Elsevier Inc. All rights reserved. doi:10.1016/j.ab.2008.02.013 * Corresponding author. Fax: +33 (0) 1 30 83 31 95. E-mail address: [email protected] (Y. Bertheau). 1 These authors contributed equally to this paper. 2 Current address: Plant Breeding, Wageningen UR, Droevendaalsesteeg 1, 6708 PB Wageningen, the Netherlands. 3 Abbreviations used: GMOs, genetically modified organisms; GM, genetically modified; Q-PCR, quantitative polymerase chain reaction; dQ-PCR, differential Q- PCR; CaMV, Cauliflower Mosaic Virus; CT, cycle threshold. Analytical Biochemistry 376 (2008) 189–199 Contents lists available at ScienceDirect Analytical Biochemistry journal homepage: www.elsevier.com/locate/yabio
Transcript of Detection of nonauthorized genetically modified organisms using differential quantitative polymerase...

Analytical Biochemistry 376 (2008) 189–199
Contents lists available at ScienceDirect
Analytical Biochemistry
journal homepage: www.elsevier .com/ locate/yabio
Detection of nonauthorized genetically modified organisms using differentialquantitative polymerase chain reaction: application to 35S in maize
Katarina Cankar a,1,2, Valérie Chauvensy-Ancel b,1, Marie-Noelle Fortabat b,1, Kristina Gruden a,André Kobilinsky c, Jana Zel a, Yves Bertheau d,*
a Department of Plant Physiology and Biotechnology, National Institute of Biology, Vecna pot 111, 1000 Ljubljana, Sloveniab INRA, Méthodologies de la Détection des OGM, RD 10, Route de Saint-Cyr, 78026 Versailles cedex, Francec INRA, Mathématiques Informatique Appliquées, Domaine de Vilvert, 78352 Jouy-en Josas cedex, Franced INRA, RD10, Route de Saint Cyr, 78026 Versailles cedex, France
a r t i c l e i n f o
Article history:Received 15 November 2007Available online 21 February 2008
Keywords:Genetically modified organismsGMONonauthorized genetically modifiedorganismDifferential quantitative real-time PCRDifferential quantitative PCR35S PromoterP35SMaize
0003-2697/$ - see front matter � 2008 Elsevier Inc. Adoi:10.1016/j.ab.2008.02.013
* Corresponding author. Fax: +33 (0) 1 30 83 31 95E-mail address: [email protected] (Y
1 These authors contributed equally to this paper.2 Current address: Plant Breeding, Wageningen UR, D
Wageningen, the Netherlands.3 Abbreviations used: GMOs, genetically modified
modified; Q-PCR, quantitative polymerase chain reacPCR; CaMV, Cauliflower Mosaic Virus; CT, cycle thresho
a b s t r a c t
Detection of nonauthorized genetically modified organisms (GMOs) has always presented an analyticalchallenge because the complete sequence data needed to detect them are generally unavailable althoughsequence similarity to known GMOs can be expected. A new approach, differential quantitative polymer-ase chain reaction (PCR), for detection of nonauthorized GMOs is presented here. This method is based onthe presence of several common elements (e.g., promoter, genes of interest) in different GMOs. A statis-tical model was developed to study the difference between the number of molecules of such a commonsequence and the number of molecules identifying the approved GMO (as determined by border-frag-ment-based PCR) and the donor organism of the common sequence. When this difference differs statis-tically from zero, the presence of a nonauthorized GMO can be inferred. The interest and scope of such anapproach were tested on a case study of different proportions of genetically modified maize events, withthe P35S promoter as the Cauliflower Mosaic Virus common sequence. The presence of a nonauthorizedGMO was successfully detected in the mixtures analyzed and in the presence of (donor organism of P35Spromoter). This method could be easily transposed to other common GMO sequences and other speciesand is applicable to other detection areas such as microbiology.
� 2008 Elsevier Inc. All rights reserved.
In a decade of use of genetically modified organisms (GMOs)3,planting of GM crops has consistently increased and areas sownwith GM crops exceeded 100 million hectares in 21 countries dur-ing 2005 [1]. Over 100 genetically modified plants have alreadybeen approved by regulatory agencies in different countries [2].Due to public perception of GMOs as controversial, legislation re-quires traceability and detection of GMOs in some countries. Inmore than 15 countries, compulsory labeling is required for prod-ucts that contain GMOs or derived product above a certain thresh-old [3]. The list of approved GMOs differs from country to country(asynchronous approval) and the control of unapproved GMOs isnecessary to monitor the presence of GMOs that are not autho-rized. Several recent unintentional releases of nonauthorized
ll rights reserved.
.
. Bertheau).
roevendaalsesteeg 1, 6708 PB
organisms; GM, geneticallytion; dQ-PCR, differential Q-ld.
GMOs (Bt10 maize, Shanyou63 rice, LLRice601) clearly indicatethe need for a detection method for unapproved GMOs. In theEuropean Union (EU), legislation strictly imposes a zero tolerancelevel for nonauthorized GMOs [4,5]. This problem is not restrictedto the EU because occurrence of GMOs authorized elsewhere infood supplies can be expected due to worldwide trade (for in-stance, the release of Chinese Shanyou63 rice into the U.S.market).
In addition to GMOs authorized elsewhere, the source of unap-proved GMOs that enter the food supply chain can also be thosethat have been authorized only for feed or industrial use. The firstwell-documented occurrence of such a case was in October 2002when Starlink maize was found in the U.S. food supply chain, halt-ing the U.S. trade toward the EU. Starlink maize was not approvedfor human consumption because the inserted protein Cry9C wassuspected to be allergenic. Starlink maize was therefore withdrawnfrom the market at considerable expense [6,7].
Due to the commercialization of the new generations of GMOs,more GMOs that will not be approved for human consumption,such as those intended for industrial processes, bioremediation,or the production of pharmaceuticals [8,9], will enter the market

190 Detection of nonauthorized GMOs by dQ-PCR / K. Cankar et al. / Anal. Biochem. 376 (2008) 189–199
as observed in the USA. Therefore, traceability of such organisms orverification of their absence in food will need to be assured.
To ensure traceability of GM products and to prevent the entry ofunapproved GMOs in to the market, methods to detect nonautho-rized GMOs are thus needed. The problems of detection, character-ization, and quantification of unapproved GMOs present analyticalchallenges for GMO detection laboratories because the data on in-serted constructs and nucleotide sequences are usually proprietaryand reference materials are not available [10], which hampers thedevelopment of specific tests for nonauthorized GMOs.
Currently, no strategy has been fully described and internation-ally accepted for the detection of nonauthorized GMOs, but severaltheoretical approaches have been proposed (e.g., the ‘‘matrix ap-proach” proposed by INRA in 1999 for the GMochips programhttp://www.gmochips.org retaken in the European research pro-gram Co-Extra http://www.coextra.eu). The so-called differentialqualitative PCR, also called the ‘‘indirect subtractive approach,” isbased on the presumption that screening tests being positive andno authorized GMO being found in the sample provide indirect evi-dence for the presence of (a) nonauthorized GMO(s) [11] and hasbeen used for instance in 2000 by the French frauds repression Ser-vices for detecting unapproved GMOs. Additionally, the DNA flank-ing the screening elements can be sequenced, which enableselucidation of the GM construct and design of specific tests forthe nonauthorized GM line. Such an approach was used to designPCR tests to detect nonauthorized GM rice varieties [12]. Alterna-tively, profiles obtained by anchored PCR may differentiate ap-proved and unapproved GMOs.
In the matrix approach that INRA proposed several years ago,the idea was extended to screening of many targets that arepresent in the constructs and to detection of authorized andunauthorized GMOs by, e.g., PCR and hybridization (see the vali-dated DualChip http://biotech.jrc.it/home/documents/report-JRC-EAT.pdf) or a SNPlex-based method. From the combination of posi-tive and negative amplifications and the hybridization results com-pared to approved GMO patterns, presence of nonauthorized GMOscan be inferred. Due to the large number of analyses that wouldneed to be performed in such approaches, the microarray tech-nique has been proposed [11], (see DualChip validation). GMOdetection microarrays have already been prepared [13–15] butare not yet widely used in GMO detection laboratories. An exten-sion to the detection on microarrays of sequences of the plasmidicvectors and inserted sequences has also been studied (A. Holst-Jen-sen et al., unpublished).
Another theoretical approach was proposed by Nesvold et al.[16], with a rationalized design for a set of synthetic oligonucleo-tide probes that would cover the entire plant genome of the speciesin question. By hybridizing the whole genomic DNA of the sampleand of the wild-type plant, any differences in the genomes wouldbe made evident. The approach is tempting because it does not re-quire prior knowledge of inserted sequences, but the whole gen-ome sequence of the plant in question and information aboutinter cultivar variability must be available before such tests canbe used, unless hybridization is carried out with vectors’ and in-serted sequences.
The ‘‘profiling” approach is based on the majority of the insertcontaining (a) common sequence(s) flanked by specific DNA se-quences that allow for discrimination among GM events. AnchoredPCR, where genomic DNA is cut by a restriction enzyme prior toadaptor-ligation, was proposed to detect unknown GMOs [11]. Sub-sequently, common sequence-specific and adaptor-specific primersare used to amplify the DNA and each GMO is represented by a spe-cific fragment size. Fragments of unexpected length are thereforeconsidered indicative of the presence of nonauthorized GMOs.
In this article, we propose a new approach for detecting nonau-thorized GMOs which is based on differential quantitative PCR
(dQ-PCR) and is an extension of the qualitative differential PCR al-ready in use in French enforcement laboratories. We statisticallytest the hypothesis that the quantity of a common sequence, pres-ent in different GM lines, equals the sum of quantities of approvedevent-specific sequences. When the sum of quantities of DNA cop-ies of authorized GM events differs statistically from the quantityof DNA copies of the common sequence, the presence of a nonau-thorized GMO can be inferred. This approach has been tested on acase study of GM maize events. Promoter P35S originating fromCauliflower mosaic virus (CaMV) was chosen as the common se-quence because it is the most commonly introduced promoter incurrently approved genetically modified plants. A statistical modelwas developed to reliably determine the presence of the nonautho-rized GMOs. Effects of the DNA extraction procedure, the replicateanalysis, and the operator extracting DNA on quantitative analysesby real-time PCR were evaluated and taken into account when set-ting up the model. The presence of P35S promoter does not neces-sarily imply the presence of genetically modified plants but couldbe due to presence of CaMV [17,18]. Therefore, an additional con-trol was introduced to account for the presence and quantity ofP35S originating from the virus. This paper is the first publishedapplication of dQ-PCR to the problem of detecting nonauthorizedGMOs.
Its major interest lies in the use of existing equipment and re-agents without the need for additional personnel training in con-trast to the above-cited other detection methods of unapproved/unknown GMOs. Such characteristics should confer it a clearadvantage over alternative methods that are directly applicable.
Materials and methods
Materials
Heterozygous seeds from the GM maize event T25 were pro-vided by Aventis. Heterozygous Bt176 maize seeds were obtainedfrom Novartis and Mon810 event seeds were provided by Monsan-to Co. Seeds were obtained through the Direction Générale de l0Ali-mentation of the French Ministry of Agriculture. Seeds were grownin a greenhouse and leaves were collected and stored at �20 �C.Non transgenic DNA was isolated from leaves of maize (Zea maysL.; hybrid LG-2447) obtained from Limagrain Co. (Chappes, France).
pBR322 plasmid with the inserted whole genome of the Cauli-flower mosaic virus (strain CabbS) was provided by the Institut deBiologie Moléculaire des Plantes, Centre National de la RechercheScientifique, Strasbourg, France [19].
Isolation of DNA
DNA was isolated from 1 g of plant leaves ground in liquidnitrogen. A DNA Midi Kit for blood and cell culture (Qiagen, Valen-cia, CA) was adapted for isolation of the DNA from large startingmaterials of plant tissue. Ten milliliters of digestion buffer G2was added to 1 g of ground plant material and vortexed. One hun-dred microliters of a-amylase (10 mg/ml; Sigma, St. Louis, MO) and100 ll of RNase (10 mg/ml; Amresco/Interchim, Montluc�on,France) were added, and samples were incubated at 65 �C for30 min. Two hundred microliters of Qiagen Proteinase K (20 mg/ml) was added, and samples were incubated at 65 �C for 1 h. Sam-ples were centrifuged at 16,000 g for 5 min. The supernatant wasalso passed through a Miracloth filter (Merck Eurolab, Darmstadt,Germany) to avoid clogging of the isolation columns. The superna-tant was then applied to the QBT-buffer-equilibrated Qiagen col-umns and the washing and elution steps were performed asdescribed by the manufacturer (genomic-tip protocol). DNA wasprecipitated using isopropanol at 4 �C and centrifugation at
Detection of nonauthorized GMOs by dQ-PCR / K. Cankar et al. / Anal. Biochem. 376 (2008) 189–199 191
8400 g for 6 min. The DNA pellet was washed with 70% ethanol,transferred to a 1.5-ml Eppendorf tube, dried with a speedvac for12 min at 30 �C and dissolved in 100 ll of TE buffer. Samples werestored at 4 �C overnight to fully dissolve and transferred to �20 �C.
For the three genetically modified maize varieties, sampleswere extracted twice (in five independent parallel procedures) bytwo different operators. Five parallel extractions of each GMO werejoined and the other five were left separated. This enabled us tostudy the effect of the operator and the variability between DNAisolations performed concurrently. Blank DNA isolations (isolationsfrom cell-culture-grade water; Biological Industries, Beit Haemek,Ashrat, Israel) were performed concurrently with the sampleDNA isolations to test for cross contamination during the DNAextraction procedure.
DNA quantification
Isolated DNA was electrophoresed on an 0.8% agarose gel con-currently with 10–30 ng of phage k DNA (MBI Fermentas, Vilnius,Lithuania). Gel images were analyzed by Bio-1 D v. 99.06 software(Vilber Lourmat Biotechnology, Marne-la-Vallée, France) and DNAconcentration was determined by comparison of the ethidium bro-mide fluorescence of DNA to the k DNA standard curve.
Additionally, a real-time PCR was performed with maize spe-cies-specific primers (Adh; see below) for three dilutions of eachDNA extract containing approximately 20,000 2,000, and 200 cop-ies of genomic DNA. DNA concentrations were equalized accordingto the obtained Ct values. DNA extracts were tested for PCR inhibi-tion by assessing PCR efficiency calculated from the standard curveobtained.
Real-time PCR primers and probes used in this study
Real-time PCR probes and primers used in this study were pre-viously published [18,20–23] and are presented in Table 1. Forgenetically modified organisms, probe and primer sets were cho-sen to specifically amplify the border fragments of the GMOs,thereby ensuring no possible cross-reactivity between differentGMOs.
Real-time PCR
Real-time PCRs were run using 200 nM probe and 300 nM pri-mer concentrations for all assays using either 1� TaqMan Univer-
Table 1Primers and probes used in the study
Event Orientation Location Primers and probe names
Bt176 forward primer transgene PBt176Freverse primer plant genome PBt176RMfluorogenic probe on the border PBt176-pr
Mon810 forward primer plant genome PMo810FMreverse primer transgene PMo810Rfluorogenic probe on the border Mo810-pr
T25 forward primer transgene PT25Freverse primer plant genome PT25RMfluorogenic probe on the border T25-pr
Adh forward primer internal Adh ADH-F3reverse primer internal Adh ADH-R4fluorogenic probe internal Adh ADH1
35S forward primer internal P35S SFreverse primer internal P35S SRfluorogenic probe internal P35S 35S
CaMV ORFIV forward primer internal ORFIV CaMVFreverse primer internal ORFIV CaMVRfluorogenic probe internal ORFIV CaMV-MGB
ORF, open reading frame.
sal PCR Master Mix (Applied Biosystems, Foster City, CA) or 1 � Q-PCR MasterMix (Eurogentec Co., Liege, Belgium). Both PCR master-mixes contain uracil N-glycosylase enzyme to prevent carryovercontaminations and ROX as a passive reference dye; the mixeswere previously checked for equality of performance (data notshown). PCRs were run either in 20 ll reaction volume on an ABIPrism 7900HT platform (Applied Biosystems) or in 25 ll reactionvolume on an ABI Prism 7700 instrument (Applied Biosystems).The MasterMix and PCR instrument were not varied within oneexperimental design (see Table 2). Universal thermal cycling con-ditions were used for all amplicons: 2 min at 50 �C, 10 min at95 �C, with 45 cycles of 15 s at 95 �C and 1 min at 60 �C. The base-line and threshold were adjusted manually after each real-timePCR run. Equal baseline and threshold were used for all ampliconswithin one experimental design to enable comparisons of resultsfrom different PCR plates.
Experimental designs
Five different experimental designs were consecutively exe-cuted to test the performance of the dQ-PCR technique. The de-signs are summarized in Table 2. The first objective was toexperimentally confirm the copy number of P35S promoter perGMO as described in the literature (designs 1 and 2). The variationin results that occurs due to extraction, the plate effect, and theoperator was studied in design 3. The dQ-PCR test was performedin design 4 on samples containing individual GM maize events andmixtures of events Bt176, Mon810, and T25 maize using differentcopy numbers. Additionally, a plasmid containing CaMV viruswas introduced in to DNA mixtures design 5 to assess the influenceof the presence of CaMV.
Statistical analysis
The aim of the dQ-PCR is to detect nonauthorized GMOs in aDNA mixture containing multiple GM events. The quantity of acommon element present in all events used in the study was mea-sured by real-time Q-PCR as was the quantity of authorized GMevents by amplification of its specific border fragment. When thesum of the quantity of authorized events substantially differs fromthe quantity of the common element, the presence of a nonautho-rized GMO can be inferred. Therefore, the sum of quantities ofauthorized events is subtracted from the total amount of the com-mon genetic element, as shown in the following equation:
Sequence 50 –> 30 Length (bp) References
GAACTGGCATGACGTGG 17 C. Collonnier et al.GAAGGGAGAAACGGTCG 17 unpublished dataCCTGCCCGTCACCGAGATCTGATGT 25CCTTCATAACCTTCGCCCG 19 20AATAAAGTGACAGATAGCTGGGCA 24ACGAAGGACTCTAACGTTTAACATCCTTTGCCA 33ACAAGCGTGTCGTGCTCCAC 20 21GACATGATACTCCTTCCACCG 21TCATTGAGTCGTTCCGCCATTGTCG 25CGTCGTTTCCCATCTCTTCCTCCT 24 22CCACTCCGAGACCCTCAGTC 20AATCAGGGCTCATTTTCTCGCTCCTCA 27CGTCTTCAAAGCAAGTGGATTG 22 23TCTTGCGAAGGATAGTGGGATT 22TCTCCACTGACGTAAGGGATGACGCA 26GGCCATTACGCCAACGAAT 19 18ATGGGCTGGAGACCCAATTTT 21TTCTCCGAGCTTTGTC 16

Table 2Overview of experimental designs
Verification of P35S copy number per GMO Extract effect Application of differentialQ-PCR test
Differential P-PCR test:introducing CaMV control
Design 1 2 3 4 5
PCR performed P35S / Bt176 / Mon810 / T25 P35S / Bt176/ Mon810 / T25/ Adh
P35S / Bt176 / Mon810 / T25/ Adh
P35S / Bt176 / Mon810 /T25
P35S / Bt176 / Mon810/ T25 / CaMV (ORFIV)
GMO quantities 1000, 5000 copies (Bt176and T25) 2000, 10,000copies (Mon810)
4000, 40,000 copies 100, 400, 1600 copies 0,100, 400, 1600 copies 0, 100, 1000 copies
Parameters Mixtures of GMO Curve for each GMO 2 experimenters 5 extractsfor each GMO = 10 extractsper each one
26 mixtures of GMOs 16 mixtures of GMOs +CaMV
Statistical analysis Nonlinear regression ANOVA ANOVA Differential Q-PCR test Differential Q-PCR test
192 Detection of nonauthorized GMOs by dQ-PCR / K. Cankar et al. / Anal. Biochem. 376 (2008) 189–199
l ¼ Quantitycommon element � Quantityauthorized GMOs
When l substantially differs from 0, it can be assumed that thesample contains nonauthorized GMOs. A statistical test of hypoth-esis, called the dQ-PCR test, was developed to determine the pres-ence or absence of nonauthorized GMOs with significance levels of5% (for all examples). The significance level of a statistical hypoth-esis test is a fixed probability of wrongly rejecting the null hypoth-esis H0 if it is in fact true.
The principle of approach is first to estimate target quantity(copy number) with a separate model for Q-PCR analysis and sec-ond to execute a dQ-PCR test (see also Appendix 1 in Supplemen-tary material for more details on both models).
Model for estimation of the target quantity in Q-PCR
Quantification of each event-specific target was performedusing the model Ct = a-blog N, where a and b are the ordinateand the slope of the standard curve, respectively. This model is de-fined for absolute copy numbers applied to a calibration curve [24].The regression curve is obtained through linear regression by theleast square method. Calibration curves must be calculated foreach of the target amplicons. With the estimators of calibrationcurve, the copy number of an unknown sample, denoted by N(u),can be calculated with the equation:
NðuÞ ¼ 10CtðuÞ�a
b
� �;
where Ct(u) is the observed Ct for the unknown sample and aand b are the estimators of a and b.
dQ-PCR test
In this case, the method was tested on a maize model systemwhere P35S was used as a common element of the three GM maizeevents Bt176, Mon810, and T25. So l can be expressed as
l ¼ QuantityP35S � QuantityBt176 � QuantityMon810 � QuantityT25:
This equation can be extended when the CaMV is present as
l ¼ QuantityP35S � QuantityBt176 � QuantityMon810 � QuantityT25
� QuantityCaMV :
The test, l = 0, can be separated into two hypotheses: the nullhypothesis (H0) l = 0, which is initially assumed to be true, againstthe alternative hypothesis l > 0. Confirmation of the null hypothe-sis would indicate the absence of a nonauthorized GMO in thesample. In our study, one of the GMOs was considerednonauthorized.
The dQ-PCR test algorithm was based on the ‘‘Delta method”[25]. The Delta method is a method of approximating the expectedvalue as a function of random variables. For this purpose, this func-
tion is considered a Taylor series. In our case, the asymptotic nor-mality of the parameters can be proven; therefore, the normaldistribution was used to test the null hypothesis. The Delta methodallows us to show that l� l � Nð0;
P2Þ, whereP2 depends on
several parameters (estimated quantities...). The test statistic used,T, can be written as T ¼ l�lP , where l is the estimated value calcu-
lated according to the observed data and l is the theoretical value;i.e., l = 0. As shown previously, this statistic is a standard normalrandom variable. The obtained value was compared with the 5th
percentile of normal distribution (i.e., 1.64). When the estimatedvalue of T is lower than 1.64, the null hypothesis cannot be re-jected; therefore, the presence of nonauthorized GMO in the sam-ple cannot be determined. When the estimated value of T is higherthan the 5th percentile of the normal distribution, the null hypoth-esis can be rejected with a significance level of 5% and the presenceof nonauthorized GMO in the sample is accordingly assumed.
R statistical freeware [26] was used to analyze real-time Q-PCRexperimental data and to test the null hypothesis.
Results and discussion
As a first step, the number of P35S promoter copies per GMOmaize event used in the study was experimentally determinedand compared to the information of the BATS database on theGMO constructs [27]. Then, the influences of DNA extraction andoperators on the results of Q-PCR were assessed. The dQ-PCR testwas applied to determine the GMO percentage range in whichthe presence of nonauthorized GMO can be assessed. Finally, theCaMV virus (which is the donor organism of P35S promoter) wasincluded in the DNA mixtures. The presence of CaMV virus andthe reliability of the dQ-PCR test when the virus is present were as-sessed to avoid false positive results.
Verification of P35S copy number per GM maize
Before testing the performance of our model, the copy numberof P35S promoter per GM event was experimentally confirmed by apreviously developed quantitative PCR (sF/sR primers), [23].According to the BATS database [27], the P35S enhancer copy num-bers detected by sF/sR primers are two copies of P35S per Bt176genome, two copies of P35S per Mon810 genome and one copyof P35S per T25 genome.
Several experiments were carried out to validate our Q-PCR testagainst the literature data. The first experiment was based onexperimental design 1 (Table 2). In this design, the real time Q-PCR tests were performed on eight DNA mixtures containing highcopy numbers of Bt176, Mon810, and T25 events. Differentamounts of each GMO were used to prepare these mixtures:5000 or 1000 haploid genome copies of Bt176 and T25 and10,000 or 2000 haploid genome copies of Mon810. Standard curves

Table 3Ratio of Bt176 and Adh content in 10 Bt176 extracts relative to the value of the firstextract
Extract Relative quantity of Bt176 Relative quantity of Adh Ratio
1 1 1 12 1.06 1.40 0.763 1.37 1.39 0.994 0.95 0.93 1.025 2.71 2.44 1.116 0.76 0.79 0.977 0.97 1.20 0.818 1.17 1.11 1.059 0.84 0.94 0.9010 0.84 0.90 0.93
Detection of nonauthorized GMOs by dQ-PCR / K. Cankar et al. / Anal. Biochem. 376 (2008) 189–199 193
were also made for each GMO and a P35S standard curve was pre-pared using the Mon810 event. To estimate the P35S copy number,a non linear model was considered (see Appendix 2, in [28]). Thevalue 2 was fixed to the Mon810 coefficient to decrease the num-ber of parameters in the model. After calculating, the coefficientswere defined as 2 for Mon810, 2.22 with SD of 0.17 for Bt176,and 0.60 with a SD of 0.11 for T25. Our data were close to the bib-liographic data in that the quantity of P35S copies detected forMon810 and Bt176 was the same, although the T25 result was low-er than expected. To complete and confirm these results, experi-mental design 2 (Table 2) was further tested.
This experiment was based on the comparison between P35Sregression curves of each GMO. Real-time Q-PCR tests were per-formed on one sample for each Bt176, Mon810, and T25 event at40,000 and 4000 haploid genome copies. Three regression curveswere tested with an ANOVA to look for their equality using twosteps: testing (i) the equality of slopes of regression curves and(ii) the equality of ordinates. The hypothesis of equality of slopeswas tested by comparing two models: model 1, where both theslopes and the ordinates associated with the different GMOs differand model 2, where a common slope for all GMOs and differentordinates are associated with regression curves of different GMOs.When the hypothesis of slope equality was accepted, the equalityof the ordinates was further tested by comparing model 2 withmodel 3, where a common slope and ordinate for all GMOs arecalculated.
Calculation allowed us to accept the hypothesis of slope equal-ity (p = 0.37) and to reject the hypothesis of ordinate equality(p < 10�6). So the three regression curves had the same slope butcould not be considered equal. Accordingly, the Q-PCR test hadthe same efficiency for all targets, but the ordinates differed.
Relative P35S quantity of GMOs was then compared. This calcu-lation was performed for both P35S and Adh quantities. The ob-tained ratio between the P35S promoter quantity in the Mon810event and that in the Bt176 event was 1.15, indicating an equalP35S copy number in these two events. The ratio of the P35S pro-moter quantity in the T25 event and that in the Bt176 eventequaled 0.48, indicating that the Bt176 event contains twice asmany P35S copies as the T25 event. The obtained results confirmedthe literature data and coefficients 2, 2, and 1 were introduced tothe differential quantitative PCR model for maize events Bt176,Mon810, and T25, respectively. The following equation was there-fore used for determination of presence of unknown GMOs:
1.5 2.0
2627
2829
3031
3233
Curves of
lo
Ct
1122
233
44
55
66
7788
99aa
extr6extr7extr8extr9extr10
Fig. 1. Calibration curves for determination of extract effect for event Bt176. Standard cgenome copy number). Number of each extract is used as plotting symbol (except for eextract.
l ¼ NðuÞP35S � 2� NðuÞBt176 � 2� NðuÞMon810 � NðuÞT25:
The introduction of these coefficients in the test modified onlythe calculation of variance.
Effect of DNA extraction and operators on Q-PCR results
The influence of extract DNA quantity and quality on accuracyof real-time PCR results has been observed in many cases. Threeexperiments were performed to test the influence of these effectson Q-PCR results. Because the three experimental designs providedsimilar results, the results presented below refer only to the exper-imental design 3 (see Table 2). Standard regression curves weremade for each DNA extract with 100, 400, and 1600 haploid gen-ome copies (see Fig. 1), and a comparison of these curves was per-formed. An ANOVA was carried out on all curves to determinewhether they could be considered equal. We confirm the equalityof slopes of regression curves for Bt176 Q-PCR identification(p = 0.28). The equality of ordinates was rejected (p < 10�13). Thesame results were obtained for the Adh target. The distance be-tween parallel lines was similar for these two Q-PCR targets asshown in Fig. 1. Further, the correlation between ordinates ofBt176 and Adh curves was determined as 94.9%. The relative quan-tities for each independent extract of Bt176 and Adh are given inTable 3, which shows that the ratio between Bt176 and Adh extractquantities are close to 1 for all studied DNA extracts. As expected,the results show both DNA extraction and operator effects on theabsolute number of target copies. However, these effects disappear
2.5 3.0
Bt176 extract
g10 N
11
1
22
22
22
33
33
44
44
55
5566
66
77
7788
89
99
aa
aa
extr1extr2extr3extr4extr5
urves of Bt176 extract for border fragment of Bt176. (Ct, cycle threshold, N, haploidxtract 10 represented by ‘a’), and different line types are used to differentiate each

194 Detection of nonauthorized GMOs by dQ-PCR / K. Cankar et al. / Anal. Biochem. 376 (2008) 189–199
when a relative quantification method is used and the event-spe-cific quantity is normalized using a single-copy maize endogenousgene. Similar results (data not shown) were obtained for T25 andMon810 DNAs.
To eliminate this DNA effect on absolute genome copy number,all following experiments were carried out using the same DNA ofeach GMO for the calibration curve and the mixtures.
Performance of the dQ-PCR test at low copy numbers of targetamplicons
The performance of the dQ-PCR method was tested practicallyon DNA mixtures containing GM maize events. To establish thelowest applicability limit and to simulate the situation where traceamounts of GM materials are present in the samples (a quite com-mon situation in enforcement laboratories), the performance of thedQ-PCR method was tested on mixtures of GM events containinglow haploid genome copy numbers (experimental design 4; see Ta-ble 2). Real-time PCR tests were performed on 26 mixtures (among64 possibilities) of Bt176, Mon810, and T25 events, containing 0,100, 400, or 1600 haploid genome copies of individual GM events.The 26 mixtures were chosen to have P35S ratios (defined below)ranging 15–50% for one GMO at least.
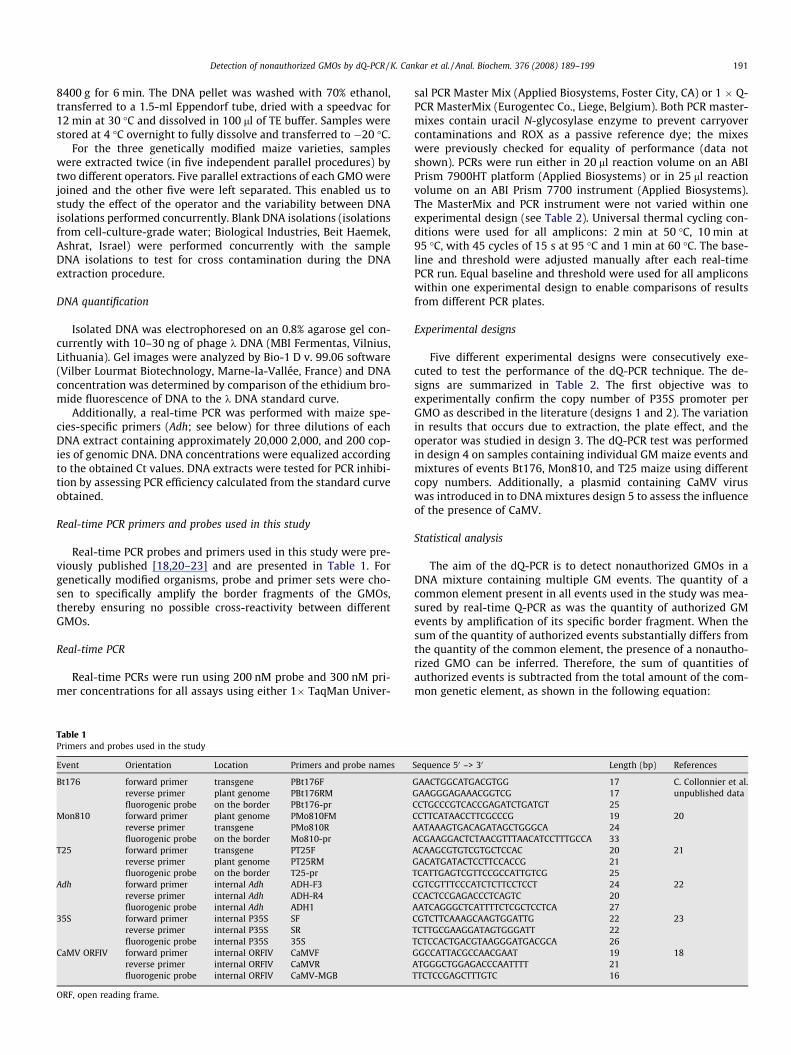
The numbers of total P35S copies and GM-specific copies weredetermined experimentally and compared to the actual haploidgenome copy number added to the reactions. Good correlations be-tween the estimated and the actual numbers of the target se-quences were obtained for all tested amplicons as shown inFig. 2. Correlation coefficients were calculated for all targets:cor(Bt176calculated/true) = 99.9%, cor(Mon810calculated/true) = 99.5%,cor(T25calculated/true) = 99.7%, and cor(P35Scalculated/true) = 99.2%.
The significance level of our asymptotic test was set to 5%. Indesign 4, only sample 3 wrongly rejected the null hypothesis H0
(which explains the detection of Bt176 when the quantity equaled0; see Fig. 3); the empirical value of the significance level is 1/26 = 3.8%. Due to cost-effective detection practice, the number ofrepetitions for a single test in GMO detection is very often less thanfive. Therefore, simulations were carried out to determine whether
0 500 1000 1500
050
015
00
a) Estimationfor Bt176
True values
Estim
ated
val
ues
0 500 1000 1500
050
015
00
c) Estimationfor T25
True values
Estim
ated
val
ues
Fig. 2. Correlation of true and estimated copy numbers of target sequences. Correlationsthe reaction for (a) Bt176 event, (b) Mon810 event, (c) T25 event, and (d) P35S promote
the significance level is really close to 5%. These simulations werebased on the observed data and normal distribution hypothesis.Levels for each mixture were simulated and all results were closeto the value of 5% with a mean of 4.8%. As expected, the signifi-cance level of our test, i.e., the probability of wrongly rejectingthe null hypothesis, is therefore equal to 5%.
Finally, the determination of an unknown GMO in the mixturewas assessed experimentally. Our aim was to detect nonauthorizedGMOs in a DNA mixture containing multiple GM events. Hypothe-sis testing was performed with one of the GM maize lines used inthe experiment considered a nonauthorized GMO and the othertwo maize GM lines considered authorized GM events. The totalquantity of the P35S promoter was compared to the quantity ofthe authorized GM events. When the sum of the quantity of autho-rized events substantially differed from the quantity of the com-mon element, the presence of a nonauthorized GMO could beinferred (Table 4).
The power of the statistical test, i.e., the probability of trulyrejecting the null hypothesis, was further assessed. First, the powerof the statistical test was shown to be dependent on the absolutequantity of the nonauthorized GMO in the reaction. At the levelsof 1600 and 400 haploid genome copies of nonauthorized GMOin the DNA mixture, the nonauthorized GMO events were detectedin 100% of cases. When using 100 haploid genome copies, reliabil-ity of the test varied by GM event (33% for T25 and 83% for Bt176and Mon810; Table 5).
The power of the statistical test thus clearly increased withhigher GM event copy number quantity per reaction. At very lowcopy number (100 haploid genome copies), the detection of un-known GM events is less reliable, probably due to the measure-ments being taken close to the limit of quantification for real-time PCRs.
For the same reason as for the significance level, some simula-tions were carried out to determine the value of the power ofour test. For the Bt176 event the mean values for the power ofthe test were 68% at the level of 100 haploid genome copies ofBt176 per reaction, 95% at the level of 400 haploid genome copiesper reaction, and 100% at the level of 1600 haploid genome copies
0 500 1000 1500
050
015
00
b) Estimationfor Mon810
True values
Estim
ated
val
ues
2000 4000 6000 8000
2000
6000
d) Estimation for P35S
True values
Estim
ated
val
ues
of experimentally estimated target copy numbers and DNA copy numbers added tor.

0 10 20 30 40 50 60
050
015
00
a) Detection of Bt176
% Bt176/P35S
Nb
copy
Bt1
76
NNDN D DDDDNDD DD DDDDD
DDDDDDD
0 10 20 30 40 50 60
050
015
00
b) Detection of Mon810
% Mon810/P35S
Nb
copy
Mon
810
DDD
D
N DDDD
D
NN DDDDDD
D
N ND
DDDD
0 10 20 30 40 50 60
050
015
00
c) Detection of T25
% T25/P35S
Nb
copy
T25
DD
DD
DD
DD
DD
D
D
D
D
N ND
DD DDD
NND
DDN
DetectedNot detected
Fig. 3. Detection of a nonauthorized GMO as a factor of P35S content. The success of detection of a nonauthorized GMO depended on the haploid genome copy number ofindividual GM events per reaction (y axis) and the percentage of P35S promoter originating from this event relative to total P35S amount (x axis).
Table 4Detection of a nonauthorized GMO in a mixture at low genome copy number
Sample P35S Bt176 Mon810 T25
A E A E T % A E T % A E T %
1 600 687 0 0 N 0.0 100 98 D 33.3 400 407 D 66.72 1200 1418 0 0 N 0.0 400 390 D 66.7 400 458 D 33.33 2400 3111 0 0 D 0.0 400 375 D 33.3 1600 1613 D 66.74 4800 5136 0 0 N 0.0 1600 1548 D 66.7 1600 1521 D 33.35 600 691 100 98 D 33.3 0 0 N 0.0 400 421 D 66.76 500 541 100 100 D 40.0 100 94 D 40.0 100 114 D 20.07 800 993 100 99 D 25.0 100 96 D 25.0 400 416 D 50.08 1400 1485 100 104 D 14.3 400 372 D 57.1 400 409 D 28.69 2600 3407 100 107 D 7.7 400 354 D 30.8 1600 1600 D 61.510 5000 5568 100 101 N 4.0 1600 1426 D 64.0 1600 1645 D 32.011 1200 1577 400 425 D 66.7 0 0 N 0.0 400 444 D 33.312 2400 2964 400 423 D 33.3 0 0 N 0.0 1600 1699 D 66.713 1400 1848 400 429 D 57.1 100 95 D 14.3 400 386 D 28.614 2600 3473 400 423 D 30.8 100 93 D 7.7 1600 1539 D 61.515 1600 1644 400 405 D 50.0 400 366 D 50.0 0 0 N 0.016 1700 1896 400 378 D 47.1 400 407 D 47.1 100 106 N 5.917 2000 2091 400 418 D 40.0 400 375 D 40.0 400 410 D 20.018 3200 3882 400 420 D 25.0 400 397 D 25.0 1600 1540 D 50.019 5600 5562 400 426 D 14.3 1600 1240 D 57.1 1600 1719 D 28.620 4800 5433 1600 1681 D 66.7 0 0 N 0.0 1600 1497 D 33.321 5000 5980 1600 1701 D 64.0 100 105 N 4.0 1600 1529 D 32.022 5600 6642 1600 1636 D 57.1 400 410 D 14.3 1600 1605 D 28.623 6400 6667 1600 1648 D 50.0 1600 1541 D 50.0 0 0 N 0.024 6500 6698 1600 1547 D 49.2 1600 1573 D 49.2 100 109 N 1.525 6800 7916 1600 1597 D 47.1 1600 1440 D 47.1 400 398 D 5.926 8000 9219 1600 1573 D 40.0 1600 1429 D 40.0 1600 1693 D 20.0
A, actual haploid genome copy number added to the reaction; E, experimentally estimated haploid genome copy number; %, the percentage of P35S promoter originatingfrom GM event relative to total P35S amount; T, result of statistical test of detection of unknown GM line, where successful detection is marked by D and unsuccessfuldetection by N.
Detection of nonauthorized GMOs by dQ-PCR / K. Cankar et al. / Anal. Biochem. 376 (2008) 189–199 195
per reaction. Thus results of simulations were close to empiricalvalues calculated on observed data (Table 5).
Secondly, successful detection of the P35S originating from theunknown GMO depended on the ratio of the P35S quantity of theunknown’s GMO to the total amount of P35S copiesðNðuÞUnknown GMO=ð2� NðuÞBt176 þ 2� NðuÞMon810 þ NðuÞT25Þ. For example, in themixtures where 100 haploid genome copies of Bt176 were addedto the reaction, the test’s power was determined to be 98.3% when
the P35S promoter originating from the Bt176 event constituted25% of the total P35S quantity. However, the Bt176 event was suc-cessfully detected in only 8.3% of the cases when the ratio of P35Sfrom the Bt176 event compared to total P35S content equaled 4%.The P35S ratios used in this experiment 4–66.67% for Bt176 andMon810 (2 P35S copies per genome) and 1.5–66.67% for T25 (seeTable 4). Better reliability of detection of the unknown GMO wasin all cases achieved at the highest percentage of P35S originating

Table 5Results of detection of a nonauthorized GMO for design 4
GMO DNA quantity (copy number) Number of samples Number of samples detected % Samples detected Simulation’s results of the power of the test (%)
Bt176 100 6 5 83 67.4400 9 9 100 95
1600 7 7 100 100Mon810 100 6 5 83 61
400 9 9 100 90.81600 7 7 100 99.8
T25 100 3 1 33 41.6400 9 9 100 89.3
1600 12 12 100 94.2
196 Detection of nonauthorized GMOs by dQ-PCR / K. Cankar et al. / Anal. Biochem. 376 (2008) 189–199
from the unknown sample (Fig. 3). The limit of detection for non-authorized GM events was shown to be 10–20% of the total P35Scontent, except in reactions where only 100 copies of the haploidgenome of unknown GMO were added. The limit of detection forunknown GM lines in this case is higher because detection of un-known GM events is observed when the percentage of its commonelement equaled 20% or more of the total amount of the commonelement (see Fig. 3).
Lower success of detection was also observed for GM event T25.At 400 haploid genome copies of target amplicon, the Bt176 andMon810 events were successfully detected at the 10% P35S contentlevel and the T25 event was detected at the 10–20% level. The low-er success of detection of the T25 event results from its content ofone P35S copy per haploid genome compared to two copies of P35Sin Bt176 and Mon810 events, as explained previously.
We have therefore confirmed that the dQ-PCR can be reliablyused to detect the presence of nonauthorized GMOs in a mixtureof GM events, in particular at low copy numbers.
Detection of unknown GMOs in presence of CaMV
The positive result of the screening method for P35S promotercan originate from either the presence of a GMO event or the pres-
0 200 600 1000
040
080
0
a) Estimationfor Bt176
True values
Estim
ated
val
ues
0 200
040
080
012
00
b) Esfor
Tru
Estim
ated
val
ues
1000 3000 5000
1000
3000
5000
d) Estimation for P35S
True values
Est
imat
ed v
alue
s
200 400
050
015
00
e) Esfor
Tru
Estim
ated
val
ues
Fig. 4. Correlations of true and calculated copy numbers of target sequences in mixturesand DNA copy numbers added to the reaction for (a) Bt176 event, (b) Mon810 event, (c
ence of CaMV in the sample; therefore, a plasmid containing theentire CaMV genome was added to DNA mixtures in further exper-iments in combination with DNA of maize GM events Bt176,Mon810 and T25. The performance of the dQ-PCR method to detectthe presence of the virus in a sample was first tested. Real-timePCR was performed on 16 mixtures that contained 0, 100, and1000 copies of the CaMV plasmid and haploid genomes of Bt176,Mon810, and T25 (Table 2). The null hypothesis was tested, as de-scribed before, with the additional estimation of CaMV genomecopies. Q-PCRs were performed at low target copy numbers toevaluate the performance of the method at the limit of detectionbecause no or very few virus contents are observed in enforcementlaboratories (virus non-host plants or diseased host plants withlow kernel production as a result of agricultural practices).
Good correlation between the experimentally estimated copynumbers and the true target copy number per reaction was ob-served (see Fig. 4). Correlations of 99.2% were calculated forBt176 event, 99.3% for Mon810 event, 99.8% for T25 event, 97.9%for the P35S promoter, and 89.1% for CaMV target.
In the second step, the hypothesis testing was performed bysuccessively considering each GMO maize line and the CaMV targetsequence as a nonauthorized GMO. The results of the hypothesistesting are summarized in Table 6. At 1000 GMO copies of haploid
600 1000
timationMon810
e values
0 200 600 1000
040
080
0
c) Estimationfor T25
True values
Estim
ated
val
ues
600 800
timation CaMV
e values
of GMOs and CaMV. Correlations of experimentally estimated target copy numbers) T25 event, (d) P35S promoter, and (e) CaMV virus.

Table 6Detection of a nonauthorized GMO in a mixture of GMOs and CaMV
Sample P35S Bt176 Mon810 T25 CaMV
A E A E T % A E T % A E T % A E T %
1 2200 3089 0 0 N 0.0 100 123 N 9.1 1000 953 D 45.5 1000 1576 D 45.52 3100 3625 0 0 N 0.0 1000 1162 D 64.5 100 126 N 3.2 1000 1317 D 32.33 4000 4398 0 0 N 0.0 1000 1082 D 50.0 1000 972 N 25.0 1000 1768 N 25.04 400 521 100 111 D 50.0 0 0 N 0.0 100 106 D 25.0 100 88 D 25.05 2200 3102 100 115 N 9.1 0 0 N 0.0 1000 985 D 45.5 1000 1340 D 45.56 500 592 100 109 D 40.0 100 112 D 40.0 0 0 N 0.0 100 70 N 20.07 1500 2304 100 107 N 13.3 100 120 N 13.3 100 118 N 6.7 1000 1491 D 66.78 2400 3073 100 105 N 8.3 100 116 N 8.3 1000 938 D 41.7 1000 1333 D 41.79 3200 3828 100 114 N 6.2 1000 944 D 62.5 0 0 N 0.0 1000 1379 D 31.210 3300 3448 100 89 N 6.1 1000 916 D 60.6 100 107 N 3.0 1000 1219 D 30.311 4200 5013 100 123 N 4.8 1000 1006 D 47.6 1000 1092 N 23.8 1000 1414 D 23.812 4000 5478 1000 1093 D 50.0 0 0 N 0.0 1000 946 D 25.0 1000 1086 D 25.013 3200 4179 1000 814 D 62.5 100 105 N 6.2 0 0 N 0.0 1000 1180 D 31.214 3300 3891 1000 936 D 60.6 100 115 N 6.1 100 101 N 3.0 1000 1404 D 30.315 4200 4705 1000 893 D 47.6 100 104 N 4.8 1000 993 D 23.8 1000 1031 D 23.816 5000 5709 1000 1026 D 40.0 1000 946 D 40.0 0 0 N 0.0 1000 1515 N 20.0
A, actual haploid genome copy number added to the reaction; E, experimentally estimated haploid genome copy number; %, the percentage of P35S promoter originatingfrom GM event relative to total P35S amount; T, result of statistical test of detection of unknown GM line or CaMV, where successful detection is marked by D andunsuccessful detection by N.
Table 7Detection results of a nonauthorized target GMO and transgenic donor organismCaMV in samples
GMO DNA quantity(copy number)
Number ofsamples
Number ofsamples detected
% Samplesdetected
Bt176 100 8 2 251000 5 5 100
Mon810 100 7 1 141000 6 6 100
T25 100 5 1 201000 7 5 71
CaMV 100 2 1 501000 14 12 86
0 10 20 30 40 50 60
040
080
0
a) Detection of Bt176
% Bt176/P35S
Nb
copy
Bt1
76
NNNDN DNNNNN
D DDDD
DN
DetectedNot detected
0 10 20 30 40
040
080
0
c) Detection of T25
% T25/P35S
Nb
copy
T25
D
N
N
D
D
NN
D
NN
ND
NN
D
N
DN
DetectedNot detected
Fig. 5. Detection of a nonauthorized GMA as a factor of P35S content in design 7. The sunumber of individual GM events or CaMV per reaction (y axis) and the percentage of P3
Detection of nonauthorized GMOs by dQ-PCR / K. Cankar et al. / Anal. Biochem. 376 (2008) 189–199 197
genome and 1000 copies of plasmid CaMV, the unknown targetwas reliably detected in 100, 100, 71, and 86% of the DNA mixturesfor Bt176, Mon810, T25, and CaMV, respectively (see Table 7). Thedetection of unknown target was not as reliable at 100 haploidgenome copies, as observed also in design 4.
The experiment was designed to assess the success of CaMVdetection at a wide range of CaMV percentages in the DNA mix-tures (20–66.7% of the total amount of P35S). As expected fromthe study in design 4, the ability to reliably detect an unknown tar-get depended on the relative content of P35S originating from theunknown target vs the total amount of P35S (Fig. 5). We could reli-ably detect the presence of the CaMV virus when it constituted atleast 20–30% of the total P35S content.
0 10 20 30 40 50 60
040
080
0
b) Detection of Mon810
%Mon810/P35S
Nb
copy
Mon
810
N
DD
NNDNN
DDD
NNNN
D
DN
DetectedNot detected
0 20 40 60 80
040
080
0
d) Detection of CaMV
% CaMV/P35S
Nb
copy
CaM
V
DDN
D
D
N
DDDDDD DDDN
DN
DetectedNot detected
ccess of detection of a nonauthorized GMO depended on the haploid genome copy5S promoter originating from this event relative to total P35S amount (x axis).

198 Detection of nonauthorized GMOs by dQ-PCR / K. Cankar et al. / Anal. Biochem. 376 (2008) 189–199
Also, in this experiment, the number of P35S copies per haploidgenome influenced the level of detection (T25 and CaMV vs Bt176and Mon810). Indeed, Bt176 and Mon810 events (which carry twocopies of the target amplicon) were more likely to be detected be-cause they contributed 40% of the total P35S at the 1000 haploidgenome level, where as T25 and CaMV contributed only 20–30%at the same copy number. Results here are a little higher than re-sults in design 4, but in this case the study was focused on CaMVdetection and its relative quantity of P35S.
Limits of dQ-PCR performance
Our study shows that the presence of nonauthorized GMO canbe successfully inferred by comparing absolute quantities of ampli-cons and thus of targeted sequences. The application of a statisticalmodel to assess Q-PCR results is justified here and ensures reliabletest results.
The level of detection for sequences of unknown origin obtainedin our case study depends on both the relative and the absolutequantities of targeted sequences. The limit of detection observedis in accordance with the limits of detection and quantificationinherent to real-time Q-PCR tests.
Although our experiments were performed using a range of lowcopy numbers of target amplicons, we can assume that the dQ-PCRtest would perform reliably using a range of higher copy numbersthat are in the linear range of Q-PCR tests. The choice of performingthe experiments at low copy numbers tests the model under theusual routine conditions that laboratories experience in the searchfor trace amounts of GMO in samples.
As previously shown, an effect of DNA extraction and/or DNAquantification interferes with the performance of the real-timePCR method and consequently with the performance of the dQ-PCR. These effects could be accounted for by data normalizationwith an endogenous reference gene (i.e., Adh in case of maize).However, the introduction of additional endogenous referencegene data in our statistical test would consequently also increasethe variability of our test statistic and potentially decrease the per-formance of the test. Further work should therefore be focused onincorporation of an endogenous gene into the statistical model.Furthermore, as the number of marketed genetically modifiedorganisms with different common elements increases, the modelshould be extended to include multiple common elements perstudy.
Our results also show that the absolute number of GMO ele-ments inserted into the plant genome can be accurately deter-mined by statistical testing of Q-PCR results, as we have shownwith the determination of P35S copy number in the maize GMevents. A potential application could be determining the numberof construct insert copies in newly released GM events. Such testscould be used to determine the presence of additional sequencesdue to the plant transformation located outside the main GMO in-sert and thus could be useful for risk assessment purposes and dos-sier approvals.
Conclusions
Detection of unapproved GMOs in samples is urgently neededas evident since the last unintended release of GMOs such asLLRice601 and Shanyou 63 rice to the market. Several techniquesto assess the presence of unapproved GMOs are currently exam-ined by the Co Extra European research program (http://www.coextra.eu/). However, all methods studied for detection ofnonapproved GMOs require an extensive change of the techniquesused in the analytical laboratories and personnel training. In addi-tion, without statistical methods, they so far generally do not pro-
vide means to assess the quantity (absolute or relative) ofunapproved GMOs. An exception could be observed for qualitativemethods using control plans with multiple attributes (see for in-stance the OPACSA software: URL: http://www.coextra.eu/researchlive/reportage851.html).
This paper presents the fastest, simplest, and most directlyapplicable approach to the detection of nonauthorized GMOs tak-ing into account both the methods currently in use in analyticallabs and the need to provide quantitative data in a cost- andtime-effective way. Among the several detection strategies of un-known GMOs (matrix approach, profiling, etc.), we favored the ap-proach whose low costs should facilitate its practicalimplementation in laboratories by using currently available meth-ods and equipment. The method enables the detection of nonau-thorized GMOs that contain common sequences in mixedsamples. The method requires a previous knowledge of possiblecommon sequences present but does not require specific target se-quence knowledge of the potential nonauthorized GMOs beingscreened. The applicability of this strategy was successfully testedin the case of maize with the very commonly used P35S screeningmethod. However, the statistical model can be easily transposed toother screening sequences such as tNOS terminator and genes ofinterest (e.g., epsps, cry).
We must emphasize that, according to the matrix approach (asdefined in 1999 by Y. Bertheau in the GMOchips European researchprogram), the absence of statistically different numbers of se-quences copies, even the most frequently used, does not provethe absence of unapproved/unknown GMOs because numerous se-quences are used in the commercial GMOs.
Application of the differential quantitative PCR required adevelopment of a statistical model using an R-based program,which will be made available later through the Co-Extra web site.The developed program provides both the results on content ofknown GMO in the sample and the statistical interpretation ofthe result (i.e., the indication of the presence of nonauthorizedGMOs). The acceptability level can be easily changed accordingto the aim of the analysis and the nature of the suspected GMO(e.g., according to the expected safety risk level or severity of theauthorities). Different levels could for example be set for GMOsauthorized in other countries for nonauthorized GMOs for whichthe safety was not assessed. The dQ-PCR method could also easilybe applied to a wider scope of testing than GMO detection, forexample, to the detection of pathogens, allergens, or mycotoxin–producing organisms which could easily be targeted by our detec-tion strategy.
Acknowledgments
This study was financially supported by the European Commis-sion through the Integrated Project Co-Extra, Contract No. 007158,under the 6th Framework Programme, priority 5, food quality andsafety and Slovenian-French cooperation (PROTEUS). This is grate-fully acknowledged. The PhD study of Katarina Cankar was sup-ported by the Slovenian Ministry of Science, Education and Sport.We thank M. Romaniuk for technical support.
Appendix A:. Supplementary material
Supplementary data associated with this article can be found, inthe online version, at doi:10.1016/j.ab.2008.02.013.
References
[1] C. James, Executive Summary of Global Status of Commercialized Biotech/GMCrops: 2005. ISAAA Briefs No. 34. ISAAA: Ithaca, NY.
[2] Agbios GM database (http://www.agbios.com/).

Detection of nonauthorized GMOs by dQ-PCR / K. Cankar et al. / Anal. Biochem. 376 (2008) 189–199 199
[3] European Commission. Regulation (EC) No. 1829/2003 of the EuropeanParliament and of the Council of 22 September 2003 on genetically modifiedfood and feed. Off. J. Eur. Union 2003, L 268, 1-23.
[4] M. Hernandez, D. Rodriguez-Lazaro, A. Ferrando, Current Methodology forDetection, Identification and Quantification of Genetically ModifiedOrganisms, Curr. Anal. Chem. 1 (2005) 203–221.
[5] European Commission. Commission Regulation (EC) No. 641/2004 of 6 April2004 on detailed rules for the implementation of Regulation (EC) No. 1829/2003 of the European Parliament and of the Council as regards the applicationfor the authorisation of new genetically modified food and feed, thenotification of existing products and adventitious or technically unavoidablepresence of genetically modified material which has benefited from afavourable risk evaluation. Off. J. Eur. Union 2004, L 102, 14-25.
[6] E. Dorey, Taco dispute underscores need for standardized tests, Nat.Biotechnol. 18 (2000) 1136–1137.
[7] J.L. Fox, EPA re-evaluates StarLink license, Nat. Biotechnol. 19 (2001) 11.[8] A. Cockburn, Commercial plant breeding: What is in the biotech pipeline?, J
Commer. Biotechnol. 10 (2004) 209–223.[9] The Pew Initiative on Food and Biotechnology, Harvest on Horizon: Future
Uses Of Agricultural Biotechnology. University of Richmond, VA, September2001.
[10] G. Vogel, Tracing the transatlantic spread of GM rice, Science 313 (2006) 1714.[11] H.J.M. Aarts, J.P.Fv. Rie, E.J. Kok, Traceability of genetically modified organisms,
Expert Rev. Mol. Diagn. 2 (2002) 69–77.[12] D. Made, C. Degner, L. Grohmann, Detection of genetically modified rice: a
construct-specific real-time PCR method based on DNA sequences fromtransgenic Bt rice, Eur. Food Res. Technol. 224 (2006) 271–278.
[13] A. Germini, S. Rossi, A. Zanetti, R. Corradini, C. Fogher, R. Marchelli R,Development of a peptide nucleic acid array platform for the detection ofgenetically modified organisms in food, J. Agric. Food Chem. 53 (2005) 3958–3962.
[14] E.J. Kok, H.J. Aarts, A.M. Van Hoef, H.A. Kuiper, DNA methods: critical review ofinnovative approaches, J. AOAC Int. 85 (2002) 797–800.
[15] S. Leimanis, M. Hernández, S. Fernández, F. Boyer, M. Burns, S. Bruderer, T.Glouden, N. Harris, O. Kaeppeli, P. Philipp, M. Pla, P. Puigdomènech, M.Vaitilingom, Y. Bertheau, J. Remacle, A Microarray-based Detection System forGenetically Modified (GM) Food Ingredients, Plant Mol. Biol. 61 (2006) 123–139.
[16] H. Nesvold, A.B. Kristoffersen, A. Holst-Jensen, K.G. Berdal, Design of a DNAchip for detection of unknown genetically modified organisms (GMOs),Bioinformatics 21 (2005) 1917–1926.
[17] C. Wolf, M. Scherzinger, A. Wurz, U. Pauli, P. Hübner, J. Lüthy, Detection ofcauliflower mosaic virus by the polymerase chain reaction: testing of foodcomponents for false-positive 35S-promoter screening results, Eur. Food Res.Technol. 210 (2000) 367–372.
[18] K. Cankar, M. Ravnikar, J. Zel, N. Toplak, K. Gruden, Real-time polymerase chainreaction detection of cauliflower mosaic virus to complement the 35Sscreening assay for genetically modified organisms, J. AOAC Int. 88 (2005)814–822.
[19] A. Franck, H. Guilley, G. Jonard, K. Richards, L. Hirth, Nucleotide sequence ofcauliflower mosaic virus DNA, Cell 21 (1980) 285–294.
[20] A. Holck, M. Vaïtilingom, L. Didierjean, K. Rudi, 50-Nuclease PCR forquantitative event-specific detection of the genetically modified Mon810maize, Eur. Food Res. Technol. 214 (2002) 449–453.
[21] C. Collonnier, A. Schattner, G. Berthier, F. Boyer, G. Coue-Philippe, A. Diolez,M.N. Duplan, S. Fernandez, N. Kebdani, A. Kobilinsky, M. Romaniuk, M. deBeuckeleer, M. de Loose, P. Windels, Y. Bertheau, Characterization and EventSpecific detection by Quantitative Real-Time PCR of T25 Maize Insert, J. AOACInt. 88 (2005) 536–546.
[22] M. Hernandez, M.N. Duplan, G. Berthier, M. Vaitilingom, W. Hauser, R. Freyer,M. Pla, Y. Bertheau, Development and comparison of four real-timepolymerase chain reaction systems for specific detection and quantificationof Zea mays L, J. Agric. Food Chem. 52 (2004) 4632–4637.
[23] S. Fernandez, C. Charles-Delobel, A. Geldreich, G. Berthier, F. Boyer, C.Collonnier, G. Coue-Philippe, A. Diolez, M.N. Duplan, N. Kebdani, M.Romaniuk, M. Feinberg, Y. Bertheau, Quantification of the P35S Promotor inDNA extracts from Genetically Modified Organisms using Real-TimePolymerase Chain Reaction and Specificity assessment on variousGenetically Modified Organisms, Part I: Operating Procedure, J. AOAC Int. 88(2005) 547–557.
[24] D.J. Finney, Statistical method in biological assay, Griffin, London, 1971.[25] A.W. Van Der Vaart, Asymptotic Statistics, Cambridge University Press,
1998.[26] R Development Core Team: R: A Language and Environment for Statistical
Computing (manual). R Foundation for Statistical Computing, Vienna, Austria2005 ({ISBN} 3-900051-07-0, http://www.R-project.org).
[27] S. Bruderer, K.E. Leitner, Genetically Modified (GM) Crops: molecular andregulatory details, Basel, Švica, BATS, Centre for biosafety and sustainability(http://www.bats.ch/gmo-watch/) 2003.
[28] D.M. Bates, D.G. Watts, Nonlinear Regression Analysis and Its Applications,Wiley, 1988.