Measurements with Arduino – Ing. Paolo Guidorzi
164
MEASUREMENTS WITH ARDUINO Ing. Paolo Guidorzi
-
Upload
khangminh22 -
Category
Documents
-
view
0 -
download
0
Transcript of Measurements with Arduino – Ing. Paolo Guidorzi

MEASUREMENTS WITH ARDUINO
Ing. Paolo Guidorzi

MEASUREMENTS WITH ARDUINOpage 2
Topics covered
- Introduction: what is Arduino
- Embedded systems, microcontrollers, sensors, home automation...
- Ohm's law, resistors, LEDs, opamp, sensors, I2C and SPI protocols
- Arduino : hardware, firmware, software (the "sketch"), the community
- Arduino and the outside world: analog and digital ports, the serial interface
- Sampling Theorem, Nyquist frequency, Antialiasing filters
- Arduino's programming language and its development environment
- The first experiments, breadboards, Prototype Board, PCB
- Reading the value of a potentiometer
- From the value of a potentiometer to the PWM output
- Brightness of an LED
- Continuously variable PWM output
- From the PWM signal to a direct voltage. «Poor man DAC»
- Using a button. Pull-up and pull-down resistors
- The voltage divider
- Resistive sensors: The photocell
- Resistive sensors: GAS sensor
Measurements with Arduino – Ing. Paolo Guidorzi

- The temperature sensor LM35 (analog)
- The thermocouple K temperature sensor (MAX6675 digital interface)
- The temperature and humidity sensors DHT11 / DHT22 (digital interface)
- The temperature sensor DS18B20 (1-Wire digital interface)
- Serial 7-segment display
- Color TFT graphic display (2.8") using Arduino UNO
- Connection of another TFT graphic display (1.8") using Arduino UNO
- Connection of another TFT graphic display (2.2") using Arduino MEGA2560
- External DAC and ADC converters
- Temperature and pressure sensor
- Bidirectional data communication between Arduino and computer (via serial port)
- Data communication from smartphone to Arduino via Bluetooth
- Using of a Multiplexer
- Example of a complete realization: the electronic nose:
- Graphic display
- 16 bit ADC - Humidity temperature pressure sensor
- Data storage on microSD and real-time clock
- Multiplexer
- Gas sensors
MEASUREMENTS WITH ARDUINOpage 3
Measurements with Arduino – Ing. Paolo Guidorzi

- Arduino is a rapid prototyping tool that allows to create small stand-
alone interactive systems.
- It was created for artists, designers, scholars, researchers or anyone
who needs a smart tool for a specific application.
- Both the Arduino hardware and software are open source, and many
ready-made projects can be freely found online (for example on the
www.arduino.cc and www.arduino.org sites)
- It is easy to use, you don't need to be an electronic engineer
MEASUREMENTS WITH ARDUINOIntroduction page 4
Measurements with Arduino – Ing. Paolo Guidorzi

- It is programmed from computer with a language similar to C
- It has various inputs and outputs (digital and analog)
- It can be expanded using the so-called Shields, which expand the
possibilities of use and interfacing with other devices and sensors
- Custom expansions for particular uses can be created by users
MEASUREMENTS WITH ARDUINOIntroduction page 5
Measurements with Arduino – Ing. Paolo Guidorzi

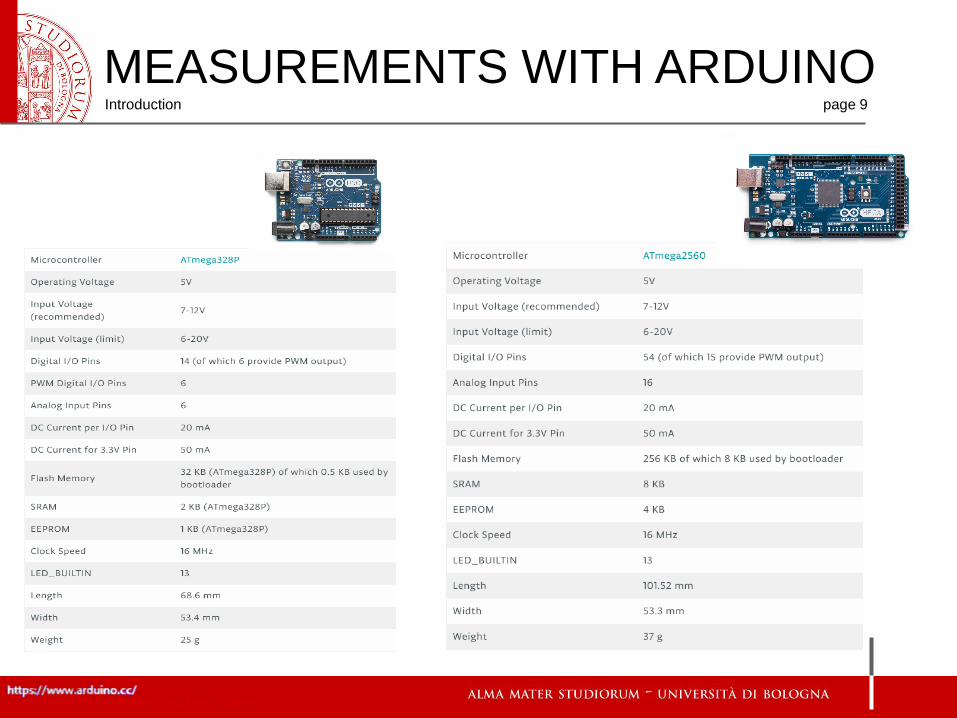
There are many versions of Arduino, with different numbers of inputs
and outputs and different computing powers. They all share the same
programming language and environment.
Arduino UNO:
MEASUREMENTS WITH ARDUINOIntroduction page 6
Measurements with Arduino – Ing. Paolo Guidorzi

Arduino MEGA2560:
MEASUREMENTS WITH ARDUINOIntroduction page 7
Measurements with Arduino – Ing. Paolo Guidorzi

Arduino DUE:
MEASUREMENTS WITH ARDUINOIntroduction page 8
Measurements with Arduino – Ing. Paolo Guidorzi
MEASUREMENTS WITH ARDUINOIntroduction page 9
Measurements with Arduino – Ing. Paolo Guidorzi

MEASUREMENTS WITH ARDUINOIntroduction page 10

MEASUREMENTS WITH ARDUINOIntroduction page 11
Measurements with Arduino – Ing. Paolo Guidorzi

MEASUREMENTS WITH ARDUINOIntroduction page 12
Measurements with Arduino – Ing. Paolo Guidorzi

Hardware e software open source..
MEASUREMENTS WITH ADRUINOIntroduction page 13
Measurements with Arduino – Ing. Paolo Guidorzi

Arduino was born in 2005 from another platform for simplified
prototyping, Wiring, created for non-experts, by Hernando Barragan, of
which Massimo Banzi, creator of Arduino, was a supervisor.
Massimo Banzi, David Cuartielles,
David Mellis, Tom Igoe, Gianluca
Martino
The name Arduino comes from
the name of a café in Ivrea where
the team met in their free time.
Arduino d'Ivrea was king of Italy
from 1002 to 1014
MEASUREMENTS WITH ARDUINOIntroduction page 14
Measurements with Arduino – Ing. Paolo Guidorzi

Who are Arduino users?
Makers are interesting people: they are not nerds, they are
rather cool guys who are interested in technology, design,
art, sustainability, alternative business models. They live on
online communities, open source software and hardware
but also on the dream of inventing something to produce on
their own, to live off their own inventions. In a time of crisis
they invent their work instead of looking for a classic one.
(from an interview with Massimo Banzi on Wired)
MEASUREMENTS WITH ARDUINOIntroduction page 15
Measurements with Arduino – Ing. Paolo Guidorzi
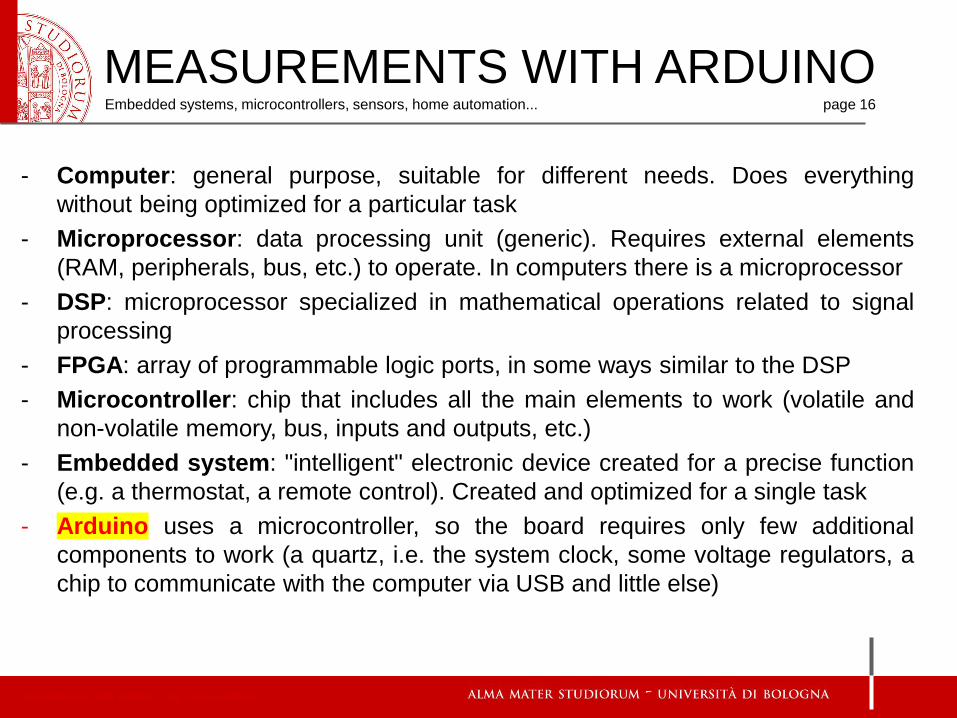
- Computer: general purpose, suitable for different needs. Does everything
without being optimized for a particular task
- Microprocessor: data processing unit (generic). Requires external elements
(RAM, peripherals, bus, etc.) to operate. In computers there is a microprocessor
- DSP: microprocessor specialized in mathematical operations related to signal
processing
- FPGA: array of programmable logic ports, in some ways similar to the DSP
- Microcontroller: chip that includes all the main elements to work (volatile and
non-volatile memory, bus, inputs and outputs, etc.)
- Embedded system: "intelligent" electronic device created for a precise function
(e.g. a thermostat, a remote control). Created and optimized for a single task
- Arduino uses a microcontroller, so the board requires only few additional
components to work (a quartz, i.e. the system clock, some voltage regulators, a
chip to communicate with the computer via USB and little else)
MEASUREMENTS WITH ARDUINOEmbedded systems, microcontrollers, sensors, home automation... page 16
Measurements with Arduino – Ing. Paolo Guidorzi

When to use a general purpose device (computer) and when a specialized one
(embedded system) like Arduino?
- Portability
- Special needs
- Miniaturization
- Energy Efficiency
Other examples of small embedded systems commonly used by hobbyists and experimenters:
Raspberry Teensy PIC
MEASUREMENTS WITH ARDUINOEmbedded systems, microcontrollers, sensors, home automation... page 17
Partially compatible with
Arduino (but much more
powerful)!
Measurements with Arduino – Ing. Paolo Guidorzi

MEASUREMENTS WITH ARDUINOEmbedded systems, microcontrollers, sensors, home automation... page 18
Measurements with Arduino – Ing. Paolo Guidorzi

Ohm's Law V = R * I
V Volt
I Ampere
R Ohm
I (current)
V (voltage)
R (resistance)
MEASUREMENTS WITH ARDUINOOhm's law, resistors, LEDs, opamp, sensors, I2C and SPI protocols page 19
Measurements with Arduino – Ing. Paolo Guidorzi
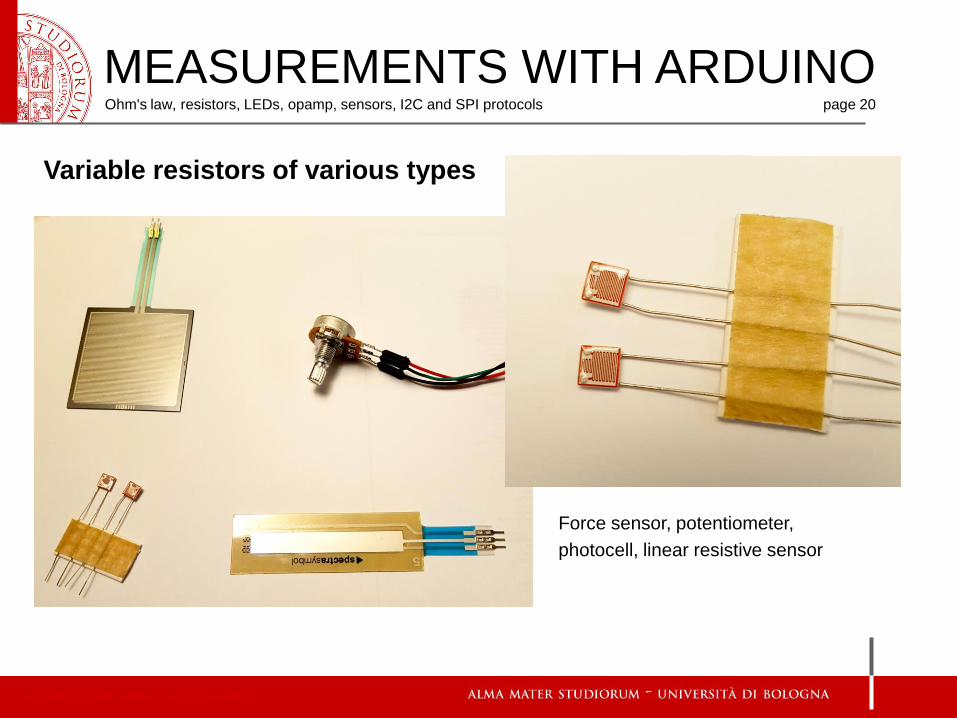
Variable resistors of various types
Force sensor, potentiometer,
photocell, linear resistive sensor
MEASUREMENTS WITH ARDUINOOhm's law, resistors, LEDs, opamp, sensors, I2C and SPI protocols page 20
Measurements with Arduino – Ing. Paolo Guidorzi

LED (Light-Emitting Diode)
- It's a diode
- The current runs through it
only in one direction
- The current must be limited
using a resistance in series
MEASUREMENTS WITH ARDUINOOhm's law, resistors, LEDs, opamp, sensors, I2C and SPI protocols page 21
Measurements with Arduino – Ing. Paolo Guidorzi
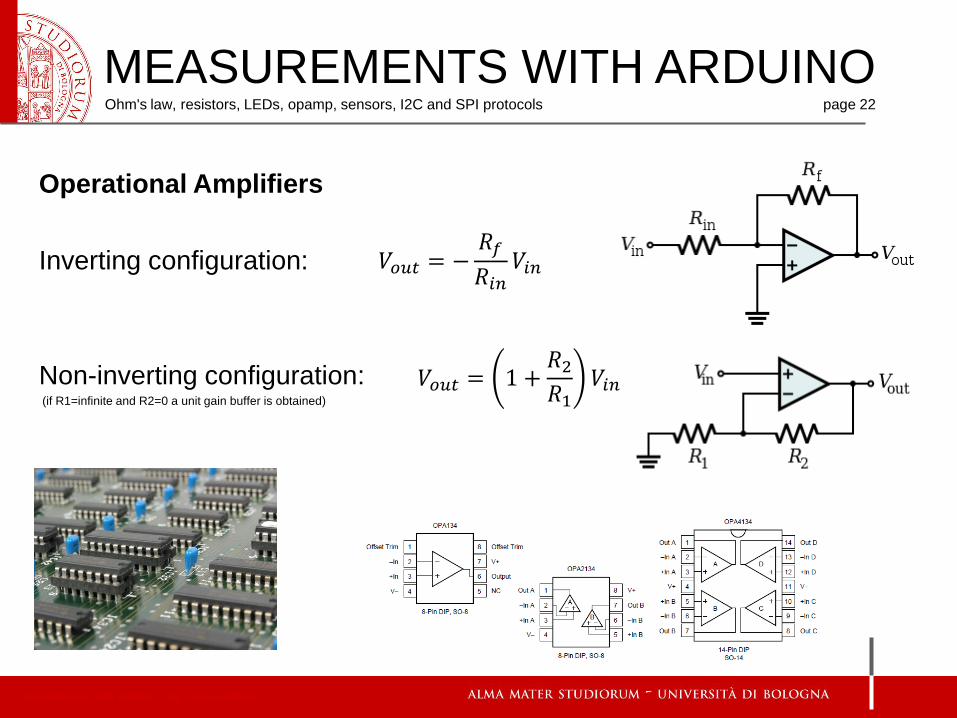
Operational Amplifiers
Inverting configuration:
Non-inverting configuration:(if R1=infinite and R2=0 a unit gain buffer is obtained)
𝑉𝑜𝑢𝑡 = −𝑅𝑓
𝑅𝑖𝑛𝑉𝑖𝑛
𝑉𝑜𝑢𝑡 = 1 +𝑅2𝑅1
𝑉𝑖𝑛
MEASUREMENTS WITH ARDUINOOhm's law, resistors, LEDs, opamp, sensors, I2C and SPI protocols page 22
Measurements with Arduino – Ing. Paolo Guidorzi

Gas sensors (analog)
MEASUREMENTS WITH ARDUINOOhm's law, resistors, LEDs, opamp, sensors, I2C and SPI protocols page 23
Measurements with Arduino – Ing. Paolo Guidorzi
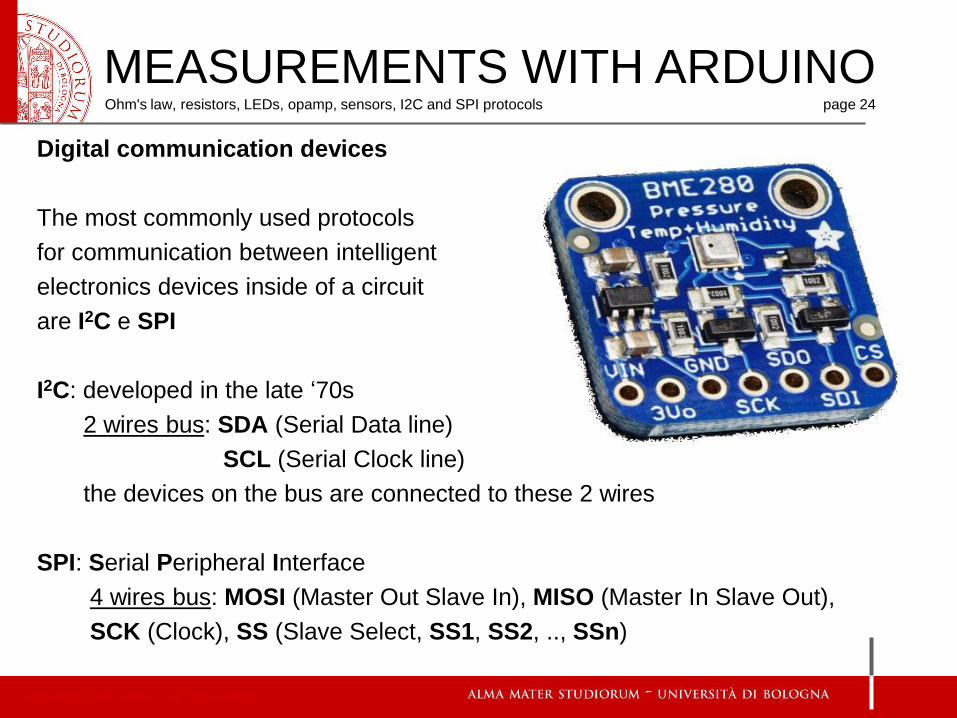
Digital communication devices
The most commonly used protocols
for communication between intelligent
electronics devices inside of a circuit
are I2C e SPI
I2C: developed in the late ‘70s
2 wires bus: SDA (Serial Data line)
SCL (Serial Clock line)
the devices on the bus are connected to these 2 wires
SPI: Serial Peripheral Interface
4 wires bus: MOSI (Master Out Slave In), MISO (Master In Slave Out),
SCK (Clock), SS (Slave Select, SS1, SS2, .., SSn)
MEASUREMENTS WITH ARDUINOOhm's law, resistors, LEDs, opamp, sensors, I2C and SPI protocols page 24
Measurements with Arduino – Ing. Paolo Guidorzi

http://howtomechatronics.com/tutorials/arduino/how-i2c-communication-works-and-how-to-use-it-with-arduino/
BUS I2C
MEASUREMENTS WITH ARDUINOOhm's law, resistors, LEDs, opamp, sensors, I2C and SPI protocols page 25
Measurements with Arduino – Ing. Paolo Guidorzi
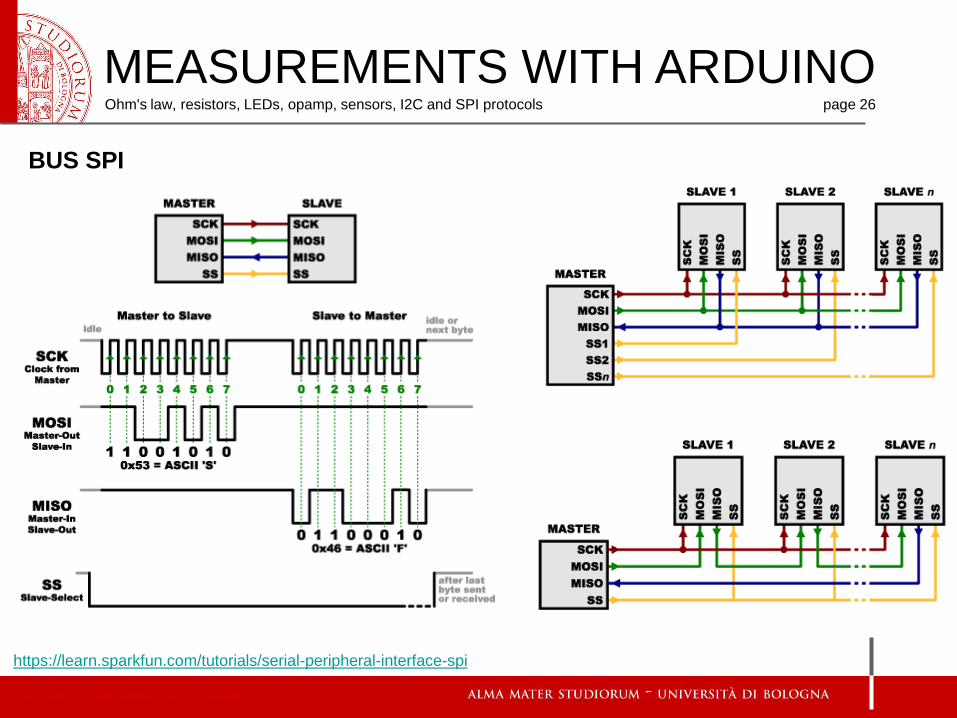
https://learn.sparkfun.com/tutorials/serial-peripheral-interface-spi
BUS SPI
MEASUREMENTS WITH ARDUINOOhm's law, resistors, LEDs, opamp, sensors, I2C and SPI protocols page 26
Measurements with Arduino – Ing. Paolo Guidorzi

Comparison between BUS I2C and BUS SPI
- Both are Master / Slave type. The Master always starts communication
- I2C uses 2 wires: SDA (Serial Data line) and SCL (Serial Clock line).
It's relatively slow (100-400 kHz)
There may be multiple Masters and Slaves on the line
- SPI uses 4+ wires: MOSI (Master Out Slave In), MISO (Master In Slave Out),
SCK (Clock), SS (Slave Select, SS1, SS2, .., SSn).
It's fast, it can go up to 25 MHz
One Master and multiple Slaves
MEASUREMENTS WITH ARDUINOOhm's law, resistors, LEDs, opamp, sensors, I2C and SPI protocols page 27
Measurements with Arduino – Ing. Paolo Guidorzi
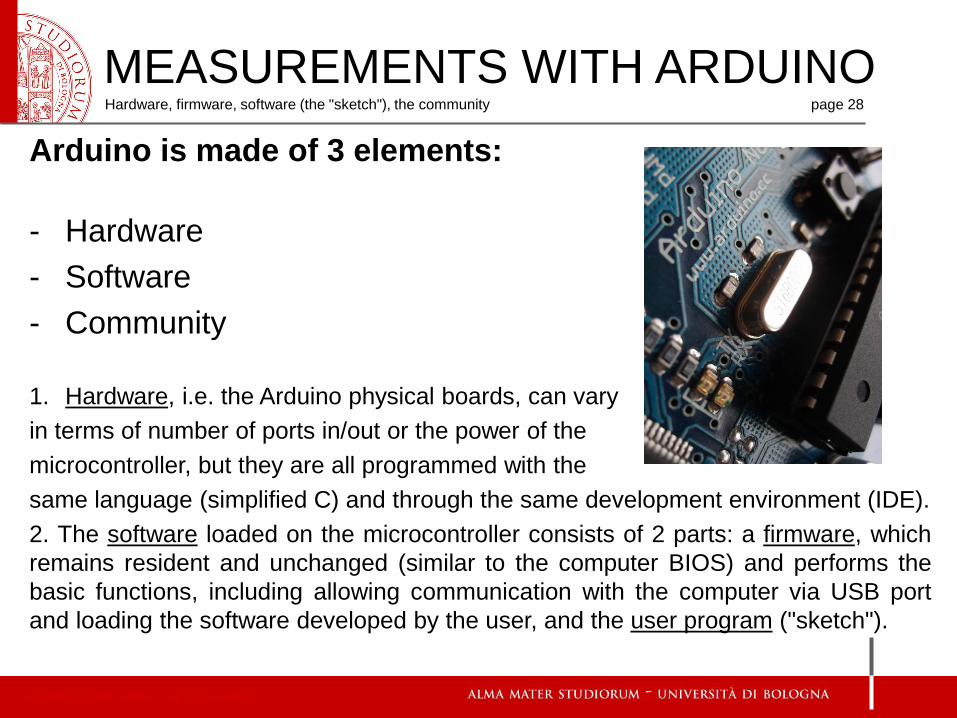
Arduino is made of 3 elements:
- Hardware
- Software
- Community
1. Hardware, i.e. the Arduino physical boards, can vary
in terms of number of ports in/out or the power of the
microcontroller, but they are all programmed with the
same language (simplified C) and through the same development environment (IDE).
2. The software loaded on the microcontroller consists of 2 parts: a firmware, which
remains resident and unchanged (similar to the computer BIOS) and performs the
basic functions, including allowing communication with the computer via USB port
and loading the software developed by the user, and the user program ("sketch").
MEASUREMENTS WITH ARDUINOHardware, firmware, software (the "sketch"), the community page 28
Measurements with Arduino – Ing. Paolo Guidorzi

3. The community is Arduino's real strength. The repository of other users'
projects and the forum of the official website are good starting points not to start
from scratch. The open source philosophy of the whole Arduino ecosystem
pushes and invites the user to share in an open and free way (with various types
of licenses) his projects with the whole community. Moreover, the development
environment (the "IDE" of Arduino) already includes thousands of working
examples.
MEASUREMENTS WITH ARDUINOHardware, firmware, software (the "sketch"), the community page 29
Measurements with Arduino – Ing. Paolo Guidorzi

Arduino UNO connections to and from the outside world
MEASUREMENTS WITH ARDUINOHardware, firmware, software (the "sketch"), the community page 30
Measurements with Arduino – Ing. Paolo Guidorzi

www.pighixxx.com
MEASUREMENTS WITH ARDUINOHardware, firmware, software (the "sketch"), the community page 31
Measurements with Arduino – Ing. Paolo Guidorzi

www.pighixxx.com
MEASUREMENTS WITH ARDUINOHardware, firmware, software (the "sketch"), the community page 32
Measurements with Arduino – Ing. Paolo Guidorzi

Arduino, in addition to communicating with the outside world through its ports, analog and digital (possibly
connected to other devices such as displays, sensors, transducers, relays, ..), can also exchange data
with the computer through its serial port (via USB). This function is often used when debugging the
sketch, to display variable values or processing status.
https://create.arduino.cc/projecthub/wesee/project-kool-temperature-and-humidity-remote-monitoring-e5ddae
MEASUREMENTS WITH ARDUINOHardware, firmware, software (the "sketch"), the community page 33
Measurements with Arduino – Ing. Paolo Guidorzi
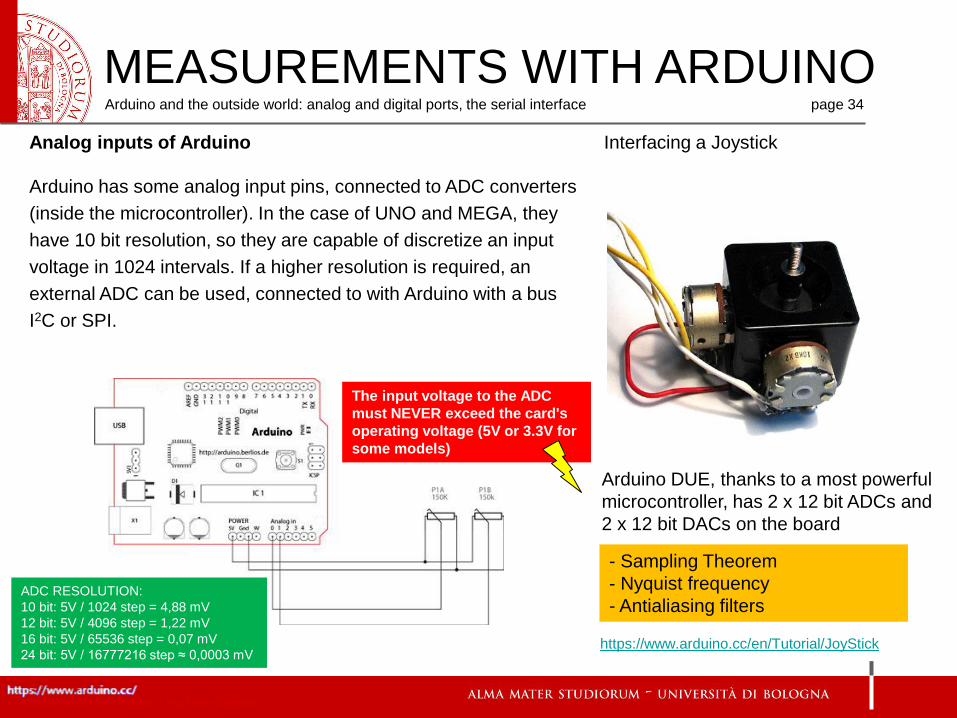
Analog inputs of Arduino Interfacing a Joystick
Arduino has some analog input pins, connected to ADC converters
(inside the microcontroller). In the case of UNO and MEGA, they
have 10 bit resolution, so they are capable of discretize an input
voltage in 1024 intervals. If a higher resolution is required, an
external ADC can be used, connected to with Arduino with a bus
I2C or SPI.
https://www.arduino.cc/en/Tutorial/JoyStick
Arduino DUE, thanks to a most powerful
microcontroller, has 2 x 12 bit ADCs and
2 x 12 bit DACs on the board
- Sampling Theorem
- Nyquist frequency
- Antialiasing filters
The input voltage to the ADC
must NEVER exceed the card's
operating voltage (5V or 3.3V for
some models)
ADC RESOLUTION:
10 bit: 5V / 1024 step = 4,88 mV
12 bit: 5V / 4096 step = 1,22 mV
16 bit: 5V / 65536 step = 0,07 mV
24 bit: 5V / 16777216 step ≈ 0,0003 mV
MEASUREMENTS WITH ARDUINOArduino and the outside world: analog and digital ports, the serial interface page 34
Measurements with Arduino – Ing. Paolo Guidorzi

Arduino digital inputs and outputs
All Arduino models have some digital and analog inputs
and outputs. The number and type of these inputs
depends on the Arduino model. For example:
Arduino UNO
- 14 digital ports (6 PWM), configurable as IN or OUT
- 6 A/D converters with 10 bit resolution (1024 values)
Arduino Mega2560
- 54 digital ports (15 PWM), configurable as IN or OUT
- 16 A/D converters with 10 bit resolution (1024 values)
Arduino DUE
- 56 digital ports (12 PWM), configurable as IN or OUT
- 12 A/D converters with 12 bit resolution (4096 values)
- 2 D/A converters with 12 bit resolution (4096 values)
MEASUREMENTS WITH ARDUINOArduino and the outside world: analog and digital ports, the serial interface page 35
- Sampling Theorem
- Nyquist frequency
- Antialiasing filters
Measurements with Arduino – Ing. Paolo Guidorzi

Electrically, the digital input and output levels correspond to values of
voltage of 5 V (or 3.3 V for some Arduino models) for the HIGH level
and 0 V for LOW level. There are actually tolerance ranges above
and below to which the logical values HIGH and LOW are recognized:
http://www.maffucci.it/2014/11/05/livelli-logici-ttl-e-cmos-cosa-si-nasconde-dietro-un-high-o-low-di-una-digitalwrite-di-arduino/
TTL
CMOS ARDUINO (5V)
MEASUREMENTS WITH ARDUINOArduino and the outside world: analog and digital ports, the serial interface page 36
Measurements with Arduino – Ing. Paolo Guidorzi
Acceptable
voltage
INPUT levels
for TTL
Acceptable
voltage
OUTPUT levels
for TTL

http://www.maffucci.it/2014/11/05/livelli-logici-ttl-e-cmos-cosa-si-nasconde-dietro-un-high-o-low-di-una-digitalwrite-di-arduino/
TTL CMOS ARDUINO (5V)
MEASUREMENTS WITH ARDUINOArduino and the outside world: analog and digital ports, the serial interface page 37
Measurements with Arduino – Ing. Paolo Guidorzi
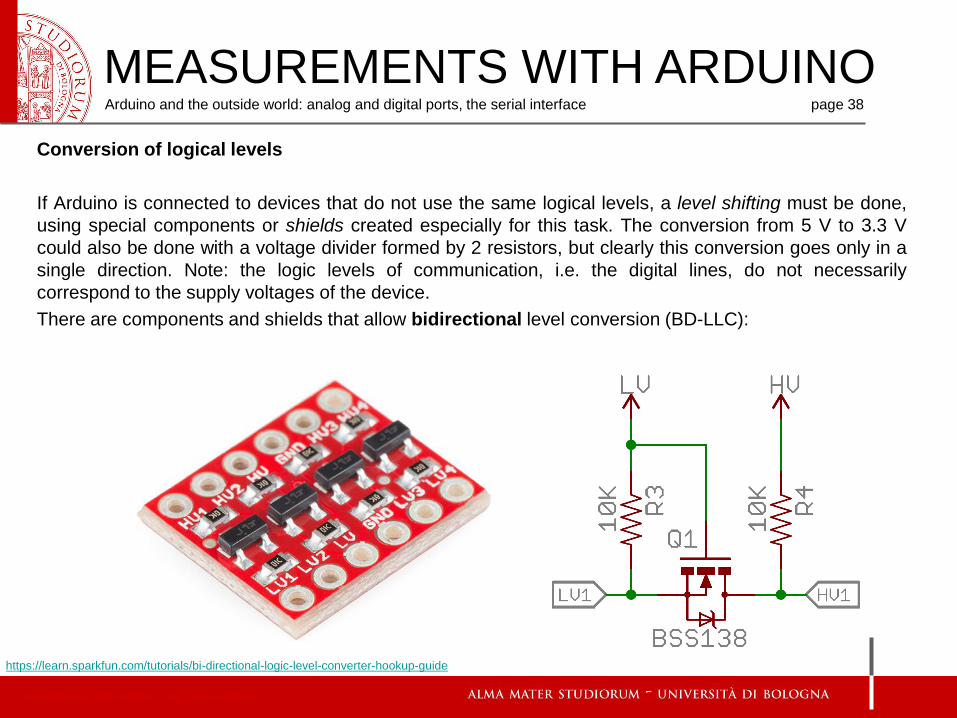
Conversion of logical levels
If Arduino is connected to devices that do not use the same logical levels, a level shifting must be done,
using special components or shields created especially for this task. The conversion from 5 V to 3.3 V
could also be done with a voltage divider formed by 2 resistors, but clearly this conversion goes only in a
single direction. Note: the logic levels of communication, i.e. the digital lines, do not necessarily
correspond to the supply voltages of the device.
There are components and shields that allow bidirectional level conversion (BD-LLC):
https://learn.sparkfun.com/tutorials/bi-directional-logic-level-converter-hookup-guide
MEASUREMENTS WITH ARDUINOArduino and the outside world: analog and digital ports, the serial interface page 38
Measurements with Arduino – Ing. Paolo Guidorzi

This shield board (and similar ones) convert the levels from 5 V logic to 3.3 V logic and vice versa.
The high voltage (5 V), low voltage (3.3 V) and ground must be connected to the board. The incoming 5 V
logic levels from HVn ports are converted to 3.3 V logic levels at LVn ports, and the incoming 3.3 V logic
levels from LVn ports are converted to 5 V logic levels at HVn ports. In this example there are 4 ports
available.
https://learn.sparkfun.com/tutorials/bi-directional-logic-level-converter-hookup-guide
MEASUREMENTS WITH ARDUINOArduino and the outside world: analog and digital ports, the serial interface page 39
Measurements with Arduino – Ing. Paolo Guidorzi

Example of connection between Arduino UNO (5 V logic) and a 3.3 V logic device. Communication from
serial ports (TX0 and RX0). Note that the Arduino also has a pin in which 3.3 V are directly available (to
power any device that requires this voltage).
https://learn.sparkfun.com/tutorials/bi-directional-logic-level-converter-hookup-guide
MEASUREMENTS WITH ARDUINOArduino and the outside world: analog and digital ports, the serial interface page 40
Measurements with Arduino – Ing. Paolo Guidorzi

Example of connection between Arduino UNO (5 V logic) and a 3.3 V logic device. Communication via
SPI protocol. 4 wires are used: MOSI (master out, slave in), MISO (master in, slave out), SCLK (serial
clock) and CS (chip select).
https://learn.sparkfun.com/tutorials/bi-directional-logic-level-converter-hookup-guide
MEASUREMENTS WITH ARDUINOArduino and the outside world: analog and digital ports, the serial interface page 41
Measurements with Arduino – Ing. Paolo Guidorzi

Example of connection between Arduino UNO (5 V logic) and a 3.3 V logic device. Communication via I2C
protocol. In this case the data passing through the 2 wires required by the protocol (SDA and SCL) are
bidirectional, supported by the conversion module.
https://learn.sparkfun.com/tutorials/bi-directional-logic-level-converter-hookup-guide
MEASUREMENTS WITH ARDUINOArduino and the outside world: analog and digital ports, the serial interface page 42
Measurements with Arduino – Ing. Paolo Guidorzi

MEASUREMENTS WITH ARDUINOArduino and the outside world: analog and digital ports, the serial interface page 43
Measurements with Arduino – Ing. Paolo Guidorzi

Sampling Theorem, Nyquist frequency, Antialiasing filters
MEASUREMENTS WITH ARDUINOSampling Theorem, Nyquist frequency, Antialiasing filters page 44
FREQUENCY ANALYSIS
TIME FREQUENCY
time
Time
Time
Time
Frequency
Frequency
Periodic
Random
Impulsive
Signal that changes over time, for
example temperature measurement
Measurements with Arduino – Ing. Paolo Guidorzi

Sampling Theorem, Nyquist frequency, Antialiasing filters
Through a mathematical operation, the Fourier Transform, it is possible to analyze a signal, for
example a sound or the time-varying temperature measurement from a sensor, by analyzing
the spectral content (frequency domain) of the signal (time domain).The Fourier theory states
that a time-varying signal can be represented by the sum of infinite sinusoids, with frequencies
varying from zero to infinity, each with a given amplitude and phase. The amplitudes and
phases of these sinusoids determine the waveform and spectrum of the signal. The spectral
components of a given signal, each associated with a specific frequency, can be calculated,
obtaining complex numbers (modulus and phase or real and imaginary part). In practice, not
being possible to analyze all frequencies from zero to infinity, the analysis is limited to a
restricted portion of frequencies. Fast calculation algorithms for Fourier transform exist: FFT =
Fast Fourier Transform.
MEASUREMENTS WITH ARDUINOSampling Theorem, Nyquist frequency, Antialiasing filters page 45
2( ) [ ( )] ( ) j ftX f F x t x t e dt
−
−
= =
1 2( ) [ ( )] ( )
− +
−
= = j ftx t F X f X f e df
(Direct) Fourier TransformTime Frequency
Inverse Fourier TransformFrequency Time
Time domain
Frequency domain
cos( ) sen( )j te t j t = +
Measurements with Arduino – Ing. Paolo Guidorzi

Similar considerations can be made on sampled signals, discrete in time and amplitude (DFT,
Discrete Fourier Transform). The integrals of the previous formulas become summations and
the continuous signals become discretized. This means that with digital devices a signal
(temporal sequence of data) can be sampled and analysed in the frequency domain (spectral
analysis). The sampled signal can be represented as a sum of sinusoids (harmonics), each
with a frequency multiple of a frequency called fundamental. Each harmonic has a certain
amplitude and phase characteristic.
MEASUREMENTS WITH ARDUINOSampling Theorem, Nyquist frequency, Antialiasing filters page 46
Measurements with Arduino – Ing. Paolo Guidorzi

Approximation of a signal via Fourier Series
MEASUREMENTS WITH ARDUINOSampling Theorem, Nyquist frequency, Antialiasing filters page 47
http://www.jhu.edu/~signals/fourier2/index.html
Measurements with Arduino – Ing. Paolo Guidorzi

Signal and its frequency spectrum
MEASUREMENTS WITH ARDUINOSampling Theorem, Nyquist frequency, Antialiasing filters page 48
=c
f
20 10 5 2 1 0.2 0.1 0.05
10 20 50 100 200 500 1 k 2 k 5 k 10 k
Frequenza, f [Hz]
Lunghezza d’onda, [m]
Frequency
Wavelength
Example: sound wave
c = speed of sound in air
Measurements with Arduino – Ing. Paolo Guidorzi

Signal and its frequency spectrum
MEASUREMENTS WITH ARDUINOSampling Theorem, Nyquist frequency, Antialiasing filters page 49
p Lp
tempo
Frequenza
tempo
tempo
p
p
Lp
FrequenzaLp
Frequenza
1
2 = 1/3 1
f2
= 3f1
f1
f2
f2f1
Frequency
Frequency
Frequency
Time
Time
Time
Example: sound wave
Amplitude
Amplitude
Measurements with Arduino – Ing. Paolo Guidorzi

Time domain and Frequency domain
A variable electrical signal (voltage) at the input of an ADC (Analog to Digital Converter),
coming for example from a sensor that measures a thermodynamic variable such as
temperature or pressure, analyzed for a certain interval of time, has a spectrum that can have
a more or less extended frequency bandwidth, which essentially depends on how fast this
signal changes over time and on the type of variation.
MEASUREMENTS WITH ARDUINOSampling Theorem, Nyquist frequency, Antialiasing filters page 50
Measurements with Arduino – Ing. Paolo Guidorzi
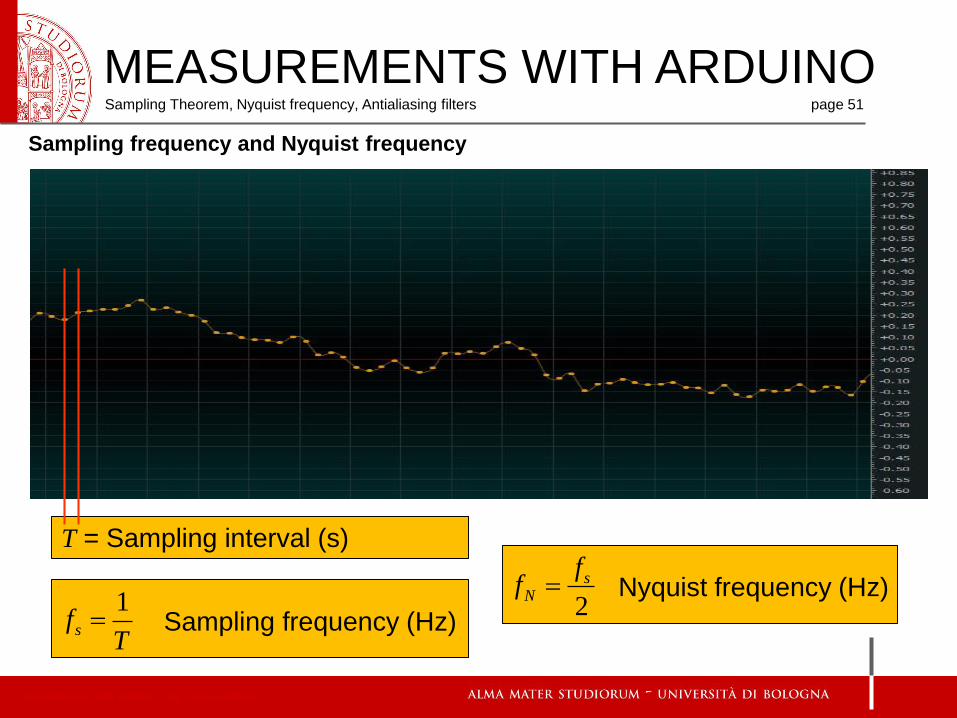
Sampling frequency and Nyquist frequency
MEASUREMENTS WITH ARDUINOSampling Theorem, Nyquist frequency, Antialiasing filters page 51
T = Sampling interval (s)
1sf
T= Sampling frequency (Hz)
2
sN
ff = Nyquist frequency (Hz)
Measurements with Arduino – Ing. Paolo Guidorzi

MEASUREMENTS WITH ARDUINOSampling Theorem, Nyquist frequency, Antialiasing filters page 52
max2
sff
The Nyquist-Shannon Theorem states that to sample a signal at the sampling frequency fs
the signal must have a spectrum with maximum frequency fmax lower than the Nyquist
frequency fN (half of the sampling frequency). Otherwise, the part of the signal spectrum
higher than the Nyquist frequency will "fall" into the sampled spectrum, creating artifacts in the
measured values, the so called aliasing.
If a signal is sampled at a certain sampling frequency, the measurement will have a bandwidth
up to the Nyquist frequency, not beyond this limit.
Measurements with Arduino – Ing. Paolo Guidorzi
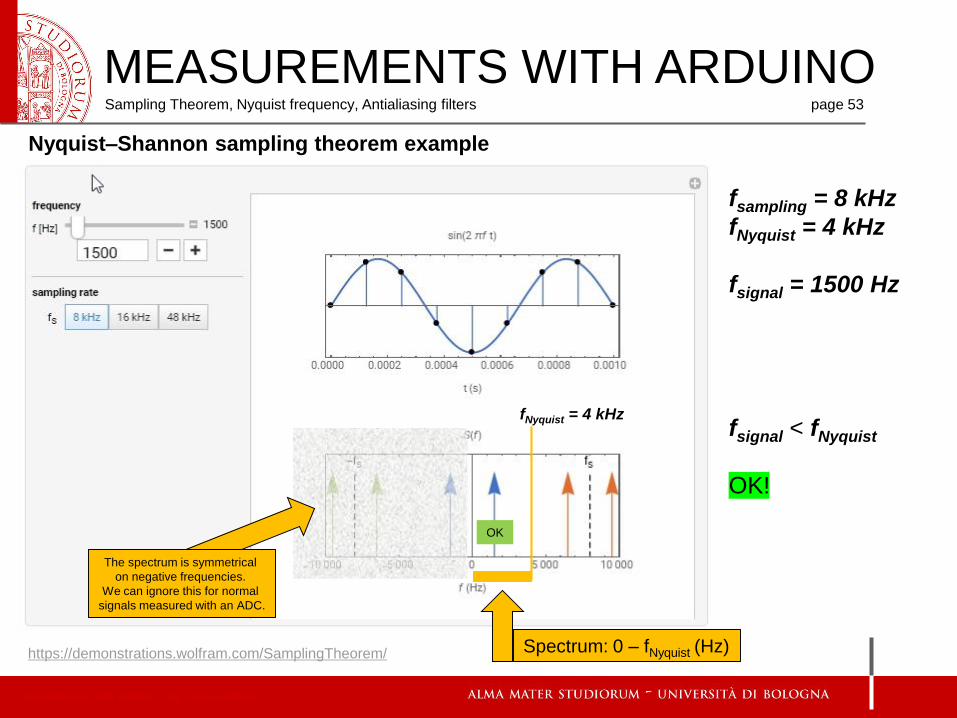
Nyquist–Shannon sampling theorem example
MEASUREMENTS WITH ARDUINOSampling Theorem, Nyquist frequency, Antialiasing filters page 53
https://demonstrations.wolfram.com/SamplingTheorem/
fsampling = 8 kHz
fNyquist = 4 kHz
fsignal = 1500 Hz
fsignal < fNyquist
OK!
fNyquist = 4 kHz
OK
Spectrum: 0 – fNyquist (Hz)
The spectrum is symmetrical
on negative frequencies.
We can ignore this for normal
signals measured with an ADC.
Measurements with Arduino – Ing. Paolo Guidorzi

Nyquist–Shannon sampling theorem example
MEASUREMENTS WITH ARDUINOSampling Theorem, Nyquist frequency, Antialiasing filters page 54
https://demonstrations.wolfram.com/SamplingTheorem/
fsampling = 8 kHz
fNyquist = 4 kHz
fsignal = 5000 Hz
fsignal > fNyquist
ALIASING!
Apparent (wrong)
frequency sampled:
3000 Hz
fNyquist = 4 kHz
AL
Measurements with Arduino – Ing. Paolo Guidorzi
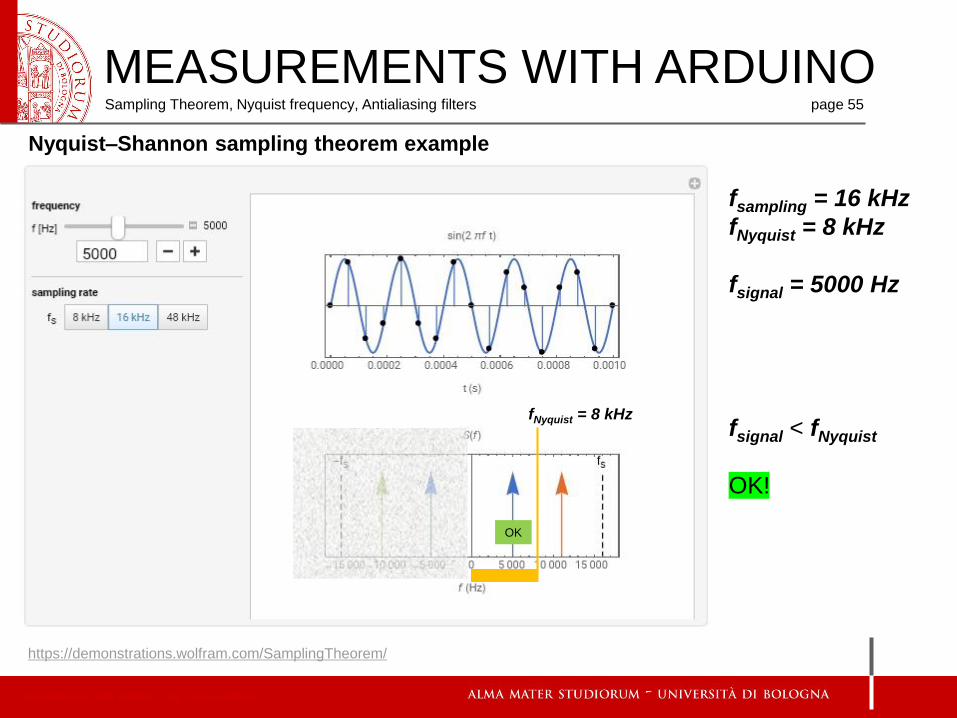
Nyquist–Shannon sampling theorem example
MEASUREMENTS WITH ARDUINOSampling Theorem, Nyquist frequency, Antialiasing filters page 55
https://demonstrations.wolfram.com/SamplingTheorem/
fsampling = 16 kHz
fNyquist = 8 kHz
fsignal = 5000 Hz
fsignal < fNyquist
OK!
fNyquist = 8 kHz
OK
Measurements with Arduino – Ing. Paolo Guidorzi

Nyquist–Shannon sampling theorem example
MEASUREMENTS WITH ARDUINOSampling Theorem, Nyquist frequency, Antialiasing filters page 56
https://demonstrations.wolfram.com/SamplingTheorem/
fsampling = 48 kHz
fNyquist = 24 kHz
fsignal = 5000 Hz
fsignal < fNyquist
OK!
fNyquist = 24 kHz
OK
Measurements with Arduino – Ing. Paolo Guidorzi

MEASUREMENTS WITH ARDUINOSampling Theorem, Nyquist frequency, Antialiasing filters page 57
https://demonstrations.wolfram.com/SamplingTheorem/
fsampling = 8 kHz
fNyquist = 4 kHz
fsignal = 3500 Hz
fsignal < fNyquist
OK!
fNyquist = 4 kHz
OK
Nyquist–Shannon sampling theorem example
Measurements with Arduino – Ing. Paolo Guidorzi

Nyquist–Shannon sampling theorem example
MEASUREMENTS WITH ARDUINOSampling Theorem, Nyquist frequency, Antialiasing filters page 58
https://demonstrations.wolfram.com/SamplingTheorem/
fsampling = 8 kHz
fNyquist = 4 kHz
fsignal = 4500 Hz
fsignal > fNyquist
ALIASING!
Apparent (wrong)
frequency sampled:
3500 Hz
fNyquist = 4 kHz
ALAL
fNyquist = 4 kHz
Measurements with Arduino – Ing. Paolo Guidorzi

- Arduino is a “SLOW” device and, with normal programming, its ADCs can reach
sampling frequencies around 9 kHz at most, so, in order to avoid aliasing, the
sampled signals can have a bandwidth up to 4.5 kHz
- Other microcontrollers, such as Teensy, are much faster than the Arduino and
can reach higher sample rates (48 kHz and above)
- If the data that Arduino is sampling varies very slowly or is stationary, there are
no problems regarding sampling rate and aliasing
- If the signal in input to the ADC has a bandwidth greater than the Nyquist
frequency, to avoid aliasing the input signal bandwidth must be reduced by
means of a low-pass filter, with cutoff frequency equal or lower than the
Nyquist frequency
MEASUREMENTS WITH ARDUINOSampling Theorem, Nyquist frequency, Antialiasing filters page 59
Measurements with Arduino – Ing. Paolo Guidorzi

MEASUREMENTS WITH ARDUINOSampling Theorem, Nyquist frequency, Antialiasing filters page 60
Full bandwith signal Low pass filtered signalFFT FFT
LOW PASS FILTERING
LOW PASS FILTERING
Cutoff
frequency
Low-pass filtering
Measurements with Arduino – Ing. Paolo Guidorzi

MEASUREMENTS WITH ARDUINOSampling Theorem, Nyquist frequency, Antialiasing filters page 61
Example of low pass filter
SignalLow-pass
filtered
Signal
Low-pass filtering
Temperature sensor
(Thermocouple)
Measurements with Arduino – Ing. Paolo Guidorzi
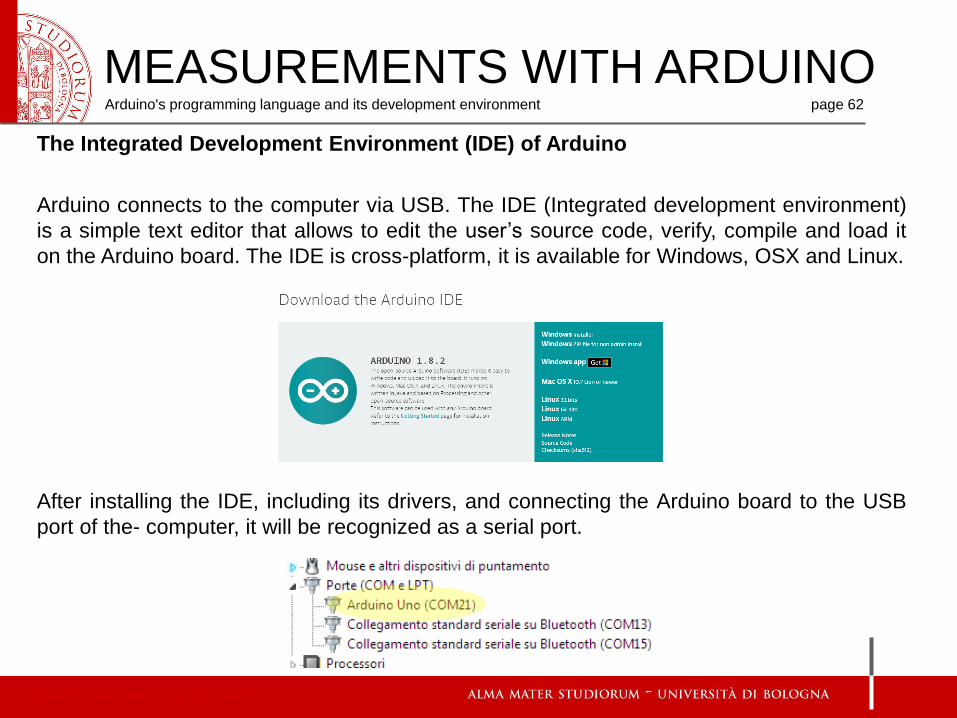
The Integrated Development Environment (IDE) of Arduino
Arduino connects to the computer via USB. The IDE (Integrated development environment)
is a simple text editor that allows to edit the user’s source code, verify, compile and load it
on the Arduino board. The IDE is cross-platform, it is available for Windows, OSX and Linux.
After installing the IDE, including its drivers, and connecting the Arduino board to the USB
port of the- computer, it will be recognized as a serial port.
MEASUREMENTS WITH ARDUINOArduino's programming language and its development environment page 62
Measurements with Arduino – Ing. Paolo Guidorzi

Now, in the IDE it is necessary to select the type of card in use and its (virtual) serial port. This operation
must be performed only the first time the Arduino card is connected to the computer.
READY TO GO!!
MEASUREMENTS WITH ARDUINOArduino's programming language and its development environment page 63
Measurements with Arduino – Ing. Paolo Guidorzi

The Arduino programming language
All user programs loadable
on Arduino are formed by at least
two parts (plus any others
user-defined functions).
The "mandatory" parts are called:
setup() and loop()
- The setup() function executes the
code enclosed in brackets { } only once,
when starting or resetting the Arduino board. Here the initialization code of the program or
of the peripherals connected to the board must be placed.
- The loop() function executes in infinite loop the part of the code enclosed in brackets { }.
Here the main code of the program must be placed.
- Other functions, created by the user, can be optionally written and called, if required.
MEASUREMENTS WITH ARDUINOArduino's programming language and its development environment page 64
Measurements with Arduino – Ing. Paolo Guidorzi
The “C” programming language syntax implemented in Arduino
The programming language reference guide is available on the official website
https://www.arduino.cc/en/Reference/HomePage
All Arduino programs include:
- Structures
- Values (memorized inside variables and constants)
- Functions
The basic structure of the program consists of the two functions Setup and Loop, but within
these there may be other control structures such as if... else or do... while or for.
The C syntax requires that the curly brackets { } delimit the portion of code executed by the
various control structures.
MEASUREMENTS WITH ARDUINOArduino's programming language and its development environment page 65
Measurements with Arduino – Ing. Paolo Guidorzi

MEASUREMENTS WITH ARDUINOArduino's programming language and its development environment page 66
Measurements with Arduino – Ing. Paolo Guidorzi

MEASUREMENTS WITH ARDUINOArduino's programming language and its development environment page 67
Measurements with Arduino – Ing. Paolo Guidorzi

MEASUREMENTS WITH ARDUINOArduino's programming language and its development environment page 68
Measurements with Arduino – Ing. Paolo Guidorzi

MEASUREMENTS WITH ARDUINOArduino's programming language and its development environment page 69
Measurements with Arduino – Ing. Paolo Guidorzi

MEASUREMENTS WITH ARDUINOArduino's programming language and its development environment page 70
Measurements with Arduino – Ing. Paolo Guidorzi

MEASUREMENTS WITH ARDUINOArduino's programming language and its development environment page 71
Measurements with Arduino – Ing. Paolo Guidorzi

Expression true: statement(s) is executed
Expression false: statement(s) is not executed and
instructions subsequent to the while block are executed
MEASUREMENTS WITH ARDUINOArduino's programming language and its development environment page 72
Measurements with Arduino – Ing. Paolo Guidorzi

MEASUREMENTS WITH ARDUINOArduino's programming language and its development environment page 73
Measurements with Arduino – Ing. Paolo Guidorzi

MEASUREMENTS WITH ARDUINOArduino's programming language and its development environment page 74
Measurements with Arduino – Ing. Paolo Guidorzi

MEASUREMENTS WITH ARDUINOArduino's programming language and its development environment page 75
Measurements with Arduino – Ing. Paolo Guidorzi

goto: better not to use it…
MEASUREMENTS WITH ARDUINOArduino's programming language and its development environment page 76
Measurements with Arduino – Ing. Paolo Guidorzi

MEASUREMENTS WITH ARDUINOArduino's programming language and its development environment page 77
Measurements with Arduino – Ing. Paolo Guidorzi
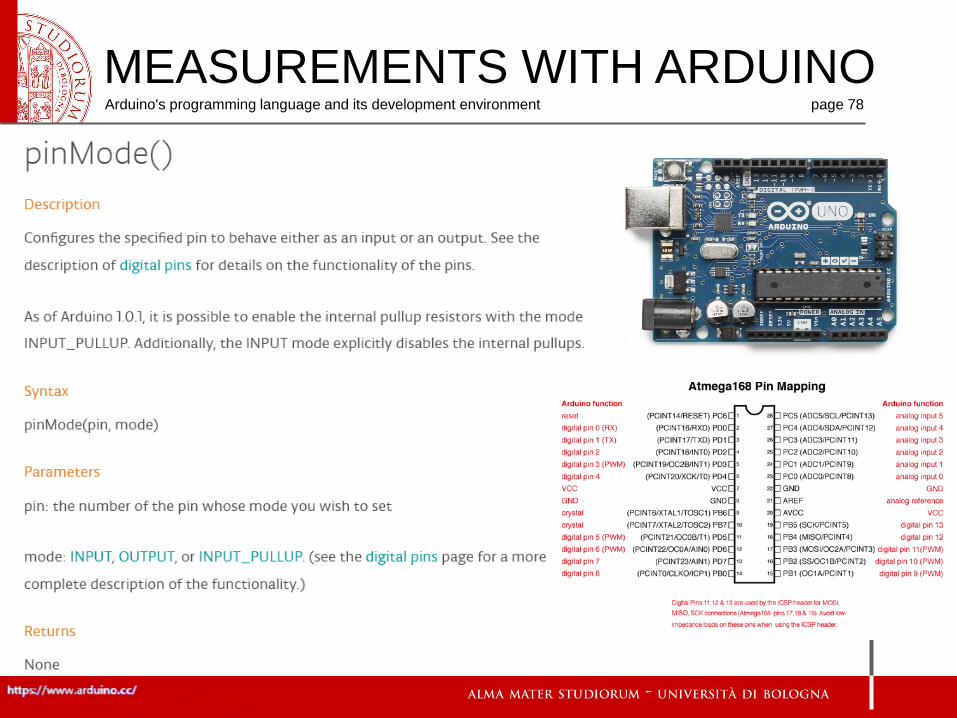
MEASUREMENTS WITH ARDUINOArduino's programming language and its development environment page 78
Measurements with Arduino – Ing. Paolo Guidorzi

MEASUREMENTS WITH ARDUINOArduino's programming language and its development environment page 79
Measurements with Arduino – Ing. Paolo Guidorzi
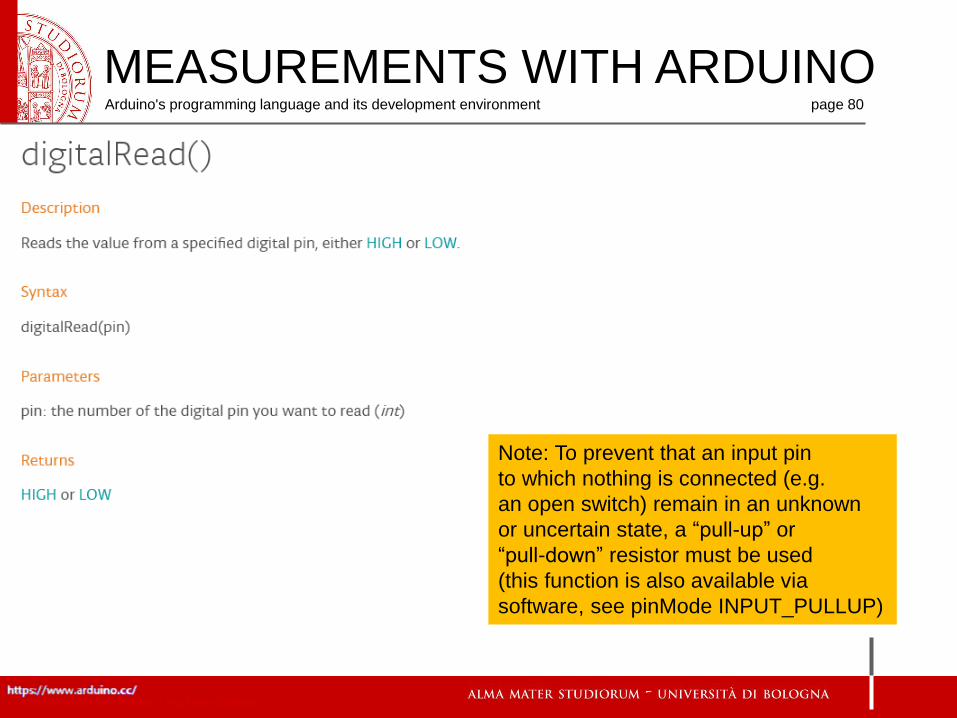
Note: To prevent that an input pin
to which nothing is connected (e.g.
an open switch) remain in an unknown
or uncertain state, a “pull-up” or
“pull-down” resistor must be used
(this function is also available via
software, see pinMode INPUT_PULLUP)
MEASUREMENTS WITH ARDUINOArduino's programming language and its development environment page 80
Measurements with Arduino – Ing. Paolo Guidorzi

MEASUREMENTS WITH ARDUINOArduino's programming language and its development environment page 81
Measurements with Arduino – Ing. Paolo Guidorzi

MEASUREMENTS WITH ARDUINOArduino's programming language and its development environment page 82
Measurements with Arduino – Ing. Paolo Guidorzi

MEASUREMENTS WITH ARDUINOArduino's programming language and its development environment page 83
Measurements with Arduino – Ing. Paolo Guidorzi

MEASUREMENTS WITH ARDUINO
Measurements with Arduino – Ing. Paolo Guidorzi

Breadboards vs Prototype Board vs PCB
Breadboard
Prototype PCB
PCB
MEASUREMENTS WITH ARDUINOpage 85
Measurements with Arduino – Ing. Paolo Guidorzi
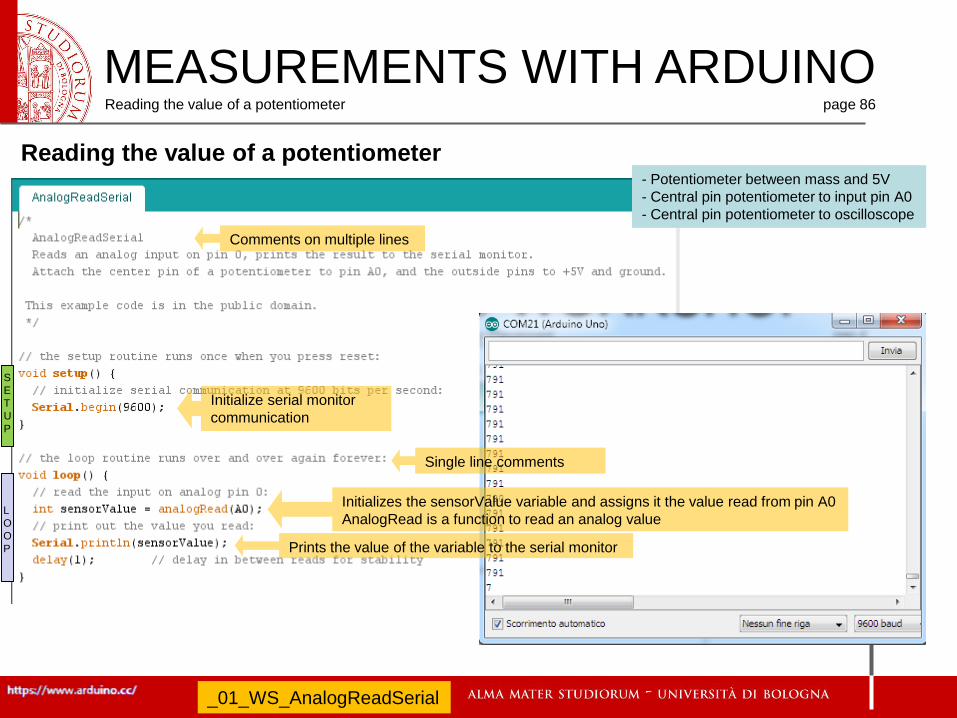
Reading the value of a potentiometer
Initialize serial monitor
communication
Comments on multiple lines
Single line comments
Initializes the sensorValue variable and assigns it the value read from pin A0
AnalogRead is a function to read an analog value
Prints the value of the variable to the serial monitor
- Potentiometer between mass and 5V
- Central pin potentiometer to input pin A0
- Central pin potentiometer to oscilloscope
S
E
T
U
P
L
O
O
P
_01_WS_AnalogReadSerial
MEASUREMENTS WITH ARDUINOReading the value of a potentiometer page 86

Reading the value of a potentiometer
MEASUREMENTS WITH ARDUINOReading the value of a potentiometer page 87
Measurements with Arduino – Ing. Paolo Guidorzi

From the value of a potentiometer to the PWM output - Changing the brightness of an LED
Writes the PWM value to the output pin:
sets the pulse width
Re-maps
values from
0..1023 to
0..255
_02_AnalogInOutSerial
print and stay in line
print and «new line»
MEASUREMENTS WITH ARDUINOFrom the value of a potentiometer to the PWM output page 88
\t → tab
- Potentiometer between mass and 5V
- Central pin potentiometer to input pin A0
- Output pin 9 to a LED (with 1K resistor)
- Central pin potentiometer to oscilloscope

From the value of a potentiometer to the PWM output - Changing the brightness of a LED
MEASUREMENTS WITH ARDUINOFrom the value of a potentiometer to the PWM output page 89
Measurements with Arduino – Ing. Paolo Guidorzi

Continuously variable PWM output
Increase or decrease brightness (PWM)
Change the brightness
(PWM) to positive or
negative
_03_Fade
MEASUREMENTS WITH ARDUINOContinuously variable PWM output page 90
- Output pin 9 to a LED (with 1K resistor)
- Output pin 9 to oscilloscope

From the PWM signal to a continue voltage. «Poor man DAC»
In Arduino (except for the DUE model) there are no DACs on board, but only ADC inputs. Using the PWM
outputs, however, it is possible to obtain a DC voltage. The frequency of the Arduino PWM modulator is of
about 490 Hz, but it can be modified via some internal registers. Assuming, however, to leave the frequency at
490 Hz, a low-pass filter placed on the output pin allows to obtain a DC voltage, to be used for various uses,
making up for the lack of a real DAC (we will use them soon), but with some limitations. A low pass filter of the
first order is used, built in the simplest way, namely with a resistor and a capacitor, placed at the output of a pin
with signal PWM. Arduino allows to vary the pulse width with a resolution of 8 bits (256 values), from 0% to
100%, i.e. 256 possible pulse widths are possible. A simulation of the effect of low pass filtering, to understand
the limits of this solution, is available on this page :
http://sim.okawa-denshi.jp/en/PWMtool.php
MEASUREMENTS WITH ARDUINOFrom the PWM signal to a continue voltage. «Poor man DAC» page 91
Measurements with Arduino – Ing. Paolo Guidorzi

- Cutoff frequency about 100 Hz
- Fast to reach maximum
average value
- Very high ripple on output
http://sim.okawa-denshi.jp/en/PWMtool.php
https://en.wikipedia.org/wiki/Low-pass_filter
MEASUREMENTS WITH ARDUINOFrom the PWM signal to a continue voltage. «Poor man DAC» page 92
Measurements with Arduino – Ing. Paolo Guidorzi

- Cutoff frequency about 10 Hz
- Less fast to reach maximum
average value
- Still some ripple on output
http://sim.okawa-denshi.jp/en/PWMtool.php
https://en.wikipedia.org/wiki/Low-pass_filter
MEASUREMENTS WITH ARDUINOFrom the PWM signal to a continue voltage. «Poor man DAC» page 93
Measurements with Arduino – Ing. Paolo Guidorzi

- Cutoff frequency about 1 Hz
- Slow to reach maximum
average value
- Very little ripple on output
http://sim.okawa-denshi.jp/en/PWMtool.php
https://en.wikipedia.org/wiki/Low-pass_filter
MEASUREMENTS WITH ARDUINOFrom the PWM signal to a continue voltage. «Poor man DAC» page 94
Measurements with Arduino – Ing. Paolo Guidorzi
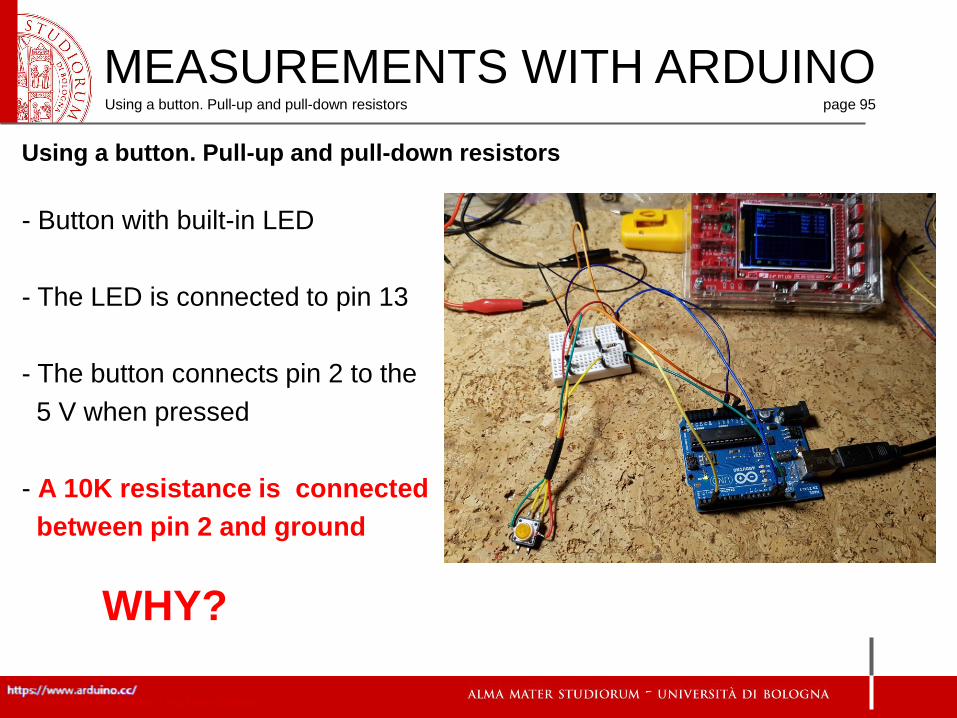
Using a button. Pull-up and pull-down resistors
- Button with built-in LED
- The LED is connected to pin 13
- The button connects pin 2 to the
5 V when pressed
- A 10K resistance is connected
between pin 2 and ground
WHY?
MEASUREMENTS WITH ARDUINOUsing a button. Pull-up and pull-down resistors page 95
Measurements with Arduino – Ing. Paolo Guidorzi

Using a button. Pull-up and pull-down resistors
_04_Button
MEASUREMENTS WITH ARDUINOUsing a button. Pull-up and pull-down resistors page 96

Using a button. Pull-up and pull-down resistors
Without pull-down
resistance
Open button
(LED pin)
With pull-down
resistance
Open button
(LED pin)
With pull-down
resistance
Closed button
(LED pin)
MEASUREMENTS WITH ARDUINOUsing a button. Pull-up and pull-down resistors page 97
Measurements with Arduino – Ing. Paolo Guidorzi
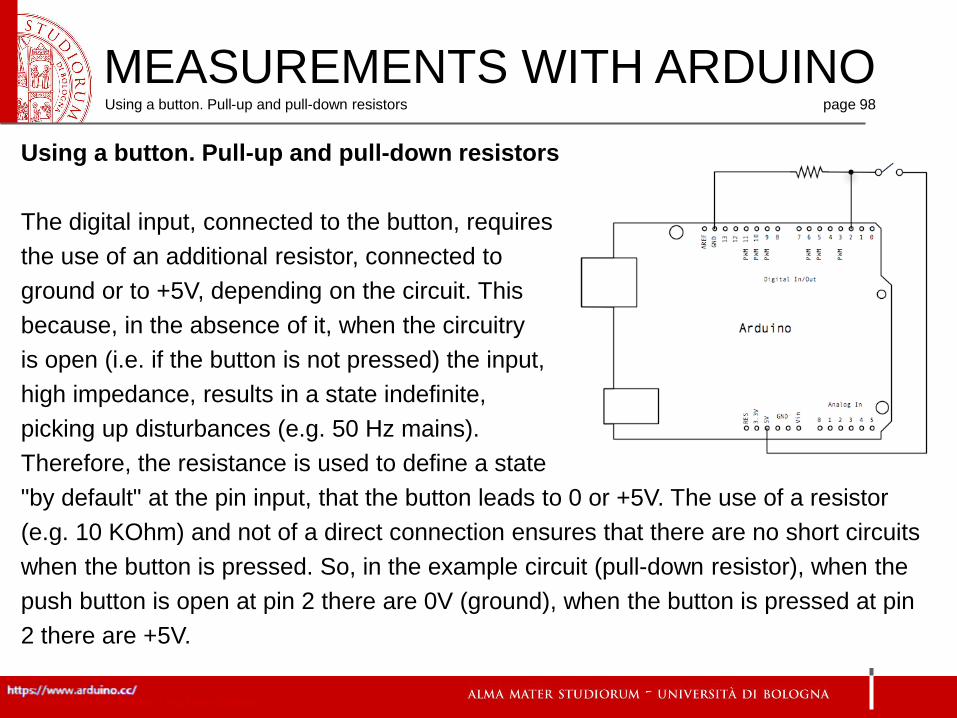
Using a button. Pull-up and pull-down resistors
The digital input, connected to the button, requires
the use of an additional resistor, connected to
ground or to +5V, depending on the circuit. This
because, in the absence of it, when the circuitry
is open (i.e. if the button is not pressed) the input,
high impedance, results in a state indefinite,
picking up disturbances (e.g. 50 Hz mains).
Therefore, the resistance is used to define a state
"by default" at the pin input, that the button leads to 0 or +5V. The use of a resistor
(e.g. 10 KOhm) and not of a direct connection ensures that there are no short circuits
when the button is pressed. So, in the example circuit (pull-down resistor), when the
push button is open at pin 2 there are 0V (ground), when the button is pressed at pin
2 there are +5V.
MEASUREMENTS WITH ARDUINOUsing a button. Pull-up and pull-down resistors page 98
Measurements with Arduino – Ing. Paolo Guidorzi

Pull-up and pull-down resistors
Pull-up Pull-down Internal Pull-up
NOTE: as seen previously, the pinMode function has among its
different modes the option INPUT or OUTPUT or INPUT_PULLUP.
It is possible to set up via software a pullup resistor (about 20K) already present inside the microcontroller.
This operation is (electrically) identical to setting the HIGH logic level of the pin (when in use as output).
pinMode(pin, INPUT);
digitalWrite(pin, HIGH);pinMode(pin, INPUT_PULLUP)
Internal
logicPin
Rpu
Arduino
Enable Pull-up
Vin
MEASUREMENTS WITH ARDUINOUsing a button. Pull-up and pull-down resistors page 99
Measurements with Arduino – Ing. Paolo Guidorzi

The voltage divider
VIN = 5V
I
R1
R2 VR2
VR1
VOUT
𝑉𝑅1 = 𝑅1 ⋅ 𝐼𝑉𝑅2 = 𝑅2 ⋅ 𝐼
𝑉𝐼𝑁 = 𝑅1 + 𝑅2 ⋅ 𝐼
𝐼 =𝑉𝐼𝑁
𝑅1 + 𝑅2
𝑉𝑅1 = 𝑉𝐼𝑁 ⋅𝑅1
𝑅1 + 𝑅2
𝑉𝑅2 = 𝑉𝐼𝑁 ⋅𝑅2
𝑅1 + 𝑅2= 𝑉𝑂𝑈𝑇
The potentiometer is a voltage
divider:
- R2 = 0 → VR2 = 0
- R1 = 0 → VR2 = VIN
- R1 = R2 → VR2 = VIN/2
→ Pull-up and pull-down resistors
MEASUREMENTS WITH ARDUINOThe voltage divider page 100
Measurements with Arduino – Ing. Paolo Guidorzi

Other resistive sensors: the photocell
VIN = 5V
RLDR
R
VOUT
𝑉𝑂𝑈𝑇 = 𝑉𝐼𝑁 ⋅𝑅
𝑅LDR + 𝑅
LDR
MEASUREMENTS WITH ARDUINOThe voltage divider: other resistive sensors: the photocell page 101
Measurements with Arduino – Ing. Paolo Guidorzi

𝑉𝑂𝑈𝑇 = 𝑉𝐼𝑁 ⋅𝑅
𝑅LDR + 𝑅
_01_WS_AnalogReadSerial
Other resistive sensors: the photocell
Try with both R = 10K and R = 1K
MEASUREMENTS WITH ARDUINOThe voltage divider: other resistive sensors: the photocell page 102

Other resistive sensors: (analog) GAS sensor
VIN = 5V
RS
RL
VOUT𝑉𝑂𝑈𝑇 = 𝑉𝐼𝑁 ⋅
𝑅𝐿𝑅S + 𝑅𝐿
GAS sensor
𝑅𝑆 =𝑅𝐿 ⋅ 𝑉𝐼𝑁 − 𝑉𝑂𝑈𝑇
𝑉𝑂𝑈𝑇
_01_WS_AnalogReadSerial
MEASUREMENTS WITH ARDUINOThe voltage divider: other resistive sensors: (analog) GAS sensor page 103

Temperature sensors
- ANALOG SENSORS
The measured thermodynamic variable is converted inside the sensor in the form of voltage,
according to a variation law specified by the manufacturer. The Arduino ADC reads this voltage
directly and, according to the manufacturer’s specification, the measured parameter can be
calculated directly in the Arduino sketch. For example the temperature sensor LM35:
- DIGITAL SENSORS
The measured parameters are transmitted to Arduino through a digital communication protocol
(e.g. SPI or I2C). The user does not need to know in detail the low level software instructions of
the communication with the sensor because software libraries are provided by the sensor
manufacturer (or by the user’s community). Once the sensor libraries have been installed in the
Arduino IDE, at first use, in the sketch it is sufficient to #include the library related to the sensor
and the reading of the parameters is done usually just with a single software instruction.
MEASUREMENTS WITH ARDUINOThe voltage divider: other resistive sensors: (analog) GAS sensor page 104
Measurements with Arduino – Ing. Paolo Guidorzi

LM 35 - ANALOG temperature sensor
It is a simple analog sensor, which provides an output voltage
proportional to the measured temperature, varying 10 mV/°C.
There are various models, for example LM35A has operating
ranges between -55°C and 150°C and LM35D has operating
ranges between 0°C and 100°C.
The 6 analog inputs of Arduino UNO have a resolution of 10 bits, that is 1024 possible values,
measuring by default an input voltage variable between 0 and 5 V (outside these values the
device is damaged).
MEASUREMENTS WITH ARDUINOThe voltage divider: other resistive sensors: (analog) GAS sensor page 105
+5V OUT GND
5ADC INPUT 0..5 V 0.00488 V = 4.88 mV (each amplitude step)
1024 =
10 mV measurement resolution 0.48 °C
°C
Measurements with Arduino – Ing. Paolo Guidorzi

LM 35 - ANALOG temperature sensor
LM35A: max 150 °C max 1.5 V at Arduino ADC input
LM35D: max 100 °C max 1 V at Arduino ADC input
In both cases, there is a "waste" of bits, in other words of resolution, because the
whole ADC measurement range (5V over 10 bit = 1024 steps) is not used.
tempC = aRead*0.488
Example of temperature measurement:
The Arduino program reads the value 43 on the ADC. Remembering that the read
value can vary from 0 to 1023 and that each step is 4.88 mV (0.48 °C), the input
voltage to the ADC is nominally 43*4.88 = 210 mV (0.21 V), corresponding to 21 °C.
MEASUREMENTS WITH ARDUINOThe voltage divider: other resistive sensors: (analog) GAS sensor page 106
0 307 1023
0 1.5 V 5 V
equivalent to 8.26 bit
0 204 1023
0 1 V 5 V
equivalent to 7.67 bit
Measurements with Arduino – Ing. Paolo Guidorzi

LM 35 - ANALOG temperature sensor
In Arduino a “trick” can be used to increase the accuracy of the measurement, when
the range of measured voltages is narrow. The voltage range of the ADC inputs can
be set with the analogReference software instruction:
analogReference(DEFAULT); // The ADC range is the Arduino voltage (5V or 3.3V)
analogReference(INTERNAL); // The ADC range is 1.1 V
analogReference(EXTERNAL); // The ADC range is the voltage applied to EXT pin (≤ 5 V)
Setting to INTERNAL:
The resolution is now about 0.1 °C instead of 0.48 °C tempC = aRead*0.10742
NOTE: the ADC input voltage must never exceed the value set with the analogReference
instruction. Setting INTERNAL, the max measurable temperature with LM35 is 110 °C
MEASUREMENTS WITH ARDUINOThe voltage divider: other resistive sensors: (analog) GAS sensor page 107
1.1ADC INPUT 0 .. 1.1 V 0.00107 V 1.07 mV
1024 =
Measurements with Arduino – Ing. Paolo Guidorzi
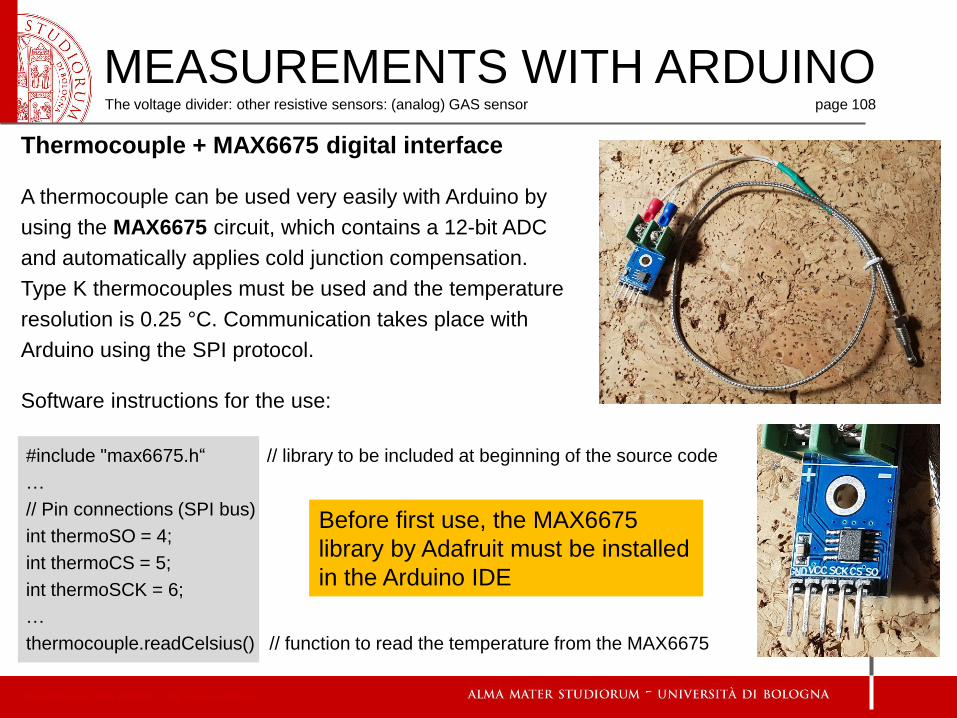
Thermocouple + MAX6675 digital interface
A thermocouple can be used very easily with Arduino by
using the MAX6675 circuit, which contains a 12-bit ADC
and automatically applies cold junction compensation.
Type K thermocouples must be used and the temperature
resolution is 0.25 °C. Communication takes place with
Arduino using the SPI protocol.
Software instructions for the use:
#include "max6675.h“ // library to be included at beginning of the source code
…
// Pin connections (SPI bus)
int thermoSO = 4;
int thermoCS = 5;
int thermoSCK = 6;
…
thermocouple.readCelsius() // function to read the temperature from the MAX6675
MEASUREMENTS WITH ARDUINOThe voltage divider: other resistive sensors: (analog) GAS sensor page 108
Before first use, the MAX6675
library by Adafruit must be installed
in the Arduino IDE
Measurements with Arduino – Ing. Paolo Guidorzi

Temperature and Humidity sensors DHT11 and DHT22
These 2 low cost devices contain a temperature sensor and a relative
humidity sensor and communicate with Arduino digitally, using a single wire.
DHT11 (blue): temperature range 0..50 °C, error on relative humidity 5%.
DHT22 (white): temperature range -40..80 °C, error on relative humidity 2%.
Software instructions for the use:
#include "DHT.h“ // library to be included at beginning of the source code
…
#define DHTPIN 2 // Arduino digital pin connected to the DHT sensor
#define DHTTYPE DHT11 // set DHT11 or DHT22
…
DHT dht1(DHTPIN, DHTTYPE); // Initialize the sensor
float h;
float t;
…
dht1.begin(); // This instruction in the setup function
…
h = dht1.readHumidity(); // read humidity and put in variable h
t = dht1.readTemperature(); // read temperature in celsius and put in variable t
MEASUREMENTS WITH ARDUINOThe voltage divider: other resistive sensors: (analog) GAS sensor page 109
Two libraries must be installed in
the Arduino IDE at first use:
DHT Sensor Library:
https://github.com/adafruit/DHT-
sensor-library
Adafruit Unified Sensor Lib:
https://github.com/adafruit/Adafr
uit_Sensor
Measurements with Arduino – Ing. Paolo Guidorzi
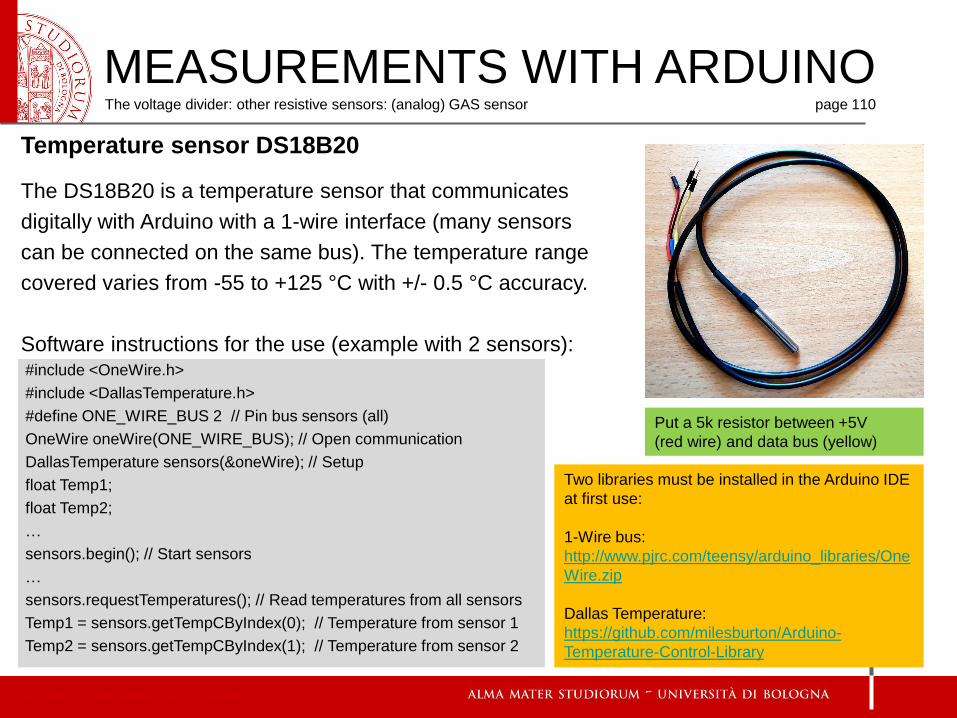
Temperature sensor DS18B20
The DS18B20 is a temperature sensor that communicates
digitally with Arduino with a 1-wire interface (many sensors
can be connected on the same bus). The temperature range
covered varies from -55 to +125 °C with +/- 0.5 °C accuracy.
Software instructions for the use (example with 2 sensors):#include <OneWire.h>
#include <DallasTemperature.h>
#define ONE_WIRE_BUS 2 // Pin bus sensors (all)
OneWire oneWire(ONE_WIRE_BUS); // Open communication
DallasTemperature sensors(&oneWire); // Setup
float Temp1;
float Temp2;
…
sensors.begin(); // Start sensors
…
sensors.requestTemperatures(); // Read temperatures from all sensors
Temp1 = sensors.getTempCByIndex(0); // Temperature from sensor 1
Temp2 = sensors.getTempCByIndex(1); // Temperature from sensor 2
MEASUREMENTS WITH ARDUINOThe voltage divider: other resistive sensors: (analog) GAS sensor page 110
Two libraries must be installed in the Arduino IDE
at first use:
1-Wire bus:
http://www.pjrc.com/teensy/arduino_libraries/One
Wire.zip
Dallas Temperature:
https://github.com/milesburton/Arduino-
Temperature-Control-Library
Put a 5k resistor between +5V
(red wire) and data bus (yellow)
Measurements with Arduino – Ing. Paolo Guidorzi

Temperature and pressure sensor BMP280
BMP280. I2C and SPI interface
Pressure:
Range: 300-1100 hPa
Resolution: 0.16 Pa
Noise: 1.3 Pa
Temperature:
Range: -40 / +85 °C
Resolution: 0.01 °C
https://www.sunfounder.com/bmp280-barometric-pressure-temperature-altitude-sensor-module.html
https://www.bosch-sensortec.com/bst/products/all_products/bmp280
MEASUREMENTS WITH ARDUINOTemperature and pressure sensor page 111
Measurements with Arduino – Ing. Paolo Guidorzi
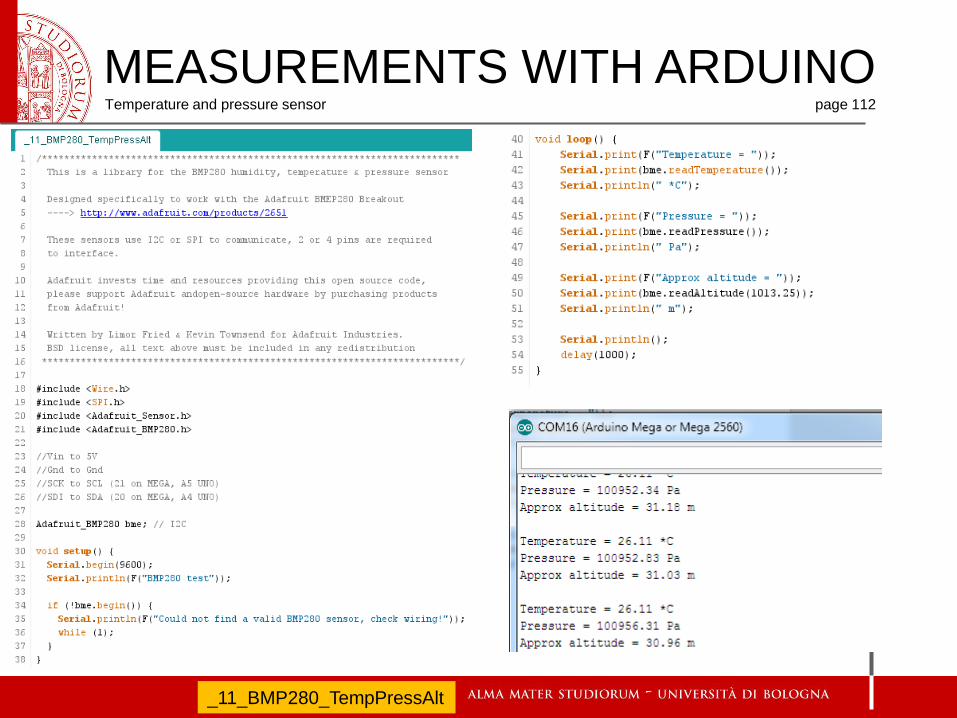
_11_BMP280_TempPressAlt
MEASUREMENTS WITH ARDUINOTemperature and pressure sensor page 112

Serial 7-segment display
To avoid having to command every single
segment and make it easier to use, this
shield includes a microscopic Arduino that
communicates with the main Arduino and receives commands on what to display. It can connect
in 3 ways: serial (TTL), SPI serial or I2C serial.
https://www.sparkfun.com/products/11442
MEASUREMENTS WITH ARDUINOSerial 7-segment display page 113
Measurements with Arduino – Ing. Paolo Guidorzi
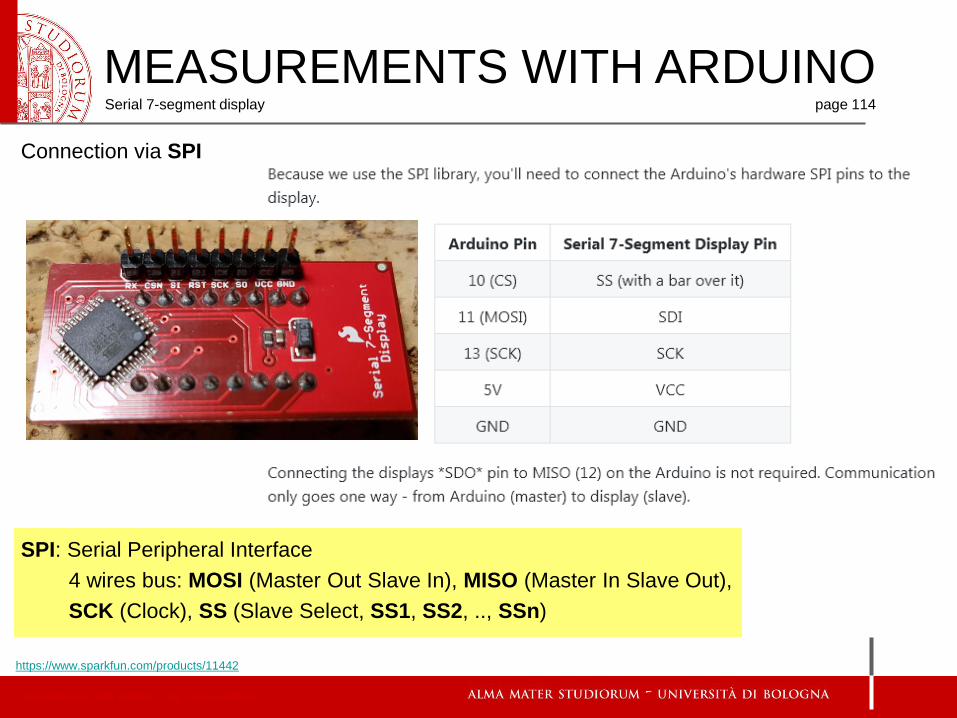
Connection via SPI
SPI: Serial Peripheral Interface
4 wires bus: MOSI (Master Out Slave In), MISO (Master In Slave Out),
SCK (Clock), SS (Slave Select, SS1, SS2, .., SSn)
https://www.sparkfun.com/products/11442
MEASUREMENTS WITH ARDUINOSerial 7-segment display page 114
Measurements with Arduino – Ing. Paolo Guidorzi
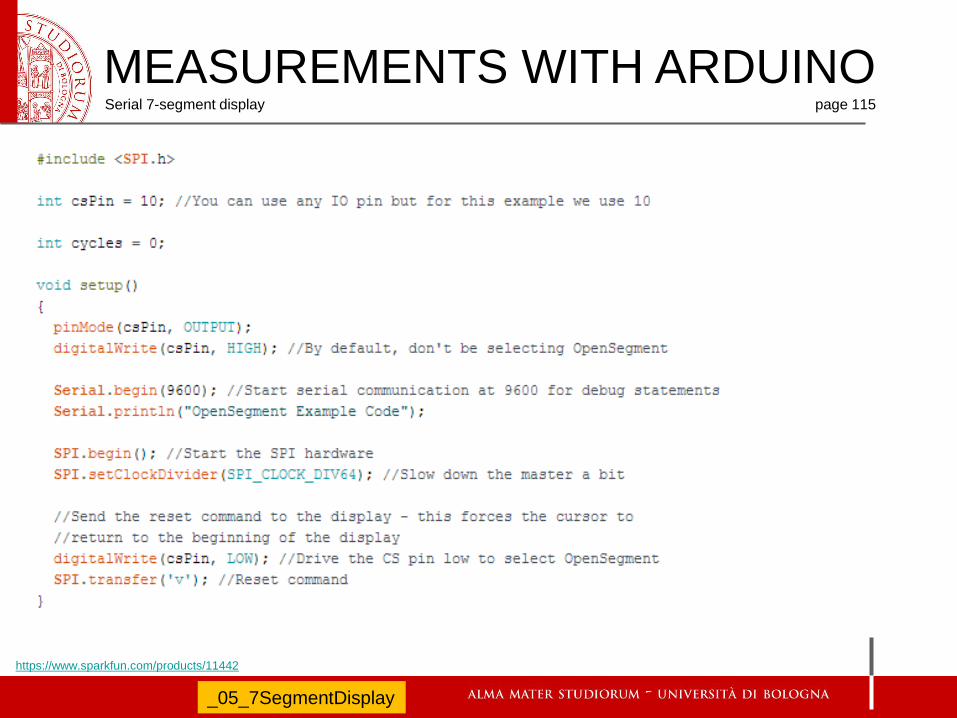
https://www.sparkfun.com/products/11442
_05_7SegmentDisplay
MEASUREMENTS WITH ARDUINOSerial 7-segment display page 115
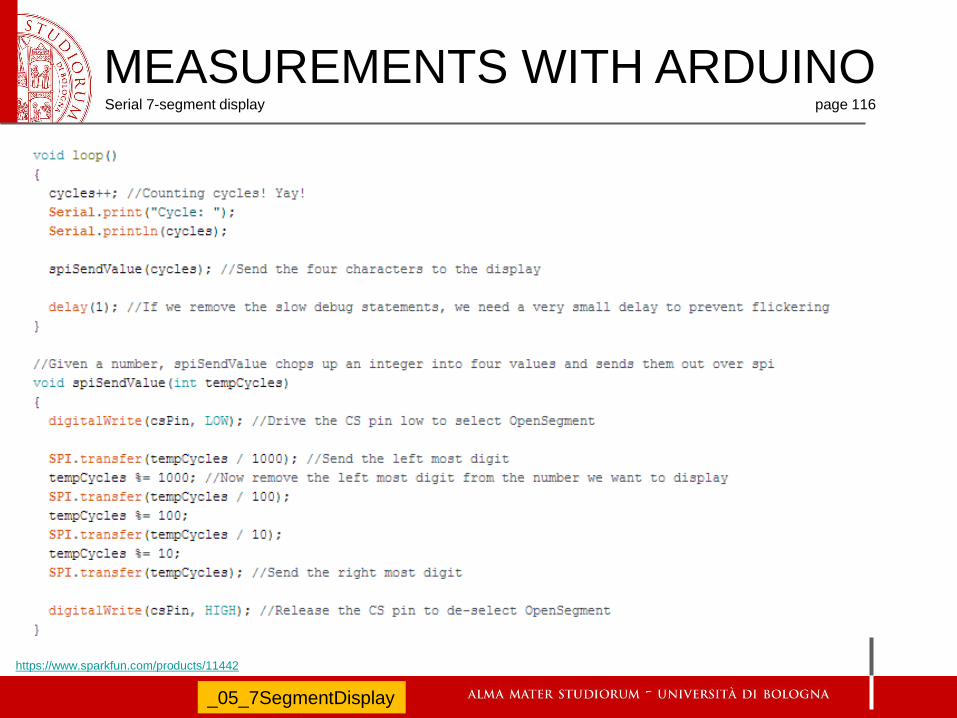
https://www.sparkfun.com/products/11442
_05_7SegmentDisplay
MEASUREMENTS WITH ARDUINOSerial 7-segment display page 116
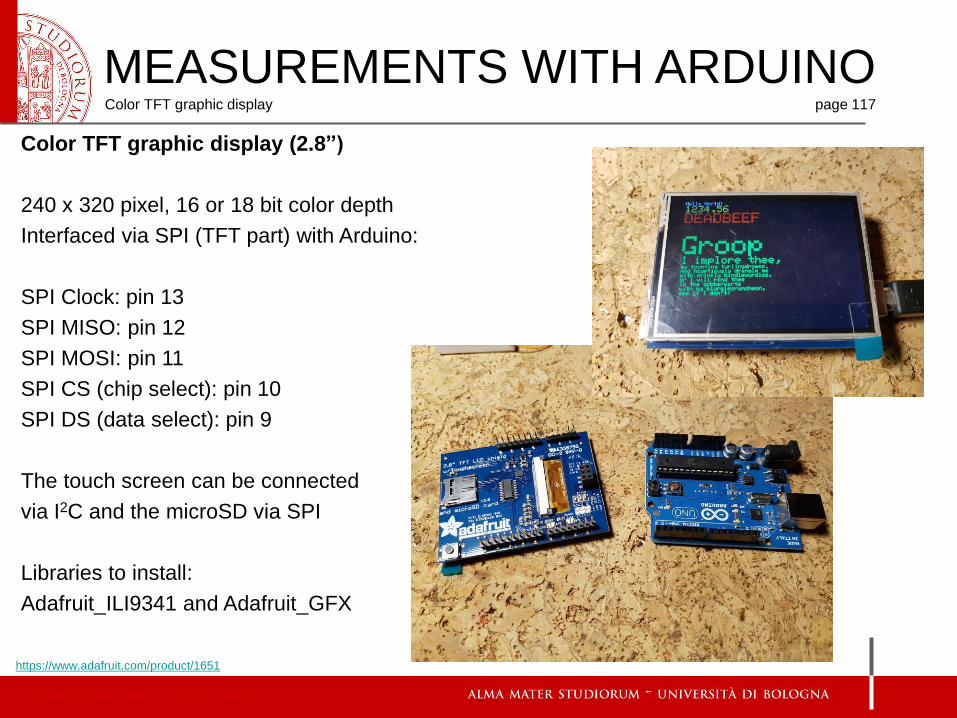
Color TFT graphic display (2.8”)
240 x 320 pixel, 16 or 18 bit color depth
Interfaced via SPI (TFT part) with Arduino:
SPI Clock: pin 13
SPI MISO: pin 12
SPI MOSI: pin 11
SPI CS (chip select): pin 10
SPI DS (data select): pin 9
The touch screen can be connected
via I2C and the microSD via SPI
Libraries to install:
Adafruit_ILI9341 and Adafruit_GFX
https://www.adafruit.com/product/1651
MEASUREMENTS WITH ARDUINOColor TFT graphic display page 117
Measurements with Arduino – Ing. Paolo Guidorzi

https://www.sparkfun.com/products/11442
_06_TFT28Adafruit
F( tells the compiler to store
the string in the flash memory
instead of internal RAM
SPI connection pin numbers
MEASUREMENTS WITH ARDUINOColor TFT graphic display page 118

https://www.sparkfun.com/products/11442
_06_TFT28Adafruit
Functions to test graphic
instructions
MEASUREMENTS WITH ARDUINOColor TFT graphic display page 119

Connection of another TFT graphic display (1.8’’)
160 x 128 pixel
Interfaced via SPI
Libraries to install:
Adafruit GFX and Adafruit ST7735
To use microSD, install the corresponding
SD library
https://www.arduino.cc/en/Main/GTFT
MEASUREMENTS WITH ARDUINOColor TFT graphic display page 120
Measurements with Arduino – Ing. Paolo Guidorzi

https://www.arduino.cc/en/Main/GTFT
_07_TFTPong_TFT18
MEASUREMENTS WITH ARDUINOColor TFT graphic display page 121

https://www.arduino.cc/en/Main/GTFT
_08_TFTGraph_TFT18
MEASUREMENTS WITH ARDUINOColor TFT graphic display page 122

Connection of another TFT graphic display (2.2’’) using Arduino MEGA2560
240 x 320 pixel, 16 bit color depth
Interfacing viaSPI to
Arduino MEGA2560:
SPI SCK (Clock): pin 52
SPI MISO: pin 50
SPI MOSI: pin 51
SPI CS (chip select): pin 53
SPI RST (reset): pin 9
SPI DC (data/command select): pin 8
Install libraries:
Adafruit_ILI9340 and Adafruit_GFX
https://www.adafruit.com/product/1480
MEASUREMENTS WITH ARDUINOColor TFT graphic display page 123
Measurements with Arduino – Ing. Paolo Guidorzi

Oscilloscope of analog inputs A0 e A1
_09_MyScopeTFT22
MEASUREMENTS WITH ARDUINOColor TFT graphic display page 124

Let's add to the previous example an external DAC converter and an external ADC
converter
Digital to Analog Converter
DAC MCP4725 (12 bit)https://learn.adafruit.com/mcp4725-12-bit-dac-tutorial
Analog to Digital Converter (x4)
ADC ADS1015 (12 bit)https://learn.adafruit.com/adafruit-4-channel-adc-breakouts
Both are connected to Arduino using I2C protocol, on different logic addresses.
Using Arduino MEGA, the pins dedicated to I2C are 20 (SDA) and 21 (SCL); both devices are
connected in parallel to this bus. The address is fixed in hardware mode on the respective card:
MCP4725: A0 unconnected→ address 0x62; A0 connected to VDD → address 0x63
ADS1015: ADDR connected to GND → address 0x48; ADDR connected to VDD → address 0x49
ADDR connected to SDA→ address 0x4A; ADDR connected to SCL→ address 0x4B
MEASUREMENTS WITH ARDUINOExternal DAC and ADC converters page 125
HEXADECIMAL ↔ DECIMAL ↔ BINARY
0x4A ↔ 74 ↔ 1001010
Measurements with Arduino – Ing. Paolo Guidorzi

We have now the TFT
display connected on the
SPI bus and the ADC and
DAC connected both on the
same I2C bus but with different
addresses. The loaded
sketch reads the voltage on
the analog input of Arduino
on the pin A0 and draw it on
the screen. In addition, the
external ADC reads a voltage
from its input A0, this value is
drawn on the screen and the external DAC is set with the same voltage. The initial part of the
sketch includes all the libraries necessary for the operation of the devices used. In the setup part
these are initialized.
The MCP4725 DAC address is set to 0x62 (its address selection pin is left disconnected), the
ADS1015 ADC address is set to 0x48 (its address selection pin is grounded). The SDAs of both
go to pin 20 of the Arduino board and the SCLs to pin 21.
MEASUREMENTS WITH ARDUINOExternal DAC and ADC converters page 126
Measurements with Arduino – Ing. Paolo Guidorzi

_10_ADC_DAC_TFT22
Setup TFT display
Setup DAC
Setup ADC
GAIN sets the
range
MEASUREMENTS WITH ARDUINOExternal DAC and ADC converters page 127

Potentiometer (divider) → external ADC
External ADC → internal DAC → internal ADC
Internal and external ADC plots are overlapped
_10_ADC_DAC_TFT22
0..1023 → 0..5V
Reads ADC
Writes DAC
Max 4,096 V Input
MEASUREMENTS WITH ARDUINOExternal DAC and ADC converters page 128
Bidirectional data communication between Arduino and computer (via serial port)
One of the many shields of Arduino allows
to save data on microSD or other types of
memories rewritable, but it can be useful to
receive and process data in real time directly
from Arduino. It is possible to do this in many
ways, for example via WiFi or Ethernet
shield or Bluetooth or GSM (the possibilities
are endless). An option at no cost, without
the use of additional shields consists in http://www.lazarus-ide.org/
using the Arduino serial monitor port: on the computer runs a very simple ad-hoc software,
which reads the data that Arduino sends to the serial port (in the form of text strings), converts
into numerical values and uses them for processing or archiving on computers, in real time.
Obviously also communication from computer to Arduino can be implemented, in a similar way.
An example is now shown, made using the Lazarus compiler, i.e. free objects Pascal, free,
open source (GPL/LGPL) and cross-platform (Windows, OSX, Linux).
MEASUREMENTS WITH ARDUINOBidirectional data communication between Arduino and computer (via serial port) page 129
Measurements with Arduino – Ing. Paolo Guidorzi

In this example the BMP280 is again used and the temperature
value is sent to the computer through the serial port, in
continuous way. To facilitate the interpretation of the data
(which are sent in the form of a text string and in
non-synchronized mode between Arduino and the computer),
these will be formatted in the form [xx.yy] where xx.yy is the
temperature, two decimal places. The computer program reads
the serial data, extrapolates the string formed by the 7
characters [xx.yy], converts xx.yy to the form xx,yy (in Italy
the numerical format provides the comma) and converts this string in numerical value, usable for
processing or direct storage on the hard disk.
The sketch loaded on Arduino (MEGA) is a simplified version of the one previously seen for the
BMP280 test.The program created with Lazarus to read the serial port includes the installation
of the free 5dpoSerial library https://sourceforge.net/projects/sdpo-cl/files/ useful to manage the
communication on serial port (virtual).
Both software sources are available for download.
MEASUREMENTS WITH ARDUINOBidirectional data communication between Arduino and computer (via serial port) page 130
Measurements with Arduino – Ing. Paolo Guidorzi

Modified version of the sketch from the previous example. On serial port only the temperature is
written, adding the square brackets before and after the numerical value.
_12_BMP280_TempArduino
MEASUREMENTS WITH ARDUINOBidirectional data communication between Arduino and computer (via serial port) page 131

Main routine of the Pascal program
written with Lazarus. At regular
intervals the serial port is read
and the string containing the
temperature value is extrapolated.
The dot is converted into a comma
and the string is converted into
a numerical value.
_12_Lazarus read serial from Arduino
MEASUREMENTS WITH ARDUINOBidirectional data communication between Arduino and computer (via serial port) page 132

Data communication from smartphone to Arduino via Bluetooth
A shield called HC-06 is used, connected to Arduino
MEGA. This card contains a transceiver Bluetooth and
works at 3.3 V (even if it is indicated 3.6-6V).
Communicates with Arduino through a serial port, so by a
TX wire and an RX wire. These two signals follow the 3.3V
CMOS standard so as not to damage the card a level
shifter is required, to transform digital signals from 5V
used on Arduino board (UNO or MEGA) to 3.3V and to
transform the 3.3V signals from the shield to the 5V
requested by Arduino.
Serial port 1 (of 4) of Arduino
MEGA is used: pin 18 (TX1)
and 19 (RX1). The TXD pin
of the HC-06 card is therefore
connected to the level shifter
and then to Arduino's RX1
pin. The RXD pin of the
HC-06 card is connected to the level shifter and after the conversion to the TX1 pin of Arduino.
https://www.sunfounder.com/bluetooth-transceiver-module-hc-06-rs232-4-pin-serial.html
MEASUREMENTS WITH ARDUINOData communication from smartphone to Arduino via Bluetooth page 133
Measurements with Arduino – Ing. Paolo Guidorzi
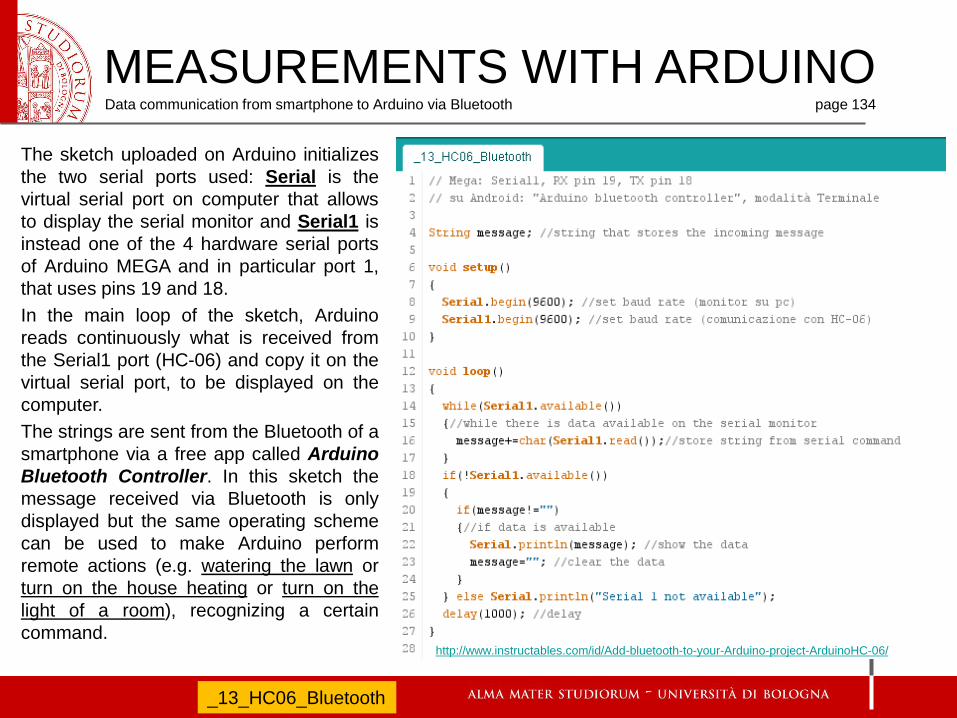
The sketch uploaded on Arduino initializes
the two serial ports used: Serial is the
virtual serial port on computer that allows
to display the serial monitor and Serial1 is
instead one of the 4 hardware serial ports
of Arduino MEGA and in particular port 1,
that uses pins 19 and 18.
In the main loop of the sketch, Arduino
reads continuously what is received from
the Serial1 port (HC-06) and copy it on the
virtual serial port, to be displayed on the
computer.
The strings are sent from the Bluetooth of a
smartphone via a free app called Arduino
Bluetooth Controller. In this sketch the
message received via Bluetooth is only
displayed but the same operating scheme
can be used to make Arduino perform
remote actions (e.g. watering the lawn or
turn on the house heating or turn on the
light of a room), recognizing a certain
command.http://www.instructables.com/id/Add-bluetooth-to-your-Arduino-project-ArduinoHC-06/
_13_HC06_Bluetooth
MEASUREMENTS WITH ARDUINOData communication from smartphone to Arduino via Bluetooth page 134

MEASUREMENTS WITH ARDUINOData communication from smartphone to Arduino via Bluetooth page 135
Measurements with Arduino – Ing. Paolo Guidorzi

1. The HC-06 module will appear in the list of Bluetooth devices
2. With the Arduino Bluetooth Controller (Android) app, connect to HC-06 in "Terminal" mode
3. Once connected, the flashing LED of the HC-06 will remain steady on
4. In the Arduino IDE on the computer open the serial monitor
5. From the app terminal on the phone, type a sentence and send it via Bluetooth
6. In the serial monitor on the computer the sentence received from Arduino will appear
MEASUREMENTS WITH ARDUINOData communication from smartphone to Arduino via Bluetooth page 136
Measurements with Arduino – Ing. Paolo Guidorzi

Using of a Multiplexer
It may sometimes be necessary to use a multiplexer, an
electronic device that works in a similar way to a rotary
selector, when for example it’s required to connect
sequentially a single ADC with several external analog
sensors.
The shield used is a simple adapter of the CD74HC4067
integrated circuit. It can be powered from 2V to 6V.
Through the 4 digital inputs S0..S3 can be selected
which of the 16 pins C0..C15 is connected to the (single)
SIG pin (in bidirectional mode) via binary logic: the
number in base 2 set to S0..S3 pins is converted in the
decimal Cx number. The EN pin if connected at a HIGH
logic level disables all connections (inverted logic). The
use is very simple: 4 Arduino digital outputs are
connected to the 4 selection pins S0..S3 and by using
binary logic the desired electrical connection between
SIG and C0..15 is established.
https://www.sparkfun.com/products/9056
MEASUREMENTS WITH ARDUINOUsing of a Multiplexer page 137
Measurements with Arduino – Ing. Paolo Guidorzi
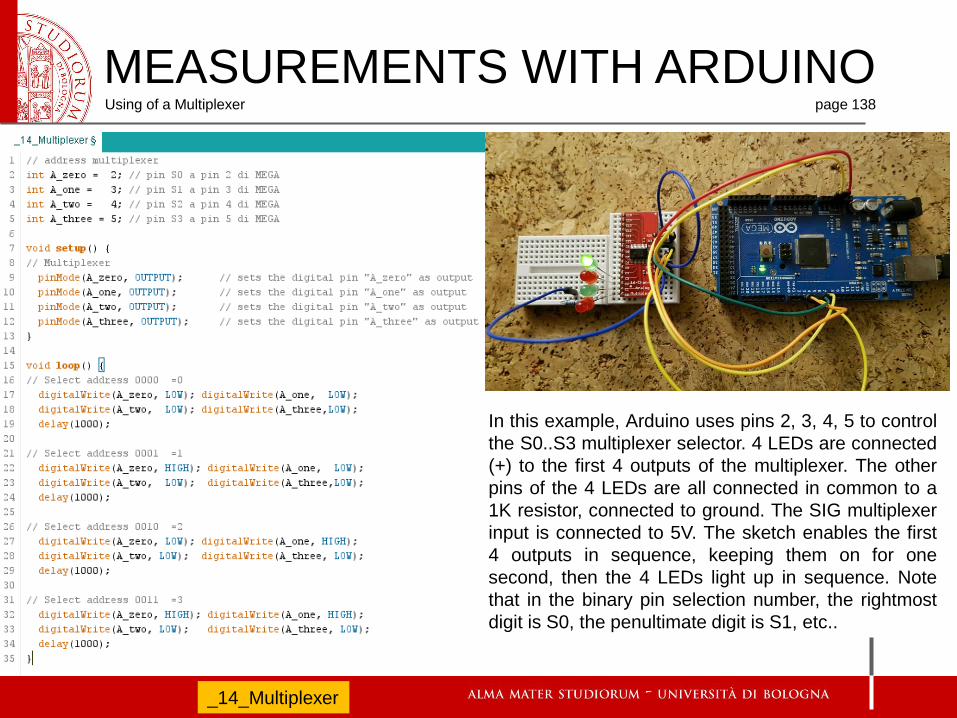
In this example, Arduino uses pins 2, 3, 4, 5 to control
the S0..S3 multiplexer selector. 4 LEDs are connected
(+) to the first 4 outputs of the multiplexer. The other
pins of the 4 LEDs are all connected in common to a
1K resistor, connected to ground. The SIG multiplexer
input is connected to 5V. The sketch enables the first
4 outputs in sequence, keeping them on for one
second, then the 4 LEDs light up in sequence. Note
that in the binary pin selection number, the rightmost
digit is S0, the penultimate digit is S1, etc..
_14_Multiplexer
MEASUREMENTS WITH ARDUINOUsing of a Multiplexer page 138

The "electronic nose" - Integrated multi-sensor platform based on Arduino
MEASUREMENTS WITH ARDUINOThe "electronic nose" - Integrated multi-sensor platform based on Arduino page 139
Measurements with Arduino – Ing. Paolo Guidorzi

SENSORS USED:
TEMPERATURE (Celsius)
RELATIVE HUMIDITY (%)
PRESSURE (Pa)
Brightness (Lux)
MQ-3: Alcohol
MQ-4: CH4 methane, natural gas
MQ-5: LPG, natural gas
MQ-6: LPG, iso-butane, propane
MQ-7: CO
MQ-8: Hydrogen H2
MQ-135: Ammonia NH3, NOx, alcohol, benzene, fumes, CO2, etc.
AIR-Q (MP-503): Alcohol and fumes
HCHO (WSP2110): Organic gases, toluene, benzene, methanol
MEASUREMENTS WITH ARDUINOThe "electronic nose" - Integrated multi-sensor platform based on Arduino page 140
Measurements with Arduino – Ing. Paolo Guidorzi
MEASUREMENTS WITH ARDUINOThe "electronic nose" - Integrated multi-sensor platform based on Arduino page 141
Measurements with Arduino – Ing. Paolo Guidorzi

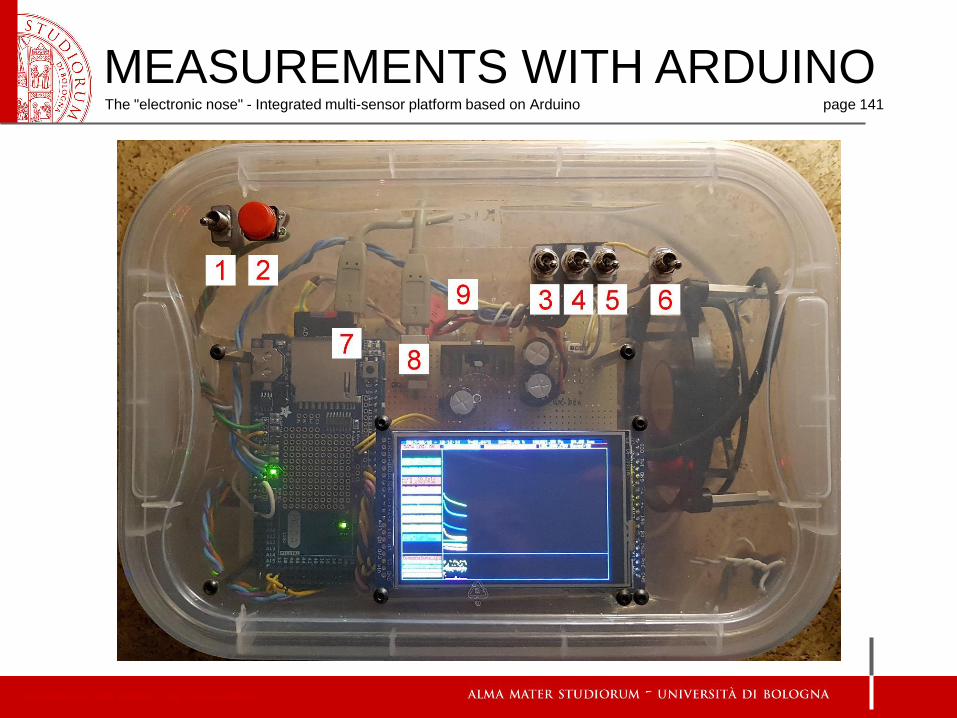
The instrument can operate either through an external power supply (9V or 12V), to be connected to the red
socket "9", or using a normal portable USB powerbank. In case of USB power supply, both sockets "7" and
"8" must be connected to the powerbank (one powers Arduino and the other one powers the sensors board).
1: ON/OFF: (when using 9V or 12V power supply)
2: RESET button: to restart the measurement log on a new file (an incremental number filename is
automatically assigned).
3: Data log ON/OFF: enables or disables data writing to file. Data writing can be enabled and disabled
several times during the measurement, without the need to reset the instrument. Data will be appended to
the current file when the option is enabled.
4: FAST / SLOW capture: Changes the data sampling period. When the mode is SLOW the numerical
values of each sensor are written to the display, each cycle, when the mode is FAST only the graph is
updated.
5: Select (a) sampling from all gas sensors plus Temperature, Relative Humidity, Pressure and Brightness,
or (b) Temperature, Relative Humidity, Pressure and Brightness only. Only the saved data are shown in the
graph.
6: Turns ON or OFF the forced air circulation fan.
7: Arduino USB power supply and connection to PC (only for programming)
8: USB sensor power supply. Use 7 and 8 together to power from battery pack
9: Red power socket: 9V or 12V power supply
MEASUREMENTS WITH ARDUINOThe "electronic nose" - Integrated multi-sensor platform based on Arduino page 142
Measurements with Arduino – Ing. Paolo Guidorzi

The measured data is saved on the SD card, in text format, which can be imported directly into Excel. When
the software is switched on, it checks the correct functioning of the system components. In case "sensor error"
is shown, the sensor card is probably missing power supply ("8") and is being powered via USB. In case of
using socket "9" (not USB) both USB cables can be removed. The current size of the SD and the name of the
log file are also shown when the power is turned on. Each time the power is turned on, the number associated
with the data saving file name is increased by one, starting with the number of the last file saved previously.
Empty the card to restart the numbering from scratch.
Note: the measured data of Temperature, Relative Humidity, Pressure and Brightness are represented by the
correct value. The data from the gas sensors require calibration depending on the type of sensor and also on
the current temperature and humidity, following the specifications in the datasheets of the individual sensors.
MEASUREMENTS WITH ARDUINOThe "electronic nose" - Integrated multi-sensor platform based on Arduino page 143
Measurements with Arduino – Ing. Paolo Guidorzi

MEASUREMENTS WITH ARDUINOThe "electronic nose" - Integrated multi-sensor platform based on Arduino page 144
#include of libraries for the used
digital sensors.
Initialization of sensors and
devices (ADC, Graphic display,…).
Measurements with Arduino – Ing. Paolo Guidorzi

Definition of variables and
constants
MEASUREMENTS WITH ARDUINOThe "electronic nose" - Integrated multi-sensor platform based on Arduino page 145
Measurements with Arduino – Ing. Paolo Guidorzi

Setup: sensors and variables
initialization
MEASUREMENTS WITH ARDUINOThe "electronic nose" - Integrated multi-sensor platform based on Arduino page 146
Measurements with Arduino – Ing. Paolo Guidorzi

Setup: sensors and variables
initialization
MEASUREMENTS WITH ARDUINOThe "electronic nose" - Integrated multi-sensor platform based on Arduino page 147
Measurements with Arduino – Ing. Paolo Guidorzi
Setup: sensors and variables
initialization
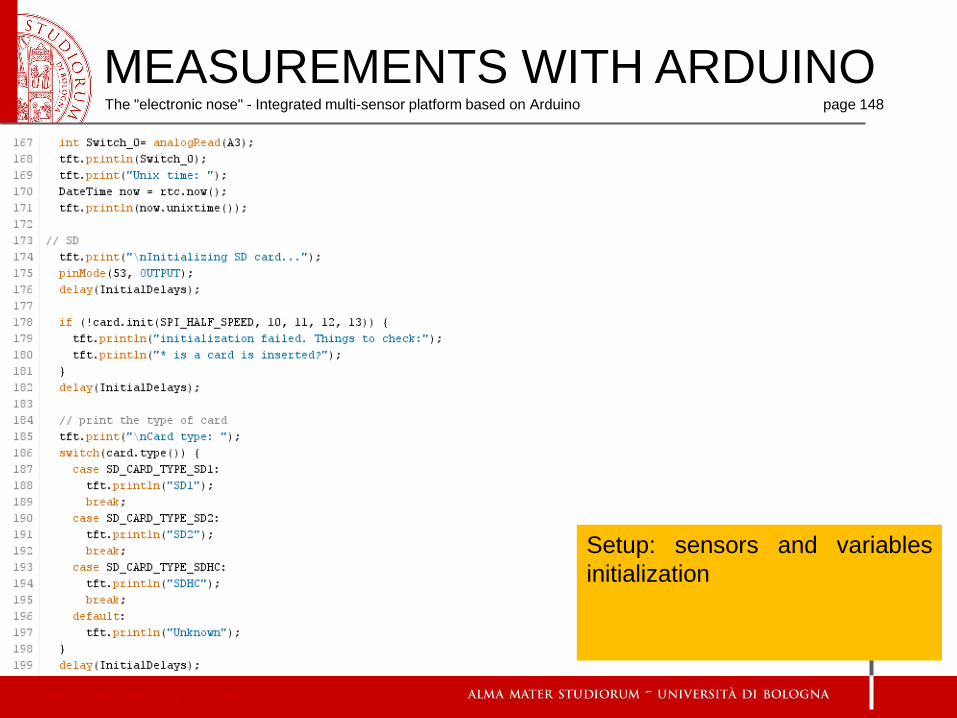
MEASUREMENTS WITH ARDUINOThe "electronic nose" - Integrated multi-sensor platform based on Arduino page 148
Measurements with Arduino – Ing. Paolo Guidorzi

Setup: sensors and variables
initialization
MEASUREMENTS WITH ARDUINOThe "electronic nose" - Integrated multi-sensor platform based on Arduino page 149
Measurements with Arduino – Ing. Paolo Guidorzi

Setup: creation of the LOG file
and saving of the first line. The
"flush()" command forces the
writing, thus creating the file
Name assignment of the
LOG file, with filename
progressive numbering
MEASUREMENTS WITH ARDUINOThe "electronic nose" - Integrated multi-sensor platform based on Arduino page 150
Measurements with Arduino – Ing. Paolo Guidorzi

Creating the skeleton of the
display graphic
MEASUREMENTS WITH ARDUINOThe "electronic nose" - Integrated multi-sensor platform based on Arduino page 151
Measurements with Arduino – Ing. Paolo Guidorzi

Creating the skeleton of the
display graphic
END of SETUP sketch part
MEASUREMENTS WITH ARDUINOThe "electronic nose" - Integrated multi-sensor platform based on Arduino page 152
Measurements with Arduino – Ing. Paolo Guidorzi

MEASUREMENTS WITH ARDUINOThe "electronic nose" - Integrated multi-sensor platform based on Arduino page 153
Measurements with Arduino – Ing. Paolo Guidorzi

Declaration of some variables
and start of the LOOP part
MEASUREMENTS WITH ARDUINOThe "electronic nose" - Integrated multi-sensor platform based on Arduino page 154
Measurements with Arduino – Ing. Paolo Guidorzi

Writing the first line in the
display (temperature, humidity,
pressure, time,...)
MEASUREMENTS WITH ARDUINOThe "electronic nose" - Integrated multi-sensor platform based on Arduino page 155
Measurements with Arduino – Ing. Paolo Guidorzi

Acquisition of data from the
various gas sensors, writing the
value on the display (if the
option is enabled) and graphic
plot
MEASUREMENTS WITH ARDUINOThe "electronic nose" - Integrated multi-sensor platform based on Arduino page 156
Measurements with Arduino – Ing. Paolo Guidorzi

MEASUREMENTS WITH ARDUINOThe "electronic nose" - Integrated multi-sensor platform based on Arduino page 157
Acquisition of data from the
various gas sensors, writing the
value on the display (if the
option is enabled) and graphic
plot
Measurements with Arduino – Ing. Paolo Guidorzi

MEASUREMENTS WITH ARDUINOThe "electronic nose" - Integrated multi-sensor platform based on Arduino page 158
Acquisition of data from the
various gas sensors, writing the
value on the display (if the
option is enabled) and graphic
plot
Measurements with Arduino – Ing. Paolo Guidorzi

MEASUREMENTS WITH ARDUINOThe "electronic nose" - Integrated multi-sensor platform based on Arduino page 159
Acquisition of data from the
various gas sensors, writing the
value on the display (if the
option is enabled) and graphic
plot
Measurements with Arduino – Ing. Paolo Guidorzi

MEASUREMENTS WITH ARDUINOThe "electronic nose" - Integrated multi-sensor platform based on Arduino page 160
Acquisition of data from the
various gas sensors, writing the
value on the display (if the
option is enabled) and graphic
plot
Measurements with Arduino – Ing. Paolo Guidorzi
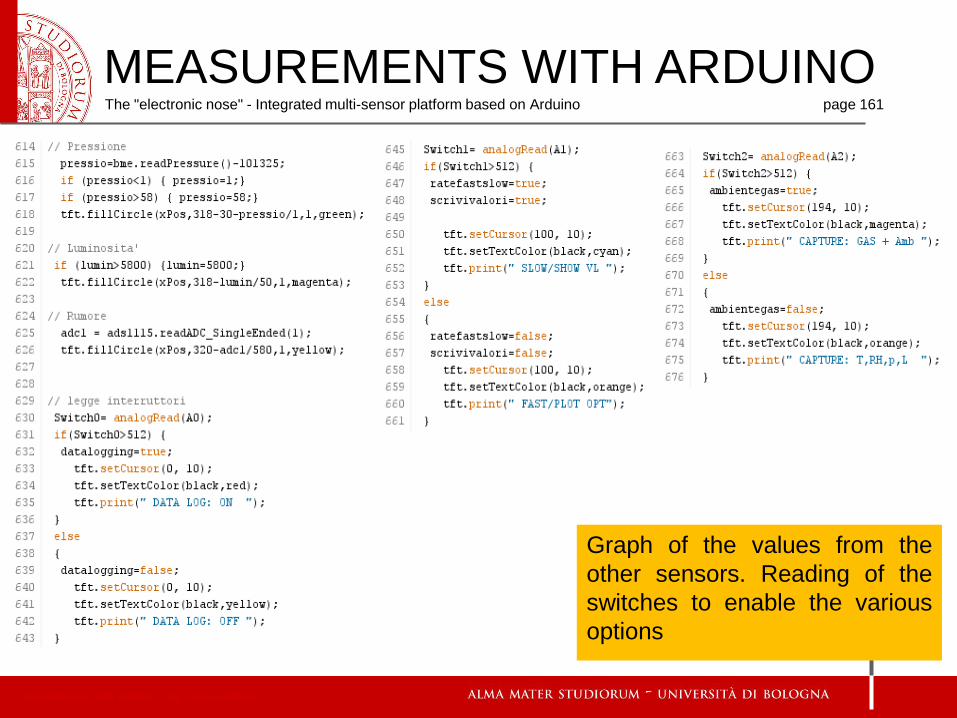
Graph of the values from the
other sensors. Reading of the
switches to enable the various
options
MEASUREMENTS WITH ARDUINOThe "electronic nose" - Integrated multi-sensor platform based on Arduino page 161
Measurements with Arduino – Ing. Paolo Guidorzi
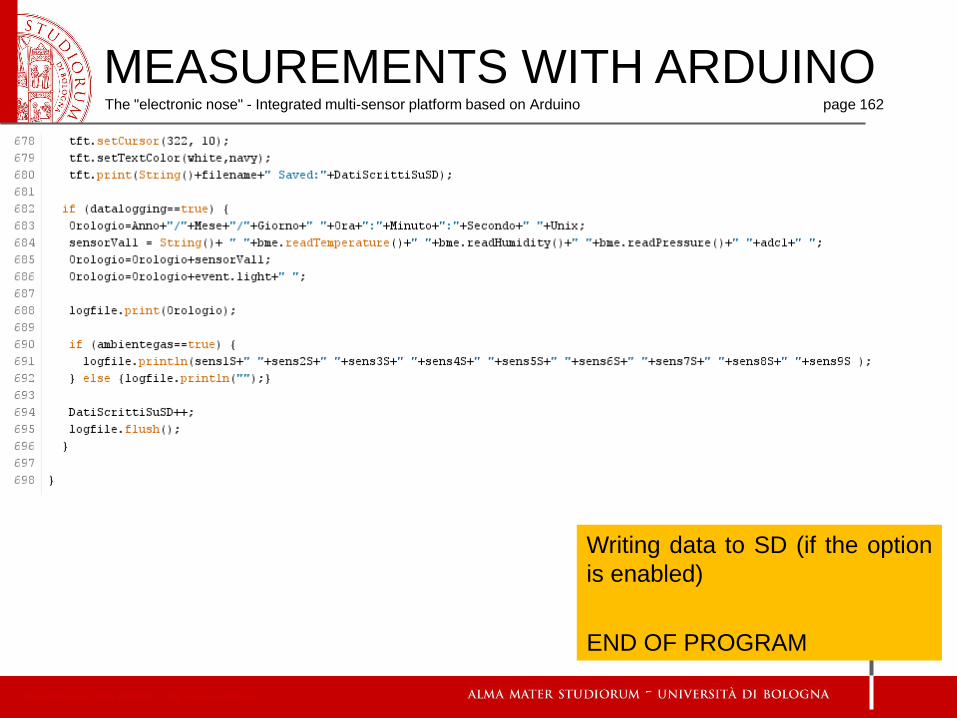
Writing data to SD (if the option
is enabled)
END OF PROGRAM
MEASUREMENTS WITH ARDUINOThe "electronic nose" - Integrated multi-sensor platform based on Arduino page 162
Measurements with Arduino – Ing. Paolo Guidorzi

MEASUREMENTS WITH ARDUINO
Measurements with Arduino – Ing. Paolo Guidorzi

Ing. Paolo GuidorziDipartimento di Ingegneria Industriale
http://acustica.ing.unibo.it/Staff/paolo/index.html
Some images and screenshots are taken from the site www.arduino.cc and other public domain or CC-BY-SA websites
These slides are licensed CC-BY-SA
https://creativecommons.org/licenses/by-sa/3.0/it/