Measurementof Glucose in Plasmaby a DifferentialpH Technique
6
CLIN. CHEM. 29/1, 80-85 (1983) 80 CLINICAL CHEMISTRY, Vol. 29, No. 1, 1983 Measurement of Glucose in Plasma by a Differential pH Technique M. Luzzana, G. Dossi, A. Mosca, A. Granelli, D. Berger, E. Rovida, M. Ripamonti, A. Musetti, and L Rossi-Bemardi A new automatic apparatus based on the differential mea- surement of pH between two solutions has been developed. Two 25-FL (internal volume) glass capillary electrodes are used to measure the results of automated (under microcom- puter control) chemical reactions that lead to the liberation or the uptake of hydrogen ions. The sensitivity of the differential pH measurements is better than ± 0.0001 pH unit, and the change in H concentration that can be detected by such an apparatus is 1 mol/L for plasma and 3 tmol/L for whole blood. The technique has been applied to the measurement of glucose in plasma, giving results in agreement with the specifications of the Food and Drug Administration reference method for quantitative determination of glucose (hexoki- nase/glucose-6-phosphate dehydrogenase method). Additional Keyphrases: change in pH as related to enzyme activity . glass capillary electrodes We have previously shown (1) that differences in pH between two solutions can be measured by using two glass electrodes, and we have applied this technique to the determination of glucose in aqueous solutions by measuring the change in pH produced by the hexokinase-catalyzed ATP-glucose reaction (2). The sensitivity of the method was about 5 x io- pH units, indicating that the pH method might be useful in the measurement of analytes of analyti- cal and climco-chemical interest. However, our previously described apparatus was not suitable for routine work and we sought to develop a fully automated instrument that could perform a variety of analytical functions, i.e., addition of reagents, filling and standardization of the electrodes, and calculation of results. Here we describe this new instrument and report the results of its application to the routine determination of glucose in plasma. We have also developed theoretical equations that predict the sensitivity of the method when applied to the determination of analytes in human plasma or whole blood. Materials and Methods The Differential pH System The basic components of the apparatus are shown sche- matically in Figure 1. Cuvette C is filled by the peristaltic pump P2 with a buffer from a separate reservoir (not shown). By means of the peristaltic pump P3 the content of the cuvette can be brought to constant volume (typically about 800 iL). The contents of cuvette C can be mixed by magnet N, which is covered with inert plastic, magnetically coupled to another magnet, and driven by motor M. El and E2 are two capillary electrodes (Ingold AG, Zurich, Switzer- land), made specially for this work. The electrodes have an internal volume of about 25 L and can be filled with the solution contained in cuvette C by the action of peristaltic pumps P4 and P5, respectively. Electrodes El and E2 are contained in a stainless-steel block to ensure an equal and constant temperature. They are joined in a Perspex (methyl methacrylate polymer) block, which is connected to cuvette C by a short length of silicone tubing. The liquid junction between the solutions contained in the electrodes is made in an all-liquid T-joint drilled in the Perspex block connecting the two electrodes. The grounding point G is made by a gold wire fixed before or at the liquid junction. The solution after this point is insulated from ground to avoid spurious electro- chemical potentials arising from various parts of the system. Cuvette C and removable plug B are both made of Perspex. Peristaltic pump P1 is used to introduce a reagent, such as an enzyme solution, into cuvette C. The electronic circuitry used to control peristaltic pumps P1 to P5 and motor M, and to monitor the output of electrodes El and E2, is based on a Z8OA microprocessor (Zilog Inc., Cupertino, CA) run by a program written in machine language. The program takes 8K bytes of EPROM memory and includes a mathematical package for all calcu- lations. A driver board with solid-state switches activates the pumps and the stirrer. Electrode output is fed into a high-input impedance differential amplifier, as previously described (2). The peak-to-peak noise of the system, when filled with the standard buffer solution used in this work, is less than ± 0.0001 pH unit. Data acquisition by the micro- processor is via a 12-bit resolution high-speed analog-to- digital converter (Analog Devices, Norwood, MA 02062). Further technical details will be described elsewhere. Principles of operation. The apparatus can perform, under microprocessor control, four operations. (a) Wash: in this cycle, pumps P2-P4 are programmed to wash cuvette C, the connecting tubes, and electrodes El and E2 with standard buffer,leaving cuvette C filledwith a known amount of standard buffer. (b) Calibration: this cycle is started by the operator, who introduces through plug Ba known amount, typically 10 iL, of glucose standard. Motor M is automati- cally activated for 2 s to mix the content of cuvette C, then Cattedra di Chimica Biologica ffi, University of Milan, do Ospedale San Raffaele, Via Olgettina 60, 20133 Milan, Italy, and Centro diFisiologia delLavoro Muscolare del C.N.R., Milan, Italy. Received June 10,1982; accepted Sept. 22,1982. Fig. 1. Schematic diagram of the pH apparatus P1 to P5,penstaltic pumps; B, a stopper to keep the content of cuvette C anaerobic and constant in volume; N. a magnetic stirrer covered in plastic; M, stirring motor; 0, ground; El and E2, 25-L (internal volume) glass capillary electrodes; A, a differential amplifier
-
Upload
independent -
Category
Documents
-
view
2 -
download
0
Transcript of Measurementof Glucose in Plasmaby a DifferentialpH Technique
CLIN. CHEM. 29/1, 80-85 (1983)
80 CLINICAL CHEMISTRY, Vol. 29, No. 1, 1983
Measurement of Glucose in Plasma by a Differential pH TechniqueM. Luzzana, G. Dossi, A. Mosca, A. Granelli, D. Berger, E. Rovida, M. Ripamonti, A. Musetti,and L Rossi-Bemardi
A new automatic apparatus based on the differential mea-surement of pH between two solutions has been developed.Two 25-FL (internal volume) glass capillary electrodes areused to measure the results of automated (under microcom-puter control) chemical reactions that lead to the liberation orthe uptake of hydrogen ions. The sensitivity of the differentialpH measurements is better than ± 0.0001 pH unit, and thechange in H concentration that can be detected by such anapparatus is 1 mol/L for plasma and 3 tmol/L for wholeblood. The technique has been applied to the measurementof glucose in plasma, giving results in agreement with thespecifications of the Food and Drug Administration referencemethod for quantitative determination of glucose (hexoki-nase/glucose-6-phosphate dehydrogenase method).
Additional Keyphrases: change in pH as related to enzymeactivity . glass capillary electrodes
We have previously shown (1) that differences in pHbetween two solutions can be measured by using two glasselectrodes, and we have applied this technique to thedetermination of glucose in aqueous solutions by measuringthe change in pH produced by the hexokinase-catalyzedATP-glucose reaction (2). The sensitivity of the method was
about 5 x io- pH units, indicating that the pH methodmight be useful in the measurement of analytes of analyti-cal and climco-chemical interest. However, our previouslydescribed apparatus was not suitable for routine work andwe sought to develop a fully automated instrument thatcould perform a variety of analytical functions, i.e., additionof reagents, filling and standardization of the electrodes, andcalculation of results.
Here we describe this new instrument and report theresults of its application to the routine determination ofglucose in plasma. We have also developed theoreticalequations that predict the sensitivity of the method whenapplied to the determination of analytes in human plasmaor whole blood.
Materials and Methods
The Differential pH System
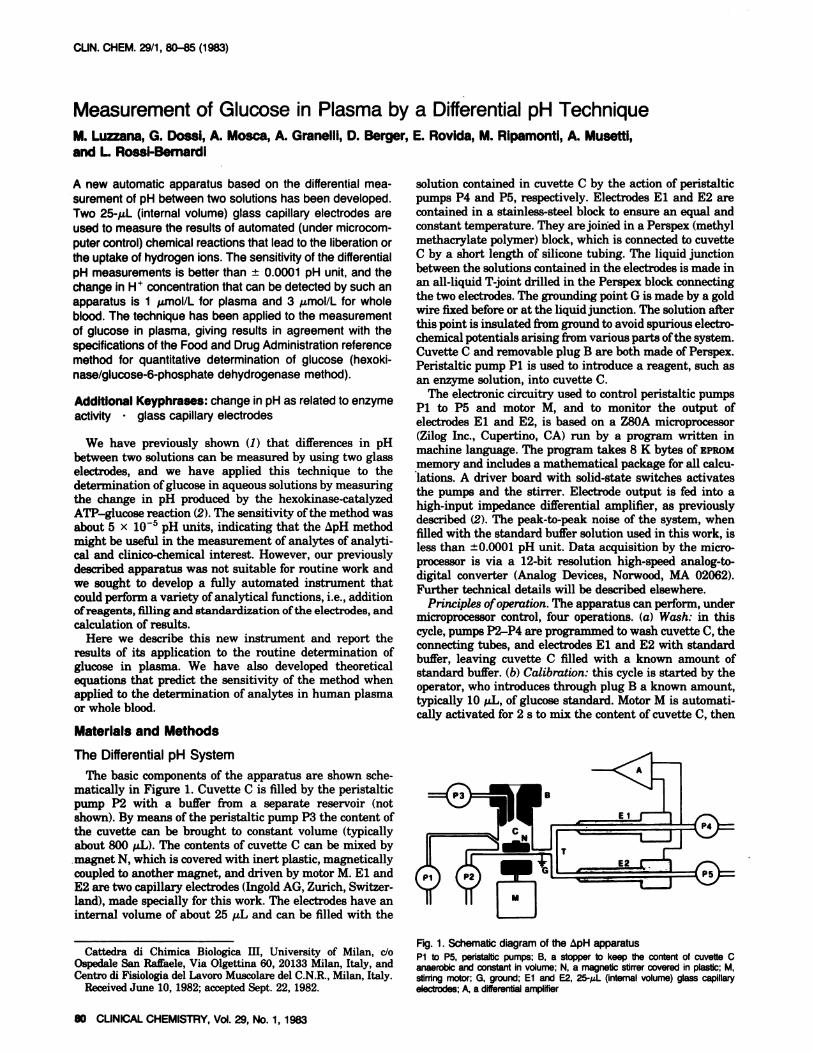
The basic components of the apparatus are shown sche-matically in Figure 1. Cuvette C is filled by the peristalticpump P2 with a buffer from a separate reservoir (notshown). By means of the peristaltic pump P3 the content ofthe cuvette can be brought to constant volume (typicallyabout 800 iL). The contents of cuvette C can be mixed bymagnet N, which is covered with inert plastic, magneticallycoupled to another magnet, and driven by motor M. El andE2 are two capillary electrodes (Ingold AG, Zurich, Switzer-land), made specially for this work. The electrodes have aninternal volume of about 25 L and can be filled with the
solution contained in cuvette C by the action of peristalticpumps P4 and P5, respectively. Electrodes El and E2 arecontained in a stainless-steel block to ensure an equal andconstant temperature. They are joined in a Perspex (methylmethacrylate polymer) block, which is connected to cuvetteC by a short length of silicone tubing. The liquid junctionbetween the solutions contained in the electrodes is made inan all-liquid T-joint drilled in the Perspex block connectingthe two electrodes. The grounding point G is made by a goldwire fixed before or at the liquid junction. The solution afterthis point is insulated from ground to avoid spurious electro-chemical potentials arising from various parts of the system.Cuvette C and removable plug B are both made of Perspex.
Peristaltic pump P1 is used to introduce a reagent, such asan enzyme solution, into cuvette C.
The electronic circuitry used to control peristaltic pumpsP1 to P5 and motor M, and to monitor the output ofelectrodes El and E2, is based on a Z8OA microprocessor(Zilog Inc., Cupertino, CA) run by a program written inmachine language. The program takes 8 K bytes of EPROM
memory and includes a mathematical package for all calcu-lations. A driver board with solid-state switches activatesthe pumps and the stirrer. Electrode output is fed into ahigh-input impedance differential amplifier, as previouslydescribed (2). The peak-to-peak noise of the system, whenfilled with the standard buffer solution used in this work, isless than ± 0.0001 pH unit. Data acquisition by the micro-processor is via a 12-bit resolution high-speed analog-to-digital converter (Analog Devices, Norwood, MA 02062).Further technical details will be described elsewhere.
Principles of operation. The apparatus can perform, undermicroprocessor control, four operations. (a) Wash: in thiscycle, pumps P2-P4 are programmed to wash cuvette C, theconnecting tubes, and electrodes El and E2 with standardbuffer,leaving cuvette C filledwith a known amount ofstandard buffer. (b) Calibration: this cycle is started by theoperator, who introduces through plug B a known amount,typically10 iL, of glucose standard. Motor M is automati-cally activated for 2 s to mix the content of cuvette C, then
Cattedra di Chimica Biologica ffi, University of Milan, do
Ospedale San Raffaele, Via Olgettina 60, 20133 Milan, Italy, andCentro diFisiologiadelLavoro Muscolare del C.N.R., Milan, Italy.
Received June 10,1982; accepted Sept. 22,1982.
Fig. 1. Schematic diagram of the pH apparatusP1 to P5,penstaltic pumps; B, a stopper to keep the content of cuvette Canaerobic and constant in volume; N. a magneticstirrer covered in plastic; M,stirring motor; 0, ground; El and E2, 25-L (internal volume) glass capillaryelectrodes;A, a differential amplifier

CLINICAL CHEMISTRY, Vol. 29, No. 1, 1983 81
solutions used for the determination of glucose according tothe hexokinase/06P dehydrogenase method as developed bythe FDA (3), referred to in this paper as the “referencemethod,” were prepared according to the instructions inAppendix A of ref. 3. The procedures outlined in the FDAreport were strictly followed as regards calibration stan-dards, reagents, instrumentation, data evaluation, and com-putation.
The spectrophotometer used in determining glucose bythe reference method was a Spectracomp 601 (Carlo Erba,Milano, Italy) calibrated against NBS reference material.We also used a Radiometer titration system type ‘1TI’61,with an ABU8O autoburette and a PHM84 pH meter(Radiometer, Copenhagen, Denmark), as an alternative
system for studying reaction 2 in aqueous solutions.All measurements with the pH apparatus described in
Figure 1 were obtained at 22 ± 1 #{176}C.However, the differencein temperature between the two glass electrodes was notmore than 0.01 #{176}C.Under such conditions the effect oftemperature on the pH and buffer power of standard buffercan be considered negligible.
(1) Samples and interfering substances. To test the perform-ance of the pH apparatus, by determining the concentra-tion of glucose in plasma, we followed the experimental planproposed by the FDA, Bureau of Medical Devices (3).Accordingly, we prepared three plasma samples by poolingindividual plasma samples with a low glucose concentration(less than 0.70 g/L), dividing this pool into three parts, andenriching two of them by adding D( + )-glucose to a concen-tration of about 1.40 and 2.40 gIL. In addition, we analyzedby the pH method normal and pathological plasma sam-ples containing glucose in the concentration range 0.5 to4.00 g/L.
To test the specificity of the zpH method, we determinedthe glucose concentration of two pools of plasma (glucoseconcentration 1.36 g/L) before and after the addition of thefollowing interfering substances (final concentration, g/L):sodium salicylate (0.35), sodium fluoride (2.00), K2EDTA(1.00), heparin (1.00), sodium citrate (5.00), fructose (0.10),galactose (0.10), xylose (0.10), maltose (0.10), lactose (0.10),creatinine (0.10), bilirubin (0.10), and uric acid (0.10).Whenever the addition caused a change in pH, we addedacid or base to bring the specimen back to its initial value.For each interfering substance used we compared values for26 specimens with and without the addition of the interfer-ing substance.
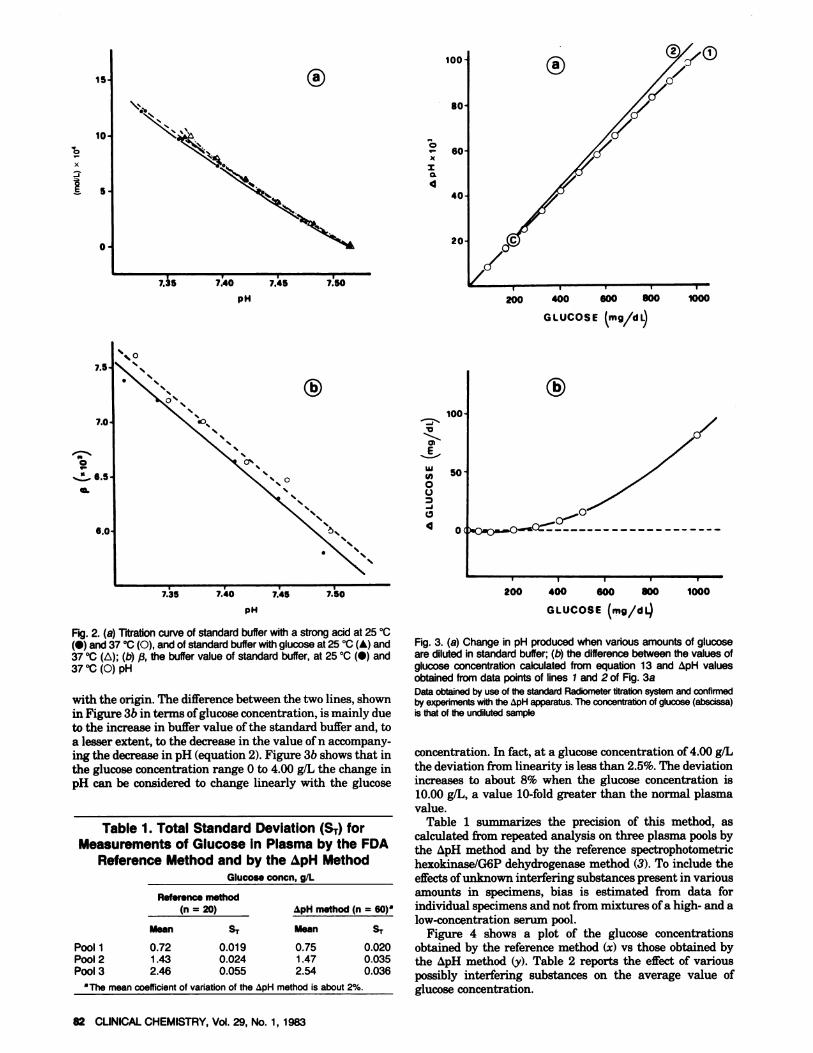
ResultsFigure 2a shows a curve for the titration with strong acid
ofthe standard bufferused in this work at 25 and 37 #{176}C,anda titration curve of the same bufferwith standard glucoseaccording to reaction 2. At pH 7.5, the titration curvesshow that the addition of one equivalent of glucose liberatesabout one equivalent of hydrogen ions, i.e., n (equation 2)1. Only below pH 7.4 does n progressively decrease. It is alsoapparent that in the pH range 7.4-7.5 the effect of tempera-ture on n is negligible. Figure 2b shows how the buffer valueof the standard buffer changes with pH over the pH interval7.3-7.5, at 25 and 37 #{176}C.
Figure 3a shows how the pH of the standard buffercontaining 4 U of hexokinase changes by the addition ofvarious amounts of glucose (line one). Addition of 1.00 g ofglucose per liter changes the pH of the standard buffer by0.01 pH unit; therefore, a system with a sensitivity of atleast 0.0001 pH unit is required for the accurate determina-tion of glucose in plasma by the pH method. Line 2 wasobtained by connecting point C, which represents the pHchange caused by the addition of 2.00 g of glucose per liter,
(2)
about 300 .tL of solution is aspirated by pumps P4 and P5into electrodes El and E2. Pump P1 then injects into cuvette
C a known quantity of hexokinase solution (typically 5 L),motor M is activated for another 2 s,and pump P5 aspiratesabout 300 tL ‘bf the enzyme-reacted solution into electrodeE2. After a suitable time (about 2-4 s for reaction 2), thedifference in pH between El and E2 (pH1) is calculatedfrom the difference in potential between two electrodes. (c)Measure: the operation described under the calibration cycleis repeated, except that a known quantity of a solutioncontaining an unknown amount of glucose is added. Asecond value of the difference in output of the two electrodes(pH2) is then measured. (d) Blank: in this cycle no stan-dard or sample is added, and the effect of the addition of theenzyme to the pH of the solution is determined (pH0).
Determination of Glucose
When glucose isplaced in a solutioncontaining ATP in
the presence of the enzyme hexokinase, ADP and glucose 6-phosphate (G6P) are formed, and the equilibrium
glucose + ATP G6P + ADP
is readily established. Because the PKa of ATP differs fromthose of G6P and ADP, the pH of the solution changesduring the reaction course. The actual reaction that occursin solution at pH 7.5 can be written symbolically (2) as
glucose + ATP G6P + AI)P + nH
where ATP, ADP, and G6P represent all of the differentcharged species in the solution for ATP, ADP, and G6P,respectively, and n is the number of hydrogen ions producedin the reaction. Therefore the liberation of n protons pro-vides a means of determining the concentration of glucose inthe original sample.
Chemicals and solutions. Hexokinase (ATP:n-hexose 6-phosphotransferase, EC 2.7.1.1) was obtained from Sigma
Chemical Co., St. Louis, MO 63178, as a lyophilized powder.We generally do not recommend using enzymes suspendedin concentrated ammonium sulfate or in strong buffers forthis work, because their addition to the solution mayconsiderably change its buffer power. ATP (sodium salt,trihydrate) and NAD (free acid) were obtained from Boeh-ringer, Mannheim, F.R.G. Sterox SE was purchased fromBaker Chemicals, Deventer, Holland. Certified NationalBureau of Standards (NBS) i( + )-glucose and G6P dehydrog-enase (n-glucose-6-phosphate:NADP 1-oxidoreductase, EC1.1.1.49) were a generous gift from Ames Miles, Milano,Italy. Carbon dioxide-free water and reagent water wereprepared as described (3). All other reagents were analyticalgrade.
The buffer medium used in this work to study reaction 2(hereafterreferred to as “standard buffer”)has the composi-tion: KC1 (0.1 mol/L), MgCl2 (3 mmolJL), NaN3 (0.5 g/L),Sterox SE (1.0 g/L), potassium phosphate (17.7 mmol/L),ATP (1.4 mmolIL), pH 7.50 (at 25 #{176}C).The stability of thestandard buffer was assessed by measuring the change inpH, ATP concentration, and hexokinase activity after stor-age in stoppered containers. The pH and ATP concentra-tions were stable for at least six days in room temperature.The hexokinase, however, lost 17% and 37% of its activityafter one and three days, respectively, at room temperature
(-0% and 18%, respectively, after one and two days at 5 #{176}C).We therefore dissolved the hexokmase in 0.5 mL of standardbuffer just before use to give a final concentration of 850 kU/L.
To prepare the working glucose standard we dissolvedstandard amounts of anhydrous n( + )-glucose in 100 mL of0.1 mol/L KCI containing 0.5 g of NaN3 per liter. The
15
10
S
0
80
60
40
20
7.35 7.40 7.5 7.50
pH
7.5
C
I
uJ
01)
-J
200 400 600 800 1000
GLUCOSE (m9/dt.)
‘S
‘S
S.S..
pH
7.45 200 400 600 800 1000
GLUCOSE (mg/dL)
Table 1. Total Standard Deviation (S1) forMeasurements of Glucose in Plasma by the FDA
Reference Method and by the pH MethodGlucose concn, gIL
The mean coefficient of variation of the pH method is about 2%.
100
82 CLINICAL CHEMISTRY, Vol. 29, No. 1, 1983
Fig. 2. (a) Titration curve of standard bufferwith a strong acid at 25 #{176}C(#{149})and 37#{176}C(0), and of standardbufferwith glucoseat 25#{176}C(A) and37#{176}C(A); (b) f3,the buffer value of standard buffer, at 25 #{176}C(#{149})and37 #{176}C(0) pH
with the origin. The difference between the two lines, shownin Figure 3b in terms of glucose concentration, is mainly dueto the increase in buffer value of the standard buffer and, toa lesser extent, to the decrease in the value of n accompany-ing the decrease in pH (equation 2). Figure 3b shows that inthe glucose concentration range 0 to 4.00 g/L the change inpH can be considered to change linearly with the glucose
Reterencemethod(n = 20) pH meth od (n = 60)a
Mean S Mean S,.
Pool 1Pool 2Pool 3
0.721.43
2.46
0.019
0.0240.055
0.75
1.472.54
0.0200.0350.036
Fig. 3. (a) Change in pH produced when various amounts of glucoseare diluted in standard buffer; (b) the differencebetweenthe values ofglucose concentration calculated from equation 13 and pH valuesobtained from data points of lines I and 2 ofFig.3aData obtained by use of the standard Radiometer titration system and confirmedby experiments with the pH apparatus. The concentrationof glucose(abscissa)is that of the undilutedsample
concentration.In fact,at a glucose concentrationof4.00 g/Lthe deviation from linearityisless than 2.5%. The deviationincreases to about 8% when the glucose concentration is10.00 g/L, a value 10-fold greater than the normal plasmavalue.
Table 1 summarizes the precision of this method, ascalculated from repeated analysis on three plasma pools bythe pH method and by the reference spectrophotometrichexokinase/G6P dehydrogenase method (3). To include theeffects of unknown interfering substances present in variousamounts in specimens, bias is estimated from data forindividual specimens and not from mixtures of a high- and alow-concentration serum pool.
Figure 4 shows a plot of the glucose concentrationsobtained by the reference method (x) vs those obtained bythe ipH method (y). Table 2 reports the effect of variouspossibly interfering substances on the average value ofglucose concentration.

00II-‘U
-)
E
‘UIa0U
-a0
100 200 300
GLUCOSE m/dL(REFERENCE METHOD)
Fig. 4. Correlation between glucose concentrations obtained by thereferencemethod (x) vs those obtained by the pH method (y)Solid line, identity line, dashed line, y 1.01 lx + 0.044 (n = 120, r = 0.996).Each point is the mean of two determinations
Discussion
Apparatus and Performance
= + Vj35Vb + V.
Because the sample is also diluted from a volume V8 to V5/(V5 + Vb), the total change of [B] or 1W] in the undilutedsample will be given by
d[B] = -d[HI = [v8±Vb X x dpH (5)
For finite increments, equation 5 becomes
[BI = -[H1 = (Y + pH (6)
The sensitivity (5) may be defined as the ratio of the changein the response (pH) to the change in the concentration ofthe quantity that is measured (X[B] or
5_dpH_ dpH V5- d[BI - dEW] - VbPb + Vj35
Concn,Glucose concn, mgIL
Substance
Sodium salicylateBilirubinCreatinineUric acidSodiumfluorideK2EDTAHeparinSodiumcitrateLactoseFructoseGalactoseXyloseMaltose
= values by FDA reference method, y = values by pH method, i =
(y-x)/concn of potential interferent.
CLINICAL CHEMISTRY, Vol. 29, No. 1, 1983 83
(b) the addition to the pH system of a reactor (cuvette C,Figure 1) with a known volume, in which a solution (or asuspension) containing an analyte may be diluted in aproper buffering medium and reacted with a suitable rea-gent, such as an enzyme; and (c) the adoption of a microcom-puter to direct the operation of the system and calculate theconcentration of the analyte of interest. Applied to themeasurement of analytes in biological fluids, the techniquehas obvious advantages over standard photometric tech-niques, because whole blood, plasma, urine, etc., can beanalyzed directly without a preliminary deproteinizationstep. Furthermore, whereas optical techniques often requirethe use of several consecutive reactions to obtain an absor-
bance change related to the concentration of the analyte ofinterest, this often need not be the case for a potentiometricapproach.
The main problem, which is inherent to any pH-relatedanalytical technique, is that pH is the measured variable,whereas [HI, the amount of hydrogen ions liberated or
absorbed in the reaction, is what is required to calculate thestoichiometry of the reaction. The relationship between pHand [H + I is given by the well-known Van Slyke bufferequation, which can be applied, for all practical purposes, inthe pH interval where the buffer value of water is negligible.
dIB] = -dEH’l = f3dpH (3)
where /3 is the buffer value of the solution. If, at constant pH,a volume V of sample with an intrinsic buffer value p isadded to a volume Vb of buffer whose value is Pb, the totalbuffer value of the system will be (as a first approximation)
We have previously shown (1) that the sensitivity thatcan be reached in the measurement of pH by two glasselectrodes is about 5 x i05 pH units. Practical limitationsto the application of the differential pH technique havealready been discussed, and an improved version of theoriginal differential pH apparatus has been described (2).Here we have shown how by further improvements thedifferential pH technique can be applied to the automaticdetermination of analytes in serum, blood, or other biologi-cal fluids. Indeed, the technique can be useful in other fieldssuch as analytical, food, and agricultural chemistry; becauseit relies on sensors specific for the measurement of hydrogenion activity, it is, to a large extent, independent of the kindof solutions or suspensions being used.
The improvements reported here are (a) the adoption oftwo capillary pH electrodes (internal volume about 25 DL);
Table 2. Effect of Potential Interferents on theGlucose Concentration of a Pooled Plasma
Sample
mgIL x 9 -x I Equation 6 shows that the maximum sensitivity is reached
349 13595 1351 9 76 0022 when Vb/3b = 0; under such conditions Smax = 1/ps. Thus99 1415.6 1411.2 4.4 0:044 maximum sensitivityis obtained when measuring pure92 1318.3 1319.9 1.7 0.018 sample, or sample diluted in pure water, provided that the
100 1333.1 1330.8 2.4 0.024 pH is such that one can assume that 13H20 0. For all other2000 1389.6 1388.4 1.3 0.001 conditions, such as when the sample is diluted into a
991 1366.6 1366.8 0.2 0.001 solution of definite buffer value, the sensitivity is corre-1326.0 0.010 spondingly reduced according to equation 7.
95 1371.5 1354:9 16:6 0.174 The overall electrochemical performance of the system95 1367.8 1412.2 44.4 0.467 described in this paper can be assessed in terms of the95 1369.8 1367.0 2.8 0.030 sensitivity of the differential pH measurement and of its95 1344.0 1349.7 5.7 0.059 stability. A series of 10 successive readings of pH values95 1364.6 1370.6 6.05 0.064 resulting from 10 calibration cycles involving 10 L of
standard (1.00 g/L) aqueous glucose solutions gave thefollowing typical values: zpH = 0.0122 (SD 0.0001). Ordi-

(Pb’Vb’ + PEVE + f3r,VpLglucose] = V’ + VE + V
- Pb’Vb’ + /3EVE + 11
Vb’ + V5 + V
whence
[glucoseI = fC(zpH2 - pH0”) (12)
The buffer power of standard buffer Pbshould be changedfrom Pbto Pb’ to take into account the effect of the addition ofplasma on the pH and hence on the Pbof standard buffer.Infact, the effect is very small. If/3,, = 9.4 x i0 and the pHvariation in individual plasma samples does not exceed ±
0.5 pH unit,the total amount of base or acid added to thestandard would be at most ±9,4 x 0,5 x 10-/81 = ±58zmoLfL, causing a maximum change of(±5.8 x 10-)/(5.8 x10-s) = ±0.01 pH unit in the standard buffer. Thiscorresponds to a total maximum change of 1% in Pb (Figure2b). Thus the effect of analyzing plasma samples withextreme pH values (i.e., 6.9-7.9) has only a negligible effecton the determination of their glucose content by this meth-od.
Because, under the experimental conditions chosen,pHo’ zpH0” XpH0”, equations 10 and 11 can becombined, giving:
B pH2 - pHo[glucoseI = [glucose]5 X - X (13)
C pH1 -
The determination of glucose in plasma by use of equation
13 allows greater analytical precision than does the use ofthe absolute values of the parameters of equation 11, in thatthe dilution factor (I), the initial pH, the composition of thestandard buffer, and V5, /3, and Vb’ do not need to beknown on an absolute basis.
Equation 13 has been developed on the assumption thatboth [glucose]9 and [glucosel5 are linearly related to pH1
(8) and ipH2, respectively. Figure 3b shows that for all practi-cal purposes this is true in the range of glucose concentra-tion 0 to 4.00 g/L. At greater concentrations there is amarked deviation from linearity, if [glucose]5 is 2.00 g/L,there is an 8% deviation from linearity when [glucose] =
10.00 g/L, for reasons discussed earlier, if linearity atgreater concentrations is required, a two-point calibrationoverlapping the concentration range of interest can be used.Alternatively, a composite buffer with a constant buffervalue in the working pH range can be used. Because themain object of this paper was to verifr the performance ofthe pH apparatus and of the simplified chemical systemused for glucose determination with reference to the FDAmethod, we limited our work to the glucose concentrationrange 0 to 4.00 g/L. Equation 13 shows how the glucoseconcentration in plasma can be determined relativeto theglucose concentration of a standard aqueous solution.
Table 1 and Figure 4 compare both the precision and theresults obtained by the pH method and by the FDAreference method (3). To make such a comparison meaning-ful at the level of precision required, all data obtained by thepH method and by the use of equation 13 (with reference to
(10) [glucose]5 = 2.00 g/L) have been corrected as follows:#{149}for the residual nonlinearity between glucose concentra-
tion and ipH (Figure 3b); the size of this correction is, atmost, 2.5% of the value of glucose concentration at thehighest limit of glucose concentration studied (4.00 g/L).
#{149}for the small (less than 0.5%) effect of changing the buffervalue of the standard buffer after the addition of plasma.
whence
84 CLINICALCHEMISTRY, Vol. 29, No. 1, 1983
narily, stability of such values was better than ± 0.0002 pHunitsper hour.
According to equation 3, there are two experimentalapproaches determining [HI from pH values: (a) /3’ isdetermined by the addition to the solution (buffer + sample)of a known amount of standard acid or base, or (b) the valueof VbPb (equation 4) is increased to make the contribution ofVj35 negligible (VbPb > V5/35). The latter approach has beenfollowed in this paper, because a much more complexconfiguration of the differential pH apparatus would berequired to make it suitable for the measurement of thebuffervalue of the solution contained in C.
To calculate the value of Pbfor which (at any given V8 andVb) VbPb ‘ VJ3S, one must first know the value of f3. /3.values for human plasma and for human whole blood can becalculated from the data reported by Siggaard-Andersen (4),and turn out to be 9.4 x iO3 and 30 x i0, respectively.Given a sensitivity of the ipH measurement of about 1 x10 pH units, the change in [BI or [H + 1 concentration thatcan be detected in pure plasma or whole blood with theapparatus shown in Figure 1 is about 1 j.tmoIlL for plasmaand -3 .tmolIL for whole blood. If Vb = 0.8 mL, Pb = 5.8 x10 (standard buffer), and V5 = 0,01 mL, then /3’ (equation4) = 5.84 x i03 (plasma) and 6.1 x i#{248}(whole blood). Theminimum change in [WI that can be detected decreases,accordingtoequations,to[(81 X 5.84) + 9.41 x i03 x iO= 48 mol/L for plasma and 51 moI1L for whole blood.
Therefore, under the conditions of our experiments, thecontribution of the buffer value of plasma and of whole bloodto the total buffer value of standard buffer is very small, i.e.,0.04/5.84 = 0.7% (plasma) and 0.30/6.10 = 4,9% (wholeblood).
Determination of Glucose in Plasma
In a blank cycle the effect of addition of enzyme solution tostandard buffer is first determined. From equations 3 and 4:
PbVb+PEVElglucose]b = , pH = ApHo
Vb + yE
Pbis the buffer value of the standard buffer at pH = 7.50(Figure 2b); Vb’, the volume of the buffer left in cuvette Cafter the first electrode has been filled with standard buffer,is typically 500 giL; VE, the volume of enzyme solution, isabout 5 1zL; and f3 Pb because we used a lyophilizedenzyme preparation dissolved in standard buffer.
In a calibration cycle, 10 L of a standard glucose solution(2.00 g/L) isadded to the standard buffer and a value of zpHis determined, if we assume a linear relationship betweenthe concentration of glucose and pH, as is found in theglucose concentration range 0 to 4.00 g/L,then:
JPbVb + /3EVE + /38V5[glucosel5 = .,,, , ., pHi\ Vf + VE+ V9
- PbVb’ + /3EVE + /39V,Vb’+VE+V.
[glucose]5 = f x B x (pH1 - ApH0”)
where f is the dilution coefficient = (Vb + V5 + V5)/V5.A measuring cycle is then performed by the addition of a
known volume (10 juL) of plasma with an unknown glucoseconcentration.Again assuming a linear relationship be-tween glucose concentration and pH, then:
CLINICALCHEMISTRY,Vol.29, No. 1,1983 85
for the volume effect due to plasma proteins, a correctionmade according to the following equation (5): c = c1([100/(100 - Vc,,,)I- 1), where c1 = concentration of glucose inplasma, c2 = concentration of glucose in the protein-freesupernate, c = c2 - c1, c,, = concentration of protein in g/dl, and V = mean partial specific volume of the proteins. ccalculated from the above formula is, for human plasma ofnormal protein content, less than 5% of the value of theglucose concentration. The correction is based on the as-sumption that in the FDA reference method there is nocoprecipitatedor adsorbed glucose in the precipitate.
Table 2 shows the effect on the mean glucose concentra-tion of various interfering substances. Clearly, only fructoseinterferes significantly. This is to be expected becausehexokinase is known to catalyze the phosphorylation of bothglucose and fructose. However, Km for glucose is 1.0 x 1Omol/L as compared with 7.0 x iO mol/L for fructose (6),which probably explains why fructose interference is equiv-alent to less than half of its total concentration. Othercarbohydrates (e.g., galactose and xylose) or disaccharides(maltose and lactose) do not produce an appreciable effect.
We were interested at this point to see whether thesimplified method of enzymatic analysis of glucose concen-tration based on reaction 2 and pH measurement wouldqualify as an FDA in vitro diagnostic device for the quanti-tative measurement of glucose in plasma or serum. Withregard to bias, which according to FDA specification (3) isthe limiting mean difference between the reference methodvalue and the zpH method value obtained with specimensrepresentative of the population to which the test is applied(measured as a percentage of the reference method value),statistical analysis of all available data showed that thepH method passed the requirements set by the FDA reportfor qualification as a diagnostic device for the quantitativemeasurement of glucose in plasma. No value of glucose
concentration by the tpH method was found to differ bymore than 15% of the value obtained by the reference FDAmethod. Analysis of data on the specificity of the pHmethod (Table 2) showed that the effect of all substancestested, including fructose, was within the interference limitset by the FDA specifications.
The small discrepancy (averaging about 0.04 g/L) betweenglucose concentrationsdetermined by the pH method witha single enzyme and by the FDA reference method wasprobably due to the simultaneous phosphorylation of fruc-tose as well as of glucose when only hexokinase was used.However, the fructose concentration in plasma of normalfasting individualsisvery small (7), probably 0.02-0.04 g/L,and would not introduce clinically relevant errors.
References1. Luzzana M, Perrella M, Rossi-Bernardi L. An electrometricmethod for measurement of small pH changes in biological systems.Anal Biochem 43, 556-563 (1971).2. Mosca A, Dossi G, Luzzana M, et al. Improved apparatusforthedifferential measurement of pH. Applications to the measurementof glucose. Anal Biochem 112, 287-294 (1981).
3. Food and Drug Administration, Bureau of Medical Devices.Proposed performance standard for in vitro diagnostic devices usedin the quantitative measurement of glucose in serum or plasma.U.S. Government Printing Office, Washington, DC, 1980-624-722/1728.4. Siggaard-Andersen 0. The Acid-Base Status of the Blood, 4thed.,Munksgaard, Copenhagen, 1974.5. Bergmeyer HU. Principles of Enzymatic Analysis, 1st ed., VerlagChemie, Weinheim, 1978,pp 116-117.
6. Barman TE. Enzyme Handbook, 1, Springer-Verlag, New York,NY, 1969, p 377.7. Scott, LD. A method for the determination of fructose in blood.Biochem J 29, 1012-1016 (1935).