Measurement of Blood–Brain Barrier Permeability of Rats with Alpha-Aminoisobutyric Acid During...
7
Hindawi Publishing Corporation ISRN Neuroscience Volume 2013, Article ID 905279, 6 pages http://dx.doi.org/10.1155/2013/905279 Clinical Study Measurement of Blood-Brain Barrier Permeability with T 1 -Weighted Dynamic Contrast-Enhanced MRI in Brain Tumors: A Comparative Study with Two Different Algorithms Maurizio Bergamino, 1,2 Laura Saitta, 3 Laura Barletta, 3 Laura Bonzano, 1,2 Giovanni Luigi Mancardi, 1,2 Lucio Castellan, 3 Jean Louis Ravetti, 4 and Luca Roccatagliata 2,3,5 1 Department of Neuroscience, Rehabilitation, Ophthalmology, Genetics, and Maternal and Child Health, University of Genoa, 16132 Genoa, Italy 2 Magnetic Resonance Research Centre on Nervous System Diseases, University of Genoa, 16132 Genoa, Italy 3 Department of Diagnostic and Interventional Neuroradiology, San Martino University Hospital, 16132 Genoa, Italy 4 Department of Pathology, San Martino University Hospital, 16132 Genoa, Italy 5 Department of Health Sciences, University of Genoa, 16132 Genoa, Italy Correspondence should be addressed to Maurizio Bergamino; [email protected] Received 24 December 2012; Accepted 16 January 2013 Academic Editors: C. Bishop and H. Ochi Copyright © 2013 Maurizio Bergamino et al. is is an open access article distributed under the Creative Commons Attribution License, which permits unrestricted use, distribution, and reproduction in any medium, provided the original work is properly cited. e purpose of this study was to assess the feasibility of measuring different permeability parameters with T 1 -weighted dynamic contrast-enhanced (DCE) magnetic resonance imaging (MRI) in order to investigate the blood brain-barrier permeability associated with different brain tumors. e Patlak algorithm and the extended Toſts-Kety model were used to this aim. Twenty- five adult patients with tumors of different histological grades were enrolled in this study. MRI examinations were performed at 1.5 T. Multiflip angle, fast low-angle shot, and axial 3D T 1 -weighted images were acquired to calculate T 1 maps, followed by a DCE acquisition. A region of interest was placed within the tumor of each patient to calculate the mean value of different permeability parameters. Differences in permeability measurements were found between different tumor grades, with higher histological grades characterized by higher permeability values. A significant difference in transfer constant ( trans ) values was found between the two methods on high-grade tumors; however, both techniques revealed a significant correlation between the histological grade of tumors and their trans values. Our results suggest that DCE acquisition is feasible in patients with brain tumors and that trans maps can be easily obtained by these two algorithms, even if the theoretical model adopted could affect the final results. 1. Introduction e blood-brain barrier (BBB) is formed by specialized endothelial cells lining capillaries in the central nervous system (CNS), and it prevents or slows the passage of some drugs and other chemical compounds, radioactive ions, and disease-causing organisms, such as viruses, from the blood into the CNS. BBB breakdown is associated with many CNS- related pathologies, including inflammatory diseases such as multiple sclerosis [1] and chronic and acute cerebrovascular pathology [2, 3]. Pathological modifications of the BBB have also been well described in degenerative diseases such as Alzheimer disease [4]; in addition, it has been shown that in brain tumors the BBB is structurally and functionally abnormal [5]. Quantitative investigation of BBB permeability is pos- sible using Magnetic Resonance Imaging (MRI) [5], and it has been applied to the study of brain tumors [6, 7]. In particular, experimental and clinical studies have demon- strated that dynamic contrast-enhanced (DCE) MRI, with a macromolecular contrast agent (CA), can be used to quantify microvascular permeability in tumors [8] and that
-
Upload
independent -
Category
Documents
-
view
0 -
download
0
Transcript of Measurement of Blood–Brain Barrier Permeability of Rats with Alpha-Aminoisobutyric Acid During...

Hindawi Publishing CorporationISRN NeuroscienceVolume 2013, Article ID 905279, 6 pageshttp://dx.doi.org/10.1155/2013/905279
Clinical StudyMeasurement of Blood-Brain Barrier Permeabilitywith T
1-Weighted Dynamic Contrast-Enhanced MRI in Brain
Tumors: A Comparative Study with Two Different Algorithms
Maurizio Bergamino,1,2 Laura Saitta,3 Laura Barletta,3
Laura Bonzano,1,2 Giovanni Luigi Mancardi,1,2 Lucio Castellan,3
Jean Louis Ravetti,4 and Luca Roccatagliata2,3,5
1 Department of Neuroscience, Rehabilitation, Ophthalmology, Genetics, and Maternal and Child Health, University of Genoa,16132 Genoa, Italy
2Magnetic Resonance Research Centre on Nervous System Diseases, University of Genoa, 16132 Genoa, Italy3 Department of Diagnostic and Interventional Neuroradiology, San Martino University Hospital, 16132 Genoa, Italy4Department of Pathology, San Martino University Hospital, 16132 Genoa, Italy5 Department of Health Sciences, University of Genoa, 16132 Genoa, Italy
Correspondence should be addressed to Maurizio Bergamino; [email protected]
Received 24 December 2012; Accepted 16 January 2013
Academic Editors: C. Bishop and H. Ochi
Copyright © 2013 Maurizio Bergamino et al. This is an open access article distributed under the Creative Commons AttributionLicense, which permits unrestricted use, distribution, and reproduction in any medium, provided the original work is properlycited.
The purpose of this study was to assess the feasibility of measuring different permeability parameters with T1-weighted dynamic
contrast-enhanced (DCE) magnetic resonance imaging (MRI) in order to investigate the blood brain-barrier permeabilityassociated with different brain tumors. The Patlak algorithm and the extended Tofts-Kety model were used to this aim. Twenty-five adult patients with tumors of different histological grades were enrolled in this study. MRI examinations were performed at1.5 T. Multiflip angle, fast low-angle shot, and axial 3D T
1-weighted images were acquired to calculate T
1maps, followed by a DCE
acquisition. A region of interest was placed within the tumor of each patient to calculate the mean value of different permeabilityparameters. Differences in permeability measurements were found between different tumor grades, with higher histological gradescharacterized by higher permeability values. A significant difference in transfer constant (𝐾trans) values was found between thetwo methods on high-grade tumors; however, both techniques revealed a significant correlation between the histological grade oftumors and their 𝐾trans values. Our results suggest that DCE acquisition is feasible in patients with brain tumors and that 𝐾transmaps can be easily obtained by these two algorithms, even if the theoretical model adopted could affect the final results.
1. Introduction
The blood-brain barrier (BBB) is formed by specializedendothelial cells lining capillaries in the central nervoussystem (CNS), and it prevents or slows the passage of somedrugs and other chemical compounds, radioactive ions, anddisease-causing organisms, such as viruses, from the bloodinto the CNS. BBB breakdown is associated with many CNS-related pathologies, including inflammatory diseases such asmultiple sclerosis [1] and chronic and acute cerebrovascularpathology [2, 3]. Pathological modifications of the BBB have
also been well described in degenerative diseases such asAlzheimer disease [4]; in addition, it has been shown thatin brain tumors the BBB is structurally and functionallyabnormal [5].
Quantitative investigation of BBB permeability is pos-sible using Magnetic Resonance Imaging (MRI) [5], and ithas been applied to the study of brain tumors [6, 7]. Inparticular, experimental and clinical studies have demon-strated that dynamic contrast-enhanced (DCE) MRI, witha macromolecular contrast agent (CA), can be used toquantify microvascular permeability in tumors [8] and that
2 ISRN Neuroscience
permeability increases with increasing histological tumorgrade [7, 9].
Different theoretical models have been proposed for theanalysis of DCE-MRI data in order to find a more accurateapproach for the tumor vascular bed and discriminate bloodflow and vascular permeability. These models include thestandard [10] and the extended Tofts-Kety (ETK) models [11,12], the adiabatic tissue homogeneity (AATH) model [13, 14],the two-compartment exchange model (2CXM) [15–17], thedistributed capillary adiabatic tissue homogeneity (DCATH)model [18], and the gamma capillary transit time model(GCTT) [19]. The absolute quantification of permeabilityparametersmay substantially differ on the basis of the specificmodel adopted to fit the DCE experimental data [11].
The purpose of this study was to quantify permeabilityparameters in patients with different histological types ofbrain tumors by using two different theoretical algorithms.To this aim, we compared the volume transfer constantbetween blood plasma and the extravascular extracellularspace (EES) (𝐾trans), the volume of EES per unit volume oftissue (𝑣
𝑒) (with 0 ≤ 𝑣
𝑒≤ 1), the vascular volume fraction
within the tissue (𝑣𝑝), and the washout rate from the EES
back into the blood plasma (𝑘𝑒𝑝). These parameters were
calculated using the Patlak algorithm [20], which assumesthat 𝑘
𝑒𝑝is small, and therefore negligible, and the ETK
model. Additionally, the results were evaluated in order tounderstand if the permeability metrics obtained with the twomethods correlated with histological grade.
2. Materials and Methods
2.1. Patients. Twenty-five adult patients (eight females andseventeen males; mean age ± standard deviation = 54.6 ±10.0 years; age range = 37–75 years) with different braintumors were enrolled in this study. The histological gradeof each lesion was determined by using the World HealthOrganization (WHO) classification of brain tumors [21].
2.2. MRI Protocol and Image Evaluation. MRI examinationswere performed on a 1.5-T clinical system (Siemens Mag-netom Avanto, Erlangen, Germany) with an 8-channel headcoil, and the following imaging sequences were acquired: T
1-
weighted (TR/TE = 500/10ms; acquisition matrix = 320 ×384; NEX = 1; field of view = 250 × 300 mm; slice thickness =5 mm, flip angle = 80∘), T
2-weighted (TR/TE = 3800/95ms;
acquisition matrix = 320 × 384; NEX = 2; field of view =250 × 300mm; slice thickness = 5mm, flip angle = 150∘),and fluid attenuated inversion recovery (FLAIR) (TR/TE =9000/119ms; acquisition matrix = 320 × 384; NEX = 1; fieldof view = 250 × 300mm; slice thickness = 5mm, flip angle= 150∘). Before intravenous injection of the CA, fast low-angle shot (FLASH) axial 3D T
1-weighted images (TR/TE =
6.7/1.0ms; acquisition matrix = 320 × 384; NEX = 1; field ofview = 250 × 300mm; slice thickness = 5mm) were acquiredwith multiple flip angles (5∘, 10∘, 15∘, 20∘, and 30∘).
Acquisition of a DCE-MRI sequence was started imme-diately after intravenous administration of a gadolinium-based CA (gadobutrol 0.1ml/kg, Gadovist) by a power
injector (Spectris Solaris EP Medrad) at a rate of 5mL/s.Dynamic axial 3DT
1-weighted TurboFLASH images (TR/TE
= 6.7/1.0ms; acquisition matrix = 320 × 384; NEX = 1; field ofview= 250× 300mm; slice thickness = 5mm; flip angle = 30∘)were acquired for 30 time points.
Permeability maps were created as described in theTheory and Data Analysis section, and the mean of𝐾trans, 𝑣
𝑒,
and 𝑣𝑝was obtained for each patient in a region of interest
(ROI) within the tumor.
2.3. The Extended Tofts-Kety Model. The Patlak algorithmand the ETK model were used in order to calculate differentpermeability parameters.
The tracer concentration in tissue, 𝐶𝑡, and the tracer
concentration in arterial blood plasma, 𝐶𝑝, are related by the
differential equation
𝑑𝐶𝑡
𝑑𝑡= 𝐾
trans𝐶𝑝− 𝑘𝑒𝑝𝐶𝑡, (1)
where 𝑘𝑒𝑝= 𝐾
trans/𝑣𝑒is the rate constant [10].
The solution of (1), using the initial conditions𝐶𝑝= 𝐶𝑡=
0 at 𝑡 = 0, is
𝐶𝑡(𝑡) = 𝐾
trans∫𝐶𝑝(𝜏) exp [−𝑘
𝑒𝑝(𝑡 − 𝜏)] 𝑑𝜏, (2)
where 𝑡 represents the current time step, 𝜏 is the variable ofintegration, 𝐶
𝑡(𝑡) is the time course of the CA concentration
in the tissue compartment, and𝐶𝑝(𝑡) is the time course of the
CA concentration in the plasma (AIF) [22, 23].Equation (2) is the standard Tofts-Kety model and is
acceptable in tumors with no large increase in blood volume;however, it is not valid in other contexts, for instancewhen blood volume can increase markedly in neoplasms[24]. Models of additional sophistication are required toadequately describe these cases. It is possible to extend (2) toinclude the concentration of CA in the blood plasma:
𝐶𝑡(𝑡) = 𝐾
trans∫𝐶𝑝(𝜏) exp [−𝑘
𝑒𝑝(𝑡 − 𝜏)] 𝑑𝜏 + 𝑣
𝑝𝐶𝑝(𝑡) .
(3)
Equation (3) is the ETK model, where 𝑣𝑝is the vascular
volume fraction within the tissue. Equations (2) and (3) arethe basis of the most of DCE-MRI experiments currentlybeing reported in the literature. The general approach is tomeasure 𝐶
𝑝and 𝐶
𝑡time courses and perform a nonlinear
least squares fit of these equations to such data. By varyingthe parameters in those equations, it is possible to obtainestimates on 𝐾trans, 𝑣
𝑒and 𝑣𝑝. For this study, postprocessing
analysis for the ETK model was performed using in-housesoftware.
2.4. Patlak Analysis. This analysis assumes that the rateconstant between EES and blood plasma (𝑘
𝑒𝑝) in (3) can be
ignored due to low permeability and short measuring time.In these cases, (3) can be reduced to
𝐶𝑡(𝑡) = 𝑣
𝑝𝐶𝑝(𝜏) + 𝐾
trans∫𝐶𝑝(𝜏) 𝑑𝜏. (4)
ISRN Neuroscience 3
Using the Patlak analysis, it is possible to linearize(4) to obtain a graph of the ratio 𝐶
𝑡(𝑡)/𝐶𝑝(𝑡) versus
∫𝐶𝑝(𝜏)𝑑𝜏/𝐶
𝑝(𝑡) in order to calculate the values of𝐾trans and
𝑣𝑝. It is useful to keep in mind that this model does not take
into account the backflow and, therefore, the results couldhave some limitations [25]. For this work, postprocessinganalysis for the Patlak algorithm was performed usingTOPPCAT (T-One weighted Perfusion imaging ParameterCalculation Toolkit) [https://dblab.duhs.duke.edu/] [26],which is a free permeability analysis software available onInternet.
2.5. The Voxel Relation Rate. The calculation of the per-meability parameters by using (2), (3), or (4) requires thevalues of 𝑆
0, the equilibrium longitudinal magnetization, and
𝑇1pregadolinium mapping for each voxel. Precontrast 𝑇
1
mapping of tissue can be obtained with different approaches;a common method employs multiple 3D gradient echoacquisitions at multiple variable flip angles. For this purpose,pulse sequence and flip angle must be chosen to maximizethe sampling rate within the constraint of an adequate signal-to-noise ratio (SNR). Another frequently used method tocalculate the 𝑇
1baseline values utilizes 2D T
1-weighted
inversion recovery scans at various inversion times [27, 28].This method is considered more accurate than the variableflip angle method, but it is usually more time consuming.
In our study, we chose to use acquisitions at multiplevariable flip angles to obtain 𝑆
0and𝑇
1values. In FLASHMRI
with a complete spoiling of the transverse magnetization, thesteady-state signal is given by
𝑆𝛼=𝑆0(1 − exp [−TR/𝑇
1]) sin𝛼
1 − cos 𝛼 ⋅ exp [−TR/𝑇1], (5)
where TR is the repetition time and 𝛼 is the flip angle for TR>> T2∗ [29]. To construct the 𝑇
1and 𝑆0maps, it is necessary
to fit the data from FLASH sequence by a linearization of (5).The 𝑇
1and 𝑆
0values are then utilized to estimate the voxel
𝑅1time courses, or relaxation rates, from the acquired signal
intensity time courses,
𝑅1(𝑡)
= −1
TR
× ln [(1 − (𝑆 (𝑡) − 𝑆 (0)𝑆0sin𝛼+1 − 𝑚
1 − (𝑚 ⋅ cos𝛼)))
×(1−cos𝛼(𝑆 (𝑡) − 𝑆 (0)𝑆0sin𝛼+(1 − 𝑚
1 − (𝑚 ⋅ cos𝛼))))
−1
] ,
(6)
where 𝑚 = exp[−TR/𝑇1], 𝛼 is the flip angle of the DCE-MR
sequence, and 𝑆(0) and 𝑆(𝑡) are the signal intensities at time𝑡 = 0 and time t, respectively. The relaxation rate 𝑅
1(𝑡) is
related to the tracer concentration 𝐶𝑡(𝑡) by
𝑅1(𝑡) = 𝑅
10+ 𝑟1𝐶 (𝑡) , (7)
where 𝑅10is the relaxation rate before tracer injection and 𝑟
1
is the relaxivity of the CA, which varies with the molecule’scontrast type (in our case 𝑟
1= 4.3mM−1s−1) [30].
2.6. Statistical Analysis. The Kolmogorov-Smirnov test ofnormality was used to determine whether the distributionof values was normal, and comparisons between these twotheoretical models were performed using the student’s t-test. A P value lower than 0.05 was considered to indicatestatistical significance for all comparisons. The relationshipbetween 𝐾trans and tumor grade was assessed by usingPearson correlation coefficients.
3. Results
The study group consisted of twenty-five patients, whosehistological diagnoses were as follows seventeen glioblastomamultiforme (WHO grade IV), two oligoastrocytoma (WHOgrade III), two anaplastic astrocytomas (WHOgrade III), onepleomorphic xanthoastrocytoma (WHOgrade III), and threeastrocytomas (WHO grade II).
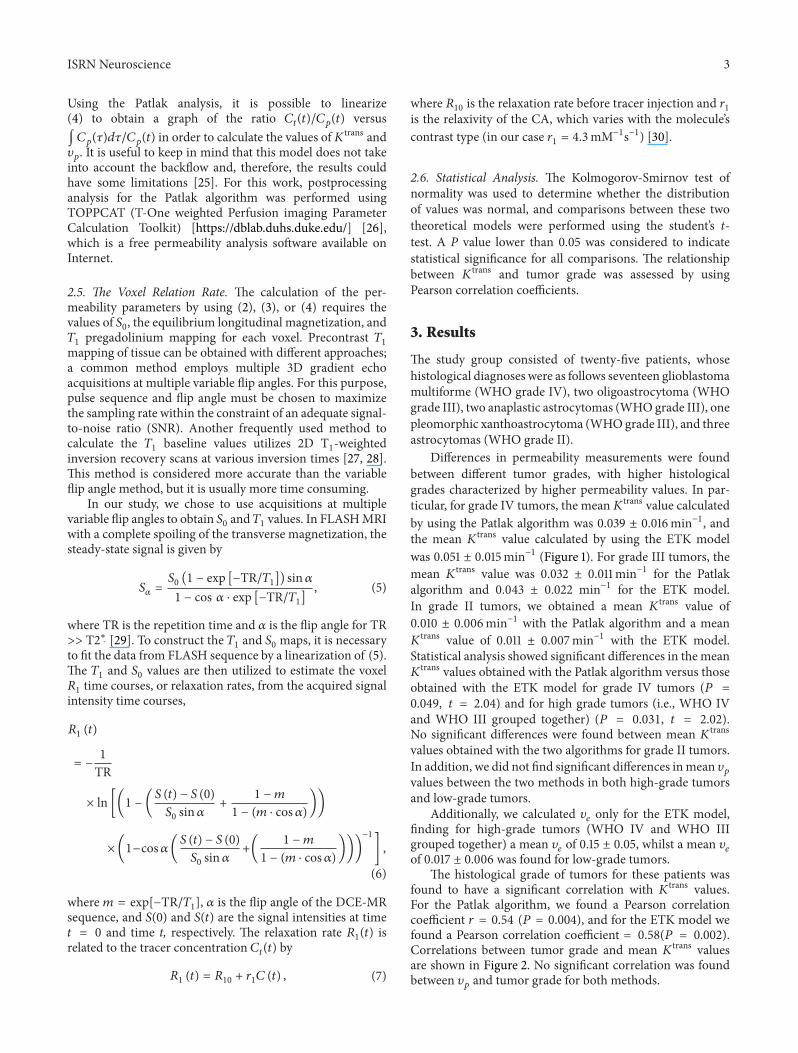
Differences in permeability measurements were foundbetween different tumor grades, with higher histologicalgrades characterized by higher permeability values. In par-ticular, for grade IV tumors, the mean𝐾trans value calculatedby using the Patlak algorithm was 0.039 ± 0.016min−1, andthe mean 𝐾trans value calculated by using the ETK modelwas 0.051 ± 0.015min−1 (Figure 1). For grade III tumors, themean 𝐾trans value was 0.032 ± 0.011min−1 for the Patlakalgorithm and 0.043 ± 0.022 min−1 for the ETK model.In grade II tumors, we obtained a mean 𝐾trans value of0.010 ± 0.006min−1 with the Patlak algorithm and a mean𝐾
trans value of 0.011 ± 0.007min−1 with the ETK model.Statistical analysis showed significant differences in the mean𝐾
trans values obtained with the Patlak algorithm versus thoseobtained with the ETK model for grade IV tumors (𝑃 =0.049, 𝑡 = 2.04) and for high grade tumors (i.e., WHO IVand WHO III grouped together) (𝑃 = 0.031, 𝑡 = 2.02).No significant differences were found between mean 𝐾transvalues obtained with the two algorithms for grade II tumors.In addition, we did not find significant differences inmean 𝑣
𝑝
values between the two methods in both high-grade tumorsand low-grade tumors.
Additionally, we calculated 𝑣𝑒only for the ETK model,
finding for high-grade tumors (WHO IV and WHO IIIgrouped together) a mean 𝑣
𝑒of 0.15 ± 0.05, whilst a mean 𝑣
𝑒
of 0.017 ± 0.006 was found for low-grade tumors.The histological grade of tumors for these patients was
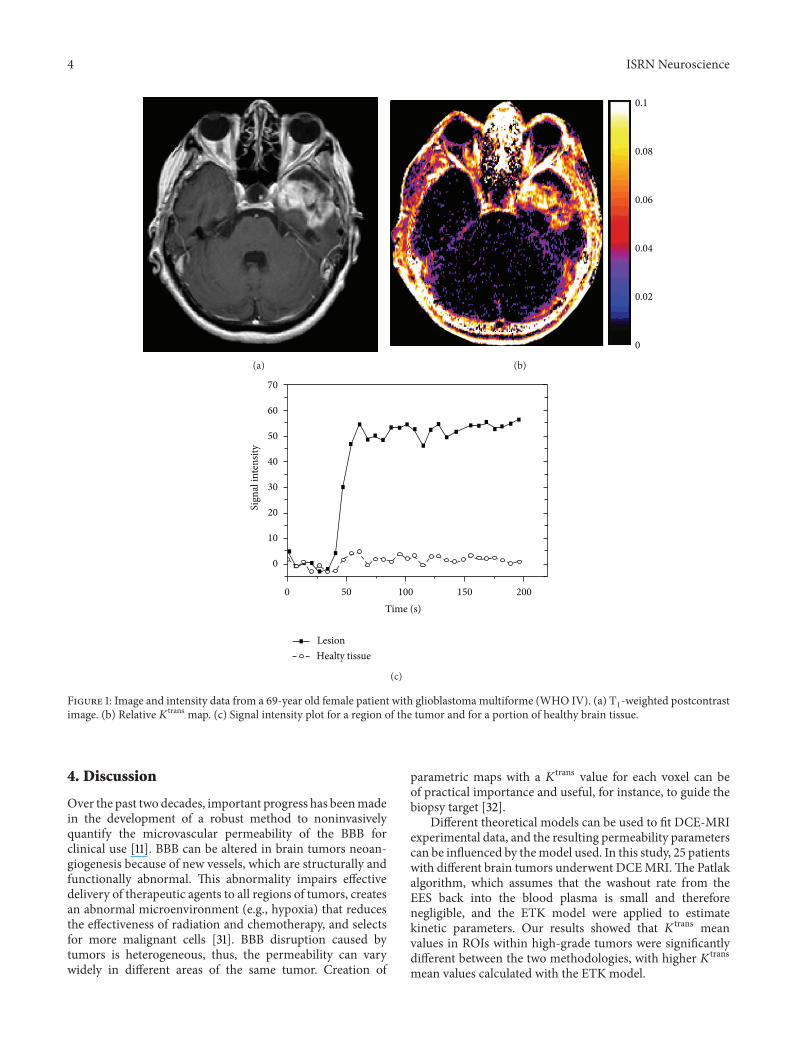
found to have a significant correlation with 𝐾trans values.For the Patlak algorithm, we found a Pearson correlationcoefficient 𝑟 = 0.54 (𝑃 = 0.004), and for the ETK model wefound a Pearson correlation coefficient = 0.58(𝑃 = 0.002).Correlations between tumor grade and mean 𝐾trans valuesare shown in Figure 2. No significant correlation was foundbetween 𝑣
𝑝and tumor grade for both methods.
4 ISRN Neuroscience
(a)
0.1
0.08
0.06
0.04
0.02
0
(b)
70
60
50
40
30
20
10
0
0 50 100 150 200Time (s)
Sign
alin
tens
ity
LesionHealty tissue
(c)
Figure 1: Image and intensity data from a 69-year old female patient with glioblastomamultiforme (WHO IV). (a) T1-weighted postcontrast
image. (b) Relative 𝐾trans map. (c) Signal intensity plot for a region of the tumor and for a portion of healthy brain tissue.
4. Discussion
Over the past two decades, important progress has beenmadein the development of a robust method to noninvasivelyquantify the microvascular permeability of the BBB forclinical use [11]. BBB can be altered in brain tumors neoan-giogenesis because of new vessels, which are structurally andfunctionally abnormal. This abnormality impairs effectivedelivery of therapeutic agents to all regions of tumors, createsan abnormal microenvironment (e.g., hypoxia) that reducesthe effectiveness of radiation and chemotherapy, and selectsfor more malignant cells [31]. BBB disruption caused bytumors is heterogeneous, thus, the permeability can varywidely in different areas of the same tumor. Creation of
parametric maps with a 𝐾trans value for each voxel can beof practical importance and useful, for instance, to guide thebiopsy target [32].
Different theoretical models can be used to fit DCE-MRIexperimental data, and the resulting permeability parameterscan be influenced by themodel used. In this study, 25 patientswith different brain tumors underwent DCEMRI.The Patlakalgorithm, which assumes that the washout rate from theEES back into the blood plasma is small and thereforenegligible, and the ETK model were applied to estimatekinetic parameters. Our results showed that 𝐾trans meanvalues in ROIs within high-grade tumors were significantlydifferent between the two methodologies, with higher 𝐾transmean values calculated with the ETK model.

ISRN Neuroscience 5
2 3 4Tumor grade
𝐾tr
ans
0.07
0.06
0.05
0.04
0.03
0.02
0.01
0
(a)
1
0.08
0.06
0.04
0.02
02 3 4
Tumor grade
𝐾tr
ans
(b)
Figure 2: A statistically significant correlation was observed between mean 𝐾trans and tumor grade for both Patlak algorithm ((a): 𝑟 =0.54 (𝑃 = 0.004)) and for the ETK model ((b): 𝑟 = 0.58 (𝑃 = 0.002)).
In many studies, 𝐾trans is estimated by applying the TKmodel or the ETK model. However, the main disadvantageof the TK model is that it overestimates 𝐾trans in highlyvascularized regions, since the contribution of intravascularCA to the signal enhancement is mistaken as tracer thatenters the EES and thus appears to reflect permeability[33]. Harrer et al. [33] used the TK and ETK models toestimate permeability on 18 high-grade gliomas, and theyfound that 𝐾trans values calculated by using the TK modelwere considerably higher than the 𝐾trans values obtainedusing the ETK technique. On the other hand, Port et al. [34]estimated the difference between noncompartmental, TK andETK models on 20 patients with recurrent glioblastoma,finding significant differences in the results obtained with thedifferent models.
In our study, we found statistically different 𝐾trans valuesfor high-grade tumors, but no significant difference forlow-grade tumors. This result may be related to the lownumber of patients with grade II tumors in this study, butbiological differences between high-grade tumors and low-grade tumors can also be associated with these findings.
Both techniques reveal a significant correlation betweenthe histological grade of tumors and their𝐾trans values.Thesedata are in line with other results that can be found in theliterature [35, 36].
5. Conclusion
In conclusion, we demonstrated that DCE acquisition isfeasible in patients with brain tumors and that the choiceof the postprocessing tool can influence the permeabilitymetrics. In particular, the use of the Patlak algorithm versusthe ETKmodel can lead to statistically significant differencesin the 𝐾trans values. In our small sample, this difference inresults did not affect the correlation with histological grade.
References
[1] M. I. Gaitan, C. D. Shea, I. E. Evangelou et al., “Evolution of theblood-brain barrier in newly formingmultiple sclerosis lesions,”Annals of Neurology, vol. 70, no. 1, pp. 22–29, 2011.
[2] S. Taheri, C. Gasparovic, B. N. Huisa et al., “Blood-brain barrierpermeability abnormalities in vascular cognitive impairment,”Stroke, vol. 42, no. 8, pp. 2158–2163, 2011.
[3] A. Kassner, D. M. Mandell, and D. J. Mikulis, “Measuringpermeability in acute ischemic stroke,” Neuroimaging Clinics ofNorth America, vol. 21, no. 2, pp. 315–325, 2011.
[4] A. P. Viggars, S. B. Wharton, J. E. Simpson et al., “Alterations inthe blood brain barrier in ageing cerebral cortex in relationshipto Alzheimer-type pathology: a study in the MRC-CFAS pop-ulation neuropathology cohort,” Neuroscience Letters, vol. 505,no. 1, pp. 25–30, 2011.
[5] H. B. W. Larsson and P. S. Tofts, “Measurement of blood-brainbarrier permeability using dynamic Gd-DTPA scanning—acomparison of methods,”Magnetic Resonance in Medicine, vol.24, no. 1, pp. 174–176, 1992.
[6] S. Cha, L. Yang, G. Johnson et al., “Comparison of microvas-cular permeability measurements,𝐾trans, determined with con-ventional steady-state T
1-weighted and first-pass T2∗-weighted
MR imaging methods in gliomas and meningiomas,” AmericanJournal of Neuroradiology, vol. 27, no. 2, pp. 409–417, 2006.
[7] H. C. Roberts, T. P. L. Roberts, R. C. Brasch, and W. P. Dil-lon, “Quantitative measurement of microvascular permeabilityin human brain tumors achieved using dynamic contrast-enhanced MR imaging: correlation with histologic grade,”American Journal of Neuroradiology, vol. 21, no. 5, pp. 891–899,2000.
[8] H. C. Schwickert, M. Stiskal, T. P. L. Roberts et al., “Contrast-enhanced MR imaging assessment of tumor capillary per-meability: effect of irradiation on delivery of chemotherapy,”Radiology, vol. 198, no. 3, pp. 893–898, 1996.
[9] H. Daldrup, D. M. Shames, M. Wendland et al., “Correlation ofdynamic contrast-enhancedMR imaging with histologic tumorgrade: comparison of macromolecular and small-molecular
6 ISRN Neuroscience
contrastmedia,”American Journal of Roentgenology, vol. 171, no.4, pp. 941–949, 1998.
[10] P. S. Tofts, G. Brix, D. L. Buckley et al., “Estimating kineticparameters fromdynamic contrast-enhancedT
1-weightedMRI
of a diffusable tracer: standardized quantities and symbols,”Journal of Magnetic Resonance Imaging, vol. 10, no. 3, pp. 223–232, 1999.
[11] D. L. Buckley, “Uncertainty in the analysis of tracer kineticsusing dynamic contrast-enhanced T
1weighted MRI,” Magnetic
Resonance in Medicine, vol. 47, no. 3, pp. 601–606, 2002.[12] P. S. Tofts, “Modeling tracer kinetics in dynamic Gd-DTPAMR
imaging,” Journal of Magnetic Resonance Imaging, vol. 7, no. 1,pp. 91–101, 1997.
[13] L. E. Kershaw and H. L. M. Cheng, “Temporal resolution andSNR requirements for accurate DCE-MRI data analysis usingthe AATHmodel,”Magnetic Resonance in Medicine, vol. 64, no.6, pp. 1772–1780, 2010.
[14] T. S. Koh, D. L. Cheong, and Z. Hou, “Issues of discontinuityin the impulse residue function for deconvolution analysis ofdynamic contrast-enhanced MRI data,” Magnetic Resonance inMedicine, vol. 66, no. 3, pp. 886–892, 2011.
[15] G. Brix, M. S. Ravesh, S. Zwick, J. Griebel, and S. Delorme,“On impulse response functions computed from dynamiccontrast-enhanced image data by algebraic deconvolution andcompartmental modeling,” Physica Medica, vol. 28, no. 2, pp.119–128, 2011.
[16] U. Hoffmann, G. Brix, M. V. Knopp, T. Hess, and W. J. Lorenz,“Pharmacokinetic mapping of the breast: a new method fordynamicMRmammography,”Magnetic Resonance inMedicine,vol. 33, no. 4, pp. 506–514, 1995.
[17] H. B. W. Larsson, F. Courivaud, E. Rostrup, and A. E. Hansen,“Measurement of brain perfusion, blood volume, and blood-brain barrier permeability, using dynamic contrast-enhancedT1-weighted MRI at 3 tesla,” Magnetic Resonance in Medicine,
vol. 62, no. 5, pp. 1270–1281, 2009.[18] T. S. Koh, V. Zeman, J. Darko et al., “The inclusion of capillary
distribution in the adiabatic tissue homogeneitymodel of bloodflow,” Physics in Medicine and Biology, vol. 46, no. 5, pp. 1519–1538, 2001.
[19] M. C. Schabel, “A unified impulse response model for DCE-MRI,”Magnetic Resonance in Medicine, vol. 68, no. 5, pp. 1632–1646, 2012.
[20] C. S. Patlak, R. G. Blasberg, and J. D. Fenstermacher, “Graph-ical evaluation of blood-to-brain transfer constants frommultiple-time uptake data,” Journal of Cerebral Blood Flow andMetabolism, vol. 3, no. 1, pp. 1–7, 1983.
[21] D. N. Louis, H. Ohgaki, O. D. Wiestler et al., “The 2007 WHOclassification of tumours of the central nervous system,” ActaNeuropathologica, vol. 114, no. 2, pp. 97–109, 2007.
[22] W. T. I. Yeung, T. Y. Lee, R. F. Del Maestro, R. Kozak, andT. Brown, “In vivo CT measurement of blood-brain transferconstant of iopamidol in human brain tumors,” Journal ofNeuro-Oncology, vol. 14, no. 2, pp. 177–187, 1992.
[23] R. A. Hawkins, M. E. Phelps, and S. C. Huang, “A kineticevaluation of blood-brain barrier permeability in human braintumors with [68Ga]EDTA and positron computed tomography,”Journal of Cerebral Blood Flow andMetabolism, vol. 4, no. 4, pp.507–515, 1984.
[24] C. Roberts, B. Issa, A. Stone, A. Jackson, J. C. Waterton, andG. J. M. Parker, “Comparative study into the robustness ofcompartmentalmodeling andmodel-free analysis inDCE-MRI
studies,” Journal of Magnetic Resonance Imaging, vol. 23, no. 4,pp. 554–563, 2006.
[25] H. Bagher-Ebadian, R. Jain, S. P. Nejad-Davarani et al., “Modelselection for DCE-T
1studies in glioblastoma,” Magnetic Reso-
nance in Medicine, vol. 68, pp. 241–251, 2011.[26] D. P. Barboriak, J. R. MacFall, A. O. Padua, G. E. York, B.
L. Viglianti, and M. W. Dewhirst, “Standardized software forcalculation of 𝐾trans and vp from dynamic T
1-weighted MR
images,” in Proceedings of the International Society for MagneticResonance in Medicine Workshop on MR in Drug Development:FromDiscovery to ClinicalTherapeutic Trials,McLean, Va, USA,2004.
[27] M. Ingrisch, O. Dietrich, U. I. Attenberger et al., “Quantitativepulmonary perfusion magnetic resonance imaging: influenceof temporal resolution and signal-to-noise ratio,” InvestigativeRadiology, vol. 45, no. 1, pp. 7–14, 2010.
[28] C. Lavini, J. J. Verhoeff, C. B. Majoie, L. J. Stalpers, D. J.Richel, and M. Maas, “Model-based, semiquantitative and timeintensity curve shape analysis of dynamic contrast-enhancedMRI: a comparison in patients undergoing antiangiogenictreatment for recurrent glioma,” Journal of Magnetic ResonanceImaging, vol. 34, no. 6, pp. 1303–1312, 2011.
[29] A. Haase, “Snapshot FLASH MRI. Applications to T1, T2, and
chemical-shift imaging,” Magnetic Resonance in Medicine, vol.13, no. 1, pp. 77–89, 1990.
[30] P. Caravan, J. J. Ellison, T. J. McMurry, and R. B. Lauffer,“Gadolinium(III) chelates as MRI contrast agents: structure,dynamics, and applications,” Chemical Reviews, vol. 99, no. 9,pp. 2293–2352, 1999.
[31] T. T. Batchelor, A. G. Sorensen, E. di Tomaso et al., “AZD2171, aPan-VEGF receptor tyrosine kinase inhibitor, normalizes tumorvasculature and alleviates edema in glioblastoma patients,”Cancer Cell, vol. 11, no. 1, pp. 83–95, 2007.
[32] R. Jain, J. Gutierrez, J. Narang et al., “In vivo correlation oftumor blood volume and permeability with histologic andmolecular angiogenic markers in gliomas,” American Journal ofNeuroradiology, vol. 32, no. 2, pp. 388–394, 2011.
[33] J. U. Harrer, G. J. M. Parker, H. A. Haroon et al., “Comparativestudy of methods for determining vascular permeability andblood volume in human gliomas,” Journal of Magnetic Reso-nance Imaging, vol. 20, no. 5, pp. 748–757, 2004.
[34] R. E. Port, L. J. Bernstein, D. P. Barboriak, L. Xu, T. P. L.Roberts, and N. Van Bruggen, “Noncompartmental kineticanalysis of DCE-MRI data from malignant tumors: applicationto glioblastoma treated with bevacizumab,”Magnetic Resonancein Medicine, vol. 64, no. 2, pp. 408–417, 2010.
[35] M. Law, S. Yang, J. S. Babb et al., “Comparison of cerebral bloodvolume and vascular permeability from dynamic susceptibilitycontrast-enhanced perfusion MR imaging with glioma grade,”American Journal of Neuroradiology, vol. 25, no. 5, pp. 746–755,2004.
[36] T. F. Patankar, H. A. Haroon, S. J. Mills et al., “Is volumetransfer coefficient (𝐾trans) related to histologic grade in humangliomas?” American Journal of Neuroradiology, vol. 26, no. 10,pp. 2455–2465, 2005.

Submit your manuscripts athttp://www.hindawi.com
Neurology Research International
Hindawi Publishing Corporationhttp://www.hindawi.com Volume 2013
Alzheimer’s DiseaseHindawi Publishing Corporationhttp://www.hindawi.com Volume 2013
International Journal of
ScientificaHindawi Publishing Corporationhttp://www.hindawi.com Volume 2013
BioMed Research International
Hindawi Publishing Corporationhttp://www.hindawi.com Volume 2013
Hindawi Publishing Corporationhttp://www.hindawi.com Volume 2013
Research and TreatmentSchizophrenia
Hindawi Publishing Corporation http://www.hindawi.com Volume 2013Hindawi Publishing Corporation http://www.hindawi.com Volume 2013
The Scientific World Journal
Hindawi Publishing Corporationhttp://www.hindawi.com Volume 2013
Neural Plasticity
Parkinson’s DiseaseHindawi Publishing Corporationhttp://www.hindawi.com Volume 2013
Hindawi Publishing Corporationhttp://www.hindawi.com Volume 2013
Research and TreatmentAutism
Sleep DisordersHindawi Publishing Corporationhttp://www.hindawi.com Volume 2013
Neuroscience JournalHindawi Publishing Corporationhttp://www.hindawi.com Volume 2013
Epilepsy Research and TreatmentHindawi Publishing Corporationhttp://www.hindawi.com Volume 2013
Psychiatry JournalHindawi Publishing Corporationhttp://www.hindawi.com Volume 2013
Hindawi Publishing Corporationhttp://www.hindawi.com Volume 2013
Computational and Mathematical Methods in Medicine
Depression Research and TreatmentHindawi Publishing Corporationhttp://www.hindawi.com Volume 2013
Hindawi Publishing Corporationhttp://www.hindawi.com Volume 2013
Brain ScienceInternational Journal of
StrokeResearch and TreatmentHindawi Publishing Corporationhttp://www.hindawi.com Volume 2013
Neurodegenerative Diseases
Hindawi Publishing Corporationhttp://www.hindawi.com Volume 2013
Journal of
Cardiovascular Psychiatry and NeurologyHindawi Publishing Corporationhttp://www.hindawi.com Volume 2013