Predicting porosity, permeability, and tortuosity of ... - Nature
Upload
khangminh22Category
view
0download
0
Industrial Materials for the Future
Managed by
UT-Battelle, LLC
Final Technical Report
Development of Cost-Effective
Low-Permeability Ceramic and
Refractory Components for Aluminum
Melting and Casting December 2005 Principal Investigators:
Dale E. Brown Pyrotek, Inc. Ronald D. Ott Oak Ridge National Laboratory Jeffrey D. Smith University of Missouri—Rolla
ORNL/TM-2005/266

DOCUMENT AVAILABILITY
Reports produced after January 1, 1996, are generally available free via the
U.S. Department of Energy (DOE) Information Bridge.
Web site http://www.osti.gov/bridge Reports produced before January 1, 1996, may be purchased by members of the public from the following source.
National Technical Information Service 5285 Port Royal Road Springfield, VA 22161
Telephone 703-605-6000 (1-800-553-6847) TDD 703-487-4639 Fax 703-605-6900 E-mail [email protected] Web site http://www.ntis.gov/support/ordernowabout.htm
Reports are available to DOE employees, DOE contractors, Energy Technology Data Exchange (ETDE) representatives, and International Nuclear Information System (INIS) representatives from the following source.
Office of Scientific and Technical Information P.O. Box 62 Oak Ridge, TN 37831 Telephone 865-576-8401 Fax 865-576-5728 E-mail [email protected] Web site http://www.osti.gov/contact.html

FINAL TECHNICAL REPORT
Project Title: Development of Cost-Effective Low-Permeability Ceramic and
Refractory Components for Aluminum Melting and Casting
Award No: DE-FC36-01ID14244
Project Period: August 1, 2002–July 31, 2005
PIs: Dale E. Brown (Pyrotek, Inc., Jackson, TN)
Now at Pyrotek, Elmsford, NY
(914) 345-4745
Ronald D. Ott (Oak Ridge National Laboratory)
(865) 574-5172
Jeffrey D. Smith (University of Missouri—Rolla)
(573) 341-4447
Additional Researchers: Greg Hodren (Pyrotek, Inc.)
(717) 249-2075
Puja B. Kadolkar (Oak Ridge National Laboratory)
(865) 574-9956
William G. Fahrenholtz (University of Missouri—Rolla)
(573) 341-6343
Recipient Organization: Pyrotek, Inc.
1231 Manufacturers Row
Trenton, TN 38382
National Laboratory: Oak Ridge National Laboratory
Bethel Valley Road
P.O. Box 2008
Oak Ridge, TN 37831
Subcontractor: University of Missouri at Rolla
Department of Materials Science and Engineering
223 McNutt Hall
Rolla, MO 65409


ORNL/TM-2005/266
Development of Cost-Effective Low-Permeability Ceramic and
Refractory Components for Aluminum Melting and Casting
Dale E. Brown
Greg Hodren
Pyrotek, Inc.
Ronald D. Ott
Puja B. Kadolkar
Oak Ridge National Laboratory
Jeffrey D. Smith
William G. Fahrenholtz
University of Missouri—Rolla
December 2005
Prepared by
OAK RIDGE NATIONAL LABORATORY
P.O. Box 2008
Oak Ridge, Tennessee 37831-6283
managed by
UT-Battelle, LLC
for the
U.S. DEPARTMENT OF ENERGY
under contract DE-AC05-00OR22725

ii
Acknowledgments and Disclaimer
Acknowledgments
This report is based upon work supported by the U.S. Department of Energy, Energy Efficiency and
Renewable Energy, Industrial Technologies Program, Industrial Materials for the Future, under
Award No. DE-FC36-01ID14244.
The authors would like to acknowledge Terry Tiegs, Jim Kiggans, Vinod Sikka, Jackie Mayotte, and
David Harper at ORNL for their valuable contributions to and participation in the project. In addition,
support from Soto Jose Maria and Sander Todd Pearson of the University of Missouri—Rolla is
greatly appreciated. The authors would like to thank Dr. Peter Angelini for project guidance and
review.
Oak Ridge National Laboratory is operated by UT-Battelle, LLC, for the U.S. Department of Energy
under contract DE-AC05-00OR22725.
Disclaimer
This report was prepared as an account of work sponsored by an agency of the United States
Government. Neither the United States Government nor any agency thereof, nor any of their
employees, makes any warranty, express or implied, or assumes any legal liability or responsibility
for the accuracy, completeness, or usefulness of any information, apparatus, product, or process
disclosed, or represents that its use would not infringe privately owned rights. Reference herein to any
specific commercial product, process, or service by trade name, trademark, manufacturer, or
otherwise, does not necessarily constitute or imply its endorsement, recommendation, or favoring by
the United States Government or any agency thereof. The views and opinions of authors expressed
herein do not necessarily state or reflect those of the United States Government or any agency thereof.

iii
Contents
List of Figures ........................................................................................................................................v List of Tables .......................................................................................................................................vii Abbreviations and Acronyms...............................................................................................................ix
1. Executive Summary...............................................................................................................................1 1.1 Research and Development.........................................................................................................1 1.2 Accomplishments ........................................................................................................................2 1.3 Commercialization ......................................................................................................................2 1.4 Recommendations .......................................................................................................................2
2. Introduction ............................................................................................................................................3 2.1 Current Status of Refractories in Industrial Processing ............................................................3 2.2 Benefits to the Domestic Aluminum and Metal Casting Industry ...........................................3 2.3 Project Objectives .......................................................................................................................4 2.4 Assumptions and Detailed Calculations of Energy Savings to the
Domestic Aluminum Industry ...................................................................................................4
3. Background ............................................................................................................................................7
3.1 Major Project Tasks.....................................................................................................................7 3.1.1 Autogenous Coatings ........................................................................................................7 3.1.2 Advanced Ceramic Coatings ............................................................................................7
3.1.3 Advanced Monolithic Refractories ..................................................................................8 3.2 Scaleup, Testing, and Characterization ......................................................................................8
3.2.1 Scaleup and Manufacturability Issues..............................................................................8 3.2.2 In-Plant Trials and Validation Testing.............................................................................8
3.2.3 Wetting of Coated- and Monolithic-Refractories............................................................8 3.2.4 Microscopic Characterization...........................................................................................9
3.3 Work Breakdown Structure ......................................................................................................10 3.3.1 Task 1: Characterization of DFS refractories ................................................................10 3.3.2 Task 2: Autogenous Coatings.........................................................................................10 3.3.3 Task 3: Advanced Ceramic Coatings.............................................................................10 3.3.4 Task 4: Advanced Monolithic Refractories ...................................................................10 3.3.5 Task 5: Coat and Field Test Prototype Components.....................................................11
4. Results and Discussion ........................................................................................................................13 4.1 Characterization of DFS Refractories ......................................................................................13
4.1.1 Microstructural Characterization....................................................................................13 4.1.2 Wettability and Aluminum Interaction Studies.............................................................14
4.2 Autogenous Coatings ................................................................................................................16 4.3 Advanced Ceramic Coatings ....................................................................................................18 4.4 Advanced Monolithic Refractories...........................................................................................28
4.4.1 Permeability of Dense Fused Silica ...............................................................................28 4.4.2 Optimization of Particle Packing Density for Minimum Permeability .......................31
4.5 Coat and Field Test Prototype Components ............................................................................35 4.5.1 Advanced Ceramic Coatings ..........................................................................................35 4.5.1 Advanced Monolithic Refractories ................................................................................36

iv
5. Accomplishments ................................................................................................................................ 39 5.1 Technical Accomplishments..................................................................................................... 39 5.2 Technology Transfer ................................................................................................................. 39
5.3 Publications ............................................................................................................................... 39
6. Conclusions.......................................................................................................................................... 41
7. Recommendations ............................................................................................................................... 43
8. References ............................................................................................................................................ 45
Appendices
A: Interaction of Aluminum with Silica-Based Ceramics ........................................................... 47 B: Development of Cost-Effective Low-Permeability Ceramic and
Refractory Components for Aluminum Melting and Casting ................................................ 61

v
List of Figures
3.1 Schematic showing the utilization of riser-tube during low-pressure die-casting process…... 9
4.1 Microstructural characterization of as-received DFS riser tube from Pyrotek. ........................ 13
4.2 (a) Schematic showing section of the reacted tube that was examined; (b) optical
image of the dense fused silica (DFS) riser tube......................................................................... 14
4.3 (a) SEM micrograph showing tube section after use; (b) high-resolution micrograph
of the reaction zone. ..................................................................................................................... 15
4.4 Elemental mapping of the reacted tube section........................................................................... 15
4.5 High-density plasma arc lamp facility at ORNL......................................................................... 16
4.6 IR-treated fused silica: (a) side view after energy input of 104,000 joules;
(b) top view after energy input of 40,000 joules. ........................................................................ 17
4.7 X-ray results showing that amorphous structure of fused silica was maintained
after IR heating. ............................................................................................................................. 17
4.8 Variation in melted zone depth with increasing exposure time. ................................................ 18
4.9 Optical micrographs showing cross sections along the glaze/substrate interface
corresponding to (a) glaze 1, (b) glaze 6, (c) glaze 7, and (d) glaze 8 compositions................ 20
4.10 SEM micrographs showing glaze section and fused silica substrate after the firing process. . 21
4.11 X-ray diffraction pattern showing various crystalline phases formed within
the glaze after the firing process: top, glaze 1; bottom, glaze 6. ................................................ 23
4.12 X-ray diffraction pattern showing various crystalline phases formed within
the glaze after the firing process: top, glaze 7; bottom, glaze 8. ................................................ 24
4.13 X-ray diffraction pattern showing cristobalite formation in fused silica
substrate after firing of glazes 6 and 8 at temperatures above 1200°C...................................... 25
4.14 Dilatometer test results for CTE measurements of glaze 1: (top) expansion of specimen;
(bottom) mean CTE as a function of temperature. ...................................................................... 26
4.15 X-ray analysis of specimen before and after CTE measurement. .............................................. 27
4.16 Reactivity of glaze 1 with molten aluminum for different exposure times. .............................. 27
4.17 Comparison of sample (a) with and (b) without protective glaze 1 after
24-h exposure at 750°C................................................................................................................. 28
4.18 Micrographs of glaze 1 on fused silica (a) with reduced Li2CO3 and containing
spodumene in the glaze mixture and (b) with the fritted glaze mixture. ................................... 29
4.19 Schematic of the vacuum-decay permeameter. ........................................................................... 29
4.20 Typical pressure decay curve recorded during permeability measurement............................... 30
4.21 Full-scale permeameter developed at UMR. ............................................................................... 31
4.22 Permeability test results showing reproducibility in pressure decay data. ................................ 32
4.23 Computer model predicting particle size distribution for optimized packing density.............. 32

vi
4.24 (a) Particle size distribution (PSD) and (b) deviation within each size class
for formulation shown in Table 4.6. ............................................................................................ 33
4.25 (a) Particle size distribution (PSD) and (b) deviation within each size class for
unconstrained formulation shown in Table 4.7........................................................................... 34
4.26 A section of DFS riser tube tested with glaze 1 prepared in methanol...................................... 36
4.27 Life extension in riser tubes resulting from coatings and castable refractories. ....................... 37

vii
List of Tables
2.1 Energy savings in the low-pressure casting of aluminum components due to
improved riser tubes...................................................................................................................... 5
4.1 EDS analysis of DFS tube after aluminum contact..................................................................... 16
4.2 IR processing conditions............................................................................................................... 16
4.4 Firing schedule for various glaze compositions.......................................................................... 19
4.5 Free energy of reaction of various crystalline phases ................................................................. 21
4.6 Initial formulation based on the continuous distribution model................................................. 33
4.7 Unconstrained formulation for silica castables: no nonwetting agent 1 and
lower cement.................................................................................................................................. 35
4.8 Two constrained formulations for silica castables ...................................................................... 35


ix
Abbreviations and Acronyms
Al2O3 alumina
BN boron nitride
Btu British thermal unit
CTE coefficient of thermal expansion
DFS dense fused silica
DOE U.S. Department of Energy
EDS energy-dispersive spectroscopy
EDX energy-dispersive X-ray
IMF Industrial Materials for the Future (DOE)
IR infrared
LPD low-pressure die
MECS Manufacturing Energy Consumption Survey
NOx nitrogen dioxide
OIT Office of Industrial Technologies (DOE)
ORNL Oak Ridge National Laboratory
OTT Office of Transportation Technologies (DOE)
PSD particle size distribution
SEM scanning electron microscope
SiO2 silica
UMR University of Missouri—Rolla
YAG yttrium aluminum garnet


1
1. Executive Summary
1.1 Research and Development
A recent review by the U.S. Advanced Ceramics Association, the Aluminum Association, and the
U.S. Department of Energy’s Office of Industrial Technologies (DOE/OIT) described the status of
advanced ceramics for aluminum processing, including monolithics, composites, and coatings. The
report observed that monolithic ceramics (particularly oxides) have attractive properties such as
resistance to heat, corrosion, thermal shock, abrasion, and erosion [1]. However, even after the
developments of the past 25 years, there are two key barriers to commercialization: reliability and
cost-effectiveness. Industry research is therefore focused on eliminating these barriers. Ceramic
coatings have likewise undergone significant development and a variety of processes have been
demonstrated for applying coatings to substrates. Some processes, such as thermal barrier coatings for
gas turbine engines, exhibit sufficient reliability and service life for routine commercial use.
Worldwide, aluminum melting and molten metal handling consumes about 506,000 tons of refractory
materials annually. Refractory compositions for handling molten aluminum are generally based on
dense fused cast silica or mullite. The microstructural texture is extremely important because an
interlocking mass of coarser grains must be bonded together by smaller grains in order to achieve
adequate strength. At the same time, well-distributed microscopic pores and cracks are needed to
deflect cracks and prevent spalling and thermal shock damage [2].
The focus of this project was to develop and validate new classes of cost-effective, low-permeability
ceramic and refractory components for handling molten aluminum in both smelting and casting
environments. The primary goal was to develop improved coatings and functionally graded materials
that will possess superior combinations of properties, including resistance to thermal shock, erosion,
corrosion, and wetting. When these materials are successfully deployed in aluminum smelting and
casting operations, their superior performance and durability will give end users marked
improvements in uptime, defect reduction, scrap/rework costs, and overall energy savings resulting
from higher productivity and yield. The implementation of results of this program will result in
energy savings of 30 trillion Btu/year by 2020.
For this Industrial Materials for the Future (IMF) project, riser tube used in the low-pressure die
(LPD) casting of aluminum was selected as the refractory component for improvement. In this LPD
process, a pressurized system is used to transport aluminum metal through refractory tubes (riser
tubes) into wheel molds. It is important for the tubes to remain airtight because otherwise, the
pressurized system will fail. Generally, defects such as porosity in the tube or cracks generated by
reaction of the tube material with molten aluminum lead to tube failure, making the tube incapable of
maintaining the pressure difference required for normal casting operation. Therefore, the primary
objective of the project was to develop a riser tube that is not only resistant to thermal shock, erosion,
corrosion, and wetting, but is also less permeable, so as to achieve longer service life. Currently, the
dense-fused silica (DFS) riser tube supplied by Pyrotek lasts for only 7 days before undergoing
failure.
The following approach was employed to achieve the goal:
• Develop materials and methods for sealing surface porosity in thermal-shock-resistant
ceramic refractories

2
• Develop new ceramic coatings for extreme service in molten aluminum operations, with
particular emphasis on coatings based on highly stable oxide phases
• Develop new monolithic refractories designed for lower-permeability applications using
controlled porosity gradients and particle size distributions
• Optimize refractory formulations to minimize wetting by molten aluminum, and characterize
erosion, corrosion, and spallation rates under realistic service conditions
• Scale up the processing methods to full-sized components and perform field testing in
commercial aluminum casting shops
1.2 Accomplishments
Two cost-effective coating formulations that offered excellent thermal shock properties and resistance
to molten aluminum attack were identified as promising candidates for application on DFS riser
tubes. One coating formulation, called “XL” glaze, is a zircon-based coating material system
developed at Pyrotek, Inc. The other glaze, referred to as “glaze 1,” is a lithium-silicate-based coating
system that was investigated at Oak Ridge National Laboratory (ORNL). In addition to coating
formulations, a computer model suggesting optimized particle packing or particle size distribution
(PSD) that would minimize permeability in monolithic fused silica castables was developed at the
University of Missouri—Rolla (UMR). Another outcome that evolved out of the research efforts at
UMR was development of a permeability measuring apparatus that can accommodate a full-scale
DFS riser tube. Currently, DFS riser tubes coated with Pyrotek’s XL glaze are routinely manufactured
and supplied by Pyrotek to its customers. The XL-coated DFS tubes are reported to last 3 to 5 weeks,
as compared to uncoated DFS tubes, which last only 7 days, indicating that the XL coating extends
the life of the DFS tubes up to 300–400%. Additionally, four full-scale fused silica castables that
were formulated on the basis of the PSD computer model were designed and manufactured at Pyrotek
and are now undergoing field testing at General Aluminum, Wapakoneta, Ohio. Preliminary test
results have shown that the silica castables lasted for 8 weeks during the aluminum casting
operations, indicating an increase in the life of the riser tubes of 700%. The potential national energy
savings by replacing the older riser tube with this improved riser tube is estimated to be 206 billion
Btu/year.
1.3 Commercialization
Pyrotek, Inc., is currently leading the commercialization efforts in promoting the new riser-tube
castables as well as the new glaze systems through its own clientele. Pyrotek is one of the world’s
leading suppliers of consumable products and melt treatment solutions for the aluminum industry and
has about 60 manufacturing sites, sales offices, and warehouses worldwide. Pyrotek has already sold
about 1200 of their XL-coated DFS riser tubes and has reported an increasing number of inquiries
since 2003 that suggests growing awareness of these enhanced riser tubes within the refractory and
aluminum industrial community. Pyrotek is projecting better sale numbers with the production of
their fused silica castables, which have been shown to increase the life of riser tubes by 700%.
1.4 Recommendations
It is recommended that use of coatings and castable formulations similar to those studied in this
project be extended to other refractory components within the aluminum casting industry (such as
troughs, metal handling ladles, spouts and pins), as well within other industries, including glass,
chemical, petrochemical, steel, agriculture, mining, and forest products.

3
2. Introduction
2.1 Current Status of Refractories in Industrial Processing
Refractories are used in many industries, including glass, aluminum, chemical, metalcasting,
petrochemicals, steel, agriculture, mining, and forest products. Refractory materials are used
primarily in applications requiring corrosion resistance at high temperatures. Thus, they are generally
used as insulation or containment linings for various furnaces, boilers, and reactor vessels used in
different industries. The purpose of refractories is generally to contain heat, melts, or chemicals, and
therefore they play a vital role in all energy-intensive industries. A recent study performed by
DOE/OIT; ORNL; Metals Manufacture, Process, and Controls Technology, Inc.; and R. E. Moore
and Associates, presented a detailed discussion of the refractory issues and challenges for various
energy-intensive processing industries [3]. Several opportunities for energy savings through
refractory improvements have been identified, and various cross-cutting R&D pathways for achieving
high energy efficiency have been suggested. The research conducted through this project is a perfect
example of identifying and overcoming one such cross-cutting refractory problem with a potential to
provide substantial energy savings to both the aluminum and the metal casting industry.
2.2 Benefits to the Domestic Aluminum and Metal Casting Industry
The aluminum and metal casting industries are energy-intensive industries. According to the 1998
DOE Manufacturing Energy Consumption Survey (MECS) [4], 90% of the total energy consumed by
these two industries is affected by refractories. Thus, it is extremely important to identify areas of
refractory improvements if significant energy savings are to be realized. It has been estimated that
improvement of refractory systems for the aluminum and metal casting industries could lead to
energy saving opportunities up to 29.2 trillion and 8.5 trillion Btu/ year, respectively [3]. The current
report discusses the energy savings that could be achieved by improving the performance of the DFS
riser tubes used in the LPD casting process for the production of aluminum components. Some of the
problems associated with current riser tubes are their inability to hold pressure due to high porosity
and material degradation due to chemical attack from molten aluminum. Improving the performance
of riser tubes will help reduce the quantity of scrap produced in the casting operation and, thus, save
the energy associated with remelting of the metal scrap. Section 2.4 provides an example of how
improvement in riser tubes can help the aluminum industry save 206 billion Btu of energy annually.
A multipartner research team consisting of representatives from industry (Pyrotek and its customers),
a national laboratory (ORNL), and a university (UMR) conducted a systematic study to address the
issues related to riser tubes and develop improved materials that would enhance the casting operation
and increase production yield. Pyrotek participated by supplying the raw materials, in-process
components, and finished components for experimental modification at ORNL. Pyrotek also
conducted field testing, validation, scale-up, and economic analysis of the improved products. ORNL
and UMR modified the refractory materials and developed new materials and processes, characterized
these materials, and performed post mortem analyses in collaboration with industry. Pyrotek and its
customers provided overall guidance and direction for the project by establishing R&D priorities and
by monitoring research progress and deliverables. The project was very successful. Two new
refractory tube formulations were developed, and one of these has been commercialized by Pyrotek.

4
2.3 Project Objectives
The cost-effective ceramic and refractory components for handling molten aluminum developed in
this project are expected to reduce downtime through longer life, reduce scrap through lower rates of
erosion and particulate generation, and reduce overall energy use by improving casting operations.
These components were developed through a focused program designed to identify, develop, and
understand new refractory materials; quantify their performance in molten metal service; and validate
these findings through actual field testing and postmortem analysis.
The following efforts were part of this project:
• Development of autogenous materials and methods for sealing surface porosity in thermal
shock–resistant fused silica refractories
• Development of new ceramic coatings for extreme service in molten aluminum operations,
with particular emphasis on coatings based on YAG and other highly stable oxide phases
• Development of new monolithic refractories for creep and erosion resistance with emphasis
on liquid-phase sintered mixed-oxide systems with controlled porosity gradients
• Optimization of refractory formulations to minimize wetting by molten aluminum, and
characterization of erosion, corrosion, and spallation rates under realistic service conditions
• Scaleup of processing methods to full-sized components and field testing in commercial
aluminum casting shops
The major issue for this project was the inability of current ceramics/refractories to maintain gas
pressure in the delivery tubes for aluminum metal casting. The project focused on porosity, which can
be closed either by surface modification or by changes in the bulk refractory chemistry. Both
approaches were evaluated in this project. Samples of refractory materials in both finished (sintered)
and green (unsintered) states were provided by Pyrotek. Both ORNL and UMR initiated efforts to
formulate coatings and bulk materials. Formulation and sintering of coatings and microstructural
characterization for test coupons was done at ORNL whereas formulation and sintering of coatings
for full-sized components was done at Pyrotek. UMR designed new formulations, prepared fused
silica castables (in the form of smaller discs) using slip casting, and conducted permeability and
reactivity tests of newly formulated castables. Full-scale silica castables were manufactured at
Pyrotek, while field testing and validation were performed at a commercial aluminum casting shop.
Pyrotek provided advice and guidance on cost and manufacturability issues.
2.4 Assumptions and Detailed Calculations of Energy Savings (Btu) to the Domestic Aluminum Industry
Aluminum is the material of choice for many components, especially in the vehicle industry.
According to Aluminum R&D for Automotive Uses and the Department of Energy’s Role, a study
performed by ORNL and DOE’s Office of Transportation Technologies (OTT) in March 2000 [5],
engines, transmissions, heat exchangers, and wheels account for over 83% of the aluminum currently
used in vehicles in North America. Castings account for more than 75% of aluminum material used,
with almost 35% of these castings produced using low-pressure methods (both low-pressure die and
low-pressure permanent mold castings). Now assuming that the production demographics of 1999
represents a typical year, from a total of 3.8 billion pounds of aluminum products produced for the
automotive industry each year, 1.3 billion pounds of aluminum is processed using low-pressure
casting techniques. Data from Pyrotek’s end users report that about 3% of the total low-pressure

5
castings produced are scrapped each year due to the improper performance of riser tubes during the
low-pressure casting operation. The energy consumed in remelting this scrap and the energy lost in
the associated dross formation account to an annual savings of 203 billion Btu. In addition,
replacement of the original DFS tubes with improved, longer-lasting, castable tubes is estimated to
provide additional annual energy savings of up to 2.19 billion Btu. Longer-lasting riser tubes suggest
fewer replacements and fewer tubes consumed per year. With fewer tubes consumed per year, fewer
tubes have to be produced. This additional 2.19 billion Btu in energy savings relates to the energy
associated with the reduced DFS riser tube production. Table 2.1 shows the detailed calculation of the
energy savings. It is important to note that these energy calculations do not incorporate the sources of
energy losses outside the casting process, such as die preheating and heating of the holding furnace
during the downtime involved with tube replacement. Adding these losses will further help enhance
the energy savings in the casting operation.
Table 2.1. Energy savings in the low-pressure casting of aluminum components due to improved riser tubes
Item
no.
Item
1 Annual production of aluminum automotive components produced using
low-pressure casting processes, lb a
1.33 109
2 Annual production of scrap metal (3%) due to improper functioning of the
riser tube, lb
3.99 107
3 Annual natural gas energy consumption in remelting scrap, Btub 8.78 10
10
4 Annual loss of metal in dross formation during remelting (4%), lb 1.6 106
5 Annual energy losses due to dross formation, Btuc 1.16 10
11
6 Annual consumption of riser tubes by low-pressure casters in U.S., lb 9.0 105
7 Annual natural gas energy consumption during firing of riser tubes, Btud 2.5 10
9
8 Annual energy savings due to reduced riser tube production, Btue 2.19 10
9
9 Total energy savings (adding Item 3 + Item 5 + Item 8) 2.06 1011
Total energy savings 2.06 1011
a Data from Ref. [5]. b
Typical energy consumed by a reverberatory aluminum-melting furnace with an efficiency of 23% is 2200 Btu/lb [3]. c
According to the 1997 energy and environmental profile of the U.S. aluminum industry [6], the energy required to produce aluminum from ore is about 72500 Btu/lb. d Natural gas consumption is 2778 Btu/lb of refractory material fired (Pyrotek).
e With Pyrotek’s castable riser tubes lasting 8 weeks longer, the annual production of riser tubes
decreases by a factor of 8.


7
3. Background
The goal of this multipartner research project was to develop and validate new classes of cost-
effective refractory components for handling molten aluminum in casting environments. This was
done by emphasizing candidate materials and processes based on scientifically sound applications of
new ceramic compositions and novel processing capabilities. The project was built on ORNL’s
expertise in ceramic forming (particularly gelcasting), mixed-oxide refractories and coatings, and
rapid thermal processing. It also benefited from ORNL’s state-of-the-art materials characterization
facilities.
Oxide refractories for handling molten aluminum are generally made from either fused silica or
mullite. The components are usually not sintered to full density because experience has shown that
some porosity contributes to high thermal shock resistance. For many applications, particularly in
pressure casters, it is also essential that, in addition to having high thermal shock resistance, the
materials not be easily wetted by the molten aluminum. The nonwetting characteristics prevent metal
buildup and eventual failure in the refractory tube.
3.1 Major Project Tasks
The primary focus of this project was to develop new families of refractory ceramics, following a
logical progression from low- to high-risk materials systems in the following order:
1. Autogenous coatings on fused silica, designed to seal or minimize surface porosity and gas
permeability while maintaining excellent thermal shock resistance
2. Advanced ceramic coatings on fused silica, to seal surface porosity and provide exceptional
resistance to erosion, corrosion, or chemical attack
3. Advanced monolithic refractories based on optimized particle packing and pore size
distribution
3.1.1 Autogenous Coatings
The first major activity of the project consisted of designing cost-effective treatments to modify the
surface of fused cast silica tubes. The goal was to seal surface porosity while preserving the thermal
shock resistance of the bulk material. In order to make the refractory surface less permeable while
keeping it resistant to molten aluminum attack, it was necessary to maintain the amorphous structure
inherent in Pyrotek’s fused silica refractory. This required rapid solidification of the melted surface of
the refractory without allowing any crystallization to occur. ORNL’s high-density plasma arc lamp
was used to achieve melting and rapid solidification of fused silica. The surface-modified fused silica
was examined for thickness, phase changes, and wetting by molten aluminum; the degree of porosity
was estimated by measuring the gas permeability under service conditions.
3.1.2 Advanced Ceramic Coatings
The second phase of the work largely emphasized the development of mixed-oxide coatings by in situ reactions. In earlier work [7], it was found that yttrium aluminum garnet (Y3Al5O12 , or YAG) was
exceptionally stable, as evidenced by its ability to withstand direct contact with molten lithium. YAG

8
is an intermediate phase (line compound) in the Y2O3-Al2O3 system [8] with eutectics on either side of
the compound.
The existence of these eutectics has profound implications for the processing of this material. The line
compound itself is very refractory and difficult to sinter if YAG powder is used as the starting
material. But if the pure oxides are mixed and heated to a temperature above the eutectics but below
the melting point of YAG, transient liquid phases form and these significantly enhance the sintering
process. Once all the material has been converted to YAG, it is refractory, creep-resistant, and
chemically inert.
Building on the previous results, it was proposed that YAG or YAG-like compounds formed on the
surface of DFS refractories be explored. The YAG could be formed in situ by applying rare earth
oxides and exploiting liquid-phase sintering to create a strong, adherent, chemically stable surface on
a relatively low-cost refractory substrate. One of the biggest challenges in coating DFS refractories is
their low coefficient of thermal expansion (0.5 10–6
/°C). One of the options considered here was to
look into semicrystalline glazes with coefficients of thermal expansion (CTEs) that would match
those of DFS. We selected several lithium-based silica glaze compounds with CTE values ranging
from –0.9 10–6
/°C to 1.3 10–6
/°C and investigated them as possible glaze materials.
3.1.3 Advanced Monolithic Refractories
The third activity in this project consisted of developing functionally graded materials, especially
density-graded, compositionally homogeneous structures [9]. Vibration-assisted slip casting was
used, along with fugitive pore formers and other well-known ceramic techniques, to create refractory
components with graded internal porosity. The formulations for producing these monolithic
refractories were optimized for particle packing and hence permeability, using particle size
distribution models.
3.2 Scaleup, Testing, and Characterization
3.2.1 Scaleup and Manufacturability Issues
ORNL, UMR, and Pyroteck closely collaborated on tasks throughout the execution of the project to
ensure that any materials and processes that were developed would be inherently manufacturable,
preserving as much as possible the standard practices of the refractories industry. Cost considerations
were a key driver, since the refractories to be developed had to be cost effective or they would not be
adopted by industrial users.
3.2.2 In-Plant Trials and Validation Testing
The autogenous coatings were evaluated in a foundry stalk/riser tube application. Figure 3.1 shows a
schematic of the pressurized system used in LPD processes where the riser tubes were tested.
Advanced coatings as well as monolithic castables were also evaluated for this application.
3.2.3 Wetting of Coated- and Monolithic-Refractories
As mentioned previously, it was desirable that the surface of the refractories not be wetted by molten
aluminum. It is very well known that the tendencies for wetting, nonwetting, and spreading can be
readily studied under carefully controlled conditions in the laboratory on the basis of the
configuration of a steady-state drop of liquid (in this case aluminum) on a flat surface of the

9
refractory, in the so-called sessile drop test. In a joining process (brazing or soldering) it is highly
desirable that the drop of molten metal wet and spread on the substrate. In the case of refractories, a
nonwetting condition is desirable to prevent the formation of an intimate interface at grain boundary
irregularities, and thus inhibit capillary behavior and prevent the penetration of the liquid into the
refractory. Because of the importance of understanding the wetting behavior in our application, we
performed the sessile drop tests with typical aluminum casting alloys on the existing refractory
material as well as on newly developed monoliths with controlled porosity and optimized particle
packing. In addition to measuring the wetting angles as a function of alloy and substrate composition,
and process variables such as time and temperature, we characterized the interfacial composition
using the microscopic characterization techniques discussed below.
3.2.4 Microscopic Characterization
As pointed out in ref. [1], a crucial part of any materials development program should be postmortem
analyses of end-of-life materials. It is only through careful examination of the microstructural
changes that we can develop a thorough understanding of the mechanisms of aging and progressive
damage. This information can then guide the iterative process of continuous materials improvement.
As is the case with many advanced materials, the key to the performance of these new refractory
components is the interface between the bulk material(s) and the coating(s), which in this case may be
of either a similar or dissimilar composition. The microstructural elements of the densified materials,
both as fabricated and following exposure testing, were characterized at ORNL’s microscopy
facilities. Phase distributions in the interfacial region were mapped using low-voltage energy-
dispersive X-ray (EDX) spectrum imaging with an analytical scanning electron microscope (SEM).
Mold cavity
Riser tube
Molten metal
Crucible
Gas
pressure
Fig. 3.1. Schematic showing utilization of
riser tube during low-pressure die-casting process.

10
3.3 Work Breakdown Structure
The following tasks were accomplished to meet the overall objective of the proposed research and
development.
3.3.1 Task 1: Characterization of DFS refractories
The focus of task 1 was to perform initial characterization of the DFS riser tubes (both as-fired and
failed in service) supplied by Pyrotek. This involved the following steps:
1. Characterizing silica refectories by studying microstructure, macrostructure, and functional
properties such as permeability and wetting characteristics with respect to molten aluminum
2. Performance of postmortem analysis of riser tubes that were in-service and experienced
failure after being attacked by molten aluminum to understand the aluminum reaction kinetics
3.3.2 Task 2: Autogenous Coatings
Task 2 involved developing surface treatments to seal the surface of porous fused silica refractories to
maintain the low-pressure requirements during casting operations. The research team at ORNL led on
this task, while Pyrotek supplied the refractories. The surfaces of the DFS coupons were melted by
exposing the coupons to a narrow band of high-density infrared (IR) energy, which after rapid
solidification would form a nonporous, gas-tight barrier. The coatings were evaluated for morphology
and degree of adhesion by performing metallography, and for integrity by performing a gas
permeability test. The following subtasks were performed:
1. Determining cost-effective methods for surface treatment of Pyrotek refractories
2. Processing test coupons machined from Pyrotek-supplied refractory material using the high-
density infrared (HID) heating system
3. Evaluating the microstructure, macrostructure, and functional properties of processed samples
3.3.3 Task 3: Advanced Ceramic Coatings
In task 3 we developed mixed-oxide coatings to seal the surface of porous fused silica refractories.
The basic idea was to form a ceramic coating on the surface of the refractories by in situ reaction of
the appropriate precursors, thereby taking advantage of a transient liquid phase sintering process. The
following subtasks were performed:
1. Determination of coating formulations
2. Application of coatings to Pyrotek’s silica refractories using various techniques such as
spraying, dipping, etc.
3. Sintering coatings using a resistance furnace and/or HID heating
4. Evaluating the microstructure, macrostructure, and functional properties of coated samples
3.3.4 Task 4: Advanced Monolithic Refractories
Task 4 developed a castable refractory formulation consisting of a non-wetting system and designed
with optimum particle packing to minimize the permeability of the refractory body. This task
involved the following subtasks:

11
1. Selection of appropriate compositions for casting advanced monolithic refractories on the
basis of chemical compatibility, functional properties, and cost
2. Development of a testing rig to measure the permeability of full-scale refractory components
3. Development of a particle size distribution model for optimum particle packing to minimize
permeability
4. Fabrication of test coupons based on the particle size distribution model
5. Testing of coupons for behavior under thermal shock conditions as well as exposure to
molten aluminum
3.3.5 Task 5: Coat and Field Test Prototype Components
In the final task ORNL and UMR assisted Pyrotek in the scaling-up of the coating techniques and
fabrication of monolithic refractory components developed under laboratory conditions. The coated
prototype riser tubes as well as the monolithic refractory components were to be field tested by
Pyrotek at a commercial aluminum casting shop. The following subtasks were completed:
1. ORNL assisted Pyrotek in the scaling-up of the previously developed coating processes.
2. Pyrotek performed sintering of coatings on selected components using resistance furnace
heating.
3. Pyrotek performed field testing of coated components at a commercial aluminum casting
shop.
4. Full-scale monolithic refractories based on the formulations developed at UMR were
produced at Pyrotek.
5. Pyrotek conducted field testing of refractory components at a commercial aluminum casting
shop.


13
4. Results and Discussion
4.1 Characterization of DFS Refractories
4.1.1 Microstructural Characterization
Microstructural characterization of the as-received riser tubes from Pyrotek was performed at ORNL.
One of Pyrotek’s fused silica riser tubes was sectioned as shown in Fig. 4.1 to evaluate the
microstructure along the tube’s length. No significant differences were found. Approximately 65% of
the microstructure area consists of dense SiO2 particles about 200 μm in length, while the remaining
35% consists of loosely packed small particles 5 μm or less in size. Several specimens were cut from
the tube sections in order to perform numerous characterization and processing techniques.
Fig. 4.1. Microstructural characterization of as-received DFS riser tube from Pyrotek.
Low-magnification images
High-magnification images
Section 3
Section 1
Section 2

14
Epoxy
Epoxy
Tube
Reacted area
Al contact surface
4.1.2 Wettability and Aluminum Interaction Studies
Pyrotek supplied an original riser tube, a single-coated tube coated with boron nitride (BN), and a
tube double-coated with Pyrotek’s proprietary zircon-based XL glaze and BN to UMR for wettability
and aluminum reactivity tests. Interactions between A356 aluminum (an Al-Si alloy) and sections of
DFS riser tubes were evaluated using a sessile drop approach. Experiments were carried out in a
horizontal furnace at 1225ºC under argon to minimize the effect of the aluminum oxide on the
interactions at the alloy-silica interface. Images of the drop were acquired and contact angle values
were measured for uncoated and coated samples, but no significant differences in the contact angles
were observed. Scanning electron microscopy (SEM) revealed the presence of cracks at the interface
between the reaction zone and the unreacted silica. The presence of reaction products (silicon in the
reacting alloy and aluminum in a reaction zone between the alloy and the unaffected silica) has been
confirmed using energy-dispersive spectroscopy (EDS). A two-layer coating system was found to be
effective in reducing penetration of the aluminum alloy. Details about these studies are included in
the published article reprinted in Appendix A.
In addition to these riser tubes, a used riser tube that had been reacted with molten aluminum was
also sent to UMR for postmortem studies. Postmortem studies included macroscopic, microscopic,
and elemental analyses of sections of reacted tube. Samples were prepared for SEM by slicing the
original tube into rings approximately 1 in. thick. Each ring was then cut to size for examination by
SEM. Samples were cut such that the surface along the inner diameter of the original tube that had
been in contact with molten aluminum could be examined [Fig. 4.2(a)]. The samples were set in
epoxy, polished, and coated with carbon. Figure 4.2(b) shows a low-magnification optical image of
DFS showing non-uniform reaction across its inner diameter. The image clearly shows that the DFS
tube reacted only at specific sites along the metal-tube interface. Less than half of the total inner
surface of the tube showed signs of reaction. From the points of reaction, the reaction zones grew into
the tube forming semispherical-shaped reactive zones. The microstructures of both the reacted and the
unreacted regions in the tube were examined by SEM. SEM analysis (Fig. 4.3) showed that the
apparent physical structure on the microscopic level had not changed by reaction. However, the SiO2
(a) (b)
Fig. 4.2. (a) Schematic showing section of the reacted tube that was examined; (b) optical image of the dense fused silica (DFS) riser tube.
Al
Tube
Region examined
Gas pressure

15
(a) (b)
Fig. 4.3. (a) SEM micrograph showing tube section after use; (b) high-resolution micrograph of the reaction zone.
surface in the tube had been converted to Al2O3 and silicon in this area, as confirmed by EDS analysis
(Fig. 4.4 and Table 4.1). This conversion of phases was similar to those observed in previous studies
[10], where silicates and aluminosilicates have shown that they react with aluminum according to
Eq. 4.1 below. EDS showed that most of the silicon was removed from the reaction zone. The oxygen
was depleted in the reacted region of the tube, and aluminum was the predominant species.
4 Al + 3 SiO2 3 Al2O3 + 3 Si (4.1)
Al map Si map
SEM O map
Fig. 4.4. Elemental mapping of the reacted tube section.
Reaction zone
Al contact surface
Reacted large grain
Reacted fine grain

16

17
Table 4.1. EDS analysis of DFS tube after aluminum contact
Wt % At % Oxide %
Element DC UA DC UA DC UA
Aluminum 48.62 1.63 36.69 1.21 91.86 3.07
Silicon 3.39 44.68 2.46 32.00 7.25 95.59
Oxygen 47.46 52.74 60.4 66.31 — —
All 100 100 100 100 100 100
Note: Standardless EDS results calculated using normalizing algorithms for the white tubing. Carbon excluded from analysis.
DC = discolored region; UA = unaffected region
4.2 Autogenous Coatings
Surface treatment of the wedge-shaped pieces cut from the riser tubes (shown in Fig. 4.1) was
performed using ORNL’s high-density infrared (IR) plasma arc lamp (Fig. 4.5). The arc lamp is a
300-kW plasma radiant source with deposition widths of 10, 20, and 35 cm and a 1-cm depth of field.
The lamp is capable of delivering extremely high power densities (3.5 kW/cm2) and has demonstrated
materials-processing capabilities at temperatures in excess of 3,020°C [11]. The lamp is typically
configured with a reflector to produce a line focus or an area of uniform irradiance and can be
operated in either a pulse or a scan mode. Initially, the IR lamp was used to process three fused silica
samples. The IR settings used for processing these three samples are shown in Table 4.2.
Fig. 4.5. High-density plasma arc lamp facility at ORNL.
Table 4.2. IR processing conditions
Specimen Sample
IR amperage
(A)
IR exposure time
(s)
Energy input
(J)
1 Fused silica 900 2 20,800
2 Fused silica 900 5 40,000
3 Fused silica 900 10 104,000

18
Figure 4.6 clearly shows that IR heating melted the surface of the fused silica. X-ray results (Fig. 4.7)
showed that in spite of the melting, the modified or the treated surface maintained an amorphous
structure similar to the one in the as-received or untreated fused silica. Observation of the cross
sections of these three samples revealed increases in the depth of the melted zone with increasing
exposure time. Figure 4.8 shows the variation of melt depth with increasing energy input. From the
figure, one can say that it is possible to tailor the uniformity of the melt zone depths by decreasing the
lamp amperage and increasing the exposure time. Thus, while it is possible to melt the entire cross
section of the sample by changing the IR lamp settings, it was first necessary to evaluate the reactivity
of the IR-treated surface with molten aluminum.
(a) (b)
Fig. 4.6. IR-treated fused silica: (a) side view after energy input of 104,000 joules; (b) top view after energy input of 40,000 joules.
Fig. 4.7. X-ray results showing that amorphous structure of fused silica was maintained after IR heating.
Melted As-received

19
0.0
1.0
2.0
3.0
4.0
0 50000 100000
Joules
Dep
th (
mm
)
Joules Melt zone depth
(mm)
20,800 0.01
40,000 1.7
104,000 3.5
Fig. 4.8. Variation in melted zone depth with increasing exposure time.
In order to test the reactivity of the modified fused silica surface with aluminum, a small aluminum
pellet was placed on the IR-treated surface of fused silica and heated to 700°C in an argon
atmosphere for 30 min. For comparison, an untreated (as-received) sample of fused silica was placed
with the aluminum pellet in the same furnace. After the treatment, aluminum was observed to adhere
to the IR-treated surface but not to the untreated surface. It is likely that the dense structure of the
treated surface may have allowed the reaction to occur faster than did the porous structure of the
untreated fused silica. Pyrotek suggested that applying a nonwetting agent to the melted surface after
IR treatment may prevent its reaction with aluminum. Although treatment with the plasma arc lamp
showed some promise in producing a nonpermeable surface, the overall process was not effective in
terms of cost and hence was not pursued further.
4.3 Advanced Ceramic Coatings
Through a literature search, several semi-crystalline (glass-ceramic) glaze compositions [12–15] were
identified as potential coating materials for application on the fused silica riser tubes. The main issue
in selecting the right glazes is the requirement of a low (or negative) coefficient of thermal expansion
(CTE). The CTE of fused silica is 0.5 10-6
/°C; hence, it is very important to find a glaze material
with a CTE value that is even lower, to prevent cracking or spalling of the coating. Semi-crystalline
glazes have been proven to have the right combination of lower CTE crystalline phases dispersed in a
glassy matrix, making it possible for them to have an overall lower CTE value. The CTE values of
semi-crystalline glazes can be tailored depending on the crystalline phases and the content of the
glassy phase present. Table 4.3 lists some of the glaze compositions discussed in the literature with
CTE values that closely match that of fused silica.
Of the several glaze compositions, the oxide mixtures numbered 1, 6, 7, and 8 were selected because
of their lower CTE values, and 100 g of each glaze mixture containing the respective weight
percentages of the individual oxides was prepared. Each mixture was dry-milled for 25 min and then
wet-milled for 2 h with ethanol to form slurries. Several wedge-shaped pieces were sectioned from
the riser tube (as shown in Figure 4.1) and oven-dried at 350°C for 3 h. The preheating/drying was
carried out to remove any volatiles or moisture that had become entrapped during or after the
manufacturing of the riser tubes. The dried wedge-shaped pieces were dipped in the four slurries
corresponding to glaze mixtures 1, 6, 7, and 8, as shown in Table 4.3. The firing schedule used to
develop the desirable crystalline phases within the four glazes is shown in Table 4.4. The glazes were
fired in an electric resistance-heated box furnace (Micropyretics Heaters International).

20
Table 4.3. Oxide composition (wt %) of selected glazes with low coefficients of thermal expansion (CTEs)
Glaze Oxide component 1
a 2
a 3
b 4
c 5
c 6
d 7
e 8
e
Al2O3 29.2 27 26.98 26.04 21.67 23.19 11.29 14.79
B2O3 5 — 4.98 2.65 1.96 — — —
CaO — — — — — 3.05 4.56 5.96
K2O 5 5 5.05 4.41 3.83 — — —
Li2O 11.3 9 9.08 9.35 7.75 4.53 3.31 4.34
MgO — — — — — 6.58 3.27 4.28
SiO2 49.5 54 53.91 55.33 51.06 62.65 47.48 53.83
ZnO — — — — 1.02 — 30.9 16
ZrO2 — 5 — 2.21 12.71 — — —
CTE –0.9 1.9 NR NR NR 1.3 0.34 0.36
aSemicrystalline glazes for low-expansion whiteware bodies
bCeramic solutions
cGlazes and glass coatings
dThermal expansion data of some alkali aluminosilicate glasses and their respective glass-ceramics
eCrystallization of some aluminosilicate glasses
NR = not reported
Table 4.4. Firing schedule for various glaze compositions
Glaze
Firing schedule
(°C/h)
Heat treatment schedule
(°C/h)
Heating rate
(°C/min) Phases expecteda
Grxn (kJ @ 700°C)
1094/0.25 — 20 1
788/0.50 — 20
-spodumene ss –142
850/5 3 6 1500/4
1050/3 3
-spodumene ss,
-eucryptite ss,
clinopyroxene
–142
–72
—
660/4 3 7 1450/3.5
900/3 3
-spodumene ss,
-eucryptite ss,
Willemite
–142
–72
–416
660/4 3 8 1450/3
780/3 3
-eucryptite ss,
Willemite, Diopside
–72
–416
—
aThe following are crystalline phases: -spodumene solid solution (LiAlSi2O6), -eucryptite solid
solution (LiAlSiO4), clinopyroxene (MgSiO3 + CaMgSi2O6), Willemite (Zn2SiO4) and Diopside (CaMgSi2O6).

21
The free energy of reaction between fused silica and molten aluminum at 700°C was estimated to be
–503.1 kJ [10]. Since the free energies of reaction between the crystalline phases and molten
aluminum are higher than –503.1 kJ, the probability of the glazes reacting with molten aluminum is
less thermodynamically favorable than the reaction with silica. Figure 4.9 shows optical micrographs
of the cross-sections along the glaze/fused silica substrate interface. All glazes appear to be
continuous and show good bonding with fused silica, except for some porosity within the glaze
representing glaze 1 composition. High-magnification SEM micrographs of the glaze sections and
fused silica substrates (Fig. 4.10) after the firing process show a crystalline phase–like structure
within the glazes and a modified substrate structure for all glazes, except for glaze corresponding to
glaze 1. The altered structures within the glazes and the substrate were also verified by performing X-
ray diffraction analysis. Figures 4.11, 4.12, and 4.13 show the diffraction patterns corresponding to
the various glazes and fused silica substrates. X-ray results for the glazes show the presence of
various crystalline phases as expected (see Table 4.4). However, X-ray results from the substrates
show formation of crystalline cristobalite in cases where the firing temperatures were above 1200°C
(i.e., the firing schedule for glazes corresponding to compositions 6, 7, and 8). The presence of
crystalline cristobalite can lead to severe cracking of the riser tube and can also increase its reactivity
with molten aluminum, and is therefore highly undesirable. Based on the X-ray results and the free
(a) (b)
(c) (d)
Fig. 4.9. Optical micrographs showing cross sections along the glaze/substrate interface corresponding to (a) glaze 1, (b) glaze 6, (c) glaze 7, and (d) glaze 8 compositions.

22
energies of reaction between the various crystalline phases and aluminum at different temperatures
(Table 4.5), it was concluded that of the four glazes, the composition as well as the thermal cycle
corresponding to glaze 1 is capable of producing the desired crystalline phases without altering the
substrate and hence could be considered as a suitable candidate for scaleup.
Table 4.5. Free energy of reaction of various crystalline phases
G reaction of various crystalline
phases with aluminum (kJ)
Temperature (°C) LiAl2SiO6 LiAlSiO4 Zn2SiO4
527 –152.8 –80.8 –420.7a
627 –148.1 –76.5 –419.1
727 –142.1 –71.2 –415.9
a At 727°C, Zn2SiO4 is highly reactive with aluminum and should be
avoided in the glaze.
(a) Glaze 1 (b) Substrate 1
(c) Glaze 6 (d) Substrate 6
Fig. 4.10. SEM micrographs showing glaze section and fused silica substrate after the firing process.

23
(e) Glaze 7 (f) Substrate 7
(g) Glaze 8 (h) Substrate 8
Fig. 4.10 (cont.). SEM micrographs showing glaze section and fused silica substrate
after the firing process.
Although the preliminary results showed that glaze 1 was an appropriate glaze material, additional
studies such as measurement of CTE values, bonding characteristics at elevated temperature and
under thermal cycling (thermal fatigue), and reactivity and wettability with molten aluminum were
necessary before the glaze could be considered for full-scale application.
CTE measurements of the monolithic glaze 1 material was performed with a dual push rod
dilatometer. Monolithic samples of glaze 1 were prepared by simply firing the glaze mixture in a
porous alumina crucible and then machining the specimen directly out of the crucible. During CTE
measurement, the sample was heated up to 700°C at 10°C/min and then allowed to cool to room
temperature. The sample was subjected to two such heating and cooling cycles. During the heating
and cooling cycle, the change in the length of the specimen with temperature was measured in
relation to the change in the length of the standard reference specimen. The mean CTE was calculated
as change in length over a specific temperature range ( L/L0)/(T–20°C). Figure 4.14 shows the
change in the expansion and mean CTE values for the glaze 1 specimen as a function of temperature.
As the figure shows, glaze 1 showed negative CTE values at lower temperatures (below 315°C);
at higher temperatures, however, the values were positive and an order of magnitude higher than the
values for fused silica. The mean CTE values during the second heating and the cooling cycle were
always positive, and the specimen was observed to have been permanently strained. The change in the
mean CTE values during the second cycle could be due to phase change or change in the amount of

24
Fig. 4.11. X-ray diffraction pattern showing various crystalline phases formed within the glaze after the firing process: top, glaze 1; bottom, glaze 6.

25
Fig. 4.12. X-ray diffraction pattern showing various crystalline phases formed within the glaze after the firing process: top, glaze 7; bottom, glaze 8.

26
Fig. 4.13. X-ray diffraction pattern showing cristobalite formation in fused silica substrate after firing of glazes 6 and 8 at temperatures above 1200°C.
crystallinity occurring during the first heating cycle when the sample reached 700°C. X-ray analysis
of the specimen before and after the CTE measurement was performed to find out what changes in the
amount of crystallinity and in the formation of newer lithium-aluminosilicate crystalline phases with
slightly different stoichiometry occurred during the heating and cooling cycles (Fig. 4.15).
While the monolithic glaze specimen was being tested for thermal cycling during CTE measurements,
separate tests to study the effect of thermal cycling on the integrity and bonding characteristics of
glaze 1 when applied to fused silica were performed. This study was necessary to simulate the actual
conditions of alternating high and lower temperatures to which the fused silica down tube would be
exposed during aluminum casting operations. For the performance of these tests, the glazed fused
silica samples were heated to 700°C at 100°C/min, held at 700°C for 10 min, and then cooled to room
temperature at 100°C/min. This process was repeated twice, and the samples were then inspected to
see if any cracking or debonding of the glaze occurred from the heating and the cooling cycle. No
spalling or cracking within the glaze layer or the fused silica substrate was observed, and X-ray
results (Figure 4.15) showed that the original crystalline phases seen in glaze 1 were retained, except
for a slight increase in the amount of crystallinity.
After the thermal fatigue tests, evaluation of glaze 1 was continued to understand its reactivity with
molten aluminum. Three wedge-shaped pieces of fused silica glazed on only one surface were
immersed in molten aluminum alloy AA356 at 750°C for 24, 48, and 72 h. Visual examination of the
cross sections of these reacted fused silica pieces indicated increasing depths of aluminum penetration
through the unglazed surfaces of fused silica as a function of exposure time (Fig. 4.16). Cross
sections of fused silica subjected to 72 h of exposure showed aluminum penetration throughout the
thickness of the sample. Optical micrographs of the glaze/molten aluminum interface showed only
minimum

27
Fig. 4.14. Dilatometer test results for CTE measurements of glaze 1: (top) expansion of specimen; (bottom) mean CTE as a function of temperature.

28
Fig. 4.15. X-ray analysis of specimen before and after CTE measurement.
As glazed (center) Fused silica being attacked from unglazed surfaces: left, 24 h; right, 48 h
Entire cross section attacked
Fig. 4.16. Reactivity of glaze 1 with molten aluminum for different exposure times.
metal attack for both the 24-h and the 48-h exposures (Fig. 4.17); however, severe spalling, metal
penetration, and cracking of the glaze was observed in the sample exposed for 72 h. We assume that
porosity and other defects, such as fine cracks, within the glaze provided a pathway for the metal to
penetrate through the glaze. Also, immediate attack and penetration of the metal through the unglazed
surfaces of these samples is likely to hinder the actual evaluation of the glaze performance during the
reactivity tests.
Although the test results for glaze 1 look promising, closing the porosity within the glaze layer is
important in improving its performance, especially in preventing the metal penetration. Efforts were
made to produce more glazes by altering the glaze 1 firing cycle (by using a slower heating rate and
long holding times at temperature), anticipating that such changes would provide sufficient time for
the volatiles (either from glaze or the substrate) to escape. However, the attempts were unsuccessful
and the porosity persisted.

29
Fig. 4.17. Comparison of sample (a) with and (b) without protective glaze 1 after 24-h exposure at 750°C.
Based on thermodynamic calculations, another possibility for pore or bubble formation in glaze 1 is
decomposition of lithium carbonate (Li2CO3) after it has melted. Li2CO3 acts a flux as well as a source
for Li2O in the glaze composition, and its melting temperature is 660°C. Based on the partial pressure
of CO2 in the decomposition atmosphere, the equilibrium decomposition temperatures for both solid
and liquid Li2CO3 were calculated to be in the range of 735 to 1176°C. (The maximum firing
temperature for firing glaze 1 is 1094°C.) Thus, the decomposition of Li2CO3 and the release of CO2
after the Li2CO3 has melted may cause pore formation if the glaze is applied as an unreacted powder.
In an effort to eliminate porosity due to decomposition of Li2CO3 , the composition and the firing
process for the glaze 1 mixture were modified using two different approaches: (1) reducing the
Li2CO3 content in the starting glaze mixture and replacing the reduced fraction with spodumene
(lithium aluminum silicate) as a source of Li2O in the glaze composition, and (2) pre-reacting or
fritting the existing glaze mixture. Fritting of the glaze mixture was carried out at UMR using a lab-
based fritting furnace. During the fritting process, the mixture was heated up to 1425°C at a rate of
20°C/min and held at this temperature for 3 h. The molten mixture was quenched in cold water to
form an amorphous lump of frit. The frit was crushed and then remelted twice under the same
condition to ensure homogeneity. The final frit was crushed with a high-speed impact crusher to
achieve a particle size of ~40 m and later mixed with polyethylene glycol and polyvinyl alcohol to
form a slurry prior to its application on fused silica. The firing schedule typical for glaze 1 was used
for firing the fritted glaze. Figure 4.18 shows the micrographs of glaze 1 with reduced Li2CO3 and
containing spodumene, and with the fritted glaze mixture. Micrographs show a strongly fused coating
for the two conditions, with some reduced porosity in the former case; however, porosity was still
present.
4.4 Advanced Monolithic Refractories
4.4.1 Permeability of Dense Fused Silica
For measurement of permeability in DFS refractories, an apparatus based on the vacuum-decay
permeametry method [16] was developed at UMR. With this method, the porous sample is placed
between two chambers and subjected to a transient pressure gradient. Figure 4.19 shows a schematic
of the permeameter. A porous disc (a DFS discs in this case) 2 in. in diameter and 1 in. thick is fixed
Glaze 1
No reaction
Al Reaction zone
(a) (b)
Surface
without glaze

30
(a) (b)
Fig. 4.18. Micrographs of glaze 1 on fused silica (a) with reduced Li2CO3 and containing
spodumene in the glaze mixture and (b) with the fritted glaze mixture.
Fig. 4.19. Schematic of the vacuum-decay permeameter.
Vacuum Pump
Pressure Gage
Valve
Rubber Gasket
Porous Disc
Vacuum Chamber

31
between a vacuum chamber on one side and another chamber at atmospheric pressure on the other
side. As the air flows from the atmosphere to the evacuated chamber through the porous disc, a
vacuum-decay or a pressure decay-curve is recorded with respect to time (Fig. 4.20). The
permeability constant (K in mDarcy) is calculated by applying Darcy’s law to the pressure-decay
curve and using Eq. (4.2), where Q is determined from dP/dt and system volume:
PA
QLK = , (4.2)
where
= fluid viscosity in cP
Q = volumetric flow rate in cm3/s
L = sample length in cm
A = sample area in cm2
P = absolute pressure drop across the sample in atm
In the case of a DFS tube, the above formula can be modified as Eq. (4.3):
PL
QR
R
K i
o
=2
ln
, (4.3)
where RO and Ri are tube outer and inner radii in cm, respectively; L is the tube length in cm; and P
is the differential pressure across tube wall in atm. Figure 4.21 shows a pemeameter developed to
measure the permeability of a full-scale DFS tube. The test fixture can accommodate tubes with
varying diameters and lengths.
0.00
0.02
0.04
0.06
0.08
0.10
0 100 200 300 400
Time (s)
Ab
so
lute
Pre
ss
ure
(M
Pa
)
t
P
(dP/dt) i
i -1
i
i +1Pi+1 - P i-1
t i+1 - t i-1
Fig. 4.20. Typical pressure decay curve recorded during permeability measurement.

32
Fig. 4.21. Full-scale permeameter developed at UMR.
A number of tests were performed using this full-scale setup to identify the right gasket material for
room-temperature and high-temperature testing, to ensure proper fastening between the swage lock
and stainless piping seals, and to verify the reproducibility of the pressure decay. Figure 4.22 shows
the results of reproducibility tests performed on a single DFS tube using the full-scale permeameter.
4.4.2 Optimization of Particle Packing Density for Minimum Permeability
New formulations for fused silica castable tubes were developed at UMR based on the optimized
packing of different particle sizes using a continuous distribution. A three-parameter continuous
distribution model based on the Funk and Dinger relationship [Eq. (4.4)] having the potential of
achieving nearly full densities was used to optimize the particle packing.
n
s
n
l
n
s
n
DD
DDCVPFT = (4.4)
where
n = distribution modulus
D = particle size
CVPFT = cumulative vol % of particles with diameters <D (cumulative vol % finer than)
Dl = largest particle size in the distribution
Ds = smallest particle size in the distribution [17]
Flex stainless
tubing
Steel plates
Silicone gaskets
All thread rods

33
0.0
0.2
0.4
0.6
0.8
1.0
0.0 1.0 2.0 3.0 4.0 5.0 6.0 7.0
Time (min)
Ab
so
lute
Pre
ssu
re (
atm
)
0.00
0.10
0.20
0.30
0.40
Pe
rme
ab
ility (m
illi Da
rcy
s)
Fig. 4.22. Permeability test results showing reproducibility in pressure decay data.
A computer model based on this theory (and using particle size distributions measured for the raw
materials to be used in the formulation) was developed to predict the weight percent of each raw
material that should be added to the formulation to optimize the particle packing and achieve the
highest density. The model (Fig. 4.23) also gives the deviation within each size class to show which
particle sizes need to be added to the formulation to improve the packing density. For initial
formulations, the particles were assumed to be perfect spheres. In calculations of the target
formulation aimed at achieving near-theoretical bulk densities, the value of n was taken to be 0.37.
Figure 4.24 represents the target and the predicted particle size distributions and deviations for the
formulation shown in Table 4.6.
Fig. 4.23. Computer model predicting particle size distribution for optimized packing density.

34
Blend and Target PSD - CPFT
0.1
1
10
100
0.1 1 10 100 1000 10000
Particle Size ( μm)
CV
PF
T (%
)Formulation Target
(a)
Blend and Target PSD - % in Class
0
1
2
3
4
5
6
7
8
9
2650
0
1320
0
6700
3364
1680
839.
2
419.
1
209.
3
104.
6
52.2
2
26.0
8
13.0
3
6.50
63.
25
1.62
3
0.81
1
0.40
5
0.20
2
0.10
1
Size Class
Perc
en
t in
Cla
ss (
%)
Target Formulation
(b)
Fig. 4.24. (a) Particle size distribution (PSD) and (b) deviation within each size class for formulation shown in Table 4.6.
Table 4.6. Initial formulation based on the continuous distribution model
Component Wt % Vol %
Size fraction 1 25.3 28.41
Size fraction 2 11.0 12.38
Size fraction 3 7.3 8.25
Size fraction 4 7.3 8.25
Size fraction 5 8.3 6.41
Size fraction 6 8.3 6.41
Reactive alumina 7.3 6.02
Nonwetting 1 5 2.77
Nonwetting 2 5 6
Fume 8 9
Cement 7 6
Maximum Size (mm) 5600
Minimum Size (mm) 0.37
Modulus 0.20

35
Table 4.6 gives the weight and volume percentages of various raw materials that should be added to
the formulation to achieve the optimal particle size distributions (PSDs) as shown in Fig. 4.24. The
discrepancies between the target PSD and the formulation PSD were caused by factors or constraints
such as water content, cement content, additive content, particle shape, etc., in the formulation that
affected the packing density. Figure 4.25 show the particle size distribution and deviation within each
size class when no nonwetting agents and lower cement contents were allowed in the formulation
(i.e., the formulation was unconstrained). Table 4.7 represents the weight and volume percentage of
the various raw materials when the formulation was unconstrained. Similar formulations and PSDs
could also be achieved by constraining the formulation by including certain compounds in specific
quantities and then recalculating the quantities of other compounds to achieve the targeted PSD or
particle packing. Table 4.8 provides an example.
Blend and Target PSD - CPFT
0.1
1
10
100
0.1 1 10 100 1000 10000
Particle Size ( μm)
CV
PF
T (%
)
Formulation Target
(a)
Blend and Target PSD - % in Class
0
2
4
6
8
10
12
2650
0
1320
067
0033
6416
80
839.
2
419.
1
209.
3
104.
6
52.2
2
26.0
8
13.0
3
6.50
63.
25
1.62
3
0.81
1
0.40
5
0.20
2
0.10
1
Size Class
Pe
rce
nt
in C
las
s (
%)
Target Formulation
(b)
Fig. 4.25. (a) Particle size distribution (PSD) and (b) deviation within each size class for unconstrained formulation shown in Table 4.7.

36
Table 4.7. Unconstrained formulation for silica castables: no nonwetting agent 1 and lower cement
Component Wt % Vol %
Size fraction 1 31.1 33.79
Size fraction 2 14.9 16.22
Size fraction 3 14.4 15.67
Size fraction 4 5.2 5.67
Size fraction 5 8.0 5.97
Size fraction 6 9.6 7.16
Reactive alumina 6.4 5.07
Nonwetting 1 0 0
Nonwetting 2 2 2
Fume 6 6
Cement 3 2
Table 4.8. Two constrained formulations for silica castables
Constrained formulation Aa Constrained formulation B
b
Component Wt % Vol % Wt % Vol %
Size fraction 1 30.4 33.83 30.6 33.84
Size fraction 2 14.5 16.18 14.6 16.13
Size fraction 3 14.0 15.64 14.3 15.81
Size fraction 4 5.2 5.82 3.7 4.15
Size fraction 5 7.6 5.78 12.8 9.68
Size fraction 6 10.4 7.92 4.4 3.34
Reactive alumina 3.9 3.15 2.6 2.11
Nonwetting 1 5 2.74 5 2.72
Nonwetting 2 5 5 4 5
Fume 0 0 3 3
Cement 5 4 5 4
aFor formulation A, the constraint is 5 wt % of each of the nonwetting agents, 0 wt % of
fume, and 5 wt % of cement bFor formulation B, the constraint is 5 wt % of nonwetting agent 1, 4–6 wt % of nonwetting
agent 2, 3 wt % of fume, and 5 wt % of cement
4.5 Coat and Field Test Prototype Components
4.5.1 Advanced Ceramic Coatings
Based on the promising results observed at the laboratory scale, Pyrotek decided to scale up the
glazing process developed at ORNL. A mixture corresponding to the composition of glaze 1 was
prepared at Pyrotek using commercial-grade oxides and carbonates and using water as a solvent.

37
Spodumene, instead of lithium carbonate, was used as a source for lithium oxide. After the slurry was
prepared, a large section of a riser tube was dipped in the slurry and then gradually pulled out to
obtain a uniform layer of the glaze material on the outer and the inner diameter of the riser tube. The
coated riser tube was dried in air and then fired in a resistance furnace using the recommended firing
schedule for glaze 1 (Table 4.4). Unlike the results obtained in the laboratory, the riser tube cracked
during the firing process. The potassium and lithium compounds used as raw materials may have
dissolved in water and then deposited in the pores of the tube, encouraging cristobalite formation in
DFS and causing the tube to crack. Apart from the cracking of the DFS tube, the fused sections of the
glaze appeared to be grainy and lumpy, suggesting that the starting powders were too coarse. Another
attempt was made to coat a large section of a riser tube with glaze 1, this time using finely ground
(ball-milled) starting powders and using methyl alcohol as a solvent. The section was again dipped in
the slurry, dried in air, and fired in the furnace using a similar firing schedule. This time, the DFS
tube did not crack. However, the glaze did not fuse uniformly, and fine cracks formed, suggesting that
the CTE mismatch between the glaze and the tube caused the crazing and spalling (see Fig. 4.26)
(a) (b) (c)
Fig. 4.26. A section of DFS riser tube tested with glaze 1 prepared in methanol.
While coating trials with full-scale DFS tubes using glaze 1 were unsuccessful, Pyrotek has reported
positive test results with its proprietary XL glaze, a zircon-based coating material. Several DFS tubes
were coated with XL glaze and tested in the field. The coatings led to life extensions of up to 300%.
Pyrotek reports that an uncoated tube generally lasts for a period of 1 week, whereas XL-coated DFS
tubes survive for an average period of 3 weeks. Field-testing of the coated DFS tubes consists of
continuously immersing the coated tubes in molten aluminum until they start leaking. A leaking tube
will produce reject castings, and the whole process must be stopped until another tube is installed to
replace the leaking tube. The replacement process usually accounts for 2–4 h of lost production time.
Therefore, an airtight, nonleaking tube is extremely important for reducing downtime and preventing
energy losses. Pyrotek’s XL-coated riser tubes have been shown to increase the life of DFS tubes,
thus reducing rejection and saving energy, time, and money.
4.5.1 Advanced Monolithic Refractories
Four fused-silica castables were prepared at Pyrotek based on the formulations predicted using the
optimized particle size distribution model from UMR. These castables were tested in one of the four
die-casting machines at General Aluminum in Wapakoneta, Ohio. The castables ran continuously for

38
about 8 weeks until casting defects, such as blow holes in the sprue area, were discovered. Whether
the casting defects occurred as a result of leakage in the riser tube or because of tooling stackup is not
known. Pyrotek will be manufacturing four more castable tubes in the near future for additional field
tests to confirm the outcome of this first test. Figure 4.27 compares the extension in the life of the
riser tubes through application of coatings and the newly developed castable formulations.
Riser Tube Life Span
0
1
2
3
4
5
6
7
8
9
No
of
we
ek
s t
ub
e s
urv
ive
d
be
fore
fa
ilu
re
Uncoated tubeTube Coated
with "XL"glaze
Fused Silica
Castable
1- week
3- week
8- week
Fig. 4.27. Life extension in riser tubes resulting from coatings and castable refractories.


40
5. Accomplishments
5.1 Technical Accomplishments
The major technical accomplishments of the project were as follows:
• The economic feasibility of high-density infrared heating was explored. While this technique
was shown to be useful in modifying the surface of the fused silica, it was not cost-effective.
• Several semicrystalline glazes were selected and applied to DFS test specimens. Preliminary
results showed that the glazes are crystalline and adherent to the fused silica. One of the
glazes has been identified as a potential candidate for coating application on DFS tubes. Field
testing of riser tubes using this glaze, as well as the XL glaze developed at Pyrotek, has been
performed.
• A permeability measuring apparatus has been developed to accommodate full-scale fused
silica riser tubes and is currently being refined for use as a quality control apparatus in the
riser tube production line.
• Preliminary particle size distribution analysis has been performed on several existing blends,
and the information was used to develop a computer model to refine the distribution and
design low-permeability castable formulations. Field-testing of castable refractory riser tubes
produced using these newly designed formulations is currently under way.
5.2 Commercialization
Two cost-effective coating formulations with excellent thermal shock properties and resistance to
molten aluminum attack were identified as promising candidates for application on DFS riser tubes.
One coating formulation is XL glaze, a zircon-based coating materials system developed at Pyrotek;
the other, referred to as “glaze 1” in this report, is a lithium silicate–based coating system that was
studied at ORNL. In addition to coating formulations, a computer model suggesting optimized
particle packing or particle size distribution (PSD) that would minimize permeability in monolithic
fused silica castables was developed at UMR. Another outcome that evolved out of the research
efforts at UMR was the development of a permeability measuring apparatus that can accommodate a
full-scale DFS riser tube.
DFS riser tubes coated with the XL glaze have been commercialized and are routinely manufactured
and supplied by Pyrotek to its customers. The XL-coated DFS tubes are reported to last 3–5 weeks, as
compared with uncoated DFS tubes, which last only 7 days; thus, the XL glaze extends the life of the
DFS tubes up to 300–400%. Additionally, four full-scale fused silica castables that were formulated
on the basis of the PSD computer model were designed and manufactured at Pyrotek and are now
undergoing field-testing at General Aluminum, Wapakoneta, Ohio. Preliminary test results have
shown that the silica castables lasted for 8 weeks during the aluminum casting operations, indicating
an increase in the lifetime of the riser tubes by 700%.
5.3 Publications
An article and a poster presentation resulted from this research. These are reproduced in Appendixes
A and B.


42
6. Conclusions
The primary goal of this project was to develop and validate new classes of cost-effective low-
permeability ceramic and refractory components for handling molten aluminum in both melting and
casting environments. Three approaches were employed with partial to full success to achieve this
goal:
1. Develop materials and methods for sealing surface porosity in thermal-shock-resistant
ceramic refractories
2. Develop new ceramic coatings for extreme service in molten aluminum operations, with
particular emphasis on coatings based on highly stable oxide phases
3. Develop new monolithic refractories designed for lower-permeability applications using
controlled porosity gradients and particle size distributions
The results of the research work and the field tests performed utilizing these three approaches are
listed below:
• It was demonstrated that high-density IR heating could be a tool for altering and sealing the
surface porosity of fused silica. However, the process was not very cost-effective.
• A low-cost glaze composition having a coefficient of thermal expansion (CTE) similar to that
of a DFS tube was identified and was successfully tested for its integrity and adherence to
DFS. Although the glaze acted as a barrier between the molten aluminum and the DFS,
persistent porosity and crazing within the glaze affected its performance during the reactivity
tests, thus acting as an obstacle in scaling up production of this glaze.
• Pyrotek’s XL glaze showed great success in improving the life of the DFS tubes. Pyrotek has
reported an increasing market demand for the XL-coated DFS tubes, which exhibit useful
lifetimes three times better than those of uncoated tubes.
• A computer model to optimize particle size distribution for reduced permeability was
developed and successfully applied to casting formulations. Silica riser tubes produced using
these new formulations have been tested in a commercial aluminum casting facility and have
been reported to increase the life of the DFS tubes by 700%.
• If all the DFS riser tubes used in LPD casting of aluminum automotive components are
replaced with the better, longer-lasting castable riser tubes, the potential national energy
savings is estimated to be 206 billion Btu/year.

44
7. Recommendations
Although this project was successful in developing two new glazing materials and optimized castable
formulations vital for increasing the life of the riser tubes in low-pressure foundries, the outcome of
this project will be effective only if such glazing technologies and formulations are used for broader
and more valuable applications. In order to achieve dramatic energy and environmental benefits, it is
recommended that similar coatings or glazes and castable formulations be extended to other
refractory components within the aluminum casting industry (such as troughs, metal handling ladles,
spouts, and pins) as well to other industries, including glass, chemical, petrochemical, steel,
agriculture, mining, and forest products. Furthermore, in terms of improving the performance of
glaze 1, an additional nonwetting coating (such as BN) is suggested. For the XL glaze, additional
characterization of its composition and understanding of its aluminum reactivity kinetics is
recommended.


46
8. References
[1] R. Brindle, ed., Applications for Advanced Ceramics in Aluminum Production: Needs and
Opportunities, report prepared for the U.S. Advanced Ceramics Association, The Aluminum
Association, and DOE/OIT, February 2001.
[2] W. D. Kingery et al., Introduction to Ceramics, J. Wiley, Hoboken, N.J., 1976, pp. 540–48.
[3] J. G. Hemrick et al., Refractories for Industrial Processing: Opportunities for Improved Energy
Efficiency, report prepared for DOE-EERE Industrial Technologies Program, January 2005.
[4] U.S. Department of Energy, Energy Information Agency, 1998 Manufacturing Energy
Consumption Survey (MECS), 1998, Table No 3.2, Fuel Consumption.
[5] S. W. Hadley, S. Das, and J. W. Miller, Aluminum R&D for Automotive Uses and the
Department of Energy’s Role, ORNL/TM-1999/157, Oak Ridge National Laboratory, Oak
Ridge, Tenn., March 2000.
[6] U. S. Department of Energy, Office of Industrial Technologies, 1997 Energy and
Environmental Profile of the US Aluminum Industry, Table 1.6, pp. 12, 13.
[7] R. J. Lauf and J. H. DeVan, “Evaluation of Ceramic Insulators for Lithium Electrochemical
Reduction Cells,” Journal of the Electrochemical Society 139, no. 8 (1992): 2087–91.
[8] E. M. Levin, H. F. McMurdie, and F. P. Hall, Phase Diagrams for Ceramists, American
Ceramic Society, Columbus, Ohio, 1964, vol. 1, p. 122.
[9] R. J. Lauf et al., Method of Making a Functionally Graded Material, U.S. Patent Application,
2001.
[10] O-J. Siljan et al., “Refractories for Molten Aluminum Contact, Part I: Thermodynamics and
Kinetics,” Refractories Applications and News 7, no. 6 (2002): 17–25.
[11] C. A. Blue et. al., JOM-e 52, no. 1 (2000).
[12] E. F. O’Conor and R. A. Eppler, “Semicrystalline Glazes for Low Expansion Whiteware
Bodies,” Ceramic Bulletin 52, no. 2 (1973).
[13] R. A. Eppler and D. R. Eppler, Glaze and Glass Coatings, A&C Black, London, and American
Ceramic Society, Westerville, Ohio, 1998.
[14] S. M. Salman and S. N. Salama, “Thermal Expansion Data of Some Alkali Aluminosilicate
Glasses and Their Respective Glass-Ceramics,” Thermochimica Acta 90 (1985): 261–76.
[15] A.W. A. El-Shennawi et al., “Crystallization of Some Aluminosilicate Glasses,” Ceramics
International 27 (2001): 725–30.
[16] J. Canon and T. Sander, “New Test Method for Evaluating Permeability of Refractory
Castables,” Refract. Appl. 2, no. 1 (1997): 6–7.
[17] J. Funk and D. Dinger, Predictive Process Control of Crowded Particulate Suspensions
Applied to Ceramic Manufacturing, Kluwer Academic Publishers, Boston, 1994.


48
Appendix A: Interaction of Aluminum with Silica-Based Ceramics
The following article appeared in Advances in Refractories of the Metallurgical Industries IV,
Proceedings of the 4th International Symposium on Advances in Refractories for the Metallurgical
Industries, Hamilton, Ontario, August 22–25, 2004, pp. 221–234.
Interaction of aluminum with silica-based ceramics
José M. Soto, Jeffrey D. Smith, William G. Fahrenholtz.
Department of Ceramic Engineering
University of Missouri-Rolla
Rolla, MO 65409-0330
USA
ABSTRACT
Interactions between A356 aluminum (Al-Si alloy) and dense fused silica (FS) riser tubes
used for low-pressure casting of aluminum alloys were evaluated using a sessile drop approach. The
tubes have a short service life, but cost and thermal shock resistance make them an effective solution.
The main problem encountered during use is the reaction of aluminum with silica to form alumina
and silicon, which causes failure. Tests have been conducted on as-fired (uncoated) and modified
(coated) tubes. Experiments were carried out in a horizontal furnace at 1225ºC under argon to
minimize the effect of the aluminum oxide on the interactions at the alloy-silica interface. Images of
the drop were acquired and contact angle values were estimated for uncoated and coated samples, but
no significant differences in the contact angles were observed. Scanning electron microscopy revealed
the presence of cracks at the interface between the reaction zone and the unreacted silica. The
presence of reaction products (silicon in the reacting alloy and aluminum in a reaction zone between
the alloy and the unaffected silica) has been confirmed using energy-dispersive spectroscopy. A two
layer coating system was found to be effective in reducing penetration of the aluminum alloy.

49
INTRODUCTION
In the year 2000, the production of aluminum in the US was of about 10.3 million
tonnes, or roughly 43% of the worldwide production of 24 million tonnes [1]. Like many
other materials, production of aluminum metal, parts and components is an energy-intensive
process and it generates waste, including spent refractory ceramics. Over the last decade
research was conducted with the aim of increasing the efficiency and reducing the generation
of waste in the production of aluminum [1-2]. Environments in the production of aluminum
are highly corrosive and the high temperature of operations make ceramic materials, which
are resistant to both the temperature and chemical aggressiveness, the contact material of
choice for many parts of the aluminum production process. It has been recognized that there
is a need for a better understanding of the aluminum/ceramic interactions [3]. Ceramics are
used in aluminum smelting and holding operations as well as in the downstream processes.
One of these downstream processes is casting. More specifically, refractory materials
for the low-pressure casting of aluminum alloys are investigated in the present research. The
casting device consists of an airtight sealed chamber where a crucible containing the molten
metal is placed. A casting device is attached to the top of the chamber. A tube (riser) in the
bottom of the casting device extends down into the liquid metal in the crucible. A positive
pressure of ~15 psi is applied inside the chamber, which makes the molten metal flow
through the riser up into the mold. Defects such as porosity in the as-fired tube or cracks
generated by the reaction of the Al alloy with the tube material lead to tube failure because
the pressure drop needed to force the aluminum alloy up into the casting apparatus cannot be
supported due to the increased permeability of the tubes. A schematic of the process is shown
in Figure 1.
Figure 1 – Schematic of a low-pressure casting apparatus for aluminum alloys [4]
Ar
15 psi
Fused Silica (FS) Riser Tube
Alloy A356
Mold

50
Risers have been made of a variety of ceramics and even metals. Alloy A356 is a
common aluminum-silicon alloy used in low-pressure casting. Currently, dense fused silica
tubes prepared by slip casting are widely used as risers.
Although slip cast fused silica tubes have a short service life their cost makes them an
effective solution. The main problem associated with silica is the formation of alumina and
silicon in a penetrated zone. The reaction results in cracking at the reaction interface due to
the difference in specific volume between the reaction zone (mainly Al2O3) and the bulk of
the ceramic (SiO2). The reaction also produces contamination of the metal as it has been
reported by other researchers [5-10]. According to Siljan et al. [9] aluminum reacts with
silica to form alumina and silicon according to the reaction:
4Al(l) + 3SiO2 = 2Al2O3 + 3Si G1200K = -503.1 kJ/mole (1)
Aluminum and its alloys are in the liquid state below temperatures of 700ºC. Although
aluminum is readily oxidized at atmospheric conditions, industrial processes involve turbulence and
fluid flow that continuously break the oxide layer allowing the liquid metal to contact the surface of
the ceramic.
In the static conditions of laboratory tests like the sessile drop test, the formation of a layer of
oxide on the surface of the molten metal will prevent contact between molten metal and the surface of
the ceramic. In previous studies [11-12] one way this problem was overcome has been to increase the
temperature and reduce the partial pressure of oxygen to promote the formation of the gaseous oxide
Al2O instead of solid Al2O3. Prabriputaloong and Piggott [12] indicated that at 1073 K and a partial
pressure of oxygen around 10-5
mbar Reaction 2 will proceed:
4Al(l) + SiO2 = 2Al2O(g) + Si G1073K = -414 kJ/mole (2)
Prabriputaloong and Piggott [12] also indicated that at 1073 K and under low oxygen partial
pressure the preexisting Al2O3 layer could decompose according to the reaction:
Al2O3 + 4Al(l) = 3Al2O(g) G1073K = -88 kJ/mole (3)
In the present research, a sessile drop test was used as a preliminary tool to evaluate
the interaction between aluminum alloy A356 and fused silica riser tubes. Contact angle
values were estimated from pictures taken at 1225ºC and scanning electron microscopy and
energy-dispersive spectroscopy was used to evaluate the microstructure and composition of
the reaction zone.
EXPERIMENTAL PROCEDURE
Samples were received as rings taken from fused silica riser tubes. Rings were 7.5 cm internal
diameter and 2.3 cm wall thickness. Three different kinds of samples were received: as-fired, tubes
with a single-layer coating and tubes with a two layer coating. Specimens in the shape of ring sections
of approximately 1.4 cm width in the inner diameter were cut from all the rings (See Figure 2).

51
Figure 2 - Specimens cut from rings of riser tubes
The nominal composition of alloy A356 is shown in Table I. Cubes of the aluminum alloy
A356 of about 1 gram in weight were cut from a billet as shown in Figure 3.
Table I - Nominal Composition of Alloy A356 [13]
Others Element Si Fe Cu Mn Mg Zn Ti
each total Al
% 6.5-7.5 0.6 0.25 0.35 0.20-0.45 0.35 0.25 0.05 0.15 balance
Figure 3 – Aluminum alloy cubes cut from billet
All the silica specimens were dried at 140 ºC for at least 24 hours before testing to remove
adsorbed water from any porosity. The fused silica section of the ring, with its inner diameter facing
up, was place in a small ceramic pan bedded with granular alumina and leveled as illustrated in
Figure 4.

52
Figure 4 – Placement of alloy cubes on top of the specimens.
A sealed horizontal furnace coupled with a gas purifier was used to heat the sample to the test
temperature. The experimental set up can be seen in Figure 5.
Figure 5 – Experimental set up for wetting and reaction experiments.
For the contact angle experiments, furnace temperature was programmed to increase at 5
ºC/minute until reaching 1225 ºC and then held at 1225 ºC for 60 minutes. Temperature was
monitored with an optical pyrometer that read an average specimen temperature of 1138 ± 10 ºC
during the contact angle experiments. The difference between the programmed temperature and the
pyrometer temperature was expected since the thermocouples that control the furnace temperature are
outside the ceramic tube and colder argon gas was continuously flowed through the furnace tube. The
furnace tube was equipped with transparent windows at both ends. A digital video camera (Sony
DCR-TRV140) was used to record the shape of the drop a regular intervals between 600ºC and
1225ºC. Images for contact angle estimations were captioned from the video taken after the samples
Ar 99.9999 %
Purifier
Controller
Exhaust
Gas Cooling System Furnace
A356 Cube
Silica
Specimen
Tabular Alumina Ceramic
Pan

53
had been at the hold temperature for at least 30 minutes. Angles were measure using Scion Image
software. Four measurements from each image were made and the average and standard deviation
calculated.
After the contact angle measurements were completed, specimens were cooled to room
temperature. Once they were cool, specimens were embedded in epoxy and then sectioned
perpendicular to the metal-ceramic interface. Macro pictures of the cross sections were taken to
determine depth of penetration. Cross section were dried, polished and coated with carbon for
examination by scanning electron microscopy (SEM) and energy-dispersive spectroscopy (EDS).
RESULTS AND DISCUSSION
Typical penetration results are shown in Figure 6 for as-fired tubes as well as those with single and
two layer coatings. Figure 7 shows the macro images of the different kinds of sample tested.
UncoatedSingle-coated
Double-coated
0.0
1.0
2.0
3.0
4.0
5.0
6.0
Sample
Penetration (mm)
Figure 6 – Quantitative comparison of average depth of penetration (and deviation) for the as-fired,
single layer, and two layer riser tubes.

54
(a) As-fired uncoated (b) Single coating (c) Double coating
Figure 7 – Qualitative comparison of depth of penetration for the as-fired, single layer, and
two layer riser tubes.
It can be seen that the difference in penetration between the uncoated specimen and the
specimen with the single layer coating is not significant. However, the sample with the two layer
coating had less penetration than the other two sample types. The two layer coating seems to
effectively prevent the contact between the liquid aluminum alloy and the silica substrate.
Figure 8 show superimposed images of drops from test with the three different specimens and
Table II shows the estimated values for the contact angle.
Figure 8 - Qualitative comparison of apparent contact angles.

55
Table II. Measured apparent contact angles.
Specimen Contac Angle
Uncoated 002UC 1 = 121 ± 3 degrees
Single Coating 106SC 2 = 121 ± 6 degrees
Double Coating 214DC 3 = 125 ± 5 degrees
Although the images show slight difference in contact angles for the three types of substrates,
the average values do not vary significantly when considering the standard deviations of
measurements from multiple specimens. The uncoated specimens and the tubes with the single layer
coating have the same average contact angle. Specimens with the two layer coating have a slightly
higher average contact angle, but the error bar for the three specimens overlap as it is shown in Figure
9.
Figure 9 – Comparison of apparent contact angles.
The reaction of the molten drop with the substrate produced a groove around the drop
reduced the accuracy of the contact angle measurements.
The initial microstructure of the aluminum alloy is shown in Figure 10. The dark rounded
features are pores. EDS mapping showed that discrete Si-rich particles were present in the aluminum
matrix.
Uncoated Single-coatedDouble-coated
60
90
120
150
Contact Angle
(degrees)
Non-Wetting
Wetting

56
Figure 10 - Microstructure of aluminum alloy 356 before testing.
Figure 11 shows the condition of the body of the fused silica slip cast tube before testing.
EDS analysis confirmed that the material was ~100% silica. Silica particles as big as ~200 μm are
observed. Also pores as big as ~50 μm are present.
Figure 11 - Microstructure of the dense fused silica tube prior to testing
Figure 12 shows the uncoated sample after testing. Silicon crystals produced by reaction of
the metal with the silica substrate have grown all the way through the original Al drop. The reaction
zone (RZ) contained aluminum in the form of alumina and some residual metal. Cracks were
observed at the interface between the reaction zone and the unaffected fused silica. Cracks were
generated by the difference in specific volume between silica and alumina.
Segregation of Si

57
EDS Compositional Maps (Al, Si)
(a) Macro (b) Drop Top (c) Drop Bottom (d) RZ Top (d) RZ Bottom
Figure 12 – SEM micrographs for the as-fired uncoated FS tube after testing
The initial condition of the sample with the single layer coating is shown in Figure 13. Figure
13(b) is a backscattered electron image that shows the differences in composition between the coating
(top, darker) and the bulk FS (bottom, lighter). The coating was around 120 μm thick and contains Zr
and Ca.
(a) Macro (b) BEI (c) Zr Map (d) Ca Map (e) Si Map
Figure 13 – Initial condition of the sample with the single layer coating
Figure 14 shows the condition of the sample with the single layer coating after testing.
Relatively large (~ 200 m width and greater than 600 μm length) silicon crystal can be seen inside
the drop. As with the uncoated sample, the reaction zone contained aluminum and silicon. Cracks
were present at the interface between the reaction zone and the underlying fused silica.

58
EDS Compositional Maps
(a) Macro (b) Drop (c) Interface Drop-RZ (d) Interface RZ-FS
Figure 14 – SEM micrographs and EDS compositions for the FS tube with the single layer coating
after testing.
The initial condition of the sample with the two layer coating is shown in Figure 15. Figure
15(b) is a backscattered electron image that shows the differences in composition between the coating
(top, darker) and the bulk of the FS (bottom, lighter). The first layer of the coating was around 10μm
thick and contained Zr and Ca while second layer was around 30 μm thick. The two layers have
different compositions.
EDS Compositional Maps
(a) Macro (b) Whole (c) Zr (d) Ca (e) Si
Figure 15 – Initial condition of the sample with the single layer coating
Figure 16 shows the sample with the two layer coating after testing. Only a small silicon
crystal can be seen inside the bottom of the residual Al drop. As with the other samples, the reaction
zone contained aluminum and silicon. Cracks were present at the interface between the reaction zone
and the unaffected fused silica.

59
EDS Compositional Maps (Al, Si)
(a) Macro
(b) Drop
Top
(c) Drop Bottom (d) RZ Side
Figure 16 – SEM micrographs for the FS with the two layer coating after testing.
CONCLUSIONS
Aluminum alloys react with and penetrate into FS riser tubes used in the low pressure casting
of aluminum. This interaction results in the formation of a reaction zone and an increased Si content
in the alloy. Samples with a two layer coating experienced less penetration than samples either with a
single layer coating or without any coating. No changes were observed in contact angle for the three
types of specimens.
This research is ongoing. Other coatings and alternative materials will be evaluated. Also, the
effects of initial tube permeability, the presence of open or closed porosity will be evaluated along
with a comparison of thermal shock resistance and tensile strength among all of the materials tested.
AKNOWLEDGEMENTS/DISCLAIMER
This material is based upon work supported by the U.S. Department of Energy and Pyrotek,
Inc. under award number DE-PS07-01ID14244. Any opinions, findings, and conclusions or
recommendations expressed in this material are those of the authors and do not necessarily reflect the
views of the Department of Energy.
REFERENCES
1. Aluminum Vision Steering Committee of the Aluminum Association, Aluminum Industry
Vision, Sustainable Solutions for a Dynamic World, November 2001.
2. The Aluminum Association, Aluminum Industry Technology Roadmap, February 2003.

60
3. United States Advanced Ceramics Association, The Aluminum Association and U.S.
Department of Energy, Applications for Advance Ceramics in Aluminum Production: Needs
and Opportunities, February 2001.
4. ASM International, Materials Handbook Desk Edition, 2001, pages 748-749.
5. Brondyke, K.J., “Effect of Molten Aluminum on Alumina-Silica Refractories”. Journal of the
American Ceramic Society, Vol. 36, No. 5, 1953, 171-175.
6. Fouletier, M.; Gold, D., “Selective, Accelerated Test for Evaluation of Refractory Lifetime in
Contact with Aluminum Alloys” UNITECR’91, Proceedings of the Unified International
Conference on Refractories, Aachen, Germany, 1991, 36-38.
7. Pereira, A.P.F.A.; Baldo, J.B., UNITECR’97, Proceedings of the Unified International
Conference on Refractories, New Orleans, USA, 1997, 1667-1676.
8. Angers, R.; Tremblay, R.; Desrosiers, L.; Dube, D., “Interactions between Dense Alumina-
Silica Ceramics and Molten Aluminum”, Journal of the Canadian Ceramic Society, Vol. 66,
No. 1, February 1997, 64-71.
9. Siljan, O-J.; Rian, G.; Petersen, D.T.; Solheim, A.; Schoning, C., “Refractories for Molten
Aluminum Contact Part I: Thermodynamics and Kinetics”,
Refractories Applications and News, Volume 7, No. 6, November/December 2002, 17-25.
10. Quesnel, S.; Allaire, C.; Afshar, S., “Criteria for Choosing Refractories in Aluminum Holding
and Melting Furnaces”, Light Metals 1998, Addendum Section of the Proceedings of the
TMS, 391-1402.
11. Coudurier, L.; Adorian, J.; Pique, D.; Eustathopoulos, N., “Etude de la Mouillabilite par
L’aluminum Liquide de L’alumine et de L’alumine Recouverte d’une Couche de Metal ou de
Compose Refractaire”, Revue Internationale des Haute Temperatures, Vol. 21, No. 2, 1984,
81-93.
12. Prabriputaloong, K.; Piggott, M.R., “Thin-film Studies of the Reduction of SiO2 by Al”,
Journal of the American Ceramic Society, Vol. 56, No. 4, 1973, 177-180.
13. ASTM International, ASTM B 108 – 03a Standard Specification for Aluminum-Alloy
Permanent Mold Castings, Annual Book of ASTM Standards, Volume 02.02, 2003.


62
Appendix B: Development of Cost-Effective Low-Permeability Ceramic and
Refractory Components for Aluminum Melting and Casting
The following poster presentation appeared at ITP 2004, Materials, Glass, Sensors Project and
Portfolio Review Meeting, Arlington, Virginia, June 21–24, 2004.

63

64
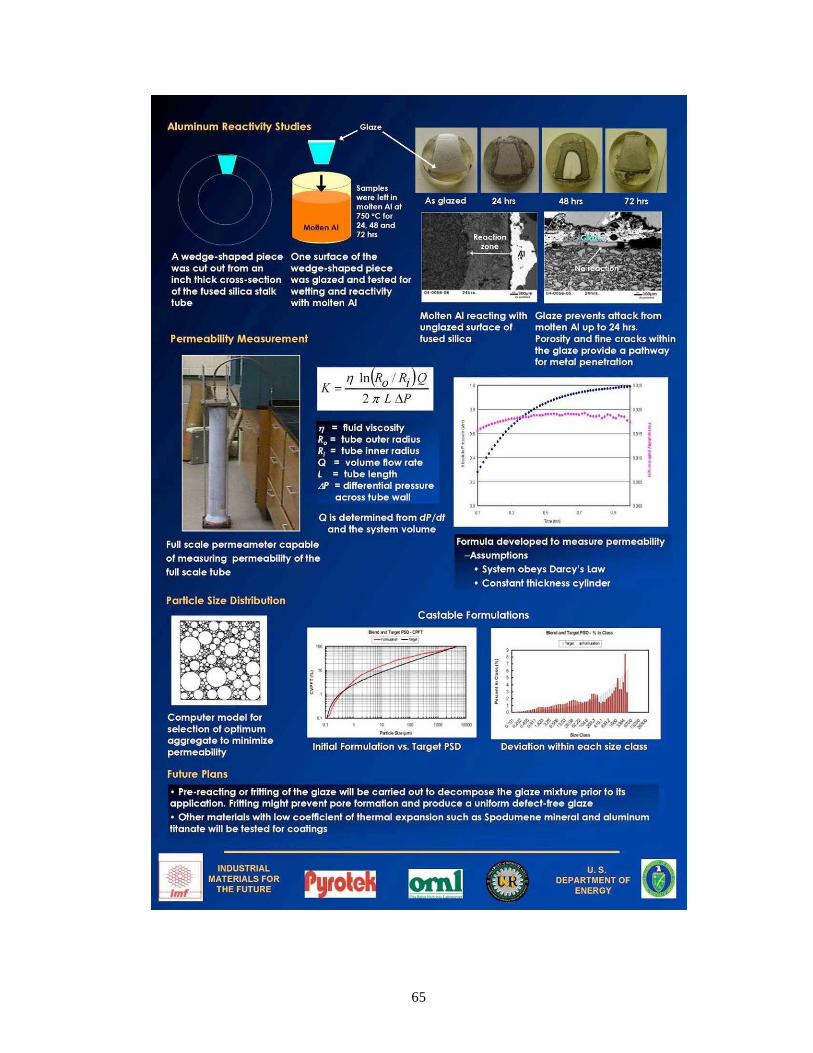
65

66
Copyright © 2022 FDOKUMEN