Measurement and analysis of shocks to products packaged in pails in single parcel ground shipments
18
Measurement and Analysis of Shocks to Products Packaged in Pails in Single Parcel Ground Shipments By Sher Paul Singh, 1 Jay Singh 2 and Pakapol Kittipinyovath 3 1 Professor, School of Packaging, Michigan State University, East Lansing, MI 48824, USA 2 Associate Professor, Industrial Technology, Cal Poly State University, San Luis Obispo, CA 93407, USA 3 Research Assistant, School of Packaging, Michigan State University, East Lansing, MI 48824, USA The objective of this study was to measure and analyse the shocks and impacts experienced by pails in the single parcel distribution environment, with and without a secondary corrugated shipper. The study was conducted in the FedEx Ground shipping environment in the USA. Instrumented 5 gal pails were shipped with and without an outer corrugated box, and with and without handling (precautionary warning) labels, from East Lansing, Michigan to destinations in California and New York. Data recorders were used to collect and analyse shock distribution data (drop heights, drop orientations and number of drops). The results showed that the precautionary labels had no effect in improving the handling or reducing the drop height levels for both corrugated boxes and pails in this environment. Pails without boxes experienced 10 drops per one-way trip with an average drop height of 0.23 m (9 in). Pails with boxes experienced 18 drops per one- way trip with a higher average drop height of 0.30 m (12 in), which amounted to 80% more drops at a 25% higher drop height level than pails without boxes. Impact orientations of pails without boxes showed that 60% of the drops occurred on the sides, and 40% on the bottom. Pails shipped in corrugated boxes showed 22% of the drops occurred on the bottoms, 34% on the side faces, 28% on edges and remaining 16% on the corners. The data collected was analysed to develop pre-shipment package performance tests that can be conducted in a lab environment. KEY WORDS: pails; boxes; small parcel; impacts; drops INTRODUCTION opment, plastic pails were expected to replace existing bulk consumer packaging systems such as Plastic pails were introduced to the packaging glass jars, metal pails, tins, steel drums and bulk industry in 1967 with the collaboration of resin boxes. Products such as paints, food products and producers, molding machinery manufacturers and adhesives were initially packaged in plastic pails. 1 color additive makers that jointly developed the The materials and processes of pail making have materials and production processes to develop this been continuously developed and improved to new packaging form. 1 In the early years of devel- enhance performance of pails. Consequently,
-
Upload
independent -
Category
Documents
-
view
2 -
download
0
Transcript of Measurement and analysis of shocks to products packaged in pails in single parcel ground shipments

Measurement and Analysis of Shocks to Products Packaged in Pails in Single Parcel Ground Shipments
By Sher Paul Singh,1 Jay Singh2 and Pakapol Kittipinyovath3
1 Professor, School of Packaging, Michigan State University, East Lansing, MI 48824, USA 2 Associate Professor, Industrial Technology, Cal Poly State University, San Luis Obispo, CA 93407, USA 3 Research Assistant, School of Packaging, Michigan State University, East Lansing, MI 48824, USA
The objective of this study was to measure and analyse the shocks and impacts experienced by pails in the single parcel distribution environment, with and without a secondary corrugated shipper. The study was conducted in the FedEx Ground shipping environment in the USA. Instrumented 5 gal pails were shipped with and without an outer corrugated box, and with and without handling (precautionary warning) labels, from East Lansing, Michigan to destinations in California and New York. Data recorders were used to collect and analyse shock distribution data (drop heights, drop orientations and number of drops). The results showed that the precautionary labels had no effect in improving the handling or reducing the drop height levels for both corrugated boxes and pails in this environment. Pails without boxes experienced 10 drops per one-way trip with an average drop height of 0.23 m (9 in). Pails with boxes experienced 18 drops per one-way trip with a higher average drop height of 0.30 m (12 in), which amounted to 80% more drops at a 25% higher drop height level than pails without boxes. Impact orientations of pails without boxes showed that 60% of the drops occurred on the sides, and 40% on the bottom. Pails shipped in corrugated boxes showed 22% of the drops occurred on the bottoms, 34% on the side faces, 28% on edges and remaining 16% on the corners. The data collected was analysed to develop pre-shipment package performance tests that can be conducted in a lab environment.
KEY WORDS: pails; boxes; small parcel; impacts; drops
INTRODUCTION opment, plastic pails were expected to replace existing bulk consumer packaging systems such as
Plastic pails were introduced to the packaging glass jars, metal pails, tins, steel drums and bulk industry in 1967 with the collaboration of resin boxes. Products such as paints, food products and producers, molding machinery manufacturers and adhesives were initially packaged in plastic pails.1
color additive makers that jointly developed the The materials and processes of pail making have materials and production processes to develop this been continuously developed and improved to new packaging form.1 In the early years of devel- enhance performance of pails. Consequently,
lib-dc
Typewritten Text
lib-dc
Typewritten Text
This is the pre-peer reviewed version of the following article: Singh, S. P., Singh, J. and Kittipinyovath, P. (2009), Measurement and analysis of shocks to products packaged in pails in single parcel ground shipments. Packaging Technology and Science, 22: 397–414. doi: 10.1002/pts.862, Which has been published in final form at http://onlinelibrary.wiley.com/doi/10.1002/pts.862/abstract

Ol1&ln
l'"d"r",d,
-~"":::-""-"--'-'-'''-'--I~
plastic pails have become more widely used than metal pails, as plastic pails tend to be more durable and cost-effective.1
A vast majority of plastic pails today are made from high density polyethylene and are available in a vast range of sizes and thicknesses. They are most commonly available in capacities of 1–6 gal (3.783–22.7 l), and thicknesses of 1.27–2.54 mm (50–100 mil), serving a range of customer requirements.2 The 18.9 l (5 gal) capacity is the most commonly used size today for industries such as retail, lube oils, vegetable oils, building products, paints, pet food, adhesives, sealants and dangerous goods or hazardous materials (HazMat) such as paints, food and flavouring, janitorial supply, chemical powders and solvents.2
Pails and drums have most commonly been shipped via ground (truck and rail) in palletized quantities. Over the last few decades, various suppliers have been shipping products in pails with and without an outer corrugated shipper using the single parcel shipping services provided by carriers such as FedEx, UPS and DHL. However, the authors could not identify any publication addressing the performance of individual pails that are exposed to the handling and transportation environment of the single parcel distribution.
The objective of this study was to measure and analyse the shocks and impacts experienced by pails in the single parcel distribution environment, with and without a secondary corrugated shipper as well as with and without precautionary labels. The study was conducted in the FedEx Ground shipping environment in the USA. FedEx Ground,
one of the FedEx Corporation’s subsidiaries, began operations in 1985 as the former Roadway Package System Incorporated (RPS Inc.) and re-branded as FedEx Ground in 2000 with headquarters in Pittsburgh, Pennsylvania.3 FedEx Ground specializes in cost-effective, small-package shipping, offering dependable business-to-business delivery or convenient residential service. More than 3.5 million packages are shipped via FedEx Ground daily using 20,000 motorized vehicles throughout the USA, Canada and Puerto Rico.3 FedEx Ground provides 100% coverage to every business addresses in the USA, with 29 ground hubs and over 500 pickup/delivery terminals.3 The delivery time of small-parcel shipment can take one to five business days in the continental USA and three to seven business days to Alaska and Hawaii. Figure 1 shows a typical ground shipping environment.
When packaged products are shipped through the distribution channels to the end customer, they may encounter many dynamic events such as drops, impacts, crushing forces, compressions, vibrations, climate and pressure changes during handling and transportation which might cause damage to a product. In the single-parcel shipping environment, shocks are one of the most severe factors that cause damage to products. Shocks can occur when a package is dropped, tossed and kicked during handling and sorting either manually or using automated material handling systems.
The various factors that cause product damage during transportation and handling have been studied by many researchers. The damage to a
Figure 1. Ground shipping environment.

product can be categorized by the distribution environment as a function of the handling and in-transit environments present during the shipments. During package handling, damage results from sorting and storage operations which include loading–unloading, stacking, lifting and conveying packages.4 Damage occurs in the transit environment as a result of vibration from transport vehicles like trucks, railcars, aircrafts, etc. The levels of damage depend on distances and types of surface encountered during travel.4
There are many studies that have measured and analysed dynamic events that occur to packages during handling and transportation. This data can be used to design, test and approve protective packaging that prevents damage from potential hazards such as drops and impacts. Various methods have been developed using observations and instrumentation to determine these dynamic events in previous studies. Following researches provide input into the dynamic nature of the parcel shipping environment.
• Goff developed performance requirements that were necessary for parcel-post packages in 1974.5 The study recommended performance-based test methods that could be used to reduce physical damage to parcel-post packages.
• Singh and Voss; and Singh and Cheema measured the dynamics of small parcel environment in the UPS ground-shipping environment.6,7 The study tested packages of different sizes and weights that were instrumented with drop-height recorders and then shipped through UPS. The study showed that the highest drop height measured was 1.06 m (41.73 in) and that the size of the package had no significant effect on the drop heights associated with medium and larger-size packages. However, small-size and lighter-weight packages did experience higher drop heights. This was attributed to the use of automated handling for the larger and heavier packages in the UPS sorting environment. The smaller and lighter packages are often placed on top in the delivery truck and are therefore subject to higher drops.
• Singh, Burgess and Hays measured the environment within UPS for packages weighing up to 64 kg (141 lb).8 In addition, the effect of label position on drop orientation has also been
studied in parcel shipments for large and heavy packages.9
• A study by Singh et al. concluded that the package size and weight had no effect on measured drop heights for packages classified as small and light-weight within the FedEx Second-Day Air delivery system.10 The study also found that precautionary labels reading ‘Fragile – Handle with Care’ had no significant effect on the handling of packages.
• In another study measuring the parcel shipping environment within Federal Express for lightweight and small-size packages, the authors concluded that neither the package size/weight nor the labels had any significant effect on the severity of drop heights.11 The highest drop height measured was 1.85 m (72.83 in).
• A study measuring and analysing the express shipping environment for mid-sized and lightweight packages for DHL, FedEx and United Parcel Service, concluded that the handling environments within FedEx and UPS are not significantly different between ground shipping, second-day and next-day, regardless of package size and weight of packages.12
• In a recent study, Singh et al. summarized that the number of drops experienced by the packages in the Overnight (Next-day) environment for USPS was comparable with average of those for DHL, FedEx and UPS.13 The Priority (Second-Day) shipments in the USPS environment, however, experienced 2.3 times lesser drops as compared with the average of those experienced in DHL, FedEx and UPS shipments. The study also found that the average drop height of the 10 highest drops experienced in the USPS shipping environment for both the Express (Nextday) and Priority (Second-day) service was higher than that for DHL, FedEx and UPS.
• Another study measured and analysed the effect of placing precautionary labels on mid-sized and light-weight packages when shipped using Next-Day and 2nd Day services provided by DHL.14 For the Next-Day service, packages with labels, as compared with those without labels, were subjected to approximately the same number of drops for shipment to California and approximately 35% less drops for shipments to New York. For the 2nd Day service, approximately 37% more drops were noted for
shipments to California for packages with labels whereas the shipments to New York experienced the same number of drops.
It may be noted here that although a considerable amount of research has been conducted in the past evaluating the different shipping environments, none have considered pails as the packaging.
The objectives of this study were:
1. To measure the shocks and drops occurring during the ground shipping environment in FedEx for 5 gal pails shipped with and without secondary outer corrugated packaging.
2. To study the effect of precautionary labels on the severity of drops of pails observed when shipped by FedEx Ground.
3. To develop a test protocol for drop testing pails for the FedEx Ground shipping environment.
MATERIALS AND METHODS
Instrumentation and recording parameters
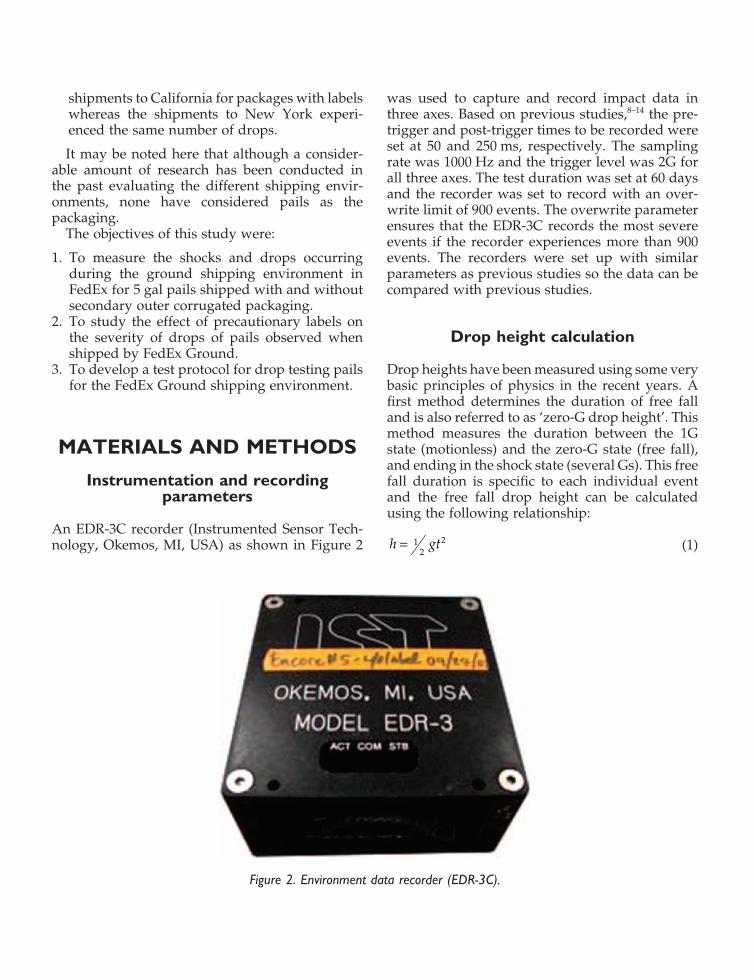
An EDR-3C recorder (Instrumented Sensor Technology, Okemos, MI, USA) as shown in Figure 2
was used to capture and record impact data in three axes. Based on previous studies,8–14 the pre-trigger and post-trigger times to be recorded were set at 50 and 250 ms, respectively. The sampling rate was 1000 Hz and the trigger level was 2G for all three axes. The test duration was set at 60 days and the recorder was set to record with an overwrite limit of 900 events. The overwrite parameter ensures that the EDR-3C records the most severe events if the recorder experiences more than 900 events. The recorders were set up with similar parameters as previous studies so the data can be compared with previous studies.
Drop height calculation
Drop heights have been measured using some very basic principles of physics in the recent years. A first method determines the duration of free fall and is also referred to as ‘zero-G drop height’. This method measures the duration between the 1G state (motionless) and the zero-G state (free fall), and ending in the shock state (several Gs). This free fall duration is specific to each individual event and the free fall drop height can be calculated using the following relationship:
h = 1 gt 2 (1)2
Figure 2. Environment data recorder (EDR-3C).

Where, h = free fall drop height, m or in g = acceleration due to gravity, 9.81 m/s2 or 386.4 in/s2
t = free fall duration, expressed in seconds
This method, however, can prove inaccurate in most packaging-related distribution scenarios.12
This is because dropping a package vertically versus tossing it sideways may provide similar free fall time, so that the calculated drop height using the equation above will be the same for both. The intensity of shock is typically greater in sideway tosses as compared with free fall drops because of the added impact velocity.
During shipping and handling, packages encounter different types of shocks, not only in the form of free fall but also impacts, tosses, kicks and complex tumbles. The second method that can analyse more complex impact conditions determines the ‘equivalent drop height’. This method calculates drop height from the acceleration versus time history of the recorded shock pulse for a particular event. The velocity change is calculated using the shocks recorded in all three shock axes from the tri-axial accelerometer. The resultant velocity change is calculated as the vector sum of the individual axis velocity changes. The equivalent drop height is then calculated using the following relationship:
1 ∆V 2
he = (2)2g 1 + e
Where, he = equivalent drop height, expressed in m or in ∆V = resultant velocity change, expressed in m/s or in/s e = coefficient of restitution g = acceleration due to gravity, 9.81 m/s2 or 386.4 in/s2
The coefficient of restitution (e) can be experimentally determined in the laboratory during the calibration of the instrumented packages. Packages used in this study, were first calibrated to develop a ‘package profile’ based on ‘e’ values produced during controlled lab drops in various orientations, using a software package called DynaMax Suite (Instrumented Sensor Technology). The ‘e’ values were obtained by dropping packaged
recorders from known drop heights several times on the faces, edges and corners using a free fall drop tester.11 In this study, plastic pails were dropped from 0.30, 0.61, 0.76, 0.91 and 1.07 m (12, 24, 30, 36 and 42 in) on bottom face and side orientations in the laboratory to determine the package profile that represents ‘e’ values in different orientations. The recorded data were then downloaded and analysed using the DynaMax Suite software to verify the accuracy of the instrument in predicting drop heights of instrumented packages or pails. This allowed predicting the most accurate equivalent drop height.
Test package shipments
The data recorder was encapsulated with 5.08 cm (2 in) thick Ethafoam 400 (Dow Chemical Company, Midland, MI, USA) cushions and encased in the 18.9 l (5 gal) capacity plastic pails as shown in Figure 3. The recorder was positioned in the geometric centre of the package. Plastic pails from four different manufacturers were used in this study. Three of them were regular pails and the fourth was a UN-certified pail that meets DOT CFR 49 test requirements. There is no difference in the overall dimensions and capacity among the types of pails used. The only difference between these pails is the type of cover or lid. The UN-approved pails have a more secure cover or lid than the non-UN pails. The specifications for all packaging used in this study are listed in Table 1 and illustrated in Figure 3.
Three types of packages were used in this study; plastic pails without precautionary labels, plastic pails with precautionary labels and plastic pails with secondary over-pack corrugated boxes (Figure 4). For pails shipped with precautionary labels, four precautionary labels reading ‘Fragile’ and ‘Handle with Care’ were placed on four sides of each pail. For the package shipped with over-pack corrugated box, the instrumented pails were put in regular slotted container-style corrugated boxes made from double-wall BC-flute with two (topbottom) corrugated pads inside, and sealed using 4.08 cm (2 in) wide general purpose box sealing tape. The boxes had an edge crush test value of 8.57 kgf/cm (48 lbf/in), size limit of 2.41 m (95 in) and a gross weight limit of 45.36 kg (100 lb).

f::::::~3 Lid:::= Layer 6
Layer 5
;:,
/ /'
LayerJ
Layer 1
Layer 1
Pail
Figure 3. Data recorder placement in pails (Ethafoam 400 was used for all tiers identified as layers).
Table 1. Package specifications and weights
Manufacturer Pail
model Lid type/model Dimension (diameter × height),
cm (in) Thickness, mm (mil)
Weight, kg (lb)
Nampac (UN pail) 05 UUN 20UN liquid 28.58 × 36.20 (11.25 × 14.25)
2.29 (90): 3.63 (8)
Letica 90 ml Cut tab cover 27.94 × 35.56 (11.00 × 14.00)
2.29 (90) 3.63 (8)
Plastican 40B pail 40CRT tear strip 28.58 × 35.89 (11.25 × 14.13)
2.29 (90) 3.63 (8)
Encore #50640 5 gal teat strip gasket 28.58 × 34.93 (11.25 × 13.75)
1.78 (70) 3.63 (8)
Corrugated box (over-pack)
– – 31.75 × 31.75 × 43.82 (12.50 × 12.50 × 17.25)
– 3.63 (8)
Instrumented packages were shipped (roundtrips) from East Lansing, Michigan to San Luis Obispo, California and between East Lansing, Michigan and Rochester, New York via FedEx
ground service (Figure 5). Plastic pails from all four different pail manufacturers were shipped together in each shipment. Three round trip shipments were made to each destination for all

a. Pail without warninglabel
b. Pail with warninglabel
c. Pail with secondarybox
Figure 4. Types of instrumented packages used in the study.
package types. At the conclusion of each round trip, the data stored on the EDR-3Cs were downloaded and analysed to determine the number of drops, drop heights and drop orientations. This information was further analysed to develop a test protocol to simulate the impact conditions that pails with or without secondary packages undergo in the single parcel environment.
RESULTS AND DISCUSSION
Drop measurement results
The recorded events were downloaded and analyzed for drop heights, drop orientations, and number of drops using DynaMax Suite software. Only drop heights of 7.62 cm (3 in) and higher were analysed. Drop heights below this threshold were ignored as they tend to be because of shocks resulting from vibration during transportation or conveyer belt sorting operations as discussed in previous studies.7,8,14 Tables 2–7 show the number
of drops, highest drop height levels, average drop heights and drop orientations from the 48 one-way trips conducted from Michigan to California and Michigan to New York. The results showed that based on the number of drops, there was no significant difference in handling between UN and non-UN pails. Tables 2 and 5 show the summary of number of drops, average drop heights and orientation for pails shipped without any precautionary labels. Tables 3 and 6 show data for pails shipped with the ‘Fragile’ and ‘Handle with Care’ precautionary labels. Tables 4 and 7 show the summarized data of pails shipped with outer corrugated boxes.
Tables 8 and 9 and Figures 6 and 7 show the drop data results for pails and packages shipped via FedEx Ground service to California and New York. For shipments to California, pails with and without precautionary labels show approximately the same number of drops and average drop heights. Pails with precautionary labels experienced 104 drops from drop height of 7.62 cm (3 in) or higher from eight one-way trips, pails without precautionary labels experienced 95 drops which averages to 13

.. III .0.
r-t--k'.
Figure 5. FedEx Ground shipment routes used for the study.
Table 2. Summary of drop data for shipments to California without precautionary labels
Drop orientation (%) Pail Number of Highest drop Average drop
Shipment manufacturer drops height, m (in) height, m (in) Bottom Side
Nampac 11 0.53 (20.92) 0.20 (8.02) 36.36 63.64 Letica 13 0.73 (28.85) 0.16 (6.26) 15.38 84.61 Plastican 5 0.75 (29.66) 0.34 (13.54) 60.00 40.00
MI–CA Encore 6 1.01 (39.79) 0.30 (11.72) 33.33 66.67 Nampac 14 1.03 (40.61) 0.23 (9.18) 28.57 71.42 Letica 11 0.88 (34.73) 0.26 (10.22) 0.00 100.00 Plastican 22 0.69 (27.06) 0.25 (9.72) 40.90 59.10
CA–MI Encore 13 0.59 (23.2) 0.22 (8.65) 7.69 92.31
MI, Michigan; CA, California.
and 12 drops per one-way trip, respectively. The approximately 40% more drops and 18% higher average drop height of pails with and without drop height than pails without boxes. labels was approximately 22.86 cm (9 in). Pails The results from shipments to New York showed with over-pack corrugated boxes experienced similar trends as the shipments to California. The

Table 3. Summary of drop data for shipments to California with precautionary labels
Drop orientation (%) Pail Number of Highest drop Average drop
Shipment manufacturer drops height, m (in) height, m (in) Bottom Side
Nampac 12 1.67 (65.59) 0.32 (12.48) 58.33 41.67 Letica 8 1.92 (75.72) 0.45 (17.84) 0.00 100.00 Plastican 9 1.05 (41.24) 0.25 (9.79) 33.33 66.67
MI–CA Encore 10 1.31 (51.58) 0.23 (8.96) 70.00 30.00 Nampac 14 0.26 (10.23) 0.15 (5.95) 42.86 57.14 Letica 28 0.74 (29.17) 0.23 (9.16) 39.28 60.71 Plastican 11 0.38 (14.85) 0.15 (6.1) 54.54 45.46
CA–MI Encore 12 0.62 (24.57) 0.22 (8.64) 33.33 66.67
MI, Michigan; CA, California.
Table 4. Summary of drop data for shipments to California with corrugated boxes
Drop orientation (%)
Face Pail Number of Highest drop Average drop
Shipment manufacturer drops height, m (in) height, m (in) Bottom Side Edge Corner
Nampac 25 0.57 (22.40) 0.19 (7.36) 20.00 32.00 28.00 20.00 Letica 24 0.88 (34.70) 0.31 (12.11) 29.17 12.50 45.83 12.50 Plastican 24 1.00 (39.20) 0.27 (10.63) 4.17 12.50 37.50 45.83
MI–CA Encore 36 0.93 (36.60) 0.32 (12.64) 19.44 33.33 25.00 22.22 Nampac 12 0.50 (19.66) 0.20 (8.00) 16.67 33.33 25.00 25.00 Letica 16 0.78 (30.53) 0.27 (10.74) 25.00 31.25 25.00 18.75 Plastican 13 1.02 (40.23) 0.32 (12.58) 23.08 7.69 46.15 23.08
CA–MI Encore 15 0.58 (22.97) 0.25 (10.00) 20.00 53.33 20.00 6.67
MI, Michigan; CA, California.
Table 5. Summary of drop data for shipments to New York without precautionary labels
Drop orientation (%) Pail Number of Highest drop Average drop
Shipment manufacturer drops height, m (in) height, m (in) Bottom Side
Nampac 8 0.75 (29.41) 0.20 (7.80) 62.50 37.50 Letica 8 0.24 (9.26) 0.14 (5.56) 62.50 37.50 Plastican 7 0.27 (10.45) 0.15 (5.93) 28.57 71.43
MI–NY Encore 8 0.24 (9.28) 0.14 (5.56) 62.50 37.50 Nampac 5 0.21 (8.38) 0.14 (5.55) 80.00 20.00 Letica 6 0.43 (16.94) 0.20 (7.87) 66.66 33.34 Plastican 10 0.90 (35.44) 0.27 (10.49) 40.00 60.00
NY–MI Encore 6 0.48 (18.77) 0.19 (7.30) 66.66 33.34
MI, Michigan; NY, New York.

Table 6. Summary of drop data for shipments to New York with precautionary labels
Drop orientation (%) Pail Number of Highest drop Average drop
Shipment manufacturer drops height, m (in) height, m (in) Bottom Side
Nampac 7 0.92 (36.18) 0.35 (13.59) 28.57 71.43 Letica 2 0.16 (6.16) 0.14 (5.35) 0.00 100.00 Plastican 7 1.00 (39.21) 0.46 (18.24) 14.28 85.72
MI–NY Encore 7 0.93 (36.44) 0.31 (12.06) 28.57 71.43 Nampac 7 0.24 (9.42) 0.13 (5.23) 57.14 42.86 Letica 4 0.16 (6.14) 0.12 (4.53) 25.00 75.00 Plastican 7 0.93 (36.44) 0.31 (12.06) 28.57 71.43
NY–MI Encore 9 0.62 (24.38) 0.24 (9.64) 66.66 33.34
MI, Michigan; NY, New York.
Table 7. Summary of drop data for shipments to New York with corrugated boxes
Drop orientation (%)
Face Pail Number of Highest drop Average drop
Shipment manufacturer drops height, m (in) height, m (in) Bottom Side Edge Corner
Nampac 20 1.03 (40.6) 0.25 (9.73) 35.00 35.00 10.00 20.00 Letica 13 0.55 (21.48) 0.23 (8.88) 23.08 53.85 15.38 7.69 Plastican 18 0.78 (30.53) 0.26 (10.18) 16.67 33.33 38.89 11.11
MI–NY Encore 18 0.56 (22.01) 0.19 (7.59) 33.33 33.33 27.78 5.56 Nampac 16 1.16 (45.58) 0.42 (16.67) 31.25 50.00 18.75 0.00 Letica 16 1.15 (45.43) 0.33 (12.88) 37.50 50.00 6.25 6.25 Plastican 13 0.78 (30.53) 0.26 (10.18) 7.69 46.15 46.15 0.00
NY–MI Encore 11 1.19 (46.81) 0.42 (16.55) 0.00 72.73 18.18 9.09
MI, Michigan; NY, New York.
Table 8. Summary of drop height data measured above 3 in: Michigan to California
Drop data Without label With label With corrugated box
Number of drops 95 104 165 Maximum drop height, m (in) 1.02 (40.31) 1.92 (75.72) 1.02 (40.24) Drop height at 99% occurrence, m (in) 1.02 (40.01) 1.67 (65.57) 0.99 (38.88) Drop height at 95% occurrence, m (in) 0.70 (27.62) 0.64 (25.21) 0.77 (30.22) Drop height at 90% occurrence, m (in) 0.56 (21.97) 0.42 (16.52) 0.56 (22.19) Average drop height, m (in) 0.23 (9.21) 0.24 (9.43) 0.27 (10.71)

, 10.oo'lo r-----====::-:::::====::;:::==llDO.lkI'1lo ~
8. iO.OO'llo ..,..,-.J'-'.. 80.00'"' V--j 70,00,",_ &o.oo'llo
! 50.00'110
:§ .o.DO'lio
U' "... 15 _C~ ....~
20.00% __CA.~
lo.00'llo CA.,,1100
O.IXI'lloI-J--_-_-_-_-_--_-_-~1U5l1lOl UIl20l "l'I(3OJ 1.O214Ol 1.27/SOl 1.52(*11 1.11(101~
Drop Height. m lin)
0.13(5) O.2S(lO) ll.3I(15) 0.11(20) O.~S) O.7e(Xl) O.8i()S) 1.(12\010) 1.l~J 1.2J(SO)
Drop IftIDN, mIIr'9
Table 9. Summary of drop height data measured above 3 in: Michigan to New York
Drop data Without label With label With corrugated box
Number of drops 58 47 125 Maximum drop height, m (in) 0.90 (35.34) 1.00 (39.21) 1.20 (47.28) Drop height at 99% occurrence, m (in) 0.77 (30.37) 0.97 (38.15) 1.18 (46.65) Drop height at 95% occurrence, m (in) 0.44 (17.15) 0.91 (35.66) 0.96 (37.81) Drop height at 90% occurrence, m (in) 0.32 (12.43) 0.73 (28.79) 0.66 (26.12) Average drop height, m (in) 0.18 (7.18) 0.27 (10.46) 0.30 (11.96)
Figure 6. Cumulative percentage versus drop height for shipments to California.
Figure 7. Cumulative percentage versus drop height for shipments to New York.

number of drops for pails with and without precautionary labels was 47 and 58, respectively from eight one-way trips which averaged to six and seven drops for a one-way trip, respectively. Packages with over-pack corrugated boxes experienced approximately 58% more drops than pails without boxes which is 16 drops per one-way trip and an average drop height of 30.48 cm (12 in).
Tables 8 and 9 show that the shipments from Michigan to California experienced approximately 39% more drops for pails without precautionary labels, 55% more drops for pails with precautionary labels and 24% more drops for packages with corrugated boxes as compared with shipments to New York. The cumulative numbers of occurrences expressed in percentages were plotted against drop height for each shipment. The terms ‘90%, 95% or 99% occurrence’ were used to determine the level
of protection needed of packages. The term 90% occurrence means 90% of all recorded drop heights were below this level. The previous studies suggest that 99% occurrence levels may be used for expensive product or when low damage level is desired. 95% and 90% occurrence levels can be used for other situations depending on the value of the product or the acceptable damage level.14 Figure 6 shows drop height levels of shipments to California. For example, 95% of drops in shipments without precautionary labels occurred below 71.12 cm (28 in), drops in shipments with precautionary labels occurred below 66.04 cm (26 in) and drops in shipments with boxes occurred below 78.74 cm (31 in). Figure 7 illustrates the drop height levels of shipments to New York.
Tables 10 and 11 show average drop height levels of 48 one-way trips and the highest drop heights
Table 10. Average drop height levels for shipments: Michigan to California
Drop height, m (in) Without label With label With corrugated box
Highest 0.78 (30.56) 0.99 (39.12) 0.78 (30.79) 2nd highest 0.41 (16.15) 0.38 (15.07) 0.66 (26.09) 3rd highest 0.32 (12.67) 0.28 (10.95) 0.53 (21.01) 4th highest 0.23 (9.02) 0.22 (8.84) 0.48 (18.75) 5th highest 0.18 (7.03) 0.20 (7.68) 0.37 (14.70) 6th highest 0.16 (6.25) 0.17 (6.76) 0.31 (12.37) 7th highest 0.16 (6.24) 0.14 (5.69) 0.29 (11.23) 8th highest 0.14 (5.61) 0.14 (5.47) 0.26 (10.05) 9th highest 0.13 (5.07) 0.14 (5.42) 0.23 (8.94) 10th highest 0.12 (4.62) 0.12 (4.68) 0.20 (7.89)
Table 11. Average drop height levels for shipments: Michigan to New York
Drop height, m (in) Without label With label With corrugated box
Highest 0.44 (17.24) 0.54 (21.26) 0.95 (37.47) 2nd highest 0.22 (8.52) 0.37 (14.67) 0.73 (28.75) 3rd highest 0.17 (6.88) 0.24 (9.51) 0.58 (22.83) 4th highest 0.15 (5.83) 0.20 (7.71) 0.46 (18.26) 5th highest 0.12 (4.83) 0.19 (7.47) 0.38 (15.07) 6th highest 0.11 (4.30) 0.11 (4.46) 0.27 (10.50) 7th highest 0.09 (3.65) 0.09 (3.46) 0.22 (8.82) 8th highest 0.09 (3.58) 0.08 (3.13) 0.19 (7.43) 9th highest 0.10 (3.99) 0.08 (3.03) 0.17 (6.70) 10th highest 0.09 (3.59) – 0.15 (5.80)

Table 12. Percent impact orientations of packages: Michigan to California
Orientation of drop (%) Without label With label With corrugated box
Face (bottom) 26.31 42.31 19.39 Face (side) 73.69 57.69 26.67 Edge – – 31.52 Corner – – 22.42
Table 13. Percent impact orientations of packages: Michigan to New York
Orientation of drop (%) Without label With label With corrugated box
Face (bottom) 56.90 41.30 24.80 Face (side) 43.10 58.70 44.80 Edge – – 22.40 Corner – – 8.00
Table 14. Summary of drop height data measured above 3 in of pails with labels, without labels and with over-pack corrugated boxes
Drop data Without label With label With corrugated box
Number of drops 153 151 290 Maximum drop height, m (in) 1.02 (40.31) 1.92 (75.72) 1.20 (47.28) Drop height at 99% occurrence, m (in) 0.96 (37.93) 1.53 (60.12) 1.16 (45.49) Drop height at 95% occurrence, m (in) 0.67 (26.23) 0.86 (33.87) 0.82 (32.14) Drop height at 90% occurrence, m (in) 0.48 (19.07) 0.47 (18.6) 0.63 (24.98) Average drop height, m (in) 0.21 (8.44) 0.25 (9.75) 0.29 (11.25)
recorded during any one-way trip. The highest drop height in this study was 1.92 m (75.7 in) recorded from a pail shipped with precautionary label to California. The dynamic events were then analysed for the impact orientation as shown in Tables 12 and 13.
Combined dynamic events for the two destinations
The dynamic events for both destinations were combined to calculate and analyse the number of drops, drop heights and drop orientations. The results are shown in Tables 14–16 and Figure 8. The number of drops for pails with and without pre
cautionary label experienced approximately the same number of drops which were 151 and 153 for the 16 one-way trips, respectively. This is an average of approximately 10 drops per one-way trip. Although the highest drop height was 1.92 m (75.72 in) for a pail with precautionary label, the average drop heights for pails with and without precautionary labels averaged approximately 25.4 cm (10 in). Packages with corrugated boxes as over-packs experienced approximately 44% higher number of drops and 21% higher average drop heights than pails without boxes. Pails with boxes experienced 290 drops from 16 one-way trips and had an average of 18 drops per one-way trip (Table 14). The average drop height for pails with boxes was 30.48 cm (12 in).

Table 15. Average drop height levels of pails with labels, without labels and with over-pack corrugated boxes
Drop height, m (in) Without label With label With corrugated box
Highest 0.61 (23.90) 0.77 (30.27) 0.87 (34.13) 2nd highest 0.31 (12.33) 0.38 (14.87) 0.70 (27.42) 3rd highest 0.25 (9.77) 0.26 (10.24) 0.56 (21.92) 4th highest 0.19 (7.43) 0.21 (8.20) 0.47 (18.50) 5th highest 0.15 (5.93) 0.20 (7.69) 0.38 (14.88) 6th highest 0.13 (5.27) 0.15 (5.87) 0.29 (11.44) 7th highest 0.13 (5.06) 0.12 (4.83) 0.25 (10.03) 8th highest 0.12 (4.80) 0.13 (5.17) 0.22 (8.74) 9th highest 0.12 (4.92) 0.13 (5.16) 0.20 (7.82) 10th highest 0.11 (4.47) 0.12 (4.68) 0.17 (6.84)
Table 16. Percent impact orientations of pails with labels, without labels and with over-pack corrugated boxes
Orientation of drop (%) Without label With label With corrugated box
Face (bottom) 37.25 41.72 21.72 Face (side) 62.75 58.28 34.48 Edge – – 27.59 Corner – – 16.21
The drop heights from each shipment of 48 one-way trips were ranked and are shown in Table 15. This format is often used to develop drop test procedures in the lab for performing drops by sequentially reducing drop height levels.15 The highest drop height is typically not used for lab simulation tests as they do not represent all events experienced, instead average of the highest drop heights occurring is used sequentially.
Table 16 shows that the impact orientations, for both the pails with and without precautionary labels, were approximately the same. Approximately 60% of all drops were on the sides of the pail and 40% were on the bottom. Pails with boxes experienced 22% of drops on the bottom, 34% of drops on the sides, 28% of drops are on the edges and 16% of drops on the corners of the packages. Ninety-five percent of all drops in shipments without precautionary labels occurred below 68.58 cm (27 in), with precautionary labels occurred
below 86.36 cm (34 in) and with corrugated boxes occurred below 83 82 cm (33 in) (Figure 8).
Similar to the conclusions from previous studies, the handling of pails with pictorial markings and/ or precautionary labels did not have a significant consequence on the difference in number of drops or drop levels as compared with pails without precautionary labels.9,14
The combined data for pails with and without precautionary labels in comparison with pails shipped in corrugated boxes are shown in Tables 17 and 18 and Figure 9. Pails without boxes experienced 304 drops during 32 one-way trips at an average of approximately 10 drops per one-way trip. Pails shipped in boxes experienced 290 drops from 16 one-way trips or an average of approximately 18 drops per one-way trip which represents approximately 56% more drops. The average drop height of pails with boxes was also 25% higher than pails without box which was 30.48 and

110'110
'00%
I00%
00%
,,%
.,%
t 00%ii .,%
~ >0%
,,%
,,%
-•
('-- Shipment without Warning Label-- Shipment with Warning Label
Shi nt with Corru ated Box
0%o 0.25(11) 0.51(20) o.J'If3Ol l.~ 1.27(501 U2(tO) I 1.11(1'0)~
Drop Height, m Ilnl
Figure 8. Cumulative percentage versus drop height for packages with label, without label and with over-pack corrugated box.
Table 17. Summary of drop height data measured above 3 in of packages with and without over-pack corrugated box
Drop data Without corrugated box With corrugated box
Number of drops 304 290 Maximum drop height, m (in) 1.92 (75.72) 1.20 (47.28) Drop height at 99% occurrence, m (in) 1.05 (41.17) 1.16 (45.49) Drop height at 95% occurrence, m (in) 0.74 (29.08) 0.82 (32.14) Drop height at 90% occurrence, m (in) 0.48 (18.95) 0.63 (24.98) Average drop height, m (in) 0.23 (9.09) 0.29 (11.25)
Table 18. Average drop height levels of pails with and without over-pack corrugated boxes
Drop height, m (in) Without corrugated box With corrugated box
Highest 0.69 (27.09) 0.87 (34.13) 2nd highest 0.35 (13.60) 0.70 (27.42) 3rd highest 0.25 (10.02) 0.56 (21.92) 4th highest 0.20 (7.80) 0.47 (18.50) 5th highest 0.17 (6.72) 0.38 (14.88) 6th highest 0.14 (5.56) 0.29 (11.44) 7th highest 0.13 (5.05) 0.25 (10.03) 8th highest 0.13 (4.97) 0.22 (8.74) 9th highest 0.13 (4.94) 0.20 (7.82) 10th highest 0.12 (4.57) 0.17 (6.84)

,.
--.. ...~--
-- ..--m"",----
flCO.em.
.""..""..,.l 1O.00'lI.
\
- IO.OCI'.
j<."".""."".""_W-_~_~ --<
1U'(10) Mll2'l '-"POI 1.lQ(4t) Ul'(~ 1.uteO) 1.7'(7IlI 1.031'0)
DrOll Helghl, m (In)
Figure 9. Cumulative percentage versus drop height for pails with and without over-pack corrugated boxes.
Table 19. Percent impact orientations of pails with and without over-pack corrugated boxes
Orientation of drop (%) Without corrugated box With corrugated box
Face (bottom) 39.8 21.72 Face (side) 60.2 34.48 Edge – 27.59 Corner – 16.21
22.86 cm (12 and 9 in), respectively. Pails with boxes experienced higher number of drops and higher drop height levels as the rectangular shape of the boxes are easier to stack and ship with other packages. On the other hand, the cylindrical shape of pails makes them harder to ship with other type of packages in single-parcel distribution environment.
Table 19 shows the impact orientations of pails with and without corrugated boxes. Pails without boxes experienced 60% of the drops on their sides and 40% on the bottom. Boxes with pails experienced 22% of the drops on the bottom, 34% on the sides, 28% on the edges and 16% on their corners. The percentage of the drops on different orientations in this study was similar to previous studies.11–13
The higher number of side drops experienced by pails without boxes and face drops in boxes with pails suggests that these impacts are the result from handling operations more than drops during transportation. Correspondingly, from the time line of recorded drop events, 67% of the total drops from all shipments occurred during handling
operation in the sorting facilities and the rest occurred during transit.
Test protocol for lab testing
Based on the results of this study, a test protocol has been developed to test pails without secondary packaging for the small parcel ground shipping environment in a lab setting.
Average number of drops per one-way trip = 10 From Table 19, the impact orientation predictions can be made as follows:
40% of drops occurred on bottom: 0.40 × 10 = four drops 60% of drops occurred on side: 0.60 × 10 = six drops
Table 18 will be used to conduct the lab-simulated test. The test protocol for pails without secondary packaging consists of performing drop tests from 25, 36 and 71 cm (10, 14 and 28 inches). A sequence of 10 drops should be performed as below.

Bollolll Drop Side Drop
Figure 10. Bottom and side drops for pails without secondary packaging.
1. At drop height of 71 cm (28 in), perform two drops (one on bottom and one on side of the pails)
2. At drop height of 36 cm (14 in), perform two drops (one on bottom and one on side of the pails)
3. At drop height of 25 cm (10 in), perform six drops (two on bottom and four on side of the pails)
Figure 10 shows the drop orientations of pails on the free fall drop tester.
CONCLUSIONS
This study showed that HazMat (UN) certification does not have a significant effect in terms of drop events experienced by the pails as well as damage to the primary containers during ground shipments in the small parcel distribution environment. Pictorial markings or precautionary labels also had no significant effect on improving handling or reducing the drop height levels of packages and pails in this environment. Pails shipped in corrugated boxes experienced 18 drops per one-way trip and average drop height of 30.48 cm (12 in) as compared with 10 drops per one-way trip
and an average drop height of 9 in experienced by pails without secondary packaging. Evaluation of the drop orientation of pails without boxes showed that 60% of the drops occurred on the sides and 40% on the bottom of the pails. Boxes containing pails experienced 22% of the drops on the bottom face, 34% on the side faces, 28% on the edges and 16% on the corners.
ACKNOWLEDGEMENTS
The authors would like to thank the Consortium of Distribution Packaging Research at Michigan State University for the funding for this study. In addition, the support by Instrumented Sensor Technology to provide instrumentation is acknowledged.
REFERENCES
1. Baker DH. History of the plastic pail industry, Plastic Shipping Container Institute. 2008; http:// www.pscionline.org/history.html [accessed 16 June 2008].
2. Baker DH. Plastic pail selection and usage, Plastic Shipping Container Institute. 2008; http:// pscionline.org/select.html [accessed 26 June 2008].
3. FedEx Facts. FedEx Ground. 2008; http://news.van. fedex.com/fedexground [accessed 13 July 2008].

4. Singh SP, Cheema A. Measurement and analysis of the overnight small package shipping environment for Federal Express and United Parcel Service. Journal of Testing and Evaluation 1996; 24(4): 205– 211.
5. Goff J. Development of performance standards for parcel post packages. Michigan State University, Project No. 3108, 1974.
6. Singh SP, Voss T. Drop heights encountered in the United Parcel Service Small Parcel Environment in the United States. Journal of Testing and Evaluation ASTM 1992; 20(5): 382–387.
7. Singh SP, Cheema A. Measurement and analysis of the overnight small package shipping environment for Federal Express and United Parcel Service. Journal of Testing and Evaluation ASTM 1996; 24(4): 205–211.
8. Singh SP, Burgess G, Hays Z. Measurement and analysis of the UPS ground shipping environment for large and heavy packages. Journal of Testing and Evaluation ASTM 2001; 29(1).
9. Newsham MD, Pierce S, Singh SP. Distribution, parcel labels pose challenges for drop orientation. Packaging Technology and Engineering 1999; 8(4): 31– 33.
10. Singh P, Burgess G, Singh J. Measurement and analysis of the small and light-weight parcel shipping
environment. Journal of Testing and Evaluation ASTM 2004; 32(5).
11. Singh P, Burgess G, Singh J. Measurement and analysis of the second-day air small and light-weight package shipping environment within Federal Express. Packaging Technology and Science 2004; 17: 119–127.
12. Singh P, Burgess G, Singh J, Kremer M. Measurement and analysis of the next-day air shipping environment for mid-sized and lightweight packages for DHL, FedEx and United Parcel Service. Packaging Technology and Science 2006; 19: 227–235.
13. Singh J, Singh SP, Burgess G, Saha K. Measurement, analysis and comparison of the parcel shipping shock and drop environment of United States Postal Service with commercial carriers. Journal of Testing and Evaluation, MS #JTE100787-06 2007; 35(4).
14. Singh J, Singh SP, Voss T, Saha K. A study of the effect of pictorial markings and warning labels on handling of packages in the DHL single parcel environment. Packaging Technology and Science, PTS-07-0029, In Print. Published online in Wiley InterScience (http://www.interscience.wiley.com). DOI: 10.1002/pts.800.
15. Sheehan RL, Singh SP. Analysis techniques for package distribution environment data. Test Engineering and Management 1997; August: 18–20.