Transportation Characteristics and Needs of Forest Products Industries Using Eastern Washington...
39
Transportation Characteristics and Needs of Forest Products Industries Using Eastern Washington Highways Part 4: Commercial Shipments EWITS Research Report Number 17 May 1997 by Lynn C. Alderson, Economic Research Assistant Washington State University Department of Agricultural Economics in cooperation with Kenneth L. Casavant, EWITS Project Director Washington State University Department of Agricultural Economics 101 Hulbert Hall Pullman, WA 99164-6210 (509) 335-1608
Transcript of Transportation Characteristics and Needs of Forest Products Industries Using Eastern Washington...

Transportation Characteristics and Needs of Forest Products Industries
Using Eastern Washington Highways Part 4: Commercial Shipments
EWITS Research Report Number 17 May 1997
by
Lynn C. Alderson, Economic Research Assistant Washington State University
Department of Agricultural Economics
in cooperation with
Kenneth L. Casavant, EWITS Project Director Washington State University
Department of Agricultural Economics 101 Hulbert Hall
Pullman, WA 99164-6210 (509) 335-1608

EWITS Research Report: Background and Purpose
This is the seventeenth of a series of reports prepared from the Eastern Washington Intermodal Transportation Study (EWITS). The reports prepared as a part of this study provide information to help shape the multimodal network necessary for the efficient movement of both freight and people into the next century. EWITS is a six-year study funded jointly by the Federal government and the Washington State Department of Transportation as a part of the Intermodal Surface Transportation Efficiency Act of 1991. Dr. Ken Casavant of Washington State University is Director of the study. A state-level Steering Committee provides overall direction pertaining to the design and implementation of the project. The Steering Committee includes Jerry Lenzi, Chair and Regional Administrator (WSDOT, Eastern Region); Richard Larson, Regional Administrator (WSDOT, South Central Region); Don Senn, Regional Administrator (WSDOT, North Central Region); Charles Howard (WSDOT, Planning Manager), and Eric Berger, Executive Director, County Road Administration Board. Pat Patterson represents the Washington State Transportation Commission on the Steering Committee. An Advisory Committee with representation from a broad range of transportation interest groups also provides guidance to the study. The following are key goals and objectives for the Eastern Washington Intermodal Transportation Study:
• Facilitate existing regional and state-wide transportation planning efforts.
• Forecast future freight and passenger transportation service needs for eastern Washington.
• Identify gaps in eastern Washington’s current transportation infrastructure.
• Pinpoint transportation system improvement options critical to economic
competitiveness and mobility within eastern Washington. For additional information about the Eastern Washington Intermodal Transportation Study or this report, please contact Ken Casavant at the following address:
Ken Casavant, Project Director Department of Agricultural Economics
Washington State University Pullman, WA 99164-6210
(509) 335-1608
ACKNOWLEDGMENT: Sincere appreciation is given to the many people who either participated in the survey or took the time to explain pertinent information regarding the industry. Their efforts have helped to increase this project’s usefulness. Specific individuals are identified in Appendix A. Helpful reviews of this manuscript were received from Jerry Lenzi, Ashley Probart, and Fred Suter.

DISCLAIMER
The contents of this report reflect the views of the author, who is responsible for the facts and accuracy the data presented herein. The contents do not necessarily reflect the official views or policies of the Washington State Department of Transportation or the Federal Highway Administration. This report does not constitute a standard, specification or regulation.
PREVIOUS EWITS REPORTS NOW AVAILABLE
1. Gillis, William R. and Kenneth L. Casavant. “Linking Transportation System Improvements to New Business Development in Eastern Washington.” EWITS Research Report Number 1. February 1994.
2. Gillis, William R. and Kenneth L. Casavant. “Lessons from Eastern
Washington: State Route Mainstreets, Bypass Routes and Economic Development in Small Towns .” EWITS Research Report Number 2. February 1994.
3. Gillis, William R. and Kenneth L. Casavant. “Washington State Freight Truck
Origin and Destination Study: Methods, Procedures, and Data Dictionary.” EWITS Research Report Number 3. December 1994.
4. Gillis, William R. and Kenneth L. Casavant. “Major Generators of Traffic on
U.S. 395 North of Spokane: Including Freight Trucks and Passenger Vehicles Crossing the International Border.” EWITS Research Report Number 4. January 1995.
5. Newkirk, Jonathan, Ken Eriksen, and Kenneth L. Casavant. “Transportation
Characteristics of Wheat and Barley Shipments on Haul Roads To and From Elevators in Eastern Washington.” EWITS Research Report Number 5. March 1995.
6. Jessup, Eric and Kenneth L. Casavant. “A Quantitative Estimate of Eastern
Washington Annual Haul Road Needs for Wheat and Barley Movement.” EWITS Research Report Number 6. March 1995.
7. Gillis, William R., Emily Gruss Gillis, and Kenneth L. Casavant.
“Transportation Needs of Eastern Washington Fruit, Vegetable and Hay Industries.” EWITS Research Report Number 7. March 1995.
8. Casavant, Kenneth L. and William R. Gillis. “Importance of U.S. 395 Corridor
For Local and Regional Commerce in South Central Washington.” EWITS Research Report Number 8. April 1995.

9. Gillis, William R., Eric L. Jessup, and Kenneth L. Casavant. “Movement of Freight on Washington’s Highways: A Statewide Origin and Destination Study.” EWITS Report Number 9, November 1995.
10. Chase, Robert A. and Kenneth L. Casavant. “Eastern Washington Transport-
Oriented Input-Output Study: Technical Report.” EWITS Research Report Number 10. March 1996.
11. Chase, Robert A. and Kenneth L. Casavant. “The Economic Contribution of
Transport Industries to Eastern Washington.” EWITS Report Number 11. April 1996.
12. Lee, Nancy S. And Kenneth L. Casavant. “Waterborne Commerce on the
Columbia-Snake.” EWITS Report Number 12. October 1996. 13. Alderson, Lynn C., Kenneth L. Casavant and Eric Jessup. “Transportation
Characteristics and Needs of Forest Products Industries Using Eastern Washington Highways, Part 1: Economic Structure of the Industry.” EWITS Research Report Number 13. January 1997.
14. Eriksen, Ken and Kenneth L. Casavant. “Impact of North American Free
Trade Agreement (NAFTA) on Washington Highways—Part 1: Commodity and Corridor Projections.” EWITS Research Report Number 14. January 1997.
15. Alderson, Lynn C. and Kenneth L. Casavant. “Transportation Characteristics
and Needs of Forest Products Industries Using Eastern Washington Highways, Part 2: Movements of Raw Logs.” EWITS Research Report Number 15. February 1997.
16. Alderson, Lynn C. and Kenneth L. Casavant. “Transportation Characteristics
and Needs of Forest Products Industries Using Eastern Washington Highways, Part 3: Shipments from Mills.” EWITS Research Report Number 16. May 1997.
PREVIOUS EWITS WORKING PAPER SERIES NOW AVAILABLE
1. Lee, Nancy and Kenneth L. Casavant. “Grain Receipts at Columbia River Grain Terminals.” EWITS Working Paper #1. March 1996.
2. Lenzi, Jerry, Eric Jessup, and Kenneth L. Casavant. “Prospective Estimates
for Road Impacts in Eastern Washington from a Drawdown of the Lower Snake River.” EWITS Working Paper #2. March 1996.
3. Ellis, John, Eric Jessup and Kenneth L. Casavant. “A GIS and Transportation
Optimization Model Approach to Determining Highway and Rural Road Commodity Flows.” EWITS Working Mills Paper #3. March 1996.
4. Painter, Kate and Kenneth L. Casavant. “A Comparison of Canadian Versus
All Truck Movements in Washington State with a Special Emphasis on Grain Truck Movements.” EWITS Working Paper #4. March 1996.
5. Jessup, Eric, John Ellis, and Kenneth L. Casavant. “Estimating the Value of
Rail Car Accessibility for Grain Shipments: A GIS Approach.” EWITS Working Paper #5. April 1996.
6. Painter, Kate and Kenneth L. Casavant. “Truck Movement Characteristics on
Selected Truck Routes in Washington State.” EWITS Working Paper #6. August 1996.
7. Lee, Nancy S. and Kenneth L. Casavant. “Grain Receipts at Columbia River
Grain Terminals: 1980-81 to 1995-95.” EWITS Working Paper #7. January 1997.
8. Jessup, Eric and Kenneth L. Casavant. “Economic Evaluation of Grain
Shipment Alternatives: A Case Study of the Coulee City and Palouse River Railroad.” EWITS Working Paper #8. March 1997.

Table of Contents Executive Summary .................................................................................................................... 1 Introduction ................................................................................................................................. 2 Study Area and Approach .......................................................................................................... 3 Data Sources .................................................................................................................... 3 Methodology...................................................................................................................... 3 Commercial Transport................................................................................................................ 6 Marketing and Transportation Characteristics of Commercial Truckers .............................. 7 Location and Size.............................................................................................................. 7 Commercial Shippers Origin ..................................................................................................... 9 Hogfuel, Woodchips, and Sawdust ................................................................................... 9 Plywood-Lumber-Post, Poles, Pilings and Other .............................................................. 9 Commercial Shipment Destination ......................................................................................... 12 Hogfuel, Woodchips, and Sawdust ................................................................................. 12 Plywood-Lumber-Post, Poles, Pilings and Other ............................................................ 12 Timing of Commercial Shipments ........................................................................................... 15 Hogfuel, Woodchips, and Sawdust ................................................................................. 15 Plywood-Lumber-Post, Poles, Pilings and Other ............................................................ 15 Most Common Routes by Respondents ................................................................................. 17 Raw Log .......................................................................................................................... 17 Hogfuel, Woodchips, and Sawdust ................................................................................. 17 Plywood-Lumber-Post, Poles, Pilings and Other ............................................................ 17 Truck Movements ..................................................................................................................... 20 Hogfuel, Woodchips, and Sawdust ................................................................................. 20 Plywood-Lumber-Post, Poles, Pilings and Other ............................................................ 20 Transportation Problems ......................................................................................................... 21 Rate Structure ........................................................................................................................... 23 Summary.................................................................................................................................... 24 References................................................................................................................................. 25 Appendix A: Study Contacts................................................................................................... 26 Appendix B: Commercial Survey Questionnaire .................................................................. 28

List of Tables Table 1 Transportation Problems for Commercial ................................................... 22 Table 2 Rate Structures Utilized by Commercial ..................................................... 23
List of Figures Figure 1 Land Ownership by County in Eastern Washington ..................................... 4 Figure 2 State and Federal Highways Utilized in Eastern Washington....................... 5 Figure 3 Commercial Shippers Locations, Two State Inland Region.......................... 7
List of Charts Chart 1 Total Volume of Commercial Shipments Reported....................................... 8 Chart 2 Origin of Hogfuel, Woodchips and Sawdust Products by Commercial
Shippers ..................................................................................................... 10 Chart 3 Origin of Post, Poles, Pilings, and Other Products by Commercial Shippers ..................................................................................................... 11 Chart 4 Hogfuel, Woodchips, and Sawdust Products Destination, Commercial Transporters ............................................................................................... 13 Chart 5 Plywood, Lumber, Post, Poles, Pilings and Other Products Destinations, Commercial Transporters ........................................................................... 14 Chart 6 Seasonal Variation of Hogfuel, Woodchips, and Sawdust Commercial Transport .................................................................................................... 16 Chart 7 Seasonal Variation in Plywood, Lumber, Post, Poles, Pilings and Other Transportation ............................................................................................ 16 Chart 8 Highways Utilized by Commercial Firms for Movements of Hogfuel, Woodchips, and Sawdust Products ............................................................ 18 Chart 9 Highways Utilized by Commercial Firms for Plywood, Lumber, Post, and Other Poles, Pilings Products .............................................................. 19 Chart 10 Truck Movements of Hogfuel, Woodchips, and Sawdust Products ............ 20 Chart 11 Truck Movements of Plywood, Lumber, Post, Poles, Pilings and Other Products .................................................................................... 21

Executive Summary
• The purpose of this report is to identify the various characteristics that affect the movement of forest products in eastern Washington to their respective markets. Questions asked were: What highways are used and in what proportion to one another? What types of problems impede movements to market? Where is the product origin? Where are their respective markets? Are shipments influenced by roadway restrictions and/or seasonal change?
• Hogfuels, woodchips and sawdust (HWS) products comprised 99% (1,254,046 tons)
of the movements reported. • Major origins of HWS products moved on eastern Washington highways were from
two sources outside Washington: Idaho 452,610 tons (36%) and Oregon 366,225 tons (29%).
• Lewiston, Idaho/Clarkston, Washington, eastern Washington and Canada were the
three primary destinations for HWS products. Tonnage of 546,413 (44%), 450,083 (36%) and 133,322 (11%) per annum was reported, respectively.
• Most common routes used in Eastern Washington are US 195, US 2, SR 20, US 395
and I-82. These movements are fewest from November to February and almost double in the summer months.
• The most important transportation problems for the commercial firms were:
available drivers; short corners in cities (turning radius corners), entrances and exits from mills and some mill yards; rates; weight restrictions; and lack of turn outs.
1

Introduction Transportation issues involving forest product industries embody a varied, often complex number of business enterprises. Several natural product divisions were apparent throughout the course of this study of the industry and its needs, thus making each segment unique in its characteristics and needs. For that reason, this overall study is being reported in a series of five written reports, as follows: Part 1: Economic Structure of the Industry The first publication gives a broad background on the economic structure of the wood product industry. General location, proportion of timberland, and Washington State’s role in the Western Region of the United States are discussed in detail as a prelude to examining how and where products move to market. Part 2: Movement of Raw Logs Raw log transportation issues are set apart from the remainder of the industry. This report deals exclusively on a survey of the shipment of raw logs, from the woods, to their designated markets. Inherent characteristics of raw log movements, such as truck configurations, roads utilized, seasonal use and problem areas are some of the items discussed. Part 3: Shipments from Mills Transportation characteristics of wood products leaving the mill are identified in this report. Mode of transportation, origin, destination, problems encountered, rate structure, types of commodity shipped and inside/outside shipping sources receive attention. Part 4: Commercial Movements Shipment by sources outside of the forest industry processing firms occurs by commercial truckers. These firms tailor their equipment to meet the demand of this type of transportation need. Market characteristics, origin, destination, rate structure, roads used and timing of shipments are a few of the items discussed. Part 5: Road Usage and Characteristics The location and characteristics of road usage determined in the three industry surveys will be summarized in this final report. Implications for road investments are offered.
2

Study Area and Approach This study investigated the importance of eastern Washington highway systems to shipments from mills. Included in the study area are the counties of Okanogan, Ferry, Stevens, Pend Oreille, Spokane, Lincoln, Whitman, Asotin, Garfield, Columbia, and Walla Walla in the state of Washington and the states of Idaho and eastern Oregon. Figure 1 indicates the counties commonly considered in the eastern Washington region. The overall goal is to determine origin, destination, seasonality, and problems encountered by these truck movements. Specific objectives are to:
1) develop information on the wood products industry in eastern Washington; 2) provide transportation characteristics and needs of truck shipments from mills.
Data Sources The intent of this study is to determine where and when shipments of forest products leaving mills utilize eastern Washington highways and to identify problems that truckers encounter. Sources were obtained from telephone books, business associations, Washington, Idaho, Montana, and Oregon Business Directories, forest product directories and contacts via prior business affiliation. Published research reports were reviewed and utilized in preparing this analysis. Methodology Accurate representation of eastern Washington freight truck movements of forest products is critical to the validity of this report. A mail survey questionnaire was planned, tested and mailed to firms who transported paper, lumber, consumer products, shake and shingles, wood residuals, post, poles, pilings and other commodities. An effective data management system helps reduce errors due to collection and data entry. Mail surveys create the potential for three sources of error. First is non-response error, the main weakness of a mail survey. Second, transporters may provide inaccurate or misleading information to the questions. Third, surveys are limited in questions that can be asked.
3
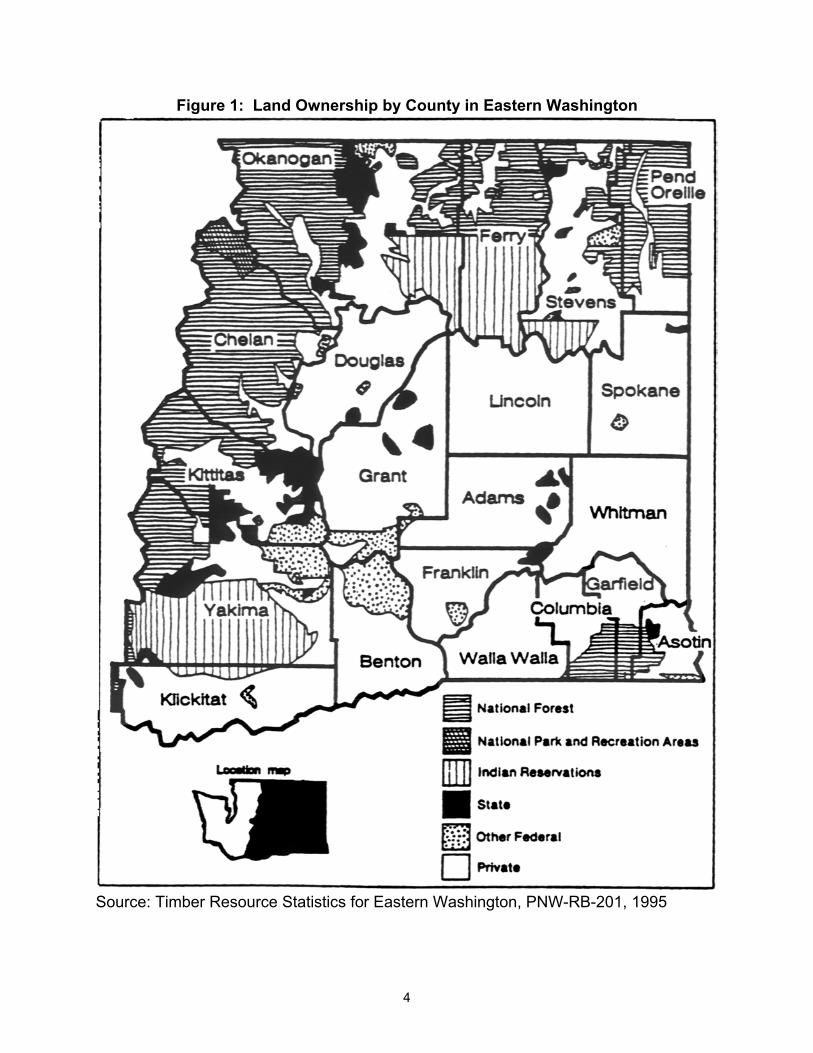
Figure 1: Land Ownership by County in Eastern Washington
Source: Timber Resource Statistics for Eastern Washington, PNW-RB-201, 1995
4
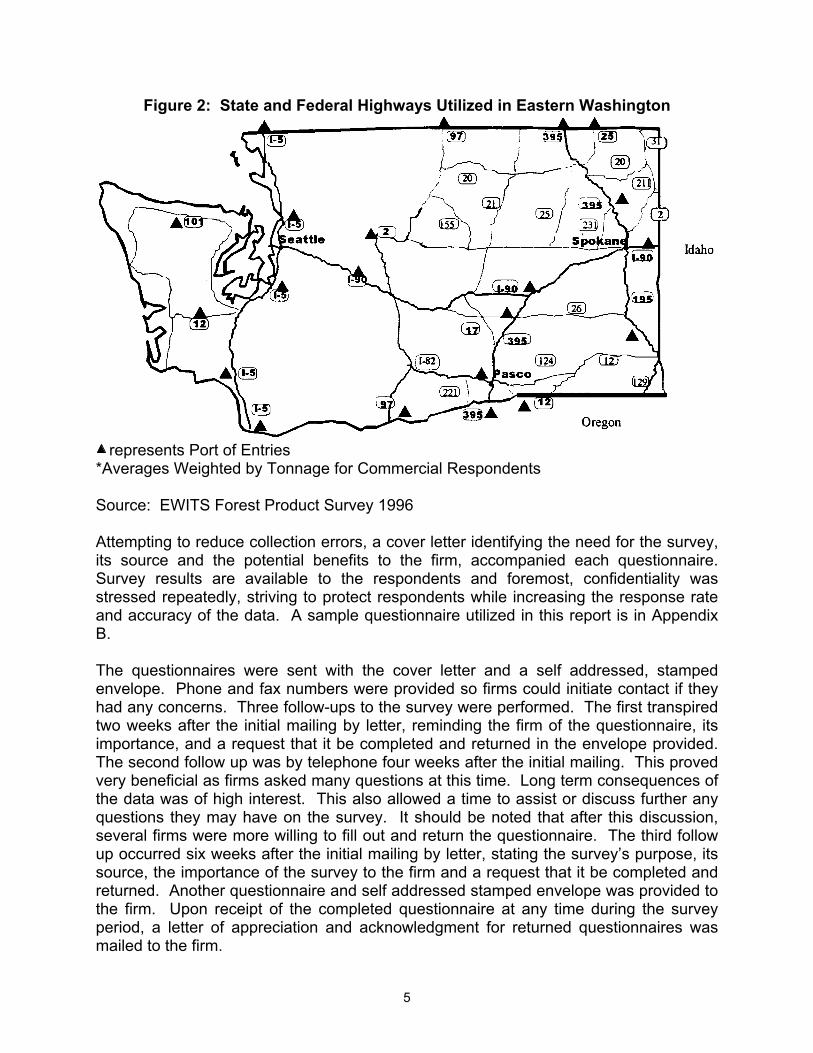
Figure 2: State and Federal Highways Utilized in Eastern Washington
represents Port of Entries *Averages Weighted by Tonnage for Commercial Respondents Source: EWITS Forest Product Survey 1996 Attempting to reduce collection errors, a cover letter identifying the need for the survey, its source and the potential benefits to the firm, accompanied each questionnaire. Survey results are available to the respondents and foremost, confidentiality was stressed repeatedly, striving to protect respondents while increasing the response rate and accuracy of the data. A sample questionnaire utilized in this report is in Appendix B. The questionnaires were sent with the cover letter and a self addressed, stamped envelope. Phone and fax numbers were provided so firms could initiate contact if they had any concerns. Three follow-ups to the survey were performed. The first transpired two weeks after the initial mailing by letter, reminding the firm of the questionnaire, its importance, and a request that it be completed and returned in the envelope provided. The second follow up was by telephone four weeks after the initial mailing. This proved very beneficial as firms asked many questions at this time. Long term consequences of the data was of high interest. This also allowed a time to assist or discuss further any questions they may have on the survey. It should be noted that after this discussion, several firms were more willing to fill out and return the questionnaire. The third follow up occurred six weeks after the initial mailing by letter, stating the survey’s purpose, its source, the importance of the survey to the firm and a request that it be completed and returned. Another questionnaire and self addressed stamped envelope was provided to the firm. Upon receipt of the completed questionnaire at any time during the survey period, a letter of appreciation and acknowledgment for returned questionnaires was mailed to the firm.
5
A data integrity review was performed with each survey. Any discrepancies were followed up by a telephone discussion to verify information provided. A sample grid was provided with the questionnaire in an attempt to minimize the potential for confusion in question 7, which proved beneficial in most cases. Problems were minor and follow up by phone rectified those encountered. Microsoft Excel, PowerPoint and Word software were utilized for analyzing and reporting the results of the collected data. These programs are menu driven and very compatible when importing and/or exporting charts, tables and maps, etc. Excel provides expansive worksheets for these data and was the primary database for the project. Original data from each question are entered on a worksheet, the statistical analysis of each question was performed on an adjacent worksheet and saved as such. Volume by weight for the year is inherent in all survey questions except for those on transportation problems and rate structure. Where repetition occurs, such as volume, the paste link function is utilized. This accomplished two things: data would not be transposed incorrectly, and any changes to the original data would carry through to any link, thus saving much time in the analysis. Integrity checks were performed on data entered in Excel worksheets. Random checks were made on computations of the data. The results of this analysis was utilized in the written presentation of this report. One methodological issue for this survey was that, during the course of this survey, four mills permanently closed and one mill’s production was curtailed. Accordingly, it was uncertain as to how this might affect the survey. Although the number of firms responding was small, it is considered representative of the population, which is also small. The remainder of this report presents findings on origin and destination of products shipped, timing of shipments, transportation problems, highways utilized to reach markets and rate structure.
Commercial Transport
Commercial truckers for forest products locate in areas where major forest production activities occur. Saint Maries, Lewiston and Post Falls in the state of Idaho, and Kettle Falls, Deer Park, Usk, Wenatchee and Yakima in Washington are the areas most commonly occupied by commercial shippers, see Figure 3. These firms have chosen to transport a selective product and have designed their equipment and other assets for the primary purpose of transporting wood products. Some firms have chosen to transport only one type of wood commodity, such as wood residuals, whereas others may transport all product types. Primary highways used in eastern Washington were US 195, US 395, US 2, I 82, and SR 20 (Figure 2).
6

Marketing and Transportation Characteristics of Commercial Truckers
Location and Size The number of commercial truckers transporting wood products is small (less than 15) and not much is known about this specialty transporter. Approximately 13 firms were identified as the population, of which 6 responded to the survey, thus a 46% response rate was achieved, (Figure 3). Commercial shippers are found in the same areas where forest timberland and mills are located. Likewise, transportation firms are found in clusters, usually 2 or 3 per area. Shipping respondents were from two states, Washington and Idaho. An accumulated total of 1,266,696 annual tons of wood products in this survey (about 40% of total movements in eastern Washington) were moved on eastern Washington highways. Although the number of firms responding to the survey was small, so was the population in eastern Washington. Several firms responding are volume leaders in the industry and provided very valuable data and insight to the survey.
Figure 3: Commercial Shippers Locations, Two State Inland Region
Source: EWITS Forest Product Survey 1996 These data indicate that commercial transporters are very competitive and selective on the commodity transported. These characteristics will be discussed in more detail in the following sections. The average firm shipped 211,116 tons per annum. The total range of firms reporting tonnage was from 200 tons to 728,551 tons annually. Two firms accounted for 92% (1,170,526 tons) of the total annual tonnage. Most firms are family owned and operated businesses.
7

Product categories were divided into three groups, as was done in the other studies: raw logs; hogfuel, woodchips, and sawdust (a.k.a. wood residuals); and post, poles, pilings and other products. Commercial shippers reported an annual volume of 1,266,696 tons being shipped. Of this 1,254,046 tons (99%) of movements was in wood residual products as reported by the six firms (Chart 1). No raw log transportation was reported and only 12,650 tons (1%) of plywood, lumber, post, poles, pilings and other (PLPO) products by volume was.
Chart 1: Total Volume of Commercial Shipments Reported*
0%
99%
1%
0%
20%
40%
60%
80%
100%
Percent
Raw Logs Hogfuel-Woodchips-
Sawdust
Plywood-Lumber-Post, Poles, and
Other
*Averages Weighted by Tonnage for Commercial Shippers Source: EWITS Forest Product Survey 1996
8
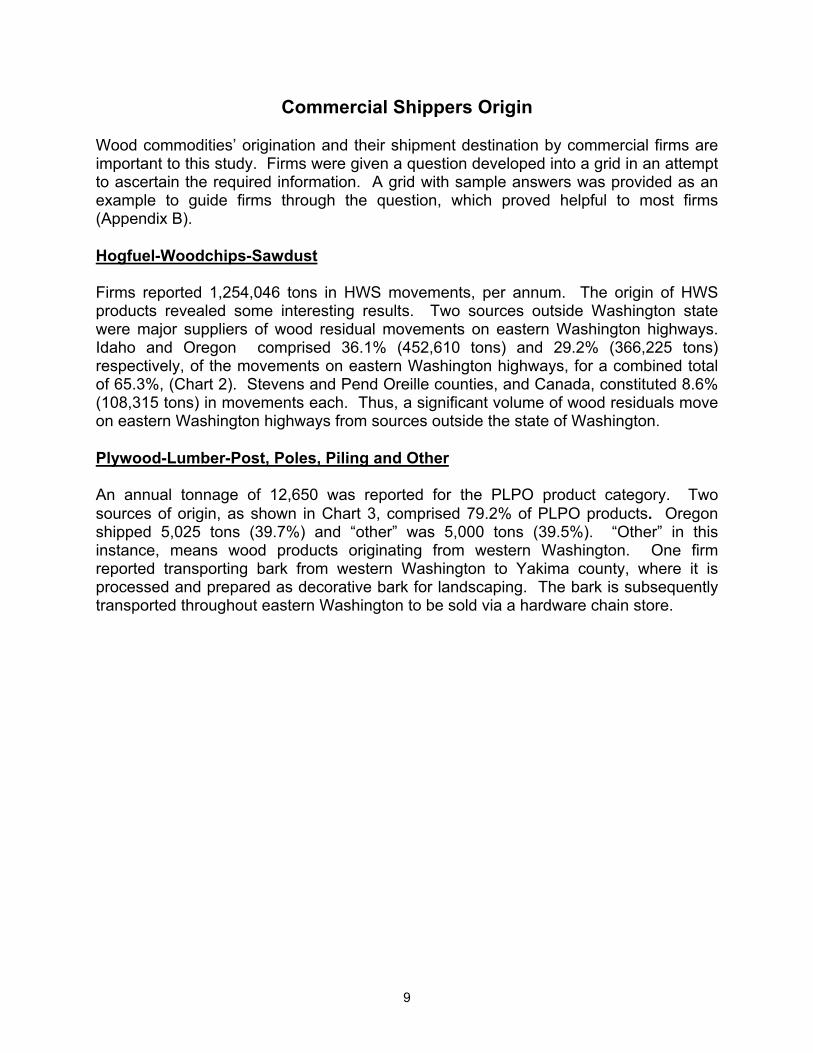
Commercial Shippers Origin Wood commodities’ origination and their shipment destination by commercial firms are important to this study. Firms were given a question developed into a grid in an attempt to ascertain the required information. A grid with sample answers was provided as an example to guide firms through the question, which proved helpful to most firms (Appendix B). Hogfuel-Woodchips-Sawdust Firms reported 1,254,046 tons in HWS movements, per annum. The origin of HWS products revealed some interesting results. Two sources outside Washington state were major suppliers of wood residual movements on eastern Washington highways. Idaho and Oregon comprised 36.1% (452,610 tons) and 29.2% (366,225 tons) respectively, of the movements on eastern Washington highways, for a combined total of 65.3%, (Chart 2). Stevens and Pend Oreille counties, and Canada, constituted 8.6% (108,315 tons) in movements each. Thus, a significant volume of wood residuals move on eastern Washington highways from sources outside the state of Washington. Plywood-Lumber-Post, Poles, Piling and Other An annual tonnage of 12,650 was reported for the PLPO product category. Two sources of origin, as shown in Chart 3, comprised 79.2% of PLPO products. Oregon shipped 5,025 tons (39.7%) and “other” was 5,000 tons (39.5%). “Other” in this instance, means wood products originating from western Washington. One firm reported transporting bark from western Washington to Yakima county, where it is processed and prepared as decorative bark for landscaping. The bark is subsequently transported throughout eastern Washington to be sold via a hardware chain store.
9

Chart 2: Origin of Hogfuel, Woodchips and Sawdust Products by Commercial Shippers*
1.6%
8.6%
8.6%
0.0%
0.0% 36.1%
7.0%
29.2%
0.2%
8.6%
0% 5% 10% 15% 20% 25% 30% 35% 40%
Percent
Ferry
Stevens
Pend Oreille
Spokane
Okanogan
Idaho
Montana
Oregon
Other
Canada
*Averages Weighted by Tonnage for Commercial Shippers Source: EWITS Forest Product Survey 1996
10

Chart 3: Origin of Post, Poles, Pilings, and Other Products by Commercial Shippers*
6.1%
0.9%
0.5%
0.4%
5.7%
0.6%
0.6% 39.7%
39.5%6.1%
0% 5% 10% 15% 20% 25% 30% 35% 40%
Percent
Ferry
Stevens
Pend Oreille
Spokane
Okanogan
Idaho
Montana
Oregon
**Other
Canada
*Averages Weighted by Tonnage for Commercial Shippers **Others are Western Washington Shipments Source: EWITS Forest Product Survey 1996
11
Commercial Shipment Destination
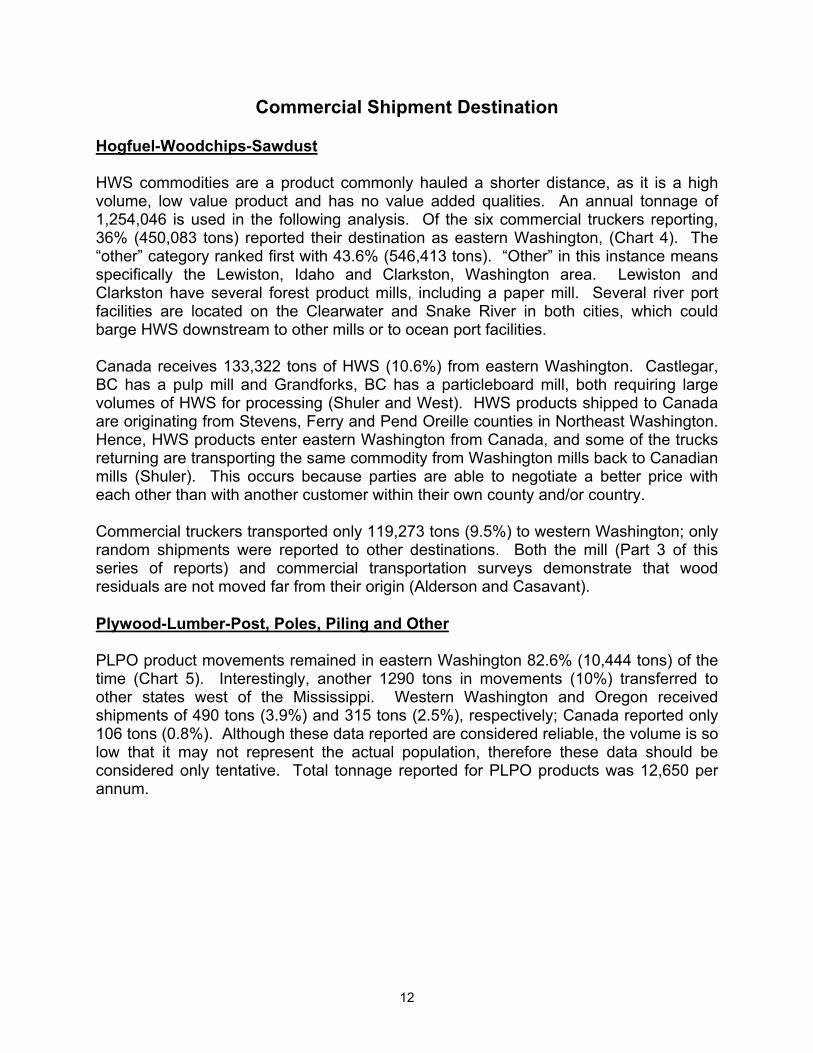
Hogfuel-Woodchips-Sawdust HWS commodities are a product commonly hauled a shorter distance, as it is a high volume, low value product and has no value added qualities. An annual tonnage of 1,254,046 is used in the following analysis. Of the six commercial truckers reporting, 36% (450,083 tons) reported their destination as eastern Washington, (Chart 4). The “other” category ranked first with 43.6% (546,413 tons). “Other” in this instance means specifically the Lewiston, Idaho and Clarkston, Washington area. Lewiston and Clarkston have several forest product mills, including a paper mill. Several river port facilities are located on the Clearwater and Snake River in both cities, which could barge HWS downstream to other mills or to ocean port facilities. Canada receives 133,322 tons of HWS (10.6%) from eastern Washington. Castlegar, BC has a pulp mill and Grandforks, BC has a particleboard mill, both requiring large volumes of HWS for processing (Shuler and West). HWS products shipped to Canada are originating from Stevens, Ferry and Pend Oreille counties in Northeast Washington. Hence, HWS products enter eastern Washington from Canada, and some of the trucks returning are transporting the same commodity from Washington mills back to Canadian mills (Shuler). This occurs because parties are able to negotiate a better price with each other than with another customer within their own county and/or country. Commercial truckers transported only 119,273 tons (9.5%) to western Washington; only random shipments were reported to other destinations. Both the mill (Part 3 of this series of reports) and commercial transportation surveys demonstrate that wood residuals are not moved far from their origin (Alderson and Casavant). Plywood-Lumber-Post, Poles, Piling and Other PLPO product movements remained in eastern Washington 82.6% (10,444 tons) of the time (Chart 5). Interestingly, another 1290 tons in movements (10%) transferred to other states west of the Mississippi. Western Washington and Oregon received shipments of 490 tons (3.9%) and 315 tons (2.5%), respectively; Canada reported only 106 tons (0.8%). Although these data reported are considered reliable, the volume is so low that it may not represent the actual population, therefore these data should be considered only tentative. Total tonnage reported for PLPO products was 12,650 per annum.
12

Chart 4: Hogfuel, Woodchips, and Sawdust Products Destination, Commercial Transporters*
35.9%
9.5%
0.1%
0.0%
0.3%
0.0%
10.6%
43.6%
0% 10% 20% 30% 40% 50%
Percent
EasternWashington
W. WA (includesWA ocean ports)
Oregon (includesOR ocean ports)
California
Other states W. ofMississippi
States E. ofMississippi
Canada
Other
*Averages Weighted by Tonnage for Commercial Shippers **Other includes Lewiston and Clarkston Destinations Source: EWITS Forest Product Survey 1996
13

Chart 5: Plywood, Lumber Post, Poles, Pilings and Other Products Destination, Commercial Transporters*
82.6%
3.9%
2.5%
0.0%
10.2%
0.0%
0.8%
0.0%
0% 20% 40% 60% 80% 100%
Percent
EasternWashington
W. WA (includesWA ocean ports)
Oregon (includesOR ocean ports)
California
Other states W. ofMississippi
States E. ofMississippi
Canada
Other
*Averages Weighted by Tonnage for Commercial Shippers Source: EWITS Forest Product Survey 1996
14

Timing of Commercial Shipments Hogfuel-Woodchips-Sawdust Seasonal variation characterized the flow of HWS products, resulting in a 13% to 22% range as illustrated in Chart 6. From May to October, a six-month period, shippers transported 59% (740,721 tons) of HWS products. This six-month period represents the most stable time frame for commercial shippers. After July-August (270,659 tons), a 3% decrease begins for the September-October period, resulting in movements at 18.7% (235,031 tons). A 6% decrease (72,855 tons) occurs from September-October to November-December, comprising 12.9% (162,176 tons) of the movements. November-December and January-February represent the lowest shipment periods for the year at 162,176 tons (12.9%) and 156,960 tons (12.5%), respectively. March-April displays a slight increase of 3%, resulting in 194,187 tons (15.5%) of total shipments for that period. May-June begins a period of more stability with 18.7% (235,031 tons) of movements. Not all wood residuals come directly from mills. Wood residuals are also produced in the woods, usually near the landing site of a harvested area. Access to these sites is diminished during spring break up, as roadways are restricted or closed. This probably explains the variation of movements in HWS products for commercial shippers. Plywood-Lumber-Post, Poles, Pilings and Other PLPO shipments show more stability in movements than HWS products, with a range of 15% to 18%, (Chart 7). From May to December movements are stable with 69.4% (8,774 tons) of the shipments in a 8-month period. The first decline in movements for these transporters occurs in January-February, with a 2% decrease, resulting in 1,931 tons (15.3%) for the two-month period. March-April remains at 15.3 % (1,941 tons) with an increase of 2% (265 tons) occurring in the May-June period (2,206 tons). In total, 12,646 annual tons was used for this analysis.
15

Chart 6: Seasonal Variations in Hogfuel, Woodchips, and Sawdust Commercial Transport*
January-February
12.5%
March-April15.5%
May-June18.7%
July-August21.6%
September-October18.7%
November-December
12.9%
*Averages Weighted by Tonnage for Commercial Shippers
Source: EWITS Forest Product Survey 1996
Chart 7: Seasonal Variations in Plywood, Lumber Post, Poles, Pilings and Other Commercial Transport*
July-August17.6%
September-October17.4%
November-December
17.0%
May-June17.4%
March-April15.3% January-
February15.3%
*Averages Weighted by Tonnage for Commercial Shippers
Source: EWITS Forest Product Survey 1996
16

Most Common Routes by Respondents Raw Log Some commercial shippers do transport raw logs, however those firms responding to the survey did not acknowledge any movements. Movement of raw logs is reported in Part 2 of this series of reports, reference should be made to that section as needed (Alderson and Casavant). A map displaying eastern Washington highways may be referred to on page 4, Figure 2. Hogfuel-Woodchips-Sawdust Unlike the raw log transporters whose route can change daily, commercial transporters use specific highways to move their products without much variation. Generally, commercial transporters hauling wood residuals can make a round trip in one shift. Market destinations thus, are more local and are discussed in further detail in a following section. Firms were asked to identify the highways utilized most frequently, and the occurrence of that use, firms reported 1,254,046 tons per annum. U.S. 195, US 2, and SR 20 were used most often, with movements of 741,002 tons (59%), 146,615 tons (11.7%), and 105,286 tons (8.4%) as shown in Chart 8. US 395 ranked fourth with 97,736 tons (7.8%). SR 211 and SR 31 tied for fifth and sixth with each reporting 73,760 tons each (5.9%). U.S. 395 placed lower than had been anticipated. However, this may be due to the location of the transporters from areas not near U.S. 395. Readers may want to refer to EWITS No. 4, a report on “Major Generators of Traffic on U.S. 395 North of Spokane” (Gillis and Casavant). The EWITS No. 4 study determined 62% of the average daily cargo tonnage transported through the Deer Park Southbound scale house on US 395 was a forest product. Plywood-Lumber-Post, Poles, Piling and Other Six prominent highways identified by PLPO transporters were I-82 (3100 tons), I-90 (3,097 tons), SR 211 (1,800 tons), US 12 (1,340 tons), SR22 (1,300 tons), and SR 14 (860 tons), (Chart 9). These six highways constitute 91% (11,497 tons) of the movements of PLPO products.
17
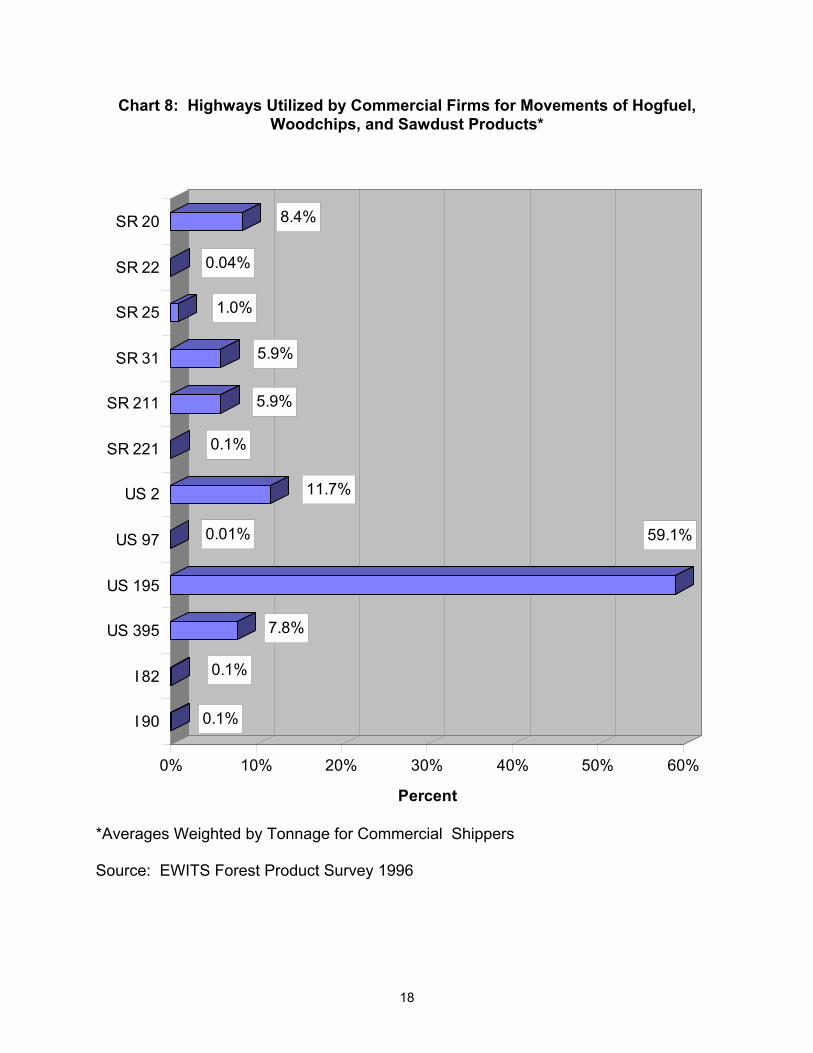
Chart 8: Highways Utilized by Commercial Firms for Movements of Hogfuel, Woodchips, and Sawdust Products*
0.1%
0.1%
7.8%
59.1%0.01%
11.7%
0.1%
5.9%
5.9%
1.0%
0.04%
8.4%
0% 10% 20% 30% 40% 50% 60%
Percent
I 90
I 82
US 395
US 195
US 97
US 2
SR 221
SR 211
SR 31
SR 25
SR 22
SR 20
*Averages Weighted by Tonnage for Commercial Shippers Source: EWITS Forest Product Survey 1996
18

Chart 9: Highways Utilized by Commercial Firms for Movements of Plywood, Lumber Post, Poles, Pilings and Other Products*
24.5%
24.5%
0.9%
0.4%
0.5%
10.6%
3.2%
0.8%
14.2%
0.4%
0.8%
10.3%
2.1%
6.8%
0% 5% 10% 15% 20% 25% 30%
Percent
I-90
I-82
US 395
US 195
US 97
US 12
SR 281
SR 221
SR 211
SR 31
SR 28
SR 22
SR 20
SR 14
*Averages Weighted by Tonnage for Commercial Shippers Source: EWITS Forest Product Survey 1996
19

Truck Movements Commercial transporters were asked to identify the destinations of all truck movements, by the three different product categories. Destinations are an important characteristic of this study, as markets are identified for the respective products. Hogfuel-Woodchips-Sawdust Movement of HWS products by truck was only to final domestic destination, as displayed in Chart 10. Movements to river ports, ocean ports, and “other” were not reported. As mentioned earlier, Lewiston, Idaho and Clarkston, Washington received 39% of the volume of HWS products, (Chart 2). Even though several river ports are available in the Lewiston-Clarkston area, none were reported as being utilized, indicating that 1,254,046 tons (100%) of the HWS products are probably sent to mills in that area. Thus, movements are taken to a processing plant, regardless of which market or direction it is headed.
Chart 12: Truck Movements of Hogfuel, Woodchips, and Sawdust Products*
100%
0% 0% 0%
0%
20%
40%
60%
80%
100%
Percent
Truck toFinal
DomesticDestination
Truck toRiver Port
Truck toOcean Port
Other
*Averages Weighted by Tonnage for Commercial Shippers Source: EWITS Forest Product Survey 1996
20

Plywood-Lumber-Post, Poles, Piling and Other PLPO products also moved mostly truck to final domestic destination, as depicted in Chart 11. Only 450 tons (3.6%) were reported as moving to ocean ports. These ocean port movements would indicate some PLPO products are being exported to other countries.
Chart 11: Truck Movements of Plywood, Lumber, Post, Poles, Pilings and Other Products*
96.4%
0.0%3.6%
0.0%
0%
20%
40%
60%
80%
100%
Percent
Truck to FinalDomestic
Destination
Truck to RiverPort
Truck toOcean Port
Other
*Averages Weighted by Tonnage for Commercial Shippers Source: EWITS Forest Product Survey 1996
21

Transportation Problems To develop an understanding of transportation problems that commercial shippers face, a grid of different issues were designed to identify problems impeding their business. As in the other surveys, respondents were given four different choices of varying intensity: often, sometimes, seldom and never. The evaluation was by number of firms and the material was not weighted by volume. Transportation problems for the commercial shippers differed from that of raw log and mill businesses, with several issues being more pronounced for commercial shippers. Most notable was availability of drivers, which received the most attention with 83% of the firms having problems often and 17% sometimes, as shown in Table 1. Follow up phone discussions proved to be informative and useful. Commercial firms transporting forest products are generally located in rural areas where often more than one trucking firm is conducting business locally. These firms are competing for the same small supply reserve of drivers. Another factor is that the federal government recently put in place new requirements for those driving commercial vehicles. A new commercial drivers test was developed and anyone wishing to drive must take the test. One of the requirements is a physical, which some of the older drivers cannot pass. More stringent guidelines exist on vision, hearing, and blood pressure limitations. Random drug and alcohol testing has also been implemented, causing some drivers to exit the profession. Firms also have minimum qualifications of their own design: one is a minimum age which may be anywhere from 21 to 25 years of age; a minimum mileage or time driven, with some requiring no less than 2 years driving experience; and drivers must have a clean record and be insurable. Another requirement is that firms ship 24 hours a day thus, unusual working hours are expected of drivers. These conditions are all instrumental in further reducing the supply of available drivers (Shuler and Stellmon). Weight restrictions of roadways is a problem, often with 17% of the firms, and 50% sometimes, resulting in weight restrictions being a problem 67% of the time. This may be due to county roads and rural state highways rather than major state highways, as was identified in Part 2, Movements of Raw Logs in this series of reports (Alderson and Casavant). Drivers purport to have a different understanding of the bridge laws than the state, which causes some confusion (Stellmon). Another perceived problem is the DOT when weighing trucks, may not have a scale capable of accommodating the total truck and trailer length. Weight is then taken by the axles and is figured as an accumulated weight of the load, not an absolute weight. Thus, the driver believes they are within the weight boundaries but the state’s regulation prohibits the load and a ticket is issued. One firm stated that they repeatedly get tickets for being over weight, challenge it in court, the judge dismisses the case and yet they continue to get tickets (Anonymous, personal communications).
22

Table 1--Transportation Problems for Commercial Shippers Commercial Transport Problems Often Sometimes Seldom Never Total
Road Closures 0% 17% 67% 17% 100% Weight Restrictions 17% 50% 33% 0% 100% Rates 33% 33% 33% 0% 100% Permits 0% 50% 33% 17% 100% Short Corners 33% 50% 17% 0% 100% Available Drivers 83% 17% 0% 0% 100% Safety Issues 0% 17% 83% 0% 100% Bridge Laws 17% 0% 83% 0% 100% Lack of Turn Outs 33% 17% 50% 0% 100% Other 0% 0% 0% 0% 0% Source: EWITS Forest Product Survey 1996 Rates were a large concern, often with 33% of the firms and sometimes 33%, indicating an overall rate problem 66% of the time. Rates are discussed further in the following section. Short corners (turning radius concerns) was a serious concern with 33% often having a problem and 50% sometimes, resulting in 83% having short corner problems. Short corners for the commercial drivers are often confronted in towns, cities, entrances and exits from mills and in some mill yards. Likewise, lack of turnouts or passing lanes was another serious problems for firms, often for 33% and 17% sometimes. Drivers said they often get behind slower traffic, and due to congestion, do not have opportunities to pass. Another problem identified by firms at a lower level was permits 50% sometimes and 33% seldom. Overall 50% of the firms have a permit problem. Bridge laws were only a minor concern for commercial transporters as compared to that for raw logs and mills. For further detail on bridge law problems, refer to Part 2 Movements of Raw Logs of this series of reports on transport problems (Alderson and Casavant). Commercial shippers reported 17% had a problem often and 83% seldom did with bridge laws. As previously mentioned, the majority of commercial shippers transported 99% of the HWS movements; trailer design is fixed for HWS products, therefore bridge laws would not be much of a concern. Road closures affected only 17% of the businesses sometimes and 67% seldom. Firms generally access state highway entrances to mills and traverse the same, thereby minimal contact with county roadways occurs, which is where most road closures occur. Safety issues, another minor concern for commercial shippers, resulted in 17% having a problem sometimes and 83% seldom. Few comments were offered in this study, hence follow up phone discussions divulged valuable information on transportation problems.
23

Rate Structure Commercial truckers reacted to the recent change in the rate structure more than other wood product transporters. These data reported are by the number of firms and are not weighted. These data depict that WUTC rates are rarely used, since regulation decreased in January 1995, (Table 2). One hundred percent of the firms indicated they seldom use WUTC rates. A few shippers used a modified WUTC rate, reporting 33% often. However, 50% of the firms indicated that they always use a non-WUTC rate. This would indicate that WUTC rates are rarely used since lesser regulation began in 1995. Write in comments indicated rates are generally negotiated daily and the rate amount will fluctuate. For a description of WUTC rates, refer to Part 2 of this series (Alderson and Casavant). Table 2--Weight Structure Utilized by Commercial Shippers Commercial Rate Structure Always Often Seldom Total WUTC 0% 0% 100% 100% Modified WUTC 0% 33% 67% 100% Other 50% 0% 50% 100% Source: EWITS Forest Product Survey 1996
24

Summary Commercial truckers provide specialized forest products transportation service by design. Thus, transportation problems and rate structures set commercial shipping firms apart from that of mills and raw log businesses. A high level of competition amongst the commercial firms was noted. One of the most surprising findings of this study was that the product originated more commonly from states other than Washington. Furthermore, destination of HWS products were most often eastern Washington and Idaho. Truck usage was the dominant method of freight hauling and distinguished itself by marketing products closer to the source of origin. Commercial transporters marketing capabilities are affected by seasonal variations.
25

References Alderson, Lynn C. and Kenneth L. Casavant. Transportation Characteristics and Needs
of Forest Products Industries Using Eastern Washington Highways: Part 2 Movements of Raw Logs. Eastern Washington Intermodal Transportation Report No. 14. Washington State University, Pullman, January 1997.
Alderson, Lynn C. and Kenneth L. Casavant. Transportation Characteristics and Needs
of Forest Products Industries Using Eastern Washington Highways: Part 3 Shipments from Mills. Eastern Washington Intermodal Transportation Report No. 16. Washington State University, Pullman, March 1997.
Gillis, William R. and Kenneth L. Casavant. Major Generators of Traffic on U.S. 395
North of Spokane: Including Freight Trucks and Passenger Vehicles Crossing the International Border. Eastern Washington Intermodal Transportation Report No. 4. Washington State University, Pullman, January 1995.
Shuler, Ted. Telephone Interview. Kettle Falls, WA. 25 June 1996. Stellmon, Bill. Telephone Interview. Lewiston, ID. 25 June 1996. Weatherman, Eric. Telephone Interview. Kettle Falls, WA. 14 Oct. 1996. West, Steven. Telephone Interview. Kettle Falls, WA. 22 May 1996.
26

Appendix A
Study Contacts
27

Study Contacts Royal Antoine Antoine & Son Trucking Chewelah, WA Jim Weddell Port of Clarkston Clarkston, WA Doug Parks Whitman County Sheriffs Dept.
Weigh Master Colfax, WA
L. and B. Lawson Lawson Trucking Colville, WA A. and B. Kroiss Andy Kroiss Logging, Inc. Colville, WA Tom Schwartz Trico Economic Development Colville, WA Lloyd McGee Vaagen Brothers Colville, WA R. Steve Truesdale RST Logging Dayton, WA John Schwartz Washington Log Truckers Assoc.
Director Federal Way, WA
Eric Weatherman Tugs R’ Us Kettle Falls, WA Steven D. West Boise Cascade Kettle Falls, WA Ted Shuler Puget Sound, Inc. Kettle Falls, WA Nicholas Jagelski Boise Cascade
Transportation Coordinator La Grande, OR
Bill Stellmon Excel Transporting, Inc. Lewiston, ID James McAdoo Potlatch Corporation Lewiston, ID Art Nordang Art Nordang Trucking, Inc. Methow, WA Charlie McUgtta University of Idaho, Department of Forestry Moscow, ID David N. Larsen WA DNR
Forest Economist Olympia, WA
George Kirkmire Washington Contract Loggers Olympia, WA Dan Mason Washington State Treasurers Office Olympia, WA Kathy Anderson Washington Utilities Transportation Commission Olympia, WA Bob Bretz Colville Indian Precision Pine Co. Omak, WA Tom Gilmore Idaho Veneer Co. Post Falls, ID Dr. Keith Blatner WA State University
Resource Economist Pullman, WA
John Kurtz J. L. Kurtz Trucking Republic, WA Debbie Keegan WA St. Community Trade and Economic Development Seattle, WA Jerry Kuisti Dellen Wood Products Spokane, WA Cheryl Weiber Washington Utilities Transportation Commission Spokane, WA James Hambidge Canyon Lumber Co., Inc. Springdale, WA Thomas Buche Tom Buche Logging Springdale, WA Bob Lloyd Lloyd Logging Twisp, WA Randal Klingbeil Klingbeil Logging
President of NE WA Loggers Trucking Assn. Valley, WA
Tim Rogers Louisiana Pacific Forester
Walla Walla, WA
Betty Walker W-4 Construction, Inc. Walla Walla, WA Duane Good Boise Cascade Wallula, WA Jim Canaday Canaday Trucking Yakima, WA
28

Appendix B
Mill Survey Questionnaire
29

Identifying the Transportation Needs of the Forest Industry CONFIDENTIAL
3. If you answered “other” in question 2 would you please explain in detail what other problem(s) you may have encountered.
Name of firm
Address Person answering questionnaire
If you want a personal copy of the results check here 4. We are interested in the rate structure used by those who transport their forest products. Would you please check the following? Answer is confidential.
1. We are interested in when your forest products are shipped to market. Please give your best estimate by percent.
Raw Logs
Plywood Lumber
Sawdust Woodchips
Hogfuel Othera) January-February b) March-April c) May-June d) July-August e) September-October f) November-December Total 100% 100% 100% 100%
Seldom Ofte
n Always
WUTC Modified WUTC Other
5. If you answered “other” or “modified WUTC” in question 4 would you briefly explain your preferred rate structure or attach your rate sheet(s).
Specify “Other”
2. How often do you experience any unusual transportation problems with the following?
6. We realize your loading site may change but to plan for improvements to the road system please identify what local and state roads within Washington you utilize most frequently to transport your forest products to a mill or port in a typical year. (For example: WA 20 (15%), US 395 (50%), Boulder (35%), etc.) Add a separate sheet if more room is needed.
Never Seldom Sometimes OftenRoad closures Weight restriction Rates Permits Short corners Availability of drivers
Safety Issues Bridge Laws Lack of turn-outs Other (specify)
ROAD-Name or number
PERCENT COUNTY(ies) LOCATION
1) 2) 3) 4) 5) 6) 7) Total = 100%
30

7. Please give your best estimate by percentage of the forest products shipped from origin to destination in an average year. (See yellow insert fro an example of question 7.)
CONFIDENTIAL
ORIGIN
DESTINATION Ferry Stevens Pend Oreille Spokane Okanogan Canada Other Eastern Washington Western WA (includes WA ocean ports) Oregon (includes OR ocean ports) California Other states west of Mississippi States east of Mississippi Canada Other 8. If “other” was answered in question 7 above could you please specify origin(s) to destination(s)?
CONFIDENTIAL 9. We are interested in the volume of forest products that you ship. This question will help us understand the amount of forest products shipped and their proportions to one another. Please provide your best estimate based on your average volume by net tons for a year.
TRUCK TO Final domestic destination River port Ocean port Other
PRODUCT SHIPPED (by average net tons per year) Raw logs Hog fuel Wood chips Saw dust Lumber Plywood Post, poles, and/or pilings Other Other (specify) 10. Your comments & concerns: (If not enough room please feel free to add a separate sheet.)
Thank you for your help
31

CONFIDENTIAL 7. Please give your best estimate by percentage of the forest products shipped from origin to destination in an average year. (See yellow insert fro an example of question 7.)
ORIGIN DESTINATION Ferry Stevens Pend Oreille Spokane Okanogan Canada Other
Eastern Washington Western WA (includes WA ocean ports) Oregon (includes OR ocean ports) California Other states west of Mississippi States east of Mississippi Canada Other 8. If “other” was answered in question 7 above could you please specify origin(s) to destination(s)?
32