A dynamic model of household decision-making and parcel level landcover change in the eastern Amazon
19
Ecological Modelling 143 (2001) 95 – 113 A dynamic model of household decision-making and parcel level landcover change in the eastern Amazon Tom P. Evans a,b, *, Aaron Manire a , Fabio de Castro a,c,d , Eduardo Brondizio d,e , Stephen McCracken d a Center for the Study of Institutions, Population and Enironmental Change, Indiana Uniersity, Bloomington, IN 47405, USA b Department of Geography, Student Building 120, Indiana Uniersity, Bloomington, IN 47405, USA c School of Public and Enironmental Affairs, Indiana Uniersity, Bloomington, IN 47405, USA d Anthropological Center for Training and Research in Global Enironmental Change, Indiana Uniersity, Bloomington, IN 47405, USA e Department of Anthropology, Indiana Uniersity, Bloomington, IN 47405, USA Abstract The region around Altamira, Brazil, located in the Eastern Amazon, has experienced rapid landcover change since the initiation of government sponsored colonization projects associated with the construction of the Trans-Amazon Highway. The 30 years since colonization (1971) have been marked by a net loss of forest cover and an increase in the amount of cultivated/productive land, particularly for pasture and annual/perennial crop production. This research presents a parcel-level model of landcover change for smallholders in the Altamira study area. The utility of specific land-use activities is calculated to identify those land-uses that are most optimal at each time point, and labor is allocated to these activities based on the availability of household and wage labor. The model reports the proportion of the parcel in the following landcover classes at each time point using a 1-year interval: mature forest, secondary successional forest, perennial crops, annual crops and pasture. A graphical user interface is used for scenario testing, such as the impact of high/low (population) fertility, the increase of out-migration to urban areas, or changes in cattle and crop prices. The model shows a rapid reduction in the amount of mature forest in the 30 years following initial settlement, after which the parcel is composed of a mosaic of secondary succession, pasture and crops. The nature and rapidity of this landcover change is the function of a variety of household and external variables incorporated in the model. In particular, the model produces different landcover compositions as a function of demographic rates (fertility, mortality) and agricultural prices. © 2001 Elsevier Science B.V. All rights reserved. Keywords: Landcover change; Simulation; Deforestation www.elsevier.com/locate/ecolmodel 1. Introduction The Brazilian Amazon has undergone tremen- dous landcover change in the past 40 years. In particular, the introduction of the Trans-Amazon highway and subsequent colonization of territory * Corresponding author. Tel.: +1-812-856-4587; fax: +1- 812-855-1661. E-mail address: [email protected] (T.P. Evans). 0304-3800/01/$ - see front matter © 2001 Elsevier Science B.V. All rights reserved. PII:S0304-3800(01)00357-X
-
Upload
independent -
Category
Documents
-
view
1 -
download
0
Transcript of A dynamic model of household decision-making and parcel level landcover change in the eastern Amazon
Ecological Modelling 143 (2001) 95–113
A dynamic model of household decision-making and parcellevel landcover change in the eastern Amazon
Tom P. Evans a,b,*, Aaron Manire a, Fabio de Castro a,c,d,Eduardo Brondizio d,e, Stephen McCracken d
a Center for the Study of Institutions, Population and En�ironmental Change, Indiana Uni�ersity, Bloomington, IN 47405, USAb Department of Geography, Student Building 120, Indiana Uni�ersity, Bloomington, IN 47405, USA
c School of Public and En�ironmental Affairs, Indiana Uni�ersity, Bloomington, IN 47405, USAd Anthropological Center for Training and Research in Global En�ironmental Change, Indiana Uni�ersity, Bloomington,
IN 47405, USAe Department of Anthropology, Indiana Uni�ersity, Bloomington, IN 47405, USA
Abstract
The region around Altamira, Brazil, located in the Eastern Amazon, has experienced rapid landcover change sincethe initiation of government sponsored colonization projects associated with the construction of the Trans-AmazonHighway. The 30 years since colonization (1971) have been marked by a net loss of forest cover and an increase inthe amount of cultivated/productive land, particularly for pasture and annual/perennial crop production. Thisresearch presents a parcel-level model of landcover change for smallholders in the Altamira study area. The utility ofspecific land-use activities is calculated to identify those land-uses that are most optimal at each time point, and laboris allocated to these activities based on the availability of household and wage labor. The model reports theproportion of the parcel in the following landcover classes at each time point using a 1-year interval: mature forest,secondary successional forest, perennial crops, annual crops and pasture. A graphical user interface is used forscenario testing, such as the impact of high/low (population) fertility, the increase of out-migration to urban areas,or changes in cattle and crop prices. The model shows a rapid reduction in the amount of mature forest in the 30years following initial settlement, after which the parcel is composed of a mosaic of secondary succession, pasture andcrops. The nature and rapidity of this landcover change is the function of a variety of household and externalvariables incorporated in the model. In particular, the model produces different landcover compositions as a functionof demographic rates (fertility, mortality) and agricultural prices. © 2001 Elsevier Science B.V. All rights reserved.
Keywords: Landcover change; Simulation; Deforestation
www.elsevier.com/locate/ecolmodel
1. Introduction
The Brazilian Amazon has undergone tremen-dous landcover change in the past 40 years. Inparticular, the introduction of the Trans-Amazonhighway and subsequent colonization of territory
* Corresponding author. Tel.: +1-812-856-4587; fax: +1-812-855-1661.
E-mail address: [email protected] (T.P. Evans).
0304-3800/01/$ - see front matter © 2001 Elsevier Science B.V. All rights reserved.
PII: S 0304 -3800 (01 )00357 -X
T.P. E�ans et al. / Ecological Modelling 143 (2001) 95–11396
in close proximity to the highway has led tolarge-scale social and biophysical change in partsof the Amazon. Much of the area where the mostrapid landcover change has occurred has beenpart of government-sponsored colonizationprojects where individual parcels are surveyed andthen allocated to colonists. These areas are com-posed of mature forest prior to settlement andsubsequently transformed to a mosaic of pasture,cultivated lands and different stages of forest re-growth associated with fallowed agricultural land.A substantial amount of research has been fo-cused on the Brazilian Amazon given its impor-tance to global geo-chemical cycles and richspecies diversity. Regional-level analyses havedocumented the spatial extent of deforestationand attempted to link this deforestation to re-gional population changes (Skole and Tucker,1993). Household-level analyses have focused onmicro-scale factors contributing to landcoverchange, including parcel soil characteristics,household income and demographic structure(Brondizio et al., 2001; McCracken et al., 2001;Moran et al., 2001).
There are a wide range of processes affectinglandcover change in the Amazon including social,biophysical, economic and institutional compo-nents (Moran, 1981; Walker and Homma, 1996).Thus, the data collection requirements to examinethe process of landcover change are considerable(McCracken et al., 1999). This is particularly trueof spatially explicit datasets where each compo-nent to the statistical model must be georefer-enced to be integrated in a spatial informationsystem. Household social surveys provide in-depth information at the level at which land-usedecisions are made but require large teams ofresearchers due to travel time requirements andthe complexity of the survey instruments. Multi-temporal remotely sensed imagery can provide acontinuous spatial coverage of landcover change,but the data processing and field validation re-quirements necessary to obtain a higher orderlandcover classification are considerable.
Dynamic modeling provides a means by whichthese landcover change processes can be examinedand different scenarios tested from a system’sperspective (Costanza et al., 1993; Dale et al.,
1993; Voinov et al., 1999). These models can becalibrated and validated using a combination ofprimary data from field data collection and fromexisting literature to develop a tool whereby dif-ferent simulations and scenarios may be tested.This paper presents a dynamic model of house-hold decision-making and landcover change at theparcel level for Altamira, Brazil. The purpose ofthis model is to identify those factors that areimportant components to the process of landcoverchange and to test a variety of scenarios or condi-tions for their impact on landcover change. Whilethe long-term predictive ability of any model islimited for various reasons (such as unforeseenshocks to a system or dramatic changes in tech-nology), as a tool dynamic models can provideconsiderable insight into the complex interactionsoperating to affect landcover change. The modelpresented here is designed to be run for a 30–100-year period, representing multiple generations forthe household. The model simplifies many ele-ments of landcover change but includes enoughcomplexity that important relationships betweenlabor, resources and landcover can be observed.
2. Altamira, Eastern Amazon
Altamira, located in the Xingu Basin of theBrazilian Amazon, is an old riverine town thatexperienced government-directed large-scale colo-nization starting in 1971 (Moran, 1981). Parcelsare rectangular lots of approximately 100 ha(500×2000 m), with the 500 m boundary adja-cent to the road to maximize the collective accessfor all parcels, and there is relatively little vari-ance in the size of parcels (�100 ha). This land-settlement pattern has resulted in the documented‘fishbone’ pattern of settlement and deforestationfound in many, but by no means all, parts of theBrazilian Amazon (Moran et al., 1994).
During the initial wave of colonization (ca.1971), each household was given a single parcel inexchange for little, if any, capital. Subsequentwaves of colonization also have seen householdsallocated a single parcel, although as time passedland acquisition required more capital due to theemergence of a land market reflecting the area’s

T.P. E�ans et al. / Ecological Modelling 143 (2001) 95–113 97
development and farm improvements (e.g. build-ings, cleared forest, pastures). To date, there is noevidence that parcel fragmentation exists in theAltamira study area and relatively little land con-solidation. In other words, there has been littlechange in the originally established parcelboundaries since the time of initial colonization.
While the initial wave of colonists needed verylittle capital to purchase rights to a parcel, parcelson which there have been improvements (e.g. landcleared for pasture, buildings) can be sold byfirst-generation colonists for substantial amounts.Households must save in order to make the sub-stantial investment needed to acquire land fortheir children. The most common pattern is forchildren to acquire their own land for cultivationrather than to inherit fragments of their parent’sparcels. Land prices and the resistance to landfragmentation encourage second-generationcolonists to seek land in frontier areas far fromtheir relatives.
After 25 years of settlement, 61% of the Al-tamira study area remains in primary forest(Brondizio et al., 2001). About one-half of thedeforested area from 1970 to 1996 remained inproduction (pasture, annuals, perennials) in 1996,and the other half has been taken over by sec-ondary forests and fallows (Brondizio et al.,2001). The land that has transitioned from clearedland to secondary succession includes lands wherefarmers perceived agricultural production to bemarginal due to initial conditions of the soil or bysuccessive years of cultivation and associated soilnutrient depletion. Of the area in production,50–80% of the landcover is in pasture (Brondizioet al., 2001). There seems to be a clear associationbetween the percentage of a property in pastureand the absence of above-average soils. As theamount of nutrient-rich alfisols increases, the per-cent of the property in pasture declines and thearea in cocoa and sugar cane increases (Moran etal., 2001).
The data show consistent deforestation trajec-tories across cohorts with marked oscillationreflecting changes in the larger political economyBrondizio et al., 2001). Farmers deforest steadilyin the beginning stages of settlement to establishcultivatable land (Leite and Furley, 1985; Dale et
al., 1993; Brondizio et al., 2001). After this initialclearing, there is an increase in pasture and peren-nial crop land while landholders maintain a mod-est amount of land for annual crop production(rice and beans).
3. Modeling land-use in the Amazon
Land-use dynamics have been the focus of alarge body of research in the Brazilian Amazon(Dale et al., 1993, 1994; Moran et al., 1994;Walker and Homma, 1996). Dale et al. (1993)developed a dynamic model of regional-level land-cover change for Central Rondonia, Brazil, anarea that is characterized by the same fishbonesettlement pattern as Altamira. Their model (Dy-namic Ecological — Land Tenure Analysis(DELTA)) uses different scenarios to determinethe impact of different land-use systems on car-bon release and habitat fragmentation at the par-cel level, and then aggregates the individual parcelresults up to a regional level model (Dale et al.,1994). In particular, the model compares the land-cover composition and pattern as a result of twoland-use strategies: (1) a system typical of thatobserved in the study area where forest is initiallycleared for annual and perennial crops followedby pasturing; and (2) a cultivation system wherethere is a greater diversity of crops, and farmersreceive no income from cattle production. Eachland-use system is given specific landcover charac-teristics, and the model produces a regional scalerepresentation of landcover pattern and composi-tion in addition to an accounting of the impact ofmodeled landcover changes on carbon sequestra-tion and species habitat. The DELTA model pre-dicts that a more diversified system of landmanagement can reduce carbon release and in-crease the productivity of the land over time (Daleet al., 1993).
In addition to land-use strategies, the DELTAmodel predicted that soil and vegetation condi-tions would affect the landcover composition as aresult of their affect on crop yields and forestregrowth rates (Dale et al., 1993). Factors exter-nal to the parcel have also been observed to affectlandcover, including distance to markets, trans-
T.P. E�ans et al. / Ecological Modelling 143 (2001) 95–11398
portation accessibility and market prices (Dale etal., 1993; Walker and Homma, 1996). In particu-lar, road conditions can vary dramatically be-tween the rainy and dry season, affecting cropchoice. For example, one method of amelioratingthe impact of poor road conditions is to substituteland-uses that produce goods requiring less fre-quent access to markets (e.g. cattle production).Perhaps more importantly, the fishbone settle-ment pattern is characterized by some parcelsbeing adjacent to the primary road (first line),while parcels that were surveyed and settled insubsequent waves of colonization are more oftenlocated on feeder roads that are in relatively poorcondition or farther from the closest market alongthe primary road. The net result is that subse-quent waves of settlers have greater travel timesto market than settlers who were part of theinitial settlement wave.
4. Model description
The model presented in this paper differs fromthe DELTA model in that each land-use activityis assigned a specific utility based on: (1) the laborand economic resources available to the house-hold, and (2) the expected benefit from that land-use activity based on crop and cattle prices. Here,we use the term ‘utility’ to describe a mathemati-cal function that expresses the preferences of land-use choices with respect to their perceived riskand expected financial return. Labor is allocatedto specific land-use activities based on these rela-tive utilities; landholders seek to maximize theirfinancial income by allocating labor to those ac-tivities that they perceive will provide the greatestfinancial return on their labor investment. Inother words, land-use systems chosen by thehousehold are a product of the household deci-sion-making structure of the model, rather thanan input to the model itself. The simulation isdesigned to be run over approximately 70 yearsusing a 1 year time step. Landholders can selectmultiple land-use decisions (e.g. cut primaryforest for annual production, convert annuals topasture, etc.) in 1 year, but there is only onedecision-making round per year. At the beginning
of the model run, the entire parcel is composed ofmature forest simulating the settlement of a previ-ously uncultivated area. Field data shows that themajority of parcels in the Altamira study areavary in size between approximately 90 and 110 ha.A parcel size of 100 ha is used for the model runspresented here based on a 500×2000 m rectangu-lar area. The model may easily accommodatealternative parcel sizes by adjusting the initial sizeof mature forest at the beginning of the modelrun.
The model is organized into the following sec-tors representing the major processes affectinglandcover change: demography, household eco-nomics (finances and prices), land-use decision-making, labor allocation, and institutions. Fig. 1shows a conceptual diagram describing how themain model components are related in the modelstructure. The interactions between each of thesesectors results in specific land management deci-sions that affect the landcover sector where thelandcover composition of the parcel is tracked.These landcover decisions result in clearing offorested land, fallowing of agricultural land, andthe transition from one type of agricultural pro-duction to another. These landcover changes re-sult in changes in the landcover composition ofthe parcel. Landcover class proportions are re-ported for the entire parcel and thus there is norepresentation of the landcover pattern within theparcel (e.g. degree of fragmentation, number ofpatches). Currently, the model assumes that bio-physical parameters are homogeneous within theparcel, such as soil fertility, topography andhydrography.
The model consists of a labor allocation frame-work whereby landholders invest labor and re-sources in specific activities to either maintainland already under one activity (e.g. perennialcrop production) or convert area in one land-useto another land-use (e.g. the conversion of matureforest to annual crop production). While there is aclear distinction between land-use and landcoverin Altamira (e.g. successional forests can either beused for agroforestry, non-timber forest produc-tion, or simply abandoned agricultural land), themodel presented here has a one-to-one correspon-dence between each land-use activity and a corre-

T.P. E�ans et al. / Ecological Modelling 143 (2001) 95–113 99
sponding landcover class. The area (ha) in eachland-use is reported in single year intervals, show-ing the landcover composition over time and thetypes and proportions of landcover transitionsthat have occurred during the model run. Themodel is run for an individual parcel given a setinitial household composition, but multiple modelruns using different household compositions canbe aggregated to construct a regional-level per-spective on landcover change. However, in orderto more properly model a regional scale represen-tation of landcover change, various parcel charac-teristics affecting land-use would need to beincluded such as transportation accessibility mea-sures and soil characteristics to represent the vari-able soil conditions in the Altamira study area.
4.1. Demography sector
The demographic sector controls human fertil-ity, mortality and migration events for membersof the household. The age and sex composition ofthe household is represented using the followingdemographic groups: children (0–14 years), adultmales (15–64 years), adult females (15–64 years)and seniors (�65 years). This breakdown wasconstructed to account for the different contribu-tions that household members (men, women, chil-dren) make to household, farm wage labor andoff-farm wage labor activities.
While dynamic models typically represent fertil-ity, mortality and migration as rates, the modelpresented here uses probabilities to initiate specificdemographic events (e.g. a birth, an adult malemigrating to an urban area). Rather than havingcontinuous flows in and out of the demographicstocks, there is a specific probability of a birth,death or out-migration from each demographicstock at each time period based on fertility, mor-tality and migration rates that can be adjusted bythe model user. Eq. (1) shows the method bywhich probabilistic birth events are calculated.Birth events are enabled only if there is an adultmale member of the household.
Bt=�i
1
Pi (1)
where Bt is the birth events during year t, i thenumber of adult females in the household, and Pi
the random number generated for individual i (0if Pi below user specified fertility rate, 1 if above).
This probabilistic method was chosen so thateach of the demographic groups would be repre-sented by integers rather than as continuous vari-ables or fractions of people. With theserepresentations, more logical behavior can be de-picted for specific demographic events. For exam-ple, if there is a single adult female in thehousehold (rather than fractions of individuals, aswould be the case with continuous rates), there
Fig. 1. Model overview.

T.P. E�ans et al. / Ecological Modelling 143 (2001) 95–113100
can be a specific probability that she will eitherleave the household or that an adult male willjoin the household. Likewise, birth events canbe more precisely controlled as a function of thenumber of adult males and females in thehousehold and the prevalence of out-of-marriagebirths. Such controls partially exist in themodel, and will be more elaborately integratedwith subsequent versions. Children start at age 0and are moved to the adult male or adult fe-male stocks based on a sex ratio based probabil-ity value. Female fertility rates are not agedependent, except that women younger than 15years old and older than 65 years old have abirth rate of zero in all cases.
Each demographic group has their own mor-tality rate that is based on United Nations De-velopment Program (UNDP) data (UnitedNations Development Program, 1999). The childmortality rate was based on an adjusted infantmortality rate from UNDP data sources forBrazil. These demographic rates are levers thatcan be adjusted by the model user for specificscenario testing (e.g. constant fertility over time,declining fertility, declining mortality). Crudebirth rates (CBR) in the region were relativelyhigh in the 1970s (CBR=40), but the crudebirth rate has been steadily declining in recentyears (CBR�25). Infant mortality rates havealso declined rapidly over the past 30 years.Model users can specify high or low fertility sce-narios as well as a declining fertility or mortal-ity scenarios over the course of a model run.
Rural–urban migration has become an in-creasingly important process in the region. TheAltamira study area is named for the town ofAltamira located along the Trans-Amazon high-way that serves as a center of commerce for thecolonists. Surveyed parcels along the Trans-Amazon extend 120 km west of the Altamiratown location, with the earliest settled parcelsbeing closest to the town. As the urban econ-omy of Altamira develops, more opportunitiesare available for urban wage labor, particularlyfor young women as household laborers. Interms of labor activities, women participate pri-marily in the cultivation of household annualand perennial crops rather than as wage labor
for other landholders (e.g. land clearing, burn-ing). Thus, migration to the town of Altamiraprovides women with a means of generating in-come that would otherwise not be possible onthe farm. The model incorporates these wagelabor opportunities by allowing the wage laborrate to be set by the model user. Scenarios canbe run where there is a high demand for wagelabor (high hourly wage) or low demand forwage labor (low hourly wage). The impact ofremittances from household members who havepermanently moved off the parcel is currentlyunknown, but is hypothesized to be modest byresearchers familiar with the study area. Whilethe model allows for such remittances to be in-corporated into the model scenarios, the modelruns presented in this paper do not include thisfactor.
4.2. Economic sector
Household income, consumption and expendi-tures are controlled by the economic sector.This sector affects landcover primarily in thatthe amount of capital available to the householdaffects their ability to hire wage labor. Eq. (2)shows the individual contributions to householdincome. Wage labor is used for land-use activi-ties requiring large amounts of labor in shortperiods of time. Examples include crop harvest,forest clearing and burning cleared vegetation.
It=ct+st+ it+at (2)
where It is the total household income duringyear t, ct the income from cattle sales duringyear t, st the income from social security duringyear t, it the wage labor income during year t,and at is the income from agricultural crops inyear t.
Households receive agricultural income fromcattle and crop sales. Crop prices are set by themodel user according to the major crop types(perennial, annual) and are measured in grossprofit per hectare per year. These prices aretreated exogenously in the model; there are nofeedbacks of agricultural production that affectprices. The primary annual crops grown in thestudy area are rice and beans, and the income

T.P. E�ans et al. / Ecological Modelling 143 (2001) 95–113 101
Table 1Labor consumption for land-use activities
‘From’ land-use Type‘To’ land-use Labor (person-weeks/ha/year)
MAnnuals 3AnnualsMPerennials 2PerennialsMPasture 1.5Pasture
AnnualsMature forest C 7CPerennials 3AnnualsCAnnuals 2.5PastureCSecondary forest succession 0Annuals
PasturePerennials C 2.5CSecondary forest succession 0Perennials
Secondary forest successionPasture C 0C 6Secondary succession AnnualsC 4.5PastureSecondary succession
See Appendix A for notes. M, Maintenance; C, conversion.
for annuals represents an aggregate measurebased on a combination of these two crops on onehectare in one year. The most common perennialcrop present in the Altamira study area is cocoa,while there are lesser amounts of coffee and sugarcane. Another source of income for some familiesis the Brazilian social security system that wasinitiated during the past decade. The model repre-sents this as a lever that can be turned on or offor to test different social security scenarios (e.g.presence/absence of social security, different socialsecurity allocation rates).
The main household expenditures are cattlepurchases, household consumption and institu-tional penalties (see Eq. (3)). Households expendcapital based on the number of members in thehousehold and an estimated per-capita householdconsumption representing costs such as food,clothing, medicine and education. Certain institu-tional factors can decrease net household incomesuch as property taxes or land regulatorypenalties, both of which can be controlled by themodel user. Expenditures for crops are incorpo-rated into the net income price/ha for each croptype.
Et=ct+pt+Ft+et (3)
where C is the household consumption (based onhousehold size), pt the expenditures from cattlepurchases, Ft the Institutional fees and penalties,and et the wage labor expenditures.
4.3. Decision-making sector
The decision-making sector is the main mecha-nism affecting landcover change outcomes in themodel and is affected by each of the other modelsectors. This decision-making sector allocateslabor to specific activities that affect the conver-sion of land from one land-use to another and thepreservation of land in its current state. The util-ity of each possible activity or decision is calcu-lated at each time point based on the expectedeconomic gain from that activity. Using theserelative utilities, labor is allocated to specific ac-tivities that are then translated into an area con-version measure based on the labor consumptionper unit area for that activity.
4.3.1. Utility calculationThere are three main types of land-use activity
on the parcel: (1) the conversion of one land-useto another land-use, (2) the preservation/mainte-nance of one land-use to the next time step, and(3) the abandonment of a specific land-use activity(e.g. the transition of cultivated or otherwise pro-ductive land to initial secondary successionthrough fallowing). The complete set of possibleactivities (including land-use activities resulting inlandcover change) is provided in Table 1. Esti-mated labor consumption for each of these activi-ties was obtained from field notes and estimatesfrom field researchers familiar with the study area.

T.P. E�ans et al. / Ecological Modelling 143 (2001) 95–113102
Labor consumption units are person-weeks neces-sary for that activity on 1 ha for 1 year. Conver-sion and maintenance activities require laborallocation, while no labor is required for thecessation of an activity and subsequent transitionto initial secondary succession.
The overall utility of each activity at a specifictime step is a function of the return on laborinvestments for that land-use activity over theprevious 5 years. This model structure mimics theprocess of how households ‘learn’ what are theoptimal land-use activities over time. The individ-ual factors that affect the utility over time arelabor availability and prices for cattle and crops.The actual utility for each activity is the ratio offinancial return per hectare to labor invested perhectare. Prices are held constant for the modelruns presented here. The model runs presented inthis paper use constant prices for each crop typeand for cattle over the entire model run. However,given data on crop and cattle prices over time, themodel can allow these prices to change during thecourse of the model run, allowing changes inrelative crop prices to affect land-use decisions.
Households may choose to maintain a currentland-use activity or convert some of their parcel inone land-use to another land-use. At each timestep, the utility of maintaining each land-use ac-tivity and the utility of converting each land-useactivity to each other activity is calculated. Main-taining a land-use requires a labor maintenancecost. Converting an area from one land-use toanother requires a conversion cost (i.e. laborweeks require to clear forest for annuals produc-tion per hectare) and a maintenance cost of the‘to’ land-use. The model distributes the cost ofland-use conversion according to an expected du-ration of the new land-use.
There are four general types of land-use utilitiescalculated. The first and simplest is the utilityinvolved in maintaining land in its current land-use. This utility is simply the ratio of the financialreturn per hectare for that land-use to the laborrequired to maintain that hectare in that land-usefor 1 year. The second type of utility is theconversion of land in one land-use that does notrequire labor maintenance (e.g. forest or sec-ondary forest) to a land-use activity that does
require labor. An example would be converting ahectare of forest to annuals crop production. Inthis case, the utility of this land-use conversion isthe ratio of the financial return per hectare forone hectare of annuals to the sum of the conver-sion cost of forest to annuals and the labormaintenance cost for annuals crop production.The third type of utility calculation is the conver-sion of land-use in one labor-requiring activity toanother land-use activity that also requires labor.The utility of this type of conversion is a functionof the difference in financial return for each land-use, the labor required for each land-use activityand the conversion cost from one land-use toanother. The last type of utility is the abandon-ment of a land-use activity requiring labor to aland-use that does not require labor. An examplewould be the abandonment of perennial cropproduction and subsequent succession of sec-ondary forest vegetation.
A household can select multiple land-use activi-ties at each time point. In other words, house-holds do not allocate all of their available labor toa single land-use activity in one year. Rather, arisk aversion parameter is used that increases ordecreases the likelihood that a household willdiversify their land-use decisions. This risk aver-sion parameter can be adjusted by the model userat the beginning of the model run. If this parame-ter is set relatively high, households will selectonly the land-use with the highest utility. If theparameter is set relatively low, the household willallocate labor to a more diverse set of land-uses.
The total available household and wage labor isthen allocated to each of the selected land-useactivities based on their relative utilities. For ex-ample, assume the following two activities areselected for a specific time step: (1) the conversionof mature forest to annuals, and (2) the conver-sion of annuals to pasture. If the utility for theconversion of mature forest to annuals is twice theutility for the conversion of annuals to pasture,then two-thirds of the labor available at that timestep will be allocated to the mature forest toannuals activity. Given a set measure of person-weeks/ha, the amount of land converted betweenland-uses or maintained is calculated as a functionof the labor allocated to that activity. The size of
T.P. E�ans et al. / Ecological Modelling 143 (2001) 95–113 103
the areas converted or maintained in differentland-uses will not necessarily be proportional totheir specific utilities because each land-use con-version consumes different amounts of labor.When there is inadequate labor necessary tomaintain the existing land-use activities, land isabandoned based on the land-use with the lowestutility.
4.4. Landco�er change sector
Each household land-use activity is associatedwith a specific landcover class, and each land-usechange involves the removal of land from onelandcover class or stock to another. The followingland-use/landcover classes are used in the model:mature forest, secondary forest succession, annu-als, perennials and pasture. A variety of annualcrops are grown in Altamira. The most commonare beans and rice, which are diet staples andgrown by all households in some quantity. Theannuals class here represents land that is rotatedoften, every 2–3 years, and is a combination ofdifferent crops. The pattern observed in Altamirais for recently cleared land to be put into sometype of annual crop until yields decline. Commonperennial crops in Altamira include coffee, cocoaand, to a lesser extent, sugar cane, and these cropsare most often harvested using wage labor. Incontrast to annuals, perennials are cultivated for6–8 years before yields decline to the point wherethe land is allowed to fallow.
The model assumes that mature forest coversthe entire parcel at the beginning of the modelrun. As land is cleared for agricultural productionand fallowed, it is moved between a series ofstocks representing different stages of forest re-growth. One simplification of the model is thatprevious land-use does not affect subsequentforest regeneration rates. In accordance with theland management practices found in Altamira,land with less than 10 years of forest regrowth isnot cleared for agricultural production. A propor-tion of each secondary succession class is movedto the next stage of forest regrowth at each timestep, eventually reaching the mature forest state.This model structure results in a dynamic land-scape where land is moved from one land-use
class to another of the several decadal run of themodel. The pattern of forest clearing and aban-donment is captured in the different stocks usedto represent labor-consuming land-uses and dif-ferent stages of forest regrowth. The actual land-scape in Altamira is characterized by a mosaic ofdifferent land-uses within a parcel with varyingdegrees of landcover fragmentation. The modelpresented here represents this compositionalstructure by the different stocks of landcover rep-resenting different landcover classes. As land-useconversion activities occur during the model run,the proportion of land in each landcover class orstock changes depending on previous land-useactivities and land-use decisions associated withlandcover transitions.
4.5. Institutional sector
A variety of institutional factors affect landmanagement in the study area. Most of thesefactors are treated as exogenous to the modelwhere the model user controls the impact or influ-ence of these factors with no feedbacks betweenlandholder decisions and these institutionalregimes. One institutional factor closely tied tolandcover change is the requirement that land-holders keep at least 50% of their land in forest(mature forest or advanced secondary succession).This requirement is only loosely enforced, butlandholders do face a penalty if caught violatingthis regulation. In addition to these land-use re-striction penalties, another institutional factor af-fecting landcover change is a loosely basedproperty tax. However, no property tax existed atthe time of initial settlement. The model user canturn this property tax on or off, or adjust theprobability that the property tax will be enforced.
It should be noted that while this paper pre-sents only a very limited set of scenarios that canpossibly be run by the model, the model user mayadjust the impact of these institutional factors andother factors through a graphical user interface.Fig. 2 shows one screen of this graphical userinterface, where there are knobs and levers that letthe user set child mortality rate, fertility rates, andsex and age composition of the household at timeof settlement. This paper presents results for

T.P. E�ans et al. / Ecological Modelling 143 (2001) 95–113104
model runs under high and low human fertilityassumptions and price regimes. However, institu-tional factors such as penalties and taxes do affectthe overall land-use decisions made by landhold-ers in model runs. While not presented in thispaper, different scenarios can be run, representingthe enforcement of penalties as well as varyingfines associated with the violation of the regula-tion, which in model runs decreases the rate ofdeforestation and the total number of parcelsrapidly clearing mature forest.
A variety of market factors also affect land-cover in the area and are also treated exogenouslyin the model. Crop and cattle prices in particularaffect the utility of different land-uses, and theseprices can be modified through the graphical userinterface. Crop prices represent the income for 1ha of land under annuals or perennials produc-tion, while annual crops are assumed to be usedfor subsistence and not sold at markets. The
model has two separate prices for the sale price ofcattle for landholders and the purchase price ofcattle for landholders. These prices can be set torun a low- or high-price scenario or to representdeclining and increasing prices through the modelrun. One simplification of the model is that thereis no allowance for varying crop yields as a func-tion of labor inputs, agricultural inputs or soilconditions.
5. Model validation
The model was validated using landcover clas-sifications for the Altamira study area derivedfrom aerial photography from 1970, LandsatMulti-Spectral Scanner satellite data from 1978and Landsat Thematic Mapper satellite imageryfrom 1985 and 1996 (McCracken et al., 1999).The 1970 and 1978 data were interpreted to pro-
Fig. 2. Demography sector and graphical user interface.

T.P. E�ans et al. / Ecological Modelling 143 (2001) 95–113 105
Fig. 3. Altamira study area landcover (1996) derived from Landsat Thematic Mapper satellite imagery.
duce a classification of mature forest and non-forest land. Non-forest land is considered to beagricultural land, pastureland, and young forestregrowth. Landcover boundaries visible in the1970 aerial photography were digitized and thenconverted into a raster cell representation to beintegrated with the raster-based satellite imagery.The 1985 and 1996 satellite images were processedto produce a classification with the followinglandcover classes: mature forest, bare ground (in-cluding land cleared for agriculture), pasture, wa-ter, and three stages of forest regrowth. Theseraster data were resampled to a cell size of 80 mand overlayed with a vector layer of 367 parcelboundaries (Instituto Nacional de Colonizacao eReforma Agraria) registered to the same coordi-nate system and projection as the landcover data(Fig. 3). These parcel boundaries were used togenerate parcel level landcover composition statis-
tics for the 1970, 1978, 1985 and 1996 time points.Brondizio et al. (2001) reports approximately 60%of the mature forest remains in the Altamiraregion today, approximately 30 years after colo-nization. However, this figure represents severalwaves of colonization. The parcels used for modelvalidation here use a subset of parcels that werecolonized with the first wave of settlement andthus represent 30 years of modification.
Fig. 4 shows the mean percent forest on parcelsfor 30 model runs and for the 367 parcels basedon the multi-temporal landcover classifications(tails indicate �1 S.D. from the mean). Thesemodel runs were performed for a low humanfertility scenario with constant cattle and cropprices, and assuming no enforcement of landcovercomposition penalties such as those associatedwith excessive clearing of forest area on the par-cel. This figure indicates that the percent mature

T.P. E�ans et al. / Ecological Modelling 143 (2001) 95–113106
forest from the observed data reasonably matchesthe model data for 1996 (approximately 25 yearsafter colonization), while the model overestimatesthe amount of mature forest in 1985. We hypoth-esize this discrepancy between the modeled andobserved data in 1985 is due to two factors. First,we assumed a low fertility rate in the absence ofspecific fertility rate data for the region. Second, themodel runs are initiated with a standard familyhousehold size/structure of one child, one maleadult, one female adult and one senior. The house-hold composition and age structure of the first waveof colonists to Altamira is unknown, and therefore,in the model run, children were assumed to be 1
year old at the time of initial settlement. In otherwords, there is a 15 year lag to the time where thechildren reach reproductive age and reach the adultlabor pool (with adults contributing more person-weeks of labor per capita compared with children).It is hypothesized that this lag is responsible for theunderestimation of deforestation in 1985. In addi-tion, the model does not incorporate access tocredit as a model parameter. Credit allows land-holders to hire wage labor for labor-intensive tasks,such as clearing land for pasture. The availabilityof credit is an example of an institutional factor thatis not included in the model, but probably affectslandcover changes in the Altamira study area.
Fig. 4. Composition of model runs (30) and parcel level (368) mature forest composition from 1970, 1978, 1985 and 1996 landcoverclassifications.

T.P. E�ans et al. / Ecological Modelling 143 (2001) 95–113 107
The variance in model results increases withtime because of the human fertility probabilityfactor used in the model. At each time point, eachadult female is given a birth probability based onthe user-defined crude birth rate for the modelrun. Thus, there is relatively little variance be-tween parcels in the amount of mature forest forthe first 10 years of the model run since thesevariations in human fertility do not have land-useoutcomes until children reach the adult pool(thereby increasing the total amount of availablehousehold labor). However, as there is more vari-ability in household composition (especially in theadult male and adult female groups), there is agreater likelihood of variation in household activ-ities, explaining the larger variances after approxi-mately the 20th model-run year.
The processing necessary to complete the clas-sifications for the 1970, 1978, 1985 and 1996 timepoints was substantial. Ideally, a denser time se-ries could be used to validate the model as theremay be multiple landcover changes in single areasbetween the 8–10 year intervals of the observeddata. However, the processing necessary to de-velop and process such a time series is prohibitive.In addition, the fluctuations in crop and cattleprices are not specifically known and the valuesused in this model are based on field researcherbest estimates. Despite the use of the variousestimated model parameters, the model landscapeoutcomes still reasonably match the landscapecomposition observed from the multi-temporallandcover data.
6. Results/scenario testing
The land-use choices of the household throughtime depend primarily on the household size(labor availability), the ability to hire wage laborand the prices of annual crops, perennial cropsand cattle. Adjusting model parameters allows theresults of various scenarios to be compared, suchas high versus low human fertility scenarios orchanges in relative prices between crops and cat-tle. Landcover composition over time can be ob-served for each of these model runs, indicating theland-uses conducted at each time point and, spe-
cifically, the ability of forest regrowth to keeppace with the degree of forest clearing for variousagricultural activities.
Using a crude birth rate of 40.0, mature forestdeclines from 100 to 0% in approximately 45–50years. Fig. 5 shows the landcover class composi-tions through a 100-year model run for a repre-sentative parcel in the high-fertility scenario witha low price for perennials and moderate price forpasture. With a crude birth rate more common indeveloped countries (11.0–16.0), 25% matureforest remains after 60 years for most mode runs(Fig. 6), presumably as a result of the lack oflabor available for the relatively high labor costactivity of clearing mature forest. Table 2 presentslandcover composition of the parcel for years0–50 in tabular form. The area of land underproduction (annuals, perennials, pasture) isgreater under the high-fertility scenarios com-pared with the low-fertility scenarios. It should benoted that the results of individual model runsvary. Some parcels in the high-fertility scenarioactually exhibit low fertility due to the probabilis-tic nature of birth events in the model. However,the different scenarios can be compared by per-forming large sets of runs for the different scenar-ios, where each individual model run representsone parcel under a specific scenario. A compari-son of the aggregate of these model runs shows amore rapid rate of deforestation under the high-fertility scenario as compared with the low-fertil-ity scenario.
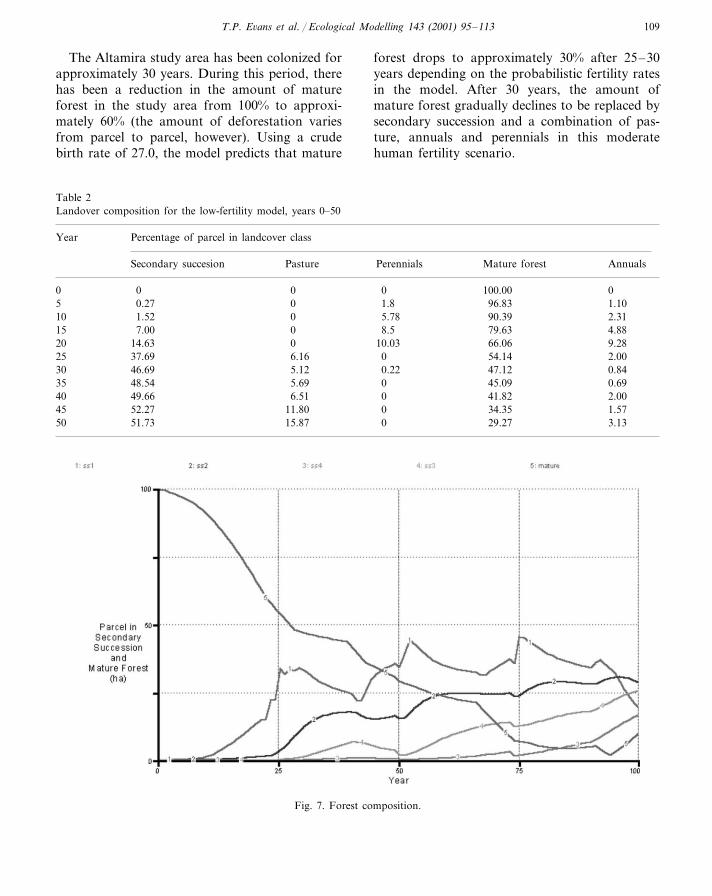
What is critical to questions of biodiversity andcarbon sequestration is the rate of deforestationoccurring in the Brazilian Amazon, and the na-ture of forest regrowth. Fig. 7 represents theproportion of forest in different stages of re-growth for a typical model run. This figure showsthat there is a gradual decline in mature forestand a gradual increase in the amount of forest indifferent successional stages. The rate of theselandcover changes and proportion at differenttime points varies as a function of a variety ofsocial, biophysical and institutional factors, butthe model does represent the mosaic of patches offorest at different stages of regrowth that followssettlement.

T.P. E�ans et al. / Ecological Modelling 143 (2001) 95–113108
Fig. 5. High-fertility scenario.
Fig. 6. Low-fertility scenario.
T.P. E�ans et al. / Ecological Modelling 143 (2001) 95–113 109
The Altamira study area has been colonized forapproximately 30 years. During this period, therehas been a reduction in the amount of matureforest in the study area from 100% to approxi-mately 60% (the amount of deforestation variesfrom parcel to parcel, however). Using a crudebirth rate of 27.0, the model predicts that mature
forest drops to approximately 30% after 25–30years depending on the probabilistic fertility ratesin the model. After 30 years, the amount ofmature forest gradually declines to be replaced bysecondary succession and a combination of pas-ture, annuals and perennials in this moderatehuman fertility scenario.
Table 2Landover composition for the low-fertility model, years 0–50
Percentage of parcel in landcover classYear
Perennials Mature forest AnnualsSecondary succesion Pasture
100.0000 0001.8 96.835 1.100.27 0
1.52 010 5.78 90.39 2.314.8879.638.515 07.00
14.6320 9.280 66.0610.0325 037.69 54.14 2.006.16
0.22 47.1230 0.845.1246.6935 0.6945.0905.6948.54
2.0041.8249.66 06.514034.35 1.5745 52.27 11.80 0
0 29.2750 3.1351.73 15.87
Fig. 7. Forest composition.

T.P. E�ans et al. / Ecological Modelling 143 (2001) 95–113110
Fig. 8. High relative price of perennials to pasture.
An initial spike is seen in the model where matureforest is cleared for annuals production, a transi-tion observed in Altamira and Rondonia (Dale etal., 1993; Brondizio et al., 2001) . After this initialclearing, there is a shift to pasture and perennialsand a drop in the amount of annuals production,another landcover transition observed in Altamira(Brondizio et al., 2001). Throughout the model run,a small amount of area is retained in annualsproduction. According to researchers familiar withthe Altamira study area, landholders prefer to keep2–4 ha of land in annuals for subsistence (primarilybeans and rice) and, to a lesser extent, for sale inlocal agricultural markets. Under typical demo-graphic and price scenarios, the amount of land inannuals ranges from 4 to 10 ha for each model run.
The model is also sensitive to the relative pricesof annuals, perennials and pasture (via cattle). Fig.8 shows a scenario where the price of perennials isinflated relative to the price for annuals or for cattleand the human fertility rate is high. This results ina greater proportion of landcover in perennialsproduction compared with annuals and pastureover the 100 years of the model run and very rapid
clearing of mature forest. This bias towards peren-nials land-use is affected by the availability ofmature forest for clearing and labor. When thereis relatively little labor and plentiful mature forest,there is more pasture relative to perennials. Afterthere is more labor available (children enter adultpool) and less mature forest, there is a transitionto perennials production. Changing these relativeprices affects both the rate of landcover change aswell as the relative proportion of each landcoverclass in the parcel. Researchers familiar with thestudy area indicate the income from 1 ha of annualsand perennials is 400 and 450 reais/year, respec-tively. Lowering the income value for annualsreduces the proportion of the parcel in annuals, asis expected. While these observations do not qualifyas model calibrations in the formal sense, they doindicate that the model can replicate the landcoverchanges observed in the Altamira study area.
7. Discussion
The model necessarily involves a series of sim-plifications of the highly complex nature of land-

T.P. E�ans et al. / Ecological Modelling 143 (2001) 95–113 111
use activities in the Altamira study area. In partic-ular, there is a greater complexity of land-use andlandcover types or classes in Altamira than isrepresented by the basic classes used in the model.The model aggregates crops into two basic classes(annuals and perennials) rather than representingeach crop individually (rice, beans, cocoa). Thus,the model is not able to predict the impact ofchanges in crop prices for a single crop in itspresent state. Additionally, households extract in-come from unmanaged forests in the form ofnon-timber forest products and managed foreststhrough agroforestry.
Another notable simplification is the homo-geneity of biophysical characteristics within a par-cel. While parcels with relatively homogeneoussoil fertility do exist in Altamira, more commonlyagricultural productivity varies within a parcel asa function of soil characteristics introducing aconstraint to the area suitable for specific land-uses. Given the present model structure, it ispossible to represent parcels with either low orhigh soil fertility within a homogeneous parcel,but not to represent a parcel with different pro-portions of low- and high-fertility soils.
Mature forest is represented as forest regrowththat has been in secondary succession for a givenperiod of time. The model currently handles thisin a relatively inelegant manner with a smallproportion of each successional class passing tothe next stage of forest regrowth at each timestep. Additionally, ecologists might argue that,even after 80 years of undisturbed growth, theforest will still not have the species diversity andecological function of primary forest (Shukla andSellers, 1990). The model does not allow forestregrowth rates to vary as a function of previousland-use and crop yields do not vary as a functionof the stage of forest growth cleared and burnedprior to planting. This could be handled if eachunit of land were assigned a specific state but,given the present model structure where landcoveris represented as a series of stocks between whichland passes, this level of complexity would bedifficult to include.
While this model attempts to construct a sim-plified model of land-use activities, the utility ofthis model as a predictive tool is understandably
limited, particularly for long time periods. Ateach time step, there is a probability that themodel will misrepresent the actual behavior ofthat single household. Thus, as time progresses,the likelihood that the model actually representsthe true landcover composition of an individualparcel declines. However, this is not seen as adrawback to this method of research or landcoverchange modeling in general.
While the long-term predictive power for simu-lating a single specific household in Altamira islimited, we believe that, collectively, the set ofmodel runs are a very powerful tool that can beused to observe interactions operating to affectlandcover change in the region. The utility of themodel can be found in understanding the impor-tance of different factors contributing to land-cover change more than as a tool to predict futurelandcover composition. Additionally, it is notpossible to foresee shocks to the system that maydramatically affect the interactions between sec-tors such as natural disasters, changes in technol-ogy or introduction of new crops or cultivars.Nevertheless, the model does represent a reason-able simulation of the existing land-use/landcoverchange process in Altamira.
8. Conclusion
This paper presents a dynamic systems modellinking social and biophysical factors to simulateland-use changes in the Altamira study area. Theutility of this model to predict particular land-cover outcomes is limited by the level of specifica-tion in the model. However, a series of trends areevident from the model output, and thus as ananalytical tool the model provides important in-sight into the relationship between different fac-tors contributing to the process of landcoverchange. In particular, the model showed that highhuman fertility scenarios result in more rapiddeforestation and a system where there is a higherproportion of successional forest growth to ma-ture forest over long time periods. Conversely,low human fertility scenarios indicate a slowerrate of mature forest loss compared with thehigh-fertility scenarios. In this regard, the implica-

T.P. E�ans et al. / Ecological Modelling 143 (2001) 95–113112
tion of demographic trends (e.g. fertility and mi-gration rates) as well as socio-economic trends(e.g., price change) in the land-use pattern can betraced through observing the landcover dynamicsthrough time.
This dynamic model structure enables one tounderstand the process of landcover change as asystem rather than as an isolated set of dependentand independent variables. In addition, the modelconstruction process highlights important rela-tionships in the complex system affecting land-cover change that would have been difficult toexplore relying solely on empirical analysis. Whatis particularly valuable about the process ofmodel construction is to indicate to the researcherand model user what factors are important toinclude in approaching the question of landcoverchange. If a particular model run generates im-plausible outcomes, the model user/creator musthypothesize about what model parameters need tobe adjusted or what additional factors need to beincluded in the model specification. This processof model specification can lead to insights thatwould not have been gained through other re-search methods. In this regard, dynamic systemsmodels can serve as both a tool to explore rela-tionships in landcover change systems and toguide the collection of datasets to be used forempirical analysis. Thus, the combination of dy-namic systems modeling and empirical analysiscan provide greater understanding of landcoverchange systems than either of these research ap-proaches provide individually.
Acknowledgements
The research described in this paper is theproduct of many institutions and team re-searchers. A larger set of projects conducting re-search in the Altamira study area is supported byNIHCHD (9701386A), NSF (SBE 9896014) andNASA (NCC5-334) funding. Emilio Moran, An-drea Siqueira and numerous Brazilian collabora-tors have led the research behind this set ofprojects. Emilio Moran provided helpful com-ments during the construction of this model. Insti-tutional support from the Center for the Study of
Institutions, Population and EnvironmentalChange (NSF; SBR 9521918) is gratefullyacknowledged.
Appendix A. Notes for Table 1
The labor necessary to convert 1 ha of matureforest to annuals is the conversion cost plus thecost to maintain 1 ha of annuals for 1 year.Therefore, the utility to convert any one land-useto another land-use is the conversion cost shownin Table 1 plus the relevant maintenance cost.
Activities where the ‘from’ and ‘to’ land-usesare the same consume only a yearly maintenancelabor cost. Activities where the ‘from’ and ‘to’land-uses differ, consume a yearly maintenancecost for the ‘to’ land-use and a conversion cost forthe labor necessary to convert the area from oneland-use to another.
Mature forest can only transition to annualsbecause field researchers indicate that landholdersprefer to extract what productivity they can fromthe cleared/burned biomass from annuals produc-tion (which benefits the most from higher fertilitysoils) and then let the annuals transition to pas-ture or perennials.
References
Brondizio, E.S., McCracken, S.D., Moran, E.F., Siqueira,A.D., Nelson, D.R., Rodriguez-Pedraza, C., 2001. TheColonist Footprint: towards a conceptual framework ofland use and deforestation trajectories among small farm-ers in Frontier Amazonia. In: C. Wood, R. Porro (Eds.),Land Use and Deforestation in the Amazon. University ofFlorida Press, Gainesville, FL (in press).
Costanza, R., Wainger, L., Folke, C., Maler, K., 1993. Model-ing complex ecological economic systems: toward an evolu-tionary, dynamic understanding of people and nature.Bioscience 43, 545–555.
Dale, V., O’Neill, R.V., Pedlowski, M., Southworth, F., 1993.Causes and effects of land-use change in Central Rondo-nia, Brazil. Photogrammetric Engineering and RemoteSensing 59 (6), 997–1005.
Dale, V.H., O’Neill, R.V., Southworth, F., Pedlowski, M.,1994. Modeling effects of land management in the Brazil-ian Amazon settlement of Rondonia. Conservation Biol-ogy 8 (1), 196–206.

T.P. E�ans et al. / Ecological Modelling 143 (2001) 95–113 113
Leite, L.L., Furley, P.A., 1985. Land development in theBrazilian Amazon with particular reference to Rondoniaand the Ouro Preto colonization project. In: Hemming, R.(Ed.), The Frontier After a Decade of Colonization.Manchester University Press, Manchester, pp. 119–140.
McCracken, S.D., Brondizio, E.S., Nelson, D., Moran, E.F.,Siqueira, A.D., Rodriguez-Pedraza, C., 1999. Remote sens-ing and GIS at farm property level: demography anddeforestation in the Brazilian Amazon. PhotogrammetricEngineering and Remote Sensing 65 (11), 1311–1320.
McCracken, S.D., Siqueira, A., Moran, E.F., Brondizio, E.,2001. Land-use patterns on an agricultural frontier inBrazil: insights and examples from a demographic perspec-tive. In: C. Wood, R. Porro (Eds.), Land Use and Defor-estation in the Amazon. University of Florida Press,Gainesville, FL (in press).
Moran, E.F., 1981. Developing the Amazon. Indiana Univer-sity Press, Bloomington, IN.
Moran, E.F., Brondizio, E., Mausel, P., Wu, Y., 1994. Inte-grating Amazonian vegetation, land-use, and satellite data.BioScience 44 (5), 329–338.
Moran, E.F., Brondizio, E.S., McCracken, S., 2001. Trajecto-ries of land use: soils, succession, and crop choice. In: C.Wood, R. Porro (Eds.), Land Use and Deforestestation inthe Amazon. University of Florida Press, Gainesville, FL(in press).
Shukla, J.C.N., Sellers, P., 1990. Amazon deforestation andclimate change. Science 247, 1322–1325.
Skole, D., Tucker, C., 1993. Tropical deforestation and habitatfragmentation in the Amazon: satellite data from 1978–1988. Science 260, 1905–1910.
United Nations Development Program, 1999. Human Devel-opment Report. United Nations Publications, New York.
Voinov, A., Costanza, R., Wainger, L., Boumans, R., Villa,F., Maxwell, T., Voinov, H., 1999. Patuxent landscapemodel: integrated ecological economic modelling of a wa-tershed. Journal of Environmental Modelling and Software14 (5), 473–491.
Walker, R., Homma, A.K., 1996. Land use and land coverdynamics in the Brazilian Amazon: an overview. Ecologi-cal Economics 18, 67–80.