Report on Indian packaged food industry - Ruchisoya
143
Report On INDIAN PACKAGED FOOD INDUSTRY 12 th August 2021 Ankur Bisen Senior Vice President
-
Upload
khangminh22 -
Category
Documents
-
view
7 -
download
0
Transcript of Report on Indian packaged food industry - Ruchisoya
Report On INDIAN PACKAGED FOOD INDUSTRY 12th August 2021
Ankur Bisen Senior Vice President

2
Technopak Advisors Pvt. Ltd.| Confidential
Contents
1. Macroeconomic Overview of India 3
2. Indian Packaged Food Market Overview 17
3. Overview of Packaged Edible Oil Market in India 25
4. Overview of Soya Products Market in India 46
5. Overview of Indian Oleochemicals Market 51
6. Overview of Market for Key Packaged Food Segments 61
7. Overview of Oil Crush Business in India 96
8. Export Market Overview of Key Categories 103
9. Overview of Nutraceuticals Market in India 118
10. Overview of Palm Plantation Sector 127
Ankur Bisen Senior Vice President

3
Technopak Advisors Pvt. Ltd.| Confidential
1. Macroeconomic Overview of India India GDP and GDP Growth
India is the world's 6th largest economy and expected to be in top 3 global economies by FY 2050 Currently, India ranks sixth in the world in terms of nominal gross domestic product ("GDP") and is the third largest economy in the world in terms of purchasing power parity ("PPP"). India is estimated to be among the top three global economies in terms of nominal GDP by Fiscal 2050.
Exhibit 1: GDP Ranking of Key Global Economies (CY 2020)
Source: World Bank Data, RBI, Technopak Research
India expected to fare better than developed economies and recover to a high growth path in coming years India's real gross domestic product ("GDP") has sustained an average growth between 6% and 7% since FY 1991. India has been the fastest-growing G20 economy since FY 2015, with annual growth rate hovering around 7%. India's economy grew at ~7% in FY 2019. The real growth rate declined to 4% in FY 2020 and witnessed a degrowth of 7.3% in FY 2021 due to the outbreak of COVID-19 pandemic which led to the imposition of lockdowns towards the last quarter of FY 2020 and a major part of the first quarter of FY 2021 causing a contraction in the economy. The impact of COVID-19 has caused several large economies to shrink. It is being estimated that India's GDP is expected to resume its pre-COVID growth momentum by FY22. India witnessed a lower-case load in the 3rd quarter along with economic recovery which continued till the
mid of 4th quarter of FY2021. However, since early March 2021, there has been a continuous rise in the
number of COVID -19 cases in India. Daily new cases had risen to more than 0.2 million at the start of April
2021, and it increased to more than 0.3 million towards end of April 2021. Many state governments have
imposed weekend and night curfew. Maharashtra has been one of the states where the rise in cases was
Country Rank % Share (World GDP,
at current prices) Rank PPP
% Share (World GDP, PPP)
United States 1 24.7% 2 15.8%
China 2 17.4% 1 18.3%
Japan* 3 5.8% 4 3.9%
Germany 4 4.5% 5 3.3%
United Kingdom 5 3.2% 9 2.3%
India 6 3.1% 3 6.7%
France 7 3.1% 8 2.3%
Italy 8 2.2% 10 1.8%
Canada 9 1.9% 14 1.3%
Korea, Republic 10 1.9% 13 1.7%
4
Technopak Advisors Pvt. Ltd.| Confidential
enormous. Other states like Punjab, Haryana, Karnataka, Gujarat were also on the tipping point as
suggested by Union health ministry. Partial/ full lockdown were imposed again in some parts of the
country like Maharashtra, New Delhi, Karnataka etc. where the caseload had been continuously rising.
At the start of FY 22, projections of Indian government, of the IMF and other organizations projected
India's GDP to resume its pre-COVID growth momentum in FY22. This was in the backdrop of India
witnessing a lower-case load in the 3rd quarter of FY 21 and the economic recovery that ensued during
that period and in the following quarter 4. However, since March 2021 there has been a continuous rise
in the number of COVID -19 cases in India. Daily new cases as per official estimates have risen to more
than 0.2 million at the start of April 2021, and that increased to more than 0.3 million towards end of April
2021. In a departure from the intervention of the central government to impose a nationwide lockdown
to mitigate the Wave 1 surge, it was left to the respective state governments (provinces) to impose local
restriction. These interventions ranged from selective restrictions (as in the case of Haryana that stopped
all commercial and retail activities post 6 pm) to total restrictions through curfews (as in the case of Delhi,
Maharashtra that imposed weekly lockdown on all kinds of movements and activities). Ramping up
vaccinations of the citizens was another intervention that the government started to implement by
revising its earlier approach from "produced in India vaccines" to "source all available vaccines from
around the globe". India launched its vaccination drive on 16 January. This was already underway albeit
at a slower pace and with conditions. As on May 1st 2021, over 126 Mn. Indian citizens had received the
1st dose and over 27 Mn. Indian citizens had been fully vaccinated. The vaccination scope was also widened
to include all adults from the earlier approach of vaccinating only above the age group of 45 years. With
the revised vaccination policy currently underway, India plans to vaccinate its entire population by
December 2021.
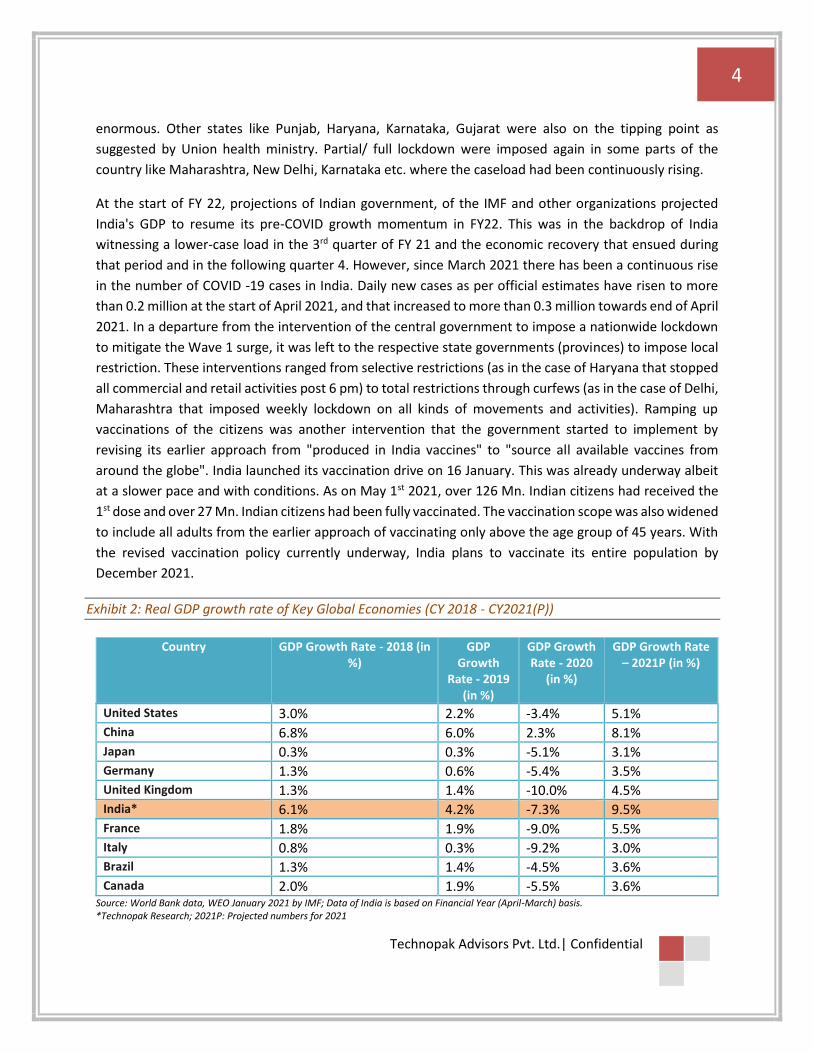
Exhibit 2: Real GDP growth rate of Key Global Economies (CY 2018 - CY2021(P))
Country GDP Growth Rate - 2018 (in
%) GDP
Growth Rate - 2019
(in %)
GDP Growth Rate - 2020
(in %)
GDP Growth Rate – 2021P (in %)
United States 3.0% 2.2% -3.4% 5.1% China 6.8% 6.0% 2.3% 8.1% Japan 0.3% 0.3% -5.1% 3.1% Germany 1.3% 0.6% -5.4% 3.5% United Kingdom 1.3% 1.4% -10.0% 4.5% India* 6.1% 4.2% -7.3% 9.5% France 1.8% 1.9% -9.0% 5.5% Italy 0.8% 0.3% -9.2% 3.0% Brazil 1.3% 1.4% -4.5% 3.6% Canada 2.0% 1.9% -5.5% 3.6%
Source: World Bank data, WEO January 2021 by IMF; Data of India is based on Financial Year (April-March) basis. *Technopak Research; 2021P: Projected numbers for 2021

5
Technopak Advisors Pvt. Ltd.| Confidential
Comparison with other Countries
India's GDP is small in absolute terms, despite high fast growth
Despite its fast growth, India's GDP is small in absolute terms when compared to the GDP of larger
economies. In 2019, India's GDP was approximately one eighth of that of the United States and
approximately one fifth of that of China.
Global economy was severely impacted in CY 2020 due to COVID-19. In some countries economic
downturn has been severe and, in some countries, it has been modest. China's growth rate for Q1 CY 2021
as compared to previous year was a massive 18.3%. Countries like Taiwan, South Korea, Indonesia also
started their recovery journey with growth rates for Q2 CY 2020 being -0.6%, -3.0% and -5.4% respectively.
Countries like UK, France, Mexico, US struggled with GDP growth rate of -21.7%, -19.0%, -19.0% and -9.5%
respectively in Q2 CY 2020.
Almost all these countries rebound in Q3 of 2020. US grew at 33.4% in Q3 and 4% in Q4 CY 2020 quarter
on quarter. UK saw a 16.9% growth in Q3 and 1.3% growth in Q4 of 2020. However, with the increased
lockdown measures, UK's GDP fell by 2.2% in January 2021 and again rose by a marginal 0.4% in February
2021. GDP of Mexico grew at a rate of 12.4% in Q3 and 3.3% in Q4 of 2020. France's GDP grew at 18.5%
in Q3 2020 but fell by 1.4% in Q4 2020. After two successive quarters of contraction (-24.4% in Q1 FY21
and -7.3% in Q2 FY21), India bounced back in Q3 FY21 with a growth rate of 0.4%
The country wise GDP of key countries is given in the table below:
Exhibit 3: Country Wise GDP (US$ trillion)
Country CY 2010
CY 2011
CY 2012
CY 2013
CY 2014
CY 2015
CY 2016
CY 2017
CY 2018
CY 2019
CY 2025P
CAGR (2019-2025)
USA 15 15.5 16.2 16.8 17.5 18.2 18.7 19.5 20.5 21.37 22.1 0.6%
China 6.1 7.6 8.5 9.6 10.4 11 11.1 12.1 13.6 14.3 17.6 3.5%
Japan 5.7 6.2 6.2 5.2 4.9 4.4 4.9 4.9 5.0 5.1 4.9 -0.7%
Germany 3.4 3.7 3.5 3.7 3.9 3.4 3.5 3.7 3.9 3.8 3.8 0.0%
UK 2.5 2.6 2.7 2.8 3 2.9 2.7 2.6 2.8 2.8 2.8 0.0%
India* 0.9 1 1.2 1.4 1.66 1.7 1.9 2.27 2.4 2.7 4.05 7.0%
Brazil 2.2 2.6 2.5 2.5 2.5 1.8 1.8 2.1 1.9 1.8 2.0 1.8%
Russia 1.5 2.1 2.2 2.3 2.1 1.4 1.3 1.6 1.7 1.7 1.5 -2.1%
Indonesia 0.8 0.9 0.9 0.9 0.9 0.9 0.9 1 1 1.1 1.3 2.8%
Turkey 0.8 0.8 0.9 1 0.9 0.9 0.9 0.9 0.8 0.8 1.1 5.5%

6
Technopak Advisors Pvt. Ltd.| Confidential
Saudi Arabia
0.5 0.7 0.7 0.7 0.8 0.7 0.6 0.7 0.8 0.8 NA NA
South Africa
0.4 0.4 0.4 0.4 0.4 0.3 0.3 0.3 0.4 0.4 0.4 0.0%
Source: India Data from RBI, Upto 2019 data from World Bank, Future growth rate from OECD Data, Technopak Research 1US$ = INR 75 (for 2019 India numbers) * For India, CY 2019 means FY 2020
India’s GDP Growth
Since FY 2005, Indian economy's growth rate has been twice as that of the world economy and it is expected to sustain this growth momentum in the long term. In the wake of COVID-19, India's nominal GDP has contracted by approximately 3% in FY2021 and is expected to bounce back and reach US$ 4 Tn by FY 2025. It is also expected that the growth trajectory of Indian economy will enable India to be among the top 3 global economies by FY 2050. Several structural factors are likely to contribute to economic growth in the long run. These include favorable demographics, reducing dependency ratio, rapidly rising education levels, steady urbanization, growing young & working population, IT revolution, increasing penetration of mobile & internet infrastructure, increasing aspirations and affordability etc.
COVID-19 had a massive impact on Indian economy in FY 2021, with GDP in Q1 FY 2021 contracting 24% as compared to same period last year. The contraction in Q1 FY 2021 was not uniform; it varied from state to state and sector to sector. Aviation sector was worst hit followed by tourism, realty, food services etc. But as government eased lockdown restrictions and economy started to open up, the economic trajectory witnessed a growth revival by end of Q1 2021. In FY 22, the Indian GDP was expecting a faster recovery and projected to grow at 14.5 - 15% (in nominal terms). However, given the current surge in the Covid pandemic that has resulted in wide-spread disruption and diversion of attention and resource to mitigate it, the projected growth of Indian GDP in the Q1 of FY 22 appears to be facing head winds and the annual growth many be restricted to 13.5%.

7
Technopak Advisors Pvt. Ltd.| Confidential
Exhibit 4: India's Nominal GDP in FY (US$ Bn)
1 US$=INR 75 White boxes at the top refer to India’s GDP rank on a global basis
Exhibit 5: Historical GDP Growth (%)
Source: RBI Data, World Bank, IMF *2012- GDP Spike in Real growth rate due to change of base from 2004-05 to 2011-12. Hence excluded from decadal growth rate as well
77 137 265 425
848 1,662
2,279 2,518 2,713 2,633 2,987 4,049
80 492489
573
1991 1995 2000 2005 2010 2015 2018 2019 2020 2021P 2022P 2025P
India's Rank in World GDP
Nominal GDP Loss in Nominal GDP due to COVID-19
1%
5% 5%7%
8% 8%
4%6%
9%
4%5%
4%
8% 8% 8% 8% 8%
3%
8%9%
5% 5%6%
7%8% 8%
7% 7%
4%
-7%
9.5%
7%
8%
15%15%15%17%17%
16%
11%
15%
12%
8% 8% 8%
12%14%14%
16%16%
13%15%
20%
13%13%14%
11%13%13%
11%11%
8%
-3%
14.5%
11%12%
-10%
-5%
0%
5%
10%
15%
20%
25%
19
91
19
92
19
93
19
94
19
95
19
96
19
97
19
98
19
99
20
00
20
01
20
02
20
03
20
04
20
05
20
06
20
07
20
08
20
09
20
10
20
11
20
12
20
13
20
14
20
15
20
16
20
17
20
18
20
19
20
20
20
21P
20
22P
20
25P
20
30P
% Growth (Real) - India % Growth (Nominal) - India
7
17 15 13
13
9
7
7
6
6
5
5
10% 10.3% 10%
-3.0% 13.5% 10.7%
Pre COVID-19 Growth Projections
Post COVID-19 Growth Projections
6.9% 11.2% 11.1% 14.4% 14.8% 9.9%
8
Technopak Advisors Pvt. Ltd.| Confidential
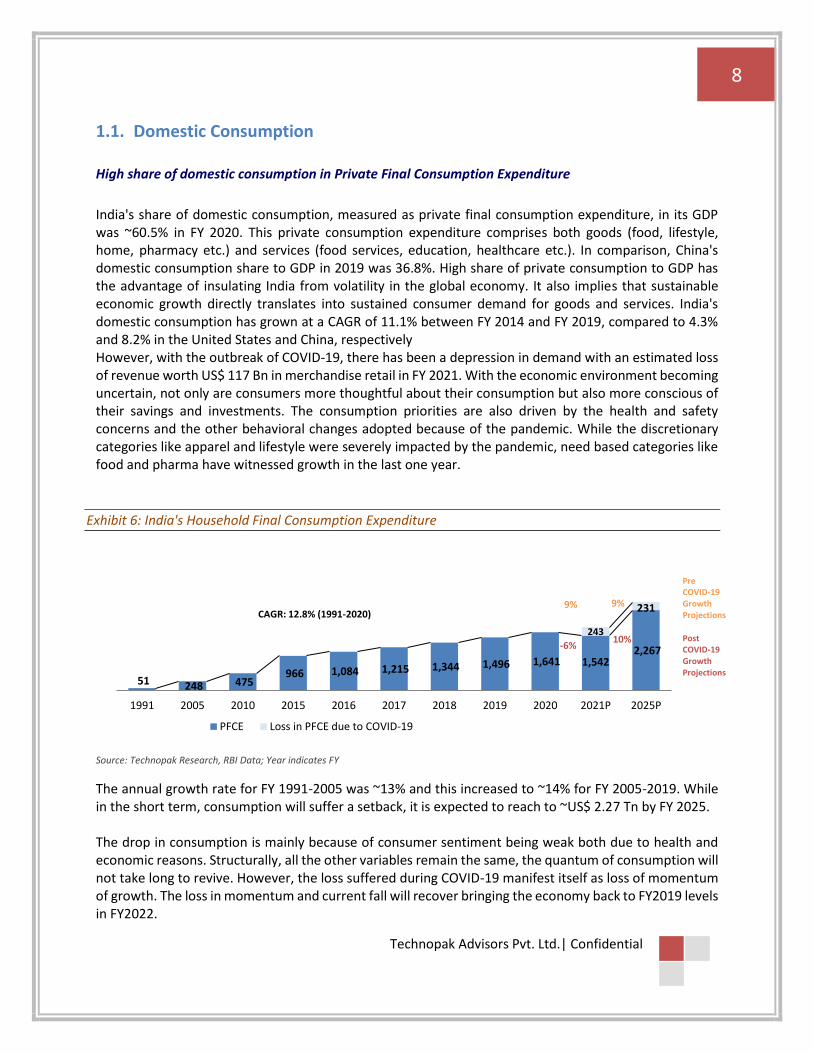
1.1. Domestic Consumption High share of domestic consumption in Private Final Consumption Expenditure
India's share of domestic consumption, measured as private final consumption expenditure, in its GDP was ~60.5% in FY 2020. This private consumption expenditure comprises both goods (food, lifestyle, home, pharmacy etc.) and services (food services, education, healthcare etc.). In comparison, China's domestic consumption share to GDP in 2019 was 36.8%. High share of private consumption to GDP has the advantage of insulating India from volatility in the global economy. It also implies that sustainable economic growth directly translates into sustained consumer demand for goods and services. India's domestic consumption has grown at a CAGR of 11.1% between FY 2014 and FY 2019, compared to 4.3% and 8.2% in the United States and China, respectively However, with the outbreak of COVID-19, there has been a depression in demand with an estimated loss of revenue worth US$ 117 Bn in merchandise retail in FY 2021. With the economic environment becoming uncertain, not only are consumers more thoughtful about their consumption but also more conscious of their savings and investments. The consumption priorities are also driven by the health and safety concerns and the other behavioral changes adopted because of the pandemic. While the discretionary categories like apparel and lifestyle were severely impacted by the pandemic, need based categories like food and pharma have witnessed growth in the last one year.
Exhibit 6: India's Household Final Consumption Expenditure
Source: Technopak Research, RBI Data; Year indicates FY
The annual growth rate for FY 1991-2005 was ~13% and this increased to ~14% for FY 2005-2019. While in the short term, consumption will suffer a setback, it is expected to reach to ~US$ 2.27 Tn by FY 2025. The drop in consumption is mainly because of consumer sentiment being weak both due to health and economic reasons. Structurally, all the other variables remain the same, the quantum of consumption will not take long to revive. However, the loss suffered during COVID-19 manifest itself as loss of momentum of growth. The loss in momentum and current fall will recover bringing the economy back to FY2019 levels in FY2022.
51 248 475 966 1,084 1,215 1,344 1,496 1,641 1,542
2,267
243
231
1991 2005 2010 2015 2016 2017 2018 2019 2020 2021P 2025P
PFCE Loss in PFCE due to COVID-19
CAGR: 12.8% (1991-2020)9% 9%
10%
Pre COVID-19 Growth Projections
Post COVID-19 Growth Projections
-6%
9
Technopak Advisors Pvt. Ltd.| Confidential
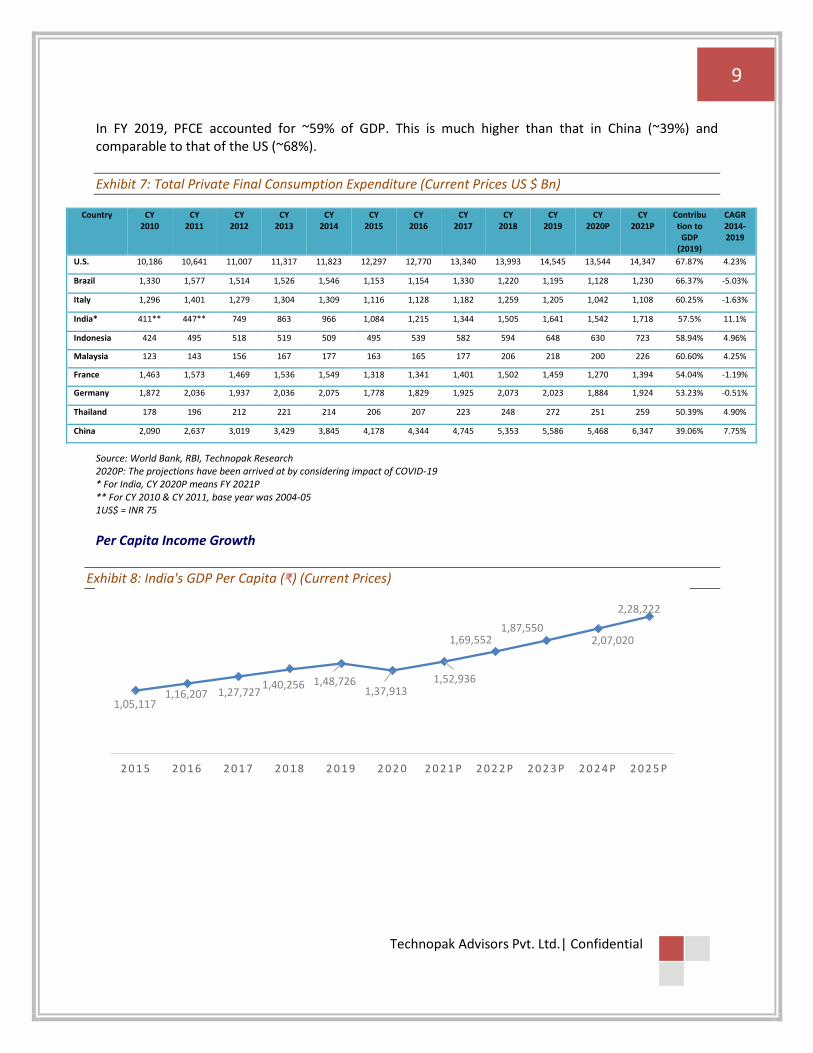
In FY 2019, PFCE accounted for ~59% of GDP. This is much higher than that in China (~39%) and comparable to that of the US (~68%).
Exhibit 7: Total Private Final Consumption Expenditure (Current Prices US $ Bn)
Country CY 2010
CY 2011
CY 2012
CY 2013
CY 2014
CY 2015
CY 2016
CY 2017
CY 2018
CY 2019
CY 2020P
CY 2021P
Contribution to
GDP (2019)
CAGR 2014-2019
U.S. 10,186 10,641 11,007 11,317 11,823 12,297 12,770 13,340 13,993 14,545 13,544 14,347 67.87% 4.23%
Brazil 1,330 1,577 1,514 1,526 1,546 1,153 1,154 1,330 1,220 1,195 1,128 1,230 66.37% -5.03%
Italy 1,296 1,401 1,279 1,304 1,309 1,116 1,128 1,182 1,259 1,205 1,042 1,108 60.25% -1.63%
India* 411** 447** 749 863 966 1,084 1,215 1,344 1,505 1,641 1,542 1,718 57.5% 11.1%
Indonesia 424 495 518 519 509 495 539 582 594 648 630 723 58.94% 4.96%
Malaysia 123 143 156 167 177 163 165 177 206 218 200 226 60.60% 4.25%
France 1,463 1,573 1,469 1,536 1,549 1,318 1,341 1,401 1,502 1,459 1,270 1,394 54.04% -1.19%
Germany 1,872 2,036 1,937 2,036 2,075 1,778 1,829 1,925 2,073 2,023 1,884 1,924 53.23% -0.51%
Thailand 178 196 212 221 214 206 207 223 248 272 251 259 50.39% 4.90%
China 2,090 2,637 3,019 3,429 3,845 4,178 4,344 4,745 5,353 5,586 5,468 6,347 39.06% 7.75%
Source: World Bank, RBI, Technopak Research 2020P: The projections have been arrived at by considering impact of COVID-19 * For India, CY 2020P means FY 2021P ** For CY 2010 & CY 2011, base year was 2004-05 1US$ = INR 75
Per Capita Income Growth
Exhibit 8: India's GDP Per Capita (₹) (Current Prices)
1,05,117 1,16,207 1,27,727
1,40,256 1,48,726 1,37,913
1,52,936
1,69,552 1,87,550
2,07,020
2,28,222
2 0 1 5 2 0 1 6 2 0 1 7 2 0 1 8 2 0 1 9 2 0 2 0 2 0 2 1 P 2 0 2 2 P 2 0 2 3 P 2 0 2 4 P 2 0 2 5 P

10
Technopak Advisors Pvt. Ltd.| Confidential
Year indicates CY Source: IMF projections Note: Numbers for 2021-2025 are Provisional
The per capita income of India has been showing an increasing trend since 2012; growing at a healthy CAGR of approximately 10%, the per capita income reached ₹1,48,726 in CY 19. Given the impact of COVID-19, it is projected to decrease to ₹1,37,913 in CY 20. However, it is expected to bounce back to ₹1,52,936 in the subsequent year and continue its growth journey at a CAGR of 10.5%.
1.2. Growth Drivers India’s medium to long term growth and its positive impact on private consumption will be determined by inter-play of demographics, urbanization and policy reforms.
(1) Demographic Profile of India
Young population India has one of the youngest populations globally compared to other leading economies. The median age
in India is estimated to be 28.1 years in 2021 as compared to 38.1 years and 37.4 years in the United States
and China, respectively, and is expected to remain under 30 years until 2030.
Exhibit 9: Median Age: Key Emerging & Developed Economies (CY2021 Estimated)
Country India China USA Singapore Russia Korea Canada UK
Median Age (Yrs)
28.1 37.4 38.1 34.6 39.6 41.8 42.2 40.5
Source: World Population Review, Technopak Research
The size of India's young population is contributing to a decline in the dependence ratio (the ratio of
dependent population size compared to the working-age population size (15 to 64 years of age), which
has decreased from 64% in Fiscal 2000 to 50% in Fiscal 2018. This trend is expected to lead to rising income
levels per household as well as higher levels of discretionary expenditure. A substantial rise in India’s
working age population from 36% in Fiscal 2000 to 50% in Fiscal 2019 is expected to continue sustaining
the growth momentum of the Indian economy and lead to rising income levels in the long-term. The
10.55%
9.91%
9.81%
6.04%
-7.27%
10.89%10.86%
10.61%
10.38%
10.24%
-10.00%
-5.00%
0.00%
5.00%
10.00%
15.00%
2015 2016 2017 2018 2019 2020 2021 2022 2023 2024 2025 2026
Percentage growth
11
Technopak Advisors Pvt. Ltd.| Confidential
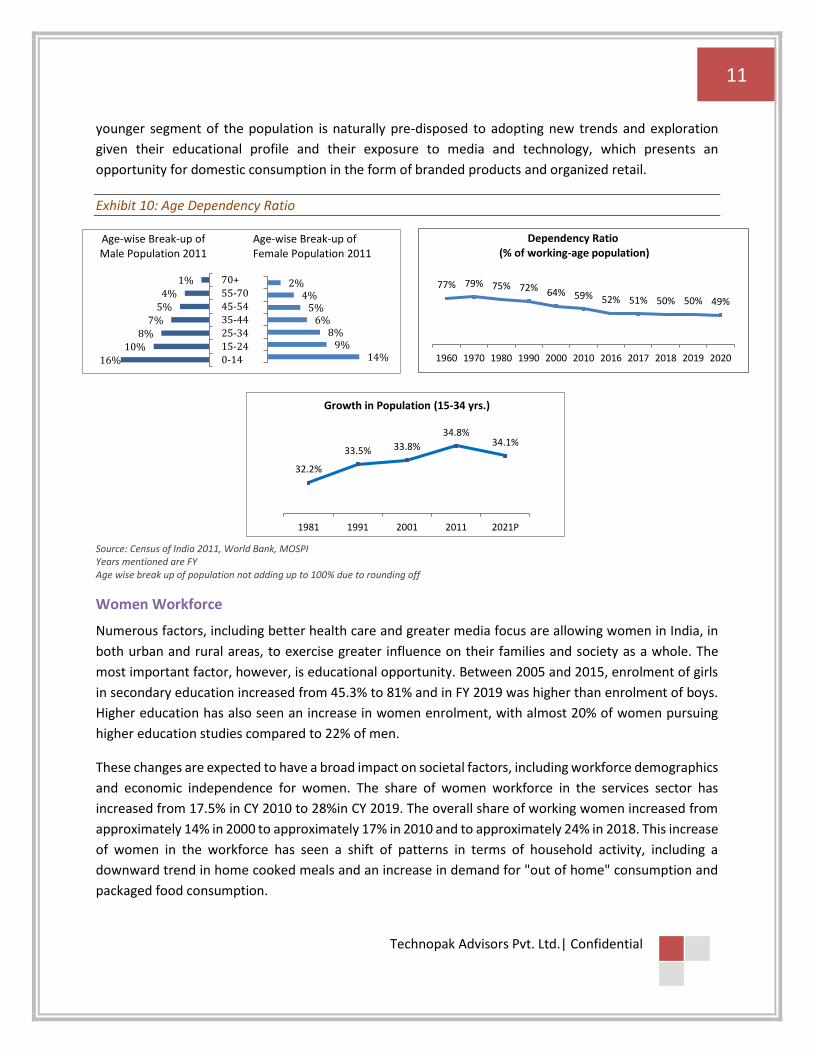
younger segment of the population is naturally pre-disposed to adopting new trends and exploration
given their educational profile and their exposure to media and technology, which presents an
opportunity for domestic consumption in the form of branded products and organized retail.
Exhibit 10: Age Dependency Ratio
Source: Census of India 2011, World Bank, MOSPI Years mentioned are FY Age wise break up of population not adding up to 100% due to rounding off
Women Workforce
Numerous factors, including better health care and greater media focus are allowing women in India, in
both urban and rural areas, to exercise greater influence on their families and society as a whole. The
most important factor, however, is educational opportunity. Between 2005 and 2015, enrolment of girls
in secondary education increased from 45.3% to 81% and in FY 2019 was higher than enrolment of boys.
Higher education has also seen an increase in women enrolment, with almost 20% of women pursuing
higher education studies compared to 22% of men.
These changes are expected to have a broad impact on societal factors, including workforce demographics
and economic independence for women. The share of women workforce in the services sector has
increased from 17.5% in CY 2010 to 28%in CY 2019. The overall share of working women increased from
approximately 14% in 2000 to approximately 17% in 2010 and to approximately 24% in 2018. This increase
of women in the workforce has seen a shift of patterns in terms of household activity, including a
downward trend in home cooked meals and an increase in demand for "out of home" consumption and
packaged food consumption.
32.2%
33.5% 33.8%
34.8%34.1%
1981 1991 2001 2011 2021P
Growth in Population (15-34 yrs.)
14%9%
8%6%
5%4%
2%
Age-wise Break-up of Female Population 2011
16%10%
8%7%
5%4%
1%
0-14 15-24 25-34 35-44 45-54 55-70 70+
Age-wise Break-up of Male Population 2011
77% 79% 75% 72% 64% 59% 52% 51% 50% 50% 49%
1960 1970 1980 1990 2000 2010 2016 2017 2018 2019 2020
Dependency Ratio(% of working-age population)
12
Technopak Advisors Pvt. Ltd.| Confidential
Exhibit 11: Sector wise Split of Female Employment
Sector CY 2010
CY 2011
CY 2012
CY 2013
CY 2014
CY 2015
CY 2016
CY 2017
CY 2018
CY 2019
Agriculture 67.0% 63.6% 60.0% 59.4% 58.7% 57.9% 57.2% 56.4% 55.5% 54.7%
Industry 15.5% 17.1% 18.8% 18.4% 18.2% 18.0% 17.7% 17.5% 17.3% 17.4%
Services 17.5% 19.3% 21.3% 22.2% 23.2% 24.1% 25.1% 26.1% 27.2% 28.0%
Total Female Employment (in Mn.)
106 102 98 98 98 98 98 98 98 100
Source: World Bank Data
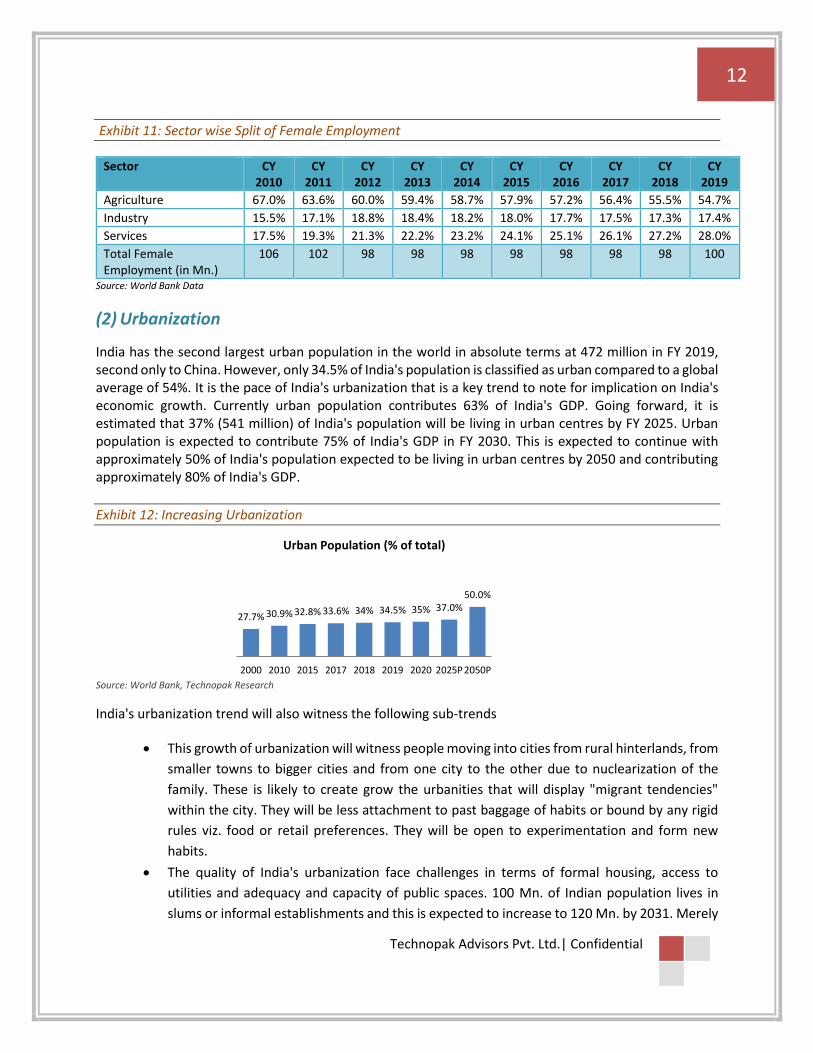
(2) Urbanization
India has the second largest urban population in the world in absolute terms at 472 million in FY 2019, second only to China. However, only 34.5% of India's population is classified as urban compared to a global average of 54%. It is the pace of India's urbanization that is a key trend to note for implication on India's economic growth. Currently urban population contributes 63% of India's GDP. Going forward, it is estimated that 37% (541 million) of India's population will be living in urban centres by FY 2025. Urban population is expected to contribute 75% of India's GDP in FY 2030. This is expected to continue with approximately 50% of India's population expected to be living in urban centres by 2050 and contributing approximately 80% of India's GDP.
Exhibit 12: Increasing Urbanization
Source: World Bank, Technopak Research
India's urbanization trend will also witness the following sub-trends
• This growth of urbanization will witness people moving into cities from rural hinterlands, from
smaller towns to bigger cities and from one city to the other due to nuclearization of the
family. These is likely to create grow the urbanities that will display "migrant tendencies"
within the city. They will be less attachment to past baggage of habits or bound by any rigid
rules viz. food or retail preferences. They will be open to experimentation and form new
habits.
• The quality of India's urbanization face challenges in terms of formal housing, access to
utilities and adequacy and capacity of public spaces. 100 Mn. of Indian population lives in
slums or informal establishments and this is expected to increase to 120 Mn. by 2031. Merely
27.7% 30.9% 32.8% 33.6% 34% 34.5% 35% 37.0%50.0%
2000 2010 2015 2017 2018 2019 2020 2025P 2050P
Urban Population (% of total)
13
Technopak Advisors Pvt. Ltd.| Confidential
35% of urban households are connected to central sewage systems thereby creating stress on
sanitation. Improving these aspects through public infrastructure development programs and
upgradation of city's infrastructure will witness continued policy focus and that in turn will
witness inward movement of people to implement these programs. However, the funding
priorities and pace of change will witness a lag from the urgency of improving the status quo
and the next decade will witness this churn of India's urbanization trajectory.
• Covid induced lockdown that India has witnessed twice within 12 months has accelerated trends like "Work from Home" for service jobs. Also, job losses in the informal economy within cities has witnessed unemployment. Both these factors have caused reverse migration for both blue collar workers and white collar led service economy. While, these disruptions will not change the overall trend of urbanization with approximately 50% of India's population expected to be living in urban centres by 2050, these factors may likely change the contours of urbanization and it may become more distributive (spread out) than concentrated. For instance, owing to the lockdown, companies across sectors have allowed 'work from home' for their employees which has led to a large section of the working class to move back to their native cities and towns enabling the Tier II and III cities to be the new consumptions centres leading. Post Covid this trend may sustain for the operating cost advantages that WFH has enabled for many organizations. Overtime, these cities may become "micro consumption clusters" that is predisposed to branded and contemporary choices for merchandise and service categories.
• The intensity, disruptive factors due to the pandemic and quality of urbanization will make
urban Indians time poor and resource constraint. Access to physical retail may become purely
a matter of recreation, extended WFH may extend working hours leaving little time for family
and recreation, pollution and transport challenges may change their behaviour towards
convivence over destination. This will impact their choices to consume products and services
to pivot towards options that offer value, convivence and ease.
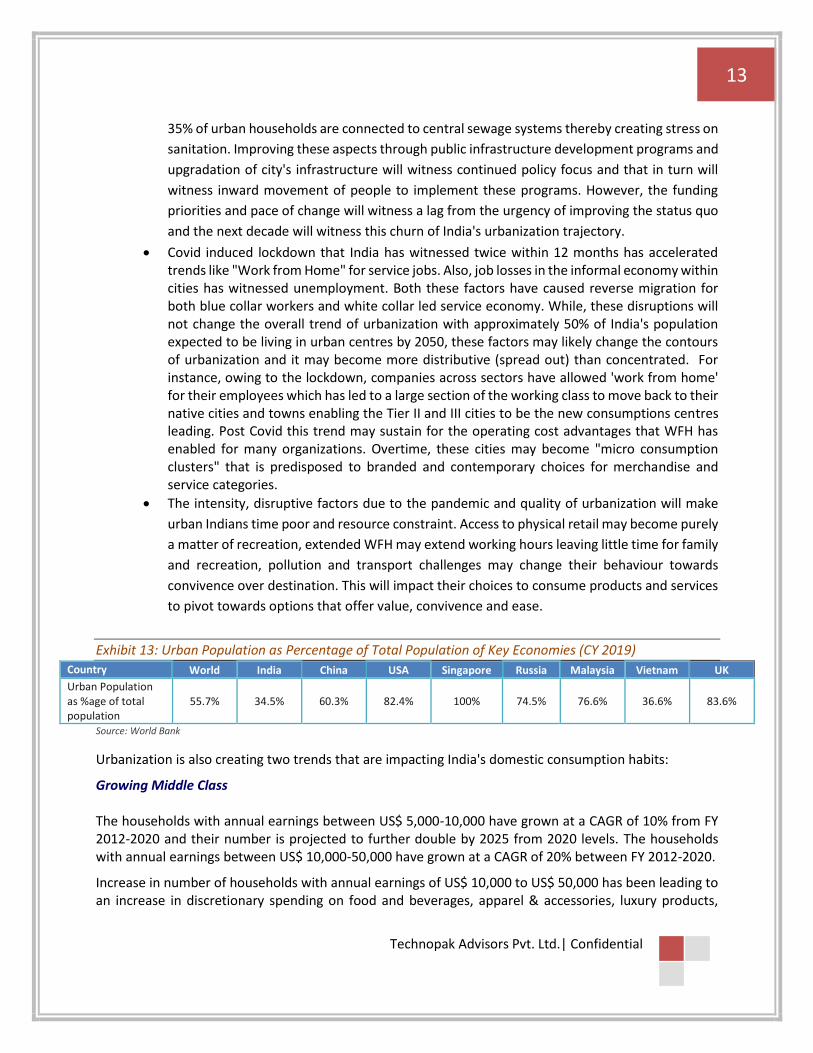
Exhibit 13: Urban Population as Percentage of Total Population of Key Economies (CY 2019)
Country World India China USA Singapore Russia Malaysia Vietnam UK
Urban Population as %age of total population
55.7% 34.5% 60.3% 82.4% 100% 74.5% 76.6% 36.6% 83.6%
Source: World Bank
Urbanization is also creating two trends that are impacting India's domestic consumption habits:
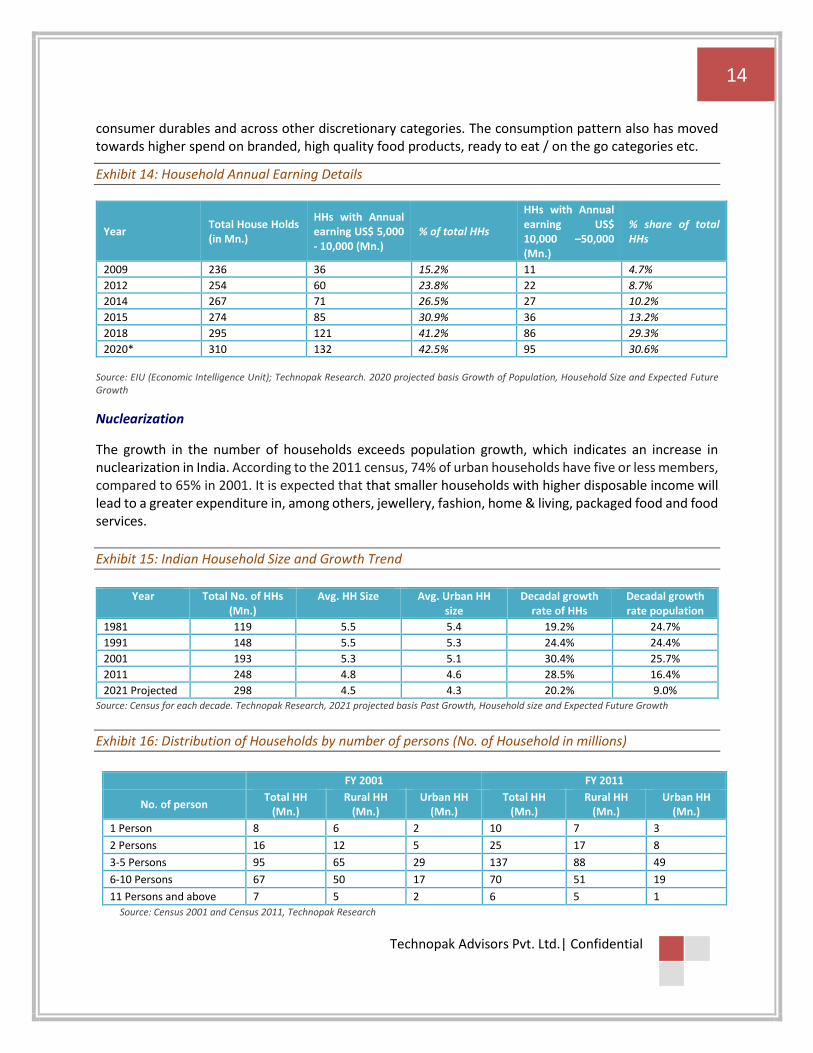
Growing Middle Class The households with annual earnings between US$ 5,000-10,000 have grown at a CAGR of 10% from FY 2012-2020 and their number is projected to further double by 2025 from 2020 levels. The households with annual earnings between US$ 10,000-50,000 have grown at a CAGR of 20% between FY 2012-2020.
Increase in number of households with annual earnings of US$ 10,000 to US$ 50,000 has been leading to an increase in discretionary spending on food and beverages, apparel & accessories, luxury products,
14
Technopak Advisors Pvt. Ltd.| Confidential
consumer durables and across other discretionary categories. The consumption pattern also has moved towards higher spend on branded, high quality food products, ready to eat / on the go categories etc.
Exhibit 14: Household Annual Earning Details
Year Total House Holds (in Mn.)
HHs with Annual earning US$ 5,000 - 10,000 (Mn.)
% of total HHs
HHs with Annual earning US$ 10,000 –50,000 (Mn.)
% share of total HHs
2009 236 36 15.2% 11 4.7%
2012 254 60 23.8% 22 8.7%
2014 267 71 26.5% 27 10.2%
2015 274 85 30.9% 36 13.2%
2018 295 121 41.2% 86 29.3%
2020* 310 132 42.5% 95 30.6% Source: EIU (Economic Intelligence Unit); Technopak Research. 2020 projected basis Growth of Population, Household Size and Expected Future Growth
Nuclearization
The growth in the number of households exceeds population growth, which indicates an increase in nuclearization in India. According to the 2011 census, 74% of urban households have five or less members, compared to 65% in 2001. It is expected that that smaller households with higher disposable income will lead to a greater expenditure in, among others, jewellery, fashion, home & living, packaged food and food services.
Exhibit 15: Indian Household Size and Growth Trend
Year Total No. of HHs
(Mn.) Avg. HH Size Avg. Urban HH
size Decadal growth
rate of HHs Decadal growth rate population
1981 119 5.5 5.4 19.2% 24.7%
1991 148 5.5 5.3 24.4% 24.4%
2001 193 5.3 5.1 30.4% 25.7%
2011 248 4.8 4.6 28.5% 16.4%
2021 Projected 298 4.5 4.3 20.2% 9.0% Source: Census for each decade. Technopak Research, 2021 projected basis Past Growth, Household size and Expected Future Growth
Exhibit 16: Distribution of Households by number of persons (No. of Household in millions)
FY 2001 FY 2011
No. of person Total HH
(Mn.) Rural HH
(Mn.) Urban HH
(Mn.) Total HH
(Mn.) Rural HH
(Mn.) Urban HH
(Mn.)
1 Person 8 6 2 10 7 3
2 Persons 16 12 5 25 17 8
3-5 Persons 95 65 29 137 88 49
6-10 Persons 67 50 17 70 51 19
11 Persons and above 7 5 2 6 5 1
Source: Census 2001 and Census 2011, Technopak Research
15
Technopak Advisors Pvt. Ltd.| Confidential
(3) Reforms: Critical to create Demand Stimulus Structural reforms are critical to harness dividends of positive demographics and urbanization and there
are risks if they fail to do so.
The first wave of reforms started in the mid-1980s, with increased participation of private sector in
economy as the public sector began to reduce its role in the economy. Economic performance improved,
with GDP growth accelerating from an average of 3.9% in the first half of the 1980s to an average 5.3% in
the second half of the decade.
The second wave of reforms came as a response to the FY 1991 balance of payments crisis. The crux of
the reform process was to signal the shift to a more open economy, involving a greater role of market
forces, the private sector and foreign investment. As the benefits of reforms began to trickle through, the
global economy slowed down and the benefits from the reforms did not translate fully into India’s
economic performance. From the early 2000’s as global economy recovered India’s growth trend
improved significantly.
In the last 10 years, Government has pushed towards infrastructure investments in roads, railways,
defense and power; public-private partnerships; smart cities; skill development; widening of domestic
manufacturing base and taxation needs to yield jobs for India’s working population. This push also needs
to deliver sustainable urbanization that provides affordable housing, improved public health metrics and
mass transportation. Many of these interventions continue to be work in progress and outcome on these
initiatives will deliver the advantages of urbanization and India’s demographic dividend towards sustained
growth of private consumption and its positive impact on discretionary purchases.
Aatma Nirbhar Bharat Abhiyan
Almost equivalent to 10% of GDP, the stimulus package announced by the Indian government contains
1.2% of direct stimulus measures and the remaining 8.8% includes liquidity support measures and credit
guarantees. Investments for infrastructure development and credit facilitation for agriculture,
horticulture, fisheries, animal husbandry and food processing industries and support to other MSMEs
through public sector expenditure entails a long -term investment and dividend cycle. It is expected to
attract participation from private players and create more job opportunities resulting in an uptick in
income levels and thereby consumption. The Government of India has allocated ₹150,000 crore for
investments and credit facilitation for various areas of agriculture, horticulture, fisheries and animal
husbandry.
The reforms around agri-marketing (Amendment in Essential Commodities Act, Agricultural Produce
Market Committee Act, and Development of a legal framework for contract farming) were long overdue
and if implemented in the right spirit, they will bring efficiencies in the value chain and improve value
16
Technopak Advisors Pvt. Ltd.| Confidential
realization for farmers. These will also encourage inflow of private investments in the food processing
industry, thereby building a platform for jobs in the rural India.
The Finance Minister of India has also announced an additional INR 40,000 crore for the Mahatma Gandhi
National Rural Employment Guarantee Act scheme to create employment for the migrants who have
returned home and who are expected to stay there till the end of the monsoon.
The Government had also allocated free food grains to all the migrants for a period of two months. This was to benefit 80 million migrants and entailed an outflow of approximately INR 3,500 crore to the central government. This Garib Kalyan Anna Yojana had been further extended till November 2020 with the coverage expanded to over 800 million people. This is an additional cost of over INR 90,000 crore for the government.

17
Technopak Advisors Pvt. Ltd.| Confidential
2. Indian Packaged Food Market Overview The Indian packaged food retail market, estimated at ~INR 6,00,000 Cr in FY 2020 contributes only 15% to the total food and grocery retail market estimated at INR 39,45,000 Cr in FY 2020. While the Indian food retail remains dominated by unbranded products such as fresh fruits and vegetables, loose staples, fresh unpackaged dairy and meat, however the packaged food market is growing at almost double the pace of the overall category and is expected to gain a market share of 17% by FY 2025. Health concerns and limitation in movement due to COVID -19 has accelerated the growth of packaged food products which offer consistent and assured quality along with convenience.
Demand for packaged foods surged in the first quarter of FY 2021 as people stocked up in panic during the lockdown period. The shutting down of foodservice options also led to a rise in the eating occasions at home. While other sectors in retail are expected to contract by 30-35% during Financial Year 2021 due to the impact of COVID-19, the packaged food segment is expected to grow at an accelerated growth rate of ~14%.
Exhibit 17: Packaged Food Retail Market in India (INR Cr)
Source: Technopak Research
Exhibit 18: Packaged Food Retail Categories
Market Size
FY 2015
(INR Cr)
CAGR
(FY2015-
FY2020)
Market Size
FY2020
(INR Cr)
CAGR
(FY2020-
FY2025)
Market Size
FY2025
(INR Cr)
Packaged Dairy (Fresh) 55,000 12% 96,800 12% 1,67,000
Packaged Meat 12,000 5% 15,000 6% 20,000
Packaged Staples – Edible Oils 1,11,000 7% 1,56,000 7% 2,14,000
Packaged Staples - Others 40,000 12% 70,000 15% 1,40,000
Other Processed Packaged Food 1, 28,000 11% 2,16,200 13% 3,95,000
3,76,000
6,02,000
10,13,000
FY 2015 FY 2020 FY 2025P
18
Technopak Advisors Pvt. Ltd.| Confidential
Packaged Beverages 30,000 10% 48,000 10% 77,000
Total 3,76,000 10% 6,02,000 11% 10,13,000
Source: Technopak Research
• Packaged Dairy (Fresh) is the pouched milk/curd/yoghurt/paneer etc. with a shelf life of 2-3 days marketed by food processing companies and co-operatives.
• Packaged Meat comprises of branded animal products such eggs and chilled or frozen meat products. Given the dominance of the fresh cuts in India, packaged meat is a relatively small category.
• Packaged Staples primarily include branded staples such as (a) edible oils and (b)others such as wheat flour, rice, pulses, sugar and spices.
• Other Processed Packaged Food includes baked goods such as biscuits and breads, confectionery, savoury snacks, pasta, noodles, sauces, breakfast cereals, value added dairy products, baby food, tea leaves, coffee powder and other categories. Value added dairy products, baked goods including biscuits and breads and savoury snacks dominate this segment.
• Packaged Beverages include packaged water, aerated beverages, juices and sports drinks amongst others.
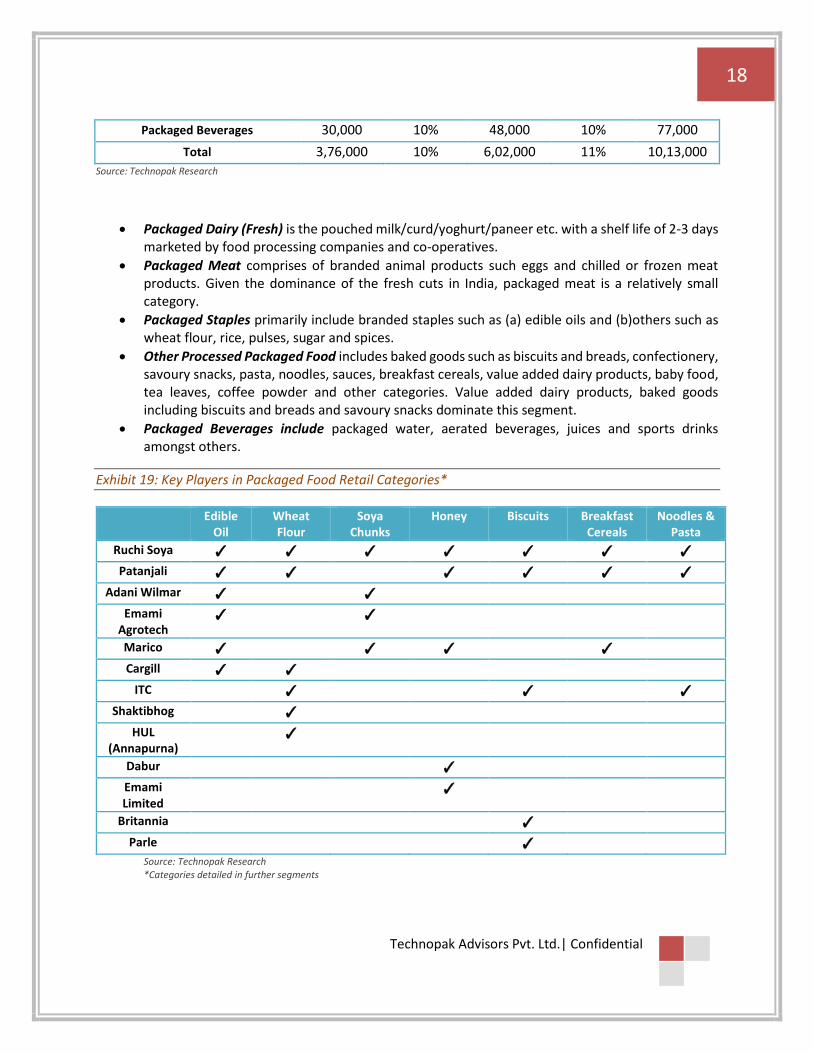
Exhibit 19: Key Players in Packaged Food Retail Categories*
Edible
Oil Wheat Flour
Soya Chunks
Honey Biscuits Breakfast Cereals
Noodles & Pasta
Ruchi Soya ✓ ✓ ✓ ✓ ✓ ✓ ✓
Patanjali ✓ ✓ ✓ ✓ ✓ ✓
Adani Wilmar ✓ ✓
Emami Agrotech
✓ ✓
Marico ✓ ✓ ✓ ✓
Cargill ✓ ✓
ITC ✓ ✓ ✓
Shaktibhog ✓
HUL (Annapurna)
✓
Dabur ✓
Emami Limited
✓
Britannia ✓
Parle ✓ Source: Technopak Research *Categories detailed in further segments
19
Technopak Advisors Pvt. Ltd.| Confidential
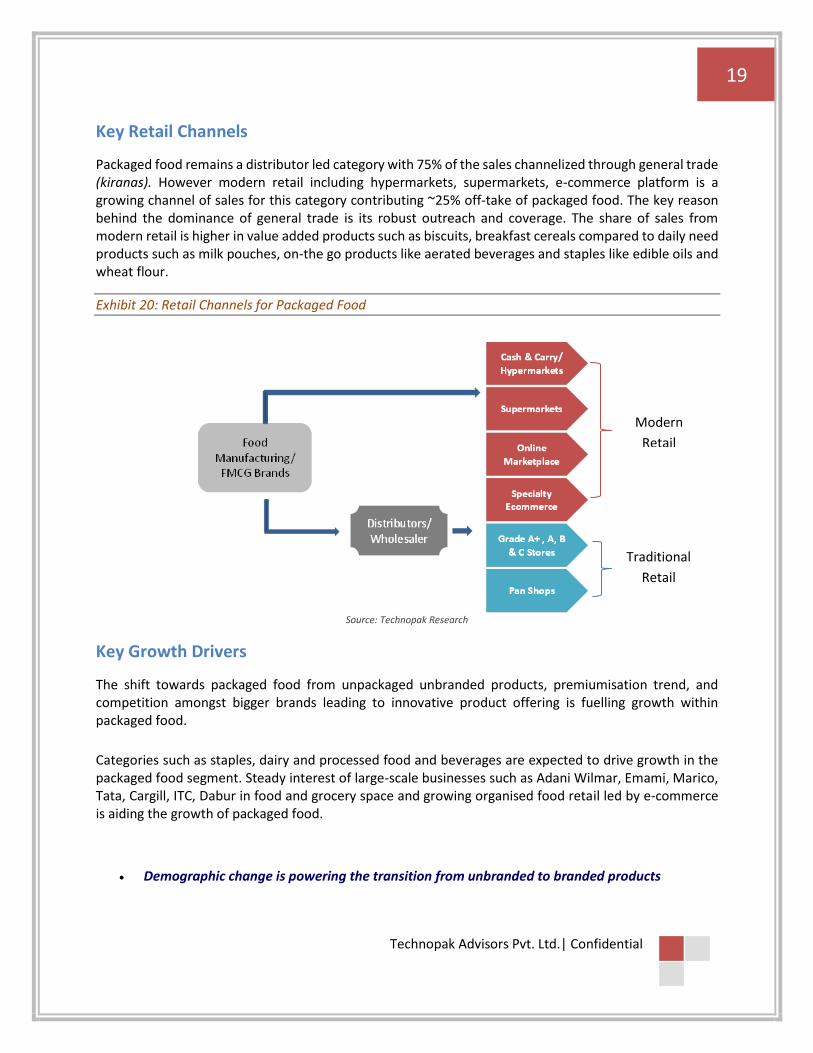
Key Retail Channels
Packaged food remains a distributor led category with 75% of the sales channelized through general trade (kiranas). However modern retail including hypermarkets, supermarkets, e-commerce platform is a growing channel of sales for this category contributing ~25% off-take of packaged food. The key reason behind the dominance of general trade is its robust outreach and coverage. The share of sales from modern retail is higher in value added products such as biscuits, breakfast cereals compared to daily need products such as milk pouches, on-the go products like aerated beverages and staples like edible oils and wheat flour.
Exhibit 20: Retail Channels for Packaged Food
Source: Technopak Research
Key Growth Drivers
The shift towards packaged food from unpackaged unbranded products, premiumisation trend, and competition amongst bigger brands leading to innovative product offering is fuelling growth within packaged food.
Categories such as staples, dairy and processed food and beverages are expected to drive growth in the packaged food segment. Steady interest of large-scale businesses such as Adani Wilmar, Emami, Marico, Tata, Cargill, ITC, Dabur in food and grocery space and growing organised food retail led by e-commerce is aiding the growth of packaged food.
• Demographic change is powering the transition from unbranded to branded products
Modern
Retail
Traditional
Retail

20
Technopak Advisors Pvt. Ltd.| Confidential
Growing number of youth in the workforce, urbanisation, rise in the middle-class population, as well as increase in disposable income across the socio-economic spectrum, higher among urban residents have been driving the consumption of packaged food in India.
Other influencing factors include the number of women entering the workplace and the evolution of the Indian household, from a multi-generational, extended family unit to single occupant or nuclear family households. These changes mean higher disposable incomes and less time for buying, primary processing and preparation, both of which favour a shift from unbranded to branded products which offer consistent and assured quality along with convenience.
• Gradual expansion of modern retail including e-commerce While the current share of modern retail in packaged food sales continues to be small but this share has slowly increased over the last few years and will continue to rise going forward. The quality of retail shelves and customer interface of modern retail both brick and mortar and e-commerce aid the growth of packaged food for their ability to introduce new categories of packaged food and to offer more choice to consumers facilitating changes in shopping habits.
• Increased in-home consumption during COVID-19
Food retail is the only category within overall retail which is expected to register 6-7% growth in the year FY 2021 given the negative impact of COVID-19 on consumption. In-home consumption of food products soared initially during the lockdown and thereafter also remained elevated due consumers working from home and having a lesser frequency of eating out due to heath and economic reasons. This trend of increased in-home consumption has sustained in the first quarter of FY 2022 as the impact of second COVID wave continues.
• Formalisation of Food Service Industry: Organized food service industry has been growing at a CAGR of 14%, much faster than the overall food service industry. This consistent transition has formalized the raw material procurement processes and supplier management system with the demand shifting in favour of the large-scale branded suppliers.
• Introduction of Smaller pack size: Introduction of Smaller pack size at low prices in various categories such as staples, biscuits, savoury snacks encourages trials in new customer segments thereby enrolling them for future purchases.
• Government policies supporting food processing
The food production and processing industry is a high focus and priority sector for the government and multiple schemes and initiatives have been launched to bolster growth in this sector
• FDI up to 100%, under the automatic route, is allowed in food processing industry. Further, 100% FDI under government route for retail trading, including through e-commerce, is permitted in respect of food products manufactured and/or produced in India. Over the years, India has been able to attract investment from food and beverages
21
Technopak Advisors Pvt. Ltd.| Confidential
companies like Nestlé, Cargill, McCain, Mondelez, Pepsi, Coca Cola and also from retail trade companies like Amazon and Walmart.
• Policies such as 'Food Parks' are designed to address weaknesses throughout the value chain. In 2016, The Food Safety and Standards Authority of India (FSSAI) launched a scheme to invest around INR 482 crore (US$ 72.3 million) to strengthen the food testing infrastructure in India, by upgrading 59 existing food testing laboratories and setting up 62 new mobile testing labs across the country. National Food Laboratory (NFL), Ghaziabad, one of the two premier referral laboratories under the direct control of FSSAI was inaugurated in 2019. The one in Kolkata is also being upgraded. FSSAI plans to set up new NFLs in Mumbai and Chennai in the near future. Increasing awareness for safe products, the food law administration restricting loose product sale and the crackdown by the government on unfair trade practices has been aiding this growth
• The recently announced reforms around agri-marketing (Farmers’ Produce Trade and Commerce (Promotion and Facilitation) Act, Farmers (Empowerment and Protection) Agreement on Price Assurance and Farm Services Act, and the Essential Commodities (Amendment) Act) are expected to bring efficiencies in the value chain and improve value realization for farmers. These will also encourage inflow of private investments in the food processing industry, thereby building a platform for jobs in the rural India.
• “Production Linked Incentive Scheme for Food Processing Industry (PLISFPI)” has also been approved to support creation of global food manufacturing champions commensurate with India’s natural resource endowment and support Indian brands of food products in the international markets with an outlay of INR 10900 Cr. The first component relates to incentivising manufacturing of four major food product segments viz. Ready to Cook/ Ready to Eat (RTC/ RTE) foods including Millets based products, Processed Fruits & Vegetables, Marine Products, Mozzarella Cheese. Innovative/ Organic products of SMEs including Free Range - Eggs, Poultry Meat, Egg Products in these segments are also covered under above component.
Challenges
• Lack of integrated supply chain and infrastructure
Every year India's farms lose between 20-25% of their fruit and vegetable output due to spoilage at various stages. Nearly 90% of food processing units are small scale, operating with limited use of technology to enhance the lifespan of their produce. These problems are compounded by India's evolving transport infrastructure, which compares unfavourably to other nations on transit time and transaction costs.
• Lack of modern retail infrastructure
Packaged food requires special shelves to maintain optimum temperature for the food products and simultaneously offer product visibility. Overall penetration of organised retail in food and grocery is 4.5%. Almost all its entire presence is concentrated clusters in urban India. This adds challenge to packaged food in terms of category extension, product innovation, and brand building. In this context, the growth of packaged food in India requires a multi-channel approach that is significantly skewed towards general kirana stores. All major national and regional players
22
Technopak Advisors Pvt. Ltd.| Confidential
therefore need wide retail touch points of general stores and modern retail to emerge as category leaders.
• Profitability continues to pose a challenge for mass categories
In order to be profitable in the packaged foods sector, companies need scale, the ability to charge a premium, an efficient cost structure, branding, deeply penetrated PAN-India distribution network, – each of which poses a challenge for regional and small players with mass market positioning in India.
• Sourcing of Raw materials: Due to evolving supply chain and fragmented farming, the raw materials sourcing for packaged food is subject to price fluctuation.
• Pricing Challenge: Low levels of disposable income, a value-conscious consumer and a strong bargaining culture make it hard for companies to charge a premium, particularly with competition from unbranded local players in the mass segment.
Key Emerging Trends
Emerging trends in India are affecting consumers’ behaviours and consumption patterns.
• Consumers shifting towards packaged and branded products
This shift first manifested in processed categories such as savoury snacks, biscuits, breads and buns. However, it is also becoming significant in staple categories like edible oil, wheat flour, spices and pulses. given the growing concern for food safety and inclination towards hygienically packaged products. This shift has been accelerated by the COVID 19 pandemic and this is expected to continue in future.
• Consumers across the spectrum are moving towards premium products Whether this means a change from preparing all foods from scratch to purchasing certain ready-made items, a move from standard to premium snack items, or the switch from basic staples to enriched, organic or luxury versions, consumers are moving upwards through food categories and prices. As India's different market segments evolve, they move in the same order through the same stages, with a 5-7-year time-lag. Thus, the premium currently placed on health by a high-income urban housewife will be echoed in time by a lower-income consumer, who will subsequently begin to purchase items such as soups or breakfast cereals.
• Convenience and healthy eating trends continue to drive sales With the growing health consciousness amongst the consumers, players are using health as a platform to introduce new variants in almost all categories. Introduction of these products not only augments the brand’s ability to command premium but also outpaces the growth of the overall category. The perception of packaged foods is changing among consumers as there has been a significant rise in the convenience, availability and affordability of such products across the country. With the onset of information sharing through various sources like social and printed media, consumers are more informed about the benefits and downsides of packaged foods, leading to better informed decisions while consuming products.
23
Technopak Advisors Pvt. Ltd.| Confidential
• Emergence of Modern Retail and Online Grocery delivery platforms Though the modern retail contributes only 4.5% of total Food and Grocery retail, it is expected to grow at a high rate of 22% till 2025.
• The modern retail is dominated by Reliance Retail and DMart. They account for 37% of the total modern retail sales. This segment has witnesses multiple M&A activities in last few years.
• This growth in modern retail is expected to be led by ecommerce which contributes only 0.5% in FY2020. However, by FY2025, it is expected to contribute ~4% to the total Food and Grocery retail growing at a CAGR of 59%. Online grocery delivery platforms like BigBasket and Grofers have catalysed consumer demand for packaged food in Metros, Mini-Metros and Tier 1 cities.
• Micro-delivery platforms like MilkBasket which deliver milk and grocery products on daily basis have inspired modern retailers to start similar service to service daily demands.
• Growing necessity, convenience and availability to drive future growth Packaged food will continue to post double digit growth over the forecast period, mainly due to rising demand for convenience as a result of the increasingly hectic pace of modern life, as well as growing awareness and availability. Essential commodities like edible oils, dairy, rice, bread and breakfast cereals are dietary cornerstones and will fuel demand among consumers, while products like biscuits, savoury snacks, breads, confectionery, spreads, soups, noodles, pasta and ice creams will remain the most dynamic categories over the forecast period.
• Experimentation with New Brands Across segments consumers are increasingly willing to try new brands, rather than remaining loyal to one. This has far-reaching implications for marketers, who now need to work not just to attract new consumers but also to retain existing ones. Seeking novelty in more than just brands, consumers are starting to play with new formats and flavors. However, this experimentation is best described as cautious. Taste continues to be of paramount importance and new purchases occur within a 'comfort-zone'. In practice, people are more likely to experiment in snacks and beverages than in meal-time choices.
• Regional companies gaining sales share and competing strongly with Leading Players Across packaged food strong regional leaders have evolved that have established their regional dominance while competing with national brands. Two reasons have contributed to emergence/success of regional brands. Firstly, regional focus has allowed these brands to respond to local taste and preferences of consumers faster than national brands. Secondly, their integrated supply chains (with own manufacturing) have allowed them to build competencies on quality assurance and standardisation, factors important for success of packaged food play.
24
Technopak Advisors Pvt. Ltd.| Confidential
Indian Packaged Food Market Prospects Rural vs Urban
Rural areas are set to become increasingly significant in driving growth in the Indian packaged food market over 2020-2025. Brands’ efforts to extend their distribution reach in rural markets will increase product availability and drive growth. Also, as a part of rural market expansion strategy, brands introduce smaller, lower priced SKUs in rural market across wide range of packaged food categories. But its trade-off is on pricing and profitability. Rural markets are pertinent to unlock next phase of growth for brands.
The consumption of packaged food is much higher in the urban areas attracting lot more companies to launch new types of products and variants. Urban areas account for ~65-70% of the demand for all packaged food. Meanwhile, urban markets are expected to see a continuing emphasis on health and wellness. Indeed, as consumer health-awareness becomes more sophisticated, especially amongst younger demographics, brands targeting of health issues is expected to become more refined, focusing on particular conditions and nutritional requirements.
25
Technopak Advisors Pvt. Ltd.| Confidential
3. Overview of Packaged Edible Oil Market in India
Edible Oil Availability in India (Volume)
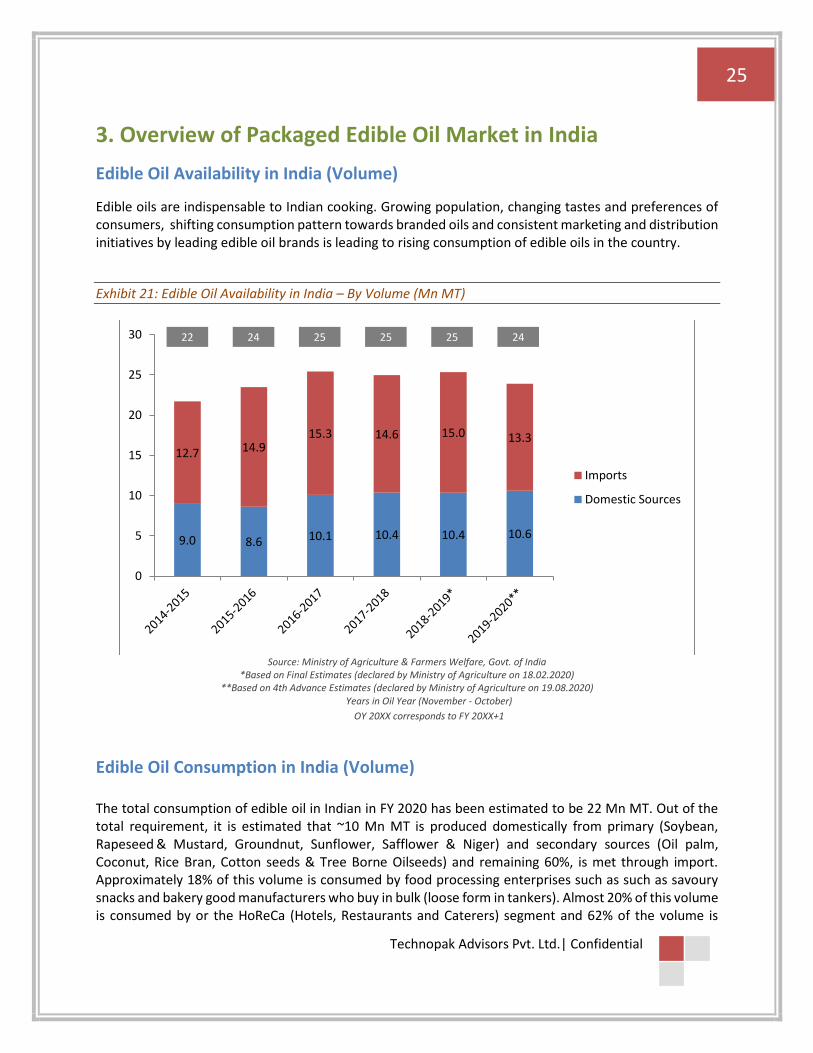
Edible oils are indispensable to Indian cooking. Growing population, changing tastes and preferences of consumers, shifting consumption pattern towards branded oils and consistent marketing and distribution initiatives by leading edible oil brands is leading to rising consumption of edible oils in the country.
Exhibit 21: Edible Oil Availability in India – By Volume (Mn MT)
Source: Ministry of Agriculture & Farmers Welfare, Govt. of India
*Based on Final Estimates (declared by Ministry of Agriculture on 18.02.2020) **Based on 4th Advance Estimates (declared by Ministry of Agriculture on 19.08.2020)
Years in Oil Year (November - October)
OY 20XX corresponds to FY 20XX+1
Edible Oil Consumption in India (Volume) The total consumption of edible oil in Indian in FY 2020 has been estimated to be 22 Mn MT. Out of the total requirement, it is estimated that ~10 Mn MT is produced domestically from primary (Soybean, Rapeseed & Mustard, Groundnut, Sunflower, Safflower & Niger) and secondary sources (Oil palm, Coconut, Rice Bran, Cotton seeds & Tree Borne Oilseeds) and remaining 60%, is met through import. Approximately 18% of this volume is consumed by food processing enterprises such as such as savoury snacks and bakery good manufacturers who buy in bulk (loose form in tankers). Almost 20% of this volume is consumed by or the HoReCa (Hotels, Restaurants and Caterers) segment and 62% of the volume is
9.0 8.6 10.1 10.4 10.4 10.6
12.7 14.915.3 14.6 15.0 13.3
0
5
10
15
20
25
30
Imports
Domestic Sources
22 24 25 25 25 24
26
Technopak Advisors Pvt. Ltd.| Confidential
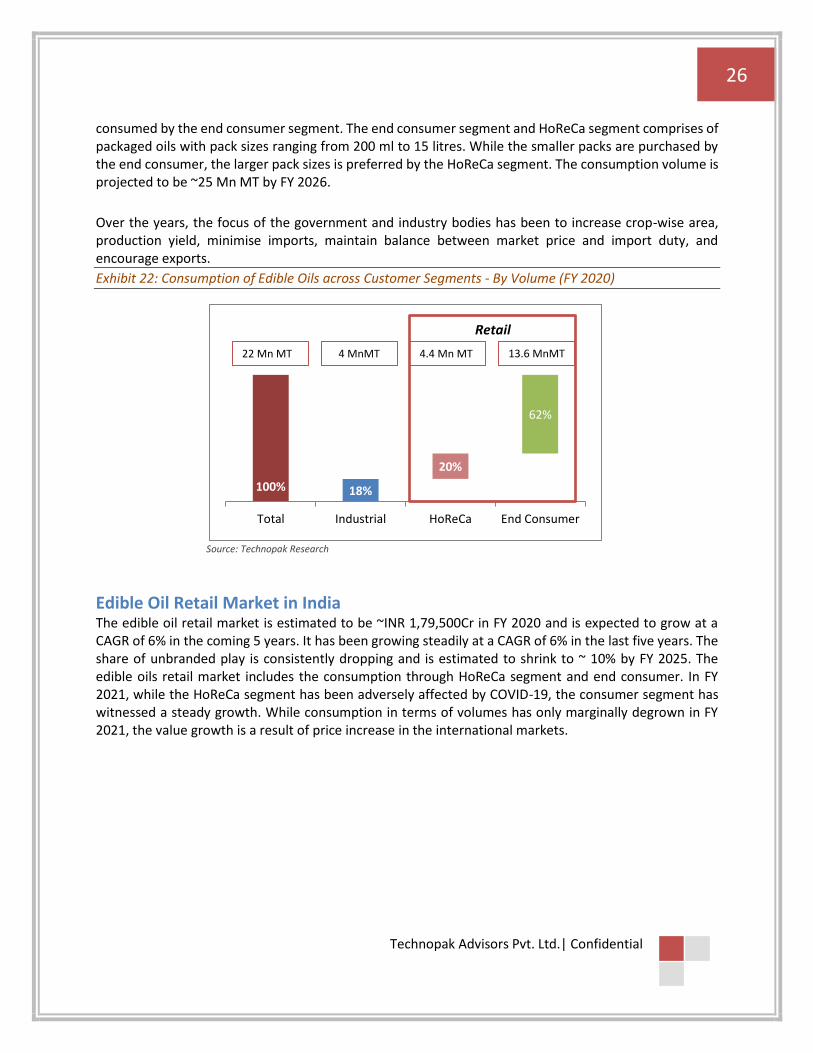
consumed by the end consumer segment. The end consumer segment and HoReCa segment comprises of packaged oils with pack sizes ranging from 200 ml to 15 litres. While the smaller packs are purchased by the end consumer, the larger pack sizes is preferred by the HoReCa segment. The consumption volume is projected to be ~25 Mn MT by FY 2026. Over the years, the focus of the government and industry bodies has been to increase crop-wise area, production yield, minimise imports, maintain balance between market price and import duty, and encourage exports.
Exhibit 22: Consumption of Edible Oils across Customer Segments - By Volume (FY 2020)
Source: Technopak Research
Edible Oil Retail Market in India
The edible oil retail market is estimated to be ~INR 1,79,500Cr in FY 2020 and is expected to grow at a CAGR of 6% in the coming 5 years. It has been growing steadily at a CAGR of 6% in the last five years. The share of unbranded play is consistently dropping and is estimated to shrink to ~ 10% by FY 2025. The edible oils retail market includes the consumption through HoReCa segment and end consumer. In FY 2021, while the HoReCa segment has been adversely affected by COVID-19, the consumer segment has witnessed a steady growth. While consumption in terms of volumes has only marginally degrown in FY 2021, the value growth is a result of price increase in the international markets.
100% 18%
20%
62%
Total Industrial HoReCa End Consumer
22 Mn MT 4 MnMT 4.4 Mn MT 13.6 MnMT
Retail

27
Technopak Advisors Pvt. Ltd.| Confidential
Exhibit 23: Edible Oil Retail Market in India (INR Cr)
Source: Technopak Research
Exhibit 24: Share of Branded Edible Oil Market in India
Source: Technopak Research
Branded Edible Oil Retail Market in India The branded edible oil market is estimated to be around INR 1,56,000 cr and is expected to grow faster than the overall category gaining a lion’s share of close to 90% of the total market in terms of value in the coming five years. It is estimated that close to 75% of the total edible oils available in terms of volume is retailed as a branded product. The edible oil industry in India is fragmented wherein 13% of oil is sold as loose/unbranded and the consumers are shifting to branded oils, which bodes well for the organized players. Increasing awareness for safe products, the Ministry of Consumer Affairs, Food & Public Distribution restricting loose product sale and the other policies to curtail unfair trade practices has been aiding this growth. In mid-2020, states were directed by the government to enforce a ban on the loose edible oils aiming at curbing the adulteration in edible oils.
1,34,500 1,79,500
1,93,860
2,38,000
FY 2015 FY 2020 FY 2021P FY 2025P
83%
17%
FY 2015: INR 1,34,500 Cr
Branded Unbranded
87%
13%
FY 2020: INR 1,79,500 Cr
Branded Unbranded
90%
10%
FY 2025P: INR 2,38,000 Cr
Branded Unbranded
28
Technopak Advisors Pvt. Ltd.| Confidential
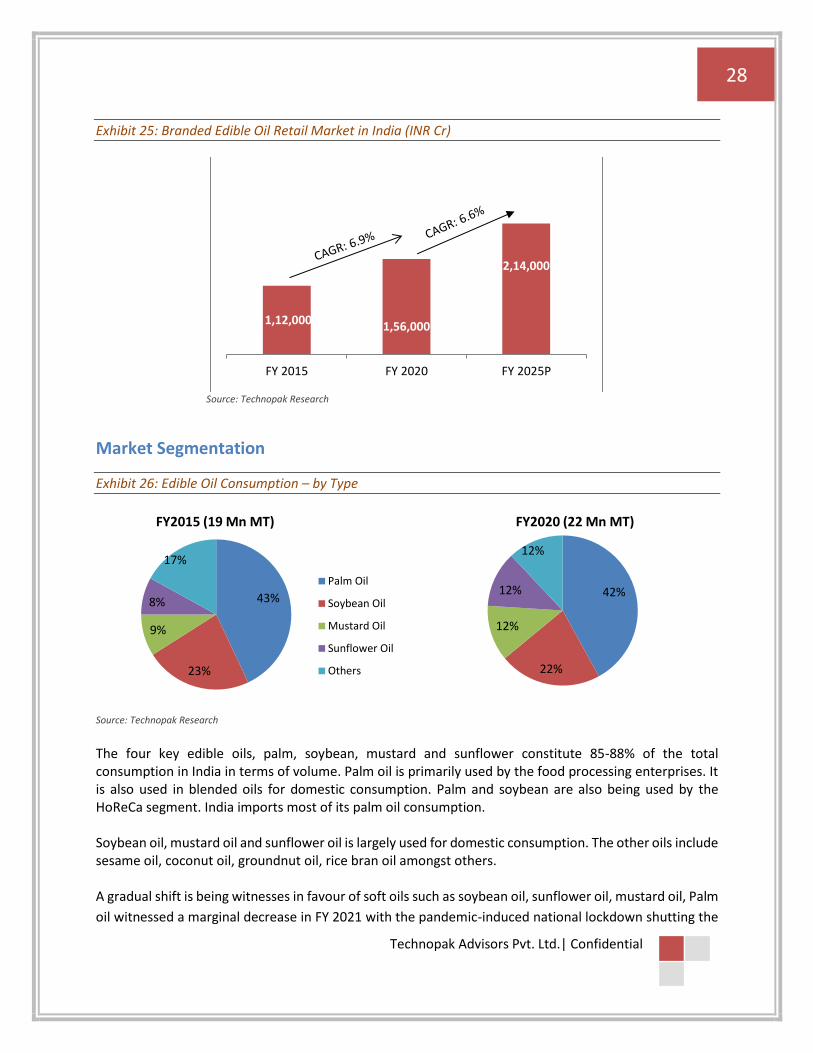
Exhibit 25: Branded Edible Oil Retail Market in India (INR Cr)
Source: Technopak Research
Market Segmentation
Exhibit 26: Edible Oil Consumption – by Type
Source: Technopak Research
The four key edible oils, palm, soybean, mustard and sunflower constitute 85-88% of the total consumption in India in terms of volume. Palm oil is primarily used by the food processing enterprises. It is also used in blended oils for domestic consumption. Palm and soybean are also being used by the HoReCa segment. India imports most of its palm oil consumption. Soybean oil, mustard oil and sunflower oil is largely used for domestic consumption. The other oils include sesame oil, coconut oil, groundnut oil, rice bran oil amongst others. A gradual shift is being witnesses in favour of soft oils such as soybean oil, sunflower oil, mustard oil, Palm
oil witnessed a marginal decrease in FY 2021 with the pandemic-induced national lockdown shutting the
1,12,000 1,56,000
2,14,000
FY 2015 FY 2020 FY 2025P
43%
23%
9%
8%
17%
FY2015 (19 Mn MT)
Palm Oil
Soybean Oil
Mustard Oil
Sunflower Oil
Others
42%
22%
12%
12%
12%
FY2020 (22 Mn MT)

29
Technopak Advisors Pvt. Ltd.| Confidential
HoReCa (hotels, restaurants, catering) segment. The HoReCa demand was substituted by the household
segment which preferred soft oils.
Exhibit 27: Region Wise Consumption of Edible Oil in India (FY 2020)
Source: Technopak Research
West India dominates the country's edible oil market in terms of volumes and per capita consumption and the region is expected to maintain its dominance during the forecast period. East and North regions also account for a significant market share, followed by the Southern region. Southern India contributes the smallest share by volume if compared with other regions. However, the per capita consumption in the southern states is the second highest after west.
Exhibit 28: Region Wise Per Capita Consumption of Edible Oil in India (FY 2020) (kg/annum)
Source: Technopak Research
25%
29%22%
24%
FY2020 (22 Mn MT)
North West South East
22
17
1314
West South North East
India Average: 17kg
World Average: 24kg

30
Technopak Advisors Pvt. Ltd.| Confidential
In the northern region, soybean oil is preferred along with mustard oil. Soybean oil is widely consumed in central India followed by sunflower oil. Cottonseed, sunflower and groundnut oil are preferred in the western states. In the eastern states, mustard and soybean oil are preferred followed by sunflower oil. In the southern states, sunflower and palm oil are the most widely consumed edible oil. Palm oil widely used in the coastal belt.
Consumption in rural India constitutes almost 50% of the total consumption in this category by volume and is growing at a faster rate than the urban. The favourable growth of economy has resulted in a high growth in consumption of packaged staples in the rural parts of India. For most national players, the growth in Tier II and III cities has been higher than that in the metros.
Value Segmentation
Most edible oils players have created brands across premium and popular value segments. The width of the portfolio lends access to various socio-economic classes without disturbing the positioning of other brands and flexibility to introduce product variants accordingly. The share of sales from premium and popular segments may vary for each player. While palm oil and blends thereof are largely positioned as popular varieties, given its application for industries, soybean, mustard and sunflower can be positioned across the two segments.
Exhibit 29: Value Segments and Key Brands
Source: Technopak Research

31
Technopak Advisors Pvt. Ltd.| Confidential
Retail Channels Amongst packaged staples, edible oil is one of the most widely penetrated categories with branded products present across urban and rural regions. Wider adoption and maturity of the category has resulted in a distribution led approach with a heavy dependence on general trade channels. The market leaders have been able to establish their footprint in the range of 1 Mn to 1.5 Mn retail outlets through a network of close to 5000 distributors.
Exhibit 30: Share of Retail Channels for Branded Edible Oil in India (FY2020)
Source: Technopak Research
Competitive Intensity
While the combined share of the top six players in the branded oil business (Adani Wilmar, Ruchi Soya, Emami, Cargill, Bunge and Marico) has been estimated ~40% in FY2020. Some other national brands are Sundrop, a sunflower oil brand owned by Conagra and Dhara, mustard oil brand owned by the National Dairy Development Board of India. Regional players have emerged strongly and cornered a sizeable chunk of the pie for themselves. Key regional players are Gemini Edibles & Fats (a subsidiary of Golden Agri-Resources (GAR)) and Kaleesuwari Oil Mills in the south, Gokul in the East, Liberty Oils Mills in the West and BL Agro and Mahesh Edible Oil Industries in the North. It is estimated that there would be around 2000 such brands out of which ~top 100 brands would be contributing almost 50%. Along with logistics and supply chain capability, the market leaders have a sizeable processing and packaging scale domestically and also have an expansive distribution network.
89%
11%
General Trade Modern Trade
32
Technopak Advisors Pvt. Ltd.| Confidential
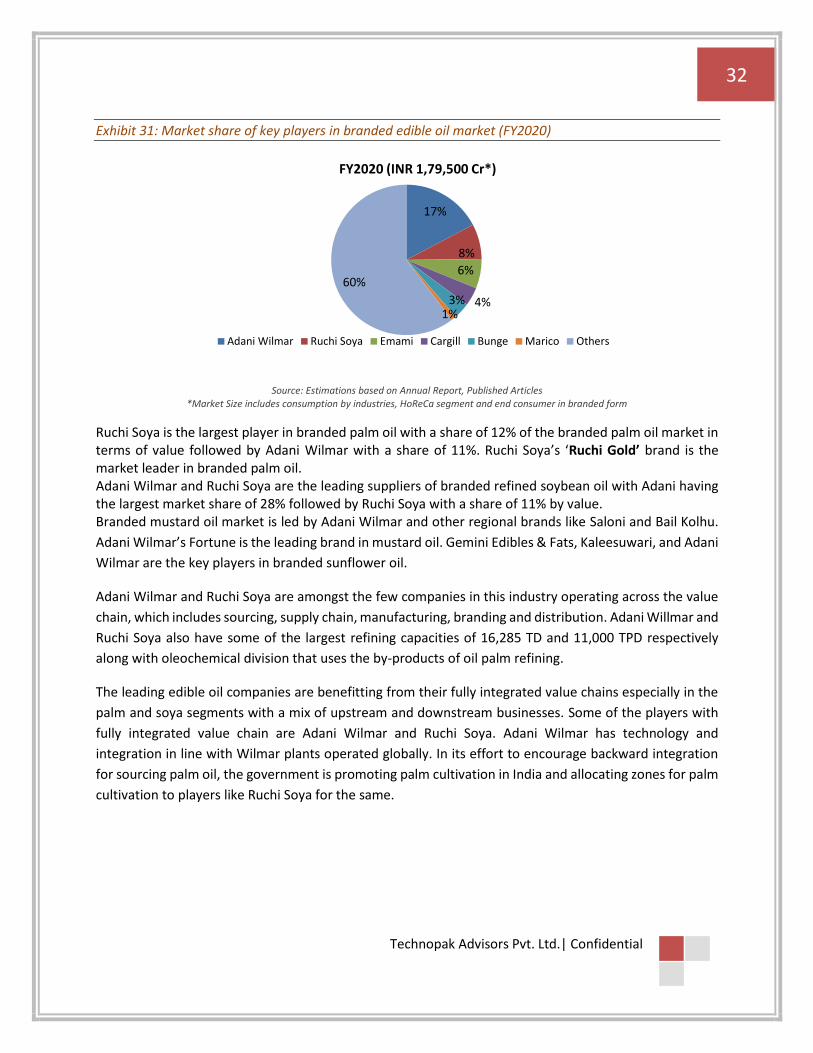
Exhibit 31: Market share of key players in branded edible oil market (FY2020)
Source: Estimations based on Annual Report, Published Articles
*Market Size includes consumption by industries, HoReCa segment and end consumer in branded form
Ruchi Soya is the largest player in branded palm oil with a share of 12% of the branded palm oil market in terms of value followed by Adani Wilmar with a share of 11%. Ruchi Soya’s ‘Ruchi Gold’ brand is the market leader in branded palm oil. Adani Wilmar and Ruchi Soya are the leading suppliers of branded refined soybean oil with Adani having the largest market share of 28% followed by Ruchi Soya with a share of 11% by value. Branded mustard oil market is led by Adani Wilmar and other regional brands like Saloni and Bail Kolhu.
Adani Wilmar’s Fortune is the leading brand in mustard oil. Gemini Edibles & Fats, Kaleesuwari, and Adani
Wilmar are the key players in branded sunflower oil.
Adani Wilmar and Ruchi Soya are amongst the few companies in this industry operating across the value
chain, which includes sourcing, supply chain, manufacturing, branding and distribution. Adani Willmar and
Ruchi Soya also have some of the largest refining capacities of 16,285 TD and 11,000 TPD respectively
along with oleochemical division that uses the by-products of oil palm refining.
The leading edible oil companies are benefitting from their fully integrated value chains especially in the
palm and soya segments with a mix of upstream and downstream businesses. Some of the players with
fully integrated value chain are Adani Wilmar and Ruchi Soya. Adani Wilmar has technology and
integration in line with Wilmar plants operated globally. In its effort to encourage backward integration
for sourcing palm oil, the government is promoting palm cultivation in India and allocating zones for palm
cultivation to players like Ruchi Soya for the same.
17%
8%
6%
4%3%1%
60%
FY2020 (INR 1,79,500 Cr*)
Adani Wilmar Ruchi Soya Emami Cargill Bunge Marico Others
33
Technopak Advisors Pvt. Ltd.| Confidential
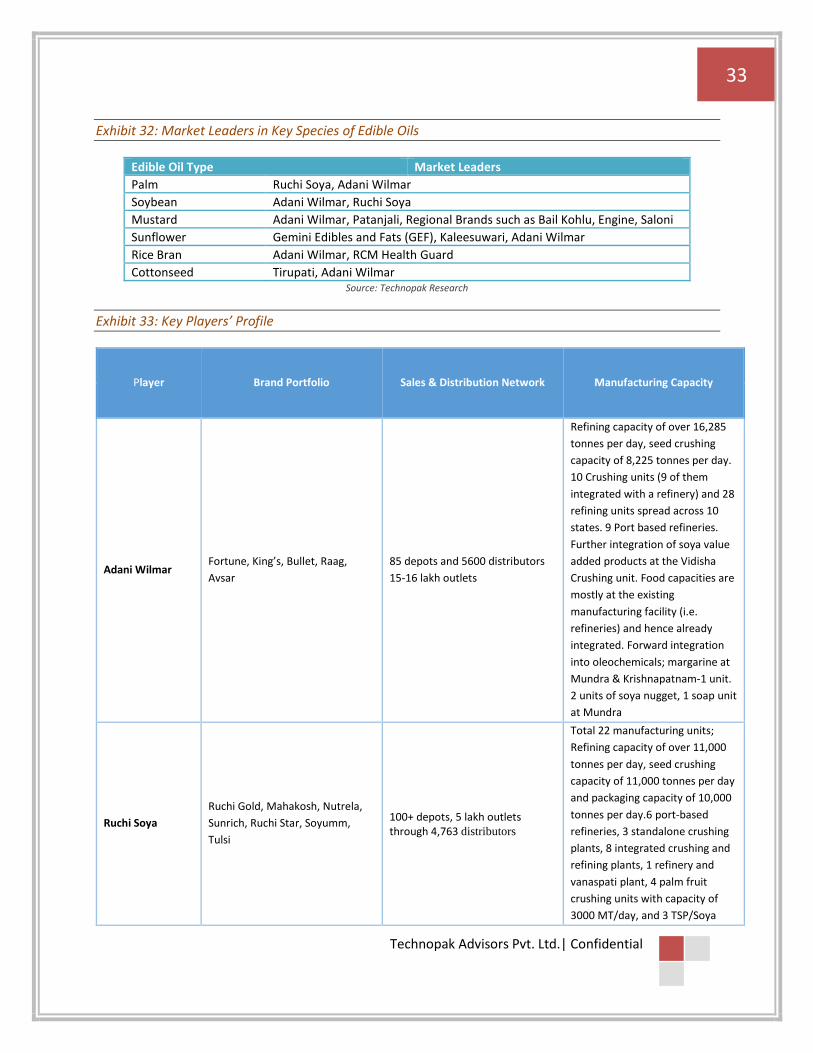
Exhibit 32: Market Leaders in Key Species of Edible Oils
Edible Oil Type Market Leaders
Palm Ruchi Soya, Adani Wilmar
Soybean Adani Wilmar, Ruchi Soya
Mustard Adani Wilmar, Patanjali, Regional Brands such as Bail Kohlu, Engine, Saloni
Sunflower Gemini Edibles and Fats (GEF), Kaleesuwari, Adani Wilmar
Rice Bran Adani Wilmar, RCM Health Guard
Cottonseed Tirupati, Adani Wilmar Source: Technopak Research
Exhibit 33: Key Players’ Profile
Player Brand Portfolio Sales & Distribution Network Manufacturing Capacity
Adani Wilmar Fortune, King’s, Bullet, Raag,
Avsar
85 depots and 5600 distributors
15-16 lakh outlets
Refining capacity of over 16,285
tonnes per day, seed crushing
capacity of 8,225 tonnes per day.
10 Crushing units (9 of them
integrated with a refinery) and 28
refining units spread across 10
states. 9 Port based refineries.
Further integration of soya value
added products at the Vidisha
Crushing unit. Food capacities are
mostly at the existing
manufacturing facility (i.e.
refineries) and hence already
integrated. Forward integration
into oleochemicals; margarine at
Mundra & Krishnapatnam-1 unit.
2 units of soya nugget, 1 soap unit
at Mundra
Ruchi Soya
Ruchi Gold, Mahakosh, Nutrela,
Sunrich, Ruchi Star, Soyumm,
Tulsi
100+ depots, 5 lakh outlets through 4,763 distributors
Total 22 manufacturing units;
Refining capacity of over 11,000
tonnes per day, seed crushing
capacity of 11,000 tonnes per day
and packaging capacity of 10,000
tonnes per day.6 port-based
refineries, 3 standalone crushing
plants, 8 integrated crushing and
refining plants, 1 refinery and
vanaspati plant, 4 palm fruit
crushing units with capacity of
3000 MT/day, and 3 TSP/Soya
34
Technopak Advisors Pvt. Ltd.| Confidential
chunk units. Forward integration
into oleochemicals, 1 unit as well
as backward integration via oil
palm plantation
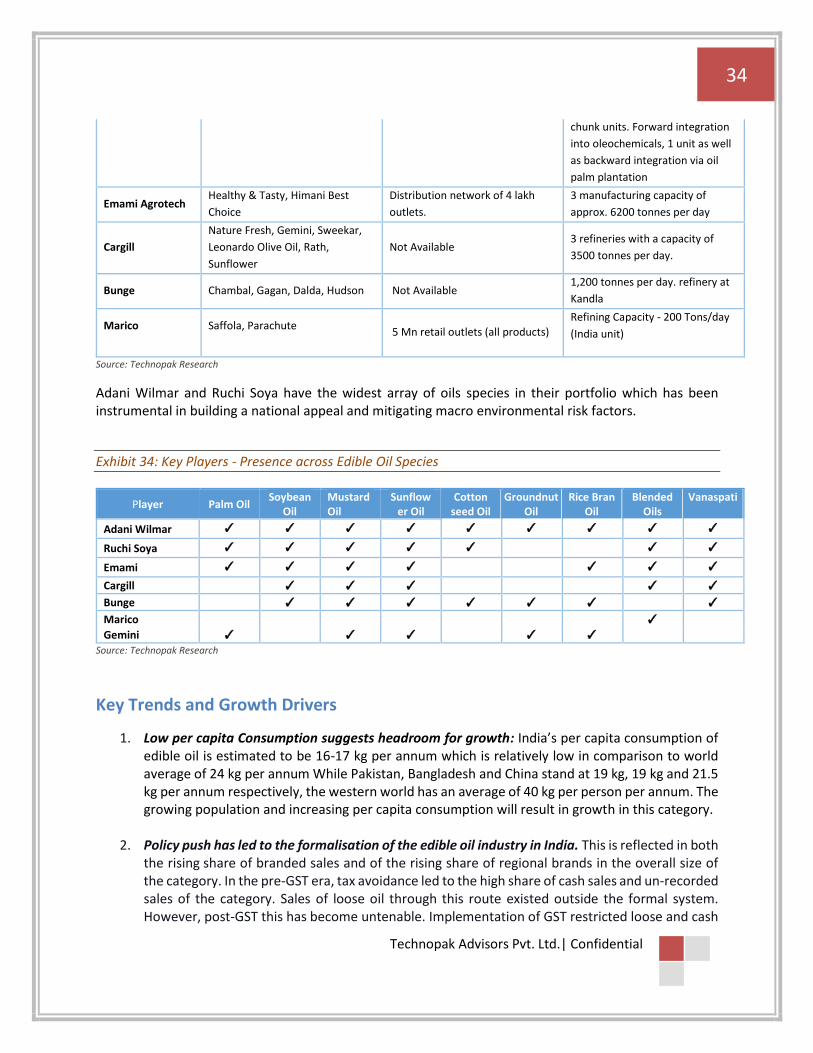
Emami Agrotech Healthy & Tasty, Himani Best
Choice
Distribution network of 4 lakh
outlets.
3 manufacturing capacity of
approx. 6200 tonnes per day
Cargill
Nature Fresh, Gemini, Sweekar,
Leonardo Olive Oil, Rath,
Sunflower
Not Available 3 refineries with a capacity of
3500 tonnes per day.
Bunge Chambal, Gagan, Dalda, Hudson Not Available 1,200 tonnes per day. refinery at
Kandla
Marico Saffola, Parachute 5 Mn retail outlets (all products)
Refining Capacity - 200 Tons/day
(India unit)
Source: Technopak Research
Adani Wilmar and Ruchi Soya have the widest array of oils species in their portfolio which has been instrumental in building a national appeal and mitigating macro environmental risk factors.
Exhibit 34: Key Players - Presence across Edible Oil Species
Player Palm Oil Soybean
Oil Mustard Oil
Sunflower Oil
Cotton seed Oil
Groundnut Oil
Rice Bran Oil
Blended Oils
Vanaspati
Adani Wilmar ✓ ✓ ✓ ✓ ✓ ✓ ✓ ✓ ✓
Ruchi Soya ✓ ✓ ✓ ✓ ✓
✓ ✓
Emami ✓ ✓ ✓ ✓
✓ ✓ ✓
Cargill
✓ ✓ ✓ ✓ ✓
Bunge
✓ ✓ ✓ ✓ ✓ ✓
✓
Marico
✓
Gemini ✓ ✓ ✓ ✓ ✓
Source: Technopak Research
Key Trends and Growth Drivers
1. Low per capita Consumption suggests headroom for growth: India’s per capita consumption of edible oil is estimated to be 16-17 kg per annum which is relatively low in comparison to world average of 24 kg per annum While Pakistan, Bangladesh and China stand at 19 kg, 19 kg and 21.5 kg per annum respectively, the western world has an average of 40 kg per person per annum. The growing population and increasing per capita consumption will result in growth in this category.
2. Policy push has led to the formalisation of the edible oil industry in India. This is reflected in both the rising share of branded sales and of the rising share of regional brands in the overall size of the category. In the pre-GST era, tax avoidance led to the high share of cash sales and un-recorded sales of the category. Sales of loose oil through this route existed outside the formal system. However, post-GST this has become untenable. Implementation of GST restricted loose and cash
35
Technopak Advisors Pvt. Ltd.| Confidential
sale. This is a positive development for the industry on two counts. One, the cash sales mind-set that pushed off the books trade has positively changed towards above board existence. Second, it created an environment for many to aspire and grow the branded B2C business than the trading business. It has contributed to the emergence of better trade practices particularly on the aspect of food adulteration practices that is rampant in the informal oil trade. Rise of the branded business signifies consumer demand induced check on this practice.
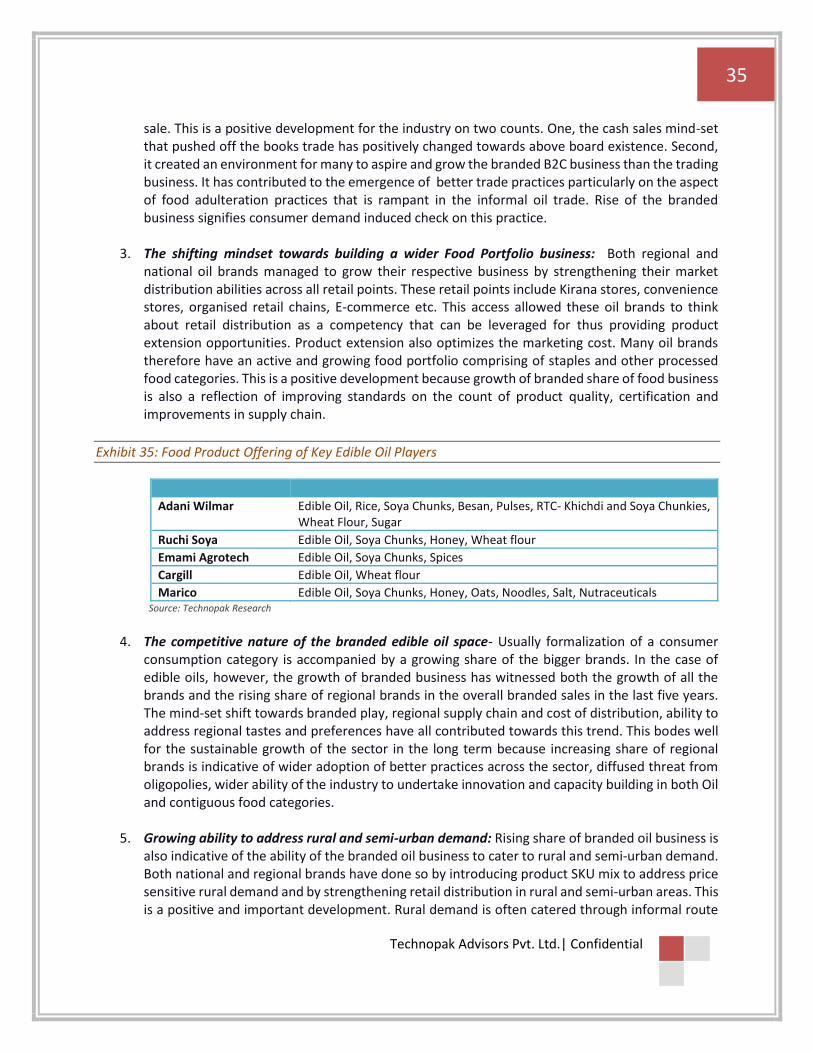
3. The shifting mindset towards building a wider Food Portfolio business: Both regional and national oil brands managed to grow their respective business by strengthening their market distribution abilities across all retail points. These retail points include Kirana stores, convenience stores, organised retail chains, E-commerce etc. This access allowed these oil brands to think about retail distribution as a competency that can be leveraged for thus providing product extension opportunities. Product extension also optimizes the marketing cost. Many oil brands therefore have an active and growing food portfolio comprising of staples and other processed food categories. This is a positive development because growth of branded share of food business is also a reflection of improving standards on the count of product quality, certification and improvements in supply chain.
Exhibit 35: Food Product Offering of Key Edible Oil Players
Adani Wilmar Edible Oil, Rice, Soya Chunks, Besan, Pulses, RTC- Khichdi and Soya Chunkies, Wheat Flour, Sugar
Ruchi Soya Edible Oil, Soya Chunks, Honey, Wheat flour
Emami Agrotech Edible Oil, Soya Chunks, Spices
Cargill Edible Oil, Wheat flour
Marico Edible Oil, Soya Chunks, Honey, Oats, Noodles, Salt, Nutraceuticals Source: Technopak Research
4. The competitive nature of the branded edible oil space- Usually formalization of a consumer
consumption category is accompanied by a growing share of the bigger brands. In the case of edible oils, however, the growth of branded business has witnessed both the growth of all the brands and the rising share of regional brands in the overall branded sales in the last five years. The mind-set shift towards branded play, regional supply chain and cost of distribution, ability to address regional tastes and preferences have all contributed towards this trend. This bodes well for the sustainable growth of the sector in the long term because increasing share of regional brands is indicative of wider adoption of better practices across the sector, diffused threat from oligopolies, wider ability of the industry to undertake innovation and capacity building in both Oil and contiguous food categories.
5. Growing ability to address rural and semi-urban demand: Rising share of branded oil business is
also indicative of the ability of the branded oil business to cater to rural and semi-urban demand. Both national and regional brands have done so by introducing product SKU mix to address price sensitive rural demand and by strengthening retail distribution in rural and semi-urban areas. This is a positive and important development. Rural demand is often catered through informal route
36
Technopak Advisors Pvt. Ltd.| Confidential
and accompanied by opaque pricing and adulterated product. Brands ability to address rural demand is an effective counter against these practices.
6. Emerging premium and health focussed segments: Exotic oils such as olive oil and canola oil and
supplemented and fortified varieties of pure and blended oils is an emerging segment positioned on health and wellness. All the keys players are building their health and wellness portfolio in oils such as Marico’s Saffola, Ruchi Soya’s Nutrela Gold focussing on heart health and Adani Wilmar’s Fortune Xpert Pro Immunity oil and Fortune Xpert Pro Sugar Conscious oil. The Food Safety and Standards Authority India (FSSAI) would also be making fortification mandatory for edible oil in near future. This policy push will accelerate the growth in the segment.
Key Challenge and Risk Factors
Market Distribution Abilities
While edible oil business continues to be a low margin business subject to various macro environment risks, however, the key challenge remains in building a robust supply chain, logistics and distribution system in order to ensure agile movement and consistent availability of quality products at the least cost. Speedy and efficient distribution is a key imperative to accomplish in this segment.
Availability of Raw Material
The availability and price of raw materials is subject to a number of external factors including overall climatic and economic conditions, production levels, supply, demand and competition for such materials, production and transportation cost, taxes and duties, international relations and natural disasters. Interruption of, or a shortage in the supply of, raw materials may result in inability to operate production facilities at optimal capacities, leading to a decline in production and sales. In addition, while competition for procuring raw material may result in an increase in raw material prices, the ability to pass on such increases in overall operational costs may be limited. Furthermore, any increase in the cost of raw materials which results in an increase in prices of the products, may reduce demand of the products and thereby affect margins and profitability.
Price & Foreign Exchange Volatility
The major raw materials are agro-based commodities and are subject to market price variations. Also, commodities are increasingly becoming asset classes. Risk management and hedging the price fluctuations in order to minimize its impact on profitability becomes very critical. Brand strength and wider portfolio in terms of varied species of oils also helps in evening out these fluctuations. Since India imports significant quantity of edible oil; variation in fluctuations in exchange rates also impact the company’s financial performance in the absence of a well-defined hedging framework.
Government Policies and geo-political relations
The policies announced by the Government have been generally progressive and are expected to remain
likewise in future. However fluidity in policies such as import bans, changes in duty structure and trade
policy disturbs supply chains. For example on 8 January 2020, Government of India moved Refined
37
Technopak Advisors Pvt. Ltd.| Confidential
bleached deodorised palm oil and Refined bleached deodorised palmolein from ‘Free’ to “Restricted’
category. Accordingly, an importer will have to take approval of the Government of India for import of
these products.
Fuel Prices
Fuel prices continue to be an area of concern as fuel, particularly coal is widely used in manufacturing and
has a direct impact on total costs.
Regulatory Framework
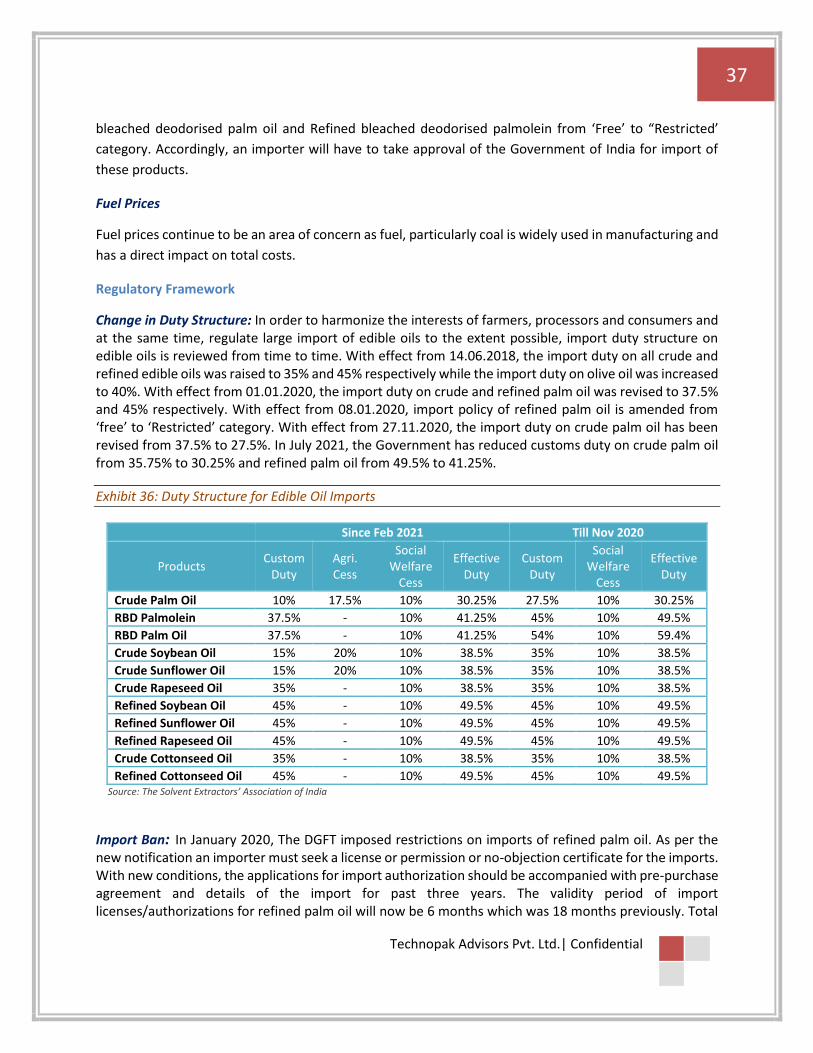
Change in Duty Structure: In order to harmonize the interests of farmers, processors and consumers and at the same time, regulate large import of edible oils to the extent possible, import duty structure on edible oils is reviewed from time to time. With effect from 14.06.2018, the import duty on all crude and refined edible oils was raised to 35% and 45% respectively while the import duty on olive oil was increased to 40%. With effect from 01.01.2020, the import duty on crude and refined palm oil was revised to 37.5% and 45% respectively. With effect from 08.01.2020, import policy of refined palm oil is amended from ‘free’ to ‘Restricted’ category. With effect from 27.11.2020, the import duty on crude palm oil has been revised from 37.5% to 27.5%. In July 2021, the Government has reduced customs duty on crude palm oil from 35.75% to 30.25% and refined palm oil from 49.5% to 41.25%.
Exhibit 36: Duty Structure for Edible Oil Imports
Since Feb 2021 Till Nov 2020
Products Custom
Duty Agri. Cess
Social Welfare
Cess
Effective Duty
Custom Duty
Social Welfare
Cess
Effective Duty
Crude Palm Oil 10% 17.5% 10% 30.25% 27.5% 10% 30.25%
RBD Palmolein 37.5% - 10% 41.25% 45% 10% 49.5%
RBD Palm Oil 37.5% - 10% 41.25% 54% 10% 59.4%
Crude Soybean Oil 15% 20% 10% 38.5% 35% 10% 38.5%
Crude Sunflower Oil 15% 20% 10% 38.5% 35% 10% 38.5%
Crude Rapeseed Oil 35% - 10% 38.5% 35% 10% 38.5%
Refined Soybean Oil 45% - 10% 49.5% 45% 10% 49.5%
Refined Sunflower Oil 45% - 10% 49.5% 45% 10% 49.5%
Refined Rapeseed Oil 45% - 10% 49.5% 45% 10% 49.5%
Crude Cottonseed Oil 35% - 10% 38.5% 35% 10% 38.5%
Refined Cottonseed Oil 45% - 10% 49.5% 45% 10% 49.5% Source: The Solvent Extractors’ Association of India
Import Ban: In January 2020, The DGFT imposed restrictions on imports of refined palm oil. As per the new notification an importer must seek a license or permission or no-objection certificate for the imports. With new conditions, the applications for import authorization should be accompanied with pre-purchase agreement and details of the import for past three years. The validity period of import licenses/authorizations for refined palm oil will now be 6 months which was 18 months previously. Total

38
Technopak Advisors Pvt. Ltd.| Confidential
non-utilization of import authorization by the applicant will lead to disqualification of the importer from getting any further license for these items in future. Customs will be required to thoroughly implement the rules of origin criteria for import of these items originating from Nepal and Bangladesh. This was implemented in consultation with the industry to check the import of edible oil routed though Nepal and Bangladesh at cheaper rates.
Policy Push towards domestic production: In the year 2014, the government has launched the National
Mission on Oilseeds and Oil Palm with a special emphasis on expanding palm oil plantations in wastelands.
NMOOP started promoting plantations in 13 states, with financial incentives given to farmers to buy plants
and maintain them for four years.
The state governments have involved about 15 private entrepreneurs of which Ruchi Soya Industries, Godrej Agrovet Pvt. Ltd., Food, Fats & Fertilizers and Shivasais Oil Palm Ltd are the key players undertaking oil palm plantation development in their respective allocated zones.
The companies have signed Memorandum of Understanding (MoU) with the state governments who in
turn have allocated zones to the companies for new plantations.
India has a huge opportunity in the palm oil business as it imports more than 90% of its demand. Oil palm plantation in India is regulated and operates in an asset light model. Players like Ruchi Soya and Godrej have participated in the government’s Oil Palm Development Program (OPDP) for accessing produce from farmers in designated areas.
FDI Policy: In 2015, the Indian government has allowed liberalization of the rules on investments by foreign firms into plantations. The following changes allow direct capital investments into oil palm and other plantation crops like rubber, cardamom, coffee and olive oil. However, the oil palm sector has not seen a great deal of interest from foreign concerns as other Southeast Asian countries have a suitable agroclimatic conditions for oil palm cultivation, higher yields and the advantage of other regulatory factors.
FSSAI: The Food Safety and Standards Authority of India (“FSSAI”) has notified the Food and Drug
Administration (“FDA”) departments in each state to ensure that all eateries using more than 50 liters of
oil per day comply with the rule of prohibiting them from using the same batch of cooking oil for more
than three times from March 1, 2019. This rule has been brought into effect as per Section 16(5) of the
Food Safety and Standards Act, 2006.

39
Technopak Advisors Pvt. Ltd.| Confidential
Domestic Production - Oilseeds
India produced ~59.5 Mn MT of oilseeds in FY 2019. The production has remained stagnant since last 5 year. Cotton seed contributed close to 47% of the total oilseed production in India followed by soybean, rapeseed & mustard and groundnut.
Exhibit 37: Oilseed Production in India (Mn MT)
Source: Ministry of Agriculture & Farmers Welfare, Govt. of India *Cotton Bales – Unit is number of bales and not Mn Tonnes
Exhibit 38: Area under Cultivation of Key Oilseeds ('000 Hectares)
2014-15 2015-16 2016-17 2017-18 2018-19 CAGR
(2015-19)
Ground Nut 4769 4596 5338 4888 4731 -0.2%
Castor 1089 1061 808 824 751 -8.9%
Sesamum 1746 1951 1667 1580 1420 -5.0%
Niger 232 252 256 218 156 -9.4%
Soybean 10911 11605 11183 10329 11131 0.5%
Sunflower 590 487 381 284 262 -18.4%
Rapeseed & Mustard 5799 5746 6074 5977 6124 1.4%
Linseed 285 263 325 326 173 -11.8%
Safflower 175 127 144 82 46 -28.4%
Source: Directorate of Economics and Statistics, Ministry of Agriculture & Farmers Welfare, Govt. of India
34.830.0 32.6 32.8
28.0
10.4
8.6
13.2 10.913.3
6.3
6.8
7.98.4
9.3
7.4
6.7
7.5 9.36.7
3.5
3.2
2.7 2.8
2.3
0
10
20
30
40
50
60
70
2014-2015 2015-2016 2016-2017 2017-2018 2018-2019
Other Oilseeds
Groundnut
Rapeseed & Mustard
Soyabean
Cottonseed

40
Technopak Advisors Pvt. Ltd.| Confidential
Oilseeds cultivation is undertaken across the country in about 27 million hectares mainly by small and
marginal farms on marginal lands, of which 72% is confined to rainfed farming. The government has been
intensifying efforts for area expansion under soybean, mustard and oil palm to enhance oil production in
the country. Along with acreage, emphasis is being given on increasing productivity. Farmers are
incentivised to cultivate pulses and oilseeds instead of crops like paddy, wheat and sugarcane in Punjab,
Haryana and Uttar Pradesh.
The major challenges in oilseed production are largely rain-fed conditions (70% area), high seed cost (Groundnut and Soybean), small holding with limited resources, low seed replacement rate and low productivity. To increase domestic availability and reduce import dependency, a National Mission on Edible Oils (NMEO) has been initiated for the coming five years (2020-21 to 2024-25). NMEO covers three Sub-Missions to increase production of oilseeds and edible oils from
1. Primary Sources (Annual Crops, Plantation Crops and Edible Tree Borne Oilseed Crop) 2. Secondary Sources (Rice bran oil and Cotton seed oil) 3. Consumer Awareness for maintaining edible oil consumption at 19 kg per person per annum
(currently at 16-17 kg per person per annum). The proposed mission will aim to increase production from 30.9 to 47.8 Mn MT of oilseeds which will produce 7 to 11 Mn MT of edible oils from primary sources by 2024-25. Similarly edible oils from secondary sources will be doubled from 3.5 to 7 Mn MT. It is aimed to reduce import dependence from 65% to 45%. At present, Madhya Pradesh, Rajasthan, Gujarat and Maharashtra are the key oilseed producing states. India’s leading soybean producing state is Madhya Pradesh with a significant share of 50% in India’s total production of this crop. Rajasthan leads in rapeseed & mustard, followed by Uttar Pradesh and Haryana. Almost 44% of rapeseed and mustard is produced in Rajasthan alone. Gujarat produces ~33% of the total groundnut followed by Rajasthan contributing 21% to the total production. Among other oil crops, Karnataka is largest producer of sunflower.

41
Technopak Advisors Pvt. Ltd.| Confidential
Exhibit 39: State wise Share of Oilseeds Production in India (Mn MT)
24%
22%
14%
8%
7%
7%
18%
Total Production of Cotton seed (CY 2019): 28 Mn MT
Maharashtra
Gujarat
Telangana
Madhya Pradesh
Rajasthan
Haryana
Others
50%
35%
9%6%
Total Production of Soybean Seed (CY 2019): 13.3 Mn MT
Madhya Pradesh
Maharashtra
Rajasthan
Others
44%
13%
12%
11%
8%
4%8%
Total Production of Rapeseed/Mustard Seed (CY 2019): 9.3 Mn MT
Rajasthan
Haryana
Uttar Pradesh
Madhya Pradesh
West Bengal
Gujarat
Others

42
Technopak Advisors Pvt. Ltd.| Confidential
Source: Technopak Research
Domestic Production – Refined Edible Oil
Exhibit 40: Edible Oil Production – by Type
Source: Technopak Research
Import of Edible Oil in India
Out of the total requirement, it is estimated that ~10 Mn MT is produced domestically from primary (Soybean, Rapeseed & Mustard, Groundnut, Sunflower, Safflower & Niger) and secondary sources (Oil palm, Coconut, Rice Bran, Cotton seeds & Tree Borne Oilseeds) and remaining 60-65%, is met through import.
28%
21%14%
14%
23%
FY2020 (10.7 Mn MT)
Mustard/Rapeseed Soyabean Groundnut Cotton Seed Others
33%
21%13%
7%
6%
6%
14%
Total Production of Groundnut (CY 2019): 6.7 Mn MT
Gujarat
Rajasthan
Tamil Nadu
Andhra Pradesh
Madhya Pradesh
Karnataka
Others
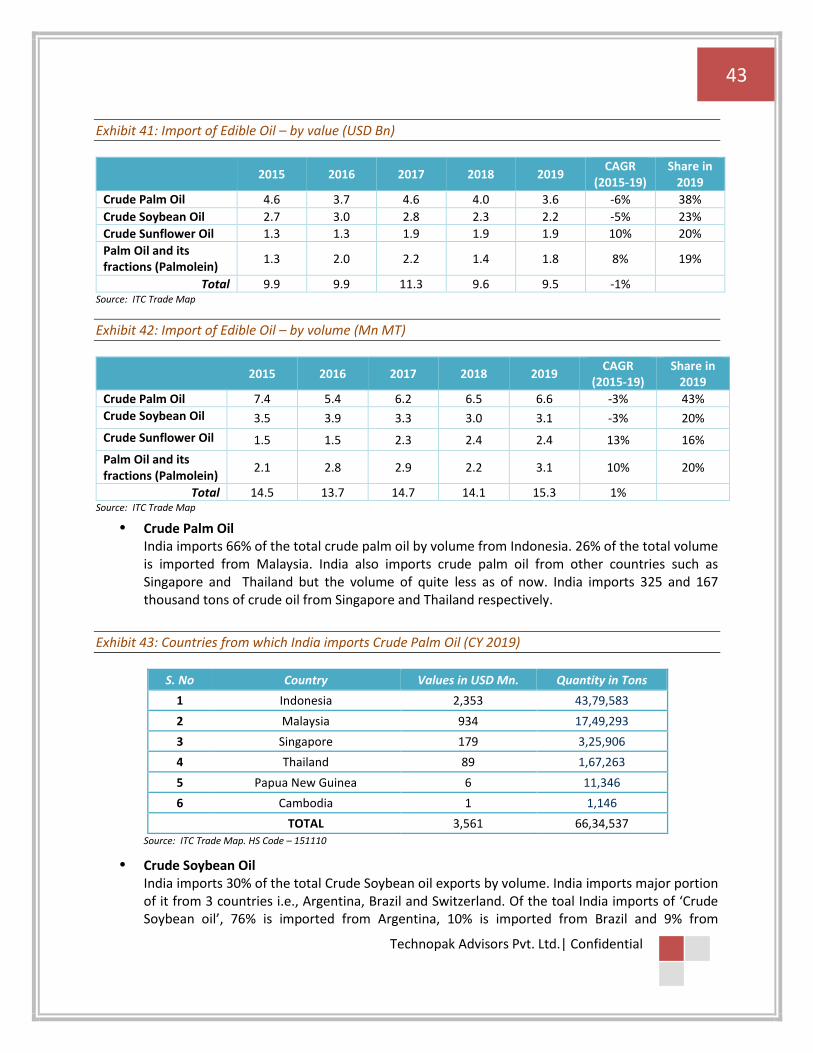
43
Technopak Advisors Pvt. Ltd.| Confidential
Exhibit 41: Import of Edible Oil – by value (USD Bn)
2015 2016 2017 2018 2019 CAGR
(2015-19) Share in
2019
Crude Palm Oil 4.6 3.7 4.6 4.0 3.6 -6% 38%
Crude Soybean Oil 2.7 3.0 2.8 2.3 2.2 -5% 23%
Crude Sunflower Oil 1.3 1.3 1.9 1.9 1.9 10% 20%
Palm Oil and its fractions (Palmolein)
1.3 2.0 2.2 1.4 1.8 8% 19%
Total 9.9 9.9 11.3 9.6 9.5 -1%
Source: ITC Trade Map
Exhibit 42: Import of Edible Oil – by volume (Mn MT)
2015 2016 2017 2018 2019 CAGR
(2015-19) Share in
2019 Crude Palm Oil 7.4 5.4 6.2 6.5 6.6 -3% 43%
Crude Soybean Oil 3.5 3.9 3.3 3.0 3.1 -3% 20%
Crude Sunflower Oil 1.5 1.5 2.3 2.4 2.4 13% 16%
Palm Oil and its fractions (Palmolein)
2.1 2.8 2.9 2.2 3.1 10% 20%
Total 14.5 13.7 14.7 14.1 15.3 1%
Source: ITC Trade Map
• Crude Palm Oil India imports 66% of the total crude palm oil by volume from Indonesia. 26% of the total volume is imported from Malaysia. India also imports crude palm oil from other countries such as Singapore and Thailand but the volume of quite less as of now. India imports 325 and 167 thousand tons of crude oil from Singapore and Thailand respectively.
Exhibit 43: Countries from which India imports Crude Palm Oil (CY 2019)
S. No Country Values in USD Mn. Quantity in Tons
1 Indonesia 2,353 43,79,583
2 Malaysia 934 17,49,293
3 Singapore 179 3,25,906
4 Thailand 89 1,67,263
5 Papua New Guinea 6 11,346
6 Cambodia 1 1,146
TOTAL 3,561 66,34,537 Source: ITC Trade Map. HS Code – 151110
• Crude Soybean Oil India imports 30% of the total Crude Soybean oil exports by volume. India imports major portion of it from 3 countries i.e., Argentina, Brazil and Switzerland. Of the toal India imports of ‘Crude Soybean oil’, 76% is imported from Argentina, 10% is imported from Brazil and 9% from
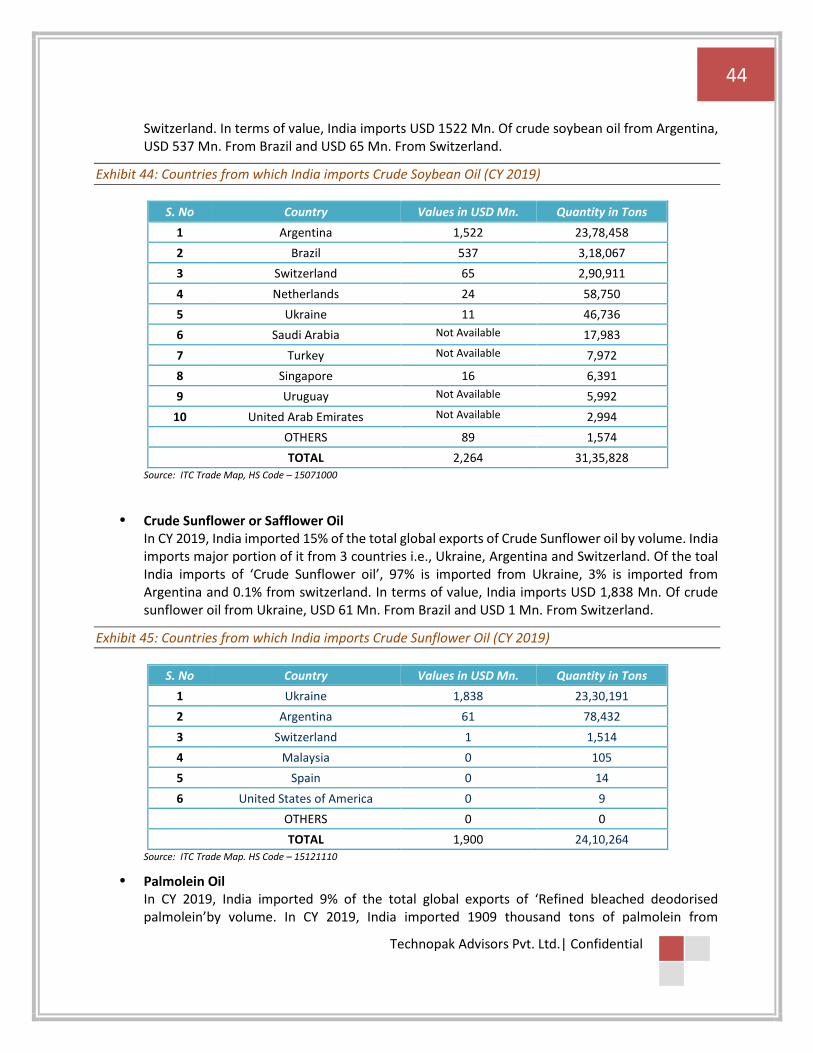
44
Technopak Advisors Pvt. Ltd.| Confidential
Switzerland. In terms of value, India imports USD 1522 Mn. Of crude soybean oil from Argentina, USD 537 Mn. From Brazil and USD 65 Mn. From Switzerland.
Exhibit 44: Countries from which India imports Crude Soybean Oil (CY 2019)
S. No Country Values in USD Mn. Quantity in Tons
1 Argentina 1,522 23,78,458
2 Brazil 537 3,18,067
3 Switzerland 65 2,90,911
4 Netherlands 24 58,750
5 Ukraine 11 46,736
6 Saudi Arabia Not Available 17,983
7 Turkey Not Available 7,972
8 Singapore 16 6,391
9 Uruguay Not Available 5,992
10 United Arab Emirates Not Available 2,994
OTHERS 89 1,574
TOTAL 2,264 31,35,828 Source: ITC Trade Map, HS Code – 15071000
• Crude Sunflower or Safflower Oil In CY 2019, India imported 15% of the total global exports of Crude Sunflower oil by volume. India imports major portion of it from 3 countries i.e., Ukraine, Argentina and Switzerland. Of the toal India imports of ‘Crude Sunflower oil’, 97% is imported from Ukraine, 3% is imported from Argentina and 0.1% from switzerland. In terms of value, India imports USD 1,838 Mn. Of crude sunflower oil from Ukraine, USD 61 Mn. From Brazil and USD 1 Mn. From Switzerland.
Exhibit 45: Countries from which India imports Crude Sunflower Oil (CY 2019)
S. No Country Values in USD Mn. Quantity in Tons
1 Ukraine 1,838 23,30,191
2 Argentina 61 78,432
3 Switzerland 1 1,514
4 Malaysia 0 105
5 Spain 0 14
6 United States of America 0 9
OTHERS 0 0
TOTAL 1,900 24,10,264 Source: ITC Trade Map. HS Code – 15121110
• Palmolein Oil In CY 2019, India imported 9% of the total global exports of ‘Refined bleached deodorised palmolein’by volume. In CY 2019, India imported 1909 thousand tons of palmolein from
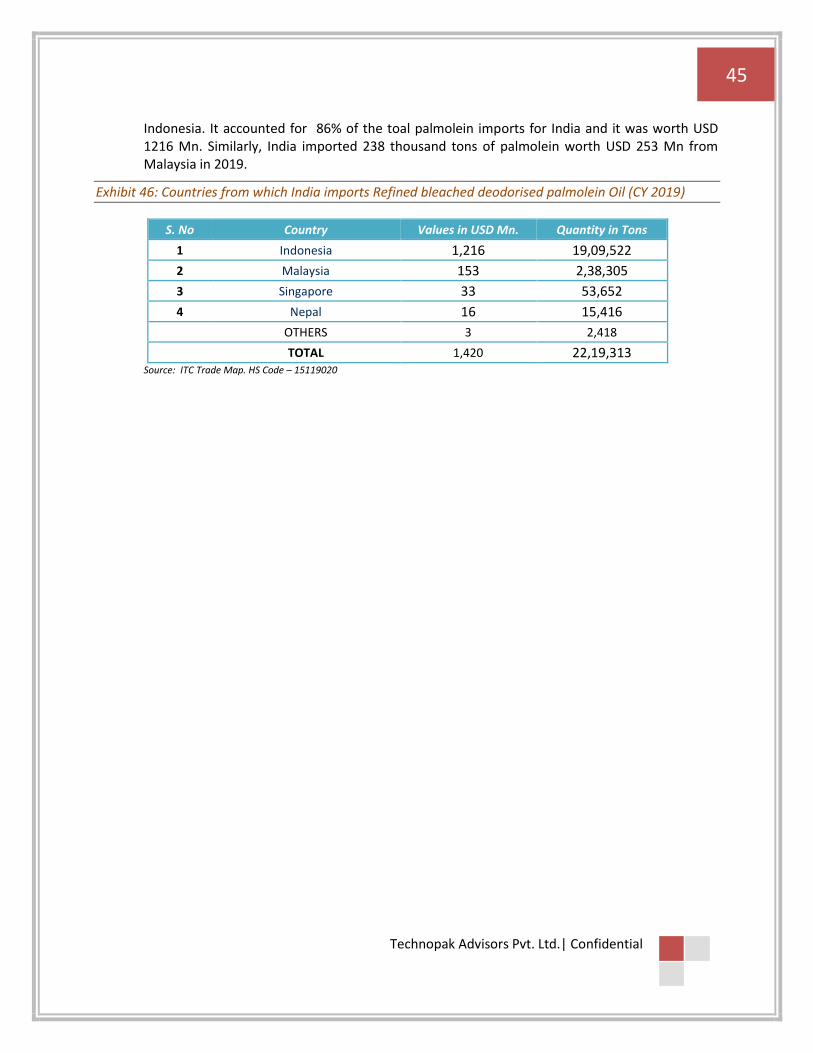
45
Technopak Advisors Pvt. Ltd.| Confidential
Indonesia. It accounted for 86% of the toal palmolein imports for India and it was worth USD 1216 Mn. Similarly, India imported 238 thousand tons of palmolein worth USD 253 Mn from Malaysia in 2019.
Exhibit 46: Countries from which India imports Refined bleached deodorised palmolein Oil (CY 2019)
S. No Country Values in USD Mn. Quantity in Tons
1 Indonesia 1,216 19,09,522
2 Malaysia 153 2,38,305
3 Singapore 33 53,652
4 Nepal 16 15,416
OTHERS 3 2,418
TOTAL 1,420 22,19,313 Source: ITC Trade Map. HS Code – 15119020
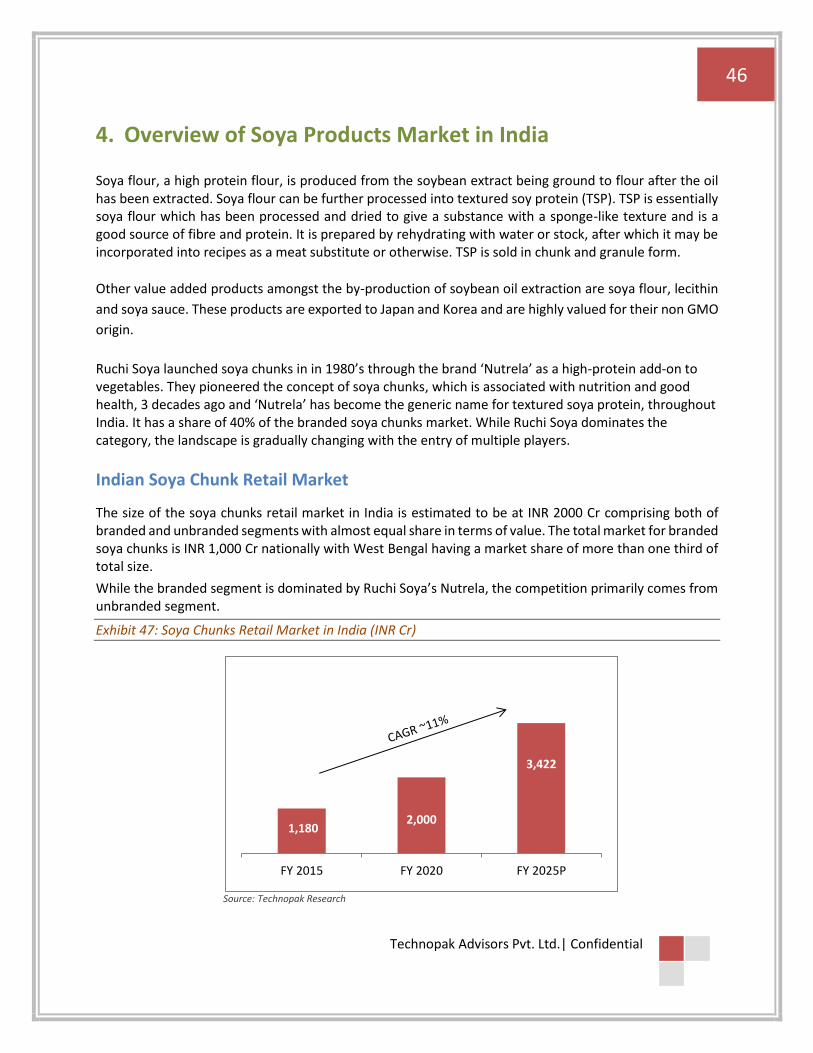
46
Technopak Advisors Pvt. Ltd.| Confidential
4. Overview of Soya Products Market in India
Soya flour, a high protein flour, is produced from the soybean extract being ground to flour after the oil has been extracted. Soya flour can be further processed into textured soy protein (TSP). TSP is essentially soya flour which has been processed and dried to give a substance with a sponge-like texture and is a good source of fibre and protein. It is prepared by rehydrating with water or stock, after which it may be incorporated into recipes as a meat substitute or otherwise. TSP is sold in chunk and granule form.
Other value added products amongst the by-production of soybean oil extraction are soya flour, lecithin
and soya sauce. These products are exported to Japan and Korea and are highly valued for their non GMO
origin.
Ruchi Soya launched soya chunks in in 1980’s through the brand ‘Nutrela’ as a high-protein add-on to vegetables. They pioneered the concept of soya chunks, which is associated with nutrition and good health, 3 decades ago and ‘Nutrela’ has become the generic name for textured soya protein, throughout India. It has a share of 40% of the branded soya chunks market. While Ruchi Soya dominates the category, the landscape is gradually changing with the entry of multiple players.
Indian Soya Chunk Retail Market
The size of the soya chunks retail market in India is estimated to be at INR 2000 Cr comprising both of branded and unbranded segments with almost equal share in terms of value. The total market for branded soya chunks is INR 1,000 Cr nationally with West Bengal having a market share of more than one third of total size.
While the branded segment is dominated by Ruchi Soya’s Nutrela, the competition primarily comes from unbranded segment.
Exhibit 47: Soya Chunks Retail Market in India (INR Cr)
Source: Technopak Research
1,180 2,000
3,422
FY 2015 FY 2020 FY 2025P
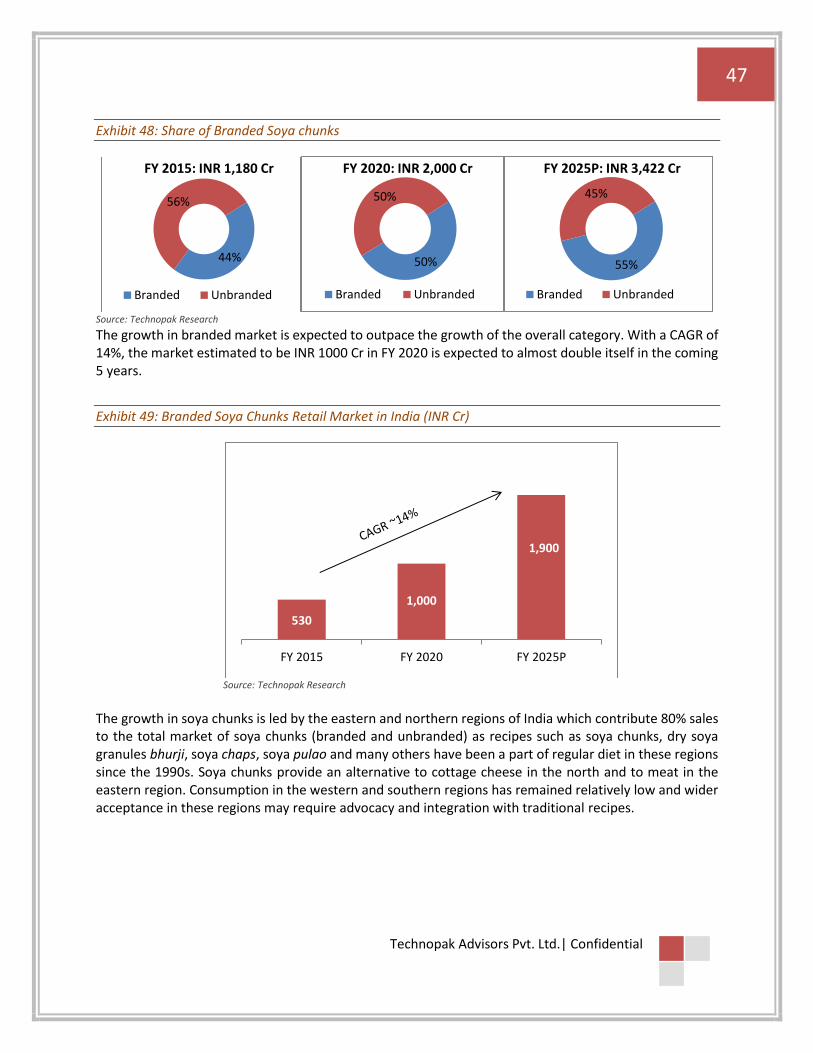
47
Technopak Advisors Pvt. Ltd.| Confidential
Exhibit 48: Share of Branded Soya chunks
Source: Technopak Research The growth in branded market is expected to outpace the growth of the overall category. With a CAGR of 14%, the market estimated to be INR 1000 Cr in FY 2020 is expected to almost double itself in the coming 5 years.
Exhibit 49: Branded Soya Chunks Retail Market in India (INR Cr)
Source: Technopak Research The growth in soya chunks is led by the eastern and northern regions of India which contribute 80% sales to the total market of soya chunks (branded and unbranded) as recipes such as soya chunks, dry soya granules bhurji, soya chaps, soya pulao and many others have been a part of regular diet in these regions since the 1990s. Soya chunks provide an alternative to cottage cheese in the north and to meat in the eastern region. Consumption in the western and southern regions has remained relatively low and wider acceptance in these regions may require advocacy and integration with traditional recipes.
44%
56%
FY 2015: INR 1,180 Cr
Branded Unbranded
50%
50%
FY 2020: INR 2,000 Cr
Branded Unbranded
55%
45%
FY 2025P: INR 3,422 Cr
Branded Unbranded
530
1,000
1,900
FY 2015 FY 2020 FY 2025P

48
Technopak Advisors Pvt. Ltd.| Confidential
Exhibit 50: Region-wise Soya Chunks Retail Market (INR Cr)
Source: Technopak Research
Retail Channels Mapping
Sales in urban areas contribute almost 80% of the total sales in the branded segment. Modern trade is a significant channel for the sale of branded products as the adoption is restricted to urban centres.
Exhibit 51: Share of Retail Channels for Branded Soya Chunks (FY2020)
Source: Technopak Research
Competitive Intensity This category has been dominated by edible oil majors (soybean) who have an established infrastructure for soybean oilseed crushing and refining. The key players in the soya chunk market include Ruchi Soya (Nutrela) and Adani Wlimar (Fortune). Emami Agrotech and Marico has also recently ventured into soya chunks with their Healthy and Tasty and Saffola brands respectively.
40%
10%10%
40%
FY2020 (INR 2000 Cr)
North West South East
75%
25%
General Trade Modern Trade

49
Technopak Advisors Pvt. Ltd.| Confidential
Exhibit 52: Market share of key players in branded soya chunks market (FY2020)
Source: Technopak Research
Exhibit 53: Key Players’ Profile
Player Brand Name Sales & Distribution Network Manufacturing
Ruchi Soya Nutrela 3 - 4 lakh Retail outlets, 1,381 exclusive
distributors In-house manufacturing
Adani Wilmar Fortune Not Available In-house manufacturing
Emami Agrotech Healthy & Tasty Not Available Outsourcing
Source: Technopak Research
Key Growth Drivers for Branded Soya Chunks Due to the small base of the branded segment in this category, it exhibits a high growth rate on account of entry of new players and private labels, thereby resulting in a shift from loose to branded products. While the branded segment registers low volumes but is a highly profitable line of business for edible oil players.
1. Remarkable shift has been taking place from consumption of unbranded soya chunks to branded ones on account of growth of modern retail and changing consumer preference due to quality assurance. Key edible oil majors with established brands in edible oils are extending into this category. The brand association is aiding in an instant offtake of soya chunks.
2. Entry of new players and private labels: In addition to new brands like Emami and Marico, there are retailers both brick and mortar and e-commerce introducing private labels in this category.
40%
18%5%
37%
FY2020 (INR 1,000 Cr)
Ruchi Soya Adani Wilmar Emami Others
50
Technopak Advisors Pvt. Ltd.| Confidential
Bigbasket sells soya chunks and granules under its umbrella brand BB Popular and BB Royal. Amazon also offers soya chunks under its private label Vedaka.
3. Positioned as protein-rich vegetarian food item: Soya chunks and granules have been positioned
as a high protein low-cost meat substitute. India has the highest number of vegetarians in the world, with more than 400 million people identifying as vegetarian. Additionally, India is largely a protein deficient country with relatively lower per capita consumption than the recommended values. Soya nuggets are said to have 52% protein, much higher than eggs and milk which range from 10-15%. This bodes well for the category and presents an apt platform for product positioning. COVID-19 has also accelerated the off-take of soya chunks given a general aversion to animal products.
Key Challenges
1. The growth in this category is led by the eastern and northern regions. The challenge lies in widening the adoption of the category in southern and western regions and building the overall scale in this category through advocacy.
Key Success Factor
1. Retail Availability: Consistent brand visibility through appropriate marketing initiatives and product availability on retail shelves in the key imperative.
2. Backward Integration: the integrated value chain of soybean crushing, refining and food product processing has benefitted the key soya chunk players like Ruchi Soya and Adani Wilmar. Besides having established market leading brands, they have been suppliers to other national and regional brands and been catering to institutional demand.
3. Specialized consumer focussed distribution network: Edible oil distribution network is not
suitable for TSP products. It needs specialized consumer focussed distribution network. Many
edible oil players who have ventured in branded TSP space are depending on the edible oil
distribution network for their TSP portfolio, resulting in limited market reach. Ruchi Soya has been
successful in this category on account of having an exclusive distribution network catering only to
TSP products.

51
Technopak Advisors Pvt. Ltd.| Confidential
5. Overview of Indian Oleochemicals Market Oleochemicals are chemicals manufactured through the organic route by using vegetable oils and derivatives. These chemicals offer a unique proposition of performance enhancers/accelerators while at the same time they are also environmentally friendly. Oleochemicals are manufactured from oils and by-products of oil refining and provide profitable product expansion opportunity to vegetable oil processors and refiners. In FY20, the Indian oleochemicals industry size was estimated at 16 Lakh MT, expected to grow at a CAGR of 5.9%.
Exhibit 54: Oleochemicals Market in India (Tonnes per Annum)
Source: Technopak Research
Oleochemicals are industrially produced chemicals, derived from animal fat or vegetable oils. Since they are safer for human use compared to conventional petrochemicals products, various end-user industries such as those engaged in manufacturing of personal care products, detergents, soaps, and agro-chemicals are substituting their requirements for petrochemicals with oleochemicals. Traditionally, oleochemicals have been used for applications such as surfactants, personal care, soaps and detergents and food additives. However, various new applications of oleochemicals such as biolubricants, biopolymers, and biosurfactants are emerging and replacements of petroleum-based products are creating exciting growth opportunities for oleochemical manufacturers. Indonesia and Malaysia are the major producers of base products for oleochemicals. While Asia Pacific is the largest consuming region, it is also the largest producer region of oleochemicals and has the major share in the global production. The large share is attributed to the rapid expansion of the end-use industries and the easy availability of palm oil, an ideal feedstock for the oleochemicals and derivatives industry.
1265000
16,00,000
21,31,000
FY 2015 FY 2020 FY 2025P
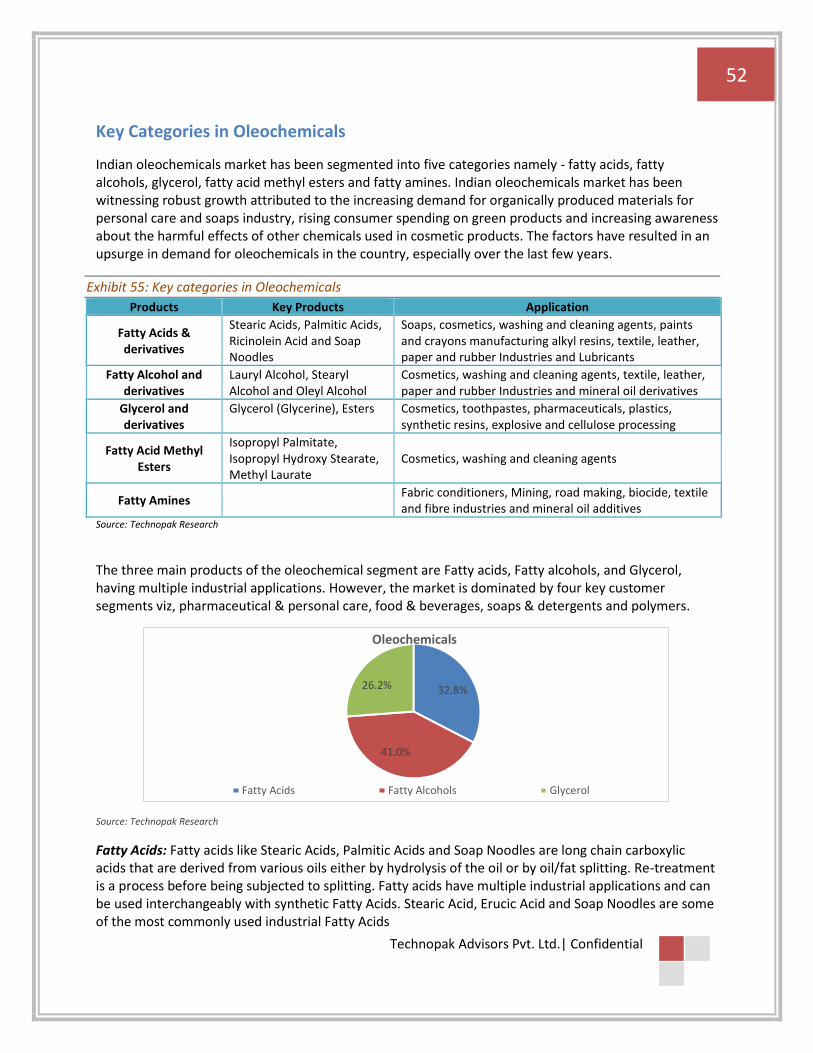
52
Technopak Advisors Pvt. Ltd.| Confidential
Key Categories in Oleochemicals
Indian oleochemicals market has been segmented into five categories namely - fatty acids, fatty alcohols, glycerol, fatty acid methyl esters and fatty amines. Indian oleochemicals market has been witnessing robust growth attributed to the increasing demand for organically produced materials for personal care and soaps industry, rising consumer spending on green products and increasing awareness about the harmful effects of other chemicals used in cosmetic products. The factors have resulted in an upsurge in demand for oleochemicals in the country, especially over the last few years.
Exhibit 55: Key categories in Oleochemicals
Products Key Products Application
Fatty Acids & derivatives
Stearic Acids, Palmitic Acids, Ricinolein Acid and Soap Noodles
Soaps, cosmetics, washing and cleaning agents, paints and crayons manufacturing alkyl resins, textile, leather, paper and rubber Industries and Lubricants
Fatty Alcohol and derivatives
Lauryl Alcohol, Stearyl Alcohol and Oleyl Alcohol
Cosmetics, washing and cleaning agents, textile, leather, paper and rubber Industries and mineral oil derivatives
Glycerol and derivatives
Glycerol (Glycerine), Esters Cosmetics, toothpastes, pharmaceuticals, plastics, synthetic resins, explosive and cellulose processing
Fatty Acid Methyl Esters
Isopropyl Palmitate, Isopropyl Hydroxy Stearate, Methyl Laurate
Cosmetics, washing and cleaning agents
Fatty Amines Fabric conditioners, Mining, road making, biocide, textile
and fibre industries and mineral oil additives Source: Technopak Research
The three main products of the oleochemical segment are Fatty acids, Fatty alcohols, and Glycerol, having multiple industrial applications. However, the market is dominated by four key customer segments viz, pharmaceutical & personal care, food & beverages, soaps & detergents and polymers.
Source: Technopak Research
Fatty Acids: Fatty acids like Stearic Acids, Palmitic Acids and Soap Noodles are long chain carboxylic acids that are derived from various oils either by hydrolysis of the oil or by oil/fat splitting. Re-treatment is a process before being subjected to splitting. Fatty acids have multiple industrial applications and can be used interchangeably with synthetic Fatty Acids. Stearic Acid, Erucic Acid and Soap Noodles are some of the most commonly used industrial Fatty Acids
32.8%
41.0%
26.2%
Oleochemicals
Fatty Acids Fatty Alcohols Glycerol
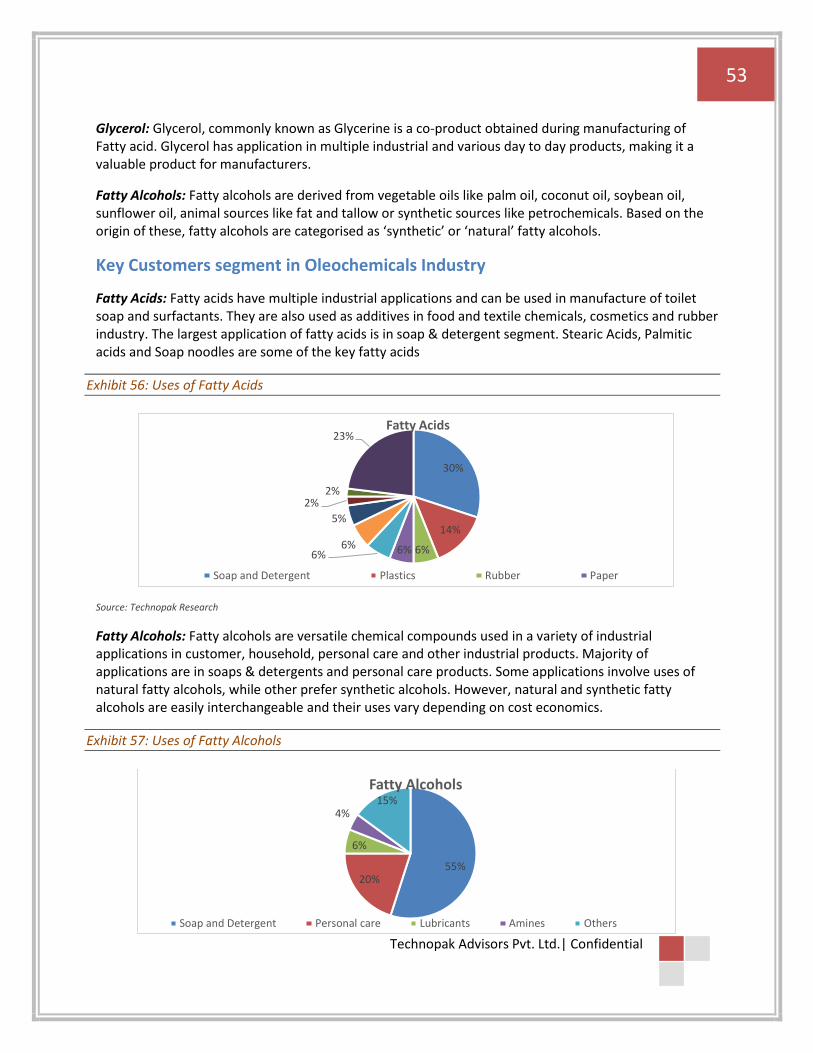
53
Technopak Advisors Pvt. Ltd.| Confidential
Glycerol: Glycerol, commonly known as Glycerine is a co-product obtained during manufacturing of Fatty acid. Glycerol has application in multiple industrial and various day to day products, making it a valuable product for manufacturers.
Fatty Alcohols: Fatty alcohols are derived from vegetable oils like palm oil, coconut oil, soybean oil, sunflower oil, animal sources like fat and tallow or synthetic sources like petrochemicals. Based on the origin of these, fatty alcohols are categorised as ‘synthetic’ or ‘natural’ fatty alcohols.
Key Customers segment in Oleochemicals Industry
Fatty Acids: Fatty acids have multiple industrial applications and can be used in manufacture of toilet soap and surfactants. They are also used as additives in food and textile chemicals, cosmetics and rubber industry. The largest application of fatty acids is in soap & detergent segment. Stearic Acids, Palmitic acids and Soap noodles are some of the key fatty acids
Exhibit 56: Uses of Fatty Acids
Source: Technopak Research
Fatty Alcohols: Fatty alcohols are versatile chemical compounds used in a variety of industrial applications in customer, household, personal care and other industrial products. Majority of applications are in soaps & detergents and personal care products. Some applications involve uses of natural fatty alcohols, while other prefer synthetic alcohols. However, natural and synthetic fatty alcohols are easily interchangeable and their uses vary depending on cost economics.
Exhibit 57: Uses of Fatty Alcohols
30%
14%
6%6%6%6%
5%
2%2%
23%Fatty Acids
Soap and Detergent Plastics Rubber Paper
55%20%
6%
4%15%
Fatty Alcohols
Soap and Detergent Personal care Lubricants Amines Others

54
Technopak Advisors Pvt. Ltd.| Confidential
Source: Technopak Research
Glycerol: Glycerol also called glycerine is used in a variety of applications including food products, pharmaceutical preparations, dietary supplements, cosmetic & personal care, coatings, plastics additives, tobacco additives and manufacture of urethane polymers
Exhibit 58: Uses of Glycerine
Source: Technopak Research
Indian players cater to the demand of basic oleochemicals and oleochemical derivatives across the industries. Companies have also expanded their reach to global markets and supply oleochemicals and derivatives across the world.
Value Chain
Basic oleochemicals include fatty acids, fatty alcohols, fatty amines and glycerine, which are further processed to obtain their derivatives that have high functional properties and are value added in nature.
Exhibit 59: Value Addition across Value Chain
Source: Technopak Research
42%
15%12%
11%
9%
3%
15%Glycerol
Soap/Cosmetic/Pharma Alkyd resin Food Polyurethanes Tobacco Explosives Others
Oils & Fats (Palm Oils,
Soybean Oil)
Base Oleochemicals
(Fatty Acids, Fatty
Alcohols, Glycerine)
Speciality Products
(Polymers, BTAC,
Lubricants)
Derivatives (Amine,
Amides, Esters,
Sulphates, Alkoxylates)
Medium Medium High High
Medium High High High
Profitability
Consolidation
Value Addition
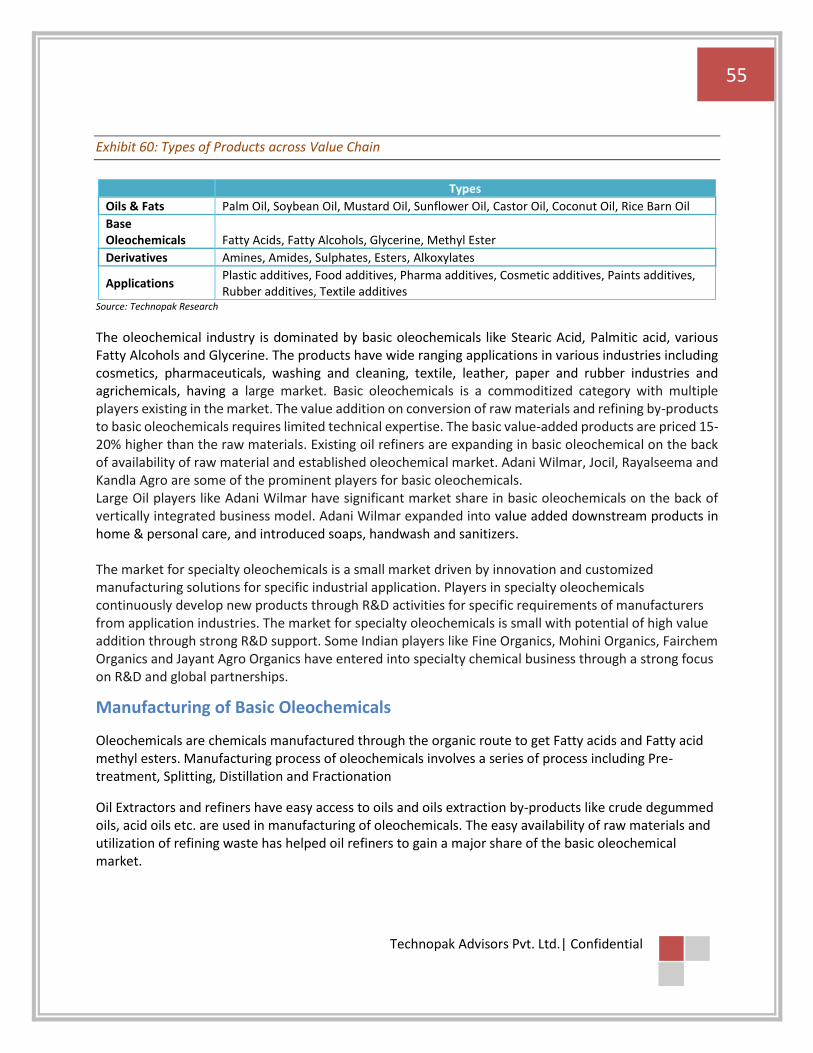
55
Technopak Advisors Pvt. Ltd.| Confidential
Exhibit 60: Types of Products across Value Chain
Types
Oils & Fats Palm Oil, Soybean Oil, Mustard Oil, Sunflower Oil, Castor Oil, Coconut Oil, Rice Barn Oil
Base Oleochemicals Fatty Acids, Fatty Alcohols, Glycerine, Methyl Ester
Derivatives Amines, Amides, Sulphates, Esters, Alkoxylates
Applications Plastic additives, Food additives, Pharma additives, Cosmetic additives, Paints additives, Rubber additives, Textile additives
Source: Technopak Research
The oleochemical industry is dominated by basic oleochemicals like Stearic Acid, Palmitic acid, various Fatty Alcohols and Glycerine. The products have wide ranging applications in various industries including cosmetics, pharmaceuticals, washing and cleaning, textile, leather, paper and rubber industries and agrichemicals, having a large market. Basic oleochemicals is a commoditized category with multiple players existing in the market. The value addition on conversion of raw materials and refining by-products to basic oleochemicals requires limited technical expertise. The basic value-added products are priced 15-20% higher than the raw materials. Existing oil refiners are expanding in basic oleochemical on the back of availability of raw material and established oleochemical market. Adani Wilmar, Jocil, Rayalseema and Kandla Agro are some of the prominent players for basic oleochemicals. Large Oil players like Adani Wilmar have significant market share in basic oleochemicals on the back of vertically integrated business model. Adani Wilmar expanded into value added downstream products in home & personal care, and introduced soaps, handwash and sanitizers. The market for specialty oleochemicals is a small market driven by innovation and customized manufacturing solutions for specific industrial application. Players in specialty oleochemicals continuously develop new products through R&D activities for specific requirements of manufacturers from application industries. The market for specialty oleochemicals is small with potential of high value addition through strong R&D support. Some Indian players like Fine Organics, Mohini Organics, Fairchem Organics and Jayant Agro Organics have entered into specialty chemical business through a strong focus on R&D and global partnerships.
Manufacturing of Basic Oleochemicals
Oleochemicals are chemicals manufactured through the organic route to get Fatty acids and Fatty acid methyl esters. Manufacturing process of oleochemicals involves a series of process including Pre-treatment, Splitting, Distillation and Fractionation
Oil Extractors and refiners have easy access to oils and oils extraction by-products like crude degummed oils, acid oils etc. are used in manufacturing of oleochemicals. The easy availability of raw materials and utilization of refining waste has helped oil refiners to gain a major share of the basic oleochemical market.
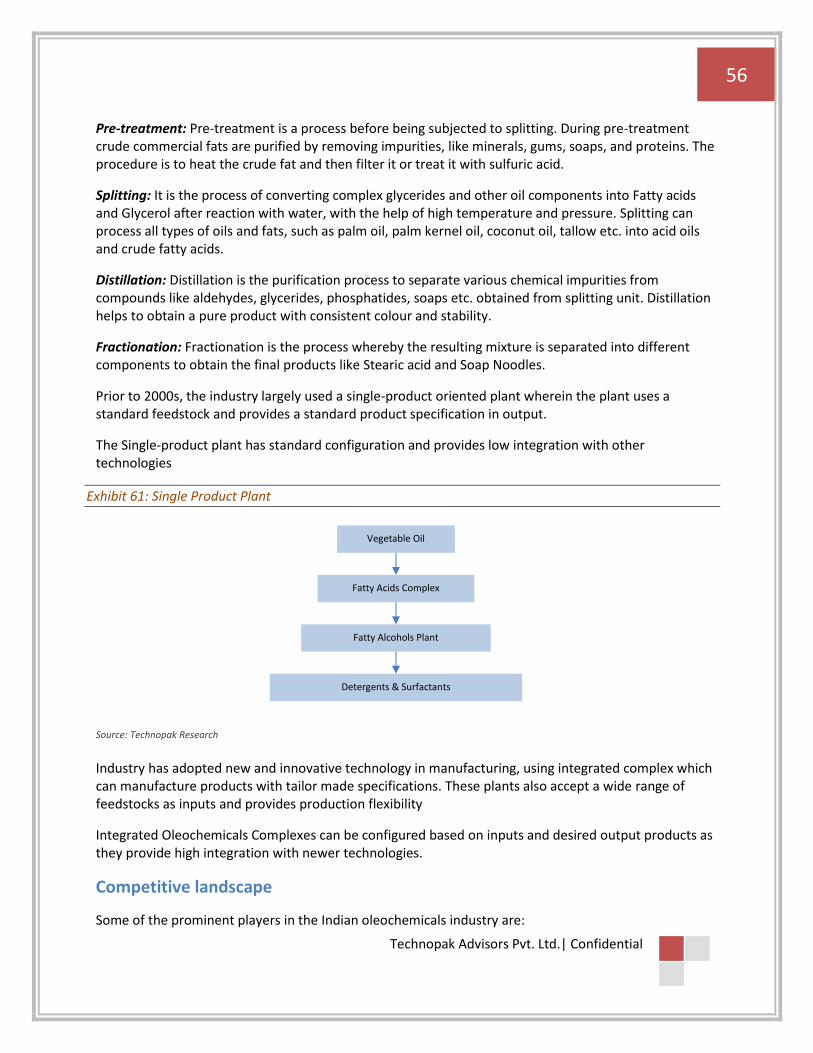
56
Technopak Advisors Pvt. Ltd.| Confidential
Pre-treatment: Pre-treatment is a process before being subjected to splitting. During pre-treatment crude commercial fats are purified by removing impurities, like minerals, gums, soaps, and proteins. The procedure is to heat the crude fat and then filter it or treat it with sulfuric acid.
Splitting: It is the process of converting complex glycerides and other oil components into Fatty acids and Glycerol after reaction with water, with the help of high temperature and pressure. Splitting can process all types of oils and fats, such as palm oil, palm kernel oil, coconut oil, tallow etc. into acid oils and crude fatty acids.
Distillation: Distillation is the purification process to separate various chemical impurities from compounds like aldehydes, glycerides, phosphatides, soaps etc. obtained from splitting unit. Distillation helps to obtain a pure product with consistent colour and stability.
Fractionation: Fractionation is the process whereby the resulting mixture is separated into different components to obtain the final products like Stearic acid and Soap Noodles.
Prior to 2000s, the industry largely used a single-product oriented plant wherein the plant uses a standard feedstock and provides a standard product specification in output.
The Single-product plant has standard configuration and provides low integration with other technologies
Exhibit 61: Single Product Plant
Source: Technopak Research
Industry has adopted new and innovative technology in manufacturing, using integrated complex which can manufacture products with tailor made specifications. These plants also accept a wide range of feedstocks as inputs and provides production flexibility
Integrated Oleochemicals Complexes can be configured based on inputs and desired output products as they provide high integration with newer technologies.
Competitive landscape
Some of the prominent players in the Indian oleochemicals industry are:
Vegetable Oil
Fatty Acids Complex
Fatty Alcohols Plant
Detergents & Surfactants
57
Technopak Advisors Pvt. Ltd.| Confidential
Adani Wilmar: Adani Willmar is the largest producer of basic oleochemicals in India. The company sources raw material (Refined Palm Oil) from its oil refinery in Mundra through pipelines, providing cost and margin advantage to the company compared to smaller players who procure raw materials form the open market. The product portfolio of the company includes Stearic acid, Soap Noodles Glycerine and Palmitic acid. The company also produce Palmitic Acid, used as animal feed, for export markets in USA and Europe
Adani Wilmar established its oleochemical plant in Nov 2012, in its Mundra facility. Wilmar group, a large player in Indonesia, Malaysia and China provided the technical and manufacturing support required to establish one of the largest plants in India with 400 Tonnes/day of Splitting capacity, 550 Tonnes/day of Distillation capacity and 200 Tonnes/day Hydrogenation capacity.
Major clients of the company include polymer additives players like Fine organics and Baerlocher, Home & personal care companies HUL, Unilever Sri Lanka and Reckitt Benckiser.
Ruchi Soya: Ruchi Soya has been present in basic oleochemical business since 2005. The company manufactures basic oleochemicals from soybean oil, palm oil and castor oil.
Products derived from soybean oil, like distilled soya fatty acid and hydrogenated soybean oil, are highly profitable for Ruchi Soya’s oleochemical business. The company manufactures castor oil based oleochemicals {Hydrogenated Castor Oil, 12-Hydroxy Steric Acid (12HSA) and Ricinoleic Acid}, Palm oil based oleochemicals {Stearic Acid, Hydrogenated Palm Oil Flakes, and Soap Noodles} and Glycerine.
Ruchi Soya’s oleochemicals manufacturing facility is located at Gandhidham, Gujarat with close proximation to Kandla port. The plant has an installed capacity of 42000 MT/Annum (118 Tonnes/day) for soap noodles, 35000 MT/Annum (98 Tonnes/day) of split fatty acid, 2250 MT/Annum (6.3 Tonnes/day) of glycerine and 33600 MT/Annum (93 Tonnes/day) of toilet soap.
Clients for Ruchi soya include tyre manufacturing and paint manufacturing companies like Asian paints and Berger paints. Ruchi soya also exports oleochemical products to China.
Fairchem Organics Ltd.: Fairchem Organics is a major player in soya based oleochemicals and specialty chemicals. The company is formed post the merger of the businesses of Adi Finechem Ltd (manufacturer of oleo chemicals & nutraceuticals) and Privi Organics Ltd (manufacturer of aroma chemicals). Fairchem has a large oleochemicals portfolio with products in linoleic and palmitic derivatives and glycerine, dimer acid, monobasic acids etc. The company is India’s largest manufacturer of Dimer acid used in many consumer products including paints. Fairchem’s manufacturing facility is located at Chekala village near Sanand, Gujarat with an installed capacity of 60,000 MT/Annum (170 Tonnes/day) The company has a customer base in consumer & industrial goods such as paints, soaps, printing ink, amines, amides, epoxy hardeners. Fairchem has Asian Paints, BASF, Cargill, Micro Inks, Arkema as some of its key clients. The company is also a major player in aroma chemicals with end use in perfumes, fragrances and FMCG and customer base in global giants like P&G and Henkel. VVF: Founded in 1939, VVF erstwhile “The Vegetable Vitamin Foods Company Pvt. Ltd., VVF manufactured Vegetable Ghee. Currently VVF is the world’s largest contract manufacturer of bar soaps,

58
Technopak Advisors Pvt. Ltd.| Confidential
with 16 operating centres spread across 4 continents - Asia, North America, Europe and Africa. VVF is one of the largest exporters of oleochemicals from India and is a significant player globally. VVF has a wide distribution and logistics network with bulk storage facilities situated in Europe and North America.
VVF commenced its chemical operations in 1971, in the field of oleochemicals. VVF has a manufacturing capacity of approximately 500,000 MT/Annum (~1400 Tonnes/day) of Fatty Alcohol, Fatty Acid and Glycerine. The company manufactures basic oleochemicals like fatty acids glycerine and fatty alcohols. The product portfolio also includes speciality fatty acids. VVF’s consumer portfolio includes bar soaps, liquid soaps, shampoos, conditioners, anti- perspirant and deodorant sticks, hand sanitizers, face washes, skin moisturizers and massage oils, creams and lotions, mouthwashes, after shave products, shower gels, sun protection products, talcum powder, hair dyes and other OTC products including cough syrup and other antiseptic hygiene products. The company has multiple brands in its portfolio like Bactershield, Doy, DoyCare, and Jo. Jocil: A company established in 1978 as Andhra Pradesh Oil and Chemical Industries, and renamed Jocil in 1992, Jocil has more than 30 years of experience in manufacture of basic oleochemical products like Stearic Acid, Fatty Acids, Refined Glycerine. Jocil India also manufactures downstream products like soap as a contract manufacturer for major FMCG players like HUL, ITC Marico, Reckitt Benckiser, Emami, Jyothy Labs and Henkel India. Jocil manufactures Liril, Superia, Lifebuoy, Vivel and Manjal brands of soap for large FMCG players.
Jocil has a production capacity of more than 70,000 MT/Annum (~190 Tonnes/day) of fatty acids, 45,000 MT/Annum (~125 Tonnes/day) of soap products and soap, and more than 300 MT/Annum (~8 Tonnes/day) of glycerine based on production estimates. Godrej Industries: Godrej is one of the largest players in oleochemicals manufacturing basic oleochemicals like fatty acids, fatty alcohols, Glycerine and surfactants. Godrej also has a specialty product line which includes Bio-Surfactants, Emulsifying Waxes, Esters Secondary Ingredients, Active/Specialty Chemical etc. The company manufactures and markets over 100 products in oleochemicals and exports to over 80 countries spread across North and South America, Asia, Europe, Australia and Africa.
Godrej has two manufacturing facilities based in Vaila, Gujarat. These plants have a combined capacity of 65,000 MT/Annum (~180 Tonnes/day) across all oleochemicals.
Growth drivers
Growth in Applications Industry
Oleochemicals and derivatives are used as raw material in the production of chemicals, which are further used to produce specialty soaps, surfactants, cosmetics, and personal care products, paints, surface coatings, pharmaceuticals, greases and lubricants, specialty rubber, and plasticizers. Mounting demand for organic and natural personal care and cosmetic products is projected to positively influence the production of organic oils, thus, contributing to the market growth.
59
Technopak Advisors Pvt. Ltd.| Confidential
Changing Indian Agriculture Landscape
Government of India introduced reforms in the agriculture sector in July 2020. It brought in the Farmers’ Produce Trade and Commerce (Promotion & Facilitation) Ordinance 2020, Farmers (Empowerment and Protection) Agreement on Price Assurance and Farm Services Ordinance 2020 and amended the Essential Commodities Act. These laws seek to change the way marketing, procurement and storage of agricultural products is done in India. Leading to diversification and innovation in business models like farmer management services, digital marketplaces, warehousing, and quality centres these changes may be helpful for the processers by enabling easy procurement, sourcing and contract farming of oilseeds, helping oleochemicals manufacturers to gain higher profitability and organised procurement.
Risk Factors
Pricing competition from Petrochemicals: Continuous availability and rising prices of feedstock is a key concern for companies operating in oleochemicals. Prices of the raw materials are a key concern for companies operating in oleochemicals. Globally, approximately 12% to 14% of vegetable oil production has been used for manufacturing of oleochemicals. The emerging applications will require an additional production of oils which can be met with the increasing global vegetable oil production. Increasing prices of raw materials like palm oil, and soybean oil impact the profitability and margins of the key oleochemical players and this is expected to increase the competition from petrochemicals
Price Volatility in Castor: Castor oilseeds are used extensively by Indian oleochemical players as a feedstock for production of castor based oleochemicals, a key product for Indian players. India is the largest producer of castor seeds, with nearly 85% production in Gujarat, leading to extra ordinary price volatility due to climatic, production and speculative factors. This price volatility impacts the profitability of manufacturers and their customers.
Opportunities and Future Outlook
Opportunities
Oleochemical based products offer a significant diversification opportunity for chemical companies. Asia is the geography with a growing market and availability of feedstock leading to increase in demand and production of oleochemicals in India and neighbouring nations, providing expansion opportunity to Indian players.
To capitalize on this opportunity, companies can explore partnerships / mergers with base oleochemicals companies or think about integrating forward / backward themselves. Going further, companies can also plan to establish their footprint in new geographies which could provide them a first mover advantage and position them as a strong integrated player.
Petrochemicals based industries such as lubricants, polymers and surfactants are accepting oleochemical alternatives The companies which capture major portion of the oleochemical value chain and are capable to spot changing industrial trends and introduce new oleochemical products could benefit significantly in the long run.
60
Technopak Advisors Pvt. Ltd.| Confidential
Future Outlook
The fastest growth in India oleochemicals market over the next ten years is anticipated to be exhibited by methyl esters and fatty amines, which are increasingly being used in the agrochemicals sector. West region controls the largest share in India oleochemicals market on account of strong presence of soaps and detergent manufacturing industries in the region. While this may continue, north India is expected to be the next hub for oleochemicals considering new manufacturing facilities expected in this region and increasing use of oleochemicals in other industries.
Chemical companies focusing on lubricants, polymers, and surfactants are expected to explore diversification in oleochemical based product portfolio. The companies are actively looking introduce environment friendly products to serve their core businesses and also significantly lower their portfolio risk and their carbon footprint.
Manufacturers are taking initiatives aimed at replacing chemically derived products with bio-based chemicals to minimize the reformulation and re-equipping time and cost. The rising demand for bio-based plastics is also expected to have a positive influence on market growth.

61
Technopak Advisors Pvt. Ltd.| Confidential
6. Overview of Market for Key Packaged Food Segments
6.1 Overview of Honey Retail in India
Indian Honey Retail Market Beekeeping (Apiculture) and honey consumption has an ancient tradition in India. Considered a natural
sweetener, it is known for its medicinal properties and finds an integral place in Ayurveda. For a long time,
its usage was limited to medicinal purposes. However, the sustained efforts of brands have elevated
honey to a food platform by widening its spectrum of usages. It has now become a healthier substitute
for sugar and also finds shelf place next to other sweet spreads and dressings.
The size of the honey retail market in India was estimated at INR 2450 Cr in FY 2020 comprising both branded and unbranded segments.
The share of branded honey is estimated to be approximately INR 1350 Cr in FY 2020. It is expected to grow faster at a CAGR of 10% than the overall category growing at a rate of 7% in the coming 5 years.
Exhibit 62: Honey Retail Market in India (INR Cr)
Source: Technopak Research
Exhibit 63: Share of Branded Honey Market
Source: Technopak Research
1,800 2,450
3,500
FY 2015 FY 2020 FY 2025P
49%
51%
FY 2015: 1800 INR Cr
Branded Unbranded
55%
45%
FY 2020: INR 2450 Cr
Branded Unbranded
62%
38%
FY 2025P: INR 3500 Cr
Branded Unbranded

62
Technopak Advisors Pvt. Ltd.| Confidential
Exhibit 64: Branded Honey Retail Market in India (INR Cr)
Source: Technopak Research
Honey Production in India India's honey production in FY 2019 was reported to be 1,20,000 metric tons (MT). The country has exported close to 50% (~59,537 MT) of the honey produced worth INR 634 Cr / US$ 88.65 Mn. during the FY 2020 to key destinations such as the USA, Saudi Arabia, United Arab Emirates, Canada, Qatar.
Exhibit 65: Honey Production in India (‘000 MT)
Source: National Horticulture Board
890
1350
2200
FY 2015 FY 2020 FY 2025P
8188
95105
120
2014-15 2015-16 2016-17 2017-18 2018-19

63
Technopak Advisors Pvt. Ltd.| Confidential
Exhibit 66: State wise Share in Honey Production in India (FY 2019)
Source: National Horticulture Board
Uttar Pradesh, West Bengal, Punjab, Bihar, Rajasthan, Himachal Pradesh, Haryana contribute almost 78% to the total honey production in the country. Besides these states, all the North eastern states put together also contribute ~3% to the total production.
Based on seasonality of production, the autumn and spring seasons dominate the market. They are followed by the winter, summer and monsoon seasons. In terms of cultivation and honey extraction, the honey market in India is highly fragmented in nature owing to the presence of a large number of producers. On the basis of flavors, multiflora honey is the most popular type of honey flavor in India. Other major flavor types include eucalyptus honey, ajwain honey, sidr honey and others.
Competitive Intensity
This is a fairly consolidated space with national brands Dabur and Patanjali being the volume drivers and contributing almost 80% to the total retail in the branded segment. Besides Dabur and Patanjali, Apis and Zandu and Saffola has also launched honey in the value segment and registered a fast growth on the back of their distribution capabilities and relationship with modern trade and e-commerce. Ruchi Soya has also introduced honey under Nutrela brand. Purity has been the key touchstone for all these brands.
Till a few years back, there was hardly any distinction between premium and mass honey. However, now premium honey constitutes atleast 10% of the total market in terms of value. Some imported brands like Capilano and Langanese, and home-grown brands such as Under the Mango Tree, The Gourmet Jar, Sprig, Organic India are promoting the flavours, organic cultivation and minimal processing intervention to command a premium. This has led the premium market to gain shared in the honey segment.
18%
15%
14%13%
9%
5%
4%
22%
Total Production: 120,000 MT
Uttar Pradesh West Bengal Punjab
Bihar Rajasthan Himachal Pradesh
Haryana Others
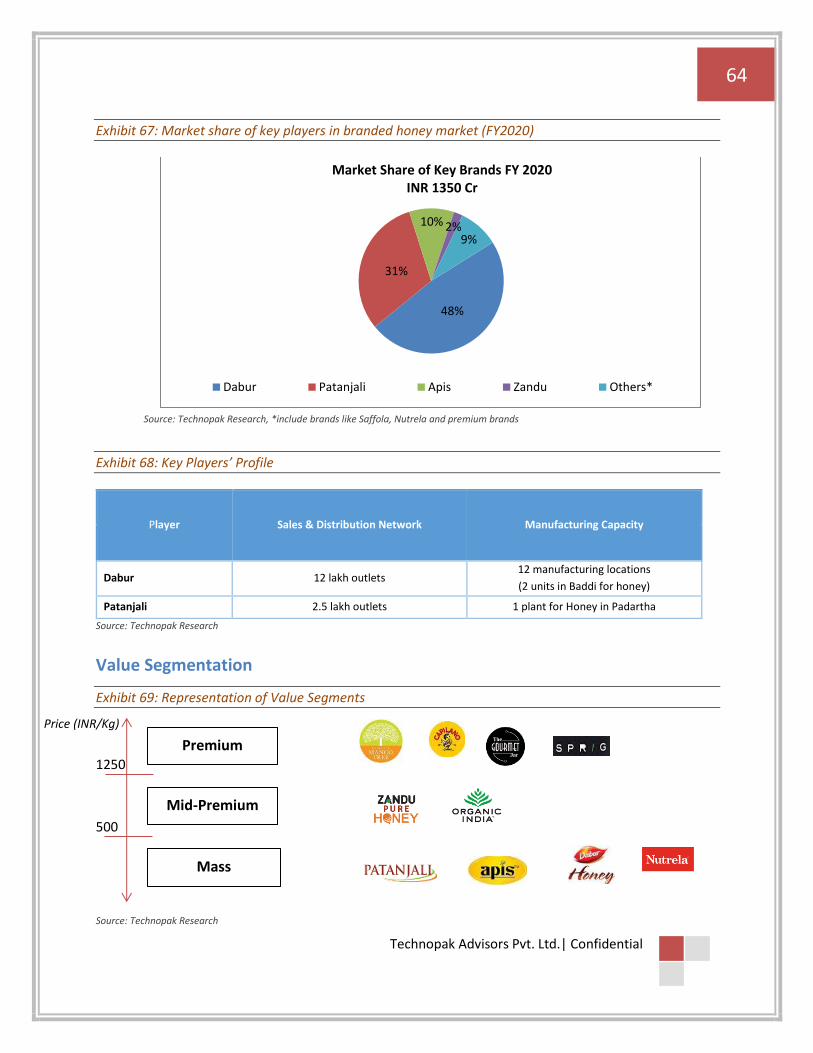
64
Technopak Advisors Pvt. Ltd.| Confidential
Exhibit 67: Market share of key players in branded honey market (FY2020)
Source: Technopak Research, *include brands like Saffola, Nutrela and premium brands
Exhibit 68: Key Players’ Profile
Player Sales & Distribution Network Manufacturing Capacity
Dabur 12 lakh outlets 12 manufacturing locations
(2 units in Baddi for honey)
Patanjali 2.5 lakh outlets 1 plant for Honey in Padartha
Source: Technopak Research
Value Segmentation
Exhibit 69: Representation of Value Segments
1250
500
Source: Technopak Research
48%
31%
10% 2%9%
Dabur Patanjali Apis Zandu Others*
Market Share of Key Brands FY 2020 INR 1350 Cr
Price (INR/Kg)
Mass
Mid-Premium
Premium
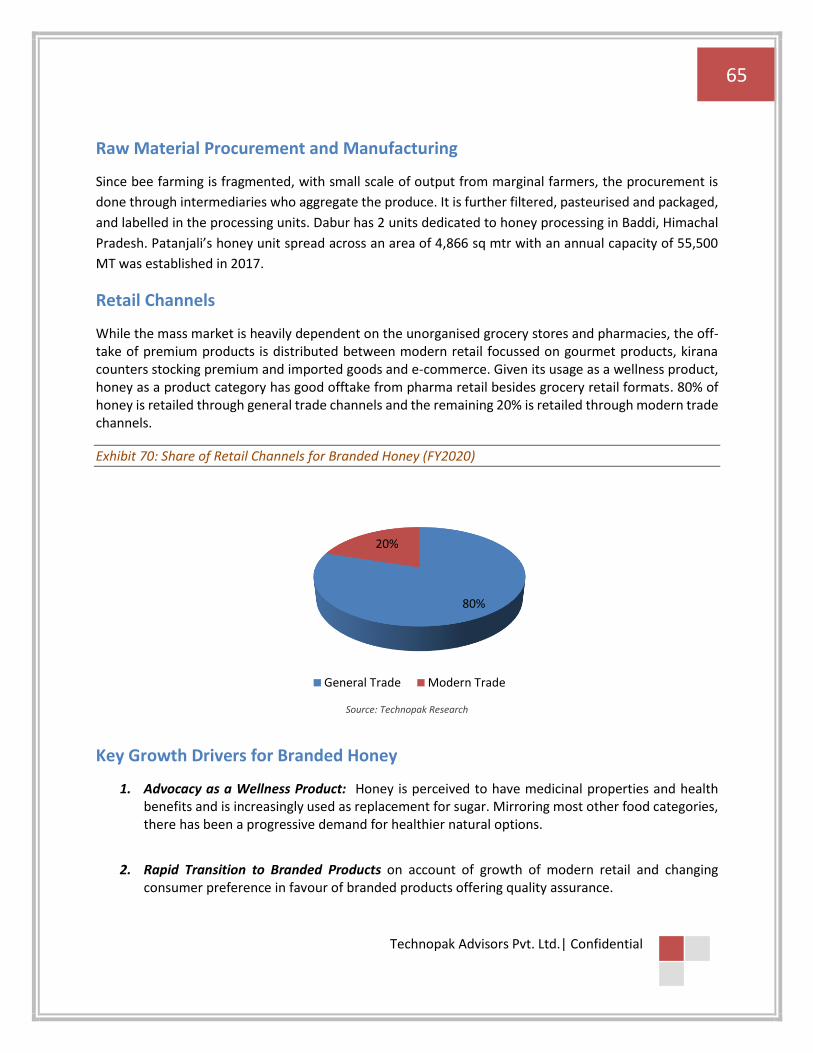
65
Technopak Advisors Pvt. Ltd.| Confidential
Raw Material Procurement and Manufacturing
Since bee farming is fragmented, with small scale of output from marginal farmers, the procurement is
done through intermediaries who aggregate the produce. It is further filtered, pasteurised and packaged,
and labelled in the processing units. Dabur has 2 units dedicated to honey processing in Baddi, Himachal
Pradesh. Patanjali’s honey unit spread across an area of 4,866 sq mtr with an annual capacity of 55,500
MT was established in 2017.
Retail Channels
While the mass market is heavily dependent on the unorganised grocery stores and pharmacies, the off-take of premium products is distributed between modern retail focussed on gourmet products, kirana counters stocking premium and imported goods and e-commerce. Given its usage as a wellness product, honey as a product category has good offtake from pharma retail besides grocery retail formats. 80% of honey is retailed through general trade channels and the remaining 20% is retailed through modern trade channels.
Exhibit 70: Share of Retail Channels for Branded Honey (FY2020)
Source: Technopak Research
Key Growth Drivers for Branded Honey
1. Advocacy as a Wellness Product: Honey is perceived to have medicinal properties and health benefits and is increasingly used as replacement for sugar. Mirroring most other food categories, there has been a progressive demand for healthier natural options.
2. Rapid Transition to Branded Products on account of growth of modern retail and changing consumer preference in favour of branded products offering quality assurance.
80%
20%
General Trade Modern Trade

66
Technopak Advisors Pvt. Ltd.| Confidential
3. Low per capita Consumption suggestive headroom for growth: While the per capita honey consumption is as low as 50 gm per year in India, globally it ranges from 250 to 300 gm, with Germany topping in per capita honey consumption, with 2 kg per year. In Asia, Japan is the biggest consumer of honey, with per capita consumption of up to 700 gm per year.
4. Government Advocacy: The government has also been promoting Ayurveda and Yoga on various forums. These initiatives have further established the long-term relevance of Ayurveda and traditional products in natural healthcare.
5. Growing emphasis on preventive healthcare during COVID-19: The pandemic has heightened the sense of awareness about consuming nutrient rich, pure, immunity boosting food. Given the inclination towards natural products, the role of honey along with other nutritious and immuno-rich super foods have become stronger. COVID-19 has resulted in broad based upsurge in the consumption of honey with the growing consumer need for immunity booster
Key Challenge and Risk for Branded Honey Players
1. Food Safety Standards: Honey is prone to adulteration. And therefore purity is key yardstick to
establish brand equity. While standards for honey purity have been revised regularly, the business
of adulteration has constantly evolved to beat laboratory tests. The fluidity in regulation and the
malpractice of adulteration hurts the brand equity of players adhering to the norms. Current
regulations specify around 18 parameters that honey must comply with for producers to label it
‘pure honey.’ The industry has been with grappling to match quality standards especially the
Nuclear Magnetic Resonance (NMR) test that can ascertain the composition of a product at the
molecular level. The NMR test is not required by Indian law for honey that is being marketed
locally but is needed for export.
Key Success Factors 1. Quality Assurance: Quality oriented approach to procurement and processing and consistent
communication of the same is critical. 2. Robust Distribution: Consistent brand visibility through appropriate marketing initiatives and
product availability on retail shelves has also benefitted brands like Dabur and Patanjali.

67
Technopak Advisors Pvt. Ltd.| Confidential
6.2 Overview of Packaged Wheat Flour Retail in India Indian Wheat Flour Retail Market Before the late-90s, wheat flour (aata) was mainly or milled through local chakki mills in India. Even now, the wheat flour market is largely dominated by local chakki mills in India. However, the branded packaged wheat flour has emerged rapidly in the country in the past fifteen years capitalizing on hygiene and convenience factors.
Wheat is the staple food for most Indians in the wheat growing areas (North and West India) and is consumed in the form of chapattis or rotis (unleavened flat bread). Wheat grain milled to flour form at home chakkis or small chakkis is referred to as unbranded form of wheat flour. This unpackaged and unbranded form of wheat flour dominates the consumption in rural and semi-urban areas.
Exhibit 71: Wheat Flour Retail Market in India (INR Cr)
Source: Technopak Research
74,000 96,000
1,27,000
FY 2015 FY 2020 FY 2025P
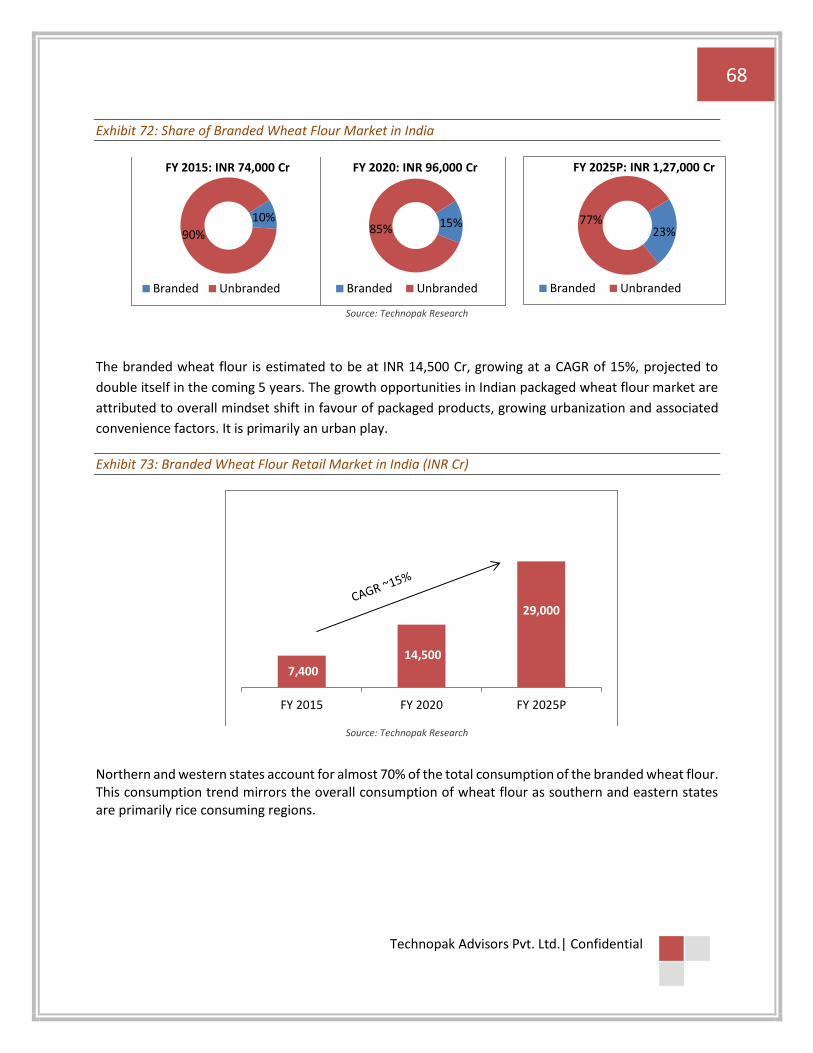
68
Technopak Advisors Pvt. Ltd.| Confidential
Exhibit 72: Share of Branded Wheat Flour Market in India
Source: Technopak Research
The branded wheat flour is estimated to be at INR 14,500 Cr, growing at a CAGR of 15%, projected to
double itself in the coming 5 years. The growth opportunities in Indian packaged wheat flour market are
attributed to overall mindset shift in favour of packaged products, growing urbanization and associated
convenience factors. It is primarily an urban play.
Exhibit 73: Branded Wheat Flour Retail Market in India (INR Cr)
Source: Technopak Research
Northern and western states account for almost 70% of the total consumption of the branded wheat flour. This consumption trend mirrors the overall consumption of wheat flour as southern and eastern states are primarily rice consuming regions.
10%
90%
FY 2015: INR 74,000 Cr
Branded Unbranded
15%85%
FY 2020: INR 96,000 Cr
Branded Unbranded
7,400 14,500
29,000
FY 2015 FY 2020 FY 2025P
23%77%
FY 2025P: INR 1,27,000 Cr
Branded Unbranded
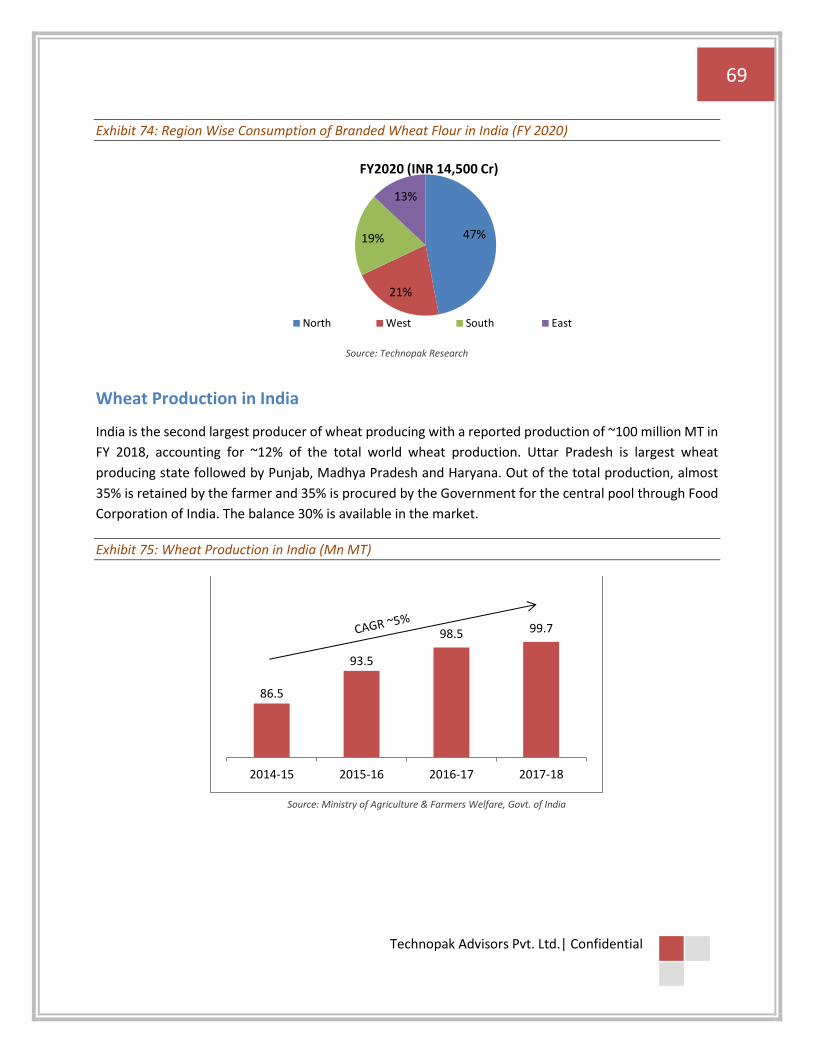
69
Technopak Advisors Pvt. Ltd.| Confidential
Exhibit 74: Region Wise Consumption of Branded Wheat Flour in India (FY 2020)
Source: Technopak Research
Wheat Production in India
India is the second largest producer of wheat producing with a reported production of ~100 million MT in
FY 2018, accounting for ~12% of the total world wheat production. Uttar Pradesh is largest wheat
producing state followed by Punjab, Madhya Pradesh and Haryana. Out of the total production, almost
35% is retained by the farmer and 35% is procured by the Government for the central pool through Food
Corporation of India. The balance 30% is available in the market.
Exhibit 75: Wheat Production in India (Mn MT)
Source: Ministry of Agriculture & Farmers Welfare, Govt. of India
47%
21%
19%
13%
FY2020 (INR 14,500 Cr)
North West South East
86.5
93.5
98.5 99.7
2014-15 2015-16 2016-17 2017-18

70
Technopak Advisors Pvt. Ltd.| Confidential
Exhibit 76: State wise Share in Wheat Production in India (FY 2018)
Source: Ministry of Agriculture & Farmers Welfare, Govt. of India
Retail Channels Given the category domination in urban regions within SEC A and B households, modern retail formats become significant sales channels. About 20% of packaged wheat flour is sold through the modern retail channels such as hypermarkets, supermarkets and e-commerce platforms. As the demand grows across urban and rural India, the players will be compelled to widen their distribution through kiranas. Almost 80% of wheat flour is sold through general trade channels and the rest 20% via modern trade.
Exhibit 77: Share of Retail Channels for Branded Wheat Flour (FY2020)
Source: Technopak Research
32%
18%16%
11%
9%
6%8%
Total Production: 99.7 Mn MT
Uttar Pradesh Punjab Madhya Pradesh
Haryana Rajasthan Bihar
Others
80%
20%
General Trade Modern Trade

71
Technopak Advisors Pvt. Ltd.| Confidential
Procurement Raw Material Sourcing: ITC’s procurement model for wheat has been a benchmark for the industry.
Wheat is procured either through e-chopual or via agents based at all major wheat mandis. ITC’s uses
third party warehouses as well as its own warehouses for storage. It is present in more than 20 states and
over 160 districts, operates through 65 hubs and over 300 warehouses spread across India. A strong,
quality-oriented, and dedicated supply chain to maintain consistent quality has been the key success
factor ITC in this category. Adani Wilmar also has an existing network of 86 depots ensuring a presence at
every 200-250 km across India for warehousing. Patanjali and other national players have also employed
intermediaries for aggregation of procurement.
Processing: Most wheat flour players including ITC, Adani Wilmar and Patanjali depend heavily on contract milling. Almost 30% of Patanjali’s wheat flour output is processed in its own facility and the balance is met through contract milling. Adani Wilmar has 7 tolling units across U.P., Maharashtra, West Bengal and Karnataka apart from an owned unit at Nimrani, Madhya Pradesh along with an upcoming in Rajasthan. In contract milling arrangement, wheat is supplied by a company (usually a branded wheat flour marketer) to a third party (the miller) to be milled into wheat flour of specified quality. Quality control norms to be followed by the third party are specified in detail and monitored by the company. The third party also provides packaging of the final product as per specification and dispatch of the same to their specified destinations. There are several advantages of contract milling
• Benefit of arrangement with mills attuned to the regional preferences It may involve choosing the right blend of wheat, milling the wheat to a specific fineness and adjusting the moisture levels to suit culinary preferences as well as geographic conditions
• Flexibility to upscale or downscale production volumes in line with seasonal variations in demand in the shortest possible time
• Cost advantage due to differential labour cost structure.
Competitive Intensity With introduction of Annapurna in 1998, HUL was the first to sell branded wheat flour, typically consumed in loose form at that time. General Mills with Pillsbury, stepped into the category at the same time. While these two were responsible for creating the category, it was the entry of Aashirvaad Atta from ITC in 2002 that brought about the wider adoption of the category. While Aashirvaad has maintained its leadership position with almost 40% market share, other national brands such as Fortune, Patanjali, Pillsbury, Nature Fresh, Annapurna, and more than 500 regional brands and private label brands together form the branded market. A large number of players having distinctive brands and product quality have created intensified competition in this space. Ruchi Soya has also introduced high protein wheat flour under its Nutrela brand called Nutrela High Protein Chakki Atta.

72
Technopak Advisors Pvt. Ltd.| Confidential
Exhibit 78: Market share of key players in branded wheat flour market (FY2020)
Source: Estimations based on Annual Reports
Pan India brands like Fortune, Pillsbury, Annapurna, Patanjali, Nature Fresh together contribute 15% of
the branded wheat flour market. Adani Wilmar’s Fortune contributes ~3% of the branded market. The
regional players comprising of 44% of the market include Shakti Bhog, Samrat, Rajdhani, Silver Coin
amongst many others.
Key Growth Drivers
1. Transition from chakkis to packaged products has been consistent due to rapidly growing urbanization, smaller house sizes and the associated convenience factors such as lack of storage of wheat in bulk, lack of resources to process the grains at household levels, along with perceived high quality of packaged wheat flour. In addition, the growing numbers of working women and their inclination towards the convenient food products is aiding the growth in this transition.
2. Emerging varieties positioned around health driving premiums: Health has become the new frontier for all packaged food categories exhibiting faster growth than that of the overall category. Mirroring the trend, the introduction of new variants in the health and wellness segment such as multigrain, low carb, sugar release control, high fibre, high protein, and fortified wheat flour varieties is aiding the growth of the packaged wheat flour market.
Key Challenges for Branded Wheat Flour
1. Low Profitability as compared with other packaged food categories because of commoditised nature of product makes the category less attractive for players.
2. Competition from regional players: No national player besides ITC has been able to acquire scale in this category. The key success factor for ITC has been the activation of contract manufacturing arrangements such that each unit is within a radius of ~300 km of the markets they are servicing thereby enabling cost optimisation in terms of labour and distribution. While any player with national ambition is compelled to undertake this journey, the regional players have advantage of
41%15%
44%
Aashirvaad Other Pan India Players Regional Players
Market Share of Key Brands FY 2020 INR 14,500 Cr
73
Technopak Advisors Pvt. Ltd.| Confidential
an established procurement and processing capability and a well-entrenched distribution network in any region.
Key Risk Factors
• Climate Risk: Since the business is based on availability of an agricultural commodity, it is subject
to climate change risks on account of extreme weather events, precipitation, and temperature
variation. Building climate resilient operations and agri-value chains is critical to compensate any
interruption due to extreme weather events.
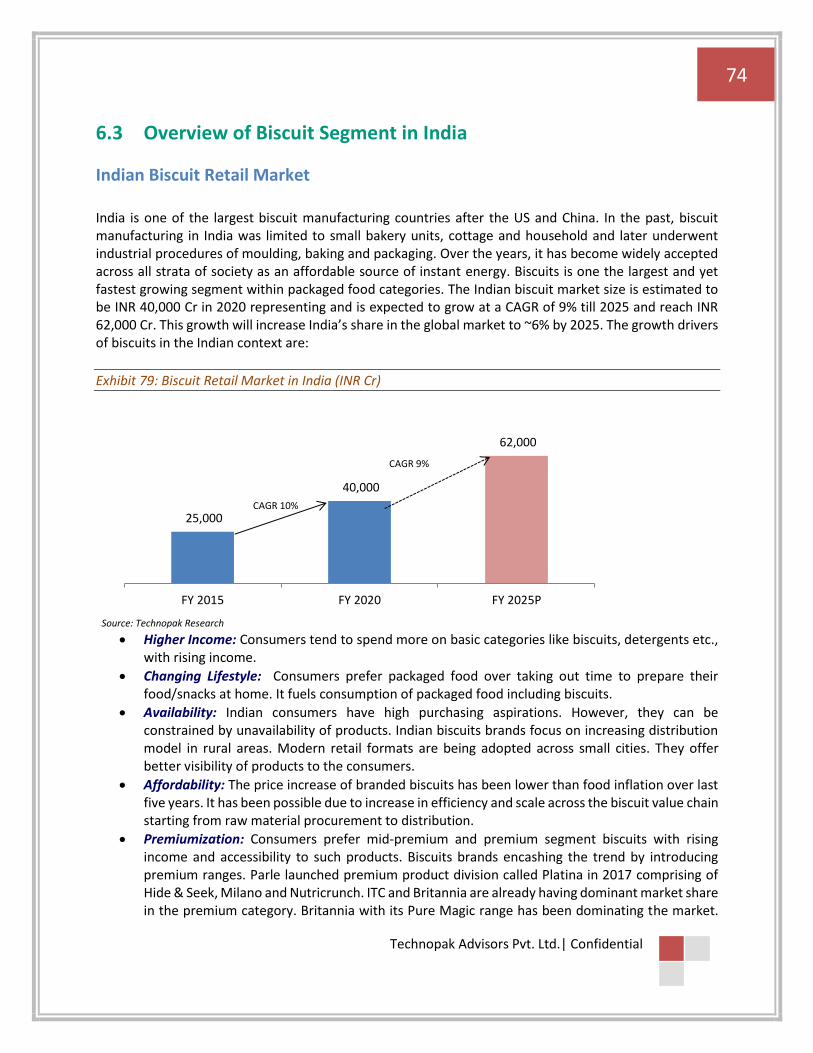
74
Technopak Advisors Pvt. Ltd.| Confidential
6.3 Overview of Biscuit Segment in India
Indian Biscuit Retail Market India is one of the largest biscuit manufacturing countries after the US and China. In the past, biscuit manufacturing in India was limited to small bakery units, cottage and household and later underwent industrial procedures of moulding, baking and packaging. Over the years, it has become widely accepted across all strata of society as an affordable source of instant energy. Biscuits is one the largest and yet fastest growing segment within packaged food categories. The Indian biscuit market size is estimated to be INR 40,000 Cr in 2020 representing and is expected to grow at a CAGR of 9% till 2025 and reach INR 62,000 Cr. This growth will increase India’s share in the global market to ~6% by 2025. The growth drivers of biscuits in the Indian context are:
Exhibit 79: Biscuit Retail Market in India (INR Cr)
Source: Technopak Research
• Higher Income: Consumers tend to spend more on basic categories like biscuits, detergents etc., with rising income.
• Changing Lifestyle: Consumers prefer packaged food over taking out time to prepare their food/snacks at home. It fuels consumption of packaged food including biscuits.
• Availability: Indian consumers have high purchasing aspirations. However, they can be constrained by unavailability of products. Indian biscuits brands focus on increasing distribution model in rural areas. Modern retail formats are being adopted across small cities. They offer better visibility of products to the consumers.
• Affordability: The price increase of branded biscuits has been lower than food inflation over last five years. It has been possible due to increase in efficiency and scale across the biscuit value chain starting from raw material procurement to distribution.
• Premiumization: Consumers prefer mid-premium and premium segment biscuits with rising income and accessibility to such products. Biscuits brands encashing the trend by introducing premium ranges. Parle launched premium product division called Platina in 2017 comprising of Hide & Seek, Milano and Nutricrunch. ITC and Britannia are already having dominant market share in the premium category. Britannia with its Pure Magic range has been dominating the market.
25,000
40,000
62,000
FY 2015 FY 2020 FY 2025P
CAGR 9%
CAGR 10%
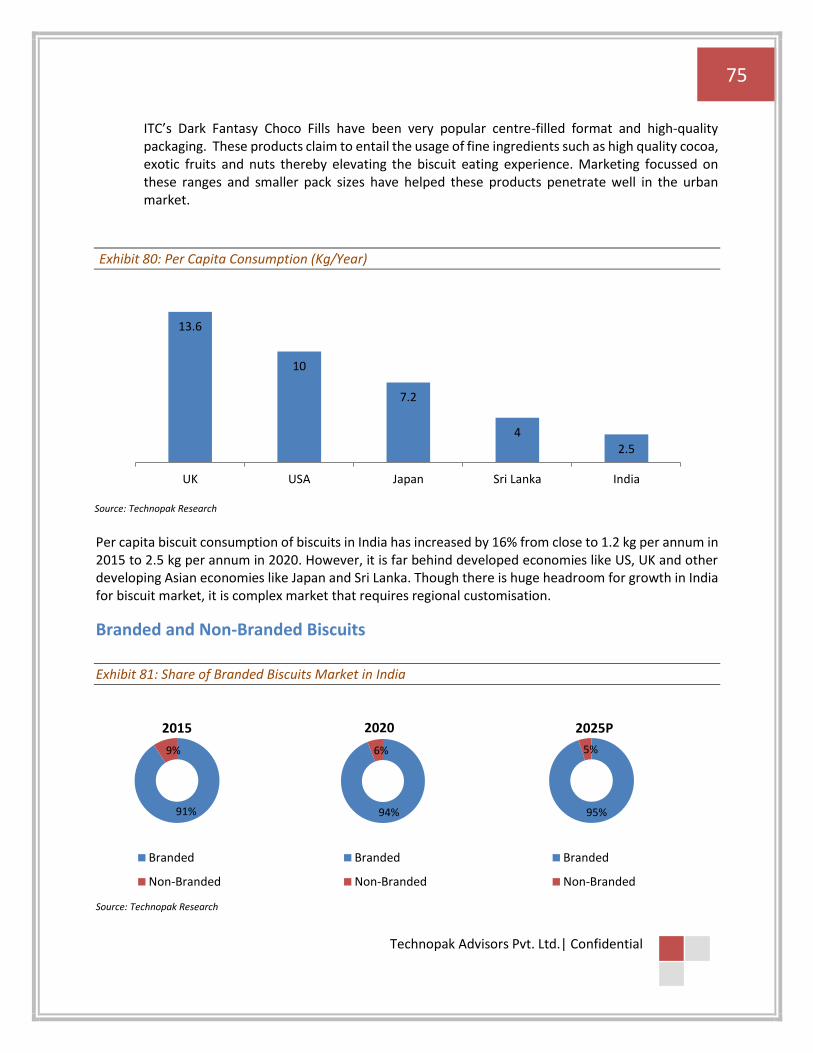
75
Technopak Advisors Pvt. Ltd.| Confidential
ITC’s Dark Fantasy Choco Fills have been very popular centre-filled format and high-quality packaging. These products claim to entail the usage of fine ingredients such as high quality cocoa, exotic fruits and nuts thereby elevating the biscuit eating experience. Marketing focussed on these ranges and smaller pack sizes have helped these products penetrate well in the urban market.
Exhibit 80: Per Capita Consumption (Kg/Year)
Source: Technopak Research
Per capita biscuit consumption of biscuits in India has increased by 16% from close to 1.2 kg per annum in 2015 to 2.5 kg per annum in 2020. However, it is far behind developed economies like US, UK and other developing Asian economies like Japan and Sri Lanka. Though there is huge headroom for growth in India for biscuit market, it is complex market that requires regional customisation.
Branded and Non-Branded Biscuits Exhibit 81: Share of Branded Biscuits Market in India
Source: Technopak Research
13.6
10
7.2
4
2.5
UK USA Japan Sri Lanka India
91%
9%
2015
Branded
Non-Branded
94%
6%
2020
Branded
Non-Branded
95%
5%
2025P
Branded
Non-Branded
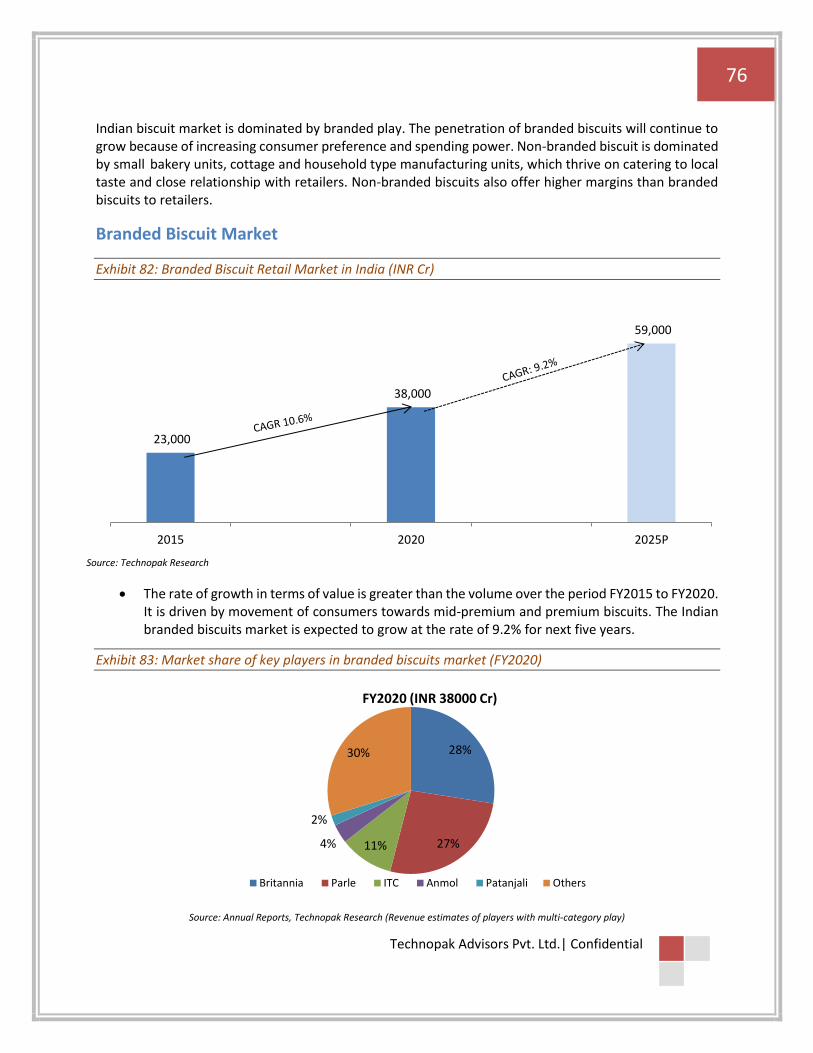
76
Technopak Advisors Pvt. Ltd.| Confidential
Indian biscuit market is dominated by branded play. The penetration of branded biscuits will continue to grow because of increasing consumer preference and spending power. Non-branded biscuit is dominated by small bakery units, cottage and household type manufacturing units, which thrive on catering to local taste and close relationship with retailers. Non-branded biscuits also offer higher margins than branded biscuits to retailers.
Branded Biscuit Market
Exhibit 82: Branded Biscuit Retail Market in India (INR Cr)
Source: Technopak Research
• The rate of growth in terms of value is greater than the volume over the period FY2015 to FY2020. It is driven by movement of consumers towards mid-premium and premium biscuits. The Indian branded biscuits market is expected to grow at the rate of 9.2% for next five years.
Exhibit 83: Market share of key players in branded biscuits market (FY2020)
Source: Annual Reports, Technopak Research (Revenue estimates of players with multi-category play)
23,000
38,000
59,000
2015 2020 2025P
28%
27%11%4%
2%
30%
FY2020 (INR 38000 Cr)
Britannia Parle ITC Anmol Patanjali Others
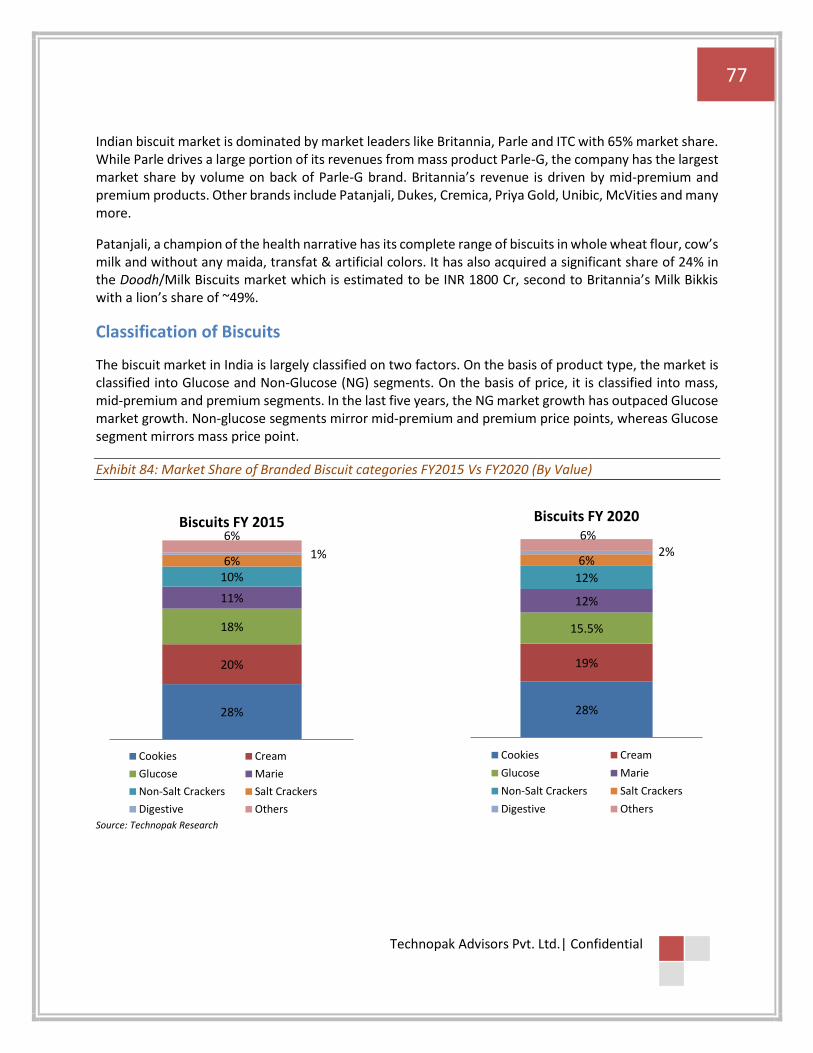
77
Technopak Advisors Pvt. Ltd.| Confidential
Indian biscuit market is dominated by market leaders like Britannia, Parle and ITC with 65% market share. While Parle drives a large portion of its revenues from mass product Parle-G, the company has the largest market share by volume on back of Parle-G brand. Britannia’s revenue is driven by mid-premium and premium products. Other brands include Patanjali, Dukes, Cremica, Priya Gold, Unibic, McVities and many more.
Patanjali, a champion of the health narrative has its complete range of biscuits in whole wheat flour, cow’s milk and without any maida, transfat & artificial colors. It has also acquired a significant share of 24% in the Doodh/Milk Biscuits market which is estimated to be INR 1800 Cr, second to Britannia’s Milk Bikkis with a lion’s share of ~49%.
Classification of Biscuits
The biscuit market in India is largely classified on two factors. On the basis of product type, the market is classified into Glucose and Non-Glucose (NG) segments. On the basis of price, it is classified into mass, mid-premium and premium segments. In the last five years, the NG market growth has outpaced Glucose market growth. Non-glucose segments mirror mid-premium and premium price points, whereas Glucose segment mirrors mass price point.
Exhibit 84: Market Share of Branded Biscuit categories FY2015 Vs FY2020 (By Value)
Source: Technopak Research
28%
20%
18%
11%
10%6%
1%
6%Biscuits FY 2015
Cookies Cream
Glucose Marie
Non-Salt Crackers Salt Crackers
Digestive Others
28%
19%
15.5%
12%
12%
6%2%
6%
Biscuits FY 2020
Cookies Cream
Glucose Marie
Non-Salt Crackers Salt Crackers
Digestive Others
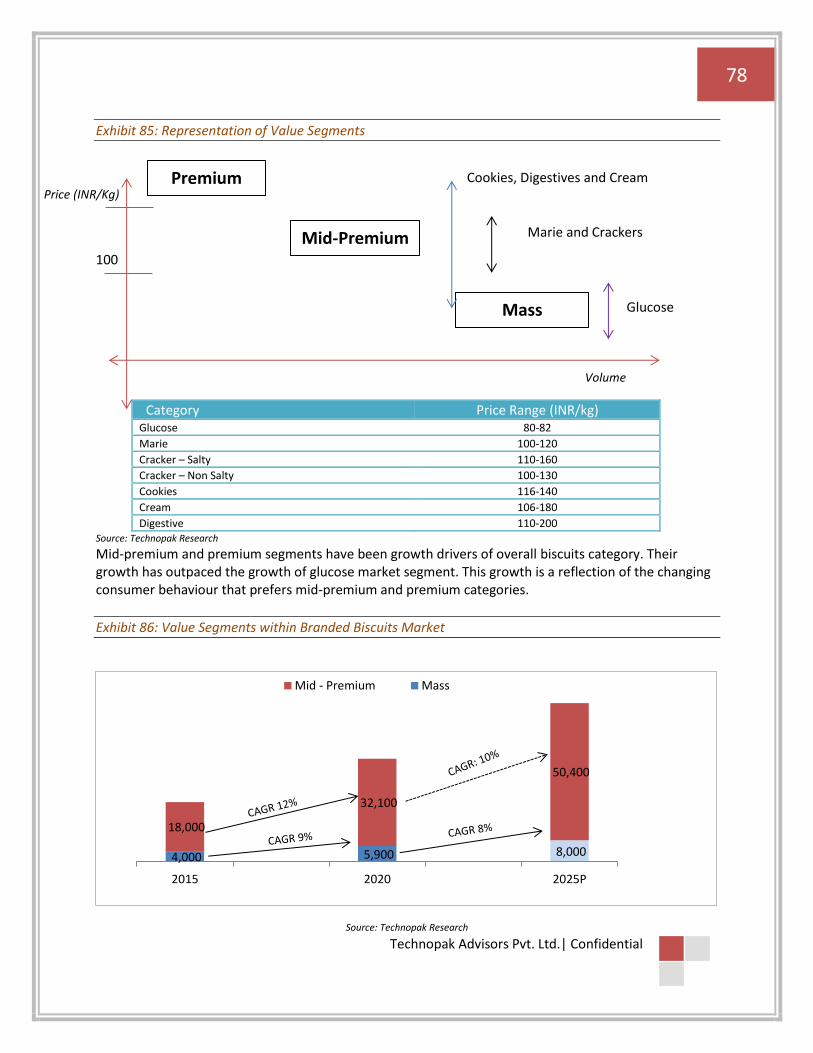
78
Technopak Advisors Pvt. Ltd.| Confidential
Exhibit 85: Representation of Value Segments
200
100
Category Price Range (INR/kg) Glucose 80-82 Marie 100-120
Cracker – Salty 110-160
Cracker – Non Salty 100-130 Cookies 116-140 Cream 106-180 Digestive 110-200
Source: Technopak Research
Mid-premium and premium segments have been growth drivers of overall biscuits category. Their growth has outpaced the growth of glucose market segment. This growth is a reflection of the changing consumer behaviour that prefers mid-premium and premium categories.
Exhibit 86: Value Segments within Branded Biscuits Market
Source: Technopak Research
4,000 5,900 8,000
18,000
32,100
50,400
2015 2020 2025P
Mid - Premium Mass
Price (INR/Kg)
Volume
Mass
Mid-Premium
Premium Cookies, Digestives and Cream
Marie and Crackers
Glucose
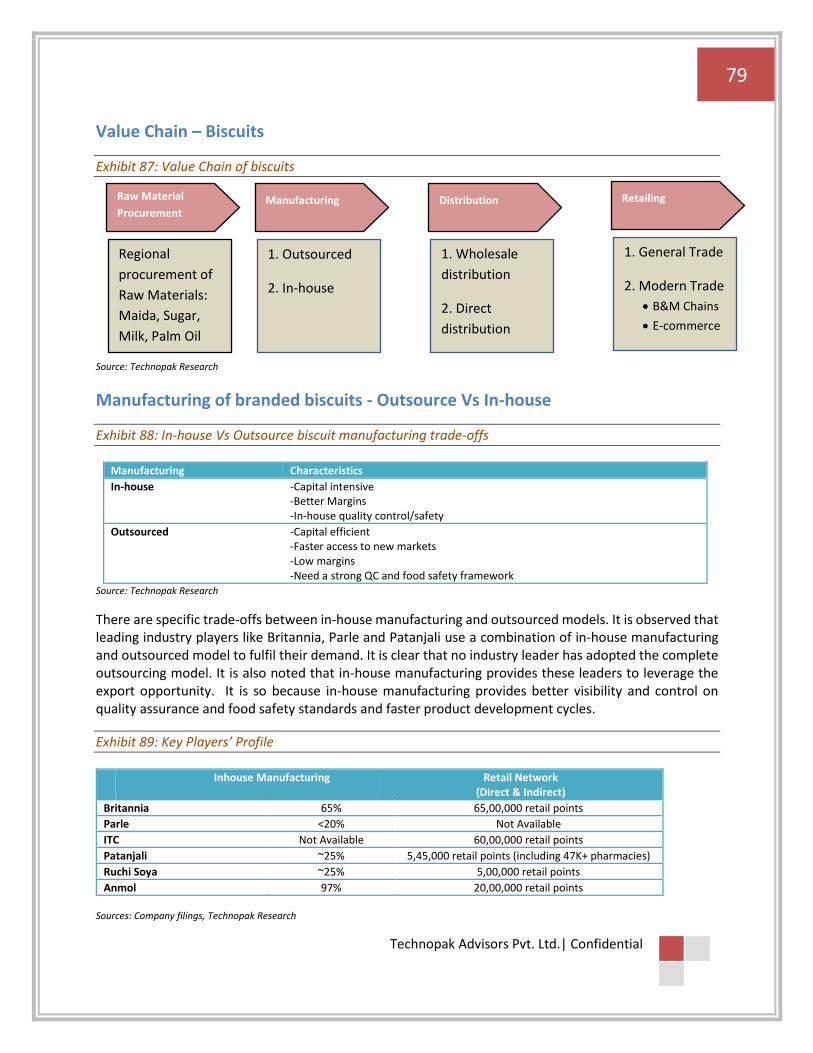
79
Technopak Advisors Pvt. Ltd.| Confidential
Value Chain – Biscuits
Exhibit 87: Value Chain of biscuits
Source: Technopak Research
Manufacturing of branded biscuits - Outsource Vs In-house
Exhibit 88: In-house Vs Outsource biscuit manufacturing trade-offs
Manufacturing Characteristics
In-house -Capital intensive -Better Margins -In-house quality control/safety
Outsourced -Capital efficient -Faster access to new markets -Low margins -Need a strong QC and food safety framework
Source: Technopak Research
There are specific trade-offs between in-house manufacturing and outsourced models. It is observed that leading industry players like Britannia, Parle and Patanjali use a combination of in-house manufacturing and outsourced model to fulfil their demand. It is clear that no industry leader has adopted the complete outsourcing model. It is also noted that in-house manufacturing provides these leaders to leverage the export opportunity. It is so because in-house manufacturing provides better visibility and control on quality assurance and food safety standards and faster product development cycles.
Exhibit 89: Key Players’ Profile
Inhouse Manufacturing Retail Network (Direct & Indirect)
Britannia 65% 65,00,000 retail points
Parle <20% Not Available
ITC Not Available 60,00,000 retail points
Patanjali ~25% 5,45,000 retail points (including 47K+ pharmacies)
Ruchi Soya ~25% 5,00,000 retail points
Anmol 97% 20,00,000 retail points Sources: Company filings, Technopak Research
Regional
procurement of
Raw Materials:
Maida, Sugar,
Milk, Palm Oil
Raw Material
Procurement
1. Outsourced
2. In-house
Manufacturing
1. Wholesale
distribution
2. Direct
distribution
Distribution
1. General Trade
2. Modern Trade
• B&M Chains
• E-commerce
Retailing

80
Technopak Advisors Pvt. Ltd.| Confidential
Distribution Channels of Branded Biscuits
Biscuits have shelf life of approximately 6 months. Like any other FMCG products, availability of products at retail points is pertinent to sales off-take. The reduction of distribution cost and consequently inventory cost has been the area of focus for biscuit brands. They have expanded their retail footprint through distributors, direct reach and modern retail outlets.
Distributors/Wholesalers: Brands send their products from distribution centre to their exclusive wholesale dealers, who further sell their products to wholesalers and retailers. Wholesalers and distributors offer local knowledge, logistic and credit collection support for brands. They take products to geographies where brands cannot reach directly in a commercially viable manner. Distributors/wholesales get a margin between 2% and 5% depending on brand, category and their location.
Direct Reach: Brands are trying to cut time between distribution centre and retail outlet. They own the entire supply chain. Their workforce visits retail stores, analyses local demands, suggests tweaks in product placements and takes orders on their mobile phones through an app. These orders are directly delivered by the brand. Such distribution models are viable and effective in urban regions. Britannia (Zero-day inventory model) and ITC are implementing direct distribution models. Patanjali too has stores for direct selling of its packaged foods. The direct reach has doubled for Britannia in a period of 5 years from 1 million retailers in 2015 to 2 million retailers in 2020. They are viable for urban regions, which are accessible and their demand volume is higher.
General Trade (GT) Vs Modern Trade (MT) Approach
Exhibit 90: Share of Retail Channels for Branded Biscuit Sales (FY2020)
Source: Technopak Research
• The percentage share of MT sales in value terms is higher a than percentage share of MT sales in volume terms. It implies that the share of sales of mid-premium and premium biscuits from MT is higher.
83%
17%
General Trade Modern Trade
81
Technopak Advisors Pvt. Ltd.| Confidential
• General Trade: Biscuits are largely retailed through traditional retail stores. Biscuit brands reach GT through distributors and wholesalers. Generally, company salesman takes order from retailer and it is fulfilled by distributor salesman. Brands offer higher margin or rental for shelf space for visibility. Retailers get between 10% to 20% margin depending on brand and category. New brands offers higher retailer margin up to 20% to push sales.
• Modern Trade: Modern retail charges the brands for display/shelf rent. They offer volume based discounts like 3+1, 4+1 or high discount for large packs to consumers. The sales of biscuits per unit space are higher in modern trade due to discounts and visibility. E-commerce is also emerging an important channel of modern retail in urban centres. While e-grocers such as Bigbasket and Grofers are limited to top 24 cities, they are ready to expand their reach. Another large channel for trade is the Canteen Stores Department which is a solely owned Government of India Enterprise under Ministry of Defence and has its depot in all major military bases operated by the Indian Armed Forces.
Key Trends
• Healthy Biscuits: Concern for health and wellness is becoming a key consideration for snacking. Heathy biscuits with high fibre digestive ingredients and sugar substitutes such as honey, fruits and dark chocolate are a rapidly growing category. Britannia’s Nutri Choice has a range health focussed variants and ITC offers Sunfeast Farm Light.
• Share of Requirement (SoR): Brands offer discounts or offers on larger packs to increase consumption throughput per customers. Such packs enable customers to have multiple offering of same brands at reduced rate. Consequently, it reduces customer risk and helps brands to prime customers for their next purchase.
• Increased in-house consumption of packaged food due to COVID-19: Occasions to eat out have reduced due to restriction imposed during the lockdown period along with health and economic concerns. The preference has therefore shifted towards hygienically packaged food products like biscuits and other snacks over eating out.
Key Success Factors
Distribution: Sales of biscuits primarily depends on distribution reach of biscuit brands. Market
leaders have maximum number of distributors across general trade and modern trade channels.
New brands build their distribution strategy by offering higher incentives to distributors and
retailers than established brands. ITC and Britannia are also experimenting with direct distribution
models for urban areas. While Parle is very well penetrated in the rural areas, Britannia is also
chasing that demand by ramping up the number of dealers in those areas. The number of rural
preferred dealers for Britannia has gone up from 7000 in 2015 to ~20000 in 2020. Through a
master distribution network agreement, Ruchi Soya would also be leveraging the strong
distribution network of Patanjali Ayurveda Limited grow its biscuit and other packaged foods
business.
• Economies of Scale: Higher volumes provides high bargaining power to biscuits brands with their manufactures, logistics providers, raw material suppliers, distributors and retailers. Market

82
Technopak Advisors Pvt. Ltd.| Confidential
leaders Britannia, Parle and ITC leverage their scale to offer their products efficiently to their customers.
• In-house manufacturing: It offers higher margins and better process controls. However, this becomes viable only when the brands have sufficient traction in the area close to manufacturing plant. Britannia and ITC have been increasing their share of in-house manufacturing to improve margins.
• Innovation: Brands regularly introduce new variants in their existing line of products for their customers. They collaborate with international player and uses imported machinery to offers new products. Britannia had collaborated with Aasted, a chocolate, bakery and confectionery company in Denmark and used Jensen 1000, a super compact chocolate moulding line, to make premium biscuit Pure Magic Deuce.
83
Technopak Advisors Pvt. Ltd.| Confidential
6.4 Overview of Breakfast Cereals Market in India
The need of having breakfast has been emphasized time and again for a person to be able to take on a
busy day. While traditional breakfast constituted of products of grains and rice that needed to be cooked,
technological advances in the field of breakfast cereal have led to the development of a variety of ready-
to-eat products or ready-to-cook products. Kellogg’s was the first company to have launched the product
category in India in 1994.
The size of the breakfast cereals market in India is estimated to be at INR 2200 Cr in FY 2020 and is
expected to grow at a high CAGR of 15% to reach a market size of ~INR 4420 Cr by FY 2025, doubling itself
in the coming 5 years. Breakfast cereals include all varieties of flakes, oats, muesli and granolas that are
largely consumed with milk for breakfast. A steady growth in the number of households adopting new
breakfast categories is witnessed which has increased the penetration of packaged cereals in the country.
which currently is lesser than 5%. Children and the youth have been adapting to the new morning regime
of breakfast cereals. Players have a range of products appealing separately to kids, adults and the health
conscious.
The market is divided into two categories of hot cereals and ready-to-eat (RTE) cereals. Hot cereals include
products like oats, oat bran, wheat bran and porridge whereas ready-to-eat cold cereals include
cornflakes, wheat flakes, choco flakes, muesli. Cornflakes, as a product type, dominate the market with
highest market share whereas other cereals like oats and muesli add up for the rest. Since Indian
consumers prefer hot breakfasts, the hot cereal category is growing at a much faster pace than ready to
eat cereals. Among hot cereals, oats have gained high acceptance and popularity consumers’ awareness
of the grain’s health benefits.
The overall hot cereal market is categorized into three sub-parts that is plain oats, flavored or masala oats
and others such as porridge/daliya, oat bran, and wheat bran. Flavored oat segment was created by
Marico in 2010, with its Saffola masala oats which not only has been successful but also became the
category propeller.
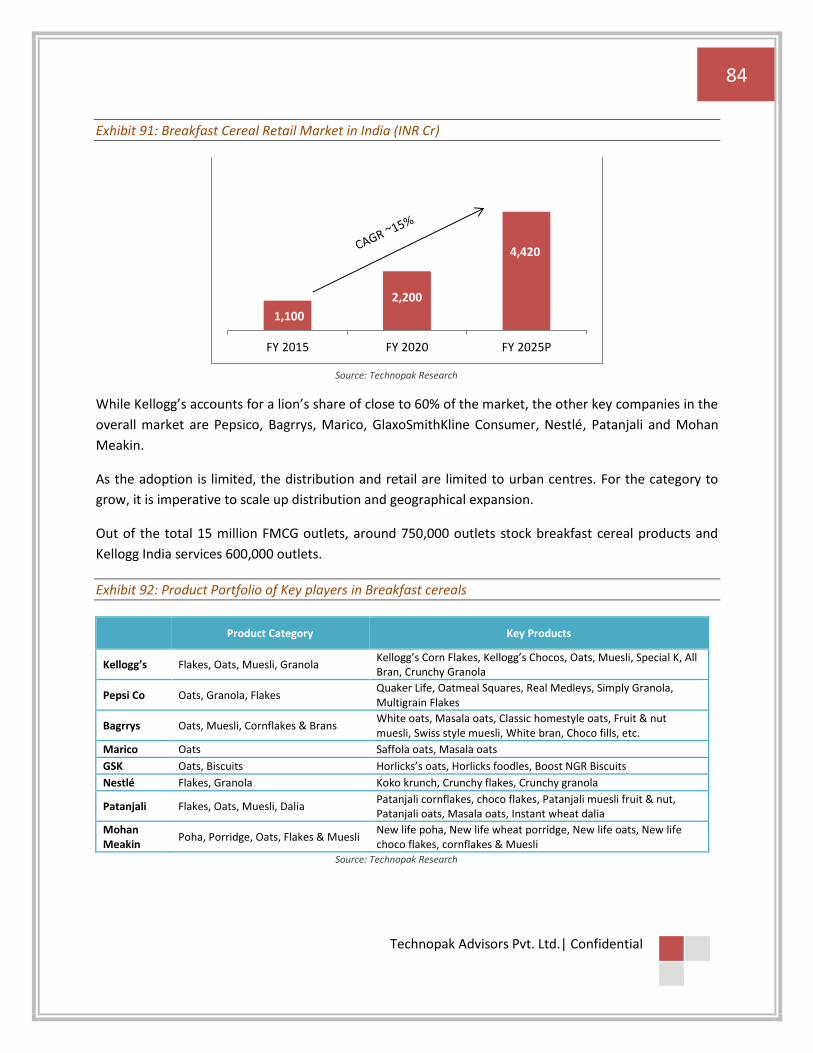
84
Technopak Advisors Pvt. Ltd.| Confidential
Exhibit 91: Breakfast Cereal Retail Market in India (INR Cr)
Source: Technopak Research
While Kellogg’s accounts for a lion’s share of close to 60% of the market, the other key companies in the
overall market are Pepsico, Bagrrys, Marico, GlaxoSmithKline Consumer, Nestlé, Patanjali and Mohan
Meakin.
As the adoption is limited, the distribution and retail are limited to urban centres. For the category to
grow, it is imperative to scale up distribution and geographical expansion.
Out of the total 15 million FMCG outlets, around 750,000 outlets stock breakfast cereal products and
Kellogg India services 600,000 outlets.
Exhibit 92: Product Portfolio of Key players in Breakfast cereals
Product Category Key Products
Kellogg’s Flakes, Oats, Muesli, Granola Kellogg’s Corn Flakes, Kellogg’s Chocos, Oats, Muesli, Special K, All Bran, Crunchy Granola
Pepsi Co Oats, Granola, Flakes Quaker Life, Oatmeal Squares, Real Medleys, Simply Granola, Multigrain Flakes
Bagrrys Oats, Muesli, Cornflakes & Brans White oats, Masala oats, Classic homestyle oats, Fruit & nut muesli, Swiss style muesli, White bran, Choco fills, etc.
Marico Oats Saffola oats, Masala oats
GSK Oats, Biscuits Horlicks’s oats, Horlicks foodles, Boost NGR Biscuits
Nestlé Flakes, Granola Koko krunch, Crunchy flakes, Crunchy granola
Patanjali Flakes, Oats, Muesli, Dalia Patanjali cornflakes, choco flakes, Patanjali muesli fruit & nut, Patanjali oats, Masala oats, Instant wheat dalia
Mohan Meakin
Poha, Porridge, Oats, Flakes & Muesli New life poha, New life wheat porridge, New life oats, New life choco flakes, cornflakes & Muesli
Source: Technopak Research
1,100
2,200
4,420
FY 2015 FY 2020 FY 2025P
85
Technopak Advisors Pvt. Ltd.| Confidential
Key Growth Drivers
• Demographic change: With growing urbanization, nuclearization, women joining the workforce
and rising household incomes, there is a steady growth in the number of households adopting
new breakfast categories due to convenience and time paucity factors. The primary consumers
for breakfast cereals continue to be urban consumers as they prefer a fast arrangement for
breakfast due to their hectic lifestyles.
• Growing health awareness and suitably propositioned product: Breakfast cereals have been
positioned on the platform of health and nutrition. Consumption of breakfast cereals has been
advocated as healthy in contrast to traditional Indian breakfasts such as parathas, fritters, idlis,
dosas which are said to be high on carbohydrates and fats. The widespread communications on
health, especially on the rising incidence of cardiovascular diseases, diabetes and obesity in
Indians have compelled the consumer to reset their breakfast habits.
• Single serve packs at low price points appealing to new customer segments: The single-serve
packs priced at INR 10 in tier I and tier II towns have helped recruit new consumers into the
nutritious ready-to-eat breakfast cereals market.
• Growth beyond Tier I & II cities: In addition to its primary focus on tier I and tier II towns, manufacturers are now expanding their footprint to tier III cities as well. With growing incomes, the spend on packaged food products is steadily increasing. The trend is accelerating because of both socio-economic factors and lifestyle reasons.
• Growth of Modern Retail: Modern retail formats are contributing to the growth by providing a good retail experience for products, especially in the premium segment.
Retail Channels
Since the demand of breakfast cereals is limited to tier I and II cities, modern retail including e-commerce contributes a higher share of sales of as compared to that in case of categories such as biscuits, instant noodles, ketchups which are widely distributed across all city types. As the category would move ahead in the curve of adoption from the metro cities to Tier I, II and III cities along with rural areas, the sales from traditional retail will grow. While general trade accounts for 75% of the total market, modern trade channels account for 25%.

86
Technopak Advisors Pvt. Ltd.| Confidential
Exhibit 93: Share of Retail Channels for Breakfast Cereals in India (FY2020)
Source: Technopak Research
Key Challenges
• Restricted Consumption of Category: The key challenge is to broaden the consumption of the category as a whole given the reservation to move away from their quintessential hot, home cooked meals. This innate inclination towards traditional breakfast meals for health and price challenges has kept the category growth in check. While the kids, youth and nuclear families have adapted to new breakfast habits, traditional joint families have not been able to alter the traditions.
Key Success Factors
• Product innovation has a significant role for this category. Saffola created a new segment of masala oats within this category keeping the Indian sensibility as a central consideration.
• Appropriate pricing can encourage trials and aid the enrolment of new customer groups given the price sensitivity in the India market.
• Consistent emphasis on health benefits and integration of the proposition with product development and communication has yielded superior results.
75%
25%
General Trade Modern Trade
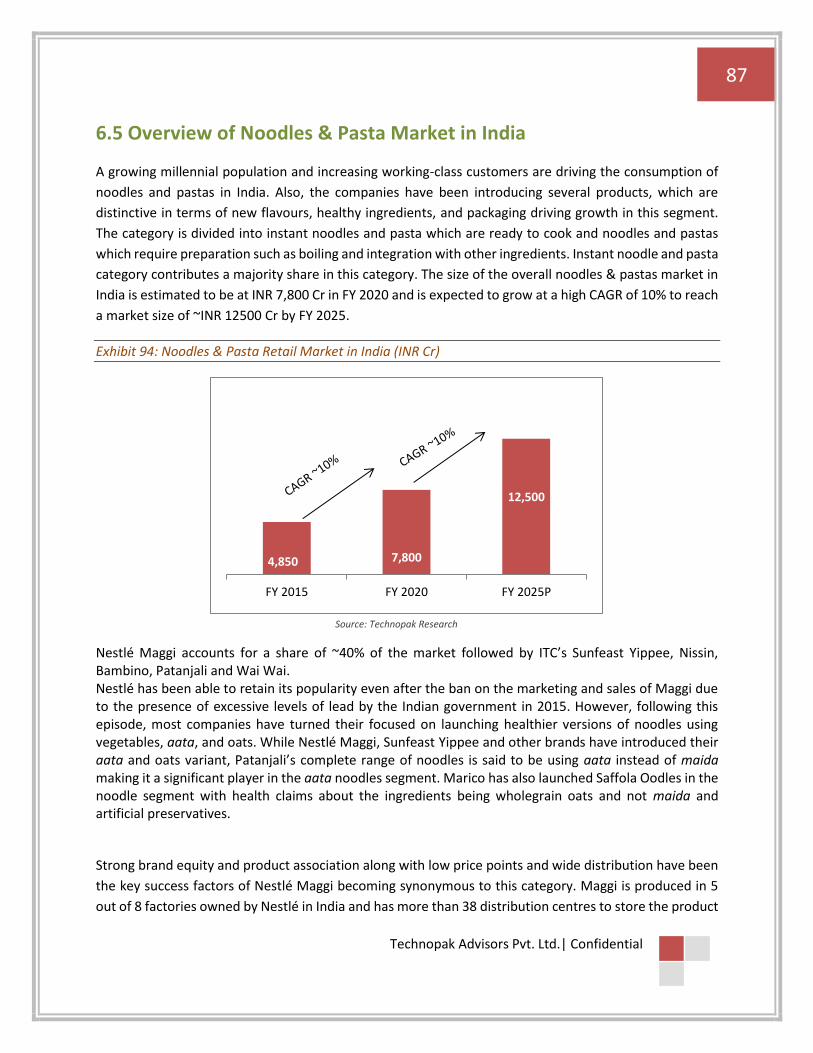
87
Technopak Advisors Pvt. Ltd.| Confidential
6.5 Overview of Noodles & Pasta Market in India
A growing millennial population and increasing working-class customers are driving the consumption of
noodles and pastas in India. Also, the companies have been introducing several products, which are
distinctive in terms of new flavours, healthy ingredients, and packaging driving growth in this segment.
The category is divided into instant noodles and pasta which are ready to cook and noodles and pastas
which require preparation such as boiling and integration with other ingredients. Instant noodle and pasta
category contributes a majority share in this category. The size of the overall noodles & pastas market in
India is estimated to be at INR 7,800 Cr in FY 2020 and is expected to grow at a high CAGR of 10% to reach
a market size of ~INR 12500 Cr by FY 2025.
Exhibit 94: Noodles & Pasta Retail Market in India (INR Cr)
Source: Technopak Research
Nestlé Maggi accounts for a share of ~40% of the market followed by ITC’s Sunfeast Yippee, Nissin, Bambino, Patanjali and Wai Wai. Nestlé has been able to retain its popularity even after the ban on the marketing and sales of Maggi due to the presence of excessive levels of lead by the Indian government in 2015. However, following this episode, most companies have turned their focused on launching healthier versions of noodles using vegetables, aata, and oats. While Nestlé Maggi, Sunfeast Yippee and other brands have introduced their aata and oats variant, Patanjali’s complete range of noodles is said to be using aata instead of maida making it a significant player in the aata noodles segment. Marico has also launched Saffola Oodles in the noodle segment with health claims about the ingredients being wholegrain oats and not maida and artificial preservatives.
Strong brand equity and product association along with low price points and wide distribution have been
the key success factors of Nestlé Maggi becoming synonymous to this category. Maggi is produced in 5
out of 8 factories owned by Nestlé in India and has more than 38 distribution centres to store the product
4,850 7,800
12,500
FY 2015 FY 2020 FY 2025P
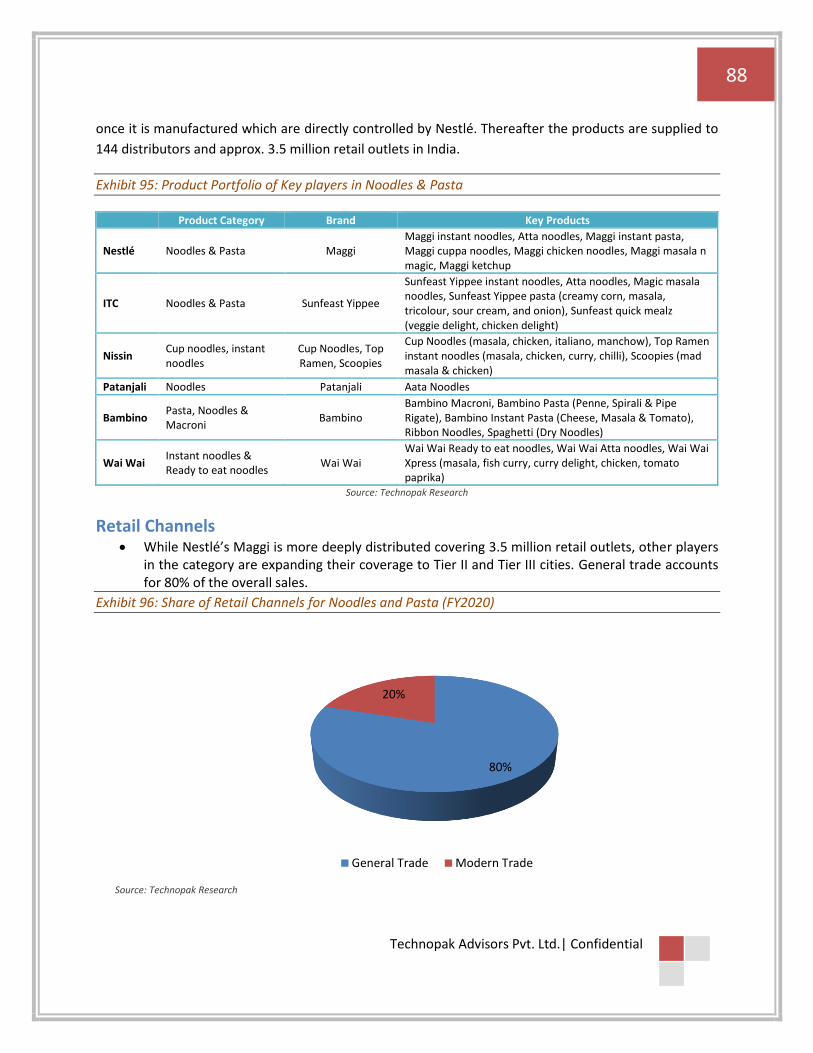
88
Technopak Advisors Pvt. Ltd.| Confidential
once it is manufactured which are directly controlled by Nestlé. Thereafter the products are supplied to
144 distributors and approx. 3.5 million retail outlets in India.
Exhibit 95: Product Portfolio of Key players in Noodles & Pasta
Product Category Brand Key Products
Nestlé Noodles & Pasta Maggi Maggi instant noodles, Atta noodles, Maggi instant pasta, Maggi cuppa noodles, Maggi chicken noodles, Maggi masala n magic, Maggi ketchup
ITC Noodles & Pasta Sunfeast Yippee
Sunfeast Yippee instant noodles, Atta noodles, Magic masala noodles, Sunfeast Yippee pasta (creamy corn, masala, tricolour, sour cream, and onion), Sunfeast quick mealz (veggie delight, chicken delight)
Nissin Cup noodles, instant noodles
Cup Noodles, Top Ramen, Scoopies
Cup Noodles (masala, chicken, italiano, manchow), Top Ramen instant noodles (masala, chicken, curry, chilli), Scoopies (mad masala & chicken)
Patanjali Noodles Patanjali Aata Noodles
Bambino Pasta, Noodles & Macroni
Bambino Bambino Macroni, Bambino Pasta (Penne, Spirali & Pipe Rigate), Bambino Instant Pasta (Cheese, Masala & Tomato), Ribbon Noodles, Spaghetti (Dry Noodles)
Wai Wai Instant noodles & Ready to eat noodles
Wai Wai Wai Wai Ready to eat noodles, Wai Wai Atta noodles, Wai Wai Xpress (masala, fish curry, curry delight, chicken, tomato paprika)
Source: Technopak Research
Retail Channels • While Nestlé’s Maggi is more deeply distributed covering 3.5 million retail outlets, other players
in the category are expanding their coverage to Tier II and Tier III cities. General trade accounts for 80% of the overall sales.
Exhibit 96: Share of Retail Channels for Noodles and Pasta (FY2020)
Source: Technopak Research
80%
20%
General Trade Modern Trade
89
Technopak Advisors Pvt. Ltd.| Confidential
Key Growth Drivers
• Overall growth of ready to eat and ready to cook products: Few factors which are responsible
for the growth in noodle & pasta industry is rapid rise in urbanisation, changing lifestyles of the
consumers and increase in the demand of ready to eat products.
• Introduction of Product variants especially healthier options: As consumers are becoming health
conscious, companies are exploring new and innovative healthy variants of instant noodles, such
as gluten-free, air-fried, sun-dried, etc, to gain market share. Product introduction like atta and
oats variants have spun off as emerging segments with a faster growth rate as compared to the
overall category.
Key Challenges & Success Factors
• Consideration of Price Sensitivity: A large part of the population comes from the middle or lower-
middle class. Therefore, price sensitivity plays a significant role in hindering the growth of the
instant noodles industry across the country.
• Robust Distribution: Consumers are unaware of the various brands unless they are available on
the retail shelves. Hence, a well-established distribution network acts as a key imperative.

90
Technopak Advisors Pvt. Ltd.| Confidential
6.6 Overview of Jams & Marmalades Market in India
The size of the jams & marmalades market in India is estimated to be at INR 1,000 Cr in FY 2020 and is
expected to grow at a high CAGR of 7% to reach a market size of ~INR 1400 Cr by FY 2025. The industry is
expected to grow with the wider adoption of ready to use products, change in lifestyle and food
preferences and premiumization within the category. With the growing focus on health and natural
products, there is a growing interest in sugar free, preservative free, real fruit jams & spreads.
Exhibit 97: Jams & Marmalades Retail Market in India (INR Cr)
Source: Technopak Research
Hindustan Uniliver’s Kissan dominates the market followed by other players like Mapro, Tops, Cremica,
Mala’s etc. The jams are available in a variety of flavours like strawberry, pineapple, mix Fruit, mango,
orange marmalades amongst others. While the premium segment in the category remains small, it is
growing at a faster pace than the overall category with Indian brands like Bhuira, Fabindia, The Gourmet
Jar and imported brands such as Dana, St. Dalfour and Smucker’s introducing differentiated products.
Leveraging HUL distribution network, Kissan brand is available across 1 million outlets.
Exhibit 98: Key players in Jams & Marmalade
Key Brands
Mrs Bector’s Food Cremica Jams (Mixed fruit, Strawberry, Pineapple) Cremica orange marmalade
Mapro Foods Mapro Jams (Mix fruit & Strawberry)
1,0001,400
FY 2020 FY 2025P
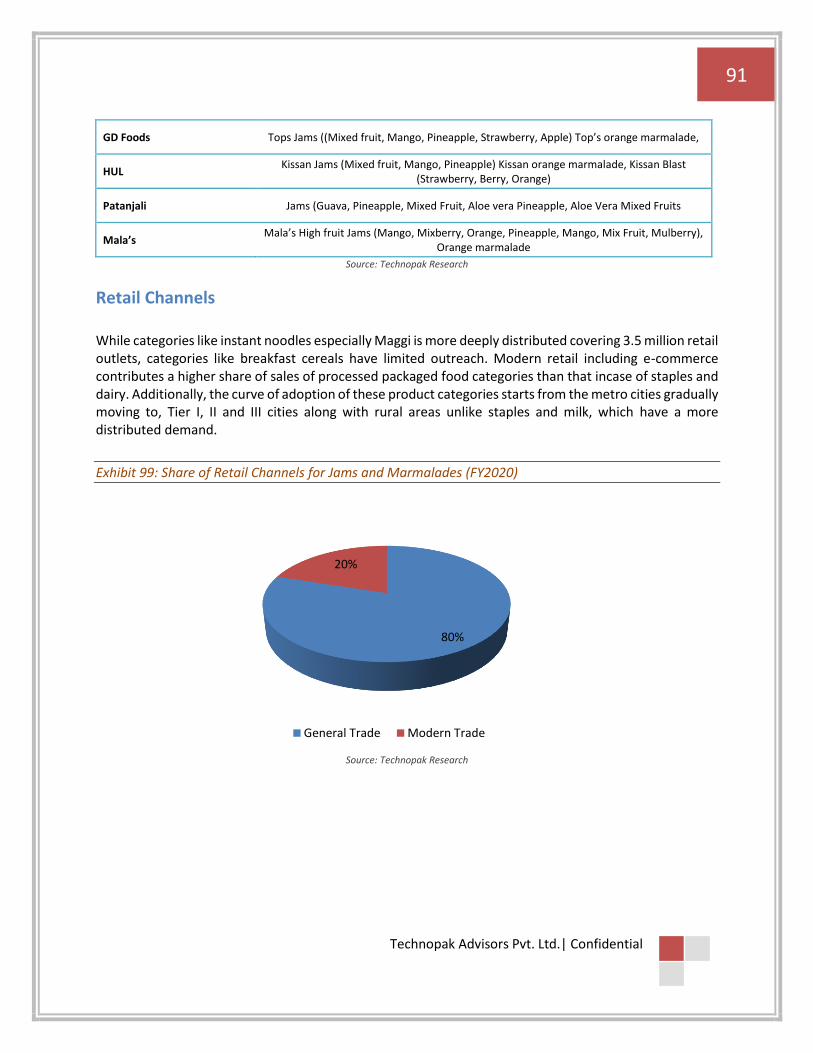
91
Technopak Advisors Pvt. Ltd.| Confidential
GD Foods Tops Jams ((Mixed fruit, Mango, Pineapple, Strawberry, Apple) Top’s orange marmalade,
HUL Kissan Jams (Mixed fruit, Mango, Pineapple) Kissan orange marmalade, Kissan Blast
(Strawberry, Berry, Orange)
Patanjali Jams (Guava, Pineapple, Mixed Fruit, Aloe vera Pineapple, Aloe Vera Mixed Fruits
Mala’s Mala’s High fruit Jams (Mango, Mixberry, Orange, Pineapple, Mango, Mix Fruit, Mulberry),
Orange marmalade
Source: Technopak Research
Retail Channels While categories like instant noodles especially Maggi is more deeply distributed covering 3.5 million retail outlets, categories like breakfast cereals have limited outreach. Modern retail including e-commerce contributes a higher share of sales of processed packaged food categories than that incase of staples and dairy. Additionally, the curve of adoption of these product categories starts from the metro cities gradually moving to, Tier I, II and III cities along with rural areas unlike staples and milk, which have a more distributed demand.
Exhibit 99: Share of Retail Channels for Jams and Marmalades (FY2020)
Source: Technopak Research
80%
20%
General Trade Modern Trade
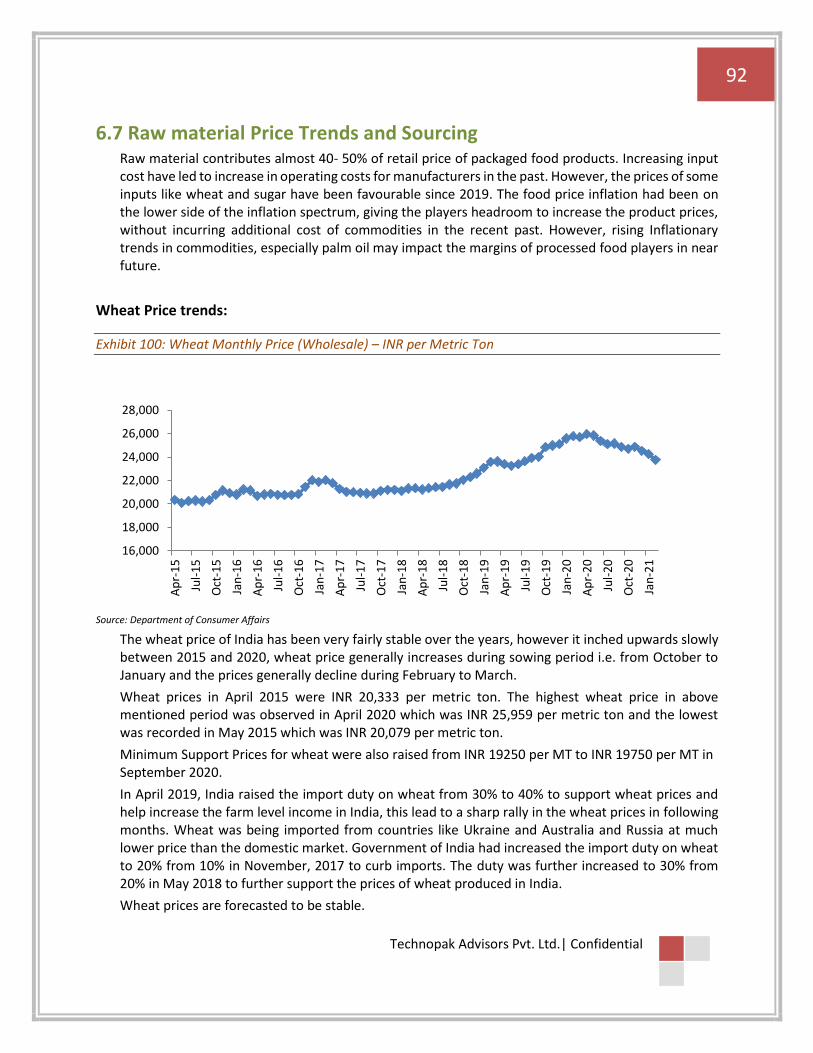
92
Technopak Advisors Pvt. Ltd.| Confidential
6.7 Raw material Price Trends and Sourcing Raw material contributes almost 40- 50% of retail price of packaged food products. Increasing input cost have led to increase in operating costs for manufacturers in the past. However, the prices of some inputs like wheat and sugar have been favourable since 2019. The food price inflation had been on the lower side of the inflation spectrum, giving the players headroom to increase the product prices, without incurring additional cost of commodities in the recent past. However, rising Inflationary trends in commodities, especially palm oil may impact the margins of processed food players in near future.
Wheat Price trends:
Exhibit 100: Wheat Monthly Price (Wholesale) – INR per Metric Ton
Source: Department of Consumer Affairs
The wheat price of India has been very fairly stable over the years, however it inched upwards slowly between 2015 and 2020, wheat price generally increases during sowing period i.e. from October to January and the prices generally decline during February to March.
Wheat prices in April 2015 were INR 20,333 per metric ton. The highest wheat price in above mentioned period was observed in April 2020 which was INR 25,959 per metric ton and the lowest was recorded in May 2015 which was INR 20,079 per metric ton.
Minimum Support Prices for wheat were also raised from INR 19250 per MT to INR 19750 per MT in September 2020.
In April 2019, India raised the import duty on wheat from 30% to 40% to support wheat prices and help increase the farm level income in India, this lead to a sharp rally in the wheat prices in following months. Wheat was being imported from countries like Ukraine and Australia and Russia at much lower price than the domestic market. Government of India had increased the import duty on wheat to 20% from 10% in November, 2017 to curb imports. The duty was further increased to 30% from 20% in May 2018 to further support the prices of wheat produced in India.
Wheat prices are forecasted to be stable.
16,000
18,000
20,000
22,000
24,000
26,000
28,000
Ap
r-1
5
Jul-
15
Oct
-15
Jan
-16
Ap
r-1
6
Jul-
16
Oct
-16
Jan
-17
Ap
r-1
7
Jul-
17
Oct
-17
Jan
-18
Ap
r-1
8
Jul-
18
Oct
-18
Jan
-19
Ap
r-1
9
Jul-
19
Oct
-19
Jan
-20
Ap
r-2
0
Jul-
20
Oct
-20
Jan
-21
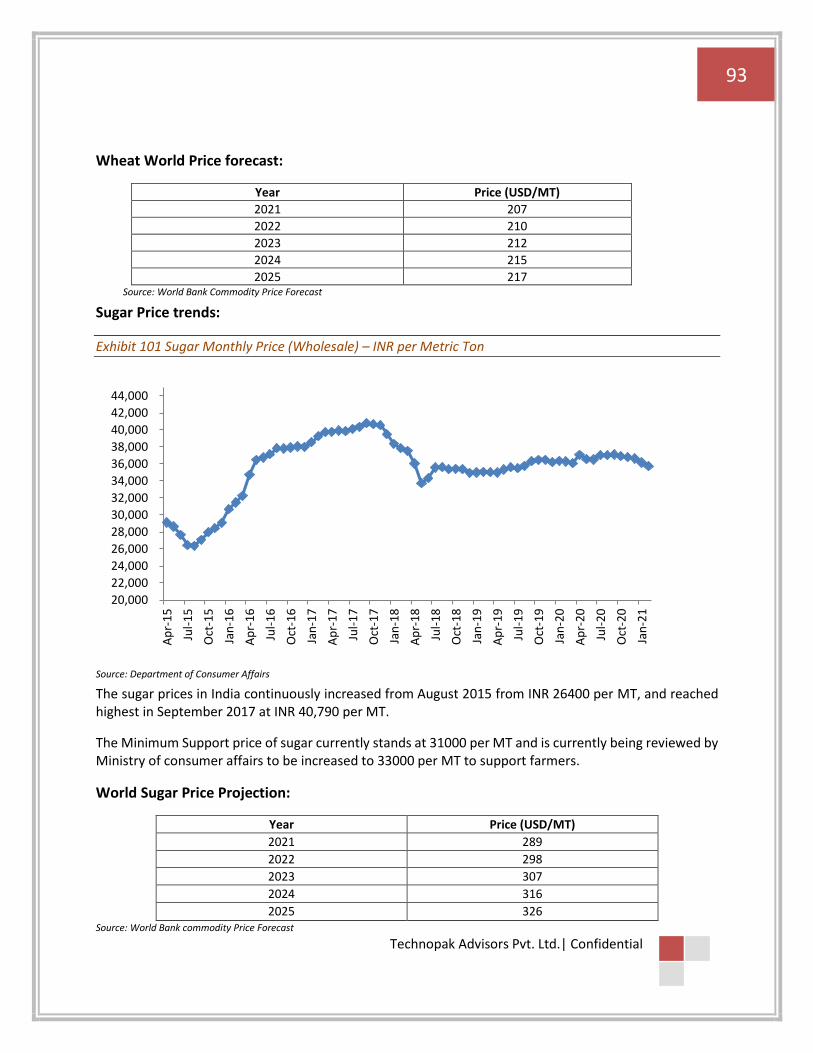
93
Technopak Advisors Pvt. Ltd.| Confidential
Wheat World Price forecast:
Year Price (USD/MT)
2021 207
2022 210
2023 212
2024 215
2025 217 Source: World Bank Commodity Price Forecast
Sugar Price trends:
Exhibit 101 Sugar Monthly Price (Wholesale) – INR per Metric Ton
Source: Department of Consumer Affairs
The sugar prices in India continuously increased from August 2015 from INR 26400 per MT, and reached highest in September 2017 at INR 40,790 per MT.
The Minimum Support price of sugar currently stands at 31000 per MT and is currently being reviewed by Ministry of consumer affairs to be increased to 33000 per MT to support farmers.
World Sugar Price Projection:
Year Price (USD/MT)
2021 289
2022 298
2023 307
2024 316
2025 326 Source: World Bank commodity Price Forecast
20,000
22,000
24,000
26,000
28,000
30,000
32,000
34,000
36,000
38,000
40,000
42,000
44,000
Ap
r-1
5
Jul-
15
Oct
-15
Jan
-16
Ap
r-1
6
Jul-
16
Oct
-16
Jan
-17
Ap
r-1
7
Jul-
17
Oct
-17
Jan
-18
Ap
r-1
8
Jul-
18
Oct
-18
Jan
-19
Ap
r-1
9
Jul-
19
Oct
-19
Jan
-20
Ap
r-2
0
Jul-
20
Oct
-20
Jan
-21

94
Technopak Advisors Pvt. Ltd.| Confidential
Palm Oil Price Trends:
Exhibit 102: Palm Oil Monthly Price (Wholesale) – INR per Metric Ton
Source: Department of Consumer Affairs
Indonesia and Malaysia are the two largest palm oil producers in the world, and India is the biggest edible importer in the world.
India buys more than 9 Mn MT of palm oil a year, accounting for nearly two-thirds of its total edible oil imports. India bought 4.4 Mn MT of Malaysian palm oil in 2019.
In January 2020, India banned imports of refined palm oil, primarily to target Malaysia in a diplomatic rift, which lead to a sharp increase in the edible oil prices in India. India continued to purchase crude palm oil to support Indian refiners. Import bans were removed in May 2020, the edible oil saw sharp increase in price amid disruption in producing countries as a result of Covid-19 induced labour shortage, the Prices are projected to stabilize in future.
World Palm oil Price forecast:
Year Price (USD/MT)
2021 723
2022 736
2023 749
2024 763
2025 777 Source: World Bank commodity Price Forecast
45,000
55,000
65,000
75,000
85,000
95,000
1,05,000
1,15,000
Ap
r-1
5
Jul-
15
Oct
-15
Jan
-16
Ap
r-1
6
Jul-
16
Oct
-16
Jan
-17
Ap
r-1
7
Jul-
17
Oct
-17
Jan
-18
Ap
r-1
8
Jul-
18
Oct
-18
Jan
-19
Ap
r-1
9
Jul-
19
Oct
-19
Jan
-20
Ap
r-2
0
Jul-
20
Oct
-20
Jan
-21
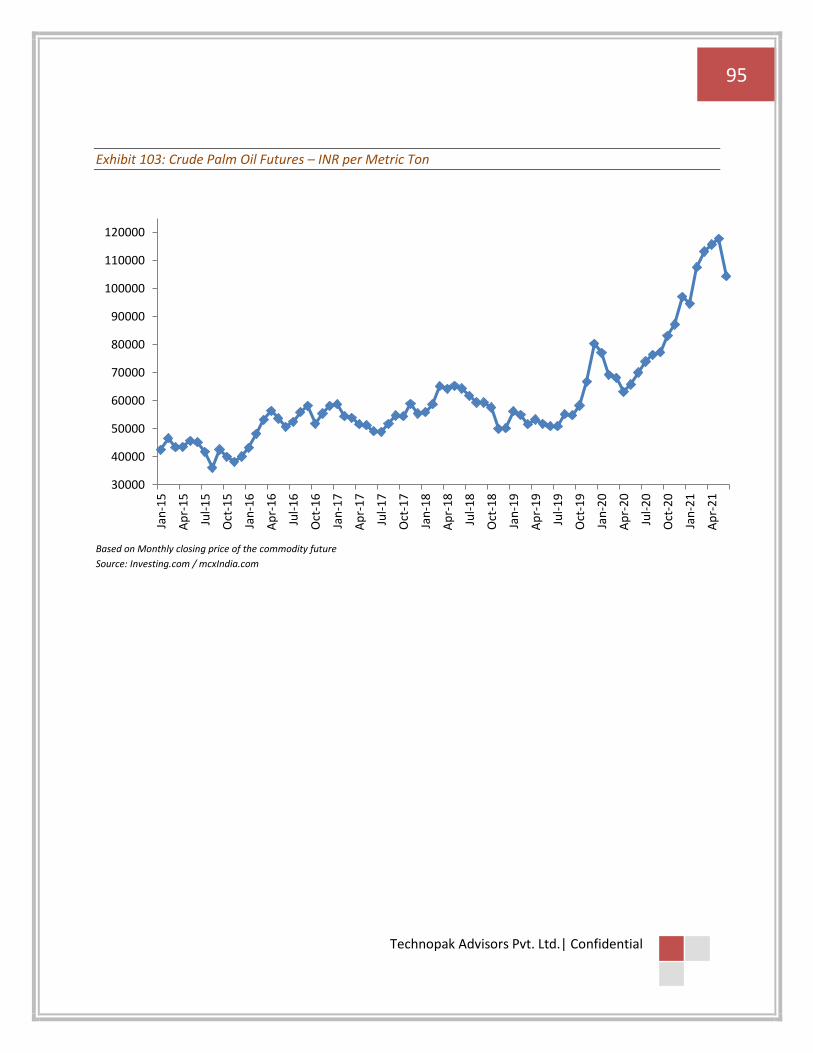
95
Technopak Advisors Pvt. Ltd.| Confidential
Exhibit 103: Crude Palm Oil Futures – INR per Metric Ton
Based on Monthly closing price of the commodity future Source: Investing.com / mcxIndia.com
30000
40000
50000
60000
70000
80000
90000
100000
110000
120000
Jan
-15
Ap
r-1
5
Jul-
15
Oct
-15
Jan
-16
Ap
r-1
6
Jul-
16
Oct
-16
Jan
-17
Ap
r-1
7
Jul-
17
Oct
-17
Jan
-18
Ap
r-1
8
Jul-
18
Oct
-18
Jan
-19
Ap
r-1
9
Jul-
19
Oct
-19
Jan
-20
Ap
r-2
0
Jul-
20
Oct
-20
Jan
-21
Ap
r-2
1
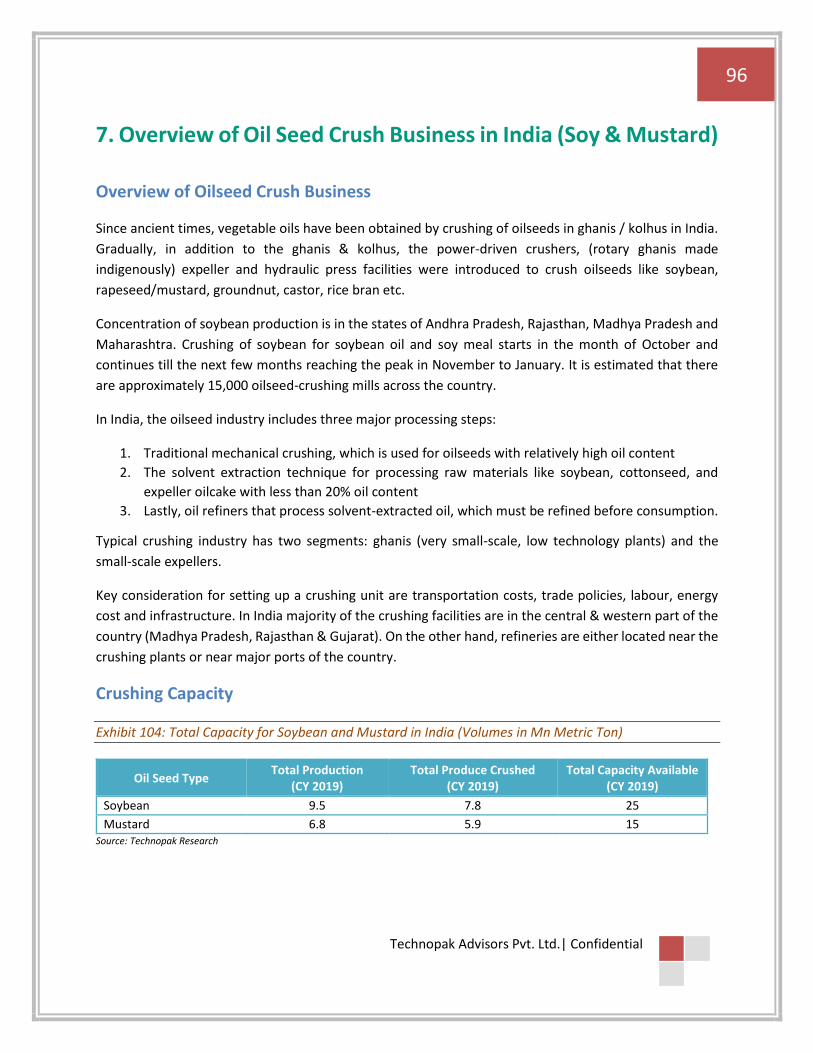
96
Technopak Advisors Pvt. Ltd.| Confidential
7. Overview of Oil Seed Crush Business in India (Soy & Mustard)
Overview of Oilseed Crush Business
Since ancient times, vegetable oils have been obtained by crushing of oilseeds in ghanis / kolhus in India.
Gradually, in addition to the ghanis & kolhus, the power-driven crushers, (rotary ghanis made
indigenously) expeller and hydraulic press facilities were introduced to crush oilseeds like soybean,
rapeseed/mustard, groundnut, castor, rice bran etc.
Concentration of soybean production is in the states of Andhra Pradesh, Rajasthan, Madhya Pradesh and
Maharashtra. Crushing of soybean for soybean oil and soy meal starts in the month of October and
continues till the next few months reaching the peak in November to January. It is estimated that there
are approximately 15,000 oilseed-crushing mills across the country.
In India, the oilseed industry includes three major processing steps:
1. Traditional mechanical crushing, which is used for oilseeds with relatively high oil content
2. The solvent extraction technique for processing raw materials like soybean, cottonseed, and
expeller oilcake with less than 20% oil content
3. Lastly, oil refiners that process solvent-extracted oil, which must be refined before consumption.
Typical crushing industry has two segments: ghanis (very small-scale, low technology plants) and the
small-scale expellers.
Key consideration for setting up a crushing unit are transportation costs, trade policies, labour, energy
cost and infrastructure. In India majority of the crushing facilities are in the central & western part of the
country (Madhya Pradesh, Rajasthan & Gujarat). On the other hand, refineries are either located near the
crushing plants or near major ports of the country.
Crushing Capacity
Exhibit 104: Total Capacity for Soybean and Mustard in India (Volumes in Mn Metric Ton)
Oil Seed Type Total Production
(CY 2019) Total Produce Crushed
(CY 2019) Total Capacity Available
(CY 2019)
Soybean 9.5 7.8 25
Mustard 6.8 5.9 15 Source: Technopak Research

97
Technopak Advisors Pvt. Ltd.| Confidential
Exhibit 105: Oilseed Content
Oil Seed Type Oil Oil Meal
Soybean 18% 82% (Poultry, edible food)
Mustard 40% 60% (Cattle feed) Source: Technopak Research
Competition Landscape
The players in oilseed crushing as a business line can be divided into four groups.
Exhibit 106: Type of Players in Oilseed Crushing
Key Players
Large Domestic Players
Adani Wilmar Ruchi Soya Sonic Biochem Sanwaria Agro Gujarat Ambuja Exports
Regional Players
Small Player with Niche Products
Gokul Refoil Kriti Nutrients Sitashree Products Dewas Soya Betul Oil
Traders
International Commodity Traders
Bunge Cargill Louis Dreyfeus Mitsui ADM
Small Players
Feed Manufacturers
Suguna Hatcheries Venkateshwara Hatcheries Godrej Agrovet Srinivasa Hatcheries
Source: Technopak Research
Ruchi Soya with a crushing capacity of approximately 11,000 MT per day and Adani Wilmar with a
crushing capacity of approximately 8,800 MT per day are the key players. The 2 players contribute
almost 17-18% of the total capacity of 40 Mn MT in India.
Exhibit 107: Oilseed Crushing Capacity of Key Players
Key Players Crushing Capacity (As of FY 2020) Number of Plants
Ruchi Soya 11000 MT per day 10 crushing plants
Adani Wilmar 8800 MT per day 8 crushing plants
Gujarat Ambuja Exports 4500 MT per day 6 crushing plants
Emami Agrotech 500 MT per day 1 crushing plant Source: Technopak Research

98
Technopak Advisors Pvt. Ltd.| Confidential
Growth Drivers
Strong Export Demand of Soybean Meal for the Feed Industry: There is strong demand for non-GM
soybean meal from the international markets. Estimated soybean meal exports in CY2018 was approx. 1.8
Mn MT and had witnessed a growth rate of 30% in the previous 3 years by volume. The soybean
production had dropped to 9.5 Mn MT in CY 2019 from 13.3 Mn MT in CY 2018 which resulted in reduction
of the crushing volumes and thereby soy meal exports. Exports to Iran and the USA contributed almost
50% to the total soybean export in CY 2019. As only 5% of soybean crop in US is non-GM, it makes the
Indian product command a price premium in international markets.
Government’s Focus to Reduce Imports through Domestic Production of Oilseeds: Government has been
taking many measures to increase the domestic production of edible oil seeds with initiatives like National
Mission on Edible Oils aiming to increase the area under cultivation, production, and productivity of the
oilseed crops. Several other initiatives like oil palm area expansion under Rastriya Krishi Vikas Yojana,
increasing the MSP of oilseed crops, concept of buffer stock for oilseeds, cluster demonstration of oilseed
crops, trade restrictions for RBD (Refined, Bleached, Deodorized) palmolein and changes in duty structure
are being implemented by the government to boost the domestic production.
Growth in Domestic Feed Industry: With the growing per capita meat and poultry consumption in India,
it has emerged as one of the largest and fastest growing compound feed markets in the world. The feed
industry is growing at a CAGR of 8%, with poultry, cattle and aqua feed sectors emerging as major growth
drivers.

99
Technopak Advisors Pvt. Ltd.| Confidential
Value Chain
Exhibit 108: Soybean Processing: Representation of Value Chain
Oil Extraction
Cleaning, Cracking, Dehulling, Conditioning, Flaking
Toasting
Grinding/Grading Oil Extraction
Grinding Crude
Soybean oil
Extrusion
Hydrogenation
Source: Technopak Research
Beans
Full Fat Flakes
Defatted Soy Flakes
Soy Flour
Textured Soy Protein
Soy Meal/Soy De-oil cakes
Dom Bagging Refined Soy Oil
Vanaspati
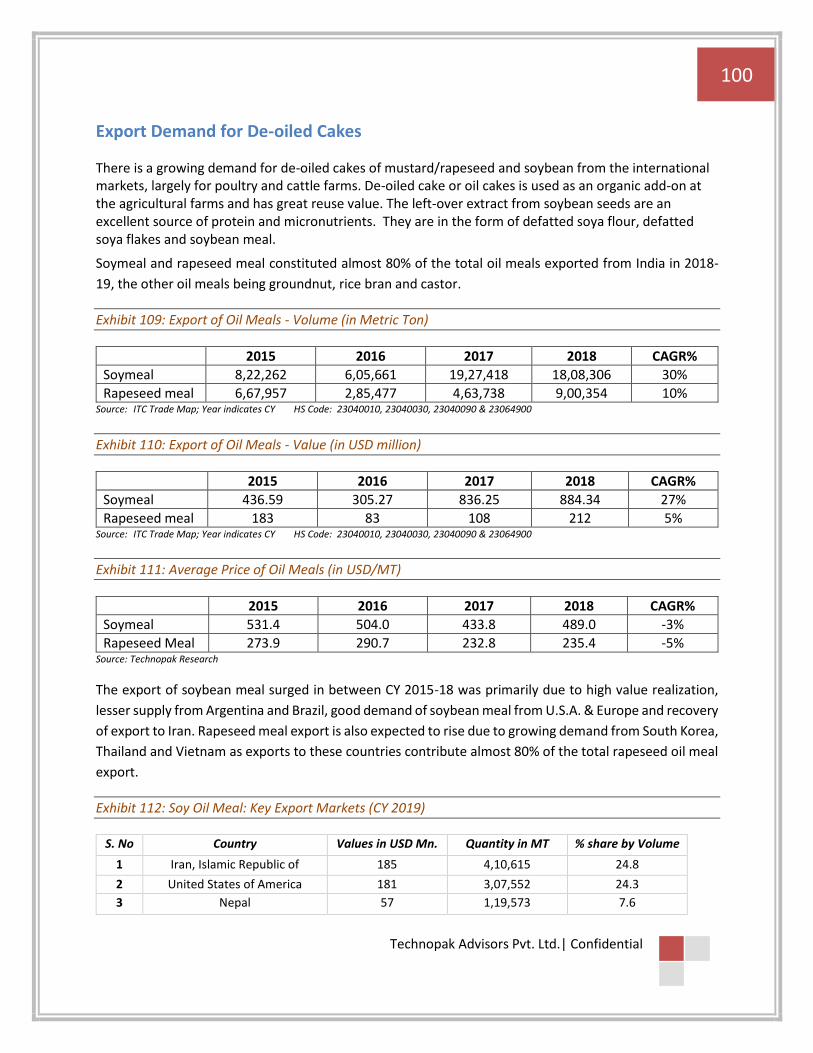
100
Technopak Advisors Pvt. Ltd.| Confidential
Export Demand for De-oiled Cakes
There is a growing demand for de-oiled cakes of mustard/rapeseed and soybean from the international markets, largely for poultry and cattle farms. De-oiled cake or oil cakes is used as an organic add-on at the agricultural farms and has great reuse value. The left-over extract from soybean seeds are an excellent source of protein and micronutrients. They are in the form of defatted soya flour, defatted soya flakes and soybean meal.
Soymeal and rapeseed meal constituted almost 80% of the total oil meals exported from India in 2018-
19, the other oil meals being groundnut, rice bran and castor.
Exhibit 109: Export of Oil Meals - Volume (in Metric Ton)
2015 2016 2017 2018 CAGR%
Soymeal 8,22,262 6,05,661 19,27,418 18,08,306 30%
Rapeseed meal 6,67,957 2,85,477 4,63,738 9,00,354 10% Source: ITC Trade Map; Year indicates CY HS Code: 23040010, 23040030, 23040090 & 23064900
Exhibit 110: Export of Oil Meals - Value (in USD million)
2015 2016 2017 2018 CAGR%
Soymeal 436.59 305.27 836.25 884.34 27%
Rapeseed meal 183 83 108 212 5% Source: ITC Trade Map; Year indicates CY HS Code: 23040010, 23040030, 23040090 & 23064900
Exhibit 111: Average Price of Oil Meals (in USD/MT)
2015 2016 2017 2018 CAGR%
Soymeal 531.4 504.0 433.8 489.0 -3%
Rapeseed Meal 273.9 290.7 232.8 235.4 -5% Source: Technopak Research
The export of soybean meal surged in between CY 2015-18 was primarily due to high value realization,
lesser supply from Argentina and Brazil, good demand of soybean meal from U.S.A. & Europe and recovery
of export to Iran. Rapeseed meal export is also expected to rise due to growing demand from South Korea,
Thailand and Vietnam as exports to these countries contribute almost 80% of the total rapeseed oil meal
export.
Exhibit 112: Soy Oil Meal: Key Export Markets (CY 2019)
S. No Country Values in USD Mn. Quantity in MT % share by Volume
1 Iran, Islamic Republic of 185 4,10,615 24.8
2 United States of America 181 3,07,552 24.3
3 Nepal 57 1,19,573 7.6
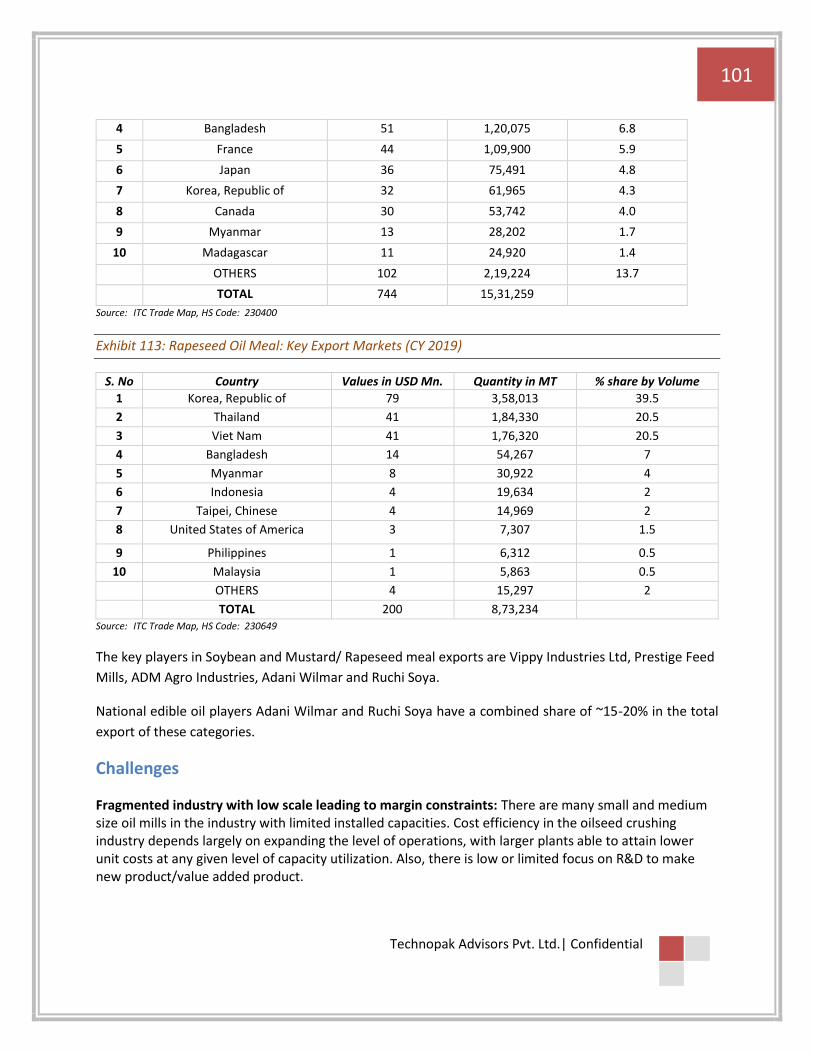
101
Technopak Advisors Pvt. Ltd.| Confidential
4 Bangladesh 51 1,20,075 6.8
5 France 44 1,09,900 5.9
6 Japan 36 75,491 4.8
7 Korea, Republic of 32 61,965 4.3
8 Canada 30 53,742 4.0
9 Myanmar 13 28,202 1.7
10 Madagascar 11 24,920 1.4
OTHERS 102 2,19,224 13.7
TOTAL 744 15,31,259
Source: ITC Trade Map, HS Code: 230400
Exhibit 113: Rapeseed Oil Meal: Key Export Markets (CY 2019)
S. No Country Values in USD Mn. Quantity in MT % share by Volume
1 Korea, Republic of 79 3,58,013 39.5
2 Thailand 41 1,84,330 20.5
3 Viet Nam 41 1,76,320 20.5
4 Bangladesh 14 54,267 7
5 Myanmar 8 30,922 4
6 Indonesia 4 19,634 2
7 Taipei, Chinese 4 14,969 2
8 United States of America 3 7,307 1.5
9 Philippines 1 6,312 0.5
10 Malaysia 1 5,863 0.5
OTHERS 4 15,297 2
TOTAL 200 8,73,234 Source: ITC Trade Map, HS Code: 230649
The key players in Soybean and Mustard/ Rapeseed meal exports are Vippy Industries Ltd, Prestige Feed
Mills, ADM Agro Industries, Adani Wilmar and Ruchi Soya.
National edible oil players Adani Wilmar and Ruchi Soya have a combined share of ~15-20% in the total
export of these categories.
Challenges
Fragmented industry with low scale leading to margin constraints: There are many small and medium size oil mills in the industry with limited installed capacities. Cost efficiency in the oilseed crushing industry depends largely on expanding the level of operations, with larger plants able to attain lower unit costs at any given level of capacity utilization. Also, there is low or limited focus on R&D to make new product/value added product.
102
Technopak Advisors Pvt. Ltd.| Confidential
Under-utilization of capacities: As soybean is a seasonal crop (Kharif Crop in India), the crushing plants
are not operated at full capacity throughout the year due to availability of the raw material for limited
period. Currently the industry operates at 30-35% capacity utilization.
Competition in the segment: Brazil, US, Argentina & China are the top soybean producers in the world followed by India. They pose competition to the Indian produce as their soy products are cheaper in international markets.
Outlook
A strong export demand for soymeal from India is expected in the future. USA has emerged as the largest customer for Indian soymeal. Soymeal exports to the US was approximately 3 lakh MT in CY 2019 contributing 24.3% to India’s total soymeal exports. Only 5% of the soybean crop in the US is non-GM (genetically modified). Customer opting for non-GM soybean products are willing to pay a premium over the GM soybean products. Indian exports benefited as the prices of soybean meal of Brazil, the US and Argentina rose in the international market. This trend is likely to continue strengthening India’s position as a global player in the world market.
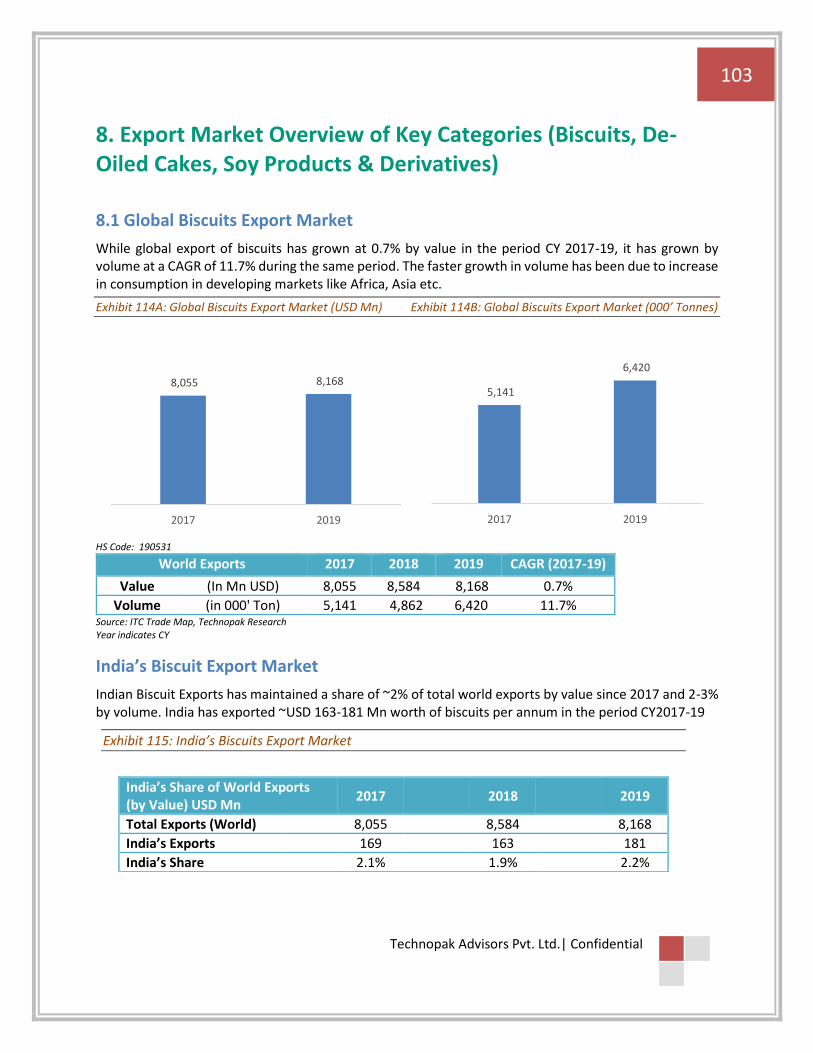
103
Technopak Advisors Pvt. Ltd.| Confidential
8. Export Market Overview of Key Categories (Biscuits, De-Oiled Cakes, Soy Products & Derivatives)
8.1 Global Biscuits Export Market
While global export of biscuits has grown at 0.7% by value in the period CY 2017-19, it has grown by volume at a CAGR of 11.7% during the same period. The faster growth in volume has been due to increase in consumption in developing markets like Africa, Asia etc.
Exhibit 114A: Global Biscuits Export Market (USD Mn) Exhibit 114B: Global Biscuits Export Market (000’ Tonnes)
HS Code: 190531
World Exports 2017 2018 2019 CAGR (2017-19)
Value (In Mn USD) 8,055 8,584 8,168 0.7%
Volume (in 000' Ton) 5,141 4,862 6,420 11.7% Source: ITC Trade Map, Technopak Research Year indicates CY
India’s Biscuit Export Market
Indian Biscuit Exports has maintained a share of ~2% of total world exports by value since 2017 and 2-3% by volume. India has exported ~USD 163-181 Mn worth of biscuits per annum in the period CY2017-19
8,055 8,168
2017 2019
5,141
6,420
2017 2019
Exhibit 115: India’s Biscuits Export Market
India’s Share of World Exports (by Value) USD Mn
2017 2018 2019
Total Exports (World) 8,055 8,584 8,168
India’s Exports 169 163 181
India’s Share 2.1% 1.9% 2.2%
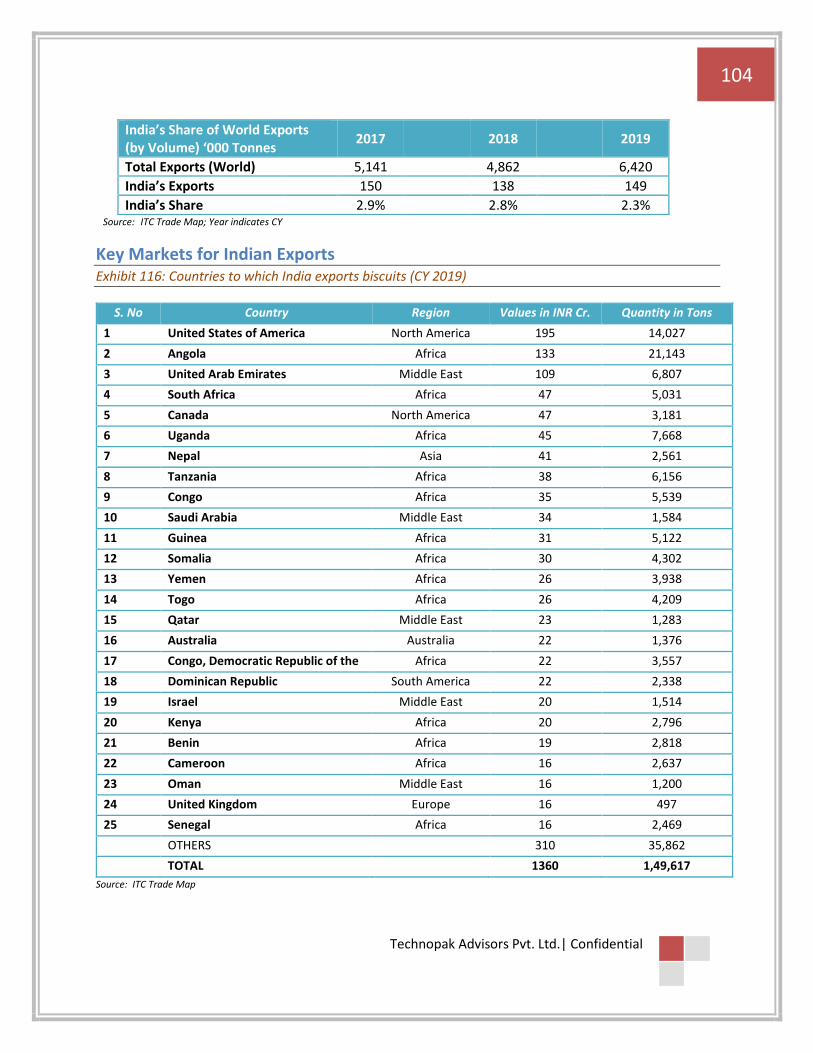
104
Technopak Advisors Pvt. Ltd.| Confidential
Key Markets for Indian Exports Exhibit 116: Countries to which India exports biscuits (CY 2019)
S. No Country Region Values in INR Cr. Quantity in Tons
1 United States of America North America 195 14,027
2 Angola Africa 133 21,143
3 United Arab Emirates Middle East 109 6,807
4 South Africa Africa 47 5,031
5 Canada North America 47 3,181
6 Uganda Africa 45 7,668
7 Nepal Asia 41 2,561
8 Tanzania Africa 38 6,156
9 Congo Africa 35 5,539
10 Saudi Arabia Middle East 34 1,584
11 Guinea Africa 31 5,122
12 Somalia Africa 30 4,302
13 Yemen Africa 26 3,938
14 Togo Africa 26 4,209
15 Qatar Middle East 23 1,283
16 Australia Australia 22 1,376
17 Congo, Democratic Republic of the Africa 22 3,557
18 Dominican Republic South America 22 2,338
19 Israel Middle East 20 1,514
20 Kenya Africa 20 2,796
21 Benin Africa 19 2,818
22 Cameroon Africa 16 2,637
23 Oman Middle East 16 1,200
24 United Kingdom Europe 16 497
25 Senegal Africa 16 2,469
OTHERS 310 35,862
TOTAL 1360 1,49,617
Source: ITC Trade Map
India’s Share of World Exports (by Volume) ‘000 Tonnes
2017 2018 2019
Total Exports (World) 5,141 4,862 6,420
India’s Exports 150 138 149
India’s Share 2.9% 2.8% 2.3% Source: ITC Trade Map; Year indicates CY
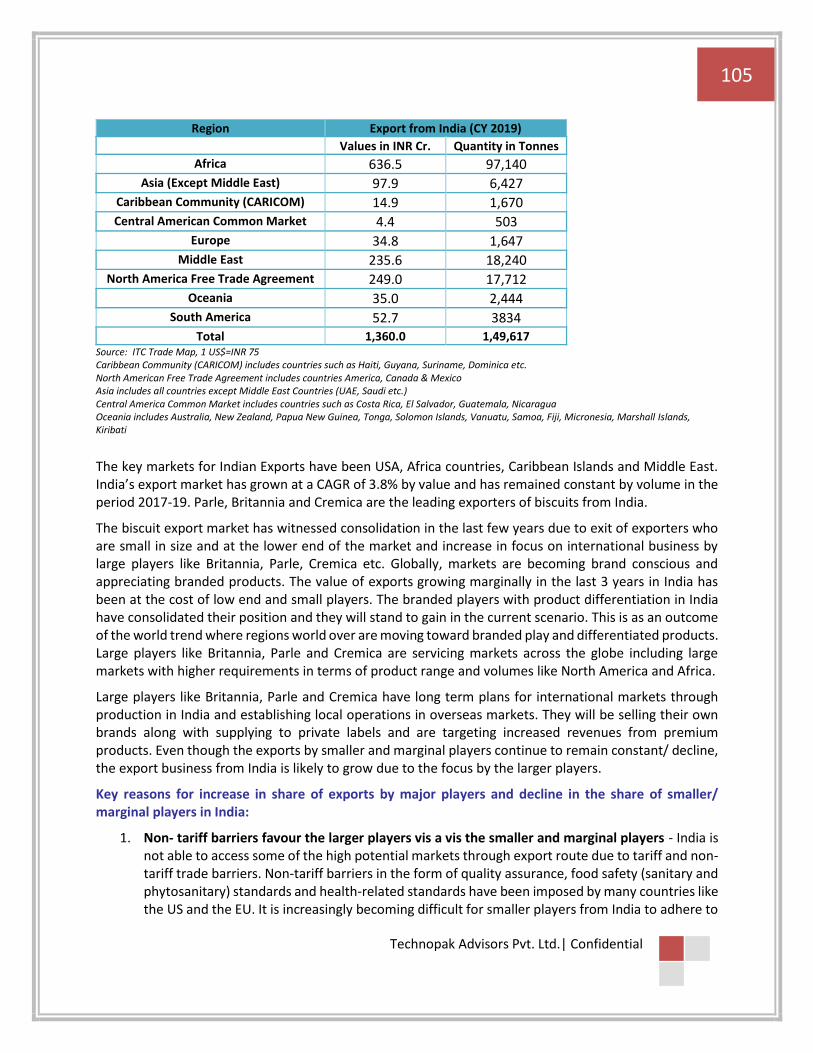
105
Technopak Advisors Pvt. Ltd.| Confidential
Region Export from India (CY 2019)
Region Values in INR Cr. Quantity in Tonnes
Africa 636.5 97,140
Asia (Except Middle East) 97.9 6,427
Caribbean Community (CARICOM) 14.9 1,670
Central American Common Market 4.4 503
Europe 34.8 1,647
Middle East 235.6 18,240
North America Free Trade Agreement 249.0 17,712
Oceania 35.0 2,444
South America 52.7 3834
Total 1,360.0 1,49,617 Source: ITC Trade Map, 1 US$=INR 75 Caribbean Community (CARICOM) includes countries such as Haiti, Guyana, Suriname, Dominica etc. North American Free Trade Agreement includes countries America, Canada & Mexico Asia includes all countries except Middle East Countries (UAE, Saudi etc.) Central America Common Market includes countries such as Costa Rica, El Salvador, Guatemala, Nicaragua Oceania includes Australia, New Zealand, Papua New Guinea, Tonga, Solomon Islands, Vanuatu, Samoa, Fiji, Micronesia, Marshall Islands, Kiribati
The key markets for Indian Exports have been USA, Africa countries, Caribbean Islands and Middle East. India’s export market has grown at a CAGR of 3.8% by value and has remained constant by volume in the period 2017-19. Parle, Britannia and Cremica are the leading exporters of biscuits from India.
The biscuit export market has witnessed consolidation in the last few years due to exit of exporters who are small in size and at the lower end of the market and increase in focus on international business by large players like Britannia, Parle, Cremica etc. Globally, markets are becoming brand conscious and appreciating branded products. The value of exports growing marginally in the last 3 years in India has been at the cost of low end and small players. The branded players with product differentiation in India have consolidated their position and they will stand to gain in the current scenario. This is as an outcome of the world trend where regions world over are moving toward branded play and differentiated products. Large players like Britannia, Parle and Cremica are servicing markets across the globe including large markets with higher requirements in terms of product range and volumes like North America and Africa.
Large players like Britannia, Parle and Cremica have long term plans for international markets through production in India and establishing local operations in overseas markets. They will be selling their own brands along with supplying to private labels and are targeting increased revenues from premium products. Even though the exports by smaller and marginal players continue to remain constant/ decline, the export business from India is likely to grow due to the focus by the larger players.
Key reasons for increase in share of exports by major players and decline in the share of smaller/ marginal players in India:
1. Non- tariff barriers favour the larger players vis a vis the smaller and marginal players - India is not able to access some of the high potential markets through export route due to tariff and non-tariff trade barriers. Non-tariff barriers in the form of quality assurance, food safety (sanitary and phytosanitary) standards and health-related standards have been imposed by many countries like the US and the EU. It is increasingly becoming difficult for smaller players from India to adhere to
106
Technopak Advisors Pvt. Ltd.| Confidential
these standards and norms. Large players with their integrated play and competencies are in a better position to adhere to these non-tariff barriers and are able to take advantage of these opportunities.
2. Diversified customer base reduces risk and favours premiumization – India’s export business of biscuits has continued to be under pressure due to deteriorating geopolitical situation and currency fluctuations in geographies like Middle East, Africa. Also general economic slowdown in certain key export markets had added to the pressure. While most of the other smaller / marginal players are concentrated towards one or two markets largely in African countries and Caribbean Islands, large players have expanded their country base to different regions and to different countries within the regions that are increasingly moving towards premiumization. This has helped the major players to reduce the risk of concentrating on 1-2 markets and have been able to sustain the cyclical vagaries of the export market.
Current Opportunities for India’s Export Segment:
1. Indian players are targeting the developing countries and the growing Indian diaspora living there and in other developed nations. Majority of Parle’s demand comes from African countires as they are in a developing stage and Parle products are available at economical prices. Products like Parle G, Marie, Krack Jack are locally produced in Africa and the brand wants to predominantly target the Indian diaspora living abroad. Britannia is looking at contract packaging in Uganda and Egypt. Both these countries have got alignment with lot of countries around them, so they can export without any duties. They will manufacture in these countries and export.
2. Players are looking at local manufacturing to customise products, lower costs and also gain entry in markets with high trade barriers. Britannia has set up plants in Mundra SEZs in India and Nepal to manufacture exclusively for exports. Britannia plans to export cream biscuits, short dough biscuits and rusks manufactured at the Gujarat plant to international markets such as North America, the UK, African countries, Singapore, Australia, New Zealand and Malaysia. Parle also has manufacturing units in 8 countries outside of India - Cameroon, Nigeria, Ghana, Ethiopia, Kenya, Ivory Coast, Nepal and Mexico.
3. Players like Britannia, Parle, Cremica are not only exporting their low and mid-range products but are also planning to introduce their premium ranges along with manufacturing for the labels present in those countries. Britannia plans to introduce its premium brands along with its current selling low-priced brands in international markets. Parle and Cremica have customised products for international markets which would result in more local authentic flavours and combinations to attract local buyers. While Cremica retails its own brands in the international market, it also caters to the requirements of retailers and food suppliers such as Shoprite and Transnational Foods for their brands and private labels
4. India has a fairly good share of trade with Middle Eastern and African countries. In the top 6 markets such as the USA, France, UK, Germany, Netherlands and China, India has a combined share of less than 1%. India has made inroads into South American countries and currently has a low share of ~3% in the growing South American markets such as Chile, Ecuador, Paraguay,
107
Technopak Advisors Pvt. Ltd.| Confidential
Uruguay, Brazil and Argentina and a share of 2.5% in the Oceanian countries. This represents an opportunity in these markets.
Key imperatives going forward for the growth of biscuit exports from India:
1. Product Differentiation – Going forward manufacturers and exporters are required to be in a position to offer product variety and do new product development to cater to the changing taste. Product portfolio of the market is changing, retailers and consumers are changing and they expect manufacturers and exporters to have installed capacity to adhere to these changes in terms of new SKU varieties, product varieties, launches etc. Players who will have this capability will be in a better position to capture a share of the market.
2. Integrated Manufacturing and Value chain – Integrated play at the manufacturing end allows better control on sourcing prices, better control on costs and margins. This has prompted many large players to opt for integrated play. Though many domestic brands in India have not opted for integrated manufacturing, players like Britannia, Parle and Cremica have own manufacturing to support their export business. Own manufacturing allows the player to leverage the capability for both domestic and export market.
3. Increasing Influence of Non-tariff Barriers particularly around Food Safety and Quality – Manufacturers that have installed capability to do self-certification, superior standards of quality assurance and systems & processes to adhere to the global standards will stand to benefit not only to address the non-tariff barriers but also to cater to developed markets and products with far more stringent quality profile.
Major players from India will not only grow the domestic market but will also capture a larger share of the export market.
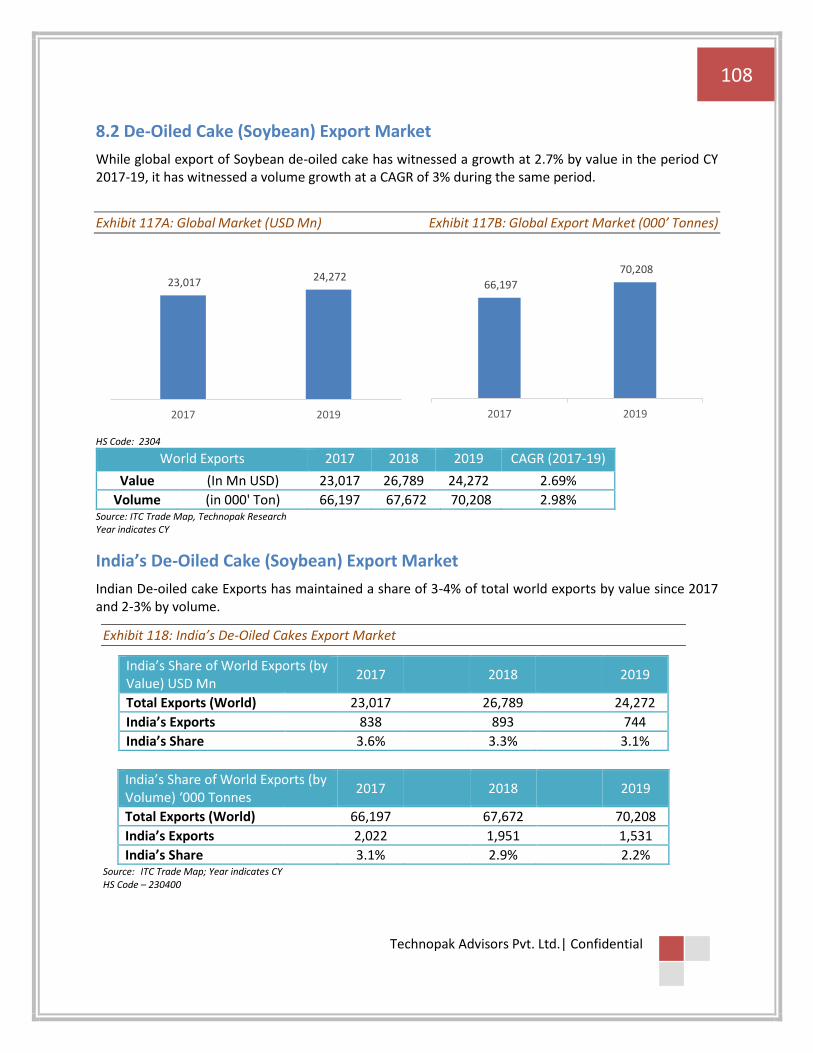
108
Technopak Advisors Pvt. Ltd.| Confidential
8.2 De-Oiled Cake (Soybean) Export Market
While global export of Soybean de-oiled cake has witnessed a growth at 2.7% by value in the period CY 2017-19, it has witnessed a volume growth at a CAGR of 3% during the same period.
Exhibit 117A: Global Market (USD Mn) Exhibit 117B: Global Export Market (000’ Tonnes)
HS Code: 2304
World Exports 2017 2018 2019 CAGR (2017-19)
Value (In Mn USD) 23,017 26,789 24,272 2.69%
Volume (in 000' Ton) 66,197 67,672 70,208 2.98% Source: ITC Trade Map, Technopak Research Year indicates CY
India’s De-Oiled Cake (Soybean) Export Market
Indian De-oiled cake Exports has maintained a share of 3-4% of total world exports by value since 2017 and 2-3% by volume.
23,017 24,272
2017 2019
66,197
70,208
2017 2019
Exhibit 118: India’s De-Oiled Cakes Export Market
India’s Share of World Exports (by Value) USD Mn
2017 2018 2019
Total Exports (World) 23,017 26,789 24,272
India’s Exports 838 893 744
India’s Share 3.6% 3.3% 3.1%
India’s Share of World Exports (by Volume) ‘000 Tonnes
2017 2018 2019
Total Exports (World) 66,197 67,672 70,208
India’s Exports 2,022 1,951 1,531
India’s Share 3.1% 2.9% 2.2% Source: ITC Trade Map; Year indicates CY HS Code – 230400

109
Technopak Advisors Pvt. Ltd.| Confidential
Soybean Meal Export Market
Indian Soybean Meal (soy meal, full fat soy flour, soy grit, soy flour and soy flakes) exports has witnessed an exponential growth during the previous years, the category has grown by a CAGR of ~79% between 2016 and 2019. The primary customers of soybean meal for India are Middle Eastern Nations and European countries like Germany and France. While Ruchi Soya is the largest soybean meal exporter from India, the company is also the largest manufacture of soybean meal in India.
Source: ITC Trade Map, Technopak Research Year indicates CY HS Code: 23040030 (Data available till 2018)
Soybean Oilcake and Oilcake Meal Export Market
Indian oil cake and oilcake meal (defatted soy flakes and soy flour) exports has witnessed an exponential growth during the previous years, the category has grown by a CAGR of ~78% by volume. The primary customers of oilcake and oilcake meal for India are North Amearican countries like USA & Canada and South East Asian countries Vietnam, Myanmar and Thailand.
Exhibit 119: India’s Soybean Oilcake and Oil cake meal Export Market
World Exports 2016 2017 2018 CAGR (2016-18)
Value (In Mn USD) 64 112 184 70%
Volume (in 000' Ton) 106 209 334 78% Source: ITC Trade Map, Technopak Research Year indicates CY HS Code: 23040010 (Data available till 2018)
Key Markets for Indian Exports Exhibit 120: Countries to which India exports Soybean Oilcake and Oil cake meal (CY 2018)
S. No Country Values in USD Mn. Quantity in
Tons
Export Share %
1 United States of
America 108 1,75,638
59
2 Vietnam 19 47,601 10
3 Canada 22 37,433 12
4 OTHERS 35 72,845 19
TOTAL 184 3,33,517 100
Exhibit 121: India’s Soybean meal Export Market
World Exports 2016 2017 2018 CAGR (2016-18)
Value (In Mn USD) 183 578 528 70%
Volume (in 000' Ton) 391 1,446 1,247 79%
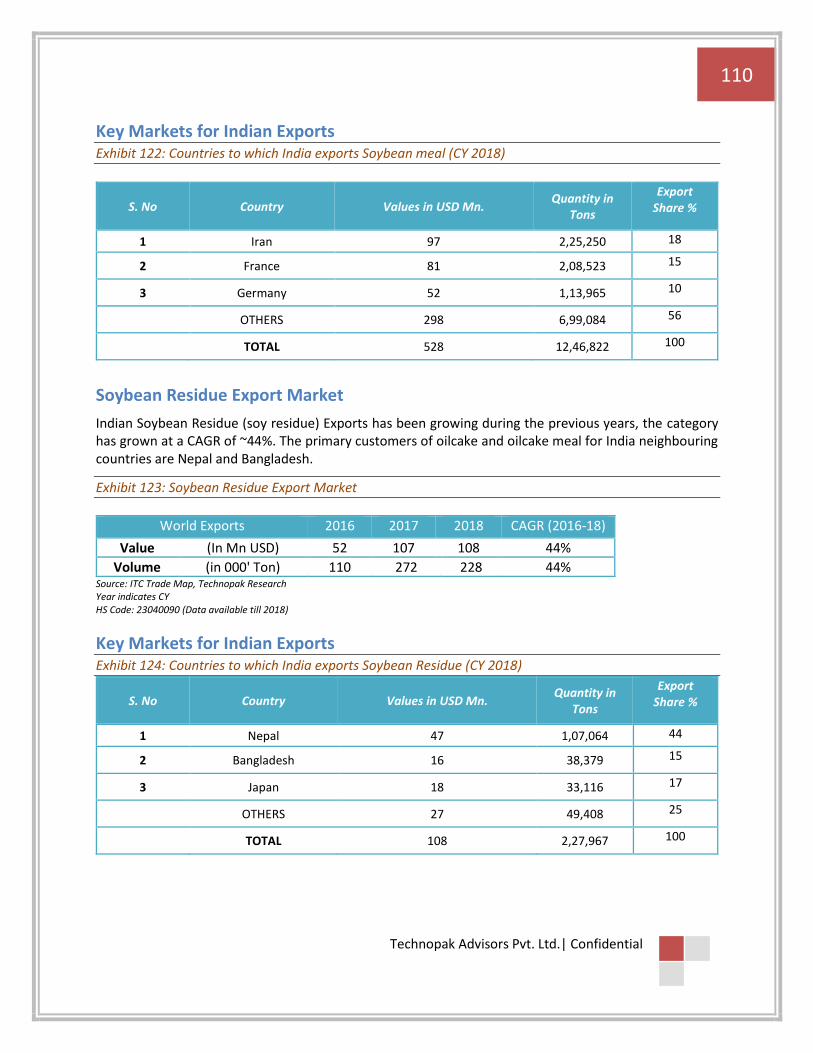
110
Technopak Advisors Pvt. Ltd.| Confidential
Key Markets for Indian Exports Exhibit 122: Countries to which India exports Soybean meal (CY 2018)
S. No Country Values in USD Mn. Quantity in
Tons
Export Share %
1 Iran 97 2,25,250 18
2 France 81 2,08,523 15
3 Germany 52 1,13,965 10
OTHERS 298 6,99,084 56
TOTAL 528 12,46,822 100
Soybean Residue Export Market
Indian Soybean Residue (soy residue) Exports has been growing during the previous years, the category has grown at a CAGR of ~44%. The primary customers of oilcake and oilcake meal for India neighbouring countries are Nepal and Bangladesh.
Source: ITC Trade Map, Technopak Research Year indicates CY HS Code: 23040090 (Data available till 2018)
Key Markets for Indian Exports Exhibit 124: Countries to which India exports Soybean Residue (CY 2018)
S. No Country Values in USD Mn. Quantity in
Tons
Export Share %
1 Nepal 47 1,07,064 44
2 Bangladesh 16 38,379 15
3 Japan 18 33,116 17
OTHERS 27 49,408 25
TOTAL 108 2,27,967 100
Exhibit 123: Soybean Residue Export Market
World Exports 2016 2017 2018 CAGR (2016-18)
Value (In Mn USD) 52 107 108 44%
Volume (in 000' Ton) 110 272 228 44%
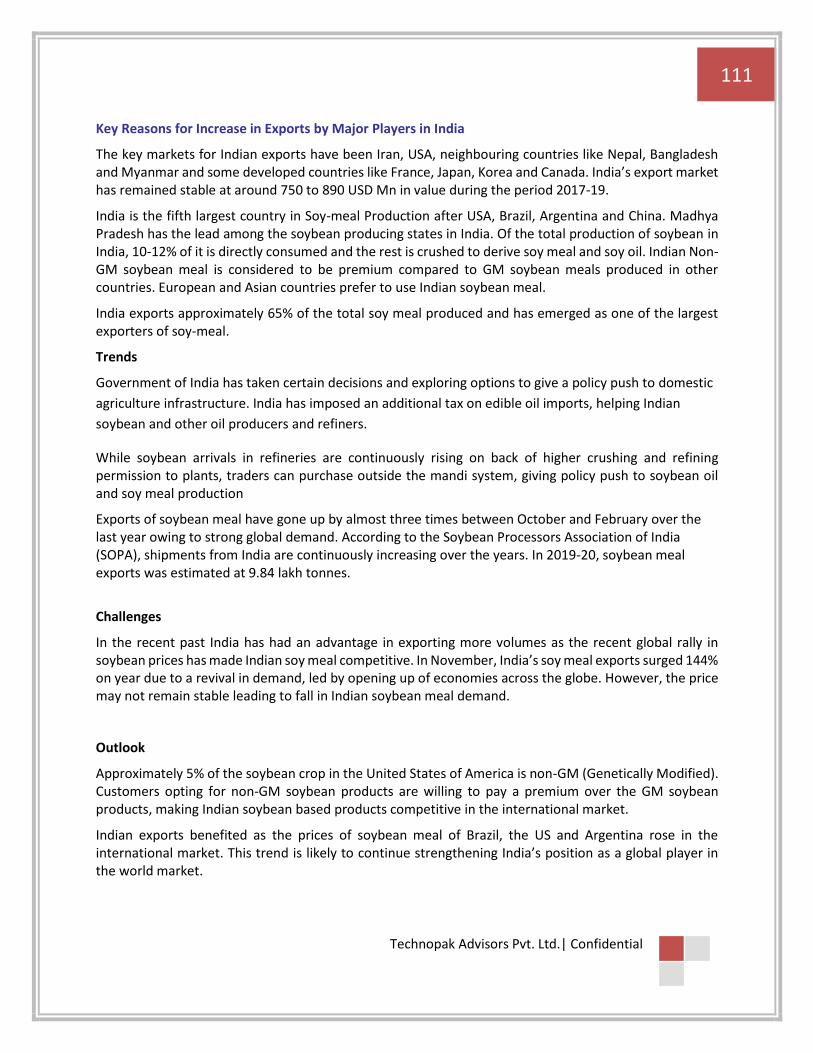
111
Technopak Advisors Pvt. Ltd.| Confidential
Key Reasons for Increase in Exports by Major Players in India
The key markets for Indian exports have been Iran, USA, neighbouring countries like Nepal, Bangladesh and Myanmar and some developed countries like France, Japan, Korea and Canada. India’s export market has remained stable at around 750 to 890 USD Mn in value during the period 2017-19.
India is the fifth largest country in Soy-meal Production after USA, Brazil, Argentina and China. Madhya Pradesh has the lead among the soybean producing states in India. Of the total production of soybean in India, 10-12% of it is directly consumed and the rest is crushed to derive soy meal and soy oil. Indian Non-GM soybean meal is considered to be premium compared to GM soybean meals produced in other countries. European and Asian countries prefer to use Indian soybean meal.
India exports approximately 65% of the total soy meal produced and has emerged as one of the largest exporters of soy-meal.
Trends
Government of India has taken certain decisions and exploring options to give a policy push to domestic
agriculture infrastructure. India has imposed an additional tax on edible oil imports, helping Indian
soybean and other oil producers and refiners.
While soybean arrivals in refineries are continuously rising on back of higher crushing and refining permission to plants, traders can purchase outside the mandi system, giving policy push to soybean oil and soy meal production
Exports of soybean meal have gone up by almost three times between October and February over the last year owing to strong global demand. According to the Soybean Processors Association of India (SOPA), shipments from India are continuously increasing over the years. In 2019-20, soybean meal exports was estimated at 9.84 lakh tonnes.
Challenges
In the recent past India has had an advantage in exporting more volumes as the recent global rally in soybean prices has made Indian soy meal competitive. In November, India’s soy meal exports surged 144% on year due to a revival in demand, led by opening up of economies across the globe. However, the price may not remain stable leading to fall in Indian soybean meal demand.
Outlook
Approximately 5% of the soybean crop in the United States of America is non-GM (Genetically Modified). Customers opting for non-GM soybean products are willing to pay a premium over the GM soybean products, making Indian soybean based products competitive in the international market.
Indian exports benefited as the prices of soybean meal of Brazil, the US and Argentina rose in the international market. This trend is likely to continue strengthening India’s position as a global player in the world market.
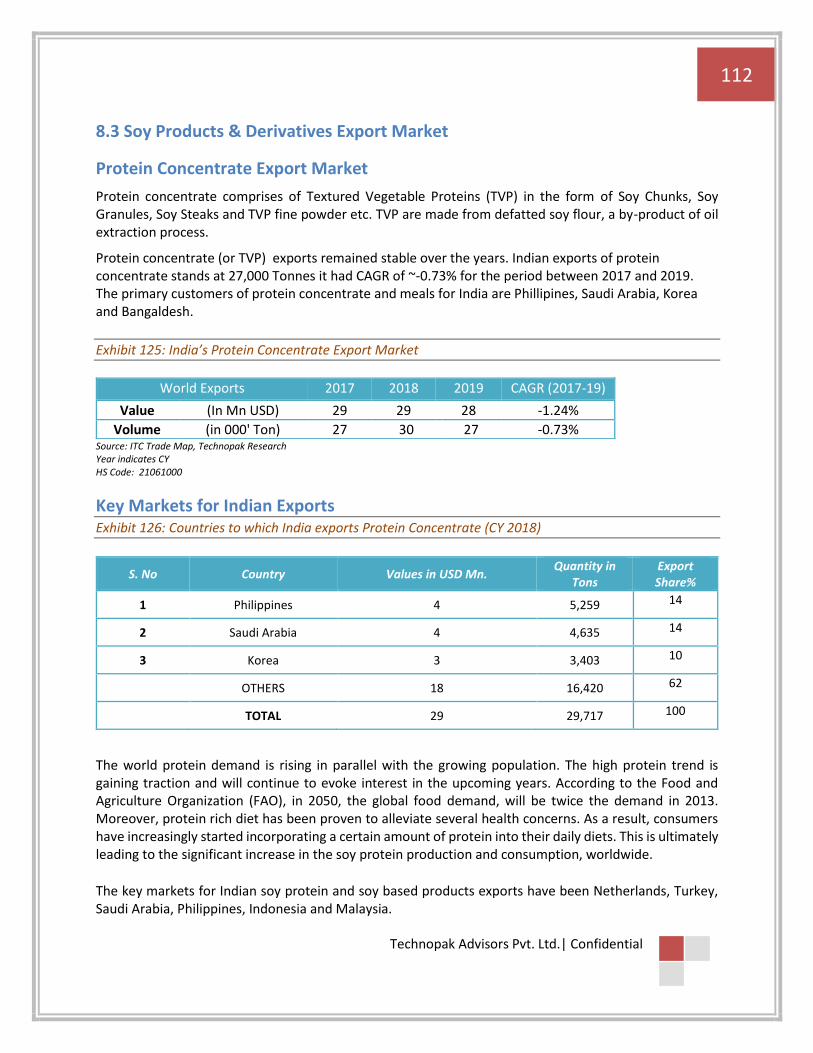
112
Technopak Advisors Pvt. Ltd.| Confidential
8.3 Soy Products & Derivatives Export Market
Protein Concentrate Export Market
Protein concentrate comprises of Textured Vegetable Proteins (TVP) in the form of Soy Chunks, Soy Granules, Soy Steaks and TVP fine powder etc. TVP are made from defatted soy flour, a by-product of oil extraction process.
Protein concentrate (or TVP) exports remained stable over the years. Indian exports of protein concentrate stands at 27,000 Tonnes it had CAGR of ~-0.73% for the period between 2017 and 2019. The primary customers of protein concentrate and meals for India are Phillipines, Saudi Arabia, Korea and Bangaldesh.
Source: ITC Trade Map, Technopak Research Year indicates CY HS Code: 21061000
Key Markets for Indian Exports Exhibit 126: Countries to which India exports Protein Concentrate (CY 2018)
S. No Country Values in USD Mn. Quantity in
Tons Export Share%
1 Philippines 4 5,259 14
2 Saudi Arabia 4 4,635 14
3 Korea 3 3,403 10
OTHERS 18 16,420 62
TOTAL 29 29,717 100
The world protein demand is rising in parallel with the growing population. The high protein trend is gaining traction and will continue to evoke interest in the upcoming years. According to the Food and Agriculture Organization (FAO), in 2050, the global food demand, will be twice the demand in 2013. Moreover, protein rich diet has been proven to alleviate several health concerns. As a result, consumers have increasingly started incorporating a certain amount of protein into their daily diets. This is ultimately leading to the significant increase in the soy protein production and consumption, worldwide.
The key markets for Indian soy protein and soy based products exports have been Netherlands, Turkey, Saudi Arabia, Philippines, Indonesia and Malaysia.
Exhibit 125: India’s Protein Concentrate Export Market
World Exports 2017 2018 2019 CAGR (2017-19)
Value (In Mn USD) 29 29 28 -1.24%
Volume (in 000' Ton) 27 30 27 -0.73%

113
Technopak Advisors Pvt. Ltd.| Confidential
Soy Lecithin Export Market
Soy lecithin is a food additive obtained during refining af crude soybean oil. Soy lechtin is used as an emulsifier, when added to food, and has uses as an antioxidant and flavor protector, it is also used in paints, cosmetics, plastics and pharmaceutical industries. Soy Lechtin is a profitable product and an importat source of revenue for oil refiners.
Soy Lechitin exports has grown by a CAGR of ~10% by volume. The primary customers of soy lecithin are Netherlands, Turkey and Saudi Arabia.
Source: ITC Trade Map, Technopak Research Year indicates CY HS Code: 29232010
Key Markets for Indian Exports Exhibit 128: Countries to which India exports Soy lecithin (CY 2018)
S. No Country Values in USD Mn. Quantity in
Tons
Export Share %
1 Netherlands 26 20,942 39
2 Turkey 2 2,039 3
3 Saudi Arabia 2 1,898 3
OTHERS 36 19,556 55
TOTAL 66 44,435 100
Soy Fatty Acid Export Market
Soy fatty acids are used in industrial and medical applications. The exports have grown at a CAGR of ~36% by volume. The primary customers of soy fatty acids are Indonesia and Malaysia.
Source: ITC Trade Map, Technopak Research Year indicates CY HS Code: 28231900
Exhibit 127: India’s Soy lecithin Export Market
World Exports 2016 2017 2018 CAGR (2016-18)
Value (In Mn USD) 69 66 66 -2%
Volume (in 000' Ton) 37 44 44 10%
Exhibit 129: India’s Soy Fatty Acid Export Market
World Exports 2016 2017 2018 CAGR (2016-18)
Value (In Mn USD) 224 319 398 33%
Volume (in 000' Ton) 293 356 543 36%
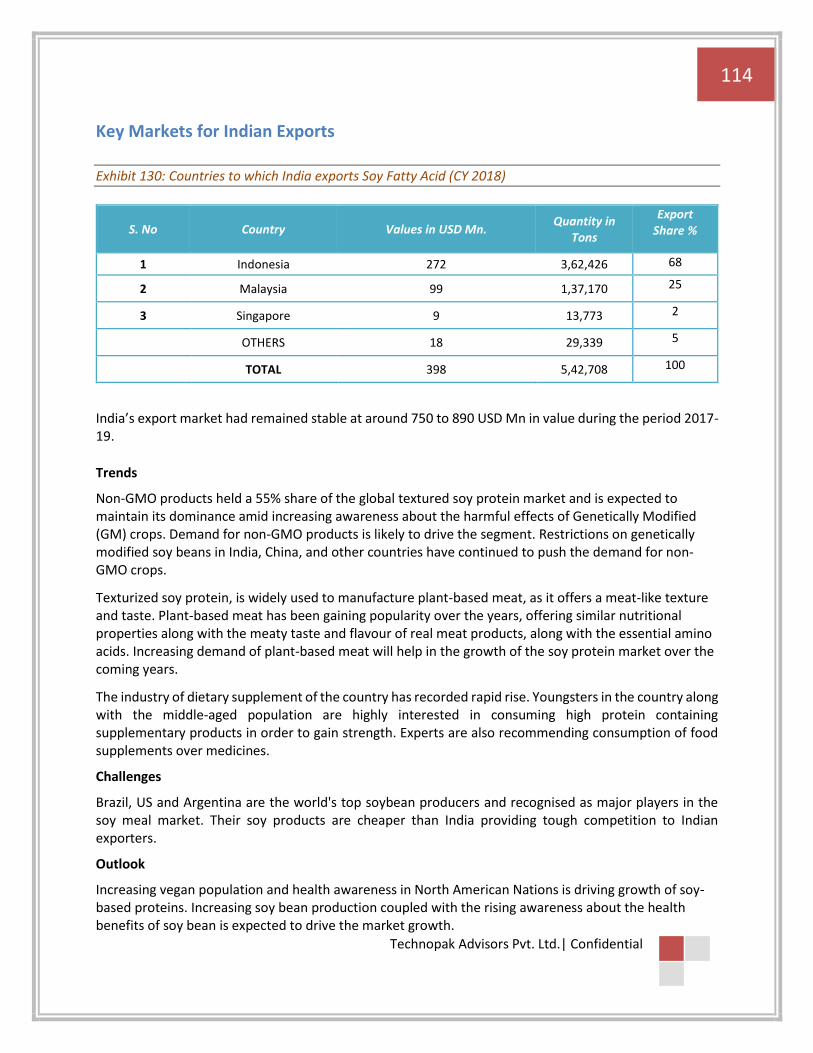
114
Technopak Advisors Pvt. Ltd.| Confidential
Key Markets for Indian Exports Exhibit 130: Countries to which India exports Soy Fatty Acid (CY 2018)
S. No Country Values in USD Mn. Quantity in
Tons
Export Share %
1 Indonesia 272 3,62,426 68
2 Malaysia 99 1,37,170 25
3 Singapore 9 13,773 2
OTHERS 18 29,339 5
TOTAL 398 5,42,708 100
India’s export market had remained stable at around 750 to 890 USD Mn in value during the period 2017-19.
Trends
Non-GMO products held a 55% share of the global textured soy protein market and is expected to maintain its dominance amid increasing awareness about the harmful effects of Genetically Modified (GM) crops. Demand for non-GMO products is likely to drive the segment. Restrictions on genetically modified soy beans in India, China, and other countries have continued to push the demand for non-GMO crops.
Texturized soy protein, is widely used to manufacture plant-based meat, as it offers a meat-like texture and taste. Plant-based meat has been gaining popularity over the years, offering similar nutritional properties along with the meaty taste and flavour of real meat products, along with the essential amino acids. Increasing demand of plant-based meat will help in the growth of the soy protein market over the coming years.
The industry of dietary supplement of the country has recorded rapid rise. Youngsters in the country along with the middle-aged population are highly interested in consuming high protein containing supplementary products in order to gain strength. Experts are also recommending consumption of food supplements over medicines.
Challenges
Brazil, US and Argentina are the world's top soybean producers and recognised as major players in the soy meal market. Their soy products are cheaper than India providing tough competition to Indian exporters.
Outlook
Increasing vegan population and health awareness in North American Nations is driving growth of soy-based proteins. Increasing soy bean production coupled with the rising awareness about the health benefits of soy bean is expected to drive the market growth.
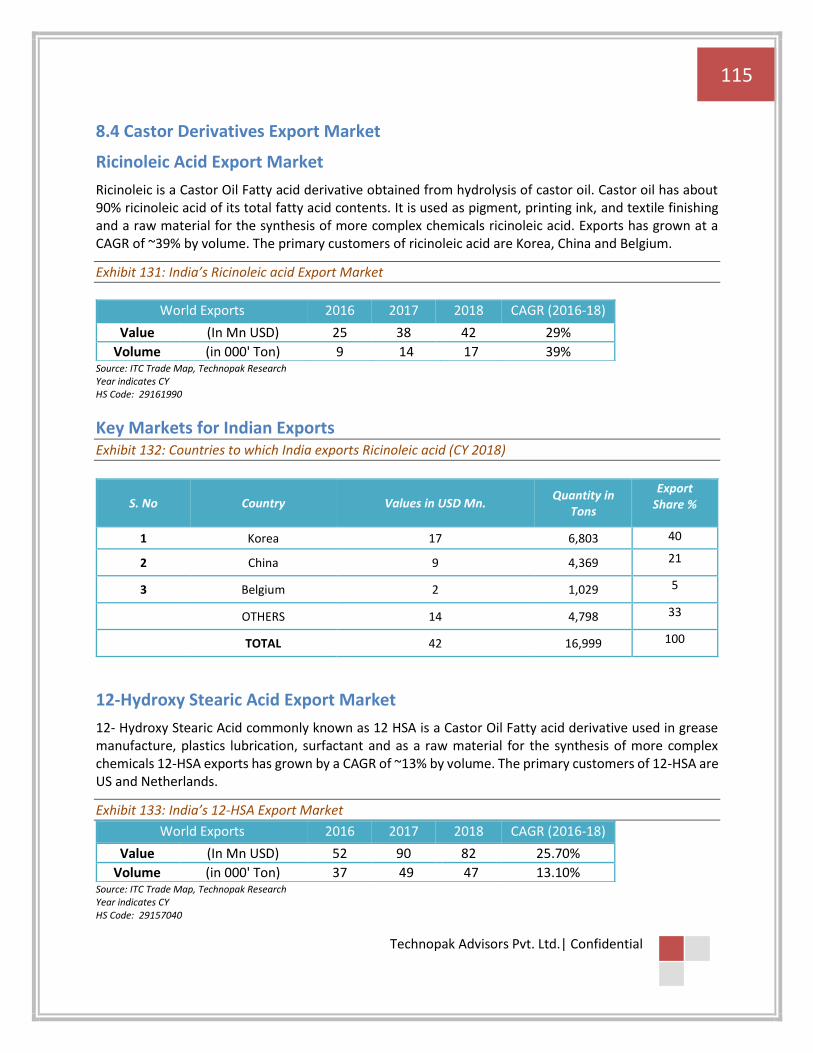
115
Technopak Advisors Pvt. Ltd.| Confidential
8.4 Castor Derivatives Export Market
Ricinoleic Acid Export Market
Ricinoleic is a Castor Oil Fatty acid derivative obtained from hydrolysis of castor oil. Castor oil has about 90% ricinoleic acid of its total fatty acid contents. It is used as pigment, printing ink, and textile finishing and a raw material for the synthesis of more complex chemicals ricinoleic acid. Exports has grown at a CAGR of ~39% by volume. The primary customers of ricinoleic acid are Korea, China and Belgium.
Source: ITC Trade Map, Technopak Research Year indicates CY HS Code: 29161990
Key Markets for Indian Exports Exhibit 132: Countries to which India exports Ricinoleic acid (CY 2018)
S. No Country Values in USD Mn. Quantity in
Tons
Export Share %
1 Korea 17 6,803 40
2 China 9 4,369 21
3 Belgium 2 1,029 5
OTHERS 14 4,798 33
TOTAL 42 16,999 100
12-Hydroxy Stearic Acid Export Market
12- Hydroxy Stearic Acid commonly known as 12 HSA is a Castor Oil Fatty acid derivative used in grease manufacture, plastics lubrication, surfactant and as a raw material for the synthesis of more complex chemicals 12-HSA exports has grown by a CAGR of ~13% by volume. The primary customers of 12-HSA are US and Netherlands.
Source: ITC Trade Map, Technopak Research Year indicates CY HS Code: 29157040
Exhibit 131: India’s Ricinoleic acid Export Market
World Exports 2016 2017 2018 CAGR (2016-18)
Value (In Mn USD) 25 38 42 29%
Volume (in 000' Ton) 9 14 17 39%
Exhibit 133: India’s 12-HSA Export Market
World Exports 2016 2017 2018 CAGR (2016-18)
Value (In Mn USD) 52 90 82 25.70%
Volume (in 000' Ton) 37 49 47 13.10%
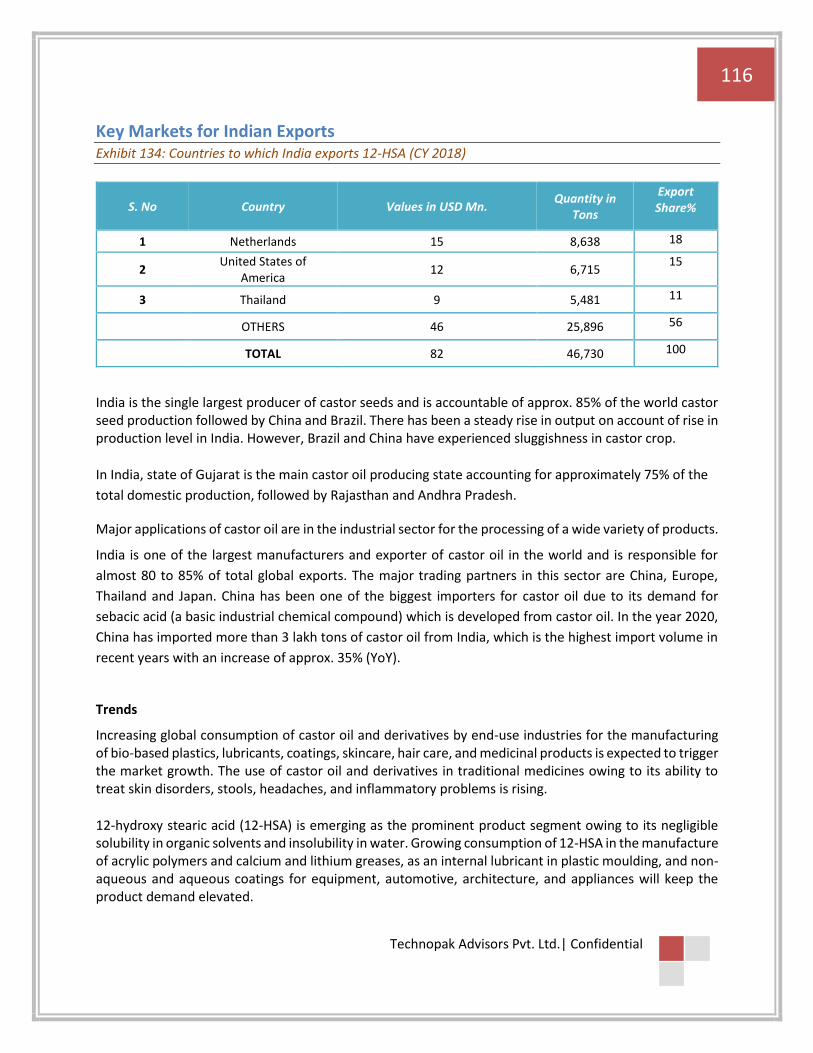
116
Technopak Advisors Pvt. Ltd.| Confidential
Key Markets for Indian Exports Exhibit 134: Countries to which India exports 12-HSA (CY 2018)
S. No Country Values in USD Mn. Quantity in
Tons
Export Share%
1 Netherlands 15 8,638 18
2 United States of
America 12 6,715
15
3 Thailand 9 5,481 11
OTHERS 46 25,896 56
TOTAL 82 46,730 100
India is the single largest producer of castor seeds and is accountable of approx. 85% of the world castor seed production followed by China and Brazil. There has been a steady rise in output on account of rise in production level in India. However, Brazil and China have experienced sluggishness in castor crop.
In India, state of Gujarat is the main castor oil producing state accounting for approximately 75% of the
total domestic production, followed by Rajasthan and Andhra Pradesh.
Major applications of castor oil are in the industrial sector for the processing of a wide variety of products.
India is one of the largest manufacturers and exporter of castor oil in the world and is responsible for
almost 80 to 85% of total global exports. The major trading partners in this sector are China, Europe,
Thailand and Japan. China has been one of the biggest importers for castor oil due to its demand for
sebacic acid (a basic industrial chemical compound) which is developed from castor oil. In the year 2020,
China has imported more than 3 lakh tons of castor oil from India, which is the highest import volume in
recent years with an increase of approx. 35% (YoY).
Trends
Increasing global consumption of castor oil and derivatives by end-use industries for the manufacturing of bio-based plastics, lubricants, coatings, skincare, hair care, and medicinal products is expected to trigger the market growth. The use of castor oil and derivatives in traditional medicines owing to its ability to treat skin disorders, stools, headaches, and inflammatory problems is rising.
12-hydroxy stearic acid (12-HSA) is emerging as the prominent product segment owing to its negligible solubility in organic solvents and insolubility in water. Growing consumption of 12-HSA in the manufacture of acrylic polymers and calcium and lithium greases, as an internal lubricant in plastic moulding, and non-aqueous and aqueous coatings for equipment, automotive, architecture, and appliances will keep the product demand elevated.
117
Technopak Advisors Pvt. Ltd.| Confidential
Challenges
China accounts for the highest consumption of castor oil and derivatives, mainly due to the gradual expansion of its downstream industries. They are used for the production of a variety of industrial products such as plasticizers, candles, lubricants, hydraulic fluids, and resins.
Castor oil and derivatives industry face demand-supply gap along with the availability of substitutes such as palm oil, sunflower oil, rapeseed oil, sugarcane, corn, and wheat which replaces castor oil derivatives in the market
Outlook
Castor oil and its derivatives have applications in the manufacturing of soaps, lubricants, hydraulic & brake fluids, paints, dyes, coatings, inks, cold resistant plastics, waxes & polishes, nylon, pharmaceuticals and perfumes. The use of castor oil derivatives in the industry are projected to increase, with increasing acceptance of castor oil derivatives in cosmetics and pharmaceutical products like lotions, makeup and cleansers.
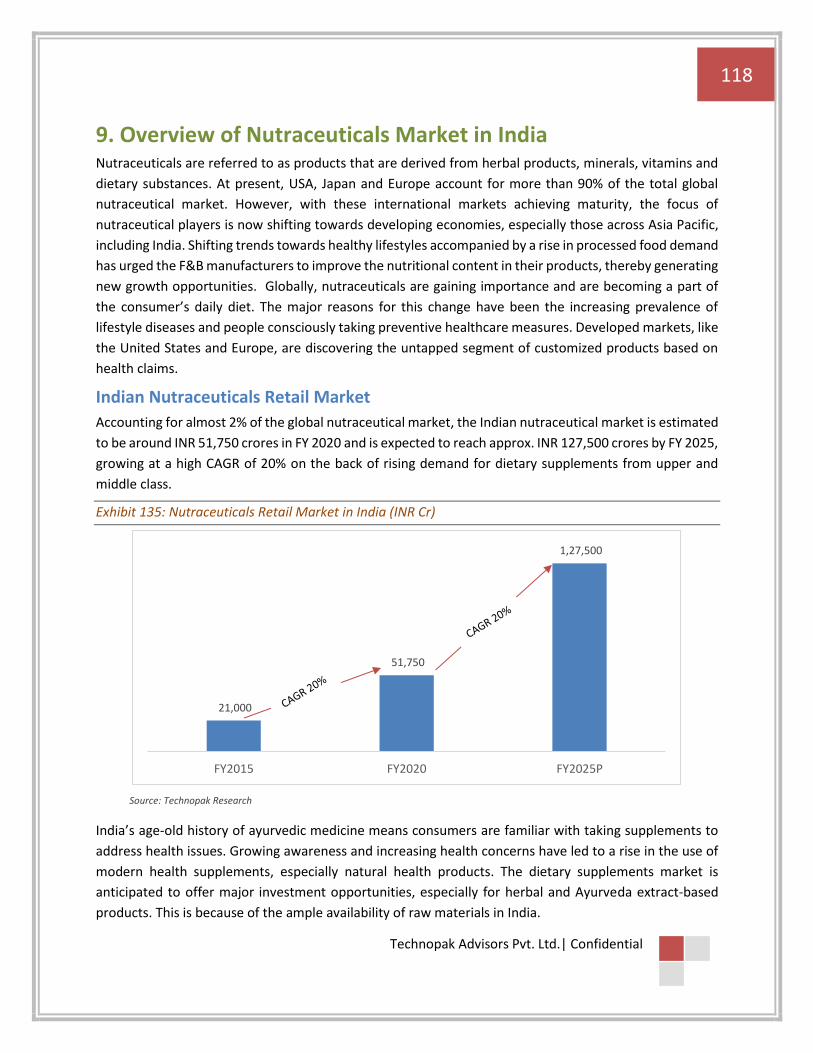
118
Technopak Advisors Pvt. Ltd.| Confidential
9. Overview of Nutraceuticals Market in India Nutraceuticals are referred to as products that are derived from herbal products, minerals, vitamins and
dietary substances. At present, USA, Japan and Europe account for more than 90% of the total global
nutraceutical market. However, with these international markets achieving maturity, the focus of
nutraceutical players is now shifting towards developing economies, especially those across Asia Pacific,
including India. Shifting trends towards healthy lifestyles accompanied by a rise in processed food demand
has urged the F&B manufacturers to improve the nutritional content in their products, thereby generating
new growth opportunities. Globally, nutraceuticals are gaining importance and are becoming a part of
the consumer’s daily diet. The major reasons for this change have been the increasing prevalence of
lifestyle diseases and people consciously taking preventive healthcare measures. Developed markets, like
the United States and Europe, are discovering the untapped segment of customized products based on
health claims.
Indian Nutraceuticals Retail Market
Accounting for almost 2% of the global nutraceutical market, the Indian nutraceutical market is estimated
to be around INR 51,750 crores in FY 2020 and is expected to reach approx. INR 127,500 crores by FY 2025,
growing at a high CAGR of 20% on the back of rising demand for dietary supplements from upper and
middle class.
Exhibit 135: Nutraceuticals Retail Market in India (INR Cr)
Source: Technopak Research
India’s age-old history of ayurvedic medicine means consumers are familiar with taking supplements to
address health issues. Growing awareness and increasing health concerns have led to a rise in the use of
modern health supplements, especially natural health products. The dietary supplements market is
anticipated to offer major investment opportunities, especially for herbal and Ayurveda extract-based
products. This is because of the ample availability of raw materials in India.
21,000
51,750
1,27,500
FY2015 FY2020 FY2025P
119
Technopak Advisors Pvt. Ltd.| Confidential
India is experiencing a spate of lifestyle changes and a corresponding rise in lifestyle diseases, including
diabetes, high blood pressure, obesity and cardiovascular problems. This has increased the demand for
nutritional supplements among upper and middle-class consumers. Nutraceutical intake is growing in
popularity as consumers look for products to boost energy and health, especially given the current COVID-
19 situation. The demand for dietary supplements such as tablets, capsules, powders, liquids, soft caps
and soft gels is increasing.
India is a global pharmaceutical hub with its ability to manufacture high-quality & low-cost generic drugs.
Nutraceutical manufacturing uses many of the similar technologies as the pharmaceutical industry, and
low cost, high quality manufacturing makes India a global leader in the nutraceutical products. India is the
third largest producer of Active Pharmaceutical Ingredient and has over hundred large contract
manufacturers in nutraceuticals which has not only opened a huge opportunity for new FDI (Foreign Direct
Investment) but has also leveraged the overall growth of the industry.
Growth Drivers
• Compensation for unhealthy lifestyles: Failure to adhere to a nutritionally balanced diet has
resulted in an increased demand for nutraceuticals to meet nutritional needs. Along with surge in
demand for dietary supplements in order to address various deficiencies, there is an increased
demand of functional foods which combine the benefit of food and nutrients.
• Growth in Non-Communicable Disease: The rise in incidences of heart diseases, lifestyle
disorders, cancer, respiratory disease & diabetes coupled with increasing share of nutraceuticals
in doctor’s prescription have led to increase in consumption.
• Impact of COVID-19: The growing demand for natural immunity-boosting products during the
COVID-19 has accelerated the growth of the nutraceuticals industry during this period. High
growth was registered during FY 2021 in the sales of vitamins & minerals especially with vitamin
C & D that help in boosting immunity.
• Government Policy Push towards Manufacturing: Under ‘Make in India’ initiative, the
government has been focussing on creating pharma manufacturing infrastructure and scale
within India thereby reducing imports and bolstering India’s strength of manufacturing.
• Increase in Awareness: Increased awareness regarding nutritional care and has made the
nutraceutical market more visible and have urge to take preventive steps
o Rapid digitalization and increase in social media usage have led to high growth in the
sector
o Players and influencers have extensively used the social media platforms for product
advocacy.
o Players like Healthkart, a dietary supplements & health devices online store has promoted
largely through online media advertisement (Facebook, Google & other ad networks).
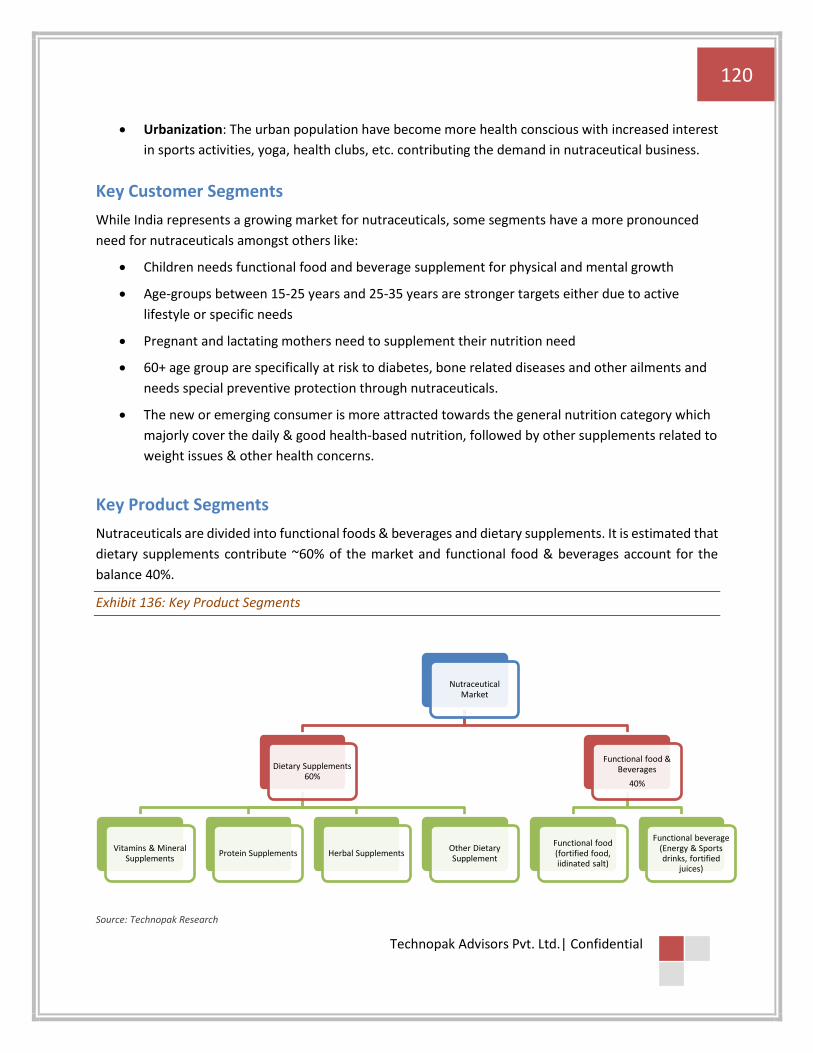
120
Technopak Advisors Pvt. Ltd.| Confidential
• Urbanization: The urban population have become more health conscious with increased interest
in sports activities, yoga, health clubs, etc. contributing the demand in nutraceutical business.
Key Customer Segments
While India represents a growing market for nutraceuticals, some segments have a more pronounced
need for nutraceuticals amongst others like:
• Children needs functional food and beverage supplement for physical and mental growth
• Age-groups between 15-25 years and 25-35 years are stronger targets either due to active
lifestyle or specific needs
• Pregnant and lactating mothers need to supplement their nutrition need
• 60+ age group are specifically at risk to diabetes, bone related diseases and other ailments and
needs special preventive protection through nutraceuticals.
• The new or emerging consumer is more attracted towards the general nutrition category which
majorly cover the daily & good health-based nutrition, followed by other supplements related to
weight issues & other health concerns.
Key Product Segments
Nutraceuticals are divided into functional foods & beverages and dietary supplements. It is estimated that
dietary supplements contribute ~60% of the market and functional food & beverages account for the
balance 40%.
Exhibit 136: Key Product Segments
Source: Technopak Research
Nutraceutical Market
Dietary Supplements 60%
Vitamins & Mineral Supplements
Protein Supplements Herbal SupplementsOther Dietary Supplement
Functional food & Beverages
40%
Functional food (fortified food, iidinated salt)
Functional beverage (Energy & Sports drinks, fortified
juices)
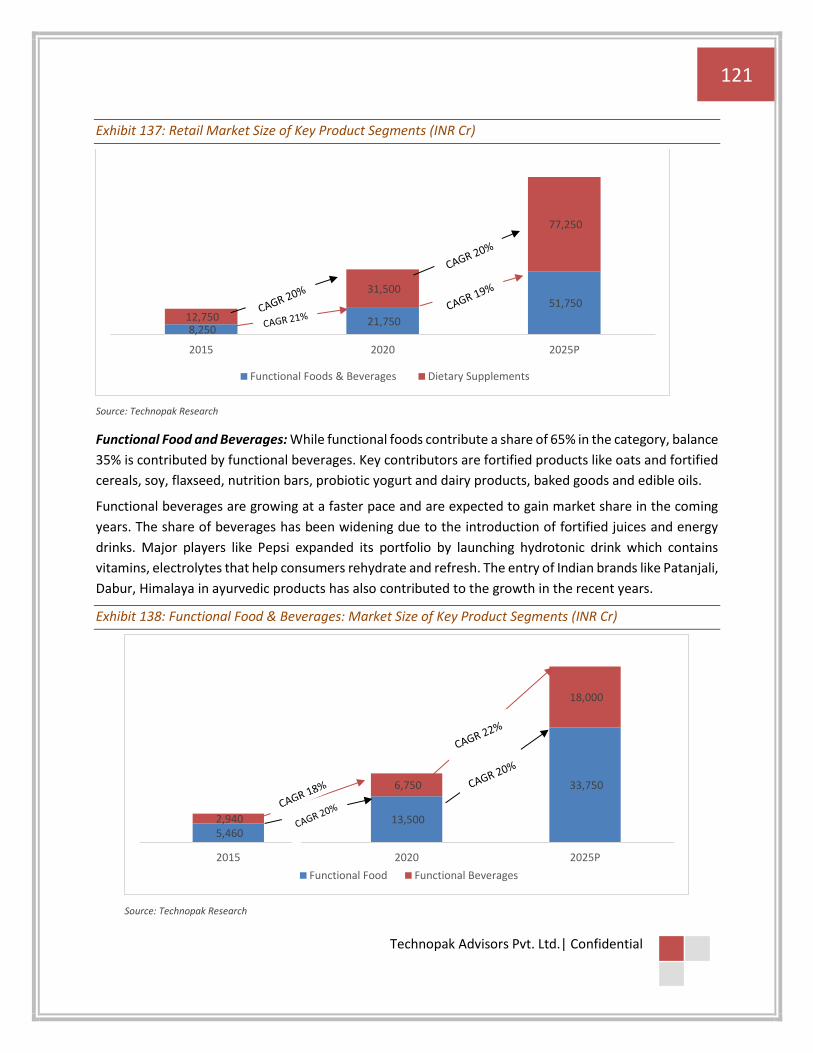
121
Technopak Advisors Pvt. Ltd.| Confidential
Exhibit 137: Retail Market Size of Key Product Segments (INR Cr)
Source: Technopak Research
Functional Food and Beverages: While functional foods contribute a share of 65% in the category, balance
35% is contributed by functional beverages. Key contributors are fortified products like oats and fortified
cereals, soy, flaxseed, nutrition bars, probiotic yogurt and dairy products, baked goods and edible oils.
Functional beverages are growing at a faster pace and are expected to gain market share in the coming
years. The share of beverages has been widening due to the introduction of fortified juices and energy
drinks. Major players like Pepsi expanded its portfolio by launching hydrotonic drink which contains
vitamins, electrolytes that help consumers rehydrate and refresh. The entry of Indian brands like Patanjali,
Dabur, Himalaya in ayurvedic products has also contributed to the growth in the recent years.
Exhibit 138: Functional Food & Beverages: Market Size of Key Product Segments (INR Cr)
Source: Technopak Research
8,250 21,750
51,750 12,750
31,500
77,250
2015 2020 2025P
Functional Foods & Beverages Dietary Supplements
5,460 13,500
33,750
2,940
6,750
18,000
2015 2020 2025P
Functional Food Functional Beverages

122
Technopak Advisors Pvt. Ltd.| Confidential
Dietary Supplements: Dietary supplements contribute around 60% of the nutraceuticals market in India
with an estimated retail sale of INR 31,500 crores in FY 2020. Vitamins and minerals are the major
contributors followed by herbal supplements and proteins.
Exhibit 139: Dietary Supplements: Market Size of Key Product Segments (INR Cr)
Source: Technopak Research
Dietary Supplements are further segmented as:
• Medical nutrition – Nutrition to meet condition/disease specific goals with formulations such as tablet, capsules and powders, products like diabetic nutrition, dialysis nutrition, bone health, anemics
• Sports nutrition – Nutrition to meet performance enhancement goals with formulations like protein powders, capsules and liquids, products like, energy supplements and mass/muscle gainers.
• General nutrition – Nutrition for overall health & general wellness with formulations like
tablet, capsules and powders, products like weight management, multi-vitamins & beauty
products for men & women.
Consumers looking for good health and daily nutrition are the major buyers in the nutraceutical
segments followed by consumers with health concerns and weight issues.
5,100 12,750
30,900
3,825
8,250
23,175
3,188
8,250
19,313
638
2,250
3,863
2015 2020 2025P
Vitamins & Minerals Herbal Supplements Proteins Others
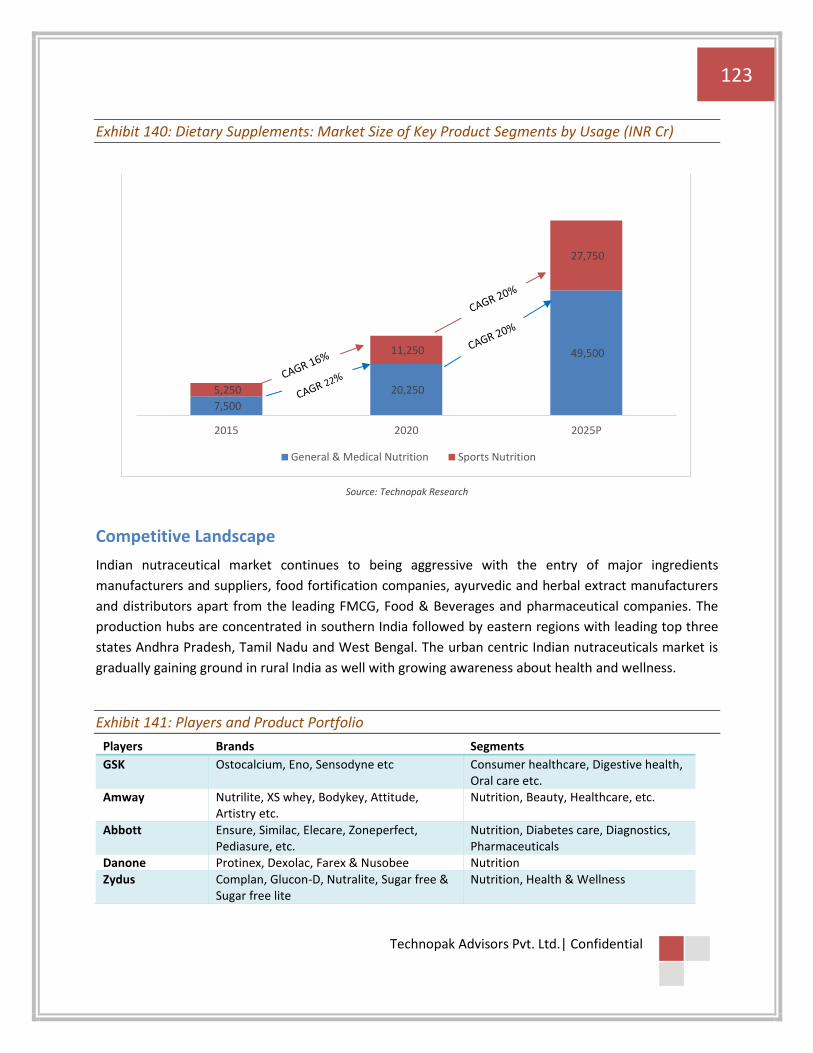
123
Technopak Advisors Pvt. Ltd.| Confidential
Exhibit 140: Dietary Supplements: Market Size of Key Product Segments by Usage (INR Cr)
Source: Technopak Research
Competitive Landscape
Indian nutraceutical market continues to being aggressive with the entry of major ingredients
manufacturers and suppliers, food fortification companies, ayurvedic and herbal extract manufacturers
and distributors apart from the leading FMCG, Food & Beverages and pharmaceutical companies. The
production hubs are concentrated in southern India followed by eastern regions with leading top three
states Andhra Pradesh, Tamil Nadu and West Bengal. The urban centric Indian nutraceuticals market is
gradually gaining ground in rural India as well with growing awareness about health and wellness.
Exhibit 141: Players and Product Portfolio
Players Brands Segments
GSK Ostocalcium, Eno, Sensodyne etc Consumer healthcare, Digestive health, Oral care etc.
Amway Nutrilite, XS whey, Bodykey, Attitude, Artistry etc.
Nutrition, Beauty, Healthcare, etc.
Abbott Ensure, Similac, Elecare, Zoneperfect, Pediasure, etc.
Nutrition, Diabetes care, Diagnostics, Pharmaceuticals
Danone Protinex, Dexolac, Farex & Nusobee Nutrition
Zydus Complan, Glucon-D, Nutralite, Sugar free & Sugar free lite
Nutrition, Health & Wellness
7,500
20,250
49,500
5,250
11,250
27,750
2015 2020 2025P
General & Medical Nutrition Sports Nutrition
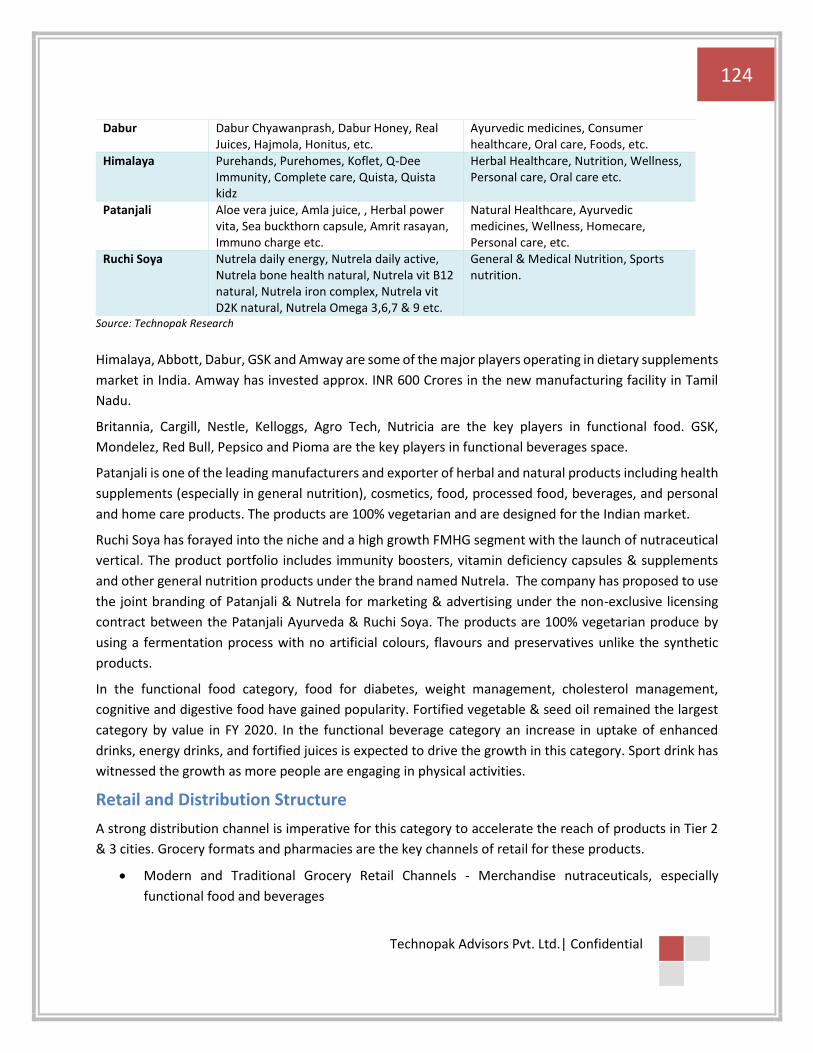
124
Technopak Advisors Pvt. Ltd.| Confidential
Dabur Dabur Chyawanprash, Dabur Honey, Real Juices, Hajmola, Honitus, etc.
Ayurvedic medicines, Consumer healthcare, Oral care, Foods, etc.
Himalaya Purehands, Purehomes, Koflet, Q-Dee Immunity, Complete care, Quista, Quista kidz
Herbal Healthcare, Nutrition, Wellness, Personal care, Oral care etc.
Patanjali Aloe vera juice, Amla juice, , Herbal power vita, Sea buckthorn capsule, Amrit rasayan, Immuno charge etc.
Natural Healthcare, Ayurvedic medicines, Wellness, Homecare, Personal care, etc.
Ruchi Soya Nutrela daily energy, Nutrela daily active, Nutrela bone health natural, Nutrela vit B12 natural, Nutrela iron complex, Nutrela vit D2K natural, Nutrela Omega 3,6,7 & 9 etc.
General & Medical Nutrition, Sports nutrition.
Source: Technopak Research
Himalaya, Abbott, Dabur, GSK and Amway are some of the major players operating in dietary supplements
market in India. Amway has invested approx. INR 600 Crores in the new manufacturing facility in Tamil
Nadu.
Britannia, Cargill, Nestle, Kelloggs, Agro Tech, Nutricia are the key players in functional food. GSK,
Mondelez, Red Bull, Pepsico and Pioma are the key players in functional beverages space.
Patanjali is one of the leading manufacturers and exporter of herbal and natural products including health
supplements (especially in general nutrition), cosmetics, food, processed food, beverages, and personal
and home care products. The products are 100% vegetarian and are designed for the Indian market.
Ruchi Soya has forayed into the niche and a high growth FMHG segment with the launch of nutraceutical
vertical. The product portfolio includes immunity boosters, vitamin deficiency capsules & supplements
and other general nutrition products under the brand named Nutrela. The company has proposed to use
the joint branding of Patanjali & Nutrela for marketing & advertising under the non-exclusive licensing
contract between the Patanjali Ayurveda & Ruchi Soya. The products are 100% vegetarian produce by
using a fermentation process with no artificial colours, flavours and preservatives unlike the synthetic
products.
In the functional food category, food for diabetes, weight management, cholesterol management,
cognitive and digestive food have gained popularity. Fortified vegetable & seed oil remained the largest
category by value in FY 2020. In the functional beverage category an increase in uptake of enhanced
drinks, energy drinks, and fortified juices is expected to drive the growth in this category. Sport drink has
witnessed the growth as more people are engaging in physical activities.
Retail and Distribution Structure
A strong distribution channel is imperative for this category to accelerate the reach of products in Tier 2
& 3 cities. Grocery formats and pharmacies are the key channels of retail for these products.
• Modern and Traditional Grocery Retail Channels - Merchandise nutraceuticals, especially
functional food and beverages
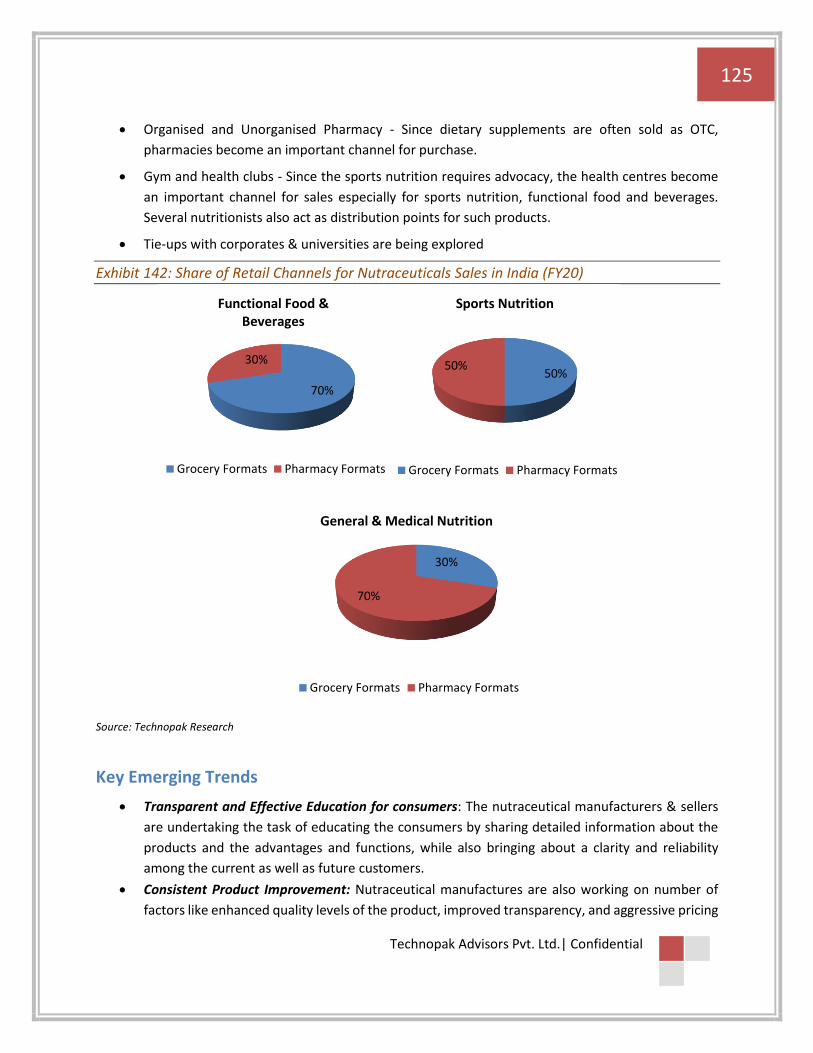
125
Technopak Advisors Pvt. Ltd.| Confidential
• Organised and Unorganised Pharmacy - Since dietary supplements are often sold as OTC,
pharmacies become an important channel for purchase.
• Gym and health clubs - Since the sports nutrition requires advocacy, the health centres become
an important channel for sales especially for sports nutrition, functional food and beverages.
Several nutritionists also act as distribution points for such products.
• Tie-ups with corporates & universities are being explored
Exhibit 142: Share of Retail Channels for Nutraceuticals Sales in India (FY20)
Source: Technopak Research
Key Emerging Trends
• Transparent and Effective Education for consumers: The nutraceutical manufacturers & sellers
are undertaking the task of educating the consumers by sharing detailed information about the
products and the advantages and functions, while also bringing about a clarity and reliability
among the current as well as future customers.
• Consistent Product Improvement: Nutraceutical manufactures are also working on number of
factors like enhanced quality levels of the product, improved transparency, and aggressive pricing
70%
30%
Functional Food & Beverages
Grocery Formats Pharmacy Formats
50%50%
Sports Nutrition
Grocery Formats Pharmacy Formats
30%
70%
General & Medical Nutrition
Grocery Formats Pharmacy Formats
126
Technopak Advisors Pvt. Ltd.| Confidential
to widen the consumption. Manufacturers too are coming up with new and better products that
are 100% natural, vegetarian, without artificial colours, flavours & preservatives, has plant-based
nutrition with no side effects.
Opportunity for new players: High cost and long-time frames of product development are entry
barriers for new players. However, the Food Safety and Standards Authority of India (FSSAI) have
been working on regulations for nutraceuticals in India which are at par with international
standards. This is expected to open avenues for new entrepreneurs to enter the nutraceutical
field. It will also open opportunities for foreign investments.
Key Challenges
• Fragmented Industry: Fragmented nature of the market both from demand & supply
perspective. This is so as every player has identified niche for themselves.
• Regulatory Challenges: Fluidity in policy from product definitions and approvals to health claims
and manufacturing standards.
• Counterfeit products: The Indian nutraceutical market grapples with a problem of counterfeit and
fraudulent products which confuse the consumer and dents their trust for such products.
• Pricing: High prices limit their adoption in the Indian market and restrict it to the urban markets.
• Tailored products: The Indian consumer preferences include vegetarianism, Halal or Hindu dietary practices and the traditional remedies reflecting social and cultural diversity. It is important for brands to be mindful that the demand for a product may vary according to dietary preference or religion.

127
Technopak Advisors Pvt. Ltd.| Confidential
10. Overview of Palm Plantation Sector
Global Overview of Palm Plantation Sector
Palm oil is the highest consumed vegetable oil in the world with almost 41% of the share of total global
consumption, followed by soy (31.4%) and mustard (16.7%). Growing demand for palm oil and derivatives
from major markets like India, China, European Union (“EU”) and Indonesia has contributed to palm oil
becoming the most popular edible oil at a global level. The global palm oil market is estimated to be USD
87 billion in CY 2020, growing at a CAGR of 6.0% during the forecast period CY 2020-2025 and to reach
USD 116 billion in CY 2025. Palm Oil is an edible vegetable oil that is derived from the mesocarp (reddish
pulp) of the fruit of the oil palms. Two types of oil can be produced, crude palm oil is extracted from the
fleshy fruit and palm kernel oil is extracted by crushing the kernel or the stone in the middle of the fruit.
Palm Plantation is carried out globally with certain focus in some areas. Indonesia, Malaysia, and Thailand
are some of the countries with highest area under palm plantation. Globally, nearly 28 million hectares of
land is under palm plantation, which produces approximately 411 million tonnes of FFB every year.
Indonesia is also the global leader in palm plantation and crude palm oil production. Indonesia has 14.7
million hectares of land under palm plantation and produces 245.56 million tonnes of FFB every year.
Yield in terms of FFB (fresh fruit bunch) production per hectare per year is 16.74 tonnes per hectare.
Malaysia has 5.2 million hectares under plantation and produces 99.07 million tonnes of FFB every year.
Exhibit 143: Countries having Area under Palm Plantation (CY 2020)
Country Crude Palm Oil Production
Quantity (000’ MT)
Percentage of World Production
FFB Production (Million Tonnes)
Area under Plantation
(Million Hectares)
FFB production per hectare per
year
Indonesia 43,500 58.0% 245.63 14.7 16.74
Malaysia 19,600 26.1% 99.07 5.2 18.99
Thailand 3,100 4.1% 16.77 0.9 18.71
Colombia 1,559 2.1% 8.39 0.5 16.64
Nigeria 1,280 1.7% 10.03 3.9 2.55
Guatemala 865 1.2% 3.27 0.2 17.39
Honduras 580 0.8% 2.34 0.2 11.69
Papua New Guinea 561 0.7% 2.68 0.2 13.51
Brazil 540 0.7% 2.58 0.2 14.56
India 200 0.3% 16.3 0.3 4.9
Others 3,215 4.3% 4.3 2.1 Not Available
Total 75,000 100% 411.3 28.3 Not Available Source: USDA, FAOSTAT
Enterprise value of Indonesia lies between $8,000 - $17,000 per hectare and that of Malaysia between
$14,000 - $23,000 per hectare. Malaysia commands premium valuation vis-à-vis Indonesia due to several
factors. Malaysian companies also often have cutting-edge R&D capabilities in-house that have led to
higher FFB yields and more efficient chemical operations relative to their Indonesian and African
128
Technopak Advisors Pvt. Ltd.| Confidential
counterparts. Also, Malaysian firms exhibit higher incidences of horizontal and vertical integration and
diversification relative to their Indonesian and African counterparts.
Exhibit 144: Enterprise Value per hectares of Key Oil Palm producing countries (CY 2020)
Source: Technopak Research
Global Players in Palm Plantation:
Malaysia and Indonesia are global leaders in the palm oil production and palm plantation. These countries
have been cultivating palm fruits for decades now and house some of the globally leading companies in
the palm plantation sector.
Country Enterprise Value per hectare Yield (CPO in MT per hectare per
year) Indonesia $8,000 - $17,000 3.3
Malaysia $14,000 - $23,000 3.8
Africa & Other Asian Countries $7,000 - $10,000 2.7

Exhibit 145: Key Global Palm Plantation Companies
United Plantations Berhad
SIMP Group
Wilmar International (Part of Kuok
Group)
Sime Darby IOI
Corporation FGV Holdings
Berhad Sumatera Plantation
Origin Country Malaysia Indonesia Singapore Malaysia Malaysia Malaysia Indonesia
Started In 1906 1992 1991 2007 1969 2007 1911
Core Business Cultivation of Oil Palm & Coconuts
Agribusiness group with palm
as key crop
Integrated Agribusiness
Company
Industrial, motors and
logistic sectors as well as
healthcare and insurance segments
Plantation, manufacturing
segments
Plantation, Sugar Logistics
Rubber and Palm Oil
Production
Area under mature plantation
42,636 hectares
2,11,626 hectares
2,05,229 hectares
6,03,145 hectares
176,909 hectares
275,262 hectares
51,443 Hectares
Area under immature plantation
4,009 hectares 41,435 hectares 34,748 hectares 1,10,292 hectares
30,053 hectares
59,842 hectares
7,470 hectares
No of Countries present in
2 1 12 14 6 9 Not Available
Key Countries Present in
Malaysia, Indonesia Indonesia Russia, China,
Malaysia, India etc.
China, Macau, Taiwan, etc.
Malaysia, Netherlands,
USA, Ghana etc.
Malaysia, USA, France, Turkey
etc.
Not Available
CPO Production (2020)
0.2 Million MT 1.7 Million MT Not Available Not Available 0.7 Million MT 3 Million MT 0.1 Million MT
No of Refinery 2 5 Not Available 11 2 6 1
No of Palm Oil Mills
5 27 Not Available
72 15 68 5
Integration of Operations
Integrated Integrated Integrated Integrated Integrated Integrated Integrated
Revenue from Plantation Division
USD 82 Million USD 0.2 Billion NA USD 889.6
Million USD 0.4 Billion USD 2.7 Billion Not Available
Source: Technopak Research
Key Growth Drivers
• Cheapest form of vegetable oil: Palm oil being the cheapest vegetable oil has led to rise in in-home
consumption as well as consumption by food processing industry and HORECA segment. Increasing
consumer focus on health & wellness along with undesirable health effects of partially hydrogenated
oils is driving food industry and HORECA segment to switch towards palm oil.
• Diversified end uses of palm oil: In addition to being consumed as edible oil, palm oil has various
applications, such as animal feed, biodiesel, consumer goods, and industrial uses (oleochemicals). This
has led to increase in the requirement of palm oil globally.
• Sustainable development of palm plantations: Measures are being taken by the industry and the
policy makers globally for the sustainable development of palm plantation
Key Challenges
Growing concerns regarding deforestation and greenhouse gas emission: There is growing concern
about palm plantation being responsible for deforestation in many parts of the world. Forests have been
cut down to meet the increasing land requirement for palm plantations. More than a third of large-scale
oil palm expansion between 1990 and 2010 has contributed to forest cover loss (about 3.5 million hectares
in total) in Indonesia, Malaysia and Papua New Guinea. Activities associated with forest clearing leads to
high greenhouse gas emission.
Palm Oil considered unhealthy: Some research and studies suggest that palm oil is unhealthy owing to
high saturated fats. However, there is still limited/ no evidence to prove the same.
Overview of Palm Plantation in India
India consumes approximately 22 million MT of edible oil every year. Palm oil being the most consumed
edible oil contributes 42% to the total consumption of edible oil in India.
India completes the yearly demand of palm oil mainly through imports and partially through domestic
production. 97% of demand of palm oil in India is met through imports and rest 3% is met through
domestic production. Hence, it becomes extremely crucial for India to increase domestic production of
palm oil to decrease its dependence on imports.
Evolution of Palm Plantation in India
Oil palm was introduced in India at National Royal Botanical Gardens, Kolkata during the year 1886. The
Maharashtra Association for Cultivation of Sciences (MACS), Pune later introduced African dura palms
along canal bunds, home gardens and, to some extent, in forest lands near Pune during 1947 to 1959.
Large scale planting of oil palm was launched from 1971 to 1984 in Kerala by Plantation Corporation of
Kerala Ltd. (subsequently taken over by Oil Palm India Ltd.) and Andaman Forest and Plantation
Development Corporation Ltd., in Little Andaman Islands of Andaman and Nicobar Islands during 1976 to
1985.

131
Technopak Advisors Pvt. Ltd.| Confidential
The Government of India introduced oil palm during 1985-86 as small holders’ crop under irrigated
conditions. Oil Palm Development Programme (OPDP) was launched during 1991-92 under the
“Technology Mission on Oilseeds and Pulses” (TMOP) with a focus on area expansion in the states of
Andhra Pradesh, Karnataka, Tamil Nadu, Orissa, Gujarat and Goa. From 2004-05 onwards, the scheme
was being implemented as part of the “Integrated Scheme of Oilseeds, Pulses, Oil Palm & Maize”
(ISOPOM) and provides support for Oil Palm cultivation in 12 states viz, Andhra Pradesh, Assam, Gujarat,
Goa, Karnataka, Kerala, Maharashtra, Mizoram, Orissa, Tamil Nadu, Tripura, & West Bengal. Under
ISOPOM, support is provided for planting material, cultivation cost, installation of drip irrigation system,
diesel pump sets, training, development of waste land and technology transfer through demonstration
and publicity.
State wise Palm Plantation in India
In India, Palm Plantation was started in 1990s. Post that, there has been a constant increase in the total area under palm plantation. In FY 2018, 0.3 million hectares of land was under Palm plantation, which produced 16.3 million tonnes of FFB. There had been an increase of 14,482 hectares of land under palm plantation during FY 2018. In FY 2017, 12.8 million tonnes of FFB was produced in comparison to 16.3 million in FY 2018.
According to Ministry of Agriculture and Farmers welfare, the total oil palm potential area in India is 1.93 million hectares and 3.5 lakh hectares (October 2019) was under cultivation across 16 states. Hence there is huge potential for palm oil plantation in India and opportunity for players to increase domestic palm plantation and reduce dependency on imports.
Andhra Pradesh is the leader in palm plantation in India with 0.16 million hectares of land under palm plantation and produced 14.2 million FFB in FY 2018. Telangana and Karnataka have 18,312 and 43,517 hectares of land under palm plantation, respectively. These three states together contribute nearly 68% of the land under palm plantation in India.
Exhibit 146: State wise Data of Palm Plantations (FY 2018)
State Area – Ha FFB Production (MT) CPO Production (MT)
Andhra Pradesh 1,62,689 14,27,827 2,34,695
Telangana 18,312 1,47,516 27,274
Karnataka 43,517 12,917 2,224
Tamil Nadu 30,900 6,983 938
Gujarat 5,797 853 -
Goa 953 3,217 581
Odisha 21,777 4,965 618
Tripura 530 Not Available Not Available
Assam 1,849 Not Available Not Available
Kerala 5,785 30,220 5,191
Maharashtra 1,474 Not Available Not Available
Mizoram 28,295 4,796 626
Chhattisgarh 4,222 Not Available Not Available

132
Technopak Advisors Pvt. Ltd.| Confidential
Andaman & Nicobar 1,593 Not Available Not Available
Arunachal Pradesh 1,416 Not Available Not Available
Nagaland 1,973 Not Available Not Available
Total 3,31,082 16,39,294 2,72,147 Source: National Mission on Oilseeds and Oil Palm
The government of India has also laid emphasis on promoting oil palm cultivation in north-eastern states
through revised funding patterns of the GOI scheme to the state governments. The funding pattern which
is 60:40 in case of general states is 90:10 in case of North-Eastern states, where former denotes the central
government share and latter denotes the state govt share in funding. As per the ICAR – IIOPR
Reassessment Committee Report, six north-eastern states – Mizoram, Arunachal Pradesh, Meghalaya,
Tripura, Nagaland, Assam – together have a potential area of 218,000 hectares for palm oil crops but less
than 20 percent from this was under plantation (till October 2019).
Key challenges of palm cultivation in the north-eastern states are the hilly and undulating topography,
limited availability of flat land and small landholding of farmers with limited resources in addition to
challenges like long gestation period, price instability due to fluctuation in international prices and
competition with crops faced by other states as well.
Indian Context vis a vis Global Context
In India, the business model of palm plantations is asset light vis a vis asset heavy model in other countries.
In global context, palm plantation companies own the land, produce and cultivate palm as per their needs.
As land is owned by companies in other countries, hence they have the asset heavy model.
However, in Indian context, government allocates the zone to private companies who wish to do palm
cultivation, but the land in these zones continue to belong to farmers and the farmers cultivate the crops
of their choice. Hence, as the land is owned by farmers in India and not by the company, it is an asset light
model. Also in Indian context, as the farmers own the land, they have the liberty to choose which crop to
grow. Hence companies or private players reach out to the farmers in their allocated zone and convince
farmers to take up oil palm plantation and provide them with support for doing so. Moreover, a player
cannot operate outside the zone allocated to it. In each zone, area that can be used for palm plantation
is specified and players must adhere to norms and guidelines by the state government. Ruchi Soya has
one of the highest allocation for oil palm cultivation i.e., 2.99 Lakh hectares. However, Ruchi Soya has
engaged with farmers in their allocated zone to bring 54,763 ha area under palm plantation.
While palm plantations in India are owned by small marginal farmers, palm plantations are owned by
industries in Indonesia and Malaysia. Palm plantations are owned by large industries having economies of
scale enabling them to scale up faster.

133
Technopak Advisors Pvt. Ltd.| Confidential
Oil Palm Plantation Lifecycle
Lifecycle of Palm Oil Plantation
• Stage 1: - Pre-Plantation Phase
Pre-Plantation Phase which takes approximately 2 years before they are planted in the field.
Initially they are grown in nurseries in poly bags and then transported to the field. The following
are some of the processes to be followed before plantation:
o Land Testing: Initially soil, water and suitability testing of the land is carried out to check the
suitability of land for palm plantation.
o Nursery Development: Thereafter nurseries are setup up and inspected by DIA.
o Sprout Procurement: Once the inspection is done, seed sprouts are procured.
The entire process generally takes 4-6 months.
o Raising Oil Palm seedlings in Nursery: Primary nursery is raised by planting germinated
sprouts in a pre-nursery bed or in polybags in a primary nursery. This process takes 3 months
o Once the plants reach a five-leaf stage, they are transported to a large secondary nursery.
Here they are grown in large poly bags and they remain here for nearly 9 months
• Stage 2: - Field Planting
The land should be prepared for oil palm plantings at least 3 months before transplanting the
seedlings to the main field. In soils with low permeability, drainage channels are to be constructed
to prevent water stagnation in upper layer of soil. After this, well grown seedlings of 12-14 months
old are planted. At this point, a well-developed seedling has a height of 1-1.3 m from base and
more than 13 functional leaves.
Once the seedlings are planted, it takes 36-48 months to bear fruit. Seedlings at this initial period
are called immature plants. When seedling grows in age, they are described by different names
such as young plantation or mature plantation etc.
Seedlings are not sown in random pattern, but they follow 9 meter gap rule. Seedlings are planted
in such a way that distance between any two seedlings is 9 meter and any three seedlings form
an equilateral triangle of 9 meter length. This pattern of seedling planting helps in inter-cropping
in palm plantations. Intercropping is a very important aspect of palm plantation, because for first
three years, there is no income from palm fruits because they are immature. Hence, for this initial
period farmers often go for intercropping to earn for first few years.

134
Technopak Advisors Pvt. Ltd.| Confidential
Exhibit 147: Lifecycle of Palm Plantation
Age (in years) * Name
0 – 4 Immature
5 – 9 Mature - Young
10 – 18 Mature - Stable
19 – 25 Old Source: Technopak Research
* Age is considered once seedling are planted
The yield of the palm plants depends on the maturity level of the plants. For 0-4 years, when the
seedling is immature, it does not yield fruit. It starts yielding fruit in mature- young stage but the
yield is quite low in this period. Yield reaches its optimum for 10-18 years when the palm plant is
mature-stable. After 18-20 years, palm plant is categorized as old and during this phase the yield
starts decreasing. After 25 years, the yield decreases to much lower levels and during this phase
new plants are being planted.
Economics of Oil Palm Plantation Lifecycle
Cost Structure Oil Palm Plantation Farmers
Oil palm plantation has a gestation period of 4 years. During the first four years, palm plantation does not
yield any fruit and hence there is no earning for the farmer. During the third and fourth year, even if the
plantation yield fruits, the yield is too low. Hence for the first four years, income is negligible but both
variable and fixed costs are incurred.
When the plantation reaches to the young stage (5-9 years), yield increases comparing to first four years,
but yield is still not the highest. From 5th year, income starts increasing till 9th year. From 9th year onwards,
the palm plantation yield is to its highest level and income becomes steady till 25th year.
Also, there are various subsidies given by government in initial years of Palm plantation so as to encourage
farmers to take up palm plantation. Planting material subsidy of INR 12,000 per hectare and Drip Irrigation
subsidy of INR 24,035 is provided by government at the start of palm plantation. Also, Input subsidy of
INR 5,000 per hectare is provided for four starting years.
Exhibit 148: Returns from oil palm plantation for farmers during pre-bearing period (1st to 4th year), per hectare
Particulars 1st Year 2nd Year 3rd Year 4th Year
Total Variable Cost 26,931 11,347 13,551 14,301
Total Fixed Cost 9,919 9,993 10,369 7,838
Total Cost (V+F) 36,850 21,340 23,920 22,138

135
Technopak Advisors Pvt. Ltd.| Confidential
Gross Income - - 929 13,469
Planting Material Subsidy
12,000 - - -
Drip Irrigation Subsidy
24,035 - - -
Input Subsidy 5,000 5,000 5,000 5,000
Net Income 4,185 -16,340 -17,991 -3,669 Source: Technopak Research
All values are in INR
Exhibit 149: Returns from oil palm plantation for farmers during bearing period (5th to 25th year), per hectare
Particulars 5th year 6th year 7th year 8th year 9th year 10-25th
year
Total Variable Cost 14,503 14,276 14,740 15,249 16,381 16,381
Total Fixed Cost 11,843 13,983 17,016 18,584 20,295 20,295
Total Cost (V+F) 26,347 28,259 31,756 33,834 36,676 36,676
Gross Income 29,492 38,052 50,183 56,456 63,298 63,298
Net Income 3,145 9,793 18,427 22,622 26,622 26,622 Source: Technopak Research
All values are in INR
Key growth drivers for palm plantation sector in India
• Oil Palm is the highest oil yielding perennial crop
With good planting material, irrigation and proper management, oil palm has the potential to
produce 20-25 MT fresh fruit bunches (FFB) per hectare after attaining the age of 5 years. This in
turn can yield 4-5 MT of palm oil and 0.4-0.5 MT palm kernel oil (PKO). In comparative terms, yield
of palm oil is 2-7 times the yield of edible oil obtainable from traditional oilseeds
• Large Potential Area for Cultivation
Various Committees constituted by Department of Agriculture, Cooperation and Farmers Welfare
(DAC& FW) have identified 19.33 lakh ha area suitable for oil palm cultivation in the country
including 2.18 lakh ha area in the North-Eastern States
• Involvement of Private Entrepreneurs
State Governments have involved about 15 private entrepreneurs includingGodrej Agrovet Pvt.
Ltd., Ruchi Soya Industries, Food, Fats & Fertilizers andShivasais Oil Palm Ltd for developing oil
palm seedling nurseries and processing mills in their respective states. These companies have
signed Memorandum of Understanding (MoU) with the State Governments who in turn have

136
Technopak Advisors Pvt. Ltd.| Confidential
allocated area/ Mandals / Districts to the companies for new plantations. The companies have
established nurseries in their allocated zone for developing seed gardens of oil palm from seed
sprouts of indigenous as well as of exotic origin which takes about 10-12 months. They also extend
technical support to the farmers for development of oil palm plantation
Key challenges for Farmers & Processors
• Key Challenges for farmers:
o High Initial investment and longer gestation period in comparison to other short terms
crops
o No income for first 4 years with longer lifecycle of crop (once planted, then for next
season farmer cannot go for planting other crops. Complete trees need to be uprooted
if farmer intends to grow other crop), limited awareness of agronomic practices,
Irrigation infrastructure, etc.
• Key challenges for processors:
o High investment is required by processors to enter the business and it also possess high
risk. Moreover, there is limited support from government to undertake high risk business
o This is a highly regulated sector with myriad central and state government regulations
o One of the challenges for processors is that once FFB is collected from the plant, it
should be processed in crushing mill within 48 hours
o As private players or processors need to engage with large number of small and marginal
farmers, hence operational costs are very high
o Also, OER is decided by state government and may not reflect actual OER achieved by
mills
Key Challenges for Palm Plantation Sector in India
• Long Gestation Period
One of the key constraints for farmers undertaking palm plantation is the long gestation period
that restricts income flow for 3-5 years and high cost of irrigation. Considering much of the land
holdings are by marginal farmers, challenges remain high as they are not able to sustain without
steady income during the initial 3-5 years. Declining ground water level and erratic monsoons
pose additional challenges for the farmers. The palm plantation faces competition from other
economically viable crops such as rubber, arecanut, sugarcane, banana, coconut etc.
• Irregular monsoons and declining ground water level
Palm plantations requires large and continuous supply of water for cultivation. Two major sources
of water i.e., Ground water and monsoons both are not sustainable options for farmers. Erratic
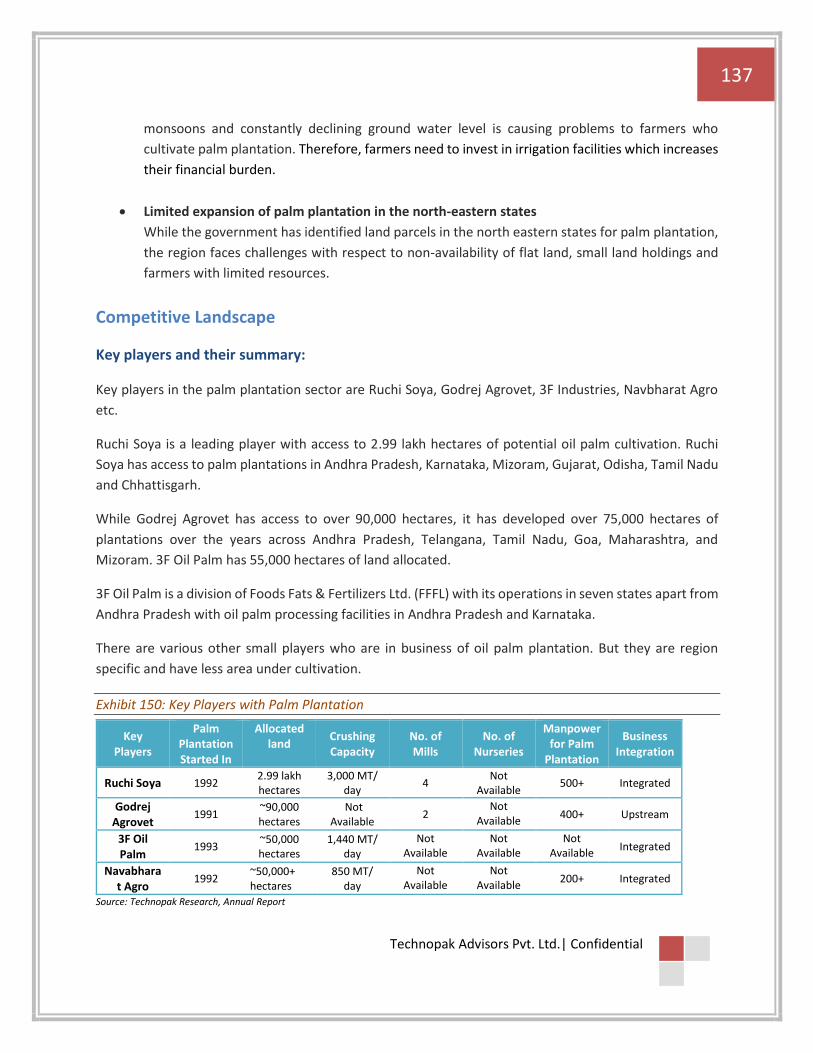
137
Technopak Advisors Pvt. Ltd.| Confidential
monsoons and constantly declining ground water level is causing problems to farmers who
cultivate palm plantation. Therefore, farmers need to invest in irrigation facilities which increases
their financial burden.
• Limited expansion of palm plantation in the north-eastern states
While the government has identified land parcels in the north eastern states for palm plantation,
the region faces challenges with respect to non-availability of flat land, small land holdings and
farmers with limited resources.
Competitive Landscape
Key players and their summary:
Key players in the palm plantation sector are Ruchi Soya, Godrej Agrovet, 3F Industries, Navbharat Agro
etc.
Ruchi Soya is a leading player with access to 2.99 lakh hectares of potential oil palm cultivation. Ruchi
Soya has access to palm plantations in Andhra Pradesh, Karnataka, Mizoram, Gujarat, Odisha, Tamil Nadu
and Chhattisgarh.
While Godrej Agrovet has access to over 90,000 hectares, it has developed over 75,000 hectares of
plantations over the years across Andhra Pradesh, Telangana, Tamil Nadu, Goa, Maharashtra, and
Mizoram. 3F Oil Palm has 55,000 hectares of land allocated.
3F Oil Palm is a division of Foods Fats & Fertilizers Ltd. (FFFL) with its operations in seven states apart from
Andhra Pradesh with oil palm processing facilities in Andhra Pradesh and Karnataka.
There are various other small players who are in business of oil palm plantation. But they are region
specific and have less area under cultivation.
Exhibit 150: Key Players with Palm Plantation
Key Players
Palm Plantation Started In
Allocated land
Crushing Capacity
No. of Mills
No. of Nurseries
Manpower for Palm
Plantation
Business Integration
Ruchi Soya 1992 2.99 lakh hectares
3,000 MT/ day
4 Not
Available 500+ Integrated
Godrej Agrovet
1991 ~90,000 hectares
Not Available
2 Not
Available 400+ Upstream
3F Oil Palm
1993 ~50,000 hectares
1,440 MT/ day
Not Available
Not Available
Not Available
Integrated
Navabharat Agro
1992 ~50,000+ hectares
850 MT/ day
Not Available
Not Available
200+ Integrated
Source: Technopak Research, Annual Report
138
Technopak Advisors Pvt. Ltd.| Confidential
Benefits of Integrated Operation vis a vis Standalone Operation: -
A vertically integrated model refers to the end-to-end supply chain being owned by the company itself –
the company owns the process of manufacturing, supply, distribution, retail etc.
There are four parts of the supply chain that a company must own to become vertically integrated
company:
• Oil palm plantations that produce oil palm fruit or have zone allocated to them (in case of India)
• Milling plants that produce crude oil from the fruit
• Refinery plants to refine the crude oil into consumable form
• Consumer products division that distributes and retails the final product
There are many benefits of having an integrated operation in oil palm plantation business.
1. Control over the entire supply chain: - This is the most critical benefit of the integrated business in
palm plantation. When a company controls the entire supply chain, it controls the entire operations.
It can plan its goals and strategies and achieve them due to full control over raw materials and they
do not have to depend over the suppliers
2. Stability of Earnings: - When a company owns both the plantations and refinery/milling plants, it can
easily hedge the costs involved. While rise in the price of palm oil fruit has a negative impact on the
refinery/milling plants, it is beneficial for the palm oil plantations hence cost risk is hedged
Indian Players with Integrated Operations
In India, Ruchi Soya is one of the key players with high integration capabilities. Ruchi Soya has zones
allocated by the government and have land under palm cultivation which provides a continuous source of
raw materials. It also has its own crushing and refining mills for extraction of oil from palm FFB. Ruchi Soya
also has consumer products division for marketing and sales of products.
Critical success factors for players operating in Oil Palm Business
Oil palm plantation has high barriers to entry as it takes long years for the plantation to yield fruits. Players
such as Ruchi Soya, Godrej Agrovet etc. have decades of experience in this segment. There are several
critical factors which ensures success in the oil palm plantation business. Some of them are as follows:
• Establishing a palm plantation business includes high initial costs and long duration before it starts
yielding fruits. Hence, this business poses high entry barriers for new players.
• Transportation cost is one of the most critical factors in the oil palm plantation and refining
business since the FFBs have to be transferred to the processing mill within 48 hours. If a company
is not able to keep a check on the transportation costs, then it becomes difficult to manage profits.
There are two main routes of transportation for this segment. One is the transportation of palm

139
Technopak Advisors Pvt. Ltd.| Confidential
fruit from Indian plantations to the mills and refineries. Second is the transportation of crude palm
oil from ports to mills and refineries. Hence a company should have optimal positions of their
plantations and refineries/milling plants to reduce transportation costs.
• Having vertically integrated operations is another critical factor for success in the oil palm
business. Vertically integrated operations allow control over entire supply chain and helps in
strategic planning of goals for the player.
• Government support for increasing domestic edible oil production is very critical for success in
palm plantation. Financial and R&D support from government both for farmers and processors is
quite critical for success. Subsidies, policies, and Acts help and motivates farmers to undertake
palm cultivation, which in turn helps players to increase palm oil production.
• Considering the large potential area available for palm plantation in India, entry of several large
corporate will ensure faster growth
• Due to myriad regulations by both centre and state government, it becomes challenging for
private players to undertake area expansion on pan India basis; hence there is need for a
centralized body to frame all regulations and monitor the sector rather than distributed
ownership
• Having high quality seed sprouts is quite crucial for this business. But as these seed sprouts are
imported, which increase cost and time. Hence there is need for high quality seed sprouts
domestic availability
• Other facilities such as irrigation infrastructure, along with other support infrastructure such as
roads in catchment area, electricity connection, farmer bank accounts etc. are quite crucial
• Moreover, government should extend technical and extension support, farm mechanization
support specific to oil palm. Also dedicated R&D institutions are required for oil palm cultivation
Regulatory Framework
Policies with respect to oil palm plantation
Over the past few years, the Indian government has taken a series of steps to increase its palm oil production but a series of factors such as water shortage and impact on groundwater, small landholdings and long gestation period has discouraged its large-scale adoption.
Apart from providing financial assistance to farmers, the government is also trying to involve private players in developing oil palm seedling nurseries and processing mills in their respective states. Some of these players have already signed a Memorandum of Understanding (MoU) with the states who in turn have allocated zones for new plantations. The companies are establishing nurseries in their allocated zone.
140
Technopak Advisors Pvt. Ltd.| Confidential
Subsidies available to farmers and processors
Special Programme on Oil Palm Area Expansion (OPAE) under Rashtriya Krishi Vikas Yojana (RKVY) A special initiative was undertaken under RKVY during 2011-12 for implementation of a Special
Programme on Oil Palm Area Expansion (OPAE) to augment the production of palm oil by 2.5 to 3.00 lakh
tonnes in the next 5 years. The objective of the program was to undertake area expansion in 60000
hectares during 2011-12 through Special Programme on Oil Palm Area Expansion (OPAE) under RKVY.
National Mission on Oilseeds and Oil Palm (NMOOP) Under the MM-II of NMOOP, financial assistance was being provided to the farmers @ 85% cost of the
planting material (Rs. 12000/ - per ha) and @ 50% cost of the other components like maintenance cost of
new plantations for four years (Rs. 20000/ - per ha), inputs for inter-cropping in oil palm during gestation
period (Rs. 20000/ - per ha) , installation of drip - irrigation systems, diesel/electric pump-sets, bore-well
(Rs. 50000/ - per unit), water harvesting structures/ponds, construction of vermi-compost units and
purchase of machinery & tools etc.
During the 12th Five Year Plan, a new National Mission on Oilseeds and Oil Palm (NMOOP) was launched
under which Mini Mission-II (MM-II) is dedicated to oil palm area expansion and productivity increases.
MM-II of NMOOP is being implemented in 12 States viz; Andhra Pradesh, Telangana, Chhattisgarh, Tamil
Nadu, Kerala, Gujarat, Karnataka, Odisha, Mizoram, Nagaland, Assam and Arunachal Pradesh w.e.f.
01.04.2014.
Policies & measures adopted by other countries to support Oil Palm Plantation
Sustainable Palm Oil Initiative Established in 2012, the Sustainable Palm Oil (SPO) Initiative is an alliance between the Government
of Indonesia (GoI), the United Nations Development Programme (UNDP), the private sector and other
non-government partners that aims to address key challenges in Indonesia’s palm oil sector such as
deforestation and improving the livelihoods of smallholder farmers.
Koprasi Kredit Primer Anggota (KKPA) KKPA was launched by Indonesian government in 1988, to improve farmers’ ability to cultivate palm oil. This scheme was funded in part by World Bank loans and Asian development bank. This scheme promoted the formation of farmers cooperatives. The cooperatives served as intermediaries between the company (who allocated land) and smallholders who owned plasma plots (palm plots for small holders). In case of Indonesia, the government has stimulated oil palm expansion in various ways, initially in the form of plantations since 1970s. For a considerable time, the government played a direct role in stimulating investments in oil palm plantations through state agencies (with direct interventions in service provision, institutional support, agricultural extension, access to land and capital, etc.).
141
Technopak Advisors Pvt. Ltd.| Confidential
In late 1970s, Indonesian government established a scheme called Nucleus Estate Scheme (NES), whereby state-owned plantation companies (the ‘nucleus’) helped farmers (namely plasma farmers) to grow oil palm. The plantation companies provided seedlings, technical assistance, and financing to small holders. Their crops would be purchased by companies’ mills. The policy was not implemented for solely plantation development; it was linked and integrated with other policy objectives: population redistribution through resettlement schemes or transmigration
Future Outlook
Going forward, palm plantation is expected to gain scale in India. India has a large potential of 1.93
million hectares of identified land for oil palm cultivation. It is expected that there will be expansion of
palm plantation through existing players and new entrants. Considering the government’s focus on
reducing import dependency for palm oil, the sector is expected to get further support from the
government in terms of steps regarding zone allocation, financial supports for farmers etc.

142
Technopak Advisors Pvt. Ltd.| Confidential
Disclaimer
• This information package is distributed by Technopak Advisors Private Limited (hereinafter
“Technopak”) on a strictly private and confidential and on ‘need to know’ basis exclusively to the
intended recipient. This information package and the information and projections contained
herein may not be disclosed, reproduced or used in whole or in part for any purpose or furnished
to any other person(s). The person(s) who is/are in possession of this information package or may
come in possession at a later day hereby undertake(s) to observe the restrictions contained
herein.
• Only leading players are profiled and benchmarked for the purpose of the report and does not
necessarily cover all types of players.
• The information contained herein is of a general nature and is not intended to address the facts
and figures of any particular individual or entity. The content provided here treats the subjects
covered here in condensed form. It is intended to provide a general guide to the subject matter
and should not be relied on as a basis for business decisions. No one should act upon such
information without taking appropriate additional professional advice and/or thorough
examination of the particular situation. This information package is distributed by Technopak
upon the express understanding that no information herein contained has been independently
verified. Further, no representation or warranty (expressed or implied) is made nor is any
responsibility of any kind accepted with respect to the completeness or accuracy of any
information as maybe contained herein. Also, no representation or warranty (expressed or
implied) is made that such information remains unchanged in any respect as of any date or dates
after those stated here in with respect to any matter concerning any statement made in this
Information package. Technopak and its directors , employees, agents and consultants shall have
no liability (including liability to any person by reason of negligence or negligent misstatement)
for any statements, opinions, information or matters (expressed or implied) arising out of,
contained in or derived from, or of any omissions from the information package and any liability
whatsoever for any direct, indirect, consequential or other loss arising from any use of this
information package and/or further communication in relation to this information package.
• All recipients of the information package should make their own independent evaluations and
should conduct their own investigation and analysis and should check the accuracy, reliability and
completeness of the information and obtain independent and specified advice from appropriate
professional adviser, as they deem necessary.

143
Technopak Advisors Pvt. Ltd.| Confidential
Authors of the Report
Ankur Bisen Senior Vice President
Madhulika Tiwari Vice President
Rashi Gupta Senior Consultant
Puneet Arora Senior Consultant
Yashovardhan Khemka Associate Consultant
Himanshu Yadav Associate Consultant
www.technopak.com
Technopak Advisors Pvt. Ltd.
Lemon Tree Hotel (Corporate Park) 5A and 5B, 5th Floor, Block A,
Village Ullhawas, Tehsil Wazirabad, Sector 60, Gurgaon-122011
T : +91.124.454 1111 I [email protected]
Corporate Identification Number: U74140DL1994PTC61818
Ankur Bisen Senior Vice President