Mathematical modelling of slow pyrolysis of segregated solid wastes in a packed-bed pyrolyser
12
Mathematical modelling of slow pyrolysis of segregated solid wastes in a packed-bed pyrolyser Yao Bin Yang * , Anh N Phan, Changkook Ryu, Vida Sharifi, Jim Swithenbank Sheffield University Waste Incineration Centre (SUWIC), Department of Chemical and Process Engineering, Sheffield University, Mappin Street, Sheffield, S1 3JD, United Kingdom Received 24 January 2006; received in revised form 27 June 2006; accepted 4 July 2006 Available online 18 August 2006 Abstract Waste segregation is being explored as one of the potential effective ways for waste management, where wastes are separated for either recycling or energy recovery. In this paper, three segregated wastes, contaminated waste wood, cardboard and waste textile are pyrolysed in a slow-heating packed-bed reactor for the purpose of solid, liquid and gas recovery. The effect of final temperature was investigated and product yields and compositions were measured. Mathematical modelling was employed to simulate the heat, mass transfer and kinetic processes inside the reactor. Both a parallel reaction model and a function group model were used to predict the product yields as well as their compositions. Char yield of 21–34%, tar 34–46% and gas 23–43% were obtained. It is found that packed-bed pyrolysis produces 30–100% more char compared to standard TGA tests and the local heating rate across the packed-bed reactor differs remark- ably from the programmed wall-heating rate and varies greatly in both time and space. Mathematical modelling suggests that wood has higher tar cracking ability than cardboard and textile wastes during pyrolysis, and the effects of mineral contents in the fuel need to be explored. CO 2 , CO, tar and water are the main released species during the major stage of the pyrolysis processes which occurs between 250 and 450 °C, whereas noticeable quantity of hydrogen and light hydrocarbons is observed only at higher temperature levels and at the final stage. Ó 2006 Elsevier Ltd. All rights reserved. Keywords: Segregated wastes; Slow pyrolysis; Mathematical modelling 1. Introduction Waste management is a big issue nowadays as wastes are being generated in an ever-increasing rate by growing afflu- ent societies. Disposal of the massive waste materials poses problems in terms of environmental impact, economic costs and technology implementation. The old-fashioned ‘cheap’ landfill is discouraged as the dumped wastes can contaminate underground as well as surface water and release harmful ‘green-house’ gases directly to atmosphere, apart from occupying precious land spaces. Alternative ways of waste disposal are reuse, recycling and thermal or biological converting. One of the difficult points facing policy makers is probably choosing between recycling of material and recovery of energy. By material recycling, wastes replace virgin materials and this could also save energy if the production processes that use recovered mate- rial are less energy-consuming than those using virgin material; by energy recovery, wastes are converted to heat or/and electricity, replacing other fuels and with ash as the only left-over which is greatly reduced in both mass and volume and can be disposed at minimum cost. Different waste materials have different physical, thermal and chem- ical properties and which method is the most appropriate depends on careful classification based on set criteria. For example [1], cardboard can save 23% net energy when it is burned while it can only save 16% net energy when it is recycled, showing that material recovery of cardboard is 0016-2361/$ - see front matter Ó 2006 Elsevier Ltd. All rights reserved. doi:10.1016/j.fuel.2006.07.012 * Corresponding author. Tel.: +44 114 2227523; fax: +44 1142227501. E-mail address: y.b.yang@Sheffield.ac.uk (Y.B. Yang).
Transcript of Mathematical modelling of slow pyrolysis of segregated solid wastes in a packed-bed pyrolyser

Mathematical modelling of slow pyrolysis of segregatedsolid wastes in a packed-bed pyrolyser
Yao Bin Yang *, Anh N Phan, Changkook Ryu, Vida Sharifi, Jim Swithenbank
Sheffield University Waste Incineration Centre (SUWIC), Department of Chemical and Process Engineering,
Sheffield University, Mappin Street, Sheffield, S1 3JD, United Kingdom
Received 24 January 2006; received in revised form 27 June 2006; accepted 4 July 2006Available online 18 August 2006
Abstract
Waste segregation is being explored as one of the potential effective ways for waste management, where wastes are separated for eitherrecycling or energy recovery. In this paper, three segregated wastes, contaminated waste wood, cardboard and waste textile are pyrolysedin a slow-heating packed-bed reactor for the purpose of solid, liquid and gas recovery. The effect of final temperature was investigatedand product yields and compositions were measured. Mathematical modelling was employed to simulate the heat, mass transfer andkinetic processes inside the reactor. Both a parallel reaction model and a function group model were used to predict the product yieldsas well as their compositions. Char yield of 21–34%, tar 34–46% and gas 23–43% were obtained. It is found that packed-bed pyrolysisproduces 30–100% more char compared to standard TGA tests and the local heating rate across the packed-bed reactor differs remark-ably from the programmed wall-heating rate and varies greatly in both time and space. Mathematical modelling suggests that wood hashigher tar cracking ability than cardboard and textile wastes during pyrolysis, and the effects of mineral contents in the fuel need to beexplored. CO2, CO, tar and water are the main released species during the major stage of the pyrolysis processes which occurs between250 and 450 �C, whereas noticeable quantity of hydrogen and light hydrocarbons is observed only at higher temperature levels and at thefinal stage.� 2006 Elsevier Ltd. All rights reserved.
Keywords: Segregated wastes; Slow pyrolysis; Mathematical modelling
1. Introduction
Waste management is a big issue nowadays as wastes arebeing generated in an ever-increasing rate by growing afflu-ent societies. Disposal of the massive waste materials posesproblems in terms of environmental impact, economiccosts and technology implementation. The old-fashioned‘cheap’ landfill is discouraged as the dumped wastes cancontaminate underground as well as surface water andrelease harmful ‘green-house’ gases directly to atmosphere,apart from occupying precious land spaces. Alternativeways of waste disposal are reuse, recycling and thermal
0016-2361/$ - see front matter � 2006 Elsevier Ltd. All rights reserved.
doi:10.1016/j.fuel.2006.07.012
* Corresponding author. Tel.: +44 114 2227523; fax: +44 1142227501.E-mail address: [email protected] (Y.B. Yang).
or biological converting. One of the difficult points facingpolicy makers is probably choosing between recycling ofmaterial and recovery of energy. By material recycling,wastes replace virgin materials and this could also saveenergy if the production processes that use recovered mate-rial are less energy-consuming than those using virginmaterial; by energy recovery, wastes are converted to heator/and electricity, replacing other fuels and with ash as theonly left-over which is greatly reduced in both mass andvolume and can be disposed at minimum cost. Differentwaste materials have different physical, thermal and chem-ical properties and which method is the most appropriatedepends on careful classification based on set criteria.For example [1], cardboard can save 23% net energy whenit is burned while it can only save 16% net energy when it isrecycled, showing that material recovery of cardboard is

Nomenclature
Ai pre-exponent factor in ith reaction rate, s�1
Cw,g moisture concentration in the gas phase, kg m�3
Cw,s moisture concentration at the solid surface,kg m�3
Dg mass diffusion coefficients of the gaseous species,m2 s�1
dp particle diameter, mEi activation energy in ith reaction rate, kJ mol�1
Hevp evaporation heat of the moisture in solids, J/kgHg gas enthalpy, J kg�1
Hs solid-phase enthalpy, J kg�1
hs convective mass transfer coefficient between so-lid and gas, m s�1
h0s convective heat transfer coefficient between solidand gas, W m�2 K�1
k kinetic rate of reactions, s�1
pg gas pressure, paPr Prandtl numberr co-ordinate in radial direction, mR reaction rate (kg m�3 s�1), gas universal con-
stantRe Reynolds numberSa particle surface area, m2 m�3
Sc Schmidt numberSgi mass source term of gaseous species Ygi,
kg m�3 s�1
Ssj mass sources due to evaporation, devolatilisa-tion, kg m�3 s�1
Ss mass loss rate from solid, kg m�3 s�1
t time, sTenv environmental temperature, K
Tg gas temperature, KTf final pyrolysis temperature, KTs solid temperature, KVsb bed volume, m3
Vgr superficial gas velocity in the radial direction,m s�1
Vgx superficial gas velocity along the bed height,m s�1
x co-ordinate in the direction of bed height, mYgi mass fractions of gaseous species, N2, H2O, gas
and tarYsj mass fractions of particle compositions (virgin
fuel, moisture and char)Dhj heat effect for jth reaction, W m�3
e emissivityr width of distribution in activation energiesrb Boltzmann radiation constantø void fraction in the bedqg gas density, kg m�3
qsb solid bulk density in the bed, kg m�3
qs material density of solids, kg m�3
kg thermal conductivity of the gaseous phase,W m�1 K�1
ks effective thermal conductivity of the solid bed,W m�1 K�1
Subscripts
chr charvgn virgin fuelm moisture
less efficient than its incineration with energy recovery. Onthe other hand, paper recycling saves twice the net energythan incinerating. Municipal solid wastes (MSWs) are amixture of widely varied materials and the different wastecomponents have different balance between those twomethods. Therefore, it is beneficial to separate differenttypes of waste components in order to treat with the mostpreferable method.
Waste segregation is normally carried out at materialrecovery facilities (MRF). Mixture of recyclable waste isseparated by mechanical process and hand sorting. Forthose waste components from which energy recovery ismore appropriate, there are three thermal processes whichcan be employed: incineration, gasification and pyrolysis.Pyrolysis thermally decomposes the segregated wastes tochar, liquid and gas products in an inert atmosphere. Theprocess conditions can be optimised to maximise the yieldof chars, liquids or gases, each of which has a potentialapplication as a fuel. High heating rates of up to 104 K/sat temperatures <650 �C with rapid quenching favor theformation of liquid products, and these process conditions
often referred to as fast or flash pyrolysis [2,3]. Slow pyro-lysis refers to process conditions with slow heating rates(typically 5–100 �C/min) coupled with low temperatures(typically 300–700 �C), which maximise the char yield.Such process conditions can be easily achieved in furnaceswith various scales and shapes, such as fixed beds androtary kilns. Char is storable, easily transformed to powderor pellets and consumed in conventional solid fuel furnacesby combustion or by gasification. It can be also mixed withpyrolytic liquids or upgraded to activated carbon.
In this paper, pyrolysis characteristics of three segre-gated wastes, contaminated waste wood, cardboard andtextile wastes are to be studied both experimentally andtheoretically in a fixed-bed reactor at temperatures from350 to 700 �C and at a programmed heating rate around10 �C/min, with maximum particle size up to 20 ·20 · 20 mm and sample weight of 150–200 g. There havebeen studies of biomass (the major component in MSWs)pyrolysis employing thermogravimetric analysis (TGA)technique for low heating rates. For example, Jong et al.[4] studied the characteristics of pelletised Miscanthus

Nitrogen
DataLogger
To
T3
T2
T1
Water-cooled
Nitrogen
DataLogger
To
T3
T2
T1
Water-cooled
Nitrogen
Samples
TemperatureController
Oil Containers
Extraction
Furnace
Data Logger
To
T3
T2
T1
Reactor(φ12.5cmx50cm High)
Water-cooled
Condenser
Sampling
Condenser
Water-cooled
Fig. 1. Schematic of the packed-bed pyrolysis reactor with capacity of1 kg sample.
giganteus and wood using TGA coupled with Fourier trans-form infrared spectroscopy (FTIR) at heating rates of 10, 30and 100 �C/min, respectively with a final temperature of900 �C. Samples of 13–16 mg with particle size <500 lmwere pyrolised. The yields of char, tar and 17 different gas-eous species were measured. Heikkinen et al. [5] examinedthe pyrolysis characteristics of around 50 waste componentsby TGA at heating rate 20 �C/min and final temperature550 �C and for each tests, 5 mg samples were used. Theweight loss curve and the corresponding differential weightloss curve were obtained and based on this, single wastecomponents are divided into three classes: low stabilityorganic, lignocellulosic and plastic materials. Other studiesbased on TGA technique include Maki and Miura [6], Kleinand Virk [7], Domburgs et al. [8], among many others.
The advantage of employing TGA-FTIR technique isthat kinetic rate parameters and pool sizes of species pre-cursors can be fitted into experimental data in order to con-vert the TGA-FTIR results into input files to be usedwithin the functional group–devolatilisation, vaporisation,cross-linking (FG–DVC) biomass pyrolysis model (http://www.afrinc.com/products/fgdvc/default.htm). It is claimed[4] that these rates, after being extrapolated, can be used topredict via the FG–DVC model, the conversion behaviourof main compounds at higher heating rates and tempera-tures in practical conversion processes.
However, the pyrolysis processes in a practical facility,packed-bed pyrolyser for example, differ from the condi-tions of TGA-FTIR tests in two crucial ways: particle sizesare much bigger (from a few mm to tens of mm), and themass of fuels are in tens or even hundreds of kg, in steadof a few mg. In this situation, the inner-particle repolymer-isation and tar cracking in the bed become important dueto longer residence time of the tar species and larger surfaceareas; heating rate inside the bed can also be significantlydifferent from the desired or programmed heating rate. Evi-dence [9] indicated that a bed filled with charcoal at ele-vated temperature could reduce tar concentration in theexit gases by 95%. This means that the results with a fewmg sample in the TGA-FTIR tests would be different fromthe results with several kg sample in a larger facility at thesame heating conditions in terms of the yields of char, tarand gas. Besides, heating rate exerted on fuel particles isexpected to be variable across an actual pyrolysis bedand different from that in the TGA-FTIR tests where theheating rate is well controlled for the sample due to smallheat capacity. The final pyrolysis results are greatly affectedby the exerted heating rate.
Because of these reasons, tests with larger sample sizesand bigger reactors are necessary, as to be the purpose ofthis study, to reflect more realistically the pyrolysis charac-teristics of larger-scale facilities. There have been manyresearch works and pilot-scale tests on fast or flash pyroly-sis, as reviewed by Bridgewater et al. [3,10], but packed-bedlow-heating rate pyrolysis tests and related modellingworks are rare so far. Chen et al. [11], employing abatch-type pyrolysis reactor which could hold up to 500 g
sample, conducted a series of experiments with rice strawand saw dust at heating rate around 50 �C/min andassessed the effect of several operating parameters like tem-perature, heating rate, residence time, reactor configurationetc on the product gas compositions. Another work wasconducted by Ruiz et al. [12] where pyrolysis of olive stonesin different reactors was carried out. More recently, Ryuet al. [13] reported slow pyrolysis results with 3 types ofsamples, pinewood, red canary grass and waste-derivedpellets in a packed-bed reactor, but only char yields andanalysis were shown. In this work, the same pyrolysis reac-tor as in Ryu’s work was used and tests were carried outwith contaminated wood, cardboard and textile wastes,to explore the technique which might suit the waste segre-gation strategy. The resultant yields of char, tar (liquid)and gases were obtained and analysis of char as well asgas compositions were made. Mathematical modellingwork is carried out to explore the temperature profile aswell as the heating rate variation inside the reactor bed,and provides more meaningful explanation to the observedphenomena. Both a parallel pyrolysis model and a func-tion-group (FG) model were employed to predict the finalyields of each component at different final temperaturesand the composition of gas emissions.
2. Experimental set-up
The reactor system built was a batch type packed bedunit shown in Fig. 1. The stainless-steel reactor was placedinside a furnace whose inner temperature (TO) was con-trolled by a temperature controller. The reactor is 50 cmhigh with a diameter of 12.5 cm and can process up to1 kg sample. The temperatures within the reactor weremonitored by three K-type thermocouples (T1, T2 andT3). Nitrogen was supplied (2.0 l/min) from below the reac-tor to purge the volatile gases released from the sampleduring pyrolysis. Increasing nitrogen flow rate can reducethe residence time of pyrolysis species in the bed and hencesubdue the re-polymerisation processes, affecting the final

char, oil and gas yields. The volatile gases and nitrogenleaving the reactor passed through two water-cooled con-densers to separate tar vapour from the gas stream. Tarwas collected in a disposable plastic container at the bot-tom of each trap. The concentrations of gas products pastthe condensers were monitored by using a CO/CO2/O2 gasanalyser and by taking samples for further analysis using agas chromatograph.
At the beginning of a pyrolysis experiment, the reactorwas charged with fresh feed, typically 150–200 g in weight.The top surface of the bed reached the level of T2. Then thereactor was placed inside the furnace and heated up to atarget temperature at a heating rate of 10 �C/min. Oncethe temperature attained the set value at T1, it was main-tained for 2 h to allow sufficient time to finish pyrolysis.After cooling the reactor to room temperature, the charwas collected from the reactor, weighed and prepared forcharacterisation using the ultimate analysis, proximateanalysis and a bomb calorimeter. The two oil containerswere also disconnected from the traps and weighted.
Additional tests using TGA were also carried out tocompare with the packed-bed pyrolysis reactor tests. Forthe TGA teats, sample of around 13 mg was pyrolysedfor each run and the heating rate was set at 10 �C/min.
Three segregated waste fuels were used: waste woodfrom building demolition (contaminated with wood treat-ment chemicals), cardboard from goods packing and textilewastes from cloth disposal. The textile contains 30% poly-mer and 70% cotton. Table 1 shows their chemical andphysical properties.
Table 1Chemical and physical properties of the tested samples
Wastewood
Cardboard Textile
Moisture (wt%) 7.5 2.7 3.6Volatile (wt%) 79.7 80.4 89.0Ash (wt%) 0.1 5.7 0.5Fixed carbon (wt%) 12.7 11.2 6.9Carbon (wt%) 47.9 41.7 43.3Hydrogen (wt%) 6.2 6.4 6.2Oxygen (wt%) 38.3 43.5 46.5S (ppm) 226 1200 1110P (ppm) 48.4 94.4 39Zn (ppm) 77.2 334 35K (ppm) 844 123 91.7Na (ppm) 469 948 392Mg (ppm) 50.2 669 172Ca (ppm) 3700 9420 1170Al (ppm) 1080 3760 984Fe (ppm) 802 403 1950Cu (ppm) 53.2 477 31.7Mn (ppm) 58.2 43.6 10Cr (ppm) 15.8 3.71 6.67Ba (ppm) 18.3 50 15Sr (ppm) 10 16 5.17LCV (MJ/kg) 16.0 15.7 16.0Particle size Cube, 2 cm 4 mm · 20 mm
· 20 mm1 mm · 50 mm· 50 mm
Packed density 272 kg/m3 72 kg/m3 131 kg/m3
3. Mathematical modelling
There are two types of models that are mostly used tosimulate solid-fuel pyrolysis: parallel reaction models andfunction-group, depolymerisation, vaporisation, cross-linking (FG-DVC) model. The FG-DVC model is advo-cated by Advanced Fuel Research, Inc. (AFR) in USA(http://www.afrinc.com/products/fgdvc/default.htm) andwas originally developed for coal pyrolysis. The modelcombines two previously developed models, a functionalgroup (FG) model [14,15] and a depolymerisation–vapori-sation–cross-linking (DVC) model [16,17]. The DVCsubroutine is employed to determine the amount andmolecular weight of macromolecular fragments, the light-est of which evolves as tar. The FG subroutine is used todescribe the gas evolution and the elemental and functionalgroup compositions of the tar and char. The reaction ratesare assumed to follow first-order kinetics with distributedactivation energy of width r. In particular the rate constantki for release of the ith functional group (also called: pool)is given by an Arrhenius expression of the form [3]
ki ¼ Ai exp �Ei � ri
RT
� �ð1Þ
where Ai is the pre-exponential factor, Ei is the activationenergy and ri the width of distribution in activationenergies.
Although the FG-DVC model can provide very detailedinformation on product yields as well as their composi-tions, it has been mostly validated at high heating ratesand otherwise against TGA tests and FTIR results in thecase of lower heating rates. Direct application of the FG-DVC model data to large particles and fuel batches mayencounter difficulty due to secondary cracking of tar andrepolymerisation both inside a pyrolysing particle and onthe activated outer-surfaces of other particles, which cansignificantly increase the char yield and subsequentlyreduce tar production. Later in the study, it will be shownthat char yield can increase as much as 30–100% in thepacked-bed pyrolyser compared to standard TGA testson which the FG-DVC model data are based. Parallel reac-tion models, on the other hand, provide a much simplertool to predict the distribution of char, tar and gases undermore realistic conditions, but the elemental composition ofeach products are not predicted. Parallel reaction modelsare also known as two-stage, semi-global models [18] andwas originated and improved by a number of researchers[19–21 and 22]. In the model, the virgin material is consid-ered as a homogeneous single species and reaction productsare grouped into gas, tar and char. The virgin fuel under-goes thermal degradation according to primary reactionsgiving as products gas, tar and char. Tar may undergo sec-ondary reactions in the gas/vapour-phase within the poresof the solid matrix, related either to cracking, to give lighthydrocarbons, or to repolymerisation to give char, as illus-trated in the following:

Waste fuel
Char
Tar
Gas
Char
Gas
k1
k2
k3
k4
k5
The two-stage parallel reaction model has been used byJanse et al. [23] and Di Blasi [24], among others, to inves-tigate the product distribution of wood fast pyrolysis forsingle particles of 0.1–6 mm.
In this study, both the two-stage parallel reaction modeland the FG model are employed to take advantage of theirrespective benefits. The kinetic parameters in the parallelreaction model are optimised to best fit the measured yieldsof char, tar and gas in the packed-bed tests, while theparameters in the FG model are adopted from publishedliterature [3] without any change. The FG model is usedto calculate the composition of released species for theconditions of the TGA tests, and can be qualitativelycompared to the packed-bed measurements. Theoreticalmodels can be integrated into a global set of heat and masstransfer equations in a packed-bed of solids, which arebased on the works of Yang et al. [25–32] for packed-bedfuel conversion. If the packed-bed is assumed to be ahomogeneous porous medium, the following equationscan be deduced accordingly for the gas phase
Continuity:
oð/qgÞot
þoð/qgV gxÞ
oxþ
oð/qgV grÞror
¼ Ss ð2Þ
x-Momentum:
oð/qgV gxÞot
þoð/qgV gxV gxÞ
oxþ
oð/qgV grV gxÞror
¼�opg
oxþF ðV gxÞ
ð3Þr-Momentum:
oð/qgV grÞot
þoð/qgV gxV grÞ
oxþ
oð/qgV grV grÞror
¼�opg
rorþF ðV grÞ
ð4Þ
The function F(Vgi,i=x,r) accounts for bed resistance to thegas flow and can be calculated by using Ergun equation[27].
The gas-phase species transport equation can be writtenas
oð/qgY giÞot
þoð/qgV gxY giÞ
oxþ
oð/qgV grY giÞror
¼ o
oxDg
oð/qgY giÞox
� �þ o
rorrDg
oð/qgY giÞor
� �þ Ssi þ Sgi
ð5Þ
where Ygi represent mass fractions of purging nitrogen,evaporated moisture, evolved gas and tar in the total gasflow respectively.
The energy equation for the gas phase in the bed isexpressed as
oð/qgH gÞot
þoð/qgV gxH gÞ
oxþ
oð/qgV grH gÞror
¼ o
oxkg
oT g
ox
� �þ o
rorrkg
oT g
or
� �þSah0sðT s�T gÞþ
XDhj
ð6Þ
For the solid phase, the following equations are applied.Volume shrink due to mass loss to the gas phase
dðqsbV sbÞdt
¼ �Ss ð7Þ
Energy conservation:
dðqsbH sÞdt
¼ o
oxks
oT s
ox
� �þ o
rorrks
oT s
or
� �
þ Sah0sðT g � T sÞ þX
Dhi ð8Þ
Species conservation:
dðqsbY sjÞdt
¼ �Ssj ð9Þ
Ysj represents solid components including virgin fuel, mois-ture and char.
Thermal conductivity of a solid particle is assumed to befunction of particle density and temperature [33,34] and theextra radiative contribution is proportional to temperatureto power of 3 [34,35], so that the effective thermal disper-sion coefficient of the porous solid phase is
ks ¼ ð1� /Þðqs=4511Þ3:5T 0:5s þ 2:27� 10�7dp
e2� /
� �T 3
s
ð10ÞHeat transfer coefficient between gas and solid phase iscalculated as follows [36]:
h0s ¼ nkgð2þ 1:1Pr1=3Re0:6Þ=dp ð11Þwhere n accounts for the effect of moisture and volatile re-lease on the gas-to-solid heat transfer and is taken as 0.10.
The rate of moisture release from solids can be expressedas
Revp ¼ SahsðCw;s � Cw;gÞ when T s < 100 �C ð12aÞ
or
Revp ¼ Qcr=H evp when T s ¼ 100 �C ð12bÞ
Qcr includes both convection and radiation heat transferand is expressed as
Qcr ¼ Sa h0sðT g � T sÞ þ erb T 4env � T 4
s
� �� �ð13Þ
The convective mass transfer coefficient, hs, is calculated as[36]
hs ¼ Dgð2þ 1:1Sc1=3Re0:6Þ=dp ð14Þ

Table 2Kinetic parameters from literature for ki = Ai exp(�Ei/RT) (i = 1,5) in the parallel reaction model
Primary reactions A1 (s�1) E1 (kJ/mol) A2 (s�1) E2 (kJ/mol) A3 (s�1) E3 (kJ/mol)
Turner and Mann [20] 5.16 · 106 84.0 1.48 · 1010 112.7 2.66 · 1010 106.5Chan et al. [21] 1.08 · 107 121 2.0 · 108 133 1.3 · 108 140Font et al. [22] 2.98 · 103 73.1 5.85 · 106 119 1.52 · 107 139.2
Secondary (tar cracking) reactions A4 (s�1) E4 (kJ/mol) A5 (s�1) E5 (kJ/mol) Dh1 = Dh1 = Dh3 = � 418 kJ/kgChan et al. [21]
Liden et al. [38] 1.0 · 106 107 4.28 · 106 107 Dh4 = Dh5 = 42 kJ/kgKoufopanos et al. [39]
Table 3Optimised kinetic parameters used in this work for ki = Ai exp(�Ei/RT) (i = 1,5) in the parallel reaction model
A1 (s�1) E1 (kJ/mol) A2 (s�1) E2 (kJ/mol) A3 (s�1) E3 (kJ/mol) Tar cracking
Contaminated wood 7.0 · 106 121 2.0 · 108 133 1.3 · 108 140 ONCardboard 2.0 · 107 121 6.0 · 107 133 1.5 · 108 140 OFFTextile waste 1.08 · 107 121 8.0 · 107 133 2.0 · 108 140 OFF
The formation rate of char, tar and gas from pyrolysis pro-cess can be written respectively as
Rchar ¼ qsbY vgnk1 þ /qgY tark4
¼ qsbY vgnA1 exp � E1
RT s
� �þ /qgY tarA4 exp � E4
RT s
� �
ð15aÞRtar ¼ qsbY vgnk2 � /qgY tarðk4 þ k5Þ
¼ qsbY vgnA2 exp � E2
RT s
� �� /qgY tar A4 exp � E4
RT s
� ��
þA5 exp � E5
RT s
� ��ð15bÞ
Rgas ¼ qsbY vgnk3 þ /qgY tark5
¼ qsbY vgnA3 exp � E3
RT s
� �þ /qgY tarA5 exp � E5
RT s
� �
ð15cÞ
and the virgin fuel converting rate
Rvgn ¼ qsbY vgnðk1 þ k2 þ k3Þ ð16Þ
The above rates account for the mass source terms Ss inEqs. (2) and (7), Ssi and Sgi in Eq. (5) and Ssj in Eq. (9).The rate parameters in Eq. (14) from literature are shownin Table 2 and the optimised ones used for this work areshown in Table 3. Other property data for the modellingare estimated as / = 0.6, e = 0.8, and the material den-sity, qs is 680 kg/m3 for wood, 288 kg/m3 for cardboardand 328 kg/m3 for textile. Molecular weight of gas is31 kg/kmol and for tar it is 145 kg/kmol [23].
Boundary and initial conditions:
At t = 0: Ts = 25 �C, Yvgn = 1, Ychr = 0, Ym = (0.075,0.027 or 0.036);x = 0: Tg = 25 �C, YTAR = 0, YN2 = 1, Y H2O ¼ 0,YGAS = 0;
r/r0 = 1: Ts = 0.167t and TS 6 = Tf;r/r0 = 0: oZ/or = 0 and Z is any conserved variables inthe above equations.
Calculations of the above equations were carried outnumerically by a 2D version of the FLIC code developedby Yang et al. for packed-bed solid fuel conversion [25–32].
4. Results and discussion
4.1. Temperature profile and heating rate variation
Temperature profiles in the bed during heating up areillustrated in Fig. 2. As the wall is heated up at a rate of10 �C/min, heat is transferred from the hot wall to theinner part of the bed. As seen, temperature increase inthe central part of the bed lags behind the temperatureincrease at the wall. As a result, local temperature differsacross the bed and the difference can be as high as 200–250 �C, with the maximum non-uniformity occurs duringthe period of t = 1800–2400 s. Further on, temperatureacross the bed gradually becomes uniform, partly due tothe increased effective thermal dispersion coefficient, ks asradiation contribution increases at higher temperatures.
The measured inside-bed temperature (T1 in Fig. 1) vs.time for the three segregated wastes is also shown and com-pared to programmed wall temperature (Fig. 2(b)). Forcardboard and textile, the measured maximum temperaturedifference between the central part of the bed and the wallconforms well to the calculation shown in Fig. 2(a) in termsof the magnitude and the corresponding time period(�250 �C around t = 2000). But for contaminated wastewood, the difference is smaller (�130 �C) as well as moreconstant during the large part of heating up period. Thisis because the waste wood has a larger equivalent particlesize, and the particle surface temperature can be higherthan the particle inner temperature.

0
100
200
300
400
500
600
700
0 0.2 0.4 0.6 0.8 1r/r0
T, °
C
300s
900s
1320s
1860s
2400s
3000s
3600s
4140s
0
100
200
300
400
500
600
700
800
0 1000 2000 3000 4000 5000 6000
Time, sec
Tem
per
atu
re, °
C
Contaminatedwood
a
bTextile
Corrugatedcardboard
Programmed walltemperatureCalculated
Fig. 2. Temperature profile in the packed-bed pyrolysis reactor: (a)calculated radial temperature distribution at bed height x = 50 mm atdifferent time instants for cardboard pyrolysis; (b) measured temperaturehistory at the centre of the bed for the three segregated wastes comparedto programmed wall temperature.
8
10
12
14
16
18
1000 1500 2000 2500 3000 3500Time, sec
Lo
cal h
eati
ng
rat
e, °
C/m
in
0.85
0.76
0.61
0.47
0.33
0
0 (measured)
r /r 0 =
0.85
0.76
0.61
0.47
0.33
0
Fig. 3. Calculated and measured local heating rate variation across thebed as temperature rises from 150 to 500 �C for textile wastes atTf = 600 �C.
The temperature profiles indicate that the local heatingrate inside the bed is different from the programmed fixedrate of 10 �C/min as exerted on the reactor inner walland this is fully demonstrated in Fig. 3. It is seen that heat-ing rate at a position nearer to the heating wall undergoessmaller change over time, with a value not far away fromthe programmed rate of 10 �C/min. However, at positionsmore centrally located, r/r0 = 0.33 for example, heatingrate varies from 9 to 16 �C/min, and at the centre of thebed (r/r0 = 0), it rises from 10 to 18 �C/min for the mainpyrolysis period. It can be also seen that at any timeinstant, variation in heating rate across the bed can be ashigh as 50%.
The variation of the local heating rate inside the bed isdictated by the heat transfer mechanism where more heatis transferred to the more central part of the bed. Deducedheating rate from temperature measurement at the centre of
the bed is also shown and satisfactorily confirms the calcu-lated results. However, there is large difference between thecalculated results and measurement data at time around3000 seconds. It could be due to local collapse of the bedas devolatilisation approaches its final stage. As pyrolysisproceeds, particles loss mass and the internal structuresbecome fragile, vulnerable to gravity-caused collapse.
4.2. Mass loss history and comparison with TGA Tests
Fig. 4(a) shows the calculated mass loss history of con-taminated waste wood at final pyrolysis temperature of600 �C based on the parallel reaction model. As the tem-perature increases starting from room level, moisture inthe fuel first evaporates, as indicated by the first peak onthe mass loss rate curve between t = 0 and 1500 s. The cal-culated temperature shows a slightly slower increase thanthe measured one during this stage, perhaps due to temper-ature difference between the particle surface and the insidewhere temperature is expected to be lower. There is a per-iod of little mass loss between the completion of moistureevaporation and the onset of fuel pyrolysing until t >2000 s when the corresponding bed temperature exceeds250 �C. Subsequently, a rapid mass loss is observed andits rate peaks at t = 2800 s around T = 390 �C. Furtheron, the pyrolysis process slows down and completes att = 4000 s when temperature reaches 600 �C.
Fig. 4(a) also demonstrates the measured temperaturehistory as compared to the calculated one. To show theeffect of different final temperature on the pyrolysis pro-cesses, the calculated mass loss history at Tf = 350 �C,400 �C and 600 �C are plotted together and shown inFig. 4(b) for waste wood. It can be seen that as the pyroly-sis temperature decreases, the processes become slower andslower, and for Tf = 350 �C, the processes do not finisheven after two and half hours which compares to little morethan 1 h with Tf = 600 �C. The figure also indicates that the

0
20
40
60
80
100
120
0 1000 2000 3000 4000 5000
Time, sec
M/M
0x10
0%
Contaminated wood Cardboard Textile
TGA
Packed-bed pyrolyser
0
2
4
6
8
10
12
0 100 200 300 400 500 600
Temperature, °C
-dm
/dt,
wt%
Contaminated wood
TGA
Packed-bed pyrolyser
a
b
Fig. 5. Comparison of calculated packed-bed pyrolyser results (parallelreaction model) to TGA tests at Tf = 600 �C. (a) Mass loss history and (b)mass loss rate vs. temperature.
Contaminated wood (Tf=600 °C)
0
20
40
60
80
100
0 1000 2000 3000 4000 5000 6000
Time, sec
M/M
0 x
100
%, 1
0 x
WT
%/m
in
0
100
200
300
400
500
600
Tem
peratu
re, °C
Mass
TT-Measured
Mass loss rate
Contaminated wood
20
40
60
80
100
0 2000 4000 6000 8000Time, sec
M/M
0 x
100%
350 °C
400 °C
600 °C
a
b
Fig. 4. Calculated mass loss history (parallel reaction model) duringpyrolysis of contaminated waste wood.
final remaining proportion of mass (char) becomes signifi-cantly less as final temperature increases.
Fig. 5 shows comparison between TGA tests and thepacked-bed pyrolysis. There are two observed differenceson the mass loss curves (Fig. 5(a)): for the packed-bedpyrolyser, it takes around 35 min for the pyrolysis pro-cesses to start and the final remaining mass (char) is around24% of the original mass; for TGA tests, the onset of pyro-lysis process takes 25 min and the final remaining char isonly 8–15% of the original mass. Fig. 5(b) further revealsthe deduced pyrolysis rates vs. fuel temperature. Obviouslythe TGA test showed a curve with a narrower but higherpeak while the packed-bed pyrolyser shows a smoothercurve with a wider and lower peak. Careful examinationreveals that the corresponding peak temperature (Tpeak) is373 �C for tests with TGA and 390 �C for tests with thepacked-bed reactor. The peak temperature with TGA testis comparable to the data of Heikkinen et al. [5] (Tpeak =374 �C for hardwood and 383 �C for softwood).
The above results indicate that char yield with a packed-bed pyrolyser can be 30–100% higher than char yield fromTGA tests at the same programmed heating rate. Thiscould be due to tar cracking and repolymerisation bothinside the pyrolysing particles and on the activated outer
surface of other particles, which prevail in the packed-bed reactor during pyrolysis.
4.3. Effect of final temperature
The effect of final temperature on the yields of char, tarand gas is illustrated in Fig. 6 for both measured andcalculated results. Generally, for the three fuels char yieldfell from 31–34% of the original mass at Tf = 350 �C to21–25% at Tf = 700 �C. Tar yield ranged from 34 to 46%,and the three fuels behaved differently as temperatureincreased: for contaminated wood, tar yield varied slightlyas Tf increased from 350 to 600 �C, but decreased dramati-cally when Tf was set at 700 �C; for cardboard, there was asteady increase in tar as Tf was increased from 350 to700 �C; for textile, tar yield rose in the range of Tf = 350–500 �C, but dropped from 46% to 34% when Tf increasedto 600 �C. Gas yield is the balance of the summation of charand tar and ranged from 23% to 41% for contaminatedwood, 29–33% for cardboard and 30–43% for textile.

Contaminated wooda
b
c
10
20
30
40
50
300 400 500 600 700 800
Final temperature, °C
Final temperature, °C
Final temperature, °C
Yie
ld, w
t%Y
ield
, wt%
Yie
ld, w
t%
Tar
Gas
Char
Cardboard
25
30
35
40
45
300 400 500 600 700 800
Tar
Gas
Char
Textile
15
25
35
45
55
300 400 500 600 700
Tar
Gases
Char
Fig. 6. Effect of final temperature on product yields: (a) contaminatedwaste wood; (b) cardboard; (c) textile wastes. Symbols: measurements;lines: parallel reaction model predictions.
Under comparable situations, Chen et al. [11] experi-mented with sawdust (dp = 0.25 mm) and rice straw pellets(B2 · 10 mm). Char yield was reported in the range of19–18% for sawdust and 29–27% for rice straw as Tf chan-ged from 500 to 700 �C. The corresponding tar yield was
46–42% for sawdust and 42–38% for rice straw, and gaswas 35–40% and 29–34%, respectively. The observedresults in this study are consistent with Chen et al.’s workin terms of the range of the product yields. However, thetrends of tar yield from cardboard and textile as temper-ature increases were contrary to the results of contami-nated wood as well as the sawdust and rice straw pelletsin Chen et al.’s work: while the latter fuels showed areduction of tar yield as temperature increased, cardboardand textile showed rises in tar yield. This could indicatethat tar cracking (into both gas and char) during pyrolysisof cardboard and textile is not sufficient to offset theincrease in tar release as temperature rises. Indeed, inmodelling calculations, the tar cracking reactions had tobe switched off to enable the numerical predictions tomatch the trends of experiments in the case of cardboardand textile. One exception is with textile when tempera-ture goes further up to 600 �C where tar cracking seemsto be activated, as indicated by the dramatic fall of tarat Tf = 600 �C.
It has been shown that [37] minerals like potassium cangreatly enhance the pyrolysis activities of willow fuels byacting as catalysts. While most biomass fuels like woodcontain minerals which might play a role in tar cracking(by acting as catalysts), cardboard and textile may losssuch minerals during the processes of their industrial pro-duction. As indicated in Table 1, potassium concentrationin waste wood is 8 times higher than in textile and card-board. This might be a possible reason for the lack oftar cracking capability in the case of cardboard andtextile. Further exploration work needs to be done in thisaspect.
Modelling results of the product yields are also shown inFig. 6. Several sets of reaction rate parameters from litera-ture (as shown in Table 2) had been tried, but none of themcould produce comparable results against the measure-ments. One of the reasons could be that all these kineticparameters had been derived mainly from fast pyrolysis,the prevailing conditions found in fluidised-beds. There-fore, the rate parameters had to be optimised for the con-ditions of packed-beds. Because of the 2D nature of thereacting system, there is no obvious and direct way todeduce or optimise the reaction parameters from experi-ments. Instead, the traditional trial and error method wasused, helped by personal modelling experience. The opti-mised kinetic parameters are summarised in Table 3 foreach of the three fuels.
Effect of final temperature on char elemental analysis isshown in Fig. 7. Carbon proportion increases and hydro-gen and oxygen fractions decrease as final pyrolysis tem-perature rises. At Tf = 700 �C, carbon constitutes 92–95%of the total char mass.
4.4. Gas compositions
Measured flue gas composition during pyrolysis in thepacked-bed pyrolyser for final temperature 700 �C is shown
Contaminatedwood
0
2
4
6
8
10
12
14
16
1000 2000 3000 4000 5000Time, sec
Gas
co
mp
osi
tio
n, v
ol %
Gas
co
mp
osi
tio
n, v
ol %
-10
0
10
20
30
40
50
Temperature, °C
Temperature, °C
Mass lo
ss rate, 10xWT
%/m
inM
ass loss rate, 10xW
T%
/min
Mass loss rate
CO2
CO
CH4
H2
C2H6
C2H4
70 160 250 340 430 520 610 700 700
70 160 250 340 430 520 610 700 700
0
4
8
12
16
20
1000 2000 3000 4000 5000-10
0
10
20
30
40
50
60
Mass loss rate
C2H6
CO2
CO
CH4
H2
C2H4
Cardboard
Time, sec
a
b
Fig. 8. Measured flue gas composition during pyrolysis in the packed-bedpyrolyser for final temperature 700 �C. Comparisons to predicted mass-loss-rate variation over time (parallel reaction model) are also shown. (a)Contaminated wood and (b) cardboard.
0
20
40
60
80
100
300 400 500 600 700 800
C,
H (
daf%
)C
, H
(da
f%)
-10
0
10
20
30
40
O (daf%
)O
(daf%)
O (daf%
)
C
O
10xH
Cardboard
0
20
40
60
80
100
300 400 500 600 700 800
-10
0
10
20
30
40
C
O
10xH
Textile
0
20
40
60
80
100
300 400 500 600 700
C, H
(d
af%
)
-10
0
10
20
30
40
C
O
10xH
Contaminated wood
Final temperature, °C
Final temperature, °C
Final temperature, °C
a
b
c
Fig. 7. Effect of final temperature on char elemental analysis: (a)contaminated waste wood; (b) cardboard; (c) textile wastes.
in Fig. 8. Comparisons to model-predicted mass-loss-ratevariation over time are also shown. It is seen that COand CO2 are the major constituents (apart from tar andwater) of the flue gas during the main stage of pyrolysis,which occurs between T = 250 and 450 �C. It is only athigher temperatures after the bulk of the volatile matterin the fuel has been released that CH4 and H2 begin to
be released at noticeable levels. CH4 concentration peaksaround T = 500 �C and H2 concentration increases signifi-cantly when temperature rise above 550 �C. There are alsosome low concentrations of C2H4 and C2H6.
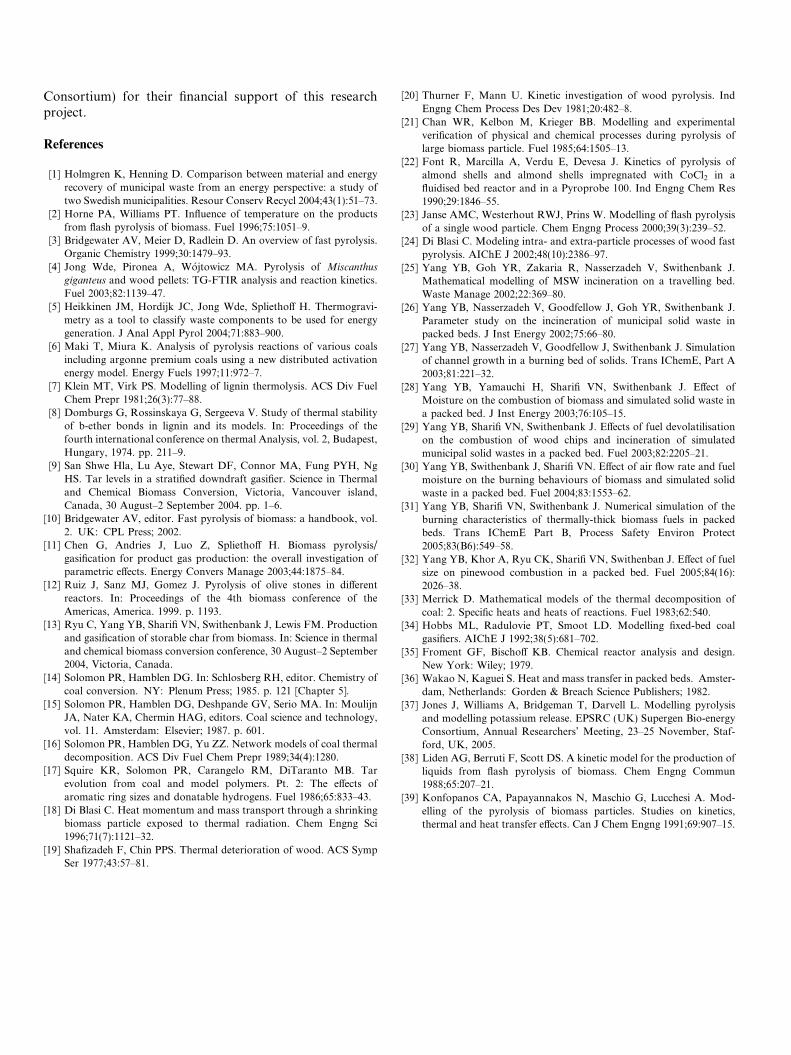
4.5. FG model calculations
This work adopted the data of Jong et al. [4] for woodpellets and the various model parameters are shown inTable 4. The predicted mass loss history and productionrates of major species are shown in Fig. 9. The experi-mental data from TGA tests are also plotted and it isseen that the predicted mass loss history confirms withthe TGA test quite well, implicating the effectiveness ofFG model when TGA test results are concerned. TheFG model predicts (chemical) water being released firstas the pyrolysis processes begin at 220 �C, followed at300 �C by the release of tar and CH3CHO which com-pletes as temperature reaches 420 �C. The release of COand CO2 spreads over a large temperature range from250 to 650 �C.

Wood
0
20
40
60
80
100
100 300 500 700 900T, °C
M/M
0 x
100%
0
0.5
1
1.5
2
2.5
3
3.5
4
4.5
5
Pro
du
ction
rate, wt%
/min
TOTAL,%
TGA
Tar, wt%/min
CO2, wt%/min
CO, wt%/min
H2O, wt%/min
CH4, wt%/min
C2H4, wt%/min
CH3CHO, wt%/min
Fig. 9. Predicted mass loss history and production rates of major speciesfrom FG model for waste wood. Kinetic data are adopted from Jong et al.[4].
Table 4Kinetic parameters and precursor pool size (yields) for main species forwood pellets in the FG model (after Jong et al. [4])
Precursor poolidentifier perevolved species
A (s�1) E/R (K) r/R (K) Yield perprecursorpool wt% (daf)
1-CO2 5.2 · 1011 18,300 900 0.952-CO2 5.2 · 1011 20,500 500 3.103-CO2 2.8 · 1012 24,830 900 0.901-CO 5.2 · 1011 20,300 500 1.902-CO 6.5 · 1012 26,300 3200 3.053-CO 2.8 · 1012 35,930 3300 1.801-H2O 5.2 · 1011 19,900 1200 11.942-H2O 4.4 · 1012 26,000 2500 3.01-CH4 6.5 · 1011 19,200 800 0.052-CH4 6.5 · 1011 22,500 800 0.63-CH4 3.1 · 1012 27,700 2100 0.61-H2
a 3.1 · 1012 30,700 2100 0.11-tar 5.2 · 1011 20,500 500 381-C2H4 2.8 · 1012 25,930 800 0.21-CH3OH 5.2 · 1011 17,800 800 0.402-CH3OH 2.3 · 1011 21,030 700 0.391-CH2O 5.2 · 1011 18,400 500 1.202-CH2O 5.2 · 1011 20,500 200 2.11-CH3CHO 5.2 · 1011 20,400 500 7.01-HCOOH 5.2 · 1012 20,800 800 1.71-CH3COOH 5.2 · 1011 19,300 900 2.31-C6H5OH 7.4 · 1018 32,500 2500 0.751-CH3OCH3 5.2 · 1012 20,900 800 1.9
a Assumed in this work.
-2
0
2
4
6
8
10
12
14
16
18
100 200 300 400 500 600 700
Temperature, °C
Gas
co
mp
osi
tio
n, v
ol %
CO2
CO
CH4
H2
C2H4
CO2 CO
CH4
H2
C2H4
Wood
Fig. 10. Predicted gas composition (major species) from FG model forwaste wood. Kinetic data are adopted from Jong et al. [4].
The corresponding predicted gas composition from FGmodel is shown in Fig. 10. Comparison to the packed-bedmeasurement shown in Fig. 8(a) reveals that the maximumlevels of CO, CO2, CH4, H2 and C2H4 are in satisfactoryagreement. Multi-peaks for most of the gases, especiallyCO2, CO and CH4 are shown with the FG model but werenot detected in the packed bed pyrolysis measurement,perhaps due to insufficiently-small sampling intervals andnon-uniformity across the bed.
5. Conclusions
In this work, slow pyrolysis of three segregated wastes ina packed-bed pyrolysis reactor has been studied by bothexperimental method and mathematical modelling. Majorconclusions are summarised in the following:
(a) Temperature difference inside the reactor bed can be ashigh as 250 �C between positions near the heating walland in the central part of the bed during heating up. Asa result, local heating rate varies greatly in both timeand space, up to 50–100% relative to the average value.
(b) Compared to TGA tests at the same programmedheating rate and final pyrolysing temperature, thepacked-bed pyrolyser produced 30–100% more char.This could be due to tar cracking and repolymerisa-tion both inside the pyrolysing particles and on theactivated outer surface of other particles.
(c) Char yield was 21–34%, tar 34–46% and gas from23% to 43% in the range of 350–700 �C of final pyrol-ysing temperature. Modelling work suggested that forcardboard and textile wastes, tar cracking in the bedis not sufficient to offset the increase in tar release aspyrolysing temperature increases. Tar cracking abil-ity in fuel is possibly linked to mineral contents inthe fuel and needs to be explored.
(d) CO and CO2 are the major constituents (apart fromtar and water) of the flue gas composition duringthe main pyrolysis stage which occurs between 250and 450 �C. Noticeable release of light hydrocarbongases and hydrogen only occurs at higher temperaturelevels after the bulk of the volatile matter in the fuelhas been released. FG model predictions comparesqualitatively well to the measured gas compositions.
Acknowledgements
The authors would like to acknowledge and thank theUK Engineering and Physical Science Research Council(EPSRC Sustainable Urban Environment – SUE Waste
Consortium) for their financial support of this researchproject.
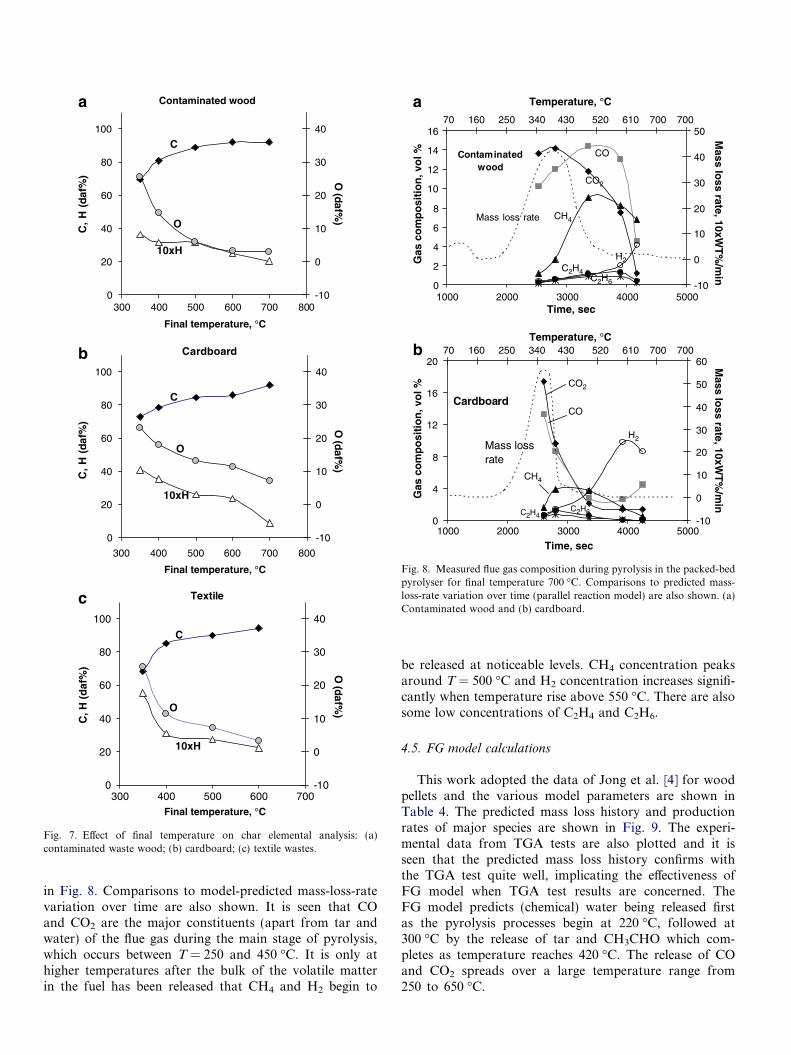
References
[1] Holmgren K, Henning D. Comparison between material and energyrecovery of municipal waste from an energy perspective: a study oftwo Swedish municipalities. Resour Conserv Recycl 2004;43(1):51–73.
[2] Horne PA, Williams PT. Influence of temperature on the productsfrom flash pyrolysis of biomass. Fuel 1996;75:1051–9.
[3] Bridgewater AV, Meier D, Radlein D. An overview of fast pyrolysis.Organic Chemistry 1999;30:1479–93.
[4] Jong Wde, Pironea A, Wojtowicz MA. Pyrolysis of Miscanthus
giganteus and wood pellets: TG-FTIR analysis and reaction kinetics.Fuel 2003;82:1139–47.
[5] Heikkinen JM, Hordijk JC, Jong Wde, Spliethoff H. Thermogravi-metry as a tool to classify waste components to be used for energygeneration. J Anal Appl Pyrol 2004;71:883–900.
[6] Maki T, Miura K. Analysis of pyrolysis reactions of various coalsincluding argonne premium coals using a new distributed activationenergy model. Energy Fuels 1997;11:972–7.
[7] Klein MT, Virk PS. Modelling of lignin thermolysis. ACS Div FuelChem Prepr 1981;26(3):77–88.
[8] Domburgs G, Rossinskaya G, Sergeeva V. Study of thermal stabilityof b-ether bonds in lignin and its models. In: Proceedings of thefourth international conference on thermal Analysis, vol. 2, Budapest,Hungary, 1974. pp. 211–9.
[9] San Shwe Hla, Lu Aye, Stewart DF, Connor MA, Fung PYH, NgHS. Tar levels in a stratified downdraft gasifier. Science in Thermaland Chemical Biomass Conversion, Victoria, Vancouver island,Canada, 30 August–2 September 2004. pp. 1–6.
[10] Bridgewater AV, editor. Fast pyrolysis of biomass: a handbook, vol.2. UK: CPL Press; 2002.
[11] Chen G, Andries J, Luo Z, Spliethoff H. Biomass pyrolysis/gasification for product gas production: the overall investigation ofparametric effects. Energy Convers Manage 2003;44:1875–84.
[12] Ruiz J, Sanz MJ, Gomez J. Pyrolysis of olive stones in differentreactors. In: Proceedings of the 4th biomass conference of theAmericas, America. 1999. p. 1193.
[13] Ryu C, Yang YB, Sharifi VN, Swithenbank J, Lewis FM. Productionand gasification of storable char from biomass. In: Science in thermaland chemical biomass conversion conference, 30 August–2 September2004, Victoria, Canada.
[14] Solomon PR, Hamblen DG. In: Schlosberg RH, editor. Chemistry ofcoal conversion. NY: Plenum Press; 1985. p. 121 [Chapter 5].
[15] Solomon PR, Hamblen DG, Deshpande GV, Serio MA. In: MoulijnJA, Nater KA, Chermin HAG, editors. Coal science and technology,vol. 11. Amsterdam: Elsevier; 1987. p. 601.
[16] Solomon PR, Hamblen DG, Yu ZZ. Network models of coal thermaldecomposition. ACS Div Fuel Chem Prepr 1989;34(4):1280.
[17] Squire KR, Solomon PR, Carangelo RM, DiTaranto MB. Tarevolution from coal and model polymers. Pt. 2: The effects ofaromatic ring sizes and donatable hydrogens. Fuel 1986;65:833–43.
[18] Di Blasi C. Heat momentum and mass transport through a shrinkingbiomass particle exposed to thermal radiation. Chem Engng Sci1996;71(7):1121–32.
[19] Shafizadeh F, Chin PPS. Thermal deterioration of wood. ACS SympSer 1977;43:57–81.
[20] Thurner F, Mann U. Kinetic investigation of wood pyrolysis. IndEngng Chem Process Des Dev 1981;20:482–8.
[21] Chan WR, Kelbon M, Krieger BB. Modelling and experimentalverification of physical and chemical processes during pyrolysis oflarge biomass particle. Fuel 1985;64:1505–13.
[22] Font R, Marcilla A, Verdu E, Devesa J. Kinetics of pyrolysis ofalmond shells and almond shells impregnated with CoCl2 in afluidised bed reactor and in a Pyroprobe 100. Ind Engng Chem Res1990;29:1846–55.
[23] Janse AMC, Westerhout RWJ, Prins W. Modelling of flash pyrolysisof a single wood particle. Chem Engng Process 2000;39(3):239–52.
[24] Di Blasi C. Modeling intra- and extra-particle processes of wood fastpyrolysis. AIChE J 2002;48(10):2386–97.
[25] Yang YB, Goh YR, Zakaria R, Nasserzadeh V, Swithenbank J.Mathematical modelling of MSW incineration on a travelling bed.Waste Manage 2002;22:369–80.
[26] Yang YB, Nasserzadeh V, Goodfellow J, Goh YR, Swithenbank J.Parameter study on the incineration of municipal solid waste inpacked beds. J Inst Energy 2002;75:66–80.
[27] Yang YB, Nasserzadeh V, Goodfellow J, Swithenbank J. Simulationof channel growth in a burning bed of solids. Trans IChemE, Part A2003;81:221–32.
[28] Yang YB, Yamauchi H, Sharifi VN, Swithenbank J. Effect ofMoisture on the combustion of biomass and simulated solid waste ina packed bed. J Inst Energy 2003;76:105–15.
[29] Yang YB, Sharifi VN, Swithenbank J. Effects of fuel devolatilisationon the combustion of wood chips and incineration of simulatedmunicipal solid wastes in a packed bed. Fuel 2003;82:2205–21.
[30] Yang YB, Swithenbank J, Sharifi VN. Effect of air flow rate and fuelmoisture on the burning behaviours of biomass and simulated solidwaste in a packed bed. Fuel 2004;83:1553–62.
[31] Yang YB, Sharifi VN, Swithenbank J. Numerical simulation of theburning characteristics of thermally-thick biomass fuels in packedbeds. Trans IChemE Part B, Process Safety Environ Protect2005;83(B6):549–58.
[32] Yang YB, Khor A, Ryu CK, Sharifi VN, Swithenban J. Effect of fuelsize on pinewood combustion in a packed bed. Fuel 2005;84(16):2026–38.
[33] Merrick D. Mathematical models of the thermal decomposition ofcoal: 2. Specific heats and heats of reactions. Fuel 1983;62:540.
[34] Hobbs ML, Radulovie PT, Smoot LD. Modelling fixed-bed coalgasifiers. AIChE J 1992;38(5):681–702.
[35] Froment GF, Bischoff KB. Chemical reactor analysis and design.New York: Wiley; 1979.
[36] Wakao N, Kaguei S. Heat and mass transfer in packed beds. Amster-dam, Netherlands: Gorden & Breach Science Publishers; 1982.
[37] Jones J, Williams A, Bridgeman T, Darvell L. Modelling pyrolysisand modelling potassium release. EPSRC (UK) Supergen Bio-energyConsortium, Annual Researchers’ Meeting, 23–25 November, Staf-ford, UK, 2005.
[38] Liden AG, Berruti F, Scott DS. A kinetic model for the production ofliquids from flash pyrolysis of biomass. Chem Engng Commun1988;65:207–21.
[39] Konfopanos CA, Papayannakos N, Maschio G, Lucchesi A. Mod-elling of the pyrolysis of biomass particles. Studies on kinetics,thermal and heat transfer effects. Can J Chem Engng 1991;69:907–15.