Pyrolysis of Mixed Solid Food, Paper, and Packaging Wastes
10
1 2008-01-2050 Pyrolysis of Mixed Solid Food, Paper, and Packaging Wastes Michael Serio, Erik Kroo, Elizabeth Florczak, and Marek Wójtowicz Advanced Fuel Research Inc, 87 Church Street, East Hartford, CT 06108-3728 Kanapathipillai Wignarajah, John Hogan, and John Fisher NASA Ames Research Center, Moffett Field, CA 94035-1000 Copyright © 2008 SAE International ABSTRACT Pyrolysis is a very versatile waste processing technology which can be tailored to produce a variety of solid, liquid and/or gaseous products. The pyrolysis processing of pure and mixed solid waste streams has been under investigation for several decades for terrestrial use and a few commercial units have been built for niche applications. Pyrolysis has more recently been considered for the processing of mixed solid wastes in space. While pyrolysis units can easily handle mixed solid waste streams, the dependence of the pyrolysis product distribution on the component composition is not well known. It is often assumed that the waste components (e.g., food, paper, plastic) behave independently, but this is a generalization that can usually only be applied to the overall weight loss and not always to the yields of individual gas species. The current paper will present results on pyrolysis of various mixtures of plastic (polyethylene), food (composite of 40% assorted dried food, 30% flour, 10% milk powder, 7% egg powder, 4% potato powder, 3% gluten, 3% corn starch, 3% sugar), and paper (cellulose). In addition to the model mixed food waste sample, additional runs were done with actual restaurant food waste after it was dehydrated. The paper will include results for major product yields (char, gas, water + oil, carbon) as well as the gas composition (H 2 , CO 2 , CO, CH 4 , C 2 H 4 , and NH 3 ), and the char composition and char reactivity. INTRODUCTION Pyrolysis is a commonly utilized method for destruction of waste products [1 -3]. It is often considered as an alternative to incineration, wet oxidation and other treatment processes. The products of pyrolysis are typically gases, liquids and a solid char, although the process can be designed to avoid the formation of hydrocarbon liquids by having a secondary pyrolysis (cracking) stage. From the perspective of management of waste streams in a space environment, pyrolysis offers certain advantages over other methods of disposal. One significant advantage is the partial decoupling of issues of CO 2 management from the waste stream disposal problem, since some of the carbon will end up in the char residue and some will end up as CH 4 and other hydrocarbons (as well as CO and CO 2 ). There are clear incentives for tying up carbon in its elemental form in the char residue. One is the compactness of storage, another is that it may be combusted on demand to provide CO 2 for plant growth (or it may be gasified with H 2 to provide methane). A third option would be to activate the char residue and use it for purification of gas or liquid streams. The formation of activated carbon by solid waste pyrolysis followed by gasification of the char residue can also be used as a method for biological stabilization and/or sterilization of waste. The initial pyrolysis products are primarily hydrocarbon liquids, but these liquids can be cracked to gases (and small amounts of carbon) as the temperature is raised an additional 200-400 °C. The major gas products are H 2 , CO, H 2 O, CO 2 , and CH 4 . Other gas products, present in much smaller amounts, will include NH 3 and H 2 S, if nitrogen and sulfur compounds are present in the solid waste stream. The liquids will initially include a large yield of a complex mixture of chemicals. This characteristic of the pyrolysis of waste streams allows for the possibility of staging the pyrolysis process. The initial step will convert the solids to liquids and will reduce the volume of the waste. In the second step, the liquids are cracked almost completely to gases, which can occur simultaneously with the first step by using a two-stage pyrolysis reactor where the second stage includes a cracking zone [4- 9]. In an optional third step, the char residue can be subsequently converted into activated carbon. The char residue will typically be less than 25-30% of the initial mass of the solid waste, unless there is a high inorganic content of one of the waste components, in which case it could be as high as 35- 55%. One of the features of the pyrolysis of solid waste materials that contain large amounts of oxygen (along with some hydrogen), such as plant biomass or paper, is
-
Upload
independent -
Category
Documents
-
view
1 -
download
0
Transcript of Pyrolysis of Mixed Solid Food, Paper, and Packaging Wastes

1
2008-01-2050
Pyrolysis of Mixed Solid Food, Paper, and Packaging Wastes
Michael Serio, Erik Kroo, Elizabeth Florczak, and Marek Wójtowicz Advanced Fuel Research Inc, 87 Church Street, East Hartford, CT 06108-3728
Kanapathipillai Wignarajah, John Hogan, and John Fisher NASA Ames Research Center, Moffett Field, CA 94035-1000
Copyright © 2008 SAE International
ABSTRACT
Pyrolysis is a very versatile waste processing technology which can be tailored to produce a variety of solid, liquid and/or gaseous products. The pyrolysis processing of pure and mixed solid waste streams has been under investigation for several decades for terrestrial use and a few commercial units have been built for niche applications. Pyrolysis has more recently been considered for the processing of mixed solid wastes in space. While pyrolysis units can easily handle mixed solid waste streams, the dependence of the pyrolysis product distribution on the component composition is not well known. It is often assumed that the waste components (e.g., food, paper, plastic) behave independently, but this is a generalization that can usually only be applied to the overall weight loss and not always to the yields of individual gas species. The current paper will present results on pyrolysis of various mixtures of plastic (polyethylene), food (composite of 40% assorted dried food, 30% flour, 10% milk powder, 7% egg powder, 4% potato powder, 3% gluten, 3% corn starch, 3% sugar), and paper (cellulose). In addition to the model mixed food waste sample, additional runs were done with actual restaurant food waste after it was dehydrated. The paper will include results for major product yields (char, gas, water + oil, carbon) as well as the gas composition (H2, CO2, CO, CH4, C2H4, and NH3), and the char composition and char reactivity.
INTRODUCTION
Pyrolysis is a commonly utilized method for destruction of waste products [1 -3]. It is often considered as an alternative to incineration, wet oxidation and other treatment processes. The products of pyrolysis are typically gases, liquids and a solid char, although the process can be designed to avoid the formation of hydrocarbon liquids by having a secondary pyrolysis (cracking) stage. From the perspective of management of waste streams in a space environment, pyrolysis offers certain advantages over other methods of disposal. One significant advantage is the partial
decoupling of issues of CO2 management from the waste stream disposal problem, since some of the carbon will end up in the char residue and some will end up as CH4 and other hydrocarbons (as well as CO and CO2). There are clear incentives for tying up carbon in its elemental form in the char residue. One is the compactness of storage, another is that it may be combusted on demand to provide CO2 for plant growth (or it may be gasified with H2 to provide methane). A third option would be to activate the char residue and use it for purification of gas or liquid streams. The formation of activated carbon by solid waste pyrolysis followed by gasification of the char residue can also be used as a method for biological stabilization and/or sterilization of waste.
The initial pyrolysis products are primarily hydrocarbon liquids, but these liquids can be cracked to gases (and small amounts of carbon) as the temperature is raised an additional 200-400 °C. The major gas products are H2, CO, H2O, CO2, and CH4. Other gas products, present in much smaller amounts, will include NH3 and H2S, if nitrogen and sulfur compounds are present in the solid waste stream. The liquids will initially include a large yield of a complex mixture of chemicals. This characteristic of the pyrolysis of waste streams allows for the possibility of staging the pyrolysis process. The initial step will convert the solids to liquids and will reduce the volume of the waste. In the second step, the liquids are cracked almost completely to gases, which can occur simultaneously with the first step by using a two-stage pyrolysis reactor where the second stage includes a cracking zone [4- 9]. In an optional third step, the char residue can be subsequently converted into activated carbon. The char residue will typically be less than 25-30% of the initial mass of the solid waste, unless there is a high inorganic content of one of the waste components, in which case it could be as high as 35-55%.
One of the features of the pyrolysis of solid waste materials that contain large amounts of oxygen (along with some hydrogen), such as plant biomass or paper, is
2
the production of water as a product. Consequently, pyrolysis processing will not only lead to recovery of the moisture in the solid waste, it will also generate additional amounts of water for life support. If the hydrogen and hydrocarbon gas products from pyrolysis are subsequently oxidized (see below), then even more water will be produced.
A significant advantage of the pyrolysis processing scheme is that the individual stages of the process can be separated in time by minutes, days, or weeks, depending on the demand for the products that are being recovered from the waste. For example, adjusting the pyrolysis conditions to primarily produce liquids will reduce the waste storage volume without increasing the volume of gases that must be used, stored, or discarded.
In general, pyrolysis processing could be useful to NASA in at least five respects: 1) it can be used as a pretreatment for a combustion process; 2) it can be used as a more efficient means of utilizing oxygen and recycling carbon and nitrogen; 3) it can be used to supply fuel gases to fuel cells for power generation; 4) it can be used as the basis for the production of chemicals and materials (such as activated carbon) in space; 5) it can be used to recover moisture and generate additional amounts of water from solid waste. Unlike incineration, the issue of CO2 management can be largely decoupled from the issue of waste management as not all of the carbon is immediately converted to CO2. A proposed sequence of processing steps for spacecraft use is shown in Figure 1. The main disadvantages of pyrolysis processing are: (1) the product stream is more complex than for many of the alternative treatments; (2) the product gases cannot be vented directly in the cabin without further treatment because of the high CO concentrations. The latter issue can be addressed by utilization of a water gas shift reactor, or by introducing the product gases into an incinerator or a high-temperature fuel cell.
Advanced Fuel Research (AFR) initially developed the waste-pyrolysis aspects of the above process under a separate NASA-funded project [10]. The focus of the current paper is a natural extension of that work.
EXPERIMENTAL
REACTOR DESIGN AND CONSTRUCTION – An initial version of a prototype hybrid pyrolysis/oxidation reactor system was described previously [11]. The previous system was designed to process a single 15-18 g waste pellet and was coupled to an On-Line Technologies Multi-Gas 2010 Fourier transform infrared (FT-IR) spectrometer equipped with a 5.1 meter path length gas cell for process monitoring and control. The second generation Hybrid Pyrolysis/Oxidation Reactor System (HPORS) is designed to process up to 100 g of material
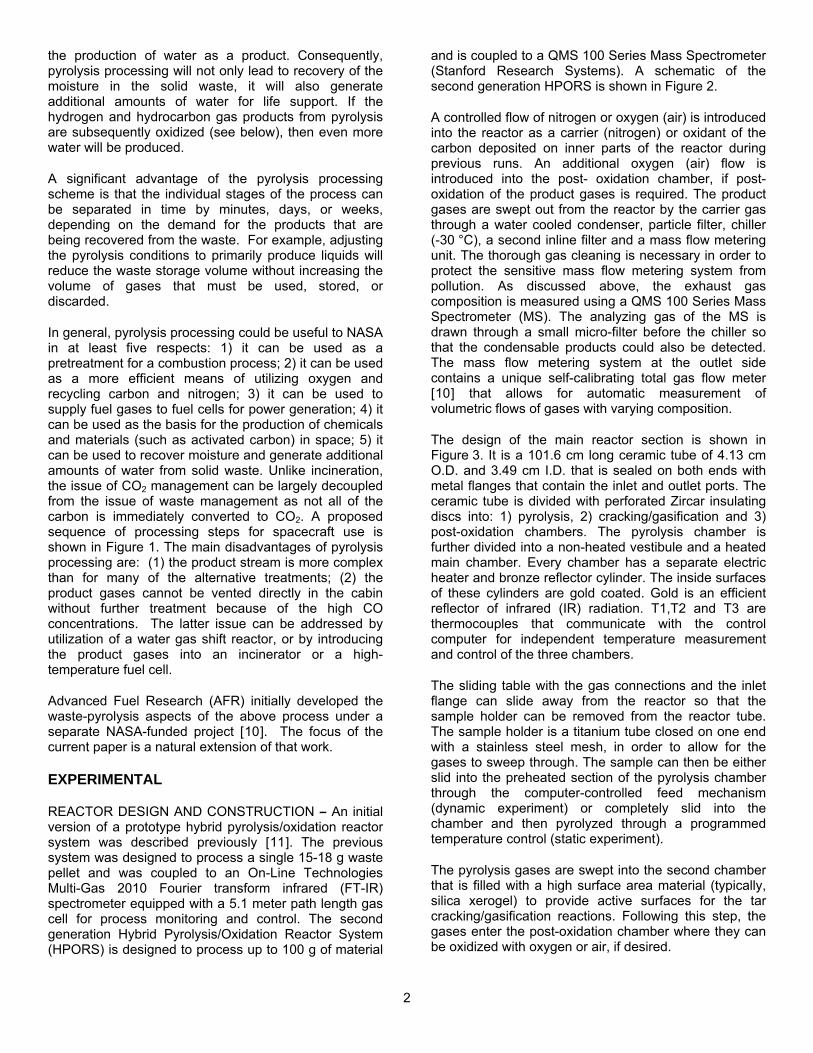
and is coupled to a QMS 100 Series Mass Spectrometer (Stanford Research Systems). A schematic of the second generation HPORS is shown in Figure 2.
A controlled flow of nitrogen or oxygen (air) is introduced into the reactor as a carrier (nitrogen) or oxidant of the carbon deposited on inner parts of the reactor during previous runs. An additional oxygen (air) flow is introduced into the post- oxidation chamber, if post-oxidation of the product gases is required. The product gases are swept out from the reactor by the carrier gas through a water cooled condenser, particle filter, chiller (-30 °C), a second inline filter and a mass flow metering unit. The thorough gas cleaning is necessary in order to protect the sensitive mass flow metering system from pollution. As discussed above, the exhaust gas composition is measured using a QMS 100 Series Mass Spectrometer (MS). The analyzing gas of the MS is drawn through a small micro-filter before the chiller so that the condensable products could also be detected. The mass flow metering system at the outlet side contains a unique self-calibrating total gas flow meter [10] that allows for automatic measurement of volumetric flows of gases with varying composition.
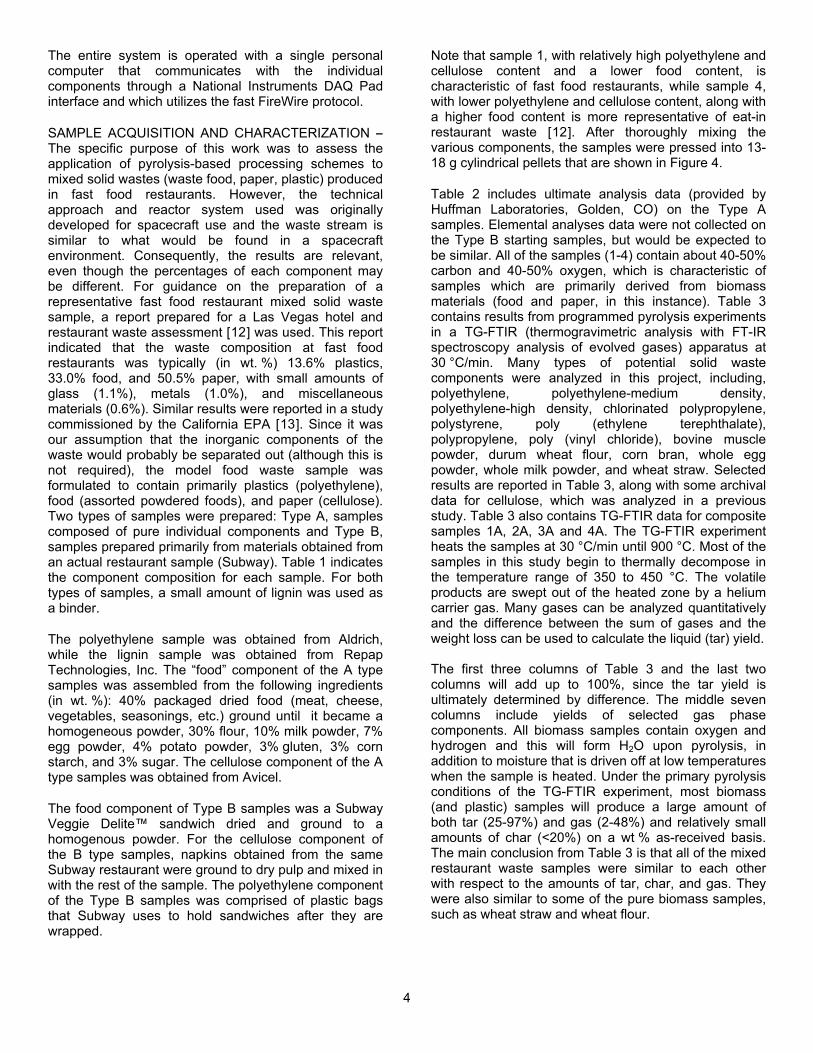
The design of the main reactor section is shown in Figure 3. It is a 101.6 cm long ceramic tube of 4.13 cm O.D. and 3.49 cm I.D. that is sealed on both ends with metal flanges that contain the inlet and outlet ports. The ceramic tube is divided with perforated Zircar insulating discs into: 1) pyrolysis, 2) cracking/gasification and 3) post-oxidation chambers. The pyrolysis chamber is further divided into a non-heated vestibule and a heated main chamber. Every chamber has a separate electric heater and bronze reflector cylinder. The inside surfaces of these cylinders are gold coated. Gold is an efficient reflector of infrared (IR) radiation. T1,T2 and T3 are thermocouples that communicate with the control computer for independent temperature measurement and control of the three chambers.
The sliding table with the gas connections and the inlet flange can slide away from the reactor so that the sample holder can be removed from the reactor tube. The sample holder is a titanium tube closed on one end with a stainless steel mesh, in order to allow for the gases to sweep through. The sample can then be either slid into the preheated section of the pyrolysis chamber through the computer-controlled feed mechanism (dynamic experiment) or completely slid into the chamber and then pyrolyzed through a programmed temperature control (static experiment).
The pyrolysis gases are swept into the second chamber that is filled with a high surface area material (typically, silica xerogel) to provide active surfaces for the tar cracking/gasification reactions. Following this step, the gases enter the post-oxidation chamber where they can be oxidized with oxygen or air, if desired.

Paper Plastic
Pelletization and Storage
Primary Pyrolysis
Secondary Pyrolysis
Gas Clean-up
Gas Collection
Food Waste
Oxidizer, Fuel Cell
Char Combustion
Ash Char
Heat
CO2, H2O
H2S NH3
Mixed waste
Oil & Gas
Gas
Figure 1. Proposed sequence of processing steps for pyrolysis of mixed solid wastes in space.
Figure 2. Schematic of the AFR Hybrid Pyrolysis/Oxidation Reactor System (HPORS).
Figure 3. Details of HPORS main reactor section.
3
4
The entire system is operated with a single personal computer that communicates with the individual components through a National Instruments DAQ Pad interface and which utilizes the fast FireWire protocol.
SAMPLE ACQUISITION AND CHARACTERIZATION – The specific purpose of this work was to assess the application of pyrolysis-based processing schemes to mixed solid wastes (waste food, paper, plastic) produced in fast food restaurants. However, the technical approach and reactor system used was originally developed for spacecraft use and the waste stream is similar to what would be found in a spacecraft environment. Consequently, the results are relevant, even though the percentages of each component may be different. For guidance on the preparation of a representative fast food restaurant mixed solid waste sample, a report prepared for a Las Vegas hotel and restaurant waste assessment [12] was used. This report indicated that the waste composition at fast food restaurants was typically (in wt. %) 13.6% plastics, 33.0% food, and 50.5% paper, with small amounts of glass (1.1%), metals (1.0%), and miscellaneous materials (0.6%). Similar results were reported in a study commissioned by the California EPA [13]. Since it was our assumption that the inorganic components of the waste would probably be separated out (although this is not required), the model food waste sample was formulated to contain primarily plastics (polyethylene), food (assorted powdered foods), and paper (cellulose). Two types of samples were prepared: Type A, samples composed of pure individual components and Type B, samples prepared primarily from materials obtained from an actual restaurant sample (Subway). Table 1 indicates the component composition for each sample. For both types of samples, a small amount of lignin was used as a binder.
The polyethylene sample was obtained from Aldrich, while the lignin sample was obtained from Repap Technologies, Inc. The “food” component of the A type samples was assembled from the following ingredients (in wt. %): 40% packaged dried food (meat, cheese, vegetables, seasonings, etc.) ground until it became a homogeneous powder, 30% flour, 10% milk powder, 7% egg powder, 4% potato powder, 3% gluten, 3% corn starch, and 3% sugar. The cellulose component of the A type samples was obtained from Avicel.
The food component of Type B samples was a Subway Veggie Delite™ sandwich dried and ground to a homogenous powder. For the cellulose component of the B type samples, napkins obtained from the same Subway restaurant were ground to dry pulp and mixed in with the rest of the sample. The polyethylene component of the Type B samples was comprised of plastic bags that Subway uses to hold sandwiches after they are wrapped.
Note that sample 1, with relatively high polyethylene and cellulose content and a lower food content, is characteristic of fast food restaurants, while sample 4, with lower polyethylene and cellulose content, along with a higher food content is more representative of eat-in restaurant waste [12]. After thoroughly mixing the various components, the samples were pressed into 13-18 g cylindrical pellets that are shown in Figure 4.
Table 2 includes ultimate analysis data (provided by Huffman Laboratories, Golden, CO) on the Type A samples. Elemental analyses data were not collected on the Type B starting samples, but would be expected to be similar. All of the samples (1-4) contain about 40-50% carbon and 40-50% oxygen, which is characteristic of samples which are primarily derived from biomass materials (food and paper, in this instance). Table 3 contains results from programmed pyrolysis experiments in a TG-FTIR (thermogravimetric analysis with FT-IR spectroscopy analysis of evolved gases) apparatus at 30 °C/min. Many types of potential solid waste components were analyzed in this project, including, polyethylene, polyethylene-medium density, polyethylene-high density, chlorinated polypropylene, polystyrene, poly (ethylene terephthalate), polypropylene, poly (vinyl chloride), bovine muscle powder, durum wheat flour, corn bran, whole egg powder, whole milk powder, and wheat straw. Selected results are reported in Table 3, along with some archival data for cellulose, which was analyzed in a previous study. Table 3 also contains TG-FTIR data for composite samples 1A, 2A, 3A and 4A. The TG-FTIR experiment heats the samples at 30 °C/min until 900 °C. Most of the samples in this study begin to thermally decompose in the temperature range of 350 to 450 °C. The volatile products are swept out of the heated zone by a helium carrier gas. Many gases can be analyzed quantitatively and the difference between the sum of gases and the weight loss can be used to calculate the liquid (tar) yield. The first three columns of Table 3 and the last two columns will add up to 100%, since the tar yield is ultimately determined by difference. The middle seven columns include yields of selected gas phase components. All biomass samples contain oxygen and hydrogen and this will form H2O upon pyrolysis, in addition to moisture that is driven off at low temperatures when the sample is heated. Under the primary pyrolysis conditions of the TG-FTIR experiment, most biomass (and plastic) samples will produce a large amount of both tar (25-97%) and gas (2-48%) and relatively small amounts of char (<20%) on a wt % as-received basis. The main conclusion from Table 3 is that all of the mixed restaurant waste samples were similar to each other with respect to the amounts of tar, char, and gas. They were also similar to some of the pure biomass samples, such as wheat straw and wheat flour.

5
Table 1 – Sample Component Composition
Sample (weight %)
Polyethylene Lignin Food Cellulose
1A 17 3 30 50
2A 12 3 40 45
3A 8 3 50 39
4A 4 3 60 33
1B 17 3 30 50 (paper)
4B 4 3 60 33 (paper) Table 2 – Ultimate Analysis of Model Food Waste Samples (weight % as received basis)
Sample C H O S N Moisture Ash
1A 50.1 7.8 41.1 0.1 0.9 3.7 1.4
2A 47.1 7.4 44.2 0.1 1.2 4.3 1.9
3A 45.4 7.2 45.8 0.1 1.5 4.8 2.4
4A 43.4 6.8 47.9 0.2 1.8 5.1 3.2
Table 3. Results from TG-FTIR Experiments at 30°C/min for Model Food Waste Samples and Individual Waste Components (weight %, as-received basis)
Sample Char Gas Tar CH4 H2O CO CO2 C2H4 NH3 CH3CHO Moist Ash
Polyethylene 0.0 2.7 97.0 0.2 0.0 0.4 0.3 0.3 0.0 0.0 0.2 0.0
PET 14.5 32.6 52.1 0.4 0.0 4.8 7.7 1.1 0.0 8.9 0.0 0.7
Wheat Straw
17.9 42.5 25.9 0.8 18.4 4.1 6.9 0.2 0.1 5.5 7.1 6.6
Wheat Flour 13.6 41.0 35.6 0.8 25.5 3.0 7.5 0.2 0.5 4.5 8.4 1.4
Egg Powder 5.0 19.4 64.7 0.6 7.8 0.7 3.7 0.1 1.0 3.1 3.1 7.8
Cellulose 2.3 13.4 71.9 0.1 4.5 1.3 1.8 0.0 0.0 0.0 12.4 0.0
1A 7.8 37.2 48.0 0.6 16.7 3.5 5.9 0.1 0.1 5.1 3.9 3.3
2A 16.0 42.1 41.9 0.9 17.8 4.0 6.9 0.1 0.2 6.9 0.0 0.0
3A 13.1 41.2 41.2 0.9 15.7 4.0 7.0 0.2 0.3 7.5 4.6 0.7
4A 13.8 47.8 32.0 0.9 22.5 4.0 7.3 0.2 0.4 7.4 5.0 1.4

RESULTS AND DISCUSSION
The pyrolysis experiments were carried out at the NASA Ames Research Center in Moffett Field, CA in the Hybrid Pyrolysis/Oxidation Reactor System (HPORS) that was constructed at AFR and delivered to NASA Ames in February 2006 (see Figures 2 and 3) [11,14]. The experiments were run without using the post-oxidation unit, i.e., no oxygen was added to this stage. A photograph of the HPORS unit is shown in Figure 5. The dynamic run condition was set up to approximate the flow of material in a continuous reactor, that is, where the material is fed into the pyrolysis chamber which is already at the operating temperature – in our case at 700 °C. Conversely, in the static run, the sample is placed in the pyrolysis chamber at ambient temperature and heated up to the maximum (700 °C) at a controlled heating rate. Although this condition does not resemble a typical pyrolysis reactor condition, it is similar to conditions used in the TG-FTIR and is a useful way to benchmark the samples. Carbon deposition occurs on the catalyst surface in the second stage tar cracking/gasification chamber, as well as on the internal surfaces of the pyrolysis and cracking chambers. The amount of this carbon is measured after every run after removing the char from the pyrolysis
chamber and changing the N2 carrier gas to air. The carbon deposition is then calculated from the cumulative evolution of CO2 and CO measured by the gas analysis system. During all of the experiments, the pyrolysis chamber was heated to a maximum temperature of 700 °C, while the cracking chamber was heated to 1050 °C. The temperature profile in the static run was as follows: 15 °C/min to 150 °C; 10 °C/min to 240 °C; 8 °C/min to 340 °C; 15 °C/min to 700 °C. The sample translation rate (i.e., rate of sample movement into the heated zone) in dynamic runs was 0.76 cm/min, while the N2 carrier flow was 650 cc/min. Finally, the air flow rate in the carbon deposition measurements was 610 cc/min. Typically, 50 g (three pellets) were pyrolyzed and the product yields as well as gas evolution profiles were determined using a QMS 100 Series Mass Spectrometer. The oil fraction is captured together with the water but could only be estimated due to deposition of oil on the external walls of the condenser and trap as well as the difficulty of separation from the water fraction. The amount of oil was typically estimated between 8-12% by weight of the water + oils, e.g., around 3% of the initial sample weight.
Figure 4. Photograph of mixed waste pellets of types 1A, 1B, 4A, 4B, respectively moving from left to right.
6

Figure 5. Photograph of HPORS unit installed at the NASA Ames Research Center. The yields of the main pyrolysis products are given in Table 4 on a wt. %, as-received basis. As can be seen in Table 4, the char yield was nearly independent of the sample composition (~20 wt. %) with the synthetic (1A-4A) samples under dynamic conditions, but is somewhat higher (~25 wt. %) with the real waste sample, 4B. The static condition also increases the char yield for the synthetic sample to about 25 wt. %. An interesting observation was the very high reactivity of all of the char samples produced upon exposure to air. Indeed, all of the char samples showed some degree of self-heating under ambient conditions. An AFR developed measure of char reactivity is the “critical temperature” or Tcr, which is the temperature at which a sample will begin to experience a measurable weight loss when heated at 30°C/min in air. For the various chars produced in these experiments, the Tcr values ranged from 330 to 394°C. These results compare well with low rank, highly reactive lignite chars (e.g., from North Dakota Lignite), which is consistent with the spontaneous heating and smoldering under ambient conditions that was observed for the chars produced in the current study. Consequently, it appears that the char residues are very well suited to combustion to provide heat for the pyrolysis process. The elemental analyses of chars were determined by Huffman Laboratories (Golden, CO) and were typically 72-80 wt. % C, 2.0-3.2 wt. % H, 16-22 wt. % O, 1.7-3.2 wt.% N, and 0.05-0.14 wt. % S, on an as-received basis. Using a correlation based on elemental analysis, the heating value of the chars was estimated as ~27
MJ/kg [15]. As a general rule, the pyrolysis of biomass materials can be self sustaining from an energy standpoint [16]. Approximately 20% of the heating value of the starting material is usually required to sustain the process. The total gas yield (see Table 4) shows a slight maximum with sample 2A (50 wt.%) and here again the “real” waste sample is different from the rest by showing reduced gas formation (39 wt. %). The static condition also results in a lower gas yield. The individual gaseous products all show slight maxima (see Table 5), but with different samples: The CO2 with 3A, the CO at 4A (dynamic condition), the H2, CH4 and C2H4 with 1A. Very little NH3 formation occurred in dynamic runs, as opposed to the static run that produced significant (7.7 vol%) NH3. The reason for this significant difference in NH3 yield is not clear. The typical gas evolution profiles for dynamic and static runs are given in Figs. 6-9. In general, all of the gases that were tracked exhibited similar evolution profiles. Figures 8 and 9 are results for the same experiment, but plotted versus temperature and time, respectively. The water+oil fraction increases from sample 1 to 4 in both the A and B series. This suggests that the “food” component is the major contributor to water. The carbon deposition is generally higher with increasing polyethylene (plastic) component of the waste sample. This is exactly what is expected based on previous experiments with samples containing polyethylene [5,10]. The occurrence of carbon deposition is
7
8
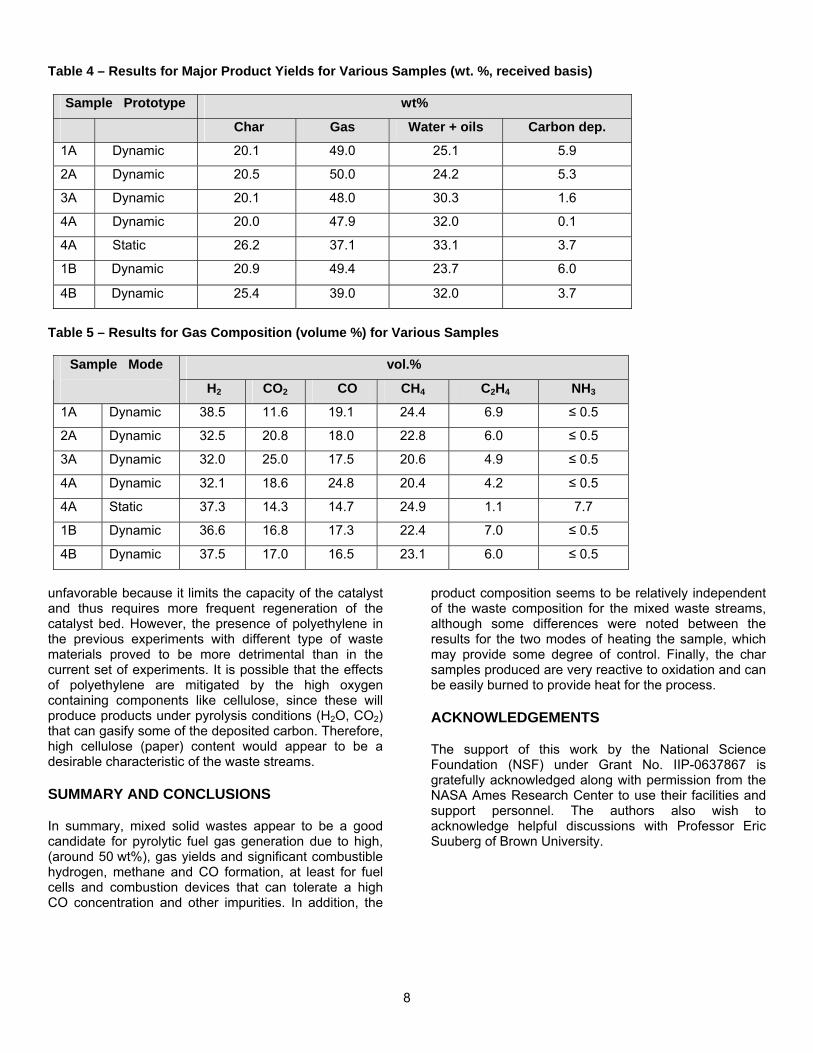
Table 4 – Results for Major Product Yields for Various Samples (wt. %, received basis)
Sample Prototype wt%
Char Gas Water + oils Carbon dep.
1A Dynamic 20.1 49.0 25.1 5.9
2A Dynamic 20.5 50.0 24.2 5.3
3A Dynamic 20.1 48.0 30.3 1.6
4A Dynamic 20.0 47.9 32.0 0.1
4A Static 26.2 37.1 33.1 3.7
1B Dynamic 20.9 49.4 23.7 6.0
4B Dynamic 25.4 39.0 32.0 3.7
Table 5 – Results for Gas Composition (volume %) for Various Samples
vol.% Sample Mode
H2 CO2 CO CH4 C2H4 NH3
1A Dynamic 38.5 11.6 19.1 24.4 6.9 ≤ 0.5
2A Dynamic 32.5 20.8 18.0 22.8 6.0 ≤ 0.5
3A Dynamic 32.0 25.0 17.5 20.6 4.9 ≤ 0.5
4A Dynamic 32.1 18.6 24.8 20.4 4.2 ≤ 0.5
4A Static 37.3 14.3 14.7 24.9 1.1 7.7
1B Dynamic 36.6 16.8 17.3 22.4 7.0 ≤ 0.5
4B Dynamic 37.5 17.0 16.5 23.1 6.0 ≤ 0.5
unfavorable because it limits the capacity of the catalyst and thus requires more frequent regeneration of the catalyst bed. However, the presence of polyethylene in the previous experiments with different type of waste materials proved to be more detrimental than in the current set of experiments. It is possible that the effects of polyethylene are mitigated by the high oxygen containing components like cellulose, since these will produce products under pyrolysis conditions (H2O, CO2) that can gasify some of the deposited carbon. Therefore, high cellulose (paper) content would appear to be a desirable characteristic of the waste streams.
SUMMARY AND CONCLUSIONS
In summary, mixed solid wastes appear to be a good candidate for pyrolytic fuel gas generation due to high, (around 50 wt%), gas yields and significant combustible hydrogen, methane and CO formation, at least for fuel cells and combustion devices that can tolerate a high CO concentration and other impurities. In addition, the
product composition seems to be relatively independent of the waste composition for the mixed waste streams, although some differences were noted between the results for the two modes of heating the sample, which may provide some degree of control. Finally, the char samples produced are very reactive to oxidation and can be easily burned to provide heat for the process.
ACKNOWLEDGEMENTS
The support of this work by the National Science Foundation (NSF) under Grant No. IIP-0637867 is gratefully acknowledged along with permission from the NASA Ames Research Center to use their facilities and support personnel. The authors also wish to acknowledge helpful discussions with Professor Eric Suuberg of Brown University.

9
Figure 6. Gas evolution rate vs. time from dynamic food waste pyrolysis experiment (up to a maximum temperature of 700°C) with sample 1A.
Figure 8. Gas evolution rate vs. temperature from static food waste pyrolysis experiment with sample 4A.
Figure 7. Gas evolution rate vs. time from dynamic food waste pyrolysis experiment (up to a maximum of 700 °C) with sample 4A.
Figure 9. Gas evolution rate vs. time from static food waste pyrolysis experiments with sample 4A.
0
200
400
600
800
1000
0 5 10 15 20 25 30 35 40
#1A Dynamic
H2CO2COCH4C2H4min
time min.
Evo
lutio
n ra
te (c
c/m
in)
Evo
lutio
n ra
te (c
c/m
in)
0
200
400
600
800
1000
0 5 10 15 20 25 30 35
#4A Dynamic
H2CO2COCH4C2H4min
time min.
Evo
lutio
n ra
te (c
c/m
in)
0
100
200
300
400
500
600
0 10 20 30 40 50 60 70 80
#4A Static
H2CO2COCH4C2H4NH3
min
time min.
100100 200 300 400 500 600 700 800 900
Temp. C
0
100
200
300
400
500
600
H2CO2
#4 StaticCOCH4C2H4NH3
min# 4A Static

10
REFERENCES
1 Freeman, H.M., Ed., Standard Handbook of Hazardous Waste Treatment and Disposal, Sections 8.7 and 9.3, McGraw-Hill, New York (1989).
2 Corbitt, R.A. Standard Handbook of Environmental Engineering, McGraw-Hill, New York (1990).
3 Brunner, C.R. Handbook of Incineration Systems, McGraw-Hill, New York (1991).
4 Serio, M., Kroo, E., Bassilakis, R., Wójtowicz, M. and Suuberg, E., “A Prototype Pyrolyzer for Solid Waste Resource Recovery in Space,” SAE 2001-01-2349, presented at the 31st International Conference on Environmental Systems, July 9-12, 2001, Orlando, Florida).
5 Chen, Y., DiTaranto, M., Kroo, E., Wójtowicz, M. A., Suuberg, E. M. and Serio, M. A., Pyrolysis Processing for Solid Waste Resource Recovery in Space, Phase I Final Report, NASA SBIR contract No. NAS2-99001, Advanced Fuel Research, Inc., East Hartford, CT, June 1999.
6 Serio, M. A., Chen, Y., Wójtowicz, M. A. and Suuberg, E. M., “Pyrolysis Processing of Mixed Solid Waste Streams,” ACS Div. of Fuel Chem. Prepr., 45 (3), 466–474 (2000).
7 Serio, M. A., Chen, Y., Wójtowicz, M. A. and Suuberg, E. M., “Pyrolysis Processing for Solid Waste Resource Recovery in Space,” Proc. 30th Int. Conf. on Environmental Systems, Toulouse, France, 10-13 July, 2000, SAE Paper No. 2000-01-2286.
8 Serio, M.A., Kroo, E., Florczak, E.H., Wójtowicz, M.A., and Suuberg, E.M., “Utilization of Solid Waste for Activated Carbon Production in Space,” SAE Paper No. 2003-01-2372 (2003).
9 Serio, M.A., Kroo, E., and Wójtowicz, M.A., “Biomass Pyrolysis for Distributed Energy Generation,” ACS Div. of Fuel Chem. Prepr., 48(2), 584-589 (2003).
10 Serio, M.A., Kroo, E., Wójtowicz, M.A., Suuberg, E., and Filburn, T., Pyrolysis Processing for Solid Waste Resource Recovery in Space, Phase II Final Report NAS2-00007 (Dec. 2002).
11 Serio, M.A., Kroo, E., Florcazk, E., Wójtowicz, M.A., Wignarajah, K., Howard, K., and Fisher, J., “A Hybrid Pyrolysis/Oxidation System for Solid Waste Resource Recovery,” SAE Paper No. 2004-01-2380 (2004).
12 Rabasca, L., “Waste from Restaurants,” Waste Age, 77-80 (1993).
13 Cascadia Consulting Group, “Waste Disposal and Diversion Findings for Selected Industry Groups,” California EPA, Integrated Waste Management Board (June 2006).
14 Serio, M.A., Kroo, E., Magoon, G., Wójtowicz, M.A., and Birbara, P., “A Hybrid Pyrolysis/Incineration System for Solid Waste Resource Recovery,” Final Report under Contract NNA04CA07C (February 2006).
15 Sheng, C. and Azevedo, J.L.T., Biomass and Bioenergy, 28(5), 499-507 (2005).
16 Klass, D.L., Biomass for Renewable Energy, Fuels, and Chemicals, Academic Press, New York (1998).
CONTACT
Michael A. Serio, [email protected]