Differential Diagnosis of Thick Myocardium according to Histologic ...
Upload
independentCategory
view
1download
0
Bulletin of Mathematical Biology (2008) 70: 910–949DOI 10.1007/s11538-007-9285-y
O R I G I NA L A RT I C L E
Mathematical Modeling of Mechanically Modulated RhythmDisturbances in Homogeneous and HeterogeneousMyocardium with Attenuated Activity of Na+–K+ Pump
Tatiana Sulman, Leonid B. Katsnelson∗, Olga Solovyova,Vladimir S. Markhasin
Institute of Immunology and Physiology, Ural Division of the Russian Academy of Sciences,Bldg. 91, Pervomayskaya str., 620041, Ekaterinburg, Russia
Received: 30 August 2006 / Accepted: 3 October 2007 / Published online: 8 February 2008© Society for Mathematical Biology 2007
Abstract A mathematical model of the cardiomyocyte electromechanical function isused to study contribution of mechanical factors to rhythm disturbances in the case ofthe cardiomyocyte calcium overload. Particular attention is paid to the overload causedby diminished activity of the sodium-potassium pump. It is shown in the framework ofthe model, where mechano-calcium feedback is accounted for that myocardium mechan-ics may significantly enhance arrhythmogenicity of the calcium overload. Specifically,a role of cross-bridge attachment/detachment processes, a role of mechanical conditionsof myocardium contractions (length, load), and a role of myocardium viscosity in the caseof simulated calcium overload have been revealed. Underlying mechanisms are analyzed.Several approaches are designed in the model and compared to each other for recovery ofthe valid myocardium electrical and mechanical performance in the case of the partiallysuppressed sodium-potassium pump.
Keywords Active myocardium mechanics · Muscle viscosity · Ionic currents ·Mechano-electric feedback · Heart rhythm · Extrasystole
1. Introduction
Rhythm disturbances are prevalent and potentially lethal complications of heart diseases.Calcium overloading of cardiomyocytes is one of the principal factors inducing rhythmdisturbances on the cellular level. For example, Ca2+ accumulation in cardiomyocytesduring heart failure is fraught with a risk of delayed afterdepolarization, triggered activityand fibrillation, as a consequence of spontaneous Ca2+ releases induced by sarcoplas-mic reticulum (SR) overload (Kihara and Morgan, 1991; Lakatta and Guarnieri, 1993;Thandroyen et al., 1991).
∗Corresponding author.E-mail addresses: [email protected]; [email protected] (Leonid B. Katsnelson).

Mathematical Modeling of Mechanically Modulated Arrhythmias 911
One of the mechanisms causing calcium overload, arises in consequence of decreasedactivity of the sodium-potassium pump (Noble and Varghese, 1998). Given the complexityof intracellular mechanisms underlying arrhythmogenesis, detailed mathematical modelscan help to outline causal chains of events and to identify possible targets for interven-tion. Indeed, previous research has focused on mathematical modeling of rhythm distur-bances caused by calcium overload (Luo and Rudy, 1994; Noble, 2002a, 2002b; Nobleand Varghese, 1998), including the case of reduced sodium-potassium pump activity (No-ble and Varghese, 1998).
Nevertheless, none of these studies have taken into account possible contributions ofmechanical factors to the studied phenomena. This may be important since cardiac dis-eases tend to affect the mechanical environment of cardiomyocytes, often giving rise tohighly heterogeneous changes in the distribution of active and passive stress-strain pat-terns (Gallagher et al., 1986; Lew, 1987; Tennant and Wiggers, 1935).
Here we try to address the lack of such analysis with the help of our mathematicalmodel of the cardiomyocyte electromechanical behavior, which has been used to eluci-date the effects of mechanical conditions on action potential (AP) configuration in ven-tricular cardiomyocytes (Solovyova et al., 2003). For the present study, the description ofmechanical activity has been improved (Katsnelson et al., 2004) that allows us to studymore delicate mechano-electric feedback effects.
When Na+–K+ pump activity is reduced in the model, the calcium overload devel-oped gradually during a series of isometric contractions (initiated by a regular stim-ulation). We studied whether mechanical conditions contributed to arrhythmogenesis,e.g., to spontaneous AP generation during interstimulus intervals when the intracellu-lar calcium increased. The following mechanical factors were considered: dependency ofcalcium-troponin kinetics on force generating cross-bridge (Xb) concentration (coopera-tivity mechanism); different mechanical loads; different initial lengths of the contactingsamples; myocardial viscosity; mechanical interaction of cardiomyocytes with heteroge-neously changed Na+–K+pum activity.
The essence of the results obtained is as follows. Using the model without the me-chanical component, only a very high degree of inhibition of the Na+–K+ pump, in fact,produced extrasystoles. This observation is fully consistent with the results of the simula-tion performed by Noble and Varghese (1998) using the Earm–Hilgemann–Noble model(1990, 1987). However, we showed that the mechanical effects on Ca2+ handling andelectrical activity may significantly increase vulnerability for triggered activity, when theNa+–K+pum attenuated.
2. Model description
Two principal configurations of mathematical models were used. One of them is con-cerned with electromechanical activity in the single cardiomyocyte and may also be usedto address the electromechanical performance of homogeneous myocardium.
The second configuration is aimed at elucidating basic electromechanical propertiesof heterogeneous myocardium, assessed in its simplest configuration (i.e., employing twointeracting elements), referred to as a muscle duplex (as described elsewhere Markhasin etal., 2003; Solovyova et al., 2003). Here we use only one particular duplex representationof heterogeneous myocardium: the in-series virtual duplex, where each duplex element is

912 Sulman et al.
represented by the model of homogeneous myocardium segment mentioned above. Belowwe specify the relevant features of both model configurations, while the complete set ofordinary differential equations is presented in Appendix B.
2.1. Single ventricular cardiomyocyte model
In this study, we used an updated version of the Ekaterinburg-Oxford (EO) model of car-diomyocyte electromechanical activity, in which the block of equations describing me-chanical activity was modified (see below for the modifications). The original EO model(EO 2003) has been reported in detail elsewhere (Solovyova et al., 2003) and describescardiomyocyte mechanical function and calcium regulation of contractile proteins (Eka-terinburg contribution); and intracellular ionic currents underlying AP development (Ox-ford contribution represented by the Noble ’98 model Noble et al., 1998).
In general, the EO model consists of three blocks: “electrical,” “chemical,” and “me-chanical.” The electrical block comprises an equation for the membrane potential, andequations for dynamic parameters that specify the probabilities for the ionic channels tobe in an open state. These are used to calculate ionic currents, which in turn determine po-tential change. The “chemical” block of the system (Fig. 1, panel I) comprises equationsdescribing the kinetics of intracellular concentrations of calcium, sodium and potassium([Ca2+]i , [Na+]i , [K+]i , respectively), extracellular potassium ([K+]o), the kinetics ofcalcium complex formation with cytosolic ligands, including the regulatory complexesof calcium with troponin C (CaTnC), and equations describing calcium kinetics in thejunction and net compartments of the SR. The mechanical block of the EO 2003 modelcomprises equations and formulas for myocardium tension, length changes in sarcomeresand whole cardiomyocyte, including a representation of the concentration of force gener-ating Xb concentrations. The latter process was reflected in a simplified manner, adequatefor previous applications.
The EO model pays special attention to the processes of association and dissociation ofCaTnC complexes along actin filaments, as these control activation of the cardiomyocytecontractile proteins. Three types of cooperativity of Ca2+ activation are taken into accountin the model.
Xb-CaTnC cooperativity (Type 1). The rate of any CaTnC complex dissociation de-creases with an increase in the amount of the average fraction of force-generating cross-bridges per single CaTnC complex (Gordon et al., 2001; Katsnelson and Markhasin,1996).
CaTnC-CaTnC cooperativity (Type 2). The rate of CaTnC complex dissociation de-creases with increased amounts of other CaTnC complexes in the proximity (Gordon etal., 2001; Katsnelson and Markhasin, 1996).
Tropomyosin end-to-end cooperativity (Type 3). Ca2+ binding with TnC molecules,located at 2 neighboring functional subunits of the thin filament, results in end-to-endinteractions between adjacent tropomyosins, and thus in opening of the additional actinsites for myosin head attachment; (the functional subunit consists of 7 actin monomerscovered by a common subfragment of the tropomyosin filament connected with one in-dividual troponin) (Katsnelson and Markhasin, 1996; Katsnelson et al., 2004; Murrayand Weber, 1981).

Mathematical Modeling of Mechanically Modulated Arrhythmias 913
Fig. 1 Panel I: Scheme of the ionic currents accounted for in the cardiomyocyte model. The currentsmodeled (ix ) contribute to the development of action potential and/or calcium transient. Here iCaL—Ca2+influx via L-type Ca2+ channels; irel—Ca2+ release from terminal cisterns (TC) triggered by Ca2+ en-tered from dyadic space (DS); CaTrop—concentration of Ca2+ bound by specific troponin C to activatethe contractile element (CE) from the rheological scheme (see Panel II); B1, B2—concentration of Ca2+bound by a fast and a slow buffer; iup—Ca2+ uptake by the sarcoplasmic reticulum pump into longitu-
dinal reticulum (LR); itr—Ca2+ diffusion between LR and TC; CaS—concentration of Ca2+ complexeswith calsequestrin; iNaCa—sodium–calcium exchange current; ibCa—background Ca2+ current. Panel II:rheological scheme of a single cardiomyocyte/homogeneous myocardium sample. Details are described inthe text. Panel III: rheological scheme of a virtual duplex formed of two homogeneous elements. The lefthalf of the panel, XSE (1) included, represents one element of the duplex, and the right half represents asecond element.
The mechanical dependence of CaTnC kinetics is implemented by making CaTnCdissociation dependent on cross-bridge kinetics, which in turn depends on the sarcomereshortening/lengthening velocity and on current sarcomere length. (The latter dependencemay be explained by several factors including the effect of lattice spacing Fuchs andMartyn, 2005; Moss et al., 2004). On the other hand, the current number of the force-generating cross-bridges depends on the CaTnC concentration. Thus, mechano-dependentcooperative modulation of CaTnC dynamics is intrinsic to the model, and reveals itselfboth in mechanî-mechanical coupling, e.g., length- and load-dependence of contractionand relaxation (Izakov et al., 1991; Solovyova et al., 2002), and in mechano-calciumcoupling, e.g., Ca2+ transient dependence on the time-course of changes in muscle lengthor load (Katsnelson and Markhasin, 1996; Solovyova et al., 2002).
Furthermore, the EO 2003 model takes into account both direct coupling and feed-back between electrical and mechanical phenomena. In particular, the effect of cross-bridge concentration on CaTnC kinetics, and hence on [Ca2+]i and in turn, the Na+–Ca2+

914 Sulman et al.
exchange current, underlies feedback between mechanical behavior and electric activity(mechano-electric feedback (MEF)) (Solovyova et al., 2003).
The type 1 cooperativity of the first type will prove to be of special importance in thisstudy as well. Let us pay a little more attention to it. This cooperativity is specified in themodel by an exponential function h π(NA) in the differential equation describing CaTnCkinetics
dA
dt= aon · (Atot − A) · CaC − aoff · exp(−kA · A) · π(NA) · A,
where A is CaTnC concentration, and NA is an average fraction of attached cross-bridgesper CaTnC complex. π(NA) decreases with the NA increase. One more exponential func-tion exp(−kA · A) in this equation means type 2 cooperativity.
2.2. Recent modifications of the EO model (EO 2006)
Modifications relate to the description of mechanical activity and its regulation. Thesemodifications were described in detail and justified in the framework of the mechanicalsubmodel (Katsnelson et al., 2004).
In the EO 2006 concentration of the force-generating cross-bridges, N is describedby a new differential equation, in which the cross-bridge attachment rate depends on theCaTnC concentration A, the length of thick and thin filament overlap zone Loz(l1) (de-pending in its turn on the sarcomere length l1), and average probability n of a myosinhead to attach to a thin filament (depending in turn on the l1) unlike in the EO 2003 modelwhere N was simplistically assumed to be a product of these magnitudes A, Loz(l1), n.
Furthermore, the above-mentioned magnitude NA now may be expressed via the newphase variable N : NA = N/(L)oz · A). The dependence π(NA), defining type 1 cooper-ativity is now expressed as π(N/(Loz · A)). It is important to note that the variable N
in the numerator of the above formula is now not proportional to the variable A in itsdenominator, unlike in the EO 2003 model. Therefore, the new formulation of N resultsin a lag between the time course of the increase/decrease in CaTnC concentration A andthat of an increase/decrease in the cross-bridge concentration N . Such a lag, in particu-lar, reveals itself as a faster decrease in the variable N as compared to a decrease in thevariable A during the relaxation phase of any contraction-relaxation cycle. Consequently,dissociation of CaTnC intensifies during any relaxation phase via the type 1 cooperativityπ(N/(Loz · A)). This point proved principally important for the results obtained in thiswork (see Section 3.2.2.1 below).
Viscosity was added to the equations of the model. The modified rheological schemeof the mechanical block of the model has been justified earlier (Katsnelson et al., 2004).
The new version of the EO model comprises mathematical descriptions of all the mech-anisms responsible for the successful simulation of the mechanical and electrical per-formance of the myocardium from the previous version of the model. Therefore, all therespective phenomena are also well-simulated in the new one. Here we only list these phe-nomena briefly. In particular, the list includes time courses of a number of processes dur-ing isometric and isotonic contractions of the heart muscle (tension development, lengthchange, calcium transient, membrane potential, various ionic currents, etc.) as well as allits basic mechanical characteristics (length—force, force—velocity, end-systolic length—relaxation time, etc.) (Izakov et al., 1991; Solovyova et al., 2002). Such well-known ef-fects as muscle response to quick deformations during isometric and isotonic twitches

Mathematical Modeling of Mechanically Modulated Arrhythmias 915
and load dependent relaxation as well as experimentally observed disappearance of load-dependence during severe myocardial hypertrophy can be simulated and explained usingany version of the model (Izakov et al., 1991; Katsnelson and Markhasin, 1996). More-over, experimentally observed effects of mechanical conditions of muscle contraction onthe calcium transient (Katsnelson and Markhasin, 1996: Solovyova et al., 2003) and onthe action potential duration (Solovyova et al., 2003) are also successfully reproduced byboth EO 2003 and EO 2006 models. Finally, both innovations in the mechanical part of themodel have been already verified in a special study (Katsnelson et al., 2004). In addition,a role of the viscosity in the experimentally observed features of myocardial relaxationwas ascertained (ibidem).
One more feature of the EO model is to be mentioned here. We really have a vari-ant of the model where stretch activated channels are accounted for Solovyova et al.(2003). Nevertheless, in this work, we premeditatedly eliminated these channels to an-alyze possible contribution of the mechanical sensitivity of Ca2+ kinetics by itself to thearrhythmogenesis. Interplay between mechano-sensitive Ca2+ kinetics and stretch acti-vated channels is an exceptionally important problem, and we are going to address thisproblem in a special study in future and analyze in the model the role of this interplay inthe arrhythmogenesis.
2.3. Virtual muscle duplex as a simplest mathematical model of heterogeneousmyocardium
We have been developing a condensed model of cardiac heterogeneity: the muscle du-plex, which allows us to study the basic effects of the interaction between heterogeneousmyocardial elements on the electromechanical activity of each element and the whole sys-tem (Markhasin et al., 2003; Solovyova et al., 2002, 2003, 2006). The duplex consists ofa pair of dynamically interacting multicellular cardiac muscle preparations that are me-chanically interconnected, either in series or in parallel. The method of virtual in-seriesduplex is implemented in this work (Fig. 1, panel III). Such a duplex is a mathematicalmodel representing a pair of interacting elements, where each element is described by theindividual EO 2006 model (with distinct values of the model parameters for either the ele-ment), and constraint equations are added. The principal feature of the in-series duplex isthe identity of the tension in each element and the tension developed by the whole duplex.Therefore, the first of the constraint equations mirrors the equality of tensions developedby the partners in the duplex. The second equation prescribes a constant value to the sumof the lengths of the two elements in the isometric mode of duplex contraction.
Despite the usage of the EO model for representing the duplex elements, each elementis interpreted as a homogeneous muscle segment, rather than a single cardiomyocyte. Inother words, each duplex element is considered as a group of cardiomyocytes in closeproximity to each other with identical electromechanical properties that are stimulatedalmost simultaneously. An important feature of the duplex model is that the temporalrelationship of the elements is under experimental control. Introducing a variable time de-lay for the electrical activation allows one to simulate the activation delays found betweendistant myocardial segments in vivo.

916 Sulman et al.
3. Numerical experiments: effects of the reduced sodium-potassium pump activityon the electromechanical function of a single cardiomyocyte
3.1. Simulation of normal steady-state mechanical activity of paced cardiomyocyte
Initially, parameter values were found to simulate the normal myocardial contraction ata steady state over a wide range of stimulation frequencies (40–120 stimuli/m) using thenew version of the EO model. In particular, the main mechanical characteristics of thesteady-state contraction-relaxation cycle at 60 stimuli/m were: Fm (peak active force) =6.9 (force here and below is expressed in dimensionless units obtained by normalizing toits passive value at 0.95 Lmax, where Lmax corresponds to the myocardium sample lengthwhere it develops a maximum active isometric tension); and t30 (relaxation time to 30%of Fm) = 180 ms.
Found parameter values are taken to be the control (basic) values for our study. (Seein Appendix B). Obtained steady-state diastolic values of phase variables are chosen asinitial ones for the respective frequencies in the following numerical experiments in whichthe Na+–K+ pump activity is attenuated.
3.2. Simulation of rhythm disturbances in a single ventricular cardiomyocyte withattenuated sodium-potassium pump function
3.2.1. Variant 1: rhythm disturbances in the case of eliminated influence ofcardiomyocyte mechanics on electrical activity in the model
To clarify an effect of decrease in the activity of the Na+–K+ pump on arrhythmogenesis,the mechanical part of the model was temporarily removed in a special series of numeri-cal experiments. This was achieved by doing the following: Crossbridge attachment anddetachment constants were zeroed and the function π(NA) describing type 1 cooperativ-ity in the equation for CaTnC kinetics was set to be equal to 1. The latter change undulyincreased the rate of CaTnC dissociation in this equation, as π(NA) is normally much lessthan 1. Therefore, maximum off-rate (parameter aoff) in the same equation was 4.6-folddecreased to compensate the increase. As a result, the normal pattern (amplitudes andduration) of the [CaTnC] time course was restored in the model.
Evidently, no influence of cross-bridge kinetics on Ca2+ handling might be observedin the model in this case. The same is true as concerns the effects of the mechanicalconditions (length, load) of the contractions on Ca2+ handling, as the latter effects maybe mediated only by the cross-bridge kinetics in the model.
Using this altered model, we simulated the effects of a strong block of the Na+–K+
pump. In particular, sensitivity of pump to Na+, i.e., Michaelis constant Km,Na (see the for-mula describing Na+–K+ ATPase activity in Appendix B) was set to 110 mM (i.e., 455%of the norm) or higher. Such blocking resulted in rhythm disturbances, including extrasys-toles, particularly for pacing equal to 75 stimuli/m. The relevant numerical experimentsare neither analyzed in more detail nor illustrated here, because these particular resultsare fully consistent; the data obtained was previously by Noble and Varghese (1998).
It is important for the following observations presented in this work that arrhythmiadid not arise in our numerical experiments for Km,Na < 455% of the norm (control), whenthe mechanical part of the model was removed as above.

Mathematical Modeling of Mechanically Modulated Arrhythmias 917
Thus, only a very strong block of the Na+–K+pump resulted in the rhythm distur-bances in the case, where cross-bridge kinetics, and, therefore, contribution of neither thiskinetics nor mechanical conditions to the intracellular Ca2+ handling were accounted forin the model.
3.2.2. Variant 2: Mechanical effects on rhythm disturbances and electromechanicaldissociation in the case of moderately attenuated function of thesodium-potassium pump
3.2.2.1. Contribution of the type 1 cooperativity When both cross-bridge attachment/detachment and type 1 cooperativity (Xb-TnC) were restored in the model, it was revealedthat rhythm disturbances also arose for a wide additional range of Na+–K+ pump inhi-bition orders of magnitude smaller than 455% of the norm. Namely, for Km,Na ≥ 40 mM(i.e., ≥165% of the control) extrasystoles occurred for all initial lengths ≤ Lmax and forall frequencies of the regular stimulation ≥75 stimuli/m. We represent here in detail anexample of such simulation obtained for 75 stimuli/m at Km,Na = 40 mM (i.e., at thelower boundary of the above-indicated inhibition range), at the length 0.9Lmax. Note thatarrhythmia did not arise for these parameter values at frequencies less than 75 stimuli/m,and steady-state contractions set in. In the particular case of 60 stimuli/m, the main me-chanical characteristics of steady-state contractions changed as compared to the normalstate (control): Fm = 7.36 (i.e., 107% of the control); and t30 = 215 ms (i.e., 119% of thecontrol).
However, at frequencies ≥75 stimuli/m, the following was observed (see Fig. 2).A breakdown of normal contractions happened after ∼170 stimuli, manifesting itself inspontaneous generation of extrasystoles and jumps of force amplitude (shown in Fig. 3).Gradually extrasystoles evolved to a concordant alternans of both force and calcium tran-sients, although it corresponded with action potentials of stable magnitudes and durations(marked out by curly bracket in Fig. 3). Thus, the contractions revealed certain featuresof electromechanical dissociation. The amplitudes of stronger and weaker contractionsduring the alternans gradually converged to a new steady-state level with quite low forceamplitudes.
Analysis of this series of numerical experiments confirmed in general that well-knownmechanisms, widely used for explanation of the rhythm disturbances resulting from theapplication of cardiac glycosides, actually underlie the extrasystoles produced in themodel simulations above. In particular, the low activity of the Na+–K+ pump gradu-ally leads to an increase in [Na+]i . This increase at stimulation frequencies equal to/over75 stimuli/m causes (via Na+–Ca2+ exchange during its reverse mode) accumulation ofCa2+ in the cell. The latter results in Ca2+ overload of the sarcoplasmic reticulum terminalcisterns (SRTC) and spontaneous Ca2+ release between stimuli. If the amount of the re-leased Ca2+ is sufficiently high, it triggers an extra AP (via Na+–Ca2+ exchange forwardmode current), and thus an extra contraction. However, the above scheme should be sup-plemented with some more processes to explain why SR calcium release channels openbetween stimuli in the case of moderately reduced Na+–K+ pump, where the diastoliclevel of [Ca2+]i is not high enough to cause by itself (without any additional mechanismsinvolved) spontaneous opening of these channels via the calcium induced calcium release.
The following sheds light on this additional mechanism that acts during regularcontraction-relaxation cycle preceding each extrasystole. Due to cooperative dependenceof TnC affinity to Ca2+ on cross-bridge concentration dissociation of CaTnC intensifies

918 Sulman et al.
Fig. 2 Contractions of a single virtual cardiomyocyte with attenuated activity of the Na+–K+ pump.L = 0.9Lmax; stimulation frequency: 75 stimuli/m. Panel I—tension development (F—arbitrary units).The magnifying glass under the time axis indicates the time interval where extrasystoles arose as revealedin detail in Fig. 3. Panel II—Calcium concentration in the terminal cisterns of the sarcoplasmic reticulum([Ca2+]TC). Panel III—intracellular sodium concentration ([Na+]i ). The magnifying lens under the panelI indicates the time interval represented in detail in Fig. 2. The band under the panel I indicates phases ofthe process where the cardiomyocyte distinctly responds to the recovery of the normal Na+–K+ pump(see Section 3.3 for details).
during the relaxation phase of any regular contraction-relaxation cycle (as was explainedin the above Section 2). Under normal conditions, this moderate intensification of theCaTnC dissociation does not lead to an increase in [Ca2+]i , because in the normal case

Mathematical Modeling of Mechanically Modulated Arrhythmias 919
Fig. 3 Details of the same series of contractions presented in Fig. 2. Panel I—three bands (top to bottom):time course of the tension development (F), calcium transients (Ca2+) and membrane potential (E) during137–160 s. Scores under the time axes indicate the moments of the regular stimuli (each 0.8 s). Verticalblack arrows are used here to indicate a subfragment (i) enlarged hereafter in Panel II (column (i)). (*)in column (i) of the Panel II indicates the extra AP following the regular one. Column (ii) of the Panel IIrepresents a numerical experiment being a special modification of the regular (leftmost) contraction shown
in column (i). In particular, after the moment indicated here by the empty arrow( ), the influence of thetype 1 (Xb-TnC) cooperativity on the CaTnC dissociation was eliminated in the model (see the text formore details), whereupon the extra AP vanished. Force in the respective panels as well as in the next twofigures is measured in arbitrary units.

920 Sulman et al.
Ca2+ dissociated from TnC leaves the cell immediately via the Na+–Ca2+ exchanger.However, the Na+–Ca2+ exchanger fails to compensate for this increase in free Ca2+ un-der calcium overload conditions, as the latter increases the diastolic Ca2+ level as well. Asa result, an additional quite small free calcium increment in cytosol arises at the end of therelaxation phase in this case. This modest increment, however, turns out to be substantialenough to initiate the opening of some relatively small numbers of SR calcium channelsrecovered from the refractory state. In turn, when the SR is overloaded with Ca2+, this rel-atively small amount is nevertheless sufficient to release a substantial amount of Ca2+ intothe cytosol. As a result, an extra action potential is triggered via the Na+–Ca2+ exchangerforward mode. The mechanism discussed considered here may be named Xb-inducedCa2+ release.
To confirm that the type 1 cooperativity through π(N/(Loz · A)) (see above Section 2for the notation used) plays a key role in the inducing extrasystoles observed, we car-ried out a special numerical experiment which was a modification of that shown in thecolumn (ii) of Panel II in Fig. 3. The experiment repeated exactly the regular contraction-relaxation cycle shown at the left of the column (i) of the same figure, but only until themoment when the term π(N/(Loz · A)) of the CaTnC off-rate constant reached its min-imum value πmin during the cycle. This moment (∼260 ms from the beginning of thecontraction) is marked by the empty arrow ( ) in the panels of the column (ii). After thismoment, the term π(N/(Loz · A)) was fixed at the value πmin in the equation describingCaTnC kinetics and thus eliminated the further effect of the Xb-kinetics on the process ofCaTnC dissociation. As a result, an extra AP did not occur despite the fact that all otherconditions remained the same as in the case demonstrated in the column (i), SR calciumoverloading included. This proves a key role of the type 1 (Xb-CaTnC) cooperativity inthe considered extrasystole appearance.
The same mechanism of the Xb-induced Ca2+ release underlies autorhythmic activityshown in Fig. 4. This result was obtained when in the simulation described above, stimu-lation was stopped after 137.6 s (i.e., after the second regular AP shown in Fig. 3, panel I).The latter stimulus was the only one in Fig. 4; all the following 24 successive contractionsin this figure are spontaneous.
Thus, the above-stated mechanism of the Xb-induced Ca2+ release demonstrates possi-ble contribution of mechanical processes (attachment/detachment of the force generatingcross-bridges) to electrical disturbances (extrasystoles). Type 1 (Xb-TnC) cooperativityturned out to be a potential trigger mechanism of this mechano-electric feedback.
3.2.2.2. Contribution of the myocardium mechanical heterogeneity In the simulationsdescribed here, a virtual in-series specific duplex was used as a model of heteroge-neous myocardium. The duplex was formed of two particular virtual elements withvariously reduced Na+–K+ pump. The first element (P-element, i.e., pathological ele-ment) represented a homogeneous segment consisting of cells identical to the cardiomy-ocyte described above, i.e., ones with diminished activity of the sodium-potassium pumpKm,Na = 40 mM, i.e., 165% of the control). The second element was a sub-critical one(SC-element) from the following viewpoint. First, the pump reduction in this element(also a homogeneous segment represented by virtual cardiomyocyte of another type)was lower than in P-element. Particularly, in SC-element Km,Na = 38 mM (157% of thecontrol), so the element by itself did not produce rhythm disturbances with the length≥ 0.9Lmax under the same conditions in isolation where the arrhythmia arose in P-element.

Mathematical Modeling of Mechanically Modulated Arrhythmias 921
Fig. 4 A sample of spontaneous rhythmic activity in the same virtual cardiomyocyte with attenuatedactivity of the Na+–K+ pump that presented in the previous figures. Top to bottom: time course of thetension development (F), calcium transients (Ca2+), calcium concentration in the terminal cisterns of theSR ([Ca2+]TC), and membrane potential (E) during 14 s. The process preceding the revealed time intervalcoincided during its first 137.6 s with that demonstrated in Figs. 2 and 3. However, in the new experimentstimulation was stopped after the regular stimulus imposed at 137.6 s. This last stimulus corresponds to
the leftmost AP (marked by ( ) shown in the bottom band of this figure. Unlike Fig. 3, all the next APsand respective contractions here are spontaneous ones.
Second, if further diminution of the SC-element Na+–K+ pump activity (≥5%) had beenimposed, this would have produced development of arrhythmia in the element before360 s. All other parameters in both virtual elements were equal. Particular parametersof the SC-element are given in Appendix B. To simulate excitation propagation in my-ocardial tissue various delays between stimulations of the duplex elements were imposedwhere a sequence of the element stimulation and values of the delay varied to mimic theeffect of different directions and velocities of propagation (see above Section 2 for theduplex concept).
A duplex formed of P- and SC-samples mimics the interaction of ventricular wallregions with different extent of local damage to the Na+–K+ pump. The main goal oftesting this duplex is to clarify whether mechanical interaction of such regions can leadto the spreading of the ectopic area from regions with higher pump depression to re-gions with lower depression. In the next subsection, we will consider various extentsof the pump depression in the SC-sample to assess them as potentially arrhythmogenicrisk.

922 Sulman et al.
Fig. 5 Tensions developed by P-sample (1) and SC-sample (2) in isolation (panel I), and being con-nected in series duplex with simultaneous stimulation of the elements (panel II) and two opposite timedelays of the duplex elements: either SC-element or P-element was regularly delayed by 30 ms (panels IIIand IV, respectively). Both the duplex and the samples in isolation contracted isometrically. The curvesrepresented are envelope lines traced through the tension amplitudes of all contractions of the respectiveelement/duplex during 360 s. Tensions of both elements in the duplex are equal to each other and to thetension of the duplex as a whole. Numbered horizontal square brackets under the time axis in all panelsindicate time intervals where extrasystolic action potentials appear in P-element of the duplex (bracket 1),and in SC-element of the duplex (bracket 2). Other details of the numerical tests conducted and propertiesof the virtual elements tested are given in the text.
The duplex experiments were carried out for 75 stimuli/m and duplex length equal to90% of its Lmax. Initial lengths of both duplex elements were equal to 90% of its Lmax
as well. Figure 5 demonstrates time courses of element/duplex force development during360 s. The forces are shown as envelope lines traced through the tension amplitudes of allcontractions for this time interval. Panel I of the figure reveals tension envelops of both theP-element (curve (1)) and the SC-element (curve (1)) when they contracted in isolation atthe length 0.9Lmax with the same stimulation frequency (75 stimuli/m). Oscillations seenin the middle of the curve (1) correspond to the alternating amplitude of tension in thefirst element. Panels II, III and IV of the figure represent tension envelops for the duplex
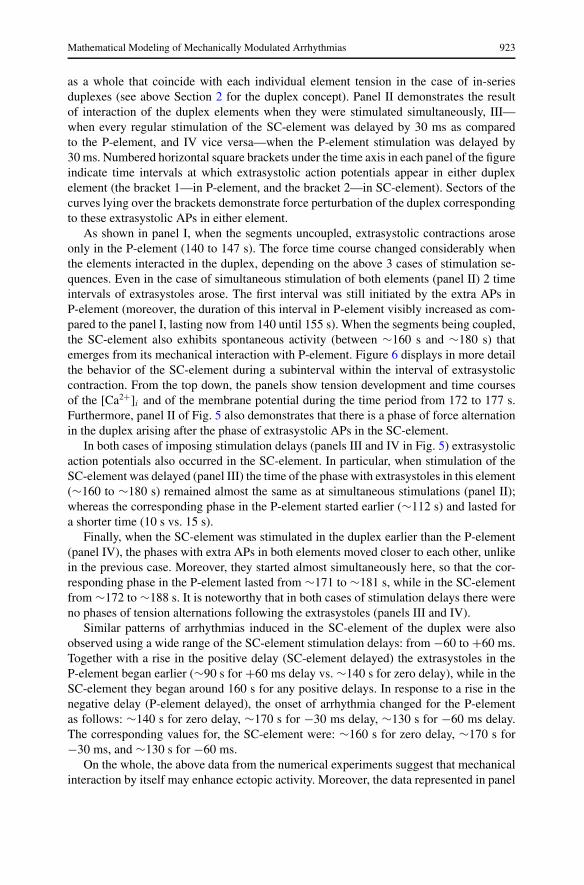
Mathematical Modeling of Mechanically Modulated Arrhythmias 923
as a whole that coincide with each individual element tension in the case of in-seriesduplexes (see above Section 2 for the duplex concept). Panel II demonstrates the resultof interaction of the duplex elements when they were stimulated simultaneously, III—when every regular stimulation of the SC-element was delayed by 30 ms as comparedto the P-element, and IV vice versa—when the P-element stimulation was delayed by30 ms. Numbered horizontal square brackets under the time axis in each panel of the figureindicate time intervals at which extrasystolic action potentials appear in either duplexelement (the bracket 1—in P-element, and the bracket 2—in SC-element). Sectors of thecurves lying over the brackets demonstrate force perturbation of the duplex correspondingto these extrasystolic APs in either element.
As shown in panel I, when the segments uncoupled, extrasystolic contractions aroseonly in the P-element (140 to 147 s). The force time course changed considerably whenthe elements interacted in the duplex, depending on the above 3 cases of stimulation se-quences. Even in the case of simultaneous stimulation of both elements (panel II) 2 timeintervals of extrasystoles arose. The first interval was still initiated by the extra APs inP-element (moreover, the duration of this interval in P-element visibly increased as com-pared to the panel I, lasting now from 140 until 155 s). When the segments being coupled,the SC-element also exhibits spontaneous activity (between ∼160 s and ∼180 s) thatemerges from its mechanical interaction with P-element. Figure 6 displays in more detailthe behavior of the SC-element during a subinterval within the interval of extrasystoliccontraction. From the top down, the panels show tension development and time coursesof the [Ca2+]i and of the membrane potential during the time period from 172 to 177 s.Furthermore, panel II of Fig. 5 also demonstrates that there is a phase of force alternationin the duplex arising after the phase of extrasystolic APs in the SC-element.
In both cases of imposing stimulation delays (panels III and IV in Fig. 5) extrasystolicaction potentials also occurred in the SC-element. In particular, when stimulation of theSC-element was delayed (panel III) the time of the phase with extrasystoles in this element(∼160 to ∼180 s) remained almost the same as at simultaneous stimulations (panel II);whereas the corresponding phase in the P-element started earlier (∼112 s) and lasted fora shorter time (10 s vs. 15 s).
Finally, when the SC-element was stimulated in the duplex earlier than the P-element(panel IV), the phases with extra APs in both elements moved closer to each other, unlikein the previous case. Moreover, they started almost simultaneously here, so that the cor-responding phase in the P-element lasted from ∼171 to ∼181 s, while in the SC-elementfrom ∼172 to ∼188 s. It is noteworthy that in both cases of stimulation delays there wereno phases of tension alternations following the extrasystoles (panels III and IV).
Similar patterns of arrhythmias induced in the SC-element of the duplex were alsoobserved using a wide range of the SC-element stimulation delays: from −60 to +60 ms.Together with a rise in the positive delay (SC-element delayed) the extrasystoles in theP-element began earlier (∼90 s for +60 ms delay vs. ∼140 s for zero delay), while in theSC-element they began around 160 s for any positive delays. In response to a rise in thenegative delay (P-element delayed), the onset of arrhythmia changed for the P-elementas follows: ∼140 s for zero delay, ∼170 s for −30 ms delay, ∼130 s for −60 ms delay.The corresponding values for, the SC-element were: ∼160 s for zero delay, ∼170 s for−30 ms, and ∼130 s for −60 ms.
On the whole, the above data from the numerical experiments suggest that mechanicalinteraction by itself may enhance ectopic activity. Moreover, the data represented in panel

924 Sulman et al.
Fig. 6 Detailed example of contractions, extrasystoles included, excerpted from the record of the ex-periment with the in-series virtual duplex presented in panel II of Fig. 5 where simultaneous stimulationwas applied to the duplex elements. Top to bottom: duplex/element tension, calcium transients in theSC-element, membrane potential in the SC-element during 172–176.8 s.
IV of the Fig. 5 show that this ectopic zone may expand even in the direction opposed tothe pathway of electrical propagation.
The mechanisms underlying the onset of spontaneous extra APs in the SC-element,when it is contracting within the in-series duplex, are analyzed in full in Appendix Afor every particular variant of time delays. In short, it is a length changes in the SC-element, which contribute mainly to these extra APs. The length changes via the type1 cooperativity mechanism enable bit-to-beat additional Ca2+ accumulation in the SRas compared to the SC-element isometric contractions in isolation. This calcium surplusshown in Fig. 7 gradually leads to reaching and exceeding the threshold for spontaneousCa2+ release from the SRTC unlike isometric contractions of the SC-element at 0.9Lmax
in isolation. It is necessary to highlight that just as before in this case the threshold ismeant as the level of Ca2+, for which the justified above mechanism of the Xb-inducedCa2+ release produces extrasystoles.
Addressing to Appendix A in which the mechanism of additional Ca2+ accumulationin the SR of the SC-element is justified in detail, anyone may ascertain that in the casewhen the SC-element is stimulated earlier than its counterpart, the result (extrasystolesin the SC-element) does not depend on specific properties of the counterpart. To checkthis proposition, we formed two additional virtual duplexes connected in-series: a homo-geneous one, that consisted of two identical SC-elements (SC–SC), and a heterogeneousone where the SC-element interacted with a normal one (SC–N). Then the 30 ms delaywas applied to either partner in the duplex SC–SC and to the normal element in the du-plex SC–N. Indeed, extrasystoles arose in the stimulated earlier SC-element in both thesecases.

Mathematical Modeling of Mechanically Modulated Arrhythmias 925
Fig. 7 Gradual growth of calcium concentration in the SR terminal cisterns of SC-sample (solid lines)when it contracted in the series duplex formed with P-sample, against the same data for the SC-samplecontracting in isolation (dotted lines). Panel I corresponds to the simultaneous stimulation of the duplexelements. Panels II and III in turn represent the results of the same opposite time delays (±30 ms) wedealt with in Fig. 5. The curves represented are envelope lines traced both through [Ca2+] maximum andminimum values during 360 s. Horizontal square brackets under the time axis in all the panels indicatetime intervals where extrasystolic action potentials appear in P-element of the duplex. In panel I and panelII, this interval evidently coincided with that where [Ca2+] in SRTC of the SC-element jumped for thefirst time over its level peculiar for the isolated contractions of this sample. As explained in the text,this increase in [Ca2+] of the SC-element does result from the extrasystoles in the P-element and frommechanical interaction of the elements.

926 Sulman et al.
Thus, the modeling suggests that mechanical interaction of the myocardium segmentsin the ventricle wall is an important factor promoting extension of ectopic zone in the wall.As regards the mechanisms underlying this extension, our experiments with the virtualduplex showed that the length changes of the SC-element during contractions within theduplex eventually resulted in extrasystolic APs in that element. This impelled to additionaltests in isolation, where various mechanical conditions were prescribed as follows.
3.2.2.3. SC-sample response to changes in the mechanical conditions of contraction inisolation The SC-sample is a homogeneous one. Therefore, when interpreting its con-tractions in isolation, results can be attributed to both the element as a whole and itsarbitrary cardiomyocyte. All the numerical experiments with the SC-sample in isolationwere performed using the same stimulation frequency, 75 stimuli/m and during the sameoverall time (0 to 360 s) as applied in the above experiments. An initial length of 0.9Lmax
was used in the numerical experiments with the SC-sample. Steady-state values reachedat 0.9Lmax were used as initial conditions.
Figure 8 demonstrates series of SC-sample isometric contractions for various initiallengths: that is, 0.9Lmax, 0.88Lmax, 0.85Lmax, 0.82Lmax from top to bottom (note that de-spite the fact that the element length did not change during isometric contraction and waspermanently equal to its initial length, sarcomeres of the element in fact shortened duringevery contraction (due to the compliance of the series elastic element SE, see Fig. 1)).All panels in the figure again represent envelope lines traced through the tension ampli-tudes of all contractions. Horizontal brackets under the time axes mark time sub-intervalswhere the extrasystolic APs arose. The line shown in panel I of the figure coincides withthe curve (1) shown in panel I of Fig. 5 as it represents a control SC-sample behavior for0.9Lmax, where no rhythm disturbances were observed in the element. Extrasystoles firstappeared in the element when its initial length was reduced to 0.88Lmax. In that case, thetime interval of their appearance lasted from 268 s till 280 s. The smaller the initial lengthchosen the earlier this interval happened: 190 s to 205 s for 0.85Lmax and 151 s to 169 sfor 0.82Lmax.
Then 5 series of SC-sample contractions in isotonic mode were performed using aconstant afterload ranging from 0.5Fm to 0.9Fm (initial length was 0.9Lmax, stimulationfrequency was 75 stimuli/m). Fm here means the maximum of the isometric contractionperformed with the same initial conditions at 0.9Lmax. Note that for any muscle the smallerthe afterload the shorter is the muscle/sarcomere length reached during contractions. Inour series of isotonic contractions, no rhythm disturbances were obtained for afterloadsof 0.9Fm, 0.8Fm and 0.7Fm. However, extrasystoles arose at 0.6Fm and 0.5Fm; and thesmaller the afterload applied the earlier the onset of the extrasystolic APs: 198 s to 213 sfor 0.6Fm, 170 s to 187 s for 0.5Fm.
Thus, the data obtained in the numerical experiments with SC-sample showed evidentdirect contribution of mechanical conditions of contractions (imposed loads and initiallengths) to the arrhythmogenesis in this sample. In both the case of isometric contrac-tions of the sample (at lengths <0.9Lmax) and that of isotonic contractions (at afterloads≤0.6Fm), the mechanisms underlying extrasystoles principally coincides with that for thecase when the SC-sample shortens additionally within an in-series duplex. Briefly, in allthe cases the smaller length of the SC-sample gradually leads to additional Ca storage inthe SR and thus promotes extra APs (see Appendix A for details of the mechanisms).

Mathematical Modeling of Mechanically Modulated Arrhythmias 927
Fig. 8 Tensions developed by the SC-sample contracting isometrically in isolation at different preimposedlength: 0.9Lmax (panel I), 0.88Lmax (panel II),0.85Lmax (panel III), 0.82Lmax (panel IV). Details aregiven in the text.
3.2.3. Clarification of the ranges of the Na+–K+ pump activity that may be loaded withrhythm disturbances due to the cardiomyocyte mechanics
The data presented above have shown that for 455% > Km,Na ≥ 165% (percentage iscalculated relative to the normal pump state) extrasystoles steadily arose in the numerical

928 Sulman et al.
experiments at any length, but only due to the contribution of the mechanical part ofthe model, particularly via the mechano-induced CaTnC dissociation mechanism (type 1cooperativity). The low value of this interval equal 165% (i.e., 40 mM) is the Km,Na valuefor the P-sample.
Furthermore, we demonstrated the effects of direct mechanical perturbations (lengthor load diminution and mechanical interaction with neighboring cardiomyocytes) on theinitiation of extrasystolic contractions in the SC-sample in which the Na+–K+ pump ac-tivity was a little outside the above interval of Km,Na values. Particularly, Km,Na in theSC-sample was 38 mM 157% of the norm). Rhythm disturbances did not arise in the SC-sample at the standard experimental lengths (≥0.9Lmax) without the direct mechanicalinterventions applied.
To determine the total range of Km,Na values where the above direct mechanical inter-ventions still may be arrhythmogenic, additional numerical experiments were carried outand showed that extrasystoles also arose for Km,Na = 37 mM, i.e., 153% of the norm (inthis case the disturbances occurred only at very small lengths not higher than 0.82Lmax).However, even the direct mechanical impacts did not induce arrhythmia for any lengthsat all, when Km,Na < 37 mM. This indicates a specific interval of the attenuated Na+–K+
pump activity, which is not steadily arrhythmogenic, but may be considered as a risk zoneor a border zone from the viewpoint of the rhythm disturbances induced by direct me-chanical impacts. The interval is represented by Km,Na values from 153% to 165% of thenorm.
3.3. Normal rhythm recovery in the P-sample
Our model was used to predict possible approaches to the elimination of the rhythm dis-turbances and restoration of the normal contractions.
All the rhythm disturbances in P-cardiomyocyte were suppressed as soon as a suffi-ciently high rate of the sodium-potassium pump was recovered. However, for the totalrecovery of the normal rhythm in any mechanical conditions, it turned out necessary toovercome slightly the control level of the pump rate (i.e., the initially normal state ofthe pump activity), because simple reestablishment of the normal Na+–K+ ATP-ase statesurprisingly did not always provide the recovery. In this case, the result substantially de-pended on the phases of the “acute heart failure” development, in which the reestablish-ment (i.e., the normal value of Km,Na) was done.
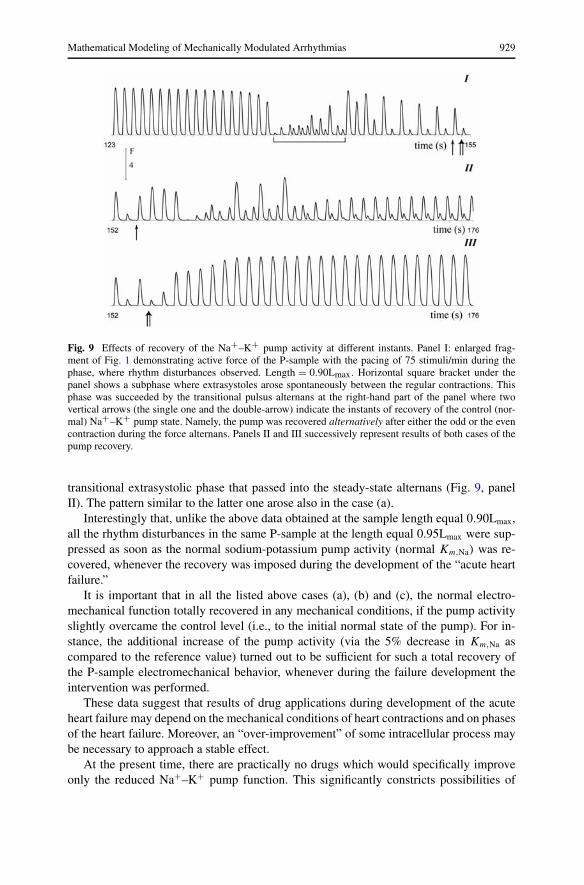
Specifically, the band under the time axis in Fig. 2 (panel I) shows such phases for theP-sample: white parts of the band indicate the phases where reestablishment of the normalKm,Na resulted in the total recovery of both the normal rhythm and normal contractionpattern. However, results of the normal Km,Na reestablishment was not so successful andstable during the shaded part of the band. Particularly, the reestablishment was tested(a) during the extrasystolic subphase indicated with the horizontal square bracket underFig. 9; (b) after each low (odd) contraction during the transitional alternans subphase thatsucceeded extrasystolic one; (c) after each high (even) contraction during the alternanssubphase. An example of (b) is indicated with the vertical arrow under time axis of thepanel I in Fig. 9, and that of (c)—with the double-arrow. The tests showed that the normalelectromechanical activity recovered totally only in the case (c) (see Fig. 9, panel III).In the case (b) the reestablishment of the normal Na+–K+ pump resulted in one more
Mathematical Modeling of Mechanically Modulated Arrhythmias 929
Fig. 9 Effects of recovery of the Na+–K+ pump activity at different instants. Panel I: enlarged frag-ment of Fig. 1 demonstrating active force of the P-sample with the pacing of 75 stimuli/min during thephase, where rhythm disturbances observed. Length = 0.90Lmax. Horizontal square bracket under thepanel shows a subphase where extrasystoles arose spontaneously between the regular contractions. Thisphase was succeeded by the transitional pulsus alternans at the right-hand part of the panel where twovertical arrows (the single one and the double-arrow) indicate the instants of recovery of the control (nor-mal) Na+–K+ pump state. Namely, the pump was recovered alternatively after either the odd or the evencontraction during the force alternans. Panels II and III successively represent results of both cases of thepump recovery.
transitional extrasystolic phase that passed into the steady-state alternans (Fig. 9, panelII). The pattern similar to the latter one arose also in the case (a).
Interestingly that, unlike the above data obtained at the sample length equal 0.90Lmax,all the rhythm disturbances in the same P-sample at the length equal 0.95Lmax were sup-pressed as soon as the normal sodium-potassium pump activity (normal Km,Na) was re-covered, whenever the recovery was imposed during the development of the “acute heartfailure.”
It is important that in all the listed above cases (a), (b) and (c), the normal electro-mechanical function totally recovered in any mechanical conditions, if the pump activityslightly overcame the control level (i.e., to the initial normal state of the pump). For in-stance, the additional increase of the pump activity (via the 5% decrease in Km,Na ascompared to the reference value) turned out to be sufficient for such a total recovery ofthe P-sample electromechanical behavior, whenever during the failure development theintervention was performed.
These data suggest that results of drug applications during development of the acuteheart failure may depend on the mechanical conditions of heart contractions and on phasesof the heart failure. Moreover, an “over-improvement” of some intracellular process maybe necessary to approach a stable effect.
At the present time, there are practically no drugs which would specifically improveonly the reduced Na+–K+ pump function. This significantly constricts possibilities of

930 Sulman et al.
the normal pump reestablishment in patients. Therefore, in the framework of the modelwe studied various alternative ways to modulate (amplify or attenuate) other intracellularmechanisms that may lead to some reduction of the cardiomyocyte Ca2+ loading, and thusto the recovery of both the normal rhythm and satisfactory mechanical characteristics ofthe contractions without intensifying Na+–K+ pump activity. Particularly, such alternativeinterventions applied to the P-sample gave the following results.
Clear antiarrhythmic effect resulted from a decrease in the rate of calcium uptake bythe SR Ca2+ pump, even if the sodium-potassium pump function was not recovered. Forexample, 13% decrease in the maximal rate of the calcium uptake αup = 0.87 mM/s vs. ba-sic value αup = 1 mM/s, suppressed rhythm disturbances at 0.95Lmax, while extrasystolesstill arose for the smaller cardiomyocyte lengths. Total “curing” of the cardiomyocytefor all the lengths ensued from αup = 0.82 mM/s, i.e., from 18% SR-uptake rate decrease.The mechanism of the “curing” is as follows. Redistribution between SR Ca2+ uptake andCa2+ removal from the cytosol via the Na+–Ca2+ exchange current shifted in favor of theCa2+ removal from the cell due to the slowing down of the SR uptake. Thanks to this shiftthe total level of intracellular Ca2+ remained lower than that causing rhythm disturbances.It is important to highlight that the moderate (less than 20%) decrease in the rate of theSR calcium uptake did not lead to an increase in the diastolic level of cytosolic calciumas compared with normal levels (at normal Na+–K+ pump activity), because Na+–Ca2+exchange (forward mode) during each relaxation was capable of compensating for thedecrease and withdraw Ca2+ from the cytosol, when it was not pumped into the SR.
Alternatively, suppressing the rhythm disturbances was achieved by decelerating L-type Ca2+ current, iCaL, via decrease in the Ca2+ permeability of L-type Ca2+ channels(parameter PCa). For example, when PCa was decreased to 85% of the basic value, ex-trasystoles vanished at 0.95Lmax, but they still arose for the smaller lengths. The total“curing” for all the lengths was observed with PCa of 80% of the basic value.
Moreover, antiarrhythmic effects were also obtained at all lengths in the case of Na+–Ca2+ exchange acceleration (20% increase in turnover rate kNaCa : kNaCa = 0.0006 nAinstead of the basic (control) kNaCa = 0.0005 nA) and in the case of decrease in sensitiv-ity of the SRTC calcium release to the [Ca2+]i (20% increase in parameter KmCaCyt :KmCaCyt = 0.0006 mM instead of the basic (control) KmCaCyt = 0.0005 mM).
When the “antiarrhythmic treatment” using one of the above parameters was applied assoon as the first extrasystole occurred at 0.9Lmax, the arrhythmia disappeared immediatelyafter the intervention was implemented. However, the time for the recovery of steady-state force amplitudes varied depending on each particular parameter change. Specifically,steady-state was reached in 160 s after the Km,Na-decrease, in 100 s after the αup-decrease,in 160 s after the PCa-decrease, in 100 s after the kNaCa-increase, and in 100 s in the caseof the KmCaCyt-increase.
Table 1 demonstrates how the peak of SR Ca2+ load as well as both inotropic (Fm)
and lusitropic (t30) characteristics of contraction-relaxation changed in comparison withthe control due to the above alternative antiarrhythmic influences. The data for the tablewere obtained in the case where the influences were applied right at the beginning of therespective numerical tests, all conducted at 0.9Lmax. The presented values were recordedat 153 s (after this time the characteristics considered did not change significantly in allthe tested series of contractions).
[Ca2+]TC, Fm and t30 are given as a percentage of the corresponding values in thenormal cardiomyocyte.

Mathematical Modeling of Mechanically Modulated Arrhythmias 931
Table 1 Results of different “treatments”
Fm t30 [Ca2+]TC
SR pump slowing-down 88.5% 101.8% 122.9%αup = 0.82 mM/s(82% of the norm)
L-type Ca2+ current reduction 95.7% 104.1% 122.7%PCa = 0.08 nA mM(80% of the norm)
Na+–Ca2+ current amplification 99.2% 108.8% 135.1%kNaCa = 0.0006 nA(120% of the norm)
Ca2+ sensitivity of the SR119.7% 138.2% 134.2%
Ca2+ release reductionKmCaCyt = 0.0006 mM(120% of the norm)
It is important to mention for comparison that there were Fm = 93%, t30 = 105%,[Ca2+]TC = 142% (of the norm) in P-cardiomyocyte just before the rhythm disturbance.
Note that applying a much higher speed-up of the Na+–Ca2+ exchange (200% of thebasic kNaCa vs. 120% represented in Table 1) resulted in a more positive inotropic effect—even as compared to the control (Fm = 101.3% of the normal peak force), while t30 was104.7% of the control and [Ca2+]TC still remained significantly higher than in the normalcardiomyocyte (123.1% of the control).
Finally, the combined effect of simultaneous αup-decrease (i.e., SR Ca pump attenua-tion) and PCa-decrease was considered, as in a real heart both may result simultaneouslyfrom the same drug application (beta-blockers). It turned out that 11% simultaneous de-crease in both parameters suppressed the rhythm disturbances at all lengths (comparedto the ∼20% decrease which was necessary in the case of the individual interventionsaimed at either αup-decrease or PCa-decrease). In the combined case changes in Fm, t30
and [Ca2+]TC were −5.6%, 5.3%, 19.2% respectively, as compared to the control value.
4. Discussion
The arrhythmogenic effects of calcium overloading were observed using a mathematicalmodel describing a wide range of electrical and mechanical phenomena in a cardiomy-ocyte. The overload revealed itself as a significant rise of Ca2+ levels in both the junctionalSR and the cytosol. In the particular case represented in this work, the overloading arosedue to the attenuation of the Na+–K+ ATPase function. Nevertheless, it is important tohighlight that in fact quite similar results were also obtained in the same model, whenother factors (e.g., speed up of the calcium current iCaL) were used to cause the overload-ing state.
The work deals with the matter that is quite actual for a number of heart diseases.For instance, the numerical/simulation experiments represented in the Section 3.2.2.1showed that for stimulation rates ≤60 stimuli/min there were no rhythm disturbances
932 Sulman et al.
in the virtual cardiac sample with moderately decreased Na+–K+ pump activity. How-ever, a faster stimulation (75 stimuli/min or higher) resulted in the following successionof events. A brief increase in the force amplitudes turned into a very gradual decrease thatwas suddenly disrupted by the drop in force accompanied by extrasystoles. Then force al-ternans arose; and steady-state contractions eventually settled, in which force developedoccurred very low. This succession of events is quite similar to that observed during theacute heart failure development.
As far as the chronic heart failure is concerned, there is a traditional treatment usingcardiac glycosides. The mechanism underlying the inotropic effects of these drugs is wellknown. When the drugs are applied in therapeutic doses, they reduce the Na+–K+ pumpactivity, and thus promote Na+ accumulation in cytosol, decrease the Na+ gradient, andconsequently, result in accumulation of calcium in the SR. The latter in its turn leads to theincrease in the amount of calcium released during cardiomyocyte excitation, and, there-fore, favors to some extent an increase in the force of myocardial contraction. However,an overdose of glycosides may cause delayed afterdepolarization, rhythm disturbancesand extrasystoles. Besides, it was found out that chronic heart failure leads to expressionof the fetal Na+–K+ ATPase isoform with reduced activity and a much higher sensitivityto glycosides than the normal isoform (Charlemagne et al., 1994). Hypokaliemia also re-duces the activity of this enzyme (Charlemagne et al., 1994). These reasons suggest theimportance of a theoretical study of the myocardium electromechanical function in thecase of reduced Na+–K+ pump activity.
The topic was earlier addressed in other works dealing with mathematical modeling. Inparticular, simulations of spontaneous electrical activity, in the state of calcium overloadwere done in mathematical models of cardiomyocyte electrical performance (DiFrancescoand Noble, 1985; Luo and Rudy, 1994; Noble, 2002a, 2002b; Noble and Varghese, 1998)including the modeling of reduced Na+–K+ pump function (Noble and Varghese, 1998).The essentially new aspect of our study, in contrast to the previous works, is its focuson the mechanical contribution to inducing rhythm disturbances in conditions where thecalcium overload of cardiomyocytes was not sufficiently large to cause the disturbancesby itself. In particular, the following mechanical factors proved to be substantial:
– Cross-bridge attachment/detachment processes during the final stage of relaxation andtheir effects on the CaTnC dissociation via the Xb-CaTnC cooperativity mechanism.
– Cardiomyocyte length during contraction-relaxation cycles.– Mechanical loads (as these influence both current lengths and contraction velocities).– Mechanical interaction of cardiomyocytes differing by degree of Na+–K+ pump inhi-
bition and/or activated in various sequences.
Indeed the contribution of the Xb–CaTnC cooperativity mechanism to the arrhythmiaobserved was proved in the special numerical experiment with P-sample where the coop-erativity effect on CaTnC dissociation was eliminated during the relaxation phase priorto the moment when an extrasystole had to occur. As a result it did not occur (Fig. 3, II,right panels in comparison with left ones).
Furthermore experiments with the SC-sample in which the Na+–K+ pump was lessseverely inhibited than in the P-sample were done. Rhythm disturbances did not arise inthe SC-sample under the same conditions which produced extrasystoles in the P-sample(isometric contractions at 0.9–0.95Lmax, 75 beats/min). However, decreasing the length

Mathematical Modeling of Mechanically Modulated Arrhythmias 933
to 0.88Lmax led to extrasystoles arising in the SC-sample as well. Extrasystoles similarlyarose in this sample when it contracted in isotonic mode at rather low loads.
Mechanical heterogeneity revealing itself in either different time course of tensiondevelopment or asynchronous stimulation of the elements connected in-series within vir-tual duplex, also produced extrasystoles in the SC-element. Three configurations of thevirtual duplexes were considered: (1) P–SC combination; (2) SC–SC combination (iden-tical ones); (3) N–SC combination of normal and SC-element. Extrasystoles arose inSC-element, when connected with P-element, in all cases of stimulation delays or syn-chronous stimulations of P–SC duplex (Fig. 5). The same happened in both samples ofthe SC–element, when stimulation delay was applied to any element of the SC–SC du-plex (2) or to the normal element in the N–SC duplex (3). The principal feature of allthese cases is dynamic shortening of the SC element during contractions that causes itstriggered activity.
It is quite probable that Na+–K+ pump partial inhibition due to the application ofcardiac glycosides is nonuniform in different regions of the ventricle, as drug sensitiv-ity of the cardiomyocytes from, e.g., endo-, meso- and epicardial layers differs strongly(Antzelevitch and Fish, 2001).
The data obtained in virtual duplexes suggest that appearance and expansion of therhythm disturbances may be induced by mechanical conditions even in the case of a smallmyocardial locus, in which cells are overloaded with calcium. Breakdown in the normalstimulation sequence or abnormal delays of stimulation may provoke these effects.
Analysis of all the phenomena of rhythm disturbances observed in the model showedthat the crucial precondition was a significant increase in Ca2+ levels in both cytosol andSR, so that the latter was substantially overloaded. Mechanical factors acted on the basisof these conditions and revealed themselves in two ways.
The first way contributed to the emergence of extrasystoles as a trigger and was as fol-lows. Even relatively small changes in Ca2+ transients caused by the crossbridge-sensitive(and, therefore, length-sensitive) cooperative kinetics of CaTnC complexes, did inducesignificant spontaneous Ca2+ release from SR, if the cell was Ca2+ overloaded. The re-lease in its turn activated inward depolarizing current via the forward mode of the Na+–Ca2+ exchanger resulting in arrhythmias.
The second way of mechanical influence on arrhythmogenicity was intensifying Ca2+storage in the SR. This way proved to play a significant role in the cases in which sarcom-eres of the cardiomyocyte shortened, as the shortening, via the same cooperative mecha-nisms, enabled gradual beat-to-beat additional Ca2+ accumulation in the SR.
In general, these two mechanisms of mechanical contribution to arrhythmogenesis al-low us to consider 3 characteristic intervals of Na+–K+ pump attenuation in the model:
1. Km,Na ≥ 110 mM, i.e., Km,Na ≥ 455% of the norm—extrasystoles arise independentlyof the mechanical part of the model.
2. 40 mM ≤ Km,Na < 110 mM, i.e., 165% ≤ Km,Na < 455% of the norm—extrasystolesarise unconditionally but only due to the contribution of the model mechanical com-ponents as a trigger of extrasystoles, namely, due to the formation of the cross-bridgesand their cooperative effects on the CaTnC kinetics.
3. 37 mM ≤ Km,Na < 40 mM, i.e., 153% ≤ Km,Na < 165%—extrasystoles arise only dueto the direct mechanical impacts (length or load changes) intensifying Ca2+ accumu-lation.

934 Sulman et al.
The latter interval includes SC-sample and may be named subcritical or a border zoneas a whole. When Km,Na lied below this zone, extrasystoles did not arise in the model atall for the normal initial conditions.
The first interval (Km,Na ≥ 455%) has many things in common with findings obtainedby Noble and Varghese (1998), who studied effects of strongly reduced Na+–K+ pumpactivity with the help of the Earm–Hilgeman–Noble model of the cardiomyocyte ioniccurrents (Earm and Noble, 1990; Hilgemann and Noble, 1987). In particular, they ob-served autorhythmic activity which arose in response to a single stimulus under stronglyreduced Na+–K+ pump function. As they showed, the autorhythmic activity in that caseresulted from the spontaneous Ca2+ release from the SR that in turn activated inward cur-rent via the Na+–Ca2+ exchanger. The same processes underlie rhythm disturbances inour simulations for Km,Na ≥ 455%. Reduction of Na+–K+ pump activity in the second455% > Km,Na ≥ 165% and the third 165% > Km,Na ≥ 153% intervals in our experi-ments was much more moderate than they simulated. Respectively, diastolic [Ca2+]i alsoincreased much less, and thus could not cause the spontaneous Ca2+ release from the SRwithout assistance from an additional mechanism. Nevertheless, both extrasystoles andautorhythmic activity occurred in these cases as well, because mechano-electric feedbackdid provide the assistance.
Of course, specific values of the found intervals may change depending on other modelparameters, e.g., on the Na+–Ca2+ exchange rate or on the rate of the SR Ca2+ pump, etc.However, the existence of similar intervals as such keeps anyway.
It is important that the predicted mechanism of the Xb–CaTnC-induced spontaneousAP generation may be verified in real experiments with a muscle sample. First, arrhythmiamay be induced in the sample via a cardiac glycoside overdose. Then cross-bridge attach-ment may be eliminated in the sample. This may be done using BDM (2,3-butanedione2-monoxime) that prevents actomyosin formation (Mulieri and Alpert, 1984). The modelpredicts that spontaneous APs will vanish after BDM application. Moreover, the vanish ispredicted to be valid for a significant range of cardiac glycoside concentrations inducingrhythm disturbances (corresponding to the found in the model range (1) of Na+–K+ pumpattenuation: 40 mM ≤ Km,Na < 110 mM.
One more focus of our work was an attempt to theoretically predict possible correctionmechanisms of the impaired electrical and mechanical function of the cardiomyocytes,when they are overloaded with Ca2+. In particular, such corrections were modeled in thecase where the overload was conditioned by the Na+–K+ ATPase attenuated function.Noble and Varghese (1998) probably first used mathematical modeling to analyze molec-ular mechanisms underlying clinic effects of local anesthetic applied in this case of Ca2+overload. They ascertained that the electrical function was restored when the lidocaineeffect was simulated in the model. The mechanism of the effect is clear: lidocaine lowersthe intensity of the fast Na+ current, and thus prevents it from reaching the depolarizingthreshold. Another important mechanism of the lidocaine effect theoretically justified byD. Noble and A. Varghese (ibidem) is a decrease in the efficiency of the external stimuli.For example, they observed that only every second stimulus excited cardiomyocytes underlidocaine application. Thus lidocaine by itself proved to be able to decrease tachycardia.Possible antiextrasystolic role of the second lidocaine effect, i.e., a decrease in the heart-beat rate was not discussed in the cited work (Noble and Varghese, 1998). However it maybe supposed that such a decrease possibly promote calcium unloading of the overloadedcardiomyocytes.

Mathematical Modeling of Mechanically Modulated Arrhythmias 935
Of course, the partial block of sodium channels suppressed autorhythmic activity inEO 2006, as well. As for the extrasystoles against the background of regular stimulation,the effect of suppression due to the partial block of sodium channels in EO 2006 was notstable and depended on the moment (within the series of stimuli), when the block of thesodium channels was applied. Besides, it is clear that the decrease in the intensity of thefast Na+ current is not able to lower cardiomyocyte calcium loading, when dealing withthe reduced Na+–K+ pump activity. Moreover, as known, such a block of sodium channelsresults in the slowing down of excitation propagation and thus may be arrhythmogenic byitself (Katz, 2000). At the same time Ca2+ overload may affect intercellular junction soas to slow down the propagation as well. Therefore, it is important to suggest approachesto suppress spontaneous electrical activity of the cardiomyocytes overloaded with Ca2+,which would be alternative to the blockers of Na+ channels.
Using our model, we found several possible ways to reduce Ca2+-overload and waysto recover normal heart rate and contractile function (see Section 3.3). It is very importantto bear in mind that there may be various pathological conditions in which the depressedNa+–K+ pump activity cannot be increased owing to the energy limitation which is quitetypical for a number of cardiac pathologies. Therefore, it is necessary to have other waysof correction. Calcium entering the cytosol from the SR and from the outside during everyregular contraction then partially returns to the SR via the Ca2+ pump and partially with-draws from the cell via the Na+–Ca2+ exchange (forward mode). Consequently, calciumunloading of overloaded cells may be reached with the following interventions:
– Decrease in the SR Ca2+ ATPase activity.– Decrease in the slow Ca2+ current.– Speed-up of the Na+–Ca2+ exchanger.
The Table 1 shows the results of the numerical experiments in which the P-cardiomyocyte overloaded with Ca2+ was exposed to such interventions. All these ex-posures stopped arrhythmias and restored the normal rhythm of the myocyte. In all thesecases, the Ca2+ level in the SR receded. The most significant drop in the SR calcium load-ing was observed, when either the SR Ca2+ uptake or the slow Ca2+ current decreased.The Na+–Ca2+ exchanger speed-up furnished too small reduction in the SR calciumloading as compared to its threshold level that produced rhythm disturbances. The tablealso demonstrates that combined effect of slowing down SR Ca2+ ATPase activity and de-crease in the slow Ca2+ current did not lead to the complete normalization of the isometricpeak force and relaxation time, while in the second case these characteristics turned outcloser to the control cases. On the other hand, the Na+–Ca2+ exchanger speed-up practi-cally restored the normal isometric force amplitude, but slowed down relaxation distinctlyas compared to the control. These observations suggest that the correction method has todepend on inotropic or lusitropic function depressed to a greater extent in a particularcase.
Besides, decrease in the SR Ca2+ pump activity is an energy-saving procedure. There-fore, it may be preferable in the situation of the cardiomyocyte energy starvation.
In addition, we observed that decrease in stimulation frequency during the consid-ered series of P-cardiomyocyte contractions also lowered calcium overload and thus sup-pressed arrhythmias (return from 75 stimuli/min to 60 stimuli/min abolished extrasystolesimmediately, while the normal steady-state contraction at 60 beats/min was restored in140 s).

936 Sulman et al.
Our results lead us to the conclusion that using β-blockers may be the most effi-cient way to correction of electromechanical disturbances, when cardiomyocytes are over-loaded with Ca2+, because these blockers simultaneously decrease heartbeat frequency,slow down both calcium current and SR calcium pump activity. We simulated the com-bined effects of the two latter factors together when decreasing by 11% both the L-typechannel calcium current and SR calcium pump rate (instead of separate 20% decrease ineach factor). In this case, even without changes in the heartbeat frequency, the SR wassignificantly relieved of calcium (23% fall as compared to the overloaded state), and al-most 95% recovery of the peak isometric force along with 5% increase in t30 of relaxationwas observed as compared to the control case.
Summarizing the above observation, it may be concluded that all the considered meth-ods of the normal electromechanical function recovery were palliatives. As applied toclinical practice, this might be interpreted as follows. If the prime cause of calcium over-load is unavoidable, the drug application is to be used permanently. Drugs in this situationare in a certain sense molecular “prosthetic tools” aimed to support impaired native mech-anisms of calcium homeostasis. Furthermore, in such a case, our modeling suggests thatapplication of cardiac glycoside and sodium channel blockers are to be conducted quitecautiously, as opposed to the β-blockers which seem to be the most effective drugs forcorrection of electromechanical function, when cardiomyocytes are overloaded with cal-cium.
Acknowledgements
The authors thank Dr. Peter Kohl and Ms. Penny Noble for helpful comments on themanuscript and Mr. Pavel Konovalov for technical support.
The work is supported by the Russian Foundation for Basic Research Grant RFBR-Ural #07-04-96113, Welcome Trust CRIG #074152/Z/04/Z, FIRCA NIH #1R03_TW006250-01A1, Russian President Leading Scientific School Grant #4923.2006.4.
Appendix A: Details of the mechanisms responsible for extrasystoles arising in theSC-sample owing to the direct contributions of mechanical factors
A.1 Mechanical interaction within the in-series duplex
To elucidate mechanisms underlying the onset of spontaneous extra APs in the SC-element, interacting in-series with the P-element, it is important to emphasize that de-spite the isometric mode of the duplex contraction, the internal redistribution of lengthsbetween the elements occurred permanently. In particular, when both duplex elementswere stimulated simultaneously, the following happened in the duplex during the phase ofextrasystoles in the P-element. Regular post-extrasystolic contractions of the P-elementwere weakened as compared to its regular contractions before the phase of extrasystoles.Therefore, when the SC-element was stimulated during the phase of extrasystoles in theP-element (see interval marked with horizontal bracket 1 in Fig. 5, II), the first met theweakened counteraction of the second one. In other words, the SC-element shortened to alarger degree during the interval marked with horizontal bracket 1 than before, and even

Mathematical Modeling of Mechanically Modulated Arrhythmias 937
more so than in isolation. This resulted in additional CaTnC complex dissociation in theregular contraction–relaxation cycles of the SC-element during this phase. Moreover, thisintensified CaTnC dissociation within each contraction-relaxation cycle occurs during thetime interval when Na+–Ca2+ exchange operates in reverse mode. Therefore a part ofthe Ca2+ that is additionally dissociated from TnC is accumulated by the SR Ca2+ pump,rather then removed from the cell through the Na+–Ca2+ exchanger. At the same time, thetotal Ca2+ level in the SC-cells slowly grows progressively (from cycle to cycle) becauseof the partially compromised function of its Na+–K+ pump. All these circumstances re-sulted in an increase in the SR calcium load for SC-element. Indeed, Panel I of the Fig. 7demonstrates that exactly within the phase of the extrasystoles in P-element the level ofCa2+ in SRTC ([Ca2+]TC) of the SC-element exceeded the level reached the isolated con-tractions of this virtual sample, and thus Ca2+ level eventually exceeded the threshold forthe Xb-induced spontaneous release from the SRTC. As a result, extra APs arose in theSC-element as a consequence of mechanical disturbances caused by element interactions.
Similar events were observed in Panel II of Fig. 7, corresponding to the case when theSC-element was stimulated with a delay of 30 ms compared to the P-element.
Let us analyze the opposite case, when P-element stimulation was delayed by 30 mscompared to SC-element. In this case, the SC-element experienced no counteractive forceduring the first 30 ms of each contraction, right from the beginning of the test. There-fore, the SC-element regularly shortened to a larger extent than in isolation, starting fromthe response to the very first stimulus. This means that the mechanism described above,responsible for the additional accumulation of the SR Ca2+ versus isolated contractions,occurred from the very first stimulus within the duplex, where the P-element delayed(Fig. 7, III). That is why in this case [Ca2+]TC of the SC-element approached the sponta-neous Ca2+ release threshold independently of the extrasystolic phase in the P-element,and extra action potentials arose in both elements almost simultaneously.
The mechanisms underlying extrasystolic activity in the SC-element in the latter casesuggest that, when it stimulated earlier than its counterpart, the result does not depend onspecific properties of the counterpart. This proposition was confirmed in the work, wheneither one more the same SC-element or the normal (control) one was chosen as sucha counterpart and extrasystoles arose in the stimulated earlier SC-element in both thesecases.
A.2 Exrasystoles in the SC-sample in response to changes in the mechanical conditionsof its contraction in isolation
The mechanisms underlying all the above effects of mechanical conditions (length, load)on rhythm disturbances in the SC-sample in isolation become clear, if one takes intoaccount that any decrease in the length of the element in all the above cases resulted (viathe type 1 (Xb–TnC) cooperativity together with the effect of sarcomere length on cross-bridge attachment probability) in the increase in CaTnC dissociation during the relaxationphases in all regular contraction-relaxation cycles. The latter increase recurring regularlyfrom cycle to cycle resulted gradually in higher accumulation of the SR Ca2+ than in thecase of the isometric contraction at the length equal 0.9Lmax. The accumulation occurssimilarly to the case of the same SC-sample, when it contracting within the duplex andstimulated first. This higher [Ca2+] in the SR (in comparison to the isometric contractionat the length equal 0.9Lmax) eventually led to the exceeding of the threshold Ca2+ level

938 Sulman et al.
for the Xb-induced spontaneous release from the SRTC, and thus initiated extra APs inthe SC-sample.
Appendix B: The model’s equations
B.1 Mechanical module of the model
This block consists of 5 ordinary differential equations describing the following phasevariables.
N Fraction of force generating attached cross-bridges.l1 Difference between the instantaneous length of contractile element CE and its length
corresponding to the muscle slack length.l2 Difference between the instantaneous length of parallel element PE and its length cor-
responding to the muscle slack length.l3 Difference between the instantaneous length of extra-series element XSE and its length
corresponding to the muscle slack length.v Velocity of contractile element CE lengthening/shortening.
Besides, in the right parts of mechanical block equations one more phase variable A
from another block is appeared. A is [CaTnC].
X Vector of all mechanical phase variables and A, i.e. X = {N; l1; l2; l3;v;A}.B.1.1 Kinetics of cross-bridge attachment–detachment
dN
dt= K(X) = k+(v) · M(A) · n1(l1) · ((l1 + S0)/(0.46 + S0)
)
· (1 − N) − k−(v) · N, (B.1)
where: M(A) = Aμ·(1+k
μμ)
Aμ+k
μμ
means end-to-end interaction between adjacent tropomyosin
segments in the case where both of them are affected by the formation of respectiveCaTnC complexes. In other words, the fraction of active sites on the thin filament in-creases cooperatively with CaTnC concentration as a result of this interaction, i.e. thisincrease turns out to be steeper then the rise of A. Here μ is a coefficient of this cooper-ativity, A = A
CaTroptot. n1(l1) is the probability of a myosin cross-bridge “finding” a vacant
site on the actin filament; in other words, the dependence of n1 on l1 means sarcomerelattice-spacing. In a simplified linearized form, this dependence looks as follows:
n1(l1) = 0.6 · l1 + 0.5.
Loz = (l1 +S0)/(0.46+S0) is a normalized linear dependence of the sarcomere overlapzone on the sarcomere length; k+(v) and k−(v) are velocity-dependent rate constants ofcross-bridges’ attachment and detachment, respectively. The following formulas set thesedependencies in the model:
k+(v) = κ · κ0 · q(v) · m0 · G∗(v),
k−(v) = κ0 · q(v) · (1 − κ · m0 · G∗(v)),

Mathematical Modeling of Mechanically Modulated Arrhythmias 939
where m0 is a model parameter denoting a fraction of cross-bridges strongly attached insteady-state isometric condition; and κ , κ0 are parameters enabling one to vary the ratiobetween particular rates of cross-bridge attachment and detachment in the model.
q(v) =
⎧⎪⎪⎨
⎪⎪⎩
q1 − q2 · (v/vmax), v ≤ 0,(q4−q3)∗v
vst+ q3, 0 < v < vst,
q4(1+(v−vst)/βq )αq , v > vst.
B.1.2 Equations describing mechanical variablesAs we shown earlier (Katsnelson et al., 2004), parallel damper VS1 contributes preva-lently to the myocardium mechanical activity as compared to the damper VS2 (bothshown in rheological scheme, Fig. 1). Therefore in this study we assume viscosity co-efficient of the damper VS2 identically equal zero.
The following equations correspond to the case of the reduced serial viscosity.
dl2
dt= ϕ(X) =
⎧⎪⎪⎪⎪⎨
⎪⎪⎪⎪⎩
Isotonic mode:α1·β1·exp(α1·(l2−l1))·v
α1·β1·exp(α1·(l2−l1))+α2·β2·exp(α2·l2),
Isometric mode:α1·β1·exp(α1·(l2−l1))·v
α1·β1·exp(α1·(l2−l1))+α2·β2·exp(α2·l2)+α3·β3·exp(α3·l3),
(B.2)
dl1
dt= v, (B.3)
dl3
dt=
{0 (Isotonic mode),
−ϕ(X) (Isometric mode),(B.4)
dv
dt= 1
λ · N · p′(v) + kP_vis
(α1 · β1 · exp
(α1 · (l2 − l1)
) · (ϕ(X) − v)
− (λ · K(X) · p(v) + αvp · kP_vis · v2
)), (B.5)
where:
kP_vis = βvp · exp(αvp · l1).Function p(v), meaning dependence of the average cross-bridge force on the sarcom-
ere shortening/lengthening velocity, appears in Eq. (B.5) and is described as follows:
(P) p(v) = P ∗(v)
G∗(v)
where P ∗(v) is the dependence of the steady-state sarcomere force on the shorten-ing/lengthening velocity, and G∗(v) is the dependence of the steady-state sarcomere stiff-ness on the velocity. Both functions are normalized so that P ∗(0) = 1, G∗(0) = 1. Theyhave the following formulation:
P ∗(v) =⎧⎨
⎩
a·(1+v/vmax)
a−v/vmaxfor v ≤ 0,
1 + dh − d2h·a
a·dh·(v/vmax)2/γ+(a+1)·v/vmax+a·dhfor v ≥ 0,

940 Sulman et al.
G∗(v) =
⎧⎪⎪⎨
⎪⎪⎩
1 + 0.6 · v/vmax for − vmax ≤ v ≤ 0,P ∗(v)
0.4·a+1a ·v/vmax+1
for 0 ≤ v ≤ v1,
P ∗(v)·exp(−αPG·((v−v1)/vmaxαPG))0.4·a+1
a ·v/vmax+1for v ≥ v1,
where:
γ = a · dh · (v1/vmax)2
3 · a · dh − (a + 1) · v1/vmax,
and v1, vmax, a, dh , αG, αPG are the model parameters.These new variants of P ∗(v) and G∗(v) actually have fully continuous derivatives.The following formula gives the force developed by the activated contractile element
in the model:
(F) FCE = λ · p(v) · N,
where λ is the model parameter comprising transition from one sarcomere to a wholevirtual muscle that consists of a number of myofibrils.
Formula (F) and the following six ones ((RI), (RII), (RIII), (RIV), (RV), (RVI)) defineall the elements of the rheological schemes underlying the mechanical module of themodel.
(RI) Fmuscle = FXSE,
(RII) FXSE = FPE + FCE + kP_vis · v,
(RIII) FXSE = FPE + FSE,
(RIV) FSE = β1 · [exp(α1 · (l2 − l1)) − 1],
(RV) FPE = β2 · [exp(α2 · l2
) − 1],
(RVI) FXSE = β3 · [exp(α3 · l3) − 1],
where
Fmuscle Muscle force.FSE Force of series element SE.FPE Force of parallel element PE.FXSE Force of extra-series element XSE.α1, β1, α2, β2, α3, β3 Coefficients of nonlinear elastic elements SE, PE, and XSE.
All the presented above formulas and equations of the mechanical module were intro-duced and justified elsewhere (Katsnelson et al., 2004). In the same work we showed thatthe effect of VS2 on the main inotropic and lusitropic characteristics of the heart muscleis quite negligible. Therefore the version of the model used in this study actually dealsonly with one viscous element VS1, i.e. we assumed here the coefficient of viscosity ofthe element VS2 to be constantly equal to 0. The above formulas are respectively reducedas compared to the complete formulation.

Mathematical Modeling of Mechanically Modulated Arrhythmias 941
B.1.3 Constraint equations for in-series duplex in isometric modeL = L1 + L2 = const, F = F1 = F2, where F1 and F2 are Fmuscle for the 1st and 2ndduplex elements respectively. L1 and L2 denote the lengths of the elements.
B.2 Calcium handling block
B.2.1 Kinetics of CaTnC complexes(presented in the form we published elsewhere Katsnelson et al., 2004) plays a crucialrole in all the versions of our model, as the time-course of [CaTnC] controls attachment ofcross-bridges (Eq. (B.1)) and thus, the mechanical behavior of the muscle. The followingequation describes dA/dt (where A is the concentration of CaTnC complexes).
dA
dt= aon · (Atot − A) · CaC − aoff · exp(−kA · A) · π(NA) · A. (B.6)
A key point of this equation is the cooperativity of Ca2+ affinity to TnC. In particular,these types of cooperativity may be phrased in the following manner.
– The affinity increases with the average number of strongly attached XBs around eachCaTnC complex. We consider CaTnC off-rate to be decreasing with increase in thisnumber. The dependence π(NA) expresses this cooperativity in above Eq. (B.6), andits particular form may be written down as follows:
π(NA) =
⎧⎪⎨
⎪⎩
1 for NA < 0,
πsc ·NA
0 for 0 ≤ NA ≤ s−1c ,
π0 for NA > s−1c ,
where NA means an average fraction of the attached cross-bridges falling on one CaTnCcomplex; i.e. NA = N/(Loz · A).
– The affinity increases with CaTnC concentration resulting from conformation oftroponin-tropomyosin complex due to Ca2+ binding to TnC. Specifically, we considerCaTnC off-rate to be decreasing with increase in A. Dependence exp(−kA · A) definesthis cooperativity in Eq. (B.6), where kA is the model’s parameter.
B.2.2 Ca2+ release from the SRFormulations are based on both the Noble’98 and the Ekaterinburg models. Descriptionsof the Ca2+ release processes originally derive from the Noble’98 model. They have,however, been significantly modified as described elsewhere (Solovyova et al., 2003).
irel = (OpenRelChFrac ∗ KmRel + LeakRate) ∗ [Ca]rel,
FrPrec = 1 − FrAct − FrProd,
RegBindSite =(
CaC
CaC + KmCaCyt+
(1 − CaC
CaC + KmCaCyt
)
· CaDS
CaDS + KmCaDS
)2
,

942 Sulman et al.
ActRate = KRegBind · RegBindSite; InActRate
= 60.0 + (KRegBind) · (RegBindSite),
dFrAct
dt=
{5 · (FrPrec · ActRate − FrAct · InActRate), E < −50 mV,
FrPrec · ActRate − FrAct · InActRate, otherwise,(B.7)
dFrProd
dt=
{5 · (FrAct · InActRate − 0.6 · FrProd), E < −50 mV,
FrAct · InActRate − 0.6 · FrProd, otherwise,(B.8)
OpenRelChFrac =(
FrAct
FrAct + KmFract
)2
.
B.2.3 Ca2+ uptake by the SR-pumpFormulations are based on the Noble ’98 model. The Ca2+ SR-pump description has beenmodified as described elsewhere (Solovyova et al., 2003).
iup = FractionUptakeCalciumSites · αup · 1
1 + CaupKinh
− FractionBackSRSites · βup,
FractionUptakeCalciumSites = CaC
/(CaC + Caup · KCyCa · Kxcs
KSRCa
+ Caup · KCyCa · Kxcs
KSRCa+ KCyCa · Kxcs + KCyCa
),
FractionBackSRSites = Caup · KCyCa · Kxcs
KSRCa
/(CaC
+ Caup · KCyCa · Kxcs
KSRCa+ KCyCa · Kxcs + KCyCa
).
B.2.4 Ca2+ buffering systemFormulations are taken from the Ekaterinburg model.
dB1
dt= b1on · (B1tot − B1) · CaC − b1off · B1, (B.9)
dB2
dt= b2on · (B2tot − B2) · CaC − b2off · B2. (B.10)
B.2.5 Ca2+ kinetics within the SRFormulations are based on the Ekaterinburg model. A ratio of 10:1 between the volumeof the uptake and release compartments of the SR has been implemented, in agreementwith conclusions from experimental data (Bers, 2002).

Mathematical Modeling of Mechanically Modulated Arrhythmias 943
Ca2+ translocation within the SR and buffering by calsequestrin:
itr = αtr · (Caup − Carel),
dC
dt= con · (Ctot − C) · Carel − coff · C.
(B.11)
B.2.6 Ca2+ concentration within the SR compartments
dCaup
dt= iup · Vi
Vup− itr, (B.12)
dCarel
dt= itr · Vup
Vrel− irel − dC
dt. (B.13)
B.2.7 Ca2+ concentration within the cytosol and the diadic space
dCaC
dt= − iCaLCa,Cyt + ib,Ca − 2
nNaCa−2 · iNaCa,Cyt
2 · Vi · F − iup,
+ irel · Vrel
Vi
−(
dB1
dt+ dB2
dt+ dA
dt
)+ CaDS · VDS · kdecay, (B.14)
dCaDS
dt= − iCaLCa,DS − 2
nNaCa−2 · iNaCa,DS
2 · VDS · Vi · F − CaDS · kdecay. (B.15)
B.3 Electrical block of the model
B.3.1 Time-dependent (delayed) K+ current, iKr1
iKr1 = xr1 · gkr1 · E − EK
1 + exp(E+922.4 )
,
dxr1
dt= αxr1 − (αxr1 + βxr1) · xr1, (B.16)
αxr1 = 50
1 + exp(−E−59 )
, βxr1 = 0.05 · exp
(−E − 20
15
).
B.3.2 Time-dependent (delayed) K+ current, iKr2
iKr2 = xr2 · gkr2 · E − EK
1 + exp(E+922.4 )
,
dxr2
dt= αxr2 − (αxr2 + βxr2) · xr2, (B.17)
αxr2 = 50
1 + exp(−E−59 )
βxr2 = 0.4 · exp
(−
(E + 30
30
)3).

944 Sulman et al.
B.3.3 Time-dependent (delayed) K+ current, iKs
iKs = x2s · gks · (E − EKs),
dxs
dt= αxs − (αxs + βxs) · xs, (B.18)
αxs = 14
1 + exp(−E−409 )
, βxs = exp
(− E
45
).
B.3.4 Inward rectifier K+ current, ik1
iK1 = gK1 · [K]o[K]o + Km,K1
· E − EK
1 + exp((E−EK−10)·1.25·F
R·T ).
B.3.5 Transient outward K+ current, ito
ito = gto · (gtos + s · (1 − gtos)) · r · (E − EK),
dr
dt= 333 ·
(1
1 + exp(− E+4steepr )
− r
), (B.19)
ds
dt= αs − (αs + βs) · s, (B.20)
αS = 0.033 · exp
(− E
17
), βS = 33
1 + exp(−0.125 · (E + 10)).
B.3.6 Background Na+ current, ibNa
ib,Na = gb,Na · (E − ENa).
B.3.7 Na+ − K+ pump, ip
ip = ip · [K]o[K]o + Km,K
· [Na]i[Na]i + Km,Na
.
B.3.8 Na+–Ca2+ exchange current, iNaCa
iNaCa,cmpt = Fraccmpt · kNaCa · 1
1 + [Ca]cmpt0.0069
· eγ ·(nNaCa−2)· EFRT · [Na]nNaCa
i · [Ca]o − e−(1−γ )·(nNaCa−2)· EFRT · [Na]nNaCa
o · [Ca]cmpt
1 + dNaCa · ([Na]nNaCao · [Ca]cmpt + [Na]nNaCa
i · [Ca]o) ,
where cmpt is used for denotation of either cytosole or diadic space compartments of thecell;
Fraccyt = 1 − INaCaFract; FracDS = INaCaFract.
B.3.9 Background Ca2+ current, ibCa
ib,Ca = gb,Ca · (E − ECa).

Mathematical Modeling of Mechanically Modulated Arrhythmias 945
B.3.10 Fast Na+ current, iNa
iNa = m3 · h · gNa · (E − Emh),
dm
dt= αm − (αm + βm) · m, (B.21)
dh
dt= αh − (αh + βh) · h, (B.22)
αm ={
2000, |E + 41| < 0.00001,200·(E+41)
1−exp(−0.1·(E+41)), otherwise,
βm = 8000 · exp(−0.056 · (E + 66)
),
αh = 20 · exp(−0.125 · (E + 75)
), βh = 2000
1 + 320 · exp(−0.1 · (E + 75)).
B.3.11 L-type Ca2+ current, iCaL
iCaL,cmpt = Fraccmpt · d · f · f2,cmpt(iCaL,Ca + iCaL,K + iCaL,Na),
where cmpt is used for denotation of either cytosole or diadic space compartments of thecell;
Fraccyt = 1 − ICaFract; FracDS = ICaFract,
iCaL,Ca = 4PCa(E − Vsurf)
FRT · ([Ca]i · eVsurf
2FRT − [Ca]o · e−(E−Vsurf)
2FRT )
1 − e−(E−Vsurf)2FRT
,
iCaL,X = PX
(E − Vsurf)FRT
· ([X]i · eVsurfFRT − [X]o · e−(E−Vsurf)
2FRT )1 − e−(E−Vsurf)
FRT ,
where X is used for either Na+ or K+.
dd
dt= αd − (αd + βd) · d, (B.23)
df
dt= αf − (αf + βf ) · f, (B.24)
αd ={
360, |E + 24 − Vshift| < 0.0001,90·(E+24−Vshift)
1−exp(−0.25·(E+24−Vshift)), otherwise,
βd ={
360, |E + 24 − Vshift| < 0.0001,
− 36·(E+24−Vshift)
1−exp(0.1·(E+24−Vshift)), otherwise,
αf ={
7.5, |E + 34| < 0.0001,1.875·(E+34)
exp(0.25·(E+_34))−1 , otherwise,
βf = 3.6
1 + exp(−0.25 · (E + 34)),

946 Sulman et al.
df2,cyt
dt= 1 − [Ca]i
KmCytInact + [Ca]i − f2,cyt, (B.25)
df2,DS
dt= RateDSInact ·
(1 − [Ca]DS
KmDSInact + [Ca]DS− f2,DS
). (B.26)
B.3.12 Persistent Na+ current, ipNa
ip,Na = gp,Na · 1
1 + exp(−E+528 )
· (E − ENa).
B.3.13 Reversal potentials
ENa = RT
F· ln
( [Na]o[Na]i
), EK = RT
F· ln
( [K]o[K]i
),
ENa = RT
2F· ln
( [Ca]o[Ca]i
), EKs = RT
F· ln
( [K]o + PKNa · [Na]o[K]i + PKNa · [Na]i
),
EKs = RT
F· ln
( [Na]o + 0.12 · [K]o[Na]i + 0.12 · [K]i
).
B.3.14 Intracellular Na+ concentration [Na+]id[Na]i
dt= − 1
ViF
(iNa + ip,Na + ib,Na + iCaL,Na
+ nNaKnNaK−1 · ip + nNaCa
nNaCa−2 · iNaCa
).
(B.27)
B.3.15 Extracellular K+ concentration, [K+]od[K]o
dt= iK + iK1 + iCaL,K − 1
nNaK−1 · ip + ito
VeF− 0.7 · ([K]o − [K]b). (B.28)
B.3.16 Intracellular K+ concentration, [K+]id[K]i
dt= − iK + iK1 + iCaL,K − 1
nNaK−1 · ip + ito
ViF. (B.29)
B.3.17 Membrane potential
dE
dt= − 1
Capacitance(iKr1 + iKr2 + iKs + iK1 + ito + ib,Na + ip
+ iNaCa,cyt + iNaCa.DS + ib,Ca + iNa + ip.Na + iCaL,Cyt
+ iCaL,DS + iStim), (B.30)
iStim = −3.0 nA (on at 0.06 s; off at 0.0625 s).

Mathematical Modeling of Mechanically Modulated Arrhythmias 947
Appendix C: Basic parameter values
The following basic parameters values characterize the normal cardiomyocyte in themodel.
Table C.1 Cell parameters
ine Parameter Value Parameter Value Parameter Value
T [K] 310 V π ·preplen· radius2 Vds (fraction of Vi ) 0.1F [C/M] 96485.341 Ve (fraction of V 0.4 [Ca]o [mM] 2R [mJ/(M K)] 8314.472 Vi (fraction of V ) 0.49 [Na]o [mM] 140preplen [mm] 0.074 Vrel (fraction of V ) 0.003 [K]b [mM] 4radius [mm] 0.012 Vup (fraction of V ) 0.03 Capacitance [μF] 9.5E-5
Table C.2 Parameters for the Ca2+ handling
Parameter Value Parameter Value Parameter Value
KmRel [1/s] 10000 Kcyca [mM] 0.00015 b1off [1/s] 182LeakRate [1/s] 0.05 Kxcs 0.4 B2tot [mM] 0.1KmCaCyt [mM] 0.0005 Ksrca [mM] 0.5 b2on [1/(mM s)] 1000KmCads [mM] 0.01 αtr [1/s] 15 b2off [1/s] 3KRegBind 500 Ctot [mM] 40 Atot [mM] 0.07KmFract 0.25 con [1/(mM s)] 50000 aon [1/(mM s)] 70000αup [mM/s] 1 coff [1/s] 0.65 aoff [1/s] 200Kinh [mM] 4 B1tot [mM] 0.08 kA [mM] 40βup [mM/s] 0.03 b1on [1/(mM s)] 1.0E-5 kdecay [1/s] 10
Phase Variable Initial Value Phase Variable Initial Value Phase Variable Initial Value
FrAct 0.001914 [Ca]up [mM] 1 [CaTrop] [mM] 6.7E-5FrProd 0.285457 [Ca]rel [mM] 1 [Ca]DS [mM] 1.71E-5
The initial values for C, B1, B1, A are obtained from the corresponding steady-stateequation.

948 Sulman et al.
Table C.3 Parameters for the electrical part
Parameter Value Parameter Value Parameter Value
gkr1 [μS] 0.0021 Km,Na [mM] 24.2 PNa [nA mM] 0.001gkr2 [μS] 0.0013 INaCaFract 0.001 Vsurf [mV] 50gks [μS] 0.0026 kNaCa [nA] 0.0005 Vshift [mV] 5gK1 [μS] 0.5 γ 0.5 KmCytInact [mM] 1.0E5KmK1[mM] 10 nNaCa 3 RateDSInact [1/s] 20gto [μS] 0.005 dNaCa[1/mM4] 0 KmDSInact [mM] 0.001gtos 0 gb,Ca [μS] 2.5E-4 gpNa [μS] 0.004steepr [mV] 5 gNa [μS] 2.5 PKNa 0.03gb,Na [μS] 0.0006 ICaFract 1 nNaK 1.5ip [nA] 0.7 PCa [nA mM] 0.1Km,K [mM] 1 PK [nA mM] 0.0002
Phase Variable Initial Value Phase Variable Initial Value Phase Variable Initial Value
xr1 0.001428 m 0.0017 f2,DS 0.9682754xr2 0.5 h 0.9939474 [Na]i [mM] 5.5997xs 0.5 d 0 [K]o [mM] 4r 0 f 1 [K]i [mM] 139.305s 1 f2,cyt 1 E [mV] −92.4993529
Table C.4 Parameters for the mechanical part
Parameter Value Parameter Value Parameter Value
α1 [1/μm] 14.6 βq 5 κ 0.705β1 [arbitrary force units] 0.84 αG 1 g1 [1/μm] 0.6α2 [1/μm] 14.6 αPG 4 g2 0.52β2 [arbitrary force units] 0.0018 sc[mM] 0.07 vmax [μm/s] 5.5α3[1/μm] 48 s0 [μm] 1.14 kμ 0.6β3 [arbitrary force units] 0.015 π0 0.03 μ 3αVP [1/μm] 16 dh 0.5 q1 [1/s] 17.3βVP [s/μm] 0.0015 xst (vst = xst∗vmax) 0.964285 q2 [1/s] 259λ [arbitrary force units] 30 x1 (v1 = x1∗vmax) 0.1 q3 [1/s] 17.3a 0.25 x0 (v0 = x0∗vmax) 1 q4 [1/s] 15αq 10 κw 3 m0 0.9
P-element and SC-element differ from the basic one only by the value of Km,Na:For P-element Km,Na = 40 mM.For SC-element Km,Na = 38 mM.
References
Antzelevitch, C., Fish, J., 2001. Electrical heterogeneity within the ventricular wall. Basic Res. Cardiol.96(6), 517–527.
Bers, D.M., 2002. Cardiac excitation-contraction coupling. Nature 415(6868), 198–205.Charlemagne, D., et al., 1994. Alteration of Na,K-ATPase subunit mRNA and protein levels in hypertro-
phied rat heart. J. Biol. Chem. 269(2), 1541–1547.DiFrancesco, D., Noble, D., 1985. A model of cardiac electrical activity incorporating ionic pumps and
concentration changes. Philos. Trans. Roy. Soc. Lond. B Biol. Sci. 307(1133), 353–398.

Mathematical Modeling of Mechanically Modulated Arrhythmias 949
Earm, Y.E., Noble, D., 1990. A model of the single atrial cell: relation between calcium current and calciumrelease. Proc. Roy. Soc. Lond. B Biol. Sci. 240(1297), 83–96.
Fuchs, F., Martyn, D., 2005. Length-dependent Ca(2+) activation in cardiac muscle: some remaining ques-tions. J. Muscle Res. Cell Motil. 26(4–5), 199–212.
Gallagher, K.P., et al., 1986. The distribution of functional impairment across the lateral border of acutelyischemic myocardium. Circ. Res. 58(4), 570–583.
Gordon, A.M., et al., 2001. Skeletal and cardiac muscle contractile activation: tropomyosin “rocks androlls”. News Physiol. Sci. 16, 49–55.
Hilgemann, D.W., Noble, D., 1987. Excitation-contraction coupling and extracellular calcium transientsin rabbit atrium: reconstruction of basic cellular mechanisms. Proc. Roy. Soc. Lond. B Biol. Sci.230(1259), 163–205.
Izakov, V., et al., 1991. Cooperative effects due to calcium binding by troponin and their consequences forcontraction and relaxation of cardiac muscle under various conditions of mechanical loading. Circ.Res. 69(5), 1171–1184.
Katsnelson, L.B., Markhasin, V.S., 1996. Mathematical modeling of relations between the kinetics of freeintracellular calcium and mechanical function of myocardium. J. Mol. Cell. Cardiol. 28(3), 475–486.
Katsnelson, L.B., et al., 2004. Influence of viscosity on myocardium mechanical activity: a mathematicalmodel. J. Theor. Biol. 230(3), 385–405.
Katz, A.M., 2000. Physiology of the Heart, 3rd edn. Lippincott Williams & Wilkins, Philadelphia.Kihara, Y., Morgan, J.P., 1991. Intracellular calcium and ventricular fibrillation. Studies in the aequorin-
loaded isovolumic ferret heart. Circ. Res. 68(5), 1378–1389.Lakatta, E.G., Guarnieri, T., 1993. Spontaneous myocardial calcium oscillations: are they linked to ven-
tricular fibrillation? J. Cardiovasc. Electrophysiol. 4(4), 473–489.Lew, W.Y., 1987. Influence of ischemic zone size on nonischemic area function in the canine left ventricle
Am. J. Physiol. 252(5 Pt 2), H990–997.Luo, C.H., Rudy, Y., 1994. A dynamic model of the cardiac ventricular action potential. II. Afterdepolar-
izations, triggered activity, and potentiation. Circ. Res. 74(6), 1097–1113.Markhasin, V.S., et al., 2003. Mechano-electric interactions in heterogeneous myocardium: development
of fundamental experimental and theoretical models. Prog. Biophys. Mol. Biol. 82(1–3), 207–220.Moss, R.L., et al., 2004. Myosin crossbridge activation of cardiac thin filaments: implications for myocar-
dial function in health and disease. Circ. Res. 94(10), 1290–1300.Mulieri, L.A., Alpert, N.R., 1984. Differential effects of BDM on activation and contraction. Biophys. J.
45, 47.Murray, J.M., Weber, A., 1981. Cooperativity of the calcium switch of regulated rabbit actomyosin system.
Mol. Cell. Biochem. 35(1), 11–15.Noble, D., 2002a. Modeling the heart–from genes to cells to the whole organ. Science 295(5560), 1678–
1682.Noble, D., 2002b. Modelling the heart: insights, failures and progress. Bioessays 24(12), 1155–1163.Noble, D., Varghese, A., 1998. Modelling of sodium-overload arrhythmias and their suppression. Can. J.
Cardiol. 14(1), 97–100.Noble, D., et al., 1998. Improved guinea-pig ventricular cell model incorporating a diadic space, IKr and
IKs, and length- and tension-dependent processes. Can. J. Cardiol. 14(1), 123–134.Solovyova, O., et al., 2002. Mechanical inhomogeneity of myocardium studied in parallel and serial car-
diac muscle duplexes: experiments and models. Chaos Solitons Fractals 13(8), 1685–1711.Solovyova, O., et al., 2003. Mechanical interaction of heterogeneous cardiac muscle segments in silico:
effects on Ca2+ handling and action potential. Int. J. Bifurcat. Chaos 13(12), 3757–3782.Solovyova, O., et al., 2006. Activation sequence as a key factor in spatio-temporal optimization of my-
ocardial function. Phil. Trans. Roy. Soc. Lond. A 364, 1367–1383.Tennant, L.R., Wiggers, C.J., 1935. The effect of coronary occlusion on myocardial contraction. Am. J.
Physiol. 112, H351–361.Thandroyen, F.T., et al., 1991. Intracellular calcium transients and arrhythmia in isolated heart cells. Circ.
Res. 69(3), 810–819.
Copyright © 2022 FDOKUMEN