
Materials and Devices Research Group
89
3II7ES , Materials and Devices Research Group
-
Upload
khangminh22 -
Category
Documents
-
view
2 -
download
0
Transcript of Materials and Devices Research Group
3II7ES ,
Materials and Devices Research Group
MATERIALS AND DEVICES RESEARCH GROUP REPORTS Previous reports may be obtained upon request *
192 "Microwave Ferrite Materials and Devices", R. F. Soohoo. IEEE Trans, on Magnetics, Vol. MAG-4, No. 2, pp. 118-133, 1968.
193 "Theory and Method for Magnetic Resonance Measurements", R. F. Soohoo and P. Christensen. J. Appl. Phys., Vol. 40, No. 3, pp. 1565-1566, 1969.
194 "The Migration of Point Defects in Crack Tip Stress Fields", M. W. Schwartz and A. K. Mukherjee. Materials Science and Engineering, 13, pp. 175-179, 1974.
195 "The Dependence of Acoustic Emission on Strain Rate in 7075-T6 Aluminum", M. A. Harostad and A. K. Mukherjee. Experimental Mechanics, Vol. 14, No. 1, pp. 33-41, 1974.
196 "The Importance of Geometric Statistics to Dislocation Motion", D. Klahn, A. K. Mukherjee, J. E. Dorn, Advances in Applied Probability, pp. 112-150, 1972.
197 "The Electric Quadrupole Moment of the 35 keV State of T e 1 2 5 " , C. E. Violet, R. Booth and F. Wooten, Phys. Letters 5, 230 (1963).
19c "Surface Effects, Band Bending, and Photoemission in Semi-conducting Fi]-s Cs3Sb", F. Wooten, Surf. Sci. 1_, 367 (1964).
199 "Nucleation Field of a Thin Superconducting Film on a Thick Normal Layer", H. J. Fink and P. f'artinoli. J. of Low Temperature Phys. 4_, pp. 305-315, 1971.
200 "Instability of Vehicles Levitated by Eddy Current Repulsion—Case of an Infinitely Lor ; Current Loop", H. J. Fink and C E. Hobrecht- J. of Appl. Phys. £2, pp. 3446-3450, 1971.
201 "Current Transitions of Superconducting Whiskers", H. J. Fink. Phys. Letters 42A, pp. 465-467, 1973,
2C2 "The Dissociation Energy and Pressure of Gallium Sesguisulfide", I. Y. Kashkooli and Z. A. Munir. High Temperature Science, Vol. 4, No. 1, 82-88, January 1972.
203 "The Sintering of Amorphous Selenium-Arsenic Powders", R. N. Lott and Z. A, Munir. Journal of Non-Crystalline Solids, Vol. 7, No. 1, 86-92, January/February 1972.
204 "The Partial Pressures of Hg(g) and Sen(g) in Equilibrium with crystalline Mercury Selenide", Z. A. Munir, D. J. Meschi and G. M. Pound. Journal of Crystal Growth, 15, 263, 1972.
205 "Short-Term Stress Relaxation of Concrete", M. A. Taylor and G. K. Maurer. Magazine of Concrete Research, (London), Vol, 25, No. 84, pp. 123-135, September 1973.
206 "Relationships Between Electrical and Physical Properties of Cement Pastes", M. A. Taylor and K. Arulanandan. J, o^ Cement and Concrete Research, Vol. 4, pp. 881-897, 1974.
FINAL TECHNICAL REPORT
CORRELATION BETWEEN ACOUSTIC EMISSION AND MICROS!RUCTURE
by
A. k. Mukherjee & R. Bunch Department of Mechanical Engineering
Univers i ty of Cal i forn ia Davis, Ca l i f o rn ia 95616
NDTfCl • ^—-- . rrpi'FI UJI pitpiifj j i in t u m n l lit »,i,^
Hlffd bl Ihr ( mid S[,i« U^mnKM Vilhcr ifcf ft! Suiti nm ihf I'mifJ Srjifi IKpiitnwii ,it ft, nin m ,«i ihfu fmpln\((i n,n jn* ,1 ihti,
• j i n n i , tuf in, ^ inpijfl r jiu.-r,'i ir.» k t f
Lr
LLL Intramural Order no. 5079503
H 1
1),:^[,,,r[fCiPi'T':i31)OC:RJrNTISr>T5.I!WrE&
ii
ABSTRACT
Acoustic Emission from pure metals undergoing deformation is caused by dislocation unpinning and can be described by a theory which was a modified version of Gilman's mobile dislocation density theory. Acoustic Emission from alloys can be dislocation related, but is primarily due to inclusion fracture. Factors affecting this include inclusion size, inclusion density, and the stress state. Inclusions crack more frequently during tensile testing than during fracture toughness testing.
iV
TABLE OF CONTENTS
Abstract 1! Acknowledgements ill Table of Contents iv List of Figures and Tables v Nomenclature vil Introduction 1 AE from Large Inclusions During Plastic Deformation and Fracture of 7075-T651 Aluminum
Introduction 3 Experimental Procedure 3 Results k
Discussion 5 AE from Pure Metals
Introduction 8 Theoretical Considerations 10 Experimental Procedure 12 Results \k
Discussion 15 Relationships Between Fracture Toughness and AE in 2I24-T85I and 20W-T851 Aluminum
Introduction 19 Experimental Procedure 21 Results 22 Discussion 27
Summary 33 Conclusions. }k
References 35
V
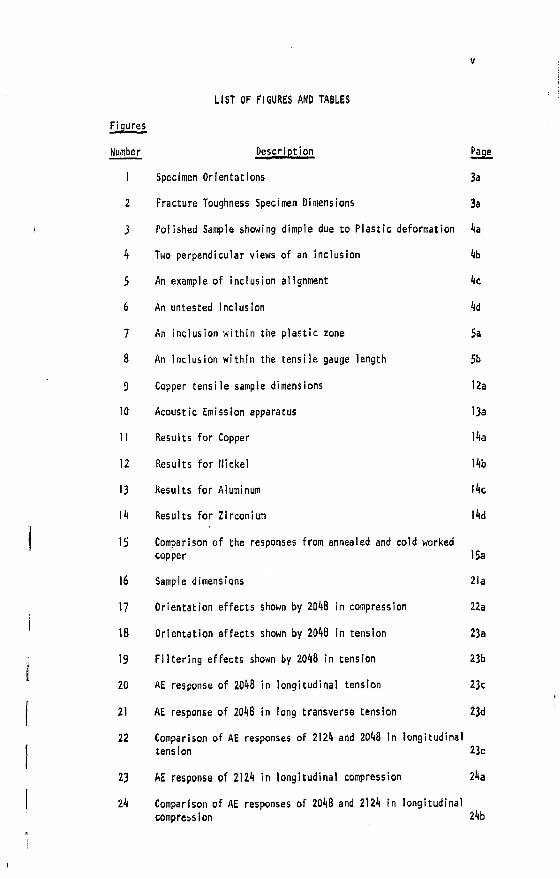
LIST OF FIGURES AND TABLES
Figures
Number Description Page
1 Specimen Orientations 3a
2 Fracture Toughness Specimen Dimensions 3a
3 Polished Sample showing dinple due to Plastic deformation Ha
4 Two perpendicular views of an inclusion 4b
5 An example of inclusion alignment 4c
6 An untested inclusion 'id
7 An inclusion within the plastic zone 5a
8 An inclusion within the tensile gauge length 5b
9 Copper tensile sample dimensions 12a
10 Acoustic Emission apparatus 13a
11 Results for Copper 14a
12 Results for Nickel 14b
13 Results for Aluminum 14c
14 Results for Zirconium I4d
15 Comparison of the responses from annealed and cold worked copper 15a
16 Sample dimensions 21a
17 Orientation effects shown by 2048 in compression 22a
18 Orientation effects shown by 2048 in tension 23a
19 Filtering effects shown by 2048 in tension 23b
20 AE response of 2048 in longitudinal tension 23c
21 AE response of 2048 in long transverse tension 23d
22 Comparison of AE responses of 2124 and 2048 In longitudinal tension 23e
23 AE response of 2124 in longitudinal compression 24a
24 Comparison of AE responses of 2048 and 2124 In longitudinal compression 24b
1 Number
1 25 26
1 27 28 i 29
1 30
3!
1 32 33 1 34
1 35 1 36
I 1 37
1 38 I
39
Tables
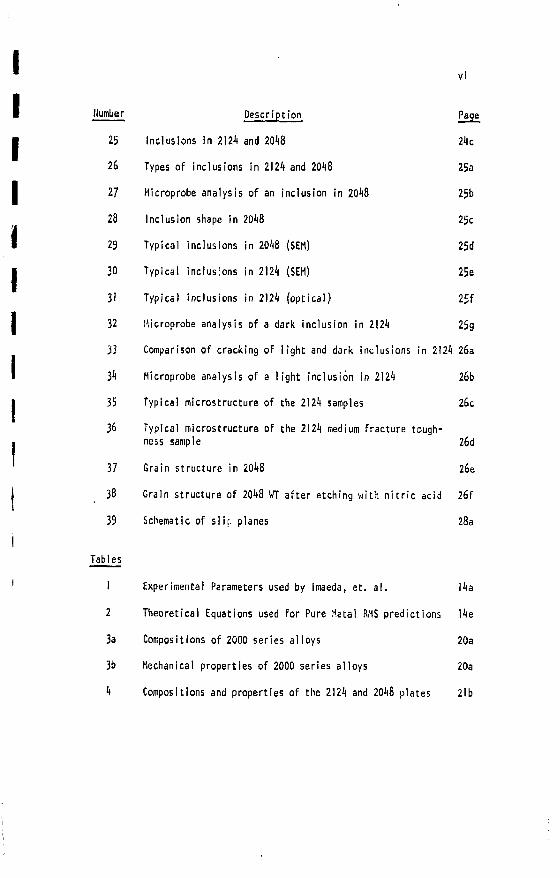
vl
Description Page
Inclusions in 2124 and 2048 24c
Types of inclusions in 2124 and 2048 25a
Hicroprobe analysis of an inclusion in 2048 25b
Inclusion shape in 2048 25c
Typical inclusions in 2048 (SEM) 25d
Typical inclusions in 2124 (SEM) 25e
Typical inclusions in 2124 (optical) 2£f
Microprobe analysis of a dark inclusion in 2124 25g
Comparison of cracking of light and dark inclusions in 2124 26a
Microprobe analysis of a light inclusion in 2124 26b
Typical microstructure of the 2124 samples 26c
Typical microstructure of the 2124 medium fracture toughness sample 26d
Grain structure in 2048 26e
Grain structure of 2048 WT after etching with nitric acid 26f
Schematic of slit, planes 28a
1 Experimental Parameters used by Imaeda, et. al. Ita
2 Theoretical Equations used for Pure Metal RMS predictions I4e
3a Compositions of 2000 series alloys 20a
3b Mechanical properties of 2000 series alloys 20a
4 Compositions and properties of the 2124 and 2048 plates 21b
vii
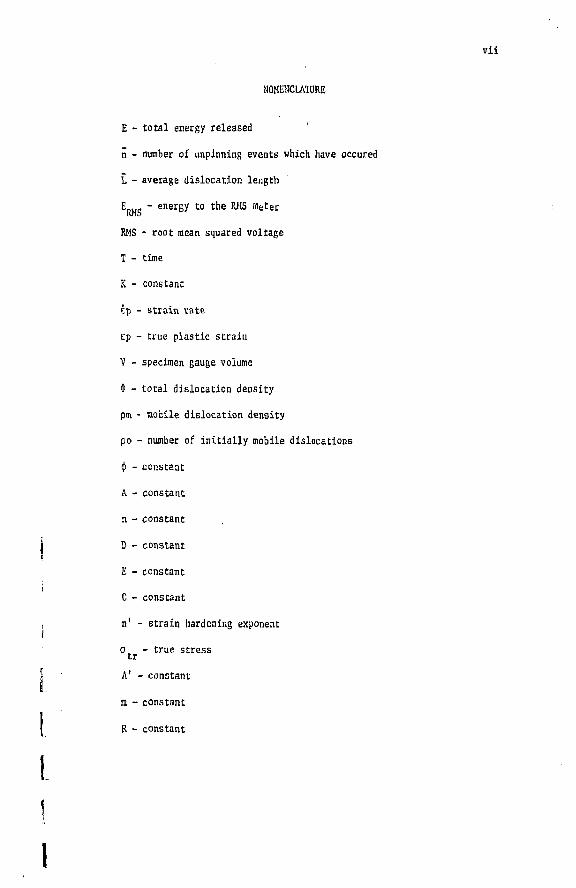
NOMENCLATURE
E - total energy released
n - number of unpinning events which have occured
L - average dislocation length
E , „ - energy to the WIS meter
EMS - root mean squared voltage
T - time
K - constant
ep - strain rate
Ep - true plastic strain
V - specimen gauge volume
$ - total dislocation density
pm - mocile dislocation density
po - number of initially mobile dislocations
<J - constant
A - constant
n - constant
D - constant
E - constant
C - constant
n' - strain hardening exponent
a - true stress tr
A' - constant
ra - constant
R - constant
I. Introduction
1
Acoustic Emission (AE), as defined by the Acoustic Emission Work
ing Group, is "the class of phenomena whereby transient elastic waves
are generated by the rapid release of energy from a localized source or
sources within a material..." During deformation or fracture of metals
and alloys, AE can be attributed to a number of sources, and, in fact,
the total observed response from a material is usually a combination of
signals from a number of sources.
In pure metals subjected to plastic deformation, a number of authors
have suggested possible mechanisms. These include twinning (1), Luder's
band formation (2), dislocation multiplication (7 :3), pileup and breakaway
of dislocations (3,4), dislocation unpinning (5), and slip advances (6).
In alloys subjected to deformation, AE may be partially dislocation re
lated, but is, in general, primarily related to cracking or decohesion of
inclusions within the matrix. During fracture, AE may be attributed to
dislocation activity due to plastic deformation of the matrix around the
crack tip, matrix cracking, and/or cracking of inclusions within the matrix.
This investigation was undertaken to identify the source of AE in a
number of pure metals and three common aluminum alloys and to correlate
these results with the existing literature. In order to obtain our goals,
the project was divided into three parts. Initially, the effect of large
inclusion cracking on AE during fracture toughness testing of 7075-T651
aluminum was studied. Next. AE, data for pure Al,Ni,Cu, and Zr was used
to check a theory by I'.amstad and Mukherjee (5) relating AE to a dislocation
pinning process. Finally, the AE responses of 2124-T851 and 2048-T851
were compared. These responses were also correlated with each material's
2
fracture behavior and mlcrostructure. For convenience to the reader,
each phase of the project will be presented separately.
i II. AE From Large Inclusions During Plastic Deformation and Fracture
of 7075-1651 Aluminum.
Introduction '
Bianchetti ct. al. (9) has shown that by monitoring the AE during
a tensile test of 7075-T651 aluminum, the presence of large 45 to 120 ym
intermetallic inclusions can be detected. That is, if the large inclu
sions are present, the typical smooth continuous AE curve will have
large hursts superimposed upon it. When the 45 to 120 urn inclusions are
not present, Graham et. al. (10) and Carpenter et. al, (11) have related
the AE response to the fracture of 2-5 un inclusions within the aluminum
matrix.
During f:acture toughness testing, burst emissions are observed
whether or not the large inclusions are present. Since the burst emis
sion generated by various cracking processes is indistinguishable from
that generated by the inclusions cracking, AE reveals nothing about the
degree of cracking of inclusions during the fracture toughness test.
The following summarizes the findings of the part of the project
which was undertaken to complete the investigation (originally began by
Bianchetti) of the properties of the 45 to 120 tjm inclusions in 7075-T651
aluminum and to determine the extent of particle fracture during both
tensile and fracture toughness testing. Specifically, the size, shape,
distribution and extent of cracking of the large inclusions wer& deter
mined during the investigation.
EXPERIMENTAL PROCEDu.lE
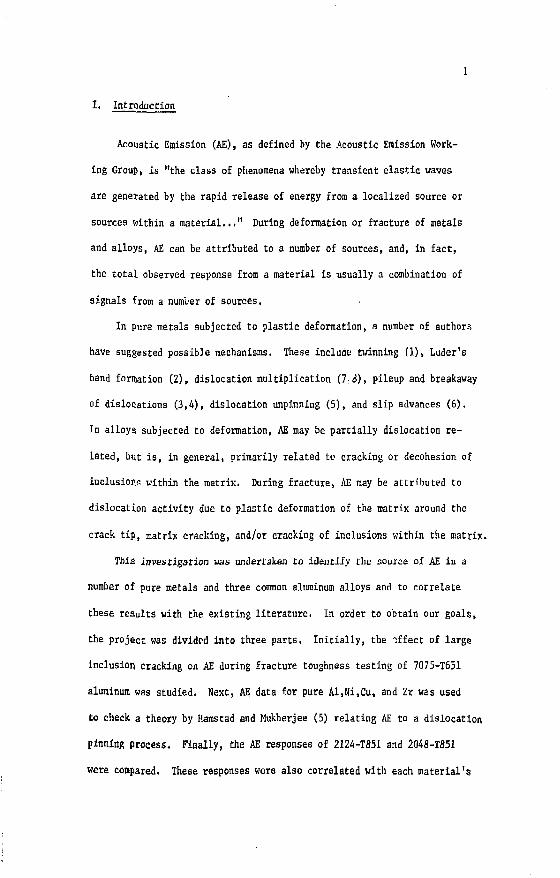
Tensile samples of dimensions documented in Reference 9 were cut
from a 12.7 mm (0.5 inch) plate of 7075-T651 aluminum. These were then
strained 102 and sectioned for metallographic observation. Sample
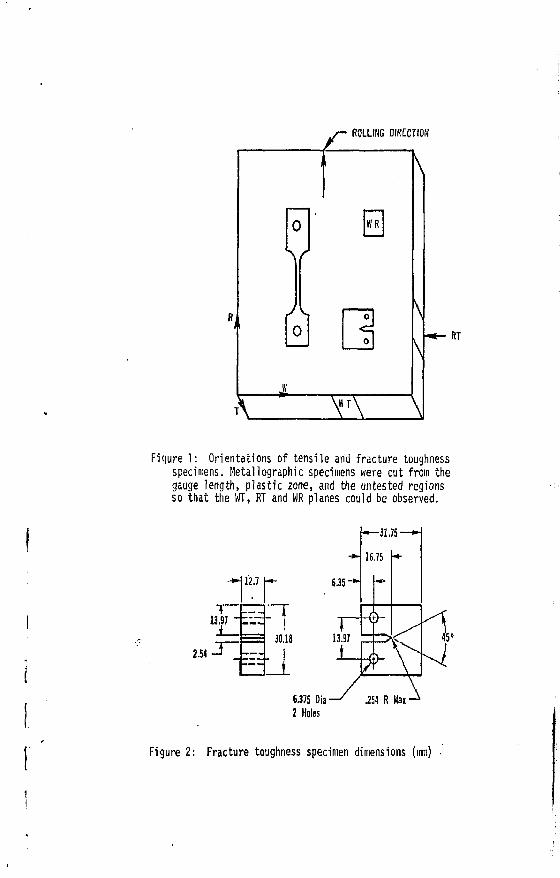
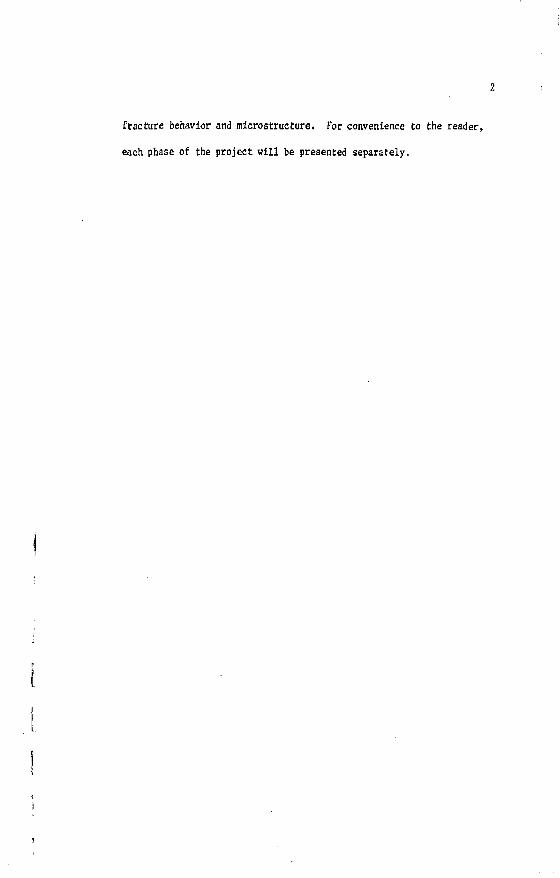
ROLLING DIRECTION
RT
Figure 1: Orientations of tensile and fracture toughness specimens. Metallographic specimens were cut from the gauge length, plastic zone, and the untested regions so that the WT, RT and WR planes could be observed.
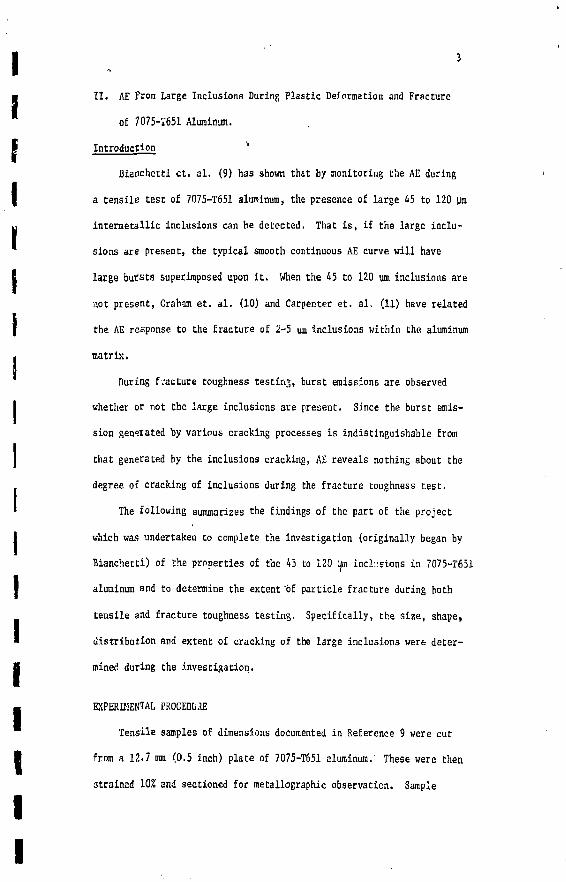
13,97
2.M-J
12.7
30.18
6 . 3 5 * *
6.375 Dia-2 Holes
.254 R Max
Figure 2: Fracture toughness specimen dimensions (mm)
4
orientations are shown in Figure 1.
Fracture toughness specimens of dimensions shown in Figure 2 were
cut from the same plate of aluminum. These specimens were annealed to
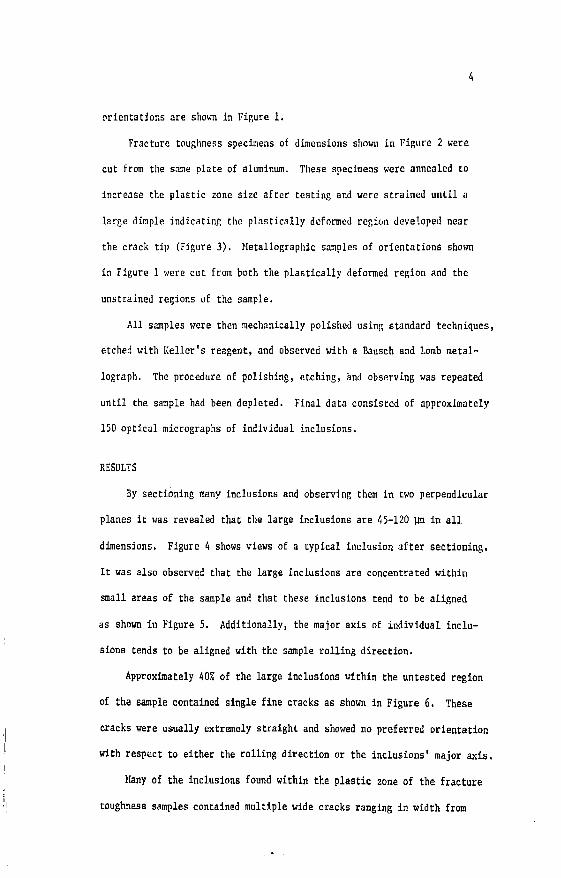
increase the plastic zone size after testing and were strained until a
large dinple indicating the plastically deformed region developed near
the crack tip (Figure 3). Metallographic samples of orientations shown
in Figure 1 were cut from both the plastically deformed region and the
unstrained regions of the sample.
All samples were then mechanically polished using standard techniques,
etched with Keller's reagent, and observed with a Bausch and Lomb metal-
lograph. The procedure of polishing, etching, and observing was repeated
until the sample had been depleted. Final data consisted of approximately
150 optical micrographs of individual inclusions.
RESULTS
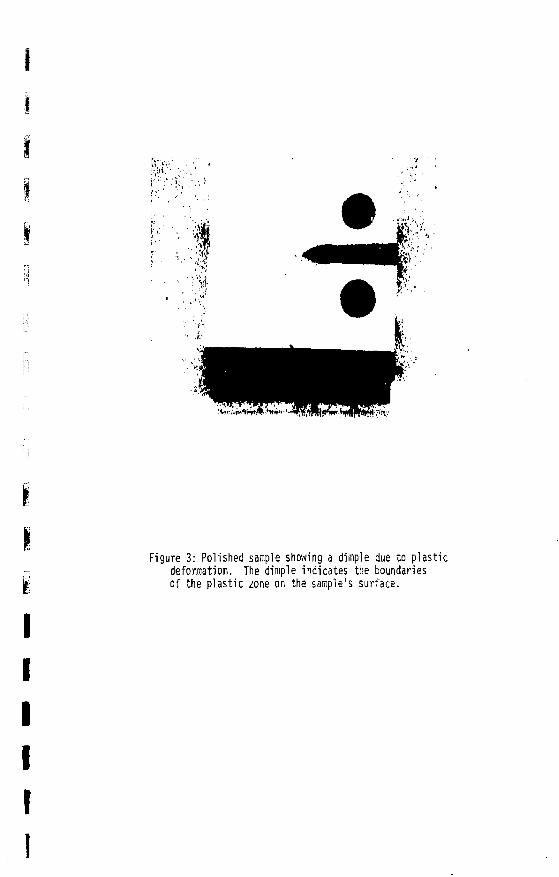
By sectioning many inclusions and observing them in two perpendicular
planes it was revealed that the large inclusions are 45-120 lim in all
dimensions. Figure 4 shows views of a typical inclusion after sectioning.
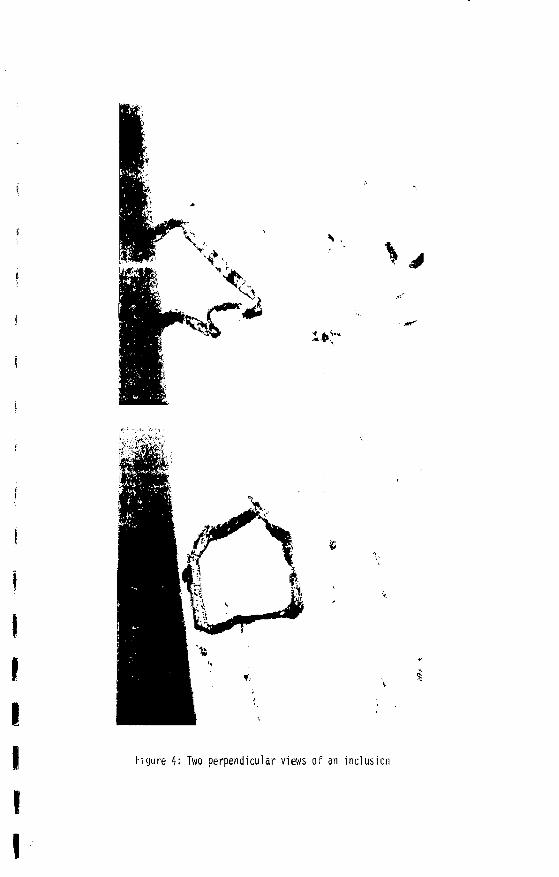
It was also observed that the large inclusions are concentrated within
small areas of the sample and that these inclusions tend to be aligned
as shown In Figure 5. Additionally, the major axis of individual inclu
sions tends to be aligned with the sample rolling direction.
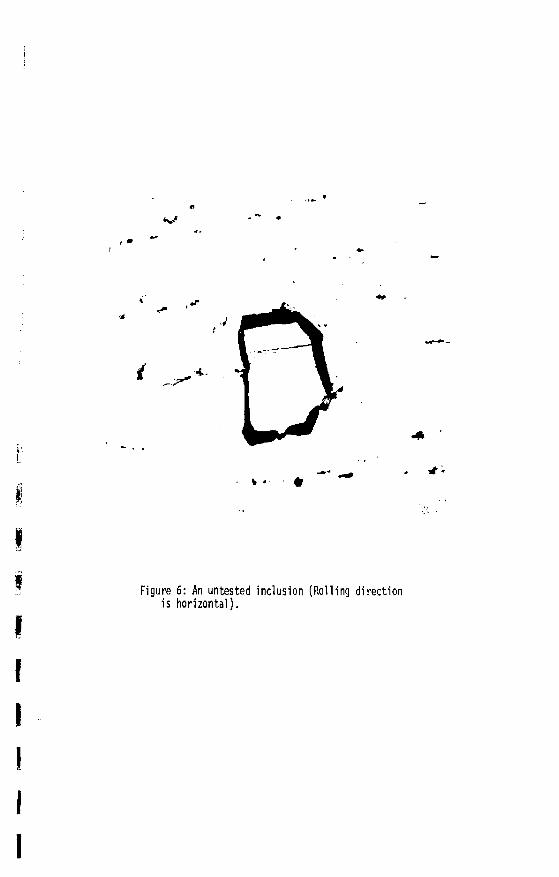
Approximately 402 of the large inclusions within the untested region
of the sample contained single fine cracks as shown in Figure 6. These
cracks were usually extremely straight and showed no preferred orientation
with respect to either the rolling direction or the inclusions' major axis.
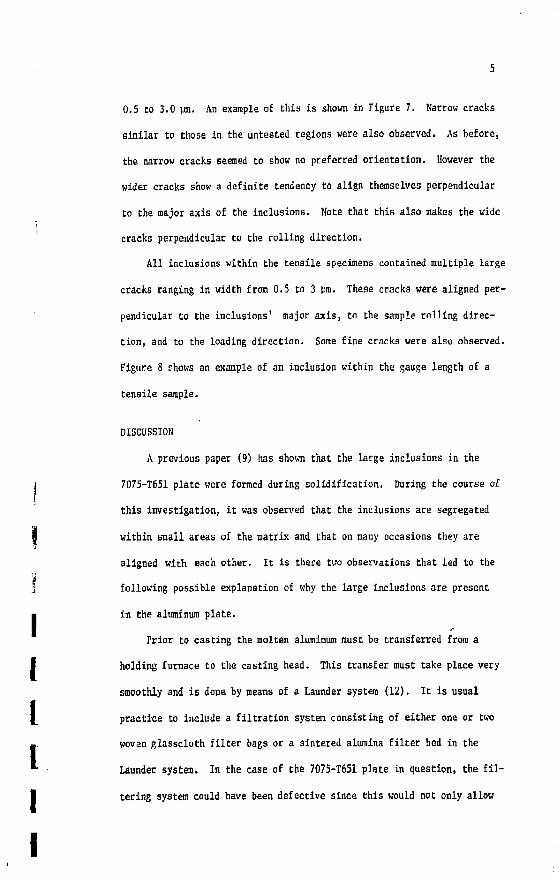
Many of the inclusions found within the plastic zone of the fracture
toughness samples contained multiple wide cracks ranging in width from
1 I
Figure 3: Polished sample showing a dimple due to plastic deformation. The dimple indicates the boundaries of the plastic zone on the sample's surface.
I
i*>
Figure 4: Two perpendicular views of an inclusion
• I -If. I-;
1 V,- * i l l 1 ; • r I d J W W ; -IV <U *!'• ^ ' ' j l «
• r • •••• • 1 - > H - ••! w i ^ V \}-\l- • >*•'
•' • ••#• ' W t H i ^ : ' h - 1 r » l : ' • f "U4 i f
( ,- . .V H i - . • » , • ; i •' . / : . '' , ;! * , • - . • •
Figure 5: An example of inclusion alignment
I I I I
«w*
' ^ -
* ' • • •
Figure 6: An untested inclusion (Rolling direction is horizontal).
5
0.5 to 3.0 yra. An example of this is shown in Figure 7. Narrow cracks
similar to those in the untested regions were also observed. As before,
the narrow cracks seemed to show no preferred orientation. However the
wider cracks show a definite tendency to align themselves perpendicular
to the major axis of the inclusions. Note that this also makes the wide
cracks perpendicular to the rolling direction.
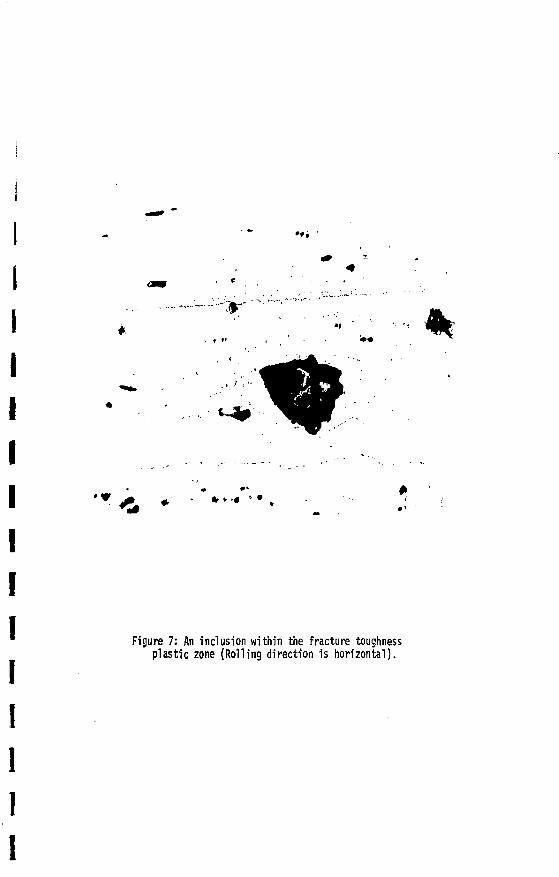
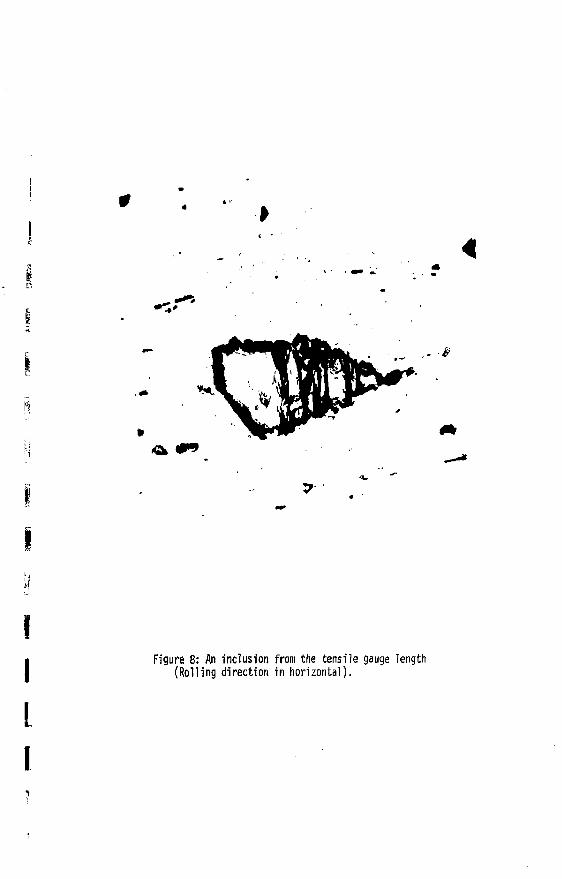
All inclusions within the tensile specimens contained multiple large
cracks ranging in width from 0.5 to 3 irai. These cracks were aligned per
pendicular to the inclusions' major axis, to the sample rolling direc
tion, and to the loading direction. Some fine cracks were also observed.
Figure 8 shows an example of an inclusion within the gauge length of a
tensile sample.
DISCUSSION
A previous paper (9) has shown that the large inclusions in the
7075-T651 plate were formed during solidification. During the course of
this investigation, it was observed that the inclusions are segregated
within small areas of the matrix and that on many occasions they are
aligned with each other. It is there tv;o observations that led to the
following possible explanation of why the large inclusions are present
in the aluminum plate.
Prior to casting the molten aluminum must be transferred from a
holding furnace to the casting head. This transfer must take place very
smoothly and is done by means of a Launder system (12). It is usual
practice to include a filtration system consisting of either one or two
woven glasscloth filter bags or a sintered alumina filter bed in the
Launder system. In the case of the 7075-T651 plate in question, the fil
tering system could have been defective since this would not only allow
*
* * • • • / I
Figure 7: An inclusion within the fracture toughness plastic zone (Rolling direction is horizontal).
<<Sfc # "
Figure 8: An inclusion from the tensile gauge length (Rolling direction in horizontal).
L
6
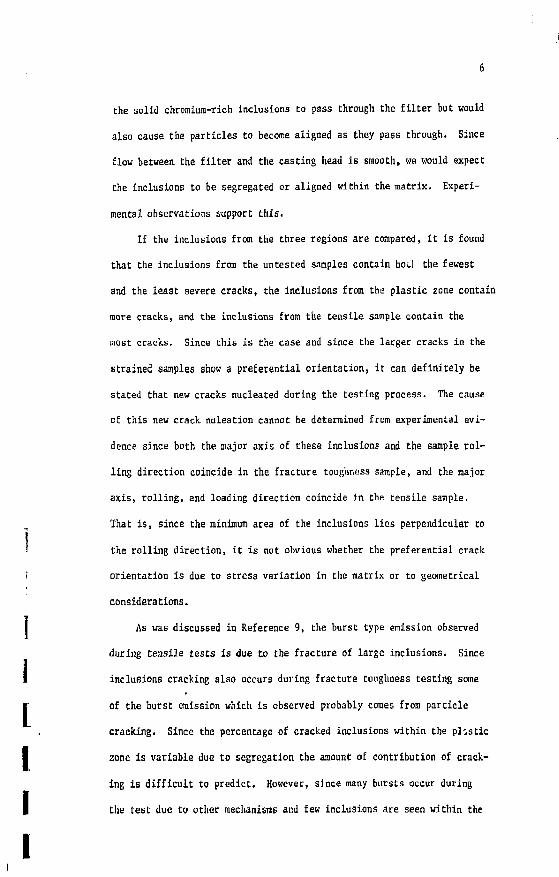
the solid chromium-rich Inclusions to pass through the filter but would
also cause the particles to become aligned as they pass through. Since
flow between the filter and the casting head is smooth, we would expect
the inclusions to be segregated or aligned within the matrix. Experi
mental observations support this.
If the inclusions from the three regions are compared, it is found
that the inclusions from the untested samples contain boil the fewest
and the least severe cracks, the inclusions from the plastic zone contain
more cracks, and the inclusions from the tensile sample contain the
most cracks. Since this is the case and since the larger cracks in the
strained samples show a preferential orientation, it can definitely be
stated that new cracks nucleated during the testing process. The cause
of this new crack nuleation cannot be determined from experimental evi
dence since both the major axis of these inclusion? and the sample rol
ling direction coincide in the fracture toughness sample, and the major
axis, rolling, and loading direction coincide in the tensile sample.
That is, since the minimum area of the inclusions lies perpendicular to
the rolling direction, it is not obvious whether the preferential crack
orientation is due to stress variation in the matrix or to geometrical
considerations.
As was discussed in Reference 9, the burst type emission observed
during tensile tests is due to the fracture of large inclusions. Since
inclusions cracking also occurs during fracture toughness testing some
of the burst emission which is observed probably comes from particle
cracking. Since the percentage of cracked inclusions within the plastic
zone is variable due to segregation the amount of contribution of crack
ing is difficult to predict. However, since many bursts occur during
the test due to other mechanisms and few inclusions are seen within the
7
plastic zone, the AE response from aluminum with the large inclusions
is not markedly different from the response of aluminum without inclusions.
III. Acoustic Emission from Pure Metals
Introduction
A "pure" metal, for the purposes of this discussion, is a metal
or alloy which would contain no inclusions which could crack or decohere
to cause AE. That is a pure alpha brass would be considered in much the
same way as would pure Cu or Zn.
A number of authors have studied the AE responses from pure metals
and have concluded that the mechanism involved is related to some type
of dislocation activity. Many reasons have led to these conclusions.
One of the most convincing of these can be reviewed by comparing the AE
response (as measured by a true EMS voltmeter) with a materials stress
strain curve. Generally, materials such as Cu, Ni, or Ag with smooth
^triss strain curves exhibit smooth continuous AE curves. Usually, the
RMS level from th^ material remains low until just before yield (when
the longer dislocation segments begin to move) reaches •„ maximum at
approximately yield (probably due to an increase in dislocation activity)
and decays slowly with increasing strain. These correlations and the
fact that the RMS curve resembles Gilraan's curve for mobile dislocation
density was one of the first indications that AE was dislocation related.
In iron alloys and alpha brasses which exhibit discontinuous defor
mation characteristics, AE shows large increases when dislocation motion
increases thus again implying that AE is dislocation related. The obser
vations that AE decreases with increasing cold work (14), decreasing
grain size (15), and neutron irradiation (16) also support the theories
of AE being dislocation related.
Even though most authors agree that AE from pure metals is disloca
tion related, few agree on the specific process which is causing the
9
emission. Some of the suggestions of possible mechanisms which have
been made include dislocation multiplication, pile-up and breakaway of
dislocation tangles, dislocation unpinning, initial dislocation moti i,
and slip advances. Of these, the experimental data for pure metals
which deform continuously (that is,those which have a smooth stress
strain curve) support a dislocation unpinning mechanism.
Some examples of results which support this are given by Schofield
(17) working with gold in 1964, James and Carpenter (18) working with
LiF, Carpenter, et. al. (11) working with the first dislocation peak in
7075-T6 aluminum and Olson, et. al. (13) working with Al-Cu alloys.
Carpenter, as well as Olsoti,using internal friction techniqi i, has
shown that the AE peak corresponds to an internal friction pe. caused
by dislocation interaction with pinning points whether these ar L solute
atoms or precipitates. Frederick (14) has observed that the AE from a
metal is decreased by a decrease in initial dislocation segment length
due to cold work or precipitation hardening. Nakasa has observed this
same effect by studying the affects of neutron irradiation on AE in pure
copper. Since the energy released during unpinning is related to the
segment length involved, this supports an unpinning theory. Final sup
port for the dislocation pinning theories comes from Eisenblatter (19),
who has successfully correlated the AE response in the form of an RMS
voltage to the mean free path of a dislocation within the mateiial.
This, in fact, would mean that pinning must be an important factor
effecting the AE response.
The following is a summary of the phase of this project which was
undertaken to check a dislocation unpinning theory by Hamstad and Muk-
herjee (5) using pure Al, Ni, Zr, and Cu as typical pure metals.
10
Data for the copper in both the cold worked and annealed states
was generated in our laboratory. Data for the Al, f.'i, and Zr was ob
tained from Iraaeda, et. al. (20).
Theoretical Considerations
In a recent paper by Hamstad and Mukherjce (5), a theory relating
AE (in the form of RMS from a true RMS voltmeter) to the process of
dislocation unpinning was developed. The following is a modified version
of their theoretical analysis which will take into account both the
initial dislocation density as well as the dislocation density due to
plastic deformation.
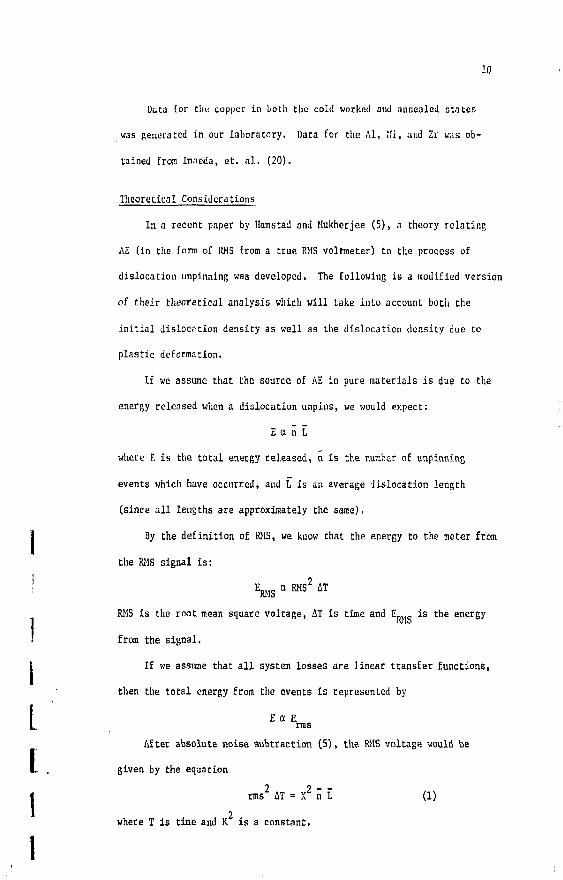
If we assume that the source of AE in pure materials is due to the
energy released when a dislocation unpins, we would expect:
E a n L
where E is the total energy released, n is the nur.ber of unpinning
events which have occurred, and L is an average dislocation length
(since all lengths are approximately the same).
By the definition of RMS, we know that the energy to the meter from
the RMS signal is:
E R M S a RMS 2 AT
RMS is the root mean square voltage, AT is time and E R M _ is the energy
from the signal.
Xf we assume that all system losses are linear transfer functions,
then the total energy from the events is represented by
E d E. rms After absolute noise subtraction (5), the RMS voltage would be
given by the equation
m s 2 AT = K 2 n L (1) 2
where T is time and K is a constant.
11
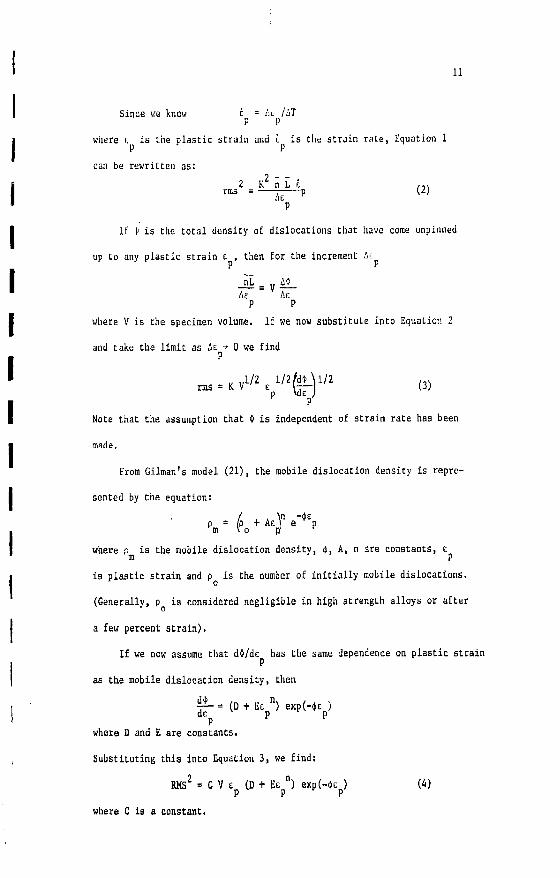
Since we knew i = :';>- /AT P P where r. is the plastic strain and c is the strain rate, Equation 1 P P can be rewritten as;
2 — . 2 K n L e ,~s rms = ; p (£) UE P
If 1> is the total density of dislocations that have come unpinned
up to any plastic strain e , then for the increment Ar
Ae Ae P P where V is the specimen volume. If we now substitute into Equation 2
and take the limit as AE + 0 we find P
= K V 1 / 2 £ 1 / 2 | L W 2 ( 3 ) p vuy Note that Che assumption Chat * is independent of strain rate has been
made.
From Oilman's model (21), the mobile dislocation density is repre
sented by the equation:
p = (p + Ac e p m V o p1 e
where p is the mobile dislocation density, <f, A, n are constants, e u P is plastic strain and p is Che number of initially mobile dislocations.
(Generally, p is considered negligible in high strength alloys or after
a few percent strain), If we now assume that d*/<fc has the same dependence on plastic strain P
as the mobile dislocation density, then
^- = (D + Ee n ) e x p H t ) de p p P
where D and £ are constants.
Substituting this into Equation 3, we find:
RMS 2 = C V e (D t E E ") e x p H e ) (4) P P P
where C is a constant.
12
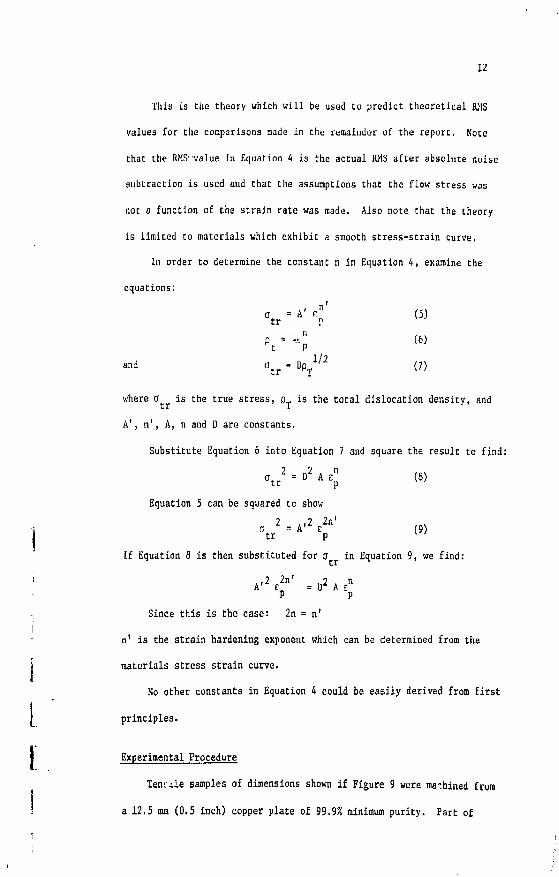
This is the theory which will be used to predict theoretical RMS
values for the comparisons nade in the remainder of the report. Note
that the RMS-value in Equation 4 is the actual RMS after absolute noise
subtraction is used and that the assumptions that the flow stress was
not a function of the strain rate was made. Also note Chat the theory
is limited to materials which exhibit a smooth stress-strain curve.
In order to determine the constant n in Equation 4, examine the
equations:
<T = A' r"' (5) tr r
P = ^" (6) t P
1/2 ™ d O t r = Dp T ' (7)
where a is the true stress, p is the total dislocation density, and
A', n', A, n and D are constants.
Substitute Equation 6 into Equation 7 and square the result to find:
°tr2 = ° 2 A \ < 8> Equation 5 can be squared to show
•J - »'2
s
fc' If Equation 8 is then substituted for o in Equation 9, we find:
A'V n' = D 2 A £r ' P P
Since this is the case: 2n = n'
n' is the strain hardening exponent which can be determined from the
materials stress strain curve.
No other constants in Equation 4 could be easily derived from first
principles.
Experimental Procedure
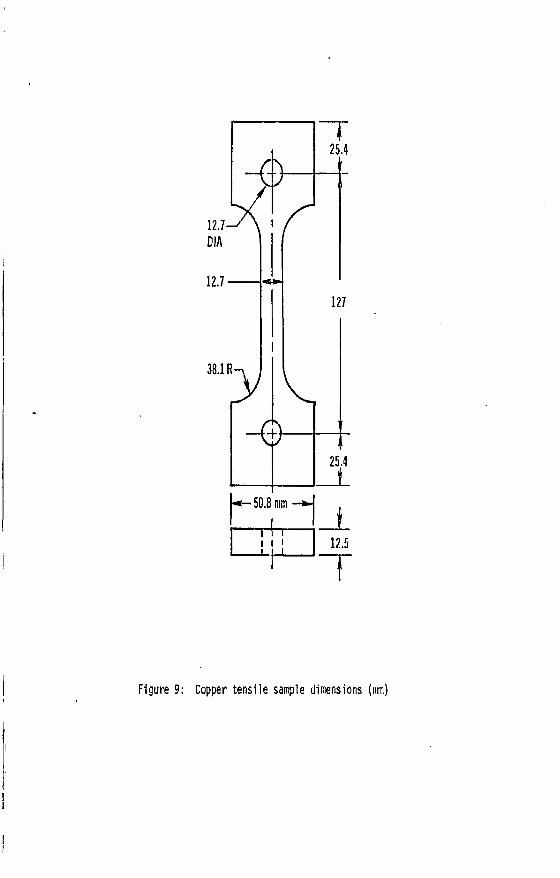
Tear ile samples of dimensions shown if Figure 9 were ma-.hined from
a 12.5 mm (0.5 Inch) copper plate of 99.9% minimum purity. Part of
——50.8 mm - * - • I i i i i 12.5
*
Figure 9: Copper tensile sample dimensions (nun)
I
13
these were annealed enough to cause full recrystallization. All were
then stored in the atmosphere at ambient temperature until testing began.
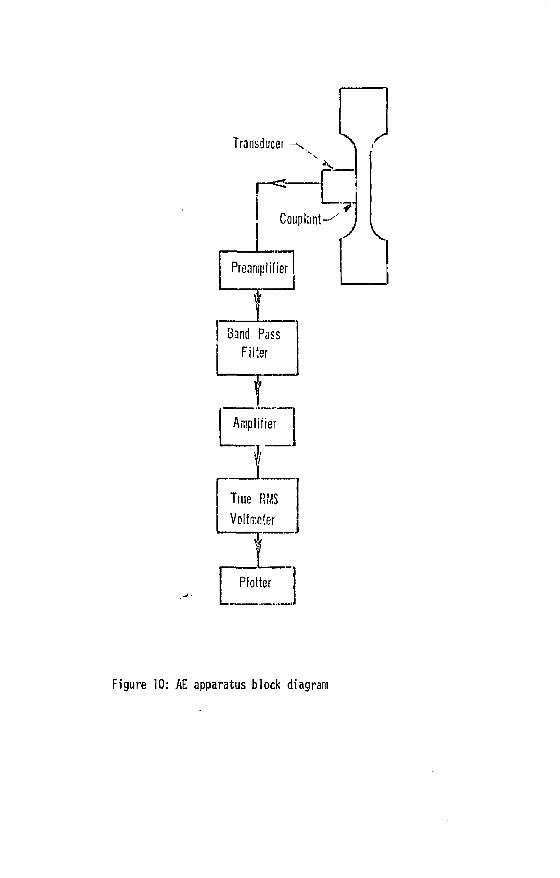
The AE response of each sample during a tensile test was measured
using a model TTD Instron testing machine and an AET Model 201 Acoustic
Emission Laboratory Signal Processor, The Signal Processor consists of
a model AC175L resonant type PZT transducer with resonance at 175Khz, a
band pass filter set at 125-250Khz, a preamplifier (69db gain), an am
plifier (32db gain) and a true RMS volt meter. A block diagram of the
equipment is shown in Figure 10. Note that the transducer is coupled to
the sample with AET SC3 couplant and is held in place with a rubber band.
The procedure followed during testing included a number of steps to
eliminate the effects of extraneous noise and to remove anything which
could attenuate the true AE signal. Initially, the sample pin areas
;• were preloaded to 1,3 times the ultimate strength of the gage length so
as to avoid AE being generated from the pin areas. Specimens were then
etched with a dilute nitric acid solution prior to testing to remove sur
face oxides. Teflon plates were placed between the fixtures of the In
stron and between the loading pins and gripping fixtures to reduce ex
traneous noise. Finally, the 25.4 mm (1 inch) gage length extensiometer
for strain measurement, and the transducer were attached to the sample,
and a light coating of grease was applied just outside the gage length
to decrease noise effects. -3 -1 All tests were run at a strain rate of 1.67 x 10 sec with noise
levels being measured before and after each test. Fracture surfaces
and surface textures were visually examined after each test. The final
data consisted of Force - Elongation and RMS - Elongation curves for
copper in both the annealed and cold worked state. These were then con
verted to True Stress - Strain and RMS - True Plastic Strain curves.
Transducer - r
i—_J Coupiant—-'" J V
Preamplifier
Band Pass Filter
Figure 10: AE apparatus block diagram
14
Stress-Strain and RMS-Strain curves for Ni, Al, and Zr were obtained
from the literature (20). Table 1 summarizes the important parameters
used during the tests. Complete details of the experimental apparatus
and procedure used to generate this data can be found in Iraaeda (20).
It should be noted that all RMS values tabulated hereafter have had
noise levels removed using an absolute subtraction technique (5).
Results
Experimental results for Cu, Al, Ni and Zr were compared with theo
retical predictions from the equation:
RKS 2 = C V t (D + E e") exp(-*E ) P P P
with n being determined from the strain hardening exponent of each
material. Since no reasonable correlations could be made, the theore
tical equation was modified so that:
RMS 2 = C VE [D e m exp (-Re: ) + E E n exp H E )] (10) P P P P P
m and R are constants.
This equation uses the' part of Gilman's theory (21) which is used in
most experimental applications. However, the modifications allow the
initial dislocations to build up and decay at a rate different from those
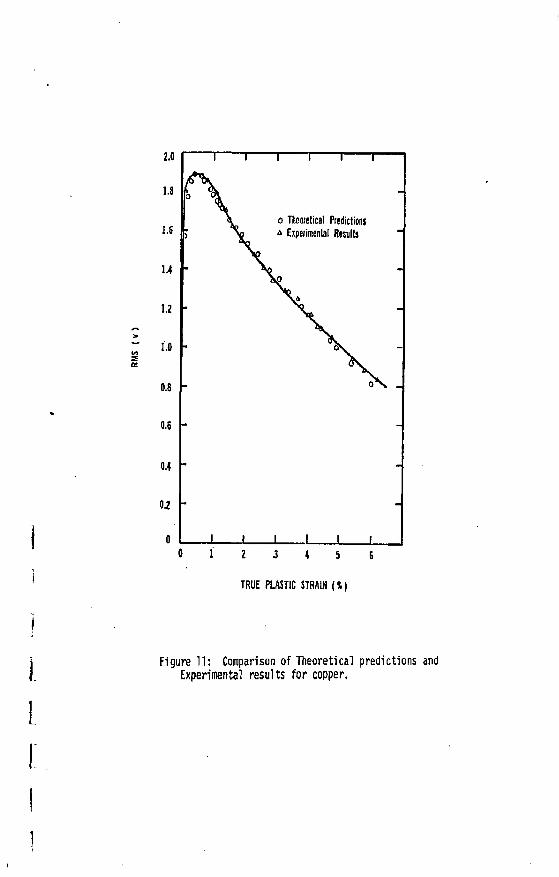
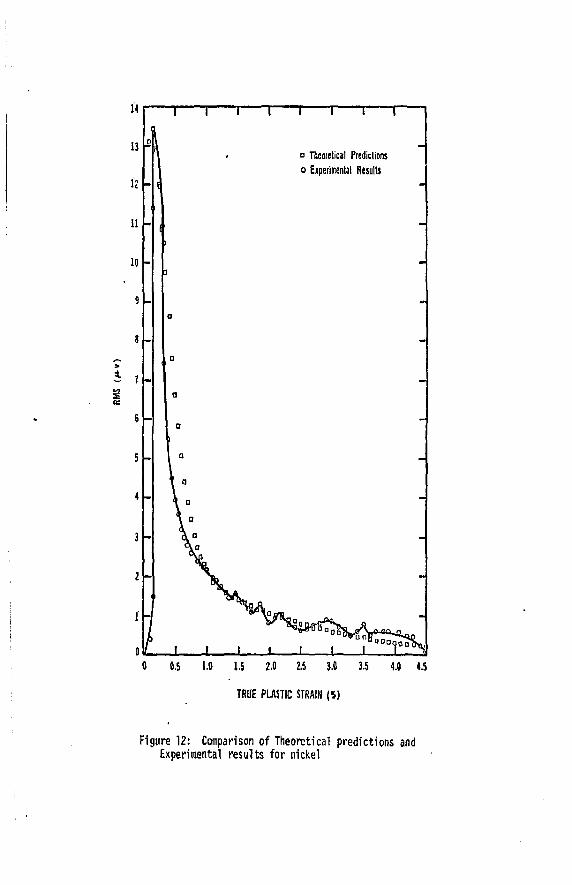
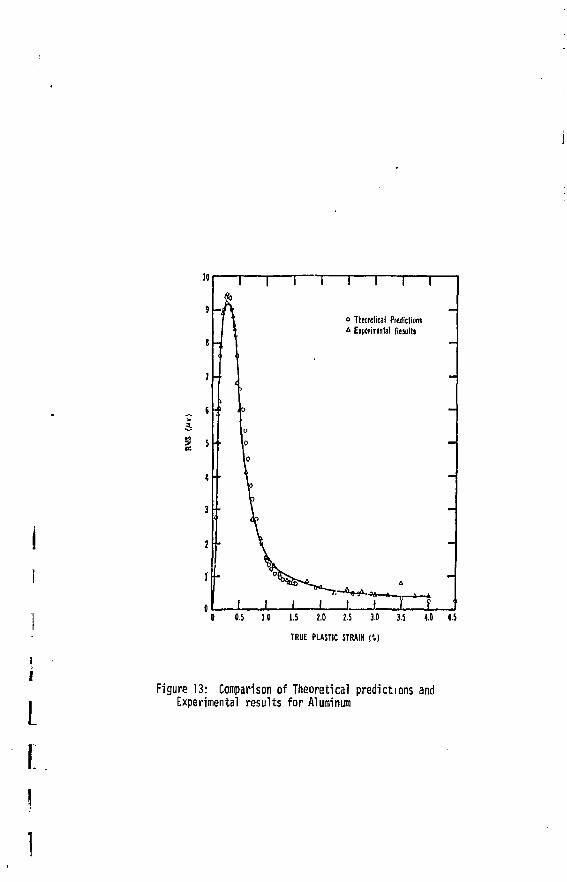
generated during deformation. Figures 11 through 14 show a comparison of
experimental results and theoretical predictions using Equation 10.
Figures 11 through 13 for the fee metals Cu, Ni, and Al respectively
show that theoretical predictions are in excellent agreement with the
average AE behavior throughout the regions of strain examined. Table 2
gives the equations used to predict the theoretical RMS values. As was
expected, the n values for the materials decreases in the order of de
creasing stacking fault energy, that is in the order Ni to Al to Cu.
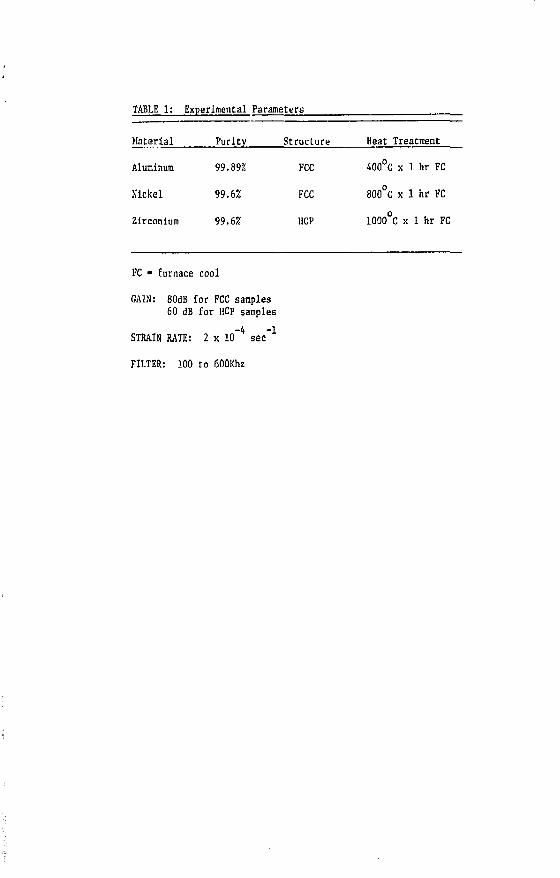
TABLE 1; Experimental Parameters
Material Purity Structure Meat Treatment
Aluminum 99.89% FCC 400°C x 1 hr FC
Nickel 99.6% FCC 800°C x 1 hr FC
Zirconium 99.6% HCP 1000 C x 1 hr FC
FC • furnace cool
GAIN: 80dB for FCC samples 60 dB for HCP samples
STRAIN RATE: 2 x 10~ 4 sec" 1
FILTER: 100 to 600Khz
2 IE
2.0
1.8
1.4
1.2
1.0
0.8
0.6
0.4
0.2
0
i 1 1 1 r
o Theoretical Predictions
0 1 2 3 4 5
TRUE PLASTIC STRAIN ( » )
; % * Experimental Results
•
\ o -
• \ 4
-
- OS. -
- oN » -
- -
i 1 1 1 1 1
-
L
Figure 11: Comparison of Theoretical predictions and Experimental results for copper.
i—i—i—r
10
5 i
1 I I L
T r
a Theaielical Predictions o Experimental Results
iJWff^
J I L 0.5 1.0 1.5 7.0 2.5 3.0 3.5 4.0 4.5
TRUE PLASTIC STRAIN {%)
Figure 12: Comparison of Theoretical predictions and Experimental results fo r nickel
* i—i—i—i—r
o Ttact ieal Predictions A Experimental Results
I I I t I Y ¥ O 0-5 1.0 1.5 2.0 2.5 3.0 3.S 4.0 4.S
TRUE PLASTIC STRAIN (*.)
L Figure 13: Comparison of Theoretical predictions and
Experimental results for Aluminum
2 3 4 5 6
TRUE FUSTIC STRAIN (5)
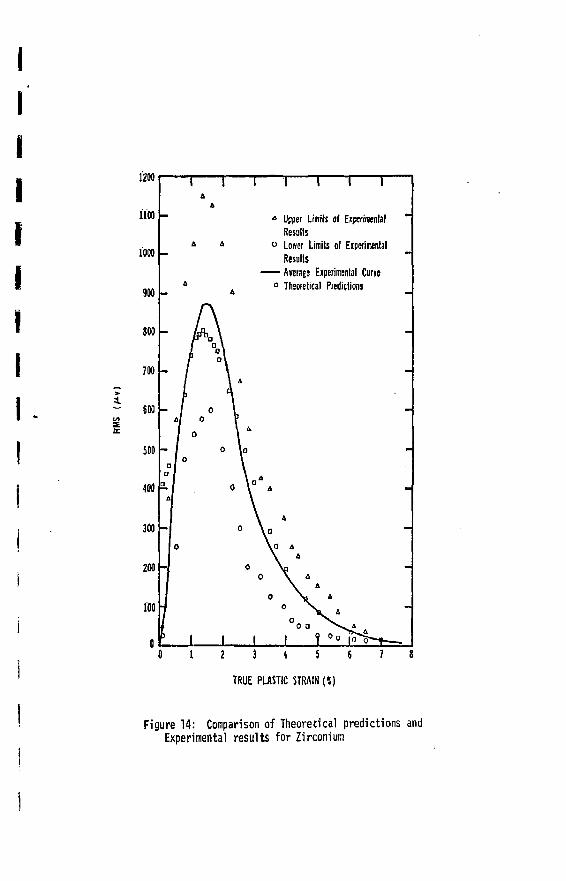
Figure 14: CompaHson of Theoretical predictions and Experimental results for Zirconium
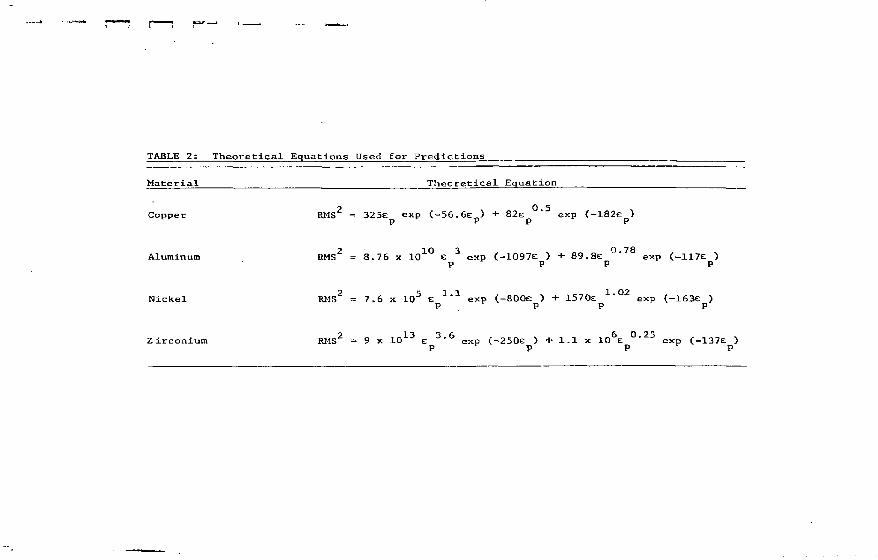
TABLE 2: Theoretical Equations Used for Predictions
Material Theoretical Equation
7 0 5 Copper RMS = 325e exp (-56.6e„) + 82e ' exp <-182e ) p P P P
Aluminum RMS 2 = 8.76 x 1 0 1 0 e 3 exp (-1097E ) + 89. 8e "" exp (-117E ) P P P P
Nickel RMS 2 = 7.6 x 10 5 e 1 " 1 exp (-800e ) + 1570e ' exp (-163e ) P . P P P
Zirconium RMS2 = 9 x 1 0 1 3 e 3 ' 6 exp (-250E > + 1.1 x 10 E * 5 exp C-137E > P P P P
I I I I «
i i i I I
15
K values given are 1.02, 0.78 and 0.50, respectively. Values for the
other constants show no relationship to the stacking fault energy due to
ti;e error in strain measurement in the Ni and Al data. (An extensiometer
was not used for strain measurements of Ni and Al).
Figure 14 compares tneoretical and e.-perimental values for zirconium.
In this case, although theoretical and average experimental values
correlate well, it must be noticed that unlike the results for the fee
metals, there is considerable experimental spread in the data. This
allows a wide variation in theoretical constants.
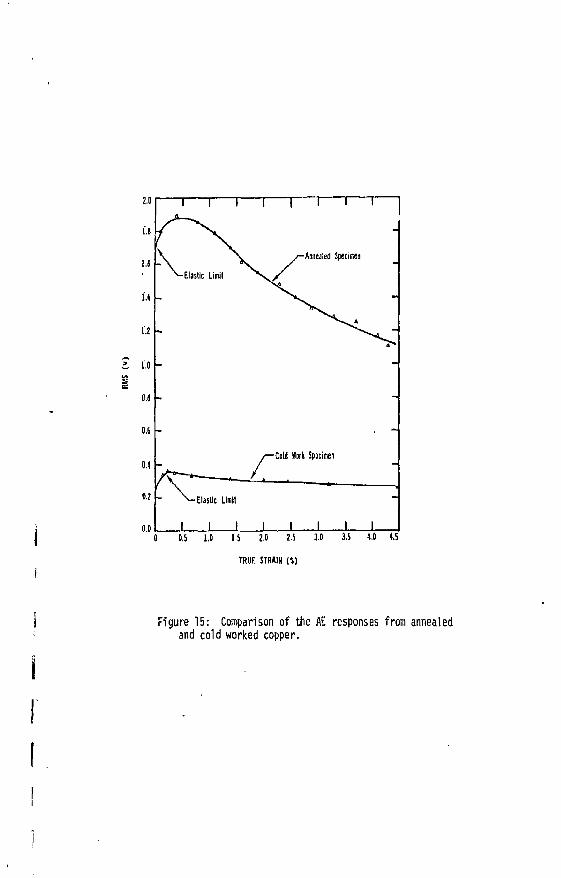
Figure 15 compares AE responses in the for.n of RMS for annealed and
cold worked copper. Two features of this figure need be noticed. First,
the peak magnitude for the annealed copper is roughly five times greater
than that for the cold worked copper. Secondly, the elastic limit as
measured from a stress strain curve occurs at the RnS peak in the cold
worked copper, but occurs much before the peak of the annealed copper.
Discussion
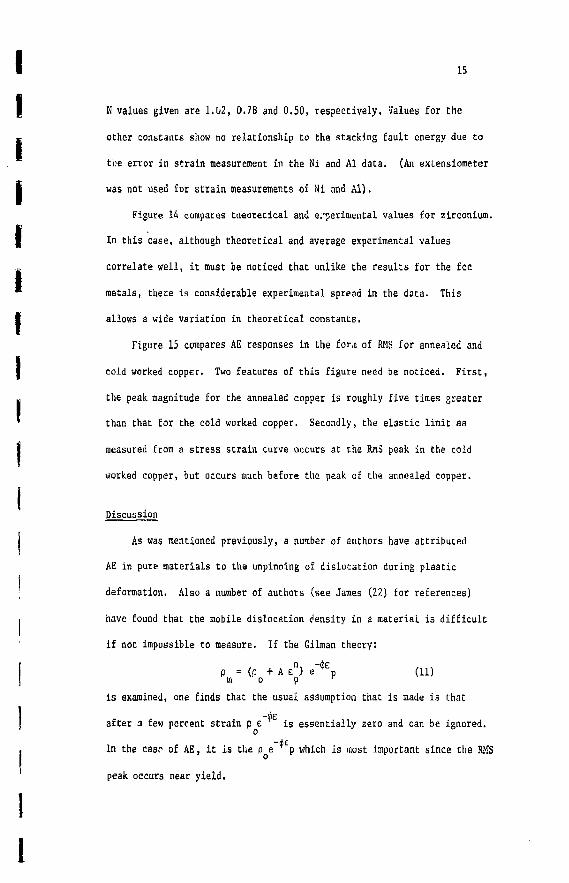
As was mentioned previously, a number of authors have attributed
AE in pure materials to the unpinning of dislocation during plastic
deformation. Also a number of authors (see James (22) for references)
have found that the mobile dislocation density in a material is difficult
if not impossible to measure. If the Gilman theory:
p = (p + A e n) e _ < j Ep (11) m o p r
is examined, one finds that the usual assumption that is made is that
after a few percent strain p e is essentially zero and can be ignored. 0
-*£
In the case of AE, it is the p e p which is most important since the RHS
peak occurs near yield.
2.D
1'.!
2.S
U
1.2
i 1.0 IS*
a. U
0.6
M
0.2
i 0.0 _ j 0 0.5 1.0 15 2.0 2.5 3.0 3.5 4.0 t.S
TRUE STRAIN ( * ) i
i Figure 15: Comparison of the AE responses from annealed and cold worked copper.
i I I . I i
1 1 1 1 I I 1 1
\ ^—Clastic Limit
y-Annealed Specimen -
-
x , ^ *
• •
A * *
- ~
- -
- -
A \ /—Cold Wort Specimen
~
A \ — Elastic Limit
1 1 1 • i i i i
Since this part of Gilman's theory is difficult to check and since
the AE data warrants such a change, we therefore feel that a slight mo
dification of Equation 11 to:
16
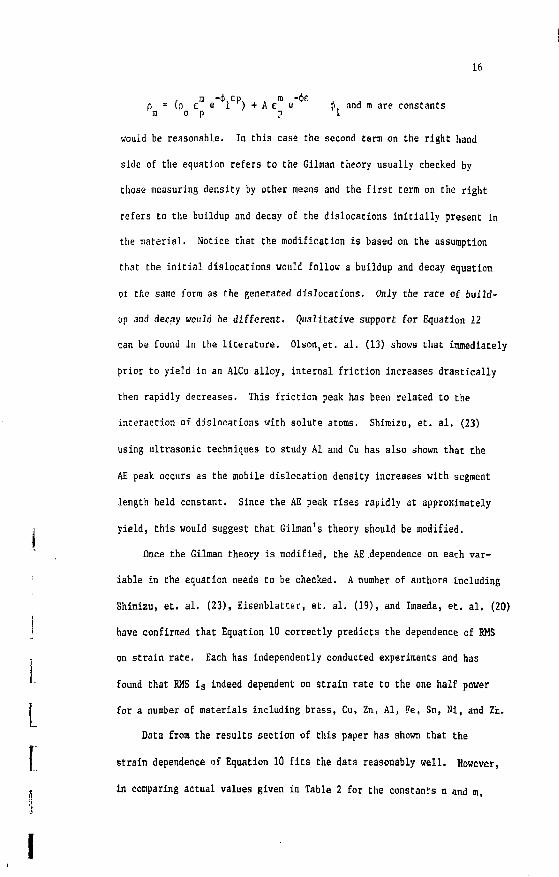
, m -t.cp^ , , m -$£ , , p = ( p e e l ) + A e e A and ra are constants n o p p 1
would be reasonable. In this case Che second term on the right hand
side of the equation refers to the Gilman theory usually checked by
those measuring density by other means and the first term on the right
refers to the buildup and decay of the dislocations initially present in
the material. Notice that the modification is based on the assumption
that the initial dislocations would follow a buildup and decay equation
of the same form as the generated dislocations. Only the rate of build
up and decay would be different. Qualitative support for Equation 12
can be found in the literature. Olson,et. al. (13) shows chac immediately
prior to yield in an AlCu alloy, internal friction increases drastically
then rapidly decreases. This friction peak has been related to the
interaction of dislocations with solute atoms. Shimizu, et. al. (23)
using ultrasonic techniques to study Al and Cu has also shown that the
AE peak occurs as the mobile dislocation density increases with segment
length held constant. Since the AE peak rises rapidly at approximately
yield, this would suggest that Gilman's theory should be modified.
Once the Gilman theory is modified, the AE .dependence on each var
iable in Che equation needs to be checked. A number of authors including
Shimizu, et. al, (23), Elsenblatter, et. al. (19), and Imaeda, et. al. (20)
have confirmed that Equation 10 correctly predicts the dependence of RMS
on strain rate. Each has independently conducted experiments and has
found that RMS i s indeed dependent on strain rate to the one half power
for a number of materials including brass, Cu, Zn, Al, Fe, Sn, Ni, and Z'r.
Data from the results section of this paper has shown that the
strain dependence of Equation 10 fits the data reasonably well. However,
in comparing actual values given in Table 2 for the constants n and m
17
a ".umber of things must be kept in mind, n has been determined from
the stress strain curve and thus is somewhat independent of small errors
in strain measurement. However, m has been empirically determined from
the RMS curve and has been found to be highly dependent on small errors
made during strain measurement. In the case of the experimental data,
the curves for Ni and Al were generated without measuring strain with
an extensiometer, thus m values should not be considered exact. In
fact, these m values are so variable that it would seem possible, if
strain measurements were entirely accurate, to eliminate the stiain
dependence of the part of Equation 10 referring to the dislocations
initially present within the material. If this could be done, the only
modification of Gilman's theory which needs be made deals with the
different decay rates of the initial and generated dislocations.
By observing Figures 11-14, a drastic difference in the data
spread of the fee and hep metals can be seen. In the case of the fee
metals, the AE curve is well defined at all values of strain. On the
other hand, the Zr curve shows a large spread in the data. An explanation
of this lies in the fact that during deformation, two processes which
generate AE occur within Zr. First, dislocation unpinning occurs much
the same as it did in fee metals. Second twinning occurs (this does not
occur in the fee metals examined). Since this is the case, the AE curve
observed in the case of Zr is a composite curve consisting of a smooth
AE curve due to dislocation motion with burst emissions due to twinning
superimposed on it. These bursts cause the data spread.
The effects of cold work on a materials' AE response is illustrated
in Figure 15. The observation that the cold worked sample shows a de
crease in peak amplitude by a factor of 5 can be explained by considering
18
the effects of cold work on the mobile dislocation density. Since
cold work increases the total density of dislocations, the mobile dis
location density should decrease due to jn increase in the amount of
dislocation interactions. Since the mobile density is decreased, fewer
dislocations can participate in the pinning process. This process is
the source of AE so the AE peak is decreased. Note that Equation 10
would predict this decrease.
I I • IV. Relationships Between Fracture Toughness and AE in 2124-T851 and 1 2048-T851 Aluminum
u Introduction
High strength aluminum alloys fracture by a void coalescence
I mechanism. Initially, the process begins when large second phase
particles begin to fracture or decohere from the matrix causing
I l a rge voids to develop. Since these voids are seperated by large
a distances, void coalescence can not occur. Instead, as the process
continues the smaller inclusions begin participating in the void
I formation process. Eventually the spacing between voids reaches
a critical value and coalescence occurs. This completes the frac-
I ture process.
. Hahn, et. al. (24), Low, et. al. (25) and Ryder (26) have indepen-
' dently summarized some of the variables which affect fracture by void
I formation and coalescence. Their conclusions are as follows. Increased I
size and volume fraction of inclusions will generally decrease the fract
strength since larger inclusions usually fracture at lower stresses and
increased volume fraction affects void coalesence. Particle properties
such as strength and elastic modulus influence fracture in that they
control the stress at which the inclusions will break and the stress
felt by the inclusions. Interface properties are important since they
control decohesion. Local stress concentrations within the matrix and
grain size are important. Also, previous processing may have an effect
since this may precrack the inclusions. In the case of high strength aluminum, the factors dealing with inclusions are the usual means of raising a material's fracture toughness.
20
Generally, when considering the effects of inclusions on the
fracture behavior of a high strength aluminum, three types of inclusions
must be considered (24). The largest inclusions found within the large
dimples of the aluminum's fracture surface is approximately 0.1 to 10 pm
in diameter and contains iron, copper, and silicon. The iron and silicon
which causes these inclusions to form is present as impurities within the
matrix, however the copper is an alloying element added to improve aging.
The intermediate size inclusions which are generally found within the
smaller dimples of the fracture surface generally contain chromium,
magnesium, or zirconium. These elements are alloying elements that were
added to control recrystallization. The final inclusion within the
mi ix is a hardening precipitate which is primarily added to strengthen
the matrix and plays little role in the fracture process.
Of the high strength aluminums, the 2000 series has been used for
a number of aircraft and other engineering construction applications
where weight is a major concern. The first Al-Cu-Mg (2000 series) alloy
was discovered by Wilm approximately 60 years ago and is now designated
2017 (29). Some years later, metallurgists began to add silicon to the
alloy to enhance the artificial aging process and alloy 2014 was born.
In the 1930's,2024 was introduced as a higher strength alloy to replace
2017. Later an alloy, 2124, was developed which had even better mechan
ical properties than 2024 and recently an alloy, 2048, has been Intro-
dueed with even better fracture properties. (Tables 3a and b list mech
anical properties and nominal compositions of some of these alloys.)
With the Improvements in the strength properties of aluminum alloys,
p;oblems with fracture have arisen to such an extent that now alloys must
mfeet certain fracture toughness requirements before they can be used for
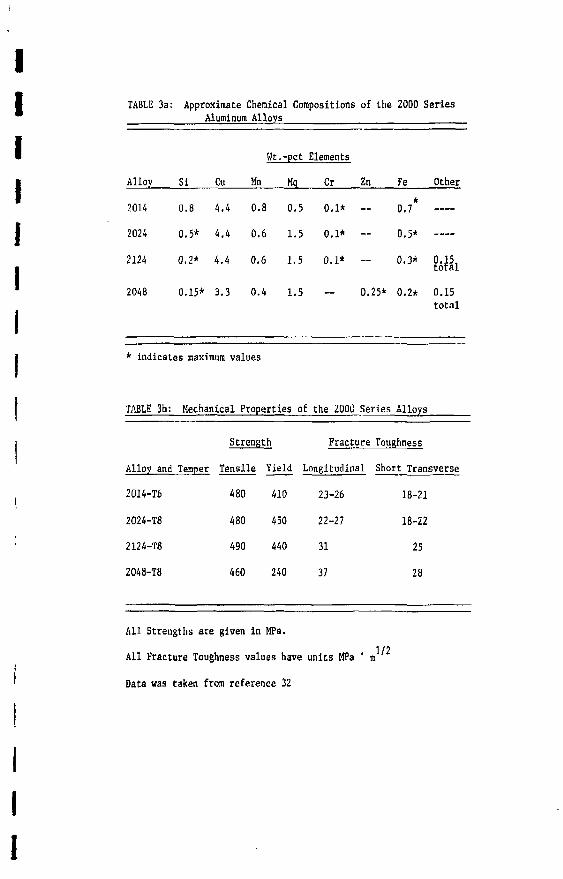
TABLE 3a: Approximate Chemical Compositions of the 2000 Series Aluminum Alloys
Ht.-pct Elements
Alloy Si Cu Mn Mq_ Cr Zn Fe Other
2014 0.8 4.4 0.8 0.5 0.1* — 0.7*
2024 0.5* 4.4 0.6 1.5 0.1* — 0.5*
2124 0.2* 4.4 0.6 1.5 0.1* — 0.3* 0.15, total
2048 0.15* 3.3 0.4 1.5 — 0.25* 0.2* 0.15 total
* indicates maximum values
TABLE 3b: Mechanical Properties of the 2000 Series Alloys
Strength Fracture Toughness
Alloy and Temper Tensile Yield Longitudinal Short Transverse
2014-T6 480 410 23-26 18-21
2024-T8 480 450 22-27 18-22
2124-T8 490 440 31 25
2048-T8 460 240 37 28
All Strengths are given in MPa. 1/2 All Fracture Toughness values have units MPa ' m
Data was taken from reference 32
21
certain applications. Since fracture toughness testing is difficult
and expensive, new testing methods are being explored, Gerberich,
working with iron alloys (27), and Graham, et. al. (10) and Bianchetti,
et. al. (9) working with aluminum alloys have shown that the primary
source of AE from alloys with second phase particles is due to inclu
sion cracking or decohesxon. This, as Mirabile (28) has stated, is
because the AE due to fracture or decohesion of particles is much greater
than that due to dislocation motion. Since, then, both fracture toughness
and AE are related to the cracking or decohesion of inclusions, AE
could possibly be used to predict the fracture behavior of a certain
plate of material.
Hamstad, ec. al. (29) has shown some correlation between AE and
fracture toughness in three plates of 212A aluminum and has shown how
AE varies with orientation. However, in the preliminary investigation
no attempt was made to related the AE differences to the plate micro-
structure. During the course of this investigation, the AE from the same
three 2124 plates will be related to their microstructural differences.
Also AE behavior, fracture toughness values, and microstructures of
2124 and 2048 aluminum will be compared. Correlations among these
variables will be made when possible.
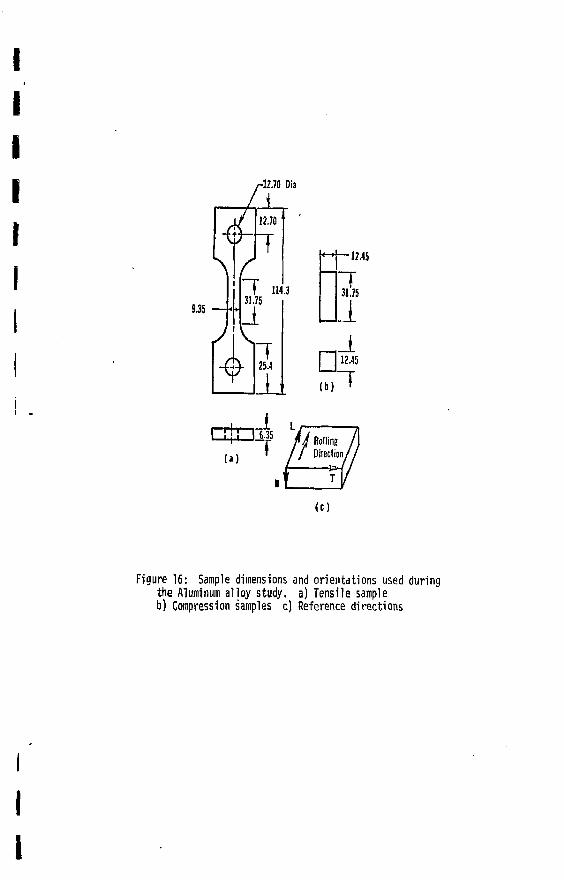
Experimental Procedure
Tensile and compression sample? of dimensions shown in Figure 16
were cut from three half inch pljtes of 2124-T851 aluminum. In this case,
the loading axes were always parallel to the plate rolling direction.
Chemical compositions and fracture toughness values for each are given
in Table 4.
\
9,35
J *
-12.70 Dia
i_ 12,70 '
"T T 114.3 31.75
% 25.4 II
-12.45
T 31.75
LU P I 12.45
(b) •
1 / / Direction/ (») -£*-/
<C)
Figure 16: Sample dimensions and orientations used during the Aluminum alloy study, a) Tensile sample b) Compression samples c) Reference directions
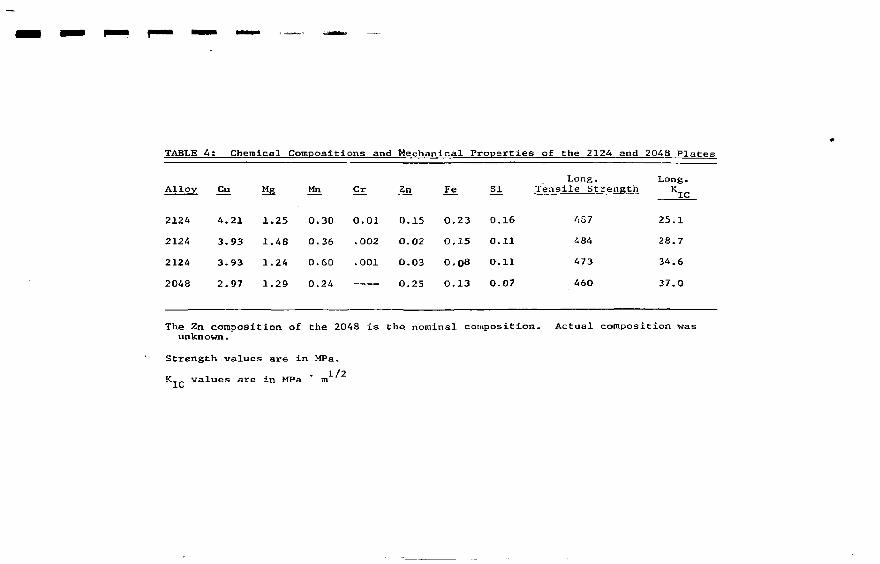
TABLE 4; Chemical Compositions and Mechanical Properties of the 2124 and 2048 Plates
Long. Long. Alloy Cu Mg Mn Cr jii Fe_ 5±_ Tensile Strength K
2124 4.21 1.25 0.30 0.01 0.15 0.23 0.16 'i37 25.1 2124 3.93 1.48 0.36 .002 0.02 0.15 0.11 484 28.7 2124 3.93 1.24 0.60 .001 0.03 0.08 0.11 473 34.6 2048 2.97 1.29 0.24 0.25 0.13 0.07 460 37.0
The Zn composition of the 2048 is the nominal composition. Actual composition was unknown.
Strength values are in MPa. 1/2 K values are in MPa m
22
Tensile and compression samples of the same dimensions were also
cut from a half inch plate of 20A8-T851 aluminum. In this case, loading
axes were oriented in either the longitudinal or the transverse direc
tion of the original plate. Compositions and approximate fracture
toughness values are given in Table 4.
Prior to testing all pin areas were preloaded to eliminate possible
emission from these areas. Teflon was placed between all fixtures of
the testing machine and samples were strained 102. While deformation
was occurring AE was monitored using a system similar to that shown in
Figure 10. In this case, however, an AET model C175B transducer was
used in conjunction with a band pass filter set at either 100-300Khz or
15-300Khz. Overall system gain was lOOdb.
After testing, the tensile samples were sectioned and mounted in
lucite so that planes perpendicular to the longitudinal, long transverse,
and short transverse directions could be examined. Specimens were then
mechanically polished using standard techniques and were etched with
either Kellers reagent or a dilute nitric acid solution. All were then
examined with the scanning electron microscope, the optical microscope,
and the electron microprobe.
Raw data consisted of approximately 250 micrographs.
Results
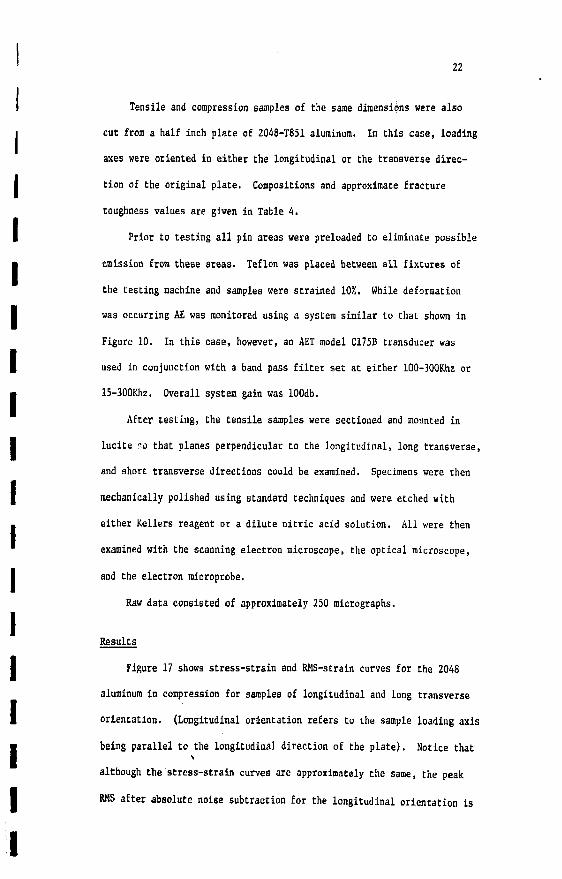
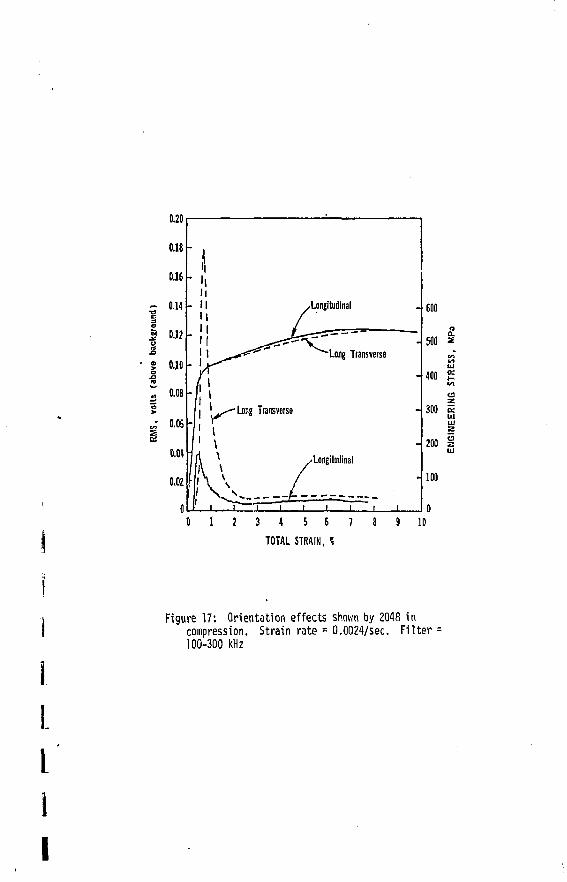
Figure 17 shows stress-strain and RMS-strain curves for the 2048
aluminum in compression for samples of longitudinal and long transverse
orientation. (Longitudinal orientation refers to the sample loading axis
being parallel to the longitudinal direction of the plate). Notice that
although the stress-strain curves are approximately the same, the peak
RMS after absolute noise subtraction for the longitudinal orientation is
a.
I
5 6 7 8
TOTAL STRAIN, *
Figure 17: Orientation effects shown by 2048 in compression. Strain rate B 0.0024/sec. F i l ter = 100-300 kHz
I
23
approximately 2.72 times less than that for the long transverse specimen.
The longitudinal peak also occurs at a lower strain than the long
transverse peak.
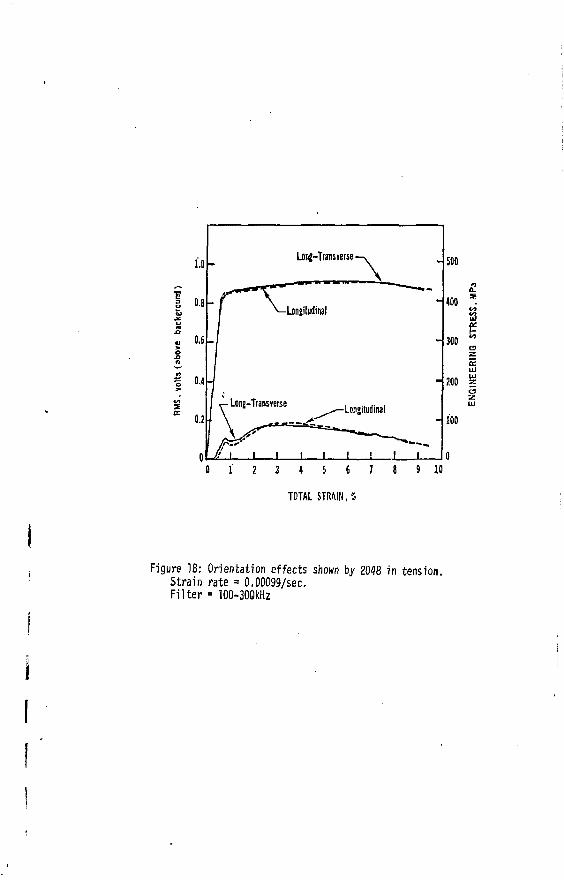
Figure 18 compares longitudinal and long transverse responses in
the frequency range 100 to 300Khz for the tensile samples of 2018.
Two things need to be noted in this case: 1) Two peaks are observed in
both cases, and 2) little or no difference in the first peak is observed.
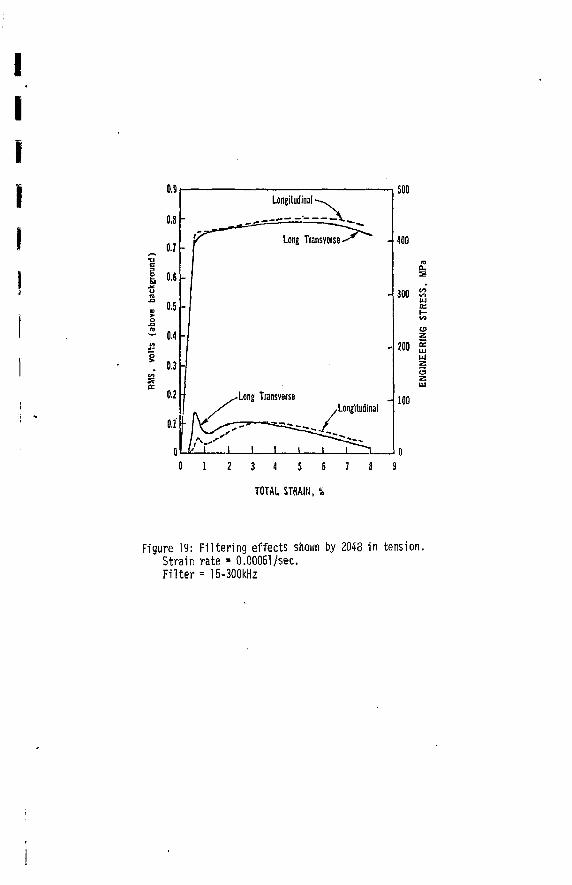
By changing the filter used in Figure 18 to L5-3O0Khz, filtering effects
can be examined (Figure 19). In this case, the 15-100Khz component of
frequency causes the long transverse peak to exceed the longitudinal
peak by a factor of approximately 1.86 after absolute noise subtraction.
Recall that this was also the case in compression when the 100 to 300Khz
filter was used.
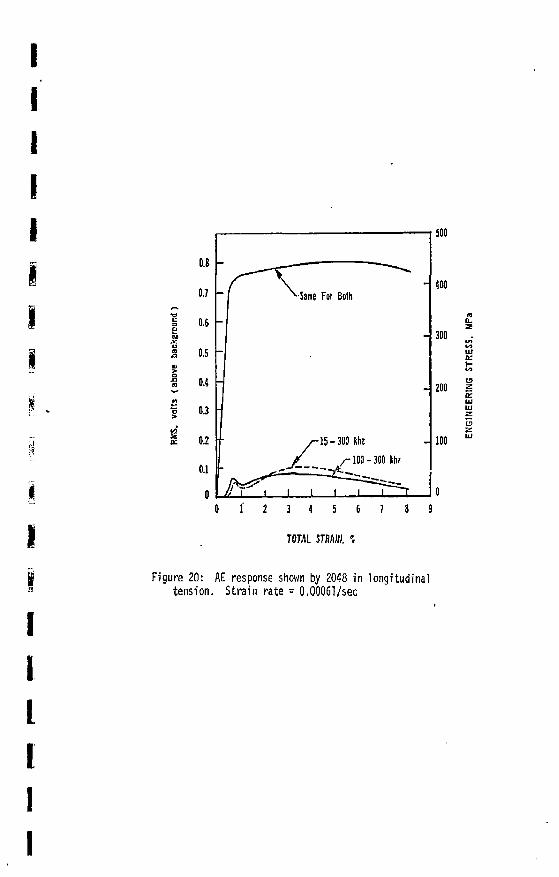
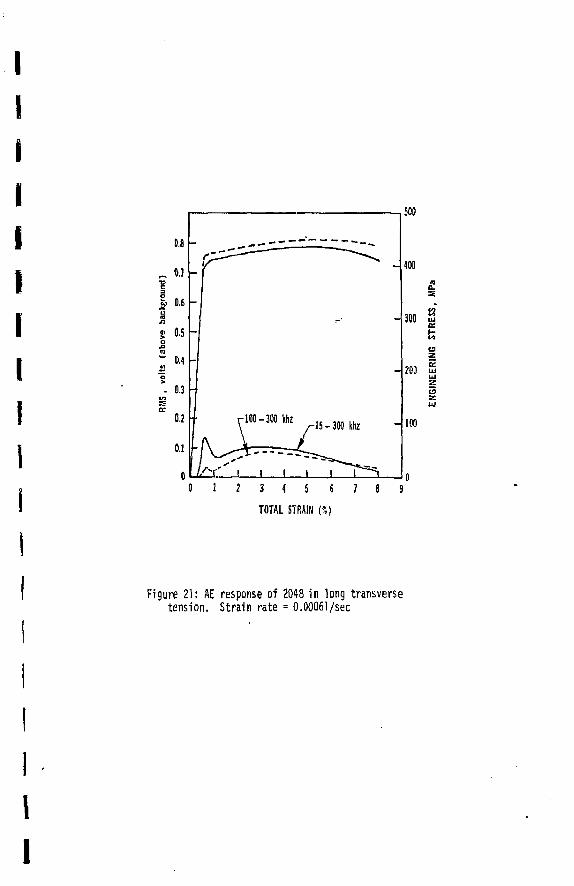
In order to identify the cause of the observed frequency dependence
of AE, the effect of filtering on both the longitudinal and transverse
planes were investigated. Results are shown in Figures 20 and 21. In
the case of the longitudinally oriented sample little or no effect of
filtering is observed. In the case of the long transverse sample
(Figure 21) the first peak is decreased by a factor of 1.6 (after abso
lute noise subtraction) when the 15 to lOOKhz frequency band is not
considered. This difference probably would not be due to the flow stress
differences observed.
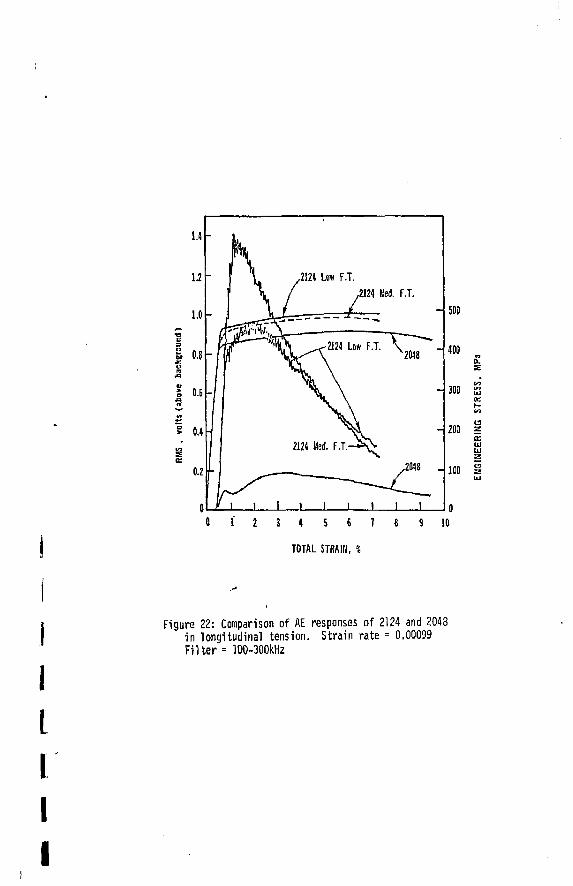
Figure 22 shows a comparison of the EMS responses of 2124 and 2048
in tension for longitudinal samples. Although the 2048 shows twin AE
peaks, one at approximately O.SZ strain and the other at about 3.552
strain, the 2124 sample curves show only one peak. This peak occurs at
approximately 1.3% strain for the medium fracture toughness sample and
2
Loiifr-Trmsverse- 500
400
300
200
100
•J!. Ill
0 1 2 3 * 5 6 7 8 9 10
TOTAL STRAIN.
Figure 18: Orientation effects shown by 2048 in tension. Strain rate = 0.00099/sec. F i l te r = 100-300kHz
I
- 0.4
longitudinal
400
300
200
100
a z
3 4 5 6
TOTAL STRAIN, S
Figure 19: Fi l ter ing effects shown by 2043 in tension. Strain rate = 0.00061/sec. F i l ter = 15-300kHz
i
0.8
0.7
0.8
0.7 Mame For Both -
.—,
1 U -
1 0.S
I 0.4
! 0.3
8 § 0.2 ^ - 1 5 - 3 D 0 khz -
0.1
0 fc< j / _ _ _ ^-100 - 300 khz:
0.1
0 fc< 1 1 1 I i ? T
500
400
-J 300
-4 200 on
UJ
«
0 1 2 3 4 5 6 7 8 9
TOTAL STJMWH, '.
Figure 20: AE response shown by 2048 in longitudinal tension. Strain rate = 0.00061/sec
I
UJ
- im tn
1 2 3 4 5 6
TOTAL STRAIN ('.)
7 8 9
Figure 21: AE response of 2048 in long transverse tension. Strain rate = O.0OO61/sec
1.4
1.2 "
1 . 0 -
£ o.8 h
£ 0.6
0.4
0.2
7\ 7\ .2124 Low F.T. V / ,2124 Med. F.T.
& - " ~ 1 — 'V\ ^r-2124 Lo* F.T. \
2124 Med. F . T . - * N
y i i
72048 -
1 1 1 1 I I 1 0 1 2 3 4 5 6
TOTAL STRAIN,
- 500
- 400
- 300
Q. E
C3 200 S
- 100
0 7 8 9 10
L
Figure 22: Comparison o f AE responses of 2124 and 2048 i n l ong i t ud ina l tens ion . S t ra in ra te = 0.00099 F i l t e r = 100-300kHz
I
24
at about 1.8% strain for the low fracture toughness sample. Peak heights
also vary among the samples with the second peak of 2048 being about 5.3
times less than that of the medium fracture toughness 2124 and about 4
times less than the low fracture toughness peak. (All values were again
determined after absolute noise subtraction was used). The ordering of
che RMS peaks with medium fracture toughness being highest, low fracture
toughness next, and 2048 lowest is different from the stress-strain
curve ordering of decreasing strength being from low to medium fracture
toughness to 2048.
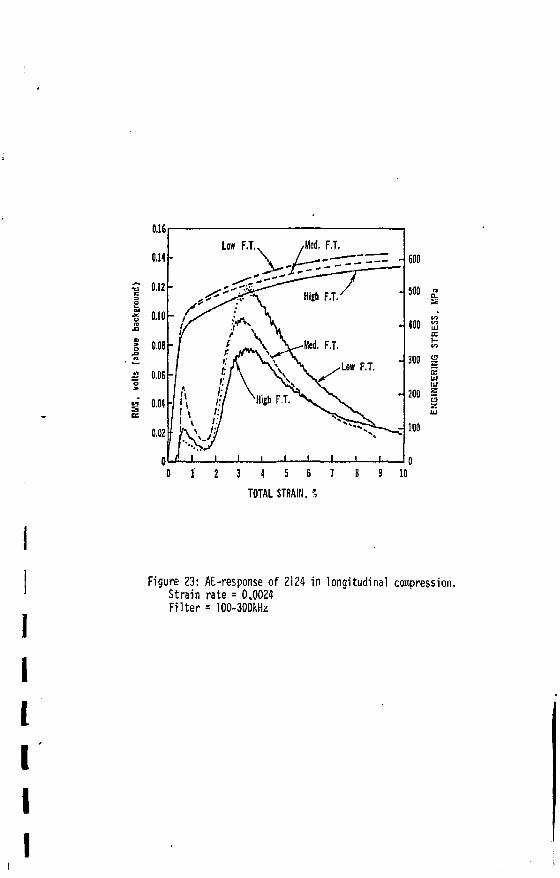
Figure 23 shows responses of 2124 aluminum of varying fracture
toughness during compression testing. Unlike the tensile responses of
the material, two AE peaks, one at .17. strain and the other at 3.5%
strain, occur during compression testing. Although flow stress decreases
from low to medium to high fracture toughness, the first AE peak de
creases in magnitude from medium to high to low fracture toughness.
Notice*however, that the second AE peaks decrease in magnitude in the
order from low to medium to high fracture toughness.
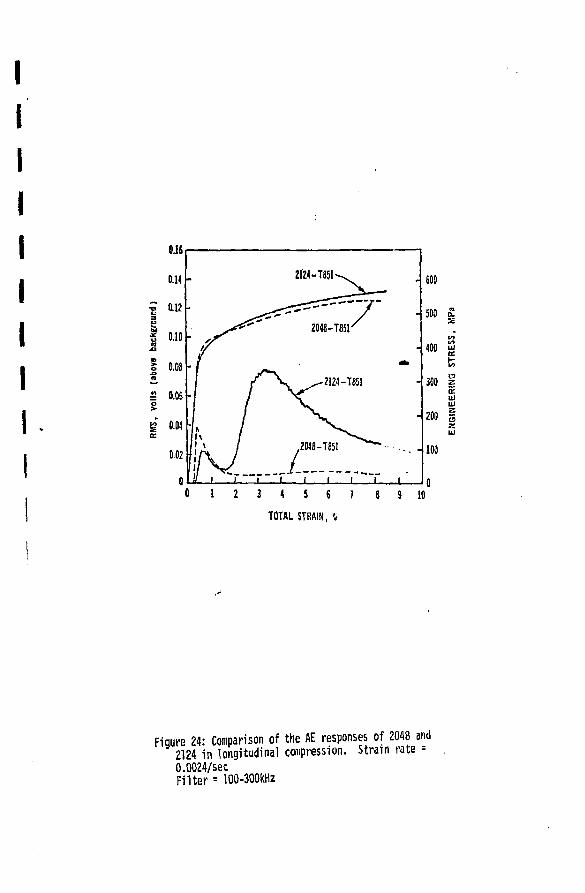
Figure 24 shows a comparison of 2048 and the 2124 high fracture
toughness samples in longitudinal compression. The first peak of 2048
is greater than the 2124 peak by a factor of 2. It also occurs at a
slightly lower strain than does the 2124 first peak. Even so, the second
peak of 2048 is almost negligible when compared to the 2124 second peak.
Recall that the high fracture toughness second peak was the lowest
second peak observed in Figure 23.
Microscopic examination has yielded a number of facts about the
samples studied. When comparing the 2048 microstructure with the 2124
microstructure, the most obvious difference is that the 2048 inclusions
are generally smaller than the 2124 inclusions (Figure 25). Figure 25
I
0.16
0.14
0.12
£ 0.10-
0.06 -
2 0.06 o > s i O.04
0.02
Low F.T.. /Med. F.T.
" ^ -• n^r •
" ^ •
- ^p$c^ Hi£h F . T . / -- / / ^ \ >r ^ \ m -( S\ -Med. F.T.
1 f J^\ V*"V
• <7\\ .•Low F.T.
If t \ ^ - l \ ;•/ N H i E h F.T.
-
! * !': ^Ns^ ^ ^
L\ /•/ * S S ^ _ l y \ \ './ 1 l-. \ v-V
A 1 1 1 l 1 J 1 1 1,. 2 3 1 5 6 7
TOTAL STRAIN, 5
500
400
300 g
200
0 8 9 10
figure 23: AE-response of 2124 in longitudinal compression. Strain rate = 0V0024 Filter = 100-300kHz
3 4 5 6
TOTAL STRAIN, %
8 9 10
Figure 24: Comparison of the AE responses of 2048 and 2124 in longitudinal compression. Strain rate = 0.0024/sec F i l te r = 100-300kHz
. •••>• ' t . v ' ; ' . ' . - ••£-:,?:
; :• .v. • • -
! & " '. ' l i t ,
> •'•?•.' « F $5*
j. - v . • -. • , ; " . ^ r •'i..,!;*: .4 , •• ,Ja3kLMc±••:• ~- V - » * T P * . * J
*»!. . SPOT
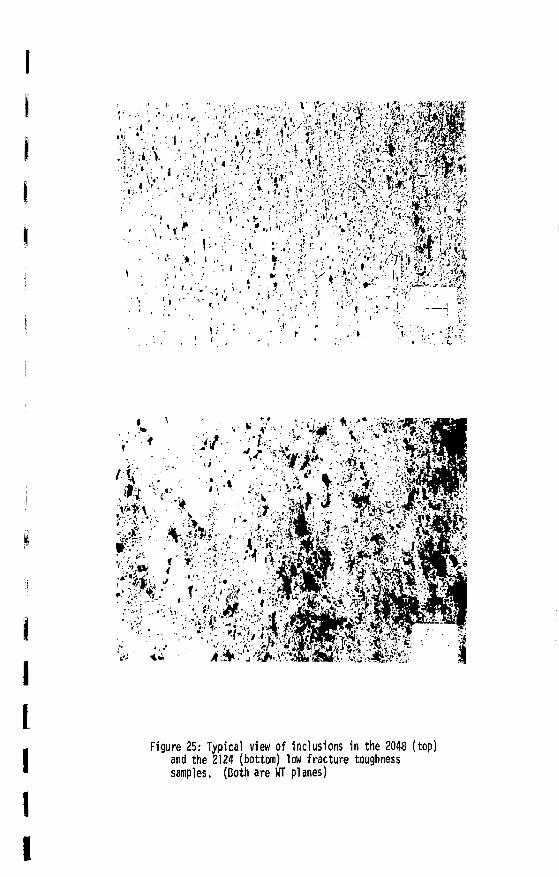
L Figure 25: Typical view of inclusions in the 2048 (top)
and the 2124 (bottom) low fracture toughness samples. (Both are WT planes)
I
25
like many of the other micrographs also seems to show that the density
of inclusions in the 2048 sample is greater than that of the 2124 in
clusions. This observation may be real or may be related to the fact
that the etching rates vary among the samples. If the observation is
real, the density difference is observed only in the LW and WT planes.
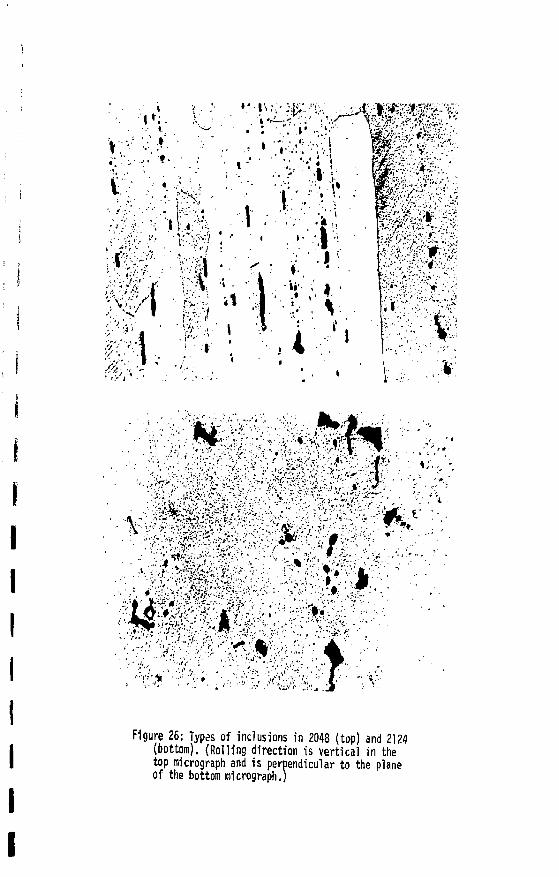
When comparing the types of inclusions in 2124 and 2048, another
basic difference between the alloys is observed. Although both contain
a large dark inclusion'(Figure 26), only 2124 samples contain large light
colored inclusions. Differences in the matrix copper content may have
caused this.
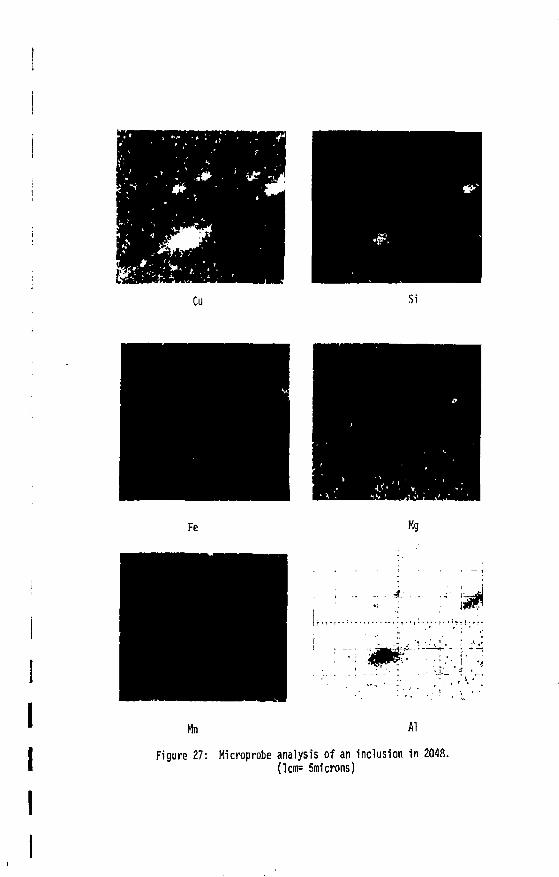
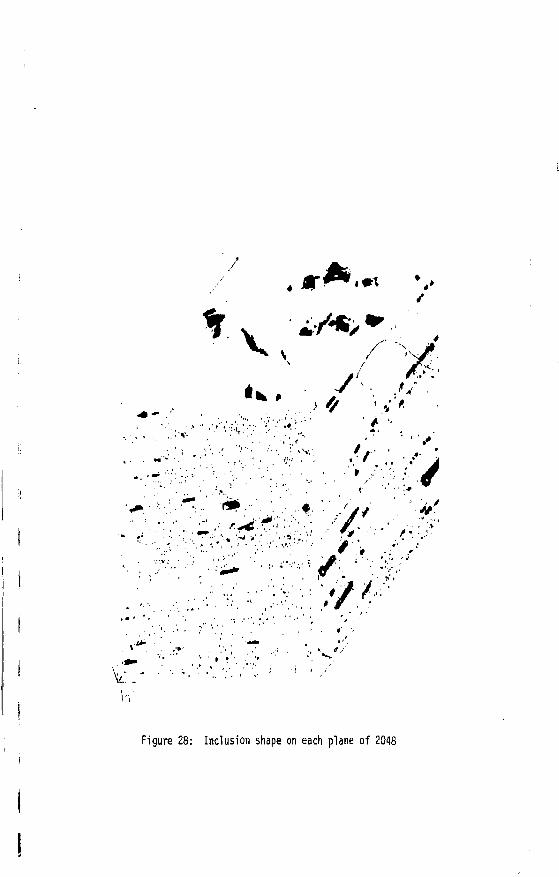
The dark inclusions in 2048 were found to be rich in Cu, Si, and
Fe (Figure 27). They have the same amount of Mn, Cr, Zn, and Ti as
the matrix and have less Mg than the matrix. Although some of the
inclusions are regularly shaped in all planes, most are elongated in
the rolling direction in the LW and WT planes and are regularly shaped
in the LT plane (See Figure 28). This suggests that most of the inclu
sions are plate-like in shape. Some stringers also occur in all planes.
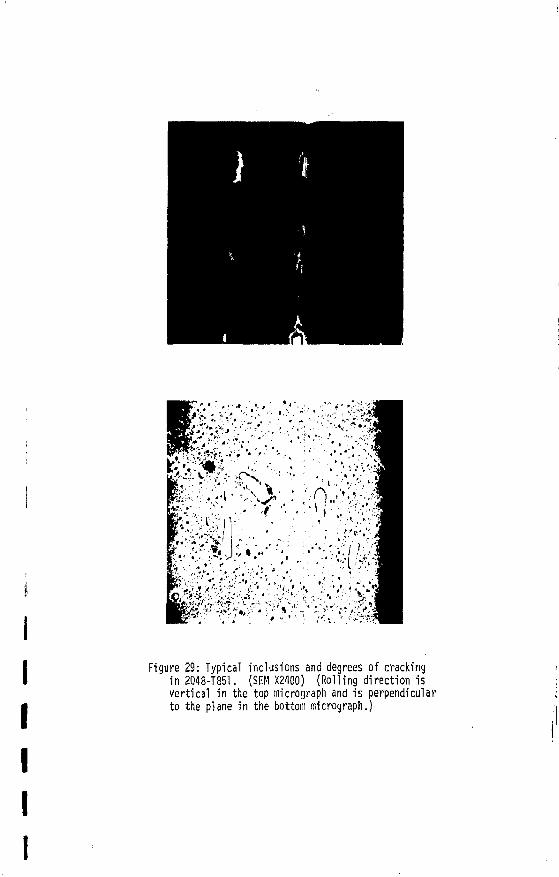
Some of the inclusions in 2048 are cracked after testing, although
the frequency of cracking seems to be less than in any of the 2124
samples. Data, also, suggests that the regularly shaped inclusions in
2048 crack more frequently than do the elongated ones (See Figures 29
and 30).
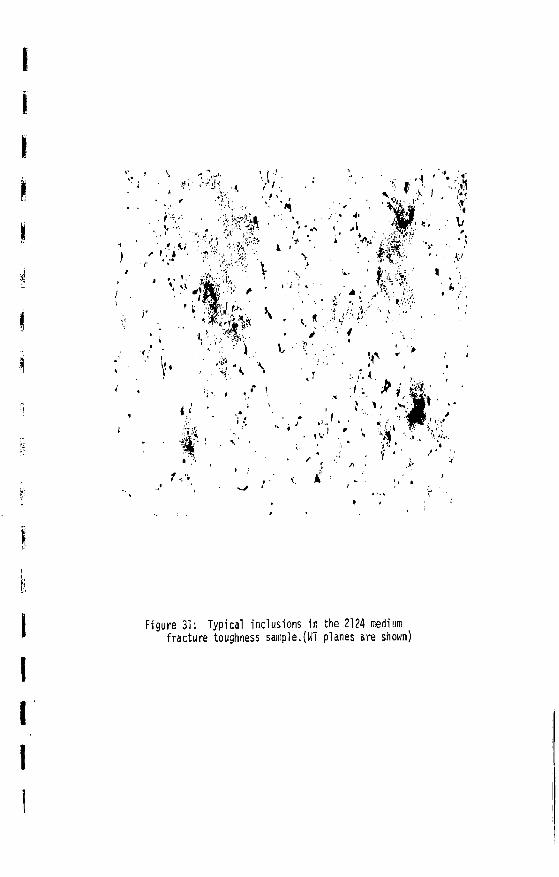
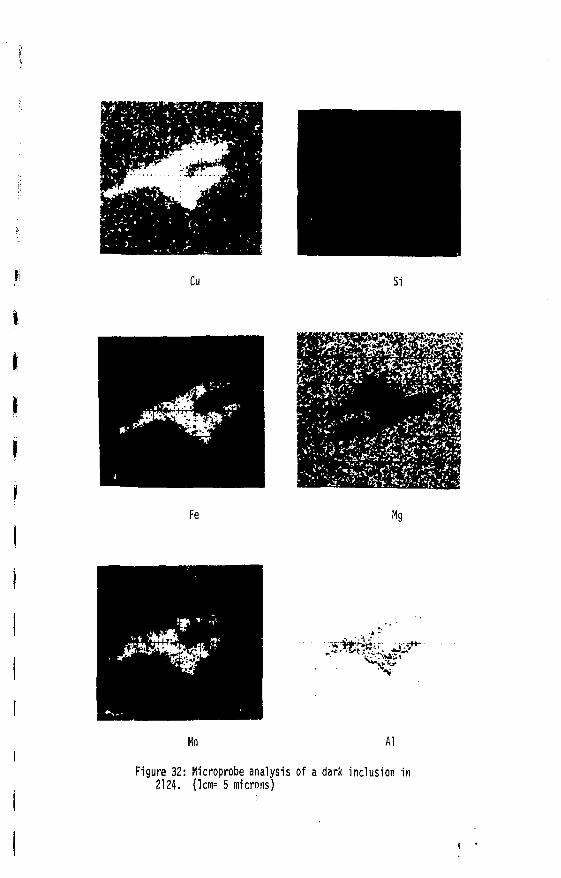
In 2124, the dark inclusions are generally either regularly shaped
or are stringers and are not elongated like the 2048 inclusions (Figure
31). The inclusions contain a concentration of Cu, Mn, Fe, and Si and
have the same amount of Zn, Cr, and Ti as the matrix (Figure 32). These,
too, are depleted of Mg. Cracks which are observed uithin these specimens
• • • : • • • : • • % •
I m-i": tea :.•
i > ? • ; . ' •
/ £ • • • ' . • - " • ' ; • • • .
t
: • > v . ' . ;
I . ,
p • ' : . * • ' . • . ' ' .
mmmmmmM •V . . • ; v i - . . ' '"-••'. . . ' • , . •' -- ^::;^&:,>-;vWv':^-/-
ii^jp^--^ .«S5f^5E*
• ' " ' * • *
Figure 26: Types of inclusions in 2048 (top) and 2124 (bottom). (Rolling direction is vertical in the top micrograph and is perpendicular to the plane of the bottom micrograph.)
Cu Si
Fe Hg
j .;• r_J
i . ' - • • '
jjiBP
j - '• ; ' i -•-jjm g^:-;^ ;•- [ - - A
• : • # m?:-
•J- V -< • . • " •
! ' . 1 • • '
Al Figure 27: Microprobe analysis of an inclusion in 2048.
(lcm= 5microns)
I » t
'N
X ,
e* <
: /£ '•••
• . *
-v' - - . ' v
/ • . - . . . ' •
* \ . ?••.-•:*. '<•'•
•//.¥
W Figure 28: Inclusion shape on each plane of 2048
ft/-1:!, . • , , ' • v ".:• -• ', "•i '^
••w-r £ s ;
P : > ^ / 1 • ' . . • • • : • • • : . ; i . " * ' . ; - . j «
a / ' .•• • > - ,* ,-• , . * " ' ' • ' , • " I • ' . * s
JErli- "'•1''1 " » ' «.""vJr'" -•** i- ' •• ' ' '.• ." r
K-r- ;'«! A*'^'•'*'>-'' ; ' ' ' ' • • ! . •'•*' V- •'/.• f \
Figure 29: Typical inclusions and degrees of cracking in 2048-T851. (SEM X2400) (Rolling direction is vertical in the top micrograph and is perpendicular to the plane in the bottom micrograph.)
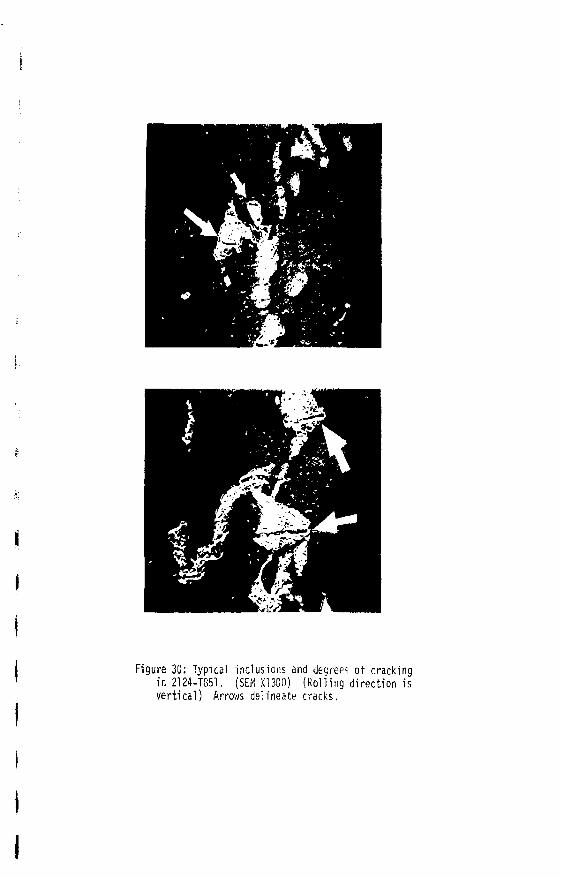
Figure 30; Typical inclusions and degrees of cracking in 2124-T851. (SEW X1300) (Rolling direction is vertical) Arrows delineate cracks,
• . ( ; ' • * ' *• ,!t
, v J i f t , • ••' ' v l & ^ . \ - . ,W ; ?"
,KC
/ , ' V
ff • f . .
> I ' -•.. '' "'•'•
'/ • ' , • "
Figure 31: Typical inclusions in the 2124 medium fracture toughness sample.(WT planes are shown)
Cu Si
Fe Mg
-.•UfiJrtri-i.; r- i - i l
V
Mn Al
Figure 32: Microprobe analysis of a dark inclusion in 2124. (lcm= 5 microns)
26
are generally perpendicular to the rolling direction and are inde
pendent of the inclusion major axis in many cases. Usually the inclu
sions contain at most a few cracks.
The light inclusion in 2124 is generally more ductile than the
dark inclusion in that the frequency of cracking of the light inclusions
is must less than that of the dark ones. Light inclusions tend to
overlap the dark ones and many times will appear to be connected to
them. Even when this occurs, the frequency of cracking of the dark
areas exceeds that of the white areas (Figure 33).
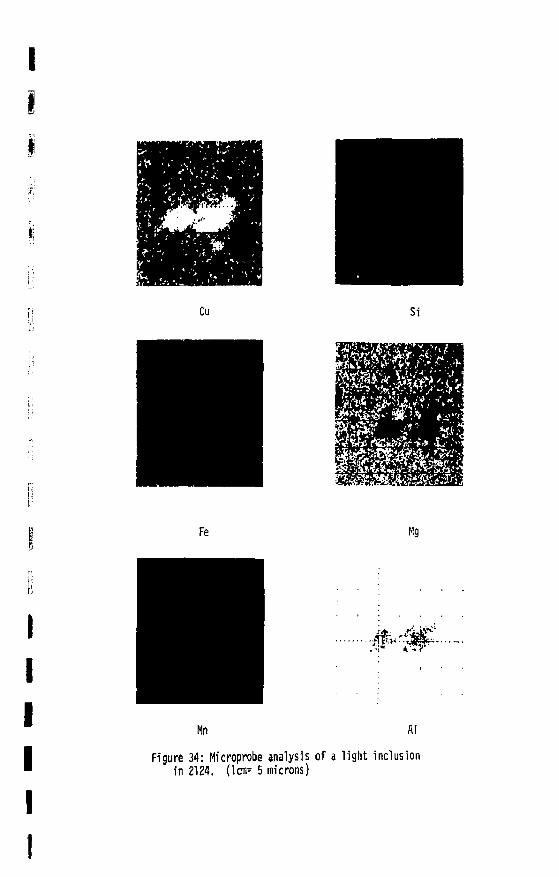
The light inclusion is rich only in Cu and contains the same com
position as the matrix in Mn, Cr, Zn, Fe, Si, and Ti. It, too, is
depleted of Mg (Figure 34).
Variations in microstructure among the 2124 samples is, as ex
pected, much less than that between the 2124 and the 2048 samples. In
fact, the differences are so subtle that only two were observable.
These are: 1) both the light and dark inclusions in the medium fracture
toughness sample appear to be slightly smaller than in either the low
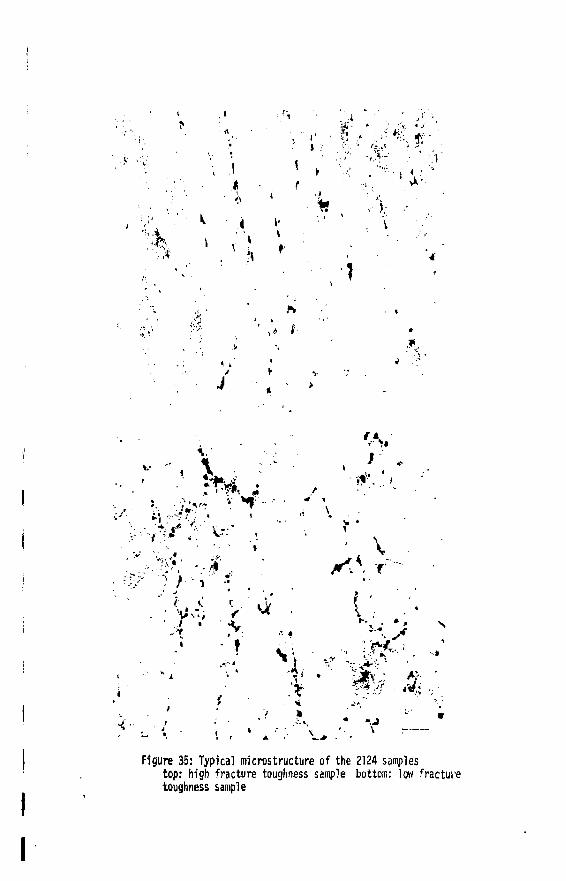
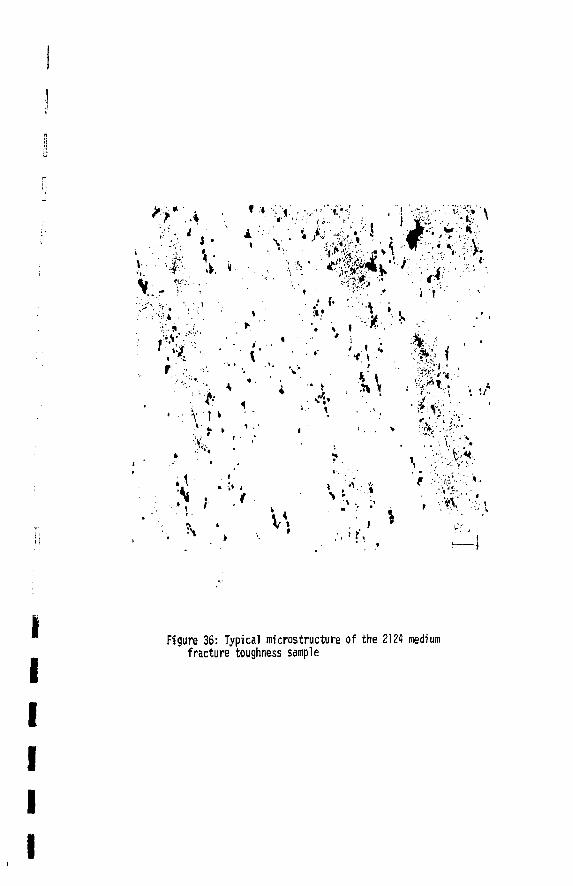
or high fracture toughness sample (Figures 35 and 36) and 2 ; the volume
fraction of inclusions in the high fracture toughness sample is less
than in the medium or low fracture toughness samples.
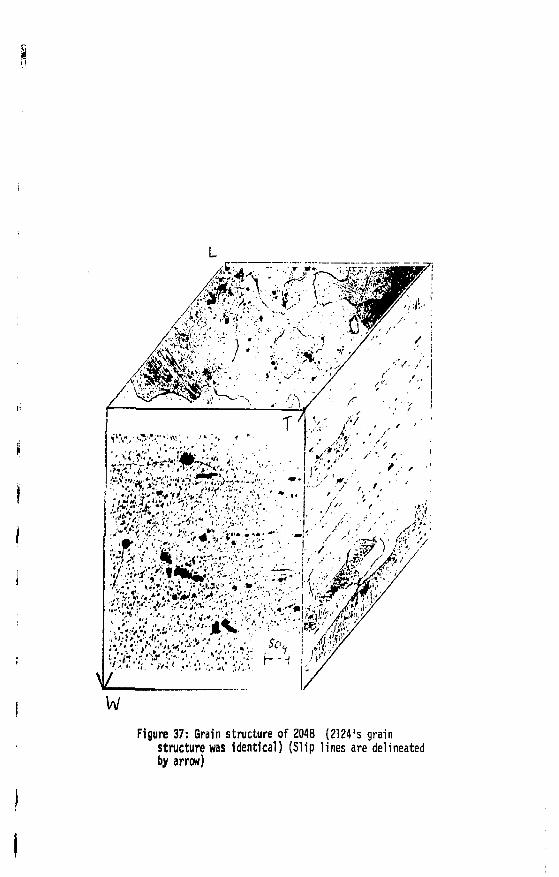
Figure 37 showed the grain structure seen in both 2124 and 2048.
Both materials seem to have the same appearance with grains being narrow
and elongated in the LW and WT planes and regularly shaped in the LT or
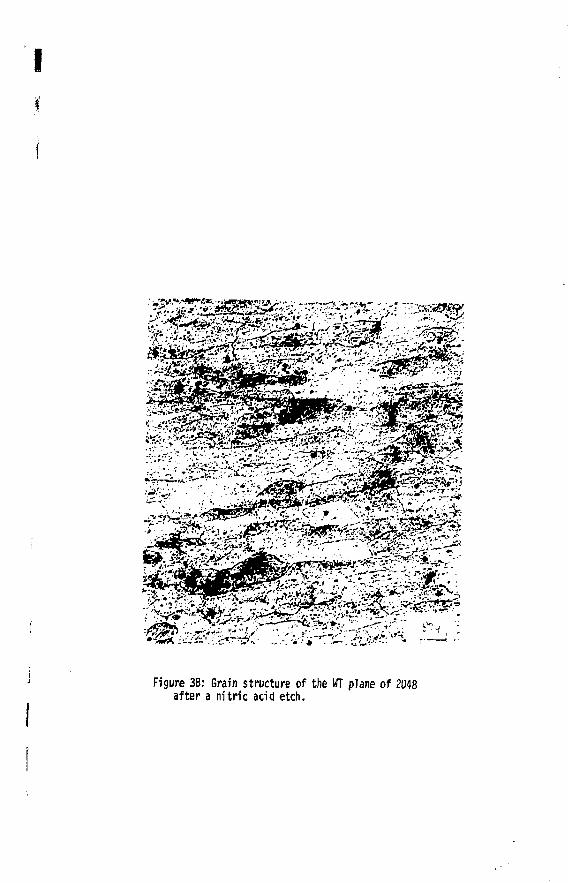
rolling plane. One observation to be made is that the grain structure
in the WT plane's would not etch with Keller's reagent (which also
etches the deformation lines) so WT samples were etched with a dilute
nitric acid solution. (See Figure 38 for a comparison of the micro-
structure revealed by each etchant).
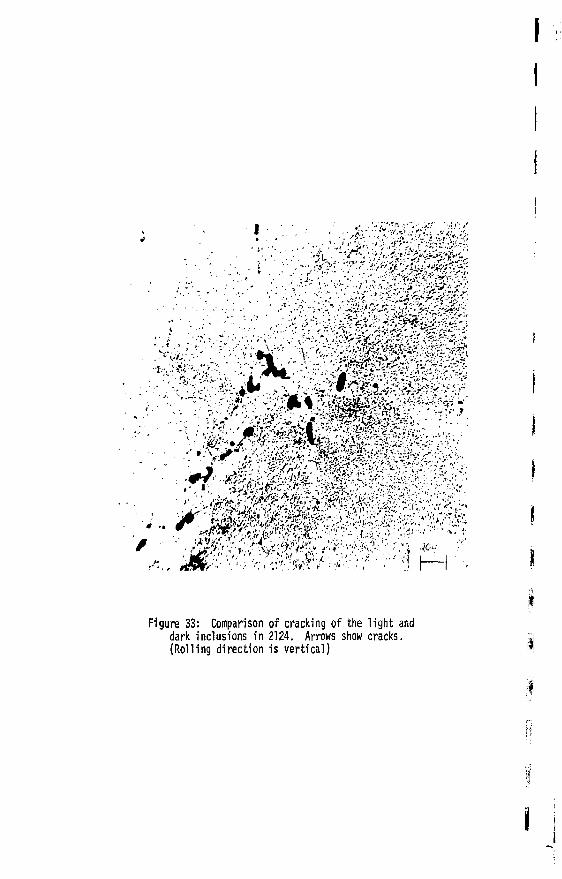
Figure 33: Comparison of cracking of the light and dark inclusions in 2124. Arrows show cracks. (Rolling direction is vertical)
Cu Si
Fe
. • : " * - r
AI Figure 34: Microprobe analysis of a light inclusion
in 2124. (lcm= 5 microns)
I
I . i • ' " ' ' " • *
> •tt- * i '">: ' / : A * ' <' ' t :!
' \-t 1
i • i . i " ^
. • - '•' 1 * . '); " ; . ; . . ' ' • < 4 »• ,'-'\
\ •i
)
* >
V" 'rV
• • • - / . •• ,. . • • *
• / 1 - ,
" ' U V" Of" • {': •
S i
-.J
| Figure 35: Typical microstructure of the 2124 samples top: high fracture toughness sample bottom: low fracture toughness sample
V:-
W '•£''•.• ' t
t -
*• k
' • » • ( '
1 . . \
H >, •£#& V . i • - • ,.
, i . r - . . !"
, • • : * Y • ',•;•• i
T,
Figure 36: Typical microstructure of the 2124 medium fracture toughness sample
/ i«MS, i - ' -4 . -V-: .»"ii •••••• I;.:- ,^W?
/ * ^ \ V * • • •• • • • ; • ' ' J -"X.. . ,
»' • '.:
•'"".' .4 V?? ' " . /'••'/.-
•? , . ' .
•I lm.ll.'
w Figure 37: Grain structure of 2048 (2124's grain
structure was identical) (Slip lines are delineated by arrow)
I
Figure 38: Grain stricture of the WT plane of 2048 after a nitric acid etch.
27
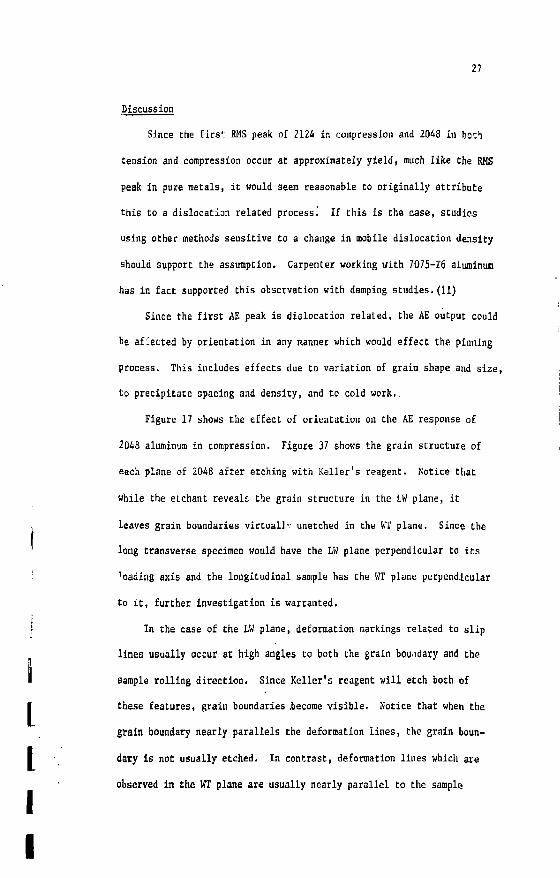
Discussion
Since the firs': RMS peak of 2124 in compression and 2048 in both
tension and compression occur at approximately yield, much like the RMS
peak in pure metals, it would seem reasonable to originally attribute
this to a dislocation related process J If this is the case, studies
using other methods sensitive to a change in mobile dislocation density
should support the assumption. Carpenter working with 7075-16 aluminum
has in fact supported this observation with damping studies.(11)
Since the first AE peak is dislocation related, the AE output could
be afCetted by orientation in any manner which would effect the pinning
process. This includes effects due to variation of grain shape and size,
to precipitate spacing and density, and to cold work,.
Figure 17 shows the effect of orientation on the AE response of
2048 aluminum in compression. Figure 37 shows the grain structure of
each plane of 2048 after etching with Keller's reagent. Notice that
while the etchant reveals, the grain structure in the LW plane, it
leaves grain boundaries virtual]'.- unetched in the WT plane. Since the
long transverse specimen would have the LW plane perpendicular to its
fading axis and the longitudinal sample has the WT plane perpendicular
to it, further investigation is warranted.
In the case of the LW plane, deformation markings related to slip
lines usually occur at high angles to both the grain boundary and the
sample rolling direction. Since Keller's reagent will etch both of
these features, grain boundaries .become visible. Notice that when the
grain boundary nearly parallels the deformation lines, the grain boun
dary is not usually etched. In contrast, deformation lines which are
observed in the WT plane are usually nearly parallel to the sample
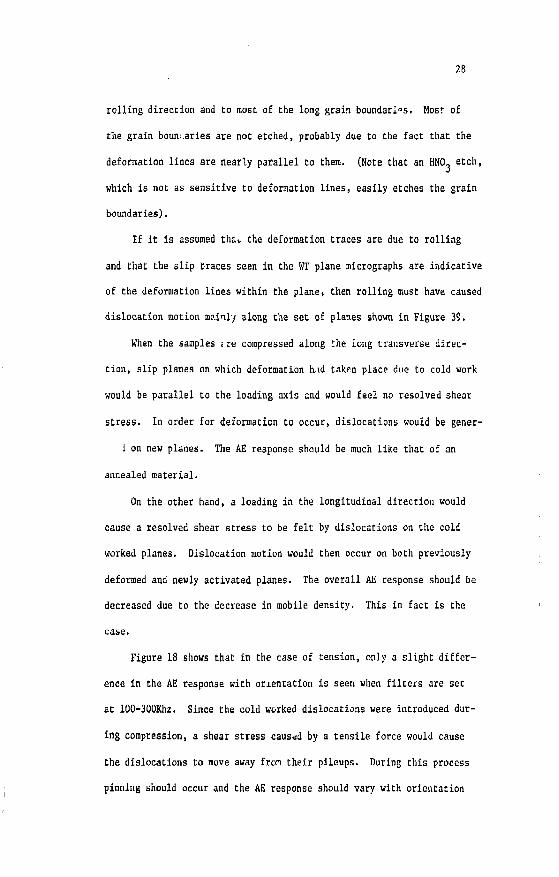
28
rolling direction and to most of the long grain boundaries. Most of
the grain boundaries are not etched, probably due to the fact that the
deformation lines are nearly parallel to them. (Note that an HNCL etch,
which is not as sensitive to deformation lines, easily etches the grain
boundaries).
If it is assumed thai, the deformation traces are due to rolling
and that the slip traces seen in the WI plane micrographs are indicative
of the deformation lines within the plane, then rolling must have caused
dislocation motion m?.inly along the set of planes shown in Figure 39.
When the samples <re compressed along the long transverse direc
tion, slip planes on which deformation h.id taken place due to cold work
would be parallel to the loading axis and would feel no resolved shear
stress. In order for deformation to occur, dislocations would be gener-
J on new planes. The AE response should be much like that of an
annealed material.
On the other hand, a loading in the longitudinal direction would
cause a resolved shear stress to be felt by dislocations on the cold
worked planes. Dislocation motion would then occur on both previously
deformed and newly activated planes. The overall AE response should be
decreased due to the decrease in mobile density. This in fact is the
case.
Figure 18 shows that in the case of tension, only a slight differ
ence in the AE response with orientation is seen when filters are set
at 100-300Khz. Since the cold worked dislocations were introduced dur
ing, compression, a shear stress caused by a tensile force would cause
the dislocations to move away fron their pileups. During this process
pinning should occur and the AE response should vary with orientation

Figure 39: Rolling has caused slip along a set of planes found by rotating plane 1 about the T axis.
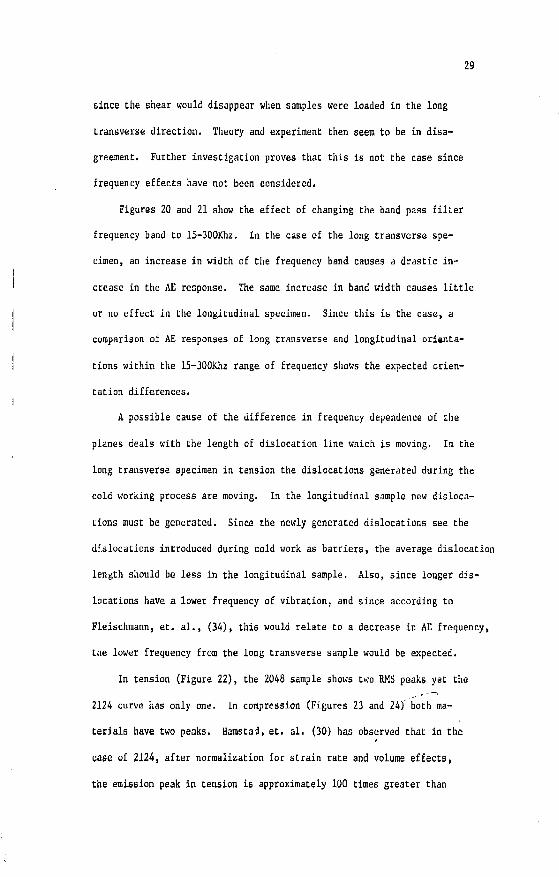
29
since the shear would disappear when samples were loaded in the long
transverse direction. Theory and experiment then seem to be in disa
greement. Further investigation proves that this is not the case since
frequency effects have not been considered.
Figures 20 and 21 show the effect of changing the band pass filter
frequency band to 15-300Khz. In the case of the long transverse spe
cimen, an increase in width of the frequency band causes a drastic in
crease in the AE response. The same increase in band width causes little
or no effect in the longitudinal specimen. Since this is the case, a
comparison of AE responses of long transverse and longitudinal orienta
tions within the 15-300Khz range of frequency shows the expected orien
tation differences.
A possible cause of the difference in frequency dependence of the
planes deals with the length of dislocation line which is moving. In the
long transverse specimen in tension the dislocations generated during the
cold working process ate moving. In the longitudinal sample new disloca
tions must be generated. Since the newly generated dislocations see the
dislocations introduced during cold work as barriers, the average dislocation
length should be less in the longitudinal sample. Also, since longer dis
locations have a lower frequency of vibration, and since according to
Fleischmann, et. al., (34), this would relate to a decrease in AE frequency,
the lower frequency from the long transverse sample would be expected.
In tension (Figure 22), the 2048 sample shows two RMS peaks yet the
2124 curve lias only one. In compression (Figures 23 and 24) both ma
terials have two peaks. HamstaJ, et. al. (30) has observed that in the
case of 2124, after normalization for strain rate and volume effects,
the emission peak in tension is approximately 100 times greater than
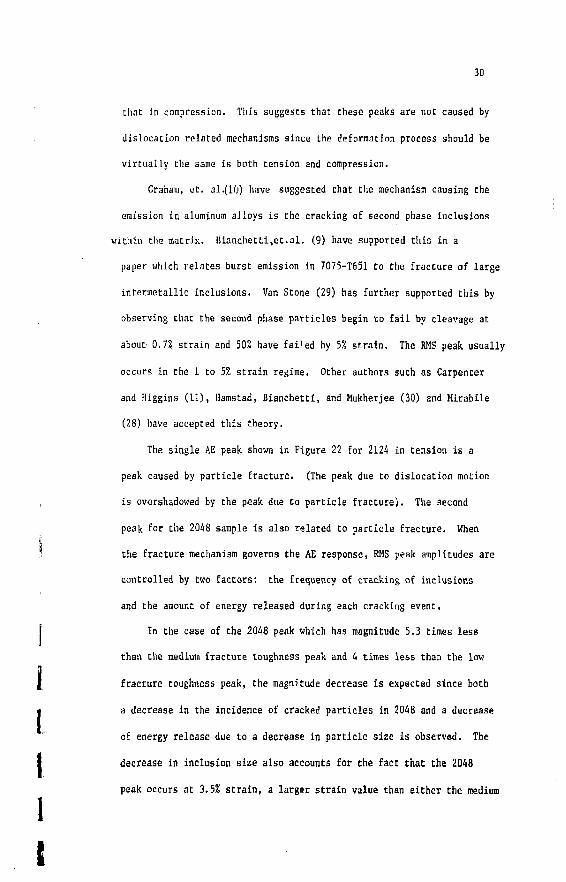
30
that in compression. This suggests that these peaks are not caused by
dislocation related mechanisms since the deformation process should be
virtually the same is both tension and compression.
Graham, et. al.(10) have suggested that the mechanism causing the
emission in aluminum alloys is the cracking of second phase inclusions
within the matrix. Iiianchetti,et.al. (9) have supported this in a
paper which relates burst emission in 7075-T651 to the fracture of large
intermetallic inclus ions. Van Stone (29) has further supported this by
observing that the second phase particles begin to fail by cleavage at
about- 0.1% strain and 50% have fa^ed by 5% strain. The RMS peak usually
occurs in the 1 to 5Z strain regime. Other authors such as Carpenter
and Higgins (11), Hamstad, Bianchetti, and Mukherjee (30) and Mirabile
(28) have accepted this theory.
The single AE peak shown in Figure 22 for 2124 in tension is a
peak caused by particle fracture. (The peak due to dislocation motion
is overshadowed by the peak due to particle fracture). The second
peak for the 2048 sample is also related to particle fracture. When
the fracture mechanism governs the AE response, RMS peak amplitudes are
controlled by two factors: the frequency of cracking of inclusions
and the amount of energy released during each cracking event.
In the case of the 2048 peak which has magnitude 5.3 times less
than the medium fracture toughness peak and 4 times less than the low
fracture toughness peak, the magnitude decrease is expected since both
a decrease in the incidence of cracked particles in 2048 and a decrease
of energy release due to a decrease in particle si2e is observed. The
decrease in inclusion size also accounts for the fact that the 2048
peak occurs at 3»5% strain, a larger strain value than either the medium
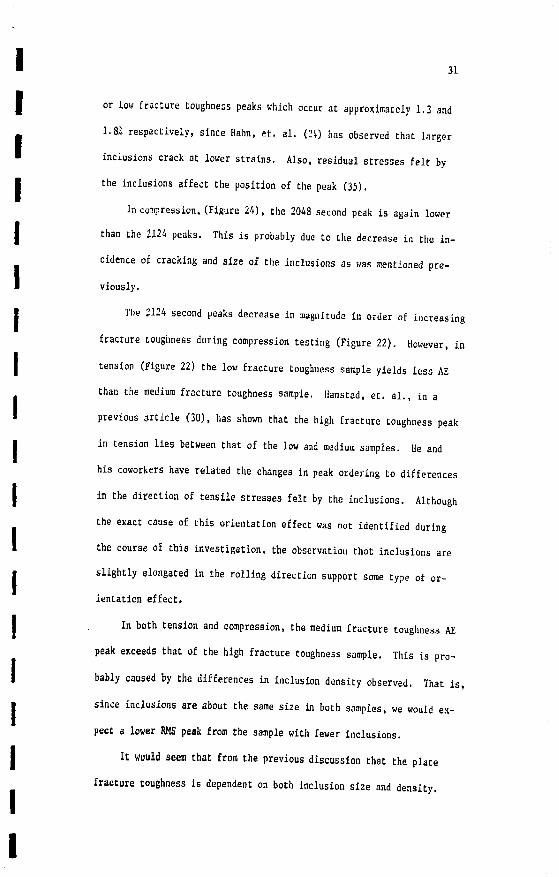
31
or low fracture toughness peaks which occur at approximately 1.3 and
1.87. respectively, since Hahn, et. al. (24) has observed that larger
inclusions crack at lower strains. Also, residual stresses felt by
the inclusions affect the position of the peak (35).
In compression, (Figure 24), the 2048 second peak is again lower
than the 2124 peaks. This is probably due to the decrease in the in
cidence of cracking and size of the inclusions as was mentioned pre
viously.
The 2124 second peaks decrease in magnitude in order of increasing
fracture toughness during compression testing (Figure 22). However, in
tension (Figure 22) the low fracture toughness sample yields less AE
than the medium fracture toughness sample, liamstad, et. al., in a
previous article (30), has shown that the high fracture toughness peak
in tension lies between that of the low and medium samples. He and
his coworkers have related the changes in peak ordering to differences
in the direction of tensile stresses felt by the inclusions. Although
the exact cause of this orientation effect was not identified during
the course of this investigation, the observation that inclusions are
slightly elongated in the rolling direction support some type of or
ientation effect.
In both tension and compression, the medium fracture toughness AE
peak exceeds that of the high fracture toughness sample. This is pro
bably caused by the differences in inclusion density observed. That is,
since inclusions are about the same size in both samples, we would ex
pect a lower RMS peak from the sample with fewer inclusions.
It would seem that from the previous discussion that the plate
fracture toughness is dependent on both inclusion size and density.
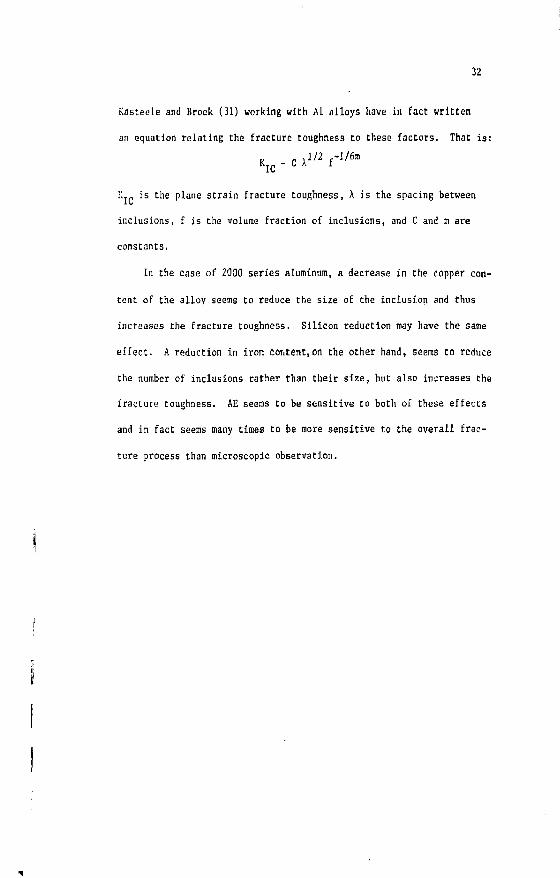
32
Kasteele and Brock (31) working with Al alloys have in fact written
an equation relating the fracture toughness Co these factors. That is:
K I C = C X1'2 f 1 / 6 m
K T f, is the plane strain fracture toughness, X is the spacing between
inclusions, f is the volume fraction of inclusions, and C and m are
constants.
In the case of 2000 series aluminum, a decrease in the copper con
tent of the alloy seems to reduce the size of the inclusion and thus
increases the fracture toughness. Silicon reduction may have the sane
effect. A reduction in iron content,on the other hand, seems to reduce
the number of inclusions rather than their size, but also increases the
fracture toughness. AE seems to be sensitive to both of these effects
and in fact seems many times to be more sensitive to the overall frac
ture process than microscopic observation.
33
V. Summary
AE has potential as both a quality control and a research
tool. AE is more sensitive to microstructural characteristics
than many other more expensive tests. In the case of "pure"
materials, AK offers new insight into mobile dislocation density
changes within the material and thus offers insight into a process
which was otherwise almost impossible to evaluate. In the case of
alloys, AE can be used to detect the presence of large(45~120 um)
inclusions and in many cases could possibly be used to check
whether or not a material meets minimum fracture toughness re
quirements. This would have the advantage of cutting costs of
testing as well as assuring a more dependable group of materials
which would save in design costs.
Norm-. "This report was prepared as an account ot work sponsored by the United States Government. Neither Ihc United Stmt, nut the United Slates Department oflinergy. nor tint of their cmplovccs. nor any of their contractor*, subcontractors, or tbeir employees, makes any warranty, impress or implied, or assume* any Icjal liability or responsibility fur the accuracy, completeness or usefulness of any information, apparatus, product or process disclosed, or represents that its use would not infringe private! wmncd riphts,"
34
VI, Conclusions
7075-T651 Aluminum Alloy Study
1) The large inclusions are 45 to 120 y in all dimensions and
are segregated at different places within the matrix.
2) Many untested inclusions (approximately 40X) contain fine
cracks.
3) Many inclusions within the plastic zone contain both fine and
wide cracks.
4) All large inclusions within the tensile sample contain numer
ous wide cracks. Fine cracks are also observed.
5) Wide cracks which are observed, are perpendicular to both the
sample rolling direction and the major axis of the inclusion.
Pure Metal Study
6) AE from pure metals is related to the dislocation unpinning
process.
7) A theory using a modified Gilutan theory for dislocation mo
bility fits the AE data for Cu, Ki, Al, and Zr well.
8) Cold work decreases the AE from pure Cu.
Aluminum Alloy Study
9) The first AE peak in Al alloys is dislocation related.
10) Fracture toughness and AE are effected by both particle si2e
and density.
11) Filtering effects are important.
35
References
1. A. Joffe, The Physics of Crystals, McGraw-Hill, New York (1928).
2. E. R. Fitzgerald, J. Acoustic Sac. Amer., j!2, 1270 (1960).
3. C. A. Tatro and R. Liptai, Acoustic Emission from Crystalline
Substrates, Proc. Syroo. on Physics and Nondestructive Testing,
Southwest Research Institute, 145 (1962).
4. B, H. Schofield, Air Force Materials Laboratory Report ASD-TDR, 1,
63-509, (1963) Unpublished,
5. M. A. Harastad and A. K. Mukherjee, Acoustic Emission vs. Strain and
Strain Rate: Measurement and a Dislocation Theory Model for a
Dispersion Strengthened Aluminum Alloy, Report UCRL-76077,
Lawrence Livermore Laboratory, Hvermore, CA. (1974).
6. R. M. Fisher and J. S. Lally, Can. J. Phys., 5_, 1147, (1967).
7. R. T. Sedgewich, J. Appl. Phys., 39, 1728 (1968).
8. J. R. Frederick, Mat. Eval., 28, 43 (1970).
9. R. Bianchetti, M. A. Hamstad, and A. K. Mukherjee, J. of Testing
and Eval., 4, 376 (1976).
10. L. J. Graham and W. L. Morris, Sources of Acoustic Emission in
Aluminum Alloys, Presented at ASNT 35th National Fall Conference,
Atlanta, Georgia, Oct. 1975.
11. S. H. Carpenter and F. P. Higgins, Met. Trans., U, 1629 (1977).
12. P. C, Varley, The Technology of Aluminum and Its Alloys, Butterworth
and Co., London, 10-15 (1970).
13. E. C. Olson, R. E. Maringer, L. L. Marsh, and G. K. Manning, Study
of Plastic Deformation in Binary Aluminum Alloys by Internal-
Friction Methods, NASA Memo 3-3-59H (1959).
36
14. J. R, Frederick and D. K. Felbeck, Acoustic Emission, ASTM ST P
505, Philadelphia. PA. 129 (1972).
15. H. Hatano, Quantitative Measurements Related to Acoustic Emission
Source Mechanisms, Presented at the Second Acoustic Emission
Symposium, Tokyo, Japan (1974).
16. H. Nakasa, '!, Tomoda, and H. Takaku, Central Res. Inst, Elect,
Power Ind. Tech. Report Wo. 73027, Tokyo, Japan, Oct. 1973.
17. B. H. Schofield, Acoustic Emission Under Applied Stress, Air Force
Materials Lab. Report ASD-TBR-63-509, pt. II (1964).
18. D. R. James and S. H. Carpenter, J. of Appi • Phy,, 42, 4685 (1971).
19. J. Eisenblstter, P. Jax, and H. Schwalbe, A Survey of Acoustic
Emission Research in Europe and Investigations Conducted at
Battelle-Frankfurt, Presented at the Second Acoustic Emission
Symposium, Tokyo, Japan, Sept. 1974.
20. H. Imaeda, H. Kusanagi, H. Kimura, and H. Nakasa, Proc. the Third
AE Symp., Tokyo, Japan, 492 (1976).
21. J. J. Gilman, Micromechanics of Flow in Solids, McGraw-Hill, New
York, 185 (1969).
22. D. James, An Overview of Acoustic Emission and Dislocation Kinetics,
Presented at a Short Course in Acoustic Emission Technology,
Dunegon Research Corp. Livermore, CA., July 1977.
23. M. Shimizu, K. Sano, T. Imanaka, and K. Fujimoto, Acoustic Emission
During Plastic Deformation in Aluminum, Copper and 3% Silicon-
Iron, Presented at the Second Acoustic Emission Symposium,
Tokyo, Japan (1974).
24. G. T. Hahn and A. R. Rosenfield, Met. Trans., 6A, 653 (1975).
37
25. J. R. Low, Engr. Fract. Mechs.. 1, 47 (1968).
26. D. A . Ryder, Elements of Fractographv. Technical Editing and
Reproduction LTD., London, 19 71.
27. W. Gerberich and D. G. Atteridge, Microstructural Effects on
Acoustic Emission In Fe-Base Alloys, University of Minnesota,
Minneapolis, MN, (1976) Unpublished.
28. M. Wirabile, Plastic Deformation and Fracture Mechanics Investi
gation by Means of the Stress-Kave-Emission Techniqi a, Presented
at the Second Acoustic Emission Symposium. Tokyo, Japan (1974).
29. R. H. Van Stone, R. H. Merchant, and J. R. Low, Jr., Investigation
of the Plastic Fracture of High-Strength Aluminum Alloys, Fa-
tigue and Fracture Toughness - Cryogenic Behavior, ASTMSTP556,
93-123 (1974).
30. M. A. Hamstad, R. Bianchetti, and A. K. Mukherjee, Engr. Fract.
Mechs., 9, 663 (1977).
31. J. C. W. Van De Kasteele and D. Broek, Engr. Fract. Mech., 9_,
625 (1977).
32. M. 0. Speidel, Met. Trans. A., 6A.631 (1975).
33. J. C. Spanner, Acoustic Emission. Intex Publishing Co., Evanston,
111., 1974.
34. P. Fleischraann, F. Lakestani, and J. C. Baboux, Mat'Is. Sci. and
fjngr., 29, 205 (1977).
35. M. Shibata and K. Ono, "Internal Stresses Due to an Oblate Spheroidal
Inclusion: Misfit, Inhomogenity, and Plastic Deformation Effects,
Technical Report 4, Office of Naval Research (1977).
207 "Pore and Eroding Fluid Influences on Surface Erosion of Soil", K. Arulanandan, P, Loganathan and R. B. Krone. Proceedings of the Amer. Soc. of Civil Engrs., Vol. 101, No. GT1, pp. 51-66, January 1975.
208 "Fundamental Acpocts of Surface Erosion of Cohesive Soils", K. Arulanandan. J. of the Hydraulics Div., Vol. 101, Ho, HY5, pp. 635-639, Hay 1975.
209 "A High-Velocity, Iliqh-Momentum Impact Testing Device for Agricultural Materials", T. II. Burkhardt and B. A. Stout. Transactions of the ASA.2 (American Society of Agricultural Engineers). 14(3): 455-457, 1971.
210 "A Unified Theory for the Firitely and Infinitesimally Sepa:-ted Position Problems of Kinematic Synthesis", P. Chen and B. Roth. Transactions of the Araer. Soc. of Mech. Engrs. 9H1) : 203-20B, 1969.
211 "Computer Aid ir Quality Detection Study", P. Chen, R. B. Fridley and K. 0'Brier. ASAE Paper No. 73-6519, 1973.
212 "Measured Radiation Effects in Hos Capacitors with a Proposed New Model", F. E. Holmstrom, T. w. Collins and J. N. Churchill. Appl. Phys. Letters, 24_, KO. 10, pp. 464-466, 1974.
213 "Electron Irradiation Effects in Mos Systems", J. N. Churchill, T. W. Collins, and F. E. Kolmstrom. IEEE Trans, on Electron Devices, Vol. ED-21, No. 12, pp. 768-777, 1974.
214 "Exact Modeling of the Transient Response of an Kos Capacitor", T. W. Collins, and J. N. Churchill. IEEE Trans, on Electron Devices, Vol. ED-22, No. 3, pp. 90-101, 1975.
215 "Interpretation of Finite Element Procedure as Stress Error Minimization Procedure", L. R. Herrmann. 3. of Engr. Mechanics Div., Amer. Soc. of Civil Engrs., EM 5, pp. 1330-1336, October 1972.
216 "Free-Surface Ideal Fluid Flows by Finite Elements", S. T. K. Chan, B. E. Larock and L. R. Herrmann. J. of the Hydraulics Div,, Amer, Soc. of Civil Engrs., Vol. 99, No. HY6, pp. 959-974, June 1973.
217 "Efficiency Evaluation of a Two-Dimensional Incompatible Finite Element", L. R. Herrmann. J. of Computers and Structures, Vol. 3, pp. 1377-1395, October 1973.
216 "Numerical Biaxial Characterization for Concrete", K. H. Pomstad, ". A. Taylor and L. R. Herrmann. J. of Engr. Mechanics Div., Amer. Soc. of Civil Engrs., Vol. 100, No. EM5, pp. 935-948, October 1974.
219 "Observation of Structure in the Angular Dependence of Photoemission from GaAs", F, Wooten, T. Huen and H. V. Winsor, Phys. Letters 36A, 351, 1971,
220 "Optical Properties of Solids", F. Wooten, Academic Press, 1972.
221 "Photoemission and Electron Scattering in Cs3Bi and C33Sb", F, Wooten, J, P. Hernandez and W. E, Spicer, J. Appl. Phys. AA, 1112, 1973.
222 "Secondary Electron Emission from Cs,Sb", F. Wooten, J. Appl. Phys, 4£, 1118, 1973.
223 "Ferromagnetic Resonance in Ni-Fe Films Deposited in Extremely Low Fields", R. F. Soohoo. Proc. Intl. Colloquium on Thin Magnetic Films, Minsk, USSR, 1973.