Optimal Design of Reinforced Concrete Materials in ... - MDPI
Upload
khangminh22Category
view
0download
0
�����������������
Citation: Wei, S.; Wei, H.; Saxen, H.;
Yu, Y. Numerical Analysis of the
Relationship between Friction
Coefficient and Repose Angle of Blast
Furnace Raw Materials by Discrete
Element Method. Materials 2022, 15,
903. https://doi.org/10.3390/
ma15030903
Academic Editor: Itzhak Green
Received: 29 October 2021
Accepted: 8 January 2022
Published: 25 January 2022
Publisher’s Note: MDPI stays neutral
with regard to jurisdictional claims in
published maps and institutional affil-
iations.
Copyright: © 2022 by the authors.
Licensee MDPI, Basel, Switzerland.
This article is an open access article
distributed under the terms and
conditions of the Creative Commons
Attribution (CC BY) license (https://
creativecommons.org/licenses/by/
4.0/).
materials
Article
Numerical Analysis of the Relationship between FrictionCoefficient and Repose Angle of Blast Furnace Raw Materialsby Discrete Element MethodShiyu Wei 1 , Han Wei 1, Henrik Saxen 2 and Yaowei Yu 1,*
1 State Key Laboratory of Advanced Special Steel, Shanghai Key Laboratory of Advanced Ferrometallurgy,School of Materials Science and Engineering, Shanghai University, Shanghai 200240, China;[email protected] (S.W.); [email protected] (H.W.)
2 Process and Systems Engineering Laboratory, Faculty of Science and Engineering, Åbo Akademi University,Henriksgatan 8, FI-20500 Åbo, Finland; [email protected]
* Correspondence: [email protected]
Abstract: In recent years, the discrete element method (DEM) has been widely used to study thefactors affecting the repose angle and calibrate particle parameters for simulations. In this paper,DEM is used to study the effects of the coefficient of rolling and static friction of pellet, sinter and cokeparticles on the repose angle. By comparison of the results of simulations and physical experiments,the coefficients of rolling and static friction suitable for simulation work are determined. The resultsdemonstrate that repose angle increases with the coefficient of rolling and static friction, but the rateof increase gradually decays, when the coefficient of rolling friction exceeds 0.4 or the coefficient ofstatic friction exceeds 0.35. The coefficient of static friction has a greater impact on the repose anglethan the coefficient of rolling friction. The rougher of the base surface, the larger the repose angle ofthe formed particle piled. It can be concluded that appropriate coefficient of rolling and static frictionfor simulations can be obtained by the outlined procedure.
Keywords: discrete element method (DEM); repose angle; particle; friction coefficient
1. Introduction
Granular material, such as soil, sugar, grain and gravel, widely exists in nature, dailylife and engineering applications. Because of such common occurrence, people are curiousabout the accumulation form and law of particles, such as the exploration of avalanche [1],use of hourglass timing and study of “granary effect” [2]. In the flow of granular material,after a large number of irregularly moving single particles gather together, the particleflow establishes a regular motion. Further analyses reveal that granular material exhibitproperties similar to but not completely consistent with traditional solids and fluids. Forexample, the particles are solid, but when the particle pile collapses, a large number ofparticles could flow like a fluid. Traditional solid and fluid theory cannot explain thisphenomenon [3].
The repose angle is an important feature of granular material at accumulation andusually refers to the maximum inclination angle formed by the granular material pilerelative to the horizontal plane, in which the particles can accumulate without collapse [4].The repose angle plays a key role in the storage, transportation, and processing of granularmaterial. For the ironmaking blast furnace, the repose angle of burden layer is important toprevent the charge from collapsing and sliding on the burden surface [5]. Hence, it is veryimportant to study the influence of the physical parameters of blast furnace raw materialson the repose angle.
A large number of studies have shown that the factors affecting the repose angleinclude water content [6], initial aspect ratio [7], particle shape [8] and size [9], coefficient
Materials 2022, 15, 903. https://doi.org/10.3390/ma15030903 https://www.mdpi.com/journal/materials
Materials 2022, 15, 903 2 of 14
of restitution [10], particle number [11], geometry [12] and friction coefficients [8,13,14].It was also found that the properties of granular materials [15] largely affect the reposeangle. For the friction coefficient, there are some arguments about the effect. The widelyrecognized dependence is that the repose angle increases with the friction coefficient andeventually approaches an asymptotic value [14]. However, there are indications [8] that therepose angle is slightly reduced when the friction coefficient becomes large, but without noreasonable explanation. Therefore, the influence of the friction coefficients on the reposeangle needs more detailed research.
To study the repose angle, it is difficult to rely on physical experiments [16,17] alonedue to the diversity of particle properties and the complexity of pile forming mechanism,and the variables are difficult to control accurately. Because of the ever-increasing computa-tional power of computers, the numerical simulations have become very popular and iswidely used to study the behavior of granular flow [18–21]. Many important methods andfindings originate from the study of repose angles, including the particle sphere physicalmodel [22], the study of rolling friction in sand pile formation [23] and the evaluation ofrolling resistance model [24].
Cundall and Strack [25] were the first to propose the Discrete Element Model (DEM).The simulation method is commonly used in object dynamics due to its transparent andeffective characteristics. DEM can be used to understand the microscopic movement ofparticles and the connection with the macroscopic particle flow. After determining thecalculation model, selecting the physical geometry and initial conditions, the physicalparameters have to be selected appropriately as they are very important for the accuracy ofthe simulation results by DEM. At present, in addition to laboratory measurements [26,27],the use of DEM to estimate physical parameters has become an established method [28–30].However, the DEM parameters of blast furnace raw materials (pellet, sinter and coke) havenot been well characterized. In particular, the friction coefficients for particle–particle andparticle–wall contact have not been accurately determined despite their importance for theaccuracy of the simulations.
Several investigators [8,14] have proposed that the particles shape affects the reposeangle, and have demonstrated this by showing the similarity between repose angles insimulation with spheres and with real particles in experiments. However, it is very difficultto accurately model irregular particles. To solve this problem, Wensrich and Katterfeld [31]considered using friction coefficient to replace the influence of shape. The results showedthat in simple cases, using the coefficient of rolling friction (CORF) as a “tunable parameter”to spherical particles can implicitly consider the effect of shape. Later, Pasha et al. [32]further demonstrated the effect of manipulating CORF to simulate the movement of non-spherical particles. Therefore, spherical particles can be replaced by non-spherical particlesusing modified CORF.
To study the relationship between friction coefficient and repose angle, and to obtainvalues of the friction coefficient for simulating the blast furnace raw material behavior, thiswork uses pellet, sinter and coke as materials. The influence of the CORF and coefficientsof static friction (COSF) for particle–particle and particle–steel plate on the repose angle isstudied through DEM simulation combined with physical experiments. By this procedure,appropriate values of CORF and COSF can be estimated for future simulations of theburden behavior in the blast furnace process.
2. Methodology2.1. Experimental Method2.1.1. EDEM
EDEM is software implementing the DEM algorithm, which can calculate the motionof granular material. The DEM describes the motion of single particles in the particlesystem to calculate the overall state of the particle flow. This method considers two types ofmotion: translation and rotation, expressed by Newton’s second law of motion. The elasticcontact model used in this work is the Hertz-Mindlin (no slip) model with RVD Rolling

Materials 2022, 15, 903 3 of 14
Friction compatibility model [33–35], adopting a Coulomb law of friction. This model is acommonly used in DEM simulations due to its accuracy and efficiency in force calculation.
As shown in Figure 1, the Hertz-Mindlin model uses the governing equations todescribe the interaction between a particle (i) and another particle (j) in terms of translation(Equation (1)) and rotation (Equation (2)). The former includes normal contact force (FCn,ij),tangential contact force (FCt,ij), corresponding viscous damping force (Fdn,ij, Fdt,ij) andgravity (mig). The latter represents the friction torque, including the torque generated bythe tangential force (Mk
r ) and torque generated by rolling friction (Mdr ). Equations (1)–(8)
are the main expressions, which hold the coefficients and physical parameters involvedin the model. In these, kn is the normal and kt is the tangential contact constant, γn is thenormal damping and γt is the tangential contact damping constant. Y, υ, and e, in turn,represent the Young’s modulus of particles, Poisson’s ratio, and the coefficient of restitutionbetween particles. As for friction coefficients, µs and µr represent COSF and CORF, while Ftis the tangential and Fn is the normal force. Ri, Rj, and mi, mj represent the radius and massof particles i and j, δn is the amount of deformation between particles, Ii is the moment ofinertia, ui is the transmission speed while ωi is the rotation speed.
miduidt
=K
∑j=1
(FCn,ij+Fdn,ij+FCt,ij+Fdt,ij ) + mig (1)
Iidωidt
= ∑Kj=1 (Mk
r+Mdr ) (2)
kn =43·
YiYj
Yj(1−ϑ2
i)+Yi
(1−ϑ2
j
)√ RiRj
Ri+Rjδn (3)
kt =4YiYj
Yj(2−ϑi)(1+ϑi)+Yi(2−ϑj)(1+ϑj) (4)
γn= −2
√56
ln(e)√ln2(e)+π2
√√√√√√2YiYj
√Ri Rj
Ri+Rjδn·
mimjmi+mj
Yj(1−ϑ2
i)+Yi
(1−ϑ2
j
) (5)
γt= −2
√56
ln(e)√ln2(e)+π2
√√√√√ 4YiYj
√Ri Rj
Ri+Rjδn·
mimjmi+mj
Yj(2−ϑi)(1+ϑi)+Yi(2−ϑj)(1+ϑj) (6)
Ft ≤ µsFn (7)
|M kr,t+∆t| ≤ Mm
r = µrRiRj
Ri+RjFn (8)
Materials 2022, 15, x FOR PEER REVIEW 3 of 15
contact model used in this work is the Hertz-Mindlin (no slip) model with RVD Rolling Friction compatibility model [33–35], adopting a Coulomb law of friction. This model is a commonly used in DEM simulations due to its accuracy and efficiency in force calculation.
As shown in Figure 1, the Hertz-Mindlin model uses the governing equations to de-scribe the interaction between a particle (i) and another particle (j) in terms of translation (Equation (1)) and rotation (Equation (2)). The former includes normal contact force (FCn,ij), tangential contact force (FCt,ij), corresponding viscous damping force (Fdn,ij, Fdt,ij) and grav-ity (mig). The latter represents the friction torque, including the torque generated by the tangential force (Mr
k) and torque generated by rolling friction (Mrd). Equations (1)–(8) are
the main expressions, which hold the coefficients and physical parameters involved in the model. In these, kn is the normal and kt is the tangential contact constant, γn is the normal damping and γt is the tangential contact damping constant. Y, υ, and e, in turn, represent the Young’s modulus of particles, Poisson’s ratio, and the coefficient of restitution be-tween particles. As for friction coefficients, µs and µr represent COSF and CORF, while Ft is the tangential and Fn is the normal force. Ri, Rj, and mi, mj represent the radius and mass of particles i and j, δn is the amount of deformation between particles, Ii is the mo-ment of inertia, ui is the transmission speed while ωi is the rotation speed.
Figure 1. Contact force diagram of discrete element particles i and j.
miduidt = FCn,ij+Fdn,ij+FCt,ij+Fdt,ij
K
j=1)+mig (1)
Iidωidt = ∑ (Mr
k+MrdK
j=1 ) (2)
kn=43 ·
YiYj
Yj 1-ϑi2 +Yi 1-ϑj
2RiRj
Ri+Rjδn (3)
kt=4YiYj
Yj 2-ϑi 1+ϑi +Yi(2-ϑj)(1+ϑj) (4)
γn=-256
ln(e)
ln2 e +π2 ⎷
2YiYj
RiRjRi+Rj
δn·mimjmi+mj
Yj 1-ϑi2 +Yi 1-ϑj
2 (5)
Figure 1. Contact force diagram of discrete element particles i and j.

Materials 2022, 15, 903 4 of 14
2.1.2. Measurement Method
In the measurement of the repose angle, the most commonly applied method isto use a protractor or similar tool to measure the angle manually [36]. This method issimple to operate, but human subjectivity may affect the accuracy of the results. Therefore,current measurement methods apply algorithms developed based on image analysis andcoordinate measurement technology [36,37]. Many investigators [38,39] have determinedthe mechanical properties of materials by processing images. The general steps can besimply summarized to include binary processing, contour extraction, coordinate mappingand Gaussian fitting. The purpose of binary processing is to reduce the amount of data inthe image and highlight the target contour. Contour extraction extracts contour coordinateson the basis of binarization. Coordinate mapping coordinates the data to draw contourlines by software. Finally, to make the profile of the particle pile smoother, the Gaussianfunction can be used to fit the contour to a bell curve.
For physical experiments in this work, we use photographs taken of the pile shapefrom four different directions with a fixed camera at the same vertical level as the center ofthe pile, and then determine the repose angle by software processing. For simulations, weuse the angle measurement tool of EDEM post-processing to get the repose angle. Finally, acomparison of the bell-shaped curves of the simulations and physical experiments obtainedby image processing is undertaken, and appropriate simulation parameters are determinedto reproduce the experimental results.
2.2. Physical Experiment
The pellet, sinter, and coke particles used in the experimental study are derived fromblast furnace charge, and their dimensions are shown in Figure 2. Table 1 shows theparameters of the three kinds of particles used in the experiments. The equivalent sphericaldiameter (ESD) was used to represent the particle size due to the irregular shape. We usedsieves with different meshes to determine the ESD range of the particles. The experimentalmethod to form a pile is the lifting cylinder method [40], which is used to determine therepose angle. The method places a funnel filled with a proper number of particles on a basewith known roughness, then lifts the funnel at a constant rate to form a pile, and finallymeasures the inclination angle of the particle pile as the repose angle.
Materials 2022, 15, x FOR PEER REVIEW 5 of 15
Figure 2. Particle size in physical experiments.
A schematic diagram of experimental device is shown in Figure 3. The experimental device of Figure 3a was used to study the repose angle of particle piles formed on a parti-cle base, where a heap is formed on a layer of particles. The experimental groups studied include pellet–pellet (P-P), sinter–sinter (S-S), coke–coke (C-C) and pellet–coke (P-C). As an example, the P-C group uses P as the particle in the funnel, while C is the particle forming the base. The repose angles of pellet, sinter and coke piles on a steel base (P-Steel, S-Steel and C-Steel) were also studied, using the device shown in Figure 3b. Firstly, the steel funnel was placed in the center of the base, and the funnel was filled with particles. Secondly, the funnel was manually lifted to a position just higher than the final particle pile apex at a speed of 0.3–0.5 m/s. Photos at the front view of the stationary particle pile were taken, and the experiment was repeated ten times. Finally, the ruler tool of Pho-toshop was applied to measure the repose angle of the piles.
Figure 3. The geometric model of the experiments: (a) Particles-base. (b) Steel-base.
2.3. Simulation Four experimental materials are involved in the experiments: pellet, sinter, coke and
steel plate. Their basic parameters are shown in Table 2 [27]. This work only changes CORF and COSF of one contact surface of the experimental group. The friction coefficients of other contact surfaces are fixed and the parameters are shown in Table 3 [27].
Figure 2. Particle size in physical experiments.
Table 1. Physical experiments particle parameters.
Materials Pellet Sinter Coke
Mass (kg) 4 2 2Size (diameter/ESD, mm) 8–13 6–8 13–15
Particle number (-) 2000 2500–3500 1500–2000
A schematic diagram of experimental device is shown in Figure 3. The experimentaldevice of Figure 3a was used to study the repose angle of particle piles formed on a particlebase, where a heap is formed on a layer of particles. The experimental groups studiedinclude pellet–pellet (P-P), sinter–sinter (S-S), coke–coke (C-C) and pellet–coke (P-C). As anexample, the P-C group uses P as the particle in the funnel, while C is the particle formingthe base. The repose angles of pellet, sinter and coke piles on a steel base (P-Steel, S-Steeland C-Steel) were also studied, using the device shown in Figure 3b. Firstly, the steel funnel

Materials 2022, 15, 903 5 of 14
was placed in the center of the base, and the funnel was filled with particles. Secondly, thefunnel was manually lifted to a position just higher than the final particle pile apex at aspeed of 0.3–0.5 m/s. Photos at the front view of the stationary particle pile were taken, andthe experiment was repeated ten times. Finally, the ruler tool of Photoshop was applied tomeasure the repose angle of the piles.
Materials 2022, 15, x FOR PEER REVIEW 5 of 15
Figure 2. Particle size in physical experiments.
A schematic diagram of experimental device is shown in Figure 3. The experimental device of Figure 3a was used to study the repose angle of particle piles formed on a parti-cle base, where a heap is formed on a layer of particles. The experimental groups studied include pellet–pellet (P-P), sinter–sinter (S-S), coke–coke (C-C) and pellet–coke (P-C). As an example, the P-C group uses P as the particle in the funnel, while C is the particle forming the base. The repose angles of pellet, sinter and coke piles on a steel base (P-Steel, S-Steel and C-Steel) were also studied, using the device shown in Figure 3b. Firstly, the steel funnel was placed in the center of the base, and the funnel was filled with particles. Secondly, the funnel was manually lifted to a position just higher than the final particle pile apex at a speed of 0.3–0.5 m/s. Photos at the front view of the stationary particle pile were taken, and the experiment was repeated ten times. Finally, the ruler tool of Pho-toshop was applied to measure the repose angle of the piles.
Figure 3. The geometric model of the experiments: (a) Particles-base. (b) Steel-base.
2.3. Simulation Four experimental materials are involved in the experiments: pellet, sinter, coke and
steel plate. Their basic parameters are shown in Table 2 [27]. This work only changes CORF and COSF of one contact surface of the experimental group. The friction coefficients of other contact surfaces are fixed and the parameters are shown in Table 3 [27].
Figure 3. The geometric model of the experiments: (a) Particles-base. (b) Steel-base.
2.3. Simulation
Four experimental materials are involved in the experiments: pellet, sinter, coke andsteel plate. Their basic parameters are shown in Table 2 [27]. This work only changes CORFand COSF of one contact surface of the experimental group. The friction coefficients ofother contact surfaces are fixed and the parameters are shown in Table 3 [27].
The simulation process is the same as in the physical experiment. In the process ofthe simulations, CORF and COSF between particle–particle and particle–steel plate arechanged. CORF is varied from 0.05 to 0.55 at intervals of 0.1, while CORF is varied from 0.1to 0.6 at intervals of 0.1.
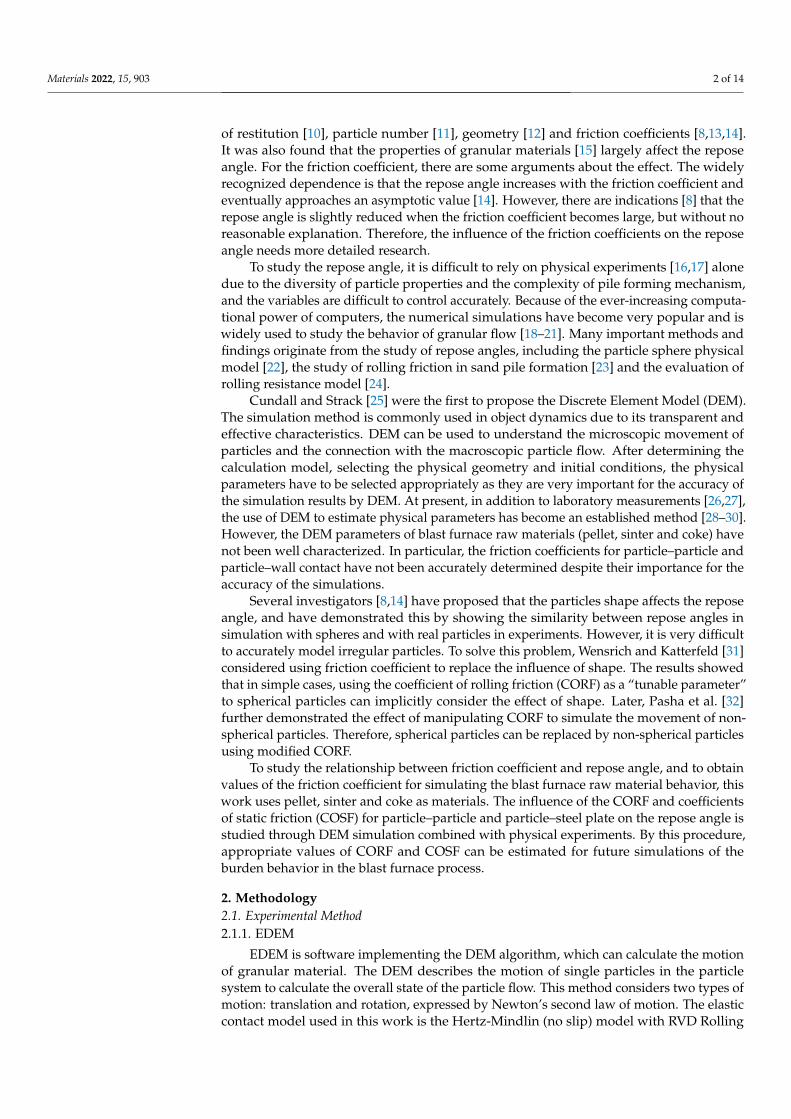
The experimental steps are as follows: Particles are randomly generated in the funnel,as shown in Figure 4. After the particles in the funnel have stabilized, the funnel was raisedin the positive direction of the z-axis at a speed of 0.4 m/s to the height above the apex ofthe particle pile that forms. The time step in the simulations was set to 1.5 × 10⁻⁵ s. Afterthe simulations, the repose angle in the four directions of ±x and ±y axis of the particlepile was measure and recorded, and average values were taken.
Table 2. Simulation parameters of pellet, sinter, coke and steel plate.
Materials P S C Steel
Diameter (mm) 10 8 13Density (kg/m3) 2284 3300 1050 7800
Young’s modulus (Pa) 2.5 × 10⁷ 3.5 × 10⁹ 5.37 × 10⁸ 2 × 10¹¹
Poisson’s ratio (-) 0.25 0.25 0.22 0.30Coefficient of restitution (-) 0.60 0.18 0.20
Materials 2022, 15, 903 6 of 14
Table 3. Coefficient of restitution, COSF and CORF in particle–particle and particle–steel plate.
Groups P-P S-S C-C P-Steel S-Steel C-Steel P-C
Coefficient ofrestitution (-) 0.42 0.35 0.39 0.62 0.40 0.42 0.40
COSF (-) 0.65 0.76 0.87 0.36 0.52 0.50CORF (-) 0.24 0.38 0.46 0.16 0.25 0.31
Materials 2022, 15, x FOR PEER REVIEW 6 of 15
Table 2. Simulation parameters of pellet, sinter, coke and steel plate.
Materials P S C Steel Diameter (mm) 10 8 13
Density (kg/m3) 2284 3300 1050 7800 Young’s modulus (Pa) 2.5 × 10⁷ 3.5 × 10⁹ 5.37 × 10⁸ 2 × 10¹¹
Poisson’s ratio (-) 0.25 0.25 0.22 0.30 Coefficient of restitution (-) 0.60 0.18 0.20
Table 3. Coefficient of restitution, COSF and CORF in particle–particle and particle–steel plate.
Groups P-P S-S C-C P-Steel S-Steel C-Steel P-C Coefficient of restitution (-) 0.42 0.35 0.39 0.62 0.40 0.42 0.40
COSF (-) 0.65 0.76 0.87 0.36 0.52 0.50 CORF (-) 0.24 0.38 0.46 0.16 0.25 0.31
The simulation process is the same as in the physical experiment. In the process of the simulations, CORF and COSF between particle–particle and particle–steel plate are changed. CORF is varied from 0.05 to 0.55 at intervals of 0.1, while CORF is varied from 0.1 to 0.6 at intervals of 0.1.
The experimental steps are as follows: Particles are randomly generated in the funnel, as shown in Figure 4. After the particles in the funnel have stabilized, the funnel was raised in the positive direction of the z-axis at a speed of 0.4 m/s to the height above the apex of the particle pile that forms. The time step in the simulations was set to 1.5 × 10⁻⁵ s. After the simulations, the repose angle in the four directions of ±x and ±y axis of the par-ticle pile was measure and recorded, and average values were taken.
Figure 4. The geometric model of the experiments: (a) Particles-base. (b) Steel-base.
Figure 4. The geometric model of the experiments: (a) Particles-base. (b) Steel-base.
3. Experimental Results and Discussion3.1. Simulation Results3.1.1. Selection Appropriate Lifting Funnel Speed
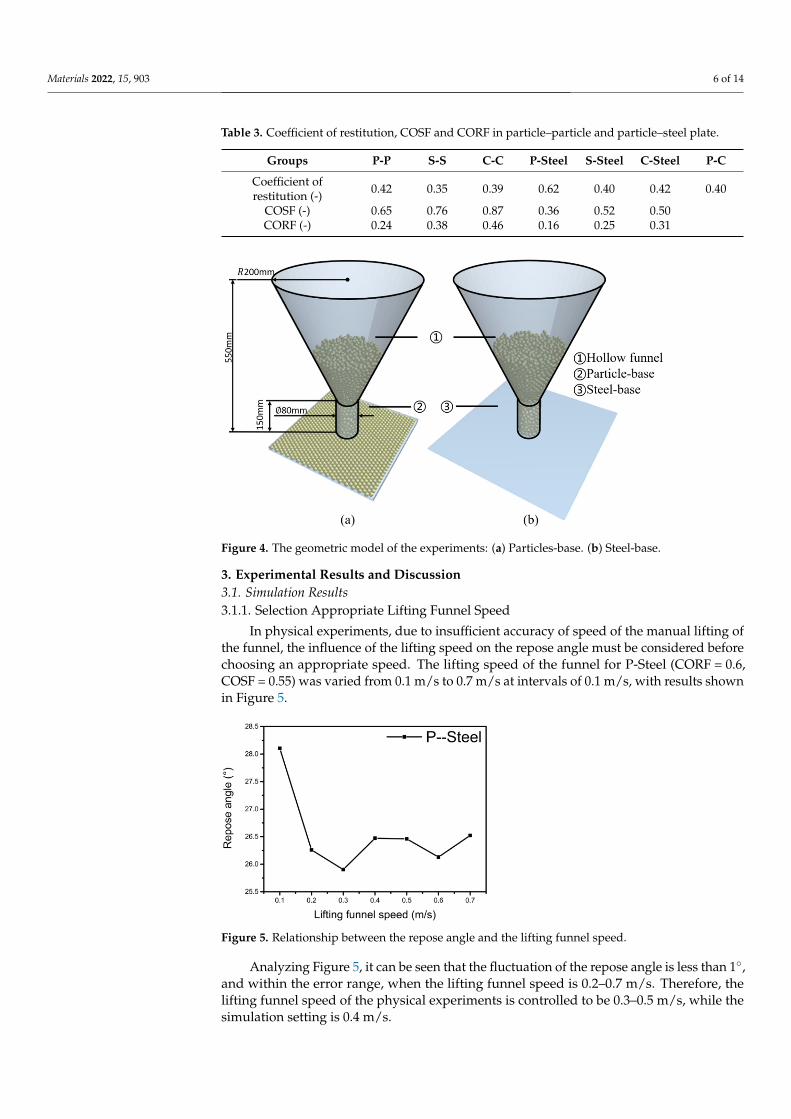
In physical experiments, due to insufficient accuracy of speed of the manual lifting ofthe funnel, the influence of the lifting speed on the repose angle must be considered beforechoosing an appropriate speed. The lifting speed of the funnel for P-Steel (CORF = 0.6,COSF = 0.55) was varied from 0.1 m/s to 0.7 m/s at intervals of 0.1 m/s, with results shownin Figure 5.
Materials 2022, 15, x FOR PEER REVIEW 7 of 15
3. Experimental Results and Discussion 3.1. Simulation Results 3.1.1. Selection Appropriate Lifting Funnel Speed
In physical experiments, due to insufficient accuracy of speed of the manual lifting of the funnel, the influence of the lifting speed on the repose angle must be considered before choosing an appropriate speed. The lifting speed of the funnel for P-Steel (CORF = 0.6, COSF = 0.55) was varied from 0.1 m/s to 0.7 m/s at intervals of 0.1 m/s, with results shown in Figure 5.
Figure 5. Relationship between the repose angle and the lifting funnel speed.
Analyzing Figure 5, it can be seen that the fluctuation of the repose angle is less than 1°, and within the error range, when the lifting funnel speed is 0.2–0.7 m/s. Therefore, the lifting funnel speed of the physical experiments is controlled to be 0.3–0.5 m/s, while the simulation setting is 0.4 m/s.
3.1.2. Repose Angle of Different Blast Furnace Raw Materials Figure 6 shows the repose angle under different CORF (µr) and COSF (µs) of the sim-
ulation groups. It can be seen from the graphs that with the increase of CORF and COSF, the repose angle also increases. Figure 7 depicts 3D graphs of the relationship between the repose angle and CORF and COSF, showing that the slope of is initially steep and then gradually levels out. Furthermore, Figures 6 and 7 indicate that the repose angle of each group from big to small are P-P > C-C > P-C > C-Steel > P-Steel > S-S > S-Steel.
Comparing the particle–particle group and particle–steel plate group, the repose an-gle of the particle–particle group is greater than that of the particle–steel plate group with the same CORF and COSF: a large roughness of the base surface will make the displace-ment shorter with the same path, thereby obtaining a greater repose angle. This causes the repose angle of the particle–particle group to be larger.
Figure 5. Relationship between the repose angle and the lifting funnel speed.
Analyzing Figure 5, it can be seen that the fluctuation of the repose angle is less than 1◦,and within the error range, when the lifting funnel speed is 0.2–0.7 m/s. Therefore, thelifting funnel speed of the physical experiments is controlled to be 0.3–0.5 m/s, while thesimulation setting is 0.4 m/s.

Materials 2022, 15, 903 7 of 14
3.1.2. Repose Angle of Different Blast Furnace Raw Materials
Figure 6 shows the repose angle under different CORF (µr) and COSF (µs) of thesimulation groups. It can be seen from the graphs that with the increase of CORF and COSF,the repose angle also increases. Figure 7 depicts 3D graphs of the relationship betweenthe repose angle and CORF and COSF, showing that the slope of is initially steep and thengradually levels out. Furthermore, Figures 6 and 7 indicate that the repose angle of eachgroup from big to small are P-P > C-C > P-C > C-Steel > P-Steel > S-S > S-Steel.
Materials 2022, 15, x FOR PEER REVIEW 8 of 15
Figure 6. Relationship between repose angle, CORF, and COSF: (a) P-P, (b) S-S, (c) C-C, (d) P-C, (e) P-Steel, (f) S-Steel, (g) C-Steel.
Figure 6. Relationship between repose angle, CORF, and COSF: (a) P-P, (b) S-S, (c) C-C, (d) P-C,(e) P-Steel, (f) S-Steel, (g) C-Steel.

Materials 2022, 15, 903 8 of 14Materials 2022, 15, x FOR PEER REVIEW 9 of 15
Figure 7. 3D graphs of the relationship of repose angle, CORF and COSF of experiment groups: (a) P-P, (b) S-S, (c) C-C, (d) P-C, (e) P-Steel, (f) S-Steel, and (g) C-Steel.
3.1.3. Relationship between CORF and Repose Angle Figures 6 and 7 illustrate that as CORF increases, the repose angle increases. Com-
paring the graphs in Figure 6, it can be seen that there is a difference in the growth trend for different experimental groups. Comparing (a), (b), (e), and (f) with (c), (d), and (g) in Figure 6, the former group is seen to show a larger increase. By analyze the system, it was found that the latter groups contain coke, which has a lower density than pellet and sinter. It is known that a collapse of a particle pile depends on gravity and friction. The smaller the density of the particles, the smaller the friction it bears. Therefore, parameters other than CORF and COSF are also important for the repose angle.
Figures 6 and 7 also show that when CORF of the group increases from 0.4 to 0.6, the repose angle increased only slightly or even occasionally decreased. This agrees with the
Figure 7. 3D graphs of the relationship of repose angle, CORF and COSF of experiment groups:(a) P-P, (b) S-S, (c) C-C, (d) P-C, (e) P-Steel, (f) S-Steel, and (g) C-Steel.
Comparing the particle–particle group and particle–steel plate group, the repose angleof the particle–particle group is greater than that of the particle–steel plate group with thesame CORF and COSF: a large roughness of the base surface will make the displacementshorter with the same path, thereby obtaining a greater repose angle. This causes the reposeangle of the particle–particle group to be larger.

Materials 2022, 15, 903 9 of 14
3.1.3. Relationship between CORF and Repose Angle
Figures 6 and 7 illustrate that as CORF increases, the repose angle increases. Com-paring the graphs in Figure 6, it can be seen that there is a difference in the growth trendfor different experimental groups. Comparing (a), (b), (e), and (f) with (c), (d), and (g) inFigure 6, the former group is seen to show a larger increase. By analyze the system, it wasfound that the latter groups contain coke, which has a lower density than pellet and sinter.It is known that a collapse of a particle pile depends on gravity and friction. The smallerthe density of the particles, the smaller the friction it bears. Therefore, parameters otherthan CORF and COSF are also important for the repose angle.
Figures 6 and 7 also show that when CORF of the group increases from 0.4 to 0.6, therepose angle increased only slightly or even occasionally decreased. This agrees with thefindings of Coetzee [8]. It is believed that with the increase of CORF, the rolling of theparticles become more and more difficult during the collapse of the particle pile. This meansthat the particles tend to slide more, and the rolling distance of the particles will continue todecrease. This phenomenon can simply be expressed as W = µr NX, where W is the workdone by the particle, X is the particle rolling distance, and N is the force perpendicular tothe rolling surface. With the increase of µr, X tends to decrease. The decrease of the W inthis process is because the increase of µr has less influence on W than on X.
3.1.4. Relationship between COSF and Repose Angle
Figures 6 and 7 suggest that the repose angle of the particle pile changes a lot with thechange of COSF. The repose angle difference between adjacent COSF is generally greaterthan 1◦ and even up to 10◦, while for CORF, it is generally less than 1◦, and the maximum is6.9◦. Another finding is that the relationship between CORF and the repose angle is affectedby COSF. Figure 6a confirms that the repose angle will increase with the increase of CORF,especially for COSF > 0.15, but the change in repose angle is small when COSF ≤ 0.15.Particles with low COSF more easily slide and usually have high speed, resulting in a shortcontact time of the particles and little influence of CORF. These two points support thetheory that COSF has a greater impact on the repose angle of the particle pile than CORF.This result agrees with findings reported in the literature [41,42]: during the formation ofthe particle pile, static friction is ubiquitous no matter if the particles move from a staticstate, or if static particles contact with dynamic particles.
Figure 6a indicates that when COSF ≥ 0.35, the difference in repose angle betweendifferent COSF is generally less than 2◦, but when COSF < 0.35, it is generally greaterthan 3◦. This substantiates that after COSF ≥ 0.35, the degree of increase in the reposeangle becomes smaller as the COSF increases, since the particles with high COSF tend toroll rather than slide. This is phenomenon can also be seen from Figures 6b–g and 7.
3.2. Comparison between Simulation and Physical Experiment
For physical experiments, the results obtained after post-processing are shown inTable 4, where the reported repose angle is the average value of the repeated experiments.Considering that the measurement error of the repose angle is generally about 1◦, andits relative standard deviation is within acceptable limits (≤0.1), these demonstrates thereliability of the results.
Table 4. Measurement results of the repose angle of physical experiment and its relative standarddeviation.
Groups P-P S-S C-C P-C P-Steel S-Steel C-Steel
Repose angle (◦) 24.73 24.96 27.40 24.91 17.68 23.72 27.22Relative standard deviation (-) 0.086 0.095 0.049 0.044 0.075 0.063 0.086
The repose angle obtained from the groups of physical experiment are in an order ofC-C > C-Steel > S-S > P-C > P-P > S-Steel > P-Steel. Among them, only P-Steel is lower

Materials 2022, 15, 903 10 of 14
than 20◦, and the repose angle of P-P is 7◦ larger than that of P-Steel. This is because the steelsurface is relatively smooth. It can be seen that CORF and COSF between particle–particleare greater than that of particle–steel plate. Next, we make a comparison of the repose angleof the pile in the experiments and simulations to obtain suitable simulation parameters.
To choose the appropriate CORF and COSF from the simulation results, as shown inFigure 8, we add a physical experiment line to Figure 6, and select the friction coefficientat the intersection point or within the range of the experiment line about 1◦. The rules todetermine the proper values (intersection point) of CORF and COSF are as follows: 1. Ingeneral, COSF should be larger than CORF. 2. CORF and COSF of particle–particle aregreater than that of particle–steel plate. 3. The contours of the particle piles for simulationsand physical experiments need to be similar. For CORF and COSF that meet the first twoconditions, we use Matlab and the data processing method of Gaussian fitting to extract thefitting curve of particle pile surface to determine whether it meets the third point. Regardingthe selection of the contour line fitting equation, although some investigators [43] describethe contour of the particle pile by a triangle, the contours observed in the experiments [29]are more irregular. The literature [37] proposes that it is more appropriate to describe thecontour of this type of particle piles with Gaussian fitting, because it approximates over alldata points and shows less errors. The CORF and COSF showing the best fit are reportedin Table 5, and a comparison of their bell curves with the experiments is given in Figure 9.
Materials 2022, 15, x FOR PEER REVIEW 11 of 15
general, COSF should be larger than CORF. 2. CORF and COSF of particle–particle are greater than that of particle–steel plate. 3. The contours of the particle piles for simulations and physical experiments need to be similar. For CORF and COSF that meet the first two conditions, we use Matlab and the data processing method of Gaussian fitting to extract the fitting curve of particle pile surface to determine whether it meets the third point. Regarding the selection of the contour line fitting equation, although some investigators [43] describe the contour of the particle pile by a triangle, the contours observed in the experiments [29] are more irregular. The literature [37] proposes that it is more appropri-ate to describe the contour of this type of particle piles with Gaussian fitting, because it approximates over all data points and shows less errors. The CORF and COSF showing the best fit are reported in Table 5, and a comparison of their bell curves with the experi-ments is given in Figure 9.
Figure 8. Choice of CORF and COSF in the intersecting part of the error range of the experimental line and the simulation lines.
Table 5. Comparison of repose angle between physical experiments and simulations.
Groups Physical/° Simulation/° (μs, μr) Relative Difference/° P-P 24.73 25.06 (0.55, 0.20) 0.33 S-S 24.96 25.53 (0.50, 0.30) 0.57 C-C 27.40 28.89 (0.45, 0.30) 1.49 P-C 24.91 25.60 (0.25, 0.10) 0.69
P-Steel 17.68 17.87 (0.45, 0.20) 0.19 S-Steel 23.72 23.71 (0.50, 0.20) 0.01 C-Steel 27.22 27.32 (0.42, 0.25) 0.10
Figure 9 compares the results of physical experiments and simulations with proper friction coefficients. The inserted figures show the simulated and experimental piles. In Figure 9a, the physical experiment curve is somewhat steeper than the simulated one, but the simulated curve falls within the error line, which means that the fit is good. Similarly, by studying Figure 9b–g, it is seen that the simulation and physical experiment curves basically overlap.
Figure 8. Choice of CORF and COSF in the intersecting part of the error range of the experimentalline and the simulation lines.
Table 5. Comparison of repose angle between physical experiments and simulations.
Groups Physical/◦ Simulation/◦ (µs, µr) Relative Difference/◦
P-P 24.73 25.06 (0.55, 0.20) 0.33S-S 24.96 25.53 (0.50, 0.30) 0.57C-C 27.40 28.89 (0.45, 0.30) 1.49P-C 24.91 25.60 (0.25, 0.10) 0.69
P-Steel 17.68 17.87 (0.45, 0.20) 0.19S-Steel 23.72 23.71 (0.50, 0.20) 0.01C-Steel 27.22 27.32 (0.42, 0.25) 0.10
Figure 9 compares the results of physical experiments and simulations with properfriction coefficients. The inserted figures show the simulated and experimental piles. InFigure 9a, the physical experiment curve is somewhat steeper than the simulated one, butthe simulated curve falls within the error line, which means that the fit is good. Similarly,by studying Figure 9b–g, it is seen that the simulation and physical experiment curvesbasically overlap.

Materials 2022, 15, 903 11 of 14Materials 2022, 15, x FOR PEER REVIEW 12 of 15
Figure 9. Comparison of bell curve of physical experiments and simulations: (a) P-P, (b) S-S, (c) C-C, (d) P-C, (e) P-Steel, (f) S-Steel, and (g) C-Steel.
It is worth noting that Table 5 indicates that the values of CORF and COSF for coke and sinter in the particle–particle group and the particle–steel plate group show small differences, and the repose angle of the two groups in the physical experiments are also similar, as seen in Table 4. The particles move more easily on the steel plate than on the particles, so a smaller repose angle should be obtained when a particle pile is formed on the steel plate. Our results show that for non-spherical particles, the difference in the movement of the particles on the particles or steel plate is not very obvious, which ulti-mately leads to similar values of CORF and COSF between particle–steel plate and parti-cle–particle.
Figure 9. Comparison of bell curve of physical experiments and simulations: (a) P-P, (b) S-S, (c) C-C,(d) P-C, (e) P-Steel, (f) S-Steel, and (g) C-Steel.
It is worth noting that Table 5 indicates that the values of CORF and COSF for cokeand sinter in the particle–particle group and the particle–steel plate group show smalldifferences, and the repose angle of the two groups in the physical experiments are alsosimilar, as seen in Table 4. The particles move more easily on the steel plate than on theparticles, so a smaller repose angle should be obtained when a particle pile is formed on thesteel plate. Our results show that for non-spherical particles, the difference in the movement
Materials 2022, 15, 903 12 of 14
of the particles on the particles or steel plate is not very obvious, which ultimately leads tosimilar values of CORF and COSF between particle–steel plate and particle–particle.
In summary, it can be concluded that value of CORF and COSF can be determined bythe outlined procedure, which is a basis for reliable DEM simulations of the behavior of theburden under charging and descent in the blast furnace.
4. Summary
In this paper, we applied DEM to simulate the formation of piles of pellet, sinter andcoke particles, and studied the influence of the coefficients of rolling friction (CORF) andstatic friction (COSF) for particle–particle and particle–steel plate contact on the repose angleof the piles. The findings of the work generally agree with what has been reported by otherinvestigators and the simulations were able to reproduce the experimental results. However,some differences between the present results and findings reported by other investigatorswere observed for the particle–particle and particle–steel plate friction coefficients of pellet,sinter and coke. The main conclusions of the present study are:
(1) The repose angle increases with CORF and COSF, but the growth rate graduallydecays or eventually even becomes negative for CORF ≥ 0.4 or COSF ≥ 0.35.
(2) COSF has generally a greater effect than CORF on the repose angle.(3) The rougher the base surface, the larger is the repose angle of the particle pile formed,
as a rough base surface reduces the displacement of the particles through the samepath, thereby forming a higher particle pile.
(4) The outlined procedure of fitting the contours of DEM-simulated piles with the exper-imental counterparts illustrate that appropriate CORF and COSF can be determined,which can be used to simulate the complex behavior of the burden in the ironmak-ing process.
Author Contributions: Conceptualization, H.W.; Data curation, S.W.; Formal analysis, S.W.; Fundingacquisition, Y.Y.; Investigation, S.W.; Methodology, S.W. and H.W.; Project administration, Y.Y.;Resources, H.S. and Y.Y.; Supervision, H.W.; Validation, S.W. and H.W.; Visualization, S.W.; Writing—original draft, S.W.; Writing—review and editing, H.W. and H.S. All authors have read and agreed tothe published version of the manuscript.
Funding: We gratefully acknowledge financial support from The Program for Professor of SpecialAppointment (Eastern Scholar) at Shanghai Institutions of Higher Learning (No. TP2015039), National111 Project (The Program of Introducing Talents of Discipline to University), Grant Award Number:D17002, and Project No: 51974182 supported by NSFC.
Institutional Review Board Statement: Not applicable.
Informed Consent Statement: Not applicable.
Data Availability Statement: Data are contained within the article and can be requested from thecorresponding author.
Conflicts of Interest: The author declares no conflict of interest.
References1. Stefania, S.; Zugliani., D.; Rosatti., G. A mathematical framework for modelling rock–ice avalanches. J. Fluid Mech. 2021, 919, 1–53.2. Janssen, H.A. Tests on grain pressure silos. Z. Vereins Deutsch. Ing. 1895, 39, 1045–1049.3. Hu, L.; Chen, Z.M.; Qian, C.L.; Zhou, L.W. Viscoelasticity of compressed granular assembly. Int. J. Mod. Phys. B 2003, 17, 217–220.
[CrossRef]4. Jin, Y.; Lu, H.; Guo, X.; Gong, X. The effect of water addition on the surface energy, bulk and flow properties of lignite. Fuel
Process. Technol. 2018, 176, 91–100. [CrossRef]5. Wei, X.; Bi, X.; Yong, Z. A model study of coke layer collapse in charging process in blast furnace. J. Wuhan Univ. Sci. Technol.
2007, 30, 342–345.6. Zaalouk, A.K.; Zabady, F.I. Effect of moisture content on angle of repose and friction coefficient of wheat grain. Misr J. Agric. Eng.
2009, 26, 418–427. [CrossRef]7. Zenit, R. Computer simulations of the collapse of a granular column. Phys. Fluids 2005, 17, 1–4. [CrossRef]

Materials 2022, 15, 903 13 of 14
8. Coetzee, C.J. Calibration of the discrete element method and the effect of particle shape. Powder Technol. 2016, 297, 50–70.[CrossRef]
9. Ferreira, I.S.B.; Peruchi, R.S.; Fernandes, N.J.; Junior, P.R. Measurement system analysis in angle of repose of fertilizers withdistinct granulometries. Measurement 2021, 170, 108681. [CrossRef]
10. Santos, D.A.; Barrozo, M.A.S.; Duarte, C.R.; Weigler, F.; Mellmann, J. Investigation of particle dynamics in a rotary drum bymeans of experiments and numerical simulations using DEM. Adv. Powder Technol. 2016, 27, 692–703. [CrossRef]
11. Miura, K.; Maeda, K.; Toki, S. Method of Measurement for the Angle of Repose of Sands. Soils Found. 1997, 37, 89–96. [CrossRef]12. Matuttis, H.G.; Luding, S.; Herrmann, H.J. Discrete element simulations of dense packings and heaps made of spherical and
non-spherical particles. Powder Technol. 2000, 109, 278–292. [CrossRef]13. Wei, H.; Zan, L.; Li, Y.; Wang, Z.; Saxén, H.; Yu, Y. Numerical and experimental studies of corn particle properties on the forming
of pile. Powder Technol. 2017, 321, 533–543. [CrossRef]14. Wei, H.; Tang, X.; Ge, Y.; Li, M.; Saxén, H.; Yu, Y. Numerical and experimental studies of the effect of iron ore particle shape on
repose angle and porosity of a heap. Powder Technol. 2019, 353, 526–534. [CrossRef]15. Kon, T.; Natsui, S.; Ueda, S.; Inoue, R.; Ariyama, T. Development of blast Furnace Simulator Based on Particle Method. In
Proceedings of the Asia Steel International Conference, Beijing China, 23–27 September 2012.16. Lajeunesse, E.; Mangeney-Castelnau, A.; Vilotte, J.P. Spreading of a granular mass on a horizontal plane. Phys. Fluids 2004,
16, 2371–2381. [CrossRef]17. Lube, G.; Huppert, H.E.; Sparks, R.S.J.; Hallworth, M.A. Axisymmetric collapses of granular columns. J. Fluid Mech. 2004,
508, 175–199. [CrossRef]18. Kejing, H.; Shoubin, D.; Zhaoyao, Z. Multigrid contact detection method. Phys. Rev. E Stat. Nonlinear Soft Matter Phys. 2007,
75, 036710.19. Staron, L.; Hinch, E.J. Study of the collapse of granular columns using DEM numerical simulation. J. Fluid Mech. 2005, 545, 1–27.
[CrossRef]20. Staron, L.; Hinch, E.J. The spreading of a granular mass: Role of grain properties and initial conditions. Granul. Matter 2007,
9, 205–217. [CrossRef]21. Crosta, G.B.; Imposimato, S.; Roddeman, D. Numerical modeling of 2-D granular step collapse on erodible and nonerodible
surface. J. Geophys. Res. Earth Surf. 2009, 114, 1–19. [CrossRef]22. Brilliantov, N.V.; Spahn, F.; Hertzsch, J.M.; PoSchel, T. Model for collisions in granular gases. Phys. Rev. E Stat. Phys. Plasmas
Fluids Relat. Interdiscip. Top. 2002, 53, 5382–5392. [CrossRef]23. Zhou, Y.C.; Wright, B.D.; Yang, R.Y.; Xu, B.H.; Yu, A.B. Rolling friction in the dynamic simulation of sandpile formation. Phys. A
Stat. Mech. Its Appl. 1999, 269, 536–553. [CrossRef]24. Ai, J.; Chen, J.-F.; Rotter, J.M.; Ooi, J.Y. Assessment of rolling resistance models in discrete element simulations. Powder Technol.
2010, 206, 269–282. [CrossRef]25. Deng, X.L.; Davé, R. Dynamic simulation of particle packing influenced by size, aspect ratio and surface energy. Granul. Matter
2013, 15, 401–415. [CrossRef]26. Boac, J.M.; Casada, M.E.; Maghirang, R.G.; Iii, J. Material and Interaction Properties of Selected Grains and Oilseeds for Modeling
Discrete Particles. Trans. Asabe 2010, 53, 1201–1216. [CrossRef]27. Wei, H.; Nie, H.; Li, Y.; Saxén, H.; He, Z.; Yu, Y. Measurement and simulation validation of DEM parameters of pellet, sinter and
coke particles. Powder Technol. 2020, 364, 593–603. [CrossRef]28. Charithkumar, K.; Goswami, T.K. Determination of properties of black pepper to use in discrete element modeling. J. Food Eng.
2019, 246, 111–118.29. Roessler, T.; Katterfeld, A. DEM parameter calibration of cohesive bulk materials using a simple angle of repose test. Particuology
2019, 45, 105–115. [CrossRef]30. Liu, F.; Zhang, J.; Li, B.; Chen, J. Calibration of parameters of wheat required in discrete element method simulation based on
repose angle of particle heap. Trans. Chin. Soc. Agric. Eng. 2016, 32, 247–253.31. Wensrich, C.M.; Katterfeld, A. Rolling friction as a technique for modelling particle shape in DEM. Powder Technol. 2012,
217, 409–417. [CrossRef]32. Pasha, M.; Hare, C.; Ghadiri, M.; Gunadi, A.; Piccione, P.M. Effect of particle shape on flow in discrete element method simulation
of a rotary batch seed coater. Powder Technol. 2016, 296, 29–36. [CrossRef]33. Kruggel-Emden, H.; Wirtz, S.; Scherer, V. A study on tangential force laws applicable to the discrete element method (DEM) for
materials with viscoelastic or plastic behavior. Chem. Eng. Sci. 2007, 63, 1523–1541. [CrossRef]34. Di Maio, F.P.; Di Renzo, A. Analytical solution for the problem of frictional-elastic collisions of spherical particles using the linear
model. Chem. Eng. Sci. 2004, 59, 3461–3475. [CrossRef]35. Wei, H.; Li, M.; Li, Y.; Ge, Y.; Saxén, H.; Yu, Y. Discrete Element Method (DEM) and Experimental Studies of the Angle of Repose
and Porosity Distribution of Pellet Pile. Processes 2019, 7, 561. [CrossRef]36. Klanfar, M.; Korman., T.; Domitrovic, D.; Herceg, V. Testing the novel method for angle of repose measurement based on
area-weighted average slope of a triangular mesh. Powder Technol. 2021, 387, 396–405. [CrossRef]37. Müller, D.; Fimbinger, E.; Brand, C. Algorithm for the determination of the angle of repose in bulk material analysis. Powder
Technol. 2021, 383, 598–605. [CrossRef]

Materials 2022, 15, 903 14 of 14
38. Wang, Z.J. Study on Wear Resistance of Eutectic High Entropy Alloy Based on Image Recognition Analysis. Master’s Thesis,Xi’an University of Technology, Xi’an, China, 2020.
39. Wang, Y.H.; Wang, H.Q.; Wu, S.L.; Zhao, Q.H.; Sun, F.Y. Full-Field Measurement Method of Mechanical Properties of MaterialsBased on Machine Vision. Meas. Control Technol. 2020, 39, 35–46.
40. Roessler, T.; Katterfeld, A. Scaling of the angle of repose test and its influence on the calibration of DEM parameters usingupscaled particles. Powder Technol. 2018, 330, 58–66. [CrossRef]
41. Zhou, Y.C.; Xu, B.H.; Yu, A.B.; Zulli, P. An experimental and numerical study of the angle of repose of coarse spheres. PowderTechnol. 2002, 125, 45–54. [CrossRef]
42. Li, T.Q.; Peng, Y.X.; Zhu, Z.C.; Zou, S.Y.; Yin, Z.X. Discrete Element Method Simulations of the Inter-Particle Contact Parametersfor the Mono-Sized Iron Ore Particles. Materials 2017, 10, 520. [CrossRef] [PubMed]
43. Kalman, H. Quantification of mechanisms governing the angle of repose, angle of tilting, and Hausner ratio to estimate theflowability of particulate materials. Powder Technol. 2021, 382, 573–593. [CrossRef]
Copyright © 2022 FDOKUMEN