Master's Thesis User-independent recognition of dynamic hand gestures using a dataglove
115
Master’s Thesis User-independent recognition of dynamic hand gestures using a dataglove Ing. Mario S. Ganzeboom s0134848 October 28, 2010 Graduation Committee: Dr. P.E. (Paul) van der Vet Dr. M. (Mannes) Poel Dr. Ir. F.W. (Wim) Fikkert Human Media Interaction Group Faculty of Electrical Engineering, Mathematics and Computer Science University of Twente, Enschede The Netherlands
Transcript of Master's Thesis User-independent recognition of dynamic hand gestures using a dataglove

Master’s Thesis
User-independent recognition ofdynamic hand gestures using a
dataglove
Ing. Mario S. Ganzebooms0134848
October 28, 2010
Graduation Committee:Dr. P.E. (Paul) van der Vet
Dr. M. (Mannes) PoelDr. Ir. F.W. (Wim) Fikkert
Human Media Interaction GroupFaculty of Electrical Engineering, Mathematics and Computer Science
University of Twente, EnschedeThe Netherlands


‘An idea. Resilient, highlycontagious. Once an ideahas taken hold of the brainit’s almost impossible toeradicate. An idea that isfully formed - fullyunderstood - that sticks;right in there somewhere.’
(Character of Cobb, Fromthe film ‘Inception’, 2010)
‘A picture is worth athousand words. Aninterface is worth athousand pictures.’
(Ben Shneiderman)
‘We have to learn to seetechnical devices andsoftware as others seethem. Feeling a sense ofpride in getting a device todo what we want doesn’tmean we’re clever, itmeans the design waswrong.’
(Jeremy Allison)

Summary
The goal of this thesis is the user-independent recognition of dynamic, single-handed gestures using a dataglove. This research focuses on the technology be-hind the recognition of these gestures. It wants to try and find suitable technolo-gies, compare them and research ways to optimise the use of these technologiesto increase recognition performance.
The dynamic hand gestures described in this research were defined by research-ing the tasks users do when controlling a large display surface. Nine gestureswere defined to cover different aspects of navigating a user interface. Using adataglove for hand pose data and an additional sensor for position and orienta-tion data, data was recorded on all nine gestures from eight users in a Wizard ofOz experiment. The aim of this experiment was the simulation of a real-worldenvironment in which users control two applications with the nine gestures.
With the recorded data three types of recognisers that were suitable for thegoal of this thesis were trained and tested: Discrete Hidden Markov Models(DHMMs), Continuous Hidden Markov Models (CHMMs) and Latent-DynamicConditional Random Fields (LDCRFs). Different data pre-processing methodsand parameter tuning were applied to try and increase their recognition rate.Contrary to expectation, the DHMMs and CHMMs performed poorly and onlyLDCRFs were able to achieve a satisfying recognition rate on the recorded dataset. Initial testing of the LDCRFs on user independence also showed satisfyingrecognition rates.
This thesis shows that the user-independent recognition of dynamic hand ges-tures using a dataglove is feasible. Even though this research describes only apart of the process involved in designing hand gesture interaction, it can withouta doubt play an effective role in its realisation.
i
Samenvatting
Het doel van deze masterscriptie is het gebruikersonafhankelijk herkennen vandynamische handgebaren met behulp van een dataglove. Het onderzoek richtzich op de technologie achter het herkennen van deze gebaren. Er is gezochtnaar geschikte technologieën en deze zijn met elkaar vergeleken. Daarnaast zijnmanieren onderzocht om ze te optimaliseren met als doel het herkenningsper-centage te verhogen.
Negen dynamische handgebaren worden in deze scriptie beschreven en zijn gede-finieerd aan de hand van een analyse van de taken die gebruikers uitvoerenwanneer zij een groot scherm bedienen. In een zogeheten ‘Wizard of Oz’-experimentis met behulp van een dataglove en een extra sensor data opgenomen met be-trekking tot de vorm, positie en oriëntatie van de hand. In dit experiment werdernaar gestreefd een zo echt mogelijke omgeving na te bootsen waarin de ge-bruikers twee applicaties bedienen met de negen gebaren.
Vervolgens zijn drie verschillende recognisers getraind en getest: Discrete Hid-den Markov Models (DHMMs), Continuous Hidden Markov Models (CHMMs)en Latent-Dynamic Conditional Random Fields (LDCRFs). Om het herken-ningspercentage van deze recognisers te verhogen, zijn verschillende datavoor-bewerkingsmethoden en de effecten van het afstellen van de recogniserparame-ters onderzocht. Geheel onverwachts presteerden de DHMMs en CHMMs slecht,de LDCRFs waren de enige met een bevredigend herkenningspercentage. DeLDCRFs gaven tevens bevredigende resultaten in de initiële gebruikersonafhanke-lijkheidstests.
Dit onderzoek toont aan dat het gestelde doel haalbaar is. Hoewel dit onderzoekslechts een deel beschrijft van het ontwerpproces van handgebareninteractie,kan het zonder twijfel een effectieve rol spelen in het realiseren ervan.
ii

Preface
Since my teenage years I have been fascinated by the interfaces used in thetelevision series ‘Star Trek: The Next Generation’. The speech interface in par-ticular fascinated me and I daydreamed more than once about its applicationin future homes. It enabled control and the exchange of knowledge by the in-tuitive use of verbal language or so it seemed. At the beginning of my master’sI was introduced to the Natural Interaction paradigm and learned that speechinterfaces are designed with naturalness in mind to be intuitive to use. Thisintroduction fed my interest in natural interaction and its use of the vision,speech and touch modalities. After doing an independent research assignmentinvolving the gestural modality I knew I wanted to do a larger project to furtherexplore the possibilities of gesturing. This became my final research project forobtaining my master’s degree. What lies before you are its results.
Even though I believe in the ‘User-Centered Design’ philosophy, in which inter-faces are designed from a user perspective, I wanted to approach this projectfrom a technological perspective. This allowed me to explore the technologiesbehind the recognition of dynamic hand gestures, to research how these tech-nologies perform and to try to find ways to optimise their use.
To quote one of my supervisors at the beginning of the project: ‘Data is every-thing with these technologies’. A statement which is inherently true when con-sidering that the machine learning techniques explored in this research solelyuse data to ‘learn’ pattern characteristics. I personally have found it to betrue after having observed the positive and negative effects various data pre-processing methods have on gesture recognition.
As every data set is different and previous research did not provide much detail,I tried to get a feel for the data characteristics by iteratively training and testing
iii

Preface
recognisers. Although this gave me the insight I wanted, I sometimes made oneiteration too many, which jeopardised my schedule. Fortunately, my supervisorswere there to drop me a hint as to when to ‘terminate’ the iterative loop.
This thesis mainly contributes to the field of gesture recognition by showing thatuser-independent recognition of hand gestures is feasible using a technology thatto the best of my knowledge had previously not been used for dynamic handgesture recognition as presented in this thesis. A comparison is also made withcommonly used technologies. In addition, contributions are made on the topicof data pre-processing in support of gesture recognition. Some research is alsodone on the numerical stability of the algorithm implementations used.
User-independent recognition of dynamic hand gestures remains a challengingtask. I hope this thesis provides inspiration for future research in the field ofhand gesture interaction.
iv

Acknowledgements
In the course of doing the research for and writing my master’s thesis I receivedsupport from many people. Here I would like to thank them. First and foremostmy supervisors, Paul van der Vet, Wim Fikkert and Mannes Poel who have sup-ported me all the way. Thank you Paul for always letting me see my research asbeing part of a bigger picture and for encouraging me to find out why I found theresults I did. Thank you Wim, most of all for showing me different angles fromwhich to look at my research and for putting it into perspective. And thank youMannes for your insight and comments on the recogniser technologies. I wouldalso like to thank Han Rauwerda from the University of Amsterdam for showingme the setup of the e-BioLab and for discussing with me the tasks users do. Ialso owe a word of thanks to Natalie Ganzeboom, who reviewed large parts ofmy thesis and to my fellow graduates for providing a productive atmosphere inthe ‘graduate room’. Finally, I would like to thank my family and friends foralways supporting and listening to me when I just needed to talk.
v

Contents
List of Tables viii
List of Figures x
1. Introduction 11.1. Motivation . . . . . . . . . . . . . . . . . . . . . . . . . . . . . . . . . . . 31.2. Thesis subject . . . . . . . . . . . . . . . . . . . . . . . . . . . . . . . . . 41.3. Research questions . . . . . . . . . . . . . . . . . . . . . . . . . . . . . . 61.4. Research context . . . . . . . . . . . . . . . . . . . . . . . . . . . . . . . 61.5. Method . . . . . . . . . . . . . . . . . . . . . . . . . . . . . . . . . . . . . 91.6. What this thesis is not about . . . . . . . . . . . . . . . . . . . . . . . . 111.7. Thesis structure . . . . . . . . . . . . . . . . . . . . . . . . . . . . . . . . 11
2. Tasks and Gestures 122.1. Tasks in the e-BioLab . . . . . . . . . . . . . . . . . . . . . . . . . . . . . 122.2. From e-BioLab tasks to elemental tasks . . . . . . . . . . . . . . . . . . 142.3. From elemental tasks to gestures . . . . . . . . . . . . . . . . . . . . . . 19
3. Hand gesture data 263.1. Used sensors . . . . . . . . . . . . . . . . . . . . . . . . . . . . . . . . . . 263.2. Experiment setup . . . . . . . . . . . . . . . . . . . . . . . . . . . . . . . 293.3. Data description . . . . . . . . . . . . . . . . . . . . . . . . . . . . . . . . 33
4. Recognition technologies 364.1. Hidden Markov Models . . . . . . . . . . . . . . . . . . . . . . . . . . . . 384.2. Latent-Dynamic Conditional Random Fields . . . . . . . . . . . . . . . 49
vi

Contents
5. Experiments and results 535.1. Unprocessed data . . . . . . . . . . . . . . . . . . . . . . . . . . . . . . . 535.2. Pre-processed data . . . . . . . . . . . . . . . . . . . . . . . . . . . . . . 545.3. Choosing parameters . . . . . . . . . . . . . . . . . . . . . . . . . . . . . 635.4. Quantity of available user data . . . . . . . . . . . . . . . . . . . . . . . 685.5. User independence . . . . . . . . . . . . . . . . . . . . . . . . . . . . . . 69
6. Conclusion 73
7. Future research 77
Bibliography 80
A. Flock Of Birds Quick Manual 90A.1. Configuring the FOB hardware . . . . . . . . . . . . . . . . . . . . . . . 91A.2. Accessing the FOB . . . . . . . . . . . . . . . . . . . . . . . . . . . . . . 93
B. Data recording protocol 97
C. Characteristics of experiment participants 99
vii

List of Tables
2.1. Initial list of user tasks . . . . . . . . . . . . . . . . . . . . . . . . . . 13
2.2. Modified list of tasks after having discussion . . . . . . . . . . . . . 13
2.3. The tasks of Table 2.2, context independently defined . . . . . . . . 14
2.4. Overview of general and elemental interface tasks . . . . . . . . . . 16
2.5. Merged overview of general and elemental interface tasks . . . . . 17
2.6. Exhaustive list of elemental tasks to define gestures for . . . . . . . 19
3.1. Number of gesture samples per class . . . . . . . . . . . . . . . . . . 34
5.1. Recognition rates using unprocessed data . . . . . . . . . . . . . . . 54
5.2. Recognition rates using rescaled data . . . . . . . . . . . . . . . . . 55
5.3. Recognition rates using normalised data . . . . . . . . . . . . . . . . 55
5.4. Recognition rates using interpolated data . . . . . . . . . . . . . . . 58
5.5. Recognition rates using data with fewer dimensions . . . . . . . . . 59
5.6. Recognition rates using data with the position difference added . . 61
5.7. Recognition results using pre-processing method combinations . . . 62
5.8. Results of the LDCRF hidden state tuning experiments . . . . . . . 67
5.9. Results of the LDCRF regularisation factor tuning experiments . . 67
5.10.Results of the LDCRF window size tuning experiments . . . . . . . 68
5.11.LDCRF recognition rates using an increasing quantity of data . . . 68
5.12.Number of gesture samples from the two additional users . . . . . 70
5.13.Recognition rates obtained with the tests on user-independence . . 70
5.14.Confusion matrix of: 6 users training set, User 1 as test set . . . . 71
viii

List of Tables
5.15.Confusion matrix of: 6 users training set, User 2 as test set . . . . 71
5.16.Confusion matrix of: 7 users training set, User 2 as test set . . . . 72
5.17.Confusion matrix of: 7 users training set, User 1 as test set . . . . 72
ix

List of Figures
1.1. Stills from the film Minority Report . . . . . . . . . . . . . . . . . . 7
1.2. The layout of the e-BioLab, taken from [69] . . . . . . . . . . . . . . 9
1.3. The method used (in phases) . . . . . . . . . . . . . . . . . . . . . . . 10
2.1. A model for executing a single general task . . . . . . . . . . . . . . 17
2.2. Four-state model showing the type of interface manipulations . . . 18
2.3. Gestures for Pointing and Selecting + Repositioning . . . . . . . . . 21
2.4. Gestures for enlarging / zooming in and shrinking / zooming out . . 22
2.5. Gestures for Maximising (2.5a) and Demaximising (2.5b) . . . . . . 23
2.6. Gestures for Minimising (2.6a) and Deminimising (2.6b) . . . . . . 24
2.7. Gesture for closing . . . . . . . . . . . . . . . . . . . . . . . . . . . . 25
3.1. The CyberTouchTM dataglove, main unit and peripherals used . . . 28
3.2. Explanations of the wrist yaw and thumb rotations . . . . . . . . . 29
3.3. The Ascension Flock Of Birds system used . . . . . . . . . . . . . . 30
3.4. Layout of the recording experiment room . . . . . . . . . . . . . . . 31
3.5. Screenshot of Squidy pipeline for recording gesture data . . . . . . 32
3.6. Plots of two samples of the close gesture . . . . . . . . . . . . . . . . 35
4.1. The recogniser development process with all inputs and outputs . . 37
4.2. An example of the ergodic and left-to-right state architectures . . . 41
4.3. Example of the parallelly connected HMMs . . . . . . . . . . . . . . 42
5.1. Two different instances of the demaximise gesture . . . . . . . . . . 56
x

List of Figures
5.2. The interpolated variants of the gestures from Figure 5.1 . . . . . . 57
5.3. Scree graph of PCA on data set with 23 dimensions . . . . . . . . . 59
5.4. Recognition rates per experimental number of symbols . . . . . . . 64
5.5. Recognition rates per number of symbols after tuning . . . . . . . . 65
5.6. CHMM recognition rates using logarithms of probabilities . . . . . 66
A.1. The Ascension Flock of Birds system used . . . . . . . . . . . . . . . 90
xi

Chapter 1Introduction
During the 1980s personal computers were introduced into working environ-ments with the office as the most striking example. Interaction was providedthrough a keyboard, mouse and a relatively small display. In the last few decadescomputers evolved and displays became larger. In addition, computers and dis-plays are no longer restricted to working environments. Nowadays they canbe found in shopping centres, train stations, municipal offices and other pub-lic environments, in which large display surfaces often provide context-relatedinformation in an interactive way. Interacting with these surfaces by using akeyboard and mouse can be obtrusive and constraining in such environments[86, 10], which has serious consequences for how users experience these environ-ments. The interaction design that is part of these environments should becomemore natural and intuitive to the user [32] and it should not draw attention tothe technology behind it or impose a high cognitive load on the user. Moreover,the interaction with computers (or machines in general) should be adapted tothe user and not force the user to adapt [50]. This change in the way of thinkingabout Human Computer Interaction has resulted in novel ways of interaction.
The different human modalities inspired scientists to design new ways of nat-ural interaction. Speech (one of the modalities) recognition technologies haveexisted since the early 1950s [14], but it was not until the mid 1980s when ad-vances in statistical processing sparked a renewed interest in the field.
Another human modality, the modality of touch inspired touch and multi-touchsurfaces for computer systems, which were invented in the early 1980s. Theyredefined interaction through direct manipulation, which allows the user to ma-nipulate objects directly using actions that (loosely) correspond to those in the
1

Chapter 1 | Introduction
physical world [76, 30]. Advances in technology increased the size of newer gen-erations of touch and multi-touch surfaces while greatly reducing their cost. Asa result the use of touch and multi-touch surfaces in different environments isincreasing steadily. Mouse actions were simply replaced by touch actions, withwhich a user navigated a graphic user interface [26]. More efficient recognitiontechniques popularised the recognition of strokes and led to the recognition ofsingle-handed strokes of different forms [42]. In the last decade, advances inmulti-touch technologies increased the popularity of the recognition of bimanualgestures on touch surfaces [18, 27].
However, research into gesture-based interaction was not limited to touch sur-faces. From the mid 1980s research has also been done on interaction throughgestures with parts of the body that are interpreted by a computer [99, 59].Gesture interaction is a broad field and includes the recognition of full body mo-tion [62], as well as head motion [56], facial expressions [63] and hand gestures[29], the latter being the subject of this thesis. A user interacting through handgestures makes gestures with the hands and arms in mid-air. These gesturesare observed and interpreted by a recogniser system, different types of whichhave been researched. Most of these systems can be categorised into one of twogroups, based on either static hand pose recognition or dynamic gesture recogni-tion [86, 54]. The systems in the former group measure and interpret the actual,static shape of the hand. A good example of this is the research on the recog-nition of sign language [37]. Dynamic gesture recognition on the other handinvolves gestures that change over time such as the waving gesture [11]. Whilemaking this gesture, the position and orientation of the arm and hand varyover time, the specific variations of which need to be recognised, which is pre-cisely what makes this type of recognition dynamic. Dynamic gesture recogni-tion makes the recognition of gestures that are less constrained possible, whichgives the user more freedom [79].
Gesture recognition can be further categorised into user-dependent [48] anduser-independent [70] recognition. The performance of user-dependent recognis-ers depends on them being tuned to the individual user. They therefore requiresome type of calibration in order to become familiar with a particular user’s spe-cific characteristics before they can be used effectively [60]. User-independentrecognisers do not needthis type of calibration and instead use their capacity togeneralise the gestures of users: any user can use this type of recogniser imme-diately as no preparation (e.g. calibration) is required.
2

Chapter 1 | Introduction
The focus of this thesis is on the development and evaluation of a dynamic, user-independent gesture recogniser. The following sections give a clear overview ofthe goals and boundaries of this research.
1.1. Motivation
A technology-driven approach was chosen due to the availability of certain hard-ware: a dataglove consisting of seventeen functional flex sensors. In previousresearch this glove has been used to measure the pose of a hand and providedata to a pose recogniser [23]. Three poses were defined to recognise four in-terface actions: clicking, dragging, zooming and rotating. A fourth pose wasdefined to function as a rest pose, to which no interface action was assigned. Atraining set of fifty samples for every pose was created. The test set consistedof fifteen samples in total that were different to those in the training set. Alltest samples were from a single person. The test results showed that fourteenout of the fifteen (93%) test samples were recognised correctly if the user’s handreturned to the resting pose in between gestures. All fifteen (100%) were recog-nised correctly when the hand transitioned smoothly from one pose to the next.No significant tests were done with other users as part of this research. How-ever, tests with another user in an informal setting showed that the recogniseronly randomly recognised the correct poses at best. The recogniser was onlytrained and tuned to a single specific user.
To embrace the unobtrusiveness natural interfaces strive for, the interactionshould not draw attention to the technology, but rather to the task at hand.For both user-dependent and user-independent recognisers learning has to takeplace to memorize the gesture set [38]. However, users of user-independentrecognisers do not have to go through a calibration or training phase prior tousing them.
The research described at the beginning of this section concerns hand pose recog-nition, which is particularly relevant for sign languages. Gestures that changeover time, also known in the field as ‘dynamic’, are more relevant to other con-texts. They are often used to recognise human motion [94], thereby diversifyingpossible gesture interaction. This is also why in this thesis the choice was madeto research user-independent recognition of dynamic gestures.
3

Chapter 1 | Introduction
1.2. Thesis subject
Although the field of gesture recognition includes many ways of gesturing thisthesis is about recognising hand gestures. It was inspired by the results fromand owes a word of thanks to Fikkert [20], who describes single-handed andbimanual gestures for controlling large display surfaces that are out of arms-reach. Fikkert’s main focus is to find suitable gestures while taking into accounthuman behaviour. The focus of this thesis is the technology behind the recog-nition of these gestures in order to enable recognition and research ways to op-timise the use of those technologies to increase recognition performance. Thisthesis focuses on single-handed gestures as their recognition is less complex.
The drop in recognition performance in previous research [23] means the gesturerecognition process cannot be extended to other users. Furthermore, dynamicgestures are extremely suitable for controlling large displays based on the factthat the dynamic gestures that Fikkert [20, ch. 4 & 5] considers all contain someform of motion in either arm, hand or fingers. This thesis researches the chal-lenges posed by user-independent recognition of dynamic gestures when appliedto the control of large display surfaces that are out of arms-reach.
One of the challenges is to define a gesture set for users to control large displaysurfaces. For example, several gestures can be defined for controlling a displayfor zooming in on an image. In front of a large display you could make a pullinggesture, one you make when pulling a closed door towards you to open it. Similarto pulling the door towards you, pulling the image towards yourself allows acloser look. Another ’zoom in’ gesture could start with both hands put together.Moving the hands in opposite directions could then start the zooming process.A third gesture for zooming in could involve moving the tips of the thumb andindex finger from or to each other, while keeping the remaining three fingersin a fist. This is the so-called ’Pinch’ gesture [91]. From the user’s perspectivethe recognition of all of these gestures would be ideal. However, when seenfrom a technological perspective the recognition of all gestures becomes verycomplex. As this thesis focuses on a solution to hand gesture recognition froma technological point of view this complexity needs to be limited. That way thenecessary calculations remain computationally tractable. As a consequence asmall subset of hand gestures needs to be defined, which is done according to theexisting literature on hand gesture recognition and the context of this thesis.
Another challenge is the usability of the interface, which depends among otherthings on the percentage of successfully recognised gestures. For instance can
4

Chapter 1 | Introduction
users complete their tasks successfully if there is a margin for error or is therelittle to no room for error? Qualitative empirical research involving users isrequired to answer this question, which is not part of this research due to its fo-cus on recognition technology. This research therefore assumes a linear relationbetween usability and percentage of successfully recognised gestures.
Its goal is the user-independent recognition of dynamic gestures, which in themost ideal situation means that every user regardless of age, gender, size, etc.,should be able to simply put on the glove and start operating the interface with-out calibration or user training. This leads to many variables and a very com-plex system. In order to make the research slightly less complex and to be ableto clearly see how different technologies and their parameters affect the recogni-tion percentage, a particular group of users is targeted in this thesis, the studyof which will reveal any characteristics that need to be taken into account duringthe recognition process.
The recognition technology that is used greatly influences the performance ofthe recognition interface. The choice of technology depends on what kind of ges-ture is selected for controlling large display surfaces. As the purpose of thisthesis is to recognise dynamic gestures, a recognition technology that takes tem-poral changes into account is the better choice. When a selection of recognitiontechnologies has been made, experimenting with different parameter settings isalso a possibility to further increase the percentage of successfully recognisedgestures [19, 31]. The training data used to train the recogniser is also of greatimportance, because when noisy data is used, the interface has more difficultyrecognising the gestures. Moreover, the training data should not be limited toone user, but should include at least a few users, a representative sample of thetarget group. This way the gesture recogniser increases its capacity to recognisegestures from users not available during training [93], which raises the follow-ing question: ’How does the number of users available at training affect thiscapacity?’
In short, having taken on the challenges described in the previous paragraphs,the ultimate goal of this thesis is to achieve a percentage of successfully recog-nised gestures that is usable for a large group of users.
5

Chapter 1 | Introduction
1.3. Research questions
This research would like to answer the following questions with respect to theabove-mentioned goal.
1. Can dynamic hand gestures be recognised independent of users?a) Which technologies are suitable for this purpose?
i. What effect does pre-processing the data set have on the perfor-mance?
ii. What effect does the tuning of parameters have on the perfor-mance?
iii. How does a traditional technology compare to a novel one?
iv. What effect does the quantity of available user data have on theperformance?
b) Can a recogniser be made user independent for a large group?
1.4. Research context
In the film ‘Minority Report’1, the main character, John, is a chief of police whotries to prevent crimes before they take place. John and his team have access toa special crime lab. In this lab John stands in front of a transparent display andsifts through large amounts of data (mostly images and video’s) about the future.One of the methods he uses to control the interface is hand gesture interactionout of arms-reach of the display. John wears special gloves and makes single-handed or bimanual gestures to control the interface. Figure 1.1a and 1.1b showJohn’s gloves and John controlling the interface.
Although this example may seem futuristic and unfeasible, it has been done.The scientists and developers who helped shape a realistic image of the tech-nologies shown in the film, were able to make a hand gesture interface withsimilar features to that in the film. It was and still is being developed by Ob-long Industries2 and their spatial operating environment as they call it has beenchristened ‘g-speak’.
John’s fictional crime lab is a good example of the use of large displays, whichare also used in the real world. As Fikkert [20] mentions, large displays can alsobe found in future homes [84], offices, schools and other public environments. In
1See http://www.imdb.com/title/tt0181689/. Last visited on July 13th, 2010.2See http://www.oblong.com. Last visited on July, 13th, 2010.
6

Chapter 1 | Introduction
(a) Special glovesJohn uses to makegestures.
(b) John controlling the interface and reflectingwith team members.
Figure 1.1.: Stills from the film Minority Report.
future homes they will be the interface for the interactive systems in the home.In offices they will be used to display and interact with images and documentsduring meetings. Schools will use them to display animated learning aids to helpstudents with their studies. Municipal offices, examples of public environments,will use large displays to provide information to visitors, enabling them to findtheir way around the building.
A more creative use of large displays in public environments is interactive artfor example. Surrounding users with display surfaces would immerse them in avirtual world, as Fikkert [20] mentions, which they could navigate and in whichthey could manipulate objects [17]. This world can either be a realistic or virtualprojection. It is expected that users explore these worlds independently and findout about its functionalities. They could also be artistic canvasses. The goalis to let the users be creative and make their own artistic creations. Museumsare also good examples of public environments which could benefit from gestureinteraction [39].
Fikkert also mentions operating theatres as locales for gesture-based interfaces.Surgeons could access patient information, for example, MRI, CT and X-ray im-ages themselves without having to ask support staff to access it for them. In ad-dition, gesture-based interfaces have the advantage that surgeons do not haveto touch any form of controller to access patient information, which keeps theirhands sterile and allows the surgeon to remain at the patient’s side.
Busy shopping streets are examples of environments we are all familiar with.Shop keepers increasingly use displays in their windows to advertise the prod-ucts to the public. The displays do not only show information about the shop or
7

Chapter 1 | Introduction
the products in the window, but passers-by can also interact with them [89]. Dis-plays that are able to detect when passers-by stand in front of them can adaptthe information displayed. Passers-by can also interact personally by browsingthe products available in the shop using simple taps, knocks or gestures. Theinteraction does not have to be limited to the detection of someone standing infront of the display, as mobile phones could take this to the next level by ex-changing information with the display.
Life scientists have to deal with large amounts of experimental data [15]. Tofully address this data, a multidisciplinary team of experts doing complex andcomputationally intensive analysis and experimentation is needed. In an ef-fort to accelerate the process of analysing and visualising large biological datasets, discuss results and address biological research questions, an e-BioLab wasbuilt at the University of Amsterdam [69]. The e-BioLab provides the life sci-entists with a large, high-resolution, tiled display, high-bandwidth connectivityand access to high-performance computing. A multidisciplinary team of scien-tists working together co-located trying to solve problems in fields of biology,genetics, bioinformatics and micro array experiments amongst others. The en-vironment employs a methodology facilitating the re-use of methods and appliesdomain dedicated Problem Solving Environments. The use of the e-BioLab inactual practice has turned out to facilitate lively and focused discussions. In-sights into problems were gained at a faster pace, which would have been nearlyimpossible without the use of the e-BioLab. The large display surface used in thee-BioLab is a tiled display that consists of twenty 21-inch LCD computer screensarranged in a 4 by 5 matrix. The software used in the e-BioLab to render the dis-play is the Scalable Adaptable Graphics Environment (SAGE)3. Basically, whatSAGE does is merge many smaller displays into one large display and provide anarchitecture to control those displays as one. In the architecture a simple win-dow management system is included opening every object in its own window.The display is controlled by an operator sitting behind a desktop system. Figure1.2 shows the layout of the laboratory used at the University of Amsterdam.
The participating scientists need to ask the operator to display images or other-wise change the screen. Scientists other than the operator might not be able todo that, because they are unfamiliar with the interface for controlling the largedisplay. A gesture-based interface could be of benefit to them in this environ-ment giving them more freedom and flexibility, as studies in similar contextsshow [4, 90]. The scientists could make gestures while standing in front of the
3See http://www.evl.uic.edu/cavern/sage/index.php. Last visited on January 14, 2010.
8

Chapter 1 | Introduction
Figure 1.2.: The layout of the e-BioLab, taken from [69].
display to display the images they need or to manipulate them while discussingthem with fellow scientists. This removes the need for an operator to control thedisplay and the communication between scientists and operator, during whichrequests could possibly be misunderstood. It gives the scientists more freedomto control the display as they see fit, without having to trouble the operator. Theultimate goal would be to enable two or more scientists to control the display bymaking gestures simultaneously. The e-BioLab is taken as an example through-out this thesis to research the practical application of hand gesture interaction.This practical application is then extended to the use of controlling large displaysurfaces with hand gestures in general.
1.5. Method
The goal of this thesis is the user-independent recognition of dynamic gestures.Figure 1.3 depicts the method used.
9

Chapter 1 | Introduction
Figure 1.3.: The method used (in phases). Phases five and six were repeated for eachrecogniser. Phases five, six and seven were repeated for each recogniser tech-nology.
In order to recognise dynamic gestures the first step was to define a dynamicgesture set based on the current literature and the context described in section1.4. Having targeted a user group a small study was carried out to discover theircharacteristics. With the gesture set and results of the user study, a Wizard ofOz experiment was held [12], the goal of which was to create a data set contain-ing instances of all gestures from as many users as possible. In this experimentthe user seemingly controlled two applications by using the gestures from thegesture set, by which is meant that the user makes the gesture while it is be-ing interpreted and translated into interface actions by the researcher. Whilethe users were making the gestures the data they generated was recorded andglobally segmented. The data was recorded using a dataglove that the userswore. This right-handed glove has several flexion sensors to measure how thewrist and fingers are bent. In order to incorporate the position and orientationof the hand in 3D space, a magnetic tracking sensor was attached to the glove.The data recorded through these devices formed the basis for the training of therecognisers. In order to make the data suitable for training, it had to be cleanedfrom noise and precisely segmented (i.e. the beginning, end and class of ges-ture had to be marked). Recognisers were trained and tested with the cleanedand segmented data. Seventy-five percent of the data was used for training.The remaining twenty-five percent was reserved for testing the percentage ofsuccessfully recognised gestures on data unseen during training. The effects onthe recognition performance by tuning the recognisers through pre-processing of
10

Chapter 1 | Introduction
the data set were studied in combination with variations in the parameter set-tings of the recognition technologies. Using this method a comparison was madebetween a traditional and a novel technology with regard to their recognitionperformance.
1.6. What this thesis is not about
This thesis does not address issues of intuitiveness and efficiency with regard tothe use of hand gestures and how users experience them in this regard. Insteadit focuses on the optimisation of the technical aspect of hand gesture recognition.
As several researchers have pointed out, it is important to define gestures whichare intuitive, come natural to humans and are easy to remember [21, 86]. Al-though this thesis uses related literature to define a gesture set, it has a differentfocus and therefore does not contain research on the intuitiveness, naturalnessand remembrance of individual gestures.
The gestures recognised are from a single hand only. Recognising gestures madeby two hands would be ideal and would add to the gesture interaction possibil-ities [74]. Unfortunately, it would also complicate the research in such a waythat it does not agree with the time frame for this thesis.
1.7. Thesis structure
This thesis is structured as follows. Chapter 2 continues with the definition of adynamic gesture set suitable for controlling large display surfaces at a distance.Consecutively, Chapter 3 explains in detail the Wizard of Oz experiment setupand the properties of the recorded data. The technologies that were researchedand applied to user-independent, dynamic gesture recognition are described inChapter 4. In Chapter 5 the performance results obtained during the recogniserexperiments are analysed and explained. The significance of these results isinterpreted in Chapter 6. Lastly, recommendations for future research are madein Chapter 7.
11
Chapter 2Tasks and Gestures
This chapter describes the dynamic hand gestures and how they were defined.The gestures were found by researching the tasks users do when controlling alarge display surface. Section 2.1 describes the context of this research, finds alist of tasks specific to that context and shows that the tasks are context inde-pendent. In Section 2.2 a detailed analysis of the tasks addresses the questionif these could be translated to gestures without any change and Section 2.3 con-cludes by describing the hand gestures as they are finally used.
2.1. Tasks in the e-BioLab
In Section 1.4 the e-BioLab was described in which a group of multidisciplinaryscientists work together to address questions in the fields of life sciences. Oneof the tools available in the lab is a large display surface, which is used to visu-alise these datasets. Currently, the display is controlled by an operator from aseparate desktop or small tablet PC. The operator is a scientist specially trainedin operating the system and software used to control the display. If other scien-tists in the lab want to change what is being displayed they need to go via theoperator. This is where a hand gesture interface could improve the method ofcontrol..
Driven by the possibilities and advantages of such an interface, this exampleand its context were further explored in this thesis. An initial list of user taskswas compiled from Kulyk et al. [41] and Rauwerda et al. [69], describing aformative user study, the e-BioLab and its setup. Only user tasks which involvecontrolling the large display were considered. In this context the term ‘user task’
12

Chapter 2 | Tasks and Gestures
is defined as described in Stone et al. [80, ch. 4, § 1.1]: “A task is a structuredset of related activities that are undertaken in some sequence." The initial listof tasks, structured in two categories is shown in Table 2.1.
Image viewing Volume viewing (3D)
• Panning• Zooming• Selecting
• Rotating• Zooming• Selecting
Table 2.1.: Initial list of user tasks for controlling the large display in the e-BioLab.
Revisiting this list in an interview with the operator of the e-BioLab resulted inthe more complete listing as shown in Table 2.2.
Tasks currently possible Tasks possible in the future
1. Window managementa) Resizingb) Repositioningc) Minimising and
maximisingd) Closing
2. Image viewinga) Panningb) Zooming
1. Volume viewing (3D)a) Rotatingb) Zoomingc) Switching between
3D view modesd) Switching between
model layers
Table 2.2.: Modified list of tasks after having discussed Table ?? with the display opera-tor.
This list is further divided into two new categories: tasks that are technologi-cally possible and currently used in e-BioLab sessions and tasks that are cur-rently not (yet) technologically possible, but are desired for the future. An ad-ditional difference with Table 2.1 is that the window management tasks wereadded. Amongst those are the tasks for resizing, repositioning and closing win-dows equal to that in traditional Windows-Icon-Menus-Pointing (WIMP) inter-faces [20, 88].
This thesis limits its research to these subcategories, because they are actuallyused in the e-BioLab. Possible integration of the interface with the existing labsystems in the future is for that reason easier as well.
The applicability of the window management tasks are not limited to the e-
13

Chapter 2 | Tasks and Gestures
BioLab. They are easily imaginable in other contexts involving interfaces withwindow management systems. The same holds for the image viewing tasks.Therefore, we can define the tasks of Table 2.2 independent from any context asshown in Table 2.3.
Tasks currently possible
1. Window managementResizing Enlarging and/or shrinking the size of a window on the large
display, given that the window is not minimised.Repositioning Moving the window left, right, up and down the
2-dimensional axes of the large display, given that the window is notminimised.
Minimising Hide the contents of the window and reduce it to the form of asmall bar at the bottom of the display, given that the window ismaximised or demaximised.
Deminimising Restore the window to its previous position and size andshow its contents, given that the window is minimised.
Maximising Enlarge the window across the whole display, stretching itscontents, given that the window is minimised or demaximised.
Demaximising Restore the window to its previous position and size,given that the window is maximised.
Closing Completely close the window, so that it is not in any way presenton the display.
2. Image viewingPanning The 2-dimensional repositioning of an image that is bigger than
the window it is viewed in, so another, invisible part of that image isdisplayed.
Zooming in Enlarging an image from a specific point of focus in awindow so as to see it from closer by and in more detail.
Zooming out Shrinking an image from a specific point of focus in awindow so as to see more of the image and less detail.
Table 2.3.: The tasks of Table 2.2, context independently defined.
2.2. From e-BioLab tasks to elemental tasks
This section aims to translate the tasks from Table 2.3 into suitable hand ges-tures. Recall the definition of ‘user task’ from paragraph 2.1. The important partin this definition is that a task consists of a set of activities. This implies that atask can be further subdivided into activities, also called actions [80, ch. 4, § 1.1].Applying this notion to the tasks already defined it becomes apparent that they
14

Chapter 2 | Tasks and Gestures
too consist of actions. The tasks window resizing and repositioning, for examplehave as precondition that a window needs to be selected before they can be exe-cuted. The other tasks in the list are similar. They all have certain preconditionswhich need to be satisfied before the actual task can be done. These precondi-tions form a part of the set of actions of a task. Until now the analysis and defini-tion of these tasks were approached from a user perspective (hence, ‘user task’).However to get tasks which can be directly translated into gestures it makesmore sense to approach it from an interface perspective. Although that perspec-tive uses a different terminology, the definitions remain the same. For example,the term ‘user task’ from the user perspective is termed ‘general interface task’in the interface perspective. The term ‘action’ is termed ‘elemental interfacetask’, which are tasks defined at such a low level that they can be executed di-rectly. They have no preconditions which need satisfaction. Fikkert [20, § 3.2]describes them as being at the heart of interfaces: “They build up an interfaceby being repeated throughout the various facets of the whole interaction.” Healso describes the best example being the Windows-Icon-Mouse-Pointer (WIMP)design. In this design the elemental interface tasks (also elemental tasks) ofpoint-and-click events are used and reused over and over again.
From this it follows that elemental tasks can be translated into hand gestures.This means that the general tasks need to be subdivided one level further toidentify the elemental tasks. Before that is done however, the problem of mis-understanding should be addressed. Misunderstanding about when the usermakes a gesture which should be interpreted by the interface and when not.Buxton [5] describes three states in which the input can be. Alternating be-tween the first two describes the problem of misunderstanding. Buxton calls thefirst state the zero or ’out-of-sync’ state and the second state the first or ‘Track-ing’ state in which no input is given and the system tracks a user’s input. Nowtake the following gesturing example, a user zooms in on an image and after-wards points out a particular part to colleagues. The zooming in task should beinterpreted, however pointing should not. The interface should change from thezero state to the tracking state while zooming and returning to the zero state af-terwards. However, the interface should stay in the zero state while pointing outthe parts to colleagues. There is no clear signal or cue given when to change fromzero to tracking and back [5]. This problem is not unique to gesture interaction.Speech interaction has the same problem in the form of the interface not clearlyknowing when its addressed and when not. There is no clear difference betweenwhen to interpret and when not, then a gesture or spoken utterance should be
15

Chapter 2 | Tasks and Gestures
interpreted in one context, but not in another. Keeping contextual informationcould play an important part in solving this problem. A solution to this problemfor gesture interaction might also contain the use of various interaction zonesa user stands in. Interaction zones define the role users play in a collabora-tive setting [24]. However, to research such a solution is outside of the scope ofthis thesis. In this research an on/off switch available on the hardware is used.Naturally, gestures are interpreted when the hardware is switched on and stopswhen it is switched off. This provides two extra elemental tasks, activate anddeactivate.
Returning to breaking down the general tasks in elemental tasks, Table 2.4 givesan overview. In this overview it is assumed that only a single task is executed.
# General interface task Elemental interface tasks1 Resizing activate - point - select - enlarge / shrink - deactivate2 Repositioning activate - point - select - move - deactivate3 Minimising activate - point - select - minimise - deactivate4 Deminimising activate - point - select - deminimise - deactivate5 Maximising activate - point - select - maximise - deactivate6 Demaximising activate - point - select - demaximise - deactivate7 Closing activate - point - select - close - deactivate8 Panning activate - point - select - move - deselect - deactivate9 Zooming in activate - point - select - zoom in - deselect - deactivate
10 Zooming out activate - point - select - zoom out - deselect - deactivate
Table 2.4.: Overview of general interface tasks and their corresponding elemental inter-face tasks.
The reader notices that tasks 1, 9 and 10 and tasks 2 and 7 have basically thesame elemental tasks, see Table 2.4. Although they are used in a different con-text, the result is the same. The names of the general tasks appear to suggesta different meaning, however at the elemental level they are identical. Incor-porating these facts in a new, merged overview, it is reduced to that in Table2.5.
16

Chapter 2 | Tasks and Gestures
# General interfacetask
Elemental interface tasks
1 Resizing / zooming in/ zooming out
activate - point - select - enlarge / shrink - deactivate
2 Repositioning /panning
activate - point - select - move - deactivate
3 Minimising activate - point - select - minimise - deactivate4 Deminimising activate - point - select - deminimise - deactivate5 Maximising activate - point - select - maximise - deactivate6 Demaximising activate - point - select - demaximise - deactivate7 Closing activate - point - select - close - deactivate
Table 2.5.: Merged overview of general interface tasks and corresponding elemental in-terface tasks.
Figure 2.1 shows a model in which the elemental tasks are generalised in how asingle task is executed.
Activate Point Select
Deselect
DeactivateTask related action
Figure 2.1.: A model for executing a single general task.
The model specifically shows the execution of a single task. Naturally, generaltasks are executed consecutively by users. This makes the constant activationand deactivation in every task of the gesture interface superfluous. Thereforeit is reduced to just one activation and deactivation at the beginning and end ofthe interaction.
As Figure 2.1 describes a model for a single general task, how would a modellook like that incorporates all elemental tasks and the possible transitions be-tween them? A model which in fact describes the possible inputs and their con-sequences. Such models exist for graphical input and several were describedin existing literature. Buxton [5] describes such a model having three states inwhich the graphical input can be. This model can for example represent point,select and drag interactions for indirect input devices like mice, but direct inputdevices like touch screens also. However, this is different for free-hand directinteraction as Fikkert [20] describes. He denotes the three states from Buxton’smodel as: out of range, tracking and selected, which is equal to deactivated,pointing and selected in Figure 2.1. For the elemental tasks activate, point andselect a separate state is created. The remaining elemental tasks described in
17

Chapter 2 | Tasks and Gestures
Table 2.5 are not modelled in Buxton’s model. Those tasks can basically be con-sidered as different manipulations in an interface, which is what Fikkert does.Furthermore Fikkert [20] describes that various extensions to Buxton’s modelwere made in the past to model extra elemental tasks. However, most of theseextensions fall short in their capacity to generalise over different interface ma-nipulations and that is what is necessary with direct free-hand interface input.Fikkert solves this shortage by following the approach of Hinckley [28]. Hinck-ley’s approach introduces a new state in the model for every new mouse button,in which every mouse button introduces a new form of manipulation. The dis-advantage is that the model grows fast, because every new state introduces newstate transitions with the existing states. To prevent this, Fikkert extends Bux-ton’s model with a fourth state. In this state all manipulation tasks are modelleddynamically. The fourth state is implemented in a way such it adapts to the task.In this way all remaining elemental tasks besides activate, point and select canbe modelled. Figure 2.2 shows the four-state model taken from Fikkert [20]. Italso shows the ‘Manipulating’ state having various ‘substates’ representing thetypes of manipulations. The possible transitions between states are representedby the arrowhead-arcs in this thesis.
Out of range#0
Tracking#1
Selected#2
Zoom out
Zoom in
Maximize
Demaximize
Minimize
Deminimize
Close
Manipulating#3
In range
Out of range
Select
Deselect
Release
ReleaseActivate
Reposition
Out of range
Figure 2.2.: Four-state model taken from Fikkert [20] in which the types of interfacemanipulations from this research are represented as ‘substates’ of the fourthstate. The substates are mutually fully connected, but to reduce clutter thearrowhead-arcs are left out.
18

Chapter 2 | Tasks and Gestures
2.3. From elemental tasks to gestures
The goal of this chapter, to have a set of hand gestures defined for general tasks,is achieved in this last paragraph. Table 2.6 lists the twelve elemental tasks forwhich gestures need to be defined.
• Activate• Deactivate• Point• Select
• Deselect• Enlarge / Zoom in• Shrink / Zoom out• Maximise
• Demaximise• Minimise• Close• Reposition
Table 2.6.: Exhaustive list of elemental tasks to define gestures for.
Multiple gestures for doing many of the elemental tasks above are defined byFikkert [20][21]. In various experiments he evaluated the intuitiveness of ges-tures and which gesture users would use when confronted with in real life. Thefollowing subparagraphs describe per pair of tasks (e.g. activate / deactivate,minimise / deminimise etc.) the hand gestures chosen. The decisions are basedon the results described in the previously mentioned literature.
2.3.1. Activate and deactivate
Several ‘gestures’ have been thought of for activating and deactivating the in-terpretation of gestures by the interface. The first option that came to mind wasthe user moving his hand above a certain threshold height regarding his bodyto activate the interface. However, this is physically hard to endure for longerperiods. Additionally, one goes above the threshold pretty quick if the user justlikes to point out something on the display without having it interpreted as agesture. As described in section 2.2 making use of different interaction zonesis another option. Although this option may have great potential it is beyondthe scope of this thesis. For the remainder of this research a button is relied onto activate and deactivate the interface according to the user’s needs. An on/offswitch located on the hardware is used for this purpose.
2.3.2. Point
Pointing comes down to controlling a pointer in two dimensions on the largedisplay surface. This has the similar concept of that of a mouse controlling a
19

Chapter 2 | Tasks and Gestures
pointer in the WIMP metaphor. The hardware used provides for a 3-dimensionalposition signal. This signal can be used to control a pointer on a 2-dimensionalsurface in real-time. However, the pointer should not be moved when a usermakes another gesture. Therefore the pointer can only be controlled when inthe pointing mode. This mode is active when the user shapes his hand in theform of a pistol in the upright position. In this way a user can immediately doa select to minimise the delay in the workflow, then pointing and selecting isoften used in conjunction. Pointing itself is based on ray-casting as experimentsfrom Fikkert [20] have shown, users rated this highest on both intuitivenessand ‘would use’. If the user’s hand is not shaped in a pistol the pointer remainson the last pointed location. This way the user can also point out objects onthe display without having the interface interpret it as a gesture. Figure 2.3avisualises the pointing gesture.
2.3.3. Select and deselect
For selecting the results of the experiments in [20] have shown that the Air-Tap is rated the highest on intuitiveness, physical strain and ‘would use’. TheThumbTrigger gesture does not fall behind much. Although the AirTap is ratedhighest, the ThumbTrigger better suits the context of this research, consideringthe hardware used. Based on this fact the ThumbTrigger gesture is used forselecting. The hand is shaped like a pistol and the thumb taps the middle fingerto do a select task.
In regard to deselecting, the results show that the DropIt (stretched hand, palmfacing downwards) and Select other (select background, empty space or otherobject) gestures are rated highest. Considering the fact that the focus of thisresearch is on the technical realisation of gesture recognition, the choice is madeto use the Select other gesture. It is equal to the gesture chosen for selecting,resulting in recognising two elemental tasks with one gesture. Additionally, theusers mentioned that they were familiar with this concept of deselecting fromthe WIMP style interfaces. See Figure 2.3b for a visualisation of the gestures.
20

Chapter 2 | Tasks and Gestures
(a) (b)
Figure 2.3.: Gestures for Pointing (2.3a) and Selecting + Repositioning (e.g. Dragging,2.3b).
2.3.4. Reposition
Basically the gesture for repositioning objects on a large display surface is thesame as that of pointing only with a little extra. The movement of the handacross the x and y axes of the large display enables the selected object to berepositioned. Note the words ‘selected object’ in the previous sentence. In factthis gesture uses position and select gestures to accomplish its goal.
2.3.5. Enlarge, zoom in and shrink, zoom out
For these elemental tasks Fikkert [20] also experimented with different ges-tures. Two gestures were found to be rated highest: ‘Move hands apart’ and‘Move fingers apart’. Given that this research is limited to gesturing with asingle hand, the gesture ‘Move hands apart’ is removed as a candidate, leaving‘Move fingers apart’ as the gesture of choice. This gesture can be done in multi-ple ways. By moving thumb and index finger from or to each other, by movingthumb and all other fingers from or to each other (as in grasping somethingbetween thumb and fingers). Additionally, the scaling factor of enlarging andshrinking (or zooming in or out for that matter) can be interpreted in two ways.
21

Chapter 2 | Tasks and Gestures
By repeatedly moving thumb and fingers from or to each other or by distributingthe total scale across the whole distance between thumb and fingers. With thelatter the user only has to move his thumb and fingers from or to each otheronce. Given that and that people are already familiar with the variant of thisgesture for touch screens, the choice has been made to use thumb and indexfinger gesture with the scaling across the distance between them. Figure 2.4visualises the gestures.
Figure 2.4.: Gestures for enlarging / zooming in and shrinking / zooming out.
2.3.6. Maximise and demaximise
Once again, this means pushing a window across the whole display (maximise)and to restore it from this state to its last size (demaximise). Fikkert [20] hasnot experimented with gestures for these elemental tasks. In existing literaturenothing could be found on this subject as well. When thinking about possibleone-handed gestures for these two elemental tasks, one tends to think in thedirection of the enlarge and shrink gestures. Then to maximise and demaximiseis basically ‘enlarge to full screen’ and ‘shrink to previous size’. The differenceis that no scaling distribution is needed. So, instead of moving thumb and indexfinger slowly from or to each other, moving thumb and other fingers explosivelyfrom or to each other might be intuitive and easy for the users to do. Movingthumb and other fingers apart explosively signals to maximise the selected win-dow whereas moving thumb and other fingers to each other explosively until
22

Chapter 2 | Tasks and Gestures
they touch signals a demaximise. Partially these gestures are derived from en-larging and shrinking pictures in the interaction with multi-touch devices. Seefigures 2.5a and 2.5b for a visualisation.
(a) (b)
Figure 2.5.: Gestures for Maximising (2.5a) and Demaximising (2.5b).
2.3.7. Minimise and deminimise
Given that the goal of minimising is to send a window downwards hiding itscontents only showing its titlebar, the gesture of waving it down seems intuitiveand easy to use. The Apple iPhone also uses this gesture in a slightly differentform for its touch screen. To deminimise the opposite gesture is used, wave thewindow up. These gestures also have an analogy in daily life in form of signallingan audience to sit down or stand up. Basically, one signals windows to ‘sit down’or ‘stand up’ instead of an audience. A visualisation of the gestures is shown inFigures 2.6a and 2.6b.
23

Chapter 2 | Tasks and Gestures
(a) (b)
Figure 2.6.: Gestures for Minimising (2.6a) and Deminimising (2.6b).
2.3.8. Close
Closing windows by gesturing is also not much written about in current litera-ture. When observing gestures people make in daily life, the closing of windowsis comparable to something which is not needed anymore, can be removed or isdisapproved to be shown on the display. To express this people in daily life oftenmake a wavy gesture of disapproval or just waving it ‘away’. With this gesturethe hand is usually stretched in a relaxed way. Additionally, the thumb pointsupwards. Starting the gesture, the palm of the hand faces towards the user af-ter which the wrist turns slightly to let the back of the hand face upwards in theend. See Figure 2.7 for a visualisation.
24

Chapter 2 | Tasks and Gestures
Figure 2.7.: Gesture for closing.
25

Chapter 3Hand gesture data
Hand gesture recognition is a concrete case of a pattern recognition problem.To recognise patterns, samples of these patterns are needed to discover theirdistinctive characteristics. Without going into further detail here, patterns arerecognised by ‘matching’ new patterns’ characteristics to those from the trainedsamples. This means that samples of the gestures defined in Chapter 2 areneeded to discover their characteristics.
This chapter is about how the necessary gesture samples were collected for train-ing and testing a recogniser. A total of 2034 samples were collected for the ninegestures. Considering the purpose of this thesis is to recognise dynamic handgestures user-independently, this thesis wanted to collect samples from as manyusers as possible. The following sections describe the sensors used for recordingdata, the experiment setup and the properties of the data set collected.
3.1. Used sensors
When considering the sensors used to recognise gestures the field of hand ges-ture recognition is generally divided into two categories [54]. Glove-based ap-proaches use instrumented gloves to measure the flexion of the fingers, the posi-tion and orientation of the hand. The category of vision-based approaches usescameras to record images of the user who is making gestures. In this categorythis thesis also includes marker-based solutions, since the markers are recordedthrough different types of cameras as well. Differences between these two ap-proaches are described along several dimensions including accuracy, resolution,latency, range of motion, user comfort and cost. As Mitra et al. [54] and Mandel
26

Chapter 3 | Hand gesture data
[50] point out, the advantages of using a vision-based approach is that it does nothinder the ease and naturalness of the user’s interaction. Nothing needs to beworn and no cables can hinder gesturing as compared to a glove-based approachwhere the user wears a glove and cables that attach the device to a computer.Advantages of glove-based approaches are that the hand and fingers are mea-sured directly and the data can be provided at a higher sampling frequency.Vision-based approaches cannot track the hand in such detail without havingto use computationally intensive calculations slowing down the tracking pro-cess. The first step in that process is always having to extract information fromthe images. Glove-based approaches on the contrary provide usable informationimmediately. Vision-based approaches also have to cope with line-of-sight occlu-sion, situations in which the hand is occluded by some object between the cameraand the hand. Glove-based approaches do not have this disadvantage. Interfer-ence from the environment in which the tracking devices are placed, could alsoinfluence the recognition accuracy. The video stream from cameras could be dis-torted by high frequency signals or vibrating objects, for example. With mostglove-based approaches additional sensors are used to track the 3D position andorientation of the hand. These are often based on ultra-sonic or magnetic tech-nologies. Other ultra-sonic signals or metal surfaces from the environment couldrespectively interfere with the accuracy of these sensors.
Considering these advantages and disadvantages, a glove-based approach waschosen for this research. The main reasons for this are that datagloves providedirect measurement, no images need to be processed before the needed informa-tion is finally extracted. Additionally, datagloves provide the measurement ofthe hand posture without complex high-dimensional parameter reconstructionmethods. From the dataglove used, signals of each sensor were read through aRS-232 interface device and put in an array of integers. As the research pro-gressed, the discovery was made that further post-processing of the array ofintegers proved advantageous to the recognition rate. Refer to Section 5.2 formore details.
In this research a CyberTouchTM dataglove from CyberTouch Systems1 wasused. Figure 3.1 shows the version used in this thesis.
This glove has eighteen high-accuracy joint-angle measurement sensors. Theymeasure the flexion and abduction of the fingers and the wrist and thumb rota-tion. Unfortunately, because of wear and tear, two sensors have broken down.
1See http://www.cyberglovesystems.com/hardware/products/cybertouch.php. Last visited on Jan-uary 6, 2010.
27

Chapter 3 | Hand gesture data
Figure 3.1.: The CyberTouchTM dataglove, main unit and peripherals used.
The wrist yaw and the thumb rotation cannot be used in this research. Thewrist yaw measures the rotation of the wrist to the left or right with respectto the lower arm (see Figure 3.2a). Such rotation is found in a waving gesturefor example. It is not found in any of the gestures in this research. The thumbrotation sensor measures the thumb rotation of the metacarpal bone, see Figure3.2b for a description.
This rotation is found in the Select, Zoom in and Zoom out gestures when thethumb rotates from alongside to under the the index finger. Unfortunately, thiscould affect the recognition of the gestures, because without the thumb rotationthey are more difficult to discriminate. These classes needed to be closely ob-served in the corresponding experiments. A total of sixteen sensors have beenused. The glove also has 6 vibro-tactile actuators to provide feedback. However,these are not used in this research.
Considering the defined gestures, 3D position and orientation information is re-quired of the lower arm. Unfortunately, the dataglove does not provide suchinformation. Therefore the Flock Of Birds system2 from the Ascension Technol-ogy Corporation was used. This system is able to measure the 3D position andorientation of an object by attaching sensors to them. It consists of a StandardRange Transmitter (SRT) unit that sends out a pulsed DC magnetic field, oneore more Fast Bird Bus units and one or more Flock Of Birds sensors [2]. See
2See http://www.ascension-tech.com/realtime/RTflockofBIRDS.php. Last visited on January 6,2010.
28

Chapter 3 | Hand gesture data
(a) The wrist rotates around the yaw axis, a ro-tation which is not used in any of the de-fined gestures.
(b) The thumb metacarpal (and the otherthumb bones) rotates around the TR axiswith value jTR
Figure 3.2.: Explanations of the wrist yaw and thumb rotations taken from [40].
Figure 3.3 for the various components.
One sensor and a SRT connected to the FBB unit were used in this research.The dataglove has a special spot just below the wrist, where the Flock Of Birdssensor was attached. This way, the 3D position and orientation of the lowerarm were measured. The actual output given by the Flock Of Birds system wasconfigured to x, y, z position coordinates and x, y, z, w quaternion orientations.
3.2. Experiment setup
An experiment was designed to collect gesture samples of the nine classes ofgestures. In this experiment users were asked to make gestures using the data-glove and Flock Of Birds sensor. To simulate a real hand gesture environmentas much as possible, the experiment was held in one of the labs at the universitythat contained a large display surface. The display surface was generated by twoprojectors hanging from the ceiling next to each other. They projected on a wide,
29

Chapter 3 | Hand gesture data
Figure 3.3.: The Ascension Flock Of Birds system used.
white screen that was made of special projecting cloth. The resolution used was2560 pixels in width and 1024 pixels in height. The video signal came from twographics cards in a quad core PC. Both the dataglove and Flock Of Birds wereconnected to this PC via USB-to-serial converters. The Flock Of Birds sensorwas attached to the dataglove at the back of the wrist. Figure 3.4 shows thesetup of the experiment room.
30

Chapter 3 | Hand gesture data
Figure 3.4.: Layout of the recording experiment room. On the right the experiment wasexplained to participants. On the left, the gestures of the participant wererecorded and interpreted by the researcher.
The PC was running Windows XP and had 4 GB RAM. The data recording ap-plication was written in Java on top of the Squidy interaction library3. Squidy’sgoal is to provide a framework of extensions for integrating input devices, pro-cessing components (e.g. filters, 2D recognizers, etc.) and system actions, to easeresearch and development of novel interfaces. Squidy extensions were devel-oped for the dataglove and Flock Of Birds. Additionally, a data recorder and logeditor was developed to record and edit the gesture data. In a pipeline fashion,the dataglove and Flock Of Birds were connected to the log editor as input. Thelog editor was connected to the already existing Mouse I/O extension, so that theuser could control the cursor on screen. In between a Kalman filter extensionfiltered the data on hand jitter. See Figure 3.5 for a screenshot of the Squidysetup of the above extensions.
The user controlled two applications with the defined gesture set. The first ap-
3See http://www.squidy-lib.de. Last visited on August 27, 2010.
31

Chapter 3 | Hand gesture data
Figure 3.5.: Screenshot of Squidy pipeline for recording gesture data.
plication under control was the Firefox plugin CoolIris4, a 3D photo wall withwhich photos can be selected, dragged, zoomed, brought to full screen, etc. Avery interactive application suited for hand gesture interaction. With this ap-plication samples from the point, select+drag, maximise, demaximise, zoom inand zoom out gestures were collected. The second application was the card gamememory, which was uniquely developed for this experiment in Adobe Flash. Thegoal was to match movie posters from a top and bottom row by selecting them,swiping them up or down in the ‘memory machine’ at the centre of the screen,wait for result and swipe the machine clean to start over. With this applica-tion samples of the point, select, minimise, deminimise and close gestures werecollected.
The experiment was designed as a ‘Wizard of Oz’ experiment. In such an ex-periment a prototype system is developed, but without the actual automatedrecogniser module. That part is played by the ‘Wizard’, usually one of the re-
4See http://www.cooliris.com. Last visited on March 12, 2010.
32

Chapter 3 | Hand gesture data
searchers on the project. In general this type of experiment is commonly usedto research how users react to the possibilities of new technologies before theyare developed. In the field of gesture recognition it is common to collect data thisway for training a recogniser. To collect that data a researcher needs to interpretthe participant’s gestures during recording.
During the actual experiment, when a participant entered the room, the re-searcher explained the goal of the experiment and the gesture set to use. Theparticipant was assisted in putting on the glove, so it fits tightly. Afterwards,the Flock Of Birds sensor was attached to the dataglove at the back of the wrist.To align the sensor the participant was asked to stand near the magnetic fieldgenerator, so that the Flock Of Birds sensor was centred above it. This way, thecentre of the magnetic field corresponded with the center of the screen. Afterhaving a short practice with the gestures on the CoolIris application, the record-ing started. Participants were encouraged to explore the applications on theirown. Sometimes the researcher gave hints on what to do next if the participantdid not know how to proceed.
The researcher sat behind the desk on which the computer was located and hada screen for himself to control the recording process. Additionally, the researcherpushed the correct keys on his keyboard after he saw a participant make a ges-ture as those described in section 2.3. That was done according to the proto-col described in Appendix B. A crude segmentation and classification was alsoadded to the recording log file while pressing the keys. When the recording wascomplete, the participant was assisted in taking of the dataglove and Flock OfBirds sensor. Afterwards the participant was thanked and received a candy barof choice, as a small token of gratitude.
3.3. Data description
Data was recorded from a total of twenty-two participants. One of them is fe-male. One is Iranian, two are German and nineteen are Dutch. Three partici-pants are left-handed, which is notable because the dataglove is only made forthe right hand. The quality of the data of these participants could be degradedbecause they had to do the gestures with their right hand. Furthermore, twoparticipants are aged between 10-20, seventeen participants between 20-30 andthree between 30-40. Considering their current occupation, one is a BA student,two are Postdoc researchers, three are Bachelor students at a University of Ap-plied Sciences, four are Ph. D. students and twelve are MSc. students. Five
33

Chapter 3 | Hand gesture data
participants have no experience regarding hand gesture interfaces. One partici-pant has experience with conventional mouse gesturing and one has experiencewith 3D mouse gesturing. Two participants have experience with mid-air bi-manual laser-pointer gesture recognition and two have experience with mid-airhand gesturing through vision-based gesture recognition. Gesturing with theWii gaming console5 was experienced by Five participants. Fifteen have experi-ence with either multi-touch phones or screens or both. For the full details of allparticipants see Appendix C.
From the twenty-two participants available, the data of six Dutch, right-handed,male participants was segmented and labeled in the scheduled time (partici-pants no. 3, 4, 9, 15, 18 and 21 of Appendix C). Among them are one Ph. D.student, two Postdoc. researchers and three MSc. students. These were primar-ily selected because they gave the most usable and clear samples of every gesturewhich was determined after having reviewed a visualisation of the recorded ges-tures from all participants. This resulted in a total of 2034 gesture samples forthe nine classes. Table 3.1 shows the number of gesture samples per gestureclass.
Class Close Demax. Demin. Max. Min. Point Select Zoom in Zoom outSamples 120 88 115 154 139 851 462 57 58
Table 3.1.: Number of gesture samples per class.
With gesture sample, a sequence of feature values is meant. They were recordedat around 70 Hz. One feature value has twenty-three dimensions. It containsthree dimensions for the position feature, four dimensions for the orientationfeature and sixteen dimensions for the hand posture feature. Both the positionand orientation feature are in doubles and their range lies between [−1,+1]. Thehand posture feature is in integers in the range of [0, 255]. Figure 3.6 shows aplot of two close gesture samples from the same participant.
Notice the differences between the two samples although they are made by thesame participant. This could be an obstacle for a recogniser. Additionally, thedata from the sensors are in two completely different intervals. This could alsolead to poor recognition from a recogniser, because the recogniser might concen-trate on the more prevalent data. To prevent this, it is better to have all featuresin the same interval. Another aspect of the data that is notable is the length ofeach sample. All samples have different lengths. That concerns samples within
5See http://www.wii.com. Last visited on July 28, 2010.
34

Chapter 3 | Hand gesture data
0 10 20 30 40 50 60 70 80 90−0.8
−0.6
−0.4
−0.2
0
0.2
0.4
0.6
0.8
Position / orientation frames
Sen
sor
valu
es
(a) Position and orientation data of a Close ges-ture.
0 10 20 30 40 50 60 70 80 9020
40
60
80
100
120
140
160
180
200
Position / orientation frames
Sen
sor
valu
es
(b) Glove data of the Close gesture from 3.6a.
0 10 20 30 40 50 60 70 80 90−0.8
−0.6
−0.4
−0.2
0
0.2
0.4
0.6
0.8
Position / orientation frames
Sen
sor
valu
es
(c) Position and orientation data of a secondClose gesture.
0 10 20 30 40 50 60 70 80 9020
40
60
80
100
120
140
160
180
200
Position / orientation frames
Sen
sor
valu
es
(d) Glove data corresponding to the Close ges-ture of 3.6c.
Figure 3.6.: Plots of two samples of the close gesture. Both are from the same partici-pant. Figures 3.6a and 3.6c show the position and orientation data in theiroriginal [−1, 1] interval. Figures 3.6b and 3.6d show the glove data in theiroriginal [0, 255] interval.
classes, but also between classes. Since the patterns are practically scaled vari-ants of each other, it makes it harder for a recogniser to recognise.
35

Chapter 4Recognition technologies
Considering gesture interaction from a machine perspective, machines and morespecifically computers find themselves in a changing real-world environment.Changing in the sense that multiple users make gestures which the computerneeds to recognise. These users all gesture in a different way, no matter howsmall that difference is. Humans seem to have the almost ‘magical’ ability torecognise the meaning of gestures. Computers (or machines in general) do nothave this ability and need to learn the mapping between the input and the char-acteristics of gesture classes in order to recognise gestures. Amongst others thefield of Human Computer Interaction uses machine learning for this purpose [1].This way the computer that is in a changing environment is given the ability tolearn. The advantage of this ability is that the interaction designer need notforesee and provide solutions for all possible situations [1].
In this thesis’ case, the case of hand gesture recognition, the aim is to learn amapping between a certain kind of input and output. In this thesis, the inputis gesture data and the output the correct class of the gesture. Machine learn-ing has different categories of learning applications. For example, Associationlearning [92, § 3.4], Classification [7], Regression [16], Supervised / Unsuper-vised learning [25] and Reinforcement learning [85]. Considering these applica-tions the aim of hand gesture recognition in this thesis falls into the applicationof Supervised / Unsupervised learning. In supervised learning a mapping be-tween input and output is learned from supervised data [1]. That data containsthe correct values provided by a supervisor. The difference with unsupervisedlearning is that these correct values are not available, only the input data re-mains. Fortunately, that is not the case in this thesis. As described in section
36

Chapter 4 | Recognition technologies
3.3 the recorded input has been manually segmented and classified. With thisdata supervised learning techniques can be applied to learn the mapping be-tween input data and gesture classes. Many different supervised learning tech-niques exist [6]. Considering the purpose of this thesis is to recognise dynamicgestures not all of these techniques are suitable. Because of the dynamic naturethe techniques are required to handle data that changes over time. Additionally,a comparison was made between a traditional and more recent technique to seehow recent developments in recognition technologies affect hand gesture recog-nition in this thesis’ context. By these criteria Hidden Markov Models (HMMs)[13] were selected as the traditional technique and a more recent developmentis the technique of Latent-Dynamic Conditional Random Fields (LDCRFs) [57].
The above technologies are applied to develop and research a hand gesturerecogniser. To develop such a recogniser the common process of supervised learn-ing is applied. That process is briefly explained in this paragraph. After havingcreated the data set described in section 3.3 the data set is divided into a train-ing and test set. The gesture samples in the training set are used to train arecogniser according to the parameter settings specified. After the training iscomplete, the recogniser is tested on the gesture samples from the test set. Thisprovides an objective test, since the recogniser has not seen the gestures in thetest set. After all gestures from the test set have gone through the recogniser,the results in this research case are represented in the total recognition rateand a confusion matrix. The total recognition rate expresses the performanceof the recogniser in the percentage of correctly recognised gestures. The confu-sion matrix displays how many gestures are classified in the available gestureclasses. One row of the matrix specifies for that particular gesture how manyinstances of that gesture from the test set are classified (or misclassified for thatmatter) in the available classes. See Figure 4.1 for a visual representation of therecognition development process.
Split
Pre-process
Dataset
Training set
Settings
Train
Pre-processedtraining set
Test
Gesturerecogniser
Test set
Pre-processPre-processedtest set
Recognitionrate,
Confusionmatrix
Training setdependent pre-process settings
Figure 4.1.: The recogniser development process with all inputs and outputs.
37

Chapter 4 | Recognition technologies
The following sections in this chapter describe the principles of the appliedrecognition technologies, their characteristics and their parameters.
4.1. Hidden Markov Models
The theory behind HMMs was known for close to eighty years, but advancesin the optimisation of Markov chains in the mid 1960s [3] were the cause ofrenewed interest in HMMs [67]. From the beginning of the 1970s HMMs are ap-plied in different research fields ranging from speech recognition [22] to predict-ing financial variables [68] and from handwriting recognition [49] to nucleosomeposition prediction in bioinformatics [95]. HMMs have gained this popularity inall the different research fields because of their ability to take the temporal as-pects into account of data that changes over time. In the course of the last fourtyyears many variants of HMMs have been researched [31, 34, 58].
A HMM is a statistical model. HMMs recognise patterns which are learnedthrough observing sequences of a particular kind of data. It models a systemwhich is considered to be in one of a set of a particular number of states. The sys-tem modelled is assumed to be a Markov process. A process is a Markov processwhen it qualifies the criteria that the conditional probability distribution of fu-ture states of the process, given the present state and a constant number of paststates, depend only upon the present state. Additionally, in a HMM the statesof the system are hidden, not observable. With not observable is meant that thestate of the system is not known at any point in time [1, 67, 66]. Fortunately,observations, sequences of observations, O, are available that are generated bythose hidden states. From these observation sequences the optimal hidden statesequence, Q, could be inferred given the Hidden Markov Model, λ. Let us nowformally define the properties of a HMM. A HMM, λ, consists of a number ofhidden states S, and the properties A, B and Π. A = aij , the state transitiondistribution between states Si and Sj , B = bj(Ot), the observation probabilitydistribution of emitting observation Ot at stateSj and Π = πi, the probabilitythat state Si is the initial state [66]. Given a number of observation sequences,the following three basic problems for HMMs are of interest [66]:
1. Given the observation sequence O = O1O2...O3, and a model λ = (A,B,Π),how is P (O|λ), the probability of the observation sequence given the modelefficiently computed?
2. Given the observation sequence O = O1O2...O3, and the model λ, how isa corresponding state sequence Q = q1q2...qT chosen which is optimal in
38

Chapter 4 | Recognition technologies
some meaningful sense (i.e. best “explains” the observations)?3. How are the model parameters, λ = (A,B,Π) adjusted to maximise P (O|λ)?
This thesis is particularly interested in training a HMM from the observationsequences (i.e. gesture samples) recorded in the experiment of Chapter 3 (i.e.problem 3). In addition, recognising gestures from observation sequences giventhat model (i.e. problem 1) is also of interest.
Then, given an observation sequence, O, and a HMM λ = (A,B,Π) the first of thebasic HMM problems can now be solved. The observation sequence probability,P (O|λ), is determined by means of the forward procedure. In this procedure, theforward α is calculated as follows [13, 66]:
α1(i) = πibi(O1), 1 ≤ j ≤ N (4.1)
αt+1(i) =
N∑i=1
αt(i)aij
bj(Ot+1), 1 ≤ t ≤ T − 1; 1 ≤ j ≤ N (4.2)
In a similar way, a backward procedure exists in which the backward variableβ is calculated [13, 66]. However, this procedure is only required in solving thethird of the basic HMM problems. However, it is described here, because ofits similarity to the forward procedure. The backward variable is calculated asfollows:
βT (i) = 1, 1 ≤ j ≤ N (4.3)
βt(i) =
N∑j=1
aijbj(Ot+1)βt+1(j), t = T − 1, T − 2, ..., 1; 1 ≤ j ≤ N (4.4)
The calculation of the forward and backward variables often result in extremelysmall probabilities, going beyond the boundaries of machine calculation. There-fore, the forward and backward variables are scaled by a coefficient, c, keepingthe calculation within machine calculation boundaries [13, 66]. The scaling co-efficient is carefully determined in the following way:
ct =1∑N
i=1 αt(i)(4.5)
It is then simply applied to formulas 4.1, 4.2, 4.3 and 4.4.
39

Chapter 4 | Recognition technologies
The observation sequence probability, P (O|λ), is finally determined by:
P (O|λ) =
N∑i=1
αT (i) (4.6)
Before solving the third basic HMM problem a solution is needed to the secondproblem. To find the optimal state sequence associated with the given observa-tion sequence David et al. [13] and Rabiner [66] et al. introduce a new variable:
γt(i) = P (qt = Si|O, λ) (4.7)
The probability of being in state Siat time t, given the observation sequence O,and the model λ. It can be expressed in terms of the forward-backward variables:
γt(i) =αt(i)βt(i)∑N
i=1 αt(i)βt(i)(4.8)
The third basic HMM problem is to determine a method to adjust the modelparameters (A,B,Π) to maximise the probability of the observation sequencegiven the model. No analytical way exists to solve this problem. Therefore asolution is proposed that locally maximises P (O|λ) by an iterative procedure asthe Baum-Welch algorithm[13, 66]. This procedure introduces a new variable:
ξt(i, j) = P (qt = Si, qt+1 = Si|O, λ) (4.9)
The probability of being in state Sjat time t, and state Siat time t + 1, giventhe model and the observation sequence. ξt(i, j) can be written in terms of theforward-backward variables as follows:
ξt(i, j) =αt(i)aijbj(Ot+1)βt+1(j)∑N
i=1
∑N
j=1 αt(i)aijbj(Ot+1)βt+1(j)(4.10)
All required formulas are now defined to reestimate the A and Π HMM param-eters [13, 66]:
Π = πi = expected frequency in state Si at time (t = 1) = γ1(i) (4.11)
A = aij =expected number of transitions fromstate Si to state Sj
expected number of transitions fromstate Si=
∑T−1
t=1 ξt(i, j)∑T−1
t=1 γt(i)
(4.12)
40

Chapter 4 | Recognition technologies
Reestimating the B parameter depends on the observation density used. Sub-sections 4.1.1 and 4.1.2 define these for the discrete and continuous cases re-spectively.
To train a HMM, the number of hidden states needs to be defined. Hidden statestry to capture and model the substructure of a gesture. With substructure, im-portant and defining moments in a gesture is meant that largely discriminatea gesture. Hence, an important parameter, because varying the number of hid-den states varies the substructure model. A second important parameter is thehidden state architecture. The number of hidden states can be arranged in dif-ferent ways. They are connected like graphs in graph theory. Hidden states arethe nodes in a graph that are connected to each other by lines representing thetransitions. Two of the most common architectures used are the ergodic andleft-to-right ones. In the ergodic architecture every state is directly connected toevery other state, including itself (see Figure 4.2a).
S0 S1 S2 S4S3
(a)
S0 S1 S2 S4S3
t
t
(b)
Figure 4.2.: An example of the ergodic (4.2a) and left-to-right (4.2b) state architec-tures. Because of bidirectional transitions in Figure 4.2a the arrows arenot shown.
Left-to-right however applies an architecture in which the states are traversedin one direction (see Figure 4.2b). The underlying state sequence associatedwith the model has the property that as time increases either the state indexincreases or stays the same [66]. This is also called a BAKIS architecture. Theeffects the settings of these two parameters have on the recorded data set arestudied in this thesis. The final goal is to find the optimal settings for this dataset.
For every gesture class a HMM was trained. The nine HMMs were parallellyconnected as proposed by David et al. [13]. Figure 4.3 shows an example.
The start and end states (i.e. Sstart and Send) describe the equal circumstancesin which all the parallelly connected HMMs start and end. They are imaginaryand serve no special purpose. Recognising a gesture involves calculating the
41

Chapter 4 | Recognition technologies
................................
HMM 0
..................................................................
..........................................................................................
..................................................................
HMM 1
HMM n
Sstart Send
S0 S1 S2 Sn
S0
S0
Sn
Sn
Figure 4.3.: Example of the parallelly connected HMMs. The start and end states (i.e.Sstartand Send) connecting the HMMs are imaginary.
observation sequence probability in every HMM. The gesture is classified in theclass of the HMM that resulted in the highest probability.
In the comparison of recognition technologies two types of HMMs were included:Continuous HMMs (CHMMs) and Discrete HMMs (DHMMs). Both are trainedand tested by algorithms which differ slightly. To train and test the HMMs the‘gpdsHMM’ toolbox1 for MATLAB2 was used. This toolbox has algorithms totrain both CHMMs and DHMMs.
The following subsections describe the formal theory behind DHMMs and CHMMsand the parameters their implementations provides.
4.1.1. Discrete Hidden Markov Models
Discrete HMMs differ from Continuous HMMs in that they handle discrete ob-servations from a finite set of symbols. The continuous stream of data from thesensors is discretised in a finite set of symbols. The conventional way to discre-tise the continuous observation is by the process of Vector Quantization (VQ).VQ is a process in which all continuous observations are matched to a finite setof symbols, {vk}k=1,...,M where N denotes the size of that set. Then the observa-tion vector, Ot of the observation sequence, O = O1, O2...OT is obtained as follows
1See http://www.gpds.ulpgc.es/download/. Last visited on September 30, 2010.2See http://www.mathworks.com. Last visited on September 30, 2010.
42

Chapter 4 | Recognition technologies
[13]:∀m 6=k Ot = k ↔ d(xt, vk) < d(xt, vm) (4.13)
with k being the index of the symbol vk and d(xt, vk) being the distance betweenxt and vk.
David [13] proposes the use of the Linde, Buzo and Gray algorithm (LBG) [47]in combination with the k-Means algorithm to calculate a finite set of N symbolsfrom training data. A set of N symbols is calculated for each component in theobservation vector. They try to find the symbol set size and vectors in which theoverall distortion between the original observations and their quantisations isminimised. The proposed algorithm makes use of the ‘Initial guess by splitting’[47] in which M -level quantisers are considered with M = 2
R where R = 0, 1, ...,
and continues until an initial guess for an N -level quantiser with an acceptablelevel of distortion is achieved. The algorithm is as follows [87, § 2.2][47]:
1. Initialisation: Set M = 1 and calculate the centroid of this symbol forall observation vector components with all observation vectors from thetraining set.
2. Given the set of symbols containing M vectors {yi; i = 1, ...,M}‘split’ eachvector yi into two close vectors yi + ε where ε = 1 + randn(M) ∗ DF andDF is the Distance Factor defining the maximum percentage of distancebetween the symbols of the current set with M symbols and the new setwith 2M symbols.
3. If M = N , the initial guess for the N -level quantisation algorithm has beenachieved. Else if M < N run the k-Means algorithm for an M -level quan-tiser on the set of M symbols to minimise its Mean Square Error (MSE)and then return to step 2.
4. Run the k-Means algorithm for an N -level quantiser on the set of N sym-bols to minimise its MSE and then terminate.
k-Means is used to compute N centroids for the N symbols and iteratively up-dates the centroids given the training data. The k-Means algorithm is as follows[87, § 2.2]:
1. Initialisation: the N first training vectors are the centroid(0).2. Each added vector is assigned to the closest centroid(t) and the centroid(t+
1) are recalculated with the new vectors added.
43

Chapter 4 | Recognition technologies
3. The algorithm is terminated when:∑||centroid(t)− centroid(t+ 1)|| < threshold
or
iterationnumber > maxnumber of iterations
The default values of threshold and maxnumber of iterations are in the case ofthis thesis 0.005 and 10, respectively. These were taken from the toolbox [87] andnot modified in this research.
With the above algorithms, hard matching decisions are made. Which meansthat the information about how observations match other symbols is discarded.Because of the large variability between the incoming observations those obser-vations can be matched to such a displaced symbol in that this displacement isa source of misrecognition [13]. In an attempt to minimize that source of mis-recognition David et al. [13] propose the use of ’Multi-labeling’. The differencewith the conventional VQ method is that multi-labeling makes a soft decisionabout which symbol is closest to the incoming observation. Multi-labeling gen-erates an output vector which components indicate the relative closeness of eachsymbol to the incoming observation. So, the multi-labeling finite set of symbols,N , maps the training vector xt into an observable vector Ot =
{w(xt, vk)
}k=1,...,C
,which is calculated with:
w(xt,vk) =1/d(xt, vk)∑Cm=1 1/d(xt,vm)
(4.14)
Now that the discretisation process is defined, let us turn to solving the threebasic HMM problems for DHMMs.
The first basic HMM, given an observation sequence, O, and a DHMM λ =
(A,B,Π), is solved with the previously described Equations 4.1 through 4.6.However, this research uses a discrete observation distribution with multi-labelingand therefore bj(Ot) is determined by [13]:
bj(Ot) =c∑
k=1
w(xt, vk)bj(vk) (4.15)
In the implementation of the gpdsHMM toolbox, c, is defined as the L mostsignificant values of w(xt,vk) for each xt where L is lower than C, from Equa-tion 4.14. This reduces the computational load and makes the multi-labelling
44

Chapter 4 | Recognition technologies
approach to DHMMs more efficient [87, § 2.2.1]. The default value of c in thetoolbox is 1. According to David [13], good results were obtained with the valueof 1 for c (i.e. taking only the component of the closest symbol into account).
A solution to the second problem of finding the optimal state sequence associatedwith the given observation sequence is given by Equation 4.18.
The problem of (re)estimating the parameters of the DHMM, λ = (A,B,Π), thethird basic HMM problem, is solved by Equations 4.11 and 4.12 for Π and A afterhaving calculated ξ by Equation 4.10. However, B is (re)estimated differentlyconsidering the discrete, multi-labeled observation distribution:
bj(k) =
∑Tt=1 γt(j)w(xt, vk)∑T
t=1 γt(j)(4.16)
With the above Equations DHMMs can now be trained and tested.
In previous research on gesture recognition with DHMMs the effects of the threeparameters (i.e. number of states, architecture and number of symbols) havealso been studied. Unfortunately, most of this research includes gesture recog-nition using computer vision and only limited includes recognition using data-gloves. Although computer vision may employ a different kind of input method(usually one or two cameras), most of the features used are similar to thoseused from the dataglove. For this reason the results from previous researchalso including computer vision is used to guide initial parameter settings. Inthat research a four to ten state left-to-right architecture is mostly employed[97, 98, 72, 77, 78] However some approaches like Yamato et al. [96] utilize alarger number of hidden states (36). All approaches report above 90% recogni-tion rate. As mentioned previously, little research is available on HMM glove-based recognition, however, Lee et al. [44] describe an approach using a fivestate left-to-right model. Properties of the gesture recognition process are of-ten similar and whether to use an ergodic or left-to-right architecture and thenumber of states are often derived from an estimation of states which a gesturemaximally could have [77, 78]. Some estimate the number of states by lookingat the number of distinct features in the data [72]. Others just intuitively esti-mate a number of states and go from there [96, 97, 98]. All use these settings asinitial values and try to improve on them empirically. In this thesis most ges-tures change over time. Considering that and assuming the fact that a gesture issomehow always completed before starting another, a left-to-right architectureis more appropriate, because of its constraint that it can only move through the
45

Chapter 4 | Recognition technologies
state sequence in one direction. When estimating the complexity of the gesturesintuitively, the number of states the gestures need are estimated in the range oftwo to five states.
Next to these parameters the VQ process, unique to the DHMM, is guided bythe parameter specifying the size of the finite set of symbols, N . The effectsof this parameter were studied in this research. In previous research, Yamatoet al. [96] recognised six human motion categories using seventy-two symbolsand obtained 90.0% for user-dependent and 70.8% for user-independent recog-nition. Yang et al. [97] used 256 symbols in their recognition of digits drawnby following the path of the mouse. They obtained 99.78% recognition on auser-dependent isolated recognition task of nine gestures. Using fourty-eightsymbols, Yoon et al. [98] obtained 93.25% with recognising hand gestures usingtheir combination of weighted x-y-v features. Experiments with other features(e.g. location, angle and velocity) and combinations of these in different coordi-nate systems resulted in recognition from 41.79% to 92.96%. In those experi-ments the number of symbols ranged between two to fourty-eight. Consideringthese settings, the choice was made to use twenty symbols for the experimentsin which the data pre-processing methods were tested. To tune the number ofsymbols in the final DHMM, the same strategy was adopted as Mäntylä [52] inwhich the number of symbols is doubled from sixteen until 256. Further tuningby increments of two was applied to the interval which showed the best results(see Subsection 5.3.1).
4.1.2. Continuous Hidden Markov Models
Continuous HMMs are characterised by the way they handle continuous obser-vations. With Discrete HMMs, the symbols observed are quantified in a finiteset. For Continuous HMMs, the distribution of the emitted symbols is continu-ous. It is assumed that the general observation can be represented in this re-search by a finite mixture of Gaussians, M , also the mixture component. There-fore, in the continuous case, b(Ot) is defined as [13, 66]:
b(Ot) =
M∑m=1
cjmN (Ot, µjm, Ujm), 1 ≤ j ≤ N (4.17)
Then, given an observation sequence, O, and a CHMM λ = (A,B,Π) the first ofthe basic HMM problems is solved by Equations 4.1 through 4.5. The observa-tion sequence probability, P (O|λ), is determined by means of Equation 4.6.
46

Chapter 4 | Recognition technologies
The second basic HMM problem is solved by Equation 4.6, which for the contin-uous case is:
γt(i) =
[αt(i)βt(i)∑N
i=1 αt(i)βt(i)
][cikN (Ot, µjm, Ujm∑M
m=1 cikN (Ot, µjm, Ujm
](4.18)
A solution to the third basic HMM problem, (re)estimating the model parame-ters of a CHMM, is given by Equations 4.11 and 4.12 for the parameters Π andA. B is (re)estimated in the continuous case according to the Equation 4.17.The following are the reestimation formulas for the parameters of the mixtureof Gaussians (c and N (µ,U)) [13, 66]:
cjk =
∑T
t=1 γt(j, k)∑T
t=1
∑M
m=1 γt(j, k)(4.19)
µjk =
∑T
t=1 γt(j, k)Ot∑T
t=1 γt(j, k)(4.20)
Ujk =
∑T
t=1 γt(j, k)(Ot − µjk)(Ot − µjk)∑T
t=1 γt(j, k)(4.21)
Considering Equation 4.17 and the mixture of Gaussians reestimation Equa-tions 4.19, 4.20 and 4.21 it can be seen that the Gaussian mixture component,M , influences the modeling of the general observation. This changes the HMMsability to model the observation distribution, affecting its capability to recognisegestures. So, M is an additional parameter which needs to be tuned to opti-mise the recognition of gestures with CHMMs. Unfortunately, most of currentliterature on HMM hand gesture recognition uses DHMMs. For that reasonno previous values for the mixture of Gaussians parameter unique to CHMMswere available other than one or two or ‘more’ [35, 34]. Additionally, similar toDHMMs, the number of states and state architecture parameters also apply toCHMMs.
To study the effects of these parameters on the recognition rate and to find theoptimal settings, the method of testing as described in the introductory text ofthis chapter was used. These tests were run to test the combinations of parame-ter settings. Both the number of hidden states and the Gaussian mixture compo-nent were tested in the range of two to thirty with increments of two. Tests withcombinations of these parameters were run with the ergodic and left-to-rightstate architecture.
47

Chapter 4 | Recognition technologies
4.1.3. Numerical instability
During the initial HMM tuning experiments, columns in the confusion matriceswere observed which were completely zero. Numerical overflows appeared to bethe cause which occurred during the training of the HMMs. The training algo-rithms used were the versions of the Baum-Welch algorithm for Discrete andContinuous HMMs. As described in Rabiner’s tutorial on HMMs [66, SectionV. - A.] both versions make use of scaling factors to avoid numerical underflow.The factors are the normalisation values of the forward probabilities for everytimestep, t, per gesture instance. Both forward and backward probabilities arenormalised with these factors, so that they cancel each other out when reesti-mating the state transition probabilities.
The case with the data set recorded in this thesis was that it contained gestureinstances of more than 250 timesteps. Because of that length the multiplica-tions for calculating the forward and backward probabilities also grew. Withthis growth the forward and backward probabilities become extremely small. Asa consequence the scaling factors become extremely large, until they go beyondthe upper boundary of machine calculation. That is where the overflow errorsoccurred and the training process derailed.
In addition, there was dissatisfaction with the recognition obtained with thetraining runs free from overflows, because recognition rates with HMMs in othercontexts were consistently higher. Also, it was acknowledged that it could be be-cause of multiple causes (too little training data, use of other HMM variants, toolong observation sequences, etc.). However, the loss in precision was mainly be-lieved to be the biggest influence. Therefore the numerical stable HMM trainingmethod described by Mann [51] was implemented. Mann gives a detailed de-scription of an approach to deal with extremely small conditional probabilities.This approach entails working with the logarithms of those probabilities. Towork with logarithms, four Equations are defined (see Equations 1-10 in Mann[51]). These Equations are essentially standard logarithm operations extendedto correctly handle zero values. They must be handled, because events can havezero probability and taking the logarithm of zero is not a number. With thesefour basic Equations defined, the calculation of the forward (α), backward (β),gamma (γ) and epsilon (ε) probabilities were reimplemented according to algo-rithms five to nine in Mann [51] respectively. The reestimation of the initial state(π), state transition (A) and observation symbol probability distributions(B)
were reimplemented according to algorithms nine to eleven.
48

Chapter 4 | Recognition technologies
4.2. Latent-Dynamic Conditional Random Fields
In many classification problems involving sequential data a solution is researchedto predict a label for each frame. Additionally, these sequences of data are un-segmented having no marked beginning or end. Facing these problems in thearea of computer vision, Morency et al. [57] proposed a new visual gesturerecognition algorithm based on Conditional Random Fields (CRFs) [43]. TheirLatent-Dynamic Conditional Random Fields (LDCRFs) aims to provide a solu-tion for the problem of recognising individual classes of gestures and detectingthe beginning and end of such gestures in unsegmented sequences. The HMMsof Section 4.1 only aim to recognise individual classes of gestures. Without ex-tensions, the traditional HMM does not have the ability to detect the beginningand end of gestures in unsegmented sequences. This is particularly useful inreal-time recognition of hand gestures and also provides the ability to furtherimprove LDCRFs with unsegmented data once trained. As LDCRFs are basedon CRFs, they too are discriminative models. Discriminative models providea probabilistic model only for the target variables conditioned on the observedvariables. In this research that is a mapping between a sequence of observationsand a sequence of hand gesture labels. HMMs are generative models. Thesemodels provide a full probabilistic model for a joint probability distribution overobservation and label sequences. However, to optimally learn such a model,the observations are assumed to be conditionally independent from each other.The main advantage of discriminative models is that this assumption is relaxed.An assumption that is otherwise too restrictive for data distributions of manyclasses.
LDCRFs can capture both subgesture patterns and dynamics between gestureclasses, this is also termed intrinsic and extrinsic class dynamics respectively.“LDCRFs discover latent (i.e. hidden) structure that best differentiate visualgestures and distinguishes subtle motion patterns such as natural head nodsand eye gaze aversion” [55, 57]. In comparison with previous discriminativemodels like Conditional Random Fields (CRFs) [43], LDCRFs incorporate hiddenstate variables modeling the substructure of gestures where CRFs do not. CRFsonly model the transitions between gestures, thereby exclusively capturing theextrinsic dynamic. Hidden-state Conditional Random Fields (HCRFs) [65] arean extension to CRFs in which the use of hidden states was first introduced.Hence, LDCRFs combine the strengths of CRF and HCRF in capturing bothintrinsic substructure and extrinsic dynamics.
49

Chapter 4 | Recognition technologies
Equal to the task of Morency et al. [57], this thesis also wants to learn a map-ping between a sequence of observations and a sequence of labels. They give thefollowing definitions [57]. Let a sequence of observations be x = {x1, x2, ..., xm}and a sequence of labels y = {y1y2, ..., ym}. Each yj is a class label for the jth
observation frame of a hand gesture sequence and is a member of a set Y ofpossible class labels. Each observation frame is represented by a feature vectorφ(xj) ∈ Rd, in this thesis’ case, the 23 dimensional vector of 3D position, ori-entation and hand posture data. For each sequence a vector h = {h1h2, ..., hm}of “sub-structure” variables is also assumed. Not observed in the training ex-amples, they are the hidden variables in the model. Given these definitions, aLDCRF is defined (Equation 2 in [57]):
P (y|x, θ) =∑
h:∀hj∈Hyj
P (h|x, θ) (4.22)
where Hyj is a set of possible hidden states, hj , for the class label yj and H, theunion of all Hy sets. P (h|x, θ) is defined (Equation 3 in [57]):
P (h|x, θ) =1
Z(x, θ)exp
(∑k
θk · Fk(h, x)
)(4.23)
and the partition function, Z(x, θ), as:
Z(x, θ) =∑h
exp
(∑k
θk · Fk(h, x)
)(4.24)
and Fk, the feature function as:
Fk(h, x) =m∑j=1
fk(hj−1, hj , x, j) (4.25)
Each feature function is either a state function sk(hj , x, j) or a transition func-tion tk(hj−1, hj , x, j), where state functions, sk, depend on a single hidden vari-able, while transition functions, tk, depend on pairs of hidden variables [57].
To learn the model parameters, Morency et al. [57] follow the initial definingwork of CRFs [43]. The following objective function is used to learn the parame-ter θ∗ (Equation 4 in [57]):
L(θ) =n∑i=1
logP (yi|xi, θ)−1
2σ2||θ||2 (4.26)
50

Chapter 4 | Recognition technologies
where the first term is the conditional log-likelihood of the training data andthe second term the log of a Gaussian prior with variance σ2. Gradient as-cent with the Broyden–Fletcher–Goldfarb–Shanno (BFGS) optimisation tech-nique is proposed to search for the optimal parameter values under the criterion,θ∗ = argmaxθL(θ). The gradients of both objective functions with respect to theparameters, θk, associated to either state function, sk (see Equations five and sixin Morency et al. [57]), or transition function, tk, is shown to be computable inO(m) using belief propagation [57, 61]. The transition functions are defined onefor each hidden state pair (h
′, h′′) and are expressed as:
tk(hj−1, hj , x, j) =
1 if hj−1 = h′andhj = h
′′
0 otherwise
Weights, θk, associated with a transition for hidden states that are in the samesubset, Hyi , model the intrinsic dynamics (i.e. substructure patterns). Theweights associated with transition functions for hidden states from differentsubsets model the extrinsic dynamics (i.e. external dynamics between gestureclasses) [57]. The number of state functions, sk, are equal to the length of thefeature vector, φ(xj), times the number of possible hidden states, |H|. In this the-sis, a 23 dimensional feature vector is used with up to five number of states. Thetotal number of state functions in the model used in this research is 23×5 = 115.
Given a new test sequence, x, the most probable label sequence, y∗, is to beestimated that maximises the conditional model:
y∗ = argmax∑
h:∀hi∈Hyi
P (h|x, θ∗) (4.27)
where the parameter values, θ∗, are learned from training sequences. The fol-lowing algorithm is used [57]:
1. For all observation frames, j, from the observation sequence, y∗j
a) Compute the marginal probabilities P (hj = a|x, θ∗) for all possiblehidden states a ∈ H using belief propagation.
b) Sum the marginal probabilities according to the disjoint sets of hiddenstates Hyj into the log-likelihood for every gesture class.
2. Sum the log-likelihoods of all observation frames per gesture class.3. Determine the maximum log-likelihood summed in step 2 and assign the
associated label.
51

Chapter 4 | Recognition technologies
Just as with HMMs, computing the marginal probabilities (step 1a) for longobservation sequences consists of many probability multiplications. That maycause numerical instability. However, the implementation used in this researchsolved this by replacing the multiplications by additions of the logarithms of theprobabilities.
Since the introduction of LDCRFs in 2007 in the field of head gesture recognitionthey have also been applied in the fields of human action recognition [46] andspeech recognition [81]. The inference algorithms of LDCRFs have also beenfurther developed [82]. Besides these fields it seems that LDCRFs have notyet been applied in this thesis’ research context. Since LDCRFs have proven tooutperform traditional models in other, similar fields, results are promising forthis thesis’ research.
LDCRFs provide several parameters to tune it to the sequences modelled, ef-fecting the final recognition performance. Similar to the CRFs, LDCRFs havea regularisation parameter. Regularisation is used to remove overfitting of thedata by using a penalty on weight vectors whose influence in the total trainingprocess is too large [83]. Values for this parameter setting used in previous re-search [55, 57] have been 0.001, 0.01, 1, 10, 100, 1000, 10000 and 0. Like HCRFs,LDCRFs use a number of states to model the internal substructure of a gesture.Values used in previous research [55, 57] range from two to six hidden states.The third parameter is the window size. With this parameter the concatenationof feature vectors of multiple frames can be used to create the input feature usedduring training. For example, if the window size is one, only the feature vector ofthe current frame is used. If however, the window size is three, the input featureused is a concatenation of the feature vectors from three frames. Namely, thecurrent frame, the one preceding it and the future frame. Values of the windowsize ranged from 1 to 31 in previous experiments [55, 57]. The effects of theseparameters on the final recognition performance were studied in this thesis us-ing the described values of these three parameters as guidance. In those studiesthe HCRF library v1.3d3 of Morency et al. [57] was used.
3See http://sourceforge.net/projects/hcrf/. Last visited on October 5, 2010.
52

Chapter 5Experiments and results
This chapter describes the results of the experiments carried out with the aimto increase the recognition rate (i.e. the percentage of gestures recognised cor-rectly). Section 5.1 describes the results obtained with unprocessed data. Theresults obtained upon applying the pre-processing methods are described in Sec-tion 5.2. First the methods were applied one-by-one (Subsections 5.2.1 to 5.2.5)and subsequently various method combinations were investigated (Subsection5.2.6). The effects of tuning the recogniser parameters were also studied (Sec-tion 5.3). In the final section of this chapter the results of our tests on user-independent recognition are described.
5.1. Unprocessed data
To obtain a baseline, experiments were first performed on the unprocessed dataset. The following parameter settings were initially used to train the recognis-ers. For Continuous HMM (CHMM): four states, four Gaussians and left-to-rightarchitecture; for Discrete HMM (DHMM): four states, twenty symbols and left-to-right architecture; and for the Latent-Dynamic Conditional Random Field(LDCRF): one hidden state, a regularisation factor of 10 and a window size of0. All recognisers were trained using 75% of the data set. The remaining 25%was used as a test set. Each time a training was started the training and testsets were randomly chosen from the total data set. Three training / test runswere done for each setting. Table 5.1 shows the average recognition rates for thethree recognition technologies.
53
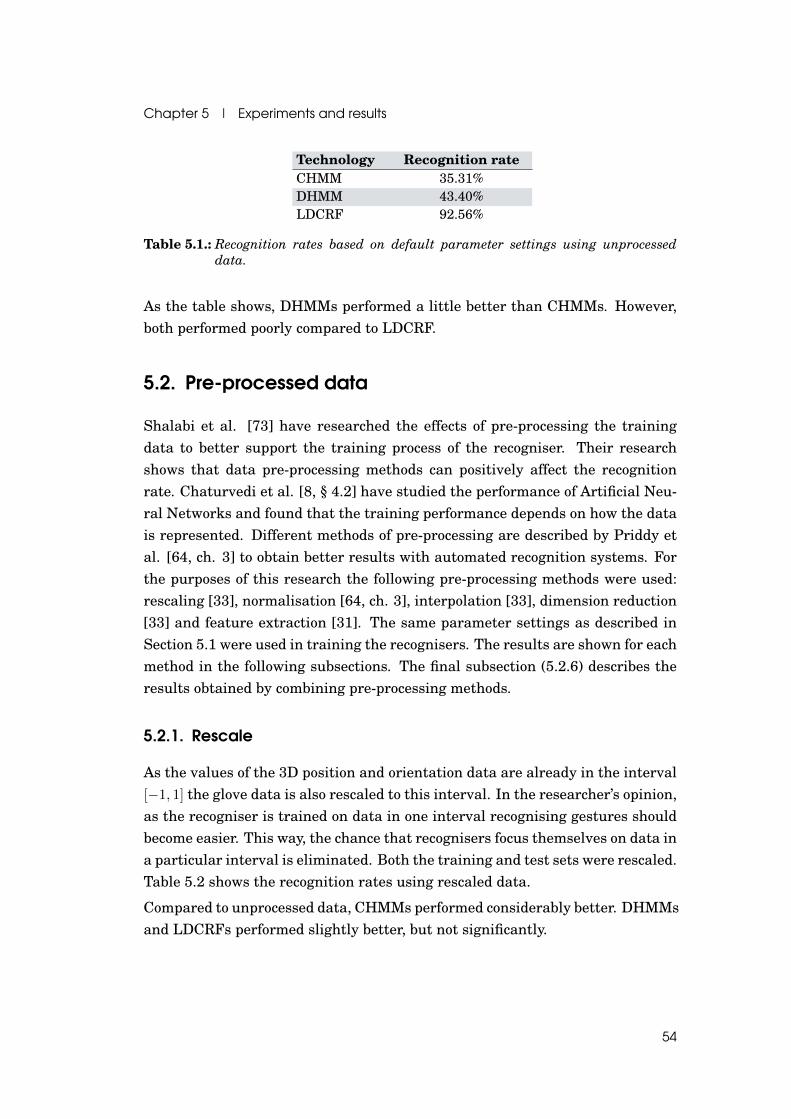
Chapter 5 | Experiments and results
Technology Recognition rateCHMM 35.31%DHMM 43.40%LDCRF 92.56%
Table 5.1.: Recognition rates based on default parameter settings using unprocesseddata.
As the table shows, DHMMs performed a little better than CHMMs. However,both performed poorly compared to LDCRF.
5.2. Pre-processed data
Shalabi et al. [73] have researched the effects of pre-processing the trainingdata to better support the training process of the recogniser. Their researchshows that data pre-processing methods can positively affect the recognitionrate. Chaturvedi et al. [8, § 4.2] have studied the performance of Artificial Neu-ral Networks and found that the training performance depends on how the datais represented. Different methods of pre-processing are described by Priddy etal. [64, ch. 3] to obtain better results with automated recognition systems. Forthe purposes of this research the following pre-processing methods were used:rescaling [33], normalisation [64, ch. 3], interpolation [33], dimension reduction[33] and feature extraction [31]. The same parameter settings as described inSection 5.1 were used in training the recognisers. The results are shown for eachmethod in the following subsections. The final subsection (5.2.6) describes theresults obtained by combining pre-processing methods.
5.2.1. Rescale
As the values of the 3D position and orientation data are already in the interval[−1, 1] the glove data is also rescaled to this interval. In the researcher’s opinion,as the recogniser is trained on data in one interval recognising gestures shouldbecome easier. This way, the chance that recognisers focus themselves on data ina particular interval is eliminated. Both the training and test sets were rescaled.Table 5.2 shows the recognition rates using rescaled data.
Compared to unprocessed data, CHMMs performed considerably better. DHMMsand LDCRFs performed slightly better, but not significantly.
54
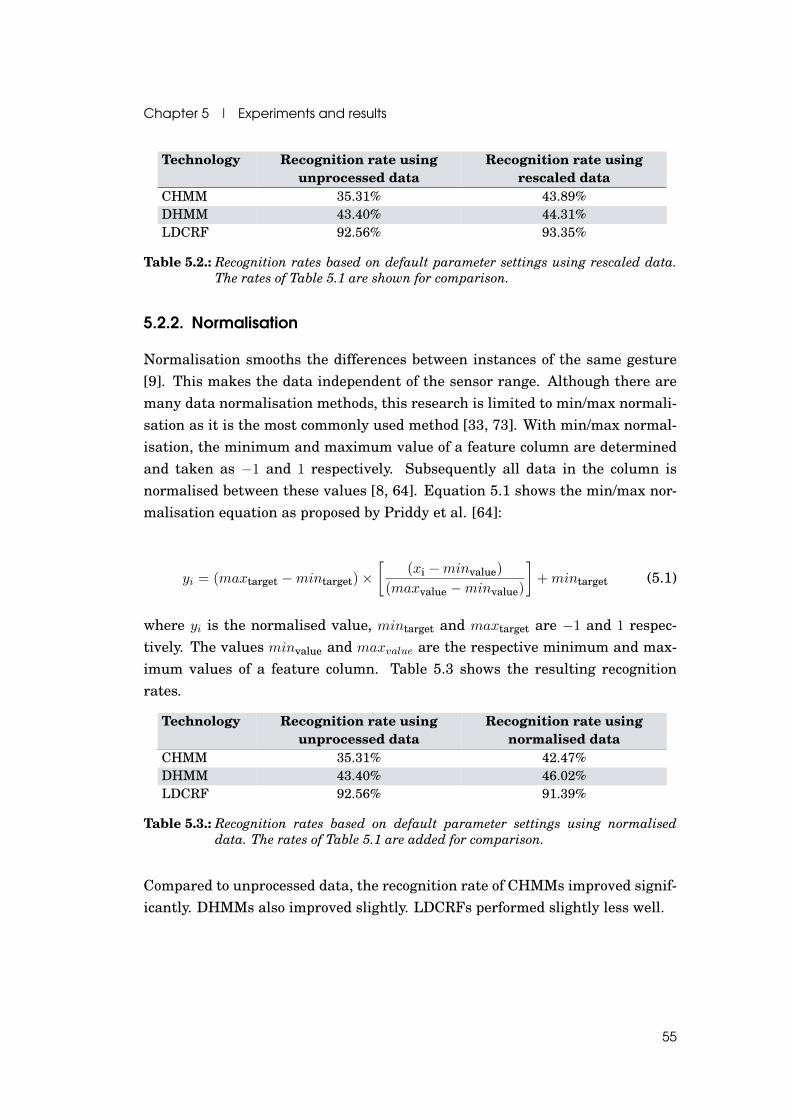
Chapter 5 | Experiments and results
Technology Recognition rate usingunprocessed data
Recognition rate usingrescaled data
CHMM 35.31% 43.89%DHMM 43.40% 44.31%LDCRF 92.56% 93.35%
Table 5.2.: Recognition rates based on default parameter settings using rescaled data.The rates of Table 5.1 are shown for comparison.
5.2.2. Normalisation
Normalisation smooths the differences between instances of the same gesture[9]. This makes the data independent of the sensor range. Although there aremany data normalisation methods, this research is limited to min/max normali-sation as it is the most commonly used method [33, 73]. With min/max normal-isation, the minimum and maximum value of a feature column are determinedand taken as −1 and 1 respectively. Subsequently all data in the column isnormalised between these values [8, 64]. Equation 5.1 shows the min/max nor-malisation equation as proposed by Priddy et al. [64]:
yi = (maxtarget −mintarget)×[
(xi −minvalue)
(maxvalue −minvalue)
]+mintarget (5.1)
where yi is the normalised value, mintarget and maxtarget are −1 and 1 respec-tively. The values minvalue and maxvalue are the respective minimum and max-imum values of a feature column. Table 5.3 shows the resulting recognitionrates.
Technology Recognition rate usingunprocessed data
Recognition rate usingnormalised data
CHMM 35.31% 42.47%DHMM 43.40% 46.02%LDCRF 92.56% 91.39%
Table 5.3.: Recognition rates based on default parameter settings using normaliseddata. The rates of Table 5.1 are added for comparison.
Compared to unprocessed data, the recognition rate of CHMMs improved signif-icantly. DHMMs also improved slightly. LDCRFs performed slightly less well.
55

Chapter 5 | Experiments and results
5.2.3. Interpolation
Gesture instances from the data set are of different lengths (i.e. the number ofsamples). For example, instances of the same gesture have similar patterns, butare ‘stretched-out versions’ of each other, as Figure 5.1 shows. This is a possiblesource of misrecognition for a recogniser.
0 20 40 60−1
−0.5
0
0.5
1
Dataglove frames
Sen
sor
valu
es
(a) An instance of the demaximise gesture.
0 20 40 60 80 100 120 140−1
−0.5
0
0.5
1
Dataglove frames
Sen
sor
valu
es
(b) Another, ‘stretched-out’ instance of the demaximise gesture.
Figure 5.1.: Examples of the demaximise gesture showing two different instances by thesame user. For reasons of clarity, only the glove data is shown.
Interpolation is used to ensure that gesture instances have the same length.This is done byeither reducing or increasing the length of a gesture to make itequal to the mean length of all gesture instances in the data set [33, 71]. Re-ducing the number of samples in a gesture is done by removing samples evenly
56

Chapter 5 | Experiments and results
distributed across the entire instance. Increasing the number of samples is doneby evenly adding samples between the existing ones through linear interpola-tion. Figure 5.2 shows the interpolated variants of the gestures from Figure 5.2.The patterns of the interpolated gestures are now more alike. The recognitionresults obtained using interpolation are shown in Table 5.4.
0 20 40 60 80 100 120−1
−0.5
0
0.5
1
Dataglove frames
Sen
sor
valu
es
(a) The interpolated variant of Figure 5.1a.
0 20 40 60 80 100 120−1
−0.5
0
0.5
1
Dataglove frames
Sen
sor
valu
es
(b) The interpolated variant of Figure 5.1b.
Figure 5.2.: Two interpolated instances of the demaximise gesture from the same user.
57

Chapter 5 | Experiments and results
Technology Recognition rate usingunprocessed data
Recognition rate usinginterpolated data
CHMM 35.31% 39.58%DHMM 43.40% 48.27%LDCRF 92.56% 90.61%
Table 5.4.: Recognition rates based on default parameter settings using interpolateddata. The rates of Table 5.1 are shown for comparison.
Compared to the experiments using unprocessed data, both CHMMs and DHMMsimproved considerably when interpolation was used. However, with LDCRFsthe recognition rate decreased slightly.
5.2.4. Dimension reduction through Principal Component Analysis
Training a recogniser becomes increasingly more complex as the number of di-mensions of the input vector (i.e. the variables to be measured) increases. Theinput feature vector has 23 dimensions as described in Chapter 3. A compari-son with previous research in glove-based hand gesture recognition shows thatthis is on the high side. Murakami et al. [59] use a sixteen-dimensional in-put vector to train an Artificial Neural Network for dynamic gesture recogni-tion. Jong-Sung et al. [37] also use sixteen-dimensional input for single-handedsign language recognition. Fewer features are also used in visual hand gesturerecognition. In order to recognise dynamic, bimanual gestures based on strokesShamaie et al. [74] track the x, y-velocities of both hands, resulting in a four-dimensional input vector to recognise bimanual dynamic gestures. Just et al.[31] applied three-dimensional position and difference features to the detectionof bimanual gestures. This resulted in a feature vector of six dimensions for asingle hand. The corresponding recognition rates lie between 70% and 99%.
One of the more commonly used techniques to reduce complexity is PrincipalComponent Analysis (PCA) [75, 64]. The goal of PCA is to reduce the dimensionsby showing how much information each feature from a given set of features con-tributes to the total. In other words, the features that have the largest varianceare the most descriptive for determining differences between data sets. Fea-tures that have little variance are removed, resulting in a reduced input featurevector.
In the experiments reduction was performed through PCA by calculating thepercentage of each feature’s variance in respect to the total. For the purposesof this research the threshold for removing a feature was set to 1.5% (i.e. if it
58

Chapter 5 | Experiments and results
contributes less than 1.5% to the total variance). This value was chosen becauseit proved to reduce a considerable amount of dimensions during initial experi-ments without losing too much variance. A PCA on unprocessed data shows thatthe 23 dimensions are reduced to eight, which still retain 95% variance. Figure5.3 shows a scree graph of the principal component variances. Such a plot oftenshows a clear separation between the fraction of total variance where the ‘mostimportant’ components cease and the ‘least important’ components begin. Such apoint is clearly seen between principal components one and two. However, prin-cipal component one only explains less than 50% of the total variance. Hence,more components were used in the reduction. The effects of this reduction onthe recognition rate are shown in Table 5.5.
1 2 3 4 5 6 7 80
10
20
30
40
50
60
70
80
90
Principal Component
Var
ianc
e E
xpla
ined
(%
)
0%
10%
20%
30%
40%
50%
60%
70%
80%
90%
Figure 5.3.: Scree graph of PCA on the data set with 23 dimensions. For each principalcomponent it is shown how much it explains the data (percentage of vari-ability). The solid line summates the percentage of variability across theprincipal component axis.
Technology Recognition rate usingunprocessed data
Recognition rate using datawith PCA applied
CHMM 35.31% 22.68%DHMM 43.40% 32.74%LDCRF 92.56% 84.34%
Table 5.5.: Recognition rates based on default parameter settings using data with fewerdimensions through PCA. The rates of Table 5.1 are shown for comparison.
59

Chapter 5 | Experiments and results
All three recognition technologies did not benefit from the dimension reduction.On the contrary, all recognition rates decreased significantly when compared tothe experiments using unprocessed data. This was unexpected because only aslittle as 5% of the variance from the total data set was removed as a consequenceof the dimension reduction. A possible explanation could be that the data wasnot in the same units prior to doing the PCA (the position / orientation data dif-fers from the glove data) [53]. Better results might be obtained by combiningthis method with rescale or min/max normalisation. In Section 5.2.6 on combin-ing pre-processing methods, the results of this experiment are described.
5.2.5. Adding the position difference feature
According to previous research [31, 36], using the difference between two posi-tions as a feature proved useful in recognising hand gestures. The aim in thisresearch is that this new feature adds significantly to the determination of dif-ferences between data sets. As a consequence, a significant positive effect onthe recognition rate should be observed. The difference in the 3D position databetween each consecutive sample was calculated and added at the end of the 23dimension feature vector. As described in the literature, the first observationvector of each observation sequence was discarded after having added the dif-ference feature of the first and second sample to the feature vector of the secondsample. The difference between the second and third sample was added to thethird, the difference between third and fourth to the fourth and so on. The dif-ference between two positions was multiplied by 100 to obtain values within thesame order of magnitude as those of the 3D position.
PCA was used to find out if the new feature added important information to thetotal feature vector. A comparison of the results of the PCA with those in Figure5.3 shows that the eight dimensions that contribute the most value in both caseswere not significantly different. In other words, the position difference featureis not of value in this recognition process. The results of the experiments shownin Table 5.6 confirmed this conclusion. The recognition rates remained virtuallythe same or decreased due to the added complexity of the extra dimensions.
60

Chapter 5 | Experiments and results
Technology Recognition rate usingunprocessed data
Recognition rate using datawith position difference
CHMM 35.31% 35.50%DHMM 43.40% 40.11%LDCRF 92.56% 90.02%
Table 5.6.: Recognition rates based on default parameter settings and with the extractedposition difference feature added to the feature vector. The rates of Table 5.1are shown for comparison.
5.2.6. Combined methods
The combination of pre-processing methods may lead to a greater improvementin recognition rates when compared to the individual methods. The previoussubsections showed that the rescale, normalisation and interpolation pre-processingmethods were effective with regard to recognition based on HMMs. The recogni-tion rates increased considerably when compared to the results obtained usingunprocessed data. However, the new position difference feature showed no effectand reducing the dimensions through PCA showed a decrease with regard to allrecognisers. With LDCRF only a slight increase was observed when rescalingwas applied to the data. The other methods either had no effect on the recogni-tion rate or decreased it.
Combinations involving PCA reduction, rescale and min/max normalisation arealso of interest because of the fact that PCA might give better results when alldata is in the same unit (as explained in Section 5.2.4).
Considering these facts, combining pre-processing methods is only useful for theHMM recognisers. Table 5.7 shows the pre-processing method combinations andthe resulting recognition rates.
61

Chapter 5 | Experiments and results
Combinations Recognitionrate CHMMs
Recognitionrate DHMMs
Recognitionrate LDCRFs
Rescale - Min/Max normalisation 42.60% 44.71% 91.00%
Rescale - PCA reduction41.55%(-6.84%)
42.60%(-6.81%)
84.93%(-6.76%)
Min/Max normalisation - PCAreduction
41.68%(-7.62%)
40.57%(-7.49%)
86.30%(-6.52%)
Min/Max normalisation -Interpolation
52.53% 54.14% N.A.
Rescale - Interpolation 52.66% 49.90% N.A.Rescale - Min/Max normalisation -PCA reduction
39.25%(-7.66%)
41.62%(-7.56%)
86.11%(-6.52%)
Rescale - Min/Max normalisation -Interpolation
56.08% 54.63% N.A.
Rescale - Min/Max normalisation -PCA reduction - Interpolation
53.78%(-7.61%)
54.44%(-7.58%)
N.A.
Table 5.7.: Recognition results using pre-processing method combinations. PCA reduc-tion removed 12 dimensions. The value in brackets indicates how much in-formation was lost in the process. N.A. indicates that the combination wasnot considered useful to be tested for the recogniser in question.
Comparison of the results of the method combination listed first 5.7 to those intables 5.2 (rescale only) and 5.3 (min/max normalisation only), shows that thereis no improvement. The recognition rates obtained using this method combi-nation are similar to those obtained using rescale and min/max normalisationrespectively. With regard to CHMMs this method combination performs slightlyless well (approximately 1%) when compared to the results using only rescale.With regard to DHMMs this method combination performs slightly less well(approximately 2%) when compared to the results using min/max normalisationonly.The second method combination listed, PCA reduction on rescaled data ensuresthat HMMs performs significantly better than PCA reduction on unprocesseddata (Table 5.5). The rate of CHMM recognition was increased by about 19%and for DHMMs by about 10%, but no significant effect was observed with re-gard to LDCRFs. This occurred with a minimal loss of variance (< 7%) and areduction of twelve dimensions.Combining min/max normalisation with PCA reduction had with regard to CHMMs,an equal effect on the recognition rate (19%), with regard to DHMMs a less pos-itive effect (~8%) and with regard to LDCRFs a positive effect (~2%) comparedto the previous method combination.
62

Chapter 5 | Experiments and results
The method combination listed in row four of the table shows considerable in-creases in the recognition rates of all but the LDCRFs recogniser.The combination of rescale and interpolation performs significantly better thanthe two separately. Wehn compared to rescale (Table 5.2) the recognition rateswere increased by approximately 9% and 6% for CHMMs and DHMMs respec-tively. When compared to interpolation (Table 5.4) the recognition rates wereincreased by about 13% and 2% for CHMMs and DHMMs respectively.Adding PCA reduction to the rescale and min/max normalisation method combi-nation (see sixth row of Table 5.7) had a negative effect on the recognition ratesof the HMMs. For both CHMMs and DHMMs the recognition rate decreasedby about 3%. The recognition rate of the LDCRFs was not significantly affected.When compared to PCA reduction on rescaled data, DHMMs performed less wellby approximately 1% and CHMMs also by about 2%.The rescale, min/max normalisation and interpolation method combination re-sulted in considerable increases in the recognition rates for both CHMMs andDHMMs. When compared to the rescale and min/max normalisation methodcombination the recognition rate increases were about 13% (CHMMs) and 9%(DHMMs) and when compared to the rescale and interpolation method combina-tion approximately 3% (CHMMs) and 4% (DHMMs). For CHMMs, this methodcombination also performed better by about 4% when compared to the min/maxnormalisation and interpolation method combination. DHMMs performed vir-tually the same.For the method combination listed in the last row PCA reduction was addedto rescale, min/max normalisation and interpolation. When compared to theprevious method combination, PCA reduction reduced 12 dimensions for bothCHMMs and DHMMs, but at the cost of about 2% in recognition for CHMMs andunder one percent for DHMMs. However, when compared to the other methodcombinations this method combination performed second best and has the ad-vantage of reducing complexity.
5.3. Choosing parameters
This section describes the results of the experiments in which the parameters ofall recognisers were tuned. First the Discrete HMMs were tuned, as describedin Subsection 5.3.1, then the Continuous HMMs (Subsection 5.3.2) and lastlythe Latent-Dynamic Conditional Random Fields (Subsection 5.3.3).
63

Chapter 5 | Experiments and results
5.3.1. Discrete HMMs
Combining the rescale, min/max normalisation and interpolation pre-processingmethods gave the best recognition results with regard to DHMMs (54.63%, Ta-ble 5.7). Because of the numerical instability described in Subsection 4.1.3the HMM training algorithms were reimplemented and the data was also nor-malised to the interval [0, 2]. The tuning experiments described in this subsec-tion were run on the renormalised data set with interpolation applied.
In Subsection 4.1.1 the number of symbols was described as an additional pa-rameter to the number of states. The results on finding the interval with thebest recognition rates are shown in Figure 5.4.
0 2 4 6 8 10 12 14 16 18 20 22 24 26 28 3040
42
44
46
48
50
52
54
56
58
Number of states
Rec
ogni
tion
rate
(%
)
16 symbols32 symbols
Figure 5.4.: Recognition rates per 16 and 32 number of symbols for each 2m states wherem = 1...15.
It shows two lines which represent the recognition rates of 16 and 32 symbols.The best recognition rates were obtained with 16 symbols. The highest being57.99% with 16 states. Because DHMMs with 32 symbols performed signifi-cantly worse than with 16 symbols, tests with a higher number of symbols werenot considered useful.
Through tuning in the range of 8 to 18 symbols the optimal settings for thenumber of symbols and states were obtained. Figure 5.5 shows the results. The
64

Chapter 5 | Experiments and results
setting of 26 states and 8 symbols gave the best result with a recognition rate of65.48%.
0 2 4 6 8 10 12 14 16 18 20 22 24 26 28 3043
45
47
49
51
53
55
57
59
61
63
65
67
69
Number of states
Rec
ogni
tion
rate
(%
)
8 symbols10 symbols12 symbols14 symbols16 symbols18 symbols
Figure 5.5.: Recognition rates of the final tuning experiments per 8 + 2n number of sym-bols for all 2m states where n = 0...4 and m = 1...15. Best recognition rate:65.48% (26 states, 8 symbols).
In Subsection 4.1.2 a third parameter for tuning was described: the hidden statearchitecture. Throughout the previous experiments the left-to-right architecturewas used because within a left-to-right algorithm the state number progressesas time progresses. Intuitively, this closely resembles the hand gesture process.More closely than with an ergodic architecture, as with this architecture it ispossible to jump back and forth from any state to any other state. Therefore,training the DHMMs with an ergodic architecture should intuitively result in alower recognition rate. The DHMMs was trained and tested with this architec-ture on the best state and symbol setting from Figure 5.5. The average recogni-tion rate after training and testing three times was 63.58%. Only slightly lowerthan with a left-to-right architecture, which is explained by the use of randomtraining and test sets.
65

Chapter 5 | Experiments and results
5.3.2. Continuous HMMs
For recognition with CHMMs the best combination of pre-processing methodswas: rescale, min/max normalisation and interpolation (56.08%, Table 5.7). Aswith DHMMs, the HMM training algorithms were reimplemented as describedin Subsection 4.1.3 and the data was also normalised to the interval [0, 2]. Thetuning experiments described in this subsection were run on the renormaliseddata set with interpolation applied.
The first tuning experiments were done to determine the most optimal parame-ter settings for CHMMs. Unfortunately, it was not possible to run experimentsas far as we wanted. Taking the logarithms of probabilities did make the train-ing of CHMMs numerically stable, but it also made it less efficient. Because theduration of an experiment multiplied by about three, it was only possible to runthe experiments for 2, 4, 6 and 8 Gaussians. Figure 5.6 shows the results.
0 2 4 6 8 10 12 14 16 18 20 22 24 26 28 30353739414345474951535557596163656769717375
Number of states
Rec
ogni
tion
rate
(%
)
2 gaussians4 gaussians6 gaussians8 gaussians
Figure 5.6.: CHMM recognition rates using logarithms of probabilities.
The best recognition rate in these experiments was obtained using 26 states and2 Gaussians: 70.22%.
Using these settings the effects of changing the state architecture parameterwere studied. All the results in this subsection were obtained with the left-to-right architecture. Three experiments were then run with the ergodic state
66
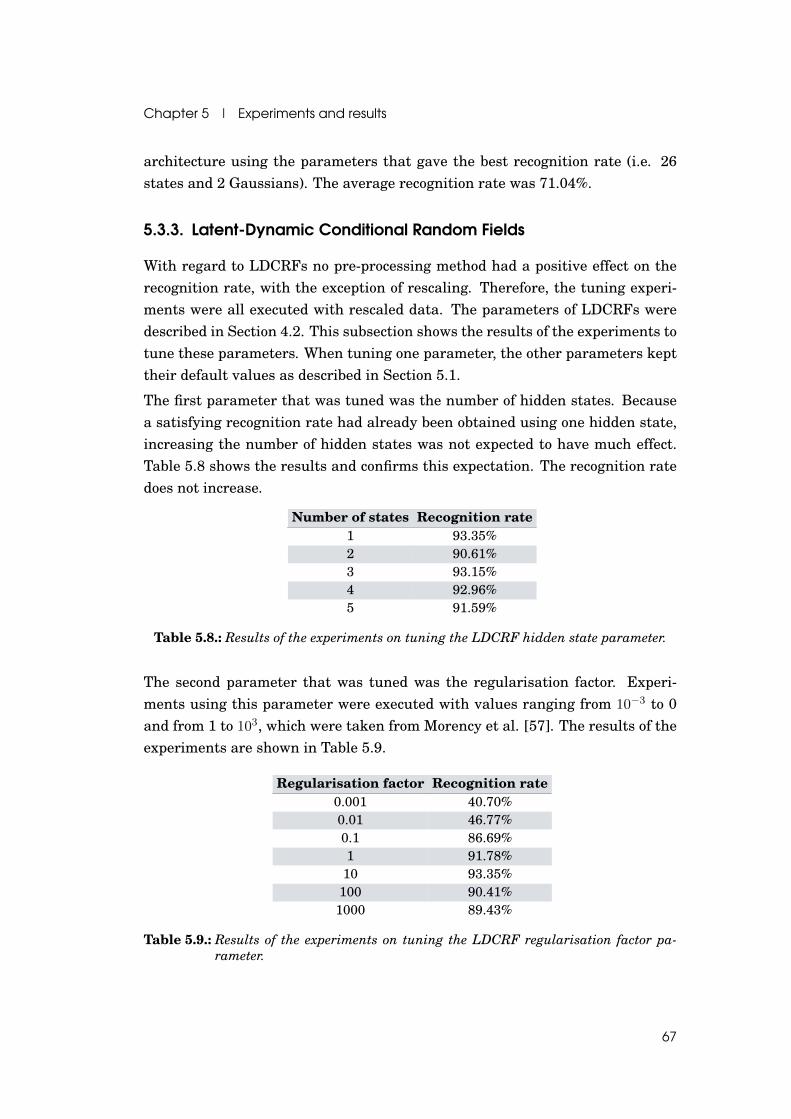
Chapter 5 | Experiments and results
architecture using the parameters that gave the best recognition rate (i.e. 26states and 2 Gaussians). The average recognition rate was 71.04%.
5.3.3. Latent-Dynamic Conditional Random Fields
With regard to LDCRFs no pre-processing method had a positive effect on therecognition rate, with the exception of rescaling. Therefore, the tuning experi-ments were all executed with rescaled data. The parameters of LDCRFs weredescribed in Section 4.2. This subsection shows the results of the experiments totune these parameters. When tuning one parameter, the other parameters kepttheir default values as described in Section 5.1.
The first parameter that was tuned was the number of hidden states. Becausea satisfying recognition rate had already been obtained using one hidden state,increasing the number of hidden states was not expected to have much effect.Table 5.8 shows the results and confirms this expectation. The recognition ratedoes not increase.
Number of states Recognition rate1 93.35%2 90.61%3 93.15%4 92.96%5 91.59%
Table 5.8.: Results of the experiments on tuning the LDCRF hidden state parameter.
The second parameter that was tuned was the regularisation factor. Experi-ments using this parameter were executed with values ranging from 10−3 to 0and from 1 to 103, which were taken from Morency et al. [57]. The results of theexperiments are shown in Table 5.9.
Regularisation factor Recognition rate0.001 40.70%0.01 46.77%0.1 86.69%1 91.78%10 93.35%
100 90.41%1000 89.43%
Table 5.9.: Results of the experiments on tuning the LDCRF regularisation factor pa-rameter.
67

Chapter 5 | Experiments and results
The recognition rate increased and reached its maximum in this table at a reg-ularisation factor of 10. It then seemed to decrease, but a higher maximumcould possibly be obtained by running experiments with a regularization factorbetween 1 and 100. However, this would require more timeconsuming tests, forwhich there was no time in the current research.
The last LDCRF parameter that was studied was the window size parameter.Table 5.10 shows the results.
Window size Recognition rate0 93.35%1 94.52%2 94.32%3 95.10%
Window size Recognition rate4 94.91%5 93.93%6 93.15%
Table 5.10.: Results of the experiments on tuning the LDCRF window size parameter.
It shows a slight upward trend in the recognition rate with a maximum at awindow size of 3 and it then shows a downward trend. Therefore, taking awindow size of 3 is for the purposes of this research the most beneficial to therecognition rate.
5.4. Quantity of available user data
To see how the quantity of available user data affects the performance, eight ex-periments were run. Only experiments with LDCRFs were run, considering thefact that the highest recognition rates were achieved with LDCRFs (see Section5.3). Table 5.11 shows the recognition rates for the increasing number of usersusing unprocessed data with untuned parameter settings. As the table shows,the increasing quantity of available user data has a significant positive effect onthe performance. After six users it seems that most of the variation in gestureshas been seen in this case, because the seventh and eighth user do not add tothe recognition rate.
Number of users Recognition rate1 85.19%2 86.41%3 90.03%4 90.41%
Number of users Recognition rate5 91.60%6 92.56%7 92.53%8 91.82%
Table 5.11.: The recognition rates of LDCRFs using an increasing quantity of user data.Rates are based on unprocessed data and using untuned parameter settings.
68

Chapter 5 | Experiments and results
5.5. User independence
The ultimate goal of this thesis is to achieve a recognition percentage that isusable for a large group of users. Because training data is not available from allpotential users, the recogniser should generalise over unseen users. It shouldsatisfactorily recognise gestures independent of its user. This section shows theresults that were obtained while testing our recogniser for user independence.Subsection 5.5.1 describes the method of testing used. Subsection 5.5.2 givesa description of the additional data that was prepared for the tests and 5.5.3shows the results of the tests.
5.5.1. Method
As subject for our tests the LDCRF recogniser was chosen because it performedthe best in the previous experiments. In the tests in the previous sections thetraining set contained randomly selected data of all users available. The test setcontained the remaining data of all users. In the tests in this section the trainingset contained all data from a particular number of users and the test set all dataof the remaining users. The difference being that the recogniser is now testedon users not seen during the training process at all. To create a more similarsetting to that of the tests in the previous sections, the LDCRF was trained onthe six already available users. As test set data from two additional users wassegmented and labelled (see Subsection 5.5.2). To research the user independentbehaviour of our recogniser, tests were executed with test sets containing thedata of user 1 and user 2 separately. Tests were also run in which User 1 wasadded to the training set and User 2 to the test set and vice versa. This way, theeffect of more training data on user independence was studied.
5.5.2. Data
Data of two additional users was cleaned and segmented for the user indepen-dence tests. Both users are male, between 20 to 25 years old and right-handed.User 1 has a bachelor’s degree in computer science and has some experiencewith gesture interfaces through the use of touch screens and the Wii gamingconsole. User 2 was doing his bachelor thesis in Art & Technology at the time ofrecording. He has additional experience with gesture interfaces through multi-touch surfaces. Table 5.12 shows the number of samples used in the tests forboth users.
69
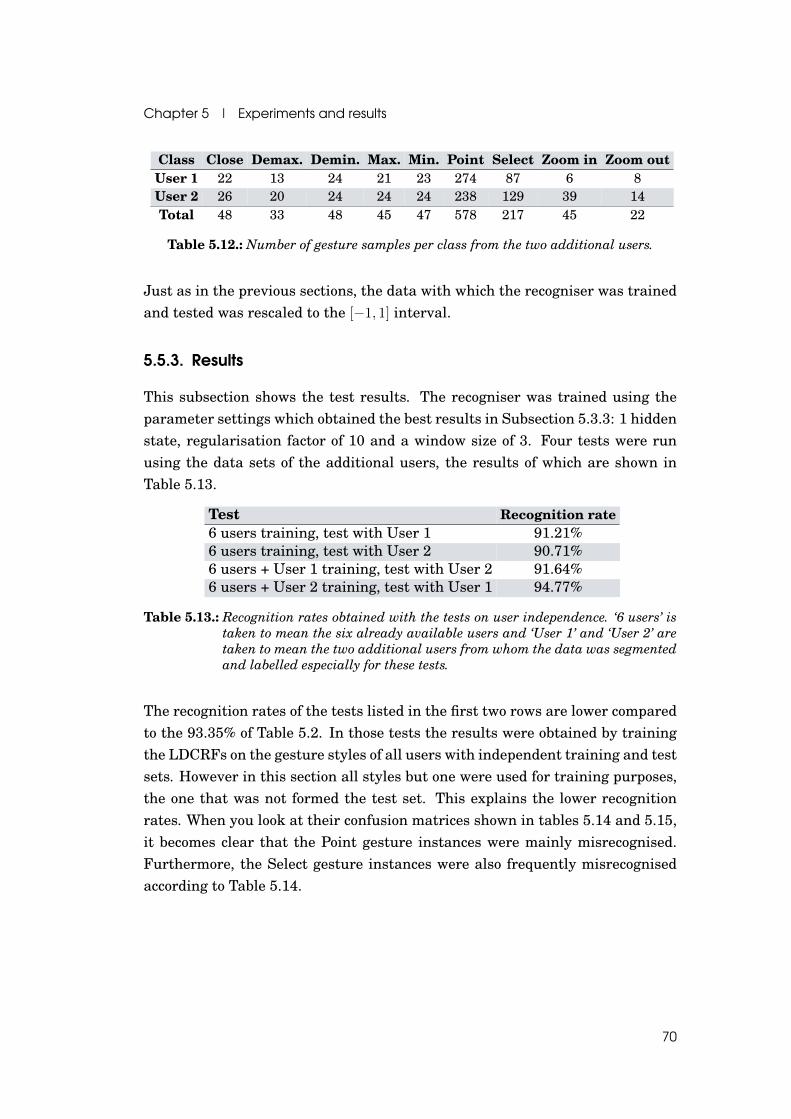
Chapter 5 | Experiments and results
Class Close Demax. Demin. Max. Min. Point Select Zoom in Zoom outUser 1 22 13 24 21 23 274 87 6 8User 2 26 20 24 24 24 238 129 39 14Total 48 33 48 45 47 578 217 45 22
Table 5.12.: Number of gesture samples per class from the two additional users.
Just as in the previous sections, the data with which the recogniser was trainedand tested was rescaled to the [−1, 1] interval.
5.5.3. Results
This subsection shows the test results. The recogniser was trained using theparameter settings which obtained the best results in Subsection 5.3.3: 1 hiddenstate, regularisation factor of 10 and a window size of 3. Four tests were runusing the data sets of the additional users, the results of which are shown inTable 5.13.
Test Recognition rate6 users training, test with User 1 91.21%6 users training, test with User 2 90.71%6 users + User 1 training, test with User 2 91.64%6 users + User 2 training, test with User 1 94.77%
Table 5.13.: Recognition rates obtained with the tests on user independence. ‘6 users’ istaken to mean the six already available users and ‘User 1’ and ‘User 2’ aretaken to mean the two additional users from whom the data was segmentedand labelled especially for these tests.
The recognition rates of the tests listed in the first two rows are lower comparedto the 93.35% of Table 5.2. In those tests the results were obtained by trainingthe LDCRFs on the gesture styles of all users with independent training and testsets. However in this section all styles but one were used for training purposes,the one that was not formed the test set. This explains the lower recognitionrates. When you look at their confusion matrices shown in tables 5.14 and 5.15,it becomes clear that the Point gesture instances were mainly misrecognised.Furthermore, the Select gesture instances were also frequently misrecognisedaccording to Table 5.14.
70

Chapter 5 | Experiments and results
Class Close Demax. Demin. Max. Min. Point Select Zoom in Zoom out Total1 21 0 0 0 1 0 0 0 0 222 1 12 0 0 0 0 0 0 0 133 0 0 24 0 0 0 0 0 0 244 0 0 0 21 0 0 0 0 0 215 0 0 0 0 23 0 0 0 0 236 0 0 0 0 0 251 10 2 11 2747 0 0 0 0 0 13 74 0 0 878 0 0 0 0 0 1 0 2 3 69 0 0 0 0 0 0 0 0 8 8
Table 5.14.: Confusion matrix of the results obtained using 6 users as training set andUser 1 as test set. Recognition rate: 91.21%
Class Close Demax. Demin. Max. Min. Point Select Zoom in Zoom out Total1 22 0 0 0 4 0 0 0 0 262 0 20 0 0 0 0 0 0 0 203 0 0 24 0 0 0 0 0 0 244 0 0 0 24 0 0 0 0 0 245 0 0 0 0 24 0 0 0 0 246 0 0 0 0 0 196 10 2 30 2387 0 0 0 0 0 0 129 0 0 1298 0 0 0 0 0 0 0 39 0 399 0 0 0 0 0 0 0 4 10 14
Table 5.15.: Confusion matrix of the results obtained using 6 users as training set andUser 2 as test set. Recognition rate: 90.71%.
The misrecognition in both tables is explained by the great difference in gesturestyle between the training and test users in combination with the definition ofthe gestures. The Point and Select gestures are similar to each other, becausea Select gesture starts and ends with a Point pose of the hand. Zoom in andout are similar because they only differ in the way the thumb and index fingermove (either toward or from each other). These similarities make it difficult fora recogniser to discriminate between either the Point or Select gestures and theZoom in or out gestures. In addition, Point gestures were also misrecognisedas Zoom in or out gestures. A possible explanation could be the fact that someof the Point instances looked similar to the starting pose of the Zoom gestures.This was however, not confirmed.
The results of the tests listed in the third and fourth row of Table 5.13 showan increase in recognition rate compared to the results listed in the first tworows. These increases are explained by a better recognition of the Point gesture
71

Chapter 5 | Experiments and results
as tables 5.16 and 5.17 show. However, the recognition of Zoom out gesturesdecreased slightly.
Class Close Demax. Demin. Max. Min. Point Select Zoom in Zoom out Total1 19 2 0 1 0 0 0 0 0 222 0 13 0 0 0 0 0 0 0 133 0 0 24 0 0 0 0 0 0 244 0 0 0 21 0 0 0 0 0 215 0 0 0 0 23 0 0 0 0 236 0 0 0 0 0 272 2 0 0 2747 0 0 0 0 0 14 73 0 0 878 0 0 0 0 0 0 0 5 1 69 0 0 0 0 0 0 0 5 3 8
Table 5.16.: Confusion matrix of the results obtained using 7 users as training set andUser 2 as test set. Recognition rate: 91.64%
Class Close Demax. Demin. Max. Min. Point Select Zoom in Zoom out Total1 24 0 0 0 2 0 0 0 0 262 0 20 0 0 0 0 0 0 0 203 0 0 24 0 0 0 0 0 0 244 0 1 0 23 0 0 0 0 0 245 0 0 0 0 24 0 0 0 0 246 0 0 0 0 0 202 5 6 25 2387 0 0 0 0 0 1 128 0 0 1298 0 0 0 0 0 0 0 39 0 399 0 0 0 0 0 0 0 5 9 14
Table 5.17.: Confusion matrix of the results obtained using 7 users as training set andUser 1 as test set. Recognition rate: 94.77%.
72

Chapter 6Conclusion
Considering the results from Chapter 5, let us first look at the initial researchquestions and answer them:
1. Can dynamic hand gestures be recognised independent of users?a) What technologies are suited for this purpose?
i. What effect does pre-processing the data set have on the perfor-mance?
ii. What effect does the tuning of parameters have on the perfor-mance?
iii. How does a traditional technology compare to a novel one?
iv. What effect does the quantity of available user data have on theperformance?
b) Can a recogniser be made user independent for a large group?
The main research question (1) is answered by this thesis as a whole. It detailsone approach to user-independent recognition of dynamic hand gestures using adataglove and a position and orientation sensor. The sensors recorded trainingdata in a Wizard of Oz experiment. The recorded data was manually segmentedand then used to train and test recognisers.
The effects of pre-processing on the performance varied per recogniser (1a, i).Both rescaling and min/max normalising the data to the [−1, 1] interval (Sub-sections 5.2.1 and 5.2.2) had a significant positive effect on the recognition rateof CHMMs, because both pre-processing methods improved the visibility of thepatterns in the data. DHMMs and LDCRFs were not significantly affected bythese two methods. For DHMMs this could be due to the vector quantisation
73
Chapter 6 | Conclusion
process that minimises the effects prior to the actual training. For LDCRFs itcould be that these two methods did not make the distinct differences betweengesture classes stand out compared to the other data.Interpolating the data had a large positive effect on both HMMs (see Subsection5.2.3). Gestures within a class were more alike in the case of HMMs when thegesture instances were interpolated to the same length. For LDCRFs, interpo-lation could possibly have removed discriminating features, which could explainthe small negative effect.Dimension reduction through Principal Component Analysis (PCA) when ap-plied to unprocessed data had a significant negative effect on all recognisers(see Subsection 5.2.4). After applying it to standardised data it still had a neg-ative effect, albeit a smaller one. It is possible that PCA removed importantdimensions which all recognisers used to discriminate gestures. However, a con-siderable reduction in training time was observed.The introduction of the position difference feature (see Subsection 5.2.5) had nosignificant effect on the recognition with CHMMs and LDCRFs. This can beexplained by comparing the PCA of the data with this feature to the PCA ofthe data without this feature (Figure 5.3). The comparison showed no signifi-cant increase in the variance of the principal components. The negative effecton DHMMs could possibly be explained by the added complexity to the vectorquantisation process due to the extra dimensions.With regard to the pre-processing methods, it can be concluded that the methodcombination of rescale, min/max normalisation and interpolation gave the bestresults for both HMM technologies (CHMM: 56.08%, DHMM: 54.63%, Table 5.7).For LDCRFs rescaling on its own gave the best results (93.35%, Table 5.2).
The effects of tuning the recogniser parameters were generally beneficial to therecognition rate (1a, ii). The numerical overflows encountered during tuningwere solved with a numerically stable reimplementation of the HMM algorithms(see Subsection 4.1.3). DHMMs were modelled best with 8 symbols, 26 statesand the left-to-right architecture (see Subsection 5.3.1). CHMMs were modelledbest with 2 Gaussians, 26 states and again the left-to-right architecture (seeSubsection 5.3.2). With a larger number of symbols and Gaussians, the increasein recognition rate levelled off sooner as the number of states increased. Forboth HMMs the number of states were equal. This confirmed that the internalsubstructure of the gestures had been found, despite the low recognition rates.LDCRFs performed best with 1 hidden state, a regularisation factor of 10 anda window size of 3. The hidden state parameter had no significant effect on the
74

Chapter 6 | Conclusion
recognition rate (see Table 5.8). The question is whether LDCRFs can find anyinternal substructure within the gestures. The regularisation factor improvedthe recognition rate in an asymptotic manner (see Table 5.9). The window sizeparameter improved the recognition rate slightly when varied from 0 to 3 (seeTable 5.10).
The traditional CHMM and DHMM technologies do not compare to LDCRFs inthis case (1a, iii). From the beginning LDCRFs have significantly outperformedboth CHMMs and DHMMs. Having applied pre-processing methods and tunedthe recogniser parameters, LDCRFs still outperformed both, providing satis-factory recognition rates (>=93.35%), whereas CHMMs (70.22%) and DHMMs(66.10%) did not. Unfortunately, this could not be explained, but it is assumedthat the different nature of the models is what is causing this, as HMM is gen-erative and LDCRF in contrast is discriminative. The advantage of the latter isthat it does not aim to fully model a data distribution, which is more complex.While comparing the traditional technologies it was found that CHMMs outper-formed DHMMs by about 5%, most likely because the DHMMs discretise thecontinuous observations during which important information is lost.
With LDCRFs experiments were run to study the effect of the quantity of userdata on the performance (1a, iv). It can be concluded that a larger quantity ofuser data can have a positive effect on the performance. However, the experi-ments also indicate that there is probably a point where adding new data doesnot outweigh the cost of training.
In almost all user-independence tests, LDCRFs achieved satisfactory recogni-tion rates of over 91%. Although these results were achieved with test sets ofonly two users, the researcher is confident that LDCRFs are suitable for user-independent dynamic gesture recognition (1b).
In the course of this research into recognising user-independent dynamic handgestures many aspects relating to the technology behind the recognisers werediscovered. For example, how data pre-processing and parameter tuning af-fect them. Knowledge was gained on how to apply certain technologies to bestachieve the goal. However, there is more to hand gesture interaction. Issuesincluding how users will receive such a technology and if and how they willuse it in completing their tasks have not been studied. The approach used pro-vided over 91% recognition independent of users, which means that about 1 in10 user gestures is not recognised correctly. The recognition of a particular ges-ture is often connected to a certain interface action, which when applied to thisresearch means that an unintended interface action is executed with every mis-
75
Chapter 6 | Conclusion
recognition. This could be disastrous when, for example, important informationis thereby accidentally deleted. To prevent such misrecognitions, variants oflikelihood thresholding are proposed by [45, 34]. Zobl et al. [100] propose usingconfidence measures. In addition, human errors could also be made (i.e. makingthe wrong gesture for a certain action). It would be interesting to find out ifusers could easily recover from such errors and how. Another question that isof interest is whether 91% recognition of gestures suffices for usable interfaceinteraction. Do users mind remaking 1 in 10 gestures, for example? Both theseissues and the technological aspect of gesture recognition are important.
This research has only studied hand gesture interaction in part. Nevertheless,it can be concluded that the recognition of user-independent dynamic hand ges-tures as described in this thesis is not only feasible, but it can without a doubtalso play an effective role in the successful realisation of hand gesture interac-tion.
76

Chapter 7Future research
This research has answered the question whether the user-independent recog-nition of dynamic hand gestures is feasible. One of the recognition technologiesthat was applied has shown satisfying results. The following paragraphs de-scribe several ideas for future research.
Continuous Hidden Markov Models (CHMMs) and Discrete Hidden Markov Mod-els (DHMMs) performed poorly in the tests when compared to Latent-DynamicConditional Random Fields (LDCRFs). This was unexpected considering thefact that previous research had shown higher recognition rates [98, 34]. Thetraining and test data were taken as a starting point in order to try and find anexplanation. Since numerical overflow was experienced even when scaling wasapplied, it is possible that the observation sequences were too long. In addition,our data was recorded at a frame rate of 70 fps. Vision-based recognition com-monly employs a frame rate of only 30 fps. The observation sequences used inthis research are thus 2.33 times longer. Future research could resample thedata set to 30 fps and study the recognition rate with shorter observation se-quences. Another explanation can be found in the fact that the same parametersettings were used for each gesture class. Given that the gestures are not thesame, a different number of states, Gaussians or symbols per gesture could pos-sibly give a better fit on the data. Future research could provide insight intothe effect varying the parameter settings depending on gesture class has on therecognition rate. The state architecture parameter could possibly increase theperformance of the HMMs. A left-to-right hidden state architecture was usedwith only two transitions. Adding transitions between more states could pos-sibly improve the recognition rate, because the HMM can then ‘skip’ states, if
77

Chapter 7 | Future research
dealing with a short gesture.Even though benchmark tests for the DHMM algorithms used had shown thatthe extension of multi-labelling improved recognition, this might not be the casefor the real-world context of this research. In future research this could be testedusing DHMM algorithms without the extension.
Before expanding this research with LDCRFs to new topics, future researchshould first study why varying the hidden state parameter had no significanteffect on the recognition rate. By running the same tests with the ‘ancestral’CRF and HCRF algorithms it would become clear whether the extensions of LD-CRF add to the recognition of gestures. Furthermore more tests could be donewith regard to user independence. By employing cross validation tests on thecurrent data set the claims on user independence could be reinforced.More gesture data was recorded than was used in the end. This data could possi-bly still be used in training the LDCRFs for unseen variation among the gestureclasses. To find out if this data contributes to the variation, future researchcould establish a method for determining whether a new data set contains un-seen variation. This method could provide a measure for making the decision toadd data from an unseen user for later offline retraining.During this research the HMM algorithms used were adapted for parallel pro-cessing, which greatly reduced the training time on multicore commodity PCs.Future research could study the potential of parallel processing in general. Inaddition, the HCRF library could also be adapted for parallel processing. Ad-vances have also been made in the use of the chips of graphic cards (GPU) forintensive parallel calculations1. GPUs are optimised for multiplication opera-tions for fast 3D graphics rendering. That optimisation could potentially be ofuse in this research, because the training algorithms also rely heavily on multi-plication operations. By using the GPU the CPU could be offloaded to do othertasks.One of the directions in which to expand this research with LDCRFs is the devel-opment of a real-time recognition system. In the long run such a system couldbe used to design a hand gesture interface. One of the most important topicsthat would need to be covered for such a system is the automatic segmenta-tion of gestures from a continuous data stream. LDCRFs are also suited to thistask, because they model both the dynamics within and between gesture classes[57]. They classify each observation in a sequence of observations, which gives astarting point for discriminating the beginning and end of a gesture in a stream.
1See http://gp-you.org. Last visited on October 5, 2010.
78

Chapter 7 | Future research
As the above paragraphs show, there are still many avenues to explore. However,with this thesis, a firm foundation for future research further exploring theseavenues has been laid.
79

Bibliography
[1] E. Alpaydin. Introduction to Machine Learning. The MIT Press, MA, USA, 1stedition, 2004.
[2] Ascension Technology Corporation, Burlington, VT, USA. The Flock of BirdsInstallation and Operation Guide, March 2004. Version 910002-A Rev C. Lastretrieved on July 27, 2010 from ftp://ftp.ascension-tech.com/MANUALS/
Flock_of_Birds_Manual-RevC.pdf.
[3] L.E. Baum and T. Petrie. Statistical inference for probabilistic functions of fintestate Markov chains. Annals of Mathematical Statistics, 37(6):1554–1563, 1966.
[4] R. A. Bolt. “Put-that-there”: Voice and gesture at the graphics interface. In SIG-GRAPH ’80: Proceedings of the 7th annual conference on Computer graphics andinteractive techniques, pages 262–270, New York, NY, USA, 1980. ACM.
[5] W. Buxton. A three-state model of graphical input. In INTERACT ’90: Proceed-ings of the IFIP TC13 Third Interational Conference on Human-Computer Inter-action, pages 449–456, Amsterdam, The Netherlands, 1990. North-Holland Pub-lishing Co.
[6] R. Caruana and A. Niculescu-Mizil. An empirical comparison of supervised learn-ing algorithms. In ICML ’06: Proceedings of the 23rd international conference onMachine learning, pages 161–168, New York, NY, USA, 2006. ACM.
[7] S. Casale, A. Russo, G. Scebba, and S. Serrano. Speech Emotion ClassificationUsing Machine Learning Algorithms. In ICSC ’08: Proceedings of the 2008 IEEEInternational Conference on Semantic Computing, pages 158–165, Washington,DC, USA, 2008. IEEE Computer Society.
[8] D. K. Chaturvedi. Soft Computing: Techniques and its Applications in ElectricalEngineering. Springer Verlag, Heidelberg, Germany, 2008.
[9] Y. Chen, W. Gao, and M.A. Jiyong. Hand Gesture Recognition Based on DecisionTree. In Proceedings of the International Symposium on Chinese Spoken Lan-guage Processing. International Speech Communication Association, 2000.
[10] K. Cheng. Direct interaction with large displays through monocular computer
80

Bibliography
vision. PhD thesis, University of Sydney, Sydney, Australia, October 2008. Lastretrieved on October 13, 2010 from http://hdl.handle.net/2123/5331.
[11] R. Cutler and M. Turk. View-based Interpretation of Real-time Optical Flow forGesture Recognition. In Proceedings of IEEE International Conference on Auto-matic Face and Gesture Recognition, pages 416–421, 1998.
[12] N. Dahlbäck, A. Jönsson, and L. Ahrenberg. Wizard of Oz studies: why and how.In IUI ’93: Proceedings of the 1st international conference on Intelligent user in-terfaces, pages 193–200, New York, NY, USA, 1993. ACM.
[13] S. David, M.A. Ferrer, C.M. Travieso, and J.B. Alonso. gpdsHMM: a hiddenMarkov model toolbox in the Matlab environment. In Complex Systems In-telligence and Modern Technological, pages 476–479, Cherbourg, France, 2004.Société de l’Electricité, de l’Electronique et des Technologies de l’Informationet de la Communication (SEE). Last retrieved on July 18, 2010 from http:
//www.gpds.ulpgc.es/download/toolbox/gpdshmm/gpdsHMM_vf.pdf.
[14] K.H. Davies, R. Biddulph, and S. Balashek. Automatic Speech Recognition ofSpoken Digits. Journal of the Acoustic Society of America, 24(6):637–642, 1952.
[15] W. de Leeuw, P. Verschure, and R. van Liere. Visualization and Analysis of LargeData Collections: a Case Study Applied to Confocal Microscopy Data. IEEETransactions on Visualization and Computer Graphics, 12(5):1251–1258, 2006.
[16] O. Dekel, F. Fischer, and A. D. Procaccia. Incentive compatible regression learn-ing. In SODA ’08: Proceedings of the nineteenth annual ACM-SIAM symposiumon Discrete algorithms, pages 884–893, Philadelphia, PA, USA, 2008. Society forIndustrial and Applied Mathematics.
[17] D. Demirdjian, T. Ko, and T. Darrell. Untethered gesture acquisition and recogni-tion for virtual world manipulation. Virtual Reality, 8(4):222–230, 2005.
[18] P. Dietz and D. Leigh. DiamondTouch: a multi-user touch technology. In UIST’01: Proceedings of the 14th annual ACM symposium on User interface softwareand technology, pages 219–226, New York, NY, USA, 2001. ACM.
[19] M. Elmezain, A. Al-Hamadi, J. Appenrodt, and B. Michaelis. A Hidden MarkovModel-based continuous gesture recognition system for hand motion trajectory.In ICPR 2008: 19th International Conference on Pattern Recognition, pages 1–4,December 2008.
[20] F. W. Fikkert. Gesture Interaction at a Distance. PhD thesis, Universiteit Twente,Enschede, The Netherlands, March 2010. Last retrieved on July 14, 2010 fromhttp://eprints.eemcs.utwente.nl/17507/.
[21] F. W. Fikkert, P. van der Vet, H. Rauwerda, T. Breit, and A. Nijholt. Gesturesto Intuitively Control Large Displays. pages 199–204. Springer Verlag, Berlin,Germany, 2009.
[22] M. Gales and S. Young. The application of hidden Markov models in speech recog-
81

Bibliography
nition. In Foundation and Trends in Signal Processing, volume 1. now PublishersInc., Hanover, MA, USA, 2008.
[23] M. Ganzeboom. How hand gestures are recognized using a dataglove. Lastretrieved on July 16, 2010 from http://hmi.ewi.utwente.nl/verslagen/
capita-selecta/CS-Ganzeboom-Mario-3.pdf, 2009.
[24] S. P. Gill and J. Borchers. Knowledge in co-action: social intelligence in collabora-tive design activity. AI & Society, 17:322–339, 2003.
[25] M. Goudbeek, A. Cutler, and R. Smits. Supervised and unsupervised learningof multidimensionally varying non-native speech categories. Speech Communica-tion, 50(2):109–125, 2008.
[26] F. Grize and M. Aminian. Cybcérone: a kiosk information system based on WWWand Java. ACM Interactions Magazine, 4(6):62–69, 1997.
[27] J. Y. Han. Low-cost multi-touch sensing through frustrated total internal reflec-tion. In UIST ’05: Proceedings of the 18th annual ACM symposium on User inter-face software and technology, pages 115–118, New York, NY, USA, 2005. ACM.
[28] K. Hinckley. Input technologies and techniques. In The human-computer inter-action handbook: fundamentals, evolving technologies and emerging applications,pages 151–168. L. Erlbaum Associates Inc., Hillsdale, NJ, USA, 2003.
[29] H. Hörtner, P. Maresch, R. Praxmarer, and C. Naglhofer. Libro Vision: Gesture-Controlled Virtual Book. volume 3105 of Lecture Notes in Computer Science, pages258–263. Springer Verlag, Heidelberg, Germany.
[30] E. L. Hutchins, J. D. Hollan, and D. A. Norman. Direct manipulation interfaces.Human-Computer Interaction, 1(4):311–338, 1985.
[31] A. Just and S. Marcel. A comparative study of two state-of-the-art sequence pro-cessing techniques for hand gesture recognition. Computer Vision and Image Un-derstanding, 113(4):532–543, 2009.
[32] F. Karray, M. Alemzadeh, J. A. Saleh, and M. N. Arab. Human-Computer Interac-tion: Overview on State of the Art. International Journal on Smart Sensing andIntelligent Systems, 1(1):137–159, 2008.
[33] J. Kela, P. Korpipää, J. Mäntyjärvi, S. Kallio, G. Savino, L. Jozzo, and D. Marca.Accelerometer-based gesture control for a design environment. Personal andUbiquitous Computing, 10(5):285–299, 2006.
[34] C. Keskin and L. Akarun. STARS: Sign tracking and recognition system usinginput-output HMMs. Pattern Recognition Letters, 30(12):1086–1095, 2009.
[35] C. Keskin, K. Balci, O. Aran, and L. Akarun. A Multimodal 3D Healthcare Com-munication System. In Proceedings of 3DTV-conference http://www.3dtv-con.org, 2007. Last retrieved on July 18, 2010 from http://www.cmpe.boun.edu.
tr/~aran/publications/keskin07multimodal.pdf.
[36] I.-C. Kim and S.-I. Chien. Analysis of 3D Hand Trajectory Gestures Using Stroke-
82

Bibliography
Based Composite Hidden Markov Models. Applied Intelligence, 15(2):131–143,2001.
[37] J.-S. Kim, W. Jang, and Z. Bien. A dynamic gesture recognition system for the Ko-rean sign language (KSL). IEEE Transactions on Systems, Man, and Cybernetics,Part B: Cybernetics, 26(2):354–359, April 1996.
[38] R. Kjeldsen and J. Kender. Toward the use of gesture in traditional user inter-faces. In Proceedings of the Second International Conference on Automatic Faceand Gesture Recognition, 1996, pages 151–156, 14-16 1996.
[39] K. J. Kortbek and K. Gronbaek. Interactive spatial multimedia for communicationof art in the physical museum space. In MM ’08: Proceeding of the 16th ACM in-ternational conference on Multimedia, pages 609–618, New York, NY, USA, 2008.ACM.
[40] J. F. Kramer. Determination of thumb position using measurements of abductionand rotation, January 1996. Last retrieved on September 24, 2010 from http:
//www.freepatentsonline.com/5482056.html.
[41] O. Kulyk, I. Wassink, P. E. van der Vet, G. C. van der Veer, and E. M. A. G. vanDijk. Sticks, balls or a ribbon? Results of a formative user study with bioin-formaticians. Technical Report TR-CTIT-08-72, Centre for Telematics and Infor-mation Technology, University of Twente, Enschede, The Netherlands, Decem-ber 2008. Last retrieved on 12 Oktober, 2010 from http://eprints.eemcs.
utwente.nl/14622/.
[42] G. Kurtenbach and B. Buxton. GEdit: a test bed for editing by contiguous ges-tures. SIGCHI Bulletin, 23(2):22–26, 1991.
[43] J. D. Lafferty, A. McCallum, and F. C. N. Pereira. Conditional Random Fields:Probabilistic Models for Segmenting and Labeling Sequence Data. In ICML ’01:Proceedings of the Eighteenth International Conference on Machine Learning,pages 282–289, San Francisco, CA, USA, 2001. Morgan Kaufmann PublishersInc.
[44] C. Lee and Y. Xu. Online, Interactive Learning of Gestures for Human/RobotInterfaces. In IEEE International Conference on Robotics and Automation, pages2982–2987, 1996.
[45] H.-K. Lee and J. H. Kim. An HMM-Based Threshold Model Approach for GestureRecognition. IEEE Transactions on Pattern Analysis and Machine Intelligence,21(10):961–973, 1999.
[46] G. Lin, Y. Fan, and E. Zhang. Human action recognition using latent-dynamiccondition random fields. International Conference on Artificial Intelligence andComputational Intelligence, 3:147–151, 2009.
[47] Y. Linde, A. Buzo, and R. M. Gray. An Algorithm for Vectore Quantizer Design.IEEE Transactions on Communications, 28(1):84–95, January 1980.
[48] J. Liu, L. Zhong, J. Wickramasuriya, and V. Vasudevan. uWave: Accelerometer-
83

Bibliography
based personalized gesture recognition and its applications. Pervasive and MobileComputing, 5(6):657–675, 2009.
[49] S. Mahmoud. Recognition of writer-independent off-line handwritten Arabic (In-dian) numerals using hidden Markov models. Signal Processing, 88(4):844–857,2008.
[50] T. Mandel. Encyclopedia of Information Systems, Volume Four, chapter 256.Academic Press, 2002. Last retrieved on July 15, 2010 from http://www.
theomandel.com/docs/mandel-encyclopedia.pdf.
[51] T. P. Mann. Numerically Stable Hidden Markov Model Implementation, Febru-ary 2006. Last retrieved on August 5, 2010 from http://bozeman.genome.
washington.edu/compbio/mbt599_2006/hmm_scaling_revised.pdf.
[52] V.-M. Mäntylä. Discrete hidden Markov models with application to isolated user-dependent hand gesture recognition. PhD thesis, VTT Electronics, Finland, 2001.Thesis for the degree of Licenciate of Philosophy.
[53] The Mathworks, Inc. The Matlab User’s Guide: Example of PrincipalComponent Analysis - Online version, 2010. Last retrieved on 3 August,2010 from http://www.mathworks.com/access/helpdesk/help/toolbox/
stats/brkgqnt.html#f14047.
[54] S. Mitra and T. Acharya. Gesture recognition: A survey. IEEE Transactions onSystems, Man and Cybernetics - Part C: Applications and Reviews, 37(3):311–324,May 2007.
[55] L.-P. Morency, C. M. Christoudias, and T. Darrell. Recognizing gaze aversion ges-tures in embodied conversational discourse. In ICMI ’06: Proceedings of the 8thinternational conference on Multimodal interfaces, pages 287–294, New York, NY,USA, 2006. ACM.
[56] L.-P. Morency and T. Darrell. Head gesture recognition in intelligent interfaces:the role of context in improving recognition. In IUI ’06: Proceedings of the 11thinternational conference on Intelligent user interfaces, pages 32–38, New York,NY, USA, 2006. ACM.
[57] L.-P. Morency, A. Quattoni, and T. Darrell. Latent-Dynamic Discriminative Mod-els for Continuous Gesture Recognition. In IEEE Computer Society Conferenceon Computer Vision and Pattern Recognition, pages 1–8, Los Alamitos, CA, USA,2007. IEEE Computer Society.
[58] P. Morguet and M. Lang. Comparison of approaches to continuous hand gesturerecognition for a visual dialog system. In ICASSP ’99: Proceedings of the IEEE In-ternational Conference on Acoustics, Speech, and Signal Processing, pages 3549–3552, Washington, DC, USA, 1999. IEEE Computer Society.
[59] K. Murakami and H. Taguchi. Gesture recognition using recurrent neural net-works. In CHI ’91: Proceedings of the SIGCHI conference on Human factors incomputing systems, pages 237–242, New York, NY, USA, 1991. ACM.
84

Bibliography
[60] F. Parvini, D. Mcleod, C. Shahabi, B. Navai, B. Zali, and S. Ghandeharizadeh.An Approach to Glove-Based Gesture Recognition. In Proceedings of the 13thInternational Conference on Human-Computer Interaction. Part II, pages 236–245, Heidelberg, Germany, 2009. Springer Verlag.
[61] J. Pearl. Probabilistic reasoning in intelligent systems: networks of plausible in-ference. Morgan Kaufmann Publishers Inc., San Francisco, CA, USA, 1988.
[62] R. Poppe. A survey on vision-based human action recognition. Image and VisionComputing, 28(6):976–990, 2010.
[63] L. V. Praseeda and M. Sasikumar. Facial Expression Recognition from Global anda Combination of Local Features. IETE Technical Review, 26(1):41–46, 2009.
[64] K. L. Priddy and P. E. Keller. Artificial Neural Networks: An Introduction, pages15–20. The International Society for Optical Engineering, Bellingham, Washing-ton, USA, 2005.
[65] A. Quattoni, M. Collins, and T. Darrell. Conditional random fields for object recog-nition. In Advances in Neural Information Processing Systems 17: Proceedings ofthe 2004 conference, pages 1097–1104. MIT Press, 2004.
[66] L. R. Rabiner. A tutorial on hidden Markov models and selected applications inspeech recognition. Readings in speech recognition, pages 267–296, 1990.
[67] L. R. Rabiner and B. H. Juang. An introduction to hidden Markov models. IEEEASSP Magazine, pages 4–15, January 1986.
[68] B. Ramaprasad and S. Hamori. Hidden Markov Models: Applications to FinancialEconomics. Spriner Verlag, Heidelberg, Germany, 2004.
[69] H. Rauwerda, W.C. de Leeuw, J. Adriaanse, M. Bouwhuis, P. van der Vet, andT.M. Breit. The role of e-BioLabs in a life sciences collaborative working environ-ment. In Expanding the Knowledge Economy: Issues, Applications, Case Studies,volume 4, pages 866–873. IOS Press, Amsterdam, The Netherlands, 2007.
[70] B. Raytchev, N. Otsu, and O. Hasegawa. User-independent gesture recognition byrelative-motion extraction and discriminant analysis. New Generation Comput-ing, 18(2):117–126, 2000.
[71] L. Reng, T. B. Moeslund, and E. Granum. Finding Motion Primitives in HumanBody Gestures. In Gesture in Human-Computer Interaction and Simulation: 6thInternational Gesture Workshop, Lecture Notes in Artificial Intelligence, pages133–144, Heidelberg, Germany, 2006. Springer Verlag.
[72] F. Samaria and S. Young. HMM-based architecture for face identification. Imageand Vision Computing, 12(8):537–543, 1994.
[73] L. A. Shalabi and Z. Shaaban. Normalization as a Preprocessing Engine for DataMining and the Approach of Preference Matrix. In DEPCOS-RELCOMEX ’06:Proceedings of the International Conference on Dependability of Computer Sys-tems, pages 207–214, Washington, DC, USA, 2006. IEEE Computer Society.
85

Bibliography
[74] A. Shamaie and A. Sutherland. A Dynamic Model for Real-Time Tracking ofHands in Bimanual Movements. In Gesture-Based Communication in Human-Computer Interaction: 5th International Gesture Workshop, volume 2915 of Lec-ture Notes in Computer Science, pages 455–456. Springer Verlag, 2004.
[75] J. Shlens. A tutorial on Principal Component Analysis, 2005. Salk Institutefor Biological Studies, California, USA. Last retrieved on October 12, 2010 fromhttp://www.snl.salk.edu/~shlens/pca.pdf.
[76] B. Shneiderman. Direct Manipulation: A Step Beyond Programming Languages.IEEE Computer Magazine, 16(8):57–69, August 1983.
[77] T. Starner and A. Pentland. Real-time American Sign Language recognition fromvideo using hidden Markov models. In ISCV ’95: Proceedings of the InternationalSymposium on Computer Vision, pages 265–270, Washington, DC, USA, 1995.IEEE Computer Society.
[78] T. Starner, A. Pentland, and J. Weaver. Real-Time American Sign LanguageRecognition Using Desk and Wearable Computer Based Video. IEEE Transac-tions on Pattern Analysis and Machine Intelligence, 20(12):1371–1375, 1998.
[79] H.I. Stern, J.P. Wachs, and Y. Edan. Optimal Consensus Intuitive Hand GestureVocabulary Design. In IEEE International Conference on Semantic Computing,pages 96–103, 4-7 2008.
[80] D. Stone, C. Jarret, M. Woodroffe, and S. Minocha. User Interface Design andEvaluation. Morgan Kaufman, San Francisco, CA, USA, 2005.
[81] X. Sun, L.-P. Morency, D. Okanohara, and J. Tsujii. Modeling latent-dynamic inshallow parsing: a latent conditional model with improved inference. In COLING’08: Proceedings of the 22nd International Conference on Computational Linguis-tics, pages 841–848, Morristown, NJ, USA, 2008. Association for ComputationalLinguistics.
[82] X. Sun and J. Tsujii. Sequential labeling with latent variables: an exact inferencealgorithm and its efficient approximation. In EACL ’09: Proceedings of the 12thConference of the European Chapter of the Association for Computational Linguis-tics, pages 772–780, Morristown, NJ, USA, 2009. Association for ComputationalLinguistics.
[83] C. Sutton and A. McCallum. An Introduction to Conditional Random Fields forRelational Learning. In Introduction to Statistical Relational Learning. MITPress, Cambridge, MA, USA, 2006. Last retrieved on October 13, 2010 fromhttp://www.cs.umass.edu/~mccallum/papers/crf-tutorial.pdf.
[84] K. Swaminathan and S. Sato. Interaction design for large displays. ACM Interac-tions magazine, 4(1):15–24, 1997.
[85] M. E. Taylor and P. Stone. Transfer Learning for Reinforcement Learning Do-mains: A Survey. The Journal of Machine Learning Research, 10:1633–1685,December 2009.
86

Bibliography
[86] M. Turk. Handbook of Virtual Environment Technology, chapter 10. LawrenceErlbaum Associates, Inc., 2001. Last retrieved on July 15, 2010 from http://
ilab.cs.ucsb.edu/projects/turk/TurkVEChapter.pdf.
[87] University of Las Palmas. GpdsHMM Toolbox User’s Guide, 2010. Last retrievedon October 2, 2010 from http://www.gpds.ulpgc.es/download/toolbox/
gpdshmm/gpdsHMM%20toolbox%20for%20matlab%20v1.0.pdf.
[88] A. van Dam. Post-WIMP user interfaces. Communications of the ACM, 40(2):63–67, 1997.
[89] M. van Doorn, E. van Loenen, and A. P. de Vries. Deconstructing ambient intel-ligence into ambient narratives: the intelligent shop window. In Ambi-Sys ’08:Proceedings of the 1st international conference on Ambient media and systems,pages 1–8, ICST, Brussels, Belgium, 2008. ICST (Institute for Computer Sciences,Social-Informatics and Telecommunications Engineering).
[90] D. Vogel and R. Balakrishnan. Distant freehand pointing and clicking on verylarge, high resolution displays. In UIST ’05: Proceedings of the 18th annual ACMsymposium on User interface software and technology, pages 33–42, New York,NY, USA, 2005. ACM.
[91] A. D. Wilson. Robust computer vision-based detection of pinching for one andtwo-handed gesture input. In UIST ’06: Proceedings of the 19th annual ACMsymposium on User interface software and technology, pages 255–258, New York,NY, USA, 2006. ACM.
[92] I. H. Witten and E. Frank. Data Mining: Practical Machine Learning Tools andTechniques. Morgan Kaufmann Publishers, San Francisco, CA, USA, 2005.
[93] J. Wu, G. Pan, D. Zhang, G. Qi, and S. Li. Gesture Recognition with a 3-D Ac-celerometer. In UIC ’09: Proceedings of the 6th International Conference on Ubiq-uitous Intelligence and Computing, pages 25–38, Berlin, Germany, 2009. SpringerVerlag.
[94] Y. Wu and T. S. Huang. Vision-Based Gesture Recognition: A Review. In GW’99: Proceedings of the International Gesture Workshop on Gesture-Based Com-munication in Human-Computer Interaction, pages 103–115, London, UK, 1999.Springer Verlag.
[95] L. Xi, Y. Fondufe-Mittendorf, L. Xia, J. Flatow, J. Widom, and J.-P. Wang. Pre-dicting nucleosome positioning using a duration Hidden Markov Model. BMCBioinformatics, 11(1):346–354, 2010.
[96] J. Yamato, J. Ohya, and K. Ishii. Recognizing human action in time-sequentialimages using hidden Markov model. In CVPR ’92: Proceedings of the IEEE Com-puter Society Conference on Computer Vision and Pattern Recognition, pages 379–385, 15-18 1992.
[97] J. Yang and X. Yangsheng. Hidden Markov Model for Gesture Recognition.Technical Report CMU-RI-TR-94-10, Robotics Institute, Carnegie Mellon Uni-
87

Bibliography
versity, Pittsburgh, PA, USA, May 1994. Last retrieved on May 3, 2010 fromhttp://www.ri.cmu.edu/publication_view.html?pub_id=329.
[98] H.-S. Yoon, J. Soh, Y. J. Bae, and H. S. Yang. Hand gesture recognition usingcombined features of location, angle and velocity. Pattern Recognition, 34(7):1491–1501, 2001.
[99] T. G. Zimmerman, J. Lanier, C. Blanchard, S. Bryson, and Y. Harvill. A handgesture interface device. SIGCHI Bulletin, 17(SI):189–192, 1987.
[100] M. Zobl, R. Nieschulz, M. Geiger, M. Lang, and G. Rigoll. Gesture Componentsfor Natural Interaction with In-Car Devices. In Gesture-Based Communication inHuman-Computer Interaction: 5th International Gesture Workshop, volume 2915of Lecture Notes in Computer Science, pages 367–368. Springer Verlag, Heidel-berg, Germany, 2004.
88

Appendices
89

Appendix AFlock Of Birds Quick Manual
The aim of this manual is to briefly explain the necessary configurations to readposition and orientation data from the Ascension Flock of Birds system1 (FOB)in the Java programming language. It was written as an appendix to a masterthesis 2 Figure A.1 shows the FOB system this manual applies to.
Figure A.1.: The Ascension Flock of Birds system used.
All these components (except for the USB-to-serial perhaps) should be availableto you. You might also have purchased additional Fast Bird Buses (FBBs) and
1See http://www.ascension-tech.com. Last visited on January 6, 2010.2Thesis ‘User-independent recognition of dynamic hand gestures using a dataglove’ by M. Ganze-
boom, October, 2010.
90

Appendix A | Flock Of Birds Quick Manual
FOB sensors which you would like to use. This manual starts with explaininghow to configure the hardware in multiple contexts and continues with givinginstructions on how to read from the FOB system through the Java driver. Thatdriver should have been bundled with this manual. Throughout this manual,references are made to the official FOB installation and operation guide revisionC (hereafter I&O guide), which is supplied to you with this manual or can bedownloaded from Ascension Tech’s FTP servers3.
A.1. Configuring the FOB hardware
Assuming that multiple FBBs and FOB sensors are at your disposal, the FOBsystem can be configured in two ways depending on the context the FOB systemis going to be used. If your context asks for the use of multiple FOB sensors,the system needs to be configured in ‘FOB mode’. If only a single FOB sensor isrequired this manual recommends ‘Standalone mode’. This manual was writtenas part of a master thesis on hand gesture recognition in which the FOB systemwas used in standalone mode. For that reason, the main focus is on configuringfor that mode. Instructions are derived for FOB mode, but they are not based onpractical experiences.
Standalone modeCollect all the components shown in Figure A.1. Take the FBB and connect theStandard Range Transmitter (SRT) to the front port. Connect the FOB sensor,RS-232 serial cable and the Electronics Unit (EU) to the right ports on the backof the FBB.
FOB modeConnect the FOB sensors and EUs to all FBBs as described under standalonemode. Interconnect the FBBs with the FBB inter-unit bus cables (Figure 2, I&Oguide, pg. 4) and connect the SRT to the master FBB (the first FBB).
Connect the first (or only) FBB to a PC. Do not yet plug in the power cord ofthe EU to the wall socket. First, take a look at the eight dipswitches on thebackpanel of the FBB (switches under the label ‘DIP SWITCH’). To be in normaloperating mode (and not in test mode), dipswitch 8 must be in the up positionon all FBBs to be used (I&O guide 2.1.7, pg. 10). We assume that the ‘NormalAddressing Mode’ for giving each Bird unit (i.e. SRT or FOB sensors) a unique
3See ftp://ftp.ascension-tech.com/MANUALS/Flock_of_Birds_Manual-RevC.pdf. Last down-loaded on October 14, 2010.
91

Appendix A | Flock Of Birds Quick Manual
address is sufficient for your context (supports up to one SRT and 13 FOB sen-sors). For other addressing modes see Subsection 2.1.7 of the I&O guide, page11.To use the maximum FOB baud rate (115200 baud), dipswitches 1, 2 and 3should be in the down position. Note that all FBBs in the setup must use thesame baud rate. For setting the FOB baud rate to other settings see Figure 4on page 12 of the I&O guide. Dipswitches 4, 5, 6 and 7 are used to define theaddress of a Bird unit connected to the FBB.
Standalone modeIn this mode one FBB, FOB sensor, SRT and corresponding cables are to be used.Dipswitches 4, 5, 6 and 7 must all be in the up position, which gives the FOBsensor the address 0.
FOB modeMultiple FBBs and FOB sensors are to be used in this mode with a single SRT,assuming that the FBBs are interconnected as described above. Configure dip-switches 4, 5, 6 and 7 on each FBB so that each connected FOB sensor has adifferent address. Which address is assigned to a FBB is not important, as longas the assigned addresses are continuous (i.e. no address is skipped). The ad-dresses must also be set to 1 or higher (else single mode operation is configured).For example, to set the address of a FOB sensor to 1 flip the dipswitches 4, 5, 6and 7 to up, up, up, down. The second sensor then has its address set to 2 byflipping the same switches to up, up, down, up. The third is set to 3 by up, up,down, down and so on.
On the front of every FBB there is a switch which can be set to either ‘FLY’ or‘STBY’. This switch is used to let the FBB perform its power up functions. It isnot an on/off power switch. To cut the power to the FBBs unplug the power cord.Flip the switch to ‘STBY’ if not in that position already. Then plug the powercord of all EUs into sockets.
Standalone modeFlip the switch of the single FBB to the ‘FLY’ position. The (red) light indicatornext to the switch will blink on and off 5 times and then stays on. At thattime, the SRT and sensor will start operating and the FBB is ready to acceptcommands from the host computer. When the switch is flipped to ‘STBY’ thelight indicator turns off, the SRT and sensors are shut off and the FBB wil notrespond to any host computer commands.
FOB mode
92

Appendix A | Flock Of Birds Quick Manual
Flip the switches of all FBBs one-by-one to the ‘FLY’ position (the order doesnot seem to be important) and check that the (red) light indicator next to theswitch will blink on and off 5 times and then goes off. The host computer mustthen send the master FBB an AUTO-CONFIG command (explained later). Onreceipt of this command the light indicators on all FBBs will turn on and stay oncontinuously without blinking if operating correctly. If indicators do blink, referto Section 11.0 of the I&O guide for the error codes.
For more details on the above power up process refer to Subsection 5.2.1 of theI&O guide. Assuming that the hardware is powered up properly, the configura-tion of the hardware is now complete. The next section explains how to use thedriver.
A.2. Accessing the FOB
Accessing the Flock Of Birds (FOB) system through the Java programming lan-guage is done with the driver supplied with this manual. The driver consists ofa single Java class in one file called ‘FOBDriver.java’. With this driver the Birdunits (i.e. FOB sensors and SRT) can be controlled through the Fast Bird Bus(FBB) from the host computer. The commonly used control commands describedin the I&O guide are implemented. This section explains how a connection tothe FOB system is established from the host computer, how the FOB software isproperly configured and how position and orientation data can be read from theFOB. We assume that the reader is experienced in programming in Java andtherefore omit irrelevant details about the Java syntax and setup. From thispoint, the FOB hardware is assumed to be correctly configured in one of the twoconfigurations as described in Section A.1.
Establishing a connection with the FOB hardware
Communicating with the FOB system is done via the RS-232 serial protocol. Tobe able to access the serial ports from Java the RXTX library is needed. Down-load the binaries from the RXTX website 4. At time of writing, release 2.1-7r2is the most recent stable version and was used in writing this manual. Put thebinary files for your specific operating system on the java library path (tip: javaproperty java.library.path) and the ‘RXTXcomm.jar’ on the class path (tip: en-vironment variable ‘CLASSPATH’). Establishing a connection between the FOBhardware and the host computer from Java is done in the following way:
4See http://rxtx.qbang.org/wiki/index.php/Download. Last visited on October 14, 2010.
93

Appendix A | Flock Of Birds Quick Manual
1. Integrate the FOBDriver.java file into your Java project.
2. Instantiate a new FOBDriver object via the default (empty) constructor.
3. Determine the serial port of the host computer to which the FOB system isconnected.
4. At the time you want to establish a connection, call theFOBDriver.open(String port) method with the serial port numberfrom step 3 as parameter.
5. Pause the Java thread that establishes the connection for about 2000 mil-liseconds. This is necessary to apparently give the FOB system enoughtime to initialise properly.
6. See the API comments of the open method to interpret the status valuereturned.
After the connection is successfully established, the FOB system needs to be con-figured to return the form of position and orientation information you require.The 3D position information is read by the FOBDriver in an x, y, z coordinate andthe orientation in either axis angles, a matrix or a quaternion (see Section 9.0 ofI&O guide). Currently, the FOBDriver supports to set the output to the combi-nations POSITION/ANGLES and POSITION/QUATERNION. However, meth-ods for the other modes are easily implemented. Depending on the FOB systembeing setup in standalone or FOB mode the following instructions apply:
Standalone mode
1. To let the FOB system output position and orientation information in theformat of POSITION/QUATERNION, call theFOBDriver.setSingleFlockToPosQuat()method after having success-fully established a connection. Use theFOBDriver.setSingleFlockToPosAngle() to set the output to POSI-TION/ANGLE format.
2. Depending on the placement of the SRT in your total system setup, differ-ent hemispheres of the magnetic field the SRT outputs can be enabled. Inour example the SRT is placed on the floor so only the upper hemisphere isrequired. To configure that callFOBDriver.setHemisphereForSingleFlock(int hem)method with theparameter FOBDriver.UPPER_HEMISPHERE. (Parameters defining otherhemispheres are similarly defined in FOBDriver.java).
3. To expand the range of the FOB sensors from the default 36 inch to 72inch, the FOBDriver.expandRangeCommand(int nrOfBirds) method
94

Appendix A | Flock Of Birds Quick Manual
should be called with the number of FOB sensors in use as the parameter.
4. To request the current position and orientation in the format just config-ured, call the methodFOBDriver.getPointInStandardGraphicMode(Tuple3f pos, Quat4f orient).The returned position and orientation are already converted from the As-cension to the standard computer graphics axes alignment. (see API com-ments and I&O guide, pg. 152)
FOB mode
1. Call the method FOBDriver.sendMasterFBBAutoConfigCommand(int nrOfBirds)
to send the master FBB the AUTO-CONFIG command. Indicator lights onthe front panel of all FBBs turns on and stays on continuously.
2. To let the FOB system output position and orientation information in theformat of POSITION/QUATERNION, call theFOBDriver.setMultiFlock(int nrOfBirds)method after having suc-cessfully established a connection and use the total number of birds in useas the parameter. No method has been implemented to let the FOB systemoutput other formats.
3. Depending on the placement of the SRT in your total system setup, differ-ent hemispheres of the magnetic field the SRT outputs can be enabled. Inour example the SRT is placed on the floor so only the upper hemisphere isrequired. To configure that callFOBDriver.setHemisphereForMultiFlock(int hem, int nrOfBirds)
method with the parameter FOBDriver.UPPER_HEMISPHERE and the to-tal number of birds in use as the second parameter.
4. To expand the range of the FOB sensors from the default 36 inch to 72inch, the FOBDriver.expandRangeCommand(int nrOfBirds) methodshould be called with the number of FOB sensors in use as the parameter.
5. Send the master FBB the AUTO-CONFIG command, like in step 1.
6. To request the current position and orientation of a specific FOB sensor,call the methodFOBDriver.getPoint(int birdNr, Tuple3f pos, Quat4f orient).The returned position and orientation are not yet converted to the standardcomputer graphics axes alignment (see API comments and I&O guide, pg.152).
95

Appendix A | Flock Of Birds Quick Manual
7. Use theFOBDriver.convertToStandardGraphicMode(Vector3f ascVector)
and FOBDriver.convertToStandardGraphicMode(Quat4f ascQuat)
methods to convert them into the standard computer graphics axes align-ment when required.
That finishes this section on accessing the FOB system with the necessary com-mands. For more command reference see Section 9.0 and possible errors (e.g.continuous blinking of FBB indicator lights) in Section 11.0 of the I&O guide.
96

Appendix BData recording protocol
After having greeted and instructed the participant of the data recording exper-iment, the dataglove and Flock of Birds sensor were put on. The participantpracticed a few minutes, to get a feeling for the cursor control. When the partic-ipant was ready, the researcher started the recording process and followed theprotocol below.
1. Press the ’Y’ key once on the keyboard to enable cursor control to the par-ticipant
2. While controlling the CoolIris application and there are less than fifteeninstances of every gesture, do:
a) If gesture Select is observed, press the ‘W’ key once to execute a leftmouse button click
b) Else if the start of gesture Drag is observed, press the ‘W’ key once toexecute a left mouse button press
c) Else if the end of gesture Drag is observed, press the ‘W’ key once toexecute a left mouse button release
d) Else if the Zoom in gesture is observed, press the ‘E’ key repeatedlyuntil the participant stops the gesture or pauses moving thumb andindex finger
e) Else if the Zoom out gesture is observed, press the ‘D’ key repeatedlyuntil the participant stops the gesture or pauses moving thumb andindex finger
f) Else if the Maximise gesture is observed, press the ‘O’ key onceg) Else if the Demaximise gesture is observed, press the ‘D’ key onceh) Else if the participant makes an undefined gesture or one that devi-
97

Appendix B | Data recording protocol
ates from its description, say out loud that the gesture is not recog-nised
3. Press the ’Y’ key once on the keyboard to disable cursor control to the par-ticipant
4. Stop the recording and change onscreen application to the Movie Memoryapplication
5. Ask the participant to centre the Flock of Birds sensor above the magneticfield generator
6. Start the recording and press the ’Y’ key once on the keyboard to enablecursor control to the participant
7. While controlling the Movie Memory application and there are less thanfifteen instances of every gesture, do:
a) If gesture Select is observed, press the ‘W’ key once to execute a leftmouse button click
b) Else if the Minimise gesture is observed, press the ‘P’ key oncec) Else if the Deminimise gesture is observed, press the ‘L’ key onced) Else if the Close gesture is observed, press the ‘S’ key oncee) Else if the participant makes an undefined gesture or one that devi-
ates from its description, say out loud that the gesture is not recog-nised
8. Press the ’Y’ key once on the keyboard to disable cursor control to the par-ticipant
9. Stop the recording
98

Appendix CCharacteristics of experimentparticipants
To train a hand gesture recogniser an experiment was held to collect data. Theexperiment is explained in Chapter 3. Data was recorded from 22 participants.The target group was students and young academic researchers. The table be-low shows their characteristics and previous experience with gesture interfaces.The rows marked bold and italic are the participants from which the data wasused in training and testing the recognisers in Sections 5.1 to 5.4. The data ofparticipants eleven and fifteen was used in Section 5.5 for testing the user inde-pendence.
# Age Gender Nation. Occupation Left-handed Experience1 20-30 M Dutch Ph.D.
student
No Gesturing with Wii and
multi-touch phones
2 20-30 M Dutch MSc.
student
No Gesturing with
multi-touch screens
3 20-30 M Dutch MSc.student
No Gesturing withmulti-touch phones
4 20-30 M Dutch MSc.student
No Gesturing with Wiiand multi-touchphones
5 20-30 M Iranian Bachelor
student
No None
99
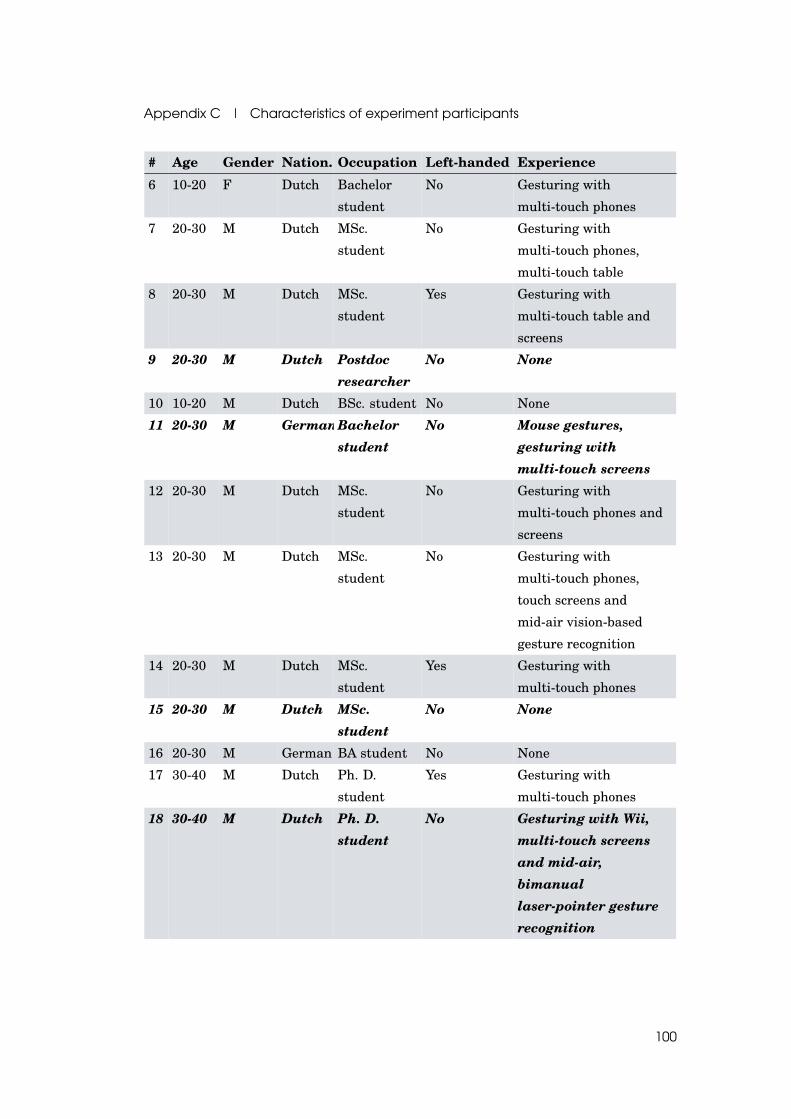
Appendix C | Characteristics of experiment participants
# Age Gender Nation. Occupation Left-handed Experience6 10-20 F Dutch Bachelor
student
No Gesturing with
multi-touch phones
7 20-30 M Dutch MSc.
student
No Gesturing with
multi-touch phones,
multi-touch table
8 20-30 M Dutch MSc.
student
Yes Gesturing with
multi-touch table and
screens
9 20-30 M Dutch Postdocresearcher
No None
10 10-20 M Dutch BSc. student No None
11 20-30 M GermanBachelorstudent
No Mouse gestures,gesturing withmulti-touch screens
12 20-30 M Dutch MSc.
student
No Gesturing with
multi-touch phones and
screens
13 20-30 M Dutch MSc.
student
No Gesturing with
multi-touch phones,
touch screens and
mid-air vision-based
gesture recognition
14 20-30 M Dutch MSc.
student
Yes Gesturing with
multi-touch phones
15 20-30 M Dutch MSc.student
No None
16 20-30 M German BA student No None
17 30-40 M Dutch Ph. D.
student
Yes Gesturing with
multi-touch phones
18 30-40 M Dutch Ph. D.student
No Gesturing with Wii,multi-touch screensand mid-air,bimanuallaser-pointer gesturerecognition
100

Appendix C | Characteristics of experiment participants
# Age Gender Nation. Occupation Left-handed Experience19 20-30 M Dutch MSc.
studentNo Gesturing with
multi-touch phonesand screens
20 20-30 M Dutch Ph. D.
student
No Gesturing with Wii and
3D Mouse
21 30-40 M Dutch Postdocresearcher
No Gesturing with Wiiand bimanuallaser-pointer gesturerecognition
22 20-30 M Dutch MSc.
student
No Gesturing with
multi-touch screens and
mid-air vision-based
gesture recognition
101