Master Thesis Design and Simulation of Engine Control System
92
1 Master Thesis Design and Simulation of Engine Control System Major: Automotive Engineering Candidate: Sun Haiteng Student Number: S232225 Tutor: Professor Daniela Maffiodo Professor Raffaella Sesana 2018.01
-
Upload
khangminh22 -
Category
Documents
-
view
0 -
download
0
Transcript of Master Thesis Design and Simulation of Engine Control System

1
MasterThesis
DesignandSimulationofEngineControlSystem
Major:AutomotiveEngineering
Candidate:SunHaiteng
StudentNumber:S232225
Tutor:ProfessorDanielaMaffiodo
ProfessorRaffaellaSesana
2018.01

2
Abstract
The objective of this paper is to design and simulate the engine control system for
engine test bench, which should be developed for didactic usage. The controlling
module or described as the engine control unit of this test bench would be developed
on a microcontroller unit called Arduino due to the feasibility and simplicity. The
programming language of this microcontroller is based on C++. It is time consuming,
difficult for student without solid programming skill and complicated to develop the
code of engine control system directly on Arduino. In order to reduce the
development time and cost of engine control system, the simulation of engine control
system could be accomplished. The model based code of engine control system could
be simulated in Matlab/Simulink. This simulation of engine control system could be
verified by combination with virtual engine model software.
In this paper, different engine control strategies are introduced and air fuel ratio
control is utilized since the engine test bench is only for teaching usage and air fuel
ratio has better understanding. The engine should be modeled by virtual engine
modeling software, GT-Power. The engine would be a 4 cylinders, SI engine with
turbocharger. The engine control system should be modeled by Simulink. In this
control system, three different engine operating conditions, such as idle speed
condition, stable operating condition and transient operating condition, should be
considered. After implementation models of engine and engine control system, the
simulation results should be demonstrated as desired characteristics of engine
performance. At the end of this paper, the simulation results should be compared with
on board diagnostic results to verify engine control simulation and to prove that the
coupling method of Simulink and GT-Power could provide a stable solution aiming at
using an accurate engine model to save development cost and time during early stage
of examining the design of control system.

3
Table of Contents ListofFigures........................................................................................................................................4Chapter1.Introduction...................................................................................................................6
1.1Background..........................................................................................................................61.2IntroductionofProject....................................................................................................61.3ProblemSolution...............................................................................................................91.4GT-PowerandMatlab/Simulink...............................................................................101.5ThesisContributions......................................................................................................11
Chapter2.LiteratureReview......................................................................................................13
2.1 Introduction................................................................................................................132.2Reviewofexistingtechnology...................................................................................132.3EngineModeling..............................................................................................................222.4Enginemanagementsystem.......................................................................................23
Chapter3EngineModelingUsingMeanValueMethod...................................................35
3.1Introduction.......................................................................................................................353.2MeanvaluemethodandGT-Power.........................................................................363.3Meanvaluegasflowmodel.........................................................................................383.4Crank-basedone-zoneSIcombustionmodel......................................................433.5EngineModelinginGT-Power...................................................................................48
Chapter4EnginecontrolstrategysimulationinSimulink............................................56
4.1 Introduction...................................................................................................................564.2 Themodelingofair-fuelratiocontrolmodule...............................................574.3 Controlofturbocharger............................................................................................64
Chapter5 ImplementationofEnginemodelinSimulinkenvironment................69
5.1 Introduction...................................................................................................................695.2 SetupofGT-PowerModel.......................................................................................705.3 SetupofSimulinkModel..........................................................................................72
Chapter6 FinalResultandfuturework..............................................................................74
6.1SimulationResult............................................................................................................746.2Analysisofsimulationresults....................................................................................84
Chapter7 ComparisonwithOnBoardDiagnosticResults..........................................79
7.1Introduction On Board Diagnostic...............................................................................817.2OnBoadrdiagnosticresults........................................................................................837.3Conclusionandfuturework........................................................................................85

4
ListofFigures
Figure1.1…………………………………………………………………………….VersionofArduinoFigure1.2…………………………………...…………SchematicofEngineTestBenchProjectFigure2.1…………………………………………………….……ObjectiveofEngineDownsizingFigure2.2…………………………………..................................................................SankeyDiagramFigure2.3……………..............................................................….PressureWaveSuperchargingFigure2.4……………..............................................……….SchematicofTurboCompoundingFigure2.5.............................................................SchematicofEngineManagementSystemFigure2.6.....................................................................TorqueBasedEngineControlModuleFigure2.7.....................................................................................Air-FuelRatioControlModuleFigure2.8..........................................................................ElectronicThrottleControlModuleFigure2.9..........................................................................................................PedalMapExampleFigure2.10.........................................................................................IdleSpeedControlModuleFigure3.1...................................................................ValveModelAccomplishedinSimulinkFigure3.2............................................................ManifoldModelAccomplishedinSimulinkFigure3.3..............................................................................................StageofPressureVaryingFigure3.4................................................................................TurbochargerModelinSimulinkFigure3.5............................................................................TurbochargerModelinGT-PowerFigure3.6........................................................................................EGRControllerinGT-PowerFigure3.7..............................................................................................SettingofEGRControllerFigure3.8...............................................................IntakeandExhaustSysteminGT-PowerFigure3.9...........................................OverallEngineModelwithSimulinkHarnessModeFigure4.1.......................................................................OverallControllerModelinSimulinkFigure4.2.................................................................StableOperatingControllerinSimulinkFigure4.3..........................................................TransientOperatingControllerinSimulinkFigure4.4.........................................................IdleSpeedConditionControllerinSimulinkFigure4.5........................................................................ExampleofTurbochargerControllerFigure4.6........................................................................................................................TurbineMapFigure4.7.......................................................................................LQCompensatorinSimulinkFigure4.8...........................................................PIDControllerofturbochargerinSimulinkFigure4.9.................................................OverallStructureofControlSysteminSimulinkFigure5.1.....................................................................................................SchematicofCouplingFigure5.2...............................................................................................SimulinkHarnessModuleFigure5.3.................................................................................EngineModelUsedforCouplingFigure5.4.............................................SchematicofEngineControlSimulationCouplingFigure6.1.....................................................................................................................ThrottleAngleFigure6.2.......................................................................................................................EngineSpeedFigure6.3......................................................................................................................Air-FuelRatioFigure6.4...........................................................................................................................IntakeMAPFigure6.5....................................................................................................................EngineTorqueFigure6......................................................................................................................TurbineSpeed

5
Nomenclature
AFR Airfuelratio𝑎! Throttleangle𝐶! Dischargecoefficient𝐶! HeatcapacityunderconstantpressureD Throttleborediameterℎ! Masstransfercoefficient𝐼!"# Rotationalinertiaofengine𝐾! Integralgain𝐾! Derivativegain𝐾! Proportionalgain𝑚! Massflowofair𝑚!" Airmassflowinintakemanifold𝑚!" Airmassflowintakeport𝑚!" Fuelmassflowintocylinder𝑚!" FuelmassflowfrominjectorN EnginespeedP CylinderpressurePe Exhaustmanifoldpressure𝑟 CompressionratioT Temperature
𝑇!"#$% BrakeTorque𝑇! Indicatedtorque𝑉! Enginevolume𝜂!"# Volumetricefficiency𝜃! Throttleopeningangle𝜃! Angleforminimumleakagearea𝐾 Ratioofspecificheat𝜆 Lambdavalue𝜌! AirdensityTDC TopdeadcenterBDC BottomdeadcenterIVO IntakevalveopeningIVC IntakevalveclosingEVC ExhaustvalveclosingEVO Exhaustvalveopening

6
Chapter1.Introduction
1.1Background
In pace with the rapid development of various new technologies of engines, the
engine electronic control technology grows rapidly and becomes more and more
complicated. Therefore, during the researching and developing period of engines, the
reduction of cost and time of design and development stage is necessary, in which the
developing process of engine can be boosted. While establishing the model of control
system, the spark ignition engine model is needed to verify the control system.
Ordinarily the model of engine control system is built in Matlab/Simulink, however,
some hypotheses are assumed when the model is built based on this kind of platform.
Some hypotheses can only indicate the changing tendency of partial engine
parameters during the changing period of engine control strategy. Nevertheless when
the real control component is running with the real engine, some problems may occur
unpredictably, thus the control strategy should be modified and the control component
should be optimized.
1.2IntroductionofProject
The project “Design and development of an engine test bench” aims at providing an
engine test bench for a spark ignition engine for didactic usage in Filos. Filos is a
insertion work orientation formation institution. It has a successful educational
program for teaching vehicle maintenance ability. For teaching purpose as improving
students knowledge of engine operating, as well as making students study the failure
of sensors and actuators, study the failure of engine components, a simple engine test
bench is needed. The main conception is using microcontrollers to control the engine
and show parameters of engine operating condition such as engine speed, intake
manifold pressure, air fuel ratio and etc. The engine test bench should compose of

7
rack with engine support, engine with cooling system, starter, alternator as load
applied to the engine, wires connecting sensor, actuator with microcontroller and
computer to show the results. For teaching usage, the test bench should be able to
analyze three different operating conditions of engine likes idle condition, stable
condition and transient condition. Since the engine prepared for using to design the
engine test bench is without Engine Control Unit (abbreviated as ECU) or any engine
management system, the control system of the engine should be considered to be
developed in the engine test bench. The controlling module described as the engine
control unit would be developed on an Arduino due to the feasibility and simplicity.
The arduino is computer hardware with open source, open project and users
community. The single board microcontrollers could be designed and be
manufactured based on the Arduino, as well as the microcontroller kits which could
be utilized for building digital devices and interaction objects to sense and control
devices in the physical world. This board is equipped with digital pins of analog input
or output in groups, with the purpose of connecting to different expansion boards or
shields as well as other electronic circuits. Feature of this board is the serial
communications interfaces, including USB equipped on some models for loading
programs from PC. The language used to programming using a dialect of features
from the programming languages C and C++.
Figure 1.1 Version of Arduino used
The basic idea of this project is to develop an engine control unit on the arduino,
which interacting with the engine using sensors and actuators. After complying this

8
stage, a graphical user interface design (GUI design) could be achieved by Labview.
The communication strategy between the microcontroller and the personal computer
is accomplished by wireless communication modules called ZigBee, which provides
low-cost, low-power needed in wireless control and monitoring applications. The
schematic of the total methodology could be shown as:
Figure 1.2 Schematic of the engine test bench project
The control strategy is using the idea that the arduino reads the missing tooth output
to determine the engine speed and crank angle position by the rpm sensor and crank
angle sensor (cam position sensor) respectively. It then drives one pin which will
connect to the fuel injector with a pulse of fuel per revolution and another pin which
drives the spark for one spark per revolution. The fuel injector timing and amount of
fuel injected, as well as the ignition timing should be both variable via a serial
connection between the arduino control unit and a computer.
The to-be-developed control unit can be considered as an embedded real-time system,
which is dedicated to manage a fuel-injected, spark ignition 4-cylinder gasoline
engine. The following methods could be adopted to develop this type of control
system:
1) Develop the code on the embedded device (ex. Arduino Mega) with continuous
testing on the engine.
2) Develop the code at one fling on the embedded device before the final testing on
the engine. It demands a high level of certainty of the code development.

9
3) Build digitally an engine simulator on PC along with a engine control software to
control it, and then program the control unit into an embedded device in order to do
the testing on a real machine.
4) Build an engine simulator and the control unit for control purpose on an embedded
device.
5) Develop the model-based code in simulating software such as Matlab or Simulink
with an engine simulator and ECU in the software respectively, and then choose a
target to program the code for testing on an embedded device.
The first three options are very time consuming with poor overview, in a while some
software experts are needed for generating the control unit code of arduino manually.
The fourth options needs to develop an engine model in complete C or C++
programming language which is a massive mission to be done for developers without
a information engineering educated background. Therefore the last one is chosen:
with the help of Matlab/Simulink and engine simulating software, the open loop or
closed loop test could be easily achieved with graphical overview, which is beneficial
for mechanical engineering without a solid programming skill. Besides that, the auto
code generation of Simulink could be utilized. It is a fast code generation with code
generated without errors.
1.3ProblemSolution
To solve the above problem, an engine model, which can demonstrate the engine
performance more systematically and integrally, should be established. The control
strategy could be simulated in the Simulink environment. By combining the virtual
engine simulator model with Simulink simulation, it could observe the changing of
the characteristics of spark ignition engine, in hence to verify the correctness of
control strategy. The control strategy simulated in the Simulink could be
auto-converted into C or C++ programming language code, which could be stored in

10
the Arduino. Therefore, in the early stage of development, the development cost and
time can be reduced distinctly, with increased quality.
The working flow of this project should be:
1) Development of the engine model using virtual engine modeling software.
2) Development of software function using a graphical programming language (such
as Simulink) according to the requirement and features predefined.
3) Test the software functions in Simulink with coupling of the engine model.
4) Generate C or C++ programming code and flash it into the Arduino.
5) Test the reliability and function of the engine sensor and actuators, connecting the
arduino, computer and engine.
6) Graphical user interfaces design
7) Set up of the engine test rig
8) Verification of software functions at engine test bench.
This thesis focuses on the development of engine model and the simulation of control
functions, also focuses on the test the control functions with virtual engine model.
1.4GT-PowerandMatlab/Simulink
GT-Power is commercial software especially designed for modeling and simulation of
vehicle powertrain system. Nowadays, GT-Power has been adopted extensively by
the most automotive analysis company. Thanks to its function of code design based
on object, the engine could be modeled followed parts by parts. It would be possible
for users to individually specify the parameters of each engine component via
compiling the property dialogue box attached to the corresponding block. Moreover,
the engine manufacturer provides most of the key parameters, for instance, the valve
lifts of intake and exhaust system.
The model made by GT-Power is primarily the foundation as dynamics one
dimensional fluid. The model represents the flow transfer in the fluid tubing and other

11
component of a motor system, as well as the heat transfer. The merge stage of the
model takes a comparatively enduring time, frequently counted by hours, with
providing the engine performance in steady state. Due to this reason, the models made
by GT-Power are impossible to be adopted for the engine simulation in real-time. In
addition, GT-Power is qualified to provide the accurate results of simulation in steady
state. However, the reliability of simulation in transient condition is comparatively
low. In hence, modeling by GT-Power can be considered as a tool commonly used to
forecas engine characteristic in steady state.
Matlab is a high-level language, which is specialized at science and engineer calculus,
system simulation. It integers numerical calculation, visible image and processing and
multimedia technology, becoming the fundamental tool and application in computer
simulation and computer aided design field.
Simulink is a package inside Matlab, which can model, simulate and analyze dynamic
system. Simulink has a powerful function and convenient operation, providing
graphical simulation tools. Subsystems are allowed to be set up under this operating
platform, which can combine and calibrate model structure. The process of simulation
is interactional; thereby the modeling and simulation of dynamic system would
become simpler.
1.5ThesisContributions
This research uses modeling of the single stage turbocharged SI engine as an entry
point, with a mixing method of mean-value crank based and time based modeling.
The mean value time based method is adopted to model the air handling system, while
the spark ignition combustion process as functions of engine crank angle. The
developed combustion model allows simulation of the spark ignition combustion
mode. The corresponding GT-Power model ensures calibration and validation of the
engine model.
Subsequently, the engine model will be implemented and validated in a simulation
environment based on Simulink.

12
The content presented in this thesis is organized by 7 chapters: In Chapter 2, a review
of existing technology and literature on the subject is given. Focus is particularly
placed on the engine modeling method and engine control strategy. Meanwhile the
new technologies and challenges are also presented briefly. In Chapter 3, the
single-stage turbocharged SI engine should be modeled by using the mean value
engine modeling method; the model is modeled under the usage of GT-Power model.
In Chapter 4, the control strategy is established in Simulink. In Chapter 5, the
coupling of the developed model with the Simulink simulation control model is
depicted with the proposed numerical approach. In Chapter 6, the final results and
analysis would be presented. In the last Chapter, on board diagnosis test and its results
should be compared with simulated results. Conclusion and future work are drawn.

13
Chapter2.LiteratureReview
2.1 Introduction
Upon the former three eras, great progress has been made in improving the efficiency
of automotive engine, as well as the fuel economy, and exhaust emissions. The part of
this progress is due to the ability of the researchers to model the engines in order to
examine and test possible innovations. Numerous rising technologies, thanks to the
research and development by engineers, are driven by the impending energy
climacteric and the more and more rigorous emission limitation of vehicle and
legislation of fuel economy. The appearance of these new technologies have
significantly increased the complexity of internal combustion engine system.
2.2Reviewofexistingtechnology
2.2.1 Engine Downsizing
The definition of engine downsizing could be generally described by Thirouard et al [1]
By using a engine with smaller volume, the engine could operate at higher specific
engine loads achieving lower fuel consumption.
The mainly method to accomplish reduction in fuel consumption is reducing the
friction loss according with downsized engine volume; as well as the reduced pump
losses due to the need for less intake throttling so that the engine can operate at higher
loads to have better efficiency. With respect to friction, the friction on slipping
exterior is representatively reduced via decreasing value of area as piston ring
contacted with cylinder, which could be explained as with the number of cylinder

14
reducing, as well as reducing crankshaft journal bearings swept area.
The advanced power concentration, which represented as short displacement, thereby
improving fuel consumption performance. For ease of downsizing, full load
performance potential is typically maintained via pressurization (Supercharging or
boost). Especially for gasoline engines, the extreme variability of valve timing for
both inlet and exhaust valves in combination with turbocharging, direct fuel injection
can also help the progress of downsizing. Due to its charged air cooling effects,
gasoline direct injection, with abbreviation as GDI, allows higher compression ratios
to increase thermal efficiency; and variable valve timing (of intake and exhaust at the
same time) can both increase scavenging and reduce partial load throttling losses.
These technologies have been combined and adopted by multiple manufacturers to
reduce emissions through engine downsizing, including Ford and Volkswagen. Fiat
even eliminated the throttle (and therefore throttling losses altogether) with their
‘Multi-Air’ electro-hydraulic valve actuation technology. Other technologies that
work with downsizing include spray guided direct injection (abbreviated as SGDI)
and variable compression ratio (VCR), although non of them has already attained
production.
The foundation of increased specific engine output which is essential to engine
downsizing, can be marked back with the definition of basic engine performance
parameters.
The equation of specific power can be represented as:
𝑝𝐴!
=𝜂!𝜂!𝜌!,!"𝑄!"𝑆!(𝐹 𝐴)
4
From this equation, a number of factors are deduced, which directly affect the
performance of the engine, indicating that adding any of these factors will improve
engine performance (all other things being equal):

15
1) Specific Fuel consumption which could be considered as fuel conversion
efficiency since these two factors are inversely proportional
2) Volumetric efficiency of engine
3) Density of intake air
4) Maximum fuel quantity that can be utilized effectively in the cylinder
5) Average value of piston speed
The following figure shows that: The method of engine downsizing targets at point 2
and point 3 in this list, and point 1, which is at least for part load in actual operating
driving condition, likewise if not full load conditions.
Figure 2.1 Objective of Engine Downsizing
2.2.2 Pressurization
Pressurization may be described as introducing the air or the mixture of air-fuel into
the engine cylinder with a certain density, which is larger than ambient pressure,
allowing the proportionately larger quantity of fuel to be used for combustion, thereby
increasing the hidden power output of engine. There are three basic approaches to
accomplish this: turbocharging or turbocharger, pressure wave supercharging, and

16
mechanical supercharging.
a) Turbocharging
A turbocharger is a device that has a compressor and turbine connecting with the
same shaft, in which the turbine could be driven by energy in the unburned residual
gases of engine; the turbine in turn drives the compressor, which provides an increase
in intake pressure. The Sankey diagram for a typical 1.4-liter, four-cylinders
spark-ignition gasoline engine,which is reproduced from Stobart and Weerasinghe, is
presented in Figure 2.2. Up to a third of the fuel energy is converted to useful work,
while a maximum of nearly 50 percents of the fuel energy is wasted as waste heat.
One of the major advantages of a turbocharger is that it uses exhaust gas energy,
which otherwise would be wasted resulting in an overall increase in thermal
efficiency.
Figure 2.2 Sankey Diagram
Common automotive turbochargers are equipped with radial flow turbine and
centrifugal compressor. Considering the utilization with a automotive engine, due to
the design and operating fundamental, this kind of turbo machines have an optimum
operating point, however, are not adequate perfectly for operation across a wide range
of flow.

17
Emissions reduction technologies such as exhaust gas recirculation, which is known
as EGR, and diesel particulate filters, which is known as DPF, also make compressor
turbine matching or coupling a problem. When fitting a turbocharger to an engine,
there is a fundamental reconciliation between engine torque during low speed
condition and engine output power at high engine speed. Large turbochargers
provides the power at high speeds, however, it would suffer from slow speed engine
operating condition performance and transient response due to the lack of exhaust gas
flow rate to overcome the inertia of the system. On the other hand, small
turbochargers offer improved torque under low engine speed working condition and
transient response due to the reduced inertia, even though at high engine speeds
working conditions the turbine bypass is required to prevent excessive turbocharger
speed, sacrificing efficiency; in addition, small turbochargers generally perform a
lower efficiency because of the increased pressure loss leakage between turbine and
housing.
For forced induction engines, the driving performance of comparable naturally
aspirated devices is a goal ideally. To reduce the effects of turbo compression
compromises, plenty solutions have been proposed to reduce the effects of turbo
compression trade-off.
The turbine bypass, which is also know as waste gate, allows the correct size of the
turbocharger to achieve low engine speed performance. With the speed increasing, the
waste gate opens, causing a proportion of the exhaust gas be allowed to bypass the
turbine, which has the result in limiting boost pressure and preventing the
turbocharger from overspeeding. Nevertheless, as mentioned earlier, thermal
efficiency is sacrificed due to the energy of wasted exhaust gas.
The idea of variable turbine geometry has existed for sometime, where the effective
turbine area or aspect ratio can be matched to varying exhaust gas flow rates. The
concepts designed to accomplish this can be divided in two categories, depending on
whether it is the geometry of the volume or the nozzle that is adjustable. A

18
turbocharger with variable geometry volume is a lower cost alternative to variable
geometry nozzle placement, which is generally more complicated [2]. Although
experiments have demonstrated that transient response has been improved, volute
turbo designs with variable geometry have not virtually achieved commercial
production.
Several factors limit the achievable single compressor pressure ratio, which is caused
mainly by reduce the efficiency of the high pressure ratio and required temperature
limits of mass flow range. A series of turbocharged configuration may become
feasible. Considering a two-stage system, two turbochargers are placed in series in
order to allow the exhaust gases undergo two stages of expansion, with the intake
charge going through two stages of compression. Using conventional turbocharger
may develop a high expansion ratio and total pressure, without sacrificing efficiency
or mass flow rate range. The system may comprise a bypass valve connected in series,
which is for a turbine and / or compressor in order to achieve greater operational
flexibility.
In a parallel turbocharged arrangement, two, in some cases four; turbochargers of the
same size are used instead of the larger single unit. Parallel turbocharging is usually
used on engines with six or more cylinders, with the exhaust pipes divided into
several groups from the cylinders exhaust flow direction, which is most beneficial to
utilize exhaust pulse effects. During using a engine with turbocharging system with
two turbochargers, each turbine receives exhaust gases from the half of cylinders from
the engine; and on the intake side, the compressors usually enters the ordinary intake
chamber.
In a sequential system, two turbochargers, as well as more in some cases, are arranged
in parallel providing the pressurized air supplied to the common intake manifold,
similar to parallel turbocharging condition. Unlike pure parallel arranged
configuration, in which the turbines are driven by exhaust gases from common
exhaust manifold are driven by flow control valves; in sequential turbo system, the

19
number of turbochargers in operation can vary. The turbochargers may have the same
or similar size characteristic. In this case, for a twin-turbo system, in the first order
period which indicates the engine operating at low engine speeds, only one
turbocharger is in operation; during the second sequence which denotes the engine
working with high engine speeds, both turbochargers are turn to be used.
Alternatively, a small turbocharger could be used for low engine speed operation, and
switch to the larger turbocharger only at high engine speeds conditions. In these two
cases, the aim and result are the same: changing the effective turbine area to match
engine speed working condition and exhaust gas flow as tuned to improve low speed
boost, torque and transient response[3].
b) Pressure wave supercharging
In the case of pressure wave supercharging, as its name implies, pressure waves are
applied in the manifolds of intake and exhaust system, in order to pressurize the
intake charge. In a circumstance where two fluids with different pressures are brought
into direct contact in long narrow channels, equalization of pressure turns out to occur
faster than mixing[3].
The main component of the Compound supercharger is a cylindrical rotor, which
requires a number of the necessary long narrow channels around the circumference.
To keep the rotor speed proportional to engine speed, the rotor should be belt driven
by the engine crankshaft. The rotor itself dose not provide compression function so
that the power consumption by the rotor is minimal. When the rotor is rotating, each
individual unit opens and closes in turn, passing through the inlet and outlet ports of
intake system and exhaust system[4]. When the cell reaches the exhaust inlet port,
high-pressure exhaust gas flows into the air and generates pressure waves to compress
the existing air intake. Then the other end of the cell opens to the intake manifold
oppositely; the pressure wave continues to force the high-pressure air to flow towards
the cylinders. The aperture is closed before the exhaust gases are allowed to flow out.
And as both ends of the cell are closed, making the gases become stationary. However,

20
the cell pressure is higher than in the exhaust outlet, so when the cell is opened to this
port, the exhaust gases expand out, resulting in fresh air drawn in from the
subsequently opened inlet port. Both holes are all closed and the system returns to
achieve the initial state.
Figure 2.3 Pressure Wave supercharging
c) Mechanical supercharging
Mechanical supercharging is a place providing increased air density and pressure
through a pump or compressor. The compressor usually is driven by the engine
crankshaft through a gear coupling system or belt-and-pulley system. In the
mechanically driven systems, the term supercharger is usually used.
The fluid is displaced by a positive displacement pump, which is in general terms, in a
pipe system by trapping and discharging the fixed amount of the fluid in cycle. In the
automotive field, the intake air is pumped into the intake pipe inlet to increase the
inflating density by pumping the air into the air inlet at a faster rate than the usual
intake of the engine. Due to the reason that this is at a settled rate corresponding to
crankshaft speed, assuming the transmission ratio is fixed, the volumetric
supercharger can produce almost constant pressurization pressure.
21
A good transient response could be achieved by mechanical drive, however, the
disadvantage is that power is extracted from the functional engine crankshaft output,
rather than employing available residual gas energy as with turbocharging. For
another side, some of the energy used by the supercharger is restored as recognized as
forward pumping work on the pistons, while the exhaust backpressure will also be
increased by turbocharger, thus increasing pumping losses and trapped remained
residuals.
Dynamic compressors consist of centrifugal for radial flow and axial compressors; but
for the purpose of automotive supercharger usage, the centrifugal type is the most
common type at present. A centrifugal compressor works by accelerating the intake
air to a high velocity, and then this velocity is converted to pressure by way of
diffusion [4]. The compressor speed is increased with the pressure produced by the
compressor consequently. Therefore, under the fixed ratio, the pressurization of the
mechanical driven centrifugal supercharger increases with the increase of the engine
speed, which makes it not ideal as the automobile engine. The advantage of
centrifugal turbochargers is that they are usually smaller, lighter and functional to
produce higher pressure ratios than their positive displacement opposite side. Besides
that, although the increase in engine speed profile may be correctly perceived as a
disadvantage, it may allow the use of higher compression ratios in the case of a
gasoline engine.
d) Turbo compounding
In a turbocharger, the utilisation of an exhaust-driven turbine for powering a
compressor, by which the density of air introduced into the engine woule be able to
increase. Moreover, a direct connection to the functional output of the engine could
make it more efficient to exploit the power generated by the turbine.
A turbo-compounded engine is defined as ‘some mechanical linkage and power
transmission between the exhaust-gas driven turbine and crankshaft of the engine’[5].

22
However, It could be possible to use the same project to describe turbine driven
generator and therefore will exhaust energy recycling system as electrical power. The
mixed configuration of the turbine can be mechanical and electrical. Figure 2.4 shows
the possible arrangement of turbo compounding.
Figure 2.4 Schematics of Turbo Compounding
2.3EngineModeling
For describing reality through a model, there are numerous methods. Different
approaches are different in both accuracy and structure. The chosen method of
modeling basically depends on the particular situation and especially the field of
application. When considering the engine modeling, two main approaches can be
found : Cylinder-by-cylinder engine approaches and mean value engine method. The
first one describes each cylinder individually and generates a torque signal for each
individual combustion pulse present derived from engine geometries, which is useful
for improving and optimizing the engine performance development aspect. The last
method – mean value engine model defines number of cylinders as one, which
occupies whole displacement volume. Its main considered aspects are dynamics of
speed, engine torque, and pressure build-up in the inlet and exhaust manifolds. The
average value over a cycle is used to model the fluctuating flow.

23
For the development of control outline, the engine modeled by mean value method in
zero dimensional are utilized diffusely because of their simplicity and low simulation
throughput. As the subsystem is influenced more lighter by the piston reciprocating
movement than on combustion process, for dynamics of crankshaft and air induction
system of engine, the utilization of the mean value models are accurate enough. The
drawback is that it doesn’t provide the particular knowledge of combustion occurred
in cylinder, for example, pressure of in cylinder gas, temperature of in cylinder gas
and signals denoted for ionization. The latter one would be a key parameter used in
closed-loop combustion control, in the mean time the in-cylinder pressure rise is a
important indicator for developing the knock control by detecting the engine knock.
As for the other modeling approaches, there are many methods that can be used to
determine the model. The most common method is physical equation, which
theoretically describes the system creating a general model working for many
operation areas. Another method used in common is entirely based on measurement.
The data measured is stored as a form of two, sometimes three or more, dimensions,
which depends on the input signals. The exact results are usually provided by the
measurement method which could directly and originally generate by the physical
engine model.
2.4Enginemanagementsystem
The two main active focus of engine research are promotions in increasing fuel
consumption performance and reducing emission. In order to fulfill the pressing
emission regulations and claim for better fuel performance, the progressive control
techniques for engine control are developed. It is of great importance to reduce
emission and improve the fuel consumption performance while compromising the
reliability and consolation riding problems. Engine design stage should always
involve the design of controlling, as it is one of the most complicated issues in the
system [6]. An effective encompassment of the automobile engines with the main soul
of mechatronic systems could provide the emission levels, fuel economy and

24
improved performance, thanks to an abundance of application of actuators, sensors
and electronics as well as control systems based on microprocessor.
Nowadays, the classical mechanical approach has been replaced by the new method
of engine-control missions, which is achieved by the electronic control systems. In
this case, the control strategies established in the system affect significantly the
performance of engine including power, torque, fuel-consumption and emission, etc. The driver making a action to control the vehicle basically based on the demanded
output. The engine management system is designed to provide the demanded value of
the engine working condition. The parameters, such as sparking, air-fuel ratio, speed
at idle condition and other variable like valve timing or another complicated
parameters are desired to be controlled. By controlling these characteristics, the
emissions could be reduced and the efficiency and performance of the engine could be
enhanced.
There are different kinds of sensors with actuators inside the engine management
system. The actual time working parameters of the engine is checked by the sensors
and the electronic device involving in the engine operation such as fuel injector,
throttle valve and spark, are controlled by the actuators. Considering the modules
within the system, some different modules consorted with the module used for torque
controlling would be controlling module concerning about: air-fuel ratio (AFR); idle
speed; electronic throttle; ignition timing; knock; diagnostic and so on.
Except these normal modules, there would be some other modules recognized as other
section of the control modules in an actual production vehicle engine management
system, like camshaft control, EGR, turbocharger, post-processing of exhaust gas.
The basic section overall structure of engine control system would be the torque
control module. The torque control module is the core module to which the other
modules are operating in parallel, for the purpose of producing the output indicators
as desired by the driver. The output of the engine to generate the demand torque is
accomplished by the coordination of torque control module and other module. The

25
manipulation of various parameters like position of intake valve, time of ignition,
duration of injection make the overall torque reference value realized.
Figure 2.5 Schematic of Engine Management System
a) Torque based engine control module
The control strategy based on the engine torque is suitable to meet the increasingly
complex integration of control system of vehicle and engine. It can easily interact
with torque interfaces of external system, like transmission, traction control. This
control module of engine management system can transform the all inputs into the
engine torque variable. The torque variable is recognized as the main connector
between the engine control unit and other functions of vehicle control system[7]. The
engine torque control module give engine actuators suck as throttle position, cam
phase positions, spark advance, an opportunity to realize torque demanded. The
demanded torque could be determined by the driver or vehicle subsystem.
When the driver changes torque demand by changing accelerator pedal, torque value
is transformed as a set point of torque, throughout the transcriber, which is the
interface between the driver and the control unit. The target of it is to translate the
demand produced by changing the position of accelerator pedal. The potentiometer in
accelerator pedal produces an electrical signal and this electrical signal equals to the
demands of torque from the driver decision.

26
A pedal map stores the torque request from driver. From that map, the values could be
interpreted into a demanded torque request as well as taking the other external
demand into consider, depending on the position signal of speed sensor signal and
accelerator pedal. The response of the vehicle corresponding to the pedal position can
be offhandedly influenced by changing the pedal map as the torque demand is the
only interface between the accelerator pedal position and the engine control
strategies[8].
The system of engine torque control is composed of feed-forward and feedback
subsystems. The system offers performance control in both steady state and transient
state. The first subsystems could calculate the desired actuator positions, in which
engine can generate torque as demanded. While last subsystem could use the
estimated torque to rectify feed forward subsystem. The friction, accessory loads and
pumping losses are subtracted from working torque during the conversion from
desired torque by torque control module block. The look-up table is used to import the
torque loss, which relies on engine speed as well as temperature of engine. The
pumping loss is also recognized by a form relying on intake charge as well as engine
speed. In consequence, the caused torque as requested is alternated as useful
torque-impacting control parameters according to control modules, such as injection
time as well as injection deviation in case of torque reduction, the variation of throttle
angle, last but not least waste-gate bypass valve used for turbocharger control, if
equipped. It should be noticed that the throttle system should be considered as an
electronic throttle controlled.
As to set-point of torque, the subsystem modes of control system, such as air-fuel
ratio and ignition, using their individual algorithms to determine fuel amount injected,
air mass flow rate and optimum spark advance for the purpose of acquire torque as
desired. Then the relevant signals are transferred to the modules used to control
actuators, which is recognized as driver circuit. Actuators receive activation signal
from driver circuit. The signal of activation must actuate the needed actuators like
spark plug, fuel injectors and intake air throttle [9]. Therefore, in order to accomplish

27
the torque as required, the different actuators, such as throttle, spark plug, injector,
needs to be managed respectively.
Figure 2.6 Torque Based engine control System
b) Air-fuel ratio control module (AFR control module)
Another important approach of managing the engine operation is air fuel ratio control
module. The air-fuel ratio keeps changing in accordance with the torque demands
generated from the torque formation, taking the engine requirement, such as air
conditioning or warming up of catalyst, and vehicle requirement, like transmission
control and cruise control, into account. For example, when considering the three way
catalytic converter used in the after treatment system, since the three way catalytic
converter reaches optative performance exclusively during the engine operating
condition is in a narrow range about the stoichiometric air-fuel ratio. Therefore the
air-fuel ratio mode has to stabilize the air-fuel ratio in a stoichiometric statu to ensure
the conversion efficiency of the three way catalytic converter remaining maximum.
For a better explanation in another word, the air fuel ratio short excursions can be
permitted if only they do not overcome the capacity of allowing interval and the mean
deviation.

28
Fuel film compensator, mass air flow estimator, air fuel ratio observer and
corresponding controller are the major components of the Air-fuel ratio control
system. These components make use of all the information sensed and generate the
suitable pulse width of injectors
The mass air flow estimator is used to meter the air mass inducted into cylinders as
well as to measure the correct amount of fuel, due to the reason that basic fuel
quantity required for maintaining stoichiometric combustion on the basis of the intake
flow rate and pressure. Generally two types of sensors are utilized to estimate the air
amount of an SI engine: Manifold absolute pressure sensor as abbreviated as MAP
and mass air flow sensor as abbreviated as MAF. For the purpose of calculating the
intake air flow introduced into cylinders and in this way make calculating fuel
demands possible, the manifold absolute pressure sensor applies speed-density
method. This method links the manifold pressure gathered by the sensor and the
temperature of charged air with volumetric efficiency of engine, which is known from
look-up table. The density of intake air flow is estimated via temperature of intake air
and pressure of manifold, therefore, as the density of inlet charge is a given number,
the air fuel ratio mode could obtain the amount of fresh charge expected to be
introduced under the engine operating condition specified by speed and MAP
according to the equation:
𝑊!"# = 𝜂!𝑛!2 𝑉!
𝑃𝑅𝑇
Where 𝑊!"# is the mean value of air introduced into the cylinders, 𝜂! is the
volumetric efficiency of the engine condition. 𝑉! is the engine displacement and 𝑛!
is the engine speed. Obviously the P is the manifold pressure and T is the intake
manifold temperature. 𝜂! is the volumetric efficiency under different engine
condition. This calculation should be accomplished in the form of volumetric
efficiency and should be stored in control unit in the form as map after calibration. In
Mass air flow sensor method, air flow rate is estimated in the intake manifold directly
since the mass air flow sensor is a hot wire anemometer commonly, which could

29
measure the flow in the cylinder with high accuracy only under steady condition [9].
During the transient operation, an additional estimator to correct the input could be
introduced to rectify the final value obtained as air flow induced into cylinder.
Fuel film compensator is a part of air-fuel ratio control system. This compensator
balances the amount of fuel stored and released in the oil film by changing the amount
of fuel injection. It should be used inside port fuel injection system, since partial fuel
amount does not immediately enter the cylinder during injection at the intake port.
The fuel would trench on the port wall, on the reverse side of the intake valve where
there would be a fuel film forming. This fuel film causes diversity between the fuel
injected amount with the fuel induced into the cylinders [9]. In case of not
compensating this lag as difference, there would be major peaks in the air-fuel ratio
response. Because when the inlet valves are open, the injected fuel is not in gaseous
state completely, so it is necessary to describe the model of the mass flow of the fuel
into the cylinder. The fuel mass balance is estimated by the fueling model as a
function of the mass ratio of the injection fuel as input and the fuel flow induced into
cylinders in the form of liquid as output, as a compensation action to balance the fuel
film mass.
Air-fuel ratio observer acquires the information of control circuits concerning the air
fuel ratio in respective cylinder, performing real time observation of air-fuel ratio.
Most of these observer methods rely on the upgrowth of a simplified model for
different aspects. This aspects involve exhaust traffic delay, dynamics effect of
sensors and air fuel mixing appearance. In this air-fuel ratio observer, the
communication requirement is the equivalence air fuel ratio of single cylinder.
Therefore the fundamental measurement is offered by the exhaust gas oxygen sensor
signal, which is abbreviated as EGO sensor. For the EGO sensor, the essential
compensation operation will be executed for the time lag, sensor characteristics and
air fuel mixing phenomena by a suitable type. This EGO sensor offers feedback air
fuel ratio control information in close loop control, which afterwards is periodically
converted to injection time rectification after the information.
30
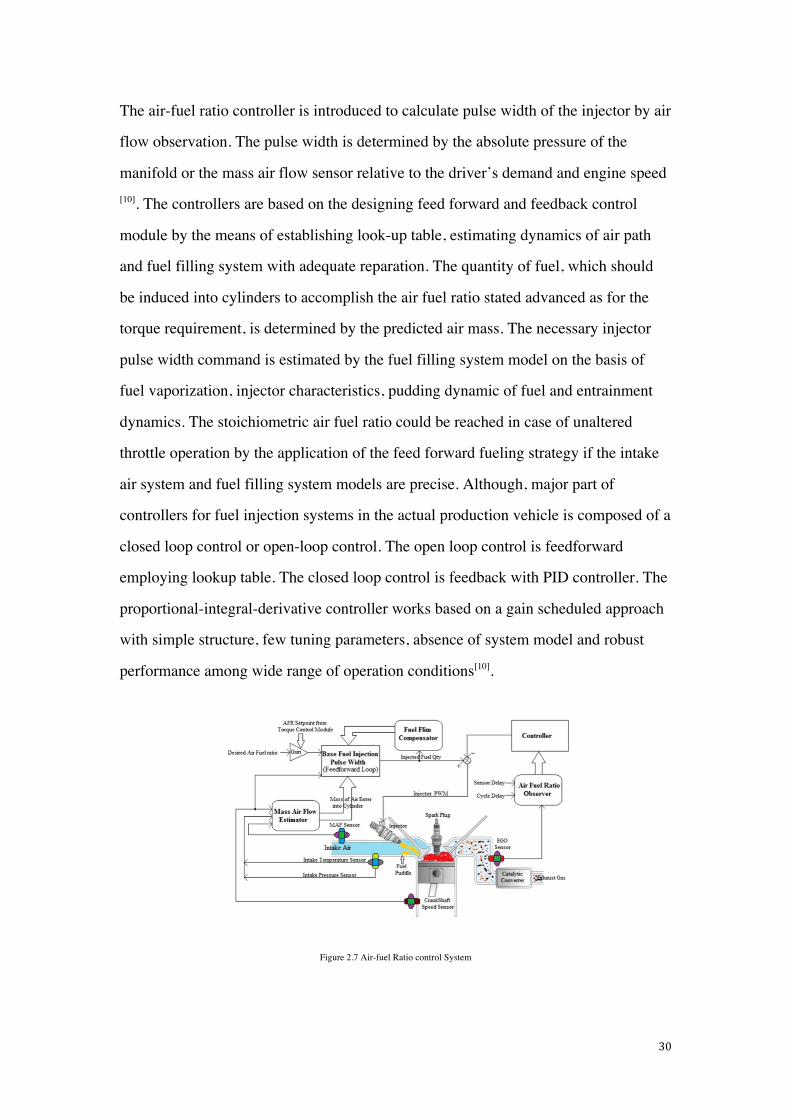
The air-fuel ratio controller is introduced to calculate pulse width of the injector by air
flow observation. The pulse width is determined by the absolute pressure of the
manifold or the mass air flow sensor relative to the driver’s demand and engine speed [10]. The controllers are based on the designing feed forward and feedback control
module by the means of establishing look-up table, estimating dynamics of air path
and fuel filling system with adequate reparation. The quantity of fuel, which should
be induced into cylinders to accomplish the air fuel ratio stated advanced as for the
torque requirement, is determined by the predicted air mass. The necessary injector
pulse width command is estimated by the fuel filling system model on the basis of
fuel vaporization, injector characteristics, pudding dynamic of fuel and entrainment
dynamics. The stoichiometric air fuel ratio could be reached in case of unaltered
throttle operation by the application of the feed forward fueling strategy if the intake
air system and fuel filling system models are precise. Although, major part of
controllers for fuel injection systems in the actual production vehicle is composed of a
closed loop control or open-loop control. The open loop control is feedforward
employing lookup table. The closed loop control is feedback with PID controller. The
proportional-integral-derivative controller works based on a gain scheduled approach
with simple structure, few tuning parameters, absence of system model and robust
performance among wide range of operation conditions[10].
Figure 2.7 Air-fuel Ratio control System

31
c) Electronic throttle control module (ETC module)
In spark ignition engine, the amount of intake flow, which is introduced into cylinders,
is controlled by throttle valve in the inlet system, as well as the cylinder charge. The
cylinder charge determines the output power from the engine and torque. It is
assumed that the throttle valve of the mechanical butterfly valve is directly connected
to the accelerating pedal and throttle body, and the stepping motor is used as an idle
actuator, in traditional mechanical throttle driven technology. The driver operates the
pedal as a control facility in accordance with the demand for torque and engine power,
controlling air flow through intake throttle. In the mechanical condition, the idle
intake bypass valve could be controlled by using a solenoid or a stepper motor in
engine management system. The electronic throttle system has replaced the
conventional mechanical throttle control for multitude of technical benefits. Within
the injection electronic controlled system, the throttle valve in controlled
electronically, thus the accelerating pedal is connected to the throttle facility not in the
mechanical way. The ETC module just stimulates the engine torque demand from
driving action via an accelerating pedal sensor to the engine management system.
Basically the intake valve stays unchanged with this different servo motor operating
the butterfly valve. Engine management system controls the throttle opening angle on
the strength of the control mode of torque as the required signals from the
accelerating pedal position sensor and requirements of additional systems.
Furthermore, the position sensor of throttle is combined into the throttle subsystem to
determine throttle valve actual position. On the basis of the signal from this throttle
position sensor, the electronic throttle retain the closed loop control as to achieve the
throttle opening angle demand from the torque control mode.
The torque demand could be generated by driving action and external additional
subsystems (traction and cruise control for example). The required values of torque
are determined as a set point for the engine by the main controlling mode of torque.
The desired intake mixture charge needs to determine at the beginning to obtain

32
torque needed and the caused value. This value indicates the intake mixture charge as
target, which is essential to accomplish the required torque.
In case of turbocharging engine, as for the represented setpoint of torque, it is
necessary to discuss captured air amount and recirculated exhaust amount. Therefore
the intake air system control could be divided into air mass control (waste gate and
throttle valve) and the recirculated exhaust gas mass control. The required mass of
intake flow is determined by the predefined lookup table on the basis of speed of
engine and torque desired set point. The set point of throttle position is calculated on
the purpose of achieving the intake mixture charge, on the basis of divided physical
model of intake system function. This electronic throttle control module transferred
the information from the position of accelerator pedal to different relevant actuators to
operate the throttle opening or closing independently.
The throttle control system defines the necessary voltage for controlling the motor by
means of respective pulse width modulation signal. As a result, this throttle receives
the signal and the DC motor with brush or a gear mechanism producing the needed
torque to enable the throttle plate to set point angle. Nevertheless, the performance of
ETC module is deteriorated because of friction in servo motor in small-signal
operating condition, causing a slow response. For the sake of improving the
performance under the small signal division working method, controllers extend to
demanded friction. It is common to use PID controller in vehicle EMS production
area, enabling high validity and accurate performance in controlling.
Figure 2.8 Electronic Throttle Control Module

33
Figure 2.9 Pedal Map Example
d) Idle speed control module
The target of this system is quite simple. The idle speed control is used to maintain
the speed of engine approximate to the defined value, which is known as selected
target idle speed, preventing motor to stalling while interference load is added or
subtracted. The interference loads could be caused by kinds of method, such as
battery charging, compressors used for air conditioning, headlamp, electric windows,
battery charging and power steering or complementary electrical accessories which
could influence the engine speed under idle speed operation condition. In that module,
the controller has only to control over the fuel, air, sparking time and recirculated
exhaust gas. The intake flow and ignition timing influence the idle speed mostly,
because there are two main factors controlling the engine speed: the throttle, which
manages the air-fuel mixing and charge amount, as well as spark advance. The control
process utilizing the spark advance system has a quicker response than utilizing the
intake air system. Therefore normally spark advance is firstly used as core input for
controlling. Subsequently, when the intake input starts to govern the engine speed, the
timing value of spark advance returns to numerical value. To simplify this control
strategy, the two control signals are used in parallel and should be aware of each other.
A desired set point value is relative to the spark advance. Therefore, during the

34
changing in other loads, it is possible to implement the idle speed control by adjusting
the air fuel mixture needed to be introduced into cylinders.
The set point of control system under idle speed condition is determined by the
different torque interfaces to the engine under idle speed condition. Only predictable
torque as load is related through the feed forward lookup table of different
interruption, because engine control unit is aware that the accessories are switched on.
After estimating the load torque by the estimated interfaces, by defined spark timing
and air-fuel ratio, the intake air mass could be calculated to remain the idle speed at
predefined set point.
Time lag exists due to the procedure of inlet charge controlling. This response and
stability has to be improved due to the combustion lag, engine identifying lag,
interfaces with external torque, passage delay and additional associated issues in inlet
charge controlling system. These kinds of time delays should be compensated by
means of appropriate compensated model or feed forward methods. Accordingly, a
typical idle speed control module consists of a controller maintaining idle speed set
point, load estimators for idle speed and time lag compensators.
Figure 2.10 Idle Speed Control Module

35
Chapter3EngineModelingUsingMeanValueMethod
3.1Introduction
As discussed in the previous chapter, downsizing is a solution to reduce the engine
consumption and turbocharger is used to keep engine performances in spite of a lower
engine capacity under steady-state and transient conditions. By using the turbocharger
in a downsized engine, it is possible to have intense density of engine power and gain
the capability to overcome different needs under various engine working environment
in the same time. However, heavy engine knock would rise to appear due to the rising
rate of charge pressure and flame temperature. In consequence, the external cooled
EGR gas is introduced to control the knock phenomena in a certain level.
Additionally, it is suggested to adopting variable valve timing technique in order to
adjust the compression ratio which could suppress the engine knock at high load.
Another effective way to decrease engine knock phenomena is using flex fuel like
ethanol instead of gasoline.
To accomplish these technologies, the desired engine control strategies are required to
be sophiscated. On the basis of the development of the control strategy and validation,
a control oriented engine model is needed. The controlling method based on model
can operate the engine with maximum efficiency. The model must have enough
accuracy, including detailed engine dynamics and could be simulated in Simulink. It
is particularly important to furthest improve the performance as well as obeying the
administrational and environmental legislation in the controller design and
development stage. Besides that, it could be confirmed that accomplishing the engine
model analysis earlier on prototyping the engine physical model is a solid approach to
save cost and time of development and research procedure [11].
In this chapter, a mean value engine model is introduced and accomplished. This
resulted model is average combination of higher simulation cycle models and simple

36
phenomenological transfer function models, which could be used for both simulation
and control purposes [12].
3.2MeanvaluemethodandGT-Power
The objective of mean value models is to predict the mean value of the gross external
engine variables and the gross internal engine variables with moderate accuracy, both
in steady state and transient situations [12]. The high accurateness can be familiarly
accomplished by assuming with more complex models. This description has much
longer time scale than a single engine cycle and much shorter time scale than the time
required for a cold engine to warm up (1000 cycles or so)[10]. The time resolution of
the model is just sufficient to describe precisely the variance of the average numerical
value of engine characteristics changing most rapidly [12]. It is divided into two types
of time scale: instantaneous and time developing. The first scale involves a process of
rapid balance, which reaches equilibrium swiftly. This process is composed of
algebraic equations describing various action likes flow passing through throttle valve.
The differential equation, such as the manifold pressure equation, proves that the
development process takes a period of one to three orders of magnitude in the engine
cycle.
In the development of control strategy, the average value of zero dimensional simple
engine model and Simulation of low throughput led to the widespread use of the
engine model, the engine model for engine crankshaft dynamics for air handling
systems or accurate enough, because of the impact of the combustion process
influence the reciprocating movement of the piston of the system on the small.
However, the lack of information about the detailed combustion process of the engine
becomes the defect of the mean modeling method. For example, the temperature, the

37
ionization signal applied for controlling combustion and gas pressure inside the
cylinders as a indicator of the detonation detection of the engine.
For the prospecting of engine combustion process, the phenomena, such as
thermodynamic, formation of pollutant, heat transfer, and fluid flow, could be
described by multi-region, three dimensional computational fluid dynamics models,
which is abbreviated as CFD models, by comprehensive chemical kinetics. For real
time hardware-in-loop simulations, a type of combustion model is necessary to be
accomplished, whose average complexity is in among the CFD models and mean
value models with time based method.
Normally the engine system could be divided into different subsystem such as the fuel
system, valve system, exhaust gas recirculation system, ignition system, and
turbo-compressor system. The engine valve actuation subsystem employs a camshaft
to open and close poppet type intake and exhaust valves. The camshaft is
mechanically connected to the crankshaft, to ensure synchronized motion between the
intake and exhaust valves opening/closing motion and the piston motion. A new
system without camshaft has been proposed to improve the flexibility of the valve
actuating system with an electronically controlled actuator. The control engine fuel
subsystem is mainly realized by the wall wetting phenomena of the port fuel injection
to achieve the required air- fuel ratio and engine output torque. While for the direct
injection fuel system, the spray and mixing motion in cylinder are two important
factors for engine control.
The control-oriented engine model has to be simple with required engine dynamics to
develop and verify the control strategies. Generally the engine model can be divided
into three portions: mean value gas flow model, crank-based combustion model, and
periodic event based model. The high fidelity models could be realized as commercial
software like GT-Power. Also the model could be recognized as consultation models
for simplifying the development of control strategy and verification purposes.

38
The commercial software, GT-Power as designed especially for automotive
powertrain model and simulation, is diffusely adopted in the vehicle industrial field.
By using the object-based design, users are allowed to model an engine part by part
and then module by module. This software mainly use the foundation of one
dimensional fluid dynamics. This fluid dynamics model could describe the motion of
fluid and heat transfer process in tube as well as other fluid components of system.
The ability of this software to provide accurate stable condition simulation results is
acceptable, however, considering transient simulations the ability is relatively low.
In this chapter, the mean value engine model and the GT-Power model are introduced
and the Simulink model is used to verify the control strategy of engine discussed in
the following chapters.
3.3Meanvaluegasflowmodel
The averaged dynamic behavior of each engine subsystem could be described by the
mathematical subsystem models, even if the system could be described as functions
generated during reciprocating motions. The variable quantity of parameters
considered in these functions are time t.
3.3.1 Valve model
In view of same physical characteristic, the engine valve model described below
could be applied to multiple actuators such as the intake throttle, the exhaust gas
recirculation (EGR) valve waste gate. For the hypothesis, the spatial effects of the
connecting pipes are ignored. The isentropic expansion should be considered for
characteristics of thermodynamic[13]. The valve model managing equation would be:
𝑚! = 𝐾!𝑆!𝑃!"𝑅𝑇!"
𝜓(𝑃!"#$𝑃!"
)
where,

39
𝜓 𝑥 =2𝑥 1− 𝑥
12
If x is bigger than 0.5 and smaller than 1, the equation of 𝜓(𝑥) is the upper case, if x
is less than 0.5, the lower case is considered. To explain the symbol, 𝐾! is the
discharge coefficient of valve; 𝑆! is the open area of valve. It should be noted as
𝐾! and 𝑆! are relevant to valve opening angle 𝜃!. 𝑇!"and 𝑃!" are respectively
temperature and pressre of valve upstream; and the mass flow rate across the valve
𝑚! could be obtained eventually. The valve model simulated in the Simulink is
shown:
Figure 3.1 Valve Model accomplished in Simulink
3.3.2 Filling dynamic of manifold model
The manifold models are mostly utilized for inter compressor, inter turbine pipes,
intake and exhaust manifolds. It is assumed that the behavior in these manifolds is an
adiabatic process. The thermodynamic states would be even across the whole division
of manifold. In each engine cycle of the mean value model, the manifold temperature
should be averaged. The equation for filling dynamics behaviors of manifold would
be [14]:

40
𝑑𝑃!𝑑𝑡 =
𝑇!𝑅𝑉!
𝑚!" −𝑚!"#
Where 𝑃!is the manifold pressure. 𝑉!is manifold volume, while the 𝑚!"# and
𝑚!" respectively represents outlet and inlet air mass flow rates.
The manifold model simulated in the Simulink is shown:
Figure 3.2 Manifold Model accomplished in Simulink
3.3.3 Crankshaft dynamic model
If a rigid crankshaft is assumed, the equation could be derived on the basis of the
Newton theory as [14]:
𝑑𝑁!𝑑𝑡 =
602𝜋
𝑀! −𝑀!
𝐽!
where 𝑀! and 𝑀! are the load and brake torque of engine; 𝐽! is the engine
crankshaft rotational inertia.
3.3.4 Turbine and compressor models
It is usually to use energy conservation equations to model turbochargers based on
turbine maps and steady-state compressors. If the turbine mapping equations,
including turbine mass flow and shaft speed, do not require a reduced form, different
turbine mappings for each inlet pressure and temperature combination are required.
To clarify the parameter used in the following equations to describe the turbine and
compressor dynamics, 𝑇!"/!"# and 𝑃!"/!"#are either inlet/outlet temperature and

41
pressre of turbine or compressor; 𝑁!"#$%is the rotating speed of shaft dimensioned in
rpm, while thermal efficiency is denoted as 𝜂.
a) Turbine mapping:
It is commonly used 𝑓!"#$ 𝑎𝑛𝑑 𝑓!"#$! to symbol turbine maps. The turbine maps are
introduced to calculate the reduced turbo mass flow rate 𝑚!"#$ and 𝜂!"#$ as
thermal efficiency. The turbine maps are determined according to speed of turbo shaft
and pressre ratio across the turbine. The actual mass flow rate could be obtained by
equation [14]:
𝑚!"#$ = 𝑓!"#$(𝑃!"𝑃!"#
,𝑁!"#$%𝑇!"
)𝑃!"𝑇!"
and
𝜂!"!" = 𝑓!"#$! (𝑃!"𝑃!"#
,𝑁!"#$%𝑇!"
)
b) Compressor mapping
For the compressor, the principal is similar with turbine mapping case, the equations
should be [15]:
𝑃!"#𝑃!"
= 𝑓!"#$(𝑚!"#$ 𝑇!"
𝑃!",𝑁!"#$%𝑇!"
)
and
𝜂!"#$ = 𝑓!"#$! (𝑚!"#$ 𝑇!"
𝑃!",𝑁!"#$%𝑇!"
)
c) Temperature calculation:

42
The turbine or compressor outlet temperature could be derived on the basis of
Clapeyron equation since the expansion of gas, as well as compressing of gas, for
components of turbocharger are assumed to be isentropic [16]:
𝑇!"#𝑇!"
= (𝑃!"#𝑃!"
)(!!!! )
Nevertheless, in the actual condition, both expansion and compression are not
isentropic; due to existences of thermal efficiency, more enthalpy is left over in the
exhaust, causing the result obtained from the equation above less than the real
temperature of outlet. While the difference is quite small respect to the numerical
value. In hence, the equation is appropriate.
d) Power calculation
Considering power produced from turbine and power required by the compressor,
denoted as 𝐸!"#$and 𝐸!"#$ respectively, which could be calculated as [17]:
𝐸!"#$ = 𝑚!"#$𝐶!𝜂!"#$𝑇!"[1− (𝑃!"#𝑃!"
)(!!!! )]
and
𝐸!"#$ = 𝑚!"#$𝐶!1
𝐸𝜂!"#$𝑇!"[
𝑃!"#𝑃!"
!!!!
− 1]
e) Power balancing of shaft equation of turbocharger
Since power emerged by turbine and power required by the compressor are known,
the difference could be represented as power balance as [18]:
𝐸!"#$ − 𝐸!"#$ = 𝑁!"#$%𝐽!"#$%𝑑𝑁!"#$%𝑑𝑡

43
Figure 3.3 Stage of pressure varying [19]
The turbine and compressor model simulated in Simulink are shown:
Figure 3.4 Turbocharger Model in Simulink
3.4ModelofSIcombustionusingcrank-basedmethod
The objective of combustion simulation is to tie the trapped cylinder mixture
properties with combustion characteristics. The properties of in-cylinder gas are
mixture pressure, mixture temperature and trapped EGR gas mass and the

44
characteristics of combustion should be burn duration, mean effective pressure and
knock.
In this combustion model, combustion related parameters are renewed every crank
degree (ex. temperature and in-cylinder gas pressure). However, some other
parameters, for instance air fuel ratio and IMEP, are renewed once only at particularly
defined crank position every engine cycle. This given crank position indicates a
periodical dynamics of the combustion process. In general, other than in the mean
value model, where all the parameters manifest as continuous functions of time t, all
these parameters are discrete functions of engine crank position.
The crank based modeling approach could also acquire more precise modeling results,
since the entire combustion process is separated into different combustion phases,
which are linked with certain events and serve as a function of crank position. The
combustion phases is composed of five parts : IVC (intake valve closing), IVO
(intake valve opening),EVO (exhaust valve opening), EVC (exhaust valve closing)
and ST (spark ignition timing). The spark ignition timing sets the start point of combustion, which should end with
exhaust valve opening. This duration between EVO and IVC indicates the gas
exchange process and between IVC and ST is compression process. These two
processes preparing the gas-fuel mixture, are also important for combustion process.
a) Gas exchange process model
It should be started talking about the gas exchange from the gas exhaust phase. When
opening valve of exhaust system, the mixture inside the cylinder expands. This
expansion should be considered as isentropic expansion in cylinders, exhaust ports
and manifold. Assuming the pressure of mixture inside cylinders equals to the exhaust
manifold absolute pressure, then the temperature of mixture inside cylinders could be
obtained by [20]:

45
𝑇 𝜃! = 𝑇 𝜃!"# [𝑃!"
𝑃 𝜃!"#]!!!!
where 𝑃!"is the exhaust manifold absolute pressure and 𝜃!"#is the crank position
when exhaust valve is closing.
Subsequently the intake valve opens, while the exhaust valve is still opened, this stage
is called overlapping phase of valves. At this stage, the intake valve starts opening, in
the mean time exhaust valve stays closing. This flow dynamics phase is quite
complicated. To simplify the modeling process of this phase, it should be assumed
that the pressure of gas inside the cylinders is equal to the average value of pressure
of intake manifold and exhaust manifold. Then the gas temperature could be obtained
by [5]:
𝑇 𝜃! = 𝑇 𝜃!"# [𝑃!" + 𝑃!"2𝑃 𝜃!"#
]!!!!
in which 𝑃!"indicates the pressure of intake manifold.
At exhaust valve closed, the mass of residual mixture could be obtained by law of
ideal gas [5]:
𝑀! =𝑃 𝜃!"# 𝑉 𝜃!"#
𝑇 𝜃!"# 𝑅
For the phase from exhaust valve closing to intake valve closing, the fresh charge is
induced from intake system to individual cylinders. It should be noticed that the
pressure inside cylinders is mostly affected by intake manifold pressure with a
volumetric efficiency. The volumetric efficiency could be gathered as a table function
of speed of engine and load.
𝑃 𝜃! = 𝑃!"𝜂!"
where 𝜂!!is the volumetric efficiency of intake system of the engine. The temperature
of mixture inside cylinders could be determined as [5]:

46
𝑇 𝜃! = 𝑇 𝜃!"# [𝑃!"𝜂!"𝑃 𝜃!"#
]!!!!
As explained in valve overlapping phase, the total mass of charge mixture introduced
to the cylinders for compression and combustion strokes at the period of closing the
intake valve could be [7]:
𝑀! =𝑃 𝜃!"# 𝑉 𝜃!"#𝑇 𝜃!"# 𝑅
= 𝜂!"𝑃 𝜃!" 𝑉 𝜃!"#𝑇 𝜃!"# 𝑅
Then the remaining phase of gas exchange process is the compression phase without
combustion, the pressure and temperature of mixture inside cylinders are on the basis
of ideal isentropic gas law [12]:
𝑃 𝜃! = 𝑃 𝜃!!! [𝑉 𝜃!!!𝑉 𝜃!
]!
𝑇 𝜃! = 𝑇 𝜃!!! [𝑉 𝜃!!!𝑉 𝜃!
](!!!)
where 𝑉 𝜃! is the volume determined by crank angle 𝜃! given as the equation:
𝑉 𝜃! = [12+
1𝑟 − 1+
𝐿𝑆 −
cos 𝜃!2 −
𝐿!
𝑆! − 𝑠𝑖𝑛!(𝜃!)]
𝜋𝐵!𝑆4
r is compression ratio, s is piston stroke, L is connecting rod length and B is piston
bore.
b) Spark ignition combustion model
In spark ignition combustion mode, any desired crank position spark timing could
control the start of combustion. The S-shaped Wiebe function could represent the
mass fraction burned of induced fuel after spark timing [4]:
𝑥 𝜃! = 1− exp [−𝑎(𝜃! − 𝜃!"∆𝜃!"
)!!!]

47
where ∆𝜃!" is the predicted burn duration of SI combustion mode; and m is the
Weibe exponent, coefficient a depends on the definition of burn duration ∆𝜃!" and it
is a function of m. In this model, m=2 and a=3 is set.
To simplify the combustion process, it should assume that burned charge is uniformly
mixed as well as the unburned charge in one zone. Then the combustion process could
be recognized as heat transfer action. Hence in-cylinder gas temperature would be
given as [21]:
𝑇 𝜃! = 𝑇 𝜃!!! [𝑉 𝜃!!!𝑉 𝜃!
](!!!) +𝜂!"𝑀!𝐻!"# 𝑥 𝜃! − 𝑥 𝜃!!! − 𝜃!
𝑀!𝐶!
Q denotes the heat transfer reaction. The heat transfer should occur among mixture
charge inside the cylinder and inner wall of cylinder, representing as just convection
exists[22]:
𝑄 𝜃! = 𝐴!ℎ![𝑇 𝜃!!! − 𝑇!]
By considering the methods, the complicated thermodynamic process could be
predigested as a combination of two processes: volume change as isentropic change
and heat absorption of burned mixture. The first process should not consider the heat
exchange for each crank degree and the second process should not consider the
volume change in an infinitesimal time phase.
c) Engine torque computation
By using a simple integration based on cylinder volume profile and pressure profile,
the engine indicated mean effective pressure, which is abbreviated as IMEP, could be
determined [22]:
𝑃!"#$ =1𝑉!
[𝑃 𝜃! ∗ (𝑉 𝜃! − 𝑉 𝜃!!! )]!!!"#
!!!
and 𝑉! = 𝑉(𝜃!"# − 𝜃!"#) as cylinder displacement.

48
Eventually, the engine torque output is calculated as[18]:
𝑇! =60𝑛(𝑃!"#$ − 𝑃!"#$)𝑉!
2𝜋𝑁!
where n denotes the engine cylinders number.
d) Fueling dynamic
For the fueling systems, normally there would be two type of injection: direct
injection and partial fuel injection. For the direct injection, it is difficult to model the
fuel vaporization as well as to model the mixing process of air and fuel vapor. On the
contrary, the combustion is less influenced by direct injection in the dynamic aspect.
Therefore, some assumption could be made that the overall amounts of fuel direct
injected for each cycle are fully vaporized and resulting uniform air fuel mixture.
While considering partial fuel injection fuel, charge mixing inside cylinder as well as
vaporization are not ideally finished. The wall wetting phenomena of the fuel
spraying on the intake port and on the back of intake valve should be considered [13].
The wall wetting phenomena equation could be demonstrated by [13]:
𝑀!"#$ 𝑘 = 𝛼 ∙𝑀!"# 𝑘 − 1 + 𝛽𝑀!"#[𝑘]
𝑀!"# 𝑘 = (1− 𝛼) ∙𝑀!"# 𝑘 − 1 + (1− 𝛽)𝑀!"#[𝑘]
where coefficients 𝛼 and 𝛽 are index about functions of speed, load and coolant
temperature of engine; k indicates the engine cycle number.
3.5EngineModelinginGT-Power
GT-Power is designed to be used to simulate all kinds of internal combustion engine.
By dragging and dropping objects in the graphical user interface, the model could be
constructed with the component database offering a brand range of engine
components. Then after linking each component with appropriate logic, it would be
49
possible to define the properties of each component and set up the simulation options.
Before running the simulation, the desired output plot could be specified. Sometimes
a model of references is needed to describe the detailed object to the program.
The engine used is a single-turbo 4-cylinders spark ignition engine with partial fuel
injection and EGR controller. The model is based on the engine with single turbo
4-cylinder partial injection engine. However, the reason why utilizing the single-turbo
and bypass control method is to enrich the content of this project and to simulate an
engine development period and test the control strategy. The engine profile is in the
appendix.
To build the engine cylinder model, the inlet boundary conditions should be defined
firstly. Normally the EndEnvironment template (see appendix 1) could be utilized to
accomplish that. The boundary condition is defined as temperature and pressure of
environment. The piperound component could be used to model intake runner and
intake port, as well as the exhaust port and exhaust runner. It should be noticed that to
distinguish different parts modeled by same component in software, the knowledge of
dimensions, roughness from material, initial state, thermal and pressure conditions
should be available. In the software library, some predefined attributes with
corresponding values could be used to represent common conditions. The icon of
component used could be explained in the appendix. The modeling process of some
main subsystems of the engine should be clarified in the following sections.
3.5.1 turbocharger
The turbocharger used is single stage, consisting three main parts for each
turbocharger: turbine, compressor and shaft with bearing. The turbine and compressor
are mounted on the same shaft and rotate with the same angle velocity. The turbine is
driven by the exhaust gas, which contains energy due to the engine inefficiency. The
compressor increases the density of inlet air induced into each cylinder. A waste gate

50
controls the boost pressure. The fuel economy of a turbocharger engine is influenced
by the same factors as in the natural aspirated engine.
The single turbochargers provide a way to generate high engine output torque during
low engine speed working condition. The utilized way of limit boost pressure is
wastegate method, which is using a valve that in the case of opened valve, the exhaust
gas could bypass the turbine. A feedback path to exhaust system downwards of
turbine appears. [14].
The wastegate is pressure controlled by proportional-integral control pressure. A
proportional valve produce the pressure, which is smaller than the boost pressure.
This proportional valve ensures that the diaphragm is controlled by the boost pressure
and inlet pressure of compressor in changing proportions [15]. Electronic system of the
engine participates in the controlling of this pressure valve. The bypass valve routes
exhaust around the turbine and dissipates pulse energy directly to the environment
through exhaust pipe. The pre-loaded spring determines the pressure at which the
wastegate actuator opens, making the maximum boost pressure remain constant.
To start building the structure of the turbocharger, the templates should be expanded
by importing the parts necessary from the library, such as FlowSplot General, End
flow cap and pipe rectangle. In the connections sections from library, the orificeconn
components should be predefined as nocond and bellmouth. After dragging the
compressor, turbine, shaft, valve for bypass control with corresponding actuator and
some pipes, it is necessary to calibrate the intercooler inside the intake system. During
this modeling period, the internal specific geometry is not known; therefore, another
simple model is introduced to obtain the desired intercooler dimensions from pressure
drop and temperature drop effect needed. The model is shown as followed.
Figure 3.5 Intercooler dimension test model

51
To adjust the cooler, it should control the pressure drop and temperature drop as
difference of inlet entry with outlet outflow. With a certain flow rate, if the pressure
drop match the experiment, it means the cooler is suitable for the engine model.
Then to model the turbine and compressor, the volumetric efficiency and performance
map of turbine and compressor should be measured. After running the basic engine
model to guarantee that valves, manifolds and cylinders are modeled correctly, a
engine modeled turbocharger without turbine should be introduced, maintaining the
turbine intake condition model as environment condition. The compressor
performance could be tested before making engine model more complex. By
adjusting attributes of rack as position and array, the compressors geometry could be
varied with unique compressor performance map. After running the model and obtain
the acceptable results of compressor, the turbine component could be added. Turbine
could be added and replace the compressor to finish the testing without compressor,
by repeating the same methodology as testing the compressor. Finally, before
connecting the components with appropriate logic and ShaftTurbo components, the
compressor and turbine should be calibrated in the range of power to get the desired
mass flow rate.
The model made in GT-Power is shown as followed:
Figure 3.5 Turbocharger Model in GT-Power (see appendix 1 on detail on symbol)

52
3.5.2 EGR controller
The EGR flow is regulated by valves. In the Exhaust gas recirculation system, the
controller is used to determine the amount of recirculation exhaust gas by gathering
the engine load and driver demand from the accelerator pedal or intake throttle.
The EGR gas is measured in this system by CO2 concentration in the intake tank. The
exhaust gas recirculation amount in the intake charge is needed to predict the
available volume of fresh air inside cylinders. By using the measurement of CO2
concentration of exhaust gas, the Exhaust gas recirculation amount of intake charge
could be calculated, under the assumption as molecules of CO2 are uniformly
disposed inside the exhaust gas. With this assumption, single CO2 molecule in the
intake gas could correlate to a definite percentage of Exhaust gas recirculation. The
equation could be explained as:
𝐸𝐺𝑅!"#$%& % =𝐸𝐺𝑅!"#$%&𝐸𝑥ℎ𝑎𝑢𝑠𝑡 ∗ 100 =
CO!𝑖𝑛𝑡𝑎𝑘𝑒 − 0.04𝑐𝑜!
The EGR controller used in this model is shown as followed:
Figure 3.6 EGR Controller in GT-Power (see appendix 1 on detail on symbol)
It is important to adjust the parameter as EGR throttle discharge coefficient to
maintain the exhaust gases percentage in a right range of values. The total target
exhaust gas recirculation fraction could be ignored when multiple EGR paths present.
The flow connection part could be defined as valve stored in template.

53
Figure 3.7 Setting of EGR Controller
3.5.3 Intake, exhaust system and Intercooler.
The intake system is composed of an air filter, a throttle and a throttle with individual
fuel injectors. There would be pressure losses since the mixture crosses over single of
those components, which relies on engine speed, the cross-sectional area, the flow
resistance or components material and the charge density. In the orifice conn named
bellmouth, which connects the endenvironment part, the discharge coefficients as
forward with reverse direction should be considered. This orifice is design to
guarantee the transition from environment to pipe without losses in the first
subsystem. Some piperound components are introduced to represent path and air filter
of intake system, as well as an orifice for throttle restriction. As for the modeling of
intake manifold, a series general pipes and flowsplits should be considered.
The exhaust system typically consists of an exhaust manifold, exhaust pipe and a
catalytic converter for controlling the emission with a muffler or a silencer.
The intercooler is used to cool the air that comes from the compressor. When using a
turbocharger, the air density increases and hence the inlet charge temperature increase
in the same time. By using an air-air cross flow heat exchanger, the pressure and
temperature drop could be achieved to eliminates the danger of knock, preserving the
benefit of more air-fuel mixture burn per engine cycle, increasing the output of the
engine.
The models of these systems or component are shown as followed:

54
Figure 3.8 Intake and Exhaust System Model in GT-Power (see appendix 1 for explanations on symbol)
3.5.4 Overall engine model
Inside the modeling process of engine, the engcylinder object is special since main
inputs are defined as reference objects. The reference could indicate heat transfer,
wall temperature, combustion, geometry and flow inside cylinder. Each cylinder
should be connected to the engine cranktrain object with appropriate firing order.
The engine model made by GT-Power is shown as followed. It should be noticed that
the aftertreatment device is not accomplished as detailed as possible since the
objective of this project is not concerning about the engine emission. The

55
dynamometer model is included in this engine model. The parameter or Simulink
simulation plot could be set up during the modeling.
Figure 3.9 Overall Engine model without SimulinkHarness mode (see appendix 1 for explanations on symbol)
3.6 Conclusion
In this chapter, the engine model is accomplished in the GT-Power environment. The
mean value method of modeling is adapted during the modeling process. By using
GT-Power, the modeling procedure is simplified and the modeling diagrams are
demonstrated more directly.
In the next chapter, the control strategy of engine control system would be simulated
in Simulink. The engine model developed in this chapter would adjusted to couple
with model of control system in the following chapters.
56
Chapter4Enginecontrolstrategysimulationin
Simulink
4.1 Introduction
The operating action of driver, as well as road conditions, is changing continuously.
These nonlinear phenomenon are the basic consideration of engine control system.
The control of the nonlinear system on real time field is a sophisticated mission. In
general, the solution of the controller design implies discovering the correct
expression of the control operations in mathematical equations that satisfy a series of
required performance standards. The developing procedure of the control system
should develop high level system demands firstly, The demands are usually abstract
and verbal, also barely indicate to a identifiable design problem. The control module,
as the result of this procedure, will be arranged in bulk to the final product. The object
of development in this control system is to offer a dependable, robust and renewable
alignment of operations to develop engine control units.
Recently, with the development of computer aided design and analysis tools, the
efficiency of design processes has been improved significantly. As discussed in
previous chapter, the application of model-based controller design has increased. The
engine-control system should comprise air fuel ratio control, idle speed control,
anti-knock control, exhaust gas recirculation control, ignition control and transmission
control. It can be ensured that engine could work around optimal states during all
operation at the range of fuel economy, emission and driving comfort by engine
control system.
Fuel injector is the main driving mechanism of air fuel ration control. The mass air

57
flow rate could be obtained by throttle angle defined from driving action, and
eventually this rate could determine the fuel flow as proportional.
The idle speed control is used to estimate and govern the speed of engine by
regulating airflow rate thanks to valve in intake throttle, perceiving vehicle quality,
ensuring low emission with better fuel economy. The crankshaft angular position and
engine speed are needed for this control.
In this chapter, air-fuel ratio control strategy of the engine and the control strategy of
single turbocharger with bypass control would be discussed. The engine conditions
concerned would include three different working conditions: Stable condition,
transient condition and idle speed condition. Furthermore, the structure of these
models and the general simulating processes is described. If the result show that the
controller can choose the relevant controller for different operating condition
automatically and make the air-fuel ratio reach the expect value, it could prove the
correctness of the control strategy.
4.2 Themodelingofair-fuelratiocontrolmodule
The air fuel ratio control, also recognized by lambda control, needs the information
provided by the Exhaust gas oxygen (EGO) sensor for the feedback control. The
behavior of this sensor is extremely nonlinear. This sensor could produce a voltage,
which is proportional to the oxygen amount remaining in exhaust gas. The sensor
could point out the intake air fuel mixed gas is rich or lean.
In the model developed in this chapter, the three different operating conditions control
strategy are achieved: stable operating, transient condition (concerning acceleration
and deceleration) and idle speed control. By using the switch mode, a total air-fuel

58
ratio controlling mode is accomplished. This model could determine the different
working conditions and automatically choose the corresponding control mode for
each working condition. Theoretically speaking, when the throttle angle equals to zero,
the idle speed mode should be chosen, however, in real condition, the throttle angle is
not completely closed during the idle speed mode, so the value of throttle angle as 2.6
degree is defined. When the throttle angle variation rate of change is greater than 3
degree, the controller transfers into transient control mode. The structure of overall
controller mode is shown as followed:
Figure 4.1 Overall Controller Model in Simulink
4.2.1 Stable operating controller
The stable operating controller mainly based on the open loop control mode and close
loop fixed mode. The open loop control adjusts the fuel injection amount by the
velocity-density method of the mean value model. The intake air flow rate is
calculated by the mean value model. Hence the fuel injection amount could be
determined by the stoichiometric air-fuel ratio.
The core control equation of this mode is to calculate the intake air-flow rate, the
equation should be:

59
𝑚!! =𝑉!
120𝑅𝑇!𝜂!"#𝑁𝑃! = 𝐶(!,!!)𝑁𝑃!
𝑚! = 𝑚!!/(𝐴/𝐹)
In the equation, 𝑚!! is the intake air flow rate with unit as kilogram per second, N is
engine speed with unit as revolutions per minute, 𝑃! is the manifold air pressure
with unit as bar; 𝑉! is volume of engine cylinders with unit as cubic metres; 𝜂!"# is
volumetric efficiency, 𝑇! is intake air temperature with unit as kelvin; 𝐶(!,!!) is
the coefficient of pumping air.
Actually the coefficient 𝐶(!,!!) is a function of engine speed and intake manifold air
pressure. The coefficient should be obtained by the calibration test of engine, storing
in the ROM of the controller by the form of table. During the real operating condition,
the coefficient 𝐶(!,!!) should be obtained by look-up table method.
In the model developed in this project, the coefficient 𝐶(!,!!) could be obtained by
the calibration test of engine modeled by GT-Power. During the calibration test, the
typical operating conditions should be defined, then determined the corresponding
intake manifold air pressure 𝑃! and intake air flow rate 𝑚!!. Eventually the
coefficient 𝐶(!,!!) could be calculated by the equation and the table of coefficient
should be listed. This method is completely practical, however, in this project, to
simplify the model, the empirical formula is used to replace the complicated
calibration method [21]:
𝑚!! = −0.366+ 0.08979𝑁𝑃! − 0.0337𝑁𝑃!! + 0.0001𝑁!𝑃!
The Exhaust gas oxygen sensor, sometime recognized like lambda sensor, estimates
the proportion of oxygen amount of exhaust gas to dynamically adjust the air-fuel
ratio. The signal of exhaust gas oxygen sensor is switch type: when the sensor detects
the air-fuel mixture is rich (greater than stoichiometric air-fuel ratio), the output signal
is high voltage; while the air-fuel mixture is lean (less than stoichiometric air-fuel

60
ratio), and the output signal is low voltage. A hyperbolic tangent function could be
used to present that function:
𝐸𝐺𝑂 = (1− tan 20 ∗𝐴𝐹 − 14.7 )/2
The closed loop correct mode is to adjust the injection fuel amount based on the
feedback signal generated by exhaust gas oxygen sensor.
The Proportional-integral control (PI control) is utilized to control the EGO sensor
signal. The expression of PI control is:
𝑒! =0.5 𝐸𝐺𝑂 ≤ 0.5−0.5 𝐸𝐺𝑂 > 0.5
𝐶!" = 𝑃𝑒! + 𝐼𝑒! 𝑑𝑡
where 𝐶!" is the correctness value of injection fuel amount.
The structure of stable operating controller is shown as followed:
Figure 4.2 Stable Operating Controller in Simulink
4.2.2 Transient operating condition controller
The fundamental aspect of transient condition lies in its operating discrepancies
compared with steady state operation. During the transient operation, both the engine
speed and the amount of injected fuel change continuously, consequently, the
air-supply and the boost pressure to the engine cylinders are influenced [16].

61
Under the transient operating condition, due to the gas filling effect, the MAP
(manifold air pressure) sensor can not measure the intake manifold air pressure with a
high accurate. Additionally, the fuel injected by the injector is not the same as the fuel
induced into the cylinder for the compression and expansion stroke, since the intake
pipe dynamic oil-film effect and wall wetting phenomena. To eliminate the air-fuel
ratio deviation caused by the factors described above, two correction modules are
introduced into the transient operating condition controller model: Observer of intake
pressure and correction of dynamic oil-film.
The observer of intake pressure generates an estimated value of intake pressure under
transient working conditions by calculating the equation based on the mean value
model. During the calculation of cycle intake air flow rate, the actual measured value
is replaced by this estimated value. The calculation model of this observer would be
represented by the equation as:
𝑚!" = 𝑓(𝜃)𝑔(𝑃!)
where 𝑚!" is the air flow rate at throttle, 𝑓(𝜃) is a function of throttle angle with
unit as degree, the equation is[23]:
𝑓 𝜃 = 2.821− 0.05231𝜃 + 0.10299𝜃! − 0.00063𝜃!
g(𝑃!) is the function of intake air pressure as estimated value.
𝑔 𝑃! = 2 𝑃!𝑃! − 𝑃!! sign 𝑃! − 𝑃! /𝑃!sign (𝑃! − 𝑃!)
where sign() is the signum function, 𝑃! denotes the ambient air pressure.
The intake manifold pressure could be calculated as
𝑃! =𝑅𝑇!𝑉!
(𝑚!" −𝑚!!)
And the fuel injection amount could be calculated in the same way as described in the
stable operating condition by stoichiometric air fuel ratio.

62
The correction of dynamic oil-film mode is structured based on the fuel evaporation
and oil-film model of mean value model. The equation to describe the mode would
be[23]: 𝑑𝑚!!"
𝑑𝑡 = 1/𝑇!(−𝑚!!" + 𝑋𝑚!"#$)
Where 𝑚!"#$ is the fuel injection mass flow rate; 𝑚!!" is the oil-film evaporated
mass flow rate; 𝑇!is the time constant as oil-film evaporation (equals to 0.25), the
fuel directly formed vapor after injection vaporization could be determined by the
coefficient X:
𝑚!" = (1− 𝑋)𝑚!"#$
𝑋 = 𝑎! + 𝑎!𝜃
The coefficient X describes the ratio of fuel deposed on the intake pipe. The two
coefficients 𝑎! and 𝑎! are valued as 0.01 and 0.00889 respectively.
The effective fuel mass flow injected into cylinder could be determined as:
𝑚!"# = 𝑚!" +𝑚!!"
A recompense coefficient 𝐶!"! = 𝑚!"#$/𝑚!"# could be calculated to revise the
injection fuel amount of open loop control value.
The overall transient condition controller model is shown as followed:
Figure 4.3 Transient Condition Controller Model in Simulink

63
4.2.3 Idle speed control condition
As described in chapter 2, the idle speed control is used to estimate and govern the
speed of engine by regulating airflow rate thanks to valve in intake throttle,
perceiving vehicle quality, ensuring low emission with better fuel economy. By taking
various load torque demands into account, the controller provides the throttle angle to
controlling system referred to the set value of the idle speed [4].
For the engine idle speed control, fuzzy logic control – a mathematical system that
analyzes the analog input values based on the logical variables, which present a
continuous value between 0 and 1, contrary to the classical or digital logic which
operates as true or false – is widely proposed to be used. However, due to the
complicated algorithm and difficulty in understanding, PID control is more classical
to be used in idle speed control field, as well as for didactic reasons.
PI control model is used to design the idle speed controller. The controller model
could be represented as [24]:
𝛽 𝑡 = 𝐾! 𝑁!"# − 𝑁 𝑡 + 𝐾! (𝑁!"# − 𝑁 𝑡 )𝑑𝑡
where the 𝑁!"# is the target idle speed set-point, 𝐾! and 𝐾! are the integral and
proportional coefficient respectively.
The PI controller model is shown as followed:

64
Figure 4.4 Idle Speed Condition Controller in Simulink
The type of integral part is numerical. Considering the actual operating of this
controller is synchronized with crankshaft, a trigger signal is needed to simulate the
synchronized rotation.
In addition, in actual structure of PI control system, it is necessary to make
suppression of the system to make the effect of anti wind-up.
4.3 Controlofturbocharger
The turbocharger group is made up of a turbo compressor and a turbine installed on
the same shaft. The turbocharger is used to increase the pressure of the intake air
going to the engine using part of the enthalpy of the exhaust gas and converts the
thermodynamic energy into mechanical energy to move the compressor.
The compressed air coming out from the compressor enters the intercooler to be
cooled and to increase its density before reaching the intake manifold and entering the
cylinders.
The target of utilize the turbocharger is to allow the engine generates high torques at
low engine speeds. In this respect, the turbine housing is designed for the working
condition at low speed with low exhaust gas mass flow rate. Therefore, in order to
prevent the turbocharger from overloading during the high engine speed condition

65
with higher exhaust gas mass flow rate, some control method governing the utilization
should be used. Most used turbocharger control methods are waste gate controlling
and variable turbine geometry controlling.
The most accepted way of limit boost pressure is wastegate method, which is using a
valve that in the case of opened valve, the exhaust gas could bypass the turbine. A
feedback path to exhaust system downwards of turbine appears.
Figure 4.5 Example of Turbocharger controller
The wastegate is pressure controlled by proportional-integral control pressure. A
proportional valve produce the pressure, which is smaller than the boost pressure.
This proportional valve ensures that the diaphragm is controlled by the boost pressure
and inlet pressure of compressor in changing proportions. Electronic system of the
engine participates in the controlling of this pressure valve.
The intake manifold air pressure sensor generates a pressure signal, which is applied
to the waste-gate diaphragm. The force generated by the pressure valve suppress the
spring thus opening the bypass valve. The bypass valve routes exhaust around the
turbine and dissipates pulse energy directly to the environment through exhaust pipe.
The pre-loaded spring determines the pressure at which the wastegate actuator opens,
making the maximum boost pressure remain constant. However, with the usage of
electro-valve, it is possible to set the maximum boost-pressure based on the engine

66
working conditions. Engine control uses the information of air quantity (estimated by
speed density method as described in previous pages), of engine speed and throttle
position to define a target boost pressure map. A closed-loop algorithm is used to
minimize the difference between actuated and target pressure.
Figure 4.6 Turbine Map
Another way for turbocharger controlling is to use variable turbine geometry. In this
kind of method, the cross section area of turbine flow could be changeable according
to the engine working condition. This kind of method makes the energy stored in
exhaust gas to be employed in maximum extend under all operating conditions by
modified the turbine’s flow resistance continuously, increasing the efficiency greatly.
An adjusting ring is rotated to provide simple adjustment of the blade angle.
The design of a boost controller for the turbo engine system is difficult due to the
nonlinearity of the system (governed by partial differential equations and geometry
complexity). There would be two methods of boost control design proposed. One is
classical Proportional-Integral-Derivative control with no process model required and
another one is linear quadratic compensator, which is a state space controller
requiring a process model [18].
In this paper, the PID controller is utilized. This 3 terms controller use an error signal
to 3 terms, attaining a control signal. The first term is proportional to the error

67
performing as a simple gain, while the second term integrates the error successively
multiplying the signal by a gain and the third term differentiates the error multiplying
the signal by a gain.
The PID control can be tuned without a specified process model using
Ziegler-Nichols tuning method. The Ziegler-Nichols method demonstrates that for the
step function response, the 𝐾! and 𝐾! gains are set to zero initially while 𝐾!
incrementally increases until it reaches 𝐾!, the gain value at which the output of the
loop starts to oscillate. The model yields the gain value and the period 𝑇! are equal
to 2 and 1.2 respectively. The PID control gain are set by Ziegler-Nichols PID tuning
method as shown in table followed [18]:
𝐾! 𝐾! 𝐾!
PID control gain 𝐾!/1.7 𝑇!/2 𝑇!/8
The structure of PID control simulated in Simulink are shown:
Figure 4.7 PID controller of Boost Control
Therefore the total control model simulated in Simulink is accomplished. The overall
control model is shown:

68
Figure 4.8 Overall Structure of Control System in Simulink
4.4 Conclusion
In this chapter, the engine control system and turbocharger controller are modeled in
Simulink environment. The air fuel ratio control strategy is utilized for engine control.
Three different operating conditions of engine, such as idle speed condition; stable
condition and transient condition are accomplished. The turbocharger controller is
modeled based on the PID control theory.
In the next chapter, the Simulink model and engine model developed in previous
chapter would be coupled inside Simulink environment to verify the function of
engine control system model in this chapter.

69
Chapter5 ImplementationofEnginemodelin
Simulinkenvironment
5.1 Introduction
The coupling of GT-Power and Simulink is based on the control module in the
GT-Power software. To achieve the coupling of these two models, the control module
in GT-Power including SimulinkHarness (The mode used for outside environment
signal connecting), sensorCon (The mode used as a sensor and generates signal),
actuatorCon (The mode used as a actuator to make the engine control strategy change
the engine), and monitorSignal (a customized outputmode) is used. The schematic of
the coupling of GT-Power and Simulink simulation is shown as followed:
Figure 5.1 Schematic of Coupling
The sensor in the GT-Power model gathers the engine speed, intake manifold air
pressure, exhaust gas oxygen signal, intake temperature of the gasoline engine and

70
generate them as input signal. Then the signal is transmitted into Simulink model via
SimulinkHarness mode, while the target idle speed and predefined profile for the
throttle angle are imported into Simulink control model directly. Some other
performance indicated characteristic generated by engine model indicated can be
directly shown by the scope function in Simulink. In the Simulink model, the engine
speed gathered by the sensor and the speed desired by the input profile defined makes
difference. The difference is utilized by the each control subsystems for the three
different working conditions, to calculate the cycle injection amount accomplishing
the air-fuel ratio control and idle control of the engine under different operating
conditions. Also the throttle angle is calculated by the Simulink control model. The
throttle angle and injection amount are used as output signal, transmitted into
simulinkHarness model in the GT-Power model and achieving the control of throttle
valve, bypass valve of exhaust system and injection system to achieve the air-fuel
ratio control, idle speed control and turbocharger control.
5.2 SetupofGT-PowerModel
Based on the engine model already developed in the previous chapter, set up the
engine model for the coupling is easy to be achieved. The sensor and the actuator as
well as the SimulinkHarness part are the components needed to be drag into the file
from the library. Several sensors are used to measure the engine performance
indicators and generate the signal which should be transmitted to the Simulink model
via SimulinkHarness. The sensors utilized includes sensor for the engine speed with
dimension as rpm, the sensor for the intake manifold pressure with dimension as bar,
the sensor for the exhaust gas oxygen which output should be a Pulse width module
signal as high or low, the sensor measuring the engine torque, actual boost pressure
used for the turbocharger waste gate control and the sensor measuring the air-fuel
ratio to demonstrate the correctness of the air-fuel ratio control strategy developed in
Simulink. Each sensor should be connect to the simulinkharness or a plot mode as
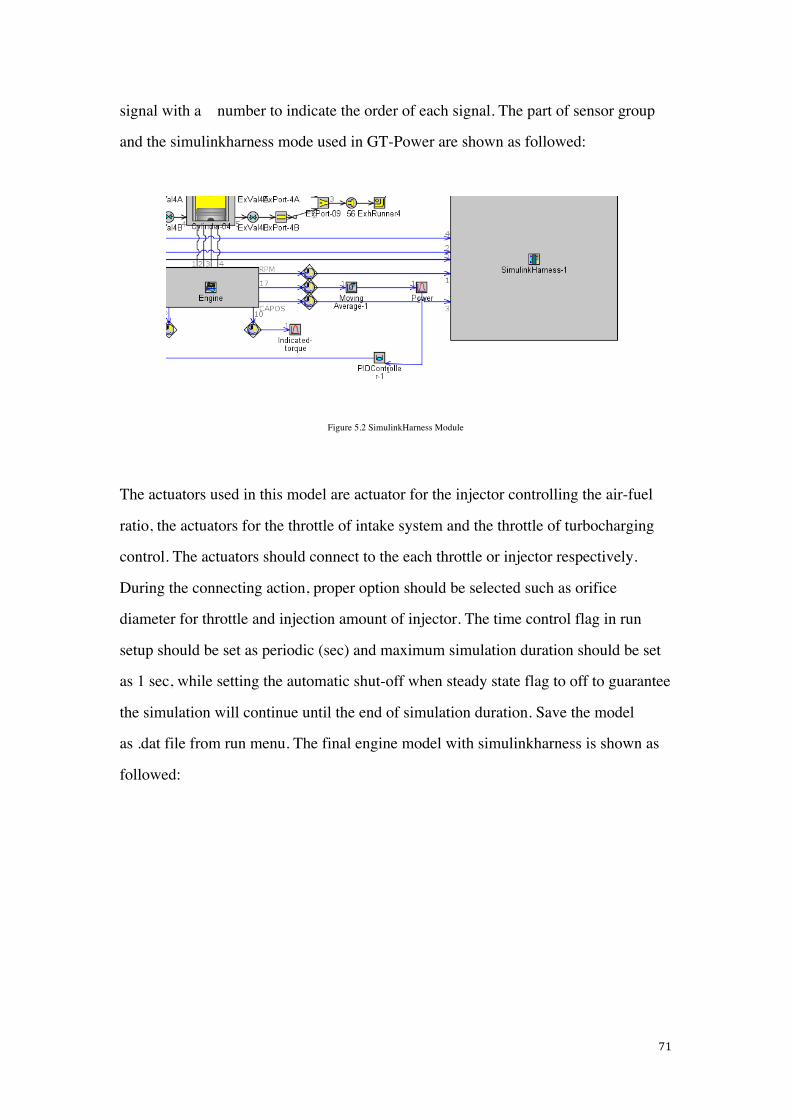
71
signal with a number to indicate the order of each signal. The part of sensor group
and the simulinkharness mode used in GT-Power are shown as followed:
Figure 5.2 SimulinkHarness Module
The actuators used in this model are actuator for the injector controlling the air-fuel
ratio, the actuators for the throttle of intake system and the throttle of turbocharging
control. The actuators should connect to the each throttle or injector respectively.
During the connecting action, proper option should be selected such as orifice
diameter for throttle and injection amount of injector. The time control flag in run
setup should be set as periodic (sec) and maximum simulation duration should be set
as 1 sec, while setting the automatic shut-off when steady state flag to off to guarantee
the simulation will continue until the end of simulation duration. Save the model
as .dat file from run menu. The final engine model with simulinkharness is shown as
followed:

72
Figure 5.3 Engine Model used for Coupling
5.3 SetupofSimulinkModel
To coupling the Simulink model with GT-power engine model, the engine model
should be imported as a single block in the Simulink library, since the Simulink is the
main environment of the simulation coupling. To have a branch of GT-Power model
in Simulink library browser, the pathtool should be used in matlab windows, create
the directory which contains the S-function library.
After the branch appearing in the library browser, drag the engine model block with
icon DP denoting double precision solver. The block with icon sp denoting single
precision link remains gray since it is only retained for legacy reasons.
Besides that, to simulate the predefined profile of desired throttle position and the
load, the ramp and step signals are used. The detailed diagram of these signals are

73
shown in the next chapter with the final result.
Then the overall engine control model should be demonstrated as:
Figure 5.4 Schematic of engine control simulation Coupling
5.4 Conclusion
In this chapter, the engine model developed in previous chapter is implemented into
Simulink environment with control system simulation. Different input and output are
defined. The input of engine control system should be engine speed, Exhaust gas
oxygen, intake manifold air pressure, throttle opening angle and intake temperature.
The output of control system should be injection amount and idle throttle angle.
In the next chapter, the simulation would set up and run. The results of simulation
developed in this chapter would be demonstrated and compared in the following
chapter.

74
Chapter6 SimulationResults
6.1SimulationResult
The coupling of GT-Power and Simulink used in this thesis only supports one case of
running. Although all the cases are set up in the case setup table (which can have
multiple cases) of GT-Power model, only one single case will be run.
After clicking the start simulation button in Simulink, the results could be observed.
The results are shown in the following paragraphs:
Figure 6.1 Throttle Angle
Figure 6.2 Engine Speed

75
Figure 6.3 Air-fuel Ratio
Figure 6.4 Intake MAP

76
Figure 6.5 Engine Torque
Figure 6.6 Turbine Speed
6.2Analysisofsimulationresults
From the diagram it could be shown that:
1) During the stable operating condition, the engine speed remains stable and the
air-fuel ratio accords to the theoretical value.
2) During the two transient operating conditions, the engine speed varies swiftly and
smoothly, the variety of air-fuel ratio remains in a acceptable range.
3) In the first transient condition, due to the sudden change of throttle angle, the
transient controller does not have sufficient time to response to that change,

77
causing the overshoot of the air-fuel ratio value. However in the second transient
condition, the transient controller plays an important role in compensating the
air-fuel ratio control with small overshoot occurs.
4) During the idle operating condition, even though the load changes suddenly, there
is not large fluctuation of engine speed and air-fuel ratio occurs. After less than 5
seconds, the engine returns to stable working in idle speed operating condition.
There is overshoot phenomena arising in the engine starting period.
5) During the low engine speed period, the engine outputs a high torque due to the
existence of turbocharger, during the transient conditions, the turbocharger keep
the boost stable. The response time is relatively low.
6) In the high engine speed range, the controller keeps the boost level stable by
controlling the bypass valve.

78
Chapter7 ComparisonwithOnBoardDiagnostic
Results
7.1 Introduction of On Board Diagnostic
In the last chapter, the simulation results are shown. To verify the simulation results,
some experimental tests could be introduced. On board diagnostic technology is used
to accomplish this comparison. The vehicle on board diagnosis system mainly
monitors the performance of the components failure function related to emission. It
can be regarded as a term of vehicle self diagnosis and capability reporting. The on
board diagnostic systems provide possibility to vehicle owner or repair technician in
order to approach conditions of various subsystems of vehicle. The on board
diagnostic system must be able to identify possible fault areas through the fault code,
which should be stored in memory area of computer. The developed instrument used
in vehicle on board diagnostic system can communicate with the electronic system of
the vehicle to collect all the available sensor data. The sensor data could be collected
is engine speed, vehicle speed that is measured on wheel, engine load if dynamometer
is exist or vehicle is operating on the road, lambda sensor voltage, catalyst
temperature, intake airflow, pressure and temperature. These sensor data could be
used to calculate the consumption and power as model input.
Figure 7.1 On Board Diagnostic

79
Inside a vehicle with on board diagnostic equipment, the air - fuel management
system takes charge of estimating total amount of air introduced into engine, and then
provides accurate fuel volume to each cylinder, in order to accomplish better
performance, the best fuel efficiency and low tail pipe emissions.The air flow passing
the engine can be measured by inserting the sensor of the intake pipe. It can also be
calculated by pulse code modulation (PCM) accurately via measuring the engine
speed, throttle position and intake manifold pressure.
All air desired to be introduced into cylinders needs to be calculated through system
so that the pulse code modulation calculates the proper quantity of fuel to adding to
the charge mixture; leading to correct operation of catalytic converter and complete
combustion as possible. If unmeasured air import into charging system, it will not add
enough fuel to cause knock and incomplete combustion. Assuming these
circumstances, the fuel efficiency of the engine is low, and there is a risk of adding
excessive pollution to environment.
The mass air flow sensor, which is as known as MAF sensor is adopted to estimate
the air flow rate introduced into cylinders of spark ignition engine. Under any
working conditions of engine, pulse code modulation utilizes air quantity information
to determine and transfer the correct fuel volume to the cylinder. The sensor is
position in the pipe used for air induction in front of the throttle body and sends out an
electrical signal to the pulse code modulation, which is proportional to the air flow to
the engine. The mass air flow sensor is main input to the pulse code modulation for
air flow information, and the oxygen sensor offers closed loop feedback to correct the
burning air / fuel mixture in real time.
No air entry into the intake system will be recorded by pulse code modulation after
the mass air flow sensor, and there may be an inappropriate air - fuel mixture. This
will lead to the possibility of excessive emission, low engine efficiency and poor
performance.

80
In several injection system, the manifold absolute pressure sensor, which as known as
MAP, is used to calculate the amount of air introduced into the cylinders. The
manifold air pressure sensor produces an electric signal to the pulse code modulation
expressing momentary information of manifold pressure. These data, as well as
engine speed and air temperature, are adopted to estimate the air density and define
the air mass flow rate of the engine, so as to identify the fuel metering needed for the
best combustion as optimum.
A tool, which is designed to collect all engine parameters, connecting to on board
diagnostic connector has been developed. The tool is on the basis of an automotive
computer with a UMTS modem, a Wifi interface, a GPS receiver and interface with
OBD and CAN. The modem transfer the data to a database deposited on server [24].
The parameters, collected, with high frequencies (2-5 Hz) are: vehicle speed, air/fuel
ratio, the intake airflow, rpm, engine load, accelerator pedal position, lambda sensor
voltage, catalyst temperature, Close/Open Loop information, absolute load
(volumetric efficiency), intake air pressure, EGR and ignition advance [24]. Typically, a simple USB KKL Diagnostic interface without protocol logic is utilized
for signal level adjustment. The analysis of vehicle black box data can be carried out
periodically, reclaimed for obtaining evidence after events likes accident, traffic
violation or mechanical failure, or transmitted to third party automatically. [24].

81
Figure 7.2 Connector Interface
7.2 On Board Diagnostic Results
To accomplish the exact testing condition as simulation test, the vehicle should be
driven over the same input cycle test. However, since the testing condition is limited
and chassis dynamometer is not presence, the input is set as throttle angle adjusted
manually and result of engine torque could not presence. After connecting the OBD
with the connector under dashboard, start the engine and the test could start by
adjusting the throttle angle manually. The results are shown on the computer
connecting to the OBD wirelessly by ESI[tronic] software. The test is repeated 8
times in order to gain the throttle angle value as desired.
The results with useful information are shown as followed:

82
Figure 7.3 Intake throttle comparison from OBD and Simulation
Figure 7.4 Engine Speed comparison from OBD and Simulation

83
Figure 7.5 Manifold air pressure comparison from OBD and Simulation
Figure 7.6 Air-fuel ratio comparison from OBD and Simulation
From the comparison between the results from OBD test and simulation test, the
simulation results are in good agreement with experimental data. In the mean time,
there are still some difference between this two kind of results. For throttle angle, it
starts from 2.6 degree in simulation since in reality during the idle speed condition the
throttle is not fully closed and the angle is assumed as 2.6 degree, however, in OBD
test, the on board diagnostic software define the closed throttle angle as 0 degree. For
the engine speed, the simulation results starts from 800 and during the transient since
the transient controller does not have sufficient time to response, the overshoot is
caused. In OBD test result, engine speed starts from 900 as predefined in the control
unit and the overshoot results are compensated and filtered. For the air fuel ratio, the

84
simulation results have large fluctuation around stoichiometric air fuel ratio during
transient condition and initial, however in OBD test, the air fuel ratio keeps stable and
little fluctuation occurs. The main difference is due to the engine control unit used in
the on board diagnostic test is a commercial version with high maturity in control
strategy and mapping of engine condition. In addition, the frequency of data
acquisition is not high enough to show the sudden change of engine parameters.
7.3Conclusionandfutureworks
This thesis focuses on the development of engine model and the simulation of control
functions, also focuses on the test the control functions with virtual engine model. In
conclusion, by coupling the simulation of engine model developed in GT-Power and
control model structured in Simulink, the different operating conditions controller of
engine could be achieved, while the varying of the desired characteristics of engine
performance could be observed. By the comparison with on board diagnostic test, it
could be proven that this method could provide a stable solution aiming at using a
accurate engine model to save development cost and time during early stage of
examining the design of control system. This kind of method could provide a stable
solution aiming at using a accurate engine model to save development cost and time
during early stage of examining the design of control system.
For the next step of the final project should be developed, the auto generation of C or
C++ programming code should be concerned. By using the function of
auto-generation in Simulink software, the C or C++ programming code could be
directly stored into the Arduino. After the code flashed into the microcontroller, the
code should be test on the real engine. In the case of unexpected situation occurred
according to the real tested results, the control strategy should be reviewed and
checked.

85
Appendix EngineSpecificationCylinderLayout In-line4Combustionchamber PentrooftypeValvetrain SingleoverheadcamshaftDisplacement 1242ccBore 35mmNumberofcylinders 4Stroke 40mmNumberofvalvespercylinder 2Torque 102Nm/3000rpmFuelsystem Multi-pointinjectionCompressionratio 9.5FuelType GasolineMinimumoctanenumber RON95Sparkadvance ControlledbycontrolunitSparkadvancedefinedinenginemodel 15oMaximumpower 99kw/5000rpmMaximumtorque 201(2500)Nm/2500rpmFiringOrder 1-3-4-2Intakevalveopen 16oBTDCIntakevalveclose 53oABDCExhaustvalveopen 50oBBDCExhaustvalveclose 16oATDC

86
OnBoardDiagnosticTestResults

87
EngineModelingExplanation
FlowSplitSphere Describeasphericalshapedflowsplitvolume
connectedtooneormoreflowcomponents
EndEnvironment Describeendenvironmentboundaryconditionsof
pressure,temperatureandcomposition
OrificeConn Describeanorificebetweentwoflowcomponents
PipeRound Modelpipesthathavearoundcross-sectionandan
optionalbend.Describeddataisusedtoautomaticallycalculatethepressurelosscoefficientsthataccountfortheassociatedheadloss
FlowSplitTRight Describeacylindricalshapedflowsplitvolume
connectedtothreeflowcomponentsinaT-configuration
EndFlowCap Captheendofapipeorflowsplitopeninginorderto
preventanyflowthroughit FlowSplitGeneral Describeaflowsplitvolumeconnectedtooneormore
flowcomponents.Candescribeanyshapeofflowsplit
Compressor Representacompressorinaturbochargedor
superchargedengine.Predictionsofmassflowrate,outlettemperatureandconsumedpowerarecalculatedbytheuseofamap
ShaftTurbo Describetheattributesofshaftturbopartsusedofr
simulatingthedynamic(speed,acceleration/deceleration)ofturbochargershafts
Turbine Representaturbineofaturbochargerand/orapower
turbine.Modelafixedgeometryturbine,aturbinewithawastegate,orvariablegeometryturbine.
ThrottleConn Describeathrottleplacedbetweentwoflowcomponents
InjAFSeqConn Describetheoperationofasequentialpulsefuelinjector.Imposethefueltoairratioandtheresultantinjectionpulsewidthiscalculatedforeachinjectionevent
FlowSplitY Describeacylindricalshapedflowsplitvolume
connectedtothreeflowcomponentsinaYconfiguration
ValveCamConn Definethecharacteristicsofacamdrivenvalveincludingitsgeometry,lifeprofileandflowcharacteristics
EngCylinder Specifytheattributesofenginecylinders.Thecylinder
geometryisspecifiedintheenginecranktrain

88
SensorConn Provideacontrolsensorlinkbetweenaflowor
mechanicalpartandcontrolcomponentspart.Passthesignalsfromtheflowormechanicalcomponenttothecontrolcomponent
ActuatorConn Alinkbetweenthecontrolslibraryandmulti-physics
library(flow,mechanical,thermal,etc)
SimulinkHarness CoupleGT-SUITEtothirdpartysoftwareprogram
Simulink.Regularcontrolcomponent
MonitorSignal Monitorinstantaneoussignalsduringasimulation
PIDController Containacontinuousproportional-integral-derivative
controller.Achieveandmaintainatargetvalueofsomesensiblequantityfromthesystembycontrollingsomeinputtotheplant
MovingAVerage Computeaveragesoverparticularintervalsofdataas
specifiedbytheuser.
Torque Describetheattributesoftorqueparts,whichcanbe
usedtoapplyatorquetorotationalmechanicalparts.

89
Reference
[1] Thirouard, M., Mendez, S., Pacaud, P., Chmielarczyk, V., Ambrazas, D, Garsi, C., Lavoisier, F. and
Barbeau, B. Potential to Improve Specific Power Using Very High Injection Pressure in HSDI Diesel
Engines. SAE paper 2009- 01-1524, 2009. �
[2] Matsura, Y., Nakazawa, N., Kobayashi, Y., Ogita, H. and Kawatani, T. Effects of Various Methods
for Improving Vehicle Startability and Transient Response of Turbocharged Diesel Trucks. SAE paper
920044, 1992. �
[3] Petitjean, D., Bernardini, L., Middlemass, C. and Shahed, S.M. Advanced Gasoline Engine
Turbocharging Technology for Fuel Economy Improvements. SAE paper 2004-01-0988, 2004. �
[4] Watson, N. and Janota, M.S. Turbocharging the Internal Combustion Engine, 1982 (Macmillan
Publishers Ltd, Basingstoke). �
[5] Watson, N. and Janota, M.S. Turbocharging the Internal Combustion Engine, 1982 (Macmillan
Publishers Ltd, Basingstoke). �
[6] Stobart, R.K., Challen, B.J., & Bowyer, R. (2001). Electronic controls-breeding new en- gines.
SAE technical paper. No: 2001-01-0255.
[7] Chamaillard, Y., Higelin, A., & Charlet, P. (2004). A simple method for robust control design,
application on a non-linear and delayed system: Engine torque control. Control Engineering Practice,
12, 417–429.
[8] Guenther, D.W., & Gerhardt, J. (2000). MOTRONIC-torque guided engine manage- ment systems
to meet future challenges in emissions and fuel consumption re- duction. SAE technical paper. No:
2000-01-1420.

90
[9] B. Ashok∗, S. Denis Ashok, C. Ramesh A review on control system architecture of a SI engine
management system, Kumar School of Mechanical Engineering (SMEC), VIT University, Vellore
632014, India
[10] Hendricks, E., & Sorenson, S. C. (1990). Mean Value SI Engine Model for Control Studies. In American Control Conference (pp. 1882-1887). IEEE.
[11] www.maplesoft.com
[12] Zhang, Shupeng, Guoming Zhu, and Zongxuan
Sun. "A Control-Oriented Charge Mixing and �Two-Zone HCCI Combustion Model", IEEE �Transactions on Vehicular Technology, 2014.
[13] "Transient Operation Fundamentals", Diesel Engine Transient Operation, 2009
[14]Andrew P. White, Guoming Zhu, Jongeun Choi. "Linear Parameter-Varying Control for Engineering Applications", Springer Nature, 2013
[15] Mrdjan Jankovic. "Developments in Control of Time-Delay Systems for Automotive Powertrain Applications", Delay Differential Equations, 2009
[16] Ehsani, . "Internal Combustion Engines", Power Electronics and Applications Series, 2004.
[17] B. Ashok, S. Denis Ashok, C. Ramesh Kumar. "Trends and future perspectives of electronic �throttle control system in a spark ignition �engine", Annual Reviews in Control, 2017
[18] Engine Modeling and Control, 2014.
[19] Bai, Yang(Chen, J and Zhao, H). "Studies on SI
engine simulation and air/fuel ratio control �systems design", Brunel University School of Engineering and Design PhD Theses, 2014.
[20] Turbocharging the Internal Combustion Engine,
1982.
[21] "Patent Application Titled "Air-Fuel Ratio Control Device of Internal Combustion Engine" Published On", Life Science Weekly, June 2 �2015 Issue
[22] Zhao, Jinxing, and Min Xu. "Model-based
calibration for the control variables of an �Atkinson cycle engine", International Journal of Powertrains, 2013.
[23] He, L., L. Li, L. Yu, E. Mao, and J. Song. "A torque-based nonlinear predictive control approach of automotive powertrain by iterative optimization", Proceedings of the Institution of Mechanical Engineers Part D Journal of Automobile Engineering, 2012.
[24] www.epa.gov United States Environmental Protection Agency.
[25] Liu Yingchun, Wang Qi, L.ling. " Transport Properties of Fluids in Micropores by Molecular Dynamics Simulation" Chinese Journal of Chemistry

91
[26] www.inderscience.com Inderscience Publisher, linking academia, business and industry through research.
[27] teacher.buet.ac.bd Bangladesh university of engineering technology.
[28] White, Andrew, Guoming Zhu, and Jongeun Choi. "Hardware-in-the-Loop simulation of Robust Gain-Scheduling Control of Port-Fuel-Injection Processes", ASME 2010 Dynamic Systems and Control Conference Volume 1, 2010
[29] H Sim. "Development and validation of a
dynamic model for a gaseous-fuel engine", �Proceedings of the Institution of Mechanical Engineers Part D Journal of Automobile Engineering, 01/01/2004
[30] Chunyue Song. "Optimal Control of Hybrid
Framework-Based Powertrain and �Transmission Systems", Lecture Notes in �Electrical Engineering, 2012
[31] Zhang, Shupeng, Guoming G. Zhu, Yongsoon
Yoon, and Zongxuan Sun. "A Control Oriented �Charge Mixing and HCCI Combustion Model for Internal Combustion Engines", Volume 2 Legged Locomotion Mechatronic Systems Mechatronics Mechatronics for Aquatic Environments MEMS Control Model Predictive Control Modeling and Model-Based Control of Advanced IC Engines, 2012.
[32] William B. Ribbens. "The Basics of Electronic Engine Control", Elsevier BV, 2017
[33] Zhenjun Xu, Huaizhi Wu, Meiling Wu. "Energy performance and consumption for biogas heat pump air conditioner", Energy, 2010
[34] Yang, Xiaojian, Guoming G. Zhu, and Zongxuan Sun. "A Control Oriented SI and �HCCI Hybrid Combustion Model for Internal �Combustion Engines", ASME 2010 Dynamic Systems and Control Conference Volume 1, 2010.
[35] Xu, Fang, Hong Chen, Xun Gong, and Qin Mei.
"Fast Nonlinear Model Predictive Control on �FPGA Using Particle Swarm Optimization", �IEEE Transactions on Industrial Electronics, 2015.
[36] Hualei Li, Guozheng Zhang, Huiyan Zhang, Lei
Shi, Mingyang Yang, Kangyao Deng. �"Equivalent matching model of a regulated �two-stage turbocharging system for the plateau adaptability", Proceedings of the Institution of Mechanical Engineers, Part D: Journal of Automobile Engineering, 2016
[37] Yildiz, Y.. "Spark ignition engine fuel-to-air ratio
control: An adaptive control approach", Control Engineering Practice, 201012
[38] Gong, Xun, Hong Chen, Yanan Fan, and Control and Automation, 2014. Yunfeng Hu. "Idle speed control for SI engine using triple-step nonlinear method", Proceeding of the 11th World Congress on Intelligent

92
[39] Wu, Yifei Wang, Zhihong Li, Yuanyuan Che. "Characteristic modeling and control of servo systems with backlash and friction.(Research Article)(R", Mathematical Problems in Engineering, Annual 2014 Issue
[40] Li, Kunying, and Bing Xiao. "Research on adaptive feedforward control strategy of �engine based on GT-power and simulink � simulation", The 26th Chinese Control and Decision Conference (2014 CCDC), 2014.
[41] Lino Guzzella. "Control of Engine Systems",Introduction to Modeling and Control of Internal Combustion Engine Systems, 2010
[42] J.H. Buckland. "Modeling and control of automotive powertrain systems: a tutorial", Proceedings of the 2005 American Control Conference 2005, 2005